This DRAFT selection from Science and Global Issues: Biology Third Edition, Redesigned for the NGSS content is copyrighted © 2021 by the Regents of the University of California and is available only for the 2021 NABT workshop. Users may not modify or electronically transfer this content. SL-00194T

Welcome message from author
This document is posted to help you gain knowledge. Please leave a comment to let me know what you think about it! Share it to your friends and learn new things together.
Transcript
This DRAFT selection from Science and Global Issues: Biology Third Edition, Redesigned for the NGSS content is copyrighted © 2021 by the Regents of the University of California and is available only for the 2021 NABT workshop. Users may not modify or electronically transfer this content.
SL-00194T
Michelle Etheridge
Cross-Out

UNIT SUMMARY
ECOLOGY
Unit Issue: The ways that humans interact with the environment can cause dramatic changes over time. People rely on natural resources, including fish, for many reasons, including food, yet many fisheries are no longer sustainable..
Driving Question: How do humans affect the environment over time? How can we use our knowledge about ecology to make informed decisions about managing fisheries to be more sustainable?
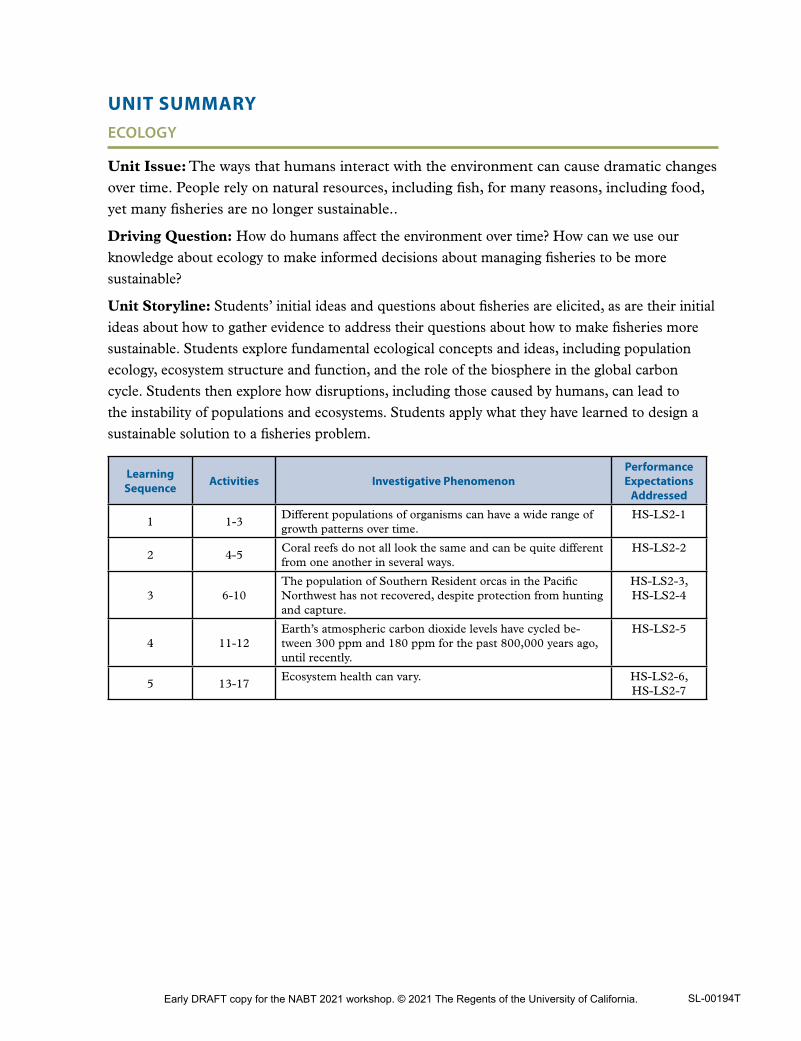
Unit Storyline: Students’ initial ideas and questions about fisheries are elicited, as are their initial ideas about how to gather evidence to address their questions about how to make fisheries more sustainable. Students explore fundamental ecological concepts and ideas, including population ecology, ecosystem structure and function, and the role of the biosphere in the global carbon cycle. Students then explore how disruptions, including those caused by humans, can lead to the instability of populations and ecosystems. Students apply what they have learned to design a sustainable solution to a fisheries problem.
Learning Sequence
Activities Investigative PhenomenonPerformance Expectations
Addressed
1 1-3Different populations of organisms can have a wide range of growth patterns over time.
HS-LS2-1
2 4-5Coral reefs do not all look the same and can be quite different from one another in several ways.
HS-LS2-2
3 6-10The population of Southern Resident orcas in the Pacific Northwest has not recovered, despite protection from hunting and capture.
HS-LS2-3, HS-LS2-4
4 11-12Earth’s atmospheric carbon dioxide levels have cycled be-tween 300 ppm and 180 ppm for the past 800,000 years ago, until recently.
HS-LS2-5
5 13-17Ecosystem health can vary. HS-LS2-6,
HS-LS2-7
Early DRAFT copy for the NABT 2021 workshop. © 2021 The Regents of the University of California. SL-00194T

Early DRAFT copy for the NABT 2021 workshop. © 2021 The Regents of the University of California.
ECOLOGY 61
4 Scaling Up: Ecosystemsm o d e l i n g
1–2 class sessions
ACTIVITY OVERVIEW
STORYLINE
Investigative Phenomenon for the Second Learning Sequence (Activities 4–5)
In the previous learning sequence, students discovered that many ecosystem factors (biotic, abiotic, intrinsic) affect the population size of an organism, using a population of song sparrows on an isolated island ecosystem as a case study. The investigative phenomenon for this learning sequence is: Coral reefs do not all look the same and can be quite different from one another in several ways. Students begin with the phenomena of one ecosystem type (coral reefs) that can look very different. Students examine several photographs of different healthy coral reefs; they share the similarities and differences they notice and suggest factors that might cause these differences. Students build their understanding of ecosystem similarities and differences by revisiting their ideas at the end of each activity in this learning sequence.
This Activity
Students investigate ecosystem boundaries and scales. All ecosystems have biotic and abiotic components that interact in specific and sometimes complicated ways. Scientists draw boundaries around these interacting components to separate one system from another. Ecosystems also exist at different scales. Students look at four examples of ecosystems of varying scales, from the vast ocean sunlight zone to the tiny blowhole ecosystem of a humpback whale, and discover that sometimes one system (e.g., the whale respiratory system) can be a subsystem of a larger system (e.g., the ocean).
SENSEMAKING PROGRESSION
• Students know from the previous learning sequence that in order to under-stand what is happening to a population of organisms, scientists need to understand what is happening in the ecosystem around that population.
• Students may not have a firm understanding of how ecologists define an ecosystem.
• Students might not yet understand explicitly that ecosystems can exist at many different spatial scales.
Early DRAFT copy for the NABT 2021 workshop. © 2021 The Regents of the University of California.
ACTIVITY 4 SCALING UP: ECOSYSTEMS
62 ECOLOGY
• Students explore four different ecosystems in order to define three things that all ecosystems have in common: components, interactions among those components, and boundaries.
• Key sensemaking: Students use their understanding of different ecosystems to come to a consensus definition of an ecosystem. This key sensemaking oppor-tunity occurs in Procedure Step 7.
Teacher’s Note: Students return to this concept in subsequent activities, devel-oping a deeper understanding of why there is such variety in ecosystems and why some of the same types of ecosystems can look very different.
• Going forward: Students build on their understanding of ecosystems throughout the remainder of the unit. Students specifically apply their under-standing of ecosystem boundaries in Activity 11: Ecosystems and the Carbon Cycle, when they explore the role of salmon at the boundary of aquatic and terrestrial ecosystems.
NGSS INTEGRATION
Students obtain information about four different ecosystems to determine what defines an ecosystem. They use the crosscutting concept of systems and system models to identify that ecosystems are defined by their components, the interactions among those components, and their boundaries. They also use the crosscutting concept of scale, proportion, and quantity to realize that an ecosystem can exist at many different scales, from vast to tiny.
NGSS CORRELATIONS
Performance Expectations
Working toward HS-LS2-2: Use mathematical representations to support and revise explanations based on evidence about factors affecting biodiversity and popula-tions in ecosystems of different scales.
Applying HS-LS2-1: Use mathematical and/or computational representations to support explanations of factors that affect carrying capacity of ecosystems at different scales.
Disciplinary Core Ideas
Primary
HS-LS2.A Interdependent Relationships in Ecosystems: Ecosystems have carrying capacities, which are limits to the numbers of organisms and populations they
D
P
Early DRAFT copy for the NABT 2021 workshop. © 2021 The Regents of the University of California.
ACTIVITY 4 SCALING UP: ECOSYSTEMS
ECOLOGY 63
can support. These limits result from such factors as the availability of living and nonliving resources and from such challenges such as predation, competition, and disease. Organisms would have the capacity to produce populations of great size were it not for the fact that environments and resources are finite. This funda-mental tension affects the abundance (number of individuals) of species in any given ecosystem.
Supporting
HS-LS2.C Ecosystem Dynamics, Functioning, and Resilience: A complex set of inter-actions within an ecosystem can keep its numbers and types of organisms relatively constant over long periods of time under stable conditions. If a modest biological or physical disturbance to an ecosystem occurs, it may return to its more or less original status (i.e., the ecosystem is resilient), as opposed to becoming a very different ecosystem. Extreme fluctuations in conditions or the size of any popula-tion, however, can challenge the functioning of ecosystems in terms of resources and habitat availability.
Science and Engineering Practices
Developing and Using Models: Develop a model based on evidence to illustrate the relationships between systems or components of a system.
Obtaining, Evaluating, and Communicating Information: Critically read scientific literature adapted for classroom use to determine the central ideas or conclusions and/or to obtain scientific and/or technical information to summarize complex evidence, concepts, processes, or information presented in a text by paraphrasing them in simpler but still accurate terms.
Crosscutting Concepts
Scale, Proportion, and Quantity: Using the concept of orders of magnitude allows one to understand how a model at one scale relates to a model at another scale.
Systems and System Models: Models (e.g., physical, mathematical, computer models) can be used to simulate systems and interactions—including energy, matter, and information flows—within and between systems at different scales.
Common Core State Standards—ELA/Literacy
RST.11-12.5: Cite specific textual evidence to support analysis of science and technical texts, attending to important distinctions the author makes and to any gaps or inconsistencies in the account.
S
C
E
Early DRAFT copy for the NABT 2021 workshop. © 2021 The Regents of the University of California.
ACTIVITY 4 SCALING UP: ECOSYSTEMS
64 ECOLOGY
MATERIALS AND ADVANCE PREPARATION
■ For the teacher
Student Sheet 4.1, “Ecosystem Comparisons”
■ For each student
Student Sheet 4.1, “Ecosystem Comparisons”
TEACHING STEPS
GET STARTED
Students are introduced to the investigative phenomenon for the second learning sequence (Activities 4–5): Coral reefs do not all look the same and can be quite different from one another in several ways.
1. Set the stage for the second learning sequence by introducing the second investigative phenomenon, using the photo montage of coral reefs in the Student Book.
Instruct students to examine and discuss these photographs in their groups of four. They should describe what they see, noting both similarities and differ-ences, and suggest what might be causing the differences.
Eliciting what they notice from the photographs gives students a common starting point and lessens the significance of prior knowledge and experiences, which encourages students from non-dominant backgrounds to share what they notice.
Facilitate a class discussion about what students noticed and what they think might cause the differences they noticed. Accept all reasonable responses at this point. Ask students if they have any new questions to add to the Driving Questions Board. Explain to them that in this activity and the next, they will explore concepts and ideas that will help them make sense of the differences between the coral reefs in the photos. The suggested driving question for this learning sequence is: What are the factors that determine the biological diversity of an ecosystem?
2. Have students read the introduction and guiding question for this activity, and elicit their initial ideas for what defines an ecosystem.
Accept all reasonable responses at this point. Record students’ ideas on the board or chart paper to revisit later in this activity. Tell students that they will read about and compare four marine (ocean) ecosystems, which will help them more clearly define what an ecosystem is.
Investigative Phenomena
Early DRAFT copy for the NABT 2021 workshop. © 2021 The Regents of the University of California.
ACTIVITY 4 SCALING UP: ECOSYSTEMS
ECOLOGY 65
DO THE ACTIVITY
Students look for similarities and differences across the four ecosystems.
3. Introduce the crosscutting concept of systems and system models.
Draw students’ attention to the box in the Student Book about the crosscutting concept of systems and system models. Explain that scientists and engineers define systems based on artificial
boundaries between components of interest and those outside of consider-ation. They then examine and model the system in terms of its components and their interactions with one another. Review the symbol for systems and system models in Appendix G: Crosscutting Concepts in the Student Book. Point out to students that defining the system they are studying helps scientists focus their investigation. For example, understanding the phases of the moon requires studying the Sun-Earth-Moon system but does not require studying the galaxy or universe.
It is important to note that crosscutting concepts are not isolated. Scientists studying a particular system are likely to ask questions about such other concepts as the scale of the system (something students will examine in this activity), its structure and function, and cause-and-effect relationships within the system.
Point out to students that the term ecosystem combines the word system as its stem and the prefix eco, which means having to do with the environment. Have students complete Step 1 in pairs, allowing them time to briefly discuss how systems and system models might relate to ecosystems. They will return to this concept throughout the activity as they build their understanding of ecosystems.
4. (literacy) Introduce Student Sheet 4.1, “Ecosystem Comparisons.”
Student Sheet 4.1, “Ecosystem Comparisons,” is a Directed Activity Related to Text (DART), a literacy strategy that supports students’ reading compre-hension and critical thinking by having them interact with and manipulate the information they are reading. Examples of DARTs are matching and labeling exercises, sequencing, grouping, predicting, and completing a diagram or table. DARTs that require higher-order processing include extracting informa-tion and placing it in tables and flowcharts. The DART on Student Sheet 4.1 is used in Procedure Step 3 to guide students in identifying and summarizing important points from the text. Before students begin, briefly explain how the DART corresponds with the text students are considering. Have them complete the Student Sheet alongside the reading.
Patterns
A ➞ B Cause and Effect
Scale, Proportion, and Quantity
Energy and Matter
Structure and Function
Stability and Change
Sysytem and System Models
y
x
O
H H
Directed Activity Related to Text
Early DRAFT copy for the NABT 2021 workshop. © 2021 The Regents of the University of California.
ACTIVITY 4 SCALING UP: ECOSYSTEMS
66 ECOLOGY
Review the terms in Procedure Step 3, which students will use to categorize their notes on Student Sheet 4.1. The terms components and interactions should be familiar from middle school. If students do not remember them, ask for a few examples of biotic and abiotic factors (e.g., organisms and carbon dioxide or oxygen, respectively) and interactions in ecosystems (e.g., predator–prey relationships). If students are unfamiliar with the use of the term boundary in this context, offer the simple example of a river ecosystem; the boundaries are the edges of the river.
5. Introduce the crosscutting concept of scale, proportion, and quantity.
Review the symbol for scale, proportion, and quantity in Appendix G in the Student Book. Explain that this crosscutting concept
relates to measurements of objects or phenomena, including measurements of size, time, and energy. Scientific phenomena occur at different scales, from the subatomic scale to the scale of the universe, from fractions of a second to billions of years. Scientists use proportional relationships to compare measure-ments of objects and events. They often use mathematical expressions and equations to represent scientific relationships.
Let students know that as they investigate their ecosystem, they will need to consider its scale. It may help them to think in terms of how large their ecosystem is and how large it is relative to other ecosystems. They will revisit this concept when they compare ecosystems later in the activity.
6. Have students complete Procedure Step 3.
Assign each group an ecosystem or have groups choose which of the four ecosystems they will examine: ocean sunlight zone, coral reefs, intertidal zone, or humpback whale respiratory microbiome. Ensure that at least two groups examine each of the four ecosystems.
While all four ecosystems are approximately equal in reading level, you may wish to assign ecosystems based on how well you think your students will be able to make sense of a particular ecosystem and to identify what all ecosystems have in common, using the crosscutting concept of systems and system models.
7. Have students share ecosystem information and compare the four ecosystems.
Ask students to report on their ecosystem. Because at least two groups read about each ecosystem, they will need to do this in turn. One efficient strategy is to have groups take turns reporting on each section (e.g., one group shares the components they listed, then the other group shares the interactions they noted). Each group may also add to what the other group shared, as needed.
Patterns
A ➞ B Cause and Effect
Scale, Proportion, and Quantity
Energy and Matter
Structure and Function
Stability and Change
Sysytem and System Models
y
x
O
H H
Early DRAFT copy for the NABT 2021 workshop. © 2021 The Regents of the University of California.
ACTIVITY 4 SCALING UP: ECOSYSTEMS
ECOLOGY 67
Record the information that groups share on a projected electronic copy of the Student Sheet, or in some other way so that students can have a reference as they take notes on their own Student Sheet. If students have challenges around taking notes (e.g., they have dyslexia or dysgraphia, they are English learners), consider providing them with a copy of the completed Student Sheet after each group has reported.
Once all groups have shared their information, have a brief class discussion about the similarities and differences between the four ecosystems. Set up a T-Chart to take notes, and ask students to first identify similarities. Students are likely to mention that the ecosystems are all located in the ocean and that several have similar organisms. If necessary, ask students to describe the ecosystem components and interactions: All the ecosystems have a number of biotic components that interact with one another and with the abiotic environment in various ways. Ask students specifically about the boundaries of the four ecosystems and whether any of the ecosystems interact. This will help them see that boundaries are not always permanent or impermeable.
Teacher’s Note: Students revisit this idea in more detail in Activity 10: Crossing Ecosystem Boundaries.
Ask students what is different about the four ecosystems. The concept of scale should emerge in this discussion. These ecosystems range from vast (ocean sunlight zone) to tiny (humpback whale respiratory microbiome). The ocean sunlight zone contains much larger organisms (the blue whale is the largest animal to ever have existed on Earth) than the blowhole (which comprises virtually all single-celled organisms). Thus, it is not necessary to be of a certain size or scale to be part of an ecosystem, and this information may not be part of the definition.
An example of notes from a class discussion is shown below.
SAMPLE CLASS RESPONSE
Ecosystem Similarities Ecosystem Differences
All are marine
Each contain some similar organisms
All have organisms interacting in them
All have a boundary
All have biotic and abiotic components
Most have predator–prey interactions
Size: some are big, some small, some in between
Each has different boundaries
Each contains different types of organisms
The whale respiratory microbiome is contained in a very specific location; the others have more flexible boundaries
The whale moves, so the microbiome moves with it; the others don’t move
Early DRAFT copy for the NABT 2021 workshop. © 2021 The Regents of the University of California.
ACTIVITY 4 SCALING UP: ECOSYSTEMS
68 ECOLOGY
BUILD UNDERSTANDING
Students develop a definition of an ecosystem.
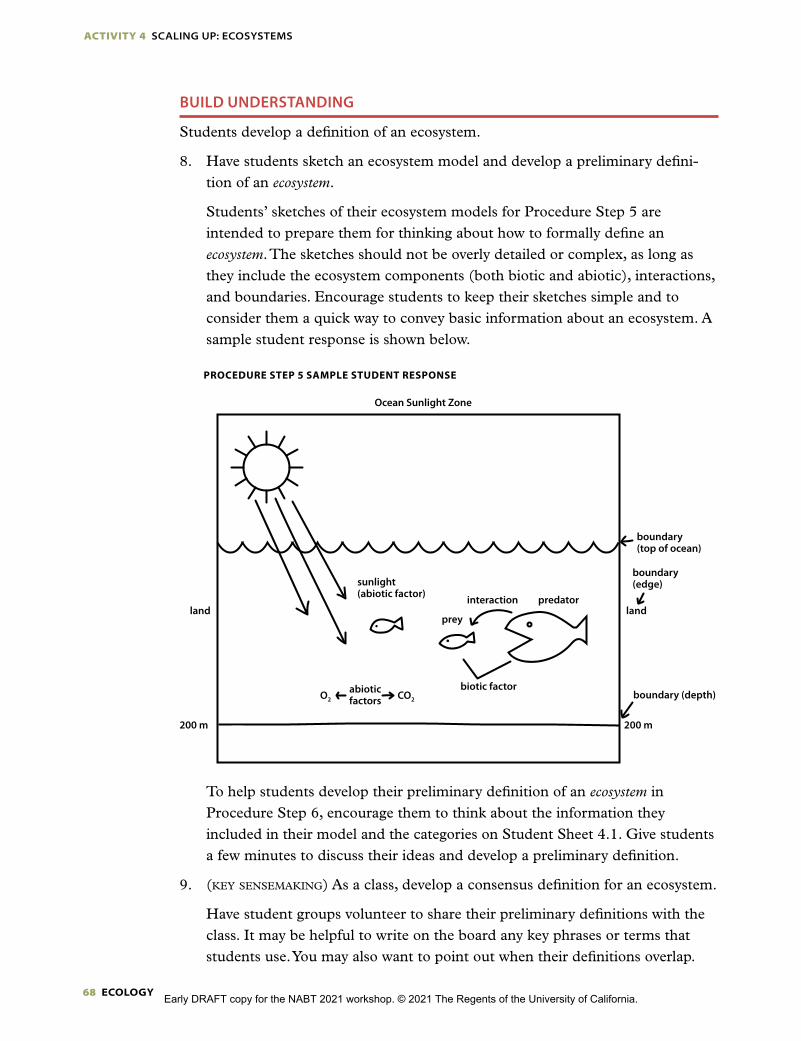
8. Have students sketch an ecosystem model and develop a preliminary defini-tion of an ecosystem.
Students’ sketches of their ecosystem models for Procedure Step 5 are intended to prepare them for thinking about how to formally define an ecosystem. The sketches should not be overly detailed or complex, as long as they include the ecosystem components (both biotic and abiotic), interactions, and boundaries. Encourage students to keep their sketches simple and to consider them a quick way to convey basic information about an ecosystem. A sample student response is shown below.
PROCEDURE STEP 5 SAMPLE STUDENT RESPONSE
To help students develop their preliminary definition of an ecosystem in Procedure Step 6, encourage them to think about the information they included in their model and the categories on Student Sheet 4.1. Give students a few minutes to discuss their ideas and develop a preliminary definition.
9. (key sensemaking) As a class, develop a consensus definition for an ecosystem.
Have student groups volunteer to share their preliminary definitions with the class. It may be helpful to write on the board any key phrases or terms that students use. You may also want to point out when their definitions overlap.
SGI Ecology 3eFigure: SGI3e Eco SS 4_17Noteworthy Reg/Bold 12
200 m 200 m
O2 CO2
abioticfactors
predator
prey
interaction
biotic factor
landland
sunlight(abiotic factor)
boundary(top of ocean)
boundary(edge)
boundary (depth)
Ocean Sunlight Zone
Early DRAFT copy for the NABT 2021 workshop. © 2021 The Regents of the University of California.
ACTIVITY 4 SCALING UP: ECOSYSTEMS
ECOLOGY 69
Encourage students to think about how the crosscutting concept of systems and system models plays a role in developing the definition. Help students bring together the key phrases and terms into a full definition of an ecosystem, which is the key sensemaking opportunity in this activity. Record the final definition on the board, and have students record it in their science notebooks for later reference. A sample class consensus definition is shown below.
PROCEDURE STEP 7 SAMPLE CLASS CONSENSUS DEFINITION
An ecosystem is a set of biotic and abiotic components that interact on a regular basis within a particular boundary.
10. Direct students to the Build Understanding items.
Build Understanding items 1 through 4 reinforce the crosscutting concepts of systems and system models and scale, proportion and quantity, which will help prepare students when they revisit these concepts again in Activity 11: Ecosystems and the Carbon Cycle. Item 3 relates this crosscutting concept to the unit issue of sustainable fisheries. Item 4 couples ecosystem carrying capacity with the crosscutting concept of scale, proportion, and quantity, both of which are aligned with Performance Expectation HS LS2-2, which will be assessed in the next activity. Item 5 brings students back to the idea of simi-larities and differences in coral reef ecosystems. Let students know that in the next activity they will begin to explore some of the reasons for these similari-ties and differences.
11. Use the Extension as an opportunity for advanced learning.
Have students who are interested in opportunities for advanced learning complete the Extension. In this activity, students can learn more about the studies done on the whale respiratory microbiome and the engineering connections with the use of drone technology to collect samples from the whales’ breath.
SAMPLE RESPONSES TO BUILD UNDERSTANDING
1. Why is it necessary for researchers to specify the boundary of the ecosystem they are investigating?
Researchers need to be able to identify all the components that interact within the ecosystem. If they don’t specify the boundary, they cannot tell what is part of the ecosystem and what isn’t. Specifying the boundary of the ecosystem gives researchers a complete picture of what components interact within the ecosystem. They also don’t need to include components that are outside the ecosystem boundary because those components won’t help researchers understand the ecosystem.
Early DRAFT copy for the NABT 2021 workshop. © 2021 The Regents of the University of California.

ACTIVITY 4 SCALING UP: ECOSYSTEMS
70 ECOLOGY
2. Suppose you were a scientist developing a model for the Mandarte Island ecosystem and the song sparrows. Would it be easier to identify the compo-nents, interactions, and boundaries of this ecosystem than others? Why or why not? What challenges might you have?
I think it would be pretty easy to identify the components, interactions, and bound-aries of the Mandarte Island ecosystem because it’s an island, so the boundary is pretty clear, and it’s on land, so you can see and study the components and their interactions. I think it would be much easier to define these things for Mandarte than many other ecosystems with boundaries that are harder to define (like a large forest that doesn’t have a distinct edge) or where it’s harder to observe all the components and interactions (like an underwater ecosystem).
3. Issue connection: How could understanding the components, interactions, and boundaries of a fishery’s ecosystem help scientists monitor the sustain-ability of that fishery?
Understanding the components, interactions, and boundaries of a fishery’s ecosystem can help scientists know what might be affecting the fish population. For example, if they know that the fish eat a certain species of smaller fish, the scientists might monitor the smaller fish to make sure that there’s enough food for the bigger fish. Knowing the boundaries of the ecosystem can help scientists know what is and isn’t part of the ecosystem, so they know what’s most important to monitor.
4. Below are three images taken of the same coral reef at different scales. Explain what types of factors researchers might investigate if they want to monitor the carrying capacity of the reef ecosystem at the scale shown in the photo on the left (a), in the middle (b), and on the right (c).
Hint: Consider what types of components and interactions might be studied at these three scales.
If researchers want to study the carrying capacity of this reef, they need to study the components and interactions that affect the populations in the reef ecosystem. On the left, researchers might investigate if the whole reef is growing or shrinking over time. In the middle, researchers might study the fish that live on the reef, and what
a b c
Early DRAFT copy for the NABT 2021 workshop. © 2021 The Regents of the University of California.
ACTIVITY 4 SCALING UP: ECOSYSTEMS
ECOLOGY 71
is happening to the various fish population sizes over time. On the right, researchers might look at the health of the coral polyps that make up the coral reef. All these factors would help researchers understand if the reef and its carrying capacity are staying the same or changing over time.
5. Look again at the coral reef photos at the start of this activity. What might explain the similarities and differences you observed in these coral reefs?
Some reefs seem to have more components than others. Some of the reefs seem to have more types of organisms, especially fish. Maybe the reefs are in different places. I’m not sure why some are more colorful than others—maybe something happened to the ones with less color.
ACTIVITY RESOURCES
KEY SCIENTIFIC TERMS
boundary
component
ecosystem
interaction
scale
system
system model
Early DRAFT copy for the NABT 2021 workshop. © 2021 The Regents of the University of California.
ACTIVITY 4 SCALING UP: ECOSYSTEMS
72 ECOLOGY
Ecology 4: Scaling Up: Ecosystems
m o d e l i n g
1–2 class sessions
TEACHING SUMMARY
GET STARTED
1. Set the stage for the second learning sequence by introducing the second investigative phenomenon, using the photo montage of coral reefs in the Student Book.
2. Have students read the introduction and guiding question for this activity, and elicit their initial ideas for what defines an ecosystem.
DO THE ACTIVITY
3. Introduce the crosscutting concept of systems and system models.
4. (literacy) Introduce Student Sheet 4.1, “Ecosystem Comparisons.”
5. Introduce the crosscutting concept of scale, proportion, and quantity.
6. Have students complete Procedure Step 3.
7. Have students share ecosystem information and compare the four ecosystems.
BUILD UNDERSTANDING
8. Have students sketch an ecosystem model and develop a preliminary defini-tion of an ecosystem.
9. (key sensemaking) As a class, develop a consensus definition for an ecosystem.
10. Direct students to the Build Understanding items.
11. Use the Extension as an opportunity for advanced learning.
Early DRAFT copy for the NABT 2021 workshop. © 2021 The Regents of the University of California.
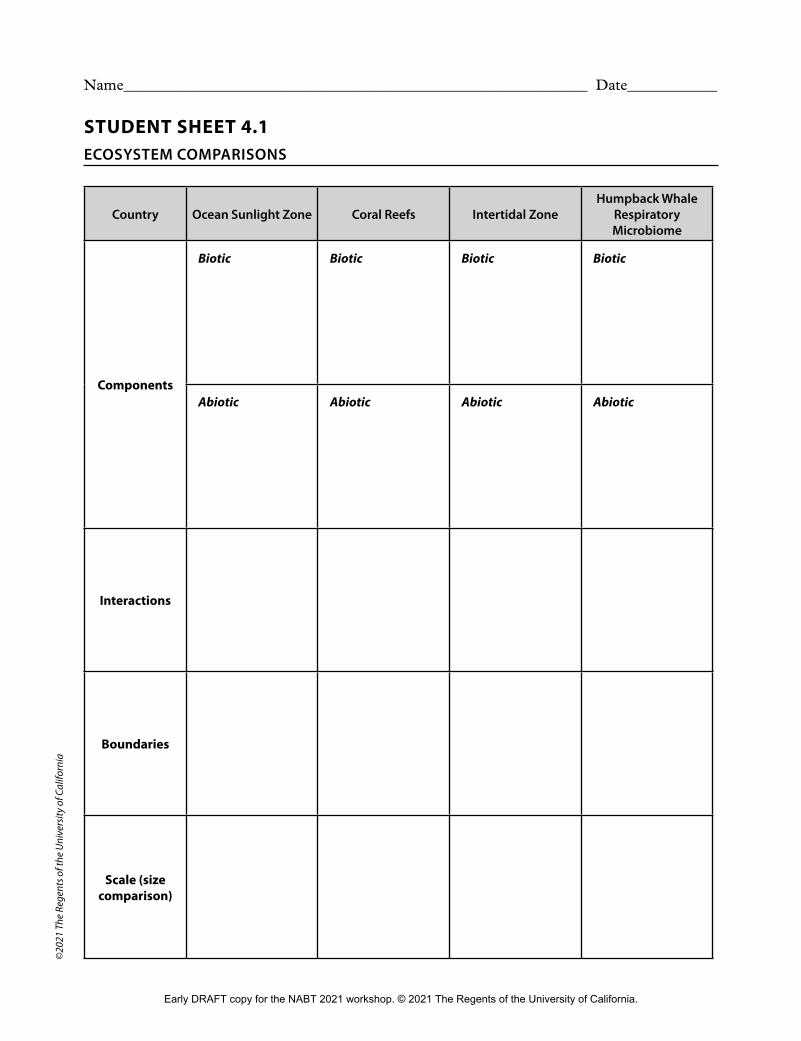
Name______________________________________________________________ Date____________
STUDENT SHEET 4.1ECOSYSTEM COMPARISONS
Country Ocean Sunlight Zone Coral Reefs Intertidal ZoneHumpback Whale
Respiratory Microbiome
Components
Biotic Biotic Biotic Biotic
Abiotic Abiotic Abiotic Abiotic
Interactions
Boundaries
Scale (size comparison)
©20
21 T
he R
egen
ts o
f the
Uni
vers
ity o
f Cal
iforn
ia
Early DRAFT copy for the NABT 2021 workshop. © 2021 The Regents of the University of California.
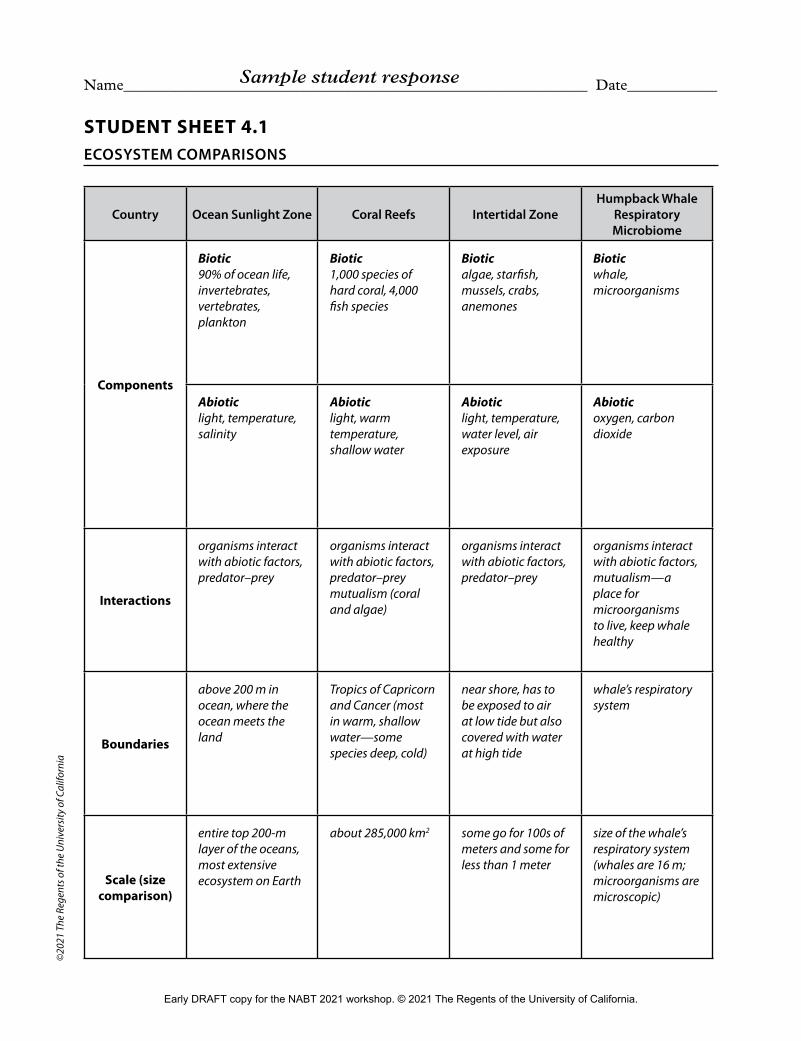
Name______________________________________________________________ Date____________
STUDENT SHEET 4.1ECOSYSTEM COMPARISONS
Country Ocean Sunlight Zone Coral Reefs Intertidal ZoneHumpback Whale
Respiratory Microbiome
Components
Biotic90% of ocean life, invertebrates, vertebrates, plankton
Biotic 1,000 species of hard coral, 4,000 fish species
Biotic algae, starfish, mussels, crabs, anemones
Biotic whale, microorganisms
Abiotic light, temperature, salinity
Abioticlight, warm temperature, shallow water
Abioticlight, temperature, water level, air exposure
Abioticoxygen, carbon dioxide
Interactions
organisms interact with abiotic factors, predator–prey
organisms interact with abiotic factors, predator–prey mutualism (coral and algae)
organisms interact with abiotic factors, predator–prey
organisms interact with abiotic factors, mutualism—a place for microorganisms to live, keep whale healthy
Boundaries
above 200 m in ocean, where the ocean meets the land
Tropics of Capricorn and Cancer (most in warm, shallow water—some species deep, cold)
near shore, has to be exposed to air at low tide but also covered with water at high tide
whale’s respiratory system
Scale (size comparison)
entire top 200-m layer of the oceans, most extensive ecosystem on Earth
about 285,000 km2 some go for 100s of meters and some for less than 1 meter
size of the whale’s respiratory system (whales are 16 m; microorganisms are microscopic)
©20
21 T
he R
egen
ts o
f the
Uni
vers
ity o
f Cal
iforn
ia
Sample student response
Early DRAFT copy for the NABT 2021 workshop. © 2021 The Regents of the University of California.
ECOLOGY 75
5 Patterns of Biological Diversityi n v e s t i g at i o n
2 class sessions
ACTIVITY OVERVIEW
STORYLINE
At this point, students have an understanding that all ecosystems have common features and differences. In this activity, students look for patterns in data on species diversity in ecosystems to try to determine cause-and-effect relationships that might explain these patterns. They build on what they have learned about coral reef distribution related to temperature: Corals are generally found in warm water, but they can also be found in cooler waters and may not be found in some warm-water areas. Understanding that there are exceptions to the patterns in the data helps students realize that they need to analyze data for additional factors to fully explain the patterns they are seeing. Students look at distribution patterns for four groups of vertebrates in the U.S.: birds, mammals, reptiles, and amphibians. They compare these distribution patterns to data for several ecosystem factors to build on their understanding of how ecosystem interactions affect patterns of biological diversity.
SENSEMAKING PROGRESSION
• Students begin to fill any gaps in their understanding of why some places or ecosystems have more biological diversity than others.
• Students develop an initial explanation for the biological diversity patterns they observe in one group of organisms: coral. They then analyze additional data and revise their explanations accordingly.
• Key sensemaking: After examining a map of an abiotic factor, students develop initial explanations for the distribution of a group of vertebrates throughout the United States. They examine four additional maps and use that infor-mation to revise their initial explanations. This key sensemaking opportunity occurs in Build Understanding item 1.
• Students add to their explanation of the investigative phenomenon for this learning sequence (Coral reefs do not all look the same and can be quite different from one another in several ways).
• Going forward: In the next learning sequence, students examine factors that may disrupt ecosystems and cause biological diversity to decrease.
Early DRAFT copy for the NABT 2021 workshop. © 2021 The Regents of the University of California.
ACTIVITY 5 PATTERNS OF BIOLOGICAL DIVERSITY
76 ECOLOGY
NGSS INTEGRATION
Students examine quantitative data, represented on maps, for five different groups of organisms to identify patterns in their distribution across the United States or the world. Students look at one map and develop an initial explanation for what might cause the different distribution patterns they observe. After examining maps of additional abiotic factors that might help explain these patterns, students revise their explanations. This activity provides an opportunity to assess Performance Expectation HS-LS2-2.
NGSS CORRELATIONS
Performance Expectations
Assessing HS-LS2-2: Use mathematical representations to support and revise expla-nations based on evidence about factors affecting biodiversity and populations in ecosystems of different scales.
Disciplinary Core Ideas
Primary
HS-LS2.A Interdependent Relationships in Ecosystems: Ecosystems have carrying capac-ities, which are limits to the numbers of organisms and populations they can support. These limits result from such factors as the availability of living and nonliving resources and from such challenges such as predation, competition, and disease. Organisms would have the capacity to produce populations of great size were it not for the fact that environments and resources are finite. This fundamental tension affects the abundance (number of individuals) of species in any given ecosystem.
Supporting
HS-LS2.C Ecosystem Dynamics, Functioning, and Resilience: A complex set of inter-actions within an ecosystem can keep its numbers and types of organisms relatively constant over long periods of time under stable conditions. If a modest biological or physical disturbance to an ecosystem occurs, it may return to its more or less original status (i.e., the ecosystem is resilient), as opposed to becoming a very different ecosystem. Extreme fluctuations in conditions or the size of any popula-tion, however, can challenge the functioning of ecosystems in terms of resources and habitat availability.
Science and Engineering Practices
Analyzing and Interpreting Data: Analyze data using tools, technologies, and/or models (e.g., computational, mathematical) in order to make valid and reliable scientific claims or determine an optimal design solution.
S
D
P
Early DRAFT copy for the NABT 2021 workshop. © 2021 The Regents of the University of California.
ACTIVITY 5 PATTERNS OF BIOLOGICAL DIVERSITY
ECOLOGY 77
Constructing Explanations and Designing Solutions: Make a quantitative and/or qualitative claim regarding the relationship between dependent and independent variables.
Using Mathematics and Computational Thinking: Use mathematical representations of phenomena or design solutions to support and revise explanations.
Connections to Nature of Science: Scientific Knowledge is Open to Revision in Light of New Evidence: Most scientific knowledge is quite durable, but is, in principle, subject to change based on new evidence and/or reinterpretation of existing evidence.
Crosscutting Concepts
Scale, Proportion, and Quantity: Using the concept of orders of magnitude allows one to understand how a model at one scale relates to a model at another scale.
Patterns: Different patterns may be observed at each of the scales at which a system is studied and can provide evidence for causality in explanations of phenomena.
Cause and Effect: Empirical evidence is required to differentiate between cause and correlation and make claims about specific causes and effects.
Common Core State Standards—Mathematics
MP.2: Reason abstractly and quantitatively.
MP.4: Model with mathematics.
Common Core State Standards—ELA/Literacy
RST.11-12.5: Cite specific textual evidence to support analysis of science and technical texts, attending to important distinctions the author makes and to any gaps or inconsistencies in the account.
MATERIALS AND ADVANCE PREPARATION
■ For the teacher
Scoring Guide: item-specific – pe-hs-ls2-3
■ For each group of four students
Vertebrate Diversity Map set of five Abiotic Factor Maps
■ For each student
Student Sheet 5.1, “Writing Frame–Constructing Explanations” (optional) Student Sheet 5.2, “Writing Review” (optional) Scoring Guide: constructing explanations (exp) (optional)
C
M
E
Early DRAFT copy for the NABT 2021 workshop. © 2021 The Regents of the University of California.
ACTIVITY 5 PATTERNS OF BIOLOGICAL DIVERSITY
78 ECOLOGY
The item-specific – pe-hs-ls2-3 Scoring Guide for teacher use can be found at the end of this activity. The constructing explanations (exp) Scoring Guide for student use can be found in Appendix C in the Student Book.
TEACHING STEPS
GET STARTED
Students begin to consider whether all places have the same number of species.
1. Ask students if they think all places have the same number of species.
Depending on your student population, they may never have thought about this question before. Conversely, they may come from or have visited places with many more species and can easily answer this question. Accept all reason-able responses. Let students know that they will investigate this idea further, and direct them to read the introduction and the guiding question for this activity (What patterns of biological diversity occur for different groups of organisms, and what might cause these patterns?).
DO THE ACTIVITY
In Part A, students explore patterns in the diversity of coral species throughout the world.
2. Introduce the crosscutting concept of patterns.
Review the symbol for patterns in Appendix G in the Student Book. Explain that a pattern can be structural, as shown in the diagram, or a pattern in events, such as the phases of the moon. Point out to students that seeing patterns in nature can lead scientists to organize and classify their observa-tions. It can also lead them to ask questions about relationships and the causes of patterns. Students will look for patterns when they analyze and interpret data, ask questions about the patterns they observe, and suggest cause-and-effect relationships to explain patterns. Tell students that they will now take a closer look at patterns in the diversity of coral species throughout the world.
Have students work on Procedure Steps 1–3 in their groups. Circulate throughout the room as groups examine the map of coral diversity in Step 1, asking Probe Questions if they are struggling to make sense of the map. Encourage them to refer to the description of coral reefs in the previous activity. When groups seem to have finished examining the map, have a couple of groups share their initial explanations for the distribution pattern.
Incorporate strategies to ensure that all students participate over time. In this activity, pay attention to group dynamics and try to ensure equal participation among members. Consider assigning roles (e.g., facilitator, recorder), and
Crosscutting Concepts
Early DRAFT copy for the NABT 2021 workshop. © 2021 The Regents of the University of California.
ACTIVITY 5 PATTERNS OF BIOLOGICAL DIVERSITY
ECOLOGY 79
circulate among the groups to encourage students to fulfill these roles. Use strategic questions to draw out the thoughts of quieter students.
Procedure Step 2 provides a map of ocean surface temperatures. Students are likely to notice that coral reefs tend to be found where ocean surface tempera-tures are higher. Thus, they may conclude that temperature is causing the pattern in coral diversity. After students have spent a few minutes discussing this, briefly bring the class together and ask students if they think ocean surface temperature can completely explain coral diversity.
3. Use Challenge Questions from the sensemaking strategy of Elicit, Probe, and Challenge Questions to encourage individual students to develop a deeper understanding or change their thinking about the conclusions they are making based on the patterns in the data.
Ask individual students Challenge Questions, such as:
• Do you notice any exceptions to that pattern?
• How does what you see here relate to your interpretation of the data?
• Does the data here align with your thinking?
These questions should help students see that while coral diversity is usually low in colder areas, there are also several warm places in the ocean that have very little coral (e.g., off the west coast of South America). This distribution pattern indicates that temperature may be important in determining coral diversity, but it cannot be the only factor.
Procedure Step 3 provides a map of an additional environmental factor: ocean depth. Be sure that students notice the map legend and that the colors on this map indicate a different scale (in this case, the red end of the spectrum indi-cates positive ocean depth—ice floating above sea level) than on the previous maps. Students consider whether the factor of ocean depth can explain the map of coral diversity. As with temperature, while ocean depth appears to be important, it cannot entirely explain the pattern. While there are almost no deep areas with coral, there are also many shallow places that do not have coral (e.g., off the coast of Antarctica).
4. Have students use the additional data they’ve gathered to revise their explana-tions for coral reef diversity.
Procedure Step 4 asks students to consider both ocean surface temperature and ocean depth as they revise their explanations. They should see that coral reefs are generally found where temperatures are warm and the ocean is shallow. Facilitate a brief class discussion on how adding more evidence helps scientists develop better explanations for patterns in data.
Elicit, Probe, Challenge
Early DRAFT copy for the NABT 2021 workshop. © 2021 The Regents of the University of California.
ACTIVITY 5 PATTERNS OF BIOLOGICAL DIVERSITY
80 ECOLOGY
5. Tell students that they will now investigate patterns in vertebrate group diver-sity in the United States.
In Part B, students investigate the pattern of diversity for a group of vertebrate organisms in the contiguous United States and develop a causal explanation for this pattern. Assign or let groups choose which of the four vertebrate groups they will examine: reptiles, amphibians, birds, or mammals. Ensure that at least two groups examine each of the four groups. Groups should obtain the respective Vertebrate Diversity Map, which includes a brief description of that group. Allow students a few minutes to complete Procedure Step 6, in which they read about their vertebrate group and study the diversity map.
Distribute a set of five Abiotic Factor Maps to each group, and have them pull out Abiotic Factor 1: Elevation and Topography Map. Review the map as a class to model how students can compare the Abiotic Factor Maps to their Vertebrate Diversity Maps. Make sure that students understand how to read and use this map. If students have trouble interpreting the map, pose Elicit Questions, such as, “What do the brown areas represent?” (Mountains and high elevations) Have each group compare the map to their Vertebrate Diversity Map, look for patterns, and then share their observations with the class. Students will likely notice that there seems to be some correlation between mammal diversity and elevation, but the pattern is less clear for the other vertebrate groups.
Have student groups continue on their own with their vertebrate group and the remaining Abiotic Factor Maps, following Procedure Steps 8–10. Circulate throughout the room as groups work through the process of trying to explain the pattern of diversity based on the factors they examine. Ask Probe Questions as students begin examining the maps, and Challenge Questions as they begin to develop and revise their explanations. If groups are struggling, suggest that they confer with another student group who is examining the same vertebrate group.
BUILD UNDERSTANDING
Students revise their explanations for the pattern of diversity in their vertebrate group.
6. Facilitate a class discussion about the factors that best explain the pattern of diversity for the four groups of organisms.
Because at least two student groups will have examined each vertebrate group, have one student group share their ideas; the other group or groups may then add any ways that their ideas differ. Ask groups to share the process they went through to revise their ideas as they examined more factors.
Early DRAFT copy for the NABT 2021 workshop. © 2021 The Regents of the University of California.
ACTIVITY 5 PATTERNS OF BIOLOGICAL DIVERSITY
ECOLOGY 81
Just like with the examination of coral diversity, students probably discov-ered that examining more factors led to a better explanation of the diversity patterns. They also may have examined some factors that didn’t appear to be important in explaining the diversity pattern of their particular vertebrate group.
7. (literacy) (key sensemaking) (assessment, HS-LS2-2) Use Build Understanding item 1 to assess Performance Expectation HS-LS2-2.
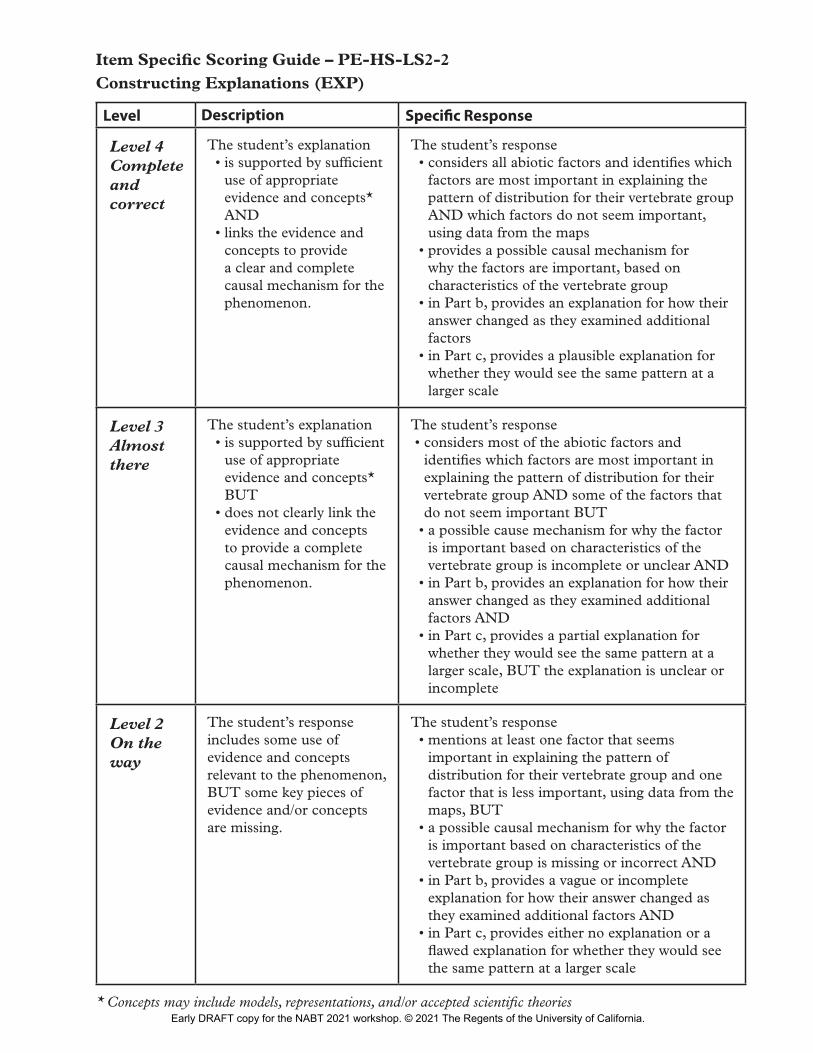
You can use the item-specific – pe-hs-ls2-2 Scoring Guide (which is based on the exp Scoring Guide) to assess students’ responses to Build Understanding item 1, which is also an opportunity to assess Performance Expectation HS-LS2-2: Use mathematical representations to support and revise explana-tions based on evidence about factors affecting biodiversity and populations in ecosystems of different scales. Sample responses for all four scoring levels (Levels 1–4) are shown in Sample Responses to Build Understanding.
Build Understanding item 1 is the key sensemaking opportunity in this activity. Have students respond to this item independently in order to assess their understanding of the Performance Expectation and provide feedback.
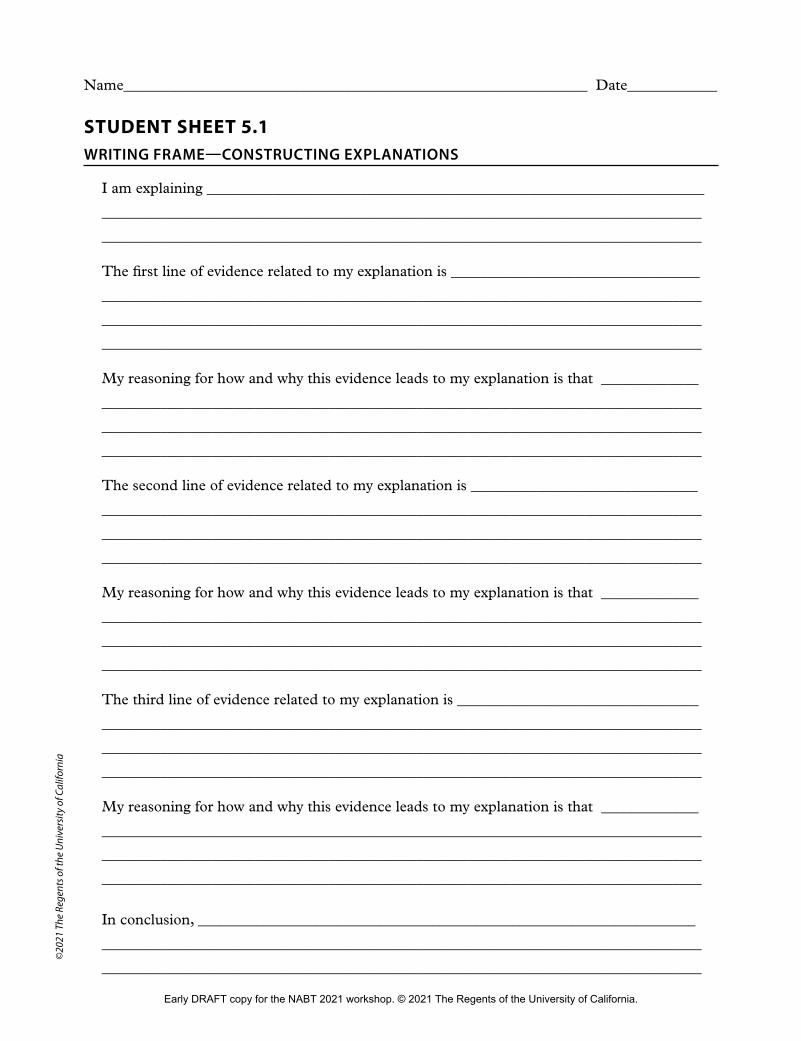
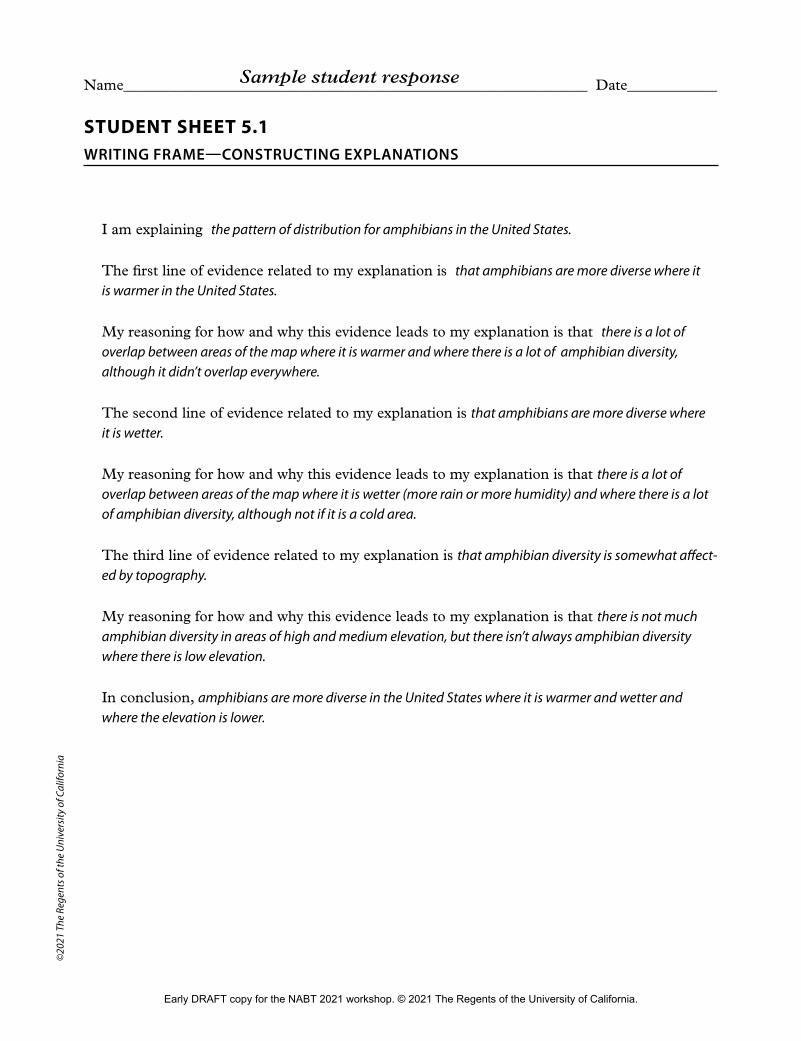
Consider having students use Student Sheet 5.1, “Writing Frame—Constructing Explanations” (which can also be found in Appendix A in the Student Book), as a scaffold for students to write their responses to Build Understanding item 1. A sample student response for Student Sheet 5.1 is provided at the end of this activity.
Note that this Writing Frame does not include parts b or c of item 1, which are important for assessing all three dimensions of the Performance Expectation.
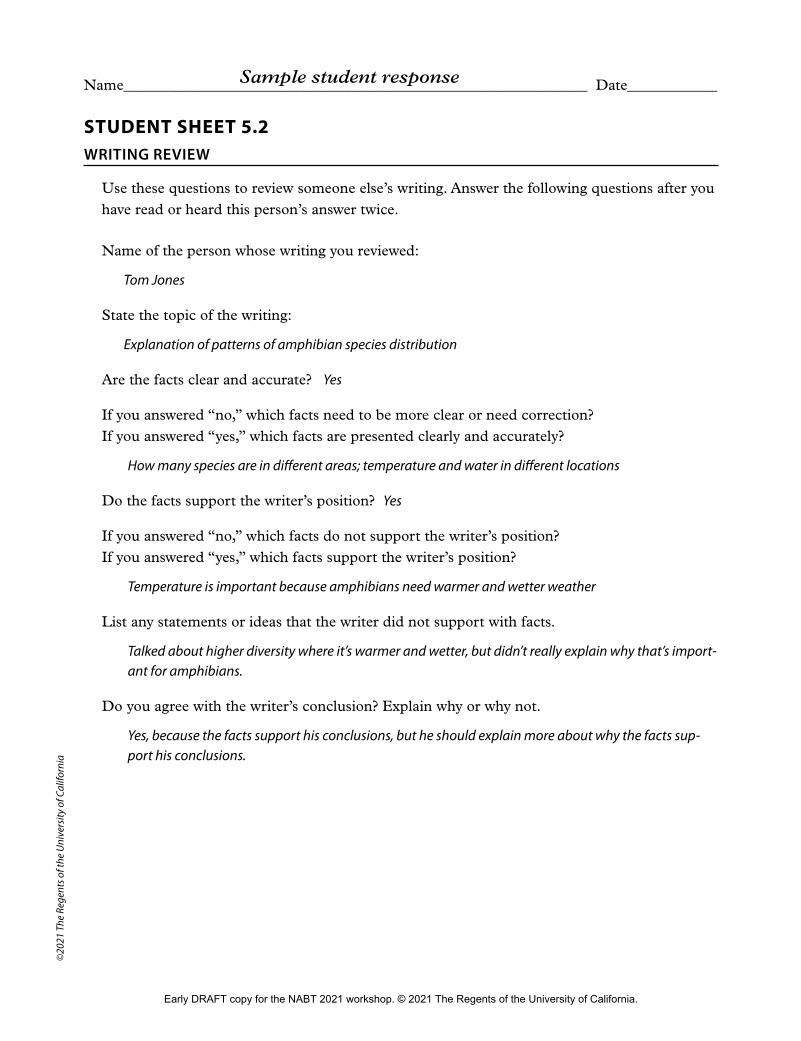
As students complete their written descriptions of patterns of species distri-bution during Build Understanding item 1, you may wish to have them use the Writing Review literacy strategy to conduct a peer review of each other’s written work. A peer Writing Review presents a series of questions that students use to evaluate each other’s writing. This strategy can be especially helpful in guiding students on how to write a complex and coherent response. Students can compare others’ responses to the review questions to improve or revise their own writing. To support students in this literacy strategy, distribute Student Sheet 5.2, “Writing Review” (which can also be found in Appendix A in the Student Book). A sample student response for Student Sheet 5.2 can be found at the end of this activity.
8. Have students complete Build Understanding items 2 through 4.
You may wish to facilitate a class discussion on Build Understanding item 2, which asks students to compare and contrast their explanations for the
Learning Pathways
Writing Review
Early DRAFT copy for the NABT 2021 workshop. © 2021 The Regents of the University of California.
ACTIVITY 5 PATTERNS OF BIOLOGICAL DIVERSITY
82 ECOLOGY
distribution of another group of vertebrates. You might also consider asking students if they can predict global patterns of these different groups.
Build Understanding item 3 asks students to return to the coral reef photo-graphs at the start of the learning sequence. It is the second sensemaking opportunity in this activity for the investigative phenomenon for this learning sequence: Coral reefs do not all look the same and can be quite different from one another in several ways. Have students record their ideas in their science note-books; they will return to these ideas in the next activity.
Build Understanding item 4 relates the idea of species diversity to the unit issue of sustainable fisheries. Students can discuss their ideas with their group members or respond individually, or you may wish to facilitate a class discussion.
9. Return to the guiding question and Driving Questions Board to complete this learning sequence.
Have students revisit the guiding question for this activity: What patterns of biological diversity occur for different groups of organisms, and what might cause these patterns? Students should be able to offer several ideas from this activity—but, more importantly, they should have noticed that a combination of factors cause many of these patterns, rather than a single factor.
This provides a good opportunity to revisit the Driving Questions Board, note the questions that students answered in this learning sequence, and add any new questions students have, particularly about additional factors that might affect biological diversity. Tell students that in the next learning sequence, they will deepen their understanding of ecosystem interactions, many of which are important factors in patterns of biological diversity on different scales.
SAMPLE RESPONSES TO BUILD UNDERSTANDING
1. (exp assessment, HS-LS2-2) For the group of vertebrate organisms that you examined:
a. Write an explanation that can account for the pattern of species distribu-tion. Be sure to discuss all the factors and to use data from the maps to support your explanation.
b. How did your explanation change as you examined more factors?
c. Imagine that you were looking at the map for your vertebrate group but on a global scale—like the coral maps you examined. Would you expect to see the same patterns of species distribution in other locations in the world? Why or why not?
Completing a Learning Sequence
Early DRAFT copy for the NABT 2021 workshop. © 2021 The Regents of the University of California.
ACTIVITY 5 PATTERNS OF BIOLOGICAL DIVERSITY
ECOLOGY 83
SAMPLE LEVEL 4 STUDENT RESPONSE
a. We examined the amphibian map, and we saw that amphibians are most diverse in the southeastern part of the United States, with 46 species, and not very diverse in the western and northern parts, where some places have only 1 species. We saw that several factors seem to be important in explaining the pattern. The southern half of the U.S. is warmer, with higher mean minimum and maximum temperatures. Because amphibians are cold-blooded animals, they need warmer temperatures. This is why they are more diverse in hotter places. But because amphibians are not diverse in the Southwest where it is also hot, there must be additional factors. We saw that the Southeast is also wetter. Because amphibians live on both land and in water, amphibians must live in places that have enough water. There is not as much overlap between amphibian diversity and elevation, although amphibians are less diverse at higher and medium elevations.
b. I first thought that temperature would be the most important factor, but that couldn’t explain why there aren’t more amphibians in the Southwest. When I looked at rainfall and humidity, I started thinking that what matters is a combination of how wet it is and temperature.
c. I think you would mostly see the same types of patterns of distribution related to abiotic factors because amphibians would likely still be more diverse in warmer, wetter locations because of their biological needs. There might be some additional factors that made the patterns more complicated because it’s on a larger scale, but I don’t think it would be too different.
SAMPLE LEVEL 3 STUDENT RESPONSE
a. We examined the amphibian map, and we saw that amphibians are most diverse in the southeastern part of the United States and not very diverse in the western part. There are 46 species in the Southeast but only 1 species in some other places. We saw that several factors seem to be important in explaining the pattern. The southern half of the U.S. is warmer. But because amphibians are not diverse in the Southwest where it is also hot, there must be additional factors. We saw that the Southeast is also wetter. It didn’t seem like elevation was important.
b. I first thought that temperature would be the most important factor, but that couldn’t explain why there aren’t more amphibians in the Southwest. When I looked at rainfall and humidity, I started thinking that what matters is a combination of how wet it is and temperature.
c. I think you would mostly see the same types of patterns of distribution related to abiotic factors because amphibians would likely still be more diverse in warmer, wetter locations.
Early DRAFT copy for the NABT 2021 workshop. © 2021 The Regents of the University of California.
ACTIVITY 5 PATTERNS OF BIOLOGICAL DIVERSITY
84 ECOLOGY
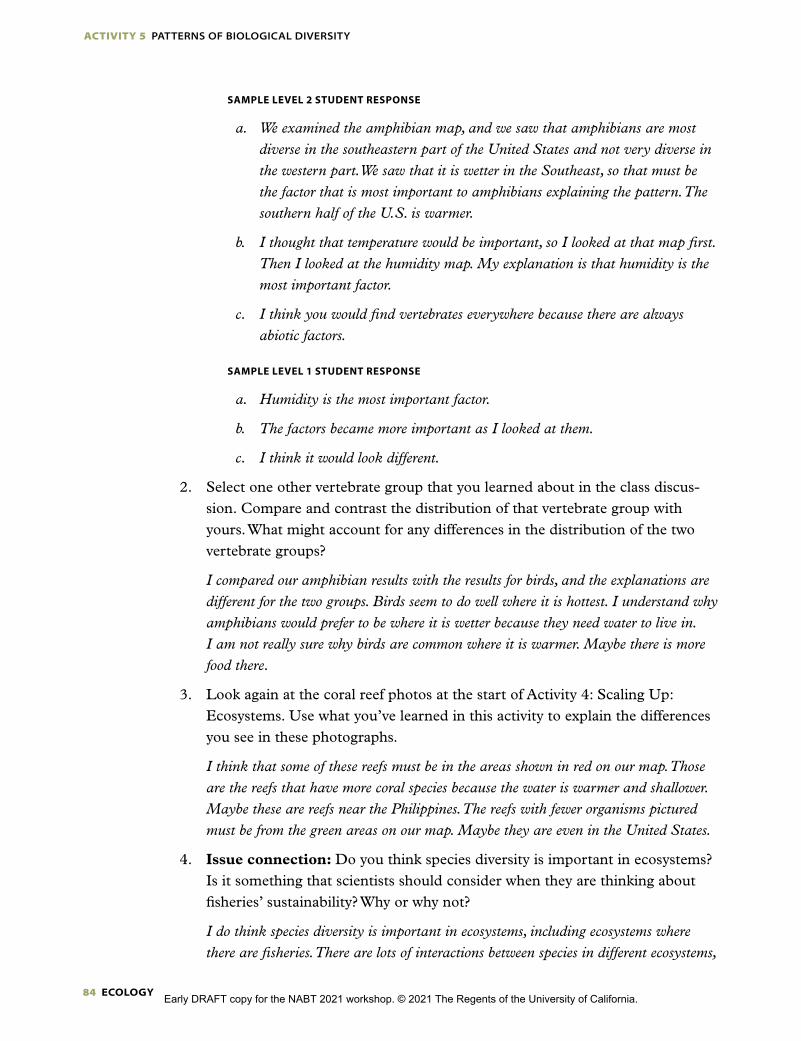
SAMPLE LEVEL 2 STUDENT RESPONSE
a. We examined the amphibian map, and we saw that amphibians are most diverse in the southeastern part of the United States and not very diverse in the western part. We saw that it is wetter in the Southeast, so that must be the factor that is most important to amphibians explaining the pattern. The southern half of the U.S. is warmer.
b. I thought that temperature would be important, so I looked at that map first. Then I looked at the humidity map. My explanation is that humidity is the most important factor.
c. I think you would find vertebrates everywhere because there are always abiotic factors.
SAMPLE LEVEL 1 STUDENT RESPONSE
a. Humidity is the most important factor.
b. The factors became more important as I looked at them.
c. I think it would look different.
2. Select one other vertebrate group that you learned about in the class discus-sion. Compare and contrast the distribution of that vertebrate group with yours. What might account for any differences in the distribution of the two vertebrate groups?
I compared our amphibian results with the results for birds, and the explanations are different for the two groups. Birds seem to do well where it is hottest. I understand why amphibians would prefer to be where it is wetter because they need water to live in. I am not really sure why birds are common where it is warmer. Maybe there is more food there.
3. Look again at the coral reef photos at the start of Activity 4: Scaling Up: Ecosystems. Use what you’ve learned in this activity to explain the differences you see in these photographs.
I think that some of these reefs must be in the areas shown in red on our map. Those are the reefs that have more coral species because the water is warmer and shallower. Maybe these are reefs near the Philippines. The reefs with fewer organisms pictured must be from the green areas on our map. Maybe they are even in the United States.
4. Issue connection: Do you think species diversity is important in ecosystems? Is it something that scientists should consider when they are thinking about fisheries’ sustainability? Why or why not?
I do think species diversity is important in ecosystems, including ecosystems where there are fisheries. There are lots of interactions between species in different ecosystems,
Early DRAFT copy for the NABT 2021 workshop. © 2021 The Regents of the University of California.
ACTIVITY 5 PATTERNS OF BIOLOGICAL DIVERSITY
ECOLOGY 85
especially predator–prey interactions. It seems like having diverse species would be important for those interactions and for the sustainability of those ecosystems. For example, in the ecosystem where the yellow perch live, the perch might be able to eat a bunch of different species, so if the ecosystem stays diverse, the perch would continue to have food sources. But if the diversity went down for some reason, the perch would have fewer prey options, and that might make their population less sustainable.
ACTIVITY RESOURCES
KEY SCIENTIFIC TERMS
biological diversity
Early DRAFT copy for the NABT 2021 workshop. © 2021 The Regents of the University of California.
ACTIVITY 5 PATTERNS OF BIOLOGICAL DIVERSITY
86 ECOLOGY
Ecology 5: Patterns of Biological Diversity
i n v e s t i g at i o n
2 class sessions
TEACHING SUMMARY
GET STARTED
1. Ask students if they think all places have the same number of species.
DO THE ACTIVITY
2. Introduce the crosscutting concept of patterns.
3. Use Challenge Questions from the sensemaking strategy of Elicit, Probe, and Challenge Questions to encourage individual students to develop a deeper understanding or change their thinking about the conclusions they are making based on the patterns in the data.
4. Have students use the additional data they’ve gathered to revise their explana-tions for coral reef diversity.
5. Tell students that they will now investigate patterns in vertebrate group diver-sity in the United States.
BUILD UNDERSTANDING
6. Facilitate a class discussion about the factors that best explain the pattern of diversity for the four groups of organisms.
7. (literacy) (key sensemaking) (assessment, HS-LS2-2) Use Build Understanding item 1 to assess Performance Expectation HS-LS2-2.
8. Have students complete Build Understanding items 2 through 4.
9. Return to the guiding question and Driving Questions Board to complete this learning sequence.
Early DRAFT copy for the NABT 2021 workshop. © 2021 The Regents of the University of California.
Name______________________________________________________________ Date____________
STUDENT SHEET 5.1WRITING FRAME—CONSTRUCTING EXPLANATIONS
I am explaining ____________________________________________________________________
__________________________________________________________________________________
__________________________________________________________________________________
The first line of evidence related to my explanation is __________________________________
__________________________________________________________________________________
__________________________________________________________________________________
__________________________________________________________________________________
My reasoning for how and why this evidence leads to my explanation is that _____________
__________________________________________________________________________________
__________________________________________________________________________________
__________________________________________________________________________________
The second line of evidence related to my explanation is _______________________________
__________________________________________________________________________________
__________________________________________________________________________________
__________________________________________________________________________________
My reasoning for how and why this evidence leads to my explanation is that _____________
__________________________________________________________________________________
__________________________________________________________________________________
__________________________________________________________________________________
The third line of evidence related to my explanation is _________________________________
__________________________________________________________________________________
__________________________________________________________________________________
__________________________________________________________________________________
My reasoning for how and why this evidence leads to my explanation is that _____________
__________________________________________________________________________________
__________________________________________________________________________________
__________________________________________________________________________________
In conclusion, ____________________________________________________________________
__________________________________________________________________________________
__________________________________________________________________________________
©20
21 T
he R
egen
ts o
f the
Uni
vers
ity o
f Cal
iforn
ia
Early DRAFT copy for the NABT 2021 workshop. © 2021 The Regents of the University of California.
Name______________________________________________________________ Date____________
STUDENT SHEET 5.1WRITING FRAME—CONSTRUCTING EXPLANATIONS
I am explaining the pattern of distribution for amphibians in the United States.
The first line of evidence related to my explanation is that amphibians are more diverse where it is warmer in the United States.
My reasoning for how and why this evidence leads to my explanation is that there is a lot of overlap between areas of the map where it is warmer and where there is a lot of amphibian diversity, although it didn’t overlap everywhere.
The second line of evidence related to my explanation is that amphibians are more diverse where it is wetter.
My reasoning for how and why this evidence leads to my explanation is that there is a lot of overlap between areas of the map where it is wetter (more rain or more humidity) and where there is a lot of amphibian diversity, although not if it is a cold area.
The third line of evidence related to my explanation is that amphibian diversity is somewhat affect-ed by topography.
My reasoning for how and why this evidence leads to my explanation is that there is not much amphibian diversity in areas of high and medium elevation, but there isn’t always amphibian diversity where there is low elevation.
In conclusion, amphibians are more diverse in the United States where it is warmer and wetter and where the elevation is lower.
©20
21 T
he R
egen
ts o
f the
Uni
vers
ity o
f Cal
iforn
ia
Sample student response
Early DRAFT copy for the NABT 2021 workshop. © 2021 The Regents of the University of California.

Name______________________________________________________________ Date____________
STUDENT SHEET 5.2WRITING REVIEW
Use these questions to review someone else’s writing. Answer the following questions after you have read or heard this person’s answer twice.
Name of the person whose writing you reviewed:
__________________________________________________________________________________
State the topic of the writing:
__________________________________________________________________________________
__________________________________________________________________________________
__________________________________________________________________________________
Are the facts clear and accurate? ____________________________________________________ If you answered “no,” which facts need to be more clear or need correction? If you answered “yes,” which facts are presented clearly and accurately?
__________________________________________________________________________________
__________________________________________________________________________________
__________________________________________________________________________________
__________________________________________________________________________________
Do the facts support the writer’s position? ____________________________________________ If you answered “no,” which facts do not support the writer’s position? If you answered “yes,” which facts support the writer’s position?
__________________________________________________________________________________
__________________________________________________________________________________
__________________________________________________________________________________
List any statements or ideas that the writer did not support with facts.
__________________________________________________________________________________
__________________________________________________________________________________
Do you agree with the writer’s conclusion? Explain why or why not.
__________________________________________________________________________________
__________________________________________________________________________________
©20
21 T
he R
egen
ts o
f the
Uni
vers
ity o
f Cal
iforn
ia
Early DRAFT copy for the NABT 2021 workshop. © 2021 The Regents of the University of California.
Name______________________________________________________________ Date____________
STUDENT SHEET 5.2WRITING REVIEW
Use these questions to review someone else’s writing. Answer the following questions after you have read or heard this person’s answer twice.
Name of the person whose writing you reviewed:
Tom Jones
State the topic of the writing:
Explanation of patterns of amphibian species distribution
Are the facts clear and accurate? Yes
If you answered “no,” which facts need to be more clear or need correction? If you answered “yes,” which facts are presented clearly and accurately?
How many species are in different areas; temperature and water in different locations
Do the facts support the writer’s position? Yes
If you answered “no,” which facts do not support the writer’s position? If you answered “yes,” which facts support the writer’s position?
Temperature is important because amphibians need warmer and wetter weather
List any statements or ideas that the writer did not support with facts.
Talked about higher diversity where it’s warmer and wetter, but didn’t really explain why that’s import-ant for amphibians.
Do you agree with the writer’s conclusion? Explain why or why not.
Yes, because the facts support his conclusions, but he should explain more about why the facts sup-port his conclusions.
©20
21 T
he R
egen
ts o
f the
Uni
vers
ity o
f Cal
iforn
ia
Sample student response
Early DRAFT copy for the NABT 2021 workshop. © 2021 The Regents of the University of California.
Level Description Specific Response
Level 4Complete andcorrect
The student’s explanation• is supported by sufficient
use of appropriateevidence and concepts*AND
• links the evidence andconcepts to providea clear and completecausal mechanism for thephenomenon.
The student’s response• considers all abiotic factors and identifies which
factors are most important in explaining thepattern of distribution for their vertebrate groupAND which factors do not seem important,using data from the maps
• provides a possible causal mechanism forwhy the factors are important, based oncharacteristics of the vertebrate group
• in Part b, provides an explanation for how theiranswer changed as they examined additionalfactors
• in Part c, provides a plausible explanation forwhether they would see the same pattern at alarger scale
Level 3Almost there
The student’s explanation• is supported by sufficient
use of appropriateevidence and concepts*BUT
• does not clearly link theevidence and conceptsto provide a completecausal mechanism for thephenomenon.
The student’s response• considers most of the abiotic factors and
identifies which factors are most important inexplaining the pattern of distribution for theirvertebrate group AND some of the factors thatdo not seem important BUT
• a possible cause mechanism for why the factoris important based on characteristics of thevertebrate group is incomplete or unclear AND
• in Part b, provides an explanation for how theiranswer changed as they examined additionalfactors AND
• in Part c, provides a partial explanation forwhether they would see the same pattern at alarger scale, BUT the explanation is unclear orincomplete
Level 2On the way
The student’s response includes some use of evidence and concepts relevant to the phenomenon, BUT some key pieces of evidence and/or concepts are missing.
The student’s response• mentions at least one factor that seems
important in explaining the pattern ofdistribution for their vertebrate group and onefactor that is less important, using data from themaps, BUT
• a possible causal mechanism for why the factoris important based on characteristics of thevertebrate group is missing or incorrect AND
• in Part b, provides a vague or incompleteexplanation for how their answer changed asthey examined additional factors AND
• in Part c, provides either no explanation or aflawed explanation for whether they would seethe same pattern at a larger scale
Item Specific Scoring Guide – PE-HS-LS2-2 Constructing Explanations (EXP)
* Concepts may include models, representations, and/or accepted scientific theoriesEarly DRAFT copy for the NABT 2021 workshop. © 2021 The Regents of the University of California.
Level Description Specific Response
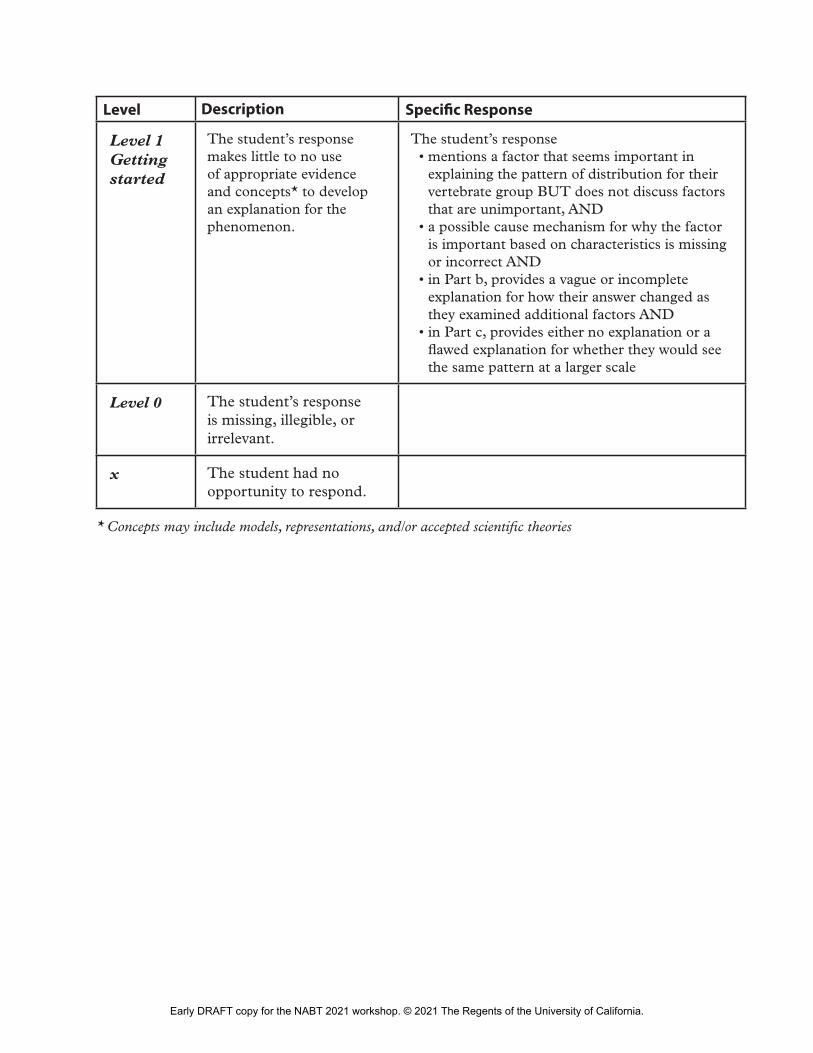
Level 1Getting started
The student’s response makes little to no use of appropriate evidence and concepts* to develop an explanation for the phenomenon.
The student’s response• mentions a factor that seems important in
explaining the pattern of distribution for theirvertebrate group BUT does not discuss factorsthat are unimportant, AND
• a possible cause mechanism for why the factoris important based on characteristics is missingor incorrect AND
• in Part b, provides a vague or incompleteexplanation for how their answer changed asthey examined additional factors AND
• in Part c, provides either no explanation or aflawed explanation for whether they would seethe same pattern at a larger scale
Level 0 The student’s response is missing, illegible, or irrelevant.
x The student had no opportunity to respond.
* Concepts may include models, representations, and/or accepted scientific theories
Early DRAFT copy for the NABT 2021 workshop. © 2021 The Regents of the University of California.
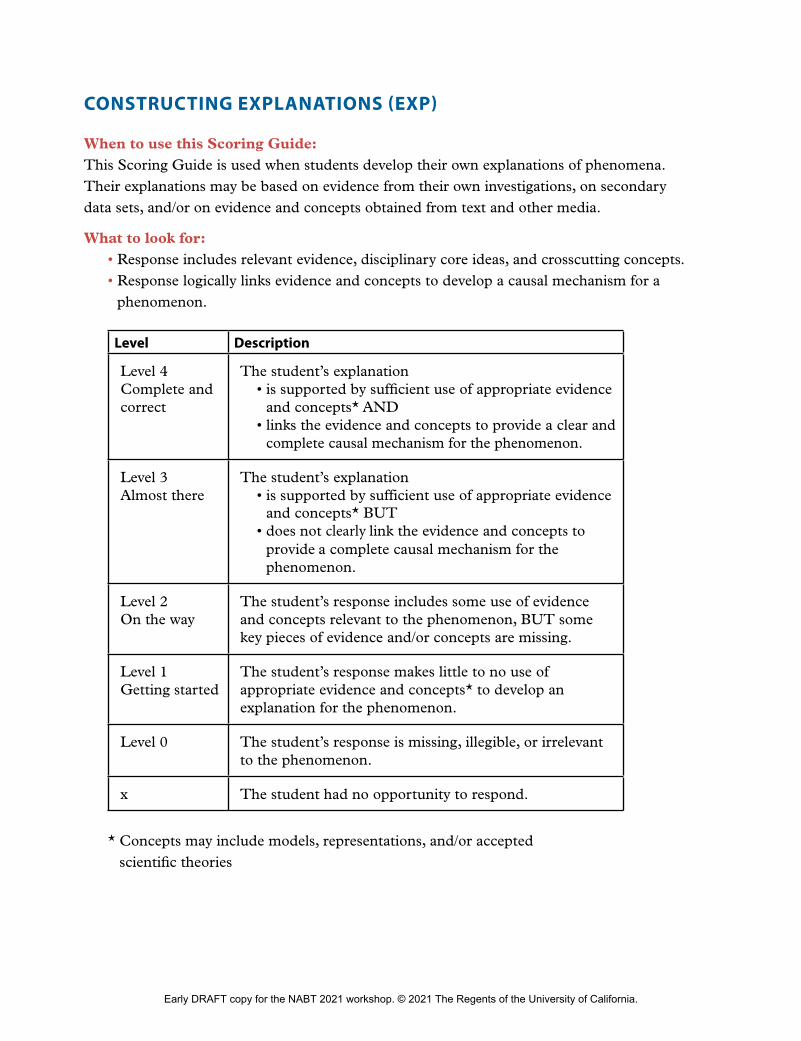
CONSTRUCTING EXPLANATIONS (EXP)
When to use this Scoring Guide:This Scoring Guide is used when students develop their own explanations of phenomena. Their explanations may be based on evidence from their own investigations, on secondary data sets, and/or on evidence and concepts obtained from text and other media.
What to look for:• Response includes relevant evidence, disciplinary core ideas, and crosscutting concepts.• Response logically links evidence and concepts to develop a causal mechanism for a
phenomenon.
Level Description
Level 4Complete andcorrect
The student’s explanation• is supported by sufficient use of appropriate evidence
and concepts* AND• links the evidence and concepts to provide a clear and
complete causal mechanism for the phenomenon.
Level 3Almost there
The student’s explanation• is supported by sufficient use of appropriate evidence
and concepts* BUT• does not clearly link the evidence and concepts to
provide a complete causal mechanism for thephenomenon.
Level 2On the way
The student’s response includes some use of evidence and concepts relevant to the phenomenon, BUT some key pieces of evidence and/or concepts are missing.
Level 1Getting started
The student’s response makes little to no use of appropriate evidence and concepts* to develop an explanation for the phenomenon.
Level 0 The student’s response is missing, illegible, or irrelevant to the phenomenon.
x The student had no opportunity to respond.
* Concepts may include models, representations, and/or acceptedscientific theories
Early DRAFT copy for the NABT 2021 workshop. © 2021 The Regents of the University of California.

Early DRAFT copy for the NABT 2021 workshop. © 2021 The Regents of the University of California.
NGSS AND COMMON CORE
ECOLOGY T-1
Activity NGSS IntegrationDisciplinaryCore Ideas
Science and Engineering
Practices
CrosscuttingConcepts
Common Core State Standards
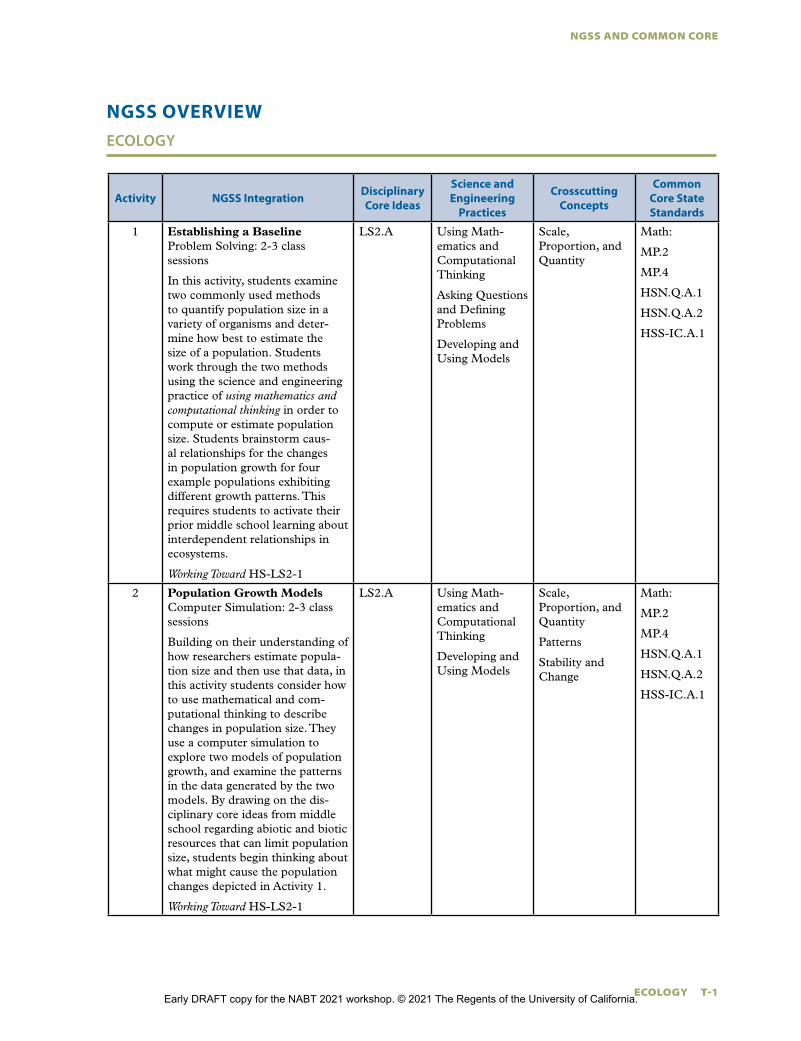
1 Establishing a BaselineProblem Solving: 2-3 class sessions
In this activity, students examine two commonly used methods to quantify population size in a variety of organisms and deter-mine how best to estimate the size of a population. Students work through the two methods using the science and engineering practice of using mathematics and computational thinking in order to compute or estimate population size. Students brainstorm caus-al relationships for the changes in population growth for four example populations exhibiting different growth patterns. This requires students to activate their prior middle school learning about interdependent relationships in ecosystems.
Working Toward HS-LS2-1
LS2.A Using Math-ematics and Computational Thinking
Asking Questions and Defining Problems
Developing and Using Models
Scale, Proportion, and Quantity
Math:
MP.2
MP.4
HSN.Q.A.1
HSN.Q.A.2
HSS-IC.A.1
2 Population Growth ModelsComputer Simulation: 2-3 class sessions
Building on their understanding of how researchers estimate popula-tion size and then use that data, in this activity students consider how to use mathematical and com-putational thinking to describe changes in population size. They use a computer simulation to explore two models of population growth, and examine the patterns in the data generated by the two models. By drawing on the dis-ciplinary core ideas from middle school regarding abiotic and biotic resources that can limit population size, students begin thinking about what might cause the population changes depicted in Activity 1.
Working Toward HS-LS2-1
LS2.A Using Math-ematics and Computational Thinking
Developing and Using Models
Scale, Proportion, and Quantity
Patterns
Stability and Change
Math:
MP.2
MP.4
HSN.Q.A.1
HSN.Q.A.2
HSS-IC.A.1
Early DRAFT copy for the NABT 2021 workshop. © 2021 The Regents of the University of California.
NGSS OVERVIEWECOLOGY
NGSS AND COMMON CORE
T-2 ECOLOGY
Activity NGSS IntegrationDisciplinaryCore Ideas
Science and Engineering
Practices
CrosscuttingConcepts
Common Core State Standards
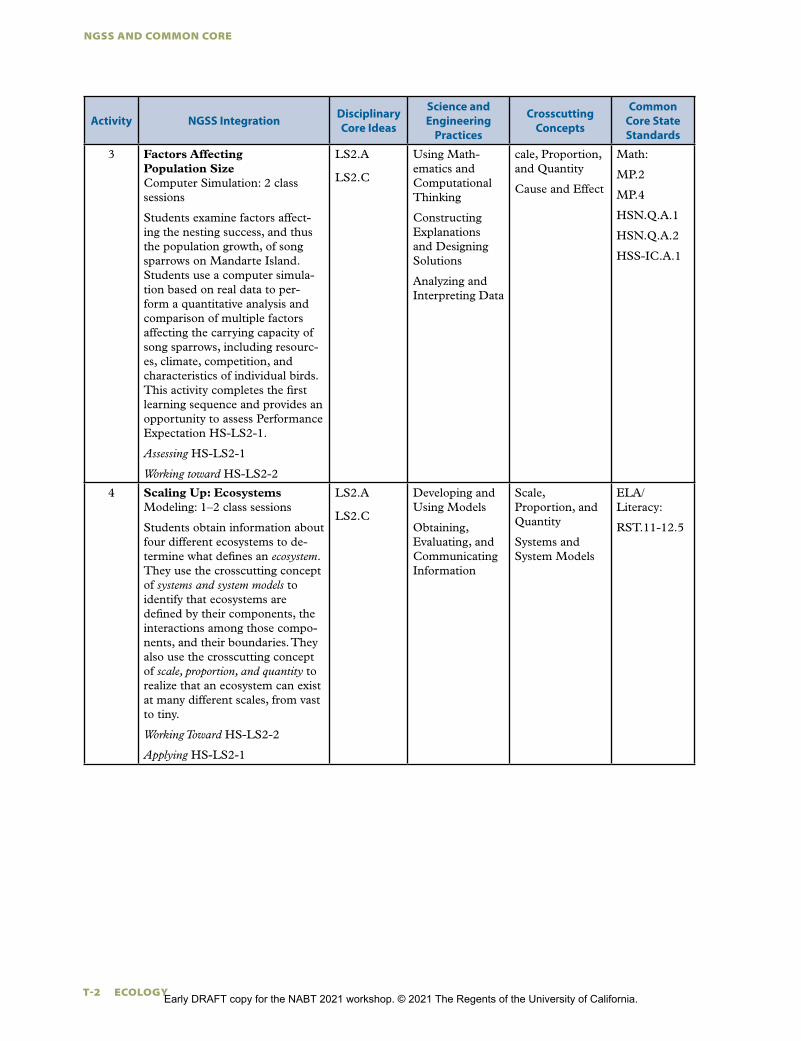
3 Factors Affecting Population SizeComputer Simulation: 2 class sessions
Students examine factors affect-ing the nesting success, and thus the population growth, of song sparrows on Mandarte Island. Students use a computer simula-tion based on real data to per-form a quantitative analysis and comparison of multiple factors affecting the carrying capacity of song sparrows, including resourc-es, climate, competition, and characteristics of individual birds. This activity completes the first learning sequence and provides an opportunity to assess Performance Expectation HS-LS2-1.
Assessing HS-LS2-1
Working toward HS-LS2-2
LS2.A
LS2.C
Using Math-ematics and Computational Thinking
Constructing Explanations and Designing Solutions
Analyzing and Interpreting Data
cale, Proportion, and Quantity
Cause and Effect
Math:
MP.2
MP.4
HSN.Q.A.1
HSN.Q.A.2
HSS-IC.A.1
4 Scaling Up: EcosystemsModeling: 1–2 class sessions
Students obtain information about four different ecosystems to de-termine what defines an ecosystem. They use the crosscutting concept of systems and system models to identify that ecosystems are defined by their components, the interactions among those compo-nents, and their boundaries. They also use the crosscutting concept of scale, proportion, and quantity to realize that an ecosystem can exist at many different scales, from vast to tiny.
Working Toward HS-LS2-2
Applying HS-LS2-1
LS2.A
LS2.C
Developing and Using Models
Obtaining, Evaluating, and Communicating Information
Scale, Proportion, and Quantity
Systems and System Models
ELA/ Literacy:
RST.11-12.5
Early DRAFT copy for the NABT 2021 workshop. © 2021 The Regents of the University of California.
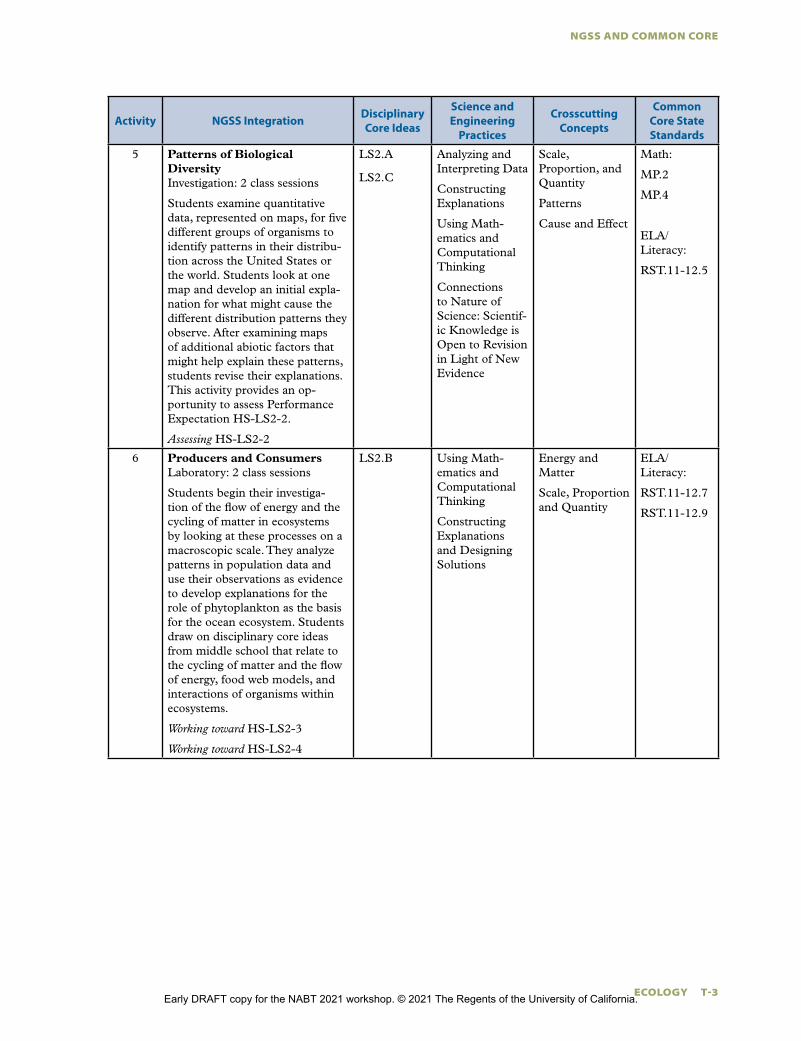
NGSS AND COMMON CORE
ECOLOGY T-3
Activity NGSS IntegrationDisciplinaryCore Ideas
Science and Engineering
Practices
CrosscuttingConcepts
Common Core State Standards
5 Patterns of Biological DiversityInvestigation: 2 class sessions
Students examine quantitative data, represented on maps, for five different groups of organisms to identify patterns in their distribu-tion across the United States or the world. Students look at one map and develop an initial expla-nation for what might cause the different distribution patterns they observe. After examining maps of additional abiotic factors that might help explain these patterns, students revise their explanations. This activity provides an op-portunity to assess Performance Expectation HS-LS2-2.
Assessing HS-LS2-2
LS2.A
LS2.C
Analyzing and Interpreting Data
Constructing Explanations
Using Math-ematics and Computational Thinking
Connections to Nature of Science: Scientif-ic Knowledge is Open to Revision in Light of New Evidence
Scale, Proportion, and Quantity
Patterns
Cause and Effect
Math:
MP.2
MP.4
ELA/ Literacy:
RST.11-12.5
6 Producers and ConsumersLaboratory: 2 class sessions
Students begin their investiga-tion of the flow of energy and the cycling of matter in ecosystems by looking at these processes on a macroscopic scale. They analyze patterns in population data and use their observations as evidence to develop explanations for the role of phytoplankton as the basis for the ocean ecosystem. Students draw on disciplinary core ideas from middle school that relate to the cycling of matter and the flow of energy, food web models, and interactions of organisms within ecosystems.
Working toward HS-LS2-3
Working toward HS-LS2-4
LS2.B Using Math-ematics and Computational Thinking
Constructing Explanations and Designing Solutions
Energy and Matter
Scale, Proportion and Quantity
ELA/ Literacy:
RST.11-12.7
RST.11-12.9
Early DRAFT copy for the NABT 2021 workshop. © 2021 The Regents of the University of California.
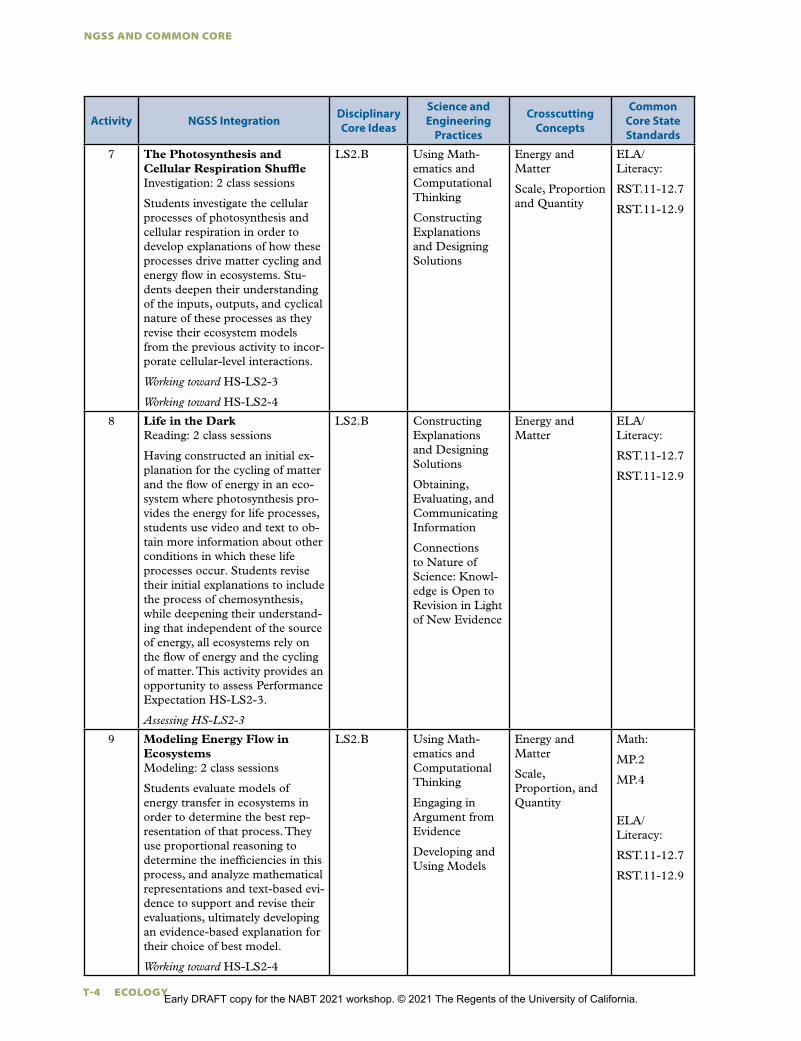
NGSS AND COMMON CORE
T-4 ECOLOGY
Activity NGSS IntegrationDisciplinaryCore Ideas
Science and Engineering
Practices
CrosscuttingConcepts
Common Core State Standards
7 The Photosynthesis and Cellular Respiration ShuffleInvestigation: 2 class sessions
Students investigate the cellular processes of photosynthesis and cellular respiration in order to develop explanations of how these processes drive matter cycling and energy flow in ecosystems. Stu-dents deepen their understanding of the inputs, outputs, and cyclical nature of these processes as they revise their ecosystem models from the previous activity to incor-porate cellular-level interactions.
Working toward HS-LS2-3
Working toward HS-LS2-4
LS2.B Using Math-ematics and Computational Thinking
Constructing Explanations and Designing Solutions
Energy and Matter
Scale, Proportion and Quantity
ELA/ Literacy:
RST.11-12.7
RST.11-12.9
8 Life in the DarkReading: 2 class sessions
Having constructed an initial ex-planation for the cycling of matter and the flow of energy in an eco-system where photosynthesis pro-vides the energy for life processes, students use video and text to ob-tain more information about other conditions in which these life processes occur. Students revise their initial explanations to include the process of chemosynthesis, while deepening their understand-ing that independent of the source of energy, all ecosystems rely on the flow of energy and the cycling of matter. This activity provides an opportunity to assess Performance Expectation HS-LS2-3.
Assessing HS-LS2-3
LS2.B Constructing Explanations and Designing Solutions
Obtaining, Evaluating, and Communicating Information
Connections to Nature of Science: Knowl-edge is Open to Revision in Light of New Evidence
Energy and Matter
ELA/ Literacy:
RST.11-12.7
RST.11-12.9
9 Modeling Energy Flow in EcosystemsModeling: 2 class sessions
Students evaluate models of energy transfer in ecosystems in order to determine the best rep-resentation of that process. They use proportional reasoning to determine the inefficiencies in this process, and analyze mathematical representations and text-based evi-dence to support and revise their evaluations, ultimately developing an evidence-based explanation for their choice of best model.
Working toward HS-LS2-4
LS2.B Using Math-ematics and Computational Thinking
Engaging in Argument from Evidence
Developing and Using Models
Energy and Matter
Scale, Proportion, and Quantity
Math:
MP.2
MP.4
ELA/ Literacy:
RST.11-12.7
RST.11-12.9
Early DRAFT copy for the NABT 2021 workshop. © 2021 The Regents of the University of California.
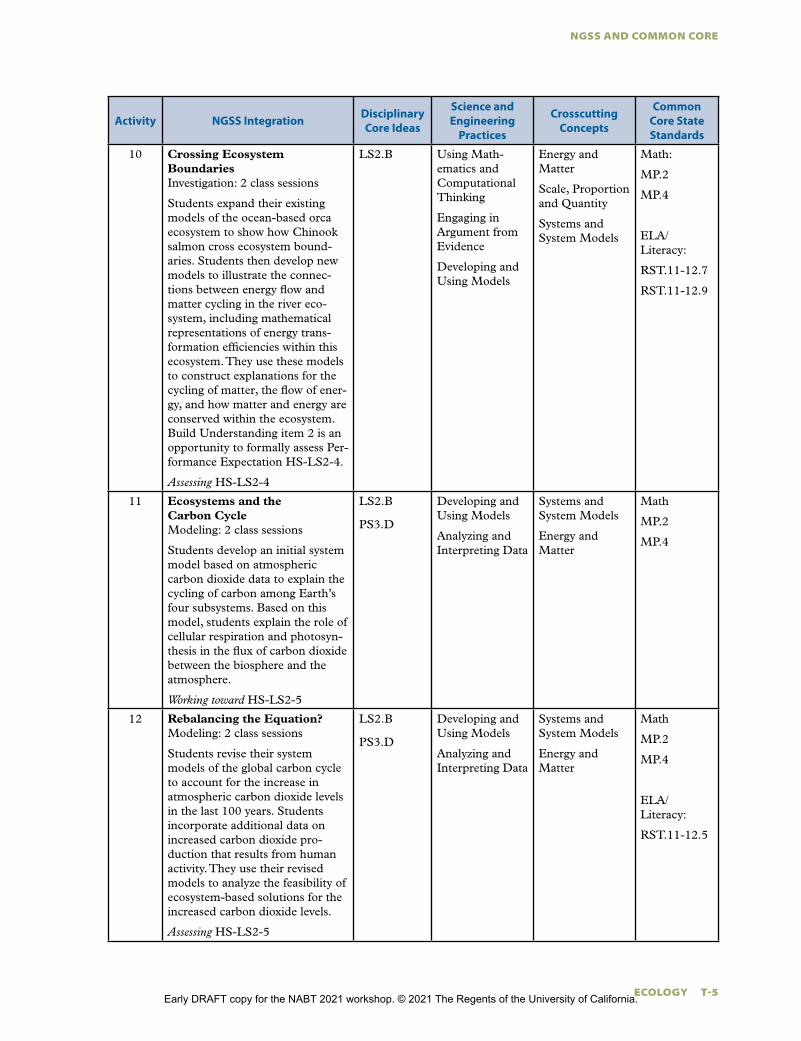
NGSS AND COMMON CORE
ECOLOGY T-5
Activity NGSS IntegrationDisciplinaryCore Ideas
Science and Engineering
Practices
CrosscuttingConcepts
Common Core State Standards
10 Crossing Ecosystem BoundariesInvestigation: 2 class sessions
Students expand their existing models of the ocean-based orca ecosystem to show how Chinook salmon cross ecosystem bound-aries. Students then develop new models to illustrate the connec-tions between energy flow and matter cycling in the river eco-system, including mathematical representations of energy trans-formation efficiencies within this ecosystem. They use these models to construct explanations for the cycling of matter, the flow of ener-gy, and how matter and energy are conserved within the ecosystem. Build Understanding item 2 is an opportunity to formally assess Per-formance Expectation HS-LS2-4.
Assessing HS-LS2-4
LS2.B Using Math-ematics and Computational Thinking
Engaging in Argument from Evidence
Developing and Using Models
Energy and Matter
Scale, Proportion and Quantity
Systems and System Models
Math:
MP.2
MP.4
ELA/ Literacy:
RST.11-12.7
RST.11-12.9
11 Ecosystems and the Carbon CycleModeling: 2 class sessions
Students develop an initial system model based on atmospheric carbon dioxide data to explain the cycling of carbon among Earth’s four subsystems. Based on this model, students explain the role of cellular respiration and photosyn-thesis in the flux of carbon dioxide between the biosphere and the atmosphere.
Working toward HS-LS2-5
LS2.B
PS3.D
Developing and Using Models
Analyzing and Interpreting Data
Systems and System Models
Energy and Matter
Math
MP.2
MP.4
12 Rebalancing the Equation?Modeling: 2 class sessions
Students revise their system models of the global carbon cycle to account for the increase in atmospheric carbon dioxide levels in the last 100 years. Students incorporate additional data on increased carbon dioxide pro-duction that results from human activity. They use their revised models to analyze the feasibility of ecosystem-based solutions for the increased carbon dioxide levels.
Assessing HS-LS2-5
LS2.B
PS3.D
Developing and Using Models
Analyzing and Interpreting Data
Systems and System Models
Energy and Matter
Math
MP.2
MP.4
ELA/ Literacy:
RST.11-12.5
Early DRAFT copy for the NABT 2021 workshop. © 2021 The Regents of the University of California.
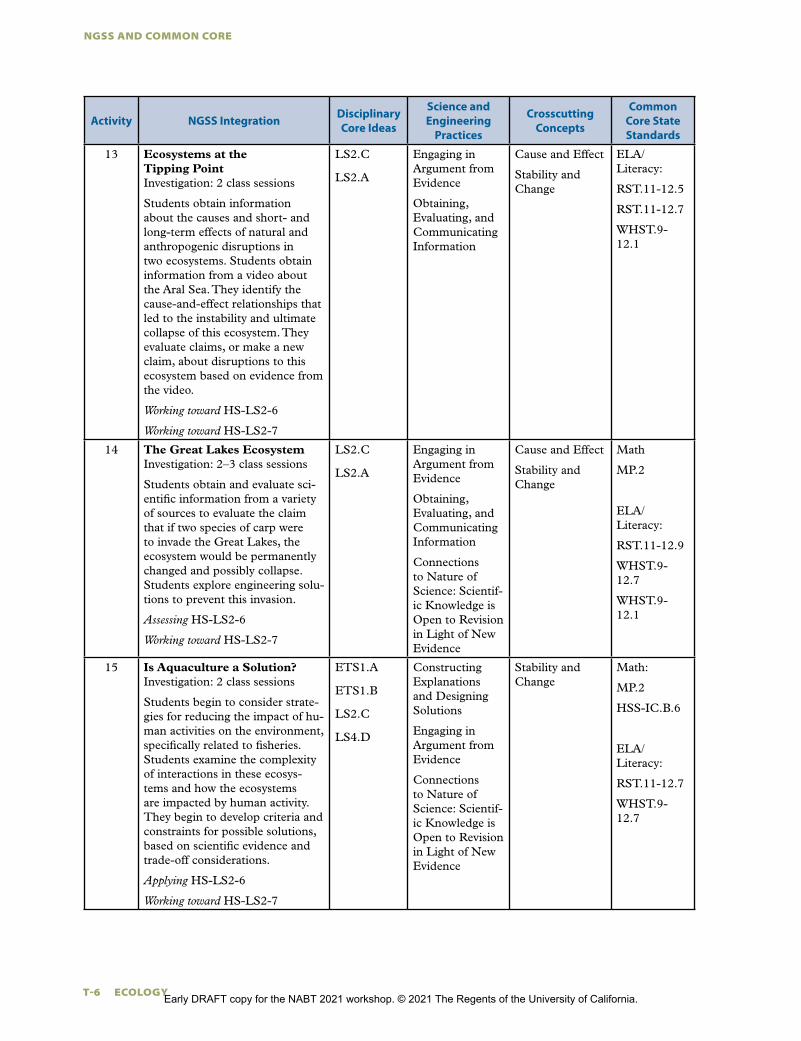
NGSS AND COMMON CORE
T-6 ECOLOGY
Activity NGSS IntegrationDisciplinaryCore Ideas
Science and Engineering
Practices
CrosscuttingConcepts
Common Core State Standards
13 Ecosystems at the Tipping Point Investigation: 2 class sessions
Students obtain information about the causes and short- and long-term effects of natural and anthropogenic disruptions in two ecosystems. Students obtain information from a video about the Aral Sea. They identify the cause-and-effect relationships that led to the instability and ultimate collapse of this ecosystem. They evaluate claims, or make a new claim, about disruptions to this ecosystem based on evidence from the video.
Working toward HS-LS2-6
Working toward HS-LS2-7
LS2.C
LS2.A
Engaging in Argument from Evidence
Obtaining, Evaluating, and Communicating Information
Cause and Effect
Stability and Change
ELA/ Literacy:
RST.11-12.5
RST.11-12.7
WHST.9-12.1
14 The Great Lakes EcosystemInvestigation: 2–3 class sessions
Students obtain and evaluate sci-entific information from a variety of sources to evaluate the claim that if two species of carp were to invade the Great Lakes, the ecosystem would be permanently changed and possibly collapse. Students explore engineering solu-tions to prevent this invasion.
Assessing HS-LS2-6
Working toward HS-LS2-7
LS2.C
LS2.A
Engaging in Argument from Evidence
Obtaining, Evaluating, and Communicating Information
Connections to Nature of Science: Scientif-ic Knowledge is Open to Revision in Light of New Evidence
Cause and Effect
Stability and Change
Math
MP.2
ELA/ Literacy:
RST.11-12.9
WHST.9-12.7
WHST.9-12.1
15 Is Aquaculture a Solution?Investigation: 2 class sessions
Students begin to consider strate-gies for reducing the impact of hu-man activities on the environment, specifically related to fisheries. Students examine the complexity of interactions in these ecosys-tems and how the ecosystems are impacted by human activity. They begin to develop criteria and constraints for possible solutions, based on scientific evidence and trade-off considerations.
Applying HS-LS2-6
Working toward HS-LS2-7
ETS1.A
ETS1.B
LS2.C
LS4.D
Constructing Explanations and Designing Solutions
Engaging in Argument from Evidence
Connections to Nature of Science: Scientif-ic Knowledge is Open to Revision in Light of New Evidence
Stability and Change
Math:
MP.2
HSS-IC.B.6
ELA/ Literacy:
RST.11-12.7
WHST.9-12.7
Early DRAFT copy for the NABT 2021 workshop. © 2021 The Regents of the University of California.
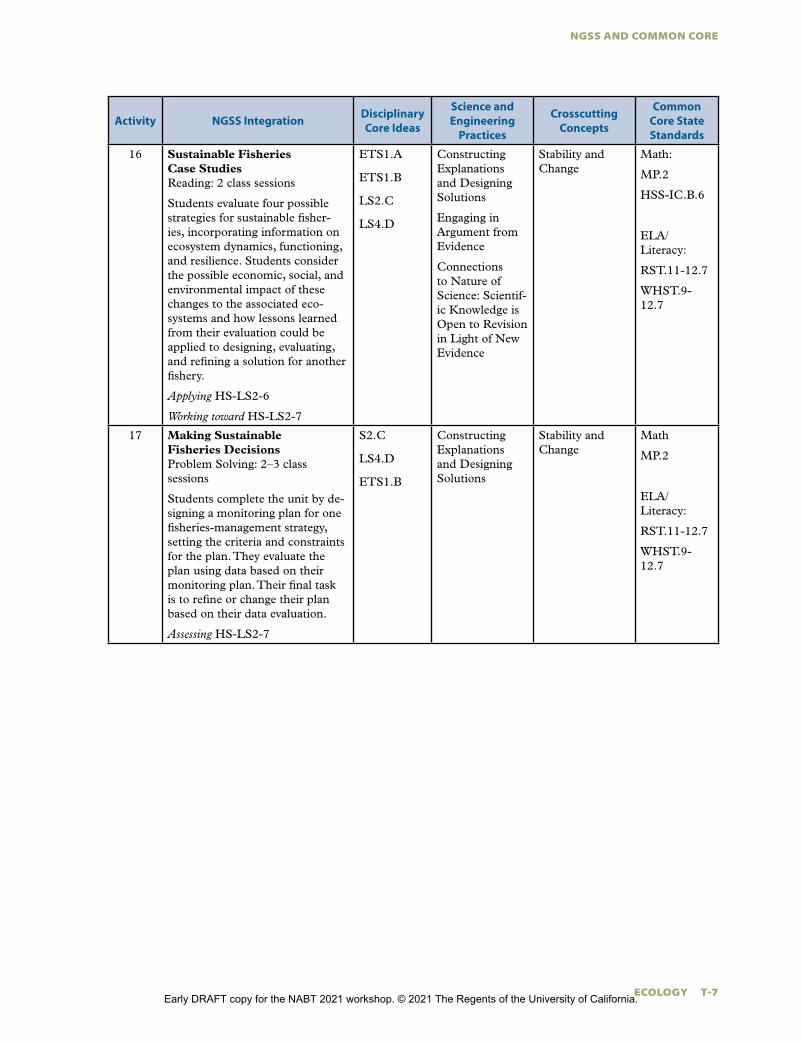
NGSS AND COMMON CORE
ECOLOGY T-7
Activity NGSS IntegrationDisciplinaryCore Ideas
Science and Engineering
Practices
CrosscuttingConcepts
Common Core State Standards
16 Sustainable Fisheries Case StudiesReading: 2 class sessions
Students evaluate four possible strategies for sustainable fisher-ies, incorporating information on ecosystem dynamics, functioning, and resilience. Students consider the possible economic, social, and environmental impact of these changes to the associated eco-systems and how lessons learned from their evaluation could be applied to designing, evaluating, and refining a solution for another fishery.
Applying HS-LS2-6
Working toward HS-LS2-7
ETS1.A
ETS1.B
LS2.C
LS4.D
Constructing Explanations and Designing Solutions
Engaging in Argument from Evidence
Connections to Nature of Science: Scientif-ic Knowledge is Open to Revision in Light of New Evidence
Stability and Change
Math:
MP.2
HSS-IC.B.6
ELA/ Literacy:
RST.11-12.7
WHST.9-12.7
17 Making Sustainable Fisheries DecisionsProblem Solving: 2–3 class sessions
Students complete the unit by de-signing a monitoring plan for one fisheries-management strategy, setting the criteria and constraints for the plan. They evaluate the plan using data based on their monitoring plan. Their final task is to refine or change their plan based on their data evaluation.
Assessing HS-LS2-7
S2.C
LS4.D
ETS1.B
Constructing Explanations and Designing Solutions
Stability and Change
Math
MP.2
ELA/ Literacy:
RST.11-12.7
WHST.9-12.7
Early DRAFT copy for the NABT 2021 workshop. © 2021 The Regents of the University of California.
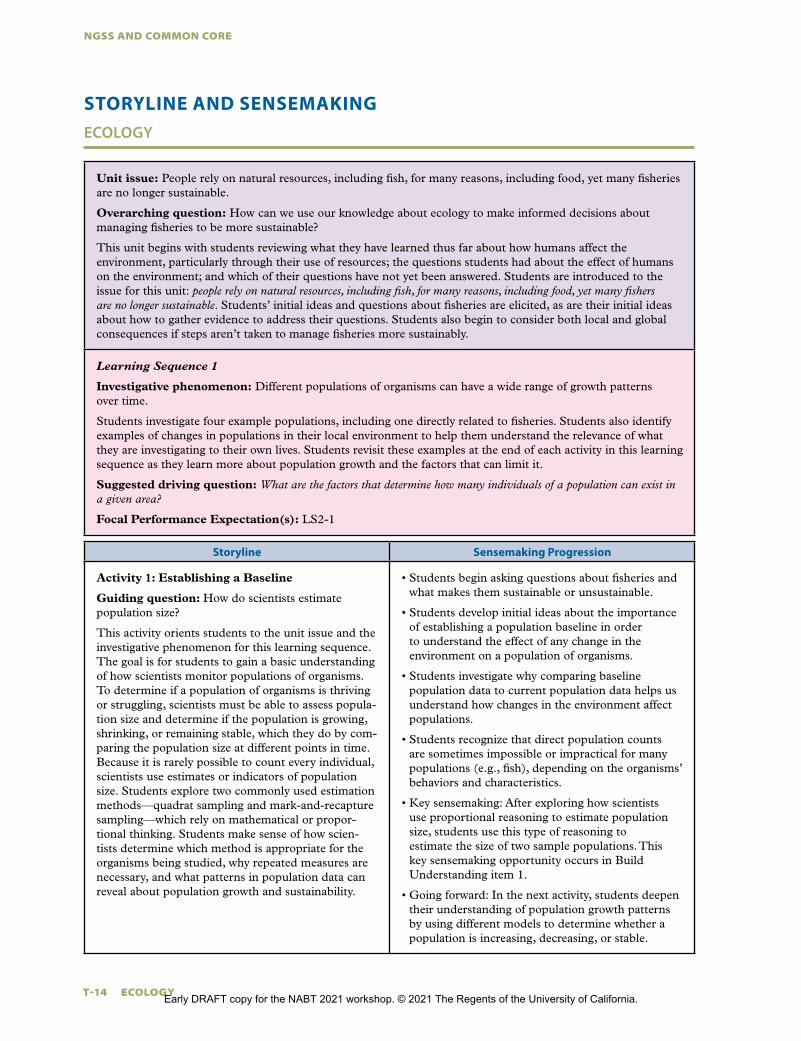
NGSS AND COMMON CORE
T-14 ECOLOGY
STORYLINE AND SENSEMAKING
ECOLOGY
Unit issue: People rely on natural resources, including fish, for many reasons, including food, yet many fisheries are no longer sustainable.
Overarching question: How can we use our knowledge about ecology to make informed decisions about managing fisheries to be more sustainable?
This unit begins with students reviewing what they have learned thus far about how humans affect the environment, particularly through their use of resources; the questions students had about the effect of humans on the environment; and which of their questions have not yet been answered. Students are introduced to the issue for this unit: people rely on natural resources, including fish, for many reasons, including food, yet many fishers are no longer sustainable. Students’ initial ideas and questions about fisheries are elicited, as are their initial ideas about how to gather evidence to address their questions. Students also begin to consider both local and global consequences if steps aren’t taken to manage fisheries more sustainably.
Learning Sequence 1
Investigative phenomenon: Different populations of organisms can have a wide range of growth patterns over time.
Students investigate four example populations, including one directly related to fisheries. Students also identify examples of changes in populations in their local environment to help them understand the relevance of what they are investigating to their own lives. Students revisit these examples at the end of each activity in this learning sequence as they learn more about population growth and the factors that can limit it.
Suggested driving question: What are the factors that determine how many individuals of a population can exist in a given area?
Focal Performance Expectation(s): LS2-1
Storyline Sensemaking Progression
Activity 1: Establishing a Baseline
Guiding question: How do scientists estimate population size?
This activity orients students to the unit issue and the investigative phenomenon for this learning sequence. The goal is for students to gain a basic understanding of how scientists monitor populations of organisms. To determine if a population of organisms is thriving or struggling, scientists must be able to assess popula-tion size and determine if the population is growing, shrinking, or remaining stable, which they do by com-paring the population size at different points in time. Because it is rarely possible to count every individual, scientists use estimates or indicators of population size. Students explore two commonly used estimation methods—quadrat sampling and mark-and-recapture sampling—which rely on mathematical or propor-tional thinking. Students make sense of how scien-tists determine which method is appropriate for the organisms being studied, why repeated measures are necessary, and what patterns in population data can reveal about population growth and sustainability.
• Students begin asking questions about fisheries andwhat makes them sustainable or unsustainable.
• Students develop initial ideas about the importanceof establishing a population baseline in orderto understand the effect of any change in theenvironment on a population of organisms.
• Students investigate why comparing baselinepopulation data to current population data helps usunderstand how changes in the environment affectpopulations.
• Students recognize that direct population countsare sometimes impossible or impractical for manypopulations (e.g., fish), depending on the organisms’behaviors and characteristics.
• Key sensemaking: After exploring how scientistsuse proportional reasoning to estimate populationsize, students use this type of reasoning toestimate the size of two sample populations. Thiskey sensemaking opportunity occurs in BuildUnderstanding item 1.
• Going forward: In the next activity, students deepentheir understanding of population growth patternsby using different models to determine whether apopulation is increasing, decreasing, or stable.
Early DRAFT copy for the NABT 2021 workshop. © 2021 The Regents of the University of California.
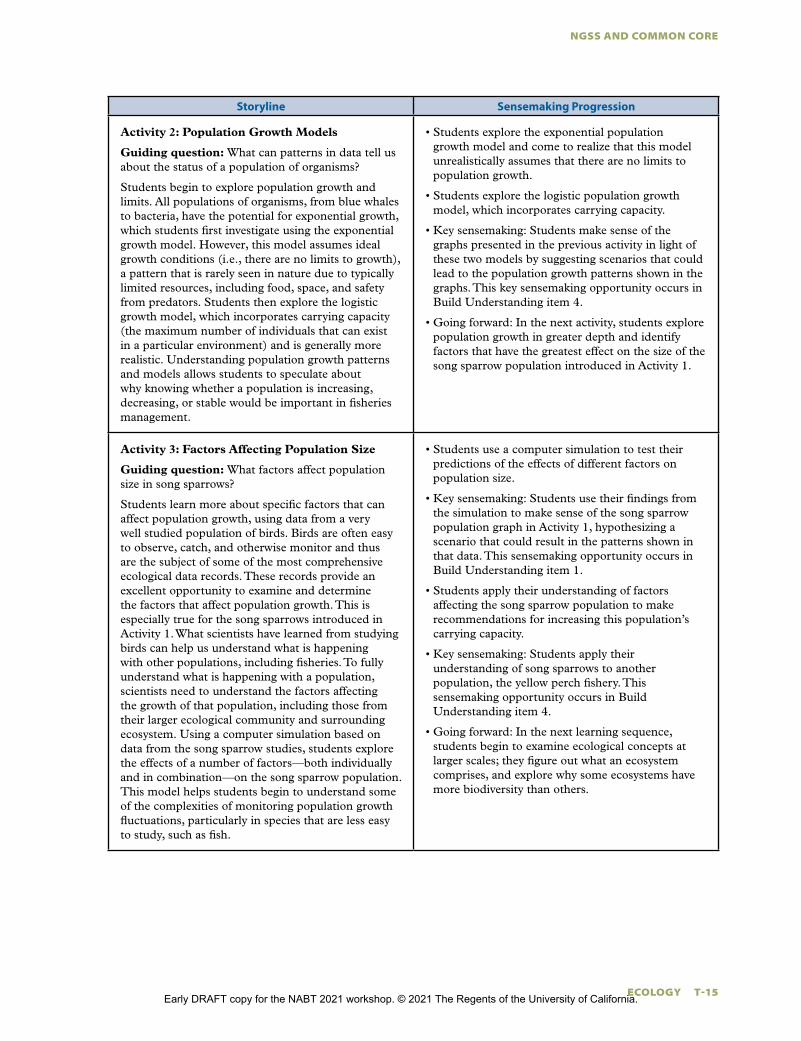
NGSS AND COMMON CORE
ECOLOGY T-15
Storyline Sensemaking Progression
Activity 2: Population Growth Models
Guiding question: What can patterns in data tell us about the status of a population of organisms?
Students begin to explore population growth and limits. All populations of organisms, from blue whales to bacteria, have the potential for exponential growth, which students first investigate using the exponential growth model. However, this model assumes ideal growth conditions (i.e., there are no limits to growth), a pattern that is rarely seen in nature due to typically limited resources, including food, space, and safety from predators. Students then explore the logistic growth model, which incorporates carrying capacity (the maximum number of individuals that can exist in a particular environment) and is generally more realistic. Understanding population growth patterns and models allows students to speculate about why knowing whether a population is increasing, decreasing, or stable would be important in fisheries management.
• Students explore the exponential populationgrowth model and come to realize that this modelunrealistically assumes that there are no limits topopulation growth.
• Students explore the logistic population growthmodel, which incorporates carrying capacity.
• Key sensemaking: Students make sense of thegraphs presented in the previous activity in light ofthese two models by suggesting scenarios that couldlead to the population growth patterns shown in thegraphs. This key sensemaking opportunity occurs inBuild Understanding item 4.
• Going forward: In the next activity, students explorepopulation growth in greater depth and identifyfactors that have the greatest effect on the size of thesong sparrow population introduced in Activity 1.
Activity 3: Factors Affecting Population Size
Guiding question: What factors affect population size in song sparrows?
Students learn more about specific factors that can affect population growth, using data from a very well studied population of birds. Birds are often easy to observe, catch, and otherwise monitor and thus are the subject of some of the most comprehensive ecological data records. These records provide an excellent opportunity to examine and determine the factors that affect population growth. This is especially true for the song sparrows introduced in Activity 1. What scientists have learned from studying birds can help us understand what is happening with other populations, including fisheries. To fully understand what is happening with a population, scientists need to understand the factors affecting the growth of that population, including those from their larger ecological community and surrounding ecosystem. Using a computer simulation based on data from the song sparrow studies, students explore the effects of a number of factors—both individually and in combination—on the song sparrow population. This model helps students begin to understand some of the complexities of monitoring population growth fluctuations, particularly in species that are less easy to study, such as fish.
• Students use a computer simulation to test theirpredictions of the effects of different factors onpopulation size.
• Key sensemaking: Students use their findings fromthe simulation to make sense of the song sparrowpopulation graph in Activity 1, hypothesizing ascenario that could result in the patterns shown inthat data. This sensemaking opportunity occurs inBuild Understanding item 1.
• Students apply their understanding of factorsaffecting the song sparrow population to makerecommendations for increasing this population’scarrying capacity.
• Key sensemaking: Students apply theirunderstanding of song sparrows to anotherpopulation, the yellow perch fishery. Thissensemaking opportunity occurs in BuildUnderstanding item 4.
• Going forward: In the next learning sequence,students begin to examine ecological concepts atlarger scales; they figure out what an ecosystemcomprises, and explore why some ecosystems havemore biodiversity than others.
Early DRAFT copy for the NABT 2021 workshop. © 2021 The Regents of the University of California.
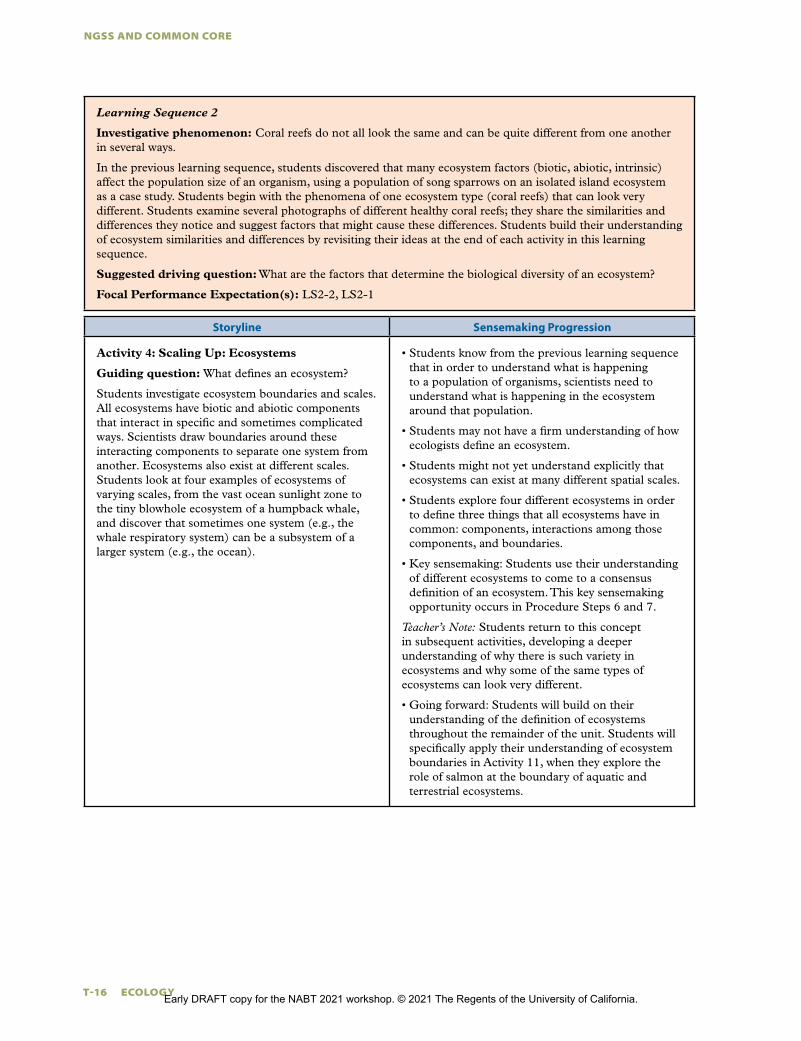
NGSS AND COMMON CORE
T-16 ECOLOGY
Learning Sequence 2
Investigative phenomenon: Coral reefs do not all look the same and can be quite different from one another in several ways.
In the previous learning sequence, students discovered that many ecosystem factors (biotic, abiotic, intrinsic) affect the population size of an organism, using a population of song sparrows on an isolated island ecosystem as a case study. Students begin with the phenomena of one ecosystem type (coral reefs) that can look very different. Students examine several photographs of different healthy coral reefs; they share the similarities and differences they notice and suggest factors that might cause these differences. Students build their understanding of ecosystem similarities and differences by revisiting their ideas at the end of each activity in this learning sequence.
Suggested driving question: What are the factors that determine the biological diversity of an ecosystem?
Focal Performance Expectation(s): LS2-2, LS2-1
Storyline Sensemaking Progression
Activity 4: Scaling Up: Ecosystems
Guiding question: What defines an ecosystem?
Students investigate ecosystem boundaries and scales. All ecosystems have biotic and abiotic components that interact in specific and sometimes complicated ways. Scientists draw boundaries around these interacting components to separate one system from another. Ecosystems also exist at different scales. Students look at four examples of ecosystems of varying scales, from the vast ocean sunlight zone to the tiny blowhole ecosystem of a humpback whale, and discover that sometimes one system (e.g., the whale respiratory system) can be a subsystem of a larger system (e.g., the ocean).
• Students know from the previous learning sequence that in order to understand what is happening to a population of organisms, scientists need to understand what is happening in the ecosystem around that population.
• Students may not have a firm understanding of how ecologists define an ecosystem.
• Students might not yet understand explicitly that ecosystems can exist at many different spatial scales.
• Students explore four different ecosystems in order to define three things that all ecosystems have in common: components, interactions among those components, and boundaries.
• Key sensemaking: Students use their understanding of different ecosystems to come to a consensus definition of an ecosystem. This key sensemaking opportunity occurs in Procedure Steps 6 and 7.
Teacher’s Note: Students return to this concept in subsequent activities, developing a deeper understanding of why there is such variety in ecosystems and why some of the same types of ecosystems can look very different.
• Going forward: Students will build on their understanding of the definition of ecosystems throughout the remainder of the unit. Students will specifically apply their understanding of ecosystem boundaries in Activity 11, when they explore the role of salmon at the boundary of aquatic and terrestrial ecosystems.
Early DRAFT copy for the NABT 2021 workshop. © 2021 The Regents of the University of California.
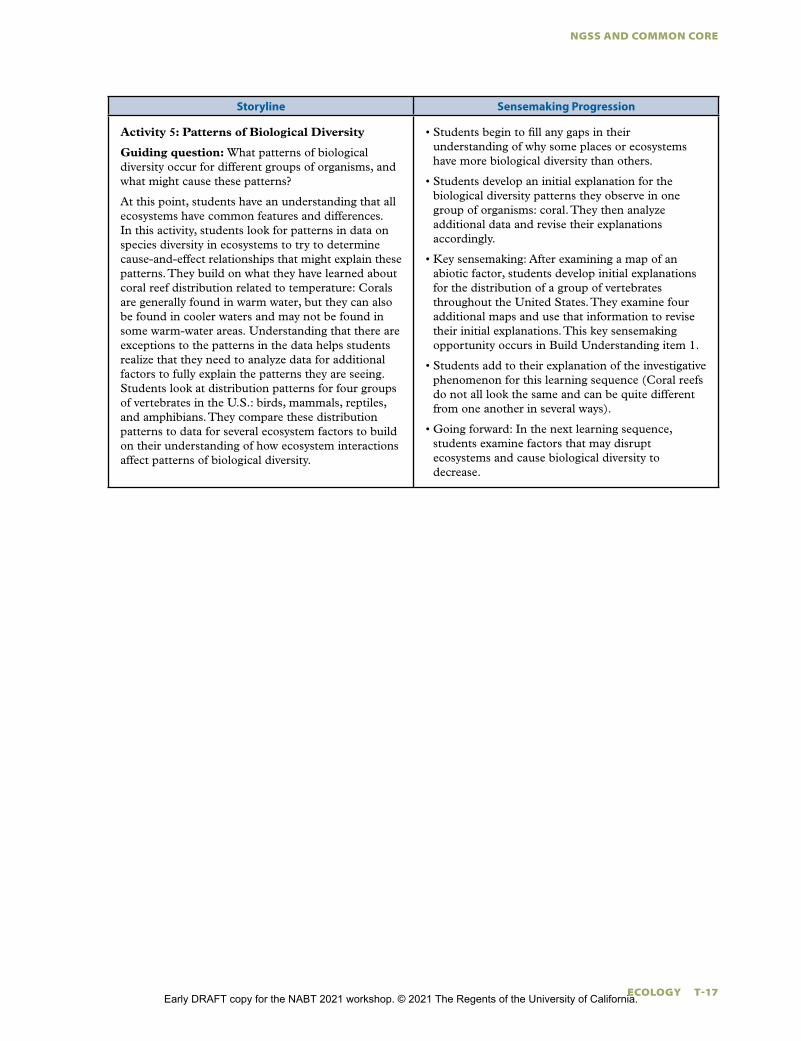
NGSS AND COMMON CORE
ECOLOGY T-17
Storyline Sensemaking Progression
Activity 5: Patterns of Biological Diversity
Guiding question: What patterns of biological diversity occur for different groups of organisms, and what might cause these patterns?
At this point, students have an understanding that all ecosystems have common features and differences. In this activity, students look for patterns in data on species diversity in ecosystems to try to determine cause-and-effect relationships that might explain these patterns. They build on what they have learned about coral reef distribution related to temperature: Corals are generally found in warm water, but they can also be found in cooler waters and may not be found in some warm-water areas. Understanding that there are exceptions to the patterns in the data helps students realize that they need to analyze data for additional factors to fully explain the patterns they are seeing. Students look at distribution patterns for four groups of vertebrates in the U.S.: birds, mammals, reptiles, and amphibians. They compare these distribution patterns to data for several ecosystem factors to build on their understanding of how ecosystem interactions affect patterns of biological diversity.
• Students begin to fill any gaps in their understanding of why some places or ecosystems have more biological diversity than others.
• Students develop an initial explanation for the biological diversity patterns they observe in one group of organisms: coral. They then analyze additional data and revise their explanations accordingly.
• Key sensemaking: After examining a map of an abiotic factor, students develop initial explanations for the distribution of a group of vertebrates throughout the United States. They examine four additional maps and use that information to revise their initial explanations. This key sensemaking opportunity occurs in Build Understanding item 1.
• Students add to their explanation of the investigative phenomenon for this learning sequence (Coral reefs do not all look the same and can be quite different from one another in several ways).
• Going forward: In the next learning sequence, students examine factors that may disrupt ecosystems and cause biological diversity to decrease.
Early DRAFT copy for the NABT 2021 workshop. © 2021 The Regents of the University of California.
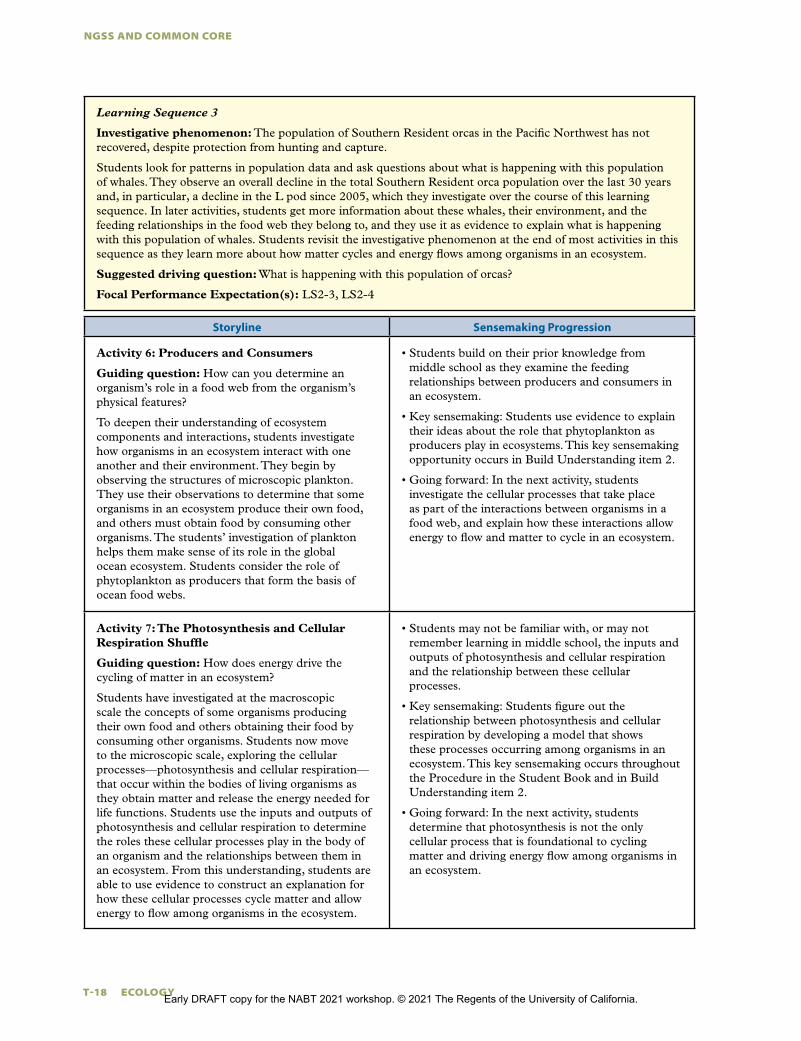
NGSS AND COMMON CORE
T-18 ECOLOGY
Learning Sequence 3
Investigative phenomenon: The population of Southern Resident orcas in the Pacific Northwest has not recovered, despite protection from hunting and capture.
Students look for patterns in population data and ask questions about what is happening with this population of whales. They observe an overall decline in the total Southern Resident orca population over the last 30 years and, in particular, a decline in the L pod since 2005, which they investigate over the course of this learning sequence. In later activities, students get more information about these whales, their environment, and the feeding relationships in the food web they belong to, and they use it as evidence to explain what is happening with this population of whales. Students revisit the investigative phenomenon at the end of most activities in this sequence as they learn more about how matter cycles and energy flows among organisms in an ecosystem.
Suggested driving question: What is happening with this population of orcas?
Focal Performance Expectation(s): LS2-3, LS2-4
Storyline Sensemaking Progression
Activity 6: Producers and Consumers
Guiding question: How can you determine an organism’s role in a food web from the organism’s physical features?
To deepen their understanding of ecosystem components and interactions, students investigate how organisms in an ecosystem interact with one another and their environment. They begin by observing the structures of microscopic plankton. They use their observations to determine that some organisms in an ecosystem produce their own food, and others must obtain food by consuming other organisms. The students’ investigation of plankton helps them make sense of its role in the global ocean ecosystem. Students consider the role of phytoplankton as producers that form the basis of ocean food webs.
• Students build on their prior knowledge from middle school as they examine the feeding relationships between producers and consumers in an ecosystem.
• Key sensemaking: Students use evidence to explain their ideas about the role that phytoplankton as producers play in ecosystems. This key sensemaking opportunity occurs in Build Understanding item 2.
• Going forward: In the next activity, students investigate the cellular processes that take place as part of the interactions between organisms in a food web, and explain how these interactions allow energy to flow and matter to cycle in an ecosystem.
Activity 7: The Photosynthesis and Cellular Respiration Shuffle
Guiding question: How does energy drive the cycling of matter in an ecosystem?
Students have investigated at the macroscopic scale the concepts of some organisms producing their own food and others obtaining their food by consuming other organisms. Students now move to the microscopic scale, exploring the cellular processes—photosynthesis and cellular respiration—that occur within the bodies of living organisms as they obtain matter and release the energy needed for life functions. Students use the inputs and outputs of photosynthesis and cellular respiration to determine the roles these cellular processes play in the body of an organism and the relationships between them in an ecosystem. From this understanding, students are able to use evidence to construct an explanation for how these cellular processes cycle matter and allow energy to flow among organisms in the ecosystem.
• Students may not be familiar with, or may not remember learning in middle school, the inputs and outputs of photosynthesis and cellular respiration and the relationship between these cellular processes.
• Key sensemaking: Students figure out the relationship between photosynthesis and cellular respiration by developing a model that shows these processes occurring among organisms in an ecosystem. This key sensemaking occurs throughout the Procedure in the Student Book and in Build Understanding item 2.
• Going forward: In the next activity, students determine that photosynthesis is not the only cellular process that is foundational to cycling matter and driving energy flow among organisms in an ecosystem.
Early DRAFT copy for the NABT 2021 workshop. © 2021 The Regents of the University of California.
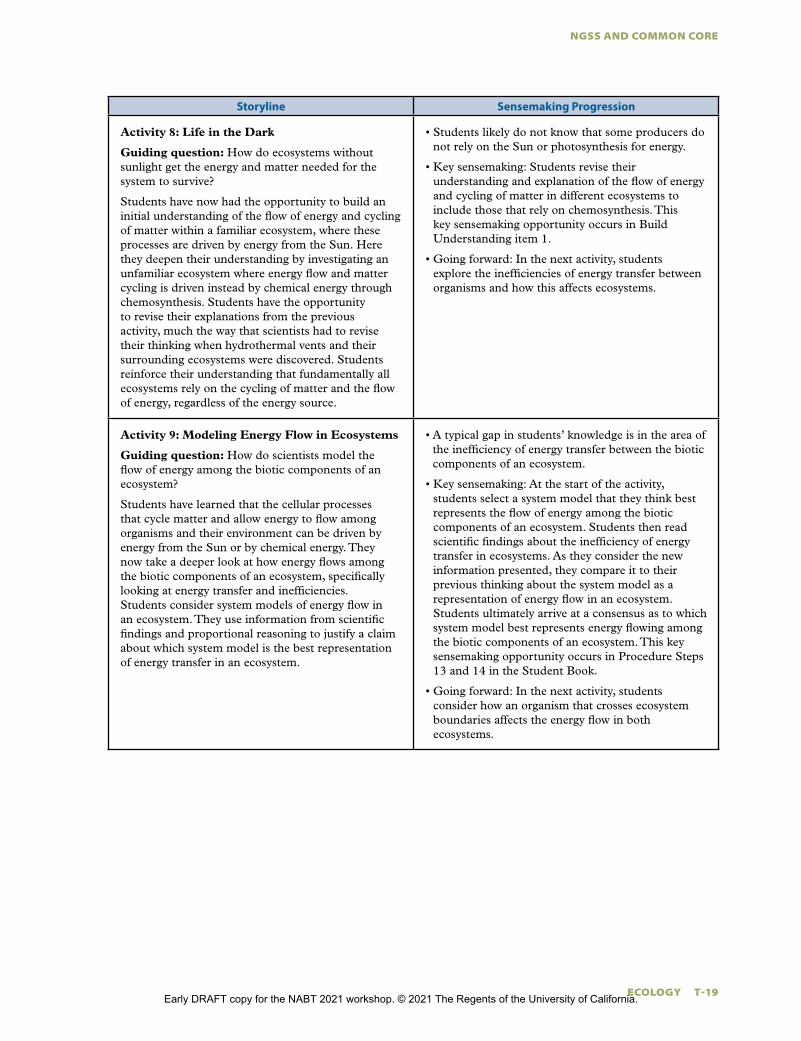
NGSS AND COMMON CORE
ECOLOGY T-19
Storyline Sensemaking Progression
Activity 8: Life in the Dark
Guiding question: How do ecosystems without sunlight get the energy and matter needed for the system to survive?
Students have now had the opportunity to build an initial understanding of the flow of energy and cycling of matter within a familiar ecosystem, where these processes are driven by energy from the Sun. Here they deepen their understanding by investigating an unfamiliar ecosystem where energy flow and matter cycling is driven instead by chemical energy through chemosynthesis. Students have the opportunity to revise their explanations from the previous activity, much the way that scientists had to revise their thinking when hydrothermal vents and their surrounding ecosystems were discovered. Students reinforce their understanding that fundamentally all ecosystems rely on the cycling of matter and the flow of energy, regardless of the energy source.
• Students likely do not know that some producers do not rely on the Sun or photosynthesis for energy.
• Key sensemaking: Students revise their understanding and explanation of the flow of energy and cycling of matter in different ecosystems to include those that rely on chemosynthesis. This key sensemaking opportunity occurs in Build Understanding item 1.
• Going forward: In the next activity, students explore the inefficiencies of energy transfer between organisms and how this affects ecosystems.
Activity 9: Modeling Energy Flow in Ecosystems
Guiding question: How do scientists model the flow of energy among the biotic components of an ecosystem?
Students have learned that the cellular processes that cycle matter and allow energy to flow among organisms and their environment can be driven by energy from the Sun or by chemical energy. They now take a deeper look at how energy flows among the biotic components of an ecosystem, specifically looking at energy transfer and inefficiencies. Students consider system models of energy flow in an ecosystem. They use information from scientific findings and proportional reasoning to justify a claim about which system model is the best representation of energy transfer in an ecosystem.
• A typical gap in students’ knowledge is in the area of the inefficiency of energy transfer between the biotic components of an ecosystem.
• Key sensemaking: At the start of the activity, students select a system model that they think best represents the flow of energy among the biotic components of an ecosystem. Students then read scientific findings about the inefficiency of energy transfer in ecosystems. As they consider the new information presented, they compare it to their previous thinking about the system model as a representation of energy flow in an ecosystem. Students ultimately arrive at a consensus as to which system model best represents energy flowing among the biotic components of an ecosystem. This key sensemaking opportunity occurs in Procedure Steps 13 and 14 in the Student Book.
• Going forward: In the next activity, students consider how an organism that crosses ecosystem boundaries affects the energy flow in both ecosystems.
Early DRAFT copy for the NABT 2021 workshop. © 2021 The Regents of the University of California.
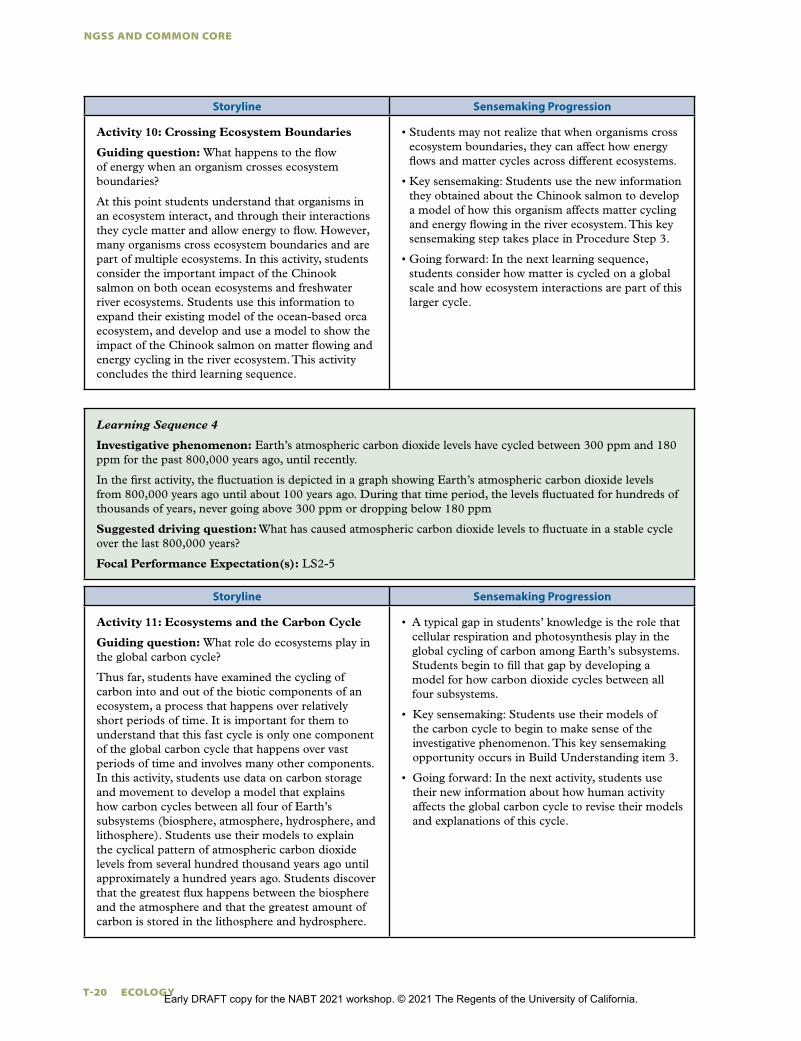
NGSS AND COMMON CORE
T-20 ECOLOGY
Storyline Sensemaking Progression
Activity 10: Crossing Ecosystem Boundaries
Guiding question: What happens to the flow of energy when an organism crosses ecosystem boundaries?
At this point students understand that organisms in an ecosystem interact, and through their interactions they cycle matter and allow energy to flow. However, many organisms cross ecosystem boundaries and are part of multiple ecosystems. In this activity, students consider the important impact of the Chinook salmon on both ocean ecosystems and freshwater river ecosystems. Students use this information to expand their existing model of the ocean-based orca ecosystem, and develop and use a model to show the impact of the Chinook salmon on matter flowing and energy cycling in the river ecosystem. This activity concludes the third learning sequence.
• Students may not realize that when organisms cross ecosystem boundaries, they can affect how energy flows and matter cycles across different ecosystems.
• Key sensemaking: Students use the new information they obtained about the Chinook salmon to develop a model of how this organism affects matter cycling and energy flowing in the river ecosystem. This key sensemaking step takes place in Procedure Step 3.
• Going forward: In the next learning sequence, students consider how matter is cycled on a global scale and how ecosystem interactions are part of this larger cycle.
Learning Sequence 4
Investigative phenomenon: Earth’s atmospheric carbon dioxide levels have cycled between 300 ppm and 180 ppm for the past 800,000 years ago, until recently.
In the first activity, the fluctuation is depicted in a graph showing Earth’s atmospheric carbon dioxide levels from 800,000 years ago until about 100 years ago. During that time period, the levels fluctuated for hundreds of thousands of years, never going above 300 ppm or dropping below 180 ppm
Suggested driving question: What has caused atmospheric carbon dioxide levels to fluctuate in a stable cycle over the last 800,000 years?
Focal Performance Expectation(s): LS2-5
Storyline Sensemaking Progression
Activity 11: Ecosystems and the Carbon Cycle
Guiding question: What role do ecosystems play in the global carbon cycle?
Thus far, students have examined the cycling of carbon into and out of the biotic components of an ecosystem, a process that happens over relatively short periods of time. It is important for them to understand that this fast cycle is only one component of the global carbon cycle that happens over vast periods of time and involves many other components. In this activity, students use data on carbon storage and movement to develop a model that explains how carbon cycles between all four of Earth’s subsystems (biosphere, atmosphere, hydrosphere, and lithosphere). Students use their models to explain the cyclical pattern of atmospheric carbon dioxide levels from several hundred thousand years ago until approximately a hundred years ago. Students discover that the greatest flux happens between the biosphere and the atmosphere and that the greatest amount of carbon is stored in the lithosphere and hydrosphere.
• A typical gap in students’ knowledge is the role that cellular respiration and photosynthesis play in the global cycling of carbon among Earth’s subsystems. Students begin to fill that gap by developing a model for how carbon dioxide cycles between all four subsystems.
• Key sensemaking: Students use their models of the carbon cycle to begin to make sense of the investigative phenomenon. This key sensemaking opportunity occurs in Build Understanding item 3.
• Going forward: In the next activity, students use their new information about how human activity affects the global carbon cycle to revise their models and explanations of this cycle.
Early DRAFT copy for the NABT 2021 workshop. © 2021 The Regents of the University of California.
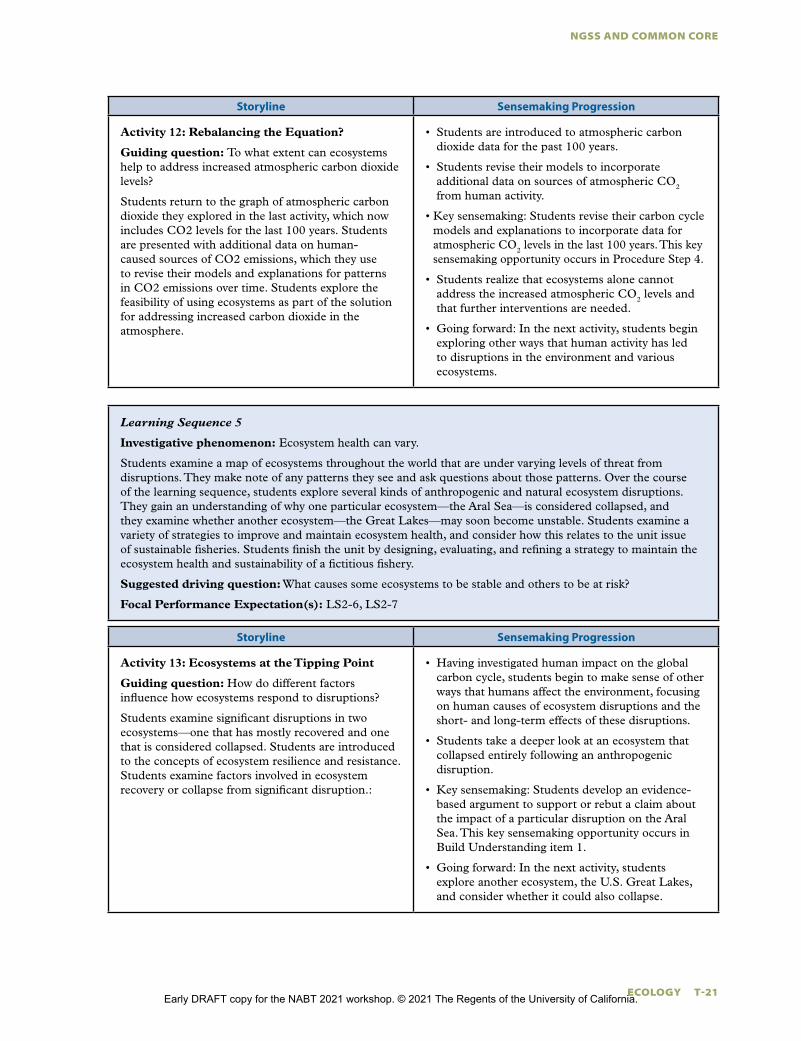
NGSS AND COMMON CORE
ECOLOGY T-21
Storyline Sensemaking Progression
Activity 12: Rebalancing the Equation?
Guiding question: To what extent can ecosystems help to address increased atmospheric carbon dioxide levels?
Students return to the graph of atmospheric carbon dioxide they explored in the last activity, which now includes CO2 levels for the last 100 years. Students are presented with additional data on human-caused sources of CO2 emissions, which they use to revise their models and explanations for patterns in CO2 emissions over time. Students explore the feasibility of using ecosystems as part of the solution for addressing increased carbon dioxide in the atmosphere.
• Students are introduced to atmospheric carbon dioxide data for the past 100 years.
• Students revise their models to incorporate additional data on sources of atmospheric CO2 from human activity.
• Key sensemaking: Students revise their carbon cycle models and explanations to incorporate data for atmospheric CO2 levels in the last 100 years. This key sensemaking opportunity occurs in Procedure Step 4.
• Students realize that ecosystems alone cannot address the increased atmospheric CO2 levels and that further interventions are needed.
• Going forward: In the next activity, students begin exploring other ways that human activity has led to disruptions in the environment and various ecosystems.
Learning Sequence 5
Investigative phenomenon: Ecosystem health can vary.
Students examine a map of ecosystems throughout the world that are under varying levels of threat from disruptions. They make note of any patterns they see and ask questions about those patterns. Over the course of the learning sequence, students explore several kinds of anthropogenic and natural ecosystem disruptions. They gain an understanding of why one particular ecosystem—the Aral Sea—is considered collapsed, and they examine whether another ecosystem—the Great Lakes—may soon become unstable. Students examine a variety of strategies to improve and maintain ecosystem health, and consider how this relates to the unit issue of sustainable fisheries. Students finish the unit by designing, evaluating, and refining a strategy to maintain the ecosystem health and sustainability of a fictitious fishery.
Suggested driving question: What causes some ecosystems to be stable and others to be at risk?
Focal Performance Expectation(s): LS2-6, LS2-7
Storyline Sensemaking Progression
Activity 13: Ecosystems at the Tipping Point
Guiding question: How do different factors influence how ecosystems respond to disruptions?
Students examine significant disruptions in two ecosystems—one that has mostly recovered and one that is considered collapsed. Students are introduced to the concepts of ecosystem resilience and resistance. Students examine factors involved in ecosystem recovery or collapse from significant disruption.:
• Having investigated human impact on the global carbon cycle, students begin to make sense of other ways that humans affect the environment, focusing on human causes of ecosystem disruptions and the short- and long-term effects of these disruptions.
• Students take a deeper look at an ecosystem that collapsed entirely following an anthropogenic disruption.
• Key sensemaking: Students develop an evidence-based argument to support or rebut a claim about the impact of a particular disruption on the Aral Sea. This key sensemaking opportunity occurs in Build Understanding item 1.
• Going forward: In the next activity, students explore another ecosystem, the U.S. Great Lakes, and consider whether it could also collapse.
Early DRAFT copy for the NABT 2021 workshop. © 2021 The Regents of the University of California.
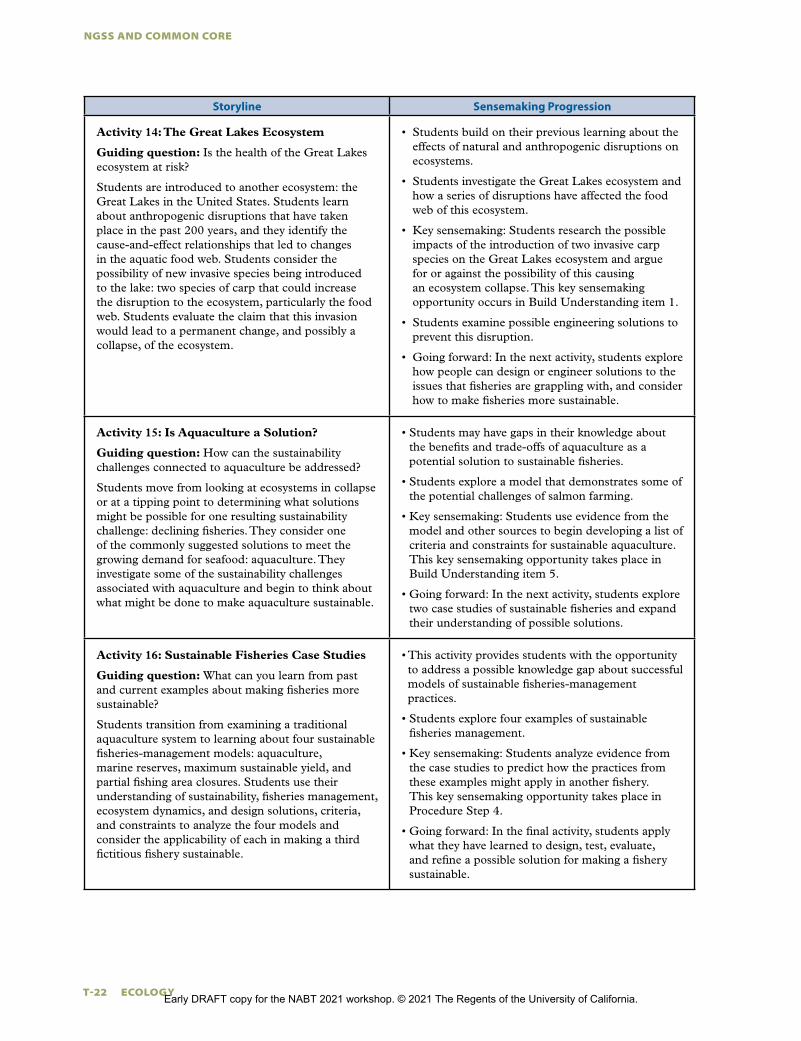
NGSS AND COMMON CORE
T-22 ECOLOGY
Storyline Sensemaking Progression
Activity 14: The Great Lakes Ecosystem
Guiding question: Is the health of the Great Lakes ecosystem at risk?
Students are introduced to another ecosystem: the Great Lakes in the United States. Students learn about anthropogenic disruptions that have taken place in the past 200 years, and they identify the cause-and-effect relationships that led to changes in the aquatic food web. Students consider the possibility of new invasive species being introduced to the lake: two species of carp that could increase the disruption to the ecosystem, particularly the food web. Students evaluate the claim that this invasion would lead to a permanent change, and possibly a collapse, of the ecosystem.
• Students build on their previous learning about the effects of natural and anthropogenic disruptions on ecosystems.
• Students investigate the Great Lakes ecosystem and how a series of disruptions have affected the food web of this ecosystem.
• Key sensemaking: Students research the possible impacts of the introduction of two invasive carp species on the Great Lakes ecosystem and argue for or against the possibility of this causing an ecosystem collapse. This key sensemaking opportunity occurs in Build Understanding item 1.
• Students examine possible engineering solutions to prevent this disruption.
• Going forward: In the next activity, students explore how people can design or engineer solutions to the issues that fisheries are grappling with, and consider how to make fisheries more sustainable.
Activity 15: Is Aquaculture a Solution?
Guiding question: How can the sustainability challenges connected to aquaculture be addressed?
Students move from looking at ecosystems in collapse or at a tipping point to determining what solutions might be possible for one resulting sustainability challenge: declining fisheries. They consider one of the commonly suggested solutions to meet the growing demand for seafood: aquaculture. They investigate some of the sustainability challenges associated with aquaculture and begin to think about what might be done to make aquaculture sustainable.
• Students may have gaps in their knowledge about the benefits and trade-offs of aquaculture as a potential solution to sustainable fisheries.
• Students explore a model that demonstrates some of the potential challenges of salmon farming.
• Key sensemaking: Students use evidence from the model and other sources to begin developing a list of criteria and constraints for sustainable aquaculture. This key sensemaking opportunity takes place in Build Understanding item 5.
• Going forward: In the next activity, students explore two case studies of sustainable fisheries and expand their understanding of possible solutions.
Activity 16: Sustainable Fisheries Case Studies
Guiding question: What can you learn from past and current examples about making fisheries more sustainable?
Students transition from examining a traditional aquaculture system to learning about four sustainable fisheries-management models: aquaculture, marine reserves, maximum sustainable yield, and partial fishing area closures. Students use their understanding of sustainability, fisheries management, ecosystem dynamics, and design solutions, criteria, and constraints to analyze the four models and consider the applicability of each in making a third fictitious fishery sustainable.
• This activity provides students with the opportunity to address a possible knowledge gap about successful models of sustainable fisheries-management practices.
• Students explore four examples of sustainable fisheries management.
• Key sensemaking: Students analyze evidence from the case studies to predict how the practices from these examples might apply in another fishery. This key sensemaking opportunity takes place in Procedure Step 4.
• Going forward: In the final activity, students apply what they have learned to design, test, evaluate, and refine a possible solution for making a fishery sustainable.
Early DRAFT copy for the NABT 2021 workshop. © 2021 The Regents of the University of California.
NGSS AND COMMON CORE
ECOLOGY T-23
Storyline Sensemaking Progression
Activity 17: Making Sustainable Fisheries Decisions
Guiding question: Which fisheries-management strategy is the best choice for the sustainability of the Avril Gulf tuna industry?
In this culminating activity for the unit, students apply what they have learned about ecosystem dynamics to design, test, and refine a solution for sustainable fisheries.
• Students incorporate what they have learned in the unit to design and test a solution for making a fishery more sustainable.
• Key sensemaking: Students use their experience with the design and testing of potential solutions to evaluate and refine a plan for increasing the sustainability of a fishery. This key sensemaking opportunity takes place in Procedure Step 10.
• Going forward: In the Cells unit, students learn about cellular biology and how it is connected to sustainability.
Early DRAFT copy for the NABT 2021 workshop. © 2021 The Regents of the University of California.
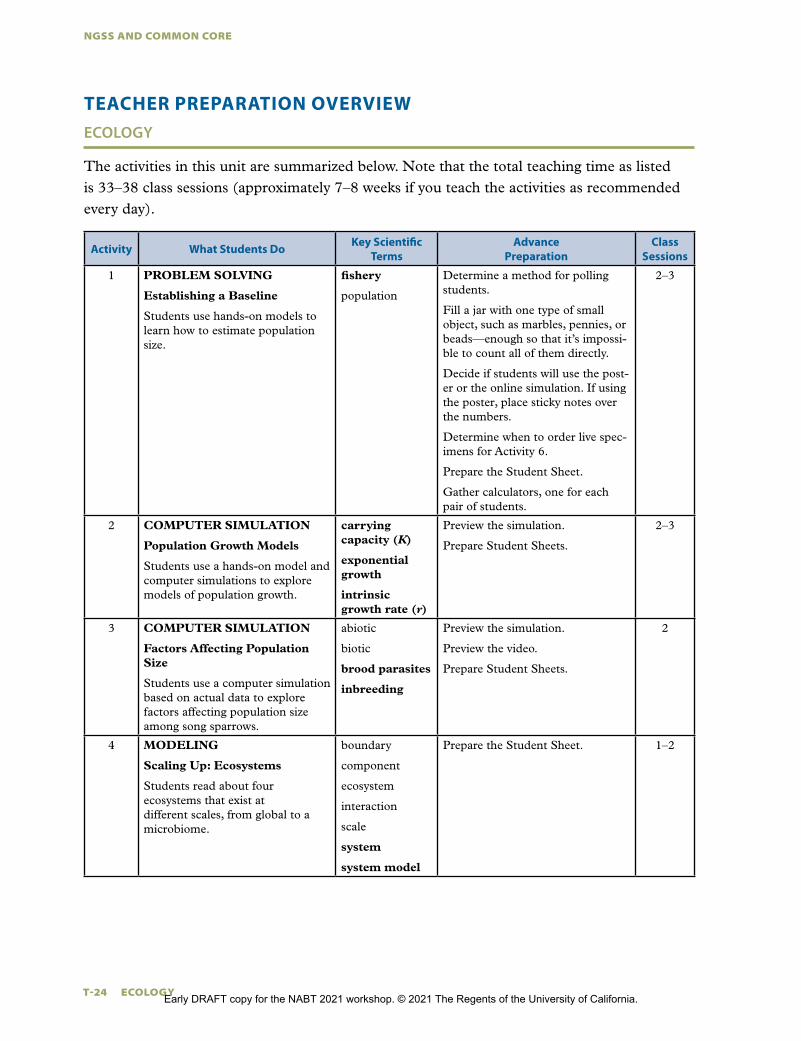
NGSS AND COMMON CORE
T-24 ECOLOGY
TEACHER PREPARATION OVERVIEW
ECOLOGY
The activities in this unit are summarized below. Note that the total teaching time as listed is 33–38 class sessions (approximately 7–8 weeks if you teach the activities as recommended every day).
Activity What Students DoKey Scientific
TermsAdvance
PreparationClass
Sessions
1 PROBLEM SOLVING
Establishing a Baseline
Students use hands-on models to learn how to estimate population size.
fishery
population
Determine a method for polling students.
Fill a jar with one type of small object, such as marbles, pennies, or beads—enough so that it’s impossi-ble to count all of them directly.
Decide if students will use the post-er or the online simulation. If using the poster, place sticky notes over the numbers.
Determine when to order live spec-imens for Activity 6.
Prepare the Student Sheet.
Gather calculators, one for each pair of students.
2–3
2 COMPUTER SIMULATION
Population Growth Models
Students use a hands-on model and computer simulations to explore models of population growth.
carrying capacity (K)
exponential growth
intrinsic growth rate (r)
Preview the simulation.
Prepare Student Sheets.
2–3
3 COMPUTER SIMULATION
Factors Affecting Population Size
Students use a computer simulation based on actual data to explore factors affecting population size among song sparrows.
abiotic
biotic
brood parasites
inbreeding
Preview the simulation.
Preview the video.
Prepare Student Sheets.
2
4 MODELING
Scaling Up: Ecosystems
Students read about four ecosystems that exist at different scales, from global to a microbiome.
boundary
component
ecosystem
interaction
scale
system
system model
Prepare the Student Sheet. 1–2
Early DRAFT copy for the NABT 2021 workshop. © 2021 The Regents of the University of California.
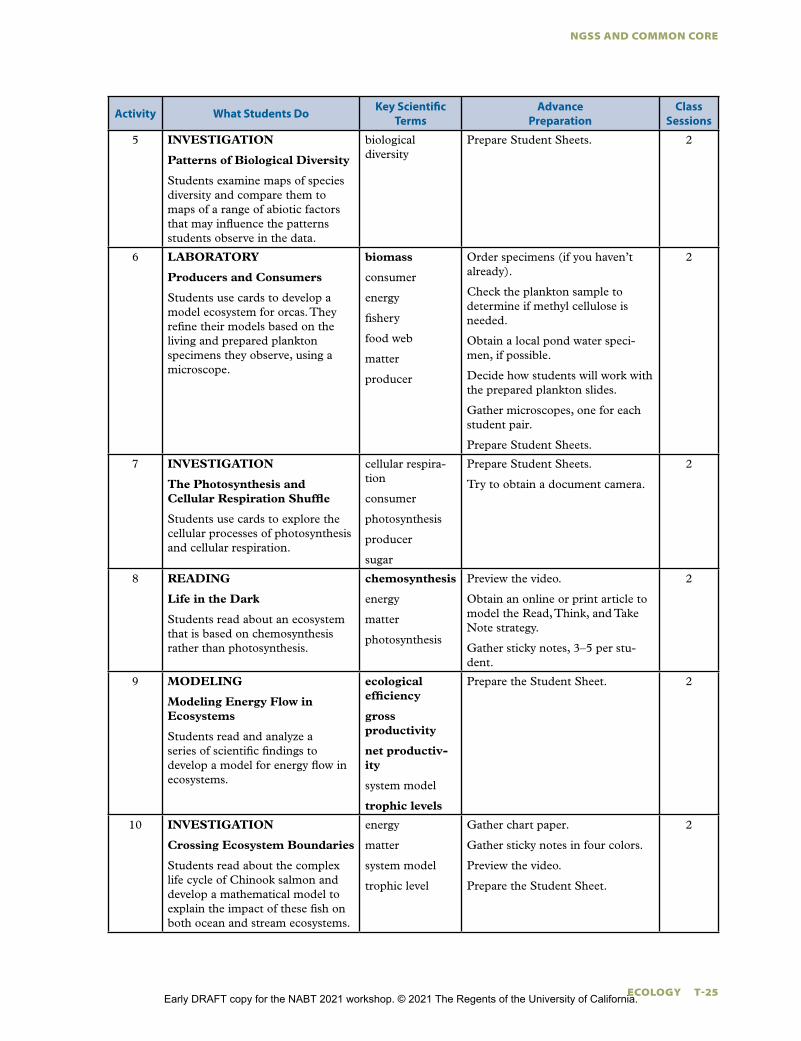
NGSS AND COMMON CORE
ECOLOGY T-25
Activity What Students DoKey Scientific
TermsAdvance
PreparationClass
Sessions
5 INVESTIGATION
Patterns of Biological Diversity
Students examine maps of species diversity and compare them to maps of a range of abiotic factors that may influence the patterns students observe in the data.
biological diversity
Prepare Student Sheets. 2
6 LABORATORY
Producers and Consumers
Students use cards to develop a model ecosystem for orcas. They refine their models based on the living and prepared plankton specimens they observe, using a microscope.
biomass
consumer
energy
fishery
food web
matter
producer
Order specimens (if you haven’t already).
Check the plankton sample to determine if methyl cellulose is needed.
Obtain a local pond water speci-men, if possible.
Decide how students will work with the prepared plankton slides.
Gather microscopes, one for each student pair.
Prepare Student Sheets.
2
7 INVESTIGATION
The Photosynthesis and Cellular Respiration Shuffle
Students use cards to explore the cellular processes of photosynthesis and cellular respiration.
cellular respira-tion
consumer
photosynthesis
producer
sugar
Prepare Student Sheets.
Try to obtain a document camera.
2
8 READING
Life in the Dark
Students read about an ecosystem that is based on chemosynthesis rather than photosynthesis.
chemosynthesis
energy
matter
photosynthesis
Preview the video.
Obtain an online or print article to model the Read, Think, and Take Note strategy.
Gather sticky notes, 3–5 per stu-dent.
2
9 MODELING
Modeling Energy Flow in Ecosystems
Students read and analyze a series of scientific findings to develop a model for energy flow in ecosystems.
ecological efficiency
gross productivity
net productiv-ity
system model
trophic levels
Prepare the Student Sheet. 2
10 INVESTIGATION
Crossing Ecosystem Boundaries
Students read about the complex life cycle of Chinook salmon and develop a mathematical model to explain the impact of these fish on both ocean and stream ecosystems.
energy
matter
system model
trophic level
Gather chart paper.
Gather sticky notes in four colors.
Preview the video.
Prepare the Student Sheet.
2
Early DRAFT copy for the NABT 2021 workshop. © 2021 The Regents of the University of California.
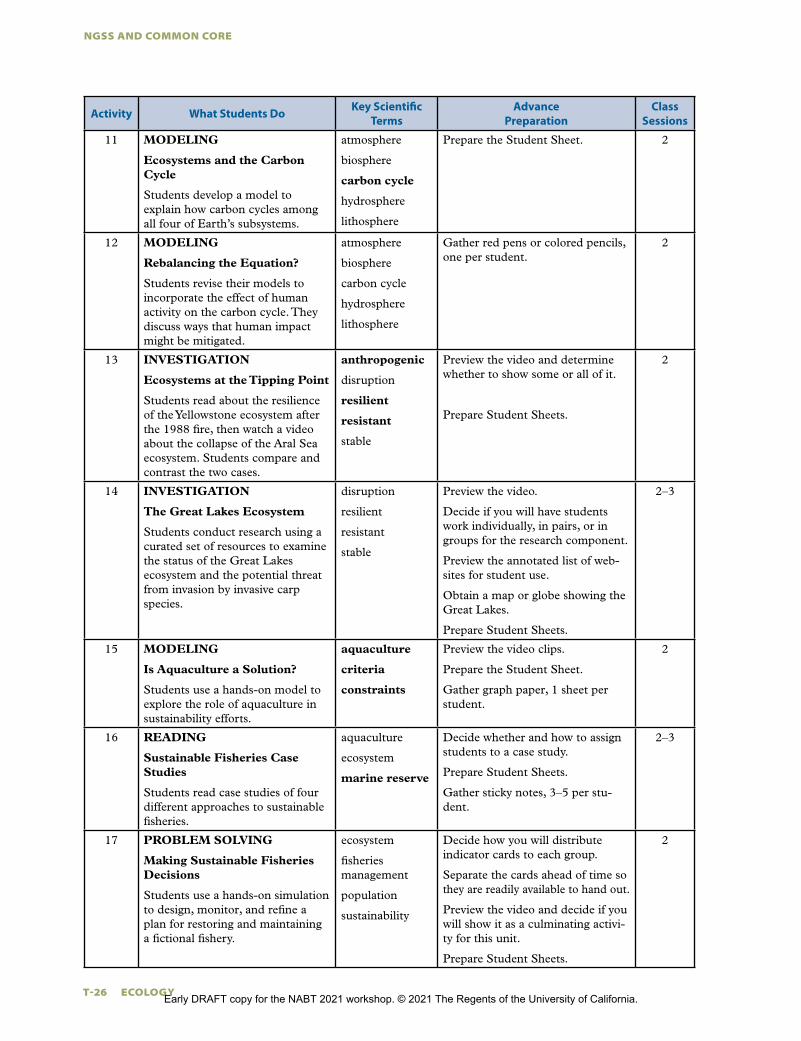
NGSS AND COMMON CORE
T-26 ECOLOGY
Activity What Students DoKey Scientific
TermsAdvance
PreparationClass
Sessions
11 MODELING
Ecosystems and the Carbon Cycle
Students develop a model to explain how carbon cycles among all four of Earth’s subsystems.
atmosphere
biosphere
carbon cycle
hydrosphere
lithosphere
Prepare the Student Sheet. 2
12 MODELING
Rebalancing the Equation?
Students revise their models to incorporate the effect of human activity on the carbon cycle. They discuss ways that human impact might be mitigated.
atmosphere
biosphere
carbon cycle
hydrosphere
lithosphere
Gather red pens or colored pencils, one per student.
2
13 INVESTIGATION
Ecosystems at the Tipping Point
Students read about the resilience of the Yellowstone ecosystem after the 1988 fire, then watch a video about the collapse of the Aral Sea ecosystem. Students compare and contrast the two cases.
anthropogenic
disruption
resilient
resistant
stable
Preview the video and determine whether to show some or all of it.
Prepare Student Sheets.
2
14 INVESTIGATION
The Great Lakes Ecosystem
Students conduct research using a curated set of resources to examine the status of the Great Lakes ecosystem and the potential threat from invasion by invasive carp species.
disruption
resilient
resistant
stable
Preview the video.
Decide if you will have students work individually, in pairs, or in groups for the research component.
Preview the annotated list of web-sites for student use.
Obtain a map or globe showing the Great Lakes.
Prepare Student Sheets.
2–3
15 MODELING
Is Aquaculture a Solution?
Students use a hands-on model to explore the role of aquaculture in sustainability efforts.
aquaculture
criteria
constraints
Preview the video clips.
Prepare the Student Sheet.
Gather graph paper, 1 sheet per student.
2
16 READING
Sustainable Fisheries Case Studies
Students read case studies of four different approaches to sustainable fisheries.
aquaculture
ecosystem
marine reserve
Decide whether and how to assign students to a case study.
Prepare Student Sheets.
Gather sticky notes, 3–5 per stu-dent.
2–3
17 PROBLEM SOLVING
Making Sustainable Fisheries Decisions
Students use a hands-on simulation to design, monitor, and refine a plan for restoring and maintaining a fictional fishery.
ecosystem
fisheries management
population
sustainability
Decide how you will distribute indicator cards to each group.
Separate the cards ahead of time so they are readily available to hand out.
Preview the video and decide if you will show it as a culminating activi-ty for this unit.
Prepare Student Sheets.
2
Early DRAFT copy for the NABT 2021 workshop. © 2021 The Regents of the University of California.
Related Documents