Proceedings of the 66 th Gulf and Caribbean Fisheries Institute November 4 – 8, 2013 Corpus Christi, Texas USA Biology, Status, and Current Management of the Caribbean Spiny Lobster (Panulirus argus) in Antigua and Barbuda Biología, Estado y Actual Administración de la Langosta Espinosa del Caribe (Panulirus argus) en Antigua y Barbuda Biologie, l'état actuel et la Gestion de la Langouste Blanche des Caraïbes (Panulirus argus) à Antigua-et-Barbuda IAN HORSFORD, HILROY SIMON, MARK ARCHIBALD, JOHN WEBBER, and TREVOR JOSEPH Fisheries Division, Point Wharf Fisheries Complex, St. John’s, Antigua, W.I. ABSTRACT Catch and effort and biological data were collected from commercial fishing trips, at-sea stop and search, and from processing plants in Antigua and Barbuda. The objectives were to: i) Determine important fishery-related biological parameters for the Caribbean spiny lobster (size of maturity, mating / breeding periods, length-weight relationships, etc.), ii) Appraise management regimes (minimum size, close season, compliance with regulations, etc.), and iii) Determine trends and status of the fishery. In terms of size, sexual dimorphism was detected, with male lobsters being significantly larger than females ( p < 0.01). The mean size of recruitment into the trap and SCUBA fisheries were significantly larger than for the free dive fishery ( p < 0.01); however, in all cases mean values were greater than the minimum legal size of 95 mm carapace length. Estimates of the size of female maturity (95.7 and 97.7 mm) were slightly larger than the minimum legal size and defined as the size at which 50% of females have mated (i.e., those bearing spermatophores plus those that were egg-bearing). Despite this it was considered important to maintain the current minimum size since it was already a widely accepted harmonised management measure within the Organization of Eastern Caribbean States. In terms of status and trends, no significant negative trends were detected for mean size of lobster landed or mean catch per unit effort, even when compared with 1970s data. Based on the fore mentioned results, the lobster fishery was considered sustainable at the current level of fishing; however greater measures have to be taken to prevent growth overfishing. KEY WORDS: Caribbean spiny lobster, Antigua and Barbuda, fisheries management, maturity, spawning, compliance rate INTRODUCTION The Caribbean spiny lobster (Panulirus argus) fishery of Antigua and Barbuda was valued at US$2.5 million in 2011 and accounted for 16% of the total ex-vessel value of capture production (US$15.6 million); in term of quantity, this was equivalent to 229 metric tons (live weight). Commercially, traps (fish pots) and the use of SCUBA with wire snares are the predominant methods used to target the spiny lobster. Free diving for lobster is still done to a limited extent in Barbuda while bottom gill nets contribute marginally in terms of incidental catch. Traps are typically constructed from hexagonal- mesh chicken wire and braced with “wattle” (stick) or steel. One or two funnel-shaped entrances are usually present, through which spiny lobster and reef fish can enter more easily than exit. Traps set to target solely lobster tend to have a larger funnel entrance than those used to target both lobster and reef fish. This is usually the case in Barbuda, where reef fish is of minor economic importance due to limited cold store and local demand. Traps are typically hauled every seven days and may be unbaited or baited with dried coconut meat (copra) and / or cowhide. The most common type of traps for lobster is the rectangular box; arrowhead and antillean Z traps are mainly used to target the deep-water snappers and groupers. Fishing vessels range from small pirogues to large fibreglass launches, with the latest equipment (global position- ing system, depth sounder, hydraulic hauler, etc.). Typical investment (including vessel, gear and equipment) ranges from US$20,000 for a 22-foot fibreglass pirogue to US$78,000 for a 38-foot fibreglass launch. Studies have indicated that the trap fishery for spiny lobster and reef fish was an economically and financially viable undertaking, which generated sufficient revenue to cover the cost of depreciation, as well as the opportunity cost of capital and generated funds for reinvestment in addition to employment, income and foreign exchange earnings (Jeffrey 1990, Horsford 2001a, Tietze et al. 2001, Tietze et al. 2005). In 2011, 180 Antiguan-registered vessels fished for both spiny lobster and reef fish, with much of the landings for lobster being consumed locally by the tourism sector (the key driver of the national economy). With much of the tourism infrastructure based on the island of Antigua and stay-over visitors at about 243,000 (Eastern Caribbean Central Bank 2011), the 480 fishers employed in the spiny lobster fishery in 2011 had a readily available market with competitive prices. In contrast, the lobster fishery of the island of Barbuda, is export-driven, due to weak local demand (resident population only 1,810 in 2011 (Statistics Division 2012)) as well as strong demand as a “luxury good” for export to neighbouring French overseas territories in the Eastern Caribbean. At its peak, the fishery in Barbuda supported 118 fishers operating

Welcome message from author
This document is posted to help you gain knowledge. Please leave a comment to let me know what you think about it! Share it to your friends and learn new things together.
Transcript

Proceedings of the 66th Gulf and Caribbean Fisheries Institute November 4 – 8, 2013 Corpus Christi, Texas USA
Biology, Status, and Current Management of the Caribbean Spiny Lobster
(Panulirus argus) in Antigua and Barbuda
Biología, Estado y Actual Administración de la Langosta Espinosa del Caribe
(Panulirus argus) en Antigua y Barbuda
Biologie, l'état actuel et la Gestion de la Langouste Blanche des Caraïbes
(Panulirus argus) à Antigua-et-Barbuda
IAN HORSFORD, HILROY SIMON, MARK ARCHIBALD, JOHN WEBBER, and TREVOR JOSEPH
Fisheries Division, Point Wharf Fisheries Complex, St. John’s, Antigua, W.I.
ABSTRACT Catch and effort and biological data were collected from commercial fishing trips, at-sea stop and search, and from processing
plants in Antigua and Barbuda. The objectives were to: i) Determine important fishery-related biological parameters for the Caribbean spiny lobster (size of maturity, mating / breeding
periods, length-weight relationships, etc.),
ii) Appraise management regimes (minimum size, close season, compliance with regulations, etc.), and
iii) Determine trends and status of the fishery.
In terms of size, sexual dimorphism was detected, with male lobsters being significantly larger than females (p < 0.01). The
mean size of recruitment into the trap and SCUBA fisheries were significantly larger than for the free dive fishery (p < 0.01);
however, in all cases mean values were greater than the minimum legal size of 95 mm carapace length. Estimates of the size of female maturity (95.7 and 97.7 mm) were slightly larger than the minimum legal size and defined as the size at which 50% of
females have mated (i.e., those bearing spermatophores plus those that were egg-bearing). Despite this it was considered important
to maintain the current minimum size since it was already a widely accepted harmonised management measure within the Organization of Eastern Caribbean States. In terms of status and trends, no significant negative trends were detected for mean size of
lobster landed or mean catch per unit effort, even when compared with 1970s data. Based on the fore mentioned results, the lobster
fishery was considered sustainable at the current level of fishing; however greater measures have to be taken to prevent growth overfishing.
KEY WORDS: Caribbean spiny lobster, Antigua and Barbuda, fisheries management, maturity, spawning, compliance rate
INTRODUCTION
The Caribbean spiny lobster (Panulirus argus) fishery of Antigua and Barbuda was valued at US$2.5 million in
2011 and accounted for 16% of the total ex-vessel value of capture production (US$15.6 million); in term of quantity, this
was equivalent to 229 metric tons (live weight). Commercially, traps (fish pots) and the use of SCUBA with wire snares are
the predominant methods used to target the spiny lobster. Free diving for lobster is still done to a limited extent in Barbuda
while bottom gill nets contribute marginally in terms of incidental catch. Traps are typically constructed from hexagonal-
mesh chicken wire and braced with “wattle” (stick) or steel. One or two funnel-shaped entrances are usually present,
through which spiny lobster and reef fish can enter more easily than exit. Traps set to target solely lobster tend to have a
larger funnel entrance than those used to target both lobster and reef fish. This is usually the case in Barbuda, where reef
fish is of minor economic importance due to limited cold store and local demand. Traps are typically hauled every seven
days and may be unbaited or baited with dried coconut meat (copra) and / or cowhide. The most common type of traps for
lobster is the rectangular box; arrowhead and antillean Z traps are mainly used to target the deep-water snappers and
groupers. Fishing vessels range from small pirogues to large fibreglass launches, with the latest equipment (global position-
ing system, depth sounder, hydraulic hauler, etc.). Typical investment (including vessel, gear and equipment) ranges from
US$20,000 for a 22-foot fibreglass pirogue to US$78,000 for a 38-foot fibreglass launch. Studies have indicated that the
trap fishery for spiny lobster and reef fish was an economically and financially viable undertaking, which generated
sufficient revenue to cover the cost of depreciation, as well as the opportunity cost of capital and generated funds for
reinvestment in addition to employment, income and foreign exchange earnings (Jeffrey 1990, Horsford 2001a, Tietze et al.
2001, Tietze et al. 2005).
In 2011, 180 Antiguan-registered vessels fished for both spiny lobster and reef fish, with much of the landings for
lobster being consumed locally by the tourism sector (the key driver of the national economy). With much of the tourism
infrastructure based on the island of Antigua and stay-over visitors at about 243,000 (Eastern Caribbean Central Bank
2011), the 480 fishers employed in the spiny lobster fishery in 2011 had a readily available market with competitive prices.
In contrast, the lobster fishery of the island of Barbuda, is export-driven, due to weak local demand (resident population
only 1,810 in 2011 (Statistics Division 2012)) as well as strong demand as a “luxury good” for export to neighbouring
French overseas territories in the Eastern Caribbean. At its peak, the fishery in Barbuda supported 118 fishers operating

Page 424 66th Gulf and Caribbean Fisheries Institute
from 54 vessels. Approximately 26% of the population of
Barbuda was directly dependent on the lobster fishery
(Horsford 1999), which also offered the highest per capita
earnings (Van der Meerin 1998). In 2011, decline in
exports due to decrease demand related to the global
economic downturn saw the number of active fishers
decline to 55 individuals operating from 34 vessels.
Limited data from 2000 indicted that 41.8% of the
variation in the monthly lobster exports to Guadeloupe
(including St. Barthelemy and St. Martin) can be explained
by monthly tourist arrivals at hotels in Guadeloupe, p <
0.05 (Fisheries Division 2009).
The Fisheries Act, No. 22 of 2006 and the Fisheries
Regulations, No. 2 of 2013, are the primary legislative
basis for fisheries management and development, as of
February 2013. These pieces of legislation replace the
Fisheries Act (1983) and the Fisheries Regulations (1990).
The new regulations move the fishery for any species of
lobster (including Panulirus argus, Panulirus guttatus,
Panulirus laevicauda, and Scyllarides spp.) from an “open
access” to a “limited entry” management regime through
the requirement for a special permit. The Fisheries
Regulations (2013) prohibits the possession or place for
sale of:
i. Any lobster carrying eggs,
ii. Any moulting lobster,
iii. Any lobster that has been speared, hooked, or
otherwise impaled,
iv. Any lobster carrying an intact tar spot
(spermatophore), or
v. Any undersize Caribbean spiny lobster (Panulirus
argus whose carapace length is less than 95 mm
or weigh less than 680 g or having a tail weighing
less than 200 g).
The Regulations limits fishing of lobster to only by
hand, loop, pot or trap with approved biodegradable panel
and minimum wire mesh aperture of 38.1 mm; hookah
compressor diving rigs are prohibited. It also requires
lobster to be landed whole and prohibits the removal of
eggs or spermatophores from lobster. In terms of close
season, it extends from 1st May to 30th June of every year
until otherwise declared by the Minister in the Gazette. The
Fisheries Act (2006) allows for the compounding of
offence, whereby a fine can be imposed according to the
prescribed schedule of fees for compounding of offence in
the Regulations; the maximum fine is EC$50,000
(US$18,518). The Fisheries Act as well as the Marine
Areas (Preservation and Enhancement) Act (1972), both
makes provision for the declaration of marine protected
areas.
Other important fisheries-related legislation include:
the Barbuda Local Government Act (1976), which gives
the local governing council of the island of Barbuda,
authority over its fisheries including the right to retain
taxes on exported seafood such as lobster; and the Barbuda
Shooting and Fishing By-Law of 1959, which limits the
authority of local council to one maritime league (5.56 km)
from the shores of Barbuda. By-laws gazetted by the local
council have the full force and effect in Barbuda however
they shall only operate in addition to and not in derogation
of any other law of Antigua and Barbuda.
The first major assessment of the spiny lobster fishery
of Antigua and Barbuda was done by Peacock (1974)
under a British Overseas Administration project. The
assessment was in response to a decline in lobster landing
from 0.68 kg per trap in 1969 to 0.45 kg per trap in 1972
(Peacock 1974). In 1995, a comprehensive data collection
(including catch and effort and biological) programme was
established under the Canadian-funded Caribbean Commu-
nity (CARICOM) Fisheries Resources Assessment and
Management Programme. In 2001, this programme was
completely revised to improve the quality of biological and
catch and effort data (e.g., proper accounting for zero-catch
trips) as well as monitor the high degree of variability
associated with the artisanal nature of the fisheries; the
fisheries sector acts as an economic “safety net” for the
tourism and construction sectors, hence upturns / down-
turns or seasonality in these related sectors can impact
fishing effort due to the practice of occupational pluralism.
To address this a census of active fishing vessels is
conducted annually to improve estimates of total fishing
effort, employment (number of active fishers by primary
fishing method) and compliance rates with respect to
licensing of local fishing vessels (Horsford 2001b).
Assessments conducted in the 2000s (Horsford 2004,
Horsford and Archibald 2006, Horsford 2008) concluded
that spiny lobster stock was sustainable at the current level
of fishing based on the fact that current production was in
line with the most conservative estimate of the maximum
sustainable yield and no negative trends were detected with
respect to the mean catch per unit effort or mean carapace
length for almost a decade. The report of the Western
Central Atlantic Fishery Commission (WECAFC) (Food
and Agriculture Organization of the United Nations 2007)
listed the stock as fully-exploited or stable based on the
results of the 2004 and 2006 studies.
In light of the fore mentioned and the limited studies
conducted, the specific objectives of this research was to:
i) Determine important fishery-related biological
parameters for the Caribbean spiny lobster (size of
maturity, mating / breeding periods, length-weight
relationships, etc.),
ii) Appraise previous and current management
regimes (minimum size, gear restrictions, close
season, compliance with regulations, etc.), and
iii) Determine trends (catch and effort, carapace
length, etc.) and status of the fishery.
MATERIALS AND METHODS
Data used in this study came from Antigua and
Barbuda’s Fisheries Division catch and effort, lobster
biological and fisheries compliance programmes (this

Horsford, I. et al. GCFI:66 (2014) Page 425
includes a registry of breaches of fisheries legislation). In
certain cases datasets date as far back as 1992. Catch and
effort and biological data were collected from commercial
fishing trips, at-sea stop and search, and inspection of retail
and export facilities. For the biological programme,
lobsters were sexed and their development stage coded
according to the following criteria:
i) Female with no eggs or tar spot (spermatophore),
ii) Female with tar spot (spermatophore) intact,
iii) Female with tar spot (spermatophore) eroded,
iv) Female with orange eggs,
v) Female with brown eggs
vi) Moulting (soft shell) female
vii) Male; and
viii) Moulting (soft shell) male.
For each sample, the following data were collected
(where possible):
i) Carapace length (measured from the front edge of
the carapace along the medial dorsal line to the
maximum concavity of the rear edge of the
carapace),
ii) Carapace width (measured from the lateral edge of
the carapace at the point of maximum convexity),
iii) Live weight of intact animal; gear or fishing
method used
iv) Depth fished, and
v) Area fished.
The status of biological samples were also recorded
(i.e., whether samples were sorted or unsorted). This was
done to avoid potential bias in fishery performance
indicators (e.g., annual or area mean carapace length). Live
weight was to the nearest 1 g, whilst carapace length and
width were measured to the nearest 0.1 mm using calipers.
Statistical analyses were conducted using Microsoft
Excel 2010 and IBM SPSS Statistics Version 20. Excel
Solver and the trend line or regression curve estimation
features of the fore mentioned software were used to best
estimate the size at maturity and peaks in the breeding
periods. Logistic regression using the probit analysis
feature in SPSS was used as an alternative method for
determining the size at maturity. Midpoints of carapace
length classes, the number of females that were mature in
each length class and the total number of females in each
length class were imported into SPSS. A logit model was
selected where the covariate (the midpoints of the carapace
length classes) were transformed to natural log. The
proportion (p) of mature female in each length class was
converted to logit, Y = logit(p) = ln[p / (1 - p)]. The logit
data (Y) were then plotted against the natural log of the
carapace length midpoints (X), and a linear regression line
fitted to the data points. The output of the regression
analysis provided an estimate of the carapace length
associated with a maturity rate of 50% for females. This is
possible since Y = ln[p / (1 - p)] = ln[e a + bX ] = a + bX, and
when p = 50% (0.5), then Y = 0; substituting this value in
the estimated regression line and solving for X = ln
(carapace length midpoints) = -a / b (Hubert 1996). The
estimated size at maturity is then equivalent to e X or e (-a /
b). Note the size at maturity was defined as the size at
which 50% of females had evidence of mating and / or
breeding (i.e., those bearing intact or eroded spermatophore
plus those that were egg-bearing).
Simple linear regression was used to investigate the
relationships between carapace dimensions (length and
width). To determine the relationships between live weight
and carapace dimensions, simple linear regression was
used on common log transformed data. Analysis of
variance was used to determine if the following conditions
existed: sexual dimorphism (i.e., significant difference in
size between the sexes); and significant spatial and / or
temporal variability in fishery performance indicators
(mean catch per unit effort and carapace length). The status
of the sex ratio (whether unbiased or biased) was deter-
mined by a Chi-square Goodness of Fit Test. Odds Ratio
was used to compare management performance with
respect to fisheries enforcement during different periods.
RESULTS
Figure 1 summarises the percentage of female spiny
lobsters that were mature by size class for 1,374 samples
collected from Antigua and Barbuda waters ranging in
depth from 3 to 110 m. Evidence of maturity included the
presence of intact or eroded spermatophore (tar spot), and /
or the presence of eggs. Solving the natural log equation
for the best-fit-line in Figure 1, when y = 0.5, provided an
estimate of 97.7 mm as the size at 50% maturity for
females. In terms of the goodness of logarithmic fit to the
Figure 1. The percentage of female Caribbean spiny lob-sters that were mature by size class for samples collected from Antigua and Barbuda waters (sample size n = 1,374; depth range: 3 - 110 m). Evidence of maturity included the presence of intact or eroded spermatophore (tar spot), and / or the presence of eggs.

Page 426 66th Gulf and Caribbean Fisheries Institute
data, the regression model accounted for 90.5% of the total
variation in the percentage of female spiny lobsters that
were mature. The estimated regression line obtained from
the logistic regression was Y = -25.044 + 5.490X, hence
the estimated size at 50% maturity was 95.7 mm. The
lower and upper 95% confidence limits for the size at
maturity were 83.3 and 103.9 mm, respectively.
In order to determine peak periods in mating and / or
breeding, a 4th order polynomial curve was fitted to the
percentage of female Caribbean spiny lobsters that had
evidence of mating by month (Figure 2). The regression
model explained 87.5% of the total variation in the
percentage of females that had evidence of mating. Data
associated with breeding (i.e., the external presence of
eggs) was not disaggregated from mating due to the fact
that few samples were berried; of the 1,374 lobsters
possessing evidence of mating, only 54 were berried (40
had orange eggs while 14 had brown eggs). For about nine
months of the year greater than 50% of females had
evidence of mating (Figure 2) and reproductive activity
was year-round with possibly a major peak (April to
August inclusive) and a minor peak (November to
February inclusive). According to the fitted polynomial
curve and the regression equation (Figure 2), the major
peak occurred in June with 79.0% of females showing
signs of mating and the minor peak occurring in January
with 56.4% of females showing signs of mating. The
lowest observed frequency of mating occurred in October
(34.7%), as opposed to November estimated from the fitted
polynomial curve and the regression equation using Excel
Solver.
Significant sexual dimorphism was detected for
carapace length [Welch and Brown-Forsythe F-ratios: F (1,
2811.00) = 108.80, p < 0.001] and carapace width [Welch
and Brown-Forsythe F-ratios: F (1, 146.25) = 11.63, p <
0.01]. The carapace of male lobsters were 6% longer
(Figure 3) and 8% wider than their female counterpart.
Despite reaching statistical significance, the actual
difference in mean carapace length between sexes was
small (108.7 mm versus 102.5 mm); the effect size,
calculated using eta squared was 0.04. For mean carapace
width, the actual difference between sexes was moderate
(86.1 mm versus 79.8 mm); eta squared was 0.07. Chi-
square Goodness of Fit Test indicted that the sex ratio was
Figure 2. The percentage of female Caribbean spiny lob-sters that had evidence of mating by month for samples collected from Antigua and Barbuda waters (sample size n = 1,374; depth range: 3 - 110 m). Evidence of mating in-cluded the presence of intact or eroded spermatophore (tar spot), and / or the presence of eggs.
Table 1 summarises the relationships between live
weight and carapace dimensions by sex for Caribbean
spiny lobster collected from Antigua and Barbuda waters;
in all cases, regressions were significant (p < 0.001). For
all regressions, the adjusted coefficient of determination
was characteristically higher for males than for females.
Regression for males accounted for as much as 97% of the
variance that can be explained by the regression model;
regression for females accounted for 89% of the variance at
best. The 95% confidence intervals for the slope of the
regression line ranged from 2.54 to 2.64 for males and 2.40
to 2.55 for females. The confidence intervals overlapped
slightly suggesting that males and females may differ sig-
nificantly in their live weight-carapace length relationship
at this level of significance; t-test confirmed slopes were
statistically different (p < 0.05). For live weight-carapace
width relationship, there was a more pronounced overlap-
ping of the 95% confidence intervals for the slope for
males and females, suggesting the difference in the rela-
tionship was not significant; t-test confirmed slopes were
not statistically different (p > 0.05). Hence the regression
equation for the pooled sample (males and females) is also
presented in Table 1.
Figure 3. Mean carapace length by sex for Caribbean spiny lobster landed from Antigua and Barbuda waters. Error bar is for the 95% confidence interval and n = sample size.
Horsford, I. et al. GCFI:66 (2014) Page 427
Table 2 summarises the regression parameters for car-
apace length as a function of carapace width and vice versa
for male and female spiny lobsters. In all cases, regressions
were significant (p < 0.001), with the adjusted coefficient
of determination being characteristically higher for males
than for females. For males, 97% of the variation in the
carapace length can be explained by the carapace width, in
contrast, regression model for females accounted for 91%
of the variance in the carapace length. According to the
regression equation for carapace width as a function of
carapace length: for males, every additional 10.0 mm of
carapace length was associated with an increase in cara-
pace width of 7.0 mm; and for females, every additional
10.0 mm of carapace length was associated with an in-
crease in carapace width of 7.4 mm. This difference in rela-
tionship was not significant (t-test, p > 0.05); the confi-
dence interval for males ranged from 0.67 to 0.73, while
for females it ranged from 0.69 to 0.80.
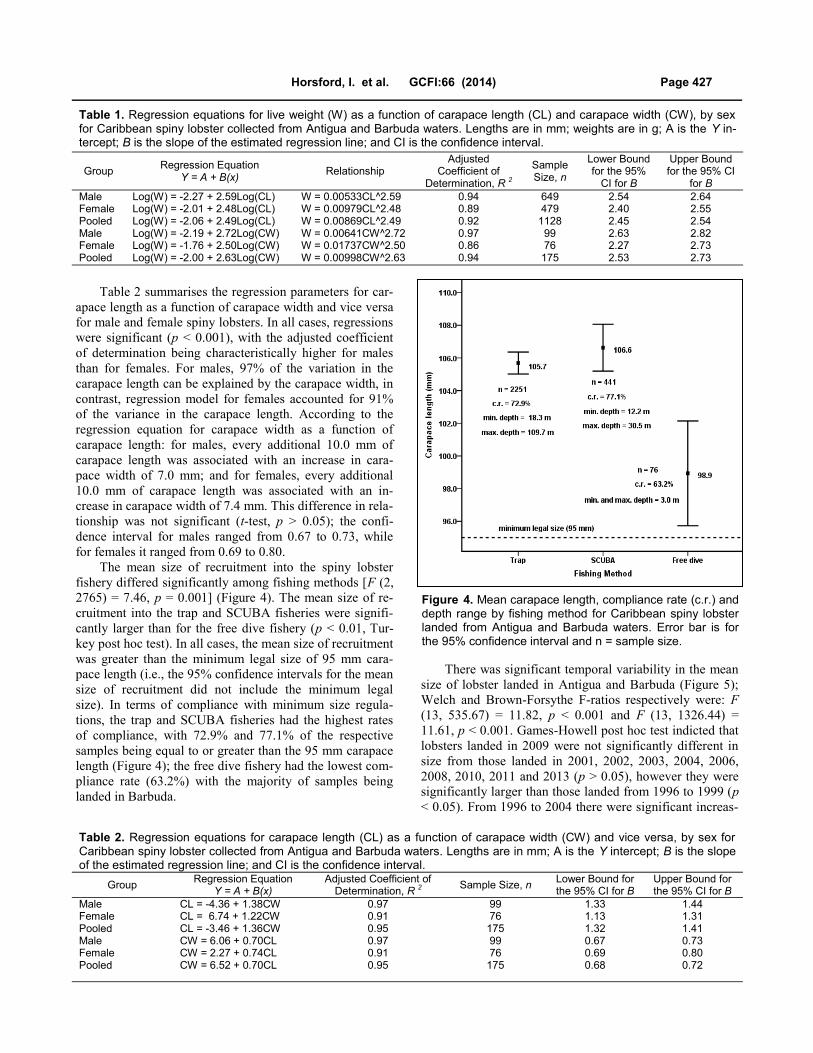
The mean size of recruitment into the spiny lobster
fishery differed significantly among fishing methods [F (2,
2765) = 7.46, p = 0.001] (Figure 4). The mean size of re-
cruitment into the trap and SCUBA fisheries were signifi-
cantly larger than for the free dive fishery (p < 0.01, Tur-
key post hoc test). In all cases, the mean size of recruitment
was greater than the minimum legal size of 95 mm cara-
pace length (i.e., the 95% confidence intervals for the mean
size of recruitment did not include the minimum legal
size). In terms of compliance with minimum size regula-
tions, the trap and SCUBA fisheries had the highest rates
of compliance, with 72.9% and 77.1% of the respective
samples being equal to or greater than the 95 mm carapace
length (Figure 4); the free dive fishery had the lowest com-
pliance rate (63.2%) with the majority of samples being
landed in Barbuda.
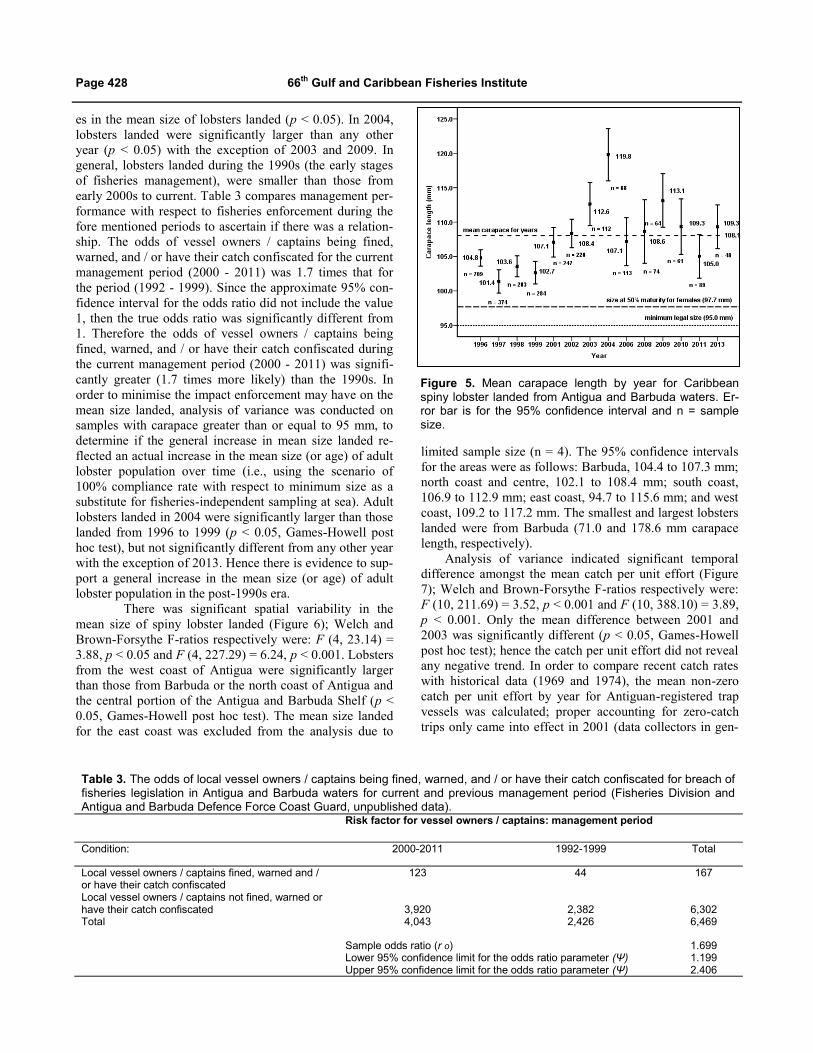
There was significant temporal variability in the mean
size of lobster landed in Antigua and Barbuda (Figure 5);
Welch and Brown-Forsythe F-ratios respectively were: F
(13, 535.67) = 11.82, p < 0.001 and F (13, 1326.44) =
11.61, p < 0.001. Games-Howell post hoc test indicted that
lobsters landed in 2009 were not significantly different in
size from those landed in 2001, 2002, 2003, 2004, 2006,
2008, 2010, 2011 and 2013 (p > 0.05), however they were
significantly larger than those landed from 1996 to 1999 (p
< 0.05). From 1996 to 2004 there were significant increas-
Table 1. Regression equations for live weight (W) as a function of carapace length (CL) and carapace width (CW), by sex for Caribbean spiny lobster collected from Antigua and Barbuda waters. Lengths are in mm; weights are in g; A is the Y in-tercept; B is the slope of the estimated regression line; and CI is the confidence interval.
Group Regression Equation
Y = A + B(x) Relationship
Adjusted Coefficient of
Determination, R 2
Sample Size, n
Lower Bound for the 95%
CI for B
Upper Bound for the 95% CI
for B Male Female Pooled Male Female Pooled
Log(W) = -2.27 + 2.59Log(CL) Log(W) = -2.01 + 2.48Log(CL) Log(W) = -2.06 + 2.49Log(CL) Log(W) = -2.19 + 2.72Log(CW) Log(W) = -1.76 + 2.50Log(CW) Log(W) = -2.00 + 2.63Log(CW)
W = 0.00533CL^2.59 W = 0.00979CL^2.48 W = 0.00869CL^2.49 W = 0.00641CW^2.72 W = 0.01737CW^2.50 W = 0.00998CW^2.63
0.94 0.89 0.92 0.97 0.86 0.94
649 479
1128 99 76 175
2.54 2.40 2.45 2.63 2.27 2.53
2.64 2.55 2.54 2.82 2.73 2.73
Table 2. Regression equations for carapace length (CL) as a function of carapace width (CW) and vice versa, by sex for Caribbean spiny lobster collected from Antigua and Barbuda waters. Lengths are in mm; A is the Y intercept; B is the slope of the estimated regression line; and CI is the confidence interval.
Group Regression Equation
Y = A + B(x) Adjusted Coefficient of
Determination, R 2 Sample Size, n
Lower Bound for the 95% CI for B
Upper Bound for the 95% CI for B
Male Female Pooled Male Female Pooled
CL = -4.36 + 1.38CW CL = 6.74 + 1.22CW CL = -3.46 + 1.36CW CW = 6.06 + 0.70CL CW = 2.27 + 0.74CL CW = 6.52 + 0.70CL
0.97 0.91 0.95 0.97 0.91 0.95
99 76
175 99 76
175
1.33 1.13 1.32 0.67 0.69 0.68
1.44 1.31 1.41 0.73 0.80 0.72
Figure 4. Mean carapace length, compliance rate (c.r.) and depth range by fishing method for Caribbean spiny lobster landed from Antigua and Barbuda waters. Error bar is for the 95% confidence interval and n = sample size.
Page 428 66th Gulf and Caribbean Fisheries Institute
es in the mean size of lobsters landed (p < 0.05). In 2004,
lobsters landed were significantly larger than any other
year (p < 0.05) with the exception of 2003 and 2009. In
general, lobsters landed during the 1990s (the early stages
of fisheries management), were smaller than those from
early 2000s to current. Table 3 compares management per-
formance with respect to fisheries enforcement during the
fore mentioned periods to ascertain if there was a relation-
ship. The odds of vessel owners / captains being fined,
warned, and / or have their catch confiscated for the current
management period (2000 - 2011) was 1.7 times that for
the period (1992 - 1999). Since the approximate 95% con-
fidence interval for the odds ratio did not include the value
1, then the true odds ratio was significantly different from
1. Therefore the odds of vessel owners / captains being
fined, warned, and / or have their catch confiscated during
the current management period (2000 - 2011) was signifi-
cantly greater (1.7 times more likely) than the 1990s. In
order to minimise the impact enforcement may have on the
mean size landed, analysis of variance was conducted on
samples with carapace greater than or equal to 95 mm, to
determine if the general increase in mean size landed re-
flected an actual increase in the mean size (or age) of adult
lobster population over time (i.e., using the scenario of
100% compliance rate with respect to minimum size as a
substitute for fisheries-independent sampling at sea). Adult
lobsters landed in 2004 were significantly larger than those
landed from 1996 to 1999 (p < 0.05, Games-Howell post
hoc test), but not significantly different from any other year
with the exception of 2013. Hence there is evidence to sup-
port a general increase in the mean size (or age) of adult
lobster population in the post-1990s era.
There was significant spatial variability in the
mean size of spiny lobster landed (Figure 6); Welch and
Brown-Forsythe F-ratios respectively were: F (4, 23.14) =
3.88, p < 0.05 and F (4, 227.29) = 6.24, p < 0.001. Lobsters
from the west coast of Antigua were significantly larger
than those from Barbuda or the north coast of Antigua and
the central portion of the Antigua and Barbuda Shelf (p <
0.05, Games-Howell post hoc test). The mean size landed
for the east coast was excluded from the analysis due to
limited sample size (n = 4). The 95% confidence intervals
for the areas were as follows: Barbuda, 104.4 to 107.3 mm;
north coast and centre, 102.1 to 108.4 mm; south coast,
106.9 to 112.9 mm; east coast, 94.7 to 115.6 mm; and west
coast, 109.2 to 117.2 mm. The smallest and largest lobsters
landed were from Barbuda (71.0 and 178.6 mm carapace
length, respectively).
Analysis of variance indicated significant temporal
difference amongst the mean catch per unit effort (Figure
7); Welch and Brown-Forsythe F-ratios respectively were:
F (10, 211.69) = 3.52, p < 0.001 and F (10, 388.10) = 3.89,
p < 0.001. Only the mean difference between 2001 and
2003 was significantly different (p < 0.05, Games-Howell
post hoc test); hence the catch per unit effort did not reveal
any negative trend. In order to compare recent catch rates
with historical data (1969 and 1974), the mean non-zero
catch per unit effort by year for Antiguan-registered trap
vessels was calculated; proper accounting for zero-catch
trips only came into effect in 2001 (data collectors in gen-
Table 3. The odds of local vessel owners / captains being fined, warned, and / or have their catch confiscated for breach of fisheries legislation in Antigua and Barbuda waters for current and previous management period (Fisheries Division and Antigua and Barbuda Defence Force Coast Guard, unpublished data). Risk factor for vessel owners / captains: management period
Condition: 2000-2011 1992-1999 Total
Local vessel owners / captains fined, warned and / or have their catch confiscated Local vessel owners / captains not fined, warned or have their catch confiscated
123
3,920
44
2,382
167
6,302 Total 4,043 2,426 6,469
Sample odds ratio (r o) Lower 95% confidence limit for the odds ratio parameter (Ψ) Upper 95% confidence limit for the odds ratio parameter (Ψ)
1.699 1.199 2.406
Figure 5. Mean carapace length by year for Caribbean spiny lobster landed from Antigua and Barbuda waters. Er-ror bar is for the 95% confidence interval and n = sample size.

Horsford, I. et al. GCFI:66 (2014) Page 429
eral did not record zero catches dating as far back as the
1960s). There was significant temporal variability in the
mean non-zero catch rate (Figure 8); Welch and Brown-
Forsythe F-ratios respectively were: F (10, 134.90) = 3.76,
p < 0.001 and F (10, 226.53) = 3.98, p < 0.001. However,
only the mean differences between 2009 and 2002, and
2003 and 2006 were significantly different (p < 0.05,
Games-Howell post hoc test). In general, recent non-zero
catch rates were not significantly different (p > 0.05) from
those reported for 1969 and 1974 (Figure 8). The reported
catch rate for 1969 (0.68 kg / trap haul) was comparable to
the catch rates for the years 2002, 2003, 2005, 2006 and
2007 whilst the catch rate for 1974 (0.45 kg / trap haul)
was comparable to the catch rates for 2001, 2004, 2005,
2007, 2008, 2010, and 2011.
Figure 7. Mean catch per unit effort (CPUE) by year for Caribbean spiny lobster from Antiguan registered trap ves-sels. Error bar is for the 95% confidence interval and n = sample size.
Figure 6. Mean carapace length by area for Caribbean spiny lobster landed from traps hauled from Barbuda and the various coasts of Antigua (depth range: 18-110 m). Er-ror bar is for the 95% confidence interval and n = sample size.
Figure 8. Mean non-zero catch per unit effort (CPUE) by year for Caribbean spiny lobster from Antiguan registered trap vessels compared to historical data (Peacock 1974). Error bar is for the 95% confidence interval and n = sample size.
There was significant spatial variability in the mean
catch per unit effort for spiny lobster from the Antigua and
Barbuda Shelf (Figure 9); Welch and Brown-Forsythe F-
ratios respectively were: F (4, 105.21) = 36.45, p < 0.001
and F (4, 112.93) = 31.36, p < 0.001. Barbuda, north coast
of Antigua and centre, and the east coast of Antigua had
similar catch rates with respect to traps (p > 0.05, Games-
Howell post hoc test). The mean catch rates for the west
and south coast of Antigua were significantly less than that
for Barbuda or the north coast of Antigua and the central
portion of the Antigua and Barbuda Shelf (p < 0.001,
Games-Howell post hoc test). While catch rates for Barbu-
da and north coast and centre were statistically equivalent
(0.69 and 0.68 kg / trap haul, respectively), they were
about five-times that of the south coast of Antigua (0.12
kg / trap haul) and about four-times that of the west coast
of Antigua (0.18 kg / trap haul). In order to compare catch
rates from the Antigua and Barbuda Shelf to other areas in
the Caribbean, the mean non-zero catch rates for the fore
mentioned areas were also calculated since data sets from
most countries in the sub region typically collect infor-
mation on species caught as oppose to including unsuc-
cessful trips or zero-catch trips. Analysis of variance yield-
ed similar significant spatial variability with respect to the
mean non-zero catch rates; Welch and Brown-Forsythe F-
ratios respectively were: F (4, 70.38) = 27.72, p < 0.001
and F (4, 73.92) = 20.89, p < 0.001. The mean non-zero

Page 430 66th Gulf and Caribbean Fisheries Institute
catch rates for Barbuda, north coast and centre, and the east
coast were statistically equivalent (0.85, 0.94 and 0.84 kg /
trap haul respectively; p > 0.05, Games-Howell post hoc
test). However, mean catch rates for the west coast (0.30
kg / trap haul) and south coast (0.33 kg / trap haul) were
significantly less than that for Barbuda or the north coast of
Antigua and centre (p < 0.001, Games-Howell post hoc
test). The 95% confidence intervals for the areas were as
follows: Barbuda, 0.75 to 0.95 kg / trap; north coast and
centre, 0.68 to 1.19 kg / trap; south coast, 0.26 to 0.41 kg /
trap; east coast, 0.41 to 1.27 kg / trap; and west coast, 0.25
to 0.35 kg / trap.
1983). Munro (1983) estimated the mean size at maturity
for females to be about 95 mm carapace length and recom-
mended that it should be the lowest acceptable limit under
any circumstance. This study estimated the size at 50%
maturity for females to be 97.7 mm based on logarithmic
curve fitting and 95.7 mm based on the logit model. These
values were at most 2.7 mm greater than the current legal
minimum size (95 mm), thereby validating the extrapola-
tion made for OECS member states. Estimates of size at
50% maturity were consistent with the findings of Peacock
(1974), where first sexual activity in terms of external char-
acteristics were observed in lobsters 80 to 90 mm and at its
maximum in lobsters 100 to 130 mm. In terms of studies
from neighbouring islands, Dilrosun (2002) cited 93 mm
carapace length as the size at 50% fecundity and 108 mm
at full fecundity for Saba Bank. When one considers the
marginal benefit of increasing the minimum size by at most
2.7 mm versus the increase likelihood of illegal intrare-
gional trade in the absence of harmonised regulations, it
was considered prudent to maintain the status quo.
The polynomial trend line in Figure 2 estimated two
maxima for mating and / or breeding with a major peak
occurring in June and a minor peak occurring in January.
Aiken (1977) reported an analogous major breeding peak
in June and a minor peak in March for lobsters from Jamai-
can waters. Reproductive activity was year-round, con-
sistent with Peacock’s (1974) findings, with greater than
50% of females having evidence of mating for about nine
months of the year. The two peaks observed during the
major mating period was attributed to annual variation in
environmental conditions since samples from different
years were pooled; the observed percentage of females
with evidence of mating were 85.4% for May and 84.1%
for July. In 2014, a closed season will be implemented for
the first time in Antigua and Barbuda from 1st May to 30th
June of every year according to the newly enacted Fisher-
ies Regulations, No. 2 of 2013. Originally, a four-month
closed season was proposed that covered the major breed-
ing period (1st May to 31st August), and in line with the
harmonised closed season in the Organization of Eastern
Caribbean States, however only two months were agreed to
through negotiations with the Barbuda Council, fisher-
folks, exporters and other stakeholders. This raises the is-
sue of how best can a “bottom up” approach to local and
national governance (e.g., co-management) fit into a re-
gional ecosystem approach to governance which is “top
down”.
Significant sexual dimorphism was detected for cara-
pace length and width (p < 0.01). The carapace of males
was 6% longer (Figure 3) and 8% wider than those of fe-
males. One possible consequence of sexual dimorphism is
differential selection between the sexes. Chi-square test
indicated that more males than females were landed (p <
0.001), with 54.1% of the sample being male. This was in
line with the findings of Munro (1983) and Dilrosun
(2002); Aiken (1977) and Peacock (1974) obtained con-
Figure 9. Mean catch per unit effort (kg / trap haul) by area for Caribbean spiny lobster from Barbuda and the various coasts of Antigua. Error bar is for the 95% confidence inter-val and n = sample size.
DISCUSSION AND CONCLUSION
The current minimum legal size for Caribbean spiny
lobster for Antigua and Barbuda and most member states
of the Organization of Eastern Caribbean States (Grenada,
St. Lucia, St. Vincent and the Grenadines, Anguilla, and
St. Christopher and Nevis) as well as Turks and Caicos
Islands and the Caribbean Netherlands is 95 mm carapace
length. The framework for harmonised fisheries regula-
tions in areas such as minimum size came from three
workshops held by the Organization of Eastern Caribbean
States (OECS) and the Food and Agriculture Organization
of the United Nations (FAO) in 1983 and 1984. This led to
the preparation of draft Harmonised OECS Fisheries Act
which all member states have enacted with minor changes
as well as harmonised regulations (Chakalall 1992); in
1993 the Revised Harmonised OECS Fisheries Laws sup-
planted earlier draft. At the time, limited lobster maturity
studies in the eastern Caribbean resulted in the adoption of
95 mm carapace length as the legal size of maturity based
on management recommendations for Jamaica (Munro

Horsford, I. et al. GCFI:66 (2014) Page 431
trasting results with the sex ratio being equivalent. The
extent to which the differential selection was due to sexual
dimorphism and / or the response by fishers to regulations
skewed towards protecting berried (and more recently sper-
matophore-bearing) females remains to be determined.
MacDiarmid and Sainte-Marie (2006) suggested that many
fisheries have the potential to alter population sex ratio,
where one sex may be more vulnerable to capture due to its
greater spatial and / or temporal exposure to fishing gear.
In this study samples were collected via a variety of fishing
methods (traps, SCUBA, free dive, etc.) in the hopes of
avoiding or mitigating potential bias associated with col-
lection method. Regardless of the cause of the skewed sex
ratio, the recent enactment of a closed season should miti-
gate to some extent the distortion in the landings. Recently,
Robertson and Butler (2013) observed that females Panu-
lirus guttatus nearly always chose males larger than them-
selves (92% of laboratory trials), and if females mated with
smaller males, then fertilization success was reduced. If
this scenario holds true for Panulirus argus in the wild,
then differential landings in favour of males (depending on
the extent) may have a long-term impact on fertilization
success rates and ultimately recruitment.
Results from t-test indicated that the live weight-
carapace length relationship for male and female spiny
lobsters was significantly different (p < 0.05). This is con-
trary to the findings of Munro (1983) and Haughton and
King (1990). The 95% confidence intervals for the slope of
the regression line ranged from 2.54 to 2.64 for males and
2.40 to 2.55 for females. The estimates for the slope were
2.738 for both sexes in the case of Munro (1983), whilst
Haughton and King (1990) obtained 95% confidence inter-
vals ranging from 2.64 to 2.78 for males and 2.52 to 2.73
for females. In general, these estimates were greater than
those obtained in this study, however t-tests or analysis of
covariance on the datasets would have to be conducted to
confirm if the difference between or among the slopes were
significant; note for both sexes the confidence intervals
overlapped slightly. For live weight (W in g)-carapace
width (CW in mm) relationship, the difference between
slopes for the sexes was not significant (p > 0.05), hence
the relationship for all lobsters could be expressed as: W =
0.00998CW 2.63. For carapace width (CW) as a function of
carapace length (CL in mm), the difference in relationship
between the sexes was also insignificant (p > 0.05). There-
fore the relationship for all lobsters can be expressed as:
CW = 6.52 + 0.70CL. Munro (1983) reported the maxi-
mum carapace width is about 0.78CL for males and
0.73CL for females. For all regressions, the adjusted coef-
ficient of determination (goodness of model fit) was char-
acteristically higher for males than for females. In the case
of weight-length relationships, this was attributed to the
variation in weight associated with the various stages of
development for females (spermatophore intact or eroded,
eggs absent or present, etc.).
The mean size of recruitment into the trap and SCUBA
fisheries (105.7 and 106.6 mm, respectively) were signifi-
cantly larger than for the free dive fishery (98.9 mm) (p <
0.01); however in all cases mean values were greater than
the minimum legal size (95 mm) or estimates of size at
50% maturity (95.7 and 97.7 mm). In the early 1970s, Pea-
cock (1974) found that the mean size of recruitment for the
free dive fishery in Barbuda was 88.6 mm in the absence of
implementing a 229 mm total length minimum size (i.e.,
regulation was only enforced for exports). The 95% confi-
dence interval for recruitment into the free dive fishery
under the current minimum size regime (95 mm carapace
length) ranged from 95.7 to 102.1 mm, considerably larger
than the 1970s estimate. Data sets were considered compa-
rable since data from commercial fishing trips were com-
plemented by data from enforcement and inspection activi-
ties hence bias associated with different management re-
gime was mitigated or eliminated. The marginal free dive fishery had the lowest compli-
ance rate with minimum size regulation (63.2%) as oppose
to 72.9% for traps and 77.1% for SCUBA (Figure 4). Dil-
rosun (2002) obtained a comparable compliance rate of
72% for traps hauled from Saba Bank for the period April
1999 to May 2000. Results for the free dive fishery validat-
ed earlier management decision to divert fishing effort
away from shallow, nursery areas typically utilised by free
divers. This was done through the establishment of a series
of marine protected areas in 1999 and 2005 to complement
those established in the 1970s. The relatively high compli-
ance rate of fishers utilising SCUBA supported not imple-
menting a ban on its use. SCUBA was not listed as a pro-
hibited method due to the topography of the Antigua and
Barbuda Shelf; the 3,400 km2 shelf (to the 200 m contour)
has a mean depth of about 27 m. From 1996 to 2008, the
overall mean compliance rate with respect to minimum size
was 73.5% (Horsford 2010), whilst the mean compliance
rate from 2009 to 2013 was 83.5%. In 2001, a compliance
rate of 85% or greater was set as an informal performance
standard or reference point for the fishery (Horsford 2010).
There was significant temporal variability in the mean
size of lobster landed (p < 0.001). In general, lobsters land-
ed during the early stages of fisheries management (the late
1990s), were significantly smaller (p < 0.05) than those
from early 2000s to current. Also, most of the mean sizes
of lobsters landed from 2000s to current were significantly
greater (p < 0.05) than the estimate of the size at 50% ma-
turity for females (95.7 mm); 95% confidence intervals for
the mean sizes generally did not overlap with the 95% con-
fidence interval for the size at maturity (83.3 to 103.9 mm
carapace length) (Figure 5). The increase in the mean size
landed was attributed to the enactment and enforcement of
Fisheries Regulations No. 10 of 1990. The odds ratio with
respect to fisheries enforcement confirmed that the odds of
vessel owners / captains being fined, warned, and / or have
their catch confiscated during the current management pe-
riod (2000 - 2011) was significantly greater (1.7 times

Page 432 66th Gulf and Caribbean Fisheries Institute
more likely) than the late 1990s (Table 3). This is a testa-
ment to the enhanced capability of the Antigua and Barbu-
da Defence Force Coast Guard and the Fisheries Division
in the area of monitoring, control and surveillance as well
as greater support from fishers and other stakeholders. A re
-analysis of the data using only samples equal to or larger
the minimum size (i.e., the scenario of 100% compliance
with respect to minimum size) provided evidence to sup-
port a general increase in the mean size (or age) of adult
lobster population in the post-1990s era. Adult lobsters
landed in 2004 were significantly larger than those landed
from 1996 to 1999 (p < 0.05), but equivalent to any other
year with the exception of 2013.
Lobsters landed via traps from the west coast of Anti-
gua (e.g., Sandy Island) were significantly larger than those
from Barbuda or the north coast of Antigua and the central
portion of the Antigua and Barbuda Shelf (p < 0.05). Nei-
ther the minimum legal size (95 mm carapace length) nor
estimates of size at 50% maturity for females (95.7 and
97.7 mm) were included in the 95% confidence intervals
for the mean size landed for the areas (Figure 6). Further,
the 95% confidence intervals for the fore mentioned areas
were, in general, significantly greater than the 95% confi-
dence interval for the estimate of the size at 50% maturity
for females, which ranged from 83.3 to 103.9 mm carapace
length. Peacock (1974) cited 113.6 mm as the mean size
for the trap fishery based on offshore banks on the west
and in between both islands. This estimate from the 1970s
was not significantly different from the estimate obtained
for the west coast (113.2 mm) which was predominantly
offshore banks; the 95% confidence intervals for the west
(109.2 to 117.2 mm) included the 1970s estimate. Munro
(1983) found that males from an unexploited part of Pedro
Bank in the early 1970s became available to traps with a
mesh size of 41.3 mm at a mean size of 106.3 mm carapace
length, and females at a mean size of 92.3 mm carapace
length. The 95% confidence intervals for both sexes from
the fore mentioned areas were at a minimum comparable to
males from the unexploited part of Pedro Bank, with lob-
sters from the west coast being possibly significantly larger
than those from Pedro Bank despite using traps with small-
er mesh size (38.1 mm). In theory, one would expect that
the larger mesh size would yield larger lobsters than the
current study if they were present in the unexploited area.
Significant temporal difference exited amongst the
mean catch per unit effort (p < 0.001); however only the
mean difference between 2001 and 2003 was significantly
different (p < 0.05) (Figure 7). Interestingly, the smallest
mean for the catch rates occurred in 2001, and all subse-
quent means were of a greater value, however not statisti-
cally greater with the exception of 2003. These results co-
incided with the improvement in fisheries enforcement as
well as the general increase in the mean size of lobsters
landed in the early 2000s (Figure 5). Re-analysis of the
data using non-zero catch trips yielded comparable results
with most of mean non-zero catch rates after 2001 being
marginally (but not statistically) greater (Figure 8); this
collaborated the fore mentioned conclusion. In terms of
comparison with historical data, recent non-zero catch rates
were generally statistically equivalent (p > 0.05) to those
cited by Peacock (1974) for 1969 (0.68 kg / trap haul) and
1974 (0.45 kg / trap haul); the 95% confidence intervals for
the mean non-zero catch rates generally included the 1969
and 1974 estimates (Figure 8). The largest mean non-zero
catch rate for spiny lobster occurred in 2002 (0.95 kg / trap
haul) and may be statistically greater than the 1974 esti-
mate, although Peacock’s 1974 study did not provide suffi-
cient data to confirm this point.
Barbuda, north coast of Antigua and centre, and the
east coast of Antigua had similar catch rates with respect to
traps (p > 0.05). In contrast, mean catch rates for the west
and south coast of Antigua were significantly less than that
for the fore mentioned areas with the exception of the east
coast of Antigua (p < 0.001) (Figure 9). One might expect
that the area with the largest (oldest) lobsters (i.e., the west
coast) would coincide with the area with the highest abun-
dance, however Peacock (1974) found that catch rates as-
sociated with traps from a lagoon in Barbuda were 2.5
times greater (in terms of weight) than offshore banks due
to the fact that it functioned as an important nursery area
for juvenile lobster recruitment to offshore areas. This was
one of the main reasons for the establishment of the Co-
drington Lagoon National Park in Barbuda in March 2005.
The mean non-zero catch rates calculated for the same are-
as had similar significant spatial variability, with rates for
Barbuda, north coast and centre, and the east coast being
statistically equivalent (0.85, 0.94 and 0.84 kg / trap haul
respectively; p > 0.05), whilst rates for the west coast (0.30
kg / trap haul) and south coast (0.33 kg / trap haul) were
significantly less than that for Barbuda or the north coast of
Antigua and centre (p < 0.001). Toller and Lundvall’s
(2008) study of Saba Bank found that the mean non-zero
catch rate for lobster traps using similar mesh size as Anti-
gua and Barbuda (38.1 mm) was 1.09 kg per haul. Values
for the north coast and centre and the east coast were com-
parable to Saba Bank (i.e., 95% confidence intervals for the
areas included the Saba Bank estimate), despite traps were
mainly set for both lobster and reef fish.
Based on the fact that:
i) No negative trends were detected for the mean
catch per unit effort for both non-zero and zero
inclusive estimates,
ii) The mean carapace lengths have increased since
the post-1990s era, and
iii) All of the fore mentioned indicators were at a
minimum not significantly different from 1970s
estimates, one can only conclude that the spiny
lobster fishery is sustainable at the current level of
fishing.

Horsford, I. et al. GCFI:66 (2014) Page 433
Nevertheless, greater measures have to be taken to
prevent growth overfishing. The setting of a compliance
rate of 85% or greater (with respect to minimum size) as an
informal performance target for the fishery, as well as other
measures (such as increased fines) outlined in the Antigua
and Barbuda Plan of Action to prevent, deter & eliminate
IUU Fishing are steps in the right direction. In terms of
restricting fishing effort in the lobster fishery, Antigua and
Barbuda has moved from an open access to a limited-entry
management regime in 2013 through the need for a
“special permit”. Future works should focus on validating
the current results through fisheries independent studies as
well as the application of more formal stock assessment
methods. Due to the limited time frame of the data set, cur-
rent maximum sustainable yield estimates and their confi-
dence intervals vary too widely to be of practical use.
ACKNOWLEDGEMENTS The authors recognise the hard work of the numerous fisheries data
collectors over the years as well as the invaluable support of the Antigua
and Barbuda Defence Force Coast Guard, the many fishers, middlemen, vendors and exporters. Special thanks to Eric Burton and Sylvester White
(deceased), stalwarts and pioneers of Antigua and Barbuda’s spiny lobster
fishery.
LITERATURE CITED Aiken, K.A. 1977. Jamaica spiny lobster investigations. Pages 11-22 in:
H.B. Stewart Jr. (ed.) Symposium on Progress in Marine Research in the Caribbean and Adjacent Regions. Caracas, Venezuela, 12-16
July 1976. FAO Fisheries Reports No. 200. FIR/R200. FAO Fishery
Resources and Environment Division, Rome, Italy. Chakalall, B. 1992. Fisheries management in the Lesser Antilles. Pro-
ceedings of Gulf and Caribbean Fisheries Institute 42:294-330.
Dilrosun, F. 2002. Spiny lobster fishery of the Saba Bank. Proceedings of Gulf and Caribbean Fisheries Institute 53:46-57.
Eastern Caribbean Central Bank. 2011. National accounts statistics 2011.
Retrieved November 1, 2013, from the ECCB website: http://www.eccb-centralbank.org/PDF/National%20Accounts%
20Publication%202011.PDF.
Fisheries Division. 2009. Monthly domestic export of fishery products from Antigua-Barbuda in 2009. Retrieved November 1, 2013, from
the Fisheries Division website: http://www.fisheries.gov.ag/
information/statistics/pdf/monthly_domestic_fishery_exports2009.pdf.
Food and Agriculture Organization of the United Nations. 2007. Report of
the Fifth Regional Workshop on the Assessment and Management of the Caribbean Spiny Lobster. Mérida, Yucatán, Mexico, 19-29 Sep-
tember 2006. FAO Fisheries Report No. 826. Food and Agriculture
Organization of the United Nations, Rome, Italy. 99 pp. Haughton, M.O. and D.P.F. King (1990). Population biology of the spiny
lobster (Panulirus argus) in Jamaican waters. Proceedings of the
Gulf and Caribbean Fisheries Institute 41:528-542. Horsford, I. 1999. A Socio-economic Survey of the Fishers of Barbuda –
Implications for Planning and Development. Fisheries Division,
Ministry of Agriculture, Lands and Fisheries, St. John’s, Antigua. 29 pp.
Horsford, I. 2001a. Economic viability of marine capture fisheries in
Antigua and Barbuda – a case study. Pages 100-117 in: U. Tietze (ed.). Report of the Regional Workshop on the Effects of Globaliza-
tion and Deregulation on Fisheries in the Caribbean. Castries, St.
Lucia, 4-8 December 2000. FAO Fisheries Report No. 640. Food and Agriculture Organization of the United Nations, Rome, Italy.
Horsford, I. 2001b. Vessel frame survey 2001 – Antigua and Barbuda. Retrieved September 5, 2013, from the Fisheries Division website:
http://www.fisheries.gov.ag/information/publications/pdf/
Vessel_Frame_Survey_2001.pdf. Horsford, I. 2004, November 21. The present and future of Antigua-
Barbuda’s spiny lobster fishery. The Sunday Scoop, the Family
Newspaper of the OECS, p. 10. Horsford, I. and M. Archibald. 2006. Status of the Spiny Lobster Fishery
of Antigua and Barbuda. FAO Regional Workshop for Assessment
and Management of the Caribbean Spiny Lobster, Merida, Mexico. Fisheries Division, Ministry of Agriculture, Lands, Marine Re-
sources and Agro Industry. 10 pp.
Horsford, I. [2008]. Status of the fishery resources of Antigua and Barbu-da. Unpubl. M.S. Fisheries Division, St. John’s, Antigua, W.I. 20
pp.
Horsford, I. 2010. Antigua and Barbuda’s plan of action to prevent, deter and eliminate illegal, unreported and unregulated fishing. Retrieved
October 28, 2010 from the Fisheries Division website: http://
www.fisheries.gov.ag/information/publications/pdf/Antigua _Barbuda_NPOA_IUU_Fishing.pdf.
Hubert, J.J. 1996. Environmental Risk Assessment. University of Guelph,
Department of Mathematics and Statistics, Guelph, Ontario. 516 pp. Jeffrey, C. 1990. An analysis of operation cost and revenue of large fish-
ing vessels in Antigua and Barbuda. Submitted in partial fulfilment
of the requirement for the Diploma in Resource Management and Environmental Studies. University of the West Indies, Cave Hill,
Barbados. 133 pp. MacDiarmid, A.B. and B. Sainte-Marie. 2006. Reproduction. Pages 45-77
in: B.F. Phillips (ed.). Lobster: Biology, Management, Aquaculture
and Fisheries. Blackwell Publishing, Ames, Iowa. Munro, J.L. 1983. The biology, ecology and bionomics of spiny lobster
(Palinuridae), spider crabs (Majiidae) and other crustacean resources
(November 1974). Pages 206-222 in: J.L. Munro (ed.). Caribbean Coral Reef Fishery Resources. International Center for Living
Aquatic Resources Management, Manila, Phillipines.
Peacock, N.A. 1974. A study of the spiny lobster fishery of Antigua and Barbuda. Proceedings of Gulf and Caribbean Fisheries Institute
26:117-130.
Robertson, D.N. and M.J. Butler IV .2013. Mate choice and sperm limita-tion in the spotted spiny lobster, Panulirus guttatus. Marine Biology
Research 9:69-76
Statistics Division. 2012. Census 2011: Preliminary Data Release. Statis-tics Division, Ministry of Finance, the Economy and Public Admin-
istration, St. John’s, Antigua. 13 pp.
Tietze, U., J. Prado, J-M. Le Ry, and R. Lasch. 2001. Techno-economic Performance of Marine Capture Fisheries. FAO Fisheries Technical
Paper No. 421. Food and Agriculture Organization of the United
Nations, Rome, Italy. 79 pp. Tietze, U., W. Thiele, R. Lasch, B. Thomsen, and D. Rihan. 2005. Eco-
nomic Performance and Fishing Efficiency of Marine Capture Fish-
eries. FAO Fisheries Technical Paper No. 482. Food and Agriculture Organization of the United Nations, Rome, Italy. 68 pp.
Toller, W. and S. Lundvall .2008. Assessment of the Commercial Fishery
of Saba Bank. Saba Conservation Foundation, Netherland Antilles. 47 pp.
Van der Meerin, S. 1998. The Lobster Fishery of Barbuda. A Socio-
economic Study. Organization of Eastern Caribbean States Natural Resources Management Unit, St. Lucia. 52 pp.
Related Documents


