Historic, Archive Document Do not assume content reflects current scientific knowledge, policies, or practices.

Welcome message from author
This document is posted to help you gain knowledge. Please leave a comment to let me know what you think about it! Share it to your friends and learn new things together.
Transcript

Historic, Archive Document
Do not assume content reflects current
scientific knowledge, policies, or practices.

United States
Department of
Agriculture
Forest Service
Rocky MountainForest and RangeExperiment Station
Fort Collins,
Colorado 80526
General Technical
Report RM-142
A f
u4s(
v
Biology and Conservation
of Northern Forest Owls0-3 -nj
Symposium Proceedings
February 3 - 7, 1987
Winnipeg, Manitoba
892439
Nero, Robert W. ; Clark, Richard J.; Knapton, Richard J.; Hamre, R. H. , eds.
1987. Biology and conservation of northern forest owls: symposium proceedings.1987 Feb. 3-7; Winnipeg, Manitoba. Gen. Tech. Rep. RM-142. Fort Collins, CO:
U.S. Department of Agriculture, Forest Service, Rocky Mountain Forest and
Range Experiment Station; 309 p.
Proceedings of this first international symposium consist of 47 presentedpapers covering 15 owl sDecies, and 4 workshops dealing with capture,telemetry, census, and management techniques. Basic information on habitatpreferences, home range size, detecting lesser known owls, etc. will be
invaluable to managers of wildlife and of forested lands; techniquesinformation will be invaluable to researchers.
SUPPORTERS
:
Air CanadaCanadian Nature FederationCity of WinnipegManitoba Naturalists SocietyManitoba Wildlife FederationRichardson Century FundSaskatchewan Natural History Society
EXHIBITORS:
Hazel Birt, James Carson, Audrey Casey,
Carole Dempster, Roy Erskine, Tim Garton,Paul Guyot, Dennis Hillman, William McCracken,
Terry McLean, Glen Moncrieff, Heather North,
Lynn Ohryn, Norm Peterson, Bob Pollock,Jim Russell, Peter Sawatsky, Roy Simmons,
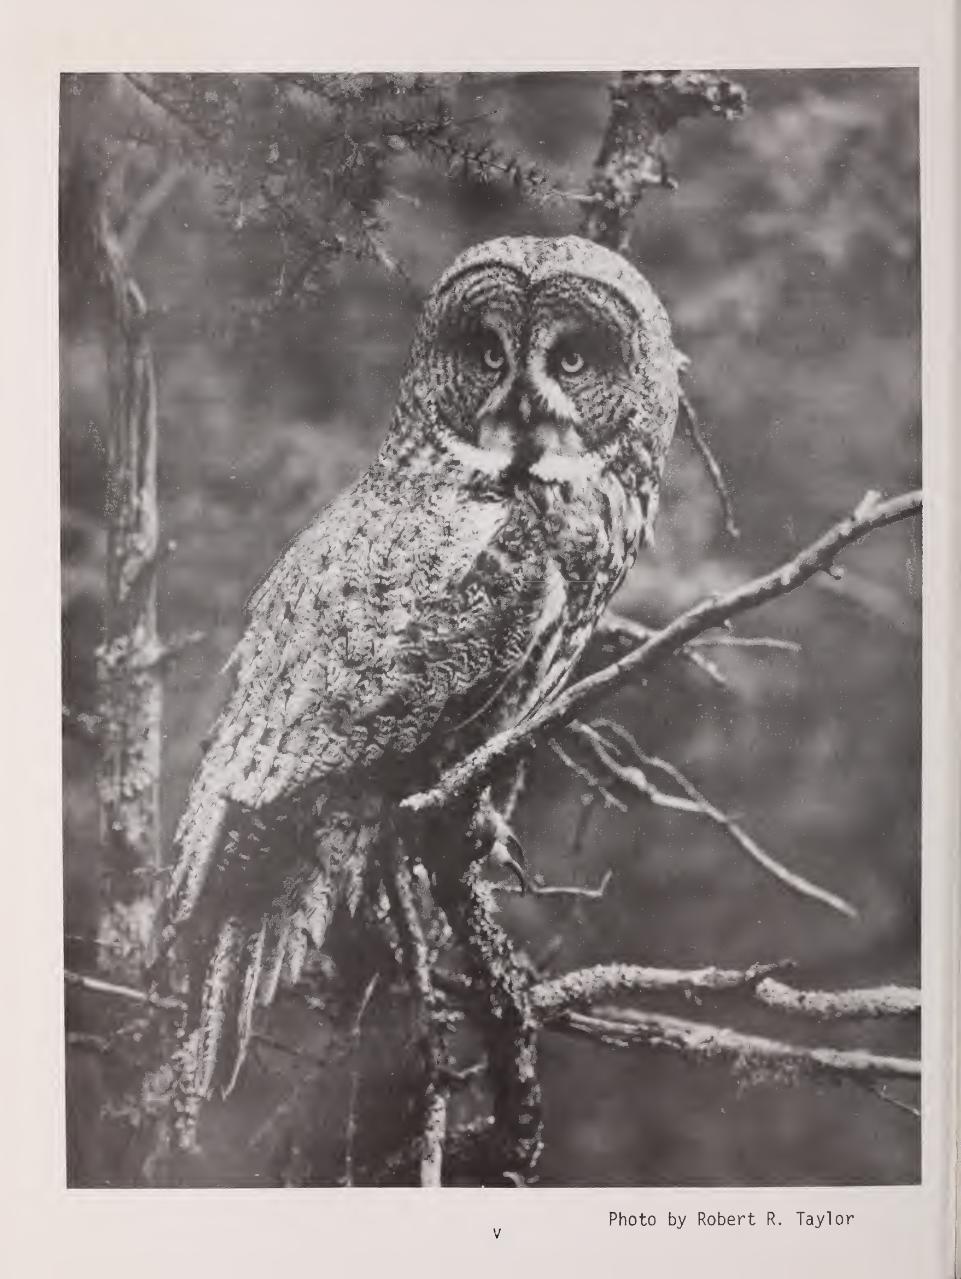
Robert R. Taylor, and Clarence Tillenius.
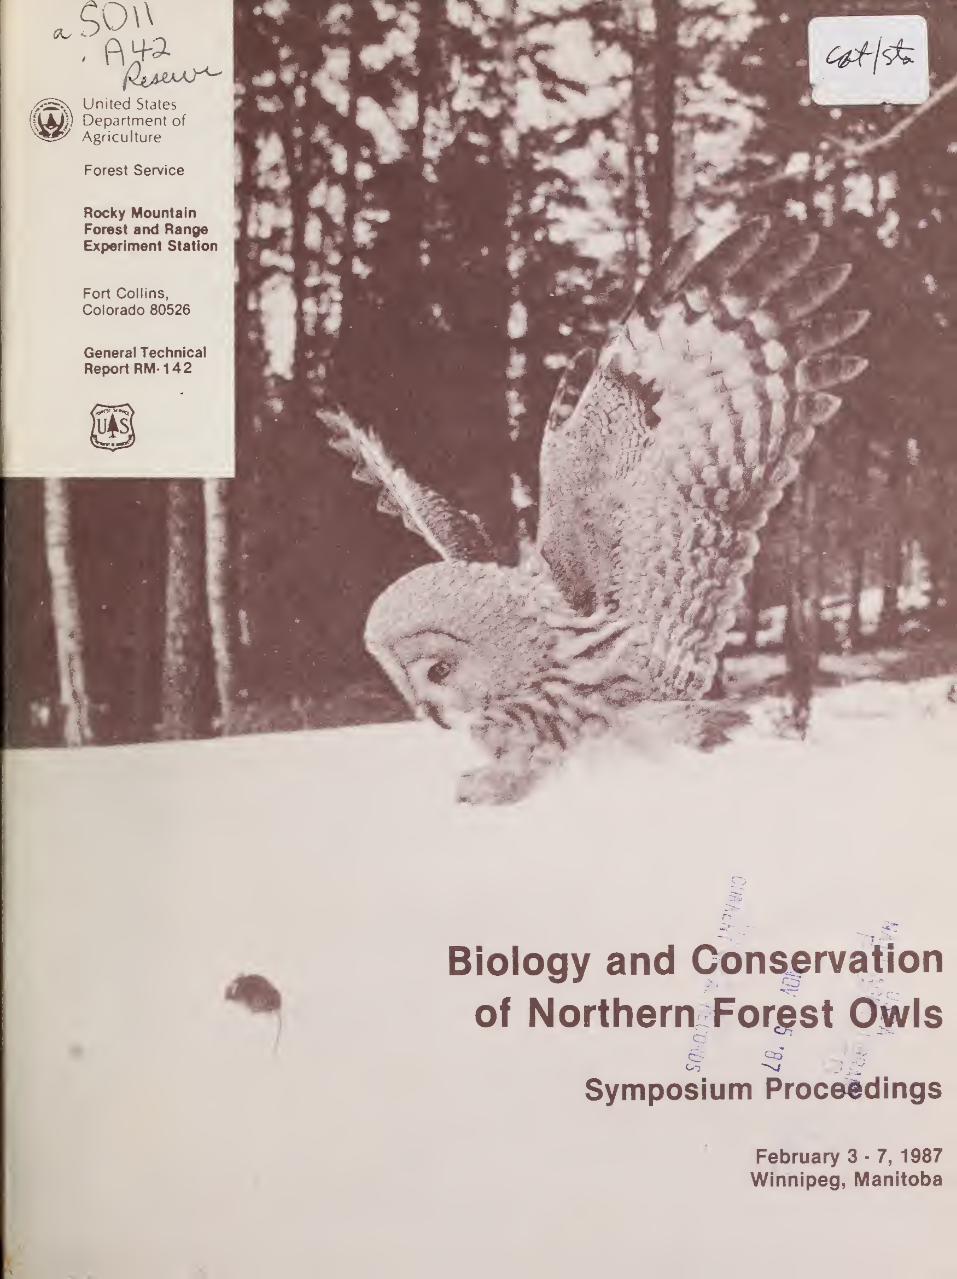
COVER
:
A Great Gray Owl drops in fordinner near Helsinki, Finland.Photo by Seppo Niiranen.
USDA Forest Service
General Technical Report RM-1421987
Biology and Conservationof Northern Forest Owls
Symposium Proceedings
February 3 - 7, 1987
Winnipeg, Manitoba
Editors:
Robert W. Nero, Manitoba Department of Natural ResourcesRichard J. Clark, York College of Pennsylvania
Richard J. Knapton, University of ManitobaR. H. Hamre, Rocky Mountain Forest & Range Experiment Station
Sponsors:
Manitoba Department of Natural ResourcesUSDA Forest Service
Natural Resources Institute, University of ManitobaWorld Wildlife Fund CanadaWorld Wildlife Fund USThe Wildlife Society
Preface
IN 1983, Bob Nero began to talk about the
need for a gathering of "owlologists" to comparenotes on Great Gray Owl research andconservation. At that time, he contacted a few
colleagues who also expressed a great need to
review their work and exchange ideas on researchtechniques. Little did any of us realize at the
time that the need was international, that the
forum would be 3 1/2 days of technicalpresentations and workshops, and that"owlologists" would be discussing all northernforest owl species at the first-of-its-kindSymposium held in Winnipeg, Manitoba, Canada,February 3-7, 1987
.
The timing was right on. The organizersworked hard. Sponsors' interest was high.Eventually a program was developed that included a
field trip, exhibits, musical and social events,all planned to provide a restful change fromintense discussions and to effect internationalcamaraderie. It worked. How well it worked canonly be known from those who were there!
As the coordinating chairman for theSymposium, I had the pleasure of working with acentral committee composed of Bill Koonz(Arrangements), Bob Nero (Program) and Ken De Smet(Finances) . Excellent support for this committeecame from office staff, university professors,volunteers, students and biologists. They are:Lori Bartley, Lynn Bergeron, Don Campbell, BrendanCarruthers, Maureen Collins, Herb Copland, Dr. JonGerrard, Chris Hofer, Kathryn Johnston, RudolfKoes, Dr. Erkki Korpimaki, Dr. Emil Kucera, JohnMorgan, Ted Muir, Dr. Ronald Ryder, UlrikeSchneider, Renate Scriven, Dr. Spencer Sealy, DonSexton, Dan Soprovich, Linda Tardiff , Rick Wishartand Rosemarie Young.
The production of a printed Proceedingswas accomplished in record fashion due to theoutstanding cooperation of the many contributorswho submitted camera-ready manuscripts andillustrations. Bob Hamre is obviously a seasoned
veteran in producing a quality publication. Hewas aptly assisted by the editorial committeeconsisting of Bob Nero, Dick Clark and RichardKnapton. Only the authors are responsible for thematerial contained in their papers; their viewsare not necessarily those of the sponsors, i.e.,the USDA Forest Service, the Wildlife Society,World Wildlife Fund, University of Manitoba, andthe Manitoba Department of Natural Resources.
How have northern forest owls benefittedfrom this Symposium? There was an initial, verypositive response from the public and local newsmedia to the holding of such an event. However,the full effect of this meeting will not berealized until the technical knowledge exchangedduring the Symposium and recorded in this documentis incorporated into action programs by managementagencies and pushed by conservation groups. Thischallenge was presented by Monte Hummel in hisopening address and recognized by Dick Clark inhis summary remarks.
Canada celebrates 100 years in wildlifeconservation in 1987 under the theme Wildlife '87:
Gaining Momentum. During a time when nongamewildlife programs are fledging and taking wing inCanada, it is appropriate that we would begin thesecond 100 years with a Northern Forest OwlSymposium as the first event of this celebration.By the time the next Northern Forest Owl Symposiumis held, I hope that action programs will havebeen implemented to protect owls where needed andto ensure that the public will have a greaterunderstanding and appreciation of the role of owlsin the natural environment.
Merlin W. Shoesmith,Chief, Biological Services,Wildlife Branch,Department of Natural Resources,Winnipeg, Manitoba.
i
Contents
Page
Preface: Merlin W. Shoesmith i
Northern Forest Owls: Special Presentations
Official Opening Remarks 1
Leonard E. Harapiak
Owls: Who Gives a Hoot? 2
Monte Hummel
Symposium Summary and Concluding Remarks 4
Richard J. Clark
Evolution, Structure, and Ecology of Northern Forest Owls (Keynote Address) 9
R. Ake Norberg
A Second Chance for Owls (Banquet Address) 44
Katherine McKeever
Special Aspects of Northern Forest Owls
Ronald A. Ryder and W. Bruce McGillivray, Chairpersons
Distributional Status and Literature of Northern Forest Owls 47
Richard J. Clark, Dwight G Smith, and Leon Kelso
Nearly Synchronous Cycles of the Great Horned Owl and Snowshoe Hare in Saskatchewan 56
C Stuart Houston
Reversed Size Dimorphism in 10 Species of Northern Owls 59
W. Bruce McGillivray
Disease Susceptibility in Owls 67
D. Bruce Hunter, Kay McKeever, Larry McKeever, and Graham Crawshaw
The Role of the Whitefish Point Bird Observatory in Studying Spring Movements of
Northern Forest Owls 71
Thomas W. Carpenter
Strix Owls of Northern Forests
Heimo Mikkola, Richard R. Howie, and Robert W. Nero, Chairpersons
Reproduction of the Ural Owl in the Bavarian National Park, Germany 75
Wolfgang T Scherzinger
Mate and Nest-Site Fidelity in Ural and Tawny Owls 81
Pertti Saurola
Nest Platforms for Great Gray Owls 87
Evelyn L. Bull, Mark G. Henjum, and Ralph G. Anderson
Biology of the Great Gray Owl in Interior Alaska 91
Timothy O. Osborne
A Floristic Analysis of Great Gray Owl Habitat in Aitkin County, Minnesota 96
Mark F. Spreyer
Movement Strategies, Mortality, and Behavior of Radio-Marked Great Gray Owls in Southeastern
Manitoba and Northern Minnesota 101
James R. Duncan
Summer Habitat Use by Great Gray Owls in Southeastern Manitoba 108
Maria C Servos
Status of the Great Gray Owl in Finland 115
Olavi Hilden and Tapio Solonen
•
II
Territorial Aspects of Barred Owl Home Range and Behavior in Minnesota 121
Thomas H Nicholls and Mark R. Fuller
Barred Owls and Nest Boxes— Results of a Five-Year Study in Minnesota 129
DavidH Johnson
Distribution, Density, and Habitat Relationships of the Barred Owl in Northern New Jersey 135
Thomas Bosakowski, Robert Speiser, and John Benzinger
Ecology of the Three Species of Strix Owls in Finland 144
Heimo Mikkola
Surnia Owls of Northern Forests
Wolfgang Scherzinger, Chairperson
Home Range Size of Hawk Owls: Dependence on Calculation Method, Number of Tracking Days,
and Number of Plotted Perchings 145
Bjorn T. Baekken, Jan O. Nybo, and Geir A. Sonerud
Observations of the Northern Hawk Owl in Alberta 149
Edgar T. Jones
Foraging Activity and Growth of Nestlings in the Hawk Owl: Adaptive Strategies Under
Northern Conditions 152
Kauko Huhtala, Erkki Korpimaki, and Erkki Pulliainen
Aegolius Owls of Northern Forests
R. Ake Norberg and Ann Swengel, Chairpersons
Sexual Size Dimorphism and Life-History Traits of Tengmalm's Owl: A Review 157
Erkki Korpimaki
Annual, Seasonal, and Nightly Variation in Calling Activity of Boreal and Northern Saw-Whet Owls ... 162
David A. Palmer
Distribution and Status of the Boreal Owl in Colorado 169
Ronald A. Ryder, David A. Palmer, and John J. Rawinski
Movements and Home Range Use by Boreal Owls in Central Idaho 175
Gregory D. Hayward, Patricia H Hayward, and Edward O. Garton
Occurrence of the Boreal Owl in Northeastern Washington 185
M. W. O'Connell
Home Range of Tengmalm's Owl: A Comparison Between Nocturnal Hunting and Diurnal Roosting ... 189
Bjorn V. Jacobsen and Geir A. Sonerud
The Breeding Biology of Northern Saw-Whet Owls in Southern British Columbia 193
Richard J. Cannings
Study of a Northern Saw-Whet Owl Population in Sauk County, Wisconsin 1 99
Scott R. Swengel and Ann B. Swengel
Remigial Molt in Fall Migrant Long-Eared and Northern Saw-Whet Owls 209
David L. Evans and Robert N. Rosenfield
Bubo, Asio, and Otus Owls of Northern Forests
Geir A. Sonerud and C Stuart Houston, Chairpersons
Dispersal and Mortality of Juvenile Eagle Owls Released from Captivity in Southeast Norway as
Revealed by Radio Telemetry 215
Runar S. Larsen, Geir A. Sonerud, and Ole H Stensrud
Geographic Variations in the Diet of Eagle Owls in Western Mediterranean Europe 220
Jose A. Donazar
Addled Eggs in Great Horned Owl Nests in Saskatchewan 225
C. Stuart Houston, Roy D. Crawford, and Donald S. Houston
Hi
Some Features of Long-Eared Owl Ecology and Behavior: Mechanisms Maintaining Territoriality 229
Vladimir I. Voronetsky
Food and Food Ecology of the Long-Eared Owl in an Agricultural Area 231
JosefKren
Fidelity to Territory and Mate in Flammulated Owls 234
Richard T Reynolds and Brian D. Linkhart
The Nesting Biology of Flammulated Owls in Colorado 239
Richard T Reynolds and Brian D. Linkhart
Distribution, Habitat Selection, and Densities of Flammulated Owls in British Columbia 249
R. Richard Howie and Ralph Ritcey
Censusing Screech Owls in Southern Connecticut 255
Dwight G. Smith, Arnold Devine, and Dan Walsh
Status of the Eastern Screech Owl in Saskatchewan with Reference to Adjacent Areas 268
Christopher I. G. Adam
Effects of Environmental Variables on Responses of Eastern Screech Owls to Playback 277
Thomas W. Carpenter
Current Status and Habitat Associations of Forest Owls in Western Montana 281
Denver W. Holt and J. Michael Hillis
People Power: Help for the Owl Bander 289
C. Stuart Houston
Northern Forest Owl Workshops
Capture Techniques for Owls 291
Evelyn L. Bull
Owl Telemetry Techniques 294
Thomas H. Nicholls and Mark R. Fuller
Owl Management Techniques 302
Katherine V. Haws
Owl Census Techniques Dwight G. Smith 304
General Census Considerations 304
Dwight G. Smith and Tom Carpenter
Census of Barred Owls and Spotted Owls 307
Tom Bosakowski
Census of Flammulated Owls 308
Richard T Reynolds
TV
Official Opening Remarks 1
Leonard E. Harapiak 2
Mr. Chairman, distinguished guests, owl biolo-gists, ladies and gentlemen. On behalf of PremierPawley and the Province of Manitoba, I will offici-ally open the Northern Forest Owl Symposium. To
those visiting delegates from northern Europe, the
United States, and other Canadian provinces andterritories: welcome to Manitoba! Your presence here
has ensured that this meeting will be a success. I
am advised that some of you have gone to consider-able effort to get here. I hope that your briefstay in Winnipeg and participation in this confer-ence will be very enjoyable and will bring you backsoon.
I would also like to congratulate the organi-zers of this event. I am sure that their hard workin developing the program and making all the arrange-ments will be evident during the next four days. I
understand that the auction beinq held later thisevening features contributions by Manitoba wildlife
artists, many of them exhibiting their work during
the symposium. Thank you to all contributors; theproceeds will go to support the symposium and to
owl conservation.
1986 was and 1987 will be special years forwildlife conservation in Canada. Last year, theWorld Wildlife Fund, a network of 23 national or-ganizations working to maintain the biological re-sources of the earth, celebrated its 25th anniver-sary. The Canadian affiliate has been a particular-ly good friend to wildlife in Manitoba, and I intendto speak more directly on that later this evening.
The Canadian Wildlife Federation also celebra-ted its 25th year in providing support for the pro-tection of natural resources in Canada. Coincident-ally, 1986 was the 25th anninversary of Manitoba'sWildlife Management Area Program. Over 7 millionacres in 59 areas have been designated for themanagement of wildlife and public use of the re-source. Many of them greatly assist in conservingowls.
During 1987, Canada will celebrate 100 yearsof wildlife conservation. As an initiative by theCanadian Nature Federation, a number of major events
Presented at the symposium, Biology and Conserv-ation of Northern Forest Owls, Feb. 3-7, 1987,Winnipeg, Manitoba. USDA Forest Service GeneralTechnical Report RM-1U2.
Minister, Manitoba Department of Natural Re-sources .
will occur under the theme "Wildlife '87: GainingMomentum". They include:
- the Northern Forest Owl Symposium- International CITES conference in Ottawa
July 12-24th- Last Mountain Lake dedication ceremonieswith Prince Philip in Saskatchewan
I am very pleased that Manitoba will be thefirst to celebrate 100 years of conservation in
Canada by focusing attention on owls of the borealforest. This is the first symposium of its kind
to be held anywhere in the world. It is my hope
that it will not be the last. It should become a
regular event to bring together the best collectivebiological wisdom on forest owls and to providedecision makers with the basis to make sound deci-sions to conserve populations of these magnificentbirds.
One of these magnificent birds is with us to-
night. Lady Gray'l, a Great Gray Owl, has beenmaintained in captivity by Dr. Robert Nero of mystaff for use in public education and research for
the last 2% years. She has visited many schoolrooms and shopping malls and has captured thehearts of many Manitobans.
While southeastern Manitoba has a substantialpopulation of these owls, it is still declared a
rare species across Canada. Manitobans have a
special obligation to ensure that Great Gray Owlspersist in Canada and to afford protection to
other owl species in jeopardy.
Because of the symbolic nature of Lady Gray'l,I expect that the Great Gray Owl will be officiallydesignated as Manitoba's provicial bird during the
forthcoming session of the Manitoba Lesislature.
In order to ensure that Great Gray Owls as
well as all wildlife species will receive the nece-
ssary resources required to manage and protect them,
I have asked my staff to prepare a non-game plan.
This plan will ensure efficient use of availablefunds, staff, student and volunteer time. I will
as well need the help of many of you and others as
leaders of conservation organizations here tonight
to co-operatively support its implementation.
In closing, I would like to express my grati-
tude to the co-sponsors and contributors who have
come forward with their generous support that will
make this symposium a success. It is with greatpersonal pleasure that I now declare the NorthernForest Owl Symposium to be officially open.
1
Owls: Who Gives a Hoot?1
Monte Hummel 2
Owls mean something to me. They've kept mecompany, lulled me to sleep and just generallymade life more worth living. I'm sure the sameis true for everyone else in this room. Yet,
what thanks have people extended to owls fortheir companionship and for their very importantrole in nature?
Well, on a world-wide basis IUCN alreadylists 13 species of owls in the Red Data Book.
I'm always interested to hear my colleague Jen'sWahlstedt from Sweden telling me exactly how manypairs of Eagle Owls they have and where each oneis.
Here in Canada, of course, we've managed to
put one owl species on each of our endangered,threatened and rare lists - the Spotted Owl,Burrowing Owl and Great Gray Owl respectively.We've cut the old growth timber habitat of the
Spotted Owl in B.C. We've plowed up, shot andlikely poisoned the Burrowing Owl in Alberta,Saskatchewan and Manitoba. And, although it has
always been found in relatively low numbers,we're making sure the Great Gray Owl stays thatway by cutting down some of its critical Tamaracknesting areas right here in Manitoba.
If you combine the IUCN world assessment to
date, add the Canada lists with other similarnational inventories, throw in a little commonsense, and I think an intelligent guess would be
that up to 20% of the world's 133 owl specieshave been either endangered or seriously jeopard-ized by the activities of people.
Makes you think doesn't it?
It makes me think. I makes me wonder whetherthe creator didn't put these birds on the planetto hoot out a question (if you'll pardon the pun),
"Just who who the hell do you humans think youare?"
Opening address presented at the symposium,Biology and Conservation of Northern ForestOwls, Feb. 3-7, 1987, Winnipeg, Manitoba. USDAForest Service General Technical Report RM 1U2.
oPresident, World Wildlife Fund Canada.
Well, who indeed do we think we are? Who
are we, one species, to have assumed control of
the earth's evolutionary fate, responsible for
the extinction of other species at an unprecedent-ed level? Who are we to cause extinctions, con-
servatively speaking, at the rate of three per
day, by the late eighties one per hour, and by
the turn of the century up to one million species
either endangered or extinct? Who are we to have
unleashed a rate of extinction 400 times greater
than anything experienced in recent geological
time? And who are we to have been responsible
for all this, but to have refused responsibility
for it?
Perhaps the numbers and estimates I gave
earlier regarding owls don't really indicate that
owls as a species-group are in any greater risk
than any other. Rather, and this may be the most
important conclusion, owls are quite representa-
tive of a trend being experienced by all forms
of wildlife.
The organization I represent, World Wildlife
Fund, is best known for trying to do something
about rescuing species from extinction, or "pre-
serving genetic diversity" as it is stated more
grandly in the World Conservation Strategy. Since
our founding in 1961, WWF has raised over $200
million for 5,000 projects in 130 countries.
Peanuts, that amount of money wouldn't even
buy you five F-18 Jet Fighters, and Canada just
ordered 138.
Some enterprizing journalist recently ident-
ified 100 species saved as a direct result of WWF's
efforts.
Peanuts again, when you consider we'll be
losing 100 per day within a matter of years.
So what can we do that amounts to anything?
Simply stated, but it's difficult to do, if we
seriously want to stem the tide of human-caused
extinctions, we must focus our efforts on con-
serving biological systems. Save a system and
you save the components. The cold fact is that
we are losing entire systems - for example the
tropical forest and wetlands on an international
scale, for example the prairie grasslands the
Carolinian Zone, and wetlands here in Canada.
Of course this is precisely why WWF Canada
last year opened an office in Calgary and launch-
ed our three-year Wild West program which has
2
already funded over 30 projects involving 40different conservation groups and agencies fromwestern Canada. We are also drafting a PrairieConservation Action Plan which will serve as a
blueprint for action on the remaining tall grass,mixed grass, shortgrass and aspen parkland prairieeco-sys terns - all of them more than 80% lost to
cultivation or grazing. This work is being donein co-operation with ranchers, farmers and otherland owners to encourage private stewardship and
conservation farming techniques. Since native
grasslands are the most endangered wildlife hab-
itats in Canada, WWF has taken the further steD
of inviting our International President, Prince
Philip, to visit western Canada in this 100th
year of wildlife conservation, to publicize the
international significance of western Canada's
conservation concerns. All of this is pursuing
that principle I mentioned earlier: "Save a
system and you save the components." In this
case, save the prairies and you save about half
the birds and mammals classified as endangered so
far in Canada.
To be sure, there are species-related steps
that can be taken. Getting back to our owls, for
example, WWF has supported conservation work on
all three species listed by the Committee on the
Status of Endangered Wildlife in Canada.
For the endangered Spotted Owl , we are sup-
porting a captive breeding program at the Owl Re-
habilitation Research Foundation with an eye to
reintroductions in this country.
For the threatened Burrowing Owl, we havesupported the first banding programs in all threeprairie provinces. We are working co-operativelywith landowners to protect pastures where nesting
burrows are found. We are helping poineer arti-ficial underground nesting boxes, and we are assis-ting with the drafting of a national recovery plan.
For the Great Gray Owl , we have supported workin Ontario into the question of why these birds in-
vade the southern Dart of that province during win-ter, and we have supported Bob Nero's work onradio telemetry and protection of the nesting hab-itat in southeastern Manitoba.
However, there is one more thing you coulddo, and I want to close by proposing it thisevening.
WWF Canada is already assisting with thepublication costs of the proceedings of thissymposium, and I am sure these will serve as
a useful update on the behavior, ecology andphysiology of North America's owls for reseacherseverywhere. But really, all the outside worldwants to know is what overall trend do thesemore technical papers indicate? Therefore couldwe not take an additional step with a statementof concern, perhaos similar to the wolf manifestoproduced by IUCN's specialist group on that spec-ies? Specifically, I'm proposing that a messagebe sent out at the closing of this meeting thatsays, hey, our beast is appearing on these bloodyendangered species lists! We are concerned andwe are speaking up. Because what is happeningto owls is sadly representative of what's happeningto wildlife in general. And we find this situationjust plain unacceptable. It cannot and must notcontinue.
Who gives a hoot about owls? We do! Nowit's time to let a few more people know aboutit.
3
Symposium Summary and Concluding Remarks 1
Richard J. Clark2
Abstract . --To summarize the geographiclocation of the researchers: of the 150 registrants,22 (15%) were from eight European countries (Norway,Finland, and Sweden topped the list), 83 (53%) werefrom five Canadian provinces and one Territory, and
45 (30%) were from 17 States of the United States.Of the 52 papers presented, 39 dealt with research ona single species, four dealt with two species, andseven dealt with more than two species. Of those,three dealt with community studies of owls. Eighteenpapers dealt with aspects of the basic behavior ofspecies and 12 papers dealt with the habitat of owlspecies in some detail. The conference brought fromobscurity some of the basic biology of Otus flammeolus ,
the Flammulated Screech Owl, and its distribution on theperiphery of its range in British Columbia, and thelatter can also be said about the population of SpottedOwls, Strix occidentalis , in that same province. Muchbasic information that will be invaluable to land andwildlife managers — such as habitat preference, homerange size, detecting lesser known owls, etc. -- waspresented.
SUMMARY AND CONCLUDING REMARKS
Someone has said that; "to summarize aconference such as this has been, is animpossible task but I would like to thankDr. Robert Nero for providing the oppor-tunity to try. I would also like tothank, on behalf of the participants if I
might be so presumptuous, Dr. MerlinShoesmith and all of the other Manitobansfor the splendid job they have done inorganizing and executing this Symposium.Having lived in Manitoba for a couple ofsummers I found the people of thisprovince to be memorably hospitable andthis trip has reinforced that feeling ofwarmth in spite of the outsidetemperatures
.
1 Concluding address at thesymposium, Biology and Conservation ofNorthern Forest Owls, Feb. 3-7, 1987,Winnipeg, Manitoba. USDA Forest ServiceGeneral Technical Report RM-142.
2 Richard J. Clark is Professor ofBiology at York College of Pennsylvania,York, Pa. 17403-3426.
I shall start out by admitting up
front that I was unable to hear all of
the papers presented. That arises fromthe fact that on Tuesday evening I was
conducting an auto census of the owls of
the forests of northern Minnesota,eastern North Dakota, and southernManitoba. I selected a strip transect to
sample the area and the strip consisted
of a band starting at the Minneapolis/St.
Paul Airport and ending at the ViscountGort Hotel in Winnipeg, Manitoba, Canada.
I choose 100 meters from the center of
the motor car route on either side of
routes 494, 94, and 49 as the specific
sampling area. The dimensions of the
sampling plot are actually 300 kilometers
by 200 meters. Admittedly only theshelterbelts and riparian woodland were
suitable habitat and I must subtract 12
kilometers of the strip where dense fog,
associated with sugar beet refineries,prevented my seeing any owls. Unfortun-
ately I did not see a single owl within
the study area. The only good aspect of
that fact is I do not have to ponderwhich statistic is most appropriate to
apply to my results. All of this is
offered as the reason underlying my
sleeping Wednesday morning when I should
have been listening to papers.
4
Secondly, I would like to define someof the technical terms that have beenused at the conference for the benefit ofthose readers of the proceedings. Someof these terms are similar to terms usedin everyday language, but they havespecial meaning here, thus I shall glossthem. I shall take the terms inalphabetical order. The first term isBastard and this has to do with mixedancestry. Now this was not the actualterm used by the presenter and when I
talked with him about my using the termhe suggested that it perhaps had anegative connotation. So to avoid thatpossibility I shall use that termComplication . We saw how Strix aluco andStrix uralensis were equally implicatedin complicating the ancestry of certaingenerations in Bavaria. Next we haveDivorce which is used to refer to thedissolution of pair bonding betweenmates. This was used to define bondingbetween individuals of the same twospecies earlier mentioned. Then we haveSecondary Females . In the humancondition this might be thought of asbeing analogous to playing second violinin an orchestra. We saw how "playingsecond fiddle" has inherent risks withinSurnia ulula populations. Finally wehave the term Topless and when applied tothe human condition this may mean thatthe upper portion of the torso isunadorned of garments or is naked. Herespecifically it refers to the torso of anest cavity box being naked of a roof
.
Enough of that—let me now try to beserious for a few minutes.
First allow me to summarize the geo-graphic location of the researchers.This information was taken from theofficial list of registrants. I havedeviated from that list only insofar as I
have recorded Dr. Heimo Mikkola as aresident of Finland rather than Indonesiaas suggested by the list. I will playthe numbers game for just a moment bysaying that of the 150 registrants 22(15%) were from eight European countries,83 (53%) were from five Canadian prov-inces and one Territory and 45 (30%) werefrom 17 states of the United States.Norway, Finland and Sweden topped thelist for numbers of participants fromEurope and not surprisingly Manitoba andSaskatchewan provided the largest numbersfrom Canada while Minnesota, Wisconsin,Colorado and Oregon were the home statesproviding the largest numbers from theUnited States
.
This says nothing about the qualityof the presentations which were overallsplendid from all countries. It wasespecially heartening to hear from Spain,Hungary, Czechoslovakia, and the USSR
even though our colleagues from thelatter three countries were unable totravel to the symposium. I trust thereaders are aware of the solidcontributions from Scandinavia and WestGermany and my comments citingspecifically representation from thesecountries will not offend those fromother countries. While humans recognizepolitical borders, owls do not; hence, itis important to hear from researchersfrom all geographic locales within owlspecies distributional ranges.
I will now shift my emphasis to whereit most appropriately belongs—to theowls themselves. I have, from theabstracts, compiled the following data[see Table 1] on a species by speciesbasis and would caution that thiscompilation was done while watchingslides and listening to presenters, hencemust be considered a preliminary to thefinal report that will appear in theProceedings . For emphasis, I will startby pointing out that seven of the 22species targeted (perhaps a bad choice ofwords) selected to be the subject of thisconference were not reported on at all.It is not at all surprising that five ofthe seven are species of Qtus for 32 ofthe 136 species of owls commonlyrecognized are of the Genus Qtus . Theyare, to enumerate, Qtus kennicotti theWestern Screech-Owl, Qtus bakkamoena theCollared Scops-Owl of Asia, Qtus bruceithe Striated Scops-Owl [also of Asia]Qtus scops the Common Scops-Owl ofAfrica, Eurasia and Indonesia and Qtussunia the Oriental Scops-Owl. Inaddition, we have heard nothing aboutBlakiston's Fish Owl Ketupa blakistoni ofJapan and Korea nor Ninox scutulata theOriental Hawk Owl which is widespread inAsia and Indonesia. Lest one think I amtotally negative I would hasten to addthat this conference has brought fromobscurity some of the basic biology ofQtus flammeolus the Flammulated ScreechOwl, and its distribution on theperiphery of its range in BritishColumbia and the same can be said aboutthe population of Spotted Owls Strixoccidentalis in that same province.Eighteen papers dealt with aspects of thebasic behavior of species and we saw howtechniques of hybridization, which can bean essential tool for isolating detailson the genetic component of species-specific behaviors can be utilized withowl species. Food habits are alwaysgoing to be an important aspect ofpredator studies; however they havereached the point where they are now wellenough known on some species that theyare now a means to the end of elucidatingecological relationships rather thanbeing an end in themselves. Twelve
5
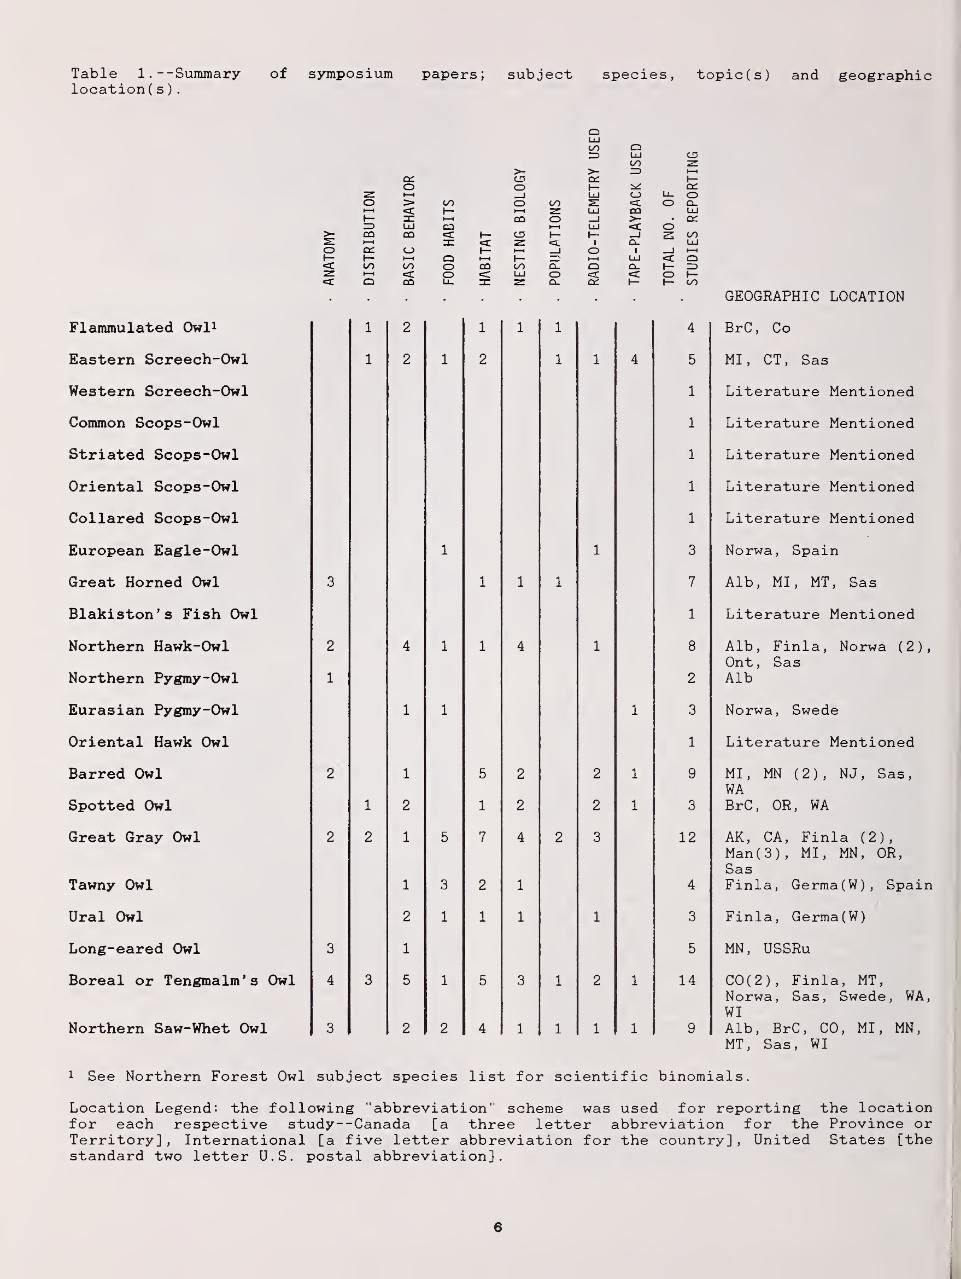
Table 1. --Summary of symposium papers; subject species, topic(s) and geographiclocation( s )
.
QLUCOrD LU CD
co>- >- rD i—
i
q: CD ct 1—o O h- OHi—
i
_l LU u_ oo > oo o CO s: o D_•—
i
1— 1—
1
z. LU CO LUt— n: I—
1
CO o __J >• CCLU co 1—
1
LU <C o>- CO co <c l- o 1— I— _i COs: 1—
1
rn eC «t o_ LUo o: o t— t—i _J o 1 _i t—t
t- h- »—
t
Q y—i f— 1—
1
LU < Q<c co O CO CO El Q O- I— ZD•z. 1—
1
<c O < LU o <C <c o \—«a: Q CO Ll- 31 o_ CC I— I— CO
GEOGRAPHIC LOCATION
Flammulated Owl* 1 2 1 1 1 4 BrC , Co
Eastern Screech-Owl 1 2 1 2 1 1 4 5 MI, CT, Sas
Western Screech-Owl 1 Literature Mentioned
Common Scops-Owl 1 Literature Mentioned
Striated Scops-Owl 1 Literature Mentioned
Oriental Scops-Owl 1 Literature Mentioned
Collared Scops-Owl 1 Literature Mentioned
European Eagle-Owl 1 1 3 Norwa, Spain
Great Homed Owl 3 1 1 1 7 Alb MI. MT. Sas
Blakiston ' s Fish Owl 1
Nnrthpm H^wlr-Owl 2 4 1 1JL 4 1JL Alh Finla Nnrwa (
9
1
Ont, SasNorthern Pygmy-Owl 1 2 Alb
Eurasian Pygmy-Owl 1 1 1 3 Norwa, Swede
Oriental Hawk Owl 1 Literature Mentioned
Barred Owl 2 1 5 2 2 1 9 MI, MN (2), NJ, Sas,WA
Spotted Owl 1 2 1 2 2 1 3 BrC, OR, WA
Great Gray Owl 2 2 1 5 7 4 2 3 12 AK, CA, Finla (2),Man(3), MI, MN, OR,Sas
Tawny Owl 1 3 2 1 4 Finla, Germa(W), Spain
Ural Owl 2 1 1 1 1 3 Finla, Germa(W)
Long-eared Owl 3 1 5 MN, USSRu
Boreal or Tengmalm's Owl 4 3 5 1 5 3 1 2 1 14 C0(2), Finla, MT,Norwa, Sas, Swede, WA,WI
Northern Saw-Whet Owl 3 2 2 4 1 1 1 1 9 Alb, BrC, CO, MI, MN,MT, Sas, WI
1 See Northern Forest Owl subject species list for scientific binomials.
Location Legend: the following "abbreviation" scheme was used for reporting the locationfor each respective study--Canada [a three letter abbreviation for the Province orTerritory] , International [a five letter abbreviation for the country] , United States [thestandard two letter U.S. postal abbreviation].
6
papers dealt with the habitat of owlspecies in some detail and hopefully thisarea of research will expand from here,for a suitable place to live is no doubteven more critical to the survival of owlspecies than it is to man. I did nottally man-owl aspects and they were nothere emphasized, however, we did see thatthere are some areas that are the causefor concern particularly with regard tospecies of Bubo . With regard to Bubothere is some good news and some bad.The good news is that through thededicated efforts of an individual andhis wife a cadre of volunteers wasdeveloped which changed the image of theGreat Horned Owl in central Canada, whilein Europe man continues to be a threat tothe survival of the Eagle Owl, eitherdirectly through his activities orindirectly through his anthropogenicstructures. The basic biology of nestingand population dynamics have beenreported but there is certainly room formore research in these areas . The latteraspect is particularly crucial if we areto insure the survival of existingspecies that are rare, threatened orendangered and also if we are to managespecies that are common, in a manner thatwill minimize conflict with man inrelations with those species.
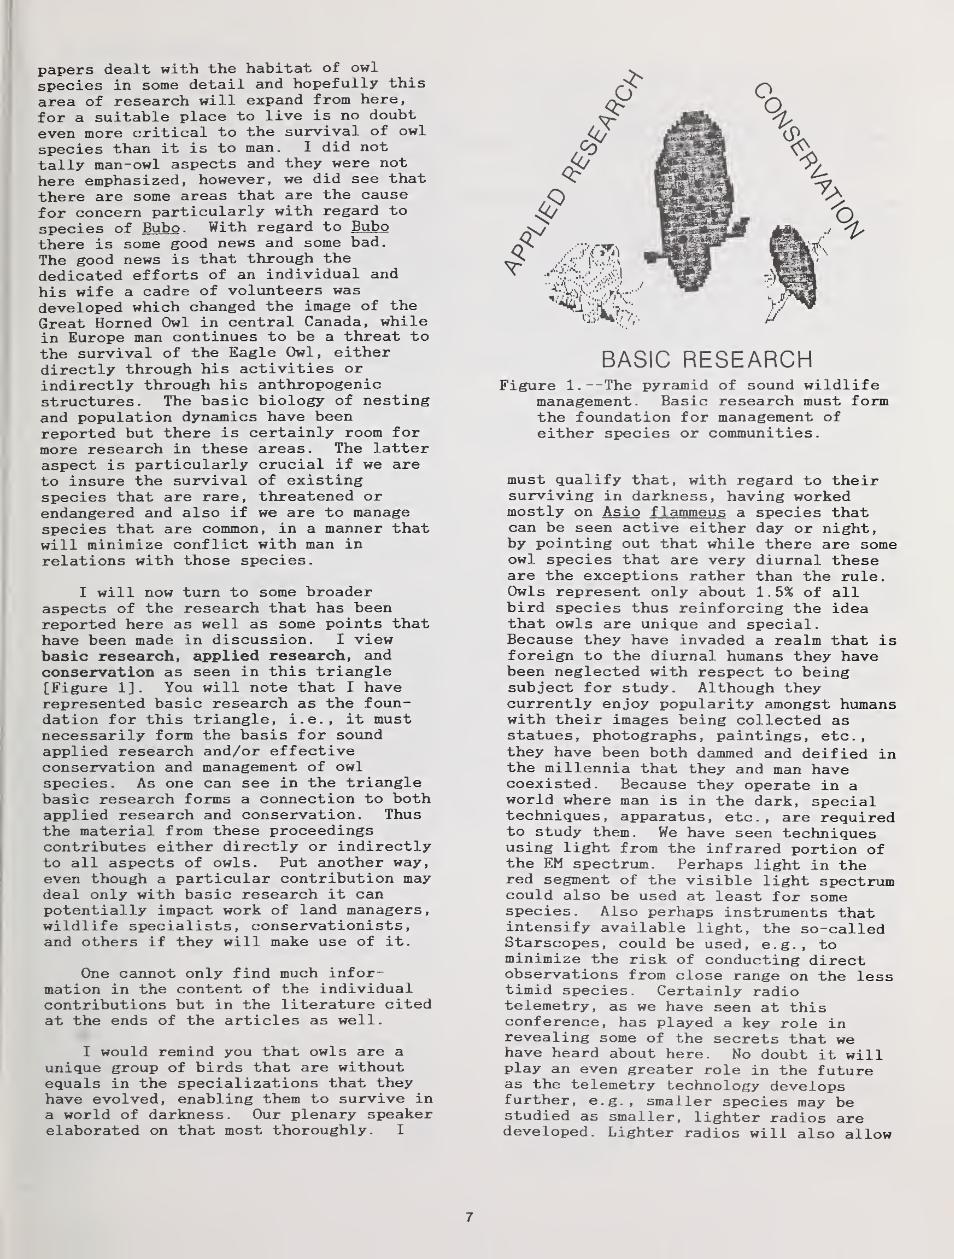
I will now turn to some broaderaspects of the research that has beenreported here as well as some points thathave been made in discussion. I viewbasic research, applied research, andconservation as seen in this triangle[Figure 1]. You will note that I haverepresented basic research as the foun-dation for this triangle, i.e., it mustnecessarily form the basis for soundapplied research and/or effectiveconservation and management of owlspecies . As one can see in the trianglebasic research forms a connection to bothapplied research and conservation. Thusthe material from these proceedingscontributes either directly or indirectlyto all aspects of owls. Put another way,even though a particular contribution maydeal only with basic research it canpotentially impact work of land managers,wildlife specialists, conservationists,and others if they will make use of it.
One cannot only find much infor-mation in the content of the individualcontributions but in the literature citedat the ends of the articles as well.
I would remind you that owls are aunique group of birds that are withoutequals in the specializations that theyhave evolved, enabling them to survive ina world of darkness . Our plenary speakerelaborated on that most thoroughly. I
BASIC RESEARCHFigure l.--The pyramid of sound wildlife
management. Basic research must formthe foundation for management ofeither species or communities
.
must qualify that, with regard to theirsurviving in darkness, having workedmostly on Asio flammeus a species thatcan be seen active either day or night,by pointing out that while there are someowl species that are very diurnal theseare the exceptions rather than the rule.Owls represent only about 1.5% of allbird species thus reinforcing the ideathat owls are unique and special.Because they have invaded a realm that isforeign to the diurnal humans they havebeen neglected with respect to beingsubject for study. Although theycurrently enjoy popularity amongst humanswith their images being collected asstatues, photographs, paintings, etc.
,
they have been both dammed and deified inthe millennia that they and man havecoexisted. Because they operate in aworld where man is in the dark, specialtechniques, apparatus, etc. , are requiredto study them. We have seen techniquesusing light from the infrared portion ofthe EM spectrum. Perhaps light in thered segment of the visible light spectrumcould also be used at least for somespecies . Also perhaps instruments thatintensify available light, the so-calledStarscopes, could be used, e.g. , tominimize the risk of conducting directobservations from close range on the lesstimid species. Certainly radiotelemetry, as we have seen at thisconference, has played a key role inrevealing some of the secrets that wehave heard about here. No doubt it willplay an even greater role in the futureas the telemetry technology developsfurther, e.g., smaller species may bestudied as smaller, lighter radios aredeveloped. Lighter radios will also allow
7
tracing the migration routes, times, etc.of those species whose movements appearto be somewhat erratic in nature as wellas the regular migrant species andperhaps satellite tracking would be mostappropriate for some of these studies.
We have seen a number of differentmethods used in trapping owls [see theworkshop presentations for details ofnumerous methodologies appropriate forowl research] , some of them variations oftechniques used on the diurnal raptors,i.e., hawks, falcons, etc., and someunique to owls. Successful trapping ofowls is critical to many types of studiesand I could not overemphasize thenecessity of having known individualswhile studying the basic ethology of thespecies in the field. At this point I
will site a quote from Larry McKeever'snew book "A dowry of owls"
Better one bird in hand than ten inthe wood.
Better for birders, but for birds notso good"
I am sure those of you who have triedto trap owls can relate to this and wouldsuggest that for the latter portion thatdepends on the professionalism of thebiologist and the use that informationgleaned as a result of the trapping isput to.
Management techniques havenecessarily brought in habitat manage-ment. We are, I think, observing a shiftin emphasis in management from thespecies to the community or even to theecosystem. However, that shift inemphasis has yet to reach owl biologists[if the biologists are not looking atwildlife from that point of view how canconservationists and wildlife managers,as well as land managers, be expected toadopt that point of view?] for of 52papers, 39 dealt with research on asingle species, four dealt with twospecies and while there were seven papersdealing with more than two species onlythree of those dealt with communitystudies of owls. There may be occasionswhen the species approach is the only way
to go, e.g., in the case of endangeredspecies [even in those cases the speciesdoes not exist in a biological vacuum butis interrelated with other species] , buta more balanced approach is that ofmanaging an ecosystem or segment of it.As we get a better picture of thedetailed habitat needs of species we arelearning that absolute minimum areadimensions for species are not the onlything required for management. We mustknow the quality of the habitat and, inmany cases the configuration of thehabitat is also crucial. This poses someinteresting challenges for appliedresearch, e. g. , will a habitat segmentwith corridors leading from it to othertracts suffice with equal satisfaction tothat of a larger intact area? Suchpoints of view and questions are going torequire manager-researcher teams for theyrequire the expertise of specialists.The list of participants of thissymposium identifies a good number of theowl experts [both professional biologistsand serious amateurs doing professionalcalibre work] and hopefully theseProceedings will carry the challenge tothose in a management position that dealwith owls within the domain of areas thatthey manage!
We do not have reason to becomplacent about our knowledge for anyspecies of owl. This conference willhowever, I think, be viewed as a landmarkin the history of owl biology for it[along with the symposium on owls held inSacramento in the fall of 1985, and thepaper session on rare owls at the WorldConference on Birds of Prey to be held inEilat, Israel on 22-27 March 1987] willgo a long way toward identifying owls asa unique group of wildlife and owlresearchers as being unique in their own"light." There has been considerablediscussion about following up thissymposium with another in two or threeyears with suggestions that it dealpotentially with any of the owl speciesand that it be held in a locale thatwould attract biologists from parts ofthe world that have been much under-represented at this symposia, e. g.
,
eastern Europe and Asia.
8
Keynote Address
Evolution, Structure, and Ecology of Northern Forest Owls 1
R. Ake Norberg 2
Abstract — In this introductory survey of northern forest owls I explore
what distinguishes them structurally, ecologically, and energetically; whatparticular ecolological conditions they are subjected to; and what selection
pressures govern their evolution. Comparisons are made betweencommunities of northern forest owls in the Old World and the New World;and between northern forest owl communities and more southern ones.
Forest owls, like most forest birds - and forest bats as well - have relatively
short and broad wings, which are adapted for flight among vegetation. Theirwing loading is low, which facilitates transportation of prey and also reducesthe wings' aerodynamic noise.
Reversed sexual size dimorphism is very pronounced in some species of
northern forest owls. But theories of this phenomenon must also explain the
same dimorphism in tropical owls and in diurnal birds of prey, and must also
be compatible with some notable exceptions from the general rule. Theseproblems have often been ignored.
Forest owls are primarily "searchers" in the sense that they spend most of
their hunting time searching for prey and little time pursuing and capturingthem. They are "perch-and-pounce" hunters, but perch height, giving-up time,
and flight length vary with sensory capacities, prey density, vegetationstructure, and weather - aspects treated by optimal foraging theory.
Particular attention is given to the evolution of asymmetry of the external
ears in some owls. Habitat choice, vegetation structure, and hunting techniquedictate to what extent vision and hearing can be used for detection andlocalization of prey. Hearing is particularly useful in dense forest and for
detection and localization of prey moving in dense ground vegetation or undersnow. When an owl depends heavily on hearing for prey finding, demands onaccurate vertical localization cause selection Tor vertical asymmetry of theexternal ears. But ear asymmetry results in conflicting auditory information at
the two ears. This may require a "training period", with extensive head tiltings,
in young owls before they can fully benefit from the ear asymmetry.Interactions between owl populations and populations of small mammals
are considered both in the ecological and evolutionary time scale. Owlsspecialized on small rodents tend to destabilize rodent population cycles, whilegeneralized owls have a stabilizing effect, suppressing prey fluctuations. Bothtypes of owls tend to synchronize population fluctuations of small rodents andotner prey animals, both locally and over larger geographic areas. Rodent cycles
give rise to different behavioral strategies in owls depending on their habitatchoice, dietary specialization, hunting mode, sensory capabilities, and nestinghabit.
1. INTRODUCTION
This symposium on the biology of northernforest owls was restricted from the outset to include
only forest owls occurring partly or entirely north of
latitude 35° North. As a brief remembrancer of
APaper presented at the symposium, Biology and
Conservation of Northern Forest Owls, Feb. 3-7, 1987,
Winnipeg, Manitoba. USDA Forest Service General Tech-
nical Report RM-142.
^R. Ake Norberg, Department of Zoology, Univer-sity of Goteborg, Box 250 59, S-400 31 Goteborg, Sweden.
geography, 35°N is 11.5° N of the Tropic of Cancer
which is at 23.5° N. The 35° N latitude crosses USAthrough southern California, central Arkansas, andthe southern part of North Carolina. In the OldWorld it passes through the northernmost corner of
Africa, through the Mediterranian Sea, just south of
the Caspian Sea, through northern Tibet, and across
central Japan. Any species occurring wholly belowthis 35° N latitude has not been considered a
"northern forest owl".
By this criterion 22 owl species will be included
(table 1). But apart from a brief mention below in a
survey of owl distribution, some of these species are
not treated further in any of the symposiumcontributions.
9
CONTENTS
1. INTRODUCTION2. DISTRIBUTION OF NORTHERN FOREST OWLS
2.1. A survey
2.2. Conclusion and discussion
3. COLOUR MORPHISM4. GEOGRAPHIC VARIATION IN COLOUR5. GENERAL SHAPE AND FORM OF FORESTOWLS
5.1. Body form5.2. Head size and shape
5.3. Ear tufts
6. WING SIZE AND SHAPE7. SILENT FLIGHT - DAMPING OFAERODYNAMIC NOISE
8. REVERSED SEXUAL SIZE DIMORPHISM8.1. Introduction
8.2. Ecological theory
8.3. Sexual selection theory
9. HUNTING MODE10. EYES AND VISION11. THE FUNCTION OF EAR ASYMMETRY IN
OWLS - "ONE OF THOSE ENIGMAS INZOOLOGY NOT TO BE SOLVED THROUGH THERESEARCHES OF MAN"
11.1. History
11.2. Theories
11.2.1. Stresemann (1934)
11.2.2. Pumphrey (1948)
11.2.3. Payne (1962)
11.2.4. Norberg (1968); 'The
Pumphrey-Norberg theory"
11.3. Head and ear size
11.4. Sound localization with
symmetrical ears
11.5. Head tilting in young owls with
asymmetrical ears
12. EVOLUTION OF EAR ASYMMETRY12.1. The origin of ear asymmetry12.2. Convergent evolution of ear
asymmetry13. OWLS AND PREY CYCLES14. ADAPTATIONS AMONG NORTHERN FOREST
OWLS15. THE GREAT GREY OWL16. EPILOGUE17. LITERATURE CITED
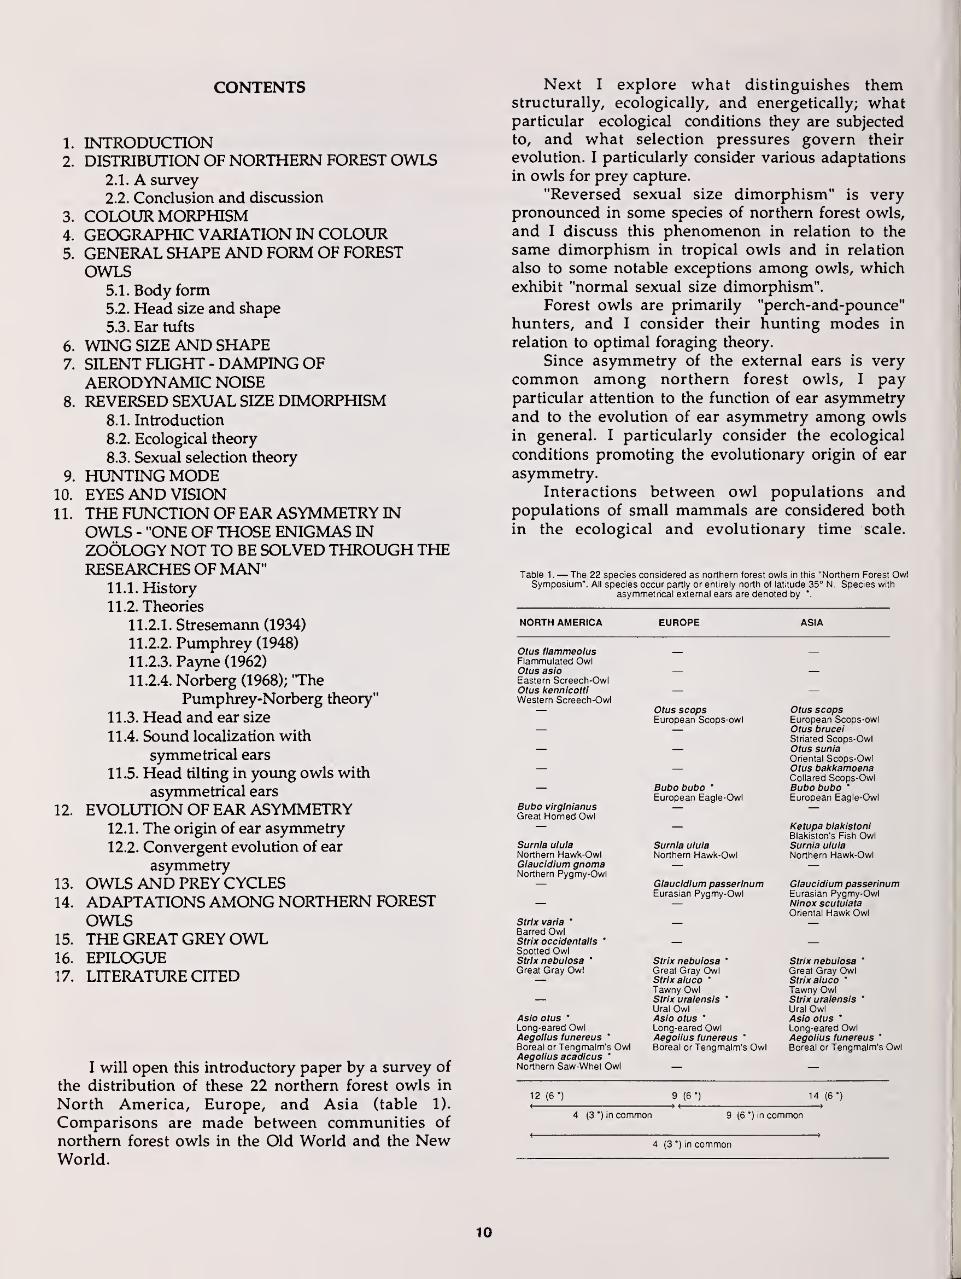
I will open this introductory paper by a survey of
the distribution of these 22 northern forest owls in
North America, Europe, and Asia (table 1).
Comparisons are made between communities of
northern forest owls in the Old World and the NewWorld.
Next I explore what distinguishes themstructurally, ecologically, and energetically; whatparticular ecological conditions they are subjected
to, and what selection pressures govern their
evolution. I particularly consider various adaptations
in owls for prey capture.
"Reversed sexual size dimorphism" is verypronounced in some species of northern forest owls,
and I discuss this phenomenon in relation to the
same dimorphism in tropical owls and in relation
also to some notable exceptions among owls, whichexhibit "normal sexual size dimorphism".
Forest owls are primarily "perch-and-pounce"
hunters, and I consider their hunting modes in
relation to optimal foraging theory.
Since asymmetry of the external ears is very
common among northern forest owls, I payparticular attention to the function of ear asymmetryand to the evolution of ear asymmetry among owlsin general. I particularly consider the ecological
conditions promoting the evolutionary origin of ear
asymmetry.Interactions between owl populations and
populations of small mammals are considered both
in the ecological and evolutionary time scale.
Table 1 .— The 22 species considered as northern forest owls in this "Northern Forest OwlSymposium". All species occur partly or entirely north of latitude 35° N. Species with
asymmetrical external ears are denoted by *.
NORTH AMERICA EUROPE ASIA
Otus flammeolusFlammulated OwlOtus asioEastern Screech-OwlOtus kennicottiWestern Screech-Owl
Bubo virginianusGreat Horned Owl
Surnla ululaNorthern Hawk-OwlGlaucldium gnomaNorthern Pygmy-Owl
Strixvaria*
Barred OwlStrlx occidentalisSpotted OwlStrix nebulosa *
Great Gray Owl
Asio otus'
Long-eared OwlAegolius lunereus '
Boreal or Tengmalm's OwlAegolius acadicus
'
Northern Saw-Whet Owl
Otus scopsEuropean Scops-owl
Bubo bubo '
European Eagle-Owl
Surnia ululaNorthern Hawk-Owl
Glaucidium passerinumEurasian Pygmy-Owl
Strix nebulosa '
Great Gray OwlStrlx aluco '
Tawny OwlStrix uralensls
'
Ural OwlAsio otus
*
Long-eared OwlAegolius lunereus
*
Boreal or Tengmalm's Owl
Otus scopsEuropean Scops-owlOtus bruceiStriated Scops-OwlOtus suniaOriental Scops-OwlOtus bakkamoenaCollared Scops-OwlBubo bubo '
European Eagle-Owl
Ketupa blakistoniBlakiston's Fish OwlSurnia ululaNorthern Hawk-Owl
Glaucidium passerinumEurasian Pygmy-OwlNinox scutulataOriental Hawk Owl
Strix nebulosa'
Great Gray OwlStrix aluco
'
Tawny OwlStrix uralensis
'
Ural OwlAsio otus
*
Long-eared OwlAegolius lunereus
'
Boreal or Tengmalm's Owl
12 (6*)
4 (3 *) in common
9 (6*)-» <
14 (6-)
9 (6 *) in common
4 (3 *) in common
10
Particular attention is given to rodent cycles and to
the stabilizing and destabilizing influence of
predation by generalized and specialized predators,
respectively. Moreover, I consider the tendency that
owl predation may have to synchronize population
fluctuations among small rodents and other prey
animals.
Throughout this introductory paper I will give
some historical background to the various topics
considered, and in particular to the historical
development of new ideas and concepts.
2. DISTRIBUTION OF NORTHERN FOREST OWLS
2.1. A survey
The distribution of the 22 northern forest owls
in North America, Europe, and Asia is summarizedin table 1. It is based on Peters (1940) and Burton
(1973). The "Working Bibliography of Owls of the
World" by Clark, Smith, and Kelso (1978) also
contains information on systematics anddistribution. And this book is indispensable for all
work on owl biology.
I will now survey the different species and makea brief comparison between communities of
northern forest owls in the Old World and the NewWorld.
There are three Otus species in North America,
only one in Europe, and four in Asia. Theflammulated scops owl O. flammeolus ranges
through western North America down to Central
America. It is closely related to the European andoriental scops owls, O. scops and O. sunia (all three of
which are sometimes regarded as conspecifics;
Hekstra 1973, p. 108). In North America, the eastern
screech owl. O. asio, lives to the east of the RockyMountains, and the western screech owl, O.
kennicotti, to the west of the Rockies. They are very
closely related, interbreed locally (for instance in the
Big Bend region of Texas, Marshall 1967, p. 3; Hekstra
1973, p. 101), and are sometimes considered to be
conspecific. They are then referred to as Otus asio, the
common screech owl, with the western population
as a subspecies, O. asio kennicottii (Peterson 1961).
Among the four Old World Otus species
considered here, O. scops, O. brucei, and O. sunia are
all closely related, and are sometimes considered to
be conspecific - and closely related to them is also the
North American O. flammeolus, as mentionedabove (Hekstra 1973, pp. 106, 108). The Old Worldcollared scops-owl, O. bakkamoena, occurs in
southeastern Asia up to about latitude 54° N. In a
recent study of the territorial calls and of the wing of
Ofws owls in Pakistan, including O. scops, O. brucei,
O. sunia, and O. bakkamoena, it was concluded that
all four are indeed good species (Roberts and King1986). The Otus owls thus constitute several species
groups whose systematics is difficult, and there hasbeen consderable confusion concerning thetaxonomic relationships of these owls. Geographicvariation is extreme among screech-owls, and their
coloration is complicated and has resulted fromparallel and convergent evolution. Systematictreatments are given by Marshall (1967; 1978) and byHekstra (1973).
Insects form the main diet of the Otus owls, andas a result most populations occurring north of the
palm-limit are migratory. Exceptional in this respect
is the common screech owl, O. asio, which is
essentially resident throughout winter even in
Canada, and then switches to non-insect prey like
small mammals and birds. By contrast, the commonscops owl, O. scops, in Siberia migrates about 7000 kmsouth-east to Ethiopia (Hekstra 1973, p. 106), andmid-palearctic populations from 45-90° E, for
instance from Mongolia, winter in Africa, south of
Sahara (Moreau 1972, pp. 13, 194).
The Eurasian Eagle Owl Bubo bubo is a hugeowl, the largest of all owls in the world. The weightof European owls is 2.2 - 4.0 kg for females (average
3.056) and 1.6 - 3.0 kg for males (average 2.275;
Mikkola 1983). From these average weights of the
two sexes, the overall average becomes 2.666 kg. This
is twice as much as the mass of its Americancounterpart Bubo virginianus, which weighs only
1.309 kg (Mueller 1986, p.392).
Bubo virginianus relies heavily on the
snow-shoe hare (=varying hare), Lepus americanus,
for food. With its weight of 1.5 kg the snow-shoehare is only about half as big as the European hares
Lepus timidus , ca. 3 kg, and Lepus europaeus, ca. 4
kg. Likewise, the Canadian lynx, Lynx canadensis,
and the smaller bobcat, Lynx rufus, which are other
North American hare predators, weigh only about
half as much as the European lynx, Lynx lynx. This
suggests that the difference in size of the hares
between North America and Europe has had someeffect on the difference in size between the NorthAmerican and the European Bubo owls and the lynx.
But with Bubo virginianus the underlying causes
must be more complex since it has a widedistribution throughout most of North and SouthAmerica; therefore, insofar as size of the main prey
selects for predator size, other prey than the
snow-shoe hare must have affected the size of Bubovirginianus over a large proportion of its range.
Blakiston's Fish Owl, Ketupa blakistoni, is
resident throughout the year in the boreal forest in
eastern Asia. Its range extends up to latitude 60° N.There it occurs at streams and rivers that are so
fast-flowing that they remain partially unfrozenthroughout the winter. Ketupa blakistoni is the only
fish owl with fully feathered legs, a feature
undoubtedly associated with its northerndistribution (Fogden, 1973, p. 68).
Leaving northern forest owl aside for a moment,
11
I will comment briefly on the world distribution of
fishing owls. There are four species of Ketupa in
Asia. They all have ear tufts and resemble Bubo owls.
And in Africa there are three species of fish-owls of
the genus Scotopelia. They lack ear tufts, and except
for their specializations in common with Ketupa for
eating fish, they are quite different in general
appearence from the Ketupa owls. Nonetheless, owls
from the two genera are believed to have their
fish-catching specializations from a commonancestor rather than as a result of convergent
evolution (Fogden 1973).
It is strange that there are no fish owls in the
New World. There are a few species of fish-eating
bats in tropical America, and it has been suggested
that the presence of fish-eating bats has prevented
fish owls from invading the New World or evolving
there (Fogden 1973, p. 61). Let us examine this
possibility in some detail.
So far, there are only five fish-eating bats knownin the world (U. M. Norberg and Rayner 1987, whogive further references). Australia has one, Myotis
adversus, with mass 10.3 g. The European Myotis
daubentoni, with mass 7.0 g, is mainly insectivorous,
but has been reported to feed also on fish. Theremaining three fish-eating bats have obvious
adaptations in the wing and hind foot for
fish-catching (U. M. Norberg and Rayner 1987).
Among these, Pizonyx vivesi, mass 25 g, has a
limited range on the southwestern part of the North
American continent - in Baja California and Sonora,
Mexico (Walker 1964). Noctilio leporinus, mass 59 g,
ranges from Mexico southward to northern
Argentina and Brazil, and Noctilio labialis ( = N.
albiventris) mass 30 g, occurs from Central America
southward to Argentina. All five belong to the
suborder Microchiroptera but are of mixedphylogenetic origins within it, with the genera
Myotis and Pizonyx belonging to the family
Vespertilionidae, and Noctilio to family
Noctilionidae. Convergent evolution in behaviour
and structure to fish-eating has obviously occurred
among the fish-eating bats.
Even though the two South Americanfish-eating bats are larger than all the others, they are
still very small by fish-owl standards and so take
small fish, probably not heavier than about 50% of
the mass of the bat, i.e. 30 g at most. It therefore
seems obvious that the fish-eating bats cannot have
constituted any competitive hindrance to anevolutionary origin of fish owls in the New World.
The absence of fish owls from the New World thus
seems to be one of those evolutionary results due to
chance only; fish owls just have not happened to
evolve in the New World, for no particular reason.
An analogy among bats is the absence of blood-eating
bats everywhere except from tropical America, wherethere are three species, each in a monotypic genus,
Desmodus rotundus, Diaemus youngi, and Diphylla
ecaudata (Walker 1964).
The northern hawk owl, Surnia ulula, is
circumboreal. It occurs along a broad zone of the
northern coniferous forest, just beneath the edge of
the arctic tundra, and ranges around the whole of the
northern hemisphere. It hunts predominantly by eyeand therefore depends on forests where the trees are
widely spaced. This may be one reason for its
northern distribution and for its choice of regions at
high elevations above the sea level; forests on such
ground are open and the coniferous trees are usually
widely spaced and have typically narrow crowns,
permitting good view of the forest floor.
The American pygmy-owl, Glaucidium gnoma,is very similar to the Eurasian pygmy-owl, G.
passerinum, and is sometimes even considered
conspecific with it (Ginn 1973, p. 178). G. gnoma has
an elongated distributional range in the north-south
direction, and occurs in western America, fromsouthernmost Alaska southward to Guatemala in
Central America. G. passerinum also occurs along an
elongated distributional band but with an east-west
orientation and a width of 600 to 1000 km.
Strix varia and S. occidentalis are two exclusively
New World Strix species, which are confined to
North America except for S. varia, whose range
extends southward into Central America. They havelargely non-overlapping ranges, extended in the
north-south directon, S. varia occurring to the east,
and S. occidentalis to the west of the RockyMountains. S. occidentalis has a strong preference for
unlogged forests of mature or old-growth conifers
more than 200 years old, forming uneven-aged,multilayered canopies with closures of 65-80%(Forsman, Meslow, and Wight 1984, p. 16).
Strix nebulosa is circumboreal occupying muchthe same range as does the hawk owl, Surnia ulula.
S. nebulosa is the largest of all Strix owls, and in
North America as well as in Eurasia its distribution
is north to those of the other Strix species. In NorthAmerica its distribution overlaps only the
northernmost parts of the ranges of S. varia and S.
occidentalis.
In the Old World, S. aluco and S. uralensis are
ecological equivalents to S. varia and S. occidentalis
in North America. But in Eurasia the ranges of all
three Strix owls are extended in the east-west
direction and ordered from north to south with the
largest one, S. nebulosa, furthest to the north,
followed in latitudinal range by the medium-sizedural owl, S. uralensis, and then by the smaller
tawny owl, S. aluco, furthest to the south. This is a
fairly orderly pattern even though there is
considerable overlap between the ranges of S.
nebulosa and S. uralensis, and rather less overlap
between S. uralensis and S. aluco (Svardson 1949;
Lundberg 1980).
12
The Eurasian S. uralensis and S. aluco are two
closely related but very well defined species of
markedly different sizes and with essentially
non-overlapping ranges, as described above; S.
uralensis (female mass 871 g, male mass 720g)
occupies mainly the coniferous taiga and S. aluco
(mass 583 g and 474 g; Mikkola 1983, p. 377 ) occurrs
further south in semi-open and open deciduous
woodland. But after crossing a female S. aluco with a
male S. uralensis in captivity, Scherzinger (1983)
made the remarkable discovery that fertile eggs were
produced and even gave rise to two viable young, a
female and a male. The F! hybrid progeny exhibited a
mosaic of characters from their parent species as
regards size, coloration, and vocalization, the overall
result therefore being truly intermediate. The male
and female hybrid siblings did not produce any eggs
during the two years they shared cage, but the hybrid
male later gave rise to viable F2birds in back-crosses
with both parent species, with S. aluco as well as with
S. uralensis.
The long-eared owl, Asio otus, is circumboreal
with a range extending across North America and
Eurasia in a broad belt essentially south of the range
of the hawk owl, Surnia ulula.
The boreal owl (North American name), or
Tengmalm's owl (European name), Aegolius
funereus, is circumboreal and occurs in a wide belt of
the northern coniferous forest, beginning as far
north as the hawk-owl's range, but extending muchfarther south. The range of the smaller saw-whetowl, Aegolius acadicus, is strictly limited to NorthAmerica (unless the Central American Aegolius
ridgwayi will prove eventually to be merely a
subspecies of A. acadicus). A. acadicus occurs
essentially south of the range of A. funereus, but
there is a zone of overlap along the Canadian-USAborder. Despite the more southern range of A.
acadicus, northern populations of it are moremigratory than is A. funereus. The latter performsirregular, irruptive, movements only, in NorthAmerica as well as in the Palearctic.
2.2. Conclusion and discussion
As will have been apparent, the northern forest
owl faunas in North America, Europe, and Asia are
remarkably similar in their overall composition(table 1).
Four species are circumboreal and occur in all
three regions, viz. Surnia ulula, Strix nebulosa, Asio
otus, and Aegolius funereus.
There are three Otus owls in North America,one in Europe, and four in Asia, and none of these
occurs both in North America and Eurasia.
Bubo and Glaucidium both have a different
representative in North America and in Eurasia, andthere is a remarkable size difference between the twoBubo species.
The fish-owl Ketupa blakistoni occurs only in
Asia, and the total absence of fish-owls from the NewWorld has no obvious ecological explanation, but is
probably the result of chance only; simply that nofish owls did ever evolve in the New World. Onepossibility in terms of ecological explanation could beif Bubo virginianus, which is a generalized owl witha very wide diet, does take fish to the extent that it
fills the prospective niche of any fish owl.
Strix nebulosa is shared between all three
regions, while there is a different set of twoadditional, Strix species in North America andEurasia, S. varia and S. occidentalis versus S. aluco
and S. uralensis, all four of which are structurally
and ecologically similar.
Finally, Aegolius funereus occurs in all three
regions, whereas A. acadicus is unique to NorthAmerica. The reason why North America has twoAegolius species, and Eurasia only one, may be that
Aegolius probably evolved in the New World. Myreason for believing this is that there are four
Aegolius species in the New World as opposed to
only one in Eurasia; A. funereus and A. acadicus in
North America, A. ridgwayi in Central America, andA. harrisii in South America, but only A. funereus in
Eurasia.
The distributional patterns of Strix owls in
Eurasia and Aegolius owls in North America thus
are in accordance with Bergmann's ecogeographic
rule, the tendency for body size in homeotherms to
be negatively correlated with environmentaltemperatures, i. e. for body size to be larger wheretemperature is lower. This trend may be expected for
the distribution of populations of differently sized
animals of the same specis (fig. 1), or for the
distribution of differently sized species that are
closely related and ecologically similar (as with the
Strix and Aegolius species).
Among the 124 (or so) species of owls in the
world, 42 species - or 34% - have asymmetrical
external ears. Among the 22 northern forest owlsrecognized here, nine - or 41% - have asymmetricalexternal ears. They are marked with an asterisk in
table 1. Among the 22 northern forest owls the
proportion of species with asymmetrical ears in the
three geographic regions is 50% for North America,
67% for Europe, and 43% for Asia. The percentage
(41%) for all northern forest owls taken together is
lower than the percentage for the owls of any of the
three geographic regions taken separately. The reason
is that owls with asymmetrical ears tend to occur in
two or three of the geographic regions more often
than do species with symmetrical ears. These large
geographical ranges of species with ear asymmetrymay reflect greater ecological success than for those
with symmetrical ears.
The figures 50%, 67%, and 43% for the northern,
regional, proportions of the number of owls with ear
asymmetry are to be compared with 34% worldwide.
13
0 30 60 90 120 150 ISO tO
O, <D>, ©, ©, • = Increasing darkness of plumage.
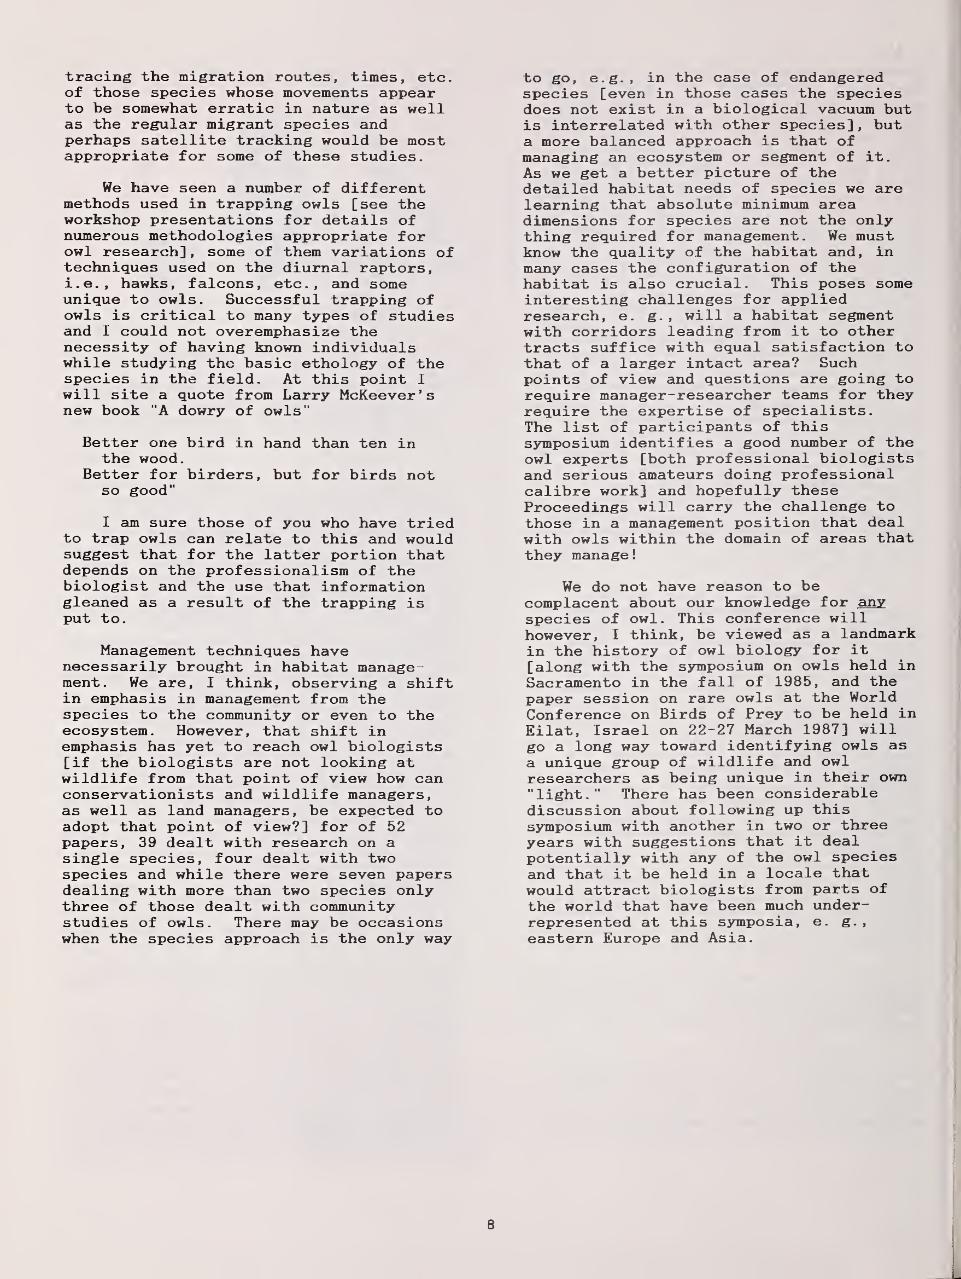
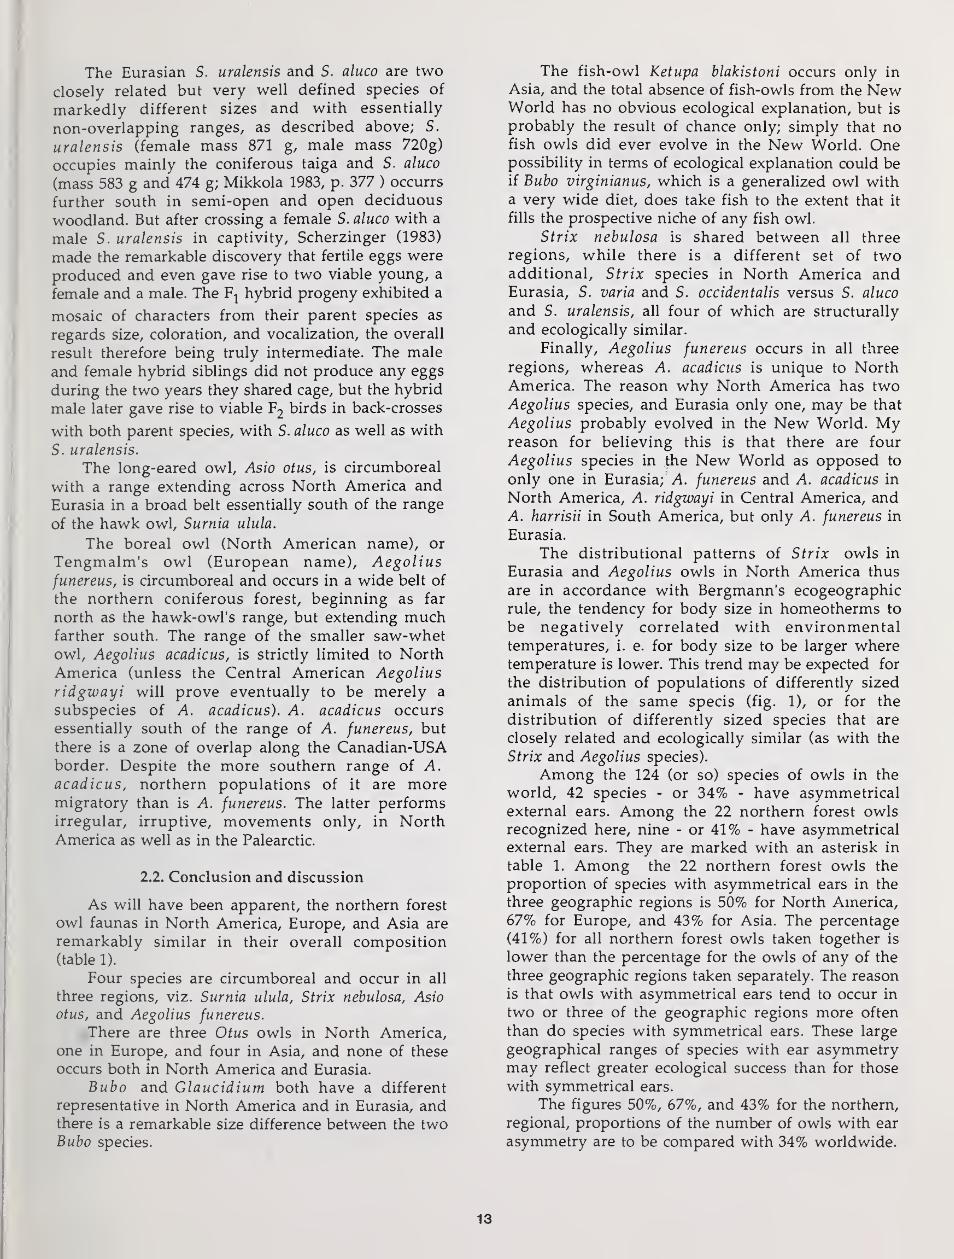
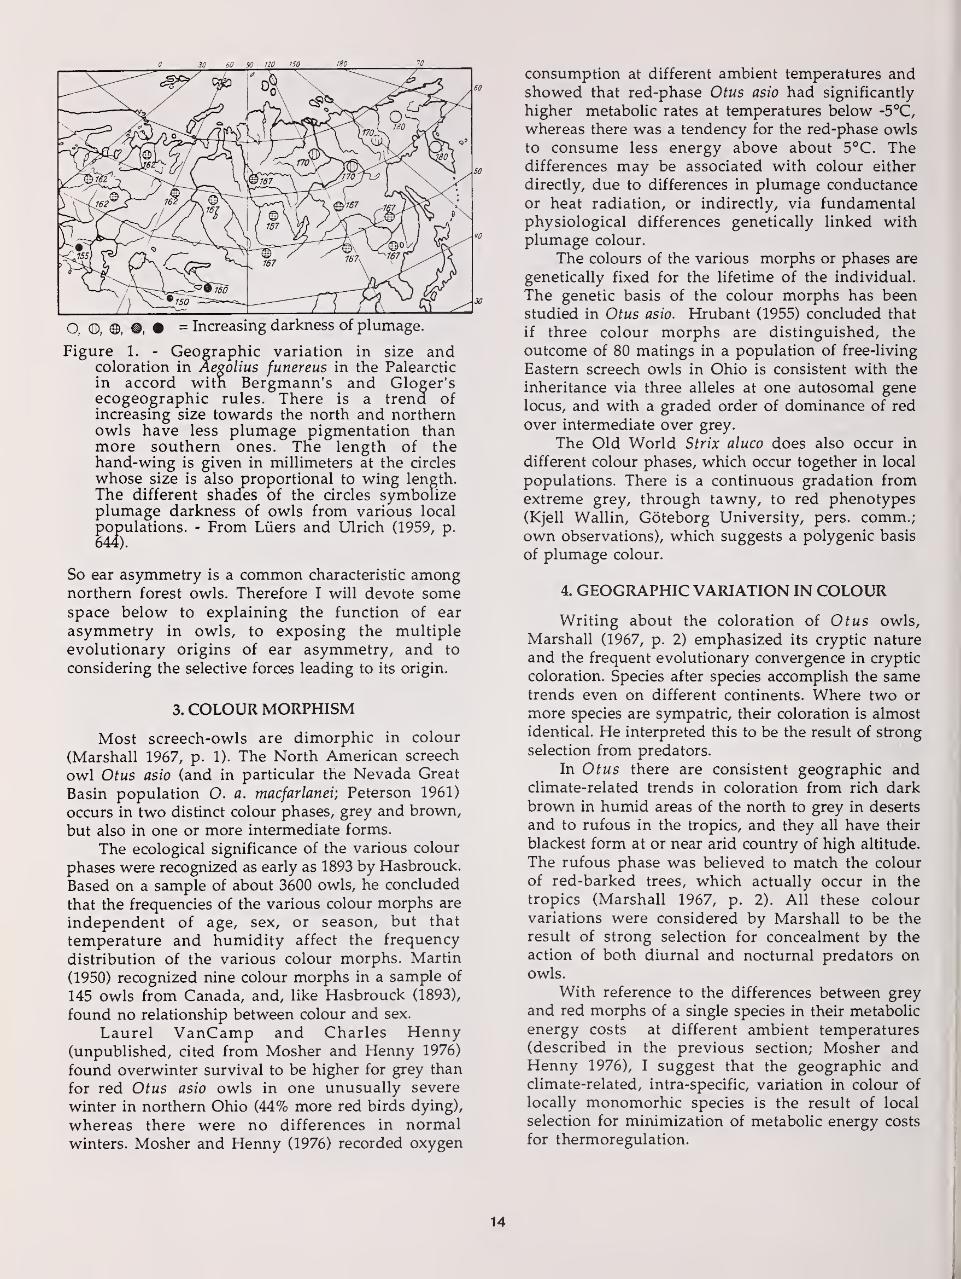
Figure 1. - Geographic variation in size andcoloration in Aegolius funereus in the Palearcticin accord witn Bergmann's and Gloeer'secogeographic rules. There is a trend ofincreasing size towards the north and northernowls have less plumage pigmentation thanmore southern ones. The length of thehand-wing is given in millimeters at the circles
whose size is also proportional to wing length.
The different shades of the circles symbolizeplumage darkness of owls from various local
populations. - From Liiers and Ulrich (1959, p.
So ear asymmetry is a common characteristic amongnorthern forest owls. Therefore I will devote somespace below to explaining the function of ear
asymmetry in owls, to exposing the multiple
evolutionary origins of ear asymmetry, and to
considering the selective forces leading to its origin.
3. COLOUR MORPHISM
Most screech-owls are dimorphic in colour
(Marshall 1967, p. 1). The North American screech
owl Otus asio (and in particular the Nevada Great
Basin population O. a. macfarlanei; Peterson 1961)
occurs in two distinct colour phases, grey and brown,
but also in one or more intermediate forms.
The ecological significance of the various colour
phases were recognized as early as 1893 by Hasbrouck.
Based on a sample of about 3600 owls, he concluded
that the frequencies of the various colour morphs are
independent of age, sex, or season, but that
temperature and humidity affect the frequency
distribution of the various colour morphs. Martin
(1950) recognized nine colour morphs in a sample of
145 owls from Canada, and, like Hasbrouck (1893),
found no relationship between colour and sex.
Laurel VanCamp and Charles Henny(unpublished, cited from Mosher and Henny 1976)
found overwinter survival to be higher for grey than
for red Otus asio owls in one unusually severe
winter in northern Ohio (44% more red birds dying),
whereas there were no differences in normalwinters. Mosher and Henny (1976) recorded oxygen
consumption at different ambient temperatures andshowed that red-phase Otus asio had significantly
higher metabolic rates at temperatures below -5°C,
whereas there was a tendency for the red-phase owls
to consume less energy above about 5°C. Thedifferences may be associated with colour either
directly, due to differences in plumage conductance
or heat radiation, or indirectly, via fundamentalphysiological differences genetically linked withplumage colour.
The colours of the various morphs or phases are
genetically fixed for the lifetime of the individual.
The genetic basis of the colour morphs has beenstudied in Otus asio. Hrubant (1955) concluded that
if three colour morphs are distinguished, the
outcome of 80 matings in a population of free-living
Eastern screech owls in Ohio is consistent with the
inheritance via three alleles at one autosomal genelocus, and with a graded order of dominance of red
over intermediate over grey.
The Old World Strix aluco does also occur in
different colour phases, which occur together in local
populations. There is a continuous gradation fromextreme grey, through tawny, to red phenotypes(Kjell Wallin, Goteborg University, pers. comm.;own observations), which suggests a polygenic basis
of plumage colour.
4. GEOGRAPHIC VARIATION IN COLOUR
Writing about the coloration of Otus owls,
Marshall (1967, p. 2) emphasized its cryptic nature
and the frequent evolutionary convergence in cryptic
coloration. Species after species accomplish the sametrends even on different continents. Where two or
more species are sympatric, their coloration is almost
identical. He interpreted this to be the result of strong
selection from predators.
In Otus there are consistent geographic andclimate-related trends in coloration from rich darkbrown in humid areas of the north to grey in deserts
and to rufous in the tropics, and they all have their
blackest form at or near arid country of high altitude.
The rufous phase was believed to match the colour
of red-barked trees, which actually occur in the
tropics (Marshall 1967, p. 2). All these colour
variations were considered by Marshall to be the
result of strong selection for concealment by the
action of both diurnal and nocturnal predators onowls.
With reference to the differences between grey
and red morphs of a single species in their metabolic
energy costs at different ambient temperatures(described in the previous section; Mosher andHenny 1976), I suggest that the geographic andclimate-related, intra-specific, variation in colour of
locally monomorhic species is the result of local
selection for minimization of metabolic energy costs
for thermoregulation.
14
There are thus two hypotheses to explain the
geographic and climate-related, intra-specific, colour
trends in owls; (1) it is the result of natural selection
for cryptic coloration against the prevailing local
colour of bark, twigs, and leaves (Marshall 1967, p. 2),
or (2) the result of natural selection for a colour that
reduces the metabolic energy costs of
thermoregulation under the local climate conditions.
Actually, these two hypotheses need not be mutually
exclusive.
Marshall (1967, pp. 2, 3) suggested that Otus owls
are monomorphic where the colour of the
vegetation is monotonous but that they occur in
various colour morphs where the vegetation is
varied, favouring different cryptic coloration in
different localities and at different times of the year.
Likewise, it might be argued that if the colour is
selected to minimize thermoregulatory metabolic
energy costs, monomorphism may occur whereclimatic conditions are stable whereas polymorphism
is favoured where there are large local and temporal
variations in climate.
These geographic colour variations are examples
of a fairly general phenomenon among animals,
summarized in Gloger's ecogeographical rule. This
rule is based on empirical observations within
species but on populations in different geographic
regions. Gloger's rule states that animals in warmand humid areas are more heavily pigmented than
those in cool and dry areas, and black pigments are
reduced in warm dry areas, whereas brown pigments
are reduced in cold humid areas (Mayr 1965, p. 324). I
know of no other explanation of the rule except for
(1) the crypsis and (2) the thermoregulatoryhypotheses discussed above.
In Eurasia Aegolius funereus shows a consistent
clinal trend in size and coloration in accord with
Bergmann's and Gloger's rules, respectively (fig. 1;
Liiers and Ulrich 1959, p. 644). Gloger's rule seems to
be broadly applicable also to inter-specific
comparisons of plumage colours amongnon-migratory northern forest owls; the northern
Strix nebulosa, Strix uralensis and Surnia ulula are
light and grey and with very little brown colour
while more southern owls, like Strix aluco and Asio
otus are darker and with much brown in their
plumage.
5. GENERAL SHAPE AND FORM OF FORESTOWLS
5.1. Body form
Wood owls in general, and those occurring at
high latitudes in particular, are very stocky, or
chunky, and have a very loose, fluffy, and thick
plumage (fig. 2). In this respect they differ from owls
hunting largely on the wing in open country.
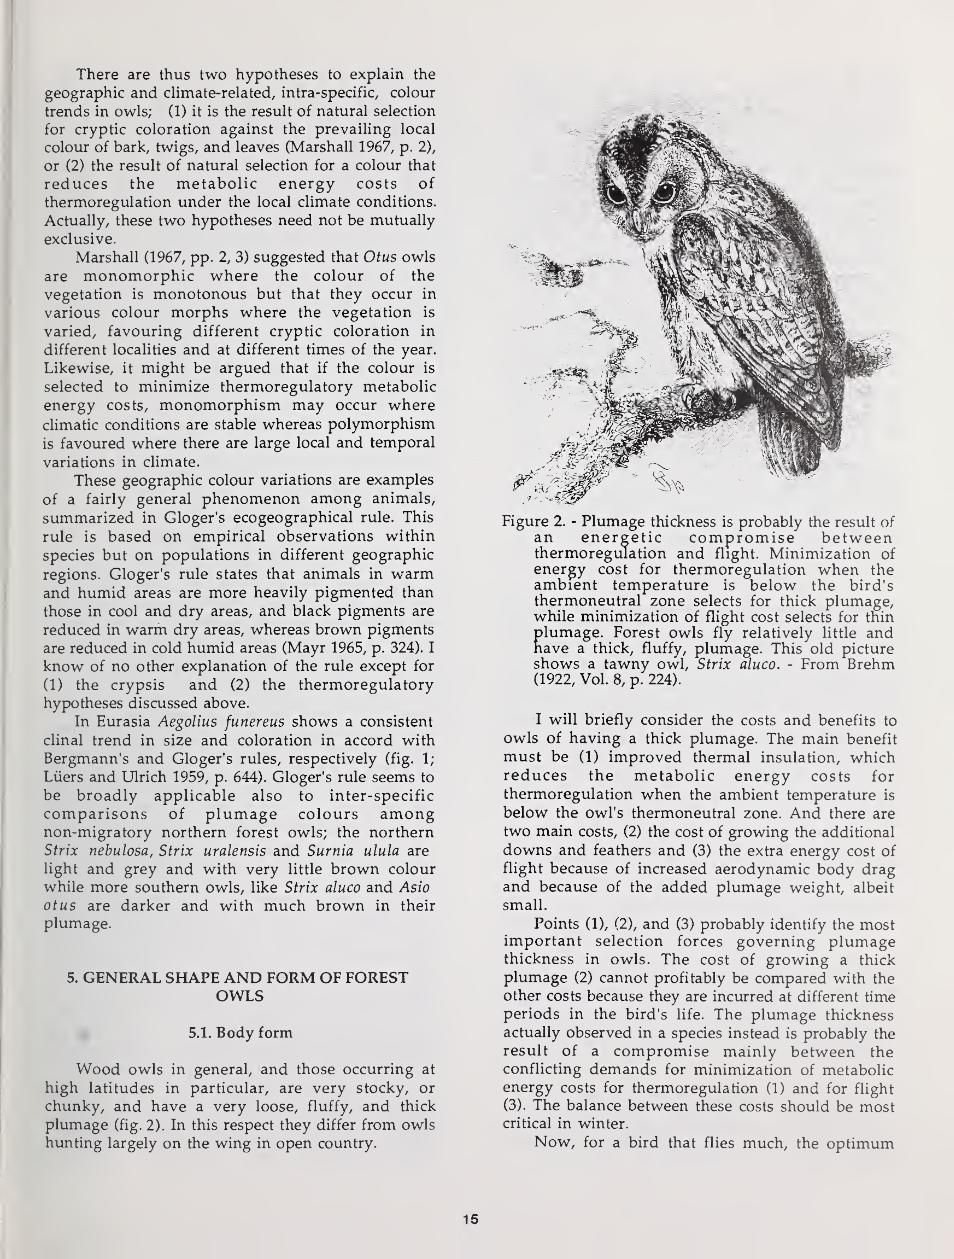
Figure 2. - Plumage thickness is probably the result ofan energetic compromise betweenthermoregulation and flight. Minimization ofenergy cost for thermoregulation when theambient temperature is below the bird'sthermoneutral zone selects for thick plumage,while minimization of flight cost selects for thinplumage. Forest owls fly relatively little andnave a thick, fluffy, plumage. This old pictureshows a tawny owl, Strix aluco. - From Brehm(1922, Vol. 8, p. 224).
I will briefly consider the costs and benefits to
owls of having a thick plumage. The main benefit
must be (1) improved thermal insulation, whichreduces the metabolic energy costs for
thermoregulation when the ambient temperature is
below the owl's thermoneutral zone. And there are
two main costs, (2) the cost of growing the additional
downs and feathers and (3) the extra energy cost of
flight because of increased aerodynamic body dragand because of the added plumage weight, albeit
small.
Points (1), (2), and (3) probably identify the mostimportant selection forces governing plumagethickness in owls. The cost of growing a thick
plumage (2) cannot profitably be compared with the
other costs because they are incurred at different time
periods in the bird's life. The plumage thickness
actually observed in a species instead is probably the
result of a compromise mainly between the
conflicting demands for minimization of metabolicenergy costs for thermoregulation (1) and for flight
(3). The balance between these costs should be mostcritical in winter.
Now, for a bird that flies much, the optimum
15
plumage thickness is less than for a bird that flies
less. But in a cold environment, the optimumplumage thickness is greater than in a warmerenvironment.
These predictions seem to be borne out by a
comparison of different owls; those that live far to
the north (cold environment) and fly little has a
thick plumage, Strix nebulosa being an extreme
example of this category, while owls that live further
to the south, or that are migratory (warmenvironment), and fly much, for hunting and /or for
migration, have a slim appearence, as for example
Asio otus and Asio flammeus.
The penalty from thick feathering comes in the
form of increased metabolic energy costs of flight. But
forest owls do not fly very much. Therefore, the
balancing selection pressures for improved thermal
insulation (i.e. thick plumage) and reduced flight
costs (i.e. slim plumage) balance at a rather thick
plumage.
It should be noted that thick plumage is an
adaptation for winter conditions. In summer it maycause difficulties for the owls getting rid of excessive
heat (e.g. Barrows 1981); then gular flutter and other
means of dissipating body heat consume extra
energy, rather than conserving it.
5.2. Head size and shape
The owls have big heads for two good reasons; to
accomodate the huge eyes, adapted for vision in poor
light, and to enable the external ears to be big and to
be placed far apart, both factors contributing to
proficiency in sound localization (see section onhearing). And since the head is large anyway in owls
(i.e. for these particular reasons), the body located aft
of it in flight may as well be stocky since it does not
add much to the aerodynamic drag, provided it does
not extend outside the frontal projection of the head.
Aerodynamic drag is determined primarily by the
projected frontal, cross-sectional, body area.
Open-country owls which fly much, like Asio
otus and Asio flammeus, have a slimmer appearence
than forest owls; and it is not only the overall bodyform that is slimmer, but they also have relatively
much smaller heads than the forest owls.
Diurnally hunting owls and open-country owls
tend to have distinct eye-brows, whereas eye-brows
are small or virtually lacking in nocturnal forest
owls. For example, contrast Surnia ulula andGlaucidium with Strix and Aegolius species! Theeye-brows obviously function as a protection against
the glaring light from the sun, sun-lit clouds, and the
open sky.
5.3. Ear tufts
Ear tufts occur in the Otus and Bubo species, in
Ketupa blakistoni and in Asio otus. They function as
camouflage at the day roost; the owls usually erect
the ear tufts when trying to avoid being detected andat the same time make themselves appear narrowerby compressing the plumage, stretching upwards into
an erect posture, and sometimes also turning its
nearest shoulder towards the intruder, thus
presenting a disrupted colour pattern, with the wingsforming a dark region contrasting with the generally
lighter breast. This is an effective way of camouflage,
and the erected ear tufts likewise have a disruptive
effect on the general appearance of the owl, making it
blend better with the surroundings. Ear tufts are
particularly common among forest owls, lending
support to the camouflage hypothesis, because it is
among branches and twigs that ear tufts are mosteffective (Perrone 1981).
But ear tufts have also been supposed to be a
kind of mimicry; when erected, the ear tufts maymake the owl face resemble that of a mammaliancarnivore, which supposedly intimidates a
prospective attacker (Mysterud and Dunker 1979).
The camouflage and the carnivore-mimicryhypotheses are not mutually exclusive but mightwell operate together.
6. WING SIZE AND SHAPE
The wing loading, which is total weight Mgdivided by wing area S, is very low in owls as
compared with other birds (M is mass and g is
acceleration due to gravity). Since wing area scales
with body mass as jn geometrically similar
birds, the wing loading Mg/S scales as M^/^.Therefore, for geometrically similar birds, wingloading becomes larger with increasing size of bird.
But the effect of size can be compensated for bycalculating a "relative wing loading", which is wingloading divided by M*' ^ or Mg/(SM^^). And whenthis is done, owls are also among the birds with the
lowest relative wing loading (Norberg and Norbergin press).
Any characteristic flight speed, such as the
minimum power speed or the maximum rangespeed (identified by their characteristic locations
along the U-shaped power versus speed curve) varies
with the square root of the wing loading, or as (Mg/S
)! / 2 (Lighthill 1977; U. M. Norberg 1985, p. 138).
Because of their low wing loading, owls can fly
slowly. This has two advantageous consequences: (1)
owls can make sharp turns, which is useful in densevegetation, and, because of the low relative speed of
the air flow over the wings, (2) there is less tendency
for aerodynamic noise to be produced, facilitating
hearing while in flight and making it more difficult
for prey animals to detect an approaching owl.
There are additional advantages of low wingloading to predators like owls; owing to the initially
low wing loading, the loading during prey transport
tends to be low also for the owl and prey combined.
16
This should enable the owl to fly slower during
transport of prey of a given weight, therefore (3)
reducing the power output during prey transport in
flight and also retaining the owl's manoeuvrability,
of particular importance in forest. For the same
reason, given a maximum, sustainable poweroutput, (4) the owl should be able to transport
heavier prey (Norberg and Norberg in press), because
with higher wing loading the flight speed wouldneed to be higher with ensuing larger demands on
power output.
Aspect ratio is an aerodynamically important
measure expressing the ratio between wingspan and
the average wing chord. It can be conveniently
estimated in animals as wingspan b squared divided
by wing area S, or b ^/S, which is wingspan divided
by mean chord length c since S = be. As comparedwith other birds, owls have wings of low aspect ratio,
i. e. short and broad wings (Norberg and Norberg, in
press). And among owls themselves, forest species
generally have much lower aspect ratios than
open-country owls. The short, broad wings of forest
owls are advantageous for flight within dense
vegetation for the obvious reason that the flying owlneeds less space among branches and twigs, but also
because such wings enhance manoeuvrability(Norberg and Norberg in press). With a short
wingspan, the wing chord needs to be long for the
wing loading to remain low, and this is a reason whyforest owls have low aspect-ratio wings.
7. SILENT FLIGHT - DAMPING OF AERODYNAMICNOISE
There are two reasons why owls benefit morefrom silent flight than would most other birds; (1) it
increases the probability for an owl to approach andpounce upon a prey with acute hearing, like small
mammals, without being detected acoustically; and(2) it improves the ability of the owl to detect andlocalize sound in flight, since flight noise wouldmask other sounds.
In an insightful paper in 1934, Graham saw anassociation between the silent flight of owls and the
following three structural features of flight feathers.
(1) The leading edge comb. - There is a
remarkably stiff, comb-like fringe on the front
margin of every feather that functions as a leading
edge. When there is a graded length of the
anteriormost primary feathers, the ones behind the
first feather are combed in the distal region that
extends beyond the first feather (fig. 5). Likewise,
where a feather is emarginated, there is a combedfringe on the new, secondary leading edge behind the
slot. This comb was believed to reduce noise by its
effect on the pressure distribution in the boundarylayer behind the leading edge.
(2) The trailing edge fringe. - Along the trailing
edge of the wing there is a very soft hair-like fringe
on the primary and secondary feathers. The barbs in
the fringe are exceedingly flexible and do not form acontinuous vane but are free to separate.
Silencing probably comes from the fringe's
smoothening effect on the air flow at the trailing
edge where the airstreams along the lower and upperwing surface mix. The stream along the ventralsurface of the wing has a higher pressure andvelocity than the stream over the wing. The fringe
may also suppress flutter, accompanied by sound, in
this region of air mixing.
(3) The downy upper surface. - The upper surface
of the primary and secondary flight feathers are
covered with a fine and soft velvet-like lining of
short hair-like structures. It reduces the noise madeby feathers sliding over one another as the wings are
extended and flexed throughout the wingbeat.
Apart from these three features of owls Graham(1934, p. 843) recognized one more, in passing,
namely:
(4) The generally low wing loading of owls,
which enables them to maintain small angles of
attack and relatively low speeds of the distal wingparts throughout the wingbeat. As a consequence,
there is less opportunity for aerodynamic noise to
arise as the air passes relatively slowly past the sharp
leading edge of the anteriormost flight feathers.
Likewise, because of the lower pressure difference
between the lower and upper wing sides, there is less
abrupt pressure equalization at the trailing edge of
the wing and at the wingtip, entailing less noise.
Fishing owls, both Ketupa and Scotopelia
(Graham 1934; Thorpe and Griffin 1962), generate
flight noise and also lack the structural characteristics
associated with silent flight. Thorpe and Griffin
(1962) showed that the flight of owls is silenced not
only in the frequency range audible to man, but also
in an ultrasonic range above 15.000 Hz, again with
the notable exception of the fishing owls Ketupa and
Scotopelia, which produce more flight noise also in
this frequency range than do other owls of similar
sizes. The ears of small mammals are sensitive to
such ultrasonic frequencies, so flight silencing in this
region is also essential to owls, even if these
frequencies are more attenuated with distance andtherefore do not carry as far as does sound of lower
frequencies.
Further descriptions of the silencing structures
of owl feathers appear in Sick (1937, pp. 316-321),
Hertel (1966), and Neuhaus, Bretting and Schweizer
(1973). Neuhaus et al. (1973) and Gruschka, Borchers
and Coble (1971) examined the frequency spectrum
and sound pressure levels of the flight noise
produced.
8. REVERSED SEXUAL SIZE DIMORPHISM
8.1. introduction
Sexual size dimorphism of the "normal" kind,
17
with males larger than females, was explained byDarwin (1871) as a result of sexual selection
favouring large males in competition over mates.
"Reversed" sexual size dimorphism refers to female
dominance in size. It occurs among two categories of
birds. Species in one of these are characterized byhaving reversed roles of the sexes in pair formation,
females competing for males. Therefore this size
dimorphism can also be explained by sexual
selection. Such species occur, for example, amongCharadridae and Scolopacidae.
The second category, which is of more concern
in this paper, includes most raptors (Falconiformes),
owls (Strigiformes) and skuas (Stercorariinae). In
addition to the reversed sexual size dimorphism, the
mates have markedly different roles during breeding
in these predatory birds. The female usually
incubates and later stays in or near the nest, guarding
the offspring until they are more than half-grown,
while the male forages for the whole family
(Andersson and Norberg 1981).
The degree of dimorphism varies strongly
among species, and there is a clear across-species
trend with dimorphism being most pronounced in
species with the largest proportion of agile prey in
their diet (Earhart and Johnson 1970; Reynolds 1972;
Snyder and Wiley 1976; Newton 1979, pp. 19-27). TheEuropean sparrowhawk, Accipiter nisus, shows a
greater weight difference between the sexes than anyraptor in the world, the female being 1.7-1.9 times as
heavy as the male (fig. 3) (Opdam 1975; Newton 1986,
p. 32). And among owls, the most pronounced size
dimorphism occurs in Aegolius funereus and Strix
nebulosa , in which the female is 1.38 - 1.57 times as
heavy as the male (Earhart and Johnson 1970, pp. 254,
255, 259; Lundberg 1986, p. 135; Korpimaki 1986, p.
327).
The explanation of reversed sexual size
dimorphism in predatory birds has been lively
debated recently, and there is disagreement about the
underlying causes. Reviews occur in, for instance,
Newton (1979, pp. 19-27; 1986, pp. 32-34, 323-326),
Andersson and Norberg (1981), Mueller and Meyer(1985), and Mueller (1986), the latter two containing
extensive tests of predictions from the mainhypotheses. Owls are treated in, for instance, Earhart
and Johnson (1970), Snyder and Wiley (1976), andMueller (1986).
The first and most important requirement on a
theory explaining the evolutionary origin of
reversed sexual size dimorphism is that it should
apply to all three groups of predatory birds with
reversed sexual size dimorphism, viz. to raptors,
owls, and skuas; and it should be applicable in all
parts of the world. It should also be able to cope with
the few, but notable, exceptions to the rule, i. e. to
species showing normal size dimorphism. Examplesof such species among owls are the burrowing owl,
Speotyto (Athene) cunicularia, and several owls of
the genus Ninox.
8.2. Ecological theory
I shall now review the basic features of aneclectic theory, with many new elements in it,
presented by Andersson and Norberg (1981). Theystrongly emphasized the need for such a theory to
provide explanations at three levels, denoted A, B,
and C below and in figure 3.
A. Why is there such a marked role partitioning
between the sexes among these birds during the
breeding season?
B. What determines the direction of the role
partitioning and size dimorphism, i. e. why does the
male alone take on the role as food-provider for the
whole family during most of the breeding season?
C. What determines the degree of size
dimorphism which varies strongly among species?
Andersson and Norberg also stressed that a theory
must explain why the factors invoked apply more to
predatory birds than to others.
The explanation presented by Andersson andNorberg (1981) is ecological, and their various
arguments are numbered 1-15 below and in figure 3
(their paper should be consulted for references to
those arguments that are from other sources). Theyemphasized conditions during breeding (Andersson
and Norberg, 1981, their legend to figure 4); since the
differences in size and behaviour are sexual, the
underlying causes are probably linked to aspects of
breeding and to prey choice during breeding (stressed
later also by Newton, 1986, p. 33).
A. (1) Owing to their structural and behavioural
adaptations for prey capture, entailing fighting
'know-how', birds of prey and skuas should be moresuccessful than similarly sized, non-predatory birds
in defending offspring. (2) When the prey are
vertebrates, which have acute senses to detect
predators, and when two predator mates hunt in the
same territory (but without co-ordinating their
search), one mate may often be searching where the
other has recently alerted potential prey. Because of
this interference they may not procure much morefood together than would one mate alone, usingsystematic search.
These arguments may explain why separation of
breeding duties may be particularly advantageousamong predatory birds, leading to its evolution in
the first place.
B. The following features may explain the
direction of role partitioning and size dimorphism, i.
e. why the female stays at the nest and becomes the
larger sex, not the male. (3) There is a risk of damageto the developing eggs inside the female duringhunts (Walter 1979); (4) the added weight during eggproduction reduces her flight performance in hunts;
(5) the female has to visit the nest for egg laying; (9)
"courtship feeding", widespread also amongnon-predatory birds, obviously speeds up energyaccumulation by the female for egg production andalso enables her to conserve energy by not hunting. -
18

/\role partitioning
1) Nest defence abilities
2) Interference between two
mates hunting alert prey
BDIRECTION OF ROLEPARTITIONING &
SIZE DIMORPHISM
SIZE
^^Risk of damage to develop-
ing eggs in female
(^Reduced flight skill due
to weight of eggs
5)Nest visits for egg laying
(yEgg production
7)lncubation
3)Nest defence
9}Aerial agility (for
courtship feeding)<Tearing apart prey for
young »
P DEGREE OF^SIZE DIMORPHISM
Aerial agility
Energy savin g
Q3)lntra-pair food compet.
@©
Weak diffuse compet.
Constraints of size on
flight performance -narrow food base in
bird specialists
Aerial agility
Energy savin g
Figure 3. - Direction and relative importance(thickness of arrows) of hypothetical selection
pressures that may be responsible for the sex role
partitioning and reversed sexual sizedimorphism among raptors, owls, and skuas.The figure shows a male and a femalesparrowhawk, Acciviter nisus, drawn to the
same scale. This Ola-World hawk is the mostsize-dimorphic raptor in the world, the femalebeing 1.7 - 1.9 times as heavy as the male. Forthis figure the weight ratio was taken to be 1.7,
and assuming that geometric similarity prevails,
this corresponds to the length ratio 1.2 shown.The explanation in this figure emphasizes three
levels. - Modified from Andersson and Norberg(1981, p. 121).
which tends to predispose the female for the
non-hunting role among birds of prey (fig. 3). These
were reasons for the direction of role separation,
while the following points, (6) - (10), may explain the
direction of size dimorphism.
(6) Egg production, (7) incubation, (8) nest
defense and (10) the dividing up of food for the
young select for large female size, roles (8) and (10)
probably most often falling on the female whichattends the nest while the male is away hunting.
And courtship feeding by the male (9) selects for
small male size, but this needs some explanation.
Andersson and Norberg (1981) made a scaling
analysis of six aspects of flight performance that mustbe crucial for hunting success. The only flight
function which improves with increased predator
19
mass is terminal diving speed, but its dependence onmass is weak. In the other five respects a small bird
does better than a larger, but geometrically similar,
one. This applies to (i) maximum linear acceleration
in flapping flight, (ii) maximum speed in horizontal
flapping flight, (iii) maximum rate of climb in flight,
(iv) maximum angular roll acceleration, and (v)
turning ability, the latter two aspects governingmanoeuvrability. Features i - v together should be of
overriding importance, in relation to the terminal
speed in dives, in determining the best predator size
for hunting. By linear programming, Andersson andNorberg (1981) illustrated how this set of five flight
aspects may constrain predator size, favouring small
over large.
(9) Courtship feeding by the male selects for
aerial agility, therefore tending towards small males.
C. The following aspects may be important for
the various degrees of dimorphism in different
species. The more agile the prey is, the closer the
predator should approach the lower size limit below
which subdueing and transporting the prey becomedifficult. The more mammals and birds the predator
takes, the stronger the selection for small size
therefore becomes, given a particular size range of
prey, constrained downwards and upwards bysmaller and larger competing predators. (11) Since
the male does most of the hunting, he is morestrongly selected for small size than the female, andmore so the more agile prey he takes. (12) A small
male also expends less energy than a larger one, in
particular among species with active hunting modes,
which are associated with high energy costs for
locomotion, as in predators on mammals and birds.
The less energy that the male expends himself the
more of the prey that he catches can be diverted to
the young, which selects for small size and small fat
reserves (R. A. Norberg 1981).
(13) Intra-pair food competition should tend to
drive the sizes of female and male apart. This applies
in particular to bird specialists (15), which havenarrow size spectra of potential prey, their food base
therefore being prone to depletion. Their prey-size
range is narrow because they can outfly and catch
only prey birds that are large relative to themselves,
whereas birds which they can outfly more easily tend
to be too large for them to subdue and transport to
the nest. Because of the narrow food base of each sex
in predators specialized on birds as prey, such
specialists thus should be subjected to particularly
strong selection to alleviate intra-pair food
competition by evolving a high degree of size
dimorphism, which widens the combined prey base
of the predator pair.
(14) Among predators on birds there should be
weak 'diffuse' competition (from competitors of
similar as well as of different kinds) because very few
but the most specialized birds of prey can catch birds.
Therefore there should be relatively little
competitive resistance against evolutionarydivergence of the food-size niches of female andmale among such birds, facilitating evolutionarydivergence in size.
Among the various flight characteristics
considered above, (i) maximum linear accelerationin flapping flight and (ii) maximum speed in
horizontal flapping flight, may be of someimportance to Glaucidium owls, which may take
birds in flight, but not so much to other owls. But the
two aspects that govern manoeuvrability, i. e. (iv)
maximum angular roll acceleration, and (v) turning
ability, should both be important for the hunting
success of most owls. And this should apply in
particular to forest owls, and most so to those
hunting in dense forest, where goodmanoeuvrability in flight among vegetation is
indispensable.
Indeed, sexual differences in manouevrability
due to differences in mass and wing size may lead to
sexual differences in diet and habitat utilization,
small males being more able to exploit dense forest
(Korpimaki 1986). Dietary differences might arise
directly, from different, size-related, hunting abilities,
or indirectly, from different, size-related, habitat
utilizations. Females of Strix nebulsoa and Aegolius
funereus take larger prey than do males (Mikkola
1983, p. 378).
Since selection for manoeuvrability should bestronger in the male than in the female, because the
male does most of the hunting, the degree of sexual
size dimorphism in the set of characters that governs
manoeuvrability should be positively correleated
with the vegetation density in the hunting habitat
(R. A. Norberg in prep.). This may help explain whyAegolius funereus and Strix nebulosa, both of whichfly much in dense forest, are the most size-dimorphic
of all owls.
There seems to be a widespread misconception
about the proportion of birds in owls' diet and their
need for manoeuvrability (e. g. Lundberg 1986, p.
136); with the exception of Glaucidium owls, whichmay take birds in flight, most other owls probably
take their avian prey on the night roost. This does
not favour manoeuvrability as much as do aerial
chases.
There is one aspect of small size among owls
that might reduce hunting efficiency, namely the
reduced distance between the ear openings; it leads to
reduced accuracy of sound localization using time
cues. Obviously there is selection to obviate this
disadvantage of small male size, because in Bubovirginianus at least, skull width is larger in the male
than in the female, whereas females are larger in all
other measurements (McGillivray 1985).
The normal size dimorphism in Speotyto
(Athene) cunicularia, with males larger than
females, actually supports the Andersson- Norbergtheory (1981, p. 112). This owl uses open habitat
20
where the male can easily detect approaching
predators whereas the female, from within the
subterranean nest burrow, can not. It seems natural,
therefore, that the male should guard and defend the
nest by aerial attacks. Moreover, Speotyto is the only
North American or Eurasian owl with colonial
breeding, and it is known to engage in group defence
against predators, which further reduces the need for
females to be the larger sex (Mueller 1986, p. 399).
This supports the nest-defence argument for role
partitioning in point A:l in figure 3. But the Ninox
owls remain an enigma for all hypotheses on
reversed sexual size dimorphism among predatory
birds (Andersson and Norberg 1981, p. 120).
Lundberg (1986) focused on northern owls only,
observed that the degree of dimorphism in mass is
inversely correlated with environmentaltemperature, and argued that because cold climate
and early breeding should select for large females
(who do the incubation), leading to strong
dimorphism, the degree of mass dimorphism is
explained by the environmental temperatures. I
agree this may help explain the degree of massdimorphism. But Lundberg (1986) ignored tropical
owls and raptors, as well as the exceptional species;
and he did not explain why role partitioning occurs
(A; fig. 3) and what determines the direction of role
partitioning and size dimorphism (B), and so his
hypothesis lacks the generality that any such theory
must exhibit.
An additional argument by Lundberg was that
because prey brought by male owls to nest-attending
females are large (as compared with those of
non-predatory birds), they tend to be delivered at
long intervals; and under harsh and fluctuating
weather conditions the intervals becomeunpredictable. Since large females take longer time to
starve than small ones, Lundberg (1986, p. 138)
thought that large female size is selected for undersuch conditions. But a large female needs more food
than a small one, and since temporarily surplus prey
are routinely stored in the nest among most owls, a
small female should survive longer on given rations
of food, delivered at unpredictable intervals (fig. 21).
Korpimaki (1986, p. 328, 329) observed that early
breeding pairs of Aegolius funereus in Finland weremore dimorphic in weight (but not in hand-winglength) than later breeders. Because of the "calendar
effect" - clutch size decreasing with later laying date -
there was a positive correlation between breeding
success and weight dimorphism within the pair.
Males showed much less seasonal weight changethan females, but females of light and short-winged
males laid eggs earlier than those with larger males.
Although a potentially interesting example of
size selection, the observed trend of later laying dates
by pairs composed of lighter females and heavier
males might just as well have a purely ecological
explanation. It is unclear whether the weight
dimorphism was due to real "size" differences, or
just reflected differences in nutritional condition,
females with the most fat reserves breeding earliest.
Early pair formation (such as when both mates are
resident throughout the winter) enables the male to
feed the female for a long time before laying,
increasing her weight but decreasing his, andenabling her to lay early. But late pair formation
gives less time for such weight dimorphism to arise
from courtship feeding and also results in late laying.
Therefore, future studies should include other "size"
measures than weight.
8.3. Sexual selection theory
It has been suggested that the reversed sexual
size dimorhsm in birds of prey may be caused byDarwinian sexual selection, similar to, but reversed
in relation to that held to be responsible for the
"normal sexual size dimorphism". The argument is
that because males invest so much in breeding bysupplying most of the food, competent males are a
scarce, valuable resource, over which females
compete, driving female size increase by intrasexual
selection (Olsen and Olsen 1984; Newton 1986, p.
326). Mating preference, females chosing small males
by their superior ability of providing food, mighthelp increase dimorphism by intersexual selection
(Cade 1982, p. 43; Safina 1984).
But I think sexual selection alone cannot explain
the origin of reversed dimorphism at any of the
three levels in figure 3; (A) why there is a role
division in the first place, (B) why the direction of
role division and size dimorphism is as observed, or
(C) why there are interspecific differences in degree of
dimorphism. A sexual selection explanation at level
C would require systematic differences betweenspecies in the variance of male competence, or in the
degree to which males invest in breeding, by food
provisioning, such that both variables increase with
increasing proportion of agile prey in the diet. Thenthe intensity of sexual selection might vary
accordingly to give various degrees of dimorphism.
But owls seem to be a remarkably uniform group in
all relative roles of the sexes in parental care
(Mueller 1986, p. 402), reducing the likelihood of this
possibility.
9. HUNTING MODE
Most forest owls hunt from a perch, using a
"sit-and-wait" - or "perch-and-pounce" - hunting
technique (figs 4 and 5). But search for prey may be
done in flight to some extent, as in the open-country
owl Asio flammeus, and short hovering bouts doalso occur occasionally among forest owls. Since
hovering flight is the most energy-demanding type
21
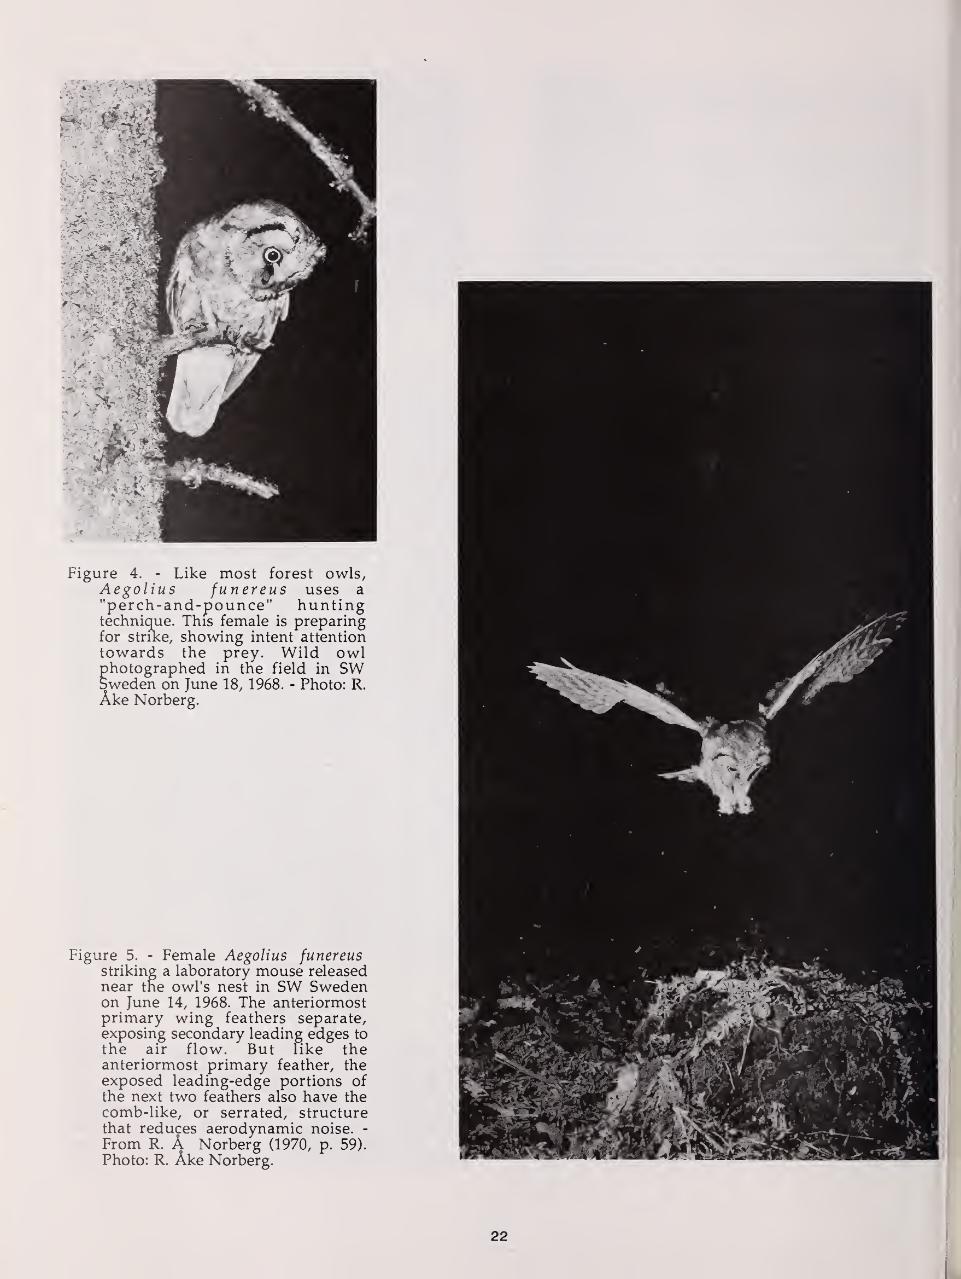
Figure 4. - Like most forest owls,Aegolius funereus uses a
"perch-and-pounce" huntingtechnique. This female is preparingfor strike, showing intent attentiontowards the prey. Wild owlphotographed in the field in SWSweden on June 18, 1968. - Photo: R.
Ake Norberg.
Figure 5. - Female Aegolius funereusstriking a laboratory mouse releasednear the owl's nest in SW Swedenon June 14, 1968. The anteriormostprimary wing feathers separate,exposing secondary leading edges to
the air flow. But like theanteriormost primary feather, theexposed leading-edge portions ofthe next two feathers also have thecomb-like, or serrated, structurethat reduces aerodynamic noise. -
From R. A Norberg (1970, p. 59).
Photo: R. Ake Norberg.
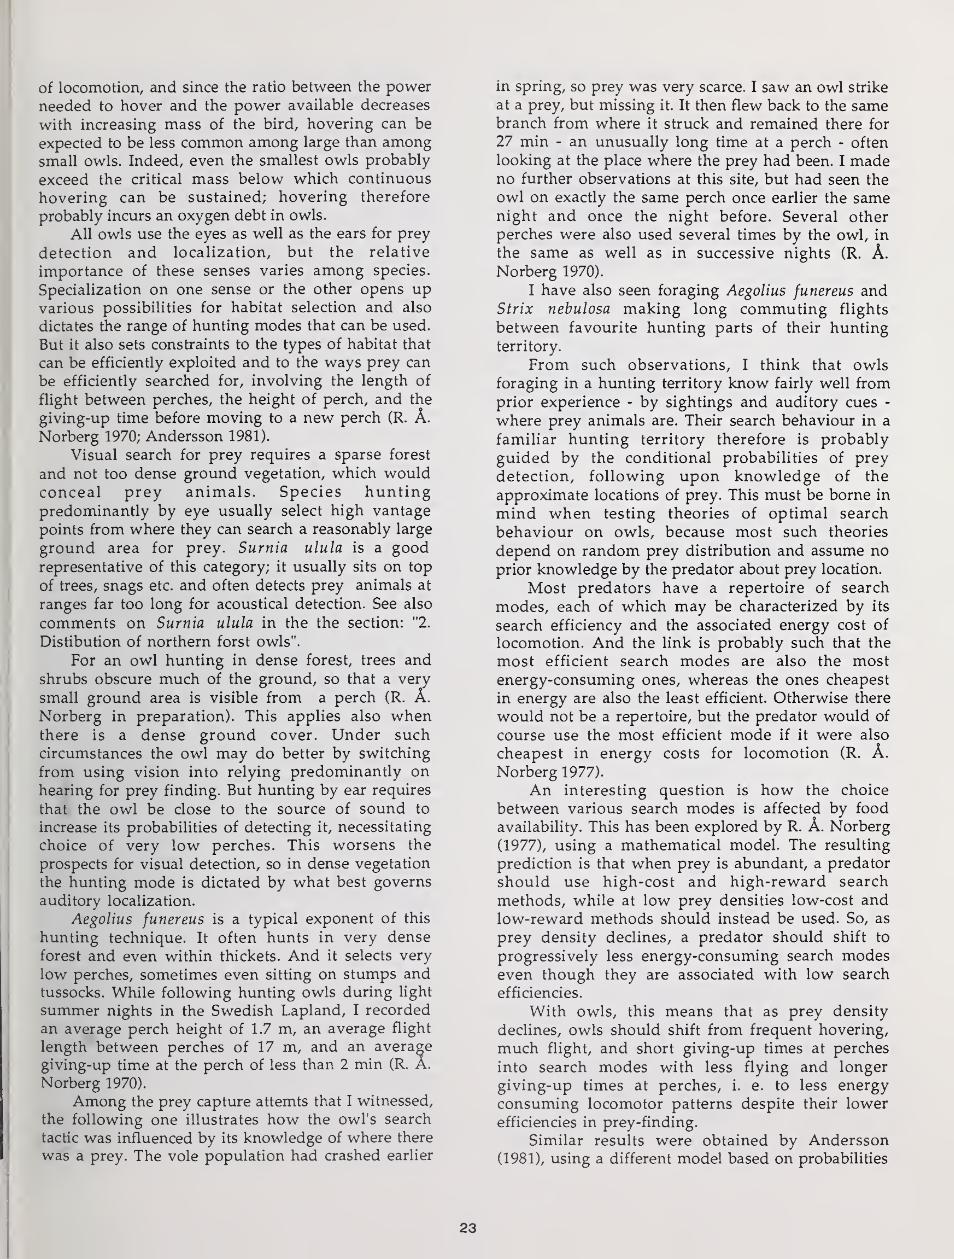
of locomotion, and since the ratio between the powerneeded to hover and the power available decreases
with increasing mass of the bird, hovering can be
expected to be less common among large than amongsmall owls. Indeed, even the smallest owls probably
exceed the critical mass below which continuous
hovering can be sustained; hovering therefore
probably incurs an oxygen debt in owls.
All owls use the eyes as well as the ears for prey
detection and localization, but the relative
importance of these senses varies among species.
Specialization on one sense or the other opens upvarious possibilities for habitat selection and also
dictates the range of hunting modes that can be used.
But it also sets constraints to the types of habitat that
can be efficiently exploited and to the ways prey can
be efficiently searched for, involving the length of
flight between perches, the height of perch, and the
giving-up time before moving to a new perch (R. A.
Norberg 1970; Andersson 1981).
Visual search for prey requires a sparse forest
and not too dense ground vegetation, which wouldconceal prey animals. Species huntingpredominantly by eye usually select high vantage
points from where they can search a reasonably large
ground area for prey. Surnia ulula is a goodrepresentative of this category; it usually sits on top
of trees, snags etc. and often detects prey animals at
ranges far too long for acoustical detection. See also
comments on Surnia ulula in the the section: "2.
Distibution of northern forst owls".
For an owl hunting in dense forest, trees andshrubs obscure much of the ground, so that a very
small ground area is visible from a perch (R. A.
Norberg in preparation). This applies also whenthere is a dense ground cover. Under suchcircumstances the owl may do better by switching
from using vision into relying predominantly onhearing for prey finding. But hunting by ear requires
that the owl be close to the source of sound to
increase its probabilities of detecting it, necessitating
choice of very low perches. This worsens the
prospects for visual detection, so in dense vegetation
the hunting mode is dictated by what best governs
auditory localization.
Aegolius funereus is a typical exponent of this
hunting technique. It often hunts in very dense
forest and even within thickets. And it selects very
low perches, sometimes even sitting on stumps andtussocks. While following hunting owls during light
summer nights in the Swedish Lapland, I recorded
an average perch height of 1.7 m, an average flight
length between perches of 17 m, and an average
giving-up time at the perch of less than 2 min (R. A.
Norberg 1970).
Among the prey capture attemts that I witnessed,
the following one illustrates how the owl's search
tactic was influenced by its knowledge of where there
was a prey. The vole population had crashed earlier
in spring, so prey was very scarce. I saw an owl strike
at a prey, but missing it. It then flew back to the samebranch from where it struck and remained there for
27 min - an unusually long time at a perch - often
looking at the place where the prey had been. I madeno further observations at this site, but had seen the
owl on exactly the same perch once earlier the samenight and once the night before. Several other
perches were also used several times by the owl, in
the same as well as in successive nights (R. A.
Norberg 1970).
I have also seen foraging Aegolius funereus andStrix nebulosa making long commuting flights
between favourite hunting parts of their hunting
territory.
From such observations, I think that owlsforaging in a hunting territory know fairly well from
prior experience - by sightings and auditory cues -
where prey animals are. Their search behaviour in a
familiar hunting territory therefore is probably
guided by the conditional probabilities of preydetection, following upon knowledge of the
approximate locations of prey. This must be borne in
mind when testing theories of optimal search
behaviour on owls, because most such theories
depend on random prey distribution and assume noprior knowledge by the predator about prey location.
Most predators have a repertoire of search
modes, each of which may be characterized by its
search efficiency and the associated energy cost of
locomotion. And the link is probably such that the
most efficient search modes are also the mostenergy-consuming ones, whereas the ones cheapest
in energy are also the least efficient. Otherwise there
would not be a repertoire, but the predator would of
course use the most efficient mode if it were also
cheapest in energy costs for locomotion (R. A.
Norberg 1977).
An interesting question is how the choice
between various search modes is affected by food
availability. This has been explored by R. A. Norberg
(1977), using a mathematical model. The resulting
prediction is that when prey is abundant, a predator
should use high-cost and high-reward search
methods, while at low prey densities low-cost andlow-reward methods should instead be used. So, as
prey density declines, a predator should shift to
progressively less energy-consuming search modeseven though they are associated with low search
efficiencies.
With owls, this means that as prey density
declines, owls should shift from frequent hovering,
much flight, and short giving-up times at perches
into search modes with less flying and longer
giving-up times at perches, i. e. to less energy
consuming locomotor patterns despite their lower
efficiencies in prey-finding.
Similar results were obtained by Andersson(1981), using a different model based on probabilities
23
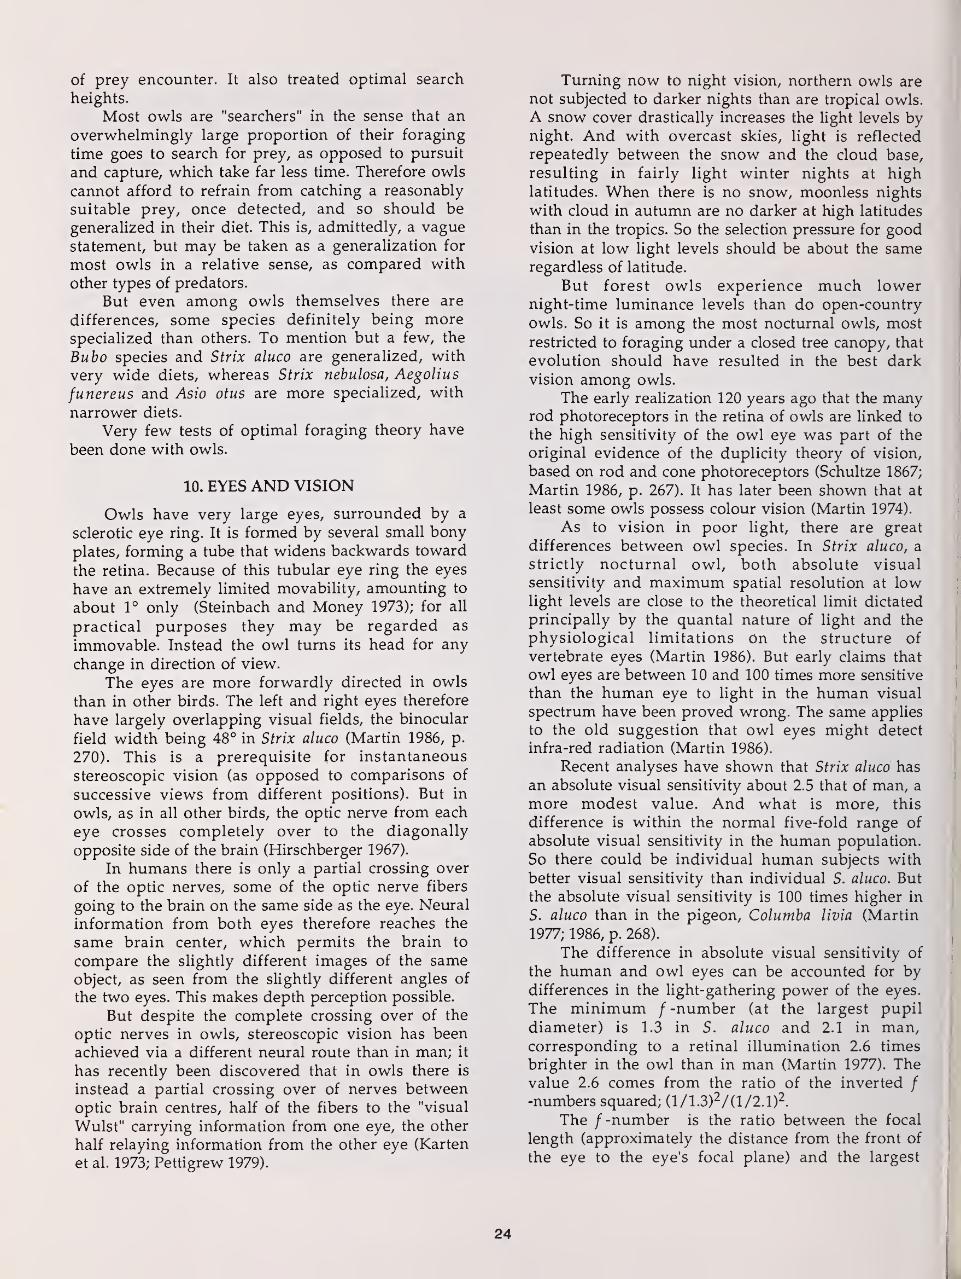
of prey encounter. It also treated optimal search
heights.
Most owls are "searchers" in the sense that anoverwhelmingly large proportion of their foraging
time goes to search for prey, as opposed to pursuit
and capture, which take far less time. Therefore owls
cannot afford to refrain from catching a reasonably
suitable prey, once detected, and so should begeneralized in their diet. This is, admittedly, a vague
statement, but may be taken as a generalization for
most owls in a relative sense, as compared with
other types of predators.
But even among owls themselves there are
differences, some species definitely being morespecialized than others. To mention but a few, the
Bubo species and Strix aluco are generalized, with
very wide diets, whereas Strix nebulosa, Aegolius
funereus and Asio otus are more specialized, with
narrower diets.
Very few tests of optimal foraging theory have
been done with owls.
10. EYES AND VISION
Owls have very large eyes, surrounded by a
sclerotic eye ring. It is formed by several small bonyplates, forming a tube that widens backwards toward
the retina. Because of this tubular eye ring the eyes
have an extremely limited movability, amounting to
about 1° only (Steinbach and Money 1973); for all
practical purposes they may be regarded as
immovable. Instead the owl turns its head for any
change in direction of view.
The eyes are more forwardly directed in owls
than in other birds. The left and right eyes therefore
have largely overlapping visual fields, the binocular
field width being 48° in Strix aluco (Martin 1986, p.
270). This is a prerequisite for instantaneous
stereoscopic vision (as opposed to comparisons of
successive views from different positions). But in
owls, as in all other birds, the optic nerve from each
eye crosses completely over to the diagonally
opposite side of the brain (Hirschberger 1967).
In humans there is only a partial crossing over
of the optic nerves, some of the optic nerve fibers
going to the brain on the same side as the eye. Neural
information from both eyes therefore reaches the
same brain center, which permits the brain to
compare the slightly different images of the sameobject, as seen from the slightly different angles of
the two eyes. This makes depth perception possible.
But despite the complete crossing over of the
optic nerves in owls, stereoscopic vision has been
achieved via a different neural route than in man; it
has recently been discovered that in owls there is
instead a partial crossing over of nerves betweenoptic brain centres, half of the fibers to the "visual
Wulst" carrying information from one eye, the other
half relaying information from the other eye (Karten
et al. 1973; Pettigrew 1979).
Turning now to night vision, northern owls are
not subjected to darker nights than are tropical owls.
A snow cover drastically increases the light levels bynight. And with overcast skies, light is reflected
repeatedly between the snow and the cloud base,
resulting in fairly light winter nights at highlatitudes. When there is no snow, moonless nights
with cloud in autumn are no darker at high latitudes
than in the tropics. So the selection pressure for goodvision at low light levels should be about the sameregardless of latitude.
But forest owls experience much lowernight-time luminance levels than do open-country
owls. So it is among the most nocturnal owls, mostrestricted to foraging under a closed tree canopy, that
evolution should have resulted in the best darkvision among owls.
The early realization 120 years ago that the manyrod photoreceptors in the retina of owls are linked to
the high sensitivity of the owl eye was part of the
original evidence of the duplicity theory of vision,
based on rod and cone photoreceptors (Schultze 1867;
Martin 1986, p. 267). It has later been shown that at
least some owls possess colour vision (Martin 1974).
As to vision in poor light, there are great
differences between owl species. In Strix aluco, a
strictly nocturnal owl, both absolute visual
sensitivity and maximum spatial resolution at lowlight levels are close to the theoretical limit dictated
principally by the quantal nature of light and the
physiological limitations on the structure of
vertebrate eyes (Martin 1986). But early claims that
owl eyes are between 10 and 100 times more sensitive
than the human eye to light in the human visual
spectrum have been proved wrong. The same applies
to the old suggestion that owl eyes might detect
infra-red radiation (Martin 1986).
Recent analyses have shown that Strix aluco has
an absolute visual sensitivity about 2.5 that of man, a
more modest value. And what is more, this
difference is within the normal five-fold range of
absolute visual sensitivity in the human population.
So there could be individual human subjects with
better visual sensitivity than individual S. aluco. But
the absolute visual sensitivity is 100 times higher in
S. aluco than in the pigeon, Columba livia (Martin
1977; 1986, p. 268).
The difference in absolute visual sensitivity of
the human and owl eyes can be accounted for bydifferences in the light-gathering power of the eyes.
The minimum / -number (at the largest pupil
diameter) is 1.3 in S. aluco and 2.1 in man,corresponding to a retinal illumination 2.6 times
brighter in the owl than in man (Martin 1977). Thevalue 2.6 comes from the ratio of the inverted /-numbers squared; (1/1.3)2/(1/2.1)2 .
The / -number is the ratio between the focal
length (approximately the distance from the front of
the eye to the eye's focal plane) and the largest
24
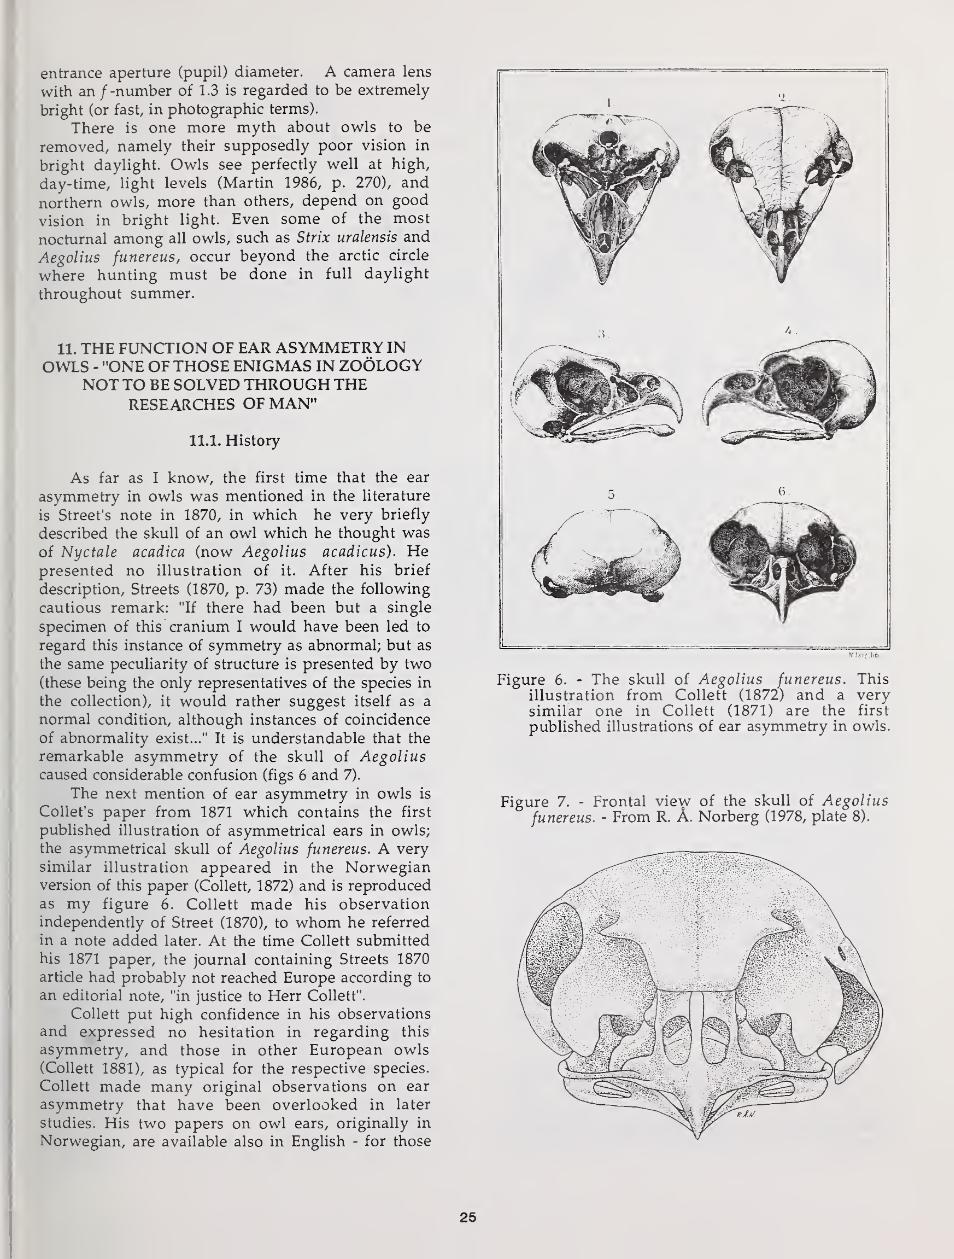
entrance aperture (pupil) diameter. A camera lens
with an /-number of 1.3 is regarded to be extremely
bright (or fast, in photographic terms).
There is one more myth about owls to be
removed, namely their supposedly poor vision in
bright daylight. Owls see perfectly well at high,
day-time, light levels (Martin 1986, p. 270), and
northern owls, more than others, depend on good
vision in bright light. Even some of the most
nocturnal among all owls, such as Strix uralensis and
Aegolius funereus, occur beyond the arctic circle
where hunting must be done in full daylight
throughout summer.
11. THE FUNCTION OF EAR ASYMMETRY INOWLS - "ONE OF THOSE ENIGMAS IN ZOOLOGY
NOT TO BE SOLVED THROUGH THERESEARCHES OF MAN"
11.1. History
As far as I know, the first time that the ear
asymmetry in owls was mentioned in the literature
is Street's note in 1870, in which he very briefly
described the skull of an owl which he thought wasof Nyctale acadica (now Aegolius acadicus). Hepresented no illustration of it. After his brief
description, Streets (1870, p. 73) made the following
cautious remark: "If there had been but a single
specimen of this cranium I would have been led to
regard this instance of symmetry as abnormal; but as
the same peculiarity of structure is presented by two(these being the only representatives of the species in
the collection), it would rather suggest itself as a
normal condition, although instances of coincidence
of abnormality exist..." It is understandable that the
remarkable asymmetry of the skull of Aegoliuscaused considerable confusion (figs 6 and 7).
The next mention of ear asymmetry in owls is
Collet's paper from 1871 which contains the first
published illustration of asymmetrical ears in owls;
the asymmetrical skull of Aegolius funereus. A very
similar illustration appeared in the Norwegianversion of this paper (Collett, 1872) and is reproducedas my figure 6. Collett made his observationindependently of Street (1870), to whom he referred
in a note added later. At the time Collett submitted
his 1871 paper, the journal containing Streets 1870
article had probably not reached Europe according to
an editorial note, "in justice to Herr Collett".
Collett put high confidence in his observations
and expressed no hesitation in regarding this
asymmetry, and those in other European owls(Collett 1881), as typical for the respective species.
Collett made many original observations on ear
asymmetry that have been overlooked in later
studies. His two papers on owl ears, originally in
Norwegian, are available also in English - for those
H l rri .lift
Figure 6. - The skull of Aegolius funereus. Thisillustration from Collett (1872) and a verysimilar one in Collett (1871) are the first
published illustrations of ear asymmetry in owls.
Figure 7. - Frontal view of the skull of Aegoliusfunereus. - From R. A. Norberg (1978, plate 8).
25
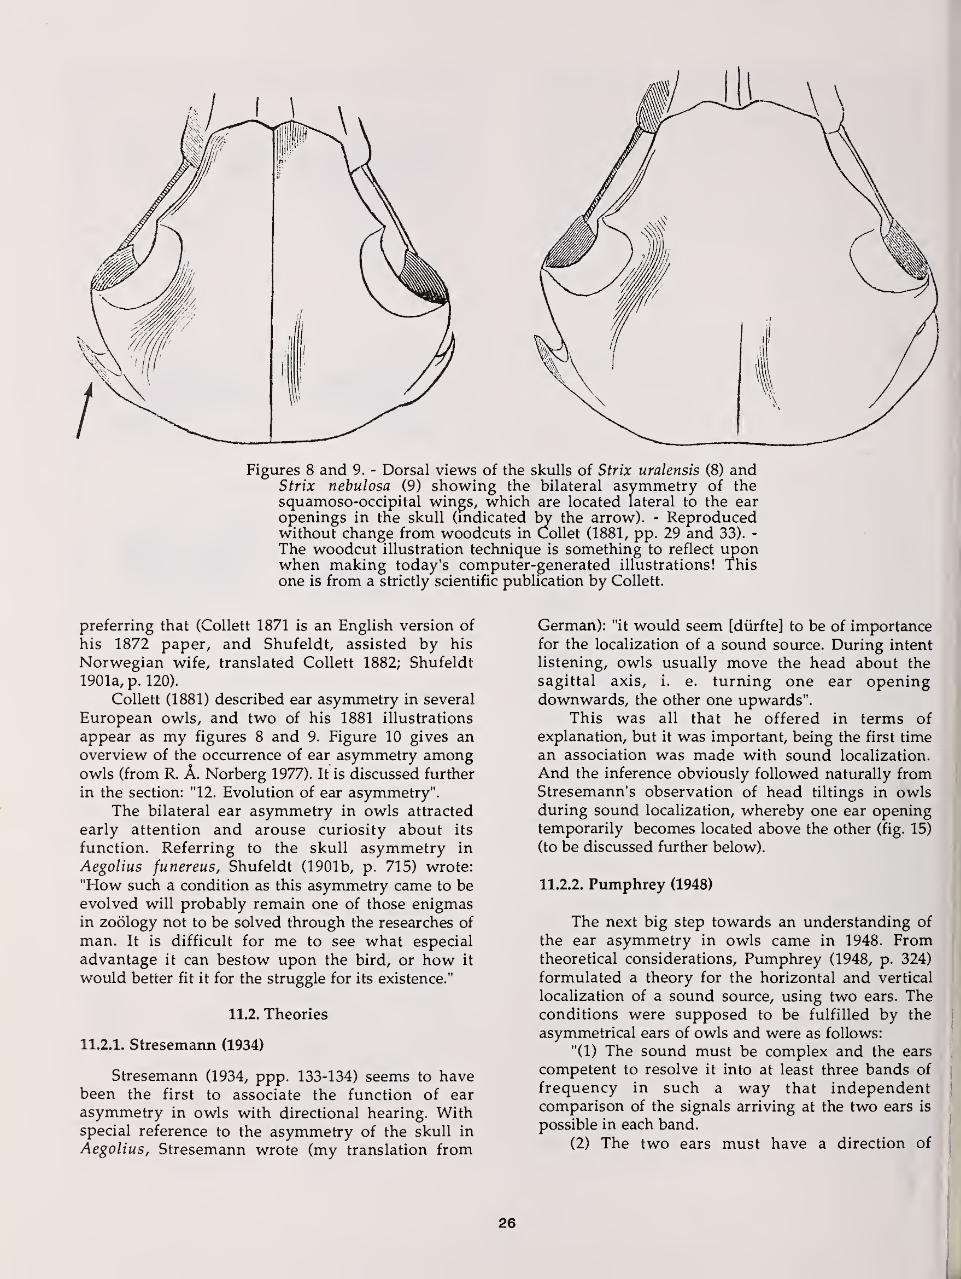
Figures 8 and 9. - Dorsal views of the skulls of Strix uralensis (8) andStrix nebulosa (9) showing the bilateral asymmetry of thesquamoso-occipital wings, which are located lateral to the earopenings in the skull (indicated by the arrow). - Reproducedwithout change from woodcuts in Collet (1881, pp. 29 and 33). -
The woodcut illustration technique is something to reflect uponwhen making today's computer-generated illustrations! Thisone is from a strictly scientific publication by Collett.
preferring that (Collett 1871 is an English version of
his 1872 paper, and Shufeldt, assisted by his
Norwegian wife, translated Collett 1882; Shufeldt
1901a, p. 120).
Collett (1881) described ear asymmetry in several
European owls, and two of his 1881 illustrations
appear as my figures 8 and 9. Figure 10 gives anoverview of the occurrence of ear asymmetry amongowls (from R. A. Norberg 1977). It is discussed further
in the section: "12. Evolution of ear asymmetry".
The bilateral ear asymmetry in owls attracted
early attention and arouse curiosity about its
function. Referring to the skull asymmetry in
Aegolius funereus, Shufeldt (1901b, p. 715) wrote:
"How such a condition as this asymmetry came to beevolved will probably remain one of those enigmasin zoology not to be solved through the researches of
man. It is difficult for me to see what especial
advantage it can bestow upon the bird, or how it
would better fit it for the struggle for its existence."
11.2. Theories
11.2.1. Stresemann (1934)
Stresemann (1934, ppp. 133-134) seems to havebeen the first to associate the function of ear
asymmetry in owls with directional hearing. Withspecial reference to the asymmetry of the skull in
Aegolius, Stresemann wrote (my translation from
German): "it would seem [diirfte] to be of importancefor the localization of a sound source. During intent
listening, owls usually move the head about the
sagittal axis, i. e. turning one ear openingdownwards, the other one upwards".
This was all that he offered in terms of
explanation, but it was important, being the first time
an association was made with sound localization.
And the inference obviously followed naturally fromStresemann's observation of head tiltings in owlsduring sound localization, whereby one ear openingtemporarily becomes located above the other (fig. 15)
(to be discussed further below).
11.2.2. Pumphrey (1948)
The next big step towards an understanding of
the ear asymmetry in owls came in 1948. Fromtheoretical considerations, Pumphrey (1948, p. 324)
formulated a theory for the horizontal and vertical
localization of a sound source, using two ears. Theconditions were supposed to be fulfilled by the
asymmetrical ears of owls and were as follows:
"(1) The sound must be complex and the ears
competent to resolve it into at least three bands of
frequency in such a way that independentcomparison of the signals arriving at the two ears is
possible in each band.
(2) The two ears must have a direction of
26

independent
evolutionary line genus
Tyto T. alba
could be several
lines of independent,
parallel, or even
convergent evolution
of ear asymmetry
common origin of
ear asymmetry
Phodilus
Bubo
Ciccaba
Strix
Rhinoptynx
•I Asio
Pseudoscops
Aegolius
strong
convergence
of ear
morphology
S. aluco
S. nebulosa
some convergence
of skull
asymmetry
strong convergence
of external ear
geometry
Figure 10. - Scheme summarizing the evolutionary history of earasymmetry among owls. At least five cases of independentorigin of ear asymmetry can be identified (left column). Theconvergence indicated for Tyto alba and Strix aluco could beextended to include more species of the genera Tyto and Strix,
the ones listed being the most obvious and best known. Butseveral Strix species lack any trend towards convergence in earstructure with Tyto alba. - From R A. Norberg (1977, p.402).
maximum sensitivity which is different for eachband and is different for the left and right ear for at
least two of these bands."
In discussing the ear asymmetry in Asio,Pumphrey (1948, p. 324) postulated a vertical
asymmetry of the ears' directional sensitivity pattern:
"...for wave lengths comparable with the slit lengthsthe direction of maximum sensitivity will be directed
above the horizontal plane for the right ear andbelow it on the left." These predicted asymmetries of
the directional sensitivity patterns at highfrequencies were first verified by R. A. Norberg in
1968. Payne (1971, p. 566) cited a personalcommunication by Pumphrey, further explainingPumphrey's theory.
Pumphrey's (1948) theory is extremelyinsightful. But it is very general, and as regards the
asymmetrical ears of owls it is somewhat vague. Thetheory given by R. A. Norberg (1968; see below) is
more precise and simpler; but it satisfies the twominimum conditions given by Pumphrey and so canbe seen as a special case of Pumphrey's fairly general
formulation.
11.2.3. Payne (1962)
Based upon recordings of sound intensities at
the eardrums of the barn owl, Tyto alba, Payne (1962,
pp. 157, 159) concluded:
"Throughout the spectrum of the frequencies
audible to the Barn Owl, one area surrounding the
line of sight will always receive sounds at maximumintensity." "... all features [of the directional
sensitivity diagrams] in the right ear occur about 10
to 15 degrees higher than their mirror imagecomplements for the left ear. This is undoubtedlylinked with the asymmetry of the ears. ... My theory,
then, puts only one demand on the owl, namely, that
it orient the head in such a way as to hear all
frequencies, audible to it in a complex sound, at
maximum intensity in both ears. When it has
achieved such an orientation, it will automatically be
facing the source of the sound..."
This theory has not been supported by later
work. But in 1971 Payne suggested a modifiedversion, which is more similar to that of R. A.
Norberg (1968; see below).
11.2.4. Norberg (1968); "The Pumphrey-Norberg theory"
As late as in 1968, 67 years after Shufeldt's
remarks in 1901 (Shufeldt 1901b, p. 715; see above:
27
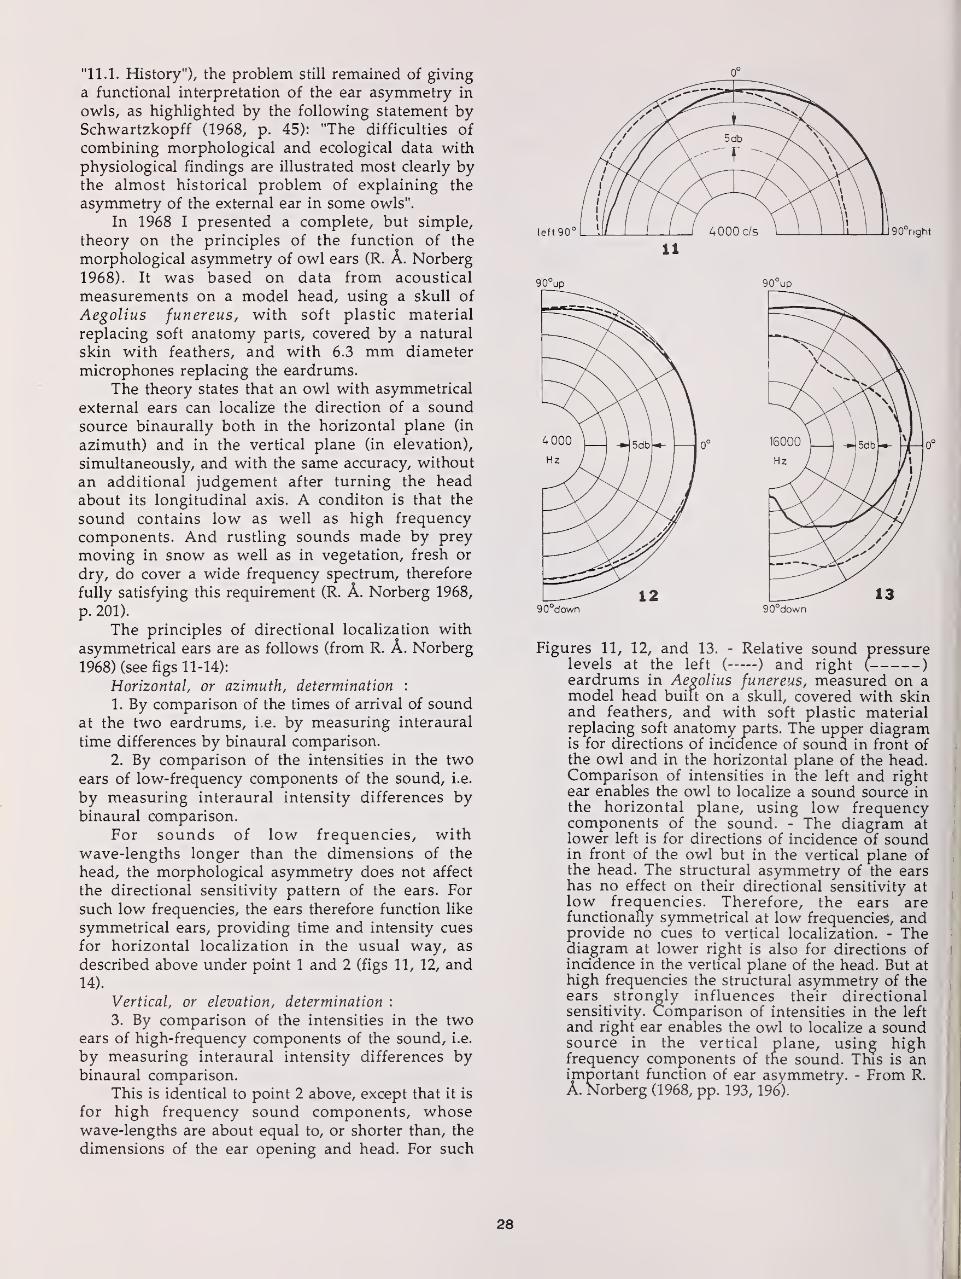
"11.1. History"), the problem still remained of giving
a functional interpretation of the ear asymmetry in
owls, as highlighted by the following statement bySchwartzkopff (1968, p. 45): "The difficulties of
combining morphological and ecological data with
physiological findings are illustrated most clearly bythe almost historical problem of explaining the
asymmetry of the external ear in some owls".
In 1968 I presented a complete, but simple,
theory on the principles of the function of the
morphological asymmetry of owl ears (R. A. Norberg
1968). It was based on data from acoustical
measurements on a model head, using a skull of
Aegolius funereus, with soft plastic material
replacing soft anatomy parts, covered by a natural
skin with feathers, and with 6.3 mm diameter
microphones replacing the eardrums.
The theory states that an owl with asymmetrical
external ears can localize the direction of a soundsource binaurally both in the horizontal plane (in
azimuth) and in the vertical plane (in elevation),
simultaneously, and with the same accuracy, without
an additional judgement after turning the headabout its longitudinal axis. A conditon is that the
sound contains low as well as high frequency
components. And rustling sounds made by prey
moving in snow as well as in vegetation, fresh or
dry, do cover a wide frequency spectrum, therefore
fully satisfying this requirement (R. A. Norberg 1968,
p. 201).
The principles of directional localization with
asymmetrical ears are as follows (from R. A. Norberg
1968) (see figs 11-14):
Horizontal, or azimuth, determination :
1. By comparison of the times of arrival of soundat the two eardrums, i.e. by measuring interaural
time differences by binaural comparison.
2. By comparison of the intensities in the twoears of low-frequency components of the sound, i.e.
by measuring interaural intensity differences bybinaural comparison.
For sounds of low frequencies, withwave-lengths longer than the dimensions of the
head, the morphological asymmetry does not affect
the directional sensitivity pattern of the ears. For
such low frequencies, the ears therefore function like
symmetrical ears, providing time and intensity cues
for horizontal localization in the usual way, as
described above under point 1 and 2 (figs 11, 12, and14).
Vertical, or elevation, determination :
3. By comparison of the intensities in the twoears of high-frequency components of the sound, i.e.
by measuring interaural intensity differences bybinaural comparison.
This is identical to point 2 above, except that it is
for high frequency sound components, whosewave-lengths are about equal to, or shorter than, the
dimensions of the ear opening and head. For such
o°
90°down 90°down
Figures 11, 12, and 13. - Relative sound pressurelevels at the left ( ) and right ( )
eardrums in Aegolius funereus, measured on amodel head built on a skull, covered with skinand feathers, and with soft plastic materialreplacing soft anatomy parts. The upper diagramis for directions of incidence of sound in front ofthe owl and in the horizontal plane of the head.Comparison of intensities in the left and rightear enables the owl to localize a sound source inthe horizontal plane, using low frequencycomponents of the sound. - The diagram atlower left is for directions of incidence of soundin front of the owl but in the vertical plane ofthe head. The structural asymmetry of the earshas no effect on their directional sensitivity at
low frequencies. Therefore, the ears arefunctionally symmetrical at low frequencies, andprovide no cues to vertical localization. - Thediagram at lower right is also for directions ofincidence in the vertical plane of the head. But at
high frequencies the structural asymmetry of theears strongly influences their directionalsensitivity. Comparison of intensities in the left
and right ear enables the owl to localize a soundsource in the vertical plane, using highfrequency components of the sound. This is animportant function of ear asymmetry. - From R.
A. Norberg (1968, pp. 193, 196).
28
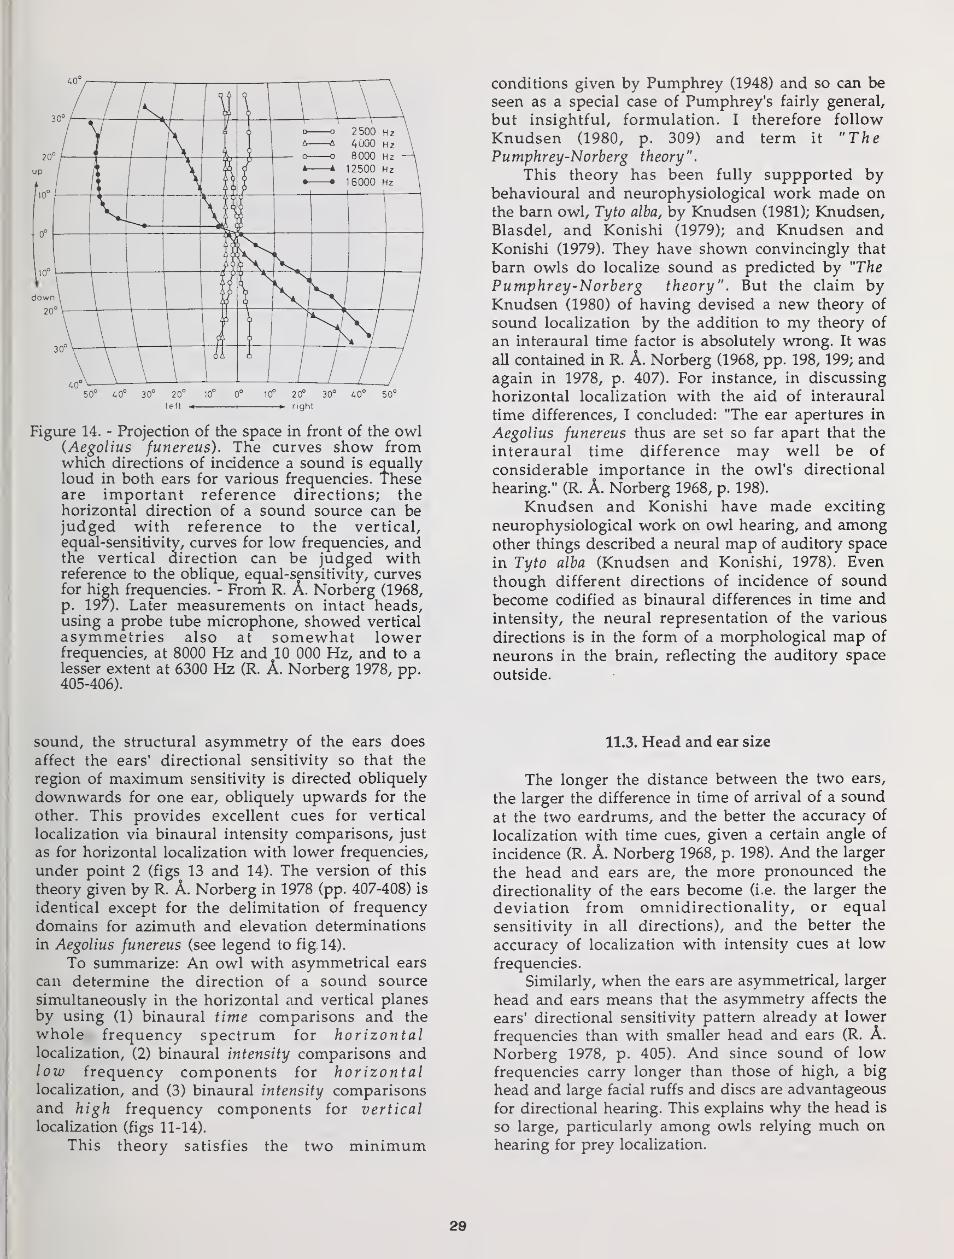
left - 1 right
Figure 14. - Projection of the space in front of the owl(Aegolius funereus). The curves show fromwhich directions of incidence a sound is equallyloud in both ears for various frequencies. Theseare important reference directions; thehorizontal direction of a sound source can bejudged with reference to the vertical,equal-sensitivity, curves for low frequencies, andthe vertical direction can be judged withreference to the oblique, equal-sensitivity, curvesfor high frequencies. - From R. A. Norberg (1968,
p. 197). Later measurements on intact heads,using a probe tube microphone, showed vertical
asymmetries also at somewhat lowerfrequencies, at 8000 Hz and 10 000 Hz, and to alesser extent at 6300 Hz (R. A. Norberg 1978, pp.405-406).
conditions given by Pumphrey (1948) and so can be
seen as a special case of Pumphrey's fairly general,
but insightful, formulation. I therefore follow
Knudsen (1980, p. 309) and term it "ThePumphrey-Norberg theory".
This theory has been fully suppported bybehavioural and neurophysiological work made onthe barn owl, Tyto alba, by Knudsen (1981); Knudsen,Blasdel, and Konishi (1979); and Knudsen andKonishi (1979). They have shown convincingly that
barn owls do localize sound as predicted by "The
Pumphrey-Norberg theory". But the claim byKnudsen (1980) of having devised a new theory of
sound localization by the addition to my theory of
an interaural time factor is absolutely wrong. It wasall contained in R. A. Norberg (1968, pp. 198, 199; andagain in 1978, p. 407). For instance, in discussing
horizontal localization with the aid of interaural
time differences, I concluded: "The ear apertures in
Aegolius funereus thus are set so far apart that the
interaural time difference may well be of
considerable importance in the owl's directional
hearing." (R. A. Norberg 1968, p. 198).
Knudsen and Konishi have made exciting
neurophysiological work on owl hearing, and amongother things described a neural map of auditory space
in Tyto alba (Knudsen and Konishi, 1978). Eventhough different directions of incidence of soundbecome codified as binaural differences in time and
intensity, the neural representation of the various
directions is in the form of a morphological map of
neurons in the brain, reflecting the auditory space
outside.
sound, the structural asymmetry of the ears does
affect the ears' directional sensitivity so that the
region of maximum sensitivity is directed obliquely
downwards for one ear, obliquely upwards for the
other. This provides excellent cues for vertical
localization via binaural intensity comparisons, just
as for horizontal localization with lower frequencies,
under point 2 (figs 13 and 14). The version of this
theory given by R. A. Norberg in 1978 (pp. 407-408) is
identical except for the delimitation of frequency
domains for azimuth and elevation determinations
in Aegolius funereus (see legend to fig. 14).
To summarize: An owl with asymmetrical ears
can determine the direction of a sound source
simultaneously in the horizontal and vertical planesby using (1) binaural time comparisons and the
whole frequency spectrum for horizontallocalization, (2) binaural intensity comparisons andlow frequency components for horizontallocalization, and (3) binaural intensity comparisonsand high frequency components for vertical
localization (figs 11-14).
This theory satisfies the two minimum
11.3. Head and ear size
The longer the distance between the two ears,
the larger the difference in time of arrival of a sound
at the two eardrums, and the better the accuracy of
localization with time cues, given a certain angle of
incidence (R. A. Norberg 1968, p. 198). And the larger
the head and ears are, the more pronounced the
directionality of the ears become (i.e. the larger the
deviation from omnidirectionality, or equal
sensitivity in all directions), and the better the
accuracy of localization with intensity cues at low
frequencies.
Similarly, when the ears are asymmetrical, larger
head and ears means that the asymmetry affects the
ears' directional sensitivity pattern already at lower
frequencies than with smaller head and ears (R. A.
Norberg 1978, p. 405). And since sound of lowfrequencies carry longer than those of high, a big
head and large facial ruffs and discs are advantageous
for directional hearing. This explains why the head is
so large, particularly among owls relying much onhearing for prey localization.
28
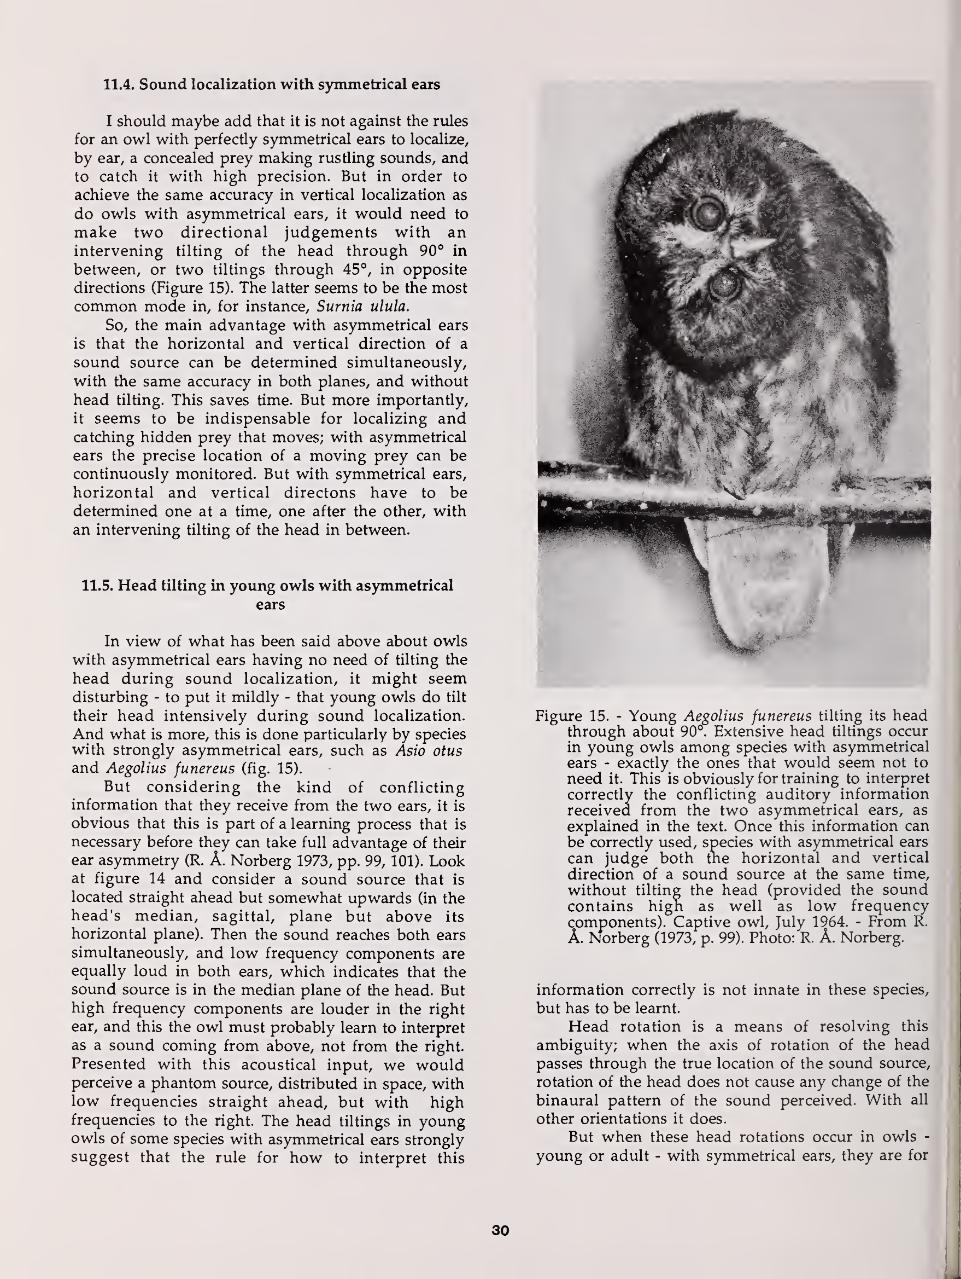
11.4. Sound localization with symmetrical ears
I should maybe add that it is not against the rules
for an owl with perfectly symmetrical ears to localize,
by ear, a concealed prey making rustling sounds, andto catch it with high precision. But in order to
achieve the same accuracy in vertical localization as
do owls with asymmetrical ears, it would need to
make two directional judgements with anintervening tilting of the head through 90° in
between, or two tiltings through 45°, in opposite
directions (Figure 15). The latter seems to be the mostcommon mode in, for instance, Surnia ulula.
So, the main advantage with asymmetrical ears
is that the horizontal and vertical direction of a
sound source can be determined simultaneously,
with the same accuracy in both planes, and without
head tilting. This saves time. But more importantly,
it seems to be indispensable for localizing andcatching hidden prey that moves; with asymmetrical
ears the precise location of a moving prey can becontinuously monitored. But with symmetrical ears,
horizontal and vertical directons have to bedetermined one at a time, one after the other, withan intervening tilting of the head in between.
11.5. Head tilting in young owls with asymmetrical
ears
In view of what has been said above about owlswith asymmetrical ears having no need of tilting the
head during sound localization, it might seemdisturbing - to put it mildly - that young owls do tilt
their head intensively during sound localization.
And what is more, this is done particularly by specieswith strongly asymmetrical ears, such as Asio otus
and Aegolius funereus (fig. 15).
But considering the kind of conflicting
information that they receive from the two ears, it is
obvious that this is part of a learning process that is
necessary before they can take full advantage of their
ear asymmetry (R. A. Norberg 1973, pp. 99, 101). Lookat figure 14 and consider a sound source that is
located straight ahead but somewhat upwards (in the
head's median, sagittal, plane but above its
horizontal plane). Then the sound reaches both ears
simultaneously, and low frequency components are
equally loud in both ears, which indicates that the
sound source is in the median plane of the head. Buthigh frequency components are louder in the right
ear, and this the owl must probably learn to interpret
as a sound coming from above, not from the right.
Presented with this acoustical input, we wouldperceive a phantom source, distributed in space, withlow frequencies straight ahead, but with highfrequencies to the right. The head tiltings in youngowls of some species with asymmetrical ears strongly
suggest that the rule for how to interpret this
Figure 15. - Young Aegolius funereus tilting its headthrough about 90°. Extensive head tiltings occurin young owls among species with asymmetricalears - exactly the ones that would seem not to
need it. This is obviously for training to interpret
correctly the conflicting auditory informationreceived from the two asymmetrical ears, as
explained in the text. Once this information canbe correctly used, species with asymmetrical ears
can judge both tne horizontal and vertical
direction of a sound source at the same time,
without tilting the head (provided the soundcontains high as well as low frequencycomponents). Captive owl, July 1964. - From R.
A. Norberg (1973, p. 99). Photo: R. A. Norberg.
information correctly is not innate in these species,
but has to be learnt.
Head rotation is a means of resolving this
ambiguity; when the axis of rotation of the headpasses through the true location of the sound source,
rotation of the head does not cause any change of the
binaural pattern of the sound perceived. With all
other orientations it does.
But when these head rotations occur in owls -
young or adult - with symmetrical ears, they are for
30
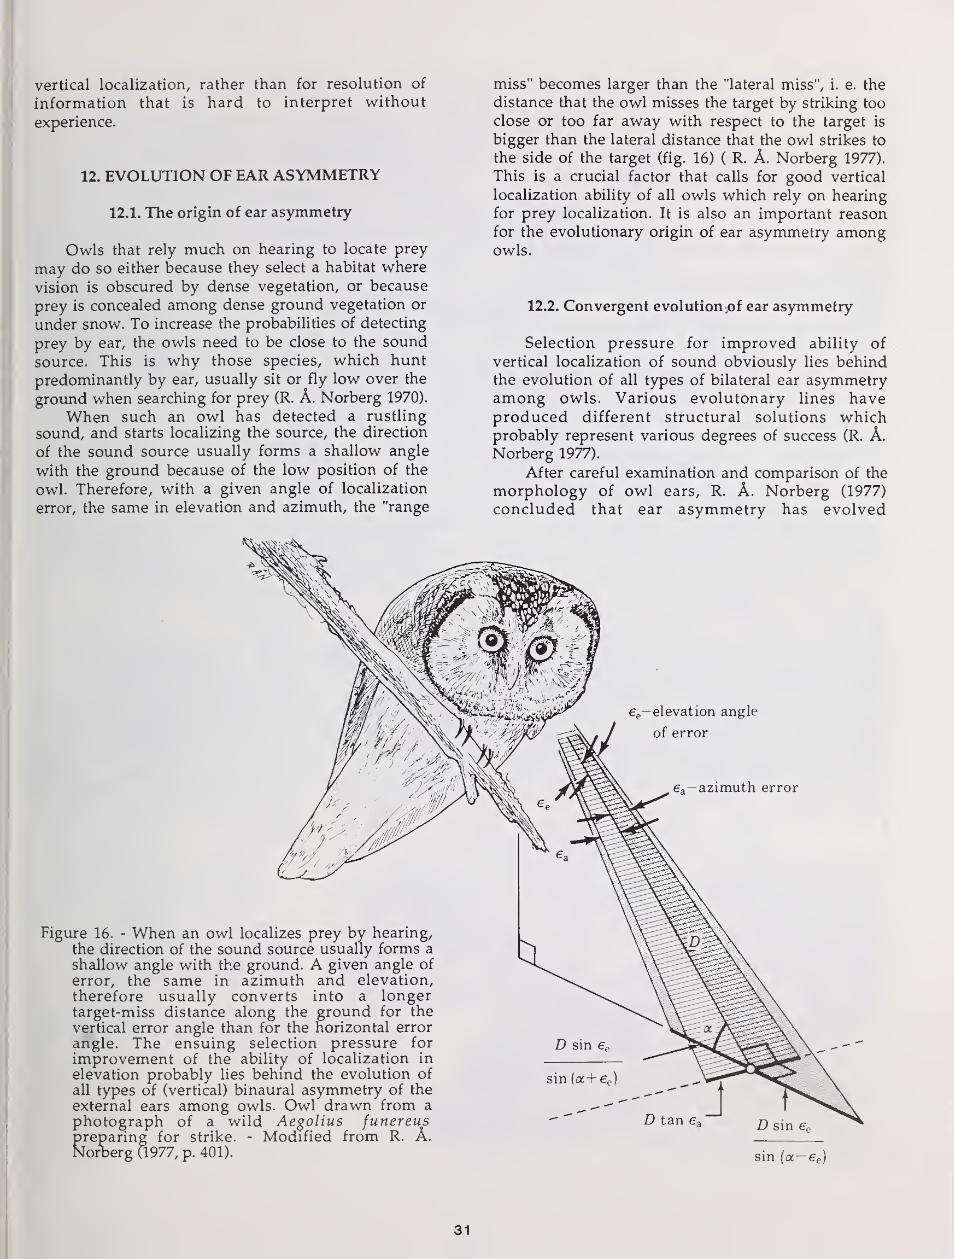
vertical localization, rather than for resolution of
information that is hard to interpret without
experience.
12. EVOLUTION OF EAR ASYMMETRY
12.1. The origin of ear asymmetry
Owls that rely much on hearing to locate prey
may do so either because they select a habitat where
vision is obscured by dense vegetation, or because
prey is concealed among dense ground vegetation or
under snow. To increase the probabilities of detecting
prey by ear, the owls need to be close to the sound
source. This is why those species, which hunt
predominantly by ear, usually sit or fly low over the
ground when searching for prey (R. A. Norberg 1970).
When such an owl has detected a rustling
sound, and starts localizing the source, the direction
of the sound source usually forms a shallow angle
with the ground because of the low position of the
owl. Therefore, with a given angle of localization
error, the same in elevation and azimuth, the "range
miss" becomes larger than the "lateral miss", i. e. the
distance that the owl misses the target by striking too
close or too far away with respect to the target is
bigger than the lateral distance that the owl strikes to
the side of the target (fig. 16) ( R. A. Norberg 1977).
This is a crucial factor that calls for good vertical
localization ability of all owls which rely on hearing
for prey localization. It is also an important reason
for the evolutionary origin of ear asymmetry amongowls.
12.2. Convergent evolution >of ear asymmetry
Selection pressure for improved ability of
vertical localization of sound obviously lies behindthe evolution of all types of bilateral ear asymmetryamong owls. Various evolutonary lines haveproduced different structural solutions whichprobably represent various degrees of success (R. A.
Norberg 1977).
After careful examination and comparison of the
morphology of owl ears, R. A. Norberg (1977)
concluded that ear asymmetry has evolved
ee— elevation angle
of error
ea—azimuth error
Figure 16. - When an owl localizes prey by hearing,
the direction of the sound source usually forms a
shallow angle with the ground. A given angle of
error, the same in azimuth and elevation,therefore usually converts into a longertarget-miss distance along the ground for the
vertical error angle than for the horizontal error
angle. The ensuing selection pressure for
improvement of the ability of localization in
elevation probably lies behind the evolution of
all types of (vertical) binaural asymmetry of the
external ears among owls. Owl drawn from a
photograph of a wild Aegolius funereuspreparing for strike. - Modified from R. A.Norberg (1977, p. 401).
sin (a+ ee )
D tan 6a
sin (a—
e
e )
31
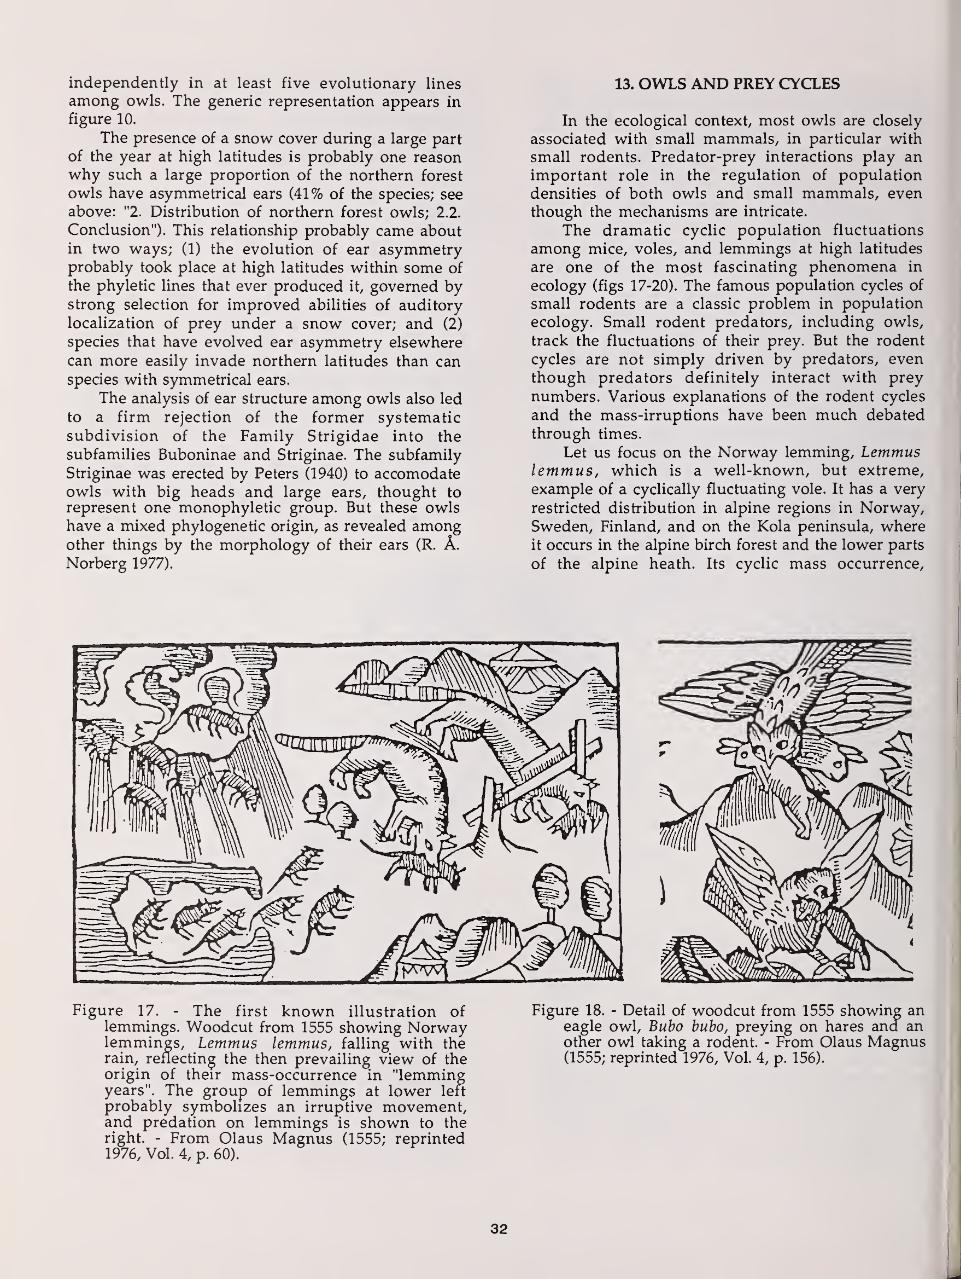
independently in at least five evolutionary lines
among owls. The generic representation appears in
figure 10.
The presence of a snow cover during a large part
of the year at high latitudes is probably one reasonwhy such a large proportion of the northern forest
owls have asymmetrical ears (41% of the species; see
above: "2. Distribution of northern forest owls; 2.2.
Conclusion"). This relationship probably came aboutin two ways; (1) the evolution of ear asymmetryprobably took place at high latitudes within some of
the phyletic lines that ever produced it, governed bystrong selection for improved abilities of auditory
localization of prey under a snow cover; and (2)
species that have evolved ear asymmetry elsewhere
can more easily invade northern latitudes than canspecies with symmetrical ears.
The analysis of ear structure among owls also led
to a firm rejection of the former systematic
subdivision of the Family Strigidae into the
subfamilies Buboninae and Striginae. The subfamily
Striginae was erected by Peters (1940) to accomodateowls with big heads and large ears, thought to
represent one monophyletic group. But these owlshave a mixed phylogenetic origin, as revealed amongother things by the morphology of their ears (R. A.
Norberg 1977).
13. OWLS AND PREY CYCLES
In the ecological context, most owls are closely
associated with small mammals, in particular with
small rodents. Predator-prey interactions play animportant role in the regulation of population
densities of both owls and small mammals, eventhough the mechanisms are intricate.
The dramatic cyclic population fluctuations
among mice, voles, and lemmings at high latitudes
are one of the most fascinating phenomena in
ecology (figs 17-20). The famous population cycles of
small rodents are a classic problem in population
ecology. Small rodent predators, including owls,
track the fluctuations of their prey. But the rodent
cycles are not simply driven by predators, eventhough predators definitely interact with prey
numbers. Various explanations of the rodent cycles
and the mass-irruptions have been much debated
through times.
Let us focus on the Norway lemming, Lemmuslemmus, which is a well-known, but extreme,
example of a cyclically fluctuating vole. It has a very
restricted distribution in alpine regions in Norway,Sweden, Finland, and on the Kola peninsula, whereit occurs in the alpine birch forest and the lower parts
of the alpine heath. Its cyclic mass occurrence,
Figure 17. - The first known illustration oflemmings. Woodcut from 1555 showing Norwaylemmings, Lemmus lemmus, falling with therain, reflecting the then prevailing view of theorigin of their mass-occurrence in "lemmingyears". The group of lemmings at lower left
probably symbolizes an irruptive movement,and predation on lemmings is shown to theright. - From Olaus Magnus (1555; reprinted1976, Vol. 4, p. 60).
Figure 18. - Detail of woodcut from 1555 showing aneagle owl, Bubo bubo, preying on hares ana another owl taking a rodent. - From Olaus Magnus(1555; reprinted 1976, Vol. 4, p. 156).
32

Figure 19. - An artist'srepresentation of anirruption of Norwaylemmings, he mm uslemmus at the turn of thelast century. - Based onBrehm; From Jaeerskiold,Lonnberg, and Adlerz (1903,p. 9).
Figure 20. - Lemmus lemmus inclose view. - From Brehm(1922, Vol. 11, p. 259).
33
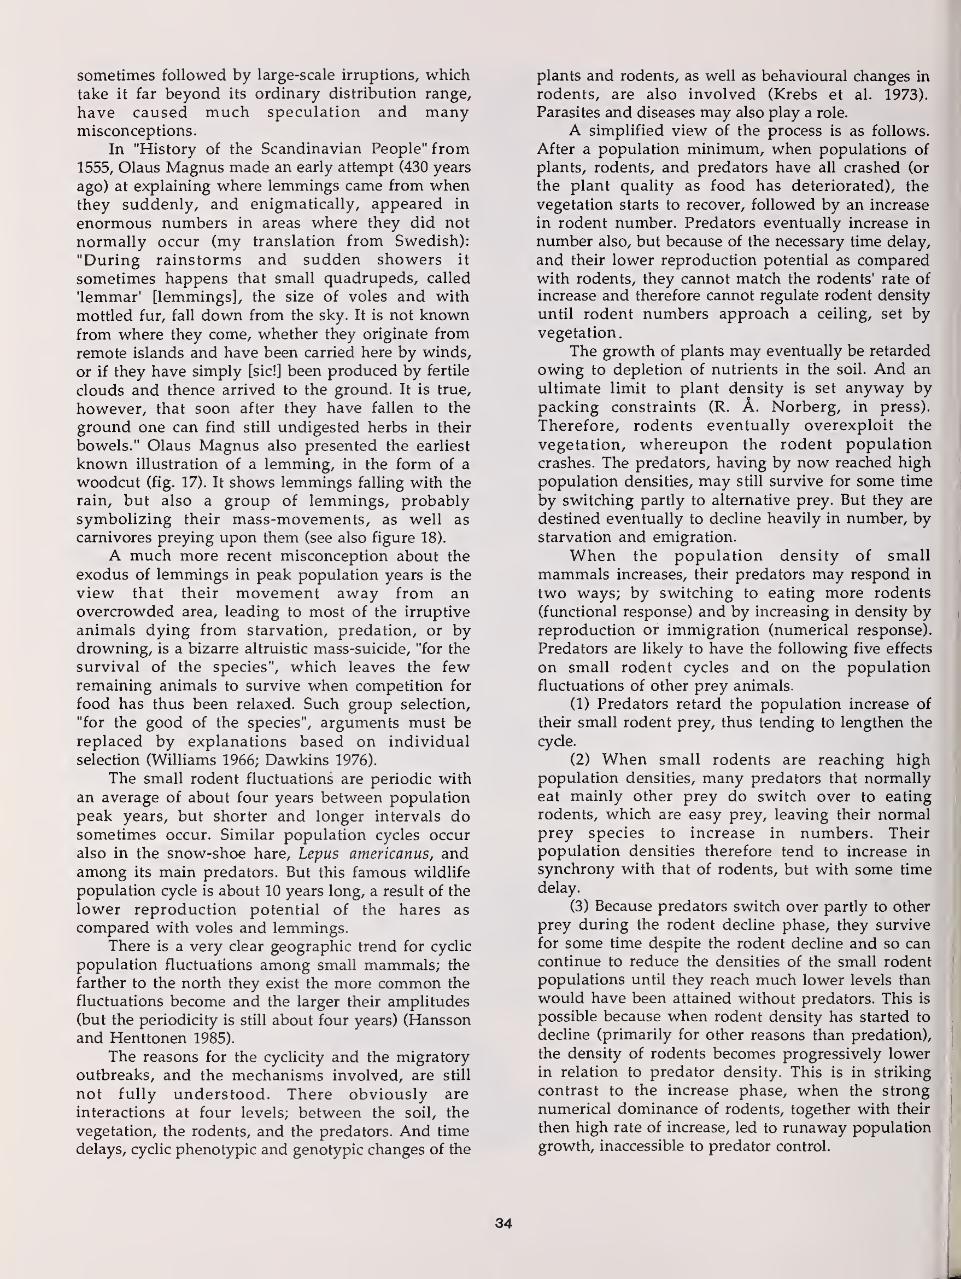
sometimes followed by large-scale irruptions, whichtake it far beyond its ordinary distribution range,
have caused much speculation and manymisconceptions.
In "History of the Scandinavian People" from1555, Olaus Magnus made an early attempt (430 years
ago) at explaining where lemmings came from whenthey suddenly, and enigmatically, appeared in
enormous numbers in areas where they did not
normally occur (my translation from Swedish):
"During rainstorms and sudden showers it
sometimes happens that small quadrupeds, called
'lemmar' [lemmings], the size of voles and with
mottled fur, fall down from the sky. It is not knownfrom where they come, whether they originate from
remote islands and have been carried here by winds,
or if they have simply [sic!] been produced by fertile
clouds and thence arrived to the ground. It is true,
however, that soon after they have fallen to the
ground one can find still undigested herbs in their
bowels." Olaus Magnus also presented the earliest
known illustration of a lemming, in the form of a
woodcut (fig. 17). It shows lemmings falling with the
rain, but also a group of lemmings, probablysymbolizing their mass-movements, as well as
carnivores preying upon them (see also figure 18).
A much more recent misconception about the
exodus of lemmings in peak population years is the
view that their movement away from anovercrowded area, leading to most of the irruptive
animals dying from starvation, predation, or bydrowning, is a bizarre altruistic mass-suicide, "for the
survival of the species", which leaves the fewremaining animals to survive when competition for
food has thus been relaxed. Such group selection,
"for the good of the species", arguments must bereplaced by explanations based on individual
selection (Williams 1966; Dawkins 1976).
The small rodent fluctuations are periodic with
an average of about four years between population
peak years, but shorter and longer intervals dosometimes occur. Similar population cycles occur
also in the snow-shoe hare, Lepus americanus, andamong its main predators. But this famous wildlife
population cycle is about 10 years long, a result of the
lower reproduction potential of the hares as
compared with voles and lemmings.There is a very clear geographic trend for cyclic
population fluctuations among small mammals; the
farther to the north they exist the more common the
fluctuations become and the larger their amplitudes
(but the periodicity is still about four years) (Hanssonand Henttonen 1985).
The reasons for the cyclicity and the migratory
outbreaks, and the mechanisms involved, are still
not fully understood. There obviously are
interactions at four levels; between the soil, the
vegetation, the rodents, and the predators. And time
delays, cyclic phenotypic and genotypic changes of the
plants and rodents, as well as behavioural changes in
rodents, are also involved (Krebs et al. 1973).
Parasites and diseases may also play a role.
A simplified view of the process is as follows.
After a population minimum, when populations of
plants, rodents, and predators have all crashed (or
the plant quality as food has deteriorated), the
vegetation starts to recover, followed by an increase
in rodent number. Predators eventually increase in
number also, but because of the necessary time delay,
and their lower reproduction potential as comparedwith rodents, they cannot match the rodents' rate of
increase and therefore cannot regulate rodent density
until rodent numbers approach a ceiling, set byvegetation
.
The growth of plants may eventually be retarded
owing to depletion of nutrients in the soil. And an
ultimate limit to plant density is set anyway bypacking constraints (R. A. Norberg, in press).
Therefore, rodents eventually overexploit the
vegetation, whereupon the rodent populationcrashes. The predators, having by now reached high
population densities, may still survive for some time
by switching partly to alternative prey. But they are
destined eventually to decline heavily in number, bystarvation and emigration.
When the population density of small
mammals increases, their predators may respond in
two ways; by switching to eating more rodents
(functional response) and by increasing in density byreproduction or immigration (numerical response).
Predators are likely to have the following five effects
on small rodent cycles and on the population
fluctuations of other prey animals.
(1) Predators retard the population increase of
their small rodent prey, thus tending to lengthen the
cycle.
(2) When small rodents are reaching highpopulation densities, many predators that normallyeat mainly other prey do switch over to eating
rodents, which are easy prey, leaving their normalprey species to increase in numbers. Theirpopulation densities therefore tend to increase in
synchrony with that of rodents, but with some time
delay.
(3) Because predators switch over partly to other
prey during the rodent decline phase, they survive
for some time despite the rodent decline and so can
continue to reduce the densities of the small rodent
populations until they reach much lower levels than
would have been attained without predators. This is
possible because when rodent density has started to
decline (primarily for other reasons than predation),
the density of rodents becomes progressively lower
in relation to predator density. This is in striking
contrast to the increase phase, when the strong
numerical dominance of rodents, together with their
then high rate of increase, led to runaway population
growth, inaccessible to predator control.
34
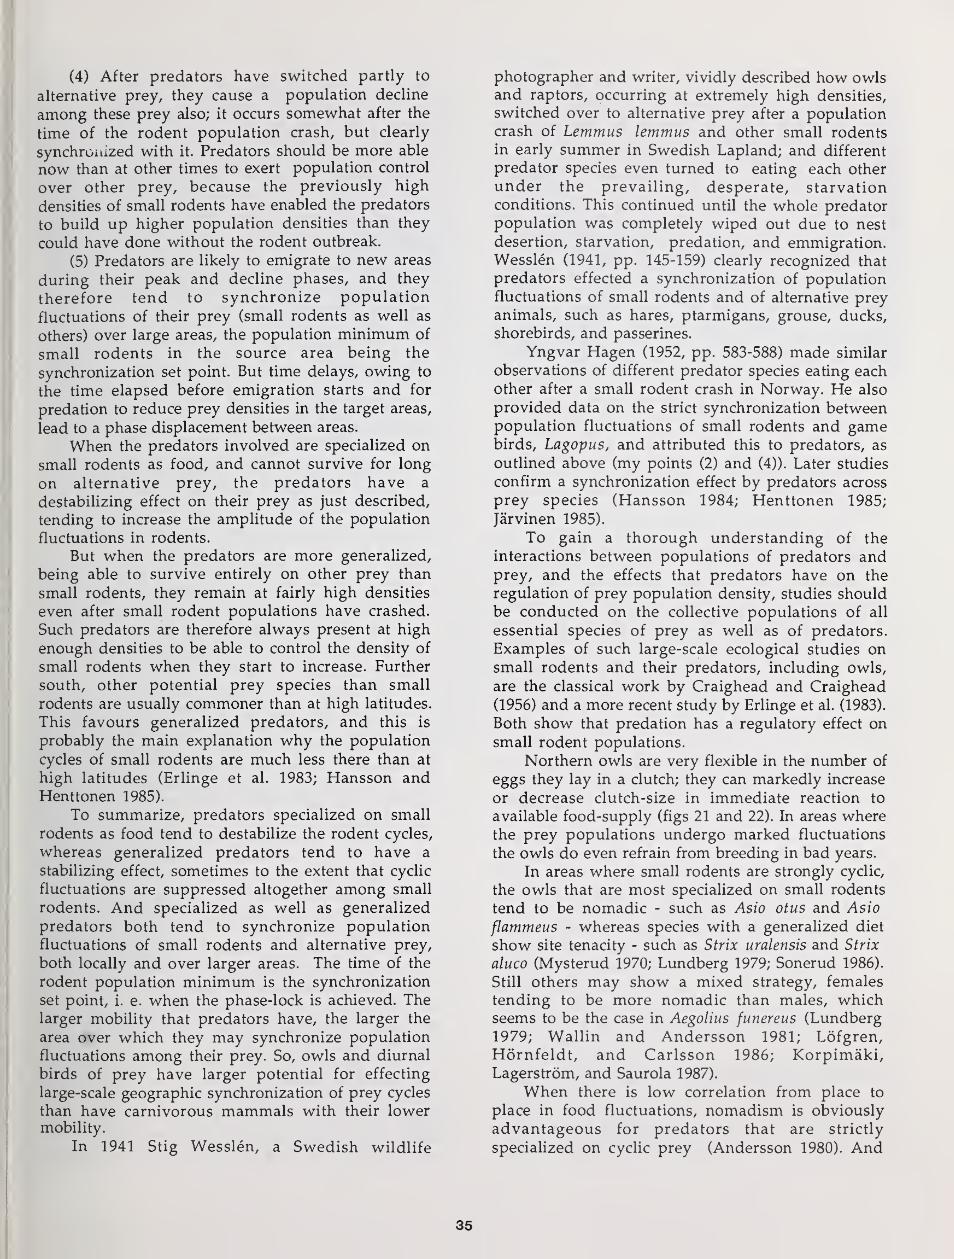
(4) After predators have switched partly to
alternative prey, they cause a population decline
among these prey also; it occurs somewhat after the
time of the rodent population crash, but clearly
synchronized with it. Predators should be more able
now than at other times to exert population control
over other prey, because the previously high
densities of small rodents have enabled the predators
to build up higher population densities than they
could have done without the rodent outbreak.
(5) Predators are likely to emigrate to new areas
during their peak and decline phases, and they
therefore tend to synchronize population
fluctuations of their prey (small rodents as well as
others) over large areas, the population minimum of
small rodents in the source area being the
synchronization set point. But time delays, owing to
the time elapsed before emigration starts and for
predation to reduce prey densities in the target areas,
lead to a phase displacement between areas.
When the predators involved are specialized onsmall rodents as food, and cannot survive for long
on alternative prey, the predators have a
destabilizing effect on their prey as just described,
tending to increase the amplitude of the population
fluctuations in rodents.
But when the predators are more generalized,
being able to survive entirely on other prey than
small rodents, they remain at fairly high densities
even after small rodent populations have crashed.
Such predators are therefore always present at high
enough densities to be able to control the density of
small rodents when they start to increase. Further
south, other potential prey species than small
rodents are usually commoner than at high latitudes.
This favours generalized predators, and this is
probably the main explanation why the population
cycles of small rodents are much less there than at
high latitudes (Erlinge et al. 1983; Hansson andHenttonen 1985).
To summarize, predators specialized on small
rodents as food tend to destabilize the rodent cycles,
whereas generalized predators tend to have a
stabilizing effect, sometimes to the extent that cyclic
fluctuations are suppressed altogether among small
rodents. And specialized as well as generalized
predators both tend to synchronize population
fluctuations of small rodents and alternative prey,
both locally and over larger areas. The time of the
rodent population minimum is the synchronization
set point, i. e. when the phase-lock is achieved. Thelarger mobility that predators have, the larger the
area over which they may synchronize population
fluctuations among their prey. So, owls and diurnal
birds of prey have larger potential for effecting
large-scale geographic synchronization of prey cycles
than have carnivorous mammals with their lowermobility.
In 1941 Stig Wesslen, a Swedish wildlife
photographer and writer, vividly described how owlsand raptors, occurring at extremely high densities,
switched over to alternative prey after a populationcrash of Lemmus lemmus and other small rodentsin early summer in Swedish Lapland; and different
predator species even turned to eating each other
under the prevailing, desperate, starvationconditions. This continued until the whole predatorpopulation was completely wiped out due to nest
desertion, starvation, predation, and emmigration.Wesslen (1941, pp. 145-159) clearly recognized that
predators effected a synchronization of populationfluctuations of small rodents and of alternative preyanimals, such as hares, ptarmigans, grouse, ducks,
shorebirds, and passerines.
Yngvar Hagen (1952, pp. 583-588) made similar
observations of different predator species eating eachother after a small rodent crash in Norway. He also
provided data on the strict synchronization betweenpopulation fluctuations of small rodents and gamebirds, Lagopus, and attributed this to predators, as
outlined above (my points (2) and (4)). Later studies
confirm a synchronization effect by predators across
prey species (Hansson 1984; Henttonen 1985;
Jarvinen 1985).
To gain a thorough understanding of the
interactions between populations of predators andprey, and the effects that predators have on the
regulation of prey population density, studies should
be conducted on the collective populations of all
essential species of prey as well as of predators.
Examples of such large-scale ecological studies onsmall rodents and their predators, including owls,
are the classical work by Craighead and Craighead
(1956) and a more recent study by Erlinge et al. (1983).
Both show that predation has a regulatory effect onsmall rodent populations.
Northern owls are very flexible in the number of
eggs they lay in a clutch; they can markedly increase
or decrease clutch-size in immediate reaction to
available food-supply (figs 21 and 22). In areas wherethe prey populations undergo marked fluctuations
the owls do even refrain from breeding in bad years.
In areas where small rodents are strongly cyclic,
the owls that are most specialized on small rodents
tend to be nomadic - such as Asio otus and Asio
flammeus - whereas species with a generalized diet
show site tenacity - such as Strix uralensis and Strix
aluco (Mysterud 1970; Lundberg 1979; Sonerud 1986).
Still others may show a mixed strategy, females
tending to be more nomadic than males, whichseems to be the case in Aegolius funereus (Lundberg
1979; Wallin and Andersson 1981; Lofgren,Hornfeldt, and Carlsson 1986; Korpimaki,Lagerstrom, and Saurola 1987).
When there is low correlation from place to
place in food fluctuations, nomadism is obviously
advantageous for predators that are strictly
specialized on cyclic prey (Andersson 1980). And
35
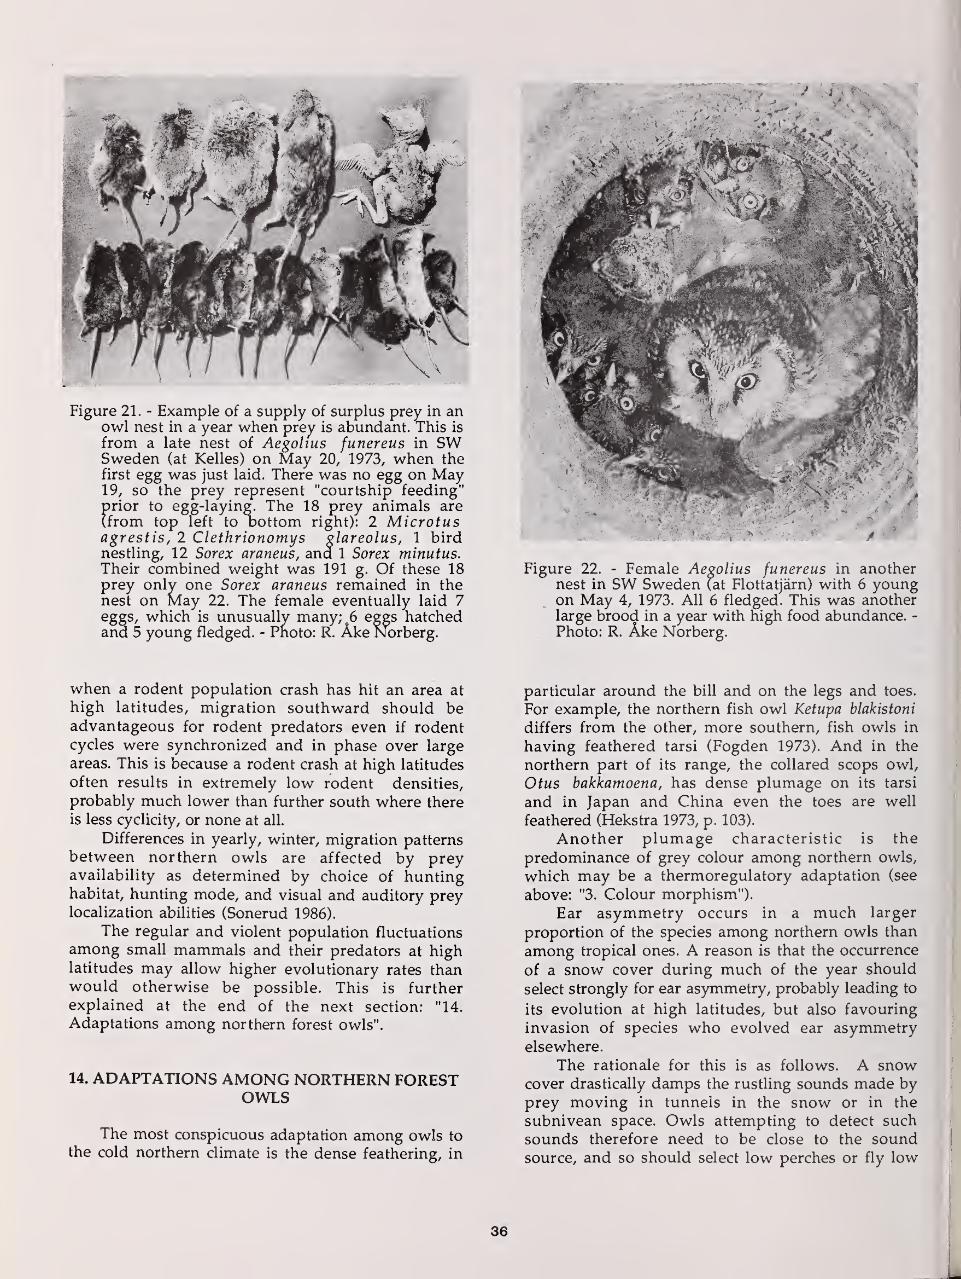
Figure 21. - Example of a supply of surplus prey in anowl nest in a year when prey is abundant. This is
from a late nest of Aegolius funereus in SWSweden (at Kelles) on May 20, 1973, when thefirst egg was just laid. There was no egg on May19, so the prey represent "courtship feeding"prior to egg-laying. The 18 prey animals are(from top left to oottom right): 2 Microtusagrestis, 2 Clethrionomys vlareolus, 1 birdnestling, 12 Sorex araneus, ana 1 Sorex minutus.Their combined weight was 191 g. Of these 18prey only one Sorex araneus remained in thenest on May 22. The female eventually laid 7eggs, which is unusually many; 6 eggs hatchedand 5 young fledged. - Photo: R. Ake Norberg.
when a rodent population crash has hit an area at
high latitudes, migration southward should beadvantageous for rodent predators even if rodentcycles were synchronized and in phase over large
areas. This is because a rodent crash at high latitudes
often results in extremely low rodent densities,
probably much lower than further south where there
is less cyclicity, or none at all.
Differences in yearly, winter, migration patterns
between northern owls are affected by preyavailability as determined by choice of huntinghabitat, hunting mode, and visual and auditory preylocalization abilities (Sonerud 1986).
The regular and violent population fluctuations
among small mammals and their predators at highlatitudes may allow higher evolutionary rates thanwould otherwise be possible. This is furtherexplained at the end of the next section: "14.
Adaptations among northern forest owls".
14. ADAPTATIONS AMONG NORTHERN FORESTOWLS
The most conspicuous adaptation among owls to
the cold northern climate is the dense feathering, in
Figure 22. - Female Aegolius funereus in anothernest in SW Sweden (at Flottatjarn) with 6 youngon May 4, 1973. All 6 fledged. This was anotherlarge brood in a year with high food abundance. -
Photo: R. Ake Norberg.
particular around the bill and on the legs and toes.
For example, the northern fish owl Ketupa blakistoni
differs from the other, more southern, fish owls in
having feathered tarsi (Fogden 1973). And in the
northern part of its range, the collared scops owl,
Otus bakkamoena, has dense plumage on its tarsi
and in Japan and China even the toes are well
feathered (Hekstra 1973, p. 103).
Another plumage characteristic is the
predominance of grey colour among northern owls,
which may be a thermoregulatory adaptation (see
above: "3. Colour morphism").
Ear asymmetry occurs in a much larger
proportion of the species among northern owls than
among tropical ones. A reason is that the occurrence
of a snow cover during much of the year should
select strongly for ear asymmetry, probably leading to
its evolution at high latitudes, but also favouring
invasion of species who evolved ear asymmetryelsewhere.
The rationale for this is as follows. A snowcover drastically damps the rustling sounds made byprey moving in tunnels in the snow or in the
subnivean space. Owls attempting to detect such
sounds therefore need to be close to the soundsource, and so should select low perches or fly low
36
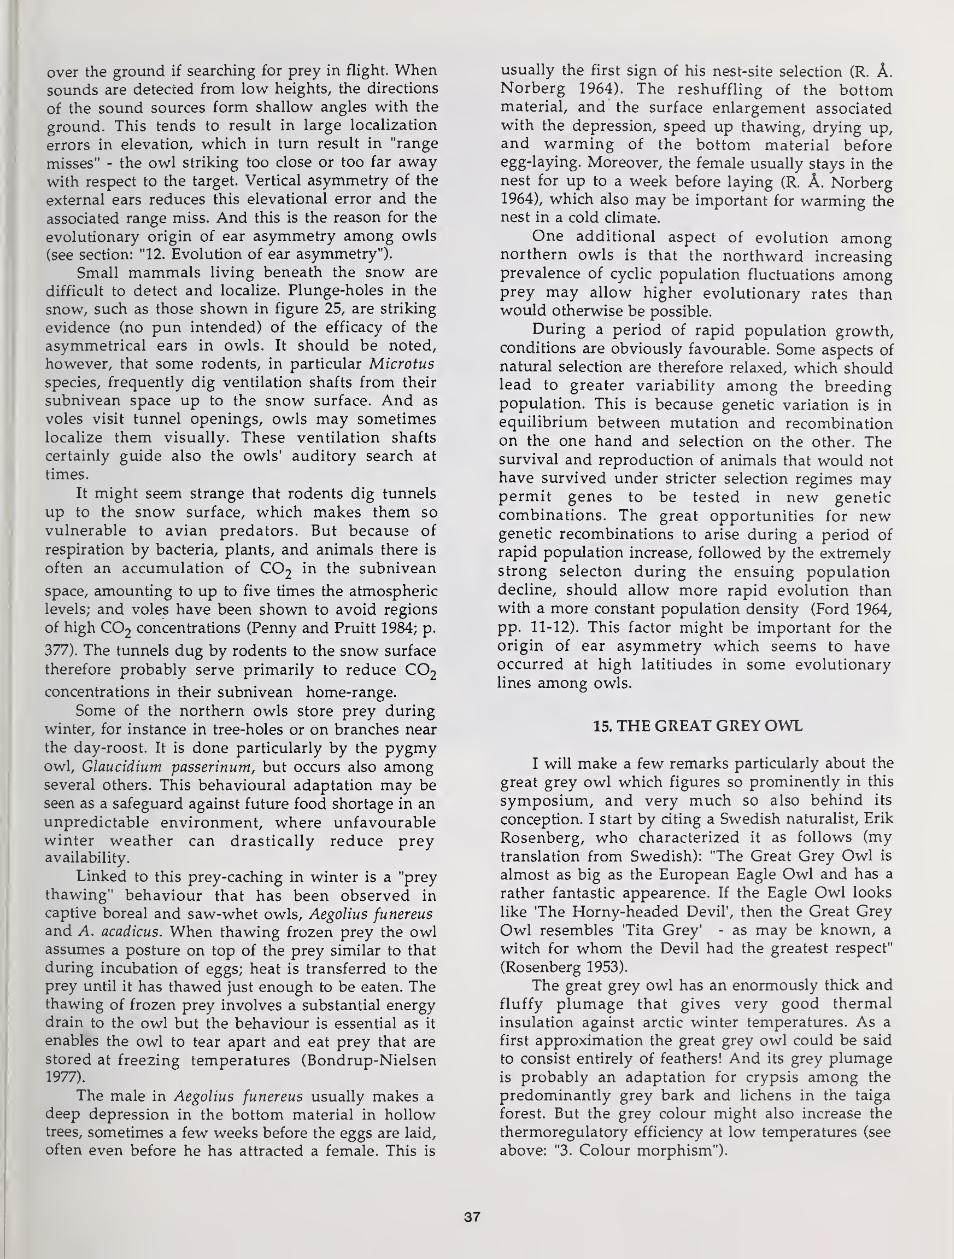
over the ground if searching for prey in flight. Whensounds are detected from low heights, the directions
of the sound sources form shallow angles with the
ground. This tends to result in large localization
errors in elevation, which in turn result in "range
misses" - the owl striking too close or too far awaywith respect to the target. Vertical asymmetry of the
external ears reduces this elevational error and the
associated range miss. And this is the reason for the
evolutionary origin of ear asymmetry among owls
(see section: "12. Evolution of ear asymmetry").
Small mammals living beneath the snow are
difficult to detect and localize. Plunge-holes in the
snow, such as those shown in figure 25, are striking
evidence (no pun intended) of the efficacy of the
asymmetrical ears in owls. It should be noted,
however, that some rodents, in particular Microtus
species, frequently dig ventilation shafts from their
subnivean space up to the snow surface. And as
voles visit tunnel openings, owls may sometimeslocalize them visually. These ventilation shafts
certainly guide also the owls' auditory search at
times.
It might seem strange that rodents dig tunnels
up to the snow surface, which makes them so
vulnerable to avian predators. But because of
respiration by bacteria, plants, and animals there is
often an accumulation of CO2 in the subnivean
space, amounting to up to five times the atmospheric
levels; and voles have been shown to avoid regions
of high C02 concentrations (Penny and Pruitt 1984; p.
377). The tunnels dug by rodents to the snow surface
therefore probably serve primarily to reduce C02
concentrations in their subnivean home-range.
Some of the northern owls store prey duringwinter, for instance in tree-holes or on branches near
the day-roost. It is done particularly by the pygmyowl, Glaucidium passerinum, but occurs also amongseveral others. This behavioural adaptation may beseen as a safeguard against future food shortage in an
unpredictable environment, where unfavourablewinter weather can drastically reduce preyavailability.
Linked to this prey-caching in winter is a "prey
thawing" behaviour that has been observed in
captive boreal and saw-whet owls, Aegolius funereusand A. acadicus. When thawing frozen prey the owlassumes a posture on top of the prey similar to that
during incubation of eggs; heat is transferred to the
prey until it has thawed just enough to be eaten. Thethawing of frozen prey involves a substantial energydrain to the owl but the behaviour is essential as it
enables the owl to tear apart and eat prey that are
stored at freezing temperatures (Bondrup-Nielsen1977).
The male in Aegolius funereus usually makes a
deep depression in the bottom material in hollowtrees, sometimes a few weeks before the eggs are laid,
often even before he has attracted a female. This is
usually the first sign of his nest-site selection (R. A.Norberg 1964). The reshuffling of the bottommaterial, and the surface enlargement associatedwith the depression, speed up thawing, drying up,and warming of the bottom material beforeegg-laying. Moreover, the female usually stays in the
nest for up to a week before laying (R. A. Norberg1964), which also may be important for warming thenest in a cold climate.
One additional aspect of evolution amongnorthern owls is that the northward increasingprevalence of cyclic population fluctuations amongprey may allow higher evolutionary rates thanwould otherwise be possible.
During a period of rapid population growth,conditions are obviously favourable. Some aspects of
natural selection are therefore relaxed, which shouldlead to greater variability among the breedingpopulation. This is because genetic variation is in
equilibrium between mutation and recombinationon the one hand and selection on the other. Thesurvival and reproduction of animals that would nothave survived under stricter selection regimes maypermit genes to be tested in new genetic
combinations. The great opportunities for newgenetic recombinations to arise during a period of
rapid population increase, followed by the extremely
strong selecton during the ensuing populationdecline, should allow more rapid evolution than
with a more constant population density (Ford 1964,
pp. 11-12). This factor might be important for the
origin of ear asymmetry which seems to haveoccurred at high latitiudes in some evolutionary
lines among owls.
15. THE GREAT GREY OWL
I will make a few remarks particularly about the
great grey owl which figures so prominently in this
symposium, and very much so also behind its
conception. I start by citing a Swedish naturalist, Erik
Rosenberg, who characterized it as follows (mytranslation from Swedish): "The Great Grey Owl is
almost as big as the European Eagle Owl and has a
rather fantastic appearence. If the Eagle Owl looks
like The Horny-headed Devil', then the Great GreyOwl resembles 'Tita Grey' - as may be known, a
witch for whom the Devil had the greatest respect"
(Rosenberg 1953).
The great grey owl has an enormously thick andfluffy plumage that gives very good thermal
insulation against arctic winter temperatures. As a
first approximation the great grey owl could be said
to consist entirely of feathers! And its grey plumageis probably an adaptation for crypsis among the
predominantly grey bark and lichens in the taiga
forest. But the grey colour might also increase the
thermoregulatory efficiency at low temperatures (see
above: "3. Colour morphism").
37
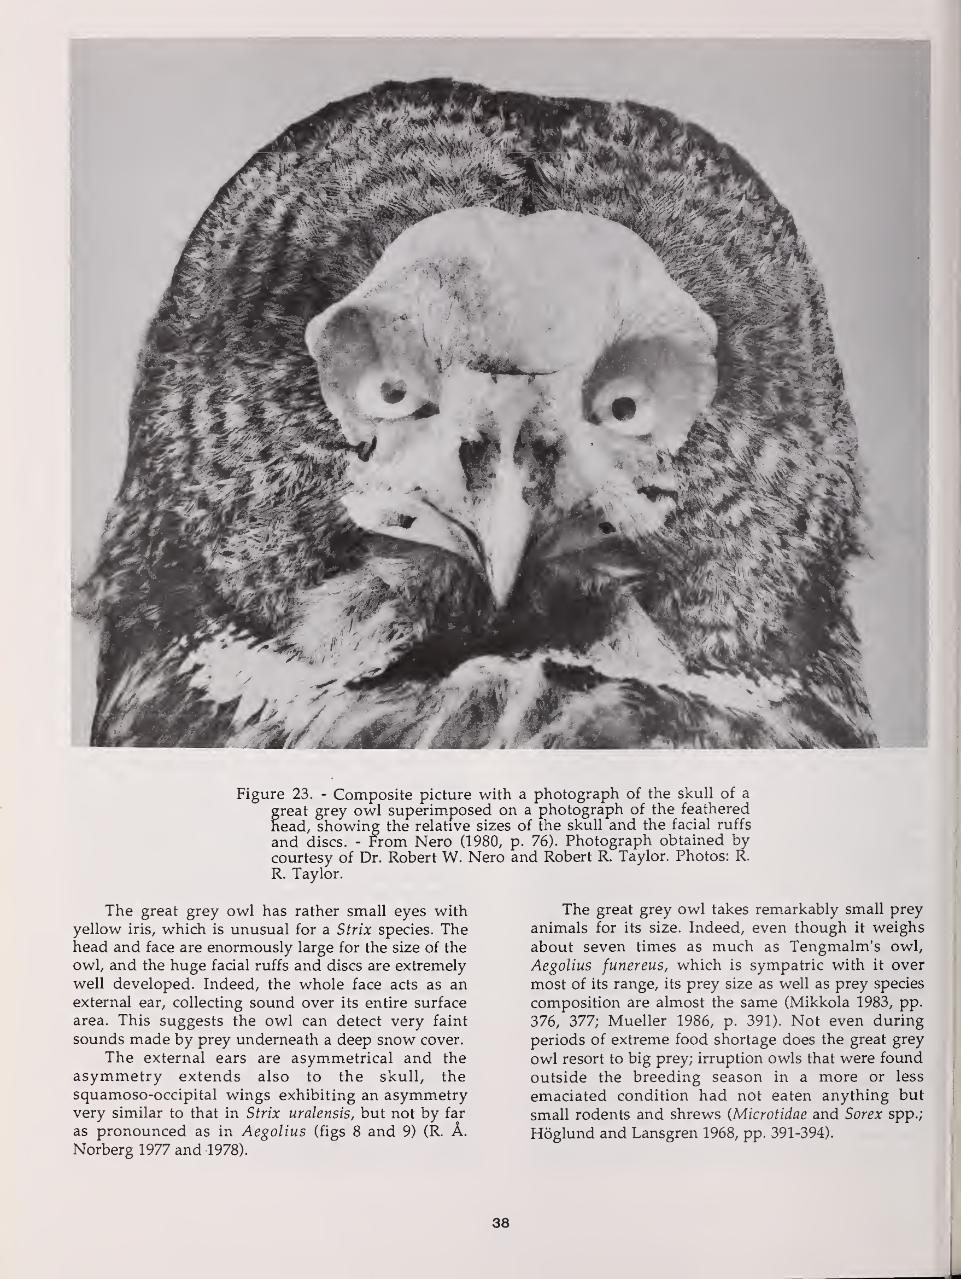
Figure 23. - Composite picture with a photograph of the skull of a
great grey owl superimposed on a photograph of the feathered
head, showing the relative sizes of the skull and the facial ruffs
and discs. - From Nero (1980, p. 76). Photograph obtained bycourtesy of Dr. Robert W. Nero and Robert R. Taylor. Photos: R.
R. Taylor.
The great grey owl has rather small eyes withyellow iris, which is unusual for a Strix species. Thehead and face are enormously large for the size of the
owl, and the huge facial ruffs and discs are extremely
well developed. Indeed, the whole face acts as anexternal ear, collecting sound over its entire surface
area. This suggests the owl can detect very faint
sounds made by prey underneath a deep snow cover.
The external ears are asymmetrical and the
asymmetry extends also to the skull, the
squamoso-occipital wings exhibiting an asymmetryvery similar to that in Strix uralensis, but not by far
as pronounced as in Aegolius (figs 8 and 9) (R. A.
Norberg 1977 and 1978).
The great grey owl takes remarkably small prey
animals for its size. Indeed, even though it weighs
about seven times as much as Tengmalm's owl,
Aegolius funereus, which is sympatric with it over
most of its range, its prey size as well as prey species
composition are almost the same (Mikkola 1983, pp.
376, 377; Mueller 1986, p. 391). Not even during
periods of extreme food shortage does the great grey
owl resort to big prey; irruption owls that were found
outside the breeding season in a more or less
emaciated condition had not eaten anything but
small rodents and shrews (Microtidae and Sorex spp.;
Hoglund and Lansgren 1968, pp. 391-394).
38
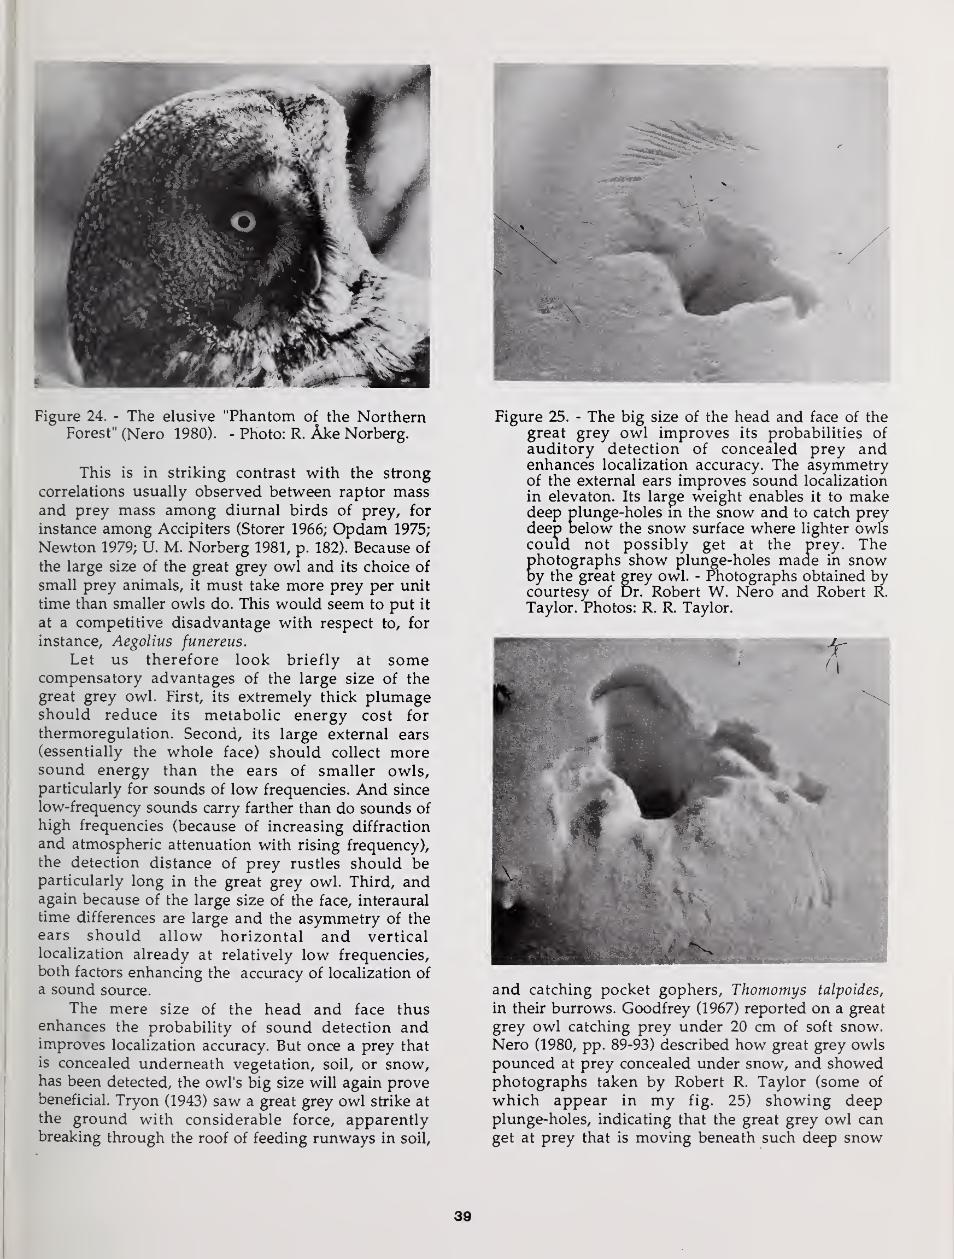
Figure 24. - The elusive "Phantom of the NorthernForest" (Nero 1980). - Photo: R. Ake Norberg.
This is in striking contrast with the strong
correlations usually observed between raptor massand prey mass among diurnal birds of prey, for
instance among Accipiters (Storer 1966; Opdam 1975;
Newton 1979; U. M. Norberg 1981, p. 182). Because of
the large size of the great grey owl and its choice of
small prey animals, it must take more prey per unit
time than smaller owls do. This would seem to put it
at a competitive disadvantage with respect to, for
instance, Aegolius funereus.
Let us therefore look briefly at somecompensatory advantages of the large size of the
great grey owl. First, its extremely thick plumageshould reduce its metabolic energy cost for
thermoregulation. Second, its large external ears
(essentially the whole face) should collect moresound energy than the ears of smaller owls,particularly for sounds of low frequencies. And since
low-frequency sounds carry farther than do sounds of
high frequencies (because of increasing diffraction
and atmospheric attenuation with rising frequency),
the detection distance of prey rustles should beparticularly long in the great grey owl. Third, andagain because of the large size of the face, interaural
time differences are large and the asymmetry of the
ears should allow horizontal and vertical
localization already at relatively low frequencies,both factors enhancing the accuracy of localization of
a sound source.
The mere size of the head and face thusenhances the probability of sound detection andimproves localization accuracy. But once a prey that
is concealed underneath vegetation, soil, or snow,has been detected, the owl's big size will again provebeneficial. Tryon (1943) saw a great grey owl strike at
the ground with considerable force, apparentlybreaking through the roof of feeding runways in soil,
Figure 25. - The big size of the head and face of thegreat grey owl improves its probabilities ofauditory detection of concealed prey andenhances localization accuracy. The asymmetryof the external ears improves sound localization
in elevaton. Its large weight enables it to makedeep plunge-holes in the snow and to catch preydeep below the snow surface where lighter owlscould not possibly get at the prey. Thephotographs show plunge-holes made in snowoy the great grey owl. - Photographs obtained bycourtesy of Dr. Robert W. Nero and Robert K.
Taylor. Photos: R. R. Taylor.
and catching pocket gophers, Thomomys talpoides,
in their burrows. Goodfrey (1967) reported on a great
grey owl catching prey under 20 cm of soft snow.Nero (1980, pp. 89-93) described how great grey owls
pounced at prey concealed under snow, and showedphotographs taken by Robert R. Taylor (some of
which appear in my fig. 25) snowing deepplunge-holes, indicating that the great grey owl can
get at prey that is moving beneath such deep snow
39
that lighter owls could not possibly reach it. And,finally, Hilden and Helo (1981, p. 164) showedphotographs taken by Eero Kemila of a striking great
grey owl that almost disappeared in the snow, andthey also reported an observation by T. Korkolainen
who witnessed a great grey owl which plungedthrough a snow crust hard enough to bear a 80-kg
man.So even though the great grey owl does not use
its large size to take big prey, it obviously benefits
from its size in other ways.
16. EPILOGUE
Before I stop entirely, I want to add the
following. For me to come to this symposium in
Winnipeg and talk about the great grey owl andother owls is like "carrying owls to Athens". This is a
Greek proverb based on the fact that owls, in
particular the Little Owl, Athene noctua , were very
common around the city of Athens in Greece (Sparks
and Soper, 1970, p.161).
But on my way here I met a Greek on the plane,
Anastasios Christodoulou. I asked him about this
proverb and he gave a different interpretation of it.
This relates to the owl being a symbol of wisdom.And since there was so much wisdom in ancient
Athens already, there was no need of "carrying owls"
there. This very much applies to my situation here at
this symposium.
Acknowledgements. - I thank Robert W. Nero andRobert R. Taylor for providing the photographsshown in figures 24 and 25 and for their permission
to reproduce them; my wife Ulla M. Norberg for
commenting on the manuscript; and Robert H.
Hamre for editorial help. The study was supported bygrants from the Swedish Natural Science Research
Council (No. B 4450).
LITERATURE CITED
Andersson, M. 1980. Nomadism and site tenacity as
alternative reproductive tactics in birds. - Journal
of Animal Ecology 49:175-184.
Andersson, M. 1981. On optimal predator search. -
Theoretical Population Biology 19:58-86.
Andersson, M. ana Norberg, R. A. 1981. Evolution of
reversed sexual size dimorphism and role
partitioning among predatory birds, with a size
scaling of flight performance. - Biological Journalof the Linnean Society 15:105-130.
Barrows, C. W. 1981. Roost selection by spotted owls:
an adaptation to heat stress. - Condor 83:302-309.
Bondrup-Nielsen, S. 1977. Thawing of frozen prey byboreal and saw-whet owls. - Canadian Journal of
Zoology 55:595-601.
Brehm, W. 1922. Brehms Tierleben. Vol. 8 & 11. -
Bibligraphiches Institut. Leipzig. (In German.)
Burton, J. A. 1973. Owls of the World. TheirEvolution, Structure and Ecology. - Peter Lowe.Eurobook Limited.
Cade, T. J. 1982. The Falcons of the World. - CornellUniversity Press, Ithaca.
Clark, R. J., Smith, D. G., and Kelso, L. H. 1978.Working Bibliography of Owls of the World -
NWF Scientific/Technical Series No. 1. NationalWildlife Federation, Washington, D. C.
Collett, R. 1871. On the asymmetry of the skull in
Strix tengmalmi. - Proceedings of the ZoologicalSociety of London 1871:739-743.
Collett, R. 1872. Om craniets assymetri hos Nyctalatengmalmi, Gm. - ChristianiaVidenskabsselskabs Forhandlinger 1872: 68-72.
(In Norwegian. Content essentially as in Collett
1871.)
Collett, R. 1881. Craniets og oreaabningernes bygninghos de nordeuropaeiske arter af familienStrigidae. - Christiania VidenskabsselskabsForhandlineer 1881, No. 3:1-38. (In Norwegian.An unabridged English version was given byShufeldt 1901a, who also added some notes.)
Craighead, J. J. and Craighead, F. C. Jr. 1956. Hawks,Owls, and Wildlife. - Stackpole Company andWildlife Management Institute. Reprinted 1969by Dover Publications, New York.
Darwin, C. 1871. The Descent of Man and Selection in
Relation to Sex. - John Murray. London.Dawkins, R. 1976. The Selfish Gene. - Oxford
University Press, Oxford.Earhart, C. M. and Johnson, N. K. 1970. Size
dimorphism and food habits of North Americanowls. - Condor 72:251-264.
Erlinge, S., Goransson, G., Hansson, L., Hogstedt, G.,
Liberg, O., Nilsson, I. N., Nilsson, T., vonSchantz, T., and Sylven, M. 1983. Predation as a
regulating factor on small rodent populations in
southern Sweden. - Oikos 40:36-52.
Fogden, M. 1973. Fishing owls, eagle owls and the
snowy owl. Ketupa, Scotopelia, Bubo, Nyctea. Pp.61-93 In: Burton, J. A. 1973. Owls of the World.
Their Evolution, Structure and Ecology. - PeterLowe. Eurobook Limited.
Ford, E. B. 1964. Ecological Genetics. - Methuen,London.
Forsman, E. D., Meslow, E. C, and Wight, H. M. 1984.
Distribution and biology of the spotted owl in
Oregon. - Wildlife Monographs No. 87.
Ginn, H. 1973. Little, pygmy and elf owls. Athene,Speotyto, Micratnene, Glaucidium, Aegolius,Pseudoscops. Pp. 164-185 In: Burton, J. A. 1973.
Owls of the World. Their Evolution, Structureand Ecology. - Peter Lowe. Eurobook Limited.
Goodfrey, W. E. 1967. Some winter aspects of the
treat gray owl. - Canadian Field-Naturalist1:99-101.
Graham, R. N. 1934. The silent flight of owls. -
Journal of the Royal Aeronautical Society38:837-843.
Gruschka, H. D., Borchers, I. U. and Coble, J. G. 1971.
Aerodynamic noise produced by a gliding owl. -
Nature 233:409-411.
Hagen, Y. 1952. Rovfuglene of Viltpleien. - GyldendalNorsk Forlag, Oslo. (In Norwegian)
Hansson, L. 1984. Predation as the factor causingextended low densities in microtine cycles. -
Oikos 43:255-256.
40
Hansson, L. and Henttonen, H. 1985. Gradients in
density variations of small rodents: the
importance of latitude and snow cover. -
Oecologia (Berlin) 67:394-402.
Hasbrouck, E. M. 1893. Evolution and dichromatismin the genus Megascops. - American Naturalist
27:638-649.
Hekstra, G. P. 1973. Scops and screech owls. Otus,
Lophostrix. Pp. 94-115 In: Burton, J. A. 1973. Owlsof the world. Their Evolution, Structure andEcology. - Peter Lowe. Eurobook Limited.
Henttonen, H. 1985. Predation causing extended lowdensities in microtine cycles: further evidencefrom shrew dynamics. - Oikos 45:156-157.
Hertel H. 1966. Structure, Form, Movement. -
Reinhold Publishing Corporation, New York.
Hilden, O. and Helo, P. 1981. The great grey owl Strix
nebulosa - a bird of the northern taiga. - OrnisFennica 58:159-166.
Hirschberger, W. 1967. HistologischeUntersuchungen an den primaren visuellenZentren des Eulengehirnes und der retinalen
Representation in ihnen. - Journal furOrnithologie 108:187-202. (In German.)
Hoglund, N. H. and Lansgren, E. 1968. The great greyowl and its prey in Sweden. - Viltrevy 5:364-421.
Hrubant, H. E. 1955. An analysis of the color phasesof the eastern screech owl, Otus asio, by the genefrequency method. - American Naturalist89:223-230.
Jagerskiold, L. A., Lonnberg, E., and Adlerz, G. 1903.
Sveriges Djurvarld. - Aftonbladet, Stockholm.(In Swedish.)
Jarvinen, A. 1985. Predation causing extended lowdensities in microtine cycles: implications frompredation on hole-nesting passerines. - Oikos
45:157-158.
Karten, H. J., Hodos, W., Nauta, W. J. and Revzin, A.M. 1973. Neural connections of the "visual
Wulst" of the avian telencephalon.Experimental studies in the pigeon (Columbalivia) and owl (Speotyto cunicularia). - Journal of
Comparative Neurology 150:253-278.
Knudsen, E. I. 1981. The hearing of the barn owl. -
Scientific American 245:113-125.
Knudsen, E. I. 1980. Sound localization in birds. Pp.289-322 In: Popper, A. N. and Fay, R. R. (eds).
Comparative Studies of Hearing in Vertebrates. -
Springer, New York.Knudsen, E. I., Blasdel, G. G., and Konishi, M. 1979.
Sound localization by the barn owl (Tyto alba)
measured with the search coil technique. -
Journal of Comparative Physiology 133:1-11.
Knudsen, E. I. and Konishi, M. 1978. A neural map of
auditory space in the owl. - Science 200:795-797.
Knudsen, E. I. and Konishi, M. 1979. Mechanisms ofsound localization in the barn owl (Tyto alba). -
Journal of Comparative Physiology 133:13-21.
Korpimaki, E. 1986. Reversea size dimorphism in
oirds of prey, especially in Tengmalm's owlAegolius funereus: a test of the "starvationhupothesis . - Ornis Scandinavica 17:326-332.
Korpimaki, E., Lagerstrom, M., and Saurola, P. 1987.
Field evidence for nomadism in Tengmalm'sowl Aegolius funereus. - Ornis Scandinavica18:1-4.
Krebs, C. J., Gaines, M. S., Keller, B. L., Myers, J. H.,and Tamarin, R. H. 1973. Population cycles in
small rodents. - Science 179:35-41.Lighthill, J. 1977. Introduction to the scaling of aerial
locomotion. Pp. 365-404 In: Pedley, T. J. (ed.) 1977.Scale Effects in Animal Locomotion. -
Academinc Press, London.Lofgren, O., Hornfeldt, B., and Carlsson, B.-G. 1986.
Site tenacity and nomadism in Tengmalm's owl(Aegolius funereus (L.)) in relation to cyclic foodproduction. - Oecologia (Berlin) 69:321-326.
Lundberg, A. 1979. Residency, migration and acompromise: adaptations to nest-site scarcity andfoocf specialization in three Fennoscandian owlspecies. - Oecologia 41:273-281.
Lundberg, A. 1980. Why are the ural owls Strixuralensis and the tawny owl S. aluco parapatricin Scandinavia? - Ornis Scandinavica 11:116-120.
Lundberg, A. 1986. Adaptive advantages of reversedsuxual size dimorphism in European owls. -
Ornis Scandinavica 17:133-140.Liiers, H. and Ulrich, H. 1959. Genetik und
Evolutionsforschung bei Tieren. Pp. 552-661 In:
Heberer, G. Die Evolution der Organismen.Ergebnisse und Probleme derAbstimmungslehre. - Gustav Fisher Verlag,Stuttgart. (In German.)
Magnus, O. 1555. Historia de GentibusSeptentrionalibus. - Rome. Swedish edition 1976:
Historia om de Nordiska Folken. - GidlundsForlag. (In Swedish.)
Martin, G. R. 1974. Color vision in the tawny owl(Strix aluco). - Journal of Comparative andPhysiological Psychology 86:133-141.
Martin, G. R. 1977. Absolute visual threshold andscotopic spectral sensitivity in the tawny owl,Strix aluco. - Nature 268:636-638.
Martin, G. R. 1986. Sensory capacities and thenocturnal habit of owls (Strigiformes). - Ibis
128:266-277.
Martin, N. D. 1950. Color phase investigations on thescreech owl in Ontario. - CanadianField-Naturalist 64:208-211.
Marshall, J. T. Jr. 1967. Parallel variation in Northand Middle American screech-owls. -
Monographs of the Western Foundation ofVertebrate Zoology, No. 1
.
Marshall, J. T. Jr. 1978. Systematics of smaller Asiannight birds based on voice. - OrnithologicalMonographs No. 25. The AmericanOrnithologists' Union.
Mayr, E. 1965. Animal Species and Evolution. -
Harward University Press, Cambridge.McGillivray, W. B. 1985. Size, sexual size
dimorphism, and their measurement in greathorned owls in Alberta. - Canadian Journal ofZoology 63:2364-2372.
Mikkola, H. 1983. Owls of Europe. - T. & A. D. Poyser,Calton.
Moreau, R. E. 1972. The Palearctic-African BirdMigration Systems. - Academic Press, London.
Mosher, J. A. end Henny, C. J. 1976. Thermaladaptiveness of plumage color in screech owls. -
Auk 93:614-619.Mueller, H. C. and Meyer, K. 1985. The evolution of
reversed sexual dimorphism in size; acomparaive analysis of the falconiformes of thewestern Palearctic. Pp. 65-101 In: Johnston, R. F.
(ed.). Current Ornithology. Vol. 2. - PlenumPress.
41
Mueller, H. C. 1986. The evolution of reversed sexualdimorphism in owls: an empirical analysis ofpossible selective factors. - Wilson Bulletin98:387-406.
Mysterud, I. 1970. Hypotheses concerningcharacteristics and causes of populationmovements in Tengmalm's owl (Aegoliusfunereus). - Nytt Magasin for Zoologi 18:49-74.
Mysterud, I. and Dunker, H. 1979. Mammal earmimicry: a hypothesis on the behaviouralfunction of owl "horns". - Animal Behaviour27:315-316.
Nero, R. W. 1980. The Great Gray Owl. Phantom of
the Northern Forest. - Smithsonian Institution
Press, Washington, D.C.Neuhaus, W., Bretting, H. and Schweizer, B. 1973.
Morphologische und funktionelleUntersuchungen iiber den "lautlosen" Flug derEulen (Strix aluco) im Vergleich zum Flug derEnten {Anas platyrhynchos). - BiologischesZentralblatt 92:495-512. (In German.)
Newton, I. 1979. Population Ecology of Raptors. - T. &A. D. Poyser, Berkhamsted.
Newton, I. 1986. The Sparrowhawk. - T. & A. D.Poyser, Calton.
Norberg, R. A. 1964. Studies on the ecology andethology of Tengmalm's owl (Aegoliusfunereus). - Var Fagelvarld 23:228-244. (In
Swedish, summary in English.)Norberg, R. A. 1968. Physical factors in directional
hearing in Aegolius funereus(Linne)(btrigiformes), with special reference tothe significance of the asymmetry of the externalears. - Arkiv for Zoologi 20:181-204.
Norberg, R. A. 1970. Hunting technique ofTengmalm's owl Aegolius funereus (L). - OrnisScandinavica 1:51-64.
Norberg, R. A. 1973. Directional hearing in man andin an owl with bilaterally asymmetrical externalears. - Swedish Natural Sciences. Yearbook of theSwedish Natural Science Research Council 1973,26: 89-101. - Stockholm. (In Swedish, summaryin English).
Norberg, R. A. 1977. Occurrence and independentevolution of bilateral ear asymmetry in owls andimplications on owl taxonomy. - PhilosophicalTransactions of the Royal Society of London. B.
280:375-408.
Norbere, R. A. 1978. Skull asymmetry, ear structureand function, and auditory localization inTengmalm's owl, Aegolius funereus (Linne). -
Philosophical Transactions or the Royal Societyof London. B. 282:325-410.
Norberg, R. A. 1981. Temporary weight decrease inbreeding birds may result in more fledged young.- The American Naturalist 118:838-850.
Norberg, R. A. In press. Theory of growth geometryin plants and self-thinning of plant populations;geometric similarity, elastic similarity, anddifferent growth modes of plant parts. - TheAmerican Naturalist.
Norberg, U. M. 1981. Flight, morphology and theecological niche in some birds and bats. Pp.173-197 In Day, M. H. (ed.) Vertebratelocomotion. Symposia of the Zooogical Societyof London No. 48. - Academic Press, London.
Norberg, U. M. 1985. Flying, gliding, and soaring. Pp.129-158 in Hildebrand, M., Bramble, D. M., Liem,
K. F., and Wake, D. B. (Eds) Functionalvertebrate morphology. - Harward UniversityPress, Cambridge, Massachusetts.
Norberg, U. M. and Rayner, J. M. V. 1987. Ecologicalmorphology and flight in bats (Mammalia;Chiroptera): Wing adaptations, flightperformance, foraging strategy and echolocation.- Philosophical Transactions of the Royal Society,of London. B. In press.
Norberg, U. M. and Norberg, R. A. In press.Ecomorphology of flight and tree-trunk climbingin birds. - Proceedings of the 19th InternationalOrnithological Congress, Ottawa, 1986.
Olsen, P. and Olsen, J. 1984. Book review: Cade, T. J.
1982. The Falcons of the World. CornellUniversity Press, Ithaca. - Australian WildlifeResearch 11:205-206.
Opdam, P. 1975. Inter- and intraspecificdifferentiation with respect to feeding ecology in
two sympatric species of the genus Accipiter. -
Ardea 63:30-54.
Payne, R. S. 1962. How the barn owl locates prey byhearing. - Living Bird 1:151-159
Payne, R. S. 1971. Acoustic location of prey by barnowls (Tyto alba). - Journal of ExperimentalBiology 54:535-573.
Penny, C. E. and Pruitt, W. O. Jr. 1984. Subniveanaccumulation of CO2 and its effects on winterdistributin of small mammals. Pp. 373-380 In:
Merritt, J. F. (ed.) Winter Ecology of SmallMammals. - Special publication of CarnegieMuseum of Natural History. No 10. Pittsburgh.
Perrone, M. Jr. 1981. Adaptive significance of ear tufts
in owls. - Condor 83:383-384.
Peters, J. L. 1940. Check-list of Birds of the World.Vol.4. - Harvard University Press, Cambridge.Reprinted 1964 by Museum of ComparativeZoology, Harvard University Press, Cambridge.
Peterson, R. T. 1961. A Field Guide to Western Birds.- Houghton Mifflin Company, Boston.
Pettierew, J. D. 1979. Binocular visual processing in
the owl's telencephalon. - Proceedings of theRoyal Society of London. B 204:435-454.
Pumphrey, R. J. 1948. The sense organs of birds. -
Annual Report of the Smithsonian Institution
1948:305-330.
Reynolds, R. T. 1972. Sexual size dimorphism in
Accipiter hawks: a new hypothesis. - Condor74:191-197.
Roberts, T. J. and King, B. 1986. Vocalizations of the
owls of the genus Otus in Pakistan. - OrnisScand. 17: 299-305.
Rosenberg, E. 1953. Faglar i Sverige. - Svensk Natur,Stockholm. (In Swedish.)
Safina, C. 1984. Selection for reduced male size in
raptorial birds: the possible roles of female chice
and mate guarding. - Oikos 43:159-164.
Scherzinger, W. 1983. Beobachtungen anWaldkauz-Habichtskauz-Hybriden (Strix aluco XStrix uralensis). - Zool. Garten N. F., Jena53:133-148. (In German.)
Schultze, M. 1867. Uber Stabchen und Zapfen derRetina. - Archiv fur mikroskopische Anatomieund Entwicklungsmechanik 3:215-247. (In
German.)Schwartzkopff, J. 1968. Structure and function of the
ear ana of the auditory brain areas in birds. Pp.41-63 In: DeReuck, A. V. S. and Knight, J. (eds).
42
Hearing Mechanisms in Vertebrates. A CibaFoundation Symposium. -
J. & A. Churchill,
London.Shufeldt, R. W. 1901a. Professor Collett on the
morphology of the cranium and the auricular
openings in the North-European species of the
family Strigidae. - Journal of Morphology17:119-176.
Shufeldt, R. W. 1901b. On the osteology of the Striges
(Strigidae and Bubonidae). - Proceedings of the
American Philosophical Society 39:665-722.
Sick, H. 1937. Morphologisch-FunktionelleUntersuchungen iiber die Feinstruktur derVogelfeder. - Journal fur Ornithologie 85:206-372.
(In German.)Snyder, N. F. R. and Wiley, J. W. 1976. Sexual size
dimorphism in hawks and owls of NorthAmerica. Ornithological Monographs No. 20. -
The American Ornithologists' Union.Sonerud, G. A. 1986. Effect of snow cover on seasonal
changes in diet, habitat, and regional distribution
of raptors that prey on small mammals in boreal
zones of Fennoscandia. - Holarctic Ecology9:33-47.
Sparks, J. and Soper, T. 1970. Owls. Their Natural andUnnatural History. - David & Charles. NewtonAbbot
Steinbach, M. J. and Money, V. E. 1973. Eyemovements of the owl. - Vision Research13:889-891.
Storer, R. W. 1966. Sexual dimorphism and foodhabits in three North American accipiters. - Auk83:423-436.
Streets, T. H. 1870. Remarks on the cranium of anowl. - Proceedings of the Academy of NaturalSciences of Philadelphia 1870:73.
Stresemann, E. 1934. Sauropsida: Aves. In: Handbuchder Zoologie (Kiickenthal and Krumbch, eds).Vol. 7/2. - Berlin, Leipzig. (In German.)
Svardson, G. 1949. Competition and habitat selectionin birds. - Oikos 1:157-174.
Thorpe, W. H. and Griffin, D. R. 1962. The lack ofultrasonic components in the flight noise ofowls compared with other birds. - Ibis104:256-257.
Tryon, C. A. 1943. The great grey owl as a predator onpocket gophers. - Wilson Bulletin 55: 130-131.
Walker, E. P. 1964. Mammals of the World. Vol. 1. -
The John Hopkins Press, Baltimore.Wallin, K. and Andersson, M. 1981. Adult
nomadism in Tengmalm's owl Aegoliusfunereus. - Ornis Scandinavica 12:125-126.
Walter, H. 1979. Eleonora's Falcon, Adaptations to
Prey and Habitat in a Social Raptor. - ChicagoUniversity Press, Chicago.
Wesslen, S. 1941. Da Rovdjuret Vakar. - Norstedts,Stockholm. (In Swedish.)
Williams, G. C. 1966. Adaptation and NaturalSelection. - Princeton University Press,Princeton.
43
A Second Chance for Owls (Banquet Address)1
Katherlne McKeever 2
The use of permanently damaged wild owls for captivebreeding, although difficult to implement, has great meritin providing intimate, continuous observations of how owlsuse space, avoid stress and form effective pair bonds whenmultiple choices are available. Surrogate parenting of wildorphans by human imprints is also examined.
The Owl Rehabilitation Research Foundation is
situated on the west bank of the Jordan River Estu-ary, two miles south of Lake Ontario, twenty mileswest of Niagara Falls in Ontario Canada. Of theeight acres (3.25 hectares) owned by the Foundation,six acres are on level ground 100 feet (31 metres)above the estuary and two acres slope to the valleyfloor. This slope supports a remnant Carolinian woodlot of mature Red and White Oak, Hickory, White Pine,
Walnut, Dogwood and Tulip Magnolia.
Incorporated as a registered charitable Foun-dation in 1975, the organization really began a dec-ade earlier as a reception and rehabilitation centrefor injured raptorial birds. In the years since, theemphasis first shifted to admission of owls exclu-sively and then to consideration of the wasted po-tential in those owls with injuries which precludedrelease but not restoration of health.
Although the returning ability to function in
release is still rewarded with freedom, those owlsfor which freedom can never be an option are asses-sed very critically for their potential in a captivebreeding program. Obviously, there is little purposein retaining members of naturally abundant speciesfor further proliferation in such a program, butthe Foundation houses several pairs of the mostcommonly encountered owls as foster parents for in-
coming orphaned young of these species.
However, permanently damaged members of natur-ally rare or diminishing species are the prime can-didates for a captive breeding program. Much of the
available land and income of the Foundation is in-
volved in this endeavour. Currently, there are 54
Baper presented at the symposium. Biology & Conservation
of Northern Forest Owls, Feb.3-7, 1987, Winnipeg, Manitoba. USDA
Forest Service General Technical Report EM-142.
2Dr. Katherine McKeever, Director, The Owl
Rehabilitation Research Foundation, R.R.#1 Vine-
land Station, Ontario, Canada. LOR 2EO
outdoor compounds, ranging from 200 to 3,500 squarefeet each (18.58 to 325.15 square metres), the aver-age being 600 to 900 square feet (55.74 to 83.61square metres). The 41 largest of these are doubterterritory breeding compounds and 13 are holding andrelease-training areas. The breeding units presentlyhouse 86 permanently damaged residents, representingthe 15 Canadian species. To date, 9 of these specieshave successfully bred on the premises, with infer-tile eggs following attempted copulation from 3 more,
(table 1)
Although the fact of these owls having achievedindependence in the wild before being injured ob-viously renders them the most unlikely and difficultprospect for captive breeding (not to mention the
Table 1. — Owl species native to Canada, all of
which are represented at the Owl Rehabilita-
tion Research Foundation.
Common name Genus and Species Resident
American Barn Owl* Tyto alba 2
Screech Owl * Otus asio 9
Flammulated Owl Otus flammeolus 5
Great Horned Owl* Bubo virginianus 6
Snowy Owl* Nyctea scandiaca 7
Northern Hawk Owl Surnia ulula 6
Northern Pygmy Owl* Glaucidium gnoma 7
Spotted Owl Strix occidentalis 2
Barred Owl Strix varia 6
Great Grey Owl* Strix nebulosa 7
Long Eared Owl Asio otus 2
Short Eared Owl Asio flammeus 5
Boreal Owl* Aegolius funereus 6
Saw-whet Owl* Aegolius acadicus 8
Burrowing Owl* Athene cunicularia 8
Species which have produced offspring.+ Species which have produced eggs only.
44
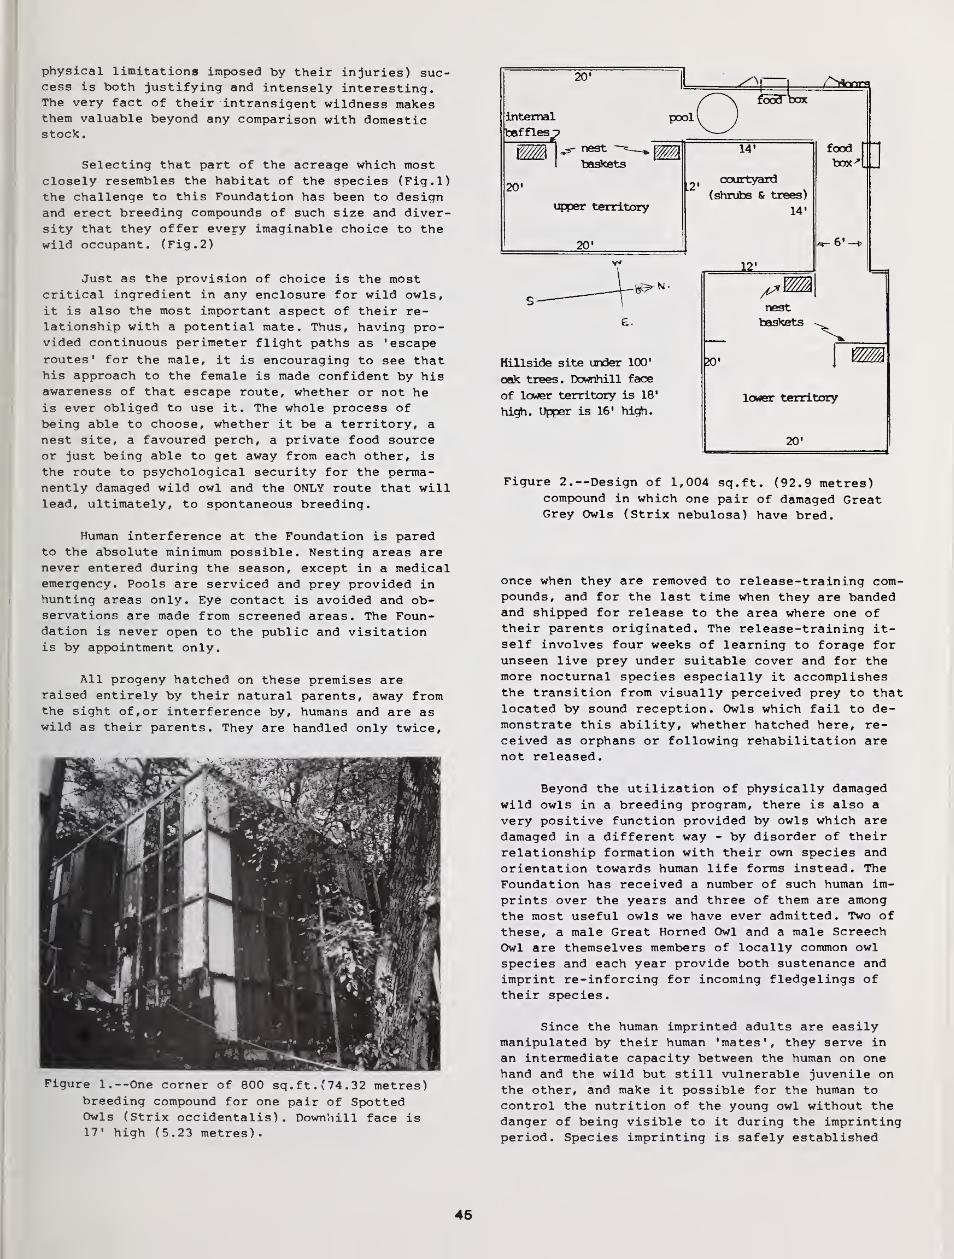
physical limitations imposed by their injuries) suc-cess is both justifying and intensely interesting.The very fact of their intransigent wildness makesthem valuable beyond any comparison with domesticstock.
Selecting that part of the acreage which mostclosely resembles the habitat of the species (Fig.l)
the challenge to this Foundation has been to designand erect breeding compounds of such size and diver-sity that they offer every imaginable choice to thewild occupant. (Fig. 2)
Just as the provision of choice is the mostcritical ingredient in any enclosure for wild owls,
it is also the most important aspect of their re-lationship with a potential mate. Thus, having pro-vided continuous perimeter flight paths as 'escape
routes* for the male, it is encouraging to see thathis approach to the female is made confident by hisawareness of that escape route, whether or not heis ever obliged to use it. The whole process ofbeing able to choose, whether it be a territory, a
nest site, a favoured perch, a private food sourceor just being able to get away from each other, is
the route to psychological security for the perma-nently damaged wild owl and the ONLY route that willlead, ultimately, to spontaneous breeding.
Human interference at the Foundation is paredto the absolute minimum possible. Nesting areas arenever entered during the season, except in a medicalemergency. Pools are serviced and prey provided inhunting areas only. Eye contact is avoided and ob-servations are made from screened areas. The Foun-dation is never open to the public and visitationis by appointment only.
All progeny hatched on these premises areraised entirely by their natural parents, away fromthe sight of, or interference by, humans and are aswild as their parents. They are handled only twice.
Figure 1.—One corner of 800 sq.ft. (74.32 metres)breeding compound for one pair of SpottedOwls (Strix occidentalis) . Downhill face is17' high (5.23 metres).
internal
baffles^?
20'
pool
a;food"
20' L2'
upper territory
20'
£.
Hillside site under 100'
oak trees. Downhill face
of lower territory is 18'
high. Upper is 16' high.
14'
courtyard
(shrubs & trees)
14'
12'
food Mboxn J
20'
nest
baskets
lower territory
20'
1
Figure 2.—Design of 1,004 sq.ft. (92.9 metres)compound in which one pair of damaged GreatGrey Owls (Strix nebulosa) have bred.
once when they are removed to release-training com-pounds, and for the last time when they are bandedand shipped for release to the area where one oftheir parents originated. The release-training it-self involves four weeks of learning to forage forunseen live prey under suitable cover and for themore nocturnal species especially it accomplishesthe transition from visually perceived prey to thatlocated by sound reception. Owls which fail to de-monstrate this ability, whether hatched here, re-ceived as orphans or following rehabilitation arenot released.
Beyond the utilization of physically damagedwild owls in a breeding program, there is also a
very positive function provided by owls which are
damaged in a different way - by disorder of theirrelationship formation with their own species and
orientation towards human life forms instead. The
Foundation has received a number of such human im-
prints over the years and three of them are amongthe most useful owls we have ever admitted. Two of
these, a male Great Horned Owl and a male ScreechOwl are themselves members of locally common owl
species and each year provide both sustenance andimprint re-inforcing for incoming fledgelings of
their species.
Since the human imprinted adults are easilymanipulated by their human 'mates', they serve in
an intermediate capacity between the human on onehand and the wild but still vulnerable juvenile onthe other, and make it possible for the human tocontrol the nutrition of the young owl without thedanger of being visible to it during the imprintingperiod. Species imprinting is safely established
45
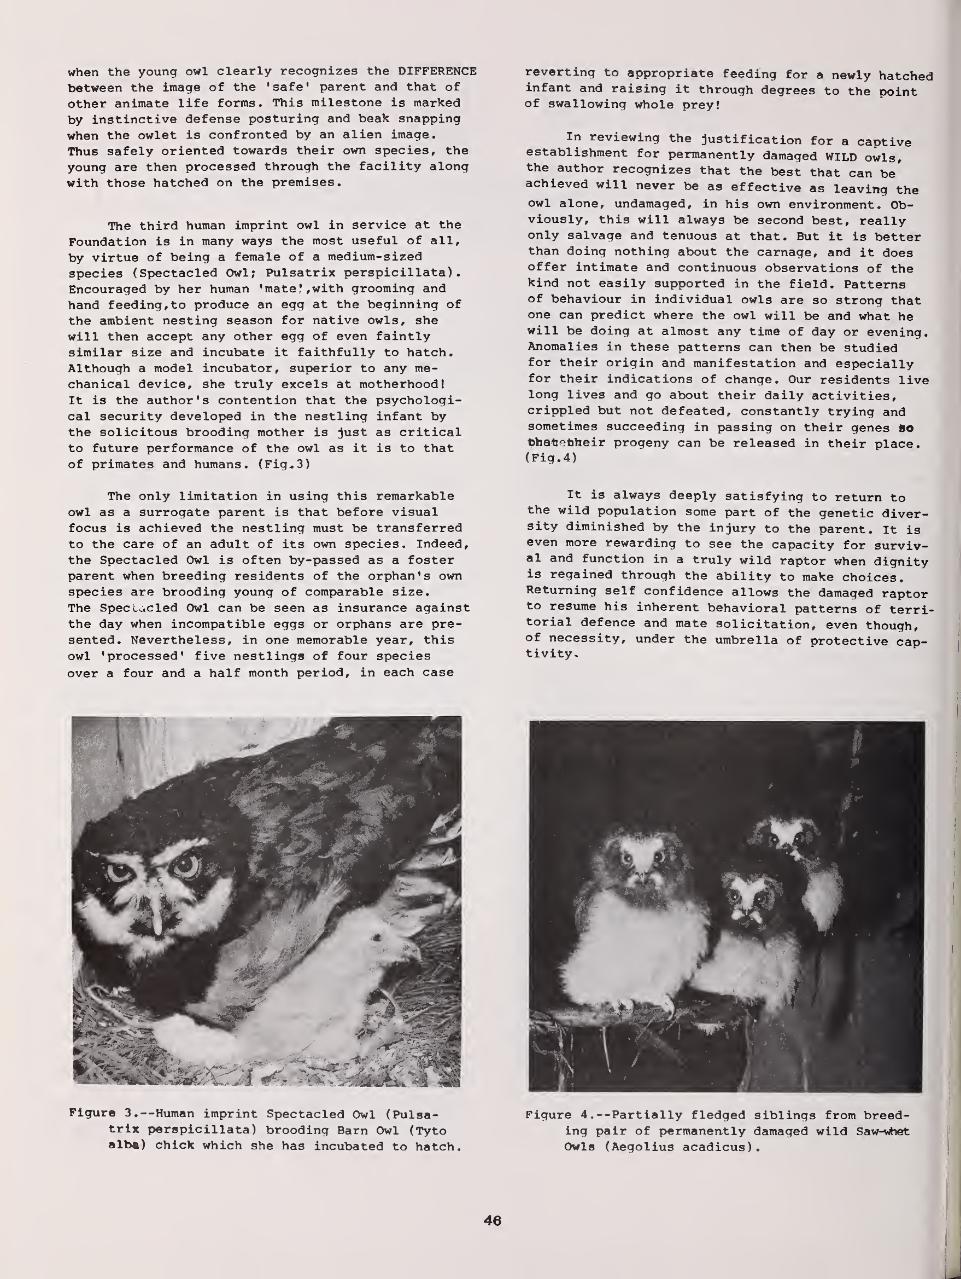
when the young owl clearly recognizes the DIFFERENCEbetween the image of the 'safe' parent and that of
other animate life forms. This milestone is marked
by instinctive defense posturing and beak snapping
when the owlet is confronted by an alien image.
Thus safely oriented towards their own species, the
young are then processed through the facility alongwith those hatched on the premises.
The third human imprint owl in service at the
Foundation is in many ways the most useful of all,
by virtue of being a female of a medium-sized
species (Spectacled Owl; Pulsatrix perspicillata)
.
Encouraged by her human 'mate J, with grooming and
hand feeding, to produce an egg at the beginning of
the ambient nesting season for native owls, shewill then accept any other egg of even faintlysimilar size and incubate it faithfully to hatch.Although a model incubator, superior to any me-chanical device, she truly excels at motherhood!It is the author's contention that the psychologi-cal security developed in the nestling infant bythe solicitous brooding mother is just as criticalto future performance of the owl as it is to thatof primates and humans. (Fig.,3)
The only limitation in using this remarkableowl as a surrogate parent is that before visualfocus is achieved the nestling must be transferredto the care of an adult of its own species. Indeed,
the Spectacled Owl is often by-passed as a fosterparent when breeding residents of the orphan's ownspecies are brooding young of comparable size.
The Spectacled Owl can be seen as insurance againstthe day when incompatible eggs or orphans are pre-sented. Nevertheless, in one memorable year, thisowl 'processed' five nestlings of four species
over a four and a half month period, in each case
Figure 3.—Human imprint Spectacled Owl (Pulsa-trix perspicillata) brooding Barn Owl (Tytoalba) chick which she has incubated to hatch.
reverting to appropriate feeding for a newly hatchedinfant and raising it through degrees to the pointof swallowing whole prey!
In reviewing the justification for a captiveestablishment for permanently damaged WILD owls,the author recognizes that the best that can be'achieved will never be as effective as leaving theowl alone, undamaged, in his own environment. Ob-viously, this will always be second best, reallyonly salvage and tenuous at that. But it is betterthan doing nothing about the carnage, and it doesoffer intimate and continuous observations of thekind not easily supported in the field. Patternsof behaviour in individual owls are so strong thatone can predict where the owl will be and what hewill be doing at almost any time of day or evening.Anomalies in these patterns can then be studiedfor their origin and manifestation and especiallyfor their indications of change. Our residents livelong lives and go about their daily activities,crippled but not defeated, constantly trying andsometimes succeeding in passing on their genes sot>ha*jetheir progeny can be released in their place.(Fig. 4)
It is always deeply satisfying to return tothe wild population some part of the genetic diver-sity diminished by the injury to the parent. It iseven more rewarding to see the capacity for surviv-al and function in a truly wild raptor when dignityis regained through the ability to make choices.Returning self confidence allows the damaged raptorto resume his inherent behavioral patterns of terri-torial defence and mate solicitation, even though,of necessity, under the umbrella of protective cap-tivity.
Figure 4.—Partially fledged siblings from breed-ing pair of permanently damaged wild Saw-whet
Owls (Aegolius acadicus).
46
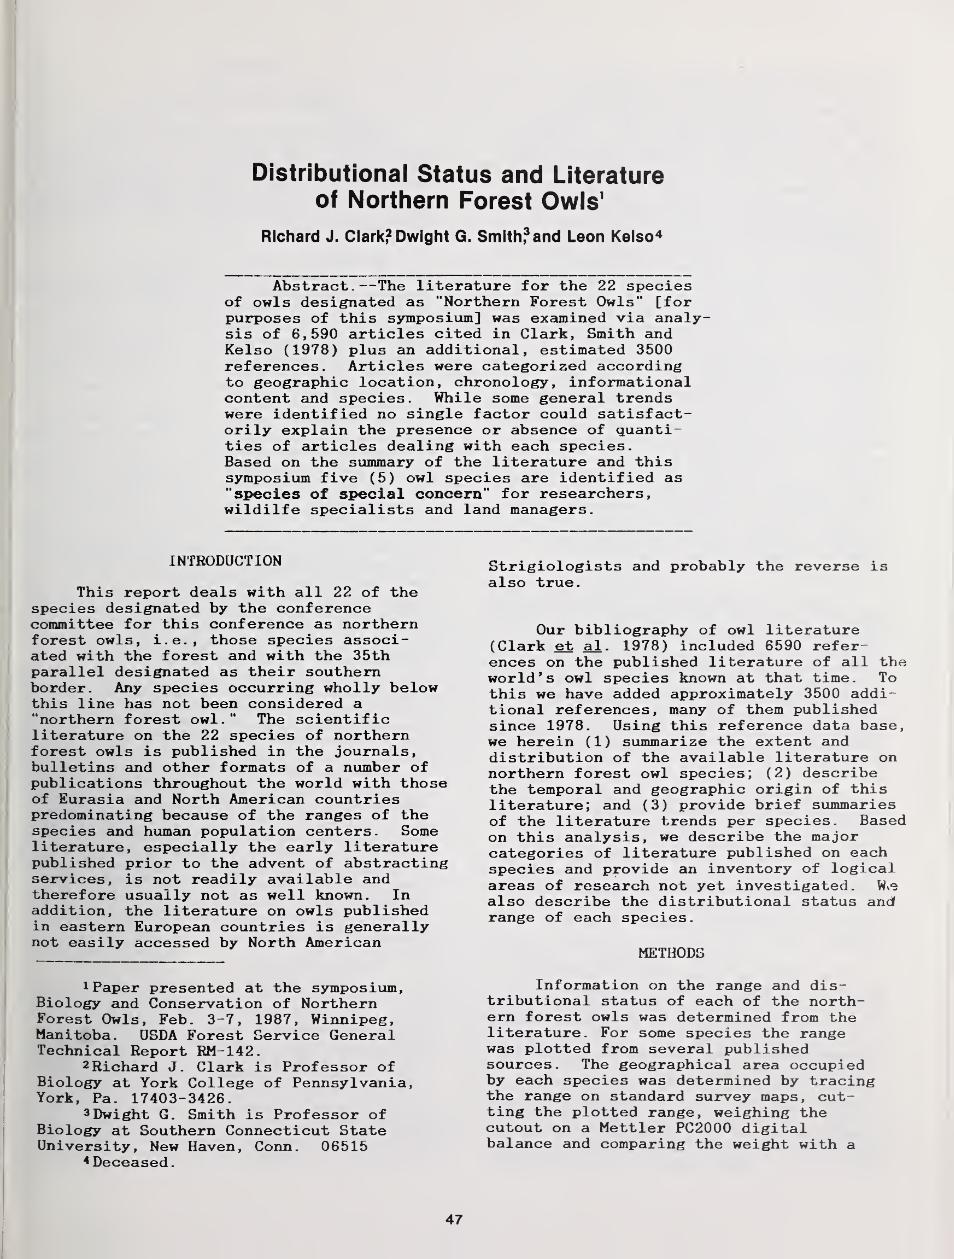
Distributional Status and Literatureof Northern Forest Owls 1
Richard J. Clark? Dwlght G. Smith,3 and Leon Kelso4
Abstract.—The literature for the 22 speciesof owls designated as "Northern Forest Owls" [forpurposes of this symposium] was examined via analy-sis of 6,590 articles cited in Clark, Smith andKelso (1978) plus an additional, estimated 3500references. Articles were categorized accordingto geographic location, chronology, informationalcontent and species. While some general trendswere identified no single factor could satisfact-orily explain the presence or absence of quanti-ties of articles dealing with each species.Based on the summary of the literature and thissymposium five (5) owl species are identified as"species of special concern" for researchers,wildilfe specialists and land managers.
INTRODUCTION
This report deals with all 22 of thespecies designated by the conferencecommittee for this conference as northernforest owls, i.e., those species associ-ated with the forest and with the 35thparallel designated as their southernborder. Any species occurring wholly belowthis line has not been considered a"northern forest owl." The scientificliterature on the 22 species of northernforest owls is published in the journals,bulletins and other formats of a number ofpublications throughout the world with thoseof Eurasia and North American countriespredominating because of the ranges of thespecies and human population centers. Someliterature, especially the early literaturepublished prior to the advent of abstractingservices, is not readily available andtherefore usually not as well known. Inaddition, the literature on owls publishedin eastern European countries is generallynot easily accessed by North American
1 Paper presented at the symposium,Biology and Conservation of NorthernForest Owls, Feb. 3-7, 1987, Winnipeg,Manitoba. USDA Forest Service GeneralTechnical Report RM-142.
2 Richard J. Clark is Professor ofBiology at York College of Pennsylvania,York, Pa. 17403-3426.
3 Dwight G. Smith is Professor ofBiology at Southern Connecticut StateUniversity, New Haven, Conn. 06515
4 Deceased
.
Strigiologists and probably the reverse isalso true.
Our bibliography of owl literature(Clark et al. 1978) included 6590 refer-ences on the published literature of all theworld's owl species known at that time. Tothis we have added approximately 3500 addi-tional references, many of them publishedsince 1978. Using this reference data base,we herein (1) summarize the extent anddistribution of the available literature onnorthern forest owl species; (2) describethe temporal and geographic origin of thisliterature; and (3) provide brief summariesof the literature trends per species. Basedon this analysis, we describe the majorcategories of literature published on eachspecies and provide an inventory of logicalareas of research not yet investigated. Wve
also describe the distributional status andrange of each species.
METHODS
Information on the range and dis-tributional status of each of the north-ern forest owls was determined from theliterature. For some species the rangewas plotted from several publishedsources . The geographical area occupiedby each species was determined by tracingthe range on standard survey maps, cut-ting the plotted range, weighing thecutout on a Mettler PC2000 digitalbalance and comparing the weight with a
47
known area/weight ratio. Resultsprovided a basis for the comparison ofthe areal coverage of each northernforest owl species range. This methoddoes not, of course, take into consider-ation the fact that not all areas withinthe boundaries delimited on such a mapwill possess suitable habitat for thatparticular species. The results are thusonly rough approximations of extent ofgeographic distribution. Information onthe literature of each owl species wasdetermined using methods described inClark et al. (1978). Briefly, we ex-tracted the references using computersearch services [such as the suitabledata bases within Lockheed's DIALOG],checking abstracting publicationsincluding Zoological Record andBiological Abstracts and searchingjournals issue by issue. Most of theestimated 3500 new references wereobtained from this source with manyhaving been obtained by authors or re-searchers having sent the senior authorlistings of references not listed inClark et al. (1978). Data obtained foreach reference included authorship, dateof publication, journal or other pub-lication format, topics covered and geo-graphic locale of the observation orinvestigation
.
Topic coverage [which we have termed"ASPECT"] of each article was assigned asone or more of eight broad categories:"ecology", "behavior", "distribution","taxonomy", "physiology", "anatomy","conservation" and "general". Many arti-cles included information which wasassigned to several categories. The"general" category was limited to arti-cles which were primarily intended for anonscientific audience.
Each article was also assigned anappropriate code indicating theGEOGRAPHIC LOCATION for the report.There were 112 listings with Australia,Canada and the United States being brokendown into states or provinces. This wasdone because the literature from thoseareas tended to be more recent and thepolitical boundaries somewhat morestable.
In addition each article was alsoassigned an appropriate code indicatingthe Genera or Genus for the report. Thereis a considerable problem with this becauseof difficulties associated with the dynamicsof nomenclature and changes in taxonomyresulting from new knowledge of thetaxonomic relationships of owl species . Oneexample should suffice to reveal the natureof these problems, e.g., our table entitled"Common names of owls in selected foreignlanguages," lists 39 common names for Otusscops and 41 common names for Strix aluco .
RESULTS
Distribution and Status
General works which describe thedistribution and ecology of owls, includingthe northern forest owls is presented inBurton (1973) and Grossman and Hamlet(1966). The owls of Europe are described ingreater detail by Mikkola (1983) and of Asiaby Dement' ev et al. (1966).
A summary of the distribution,ecological habitat and status of the 22species of northern forest owls is presentedin Table 1. The Long-eared Owl, Hawk Owl,Great Gray Owl and Boreal Owl are holarctic,occurring in both new and old world hemi-spheres. Of these, the Long-eared Owl isthe most wide-ranging and encompasses thelargest geographical area of any species ofnorthern forest owl. The Great Gray Owl,Boreal Owl and Hawk Owl may more correctlybe classed as circumboreal since they occupyconiferous forest habitat and its succes-sional stages, except during their southwardincursions. Although more restricted indistribution, the Eagle Owl, Great HornedOwl and Scops Owl also have a wide arealrange coverage. All three may be consideredhabitat generalists. The Eagle Owl occursin a wide variety of habitats in Europe,Asia and Africa while its new world kin, theGreat Horned Owl, occupies deciduous, conif-erous, mixed and riparian woodlands, desertscrub, and other habitats in North, Centraland South America. The Saw-whet Owl issomething of an exception to the rule thatan owl must be a generalist to have a largeareal range coverage. Being a wide-rangingspecies in North America, it occurs mostlyin conifer or mixed woodland. This specieshas a comparatively small home range and canapparently take advantage of small stands ofconifers that occur as natural successionalstages throughout much of North America.Conversely, several species have comparat-ively small ranges, including the SpottedOwl , Flammulated Owl and Western ScreechOwl, all occurring in western North America.Of these, the Spotted Owl apparentlyrequires large tracts of relativelyundisturbed woodland or forest while theFlammulated Owl occurs mainly in montanedeciduous woodland.
Literature Synopsis
The literature on northern forestowls includes a minimum of 3800references which comprises approximately38% of our accumulated references onowls. These represent studies andreports from virtually every Eurasian andNorth American country. Geographically,approximately 52% of these references arefrom North American sources and 48% fromEurasian, principally European sources.
48
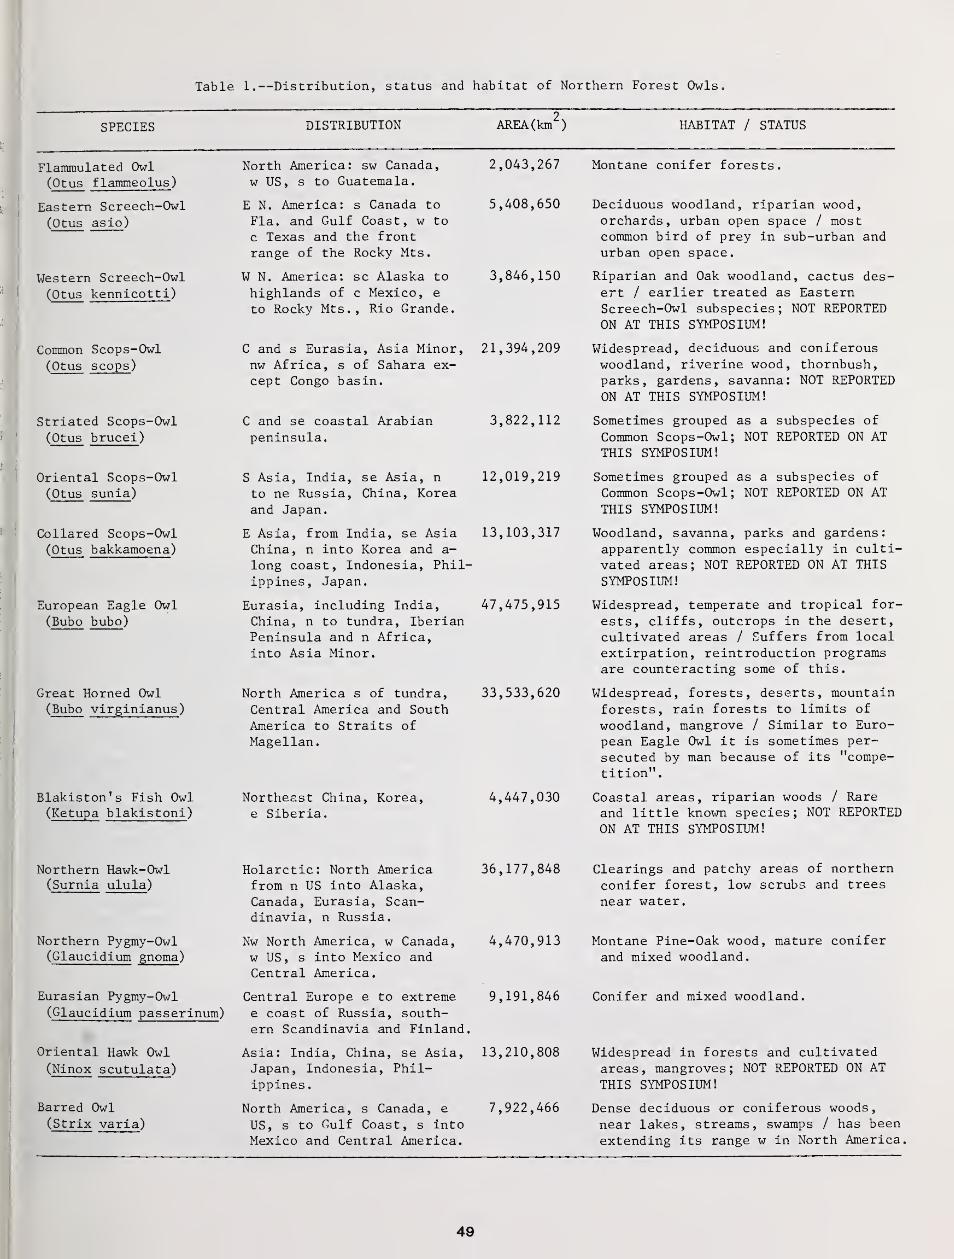
Table 1.—Distribution, status and habitat of Northern Forest Owls.
SPECIES DISTRIBUTION AREA (km ) HABITAT / STATUS
Flammulated Owl(Otus flammeolus )
Eastern Screech-Owl(Otus asio)
Western Screech-Owl
(Otus kennicotti)
Common Scops-Owl
(Otus scops)
Striated Scops-Owl
(Otus brucei )
Oriental Scops-Owl
(Otus sunia )
Collared Scops-Owl(Otus bakkamoena)
European Eagle Owl(Bubo bubo)
Great Horned Owl(Bubo virginianus)
North America: sw Canada, 2,043,267w US, s to Guatemala.
E N. America: s Canada to 5,408,650Fla. and Gulf Coast, w to
c Texas and the front
range of the Rocky Mts.
W N. America: sc Alaska to 3,846,150highlands of c Mexico, e
to Rocky Mts., Rio Grande.
C and s Eurasia, Asia Minor, 21,394,209nw Africa, s of Sahara ex-cept Congo basin.
C and se coastal Arabian 3,822,112peninsula.
S Asia, India, se Asia, n 12,019,219to ne Russia, China, Koreaand Japan.
Montane conifer forests.
Deciduous woodland, riparian wood,orchards, urban open space / mostcommon bird of prey in sub-urban andurban open space.
Riparian and Oak woodland, cactus des-ert / earlier treated as EasternScreech-Owl subspecies; NOT REPORTEDON AT THIS SYMPOSIUM!
Widespread, deciduous and coniferouswoodland, riverine wood, thornbush,parks, gardens, savanna: NOT REPORTEDON AT THIS SYMPOSIUM!
Sometimes grouped as a subspecies of
Common Scops-Owl; NOT REPORTED ON ATTHIS SYMPOSIUM!
Sometimes grouped as a subspecies of
Common Scops-Owl; NOT REPORTED ON AT
THIS SYMPOSIUM!
E Asia, from India, se Asia 13,103,317 Woodland, savanna, parks and gardens
Blakiston's Fish Owl(Ketupa blakistoni )
China, n into Korea and a-
long coast, Indonesia, Phil-ippines, Japan.
Eurasia, including India, 47,475,915China, n to tundra, IberianPeninsula and n Africa,into Asia Minor.
North America s of tundra, 33,533,620Central America and SouthAmerica to Straits ofMagellan.
Northeast China, Korea, 4,447,030e Siberia.
apparently common especially in culti-vated areas; NOT REPORTED ON AT THIS
SYMPOSIUM!
Widespread, temperate and tropical for-
ests, cliffs, outcrops in the desert,cultivated areas / Suffers from localextirpation, reintroduction programsare counteracting some of this.
Widespread, forests, deserts, mountainforests, rain forests to limits of
woodland, mangrove / Similar to Euro-
pean Eagle Owl it is sometimes per-
secuted by man because of its "compe-
tition".
Coastal areas, riparian woods / Rareand little known species; NOT REPORTED
ON AT THIS SYMPOSIUM!
Northern Hawk-Owl(Surnia ulula)
Northern Pygmy-Owl(Glaucidium gnoma )
Eurasian Pygmy-Owl
(Glaucidium passerinum)
Oriental Hawk Owl(Ninox scutulata )
Barred Owl(Strix varia)
Holarctic: North America 36,177,848from n US into Alaska,Canada, Eurasia, Scan-dinavia, n Russia.
Nw North America, w Canada, 4,470,913w US , s into Mexico andCentral America.
Central Europe e to extremee coast of Russia, south-ern Scandinavia and Finland.
Asia: India, China, se Asia, 13,210,808Japan, Indonesia, Phil-ippines .
North America, s Canada, e 7,922,466US, s to Gulf Coast, s intoMexico and Central America.
Clearings and patchy areas of northern
conifer forest, low scrubs and trees
near water.
Montane Pine-Oak wood, mature coniferand mixed woodland.
9,191,846 Conifer and mixed woodland.
Widespread in forests and cultivatedareas, mangroves; NOT REPORTED ON AT
THIS SYMPOSIUM!
Dense deciduous or coniferous woods,
near lakes, streams, swamps / has been
extending its range w in North America.
49
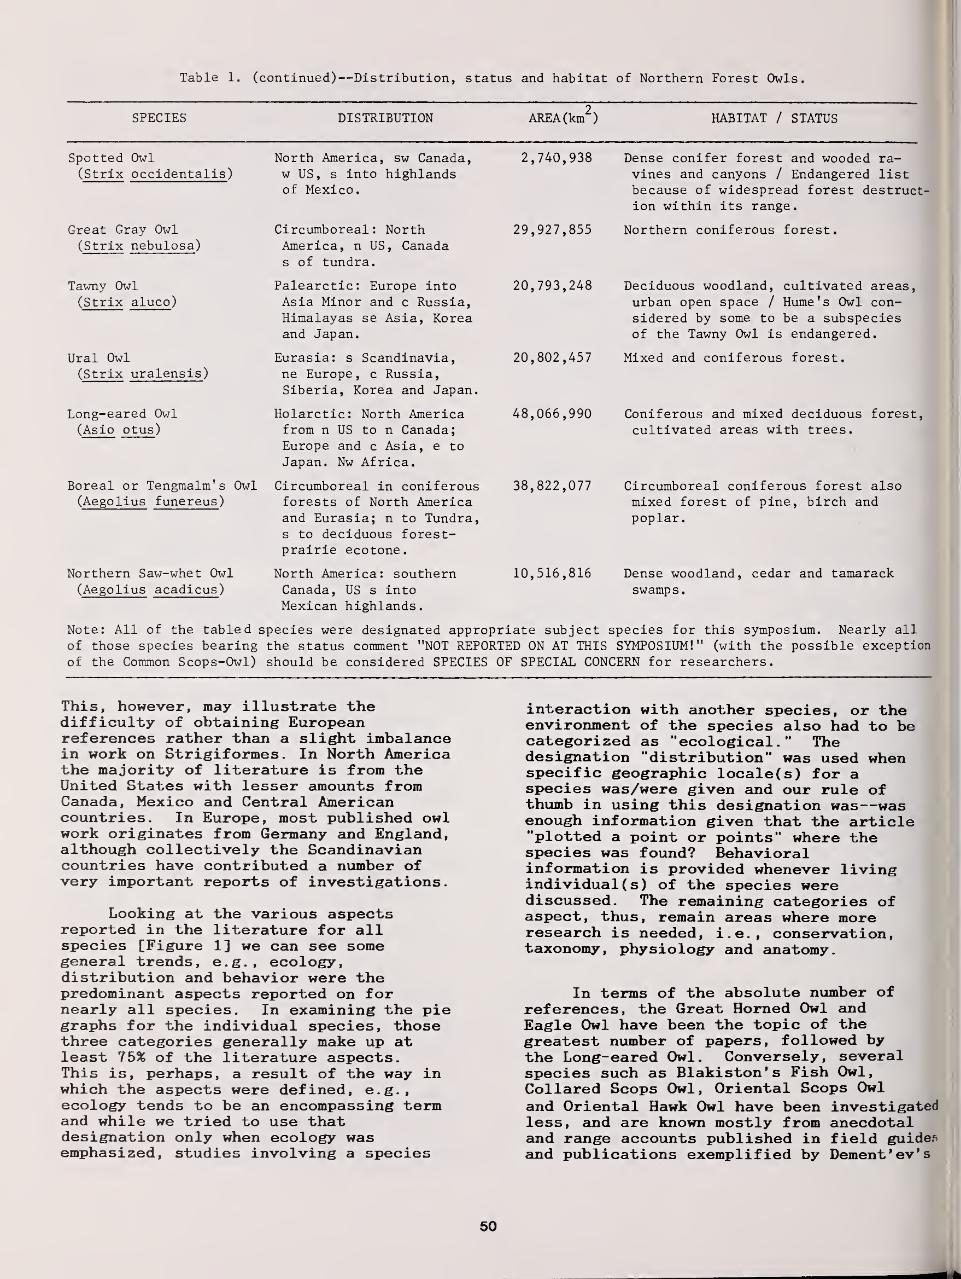
Table 1. (continued)—Distribution, status and habitat of Northern Forest Owls.
SPECIES DISTRIBUTION AREA (km ) HABITAT / STATUS
Spotted Owl(Strix occidentalis)
Great Gray Owl
(Strix nebulosa )
Tawny Owl
(Strix aluco)
Ural Owl
(Strix uralensis )
Long-eared Owl(Asio otus)
Boreal or Tengmalm's Owl(Aegolius funereus)
Northern Saw-whet Owl(Aegolius acadicus)
North America, sw Canada, 2,740,938w US, s into highlandsof Mexico.
Dense conifer forest and wooded ra-vines and canyons / Endangered listbecause of widespread forest destruct-ion within its range.
Circumboreal : NorthAmerica, n US, Canadas of tundra.
Palearctic: Europe into 20,793,248Asia Minor and c Russia,Himalayas se Asia, Koreaand Japan.
Eurasia: s Scandinavia,ne Europe, c Russia,Siberia, Korea and Japan.
Holarctic: North America 48,066,990from n US to n Canada;Europe and c Asia, e to
Japan. Nw Africa.
Circumboreal in coniferous 38,822,077forests of North Americaand Eurasia; n to Tundra,s to deciduous forest-prairie ecotone.
North America: southern 10,516,816Canada, US s intoMexican highlands.
29,927,855 Northern coniferous forest.
Deciduous woodland, cultivated areas,urban open space / Hume's Owl con-sidered by some to be a subspeciesof the Tawny Owl is endangered.
20,802,457 Mixed and coniferous forest.
Coniferous and mixed deciduous forest,
cultivated areas with trees.
Circumboreal coniferous forest alsomixed forest of pine, birch andpoplar.
Dense woodland, cedar and tamarackswamps
.
Note: All of the tabled species were designated appropriate subject species for this symposium. Nearly all
of those species bearing the status comment "NOT REPORTED ON AT THIS SYMPOSIUM!" (with the possible exceptionof the Common Scops-Owl) should be considered SPECIES OF SPECIAL CONCERN for researchers.
This, however, may illustrate thedifficulty of obtaining Europeanreferences rather than a slight imbalancein work on Strigiformes . In North Americathe majority of literature is from theUnited States with lesser amounts fromCanada, Mexico and Central Americancountries. In Europe, most published owlwork originates from Germany and England,although collectively the Scandinaviancountries have contributed a number ofvery important reports of investigations.
Looking at the various aspectsreported in the literature for allspecies [Figure 1] we can see somegeneral trends, e.g., ecology,distribution and behavior were thepredominant aspects reported on fornearly all species. In examining the piegraphs for the individual species, thosethree categories generally make up atleast 75% of the literature aspects.This is, perhaps, a result of the way inwhich the aspects were defined, e.g.,ecology tends to be an encompassing termand while we tried to use thatdesignation only when ecology wasemphasized, studies involving a species
interaction with another species, or theenvironment of the species also had to becategorized as "ecological." Thedesignation "distribution" was used whenspecific geographic locale(s) for aspecies was/were given and our rule ofthumb in using this designation was—wasenough information given that the article"plotted a point or points" where thespecies was found? Behavioralinformation is provided whenever livingindividual ( s ) of the species werediscussed. The remaining categories ofaspect, thus, remain areas where moreresearch is needed, i.e., conservation,taxonomy, physiology and anatomy.
In terms of the absolute number ofreferences, the Great Horned Owl andEagle Owl have been the topic of thegreatest number of papers, followed bythe Long-eared Owl. Conversely, severalspecies such as Blakiston's Fish Owl,Collared Scops Owl, Oriental Scops Owland Oriental Hawk Owl have been investigatedless, and are known mostly from anecdotaland range accounts published in field guidesand publications exemplified by Dement* ev's
50
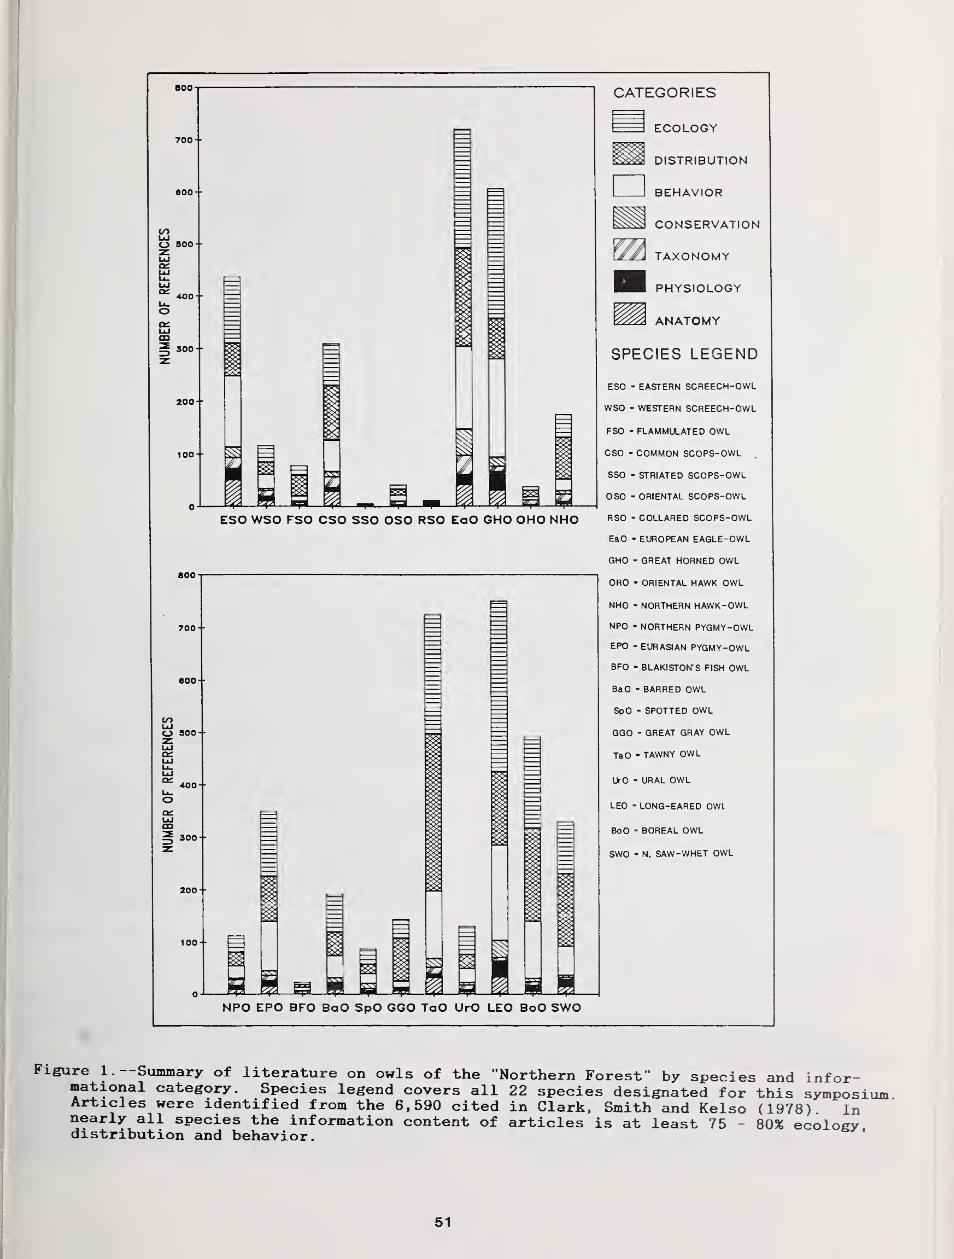
800 CATEGORIES
ESO WSO FSO CSO SSO OSO RSO EaO GHO OHO NHO
800-
700 -
600--
UJo soo -
400--
oUJm
300 -
-
200 -
-
100--
ECOLOGY
DISTRIBUTION
BEHAVIOR
CONSERVATION
A TAXONOMY
PHYSIOLOGY
ANATOMY
SPECIES LEGEND
ESO - EASTERN SCREECH-OWL
WSO - WESTERN SCREECH-OWL
FSO - FLAMMULATED OWL
CSO - COMMON SCOPS-OWL
SSO - STRIATED SCOPS-OWL
OSO - ORIENTAL SCOPS-OWL
RSO - COLLARED SCOPS-OWL
EaO - EUROPEAN EAGLE-OWL
GHO - GREAT HORNED OWL
0R0 - ORIENTAL HAWK OWL
NHO - NORTHERN HAWK-OWL
NPO - NORTHERN PYGMY-OWL
EPO - EURASIAN PYGMY-OWL
BFO - BLAKISTONTS FISH OWL
BaO - BARRED OWL
SpO - SPOTTED OWL
GGO - GREAT GRAY OWL
TaO - TAWNY OWL
UrO - URAL OWL
LEO - LONG-EARED OWl
BoO - BOREAL OWL
SWO - N. SAW-WHET OWL
NPO EPO BFO BaO SpO GGO TaO UrO LEO BoO SWO
Figure 1.—Summary of literature on owls of the "Northern Forest" by species and infor-mational category. Species legend covers all 22 species designated for this symposiArticles were identified from the 6,590 cited in Clark, Smith and Kelso (1978). Innearly all species the information content of articles is at least 75 - 80% ecologydistribution and behavior.
51
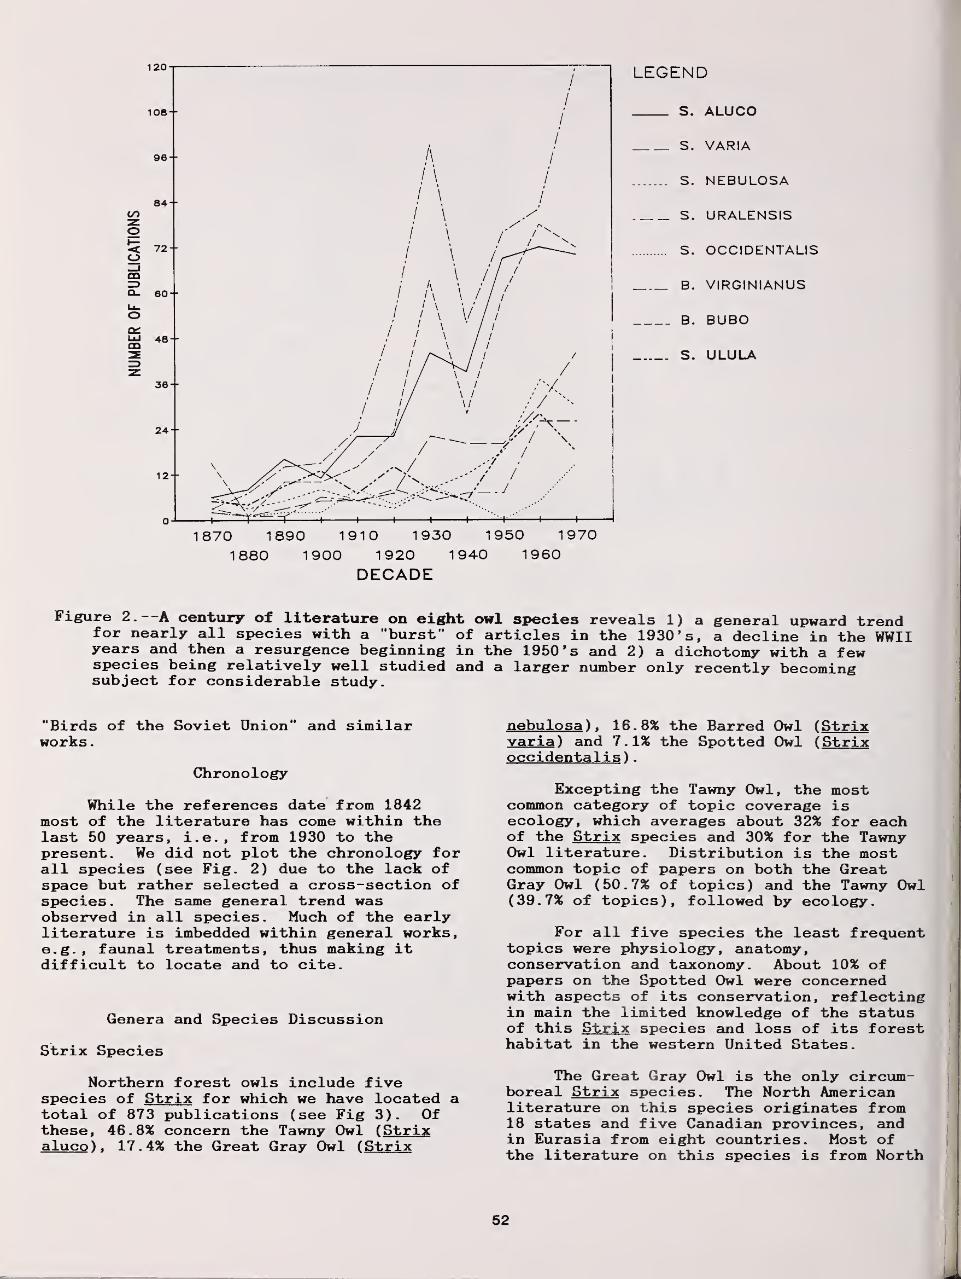
120
108--
96--
84+COzo!< 72-Om=5Q_ 60--
UJ 48+
36--
24-
12--
LEGEND
S. ALUCO
S. VARIA
S. NEBULOSA
S. URALENSIS
S. OCCIDENTALIS
B. VIRGINIANUS
B. BUBO
S. ULULA
1870 1890 1910 1930 1950 1970
1880 1900 1920 1940 1960DECADE
Figure 2. —A century of literature on eight owl species reveals 1) a general upward trendfor nearly all species with a "burst" of articles in the 1930' s, a decline in the WWIIyears and then a resurgence beginning in the 1950 's and 2) a dichotomy with a fewspecies being relatively well studied and a larger number only recently becomingsubject for considerable study.
"Birds of the Soviet Onion" and similarworks
.
Chronology
While the references date from 1842most of the literature has come within thelast 50 years, i.e., from 1930 to thepresent. We did not plot the chronology forall species (see Fig. 2) due to the lack ofspace but rather selected a cross-section ofspecies. The same general trend wasobserved in all species. Much of the earlyliterature is imbedded within general works,e.g., faunal treatments, thus making itdifficult to locate and to cite.
Genera and Species Discussion
Strix Species
Northern forest owls include fivespecies of Strix for which we have located atotal of 873 publications (see Fig 3). Ofthese, 46.8% concern the Tawny Owl ( Strixaluco), 17.4% the Great Gray Owl (Strix
nebulosa), 16.8% the Barred Owl (Strixvaria) and 7.1% the Spotted Owl ( Strixoccidentalis )
.
Excepting the Tawny Owl, the mostcommon category of topic coverage isecology, which averages about 32% for eachof the Strix species and 30% for the TawnyOwl literature. Distribution is the mostcommon topic of papers on both the GreatGray Owl (50.7% of topics) and the Tawny Owl(39.7% of topics), followed by ecology.
For all five species the least frequenttopics were physiology, anatomy,conservation and taxonomy. About 10% ofpapers on the Spotted Owl were concernedwith aspects of its conservation, reflectingin main the limited knowledge of the statusof this Strix species and loss of its foresthabitat in the western United States.
The Great Gray Owl is the only circum-boreal Strix species. The North Americanliterature on this species originates from18 states and five Canadian provinces, andin Eurasia from eight countries. Most ofthe literature on this species is from North
52
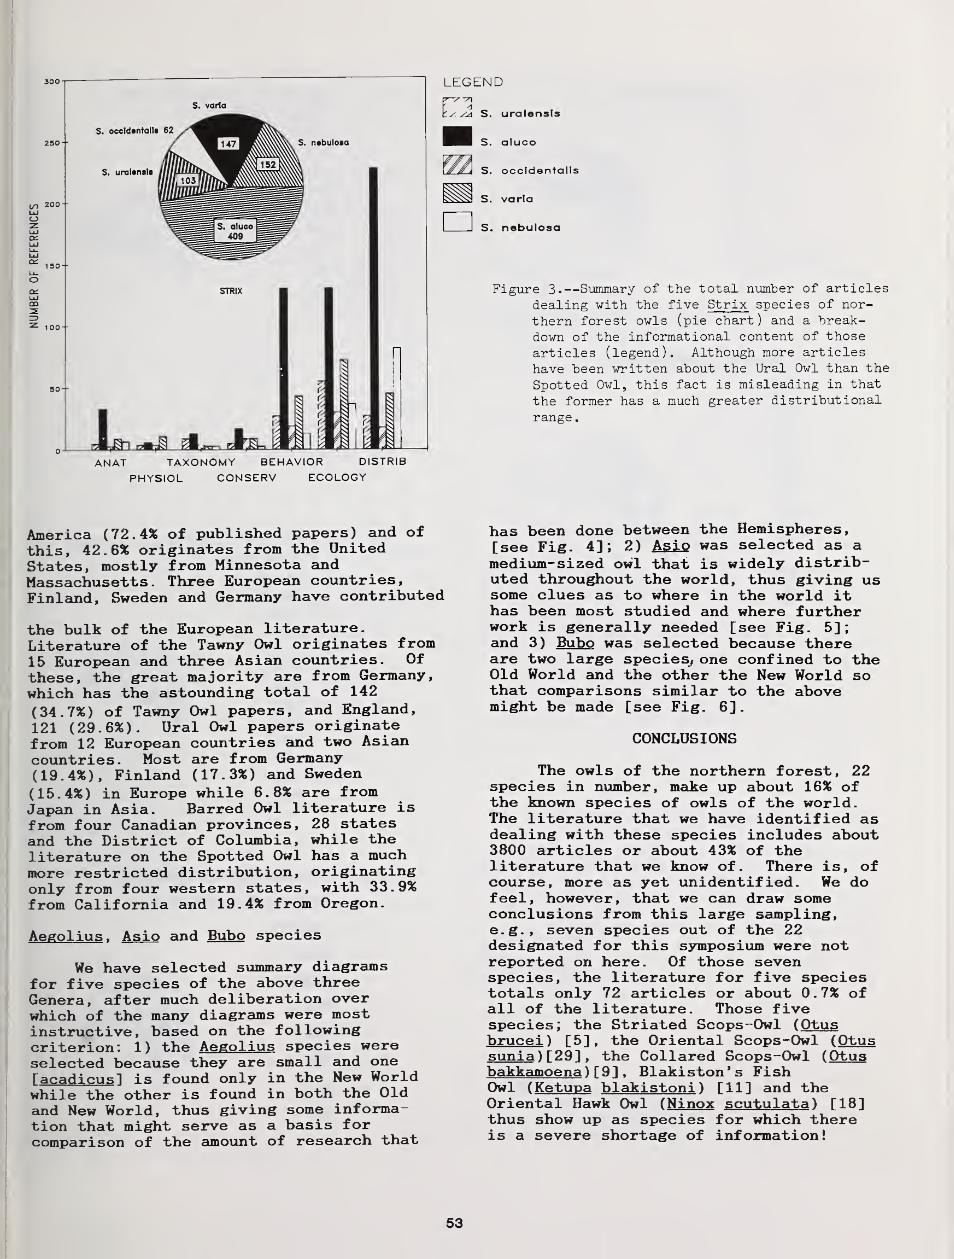
300-
S. varia
S. occld«ntalls 62
S. uralonsls
in 200-Ulo
S. n«bulo«a
150--
O
CD
STRIX
.__JLn-
LEGEND
is S. uralensls
S. aluco
ANAT TAXONOMY BEHAVIOR DISTRIB
PHYSIOL CONSERV ECOLOGY
Figure 3.—Summary of the total number of articlesdealing with the five Strix species of nor-thern forest owls (pie chart ) and a break-down of the informational content of those
articles (legend). Although more articleshave been written about the Ural Owl than the
Spotted Owl, this fact is misleading in that
the former has a much greater distributional
range
.
America (72.4% of published papers) and ofthis, 42.6% originates from the UnitedStates, mostly from Minnesota andMassachusetts. Three European countries,Finland, Sweden and Germany have contributed
the bulk of the European literature.Literature of the Tawny Owl originates from15 European and three Asian countries. Ofthese, the great majority are from Germany,which has the astounding total of 142
(34.7%) of Tawny Owl papers, and England,121 (29.6%). Ural Owl papers originatefrom 12 European countries and two Asiancountries. Most are from Germany(19.4%), Finland (17.3%) and Sweden
(15.4%) in Europe while 6.8% are fromJapan in Asia. Barred Owl literature isfrom four Canadian provinces, 28 statesand the District of Columbia, while theliterature on the Spotted Owl has a muchmore restricted distribution, originatingonly from four western states, with 33.9%from California and 19.4% from Oregon.
Aegolius . Asio and Bubo species
We have selected summary diagramsfor five species of the above threeGenera, after much deliberation overwhich of the many diagrams were mostinstructive, based on the followingcriterion: 1) the Aegolius species wereselected because they are small and one[acadicus] is found only in the New Worldwhile the other is found in both the Oldand New World, thus giving some informa-tion that might serve as a basis forcomparison of the amount of research that
has been done between the Hemispheres,[see Fig. 4]; 2) Asio was selected as amedium-sized owl that is widely distrib-uted throughout the world, thus giving ussome clues as to where in the world ithas been most studied and where furtherwork is generally needed [see Fig. 5];and 3) Bubo was selected because thereare two large species, one confined to theOld World and the other the New World sothat comparisons similar to the abovemight be made [see Fig. 6].
CONCLUSIONS
The owls of the northern forest, 22species in number, make up about 16% ofthe known species of owls of the world.The literature that we have identified asdealing with these species includes about3800 articles or about 43% of theliterature that we know of. There is, ofcourse, more as yet unidentified. We dofeel, however, that we can draw someconclusions from this large sampling,e.g., seven species out of the 22designated for this symposium were notreported on here. Of those sevenspecies, the literature for five speciestotals only 72 articles or about 0.7% ofall of the literature. Those fivespecies; the Striated Scops-Owl (Otusbrucei ) [5], the Oriental Scops-Owl (Otussunia ) [29] « the Collared Scops-Owl (Otusbakkamoena ) T 9 1 . Blakiston's FishOwl (Ketupa blakistoni ) [11] and theOriental Hawk Owl (Ninox scutulata ) [18]thus show up as species for which thereis a severe shortage of information!
53

CONSERVATION 4TAXONOlfr 4
PHYSIOLOGY 14
ONTARIO
FRANCE
60 80 100 120 140 160
NUMBER OF REFERENCES FOR BARS
Figure k.—Comparison of informational content,extent of study, and geographic distributionof the literature on Northern Saw-Whet (upper)and Boreal or Tengmalm's Owl. The former is
confined to North America, while the latter is
also found in northern Europe also. Note thesame three informational categories predominate,
When the National Wildlife Federation waspreparing the final copy for ourbibliography we asked them to use theSpotted Owl (Strix occidentalis ) as a modelfor the artwork for the cover. We did thisbecause we saw that as a species badly inneed of research. Since publication of thebibliography in 1978 there has beenconsiderable research done on that speciesand some of that need for research has beenmet. We are sure that much of the interestfor that species has arisen from its
Figure 6.—Comparison of the large Great Horned Owl(upper) and its ecological counterpart theEurasian Eagle Owl (lower) shows the same threeinformational categories prevail as for theother species compared.
102
CONSERVATION 33TAXONOMY 7
PHYSIOLOGY 30
ANATOMY 34
60 80 100 120 1 40 160
NUMBER OF REFERENCES FOR BARS
Figure 5.—The trend in the literature of the mostwidely distributed northern forest owl, the
i medium-sized Long-eared Owl, is quite similarJ
< to that of the smaller owls.
U.S.A. (other)
CALIFORNIA
MINNESOTA
CANADA (other)
MEXICO AND S. AMER.
NEW YORK
WISCONSIN
IOWA
SASKATCHEWAN
SOUTH DAKOTA
MICHIGAN
NEBRASKA
COLORADO
BRITISH COLUMBIA
ONTARIO
172
CONSERVATION 17TAXONOMY 10
PHYSIOLOGY 35
ANATOMY 31
BUBO VIRGINIANUS
40 60 80 1 00 1 20 1 40 1 60
NUMBER OF REFERENCES FOR BARS
GERMANY
EUROPE (other)
ENGLAND
RUSSIA
CONSERVATION 50
TAXONOMY 37
PHYSIOLOGY 18
ANATOMY 42
20 40 60 60 100 120 1*0 160 180 200
NUMBER OF REFERENCES FOR BARS
54
designation as an Endangered Species. Weare here designating the above five species,i.e., the Striated Scops-Owl, the OrientalScops-Owl, the Collared Scops-Owl,Blakiston's Fish Owl and the Oriental HawkOwl as SPECIES OF SPECIAL CONCERN forresearchers in order to call attention tothe urgent need for information on thosespecies. The urgency arises from thealarming rate at which habitats for wildlifeare being destroyed. While we have identi-fied the need for information for certainspecies we have also identified a need forcommunication with regard to informationthat currently exists in the literature.Much of the literature is not readilyavailable to the conservationists andwildlife and land managers who have a needfor the available literature. There arecomputerized databases available that canget a person with the need to know into someof the literature but they do not approachcompleteness in their coverage and fairlyextensive search strategies are sometimesrequired to access the literature.Bibliographies are extremely difficult toobtain funding for as most of theconventional sources of funding are notavailable for such publications. They arereference works with perhaps a select"clientele," but they are critically needed.Governmental agencies or wildlifeconservation organizations would do the owls[as well as other wildlife forms] a great
service if they would actively seek workingbibliographies and support their preparationand publication. Authors, utilizingbibliographies; can also further the cause byciting bibliographies in their researchpublications
.
LITERATURE CITED
Burton, J. A. [Ed.] 1973. Owls of theworld. New York, E.P. Dutton and Co.,Inc. 216 pp.
Clark, R.J., D.G. Smith and L.H. Kelso.1978. Working bibliography of owls ofthe world: With summaries of currenttaxonomy and distributional status. NWFSci./Tech. Series No. 1. 319 pp.
Dement'ev, G.P., N.A. Gladkov, E.S.Ptushenko, E.P. Spangenberg and A.M.Sudilovskaya . 1966. Birds of theSoviet Union. Vol. 1. Jerusalem,Israel Prog. Sci. Trans. 704 pp.
Grossman, M.L. and J. Hamlet. 1964.Birds of prey of the world. London,Cassell and Co. 496 pp.
Mikkola, H. 1983. Owls of Europe.Vermillion, Buteo Books. 397 pp.
55
Nearly Synchronous Cycles of the Great Horned Owland Snowshoe Hare in Saskatchewan 1
C. Stuart Houston 2
Abstract.— In the aspen parkland o-f Saskatchewan, GreatHorned Owl reproductive success is cyclical and appears to-follow closely the numbers o-f the Snowshoe Hare, its mainprey item. In peak years, nearly all owls nest, some raisefour young, and they fledge an average o-f 2.5 young persuccessful nest.
INTRODUCTION
A 30-year study of Great Horned Owl
productivity included banding of 4285 nestlings in
1883 successful nests. Changes in numbers and
reproductive success were roughly coincident withthe 10-year cycle of the Snowshoe Hare, ( Lepus
amer i canus ) , though as with the lynx, the owl may
sometimes peak a year after the hare.
The 10-year cycle of the Snowshoe Hare has
been documented for over 100 years. The famousexplorer, mapmaker and fur trader, Peter Fidler,
gave the following report from Dauphin House,Manitoba, in 1820: "There are in some seasonsplenty of rabbits, this year in particular, some
years very few, and what is rather remarkable, the
rabbits are the most numerous when the cats [lynxl
appear. . . . the cats are only plentiful at
certain periods of about every 8 or 10 years, and
seldom remain in these southern parts in any
number for more than two or three years."
Similarly, Dr. John Richardson, surgeon and
naturalist with the first and second Franklinexpeditions in the 1820s, wrote: "the Canada lynx
is the animal which perhaps most exclusively feeds
upon it Cthe hare]. It has been remarked that
lynxes are numerous only where there are plenty of
hares in the neighbourhood. At some periods a
sort of epidemic has destroyed vast numbers of
hares in particular districts, and they have not
recruited again until after the lapse of severalyears, during which the lynxes are likewisescarce. "
l Paper presented at the symposium,Biology and Conservation of Northern Forest Owls,
Feb. 3-7, 1987, Winnipeg, Manitoba. USDA ForestService General Technical Report RM-142.
2 Stuart Houston is Professor of MedicalImaging, University of Saskatchewan, Saskatoon,Sask
.
Lloyd B. Keith's wel 1 -researched book,
Wildlife's Ten-year Cycl
e
, includes many graphs
from Hudson's Bay Company pelt collections and
other sources. These demonstrate the approximate
10-year cycle of the hare and lynx as well as the
one or two year lag in peaks and troughs between
different geographic regions. The Ruffed Grouse
cycle was almost synchronous with the hare's, but
at that time data were inadequate for the Great
Horned Owl. Later, long-term studies by Keith and
associates in the mixed forest at Rochester,
Alberta, provided evidence that Great Horned Owl
numbers and reproductive success were quite
clearly synchronous with Snowshoe Hare numbers
(Rusch et al 1972).
METHODS
A relatively small number of observant,
helpful farmers and rural schoolteachers have
provided fairly consistent effort in finding nests
each year. However, I exhorted them to extra
searching in the low-hare years of 1984 and 1985,
since nest sample numbers had been very low during
the previous bottoms of the cycle in the 1960s and
1970s. With extremely few exceptions, every
active nest reported within a wide study area was
visited and the young banded.
Skewing of Nest Numbers
The nest total was skewed upwards in two
years. In 1967, two assistant tree climbers, Doug
Whitfield and Jon Gerrard, made a special effort
and found over 30 nests themselves. In 1968,
Whitfield found ten nests and this one year we
also went further southeast to 21 nests near
Indian Head and Lemberg, an area later covered by
Lome Scott of Indian Head. Total young banded in
these two years was thus disproportionately high.
Nest success was skewed downwards in 1982 when a
forest tent caterpillar invasion almost filled the
aspen forest with thick webs, apparently impeding
hunting by the parent owls.
56
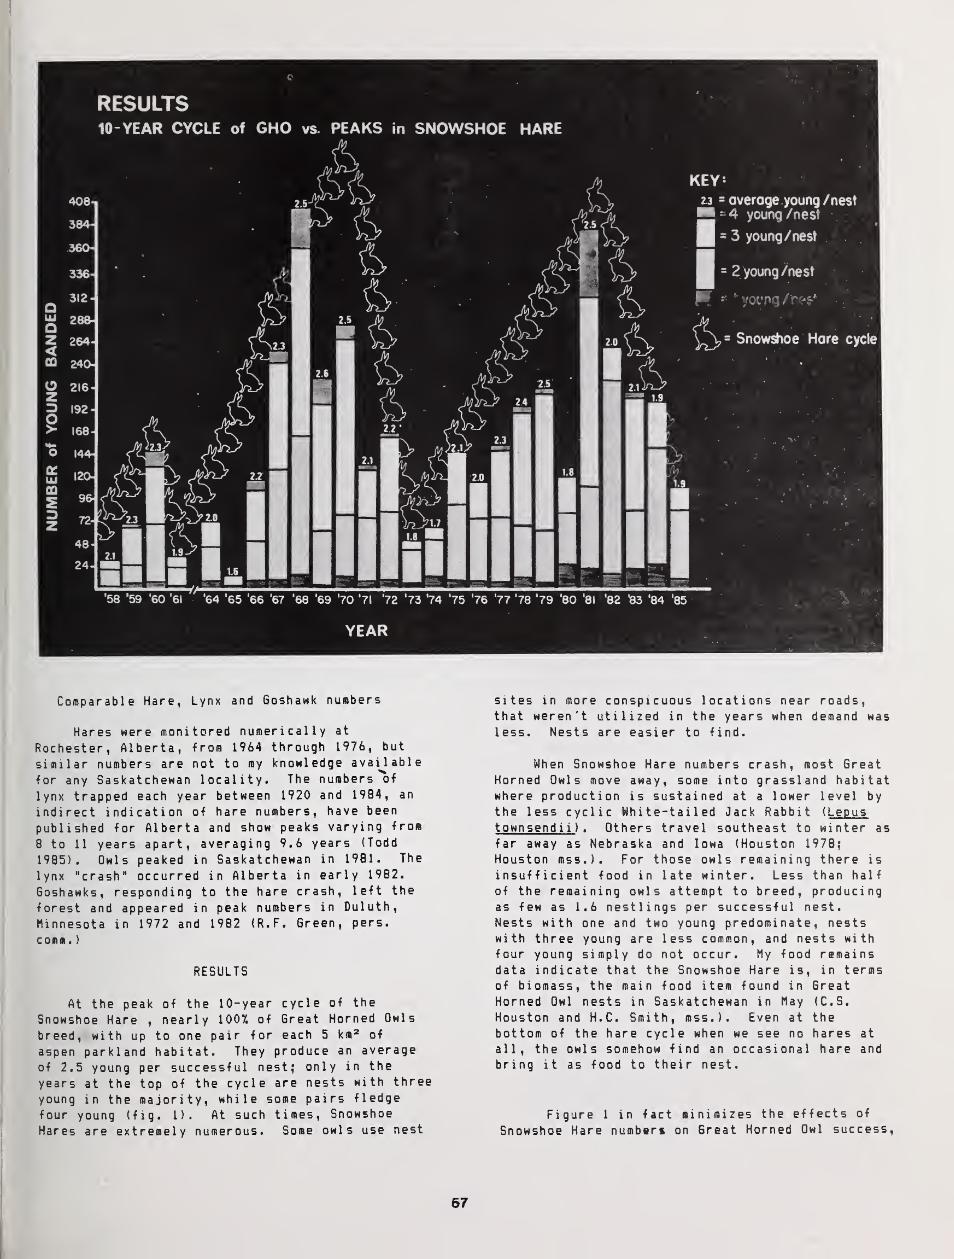
RESULTS10- YEAR CYCLE of GHO vs. PEAKS in SNOWSHOE HARE
YEAR
Comparable Hare, Lynx and Goshawk numbers
Hares were monitored numerically at
Rochester, Alberta, from 1964 through 1976, but
similar numbers are not to my knowledge available
for any Saskatchewan locality. The numbers of
lynx trapped each year between 1920 and 1984, an
indirect indication of hare numbers, have been
published for Alberta and show peaks varying from
8 to 11 years apart, averaging 9.6 years (Todd
1985). Owls peaked in Saskatchewan in 1981. The
lynx "crash" occurred in Alberta in early 1982.
Goshawks, responding to the hare crash, left the
forest and appeared in peak numbers in Duluth,
Minnesota in 1972 and 1982 (R.F. Green, pers.
coma.
)
RESULTS
At the peak of the 10-year cycle of the
Snowshoe Hare,nearly 1007. of Great Horned Owls
breed, with up to one pair for each 5 km 2 of
aspen parkland habitat. They produce an average
of 2.5 young per successful nest; only in the
years at the top of the cycle are nests with three
young in the majority, while some pairs fledge
four young (fig. 1). At such times, Snowshoe
Hares are extremely numerous. Some owls use nest
sites in more conspicuous locations near roads,that weren't utilized in the years when demand was
less. Nests are easier to find.
When Snowshoe Hare numbers crash, most GreatHorned Owls move away, some into grassland habitatwhere production is sustained at a lower level by
the less cyclic White-tailed Jack Rabbit ( Lepustownsendi i
)
. Others travel southeast to winter as
far away as Nebraska and Iowa (Houston 1978;
Houston mss.). For those owls remaining there is
insufficient food in late winter. Less than half
of the remaining owls attempt to breed, producingas few as 1.6 nestlings per successful nest.
Nests with one and two young predominate, nestswith three young are less common, and nests withfour young simply do not occur. My food remainsdata indicate that the Snowshoe Hare is, in termsof biomass, the main food item found in GreatHorned Owl nests in Saskatchewan in May (C.S.
Houston and H.C. Smith, mss.). Even at the
bottom of the hare cycle when we see no hares at
all, the owls somehow find an occasional hare and
bring it as food to their nest.
Figure 1 in fact minimizes the effects of
Snowshoe Hare numbers on 6reat Horned Owl success,
67
since much of our overall Saskatchewan banding
area contains both Jack Rabbits and SnowshoeHares. The best Snowshoe Hare habitat within the
aspen forest at Birch Hills - Crystal Springs -
Yellow Creek - Cudworth - Humboldt - Wadena was
therefore contrasted with a more southerly
rectangle which includes Simpson - Raymore -
Kelliher - Duval - Strasbourg - Bulyea. Because
the northern area has so few nests at the bottom
of the cycle, the long-term average number of
successful nests there is only 19, as compared
with the average of 30 further south. In a peak
owl year of 1981, when hares were visibleeverywhere, the northern area had 42 successfulnests — which fledged 102 young owls. In 1985,when hares were nowhere to be seen, the last of
two known incubating female owls was still on her
nest on 9 May but had deserted by the time of our
fruitless visit on 19 May.
In contrast, the southern area in the peakyear of 1981 also had 42 successful nests — which
fledged 118 young. In 1985, at the Snowshoe Hare
low, these owls had dropped to half their previousnumbers and were apparently relying on Jack
Rabbits, for there were 20 successful pairs able
to fledge 37 young.
Finally, there was a highly significantcorrelation (r=.61, p <.01) between the number of
nests found and the average number of youngproduced per successful nest. This offers furthersupport for my conviction that cyclical variations
are real and not merely artefacts, for example, ofobserver effort.
DISCUSSION
Although the Great Horned Owl is a strong andcapable hunter, food is very much restricted dueto cold weather and deep snow during courtship inFebruary and during incubation in March. In theaspen parkland of Saskatchewan, this owl's repro-ductive success depends heavily on its main preyspecies, the Snowshoe Hare. As a result, theircycles are closely synchronous.
LITERATURE CITED
Houston, C.S. 1978. Recoveries of Saskatchewan-banded Great Horned Owls. Canadian Field-Naturalist 92 < 1 ) : 61-66.
Keith, L.B. 1963. Wildlife's ten-year cycle. 201
p. University of Wisconsin Press, Madison.Richardson, J. 1828. Fauna Boreal i -Ameri cana , or
the Zoology of the Northern Parts of BritishAmerica. Part first: the Mammals. 302 p. JohnMurray, London.
Rusch, D.H., E.C. Meslow, P.D. Doerr, and L.B.Keith. 1972. Response of Great Horned Owlpopulations to changing prey densities.Journal of Wildlife Management 36 (2) : 282-296.
Todd, A.W. The Canada Lynx: ecology andmanagement. Canadian Trapper 13(2) : 15-20.
58
Reversed Size Dimorphism in 10 Speciesof Northern Owls
1
W. Bruce McGillivray 2
Abstract. --Nineteen measurements were taken onmuseum specimens of 8 species of northern forest owlsas well as two other common northern owls. DimorphismIndices were computed for all characters and combinedwith Hfe-h1story data 1n a principal componentanalysis. Overall levels of SSD vary from 2.5%(Northern Hawk-Owl) to 8.0% (Boreal Owl). There are norelationships between SSD and migratory habitat, size,and higher order taxonomy of the species. Dimorphismlevels are lowest for skull characters and highest forbody core measures. For many characters, sexual sizedimorphism 1s correlated with the percentage weightdifference between males and females.
INTRODUCTION
Reversed size dimorphism (RSD) 1s said to
occur 1f the female of a species 1s larger
than the male. This situation obtains for
most, but by no means for all, species of
raptorial birds ( Falconlformes ,Str1g1formes
and Stercorarl 1dae) . These taxa are not
closely related, therefore a unitary
explanation for the evolution of RSD has not
been possible. A wide variety of hypotheseshave been proposed to explain RSD 1n diurnal
raptors (see Mueller and Meyer 1985 for a
recent review and references) although the
relevance of many of these hypotheses for owls
1s debatable (Mueller 1986). Only Earhart and
Johnson (1970) and Mueller (1986) have
specifically examined the question of RSD 1n
the Str1g1formes (see also Snyder and Wiley
1976).
I showed for Great Horned Owls (dSubo
uirvinUmu*) that the standard measures of size
(weight and wing length) used 1n previous RSD
studies are not highly correlated withmultivariate estimates of size obtained fromskeletal characters (McGillivray 1985). As
well, the degree of RSD varied from -2.18% to
9.75% among the 16 skeletal characters. A
'Paper presented at the symposium,Biology and Conservation of Northern ForestOwls, Feb. 3-7, 1987, Winnipeg, Manitoba.USDA Forest Service General Technical ReportRM-142.
2W. Bruce McGillivray, Curator of
Ornithology, Provincial Museum of Alberta,Edmonton, Alberta.
legitimate question 1s: which charactersshould be selected to give the best measure of
the difference 1n size between males andfemales?
There are several assumptions with respectto size that are Implicit 1n discussions ofthe evolution of RSD:
(1) Variable x (or y) 1s a good measure ofsize. It 1s assumed that we can measuresome characters (e.g., wing length orweight) and using them to determinequantitative differences between males andfemales; relate these numbers tointeractions between members of pairswhich led to the evolution of RSD. Theproblem 1s as noted above - the choice ofcharacters may affect the assessment ofsize variation. It 1s not easy to definesize unlvarlately since Intercharactercorrelations may be low. Consider theGreat Gray Owl (Strix nebulooa)
, by winglength 1t 1s the largest North Americanowl but by weight 1t ranks a distant thirdbehind the Snowy (Tlyctea scandiaca) andGreat Horned Owls (Earhart and Johnson1970). Is the Great Gray therefore a
large or a medium-sized owl?
(2) Correlations derived fromInterspecific comparisons are valid for1ntraspec1f 1c relationships. Figure 1
shows 2 variables, which are highlypositively correlated 1f examined across a
range of species but within each speciesthey may be uncorrelated or evennegatively correlated. These types ofinterspecies correlations lead to theconcept that any of several characters 1s
adequate for estimating size.
59
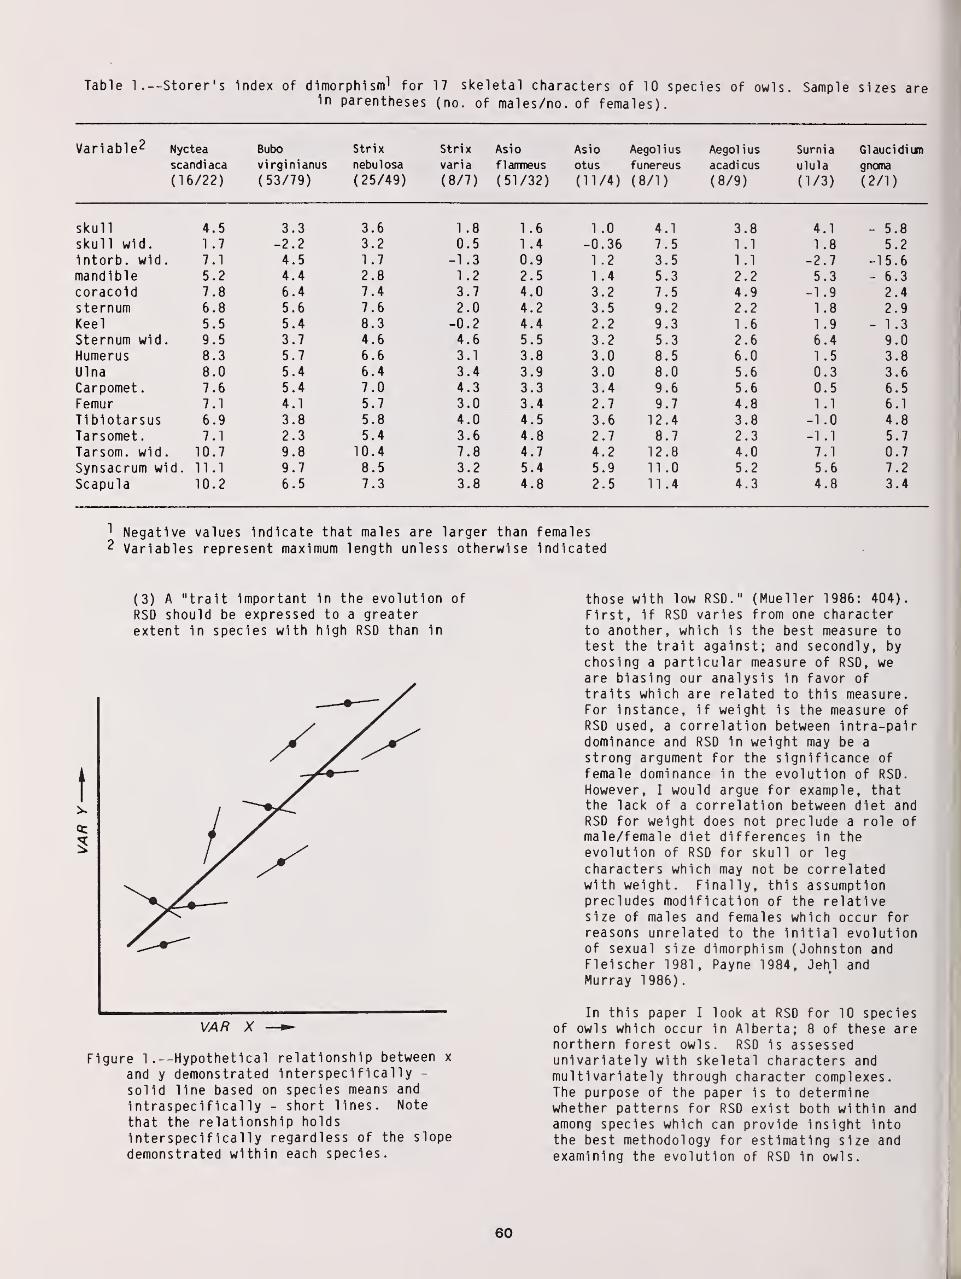
Table 1 .--Storer's Index of dimorphism1 for 17 skeletal characters of 10 species of owls. Sample sizes are1n parentheses (no. of males/no. of females).
Variable 2 Nyctea Bubo Strix Strix
scandiaca virginianus nebulosa varia
(16/22) (53/79) (25/49) (8/7)
Asio Asio Aegolius Aegolius Surnia Glaucidium
flammeus otus funereus acadicus ulula gncma
(51/32) (11/4) (8/1) (8/9) (1/3) (2/1)
skull 4.5 3.3 3.6 1 .8 1 .6 1 .0 4.1 3.8 4.1 - 5.8skull w1d. 1 .7 -2.2 3.2 0.5 1 .4 -0.36 7.5 1.1 1 .8 5.2Intorb. w1d. 7.1 4.5 1 .7 -1.3 0.9 1.2 3.5 1.1 -2.7 -15.6mandible 5.2 4.4 2.8 1 .2 2.5 1 .4 5.3 2.2 5.3 - 6.3coracold 7.8 6.4 7.4 3.7 4.0 3.2 7.5 4.9 -1 .9 2.4sternum 6.8 5.6 7.6 2.0 4.2 3.5 9.2 2.2 1 .8 2.9Keel 5.5 5.4 8.3 -0.2 4.4 2.2 9.3 1 .6 1 .9 - 1.3Sternum w1d. 9.5 3.7 4.6 4.6 5.5 3.2 5.3 2.6 6.4 9.0Humerus 8.3 5.7 6.6 3.1 3.8 3.0 8.5 6.0 1.5 3.8Ulna 8.0 5.4 6.4 3.4 3.9 3.0 8.0 5.6 0.3 3.6Carpomet. 7.6 5.4 7.0 4.3 3.3 3.4 9.6 5.6 0.5 6.5Femur 7.1 4.1 5.7 3.0 3.4 2.7 9.7 4.8 1.1 6.1
T1b1otarsus 6.9 3.8 5.8 4.0 4.5 3.6 12.4 3.8 -1 .0 4.8Tarsomet. 7.1 2.3 5.4 3.6 4.8 2.7 8.7 2.3 -1.1 5.7
Tarsom. w1d. 10.7 9.8 10.4 7.8 4.7 4.2 12.8 4.0 7.1 0.7
Synsacrum w1d. 11.1 9.7 8.5 3.2 5.4 5.9 11.0 5.2 5.6 7.2
Scapula 10.2 6.5 7.3 3.8 4.8 2.5 11.4 4.3 4.8 3.4
1 Negative values Indicate that males are larger than females2 Variables represent maximum length unless otherwise Indicated
(3) A "trait Important 1n the evolution of
RSD should be expressed to a greaterextent 1n species with high RSD than 1n
VAR X —Figure 1 .--Hypothetical relationship between x
and y demonstrated Interspedf 1cal ly -
solid line based on species means and
Intraspedf 1cal ly - short lines. Note
that the relationship holds
Intersped f 1cal ly regardless of the slope
demonstrated within each species.
those with low RSD." (Mueller 1986: 404).
First, 1f RSD varies from one characterto another, which 1s the best measure totest the trait against; and secondly, by
choslng a particular measure of RSD, weare biasing our analysis 1n favor of
traits which are related to this measure.For Instance, 1f weight Is the measure of
RSD used, a correlation between 1ntra-pa1rdominance and RSD 1n weight may be a
strong argument for the significance of
female dominance 1n the evolution of RSD.
However, I would argue for example, thatthe lack of a correlation between diet andRSD for weight does not preclude a role of
male/female diet differences 1n theevolution of RSD for skull or leg
characters which may not be correlatedwith weight. Finally, this assumptionprecludes modification of the relativesize of males and females which occur forreasons unrelated to the Initial evolutionof sexual size dimorphism (Johnston andFleischer 1981, Payne 1984, Jehl andMurray 1986).
In this paper I look at RSD for 10 speciesof owls which occur in Alberta; 8 of these arenorthern forest owls. RSD 1s assessedunivariately with skeletal characters andmulti variately through character complexes.The purpose of the paper 1s to determinewhether patterns for RSD exist both within andamong species which can provide insight intothe best methodology for estimating size andexamining the evolution of RSD in owls.
60
MATERIALS AND METHODS
Data Collection
Nineteen measurements were taken with dialcalipers on skeletons of 10 species of
northern owl. Most measures defined a
greatest linear dimension such as length or
width of an element. A description of themeasures (Table 1) can be obtained fromSchnell (1970). Note that tarsometatarsuswidth (1n this paper) equals thetarsometatarsus distal end width of Schnell(1970). Because some owl skeletons wereprepared with the rhamphotheca removed andothers with 1t attached, skull length andmandible length were defined as compositemeasures to standardize the data (McGlllivray1985). Hence, skull length equals total skulllength minus premaxllla length and mandiblelength equals total mandible length minusdentary length. Most specimens are from thecollection of the Provincial Museum of Albertaand were obtained in Alberta. Canada.However, some Pygmy Owls (^BaucidLum qnoma)are from the state of Washington, some HawkOwls (SurnLa uiuia) were obtained in Ontarioand some Barred Owls (StrLx uarla) wereacquired in several eastern states of theUSA. To provide standard measures of weight,I used the values given in Snyder and Wiley(1976).
Data Analysis
RSD for skeletal characters was initially
examined univarlately using a dimorphism index
(DI) of Storer (1966). The index measures the
difference between the variable means of each
sex (female Xf; male Xm)_as a_percentage of
the grand mean [100 (Xf-Xm)/(Xf +Xm)/2].
Skeletal characters were grouped into
"complexes" to facilitate interpretation of
interspecific differences. The size of a
complex equals the sum of the size of each
variable in the complex. The sum of a group
of characters represents a standard size axis
(Mosimann 1970, Reyment et al. 1984) and 1s
shown to be analagous to an ideal isometricsize vector derived from a principal componentanalysis (McGilllvray 1985, Somers 1986). The
four complexes are skull (the sum of skull
length, skull width, and mandible length);body (the sum of coracoid length, sternumlength, keel length, sternum width, scapulalength and synsacrum width); wing (the sum of
humerus length, ulna length and
carpometacarpus length) and leg (the sum of
femur length, tlbiotarsus length,tarsometatarsus length and tarsometatarsuswidth)
.
Relative trait lengths (Cherry et al.
1982) were calculated for the four charactercomplexes and compared among species. Thesemeasures (which equal complex size/total size,where total size 1s the sum of all the
characters) although not statisticallyIndependent of size (Atchley et al. 1976,Somers 1986) provide a convenient method ofcomparing relative dimensions of charactersbetween sexes of a species and among speciesfor each sex.
Finally, the skeletal data generated inthis study were combined with data presentedIn Mueller's (1986) discussion of reversedsize dimorphism in owls 1n a principalcomponent analysis. This analysis generatedcomponents linking diet, weight variation,clutch size and egg weight to RSD as measuredby skeletal characters. All statisticalanalyses were run using the SAS statisticalpackage (SAS Institute 1985) or with a handcalculator.
RESULTS
A summary of univariate measures of RSDfor each species 1s given in Table 1. For allspecies, there 1s considerable Intercharacter
variation in the degree of RSD. It 1s alsoapparent that there is great variation among
species in the degree of RSD for each
character. This variation will be examined 1n
greater detail later but it is worth noting
two things here. First, intrageneric species
pairs (4&Lo, j4e<}ol!LuA and Strix) show no
greater similarity than intergenerlc pairs.
Secondly, the amount of RSD exhibited for
coracoid, sternum, keel, and carpometacarpuslength and tarsometatarsus width is
significantly correlated with RSD for
we1ght(r=0.68, 0.71, 0.71, 0.63 and 0.71
respectively, P < . 05 , n=10). RSD for humerus
length and ulna is correlated at 0.61 and 0.62
respectively with RSD for weight, these are
very close to the .05 level of 0.63.
These data are more easily Interpreted if
the variables are combined Into charactercomplexes (Table 2). Overall, mean levels of
RSD are highest for body characters and lowest
for head characters (Table 3). There 1s no
relationship between rank size (weight) and
RSD for weight (Table 2). As well, all
correlations between RSD for weight and RSD
for character complexes are not significantlydifferent from 0.0. Two potential sources of
pattern in RSD variation are phylogeneticsimilarity and habitat preferences. However,none of the intrageneric species pairs showparticularly similar levels of dimorphism. As
well the two open-country and migratoryspecies - 'flycteascandla.ca and ^alo
pBammeut show quite different levels of RSD.
A multivariate examination of RSD was madeby Including the univariate measures of
dimorphism and those obtained from charactercomplexes with variables given in Mueller(1986:392) 1n a principal component analysis.Variables taken from Muejler (1986) are wingloading, percent mammals, birds and
61
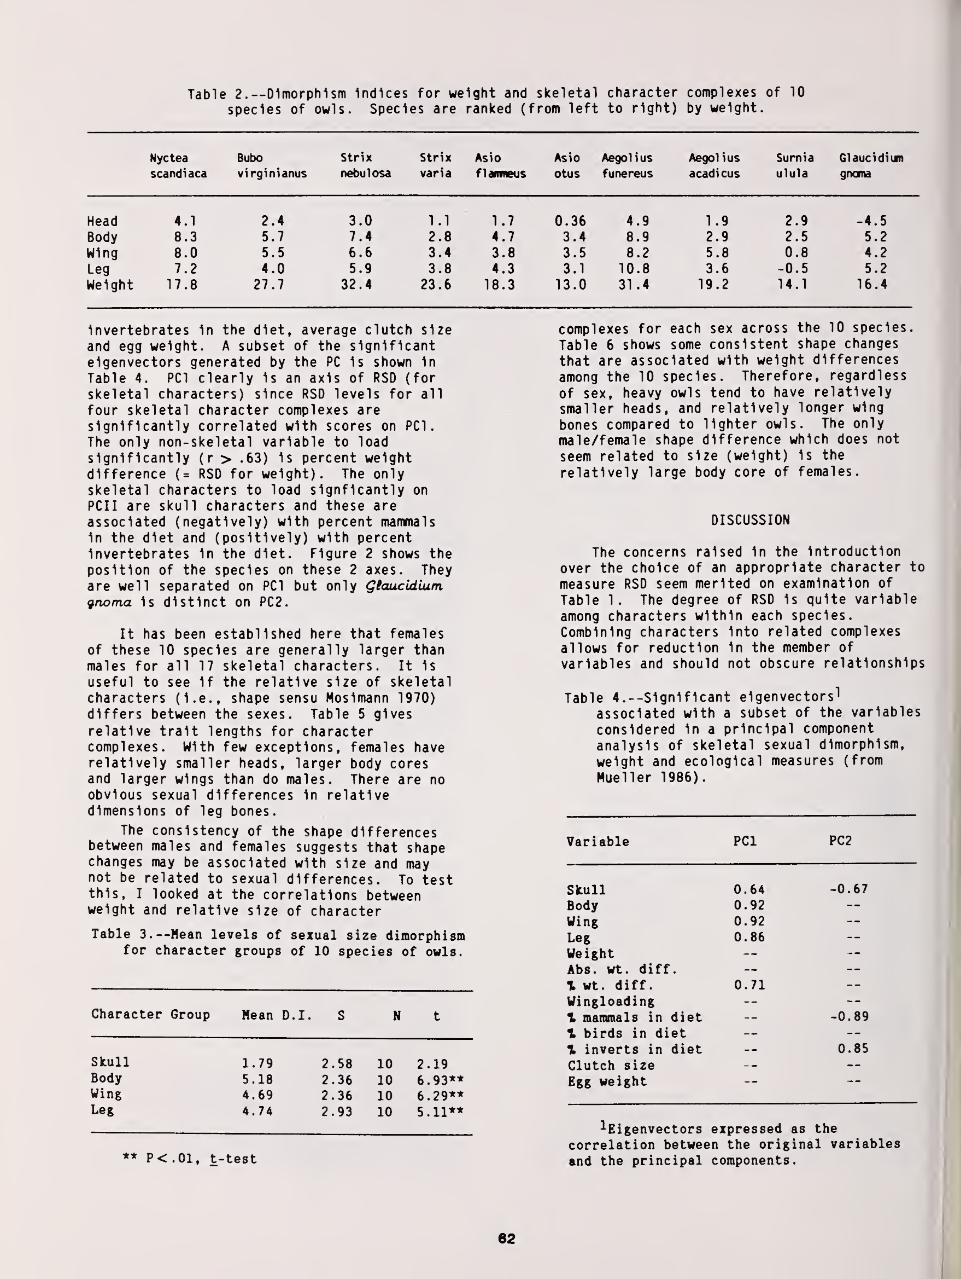
Table 2.—Dimorphism Indices for weight and skeletal character complexes of 10
species of owls. Species are ranked (from left to right) by weight.
Nyctea Bubo Strix Strix Asio Asio Aegolius Aegolius Surnia Glaucidium
scandiaca virginianus nebulosa varia flanmeus otus funereus acadicus ulula gncma
Head 4.1 2.4 3.0 1 .1 1.7 0.36 4.9 1 .9 2.9 -4.5
Body 8.3 5.7 7.4 2.8 4.7 3.4 8.9 2.9 2.5 5.2
Wing 8.0 5.5 6.6 3.4 3.8 3.5 8.2 5.8 0.8 4.2
Leg 7.2 4.0 5.9 3.8 4.3 3.1 10.8 3.6 -0.5 5.2
Weight 17.8 27.7 32.4 23.6 18.3 13.0 31 .4 19.2 14.1 16.4
Invertebrates 1n the diet, average clutch size
and egg weight. A subset of the significanteigenvectors generated by the PC 1s shown 1n
Table 4. PCI clearly 1s an axis of RSD (for
skeletal characters) since RSD levels for all
four skeletal character complexes aresignificantly correlated with scores on PCI.
The only non-skeletal variable to load
significantly (r> .63) 1s percent weightdifference (= RSD for weight). The onlyskeletal characters to load slgnflcantly on
PCII are skull characters and these areassociated (negatively) with percent mammals1n the diet and (positively) with percentInvertebrates 1n the diet. Figure 2 shows theposition of the species on these 2 axes. Theyare well separated on PCI but only gtaucidiumqnoma 1s distinct on PC2.
It has been established here that femalesof these 10 species are generally larger thanmales for all 17 skeletal characters. It 1s
useful to see 1f the relative size of skeletalcharacters (I.e., shape sensu Moslmann 1970)differs between the sexes. Table 5 gives
relative trait lengths for charactercomplexes. With few exceptions, females haverelatively smaller heads, larger body coresand larger wings than do males. There are noobvious sexual differences 1n relativedimensions of leg bones.
The consistency of the shape differencesbetween males and females suggests that shapechanges may be associated with size and maynot be related to sexual differences. To testthis, I looked at the correlations betweenweight and relative size of character
Table 3. --Mean levels of sexual size dimorphismfor character groups of 10 species of owls.
Character Group Mean D.I. S N t
Skull 1.79 2 .58 10 2 .19Body 5.18 2 .36 10 6 .93**Wing 4.69 2 .36 10 6 29**Leg 4.74 2 .93 10 5 11**
complexes for each sex across the 10 species.
Table 6 shows some consistent shape changes
that are associated with weight differences
among the 10 species. Therefore, regardless
of sex, heavy owls tend to have relatively
smaller heads, and relatively longer wing
bones compared to lighter owls. The only
male/female shape difference which does not
seem related to size (weight) 1s the
relatively large body core of females.
DISCUSSION
The concerns raised 1n the Introductionover the choice of an appropriate character to
measure RSD seem merited on examination of
Table 1. The degree of RSD 1s quite variable
among characters within each species.
Combining characters Into related complexes
allows for reduction 1n the member of
variables and should not obscure relationships
Table 4. --Significant eigenvectors 1
associated with a subset of the variables
considered 1n a principal component
analysis of skeletal sexual dimorphism,
weight and ecological measures (from
Mueller 1986).
Variable PCI PC2
SkullBodyWingLegWeightAbs. wt. diff.
I wt. diff.
WingloadingX mammals in diet\ birds in diet
\ inverts in dietClutch size
Egg weight
0.640.920.920.86
0.71
-0.67
•0.89
0.85
** P<.01, t-test
^Eigenvectors expressed as the
correlation between the original variables
and the principal components.
62
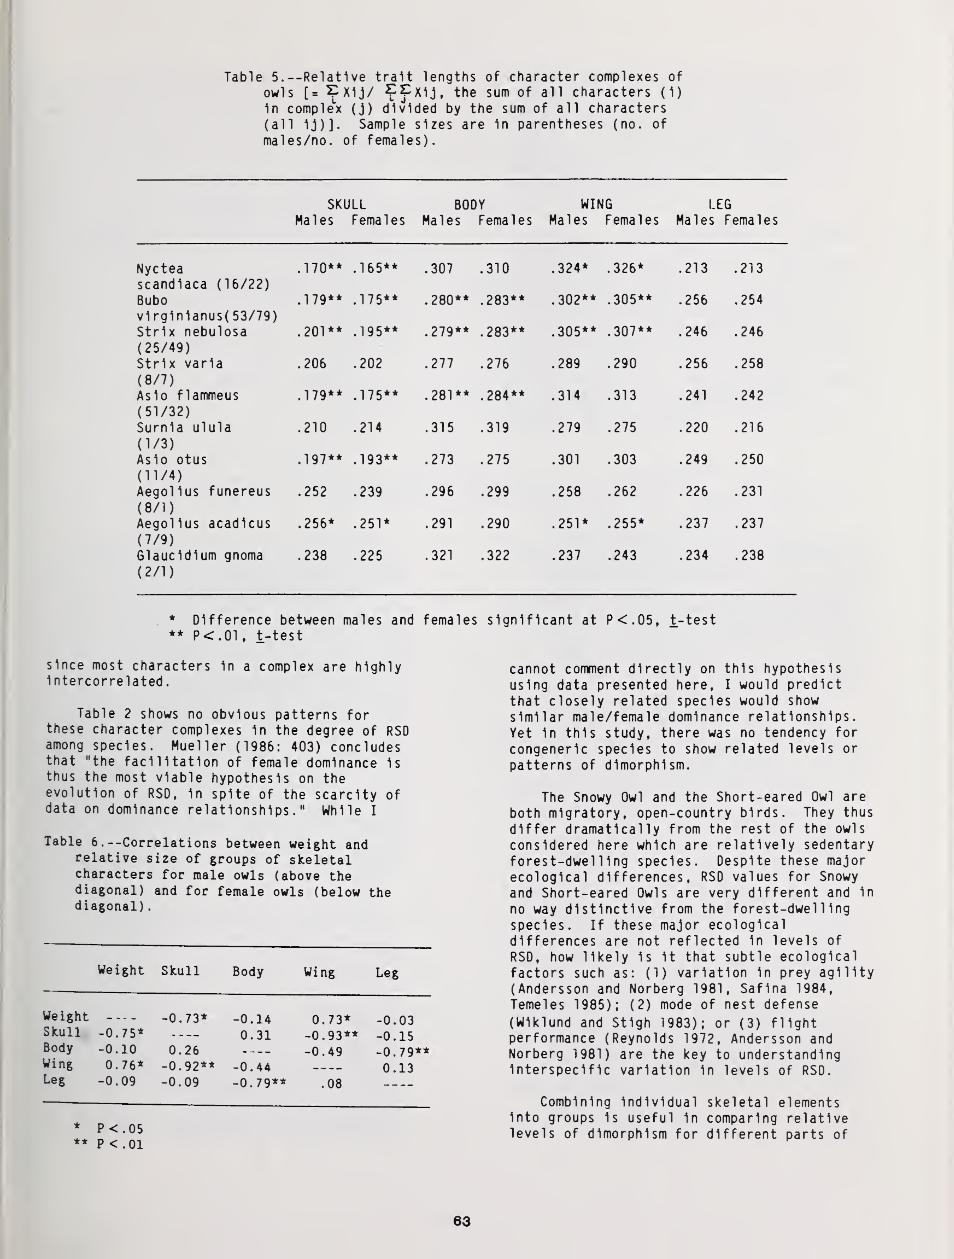
Table 5. --Relative trait lengths of character complexes of
owls [= ?X1J/ ?fx1j, the sum of all characters (1)
1n compleLx (j) divided by the sum of all characters
(all Sample sizes are 1n parentheses (no. of
males/no. of females).
SKULL BODY WING LEG
Males Fema 1 es Males Fema 1 es Males Fema 1 es Males Fema 1
<
1 vll Ivl 1 '
Nyctea .170** .165** .307 .310 .324* .326* .213 .213
scandlaca (16/22)
Bubo .179** .175** .280** .283** .302** .305** .256 .254
v1 ra1n1anus( 53/79)Strlx nebulosa .201** .195** .279** .283** .305** .307** .246 .246
(25/49)Strlx varla .206 .202 .277 .276 .289 .290 .256 .258
(8/7)As1o flammeus .179** .175** .281** .284** .314 .313 .241 .242
(51/32)Surnla ulula .210 .214 .315 .319 .279 .275 .220 .216
(1/3)As1o otus .197** .193** .273 .275 .301 .303 .249 .250
(11/4)Aegollus funereus .252 .239 .296 .299 .258 .262 .226 .231
(8/1)Aegollus acadlcus .256* .251* .291 .290 .251* .255* .237 .237
(7/9)Glauddlum gnoma .238 .225 .321 .322 .237 .243 .234 .238
(2/1)
* Difference between males and females significant at P<.05, t-test** P<.01 , t-test
since most characters 1n a complex are highlyIntercorrelated
.
Table 2 shows no obvious patterns forthese character complexes 1n the degree of RSDamong species. Mueller (1986: 403) concludesthat "the facilitation of female dominance 1sthus the most viable hypothesis on theevolution of RSD, 1n spite of the scarcity ofdata on dominance relationships." While I
Table 6 . --Correlations between weight andrelative size of groups of skeletalcharacters for male owls (above thediagonal) and for female owls (below thediagonal)
.
Weight Skull Body Wing Leg
Weight -0 73* -0 14 0 73* -0 03Skull -0. 75* 0 31 -0 93** -0 15Body -0. 10 0 26 -0 49 -0 79**Wing 0. 76* -0 92** -0 44 0 13Leg -0. 09 -0 09 -0 79** 08
* P<.05** P < .01
cannot comment directly on this hypothesisusing data presented here, I would predict
that closely related species would show
similar male/female dominance relationships.
Yet 1n this study, there was no tendency for
congeneric species to show related levels or
patterns of dimorphism.
The Snowy Owl and the Short-eared Owl are
both migratory, open-country birds. They thus
differ dramatically from the rest of the owls
considered here which are relatively sedentaryf orest-dwel 1 1ng species. Despite these majorecological differences, RSD values for Snowy
and Short-eared Owls are very different and 1n
no way distinctive from the f orest-dwel 1 1ng
species. If these major ecologicaldifferences are not reflected 1n levels of
RSD, how likely 1s 1t that subtle ecological
factors such as: (1) variation 1n prey agility(Andersson and Norberg 1981, Saflna 1984,
Temeles 1985); (2) mode of nest defense
(Wlklund and Stlgh 1983); or (3) flightperformance (Reynolds 1972, Andersson andNorberg 1981) are the key to understandingInterspecific variation 1n levels of RSD
.
Combining Individual skeletal elementsInto groups 1s useful 1n comparing relativelevels of dimorphism for different parts of
63

PC 2
6-
5
4
3
2
1 -
0 -
-1
-2
-3
-4
-5
Glaucidium gnoma
Asio otus
Strixv|ria
* Surniaulula
Aegol ius
acadicus
Asio flammeus
Bubovirginianus
Nycteascandiaca
Strix nebulosa
Aegol ius
funereus
T"•5.0 •3.5 -2.0 -0.5
I
1.0
I
2.5 4.0 5.5
PC1
7.0
Figure 2. --Plot of species means on principal components 1 and 2 based on skeletal
characters and a variety of ecological measures. PCI appears to serve as an axis of RSD.
the skeleton. It 1s clear from Table 3, thatskull elements are less dimorphic than eitherbody core or Umb elements. McG1ll1vray
(1985) suggested that relatively wide skulls
1n Great Horned Owl males might Improve theirability to locate prey by sound. Evidence for
this 1s not as convincing 1n other specieswith only A*>io otu* showing negative RSD
(males larger than females) for skull width.
From a strict statistical standpoint,there was no correlation between RSD forcharacter complexes and RSD for weight betweenmales and females. However, I believe this 1s
misleading because the correlation of bodycore characters and wing characters with RSDfor weight are (.60) just below the .05 levelof 0.63; and several component characters(coracoid, sternum, keel, carpometacarpus)show significant correlations. It would bevery surprising from a theoretical standpointto not find a relationship between skeletaldimensions and weight (Schmidt-Nielsen 1984).This relationship 1s further supported by theprincipal component analysis 1n which the onlyvariable related to overall skeletaldimorphism was the percent weight differencebetween males and females.
The association on PC2 between low levelsof skull dimorphism and a high Insect, lowmammal diet 1s Intriguing but the plot (F1g.
2) reveals that this axis 1s created bygSaucbdium gnoma which diverges dramaticallyfrom the rest of the species. Overall there1s Uttle support for the role of diet 1n
modifying RSD which confirms Mueller's (1986)conclusion.
There are consistent shape differencesbetween males and females of the species
considered here. Males have relatively larger
skulls but smaller body core and wingelements. However, Table 6 shows that these
shape differences, with the exception of body
core measures, are a function of size. In
other words, there 1s no evidence for shape
variation between males and females which 1s
consistent with differing ecological roles.
Table 6 (and 5) also Indicate that despitetheir different habitat and behavior, these 10
species show virtually no shape differencesother than those associated with size. The
only exception appears to be leg elements
where Interesting variation 1s found. For
Instance the tarsometatarsus 1s very short 1n
both Ylyctea scandiaca and Surnia uiuta
relative to their overall size. The link
between prey size, habitat, and climate and
leg size 1n owls 1s worth further examination.
CONCLUSIONS AND RECOMMENDATIONS
The rank ordering of these 10 species by
RSD as estimated on PCI (F1g. 2) differs fromthe findings of Mueller (1986) and Earhart and
Johnson (1970). However, 1n both these
previous works the rank order depended on the
variable used to measure RSD. For bothstudies, the correlation between RSD measuredby wing and that measured by weight 1n NorthAmerican owls 1s 0.78 (n=18, Mueller 1986;
n=26, Earhart and Johnson 1970). This value1s highly significant but 1t shows that only
61 percent of the variation 1n one measure can
be accounted for by the other. W1ng length
64
has been shown to be a poor measure of size 1n
RSO studies (McGlllivray 1985, Mueller 1986)
and 1t was not considered here. Mueller
(1986) concludes that weight 1s the best
measure to use 1n estimating RSO. In this
study RSO 1n weight 1s shown to be related to
RSO for some body core and wing elements;
although these correlations are generallyweak. The question 1s: does adequate weightdata on owls exist to continue using weight as
an Index of size? My assessment 1s no based
on three considerations: (1) Wljnandts (1984)has shown that weights for female Long-earedOwls vary as much as 25% during the breedingseason. Females gain considerable weightprior to and during Incubation but lose 1t andmore during the nestling period. Throughoutthis period, the female needs to remain mobilefor nest defense and to escape predatlon,therefore the skeleto-musculature must belarge enough to deal with the extra weight.
(2) Weight data obtained from museumspecimens are biased because most owls areobtained as road kills or accidentalcasualties. These birds are often 1n poorcondition when they died and weights areobtained after much desslcatlon. As well fornorthern species, most Individuals areacquired during migration or during southwardmovements 1n winter. Therefore, weight dataare from outside the breeding season whichlikely underepresents the extent of weightdimorphism (Wljnandts 1984, McG1ll1vray1985). An example from this study 1s forTlyctea Acandiaca, for which virtually all
specimens 1n North American museums are winterbirds. The level of RSD for skeletal measuresfor Snowy Owls 1s very high (second only toAevotiuA funereu*) yet the level for weight 1s
only 17.8% which ranks 3rd lowest among the 10species. I would predict that weightdimorphism for Snowy Owls would beconsiderably higher than 17.8% 1f measuredduring the breeding season.
(3) All the weight data used are from onesource. Mueller (1986) cites Dunning (1984)but Dunning obtained weights from Snyder andWiley (1976) who used data from Earhart andlohnson (1970). For studies of RSD 1n NorthAmerican owls, all the weight data originatewith Earhart and Johnson (1970). Given ourunderstanding of geographic variation 1n manyspecies, and potential biases associated withmuseum specimens, a larger data base 1srequired before we have adequate estimates ofRSO in weight.
My recommendation is that attempts be madeto obtain breeding season weight data such asacquired by Wljnandts (1984), but 1n lieu ofthat to use skeletal measures to estimateRSD. There is a good body of theory Unkingskeletal dimensions to mass (Schmidt-Neilsen1984). Most skeletal differences between maleand female owls examined here appear relatedto mass. A worthwhile area of study would be
an examination of the weight flux female owlsundergo during the breeding season and howthis varies among species. Selection forlarge size might occur 1f the female 1s
required to gain considerable weight duringIncubation. If so, 1t may be necessary to
reconsider the role of ecological factors in
the evolution of RSD.
ACKNOWLEDGMENTS
I thank Dr. Slevert Rohwer, Thomas BurkeMemorial Museum, J1m Dick, Royal OntarioMuseum and Dr. R. Zus1, U.S. National Museumfor loaning specimens under their care.Special thanks are given to Pauline Ericksonfor her assistance 1n measuring many of thespecimens and 1n preliminary data analysis.Colleen Stelnhilber 1s gratefully acknowledgedfor her typing. Dr. J1m Burns preparedFigures 1 and 2 and S. McGlllivray Improvedthe paper with her comments.
LITERATURE CITED
Andersson, M. and R.A. Norberg. 1981.Evolution of reversed sexual sizedimorphism and role partitioning amongpredatory birds, with a size scaling of
flight performance. Biol. J. Linn. Soc.15: 105-130.
Atchley, W.R., C.T. Gasklns, and D. Anderson.1976. Statistical properties of ratiosI. Emperical results. Syst. Zool. 25:
137-148.Cherry, L.M., S.M. Case, J.G. Kunkel, J.S.
Wyles and A.C. Wilson. 1982. Body shapemetrics and organlsmal evolution.Evolution 36: 914-933.
Dunning, J.B. Jr. 1984. Body weights of 686species of North American birds. West.Bird Band. Assoc. Monogr. 1.
Earhart, CM. and N.K. Johnson. 1970. Sizedimorphism and food habits of NorthAmerican owls. Condor 72: 251-264.
Jehl, J.R. and B.G. Murray, Jr. 1986. Theevolution of normal and reverse sexualsize dimorphism in shoreblrds and otherbirds. Current Ornlthol. 3: 1-86.
Johnston, R.F. and R.C. Fleischer. 1981.Overwinter mortality and sexual size
dimorphism 1n the House Sparrow. Auk 98:
503-511
.
McGlllivray, W.B. 1985. Size, sexual sizedimorphism and their measurement 1n GreatHorned Owls in Alberta. Can. J. Zool.63: 2364-2372.
Moslmann, J.E. 1970. Size allometry: size andshape variables with characterizations ofthe lognormal and generalized gammadistributions. J. Am. Stat. Assoc. 65:930-945.
65
Mueller, H.C. 1986. The evolution of reversedsexual dimorphism 1n owls: an empiricalanalysis of possible selective factors.Wilson Bull. 98: 387-406.
Mueller, H.C. and K. Meyer. 1985. Theevolution of reversed sexual dimorphism 1n
size: A comparative analysis of theFalconlformes of the western Palearctlc.Current Ornlthol. 2: 65-101.
Payne, R.B. 1984. Sexual selection, lek andarena behavior and sexual dimorphism 1n
birds. Ornlthol. Monogr. 33: 1-42.
Reyment, R.A., R.E. Blacklth and N.A.
Campbell. 1984. Multivariatemorphometries. 2nd ed. Academic Press,
London, England.Reynolds, R.T. 1972. Sexual dimorphism 1n
acdplter hawks: a new hypothesis. Condor74: 191-197.
Saflna, C. 1984. Selection for reduced malesize 1n raptorial birds: the possibleroles of female choice and mate guarding.01kos 43: 159-164.
SAS Institute. 1985. SAS user's guide:statistics. SAS Institute Inc., Cary, NC.
Schmidt-Nielsen, K. 1984. Scaling: why 1s
animal size so Important? Cambridge Univ.Press, Cambridge.
Schnell, G.D. 1970. A phenetlc study of thesuborder Lar1 (Aves)/I. Methods andresults of principal components analyses.Syst. Zool. 19: 35-57.
Snyder, N.F.R. and J.W. Wiley. 1976. Sexualsize dimorphism 1n hawks and owls of NorthAmerica. Ornlthol. Monogr. 20: 1-96.
Somers, K.M. 1986. Multivariate allometry andremoval of size with principal componentsanalysis. Syst. Zool. 35: 359-368.
Storer, R.W. 1966. Sexual dimorphism and foodhabits 1n three North Americanacdplters. Auk 83: 423-436.
Temeles, E.J. 1985. Sexual size dimorphism of
b1rd-eat1ng hawks: The effect of preyvulnerability. Amer. Natur. 125: 485-499.
Wljnandts, H. 1984. Ecological energetics of
the Long-eared Owl {Atix> otu*) . Ardea72: 1-92.
Wlklund, C.G. and J. Stlgh. 1983. Nestdefence and evolution of reversed sexual
size dimorphism 1n Snowy Owls Nycteascandlaca. 0rn1s Scand. 14: 58-62.
66

Disease Susceptibility in Owls1
D. Bruce Hunter? Kay McKeever,3 Larry McKeever,3
and Graham Crawshaw 4
Abstract.—Disease may be a significant factorin the population dynamics of free-living species.Subclinical disease may alter food gatheringcapabilities, ability to escape predators andreproductive success. This paper describes threedisease outbreaks in owls: Hippoboscid flyinfestation, Cyathostoma amer icana (gapeworm)infestation and fungal pneumonia, (Aspergillosis) toillustrate that disease can impact recruitment andsurvivability of owls.
INTRODUCTION
Disease is any process whichalters normal body function and resultsin decreased production andsurvivability. Disease may be causedby infectious agents, nutritionaldeficiencies or excesses, environmentaltoxins or genetic or congenitalaccidents. Studies in commerciallivestock and zoological collectionsshow that although some diseases maycause overt sickness and mortality mostdiseases are subclinical and interferewith either normal growth, behavior oralter reproductive success but do notnecessarily kill the host. Commercialanimal production industries go togreat expense to monitor their animalsfor signs of subclinical disease whichmay affect the profitability of theenterprise
.
•Paper presented at the NorthernOwl Symposium. [Winnipeg, Manitoba,February
, 1987]
.
^D. Bruce Hunter is AssociateProfessor of Avian Pathology, OntarioVeterinary College, University ofGuelph, Guelph, Ontario.
^Kay and Larry McKeever are Co-founders of The Owl Rehabilitation andResearch Foundation, Vineland Station,Ontario
.
4Graham Crawshaw is StaffVeterinarian at the MetropolitanToronto Zoo, Toronto, Ontario.
Naturally occurring disease isseldom considered to be an importantfactor in recruitment and livabilityof owls and yet in the presentsymposium data from several speakersshowed survivability in young owls tobe as low as 20% by the second year oflife. "Starvation", "killed by aGreat Horned owl", "fell from the nestsite," eggs failed to hatch" were allgiven as reasons for mortality butcomplete post mortems were seldomperformed to confirm the immediatecause of death or the presence ofconcurrent disease. It is possiblethat subclinical disease, whether dueto hematozoan or ectoparasiteinfestation causing marginal anemia,neonatal bacterial diarrhea orsepticemia, sublethal levels of apesticide, or even limited preyavailability causing subnormal growthefficiency may alter a young owl'sability to secure prey or render theowl more susceptible to predation.Factors which alter survivabilityduring the first year of life areimportant and poorly understood piecesof the natural history puzzle of owls.The following examples of specificdiseases in owls serve to illustratesome of the factors that may influencean owls susceptibility to disease andfurther emphasize that disease canhave a significant effect onsurvivability and recruitment.
67
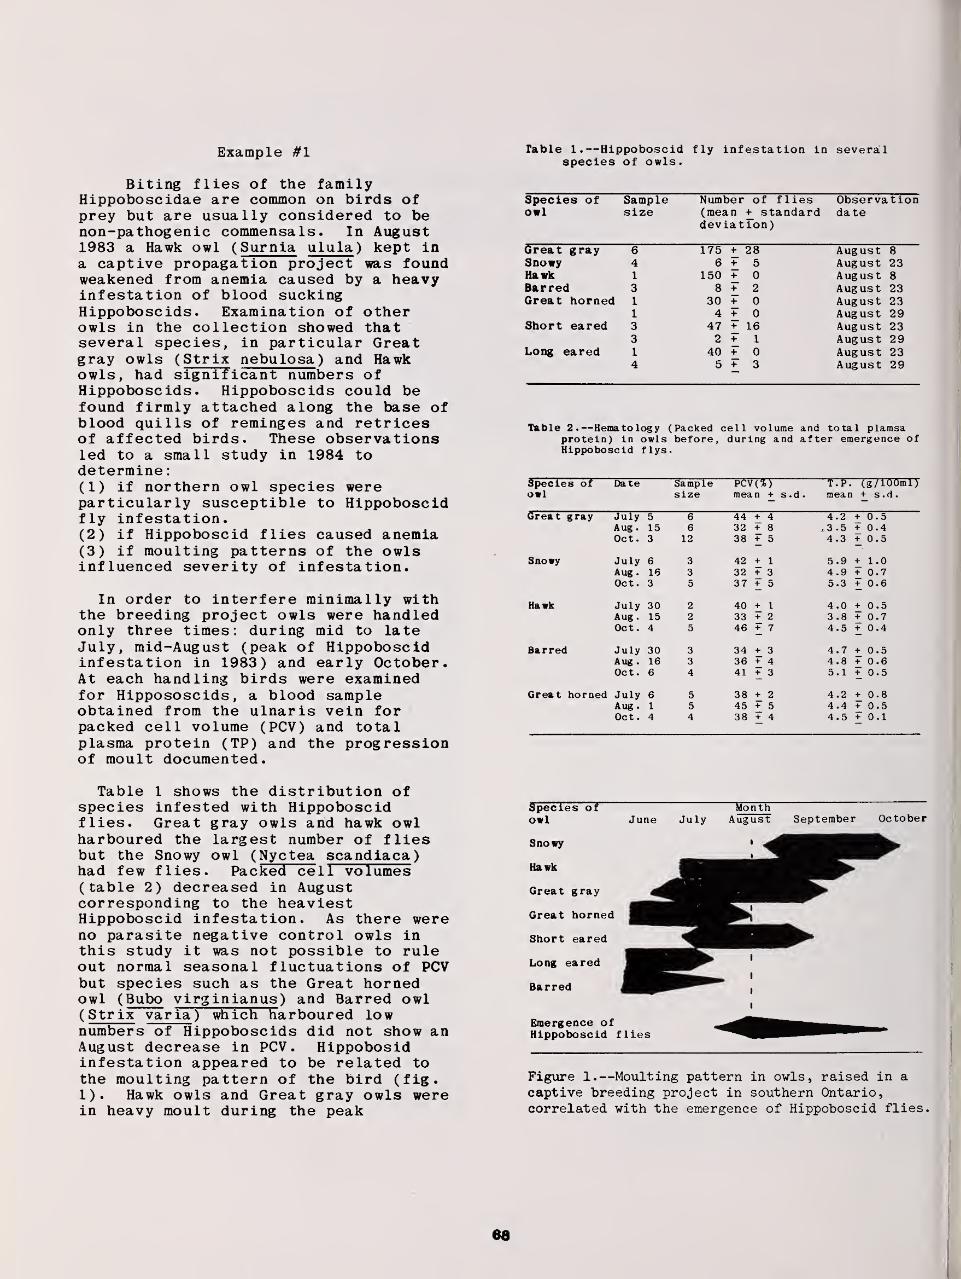
Example #1 Table 1.—Hippoboscid fly infestation in severalspecies of owls.
Biting flies of the familyHippoboscidae are common on birds ofprey but are usually considered to benon-pathogenic commensals. In August1983 a Hawk owl (Surnia ulula ) kept ina captive propagation project was foundweakened from anemia caused by a heavyinfestation of blood suckingHippoboscids. Examination of otherowls in the collection showed thatseveral species, in particular Greatgray owls ( Strix nebulosa ) and Hawkowls, had significant numbers ofHippoboscids. Hippoboscids could befound firmly attached along the base ofblood quills of reminges and retricesof affected birds. These observationsled to a small study in 1984 todetermine
:
(1) if northern owl species wereparticularly susceptible to Hippoboscidfly infestation.(2) if Hippoboscid flies caused anemia(3) if moulting patterns of the owlsinfluenced severity of infestation.
In order to interfere minimally withthe breeding project owls were handledonly three times: during mid to lateJuly, mid-August (peak of Hippoboscidinfestation in 1983) and early October.At each handling birds were examinedfor Hippososcids , a blood sampleobtained from the ulnaris vein forpacked cell volume (PCV) and totalplasma protein (TP) and the progressionof moult documented.
Species of Sample Number of flies Observationowl size (mean + standard date
deviation)
Great gray 6 175 + 28 August 8Snowy 4 6+5 August 23Hawk 1 150 + 0 August 8Barred 3 8+2 Aug ust 23Great horned 1 30+0 August 23
1 4+0 August 29Short eared 3 47 + 16 August 23
3 2+1 August 29Long eared 1 40+0 August 23
4 5+3 August 29
Table 2.—Hematology (Packed cell volume and total plamsaprotein) in owls before, during and after emergence ofHippoboscid flys.
Species of Date Sample PCV<%) T.P. g/lOOml)owl size mean + s.d
.
mean + s.d.
Great gray July 5 6 44 + 4 4.2 + 0.5Aug
.
15 6 32 8 c3.5 + 0.4Oct. 3 12 38 + 5 4.3 0.5
Snowy July 6 3 42 + 1 5.9 + 1.0Aug
.
18 3 32 + 3 4.9 + 0.7Oct. 3 5 37 + 5 5.3 + 0.6
Hawk July 30 2 40 + 1 4.0 + 0.5Aug
.
15 2 33 + 2 3 .8 + 0.7Oct. 4 5 46 7 4.5 + 0.4
Barred July 30 3 34 + 3 4.7 + 0.5Aug . 16 3 36 + 4 4.8 + 0.6Oct. 6 4 41 + 3 5.1 + 0.5
Great horned July 6 5 38 + 2 4.2 + 0.8Aug
.
1 5 45 + 5 4.4 + 0.5Oct. 4 4 38 + 4 4.5 0.1
Table 1 shows the distribution ofspecies infested with Hippoboscidflies. Great gray owls and hawk owlharboured the largest number of fliesbut the Snowy owl ( Nyctea scandiaca)had few flies. Packed cell volumes(table 2) decreased in Augustcorresponding to the heaviestHippoboscid infestation. As there wereno parasite negative control owls inthis study it was not possible to ruleout normal seasonal fluctuations of PCVbut species such as the Great hornedowl ( Bubo virg inianus ) and Barred owl( Strix var ia ) which harboured lownumbers of Hippoboscids did not show anAugust decrease in PCV. Hippobosidinfestation appeared to be related tothe moulting pattern of the bird (fig.1). Hawk owls and Great gray owls werein heavy moult during the peak
Species of Monthowl June July August September October
Figure 1.—Moulting pattern in owls, raised in acaptive breeding project in southern Ontario,correlated with the emergence of Hippoboscid flies.
68
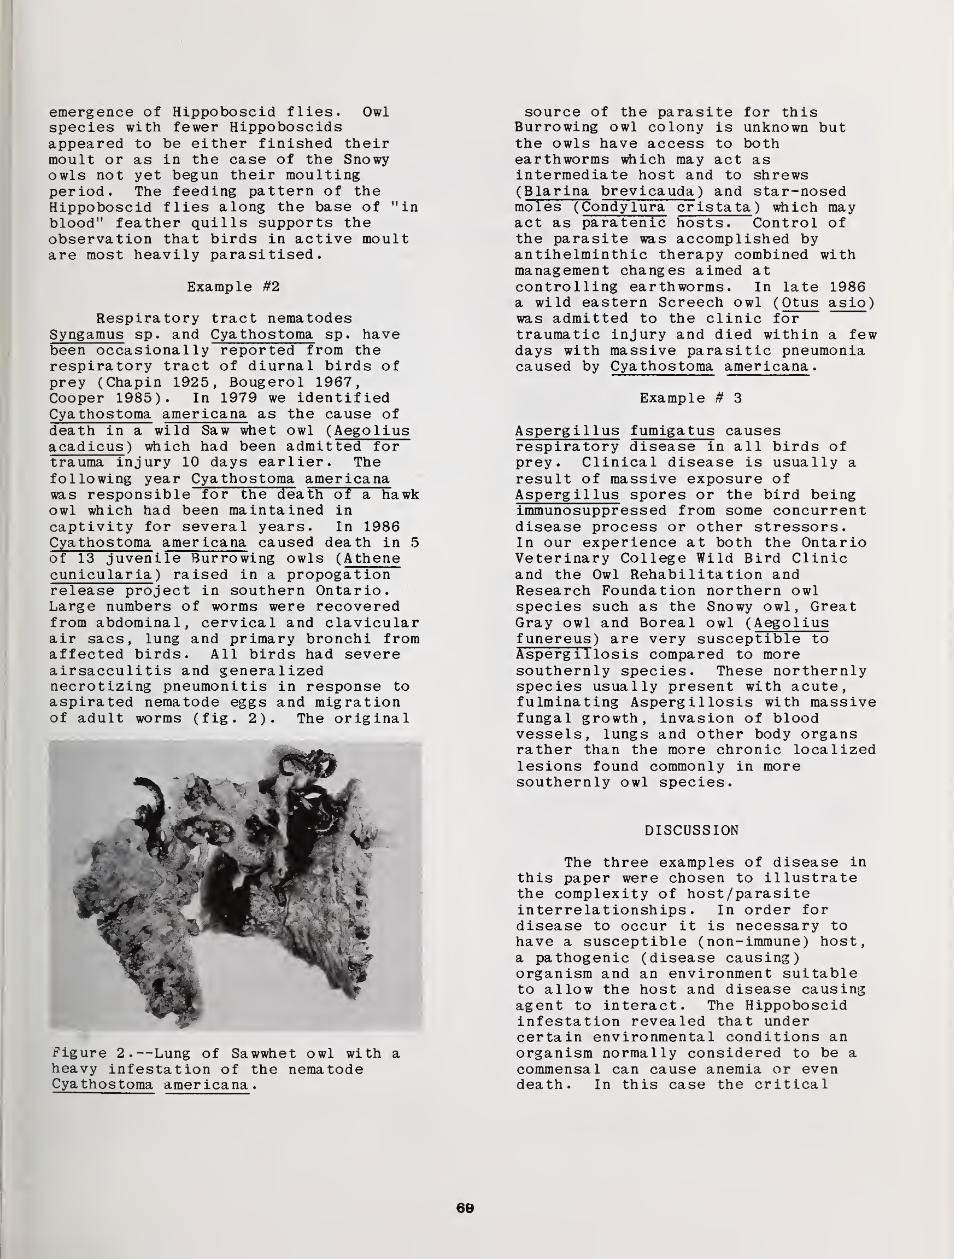
emergence of Hippoboscid flies. Owlspecies with fewer Hippoboscidsappeared to be either finished theirmoult or as in the case of the Snowyowls not yet begun their moultingperiod. The feeding pattern of theHippoboscid flies along the base of "inblood" feather quills supports theobservation that birds in active moultare most heavily parasitised.
Example #2
Respiratory tract nematodesSyngamus sp. and Cyathostoma sp. havebeen occasionally reported from therespiratory tract of diurnal birds ofprey (Chapin 1925, Bougerol 1967,Cooper 1985). In 1979 we identifiedCyathostoma amer icana as the cause ofdeath in a wild Saw whet owl ( Aegoliusacadicus ) which had been admitted fortrauma injury 10 days earlier. Thefollowing year Cyathostoma amer icanawas responsible for the death of a hawkowl which had been maintained incaptivity for several years. In 1986Cyathostoma amer icana caused death in 5of 13 juvenile Burrowing owls ( Athenecunicular ia ) raised in a propogationrelease project in southern Ontario.Large numbers of worms were recoveredfrom abdominal, cervical and clavicularair sacs, lung and primary bronchi fromaffected birds. All birds had severeairsacculitis and generalizednecrotizing pneumonitis in response toaspirated nematode eggs and migrationof adult worms (fig. 2). The original
Figure 2.—Lung of Sawwhet owl with aheavy infestation of the nematodeCyathostoma americana.
source of the parasite for thisBurrowing owl colony is unknown butthe owls have access to bothearthworms which may act asintermediate host and to shrews( Blar ina brevicauda ) and star-nosedmoles ( Condylura crista ta ) which mayact as paratenic hosts. Control ofthe parasite was accomplished byantihelminthic therapy combined withmanagement changes aimed atcontrolling earthworms. In late 1986a wild eastern Screech owl (Otus asio)was admitted to the clinic fortraumatic injury and died within a fewdays with massive parasitic pneumoniacaused by Cyathostoma americana .
Example # 3
Asperg il lus fumigatus causesrespiratory disease in all birds ofprey. Clinical disease is usually a
result of massive exposure ofAspergillus spores or the bird beingimmunosuppressed from some concurrentdisease process or other stressors.In our experience at both the OntarioVeterinary College Wild Bird Clinicand the Owl Rehabilitation andResearch Foundation northern owlspecies such as the Snowy owl, GreatGray owl and Boreal owl ( Aegoliusfunereus ) are very susceptible toAspergillosis compared to moresouthernly species. These northernlyspecies usually present with acute,fulminating Aspergillosis with massivefungal growth, invasion of bloodvessels, lungs and other body organsrather than the more chronic localizedlesions found commonly in moresouthernly owl species.
DISCUSSION
The three examples of disease inthis paper were chosen to illustratethe complexity of host/parasiteinterrelationships. In order fordisease to occur it is necessary tohave a susceptible (non-immune) host,a pathogenic (disease causing)organism and an environment suitableto allow the host and disease causingagent to interact. The Hippoboscidinfestation revealed that undercertain environmental conditions anorganism normally considered to be acommensal can cause anemia or evendeath. In this case the critical
68

environmental factors included theemergence of the Hippoboscid flies andthe timing of the seasonal moult of thebirds. Most of the owls developed amarginal anemia during the period ofinfestation. It is interesting tospeculate whether a similar mild anemiain a wild owl would decrease foodgathering ability or increasesusceptibility to predation. Manyraptors presented to our clinic have amarginal anemia and moderate to lowlevels of blood parasites, particularlyHemoproteus sp. and Leucocytozoon sp.As these agents are transmitted bybiting arthropods it would beinteresting to study nestling owlswhich are commonly infested withmosquitoes or black flies to determineif parasite induced hematologic changesmay correlate with fledglingsurvivability
.
The death of the captive Burrowingowls and the wild Sawwhet and Screechowl indicate that Cyathostoma americanais a potential pathogen. The highmortality in the Burrowing owl colonywas undoubtably related to housing andconfinement of the birds; however,identifying Cyathostoma as the cause ofdeath in wild Ontario owls raisesquestions about the significance ofthis parasite in owl species which feedon earthworms, shrews or moles.
Aspergillosis is well described inmany avian species. Our experienceshave shown that northernly species suchas the Snowy owl, Hawk owl, Gyr falcon( Fa Icq rusticolus ) , Rough-legged hawk( Buteo lagopus ) , Eider duck ( Somater iasp.), Old Squaw duck ( Clangulahyemalis ) are very susceptible tofungal infections. This may be due toa lack of exposure to fungal spores intheir home environment, toimmunosuppression from migratorystressors, nutrition changes orstresses within our hospitalenvironments. There have been no
studies to investigate comparativeimmune responses among species ofowls
.
In summary disease processes mayaffect species population dynamics inmore subtle ways than killing thehost. Subclinical disease may be animportant factor in reproductivesuccess and livability of wild owlpopulations. Our knowledge ofnaturally occurring disease in owls isvery limited and it would be highlydesirable for field biologists andveterinary pathologists to developcooperative studies to investigatethis fascinating aspect of owlbiology.
LITERATURE CITED
Appleby, E.C. 1962. Mycosis of therespiratory tract in penguins.Proceedings of the ZoologicalSociety London 139:495-501.
Bougerol, C. 1967. Essai sur lapathologie des oiseaux de chasseau vol. Alfort, France.
Chapin, E.A. 1925. Review of theNematode genera Syngamus Sieb.and Cysathostoma E. Blanchard.Journal Agricultural Research30 : 557-570.
Cooper, J.E. 1985. Veterinaryaspects of captive birds of prey.The Standfast Press, page 89-90.
Redig, P.T. 19 . Aspergillosis inraptors, p. 117-122. In Recentadvances in the study of raptordiseases. Cooper, J.E. andGreenwood, A.G. editors. ChironPublications, Keighley,Yorkshire.
Sladen, W.J.R., Divers, B.G. andGar ley-Phipps , J.J. 1979. Medicalproblems and treatment of penguinsat the Baltimore Zoo.International Zoo Yearbook 19:202-209.
70
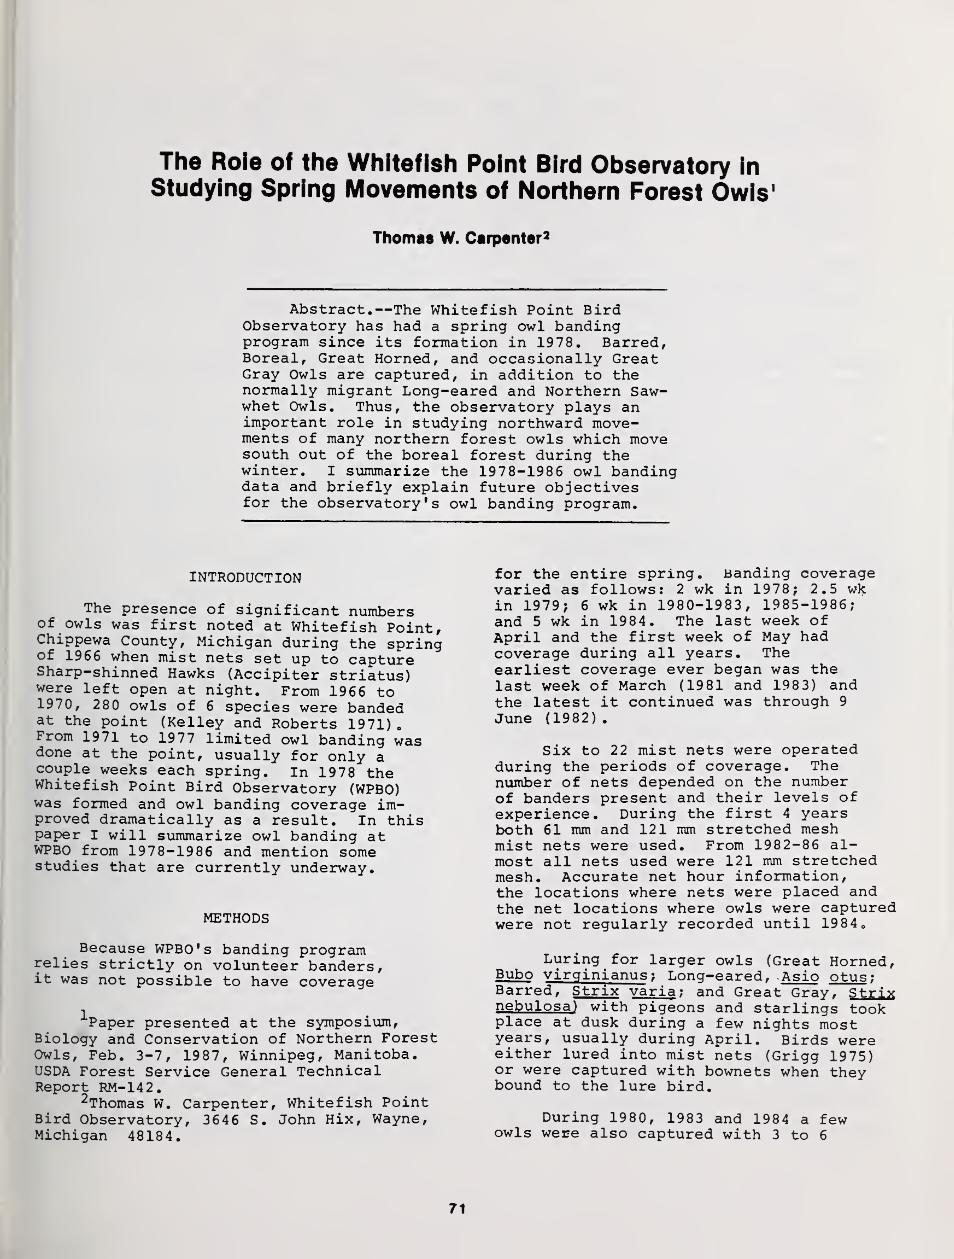
The Role of the Whitefish Point Bird Observatory in
Studying Spring Movements of Northern Forest Owls 1
Thomas W. Carpenter2
Abstract.—The Whitefish Point BirdObservatory has had a spring owl bandingprogram since its formation in 1978. Barred,Boreal, Great Horned, and occasionally GreatGray Owls are captured, in addition to thenormally migrant Long-eared and Northern Saw-whet Owls. Thus, the observatory plays animportant role in studying northward move-ments of many northern forest owls which movesouth out of the boreal forest during thewinter. I summarize the 1978-1986 owl bandingdata and briefly explain future objectivesfor the observatory's owl banding program.
INTRODUCTION
The presence of significant numbersof owls was first noted at Whitefish Point,Chippewa County, Michigan during the springof 1966 when mist nets set up to captureSharp-shinned Hawks (Accipiter striatus)were left open at night. From 1966 to1970, 280 owls of 6 species were bandedat the point (Kelley and Roberts 1971).From 19 71 to 1977 limited owl banding wasdone at the point, usually for only acouple weeks each spring. In 1978 theWhitefish Point Bird Observatory (WPBO)was formed and owl banding coverage im-proved dramatically as a result. In thispaper I will summarize owl banding atWPBO from 1978-1986 and mention somestudies that are currently underway.
METHODS
Because WPBO's banding programrelies strictly on volunteer banders,it was not possible to have coverage
^"Paper presented at the symposium,Biology and Conservation of Northern ForestOwls, Feb. 3-7, 1987, Winnipeg, Manitoba.USDA Forest Service General TechnicalReport RM-142.
2Thomas W. Carpenter, Whitefish PointBird Observatory, 3646 S. John Hix, Wayne,Michigan 48184.
for the entire spring. Banding coveragevaried as follows: 2 wk in 1978; 2.5 wkin 1979; 6 wk in 1980-1983, 1985-1986;and 5 wk in 1984. The last week ofApril and the first week of May hadcoverage during all years. Theearliest coverage ever began was thelast week of March (1981 and 1983) andthe latest it continued was through 9
June (1982).
Six to 22 mist nets were operatedduring the periods of coverage. Thenumber of nets depended on the numberof banders present and their levels ofexperience. During the first 4 yearsboth 61 mm and 121 mm stretched meshmist nets were used. From 1982-86 al-most all nets used were 121 mm stretchedmesh. Accurate net hour information,the locations where nets were placed andthe net locations where owls were capturedwere not regularly recorded until 1984
„
Luring for larger owls (Great Horned,Bubo virginianus ; Long-eared,
-
Asio otus;Barred, Strix varia ; and Great Gray, Strixnebulosa) with pigeons and starlings tookplace at dusk during a few nights mostyears, usually during April. Birds wereeither lured into mist nets (Grigg 1975)or were captured with bownets when theybound to the lure bird.
During 1980, 1983 and 1984 a fewowls were also captured with 3 to 6
71
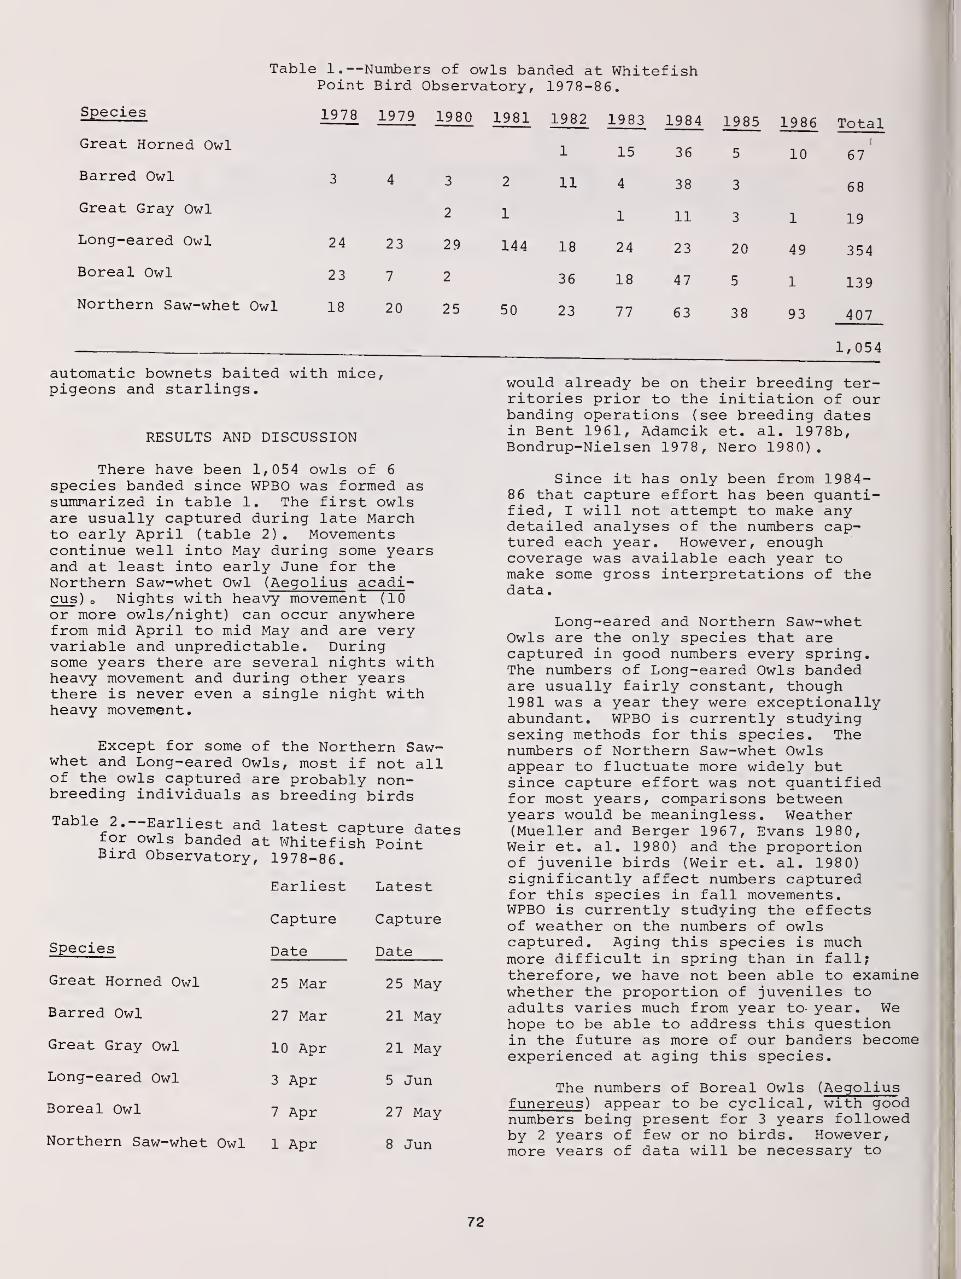
Table 1.—Numbers of owls banded at WhitefishPoint Bird Observatory, 1978-86.
Species 1978 1979 1980 1981 1982 1983 1984 1985 1986 L KJ Lu _L
Great Horned Owl 1 15 36 5[
D /
Barred Owl 3 4 3 2 11 4 38 3 68
Great Gray Owl 2 1 1 11 3 1 19
Long-eared Owl 24 23 29 144 18 24 23 20 A Q J D 4
Boreal Owl 23 7 2 36 18 47 5 1 139
Northern Saw-whet Owl 18 20 25 50 23 77 63 38 93 407
1,054
automatic bownets baited with mice,pigeons and starlings.
RESULTS AND DISCUSSION
There have been 1,054 owls of 6
species banded since WPBO was formed assummarized in table 1. The first owlsare usually captured during late Marchto early April (table 2) . Movementscontinue well into May during some yearsand at least into early June for theNorthern Saw-whet Owl (Aegolius acadi-cus ) o Nights with heavy movement (10or more owls/night) can occur anywherefrom mid April to mid May and are veryvariable and unpredictable. Duringsome years there are several nights withheavy movement and during other yearsthere is never even a single night withheavy movement.
Except for some of the Northern Saw-whet and Long-eared Owls, most if not allof the owls captured are probably non-breeding individuals as breeding birds
Table 2.—Earliest and latest capture datesfor owls banded at Whitefish PointBird Observatory, 1978-86.
Earliest Latest
Capture Capture
Species Date Date
Great Horned Owl 25 Mar 25 May
Barred Owl 27 Mar 21 May
Great Gray Owl 10 Apr 21 May
Long-eared Owl 3 Apr 5 Jun
Boreal Owl 7 Apr 27 May
Northern Saw-whet Owl 1 Apr 8 Jun
would already be on their breeding ter-ritories prior to the initiation of ourbanding operations (see breeding datesin Bent 1961, Adamcik et. al. 1978b,Bondrup-Nielsen 1978, Nero 1980).
Since it has only been from 1984-86 that capture effort has been quanti-fied, I will not attempt to make anydetailed analyses of the numbers cap-tured each year. However, enoughcoverage was available each year tomake some gross interpretations of thedata
.
Long-eared and Northern Saw-whetOwls are the only species that arecaptured in good numbers every spring.The numbers of Long-eared Owls bandedare usually fairly constant, though1981 was a year they were exceptionallyabundant. WPBO is currently studyingsexing methods for this species. Thenumbers of Northern Saw-whet Owlsappear to fluctuate more widely butsince capture effort was not quantifiedfor most years, comparisons betweenyears would be meaningless. Weather(Mueller and Berger 1967, Evans 1980,Weir et. al. 1980) and the proportionof juvenile birds (Weir et. al. 1980)significantly affect numbers capturedfor this species in fall movements.WPBO is currently studying the effectsof weather on the numbers of owlscaptured. Aging this species is muchmore difficult in spring than in fall;therefore, we have not been able to examinewhether the proportion of juveniles toadults varies much from year to year. Wehope to be able to address this questionin the future as more of our banders becomeexperienced at aging this species.
The numbers of Boreal Owls (Aegoliusfunereus ) appear to be cyclical, with goodnumbers being present for 3 years followedby 2 years of few or no birds. However,more years of data will be necessary to
72
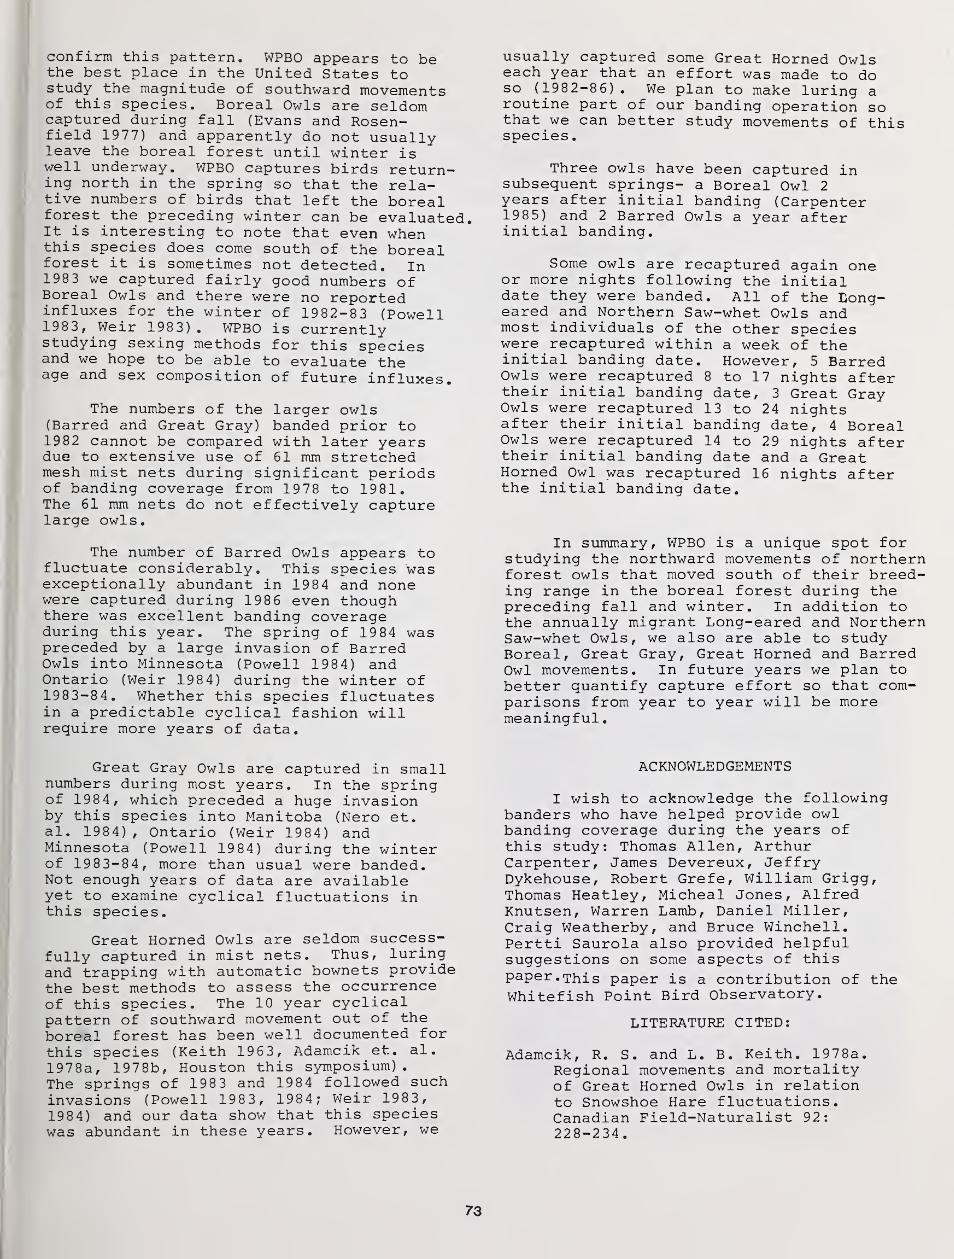
confirm this pattern. WPBO appears to bethe best place in the United States tostudy the magnitude of southward movementsof this species. Boreal Owls are seldomcaptured during fall (Evans and Rosen-field 1977) and apparently do not usuallyleave the boreal forest until winter iswell underway. WPBO captures birds return-ing north in the spring so that the rela-tive numbers of birds that left the borealforest the preceding winter can be evaluated.It is interesting to note that even whenthis species does come south of the borealforest it is sometimes not detected. In1983 we captured fairly good numbers ofBoreal Owls and there were no reportedinfluxes for the winter of 1982-83 (Powell1983, Weir 1983). WPBO is currentlystudying sexing methods for this speciesand we hope to be able to evaluate theage and sex composition of future influxes.
The numbers of the larger owls(Barred and Great Gray) banded prior to1982 cannot be compared with later yearsdue to extensive use of 61 mm stretchedmesh mist nets during significant periodsof banding coverage from 1978 to 1981.The 61 mm nets do not effectively capturelarge owls.
The number of Barred Owls appears tofluctuate considerably. This species wasexceptionally abundant in 19 84 and nonewere captured during 1986 even thoughthere was excellent banding coverageduring this year. The spring of 1984 waspreceded by a large invasion of BarredOwls into Minnesota (Powell 1984) andOntario (Weir 1984) during the winter of1983-84. Whether this species fluctuatesin a predictable cyclical fashion willrequire more years of data.
Great Gray Owls are captured in smallnumbers during most years. In the springof 1984, which preceded a huge invasionby this species into Manitoba (Nero et.al. 1984), Ontario (Weir 1984) andMinnesota (Powell 19 84) during the winterof 1983-84, more than usual were banded.Not enough years of data are availableyet to examine cyclical fluctuations inthis species.
Great Horned Owls are seldom success-fully captured in mist nets. Thus, luringand trapping with automatic bownets providethe best methods to assess the occurrenceof this species. The 10 year cyclicalpattern of southward movement out of theboreal forest has been well documented forthis species (Keith 1963, Adamcik et. al.1978a, 1978b, Houston this symposium)
.
The springs of 1983 and 1984 followed suchinvasions (Powell 1983, 1984; Weir 1983,1984) and our data show that this specieswas abundant in these years. However, we
usually captured some Great Horned Owlseach year that an effort was made to doso (1982-86) . We plan to make luring aroutine part of our banding operation sothat we can better study movements of thisspecies
.
Three owls have been captured insubsequent springs- a Boreal Owl 2years after initial banding (Carpenter1985) and 2 Barred Owls a year afterinitial banding.
Some owls are recaptured again oneor more nights following the initialdate they were banded. All of the Long-eared and Northern Saw-whet Owls andmost individuals of the other specieswere recaptured within a week of theinitial banding date. However, 5 BarredOwls were recaptured 8 to 17 nights aftertheir initial banding date, 3 Great GrayOwls were recaptured 13 to 24 nightsafter their initial banding date, 4 BorealOwls were recaptured 14 to 29 nights aftertheir initial banding date and a GreatHorned Owl was recaptured 16 nights afterthe initial banding date.
In summary, WPBO is a unique spot forstudying the northward movements of northernforest owls that moved south of their breed-ing range in the boreal forest during thepreceding fall and winter. In addition tothe annually migrant Long-eared and NorthernSaw-whet Owls, we also are able to studyBoreal, Great Gray, Great Horned and BarredOwl movements. In future years we plan tobetter quantify capture effort so that com-parisons from year to year will be moremeaningful.
ACKNOWLEDGEMENTS
I wish to acknowledge the followingbanders who have helped provide owlbanding coverage during the years ofthis study: Thomas Allen, ArthurCarpenter, James Devereux, JeffryDykehouse, Robert Grefe, William Grigg,Thomas Heatley, Micheal Jones, AlfredKnutsen, Warren Lamb, Daniel Miller,Craig Weatherby, and Bruce Winchell.Pertti Saurola also provided helpfulsuggestions on some aspects of thispaper. This paper is a contribution of theWhitefish Point Bird Observatory.
LITERATURE CITED:
Adamcik, R. S. and L. B. Keith. 1978a.Regional movements and mortalityof Great Horned Owls in relationto Snowshoe Hare fluctuations.Canadian Field-Naturalist 92:228-234.
73
, A. W. Todd and L. B. Keith.1978b. Demographic and dietaryresponses of Great Horned Owlsduring a Snowshoe Hare cycle.Canadian Field-Naturalist 92:156-166.
Bent, A. C. 1961. Life histories of NorthAmerican birds of prey (part 2)
.
Dover. New York, N. Y.
Bondrup-Nielsen, S. 1978. Vocalizations,nesting and habitat preferences ofthe Boreal Owl (Aegolius funereus)in North America. M. S. thesis.Univ. of Toronto, Toronto, Ontario.
Carpenter, T. W. 1985. Recapture of anon-breeding Boreal Owl 2 yearslater. Raptor Research 19:142.
Evans, D. L. and R. N. Rosenfield. 1977.Fall migration of Boreal Owls.Loon 49:165-167.
. 1980. Multivariate analyses ofweather and fall migration of Saw-whet Owls at Duluth, Minnesota. M. S.thesis, North Dakota State Univ.,Fargo, N. D.
Grigg, W. N. 1975. A proven way ofcatching adult Great Horned Owls.Inland Bird Banding News 47:16-17.
Keith, L. B. 1963. Wildlife's ten yearcycle. Univ. of Wisconsin Press.
Madison, Wise.
Kelley, A. H. and J. O. L. Roberts.1971. Spring migration of owls atWhitefish Point. Jack-Pine Warbler49:65-70.
Mueller, H. C. and D. D. Berger. 1967.
Observations on migrating Saw-whetOwls. Bird-Banding 38:120-125.
Nero, R. W. 198 0. The Great Gray Owl.Smithsonian Institution Press.Washington, D. C.
, h. W. R. Copeland and J. Mezibroski.1984. The Great Gray Owl in Manitoba,1968-83. Blue Jay 42:130-151.
Powell, D. J. 1983. Western Great Lakesregion. American Birds 37:303-306.
. 1984. Western Great Lakes region.American Birds 38:319-321.
Weir, R. D., F. Cooke, M. H. Edwards,and R. B. Stewart. 1980. Fall mi-gration of Saw-whet Owls at PrinceEdwards Point, Ontario. Wilson Bul-letin 92:475-488.
. 1983. Ontario region. AmericanBirds 37:296-299.
. 1984. Ontario region. AmericanBirds 38:310-314.
74
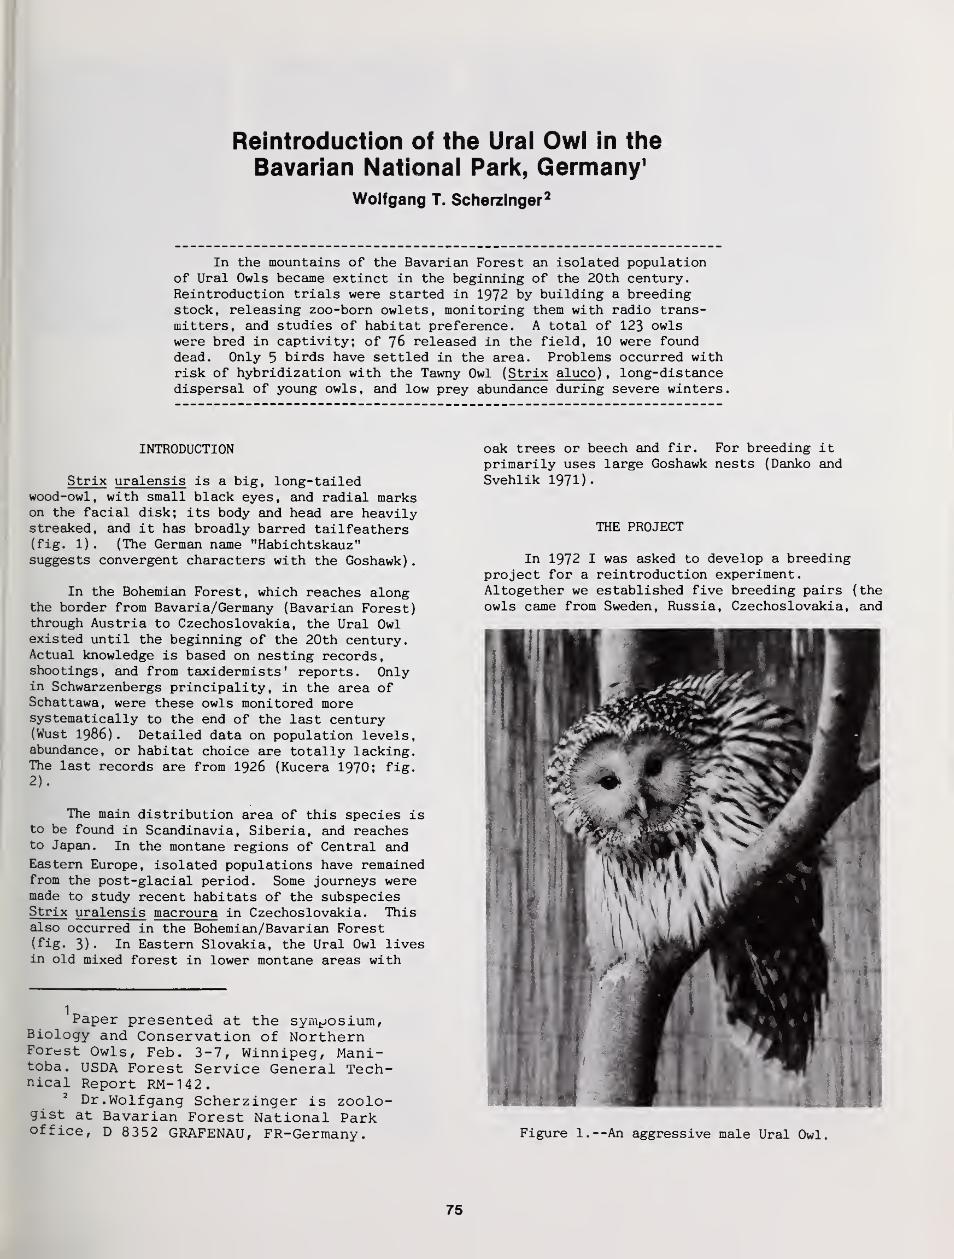
Reintroduction of the Ural Owl in the
Bavarian National Park, Germany 1
Wolfgang T. Scherzlnger 2
In the mountains of the Bavarian Forest an isolated populationof Ural Owls became extinct in the beginning of the 20th century.Reintroduction trials were started in 1972 by building a breedingstock, releasing zoo-born owlets, monitoring them with radio trans-mitters, and studies of habitat preference. A total of 123 owlswere bred in captivity; of 76 released in the field, 10 were founddead. Only 5 birds have settled in the area. Problems occurred withrisk of hybridization with the Tawny Owl ( Strix aluco ) , long-distancedispersal of young owls, and low prey abundance during severe winters.
INTRODUCTION
Strix uralensis is a big, long-tailedwood-owl, with small black eyes, and radial markson the facial disk; its body and head are heavilystreaked, and it has broadly barred tailfeathers(fig. 1). (The German name "Habichtskauz"suggests convergent characters with the Goshawk)
.
In the Bohemian Forest, which reaches alongthe border from Bavaria/Germany (Bavarian Forest)through Austria to Czechoslovakia, the Ural Owlexisted until the beginning of the 20th century.Actual knowledge is based on nesting records,shootings, and from taxidermists' reports. Onlyin Schwarzenbergs principality, in the area ofSchattawa, were these owls monitored moresystematically to the end of the last century(Wust 1986). Detailed data on population levels,abundance, or habitat choice are totally lacking.The last records are from 1926 (Kucera 1970; fig.2).
The main distribution area of this species isto be found in Scandinavia, Siberia, and reachesto Japan. In the montane regions of Central and
Eastern Europe, isolated populations have remainedfrom the post-glacial period. Some journeys weremade to study recent habitats of the subspeciesStrix uralensis macroura in Czechoslovakia. Thisalso occurred in the Bohemian/Bavarian Forest(fig. 3)« In Eastern Slovakia, the Ural Owl livesin old mixed forest in lower montane areas with
Paper presented at the symposium,Biology and Conservation of NorthernForest Owls, Feb. 3-7, Winnipeg, Mani-toba. USDA Forest Service General Tech-nical Report RM-142.
2 Dr. Wolfgang Scherzinger is zoolo-gist at Bavarian Forest National Parkoffice, D 8352 GRAFENAU, FR-Germany.
oak trees or beech and fir. For breeding it
primarily uses large Goshawk nests (Danko andSvehlik 1971).
THE PROJECT
In 1972 I was asked to develop a breedingproject for a reintroduction experiment.Altogether we established five breeding pairs (the
owls came from Sweden, Russia, Czechoslovakia, and
Figure 1.—An aggressive male Ural Owl.
75
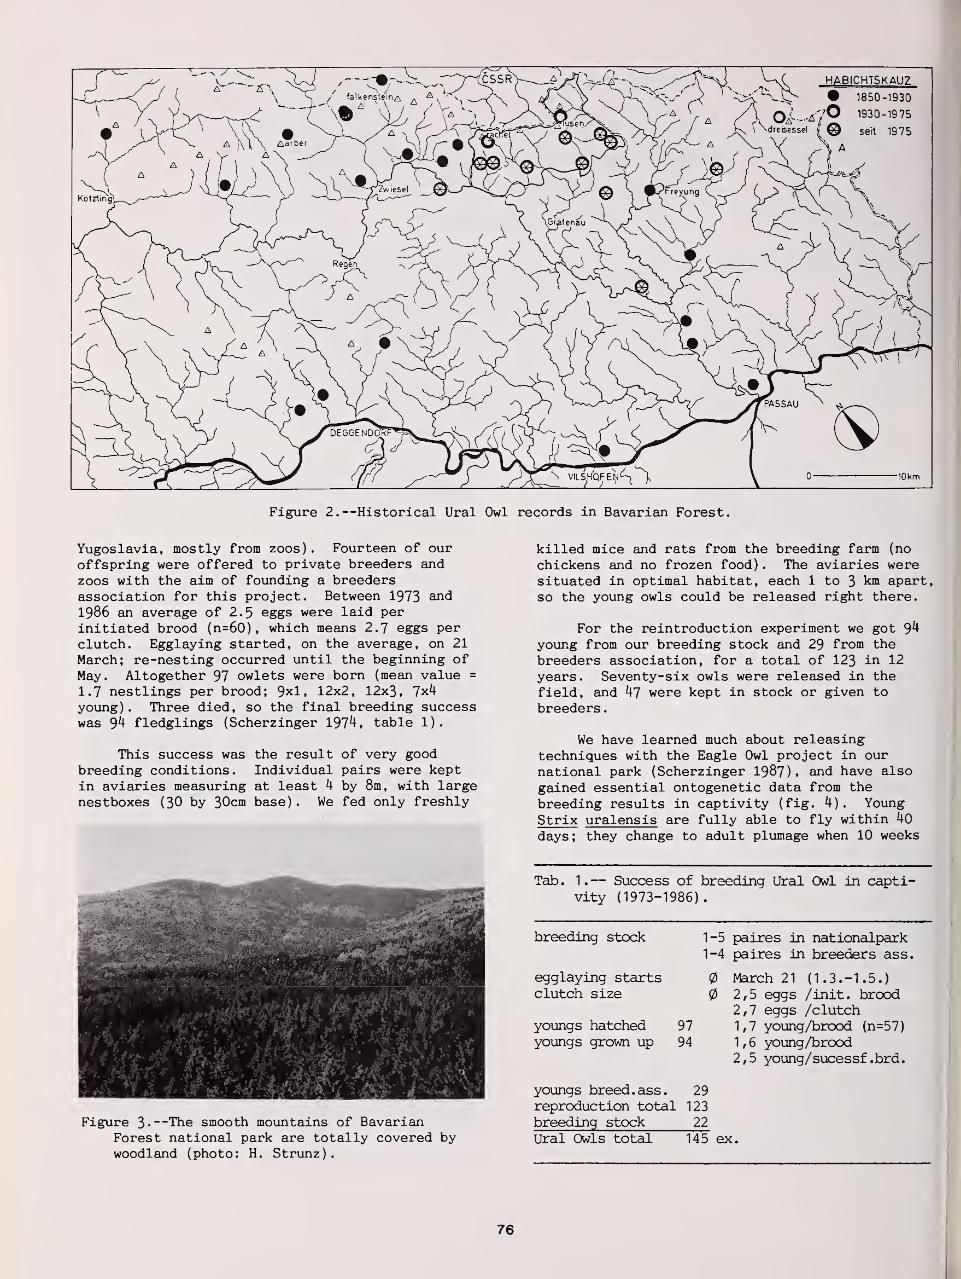
Figure 2.—Historical Ural Owl records in Bavarian Forest.
Yugoslavia, mostly from zoos). Fourteen of ouroffspring were offered to private breeders and
zoos with the aim of founding a breedersassociation for this project. Between 1973 and
1986 an average of 2.5 eggs were laid perinitiated brood (n=60) , which means 2.7 eggs perclutch. Egglaying started, on the average, on 21
March; re-nesting occurred until the beginning ofMay. Altogether 97 owlets were born (mean value =
1.7 nestlings per brood; 9x1, 12x2, 12x3, 7x4young). Three died, so the final breeding successwas 94 fledglings (Scherzinger 1974, table 1).
This success was the result of very goodbreeding conditions. Individual pairs were keptin aviaries measuring at least 4 by 8m, with largenestboxes (30 by 30cm base). We fed only freshly
killed mice and rats from the breeding farm (no
chickens and no frozen food) . The aviaries weresituated in optimal habitat, each 1 to 3 km apart,
so the young owls could be released right there.
For the reintroduction experiment we got 94young from our breeding stock and 29 from the
breeders association, for a total of 123 in 12
years. Seventy-six owls were released in thefield, and 47 were kept in stock or given to
breeders
.
We have learned much about releasingtechniques with the Eagle Owl project in ournational park (Scherzinger 1987), and have also
gained essential ontogenetic data from the
breeding results in captivity (fig. 4). YoungStrix uralensis are fully able to fly within 40
days; they change to adult plumage when 10 weeks
Figure 3«—The smooth mountains of BavarianForest national park are totally covered bywoodland (photo: H. Strunz).
Tab. 1.— Success of breeding Ural Owl in capti-vity (1973-1986).
breeding stock
egglaying startsclutch size
youngs hatchedyoungs grown up
1-5 paires in nationalpark1-4 paires in breeders ass.
0 March 21 (1.3.-1.5.)
0 2,5 eggs /init. brood2,7 eggs /clutch
97 1,7 young/brood (n=57)
94 1,6 young/brood2,5 young/sucessf .brd.
youngs breed. ass. 29reproduction total 123
breeding stock 22
Ural Owls total 145 ex.
76

Figure 4 . --Ontogenetic development of Ural Owl: 2, 16, 30, and 45 days of age.
old; the begging period ends during their 3rdmonth of life. The behavior for catching preydoes not need to be learned (Scherzinger 1980)
.
It is not necessary either to train the owls withlive prey, if they have the opportunity to
frequent a feeding place in the field. Ural Owlsare most aggressive hunters, and feed on their ownprey a few days after release.
The best age for setting them free is between100 and 120 days. In this ontogenetic stage,plumage of adults is fully developed, the familycontext loosens, and the young owls are able to
catch prey independently. During release,avoidance of stress or shock must be considered.Therefore it is necessary to do all themeasurement, banding, and mounting of radios atleast 3"5 days before release, so the birds havetime to reassure themselves. They should bereleased at early dawn on days without wind orprecipitation.
The young should be released beside the cagedparents. When I put them into a small basket madefrom fresh branches outside the aviary, the owlsfree themselves by climbing out after a fewminutes. Usually they spend their first night ina tree above the aviary in contact with the adultowls and brothers and sisters. A supply of knownfood is laid out daily within sight. The owlslearn this place quickly. I will emphasize thatoffering food will not lead to dependence of thebirds; they visit the feeding station only if theyare unsuccessful in catching their own prey.
MONITORING
As long as the young owls utter beggingcalls, their position can easily be located. Butjust at the age of release the social familycontext breaks up and the offspring will disperse.I have not yet been able to develop an optimaltechnique to register systematically the dailylocations of the birds. Owls found dead orobserved incidentally give us hints on their fate.
Of 76 released birds, 10 were found dead (table2) . The lifespan of these owls has averaged only6 months. This suggests that the mortality rateis highest at the end of winter, when bodycondition is at a minimum (extreme data: 46 daysto 5 years). Most of the young owls disperse inautumn before snow cover decreases preyabundance. The average dispersal distance is 10.2
km (extreme data: 2 to 21km)
.
The recovery rate is surprisingly low (13#).
This is on the one hand a fact of difficulty of
survey in dense woodland, and on the other hand of
unapproachable areas, especially in adjacentCzechoslovakia.
As the records of owls in the woodlandsremained unsatisfactory, we have used radiotransmitters from "Biotrack" (R. Kenward/GB)
,
weighing 12g, working for 9-12 months and at a
distance of l~5km (fig. 5)- As the "rucksack"
package could affect the owl's prey-catchingsuccess, and the bird cannot get rid of the
harness after the transmitter fails, we decided to
mount radios on the quills of the middletailfeathers. In this type of radio, the flexibleantenna is fixed along the quills. This methodhas been demonstrated by Kenward (1978) with the
Tab. 2.— Reintroduction of Ural Owl; release
and recoveries (1973-1986)
.
release in 12 years 76 6,3 owls/year(extr.= 0-14)
found dead 10 13%
causes of death 3 starved2 fence1 traffic1 power line
habitat chosen 4 old mixed forest2 forest edge near meadow
distance of dispers. 0 10,2 kms (extr.= 2-20kms)
age of recoverie 0 6 months (extr . = 5 years)
telemetric equippm. 19 ex in 4 years
77
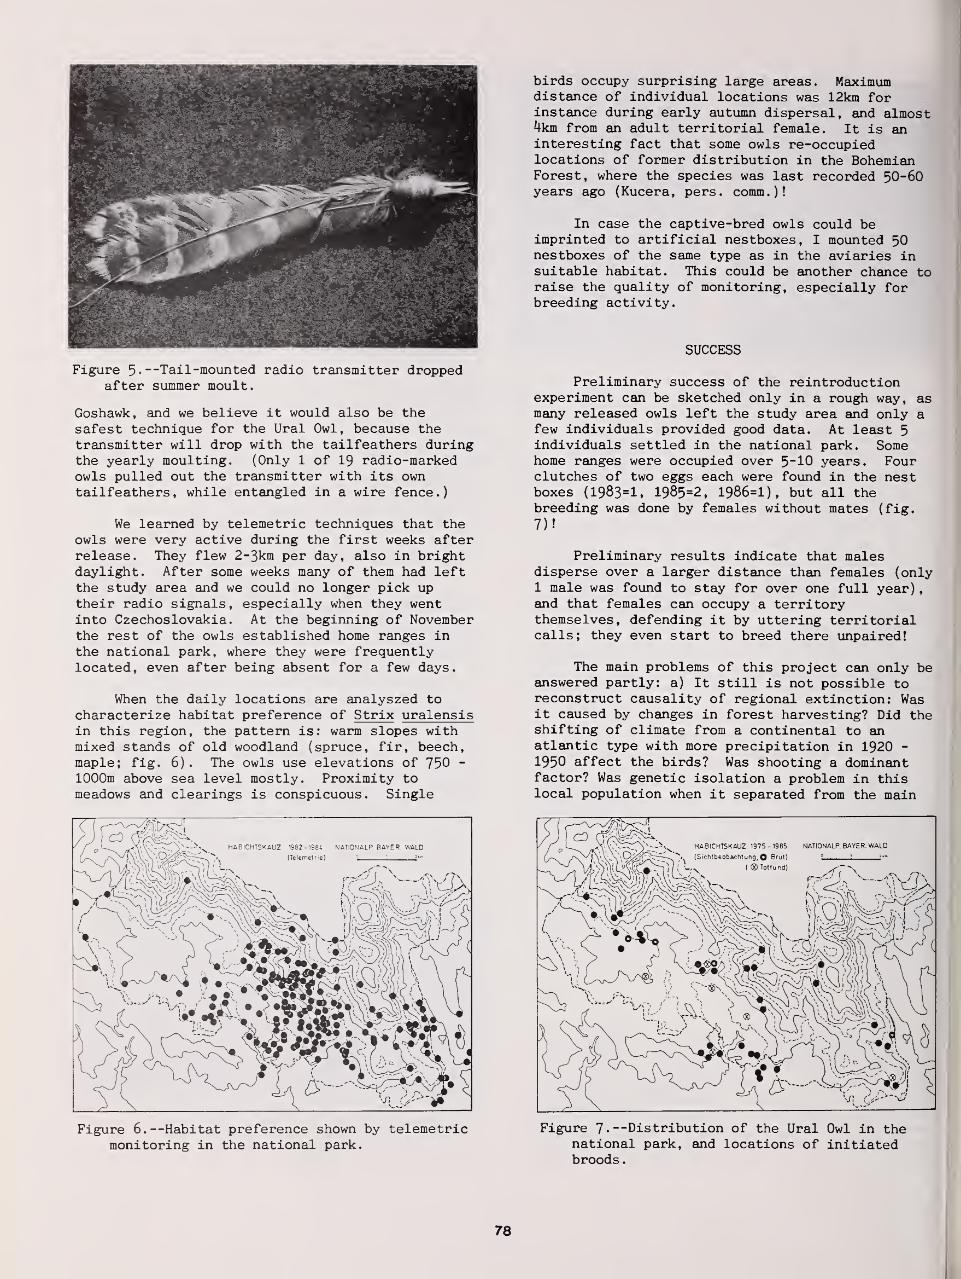
Figure 5-—Tail-mounted radio transmitter droppedafter summer moult.
Goshawk, and we believe it would also be thesafest technique for the Ural Owl, because thetransmitter will drop with the tailfeathers duringthe yearly moulting. (Only 1 of 19 radio-markedowls pulled out the transmitter with its owntailfeathers, while entangled in a wire fence.)
We learned by telemetric techniques that theowls were very active during the first weeks afterrelease. They flew 2~3km per day, also in brightdaylight. After some weeks many of them had leftthe study area and we could no longer pick uptheir radio signals, especially when they wentinto Czechoslovakia. At the beginning of Novemberthe rest of the owls established home ranges inthe national park, where they were frequentlylocated, even after being absent for a few days.
When the daily locations are analyszed tocharacterize habitat preference of Strix uralensisin this region, the pattern is: warm slopes withmixed stands of old woodland (spruce, fir, beech,maple; fig. 6). The owls use elevations of 750 -
1000m above sea level mostly. Proximity tomeadows and clearings is conspicuous. Single
Figure 6. --Habitat preference shown by telemetricmonitoring in the national park.
birds occupy surprising large areas. Maximumdistance of individual locations was 12km forinstance during early autumn dispersal, and almost4km from an adult territorial female. It is aninteresting fact that some owls re-occupiedlocations of former distribution in the BohemianForest, where the species was last recorded 50-60years ago (Kucera, pers. comm.)!
In case the captive-bred owls could beimprinted to artificial nestboxes, I mounted 50nestboxes of the same type as in the aviaries insuitable habitat. This could be another chance toraise the quality of monitoring, especially forbreeding activity.
SUCCESS
Preliminary success of the reintroductionexperiment can be sketched only in a rough way, asmany released owls left the study area and only afew individuals provided good data. At least 5individuals settled in the national park. Somehome ranges were occupied over 5~10 years. Fourclutches of two eggs each were found in the nestboxes (1983=1, 1985=2, 1986=1), but all thebreeding was done by females without mates (fig.
7)!
Preliminary results indicate that malesdisperse over a larger distance than females (only1 male was found to stay for over one full year),and that females can occupy a territorythemselves, defending it by uttering territorialcalls; they even start to breed there unpaired!
The main problems of this project can only beanswered partly: a) It still is not possible toreconstruct causality of regional extinction: Wasit caused by changes in forest harvesting? Did theshifting of climate from a continental to anatlantic type with more precipitation in 1920 -
1950 affect the birds? Was shooting a dominantfactor? Was genetic isolation a problem in thislocal population when it separated from the main
Figure 7. —Distribution of the Ural Owl in thenational park, and locations of initiatedbroods
.
78
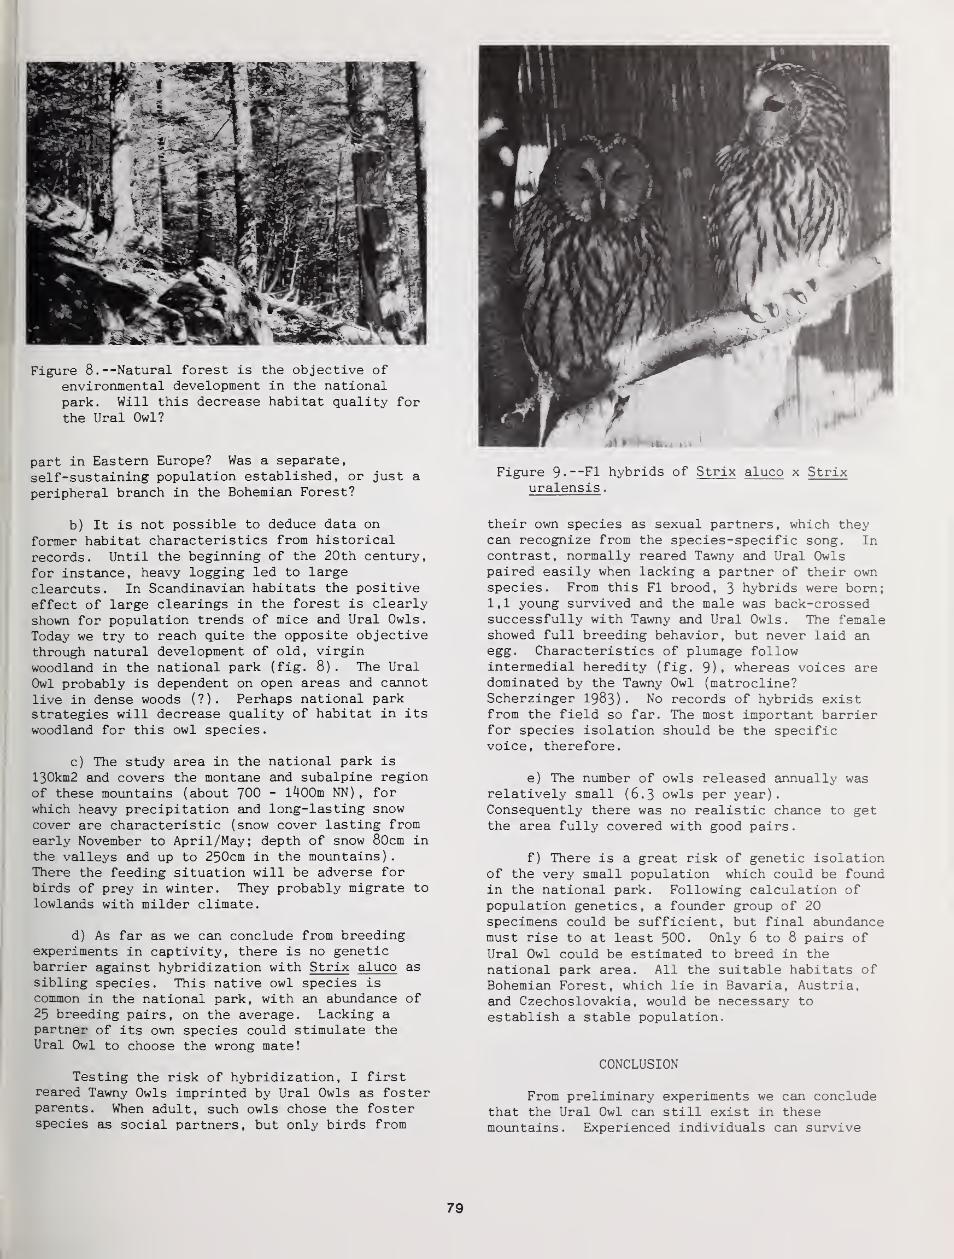
Figure 8. --Natural forest is the objective ofenvironmental development in the nationalpark. Will this decrease habitat quality forthe Ural Owl?
part in Eastern Europe? Was a separate,
self-sustaining population established, or just a
peripheral branch in the Bohemian Forest?
b) It is not possible to deduce data on
former habitat characteristics from historical
records. Until the beginning of the 20th century,
for instance, heavy logging led to large
clearcuts. In Scandinavian habitats the positiveeffect of large clearings in the forest is clearly
shown for population trends of mice and Ural Owls.
Today we try to reach quite the opposite objectivethrough natural development of old, virginwoodland in the national park (fig. 8). The Ural
Owl probably is dependent on open areas and cannot
live in dense woods ( ? ) . Perhaps national parkstrategies will decrease quality of habitat in its
woodland for this owl species.
c) The study area in the national park is
130km2 and covers the montane and subalpine regionof these mountains (about 700 - 1400m NN) , forwhich heavy precipitation and long-lasting snowcover are characteristic (snow cover lasting fromearly November to April/May; depth of snow 80cm inthe valleys and up to 250cm in the mountains).There the feeding situation will be adverse forbirds of prey in winter. They probably migrate tolowlands with milder climate.
d) As far as we can conclude from breedingexperiments in captivity, there is no geneticbarrier against hybridization with Strix aluco assibling species. This native owl species iscommon in the national park, with an abundance of25 breeding pairs, on the average. Lacking apartner of its own species could stimulate theUral Owl to choose the wrong mate!
Testing the risk of hybridization, I firstreared Tawny Owls imprinted by Ural Owls as fosterparents. When adult, such owls chose the fosterspecies as social partners, but only birds from
Figure S.—Fl hybrids of Strix aluco x Strixuralensis .
their own species as sexual partners , which theycan recognize from the species-specific song. Incontrast, normally reared Tawny and Ural Owlspaired easily when lacking a partner of their ownspecies. From this Fl brood, 3 hybrids were born;1 , 1 young survived and the male was back-crossedsuccessfully with Tawny and Ural Owls. The femaleshowed full breeding behavior, but never laid anegg. Characteristics of plumage followintermedial heredity (fig. 9). whereas voices aredominated by the Tawny Owl (matrocline?Scherzinger 1983) . No records of hybrids existfrom the field so far. The most important barrierfor species isolation should be the specificvoice, therefore.
e) The number of owls released annually wasrelatively small (6.3 owls per year).Consequently there was no realistic chance to getthe area fully covered with good pairs.
f) There is a great risk of genetic isolationof the very small population which could be foundin the national park. Following calculation ofpopulation genetics, a founder group of 20specimens could be sufficient, but final abundancemust rise to at least 500. Only 6 to 8 pairs ofUral Owl could be estimated to breed in thenational park area. All the suitable habitats ofBohemian Forest, which lie in Bavaria, Austria,and Czechoslovakia, would be necessary to
establish a stable population.
CONCLUSION
From preliminary experiments we can concludethat the Ural Owl can still exist in thesemountains . Experienced individuals can survive
79

even under severe winter conditions, when there isheavy snow cover. In the future it will benecessary to release at least 15 - 20 individualsper year, probably from more wide-spreadlocations, to compensate for dispersal movements.Therefore we must create a larger breeding stock,either by enlarging the breeders association incooperation with zoos and pet lovers, or by
enlarging our breeding station in the nationalpark. This second way is very expensive and hasbeen cancelled by our office this year. Thereforethe resumption of reintroduction of the Ural Owlin the Bavarian Forest is at stake. The finaldecision will depend on results of an intensifiedmonitoring project of radio-marked owls during thenext years.
80
Mate and Nest-Site Fidelity in Ural and Tawny Owls 1
Pertti Saurola2
Abstract. —This study is based on Finnish ringrecoveries and retraps . The data suggests that 98-100% of Ural Owl (Strix uralensis) males, 90-95% ofthe females, and 80-90% of both sexes of the TawnyOwl (Strix aluco) are faithful to their previousnest site. Fidelity to the mate seems to be almostabsolute (95-97%) in the Ural Owl, but less (80-85%)in the Tawny Owl
.
INTRODUCTION
Owls are very popular among the sub-jects for Finnish bird ringers. More than12 500 nest-boxes for owls and 3500 naturalholes are checked annually (Haapala andSaurola 1986), and more than 10 000 owlswere ringed in 1986, the top year so far(table 1) . This enthusiasm provides us withrelevant data on the biology of owls.
Fidelity to the nest site and fidelityto the mate are life history characteris-tics which vary from species to species. Inmany studies on population ecology of aspecies (mortality studies, studies onlife-time reproductive output etc.), know-ledge about these strategies are of vitalimportance
.
Although very little hard data havebeen published, it is more or less a dogma,that both the Ural Owl and the Tawny Owlare very faithful to their breeding sites,and that their pair-bond is life long (e.g.Mikkola 1983)
.
In this paper, I first describe themethods for capturing adults of thesespecies at the nest and then discuss nestsite and mate fidelity based on the Finnishring recovery and retrap data.
Table 1.—Ringing of owls in Finland in1986, and grand totals 1913-1986.
1986 1913-1986pullus full- total
grown
Eagle OwlBubo bubo 719 4 4760
Snowy OwlNyctea scandiaca 14
Hawk OwlSurnia ulula 140 16 1246
Pygmy OwlGlauc. passerinum 45 63 919
Tawny OwlStrix aluco 1201 143 19383
Ural OwlStrix uralensis 1569 120 12067
Great Grey OwlStrix nebulosa 9 1 796
Long-eared OwlAsio otus 530 162 6391
Short-eared OwlAsio flammeus 231 13 3386
Tengmalm's OwlAegol . funereus 4044 1797 36120
Total 8488 2319 85016
MATERIAL AND METHODS
^Paper presented at the NorthernForest Owl Symposium. [Winnipeg, Manitoba,Canada, February 3-7, 1987]
.
2Pertti Saurola is the Head of FinnishRinging Centre, University of Helsinki,Helsinki, Finland.
Capturing Adults at the Nest
If the nest is in a nest-box or simi-lar natural cavity, the females can usuallybe captured very easily. If the opening ofthe box/cavity is covered by a capaciousbutterfly net, the female either tries toescape and jumps into the net, or stays inthe nest, from which she can readily betaken by hand.
81
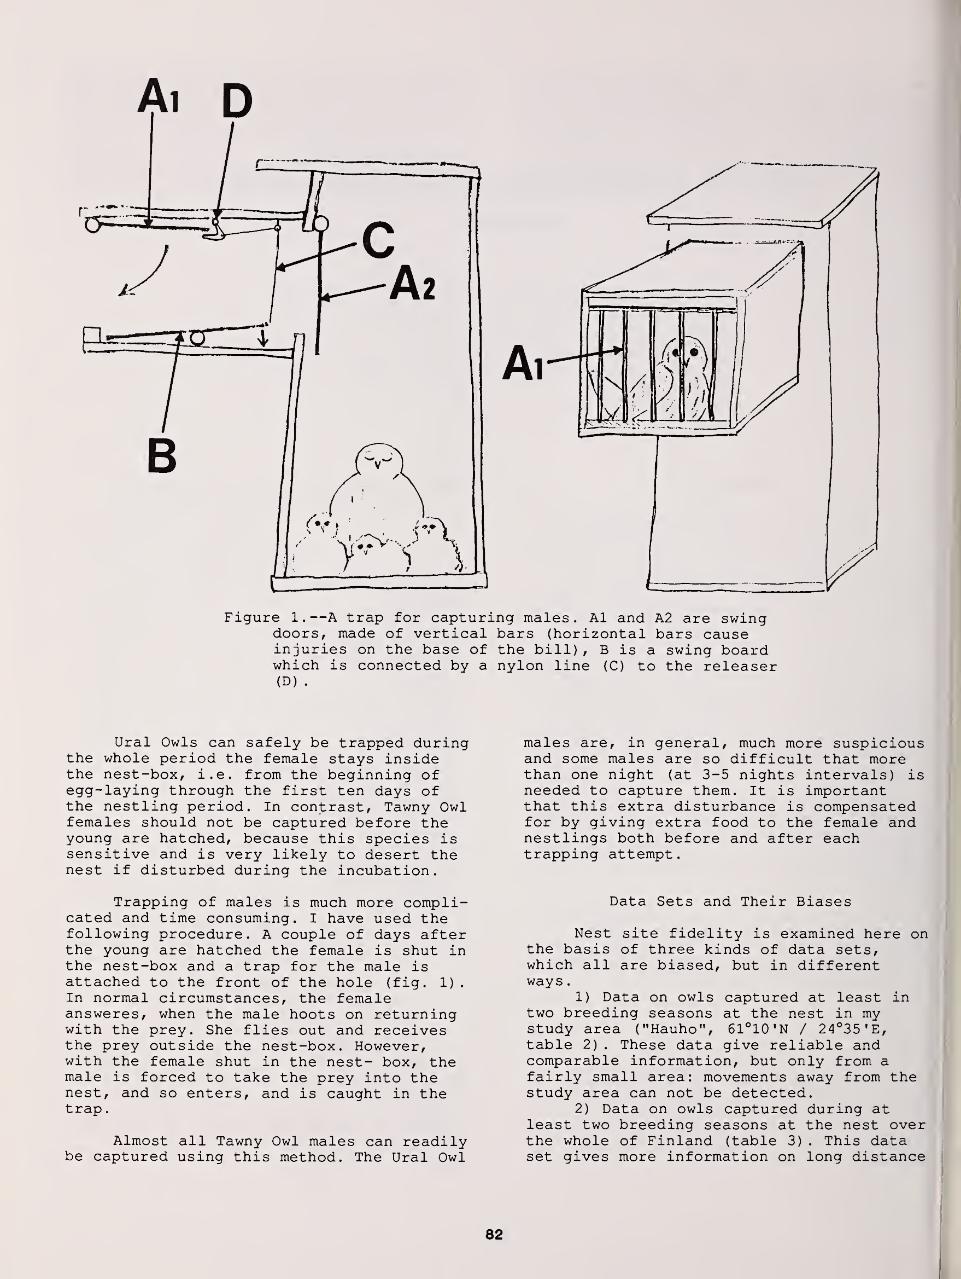
Figure 1.—A trap for capturing males. Al and A2 are swingdoors, made of vertical bars (horizontal bars causeinjuries on the base of the bill) , B is a swing boardwhich is connected by a nylon line (C) to the releaser(D) .
Ural Owls can safely be trapped duringthe whole period the female stays insidethe nest-box, i.e. from the beginning ofegg-laying through the first ten days ofthe nestling period. In contrast, Tawny Owlfemales should not be captured before theyoung are hatched, because this species issensitive and is very likely to desert thenest if disturbed during the incubation.
Trapping of males is much more compli-cated and time consuming. I have used thefollowing procedure. A couple of days afterthe young are hatched the female is shut inthe nest-box and a trap for the male isattached to the front of the hole (fig. 1)
.
In normal circumstances, the femaleansweres, when the male hoots on returningwith the prey. She flies out and receivesthe prey outside the nest-box. However,with the female shut in the nest- box, themale is forced to take the prey into thenest, and so enters, and is caught in thetrap
.
Almost all Tawny Owl males can readilybe captured using this method. The Ural Owl
males are, in general, much more suspiciousand some males are so difficult that morethan one night (at 3-5 nights intervals) isneeded to capture them. It is importantthat this extra disturbance is compensatedfor by giving extra food to the female andnestlings both before and after eachtrapping attempt
.
Data Sets and Their Biases
Nest site fidelity is examined here onthe basis of three kinds of data sets,which all are biased, but in differentways
.
1) Data on owls captured at least intwo breeding seasons at the nest in mystudy area ("Hauho", 61°10'N / 24°35'E,table 2) . These data give reliable andcomparable information, but only from afairly small area: movements away from thestudy area can not be detected.
2) Data on owls captured during atleast two breeding seasons at the nest overthe whole of Finland (table 3) . This dataset gives more information on long distance
82
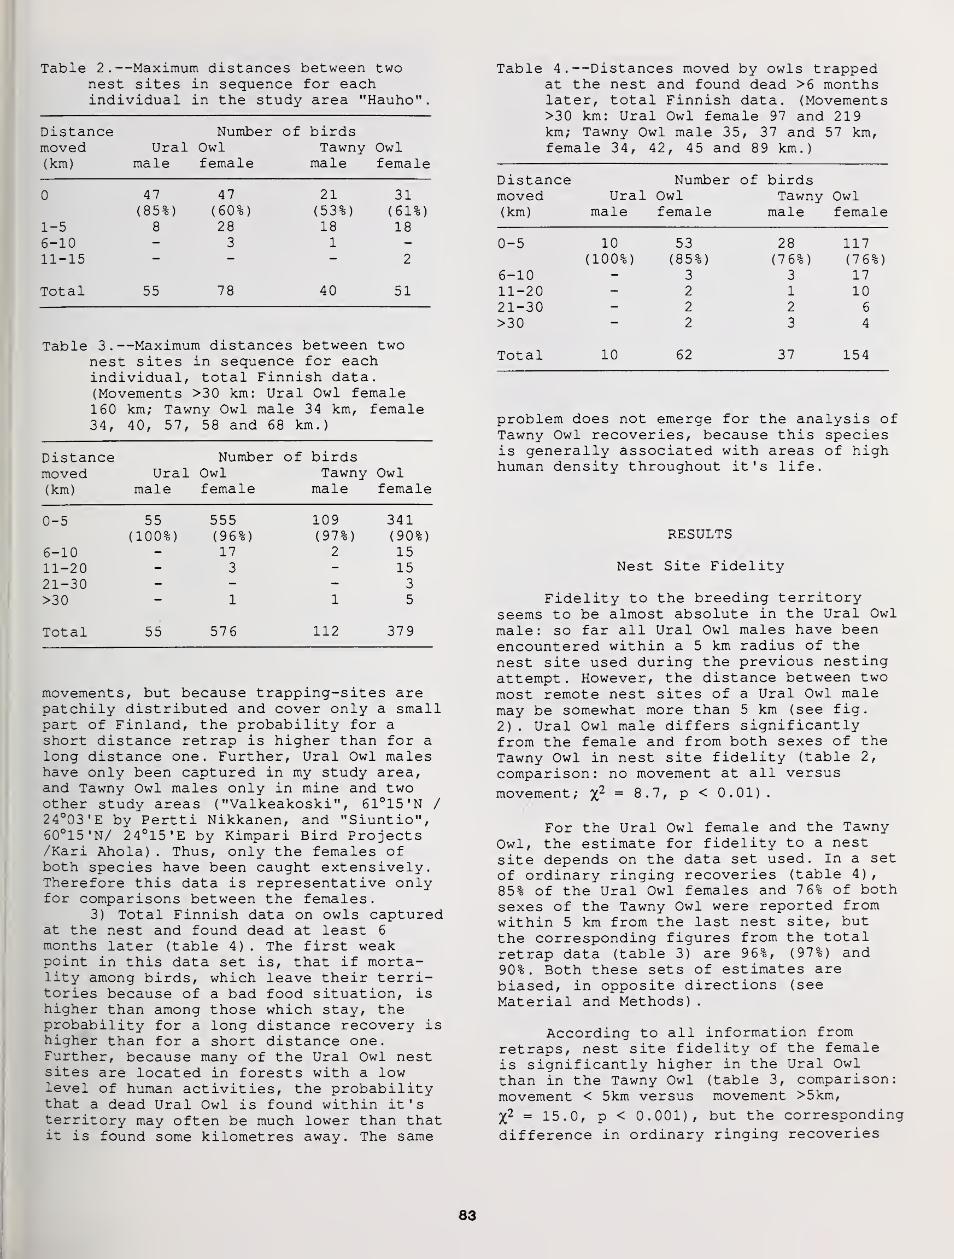
Table 2.—Maximum distances between twonest sites in sequence for eachindividual in the study area "Hauho".
Distance Number of birdsmoved Ural Owl Tawny Owl(km) male female male female
0
I- 5
6-10II- 15
47(85%)
8
47
(60%)283
21(53%)181
31(61%)18
2
Total 55 78 40 51
Table 3.—Maximum distances between twonest sites in sequence for eachindividual, total Finnish data.(Movements >30 km: Ural Owl female160 km; Tawny Owl male 34 km, female34, 40, 57, 58 and 68 km.)
Distancemoved(km)
Uralmale
Number ofOwlfemale
birdsTawny
maleOwlfemale
0-5
6-1011-2021-30>30
55(100%)
555(96%)173
1
109(97%)
2
1
341(90%)15153
5
Total 55 576 112 379
movements, but because trapping-sites arepatchily distributed and cover only a smallpart of Finland, the probability for ashort distance retrap is higher than for along distance one. Further, Ural Owl maleshave only been captured in my study area,and Tawny Owl males only in mine and twoother study areas ( "Valkeakoski" , 61°15'N /
24°03'E by Pertti Nikkanen, and "Siuntio",60°15'N/ 24°15'E by Kimpari Bird Projects/Kari Ahola) . Thus, only the females ofboth species have been caught extensively.Therefore this data is representative onlyfor comparisons between the females.
3) Total Finnish data on owls capturedat the nest and found dead at least 6
months later (table 4) . The first weakpoint in this data set is, that if morta-lity among birds, which leave their terri-tories because of a bad food situation, ishigher than among those which stay, theprobability for a long distance recovery ishigher than for a short distance one.Further, because many of the Ural Owl nestsites are located in forests with a lowlevel of human activities, the probabilitythat a dead Ural Owl is found within it'sterritory may often be much lower than thatit is found some kilometres away. The same
Table 4.—Distances moved by owls trappedat the nest and found dead >6 monthslater, total Finnish data. (Movements>30 km: Ural Owl female 97 and 219km; Tawny Owl male 35, 37 and 57 km,female 34, 42, 45 and 89 km.)
Distance Number of birdsmoved Ural Owl Tawny Owl(km) male female male female
0-5 10 53 28 117(100%) (85%) (76%) (76%)
6-10 3 3 1711-20 2 1 1021-30 2 2 6
>30 2 3 4
Total 10 62 37 154
problem does not emerge for the analysis ofTawny Owl recoveries, because this speciesis generally associated with areas of highhuman density throughout it's life.
RESULTS
Nest Site Fidelity
Fidelity to the breeding territoryseems to be almost absolute in the Ural Owlmale: so far all Ural Owl males have beenencountered within a 5 km radius of thenest site used during the previous nestingattempt. However, the distance between twomost remote nest sites of a Ural Owl malemay be somewhat more than 5 km (see fig.
2) . Ural Owl male differs significantlyfrom the female and from both sexes of theTawny Owl in nest site fidelity (table 2,
comparison: no movement at all versus
movement; %2 = 8.7, p < 0.01).
For the Ural Owl female and the TawnyOwl, the estimate for fidelity to a nestsite depends on the data set used. In a setof ordinary ringing recoveries (table 4),85% of the Ural Owl females and 7 6% of bothsexes of the Tawny Owl were reported fromwithin 5 km from the last nest site, butthe corresponding figures from the totalretrap data (table 3) are 96%, (97%) and90%. Both these sets of estimates arebiased, in opposite directions (seeMaterial and Methods)
.
According to all information fromretraps, nest site fidelity of the femaleis significantly higher in the Ural Owlthan in the Tawny Owl (table 3, comparison:movement < 5km versus movement >5km,
X2 = 15.0, p < 0.001), but the corresponding
difference in ordinary ringing recoveries
83
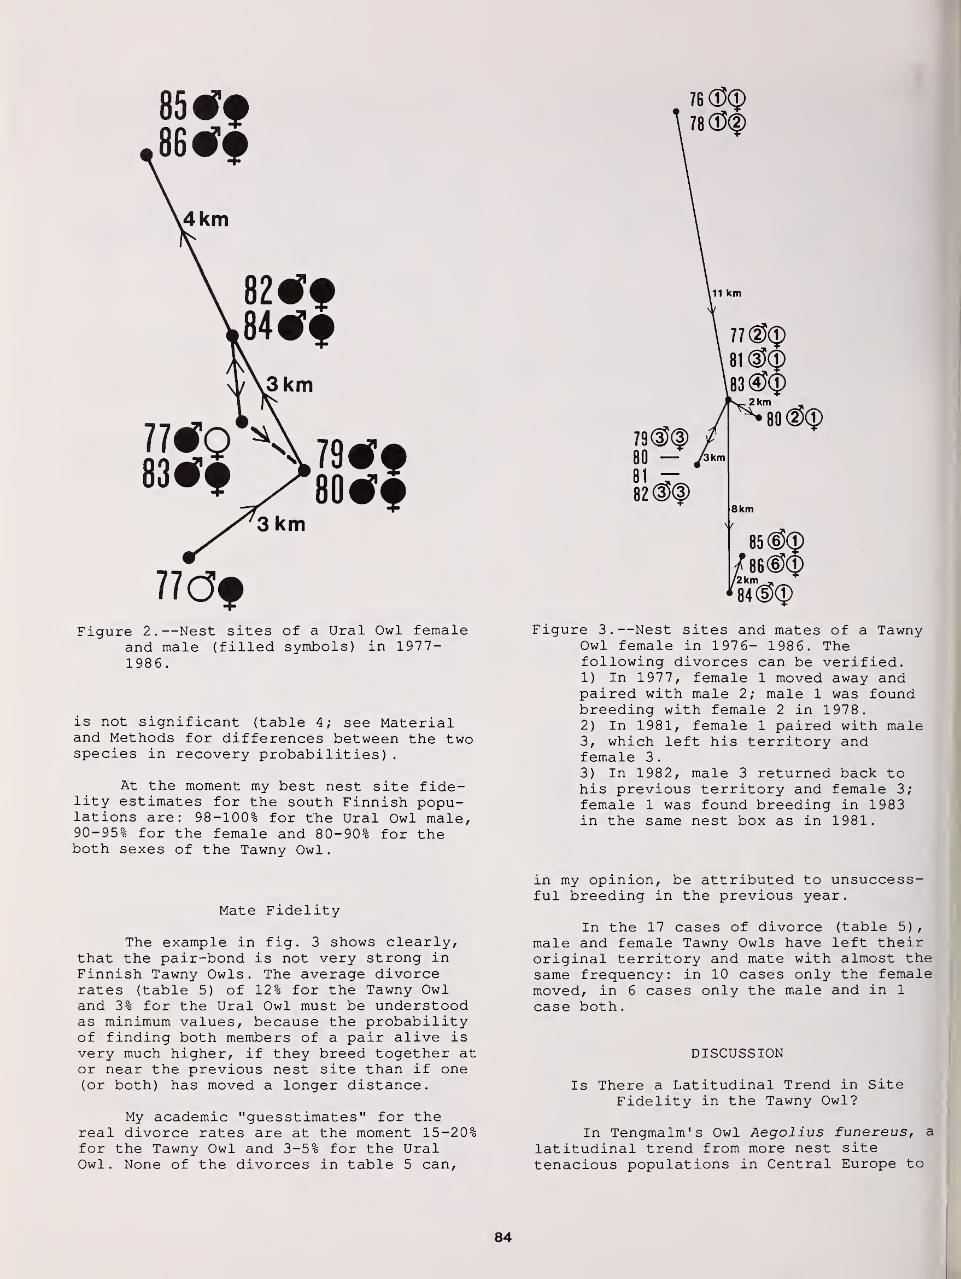
77OfFigure 2.—Nest sites of a Ural Owl female
and male (filled symbols) in 1977-1986.
is not significant (table 4; see Materialand Methods for differences between the twospecies in recovery probabilities)
.
At the moment my best nest site fide-lity estimates for the south Finnish popu-lations are: 98-100% for the Ural Owl male,90-95% for the female and 80-90% for theboth sexes of the Tawny Owl.
Mate Fidelity
The example in fig. 3 shows clearly,that the pair-bond is not very strong inFinnish Tawny Owls. The average divorcerates (table 5) of 12% for the Tawny Owland 3% for the Ural Owl must be understoodas minimum values, because the probabilityof finding both members of a pair alive isvery much higher, if they breed together ator near the previous nest site than if one(or both) has moved a longer distance.
My academic "guesstimates" for thereal divorce rates are at the moment 15-20%for the Tawny Owl and 3-5% for the UralOwl . None of the divorces in table 5 can,
Figure 3.—Nest sites and mates of a TawnyOwl female in 197 6- 1986. Thefollowing divorces can be verified.1) In 1977, female 1 moved away andpaired with male 2; male 1 was foundbreeding with female 2 in 1978.2) In 1981, female 1 paired with male3, which left his territory andfemale 3
.
3) In 1982, male 3 returned back tohis previous territory and female 3;female 1 was found breeding in 1983in the same nest box as in 1981.
in my opinion, be attributed to unsuccess-ful breeding in the previous year.
In the 17 cases of divorce (table 5)
,
male and female Tawny Owls have left theiroriginal territory and mate with almost thesame frequency: in 10 cases only the femalemoved, in 6 cases only the male and in 1
case both.
DISCUSSION
Is There a Latitudinal Trend in SiteFidelity in the Tawny Owl?
In Tengmalm's Owl Aegolius funereus, a
latitudinal trend from more nest sitetenacious populations in Central Europe to
84
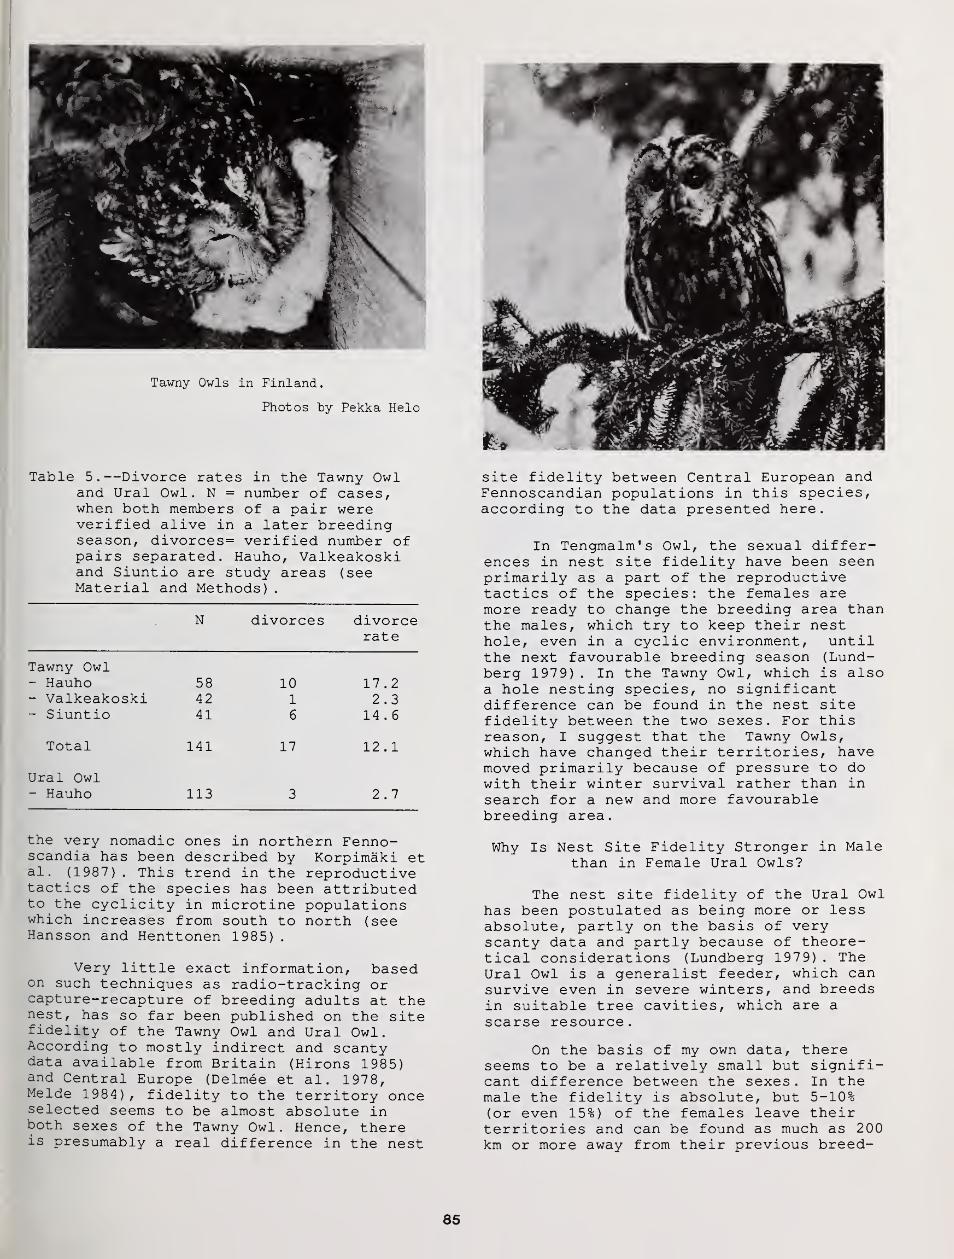
Tawny Owls in Finland.
Photos by Pekka Helo
Table 5.—Divorce rates in the Tawny Owland Ural Owl. N = number of cases,when both members of a pair wereverified alive in a later breedingseason, divorces= verified number ofpairs separated. Hauho, Valkeakoskiand Siuntio are study areas (seeMaterial and Methods)
.
N divorces divorcerate
Tawny Owl- Hauho 58 10 17 .2- Valkeakoski 42 1 2.3- Siuntio 41 6 14 . 6
Total 141 17 12 .
1
Ural Owl- Hauho 113 3 2.7
the very nomadic ones in northern Fenno-scandia has been described by Korpimaki etal. (1987). This trend in the reproductivetactics of the species has been attributedto the cyclicity in microtine populationswhich increases from south to north (seeHansson and Henttonen 1985)
.
Very little exact information, basedon such techniques as radio-tracking orcapture-recapture of breeding adults at thenest, has so far been published on the sitefidelity of the Tawny Owl and Ural Owl.According to mostly indirect and scantydata available from Britain (Hirons 1985)and Central Europe (Delmee et al . 1978,Melde 1984), fidelity to the territory onceselected seems to be almost absolute inboth sexes of the Tawny Owl. Hence, thereis presumably a real difference in the nest
site fidelity between Central European andFennoscandian populations in this species,according to the data presented here.
In Tengmalm's Owl, the sexual differ-ences in nest site fidelity have been seenprimarily as a part of the reproductivetactics of the species: the females aremore ready to change the breeding area thanthe males, which try to keep their nesthole, even in a cyclic environment, untilthe next favourable breeding season (Lund-berg 1979) . In the Tawny Owl, which is alsoa hole nesting species, no significantdifference can be found in the nest sitefidelity between the two sexes. For thisreason, I suggest that the Tawny Owls,which have changed their territories, havemoved primarily because of pressure to dowith their winter survival rather than insearch for a new and more favourablebreeding area.
Why Is Nest Site Fidelity Stronger in Malethan in Female Ural Owls?
The nest site fidelity of the Ural Owlhas been postulated as being more or lessabsolute, partly on the basis of veryscanty data and partly because of theore-tical considerations (Lundberg 197 9) . TheUral Owl is a generalist feeder, which cansurvive even in severe winters, and breedsin suitable tree cavities, which are a
scarse resource.
On the basis of my own data, thereseems to be a relatively small but signifi-cant difference between the sexes . In themale the fidelity is absolute, but 5-10%(or even 15%) of the females leave theirterritories and can be found as much as 200km or more away from their previous breed-
85
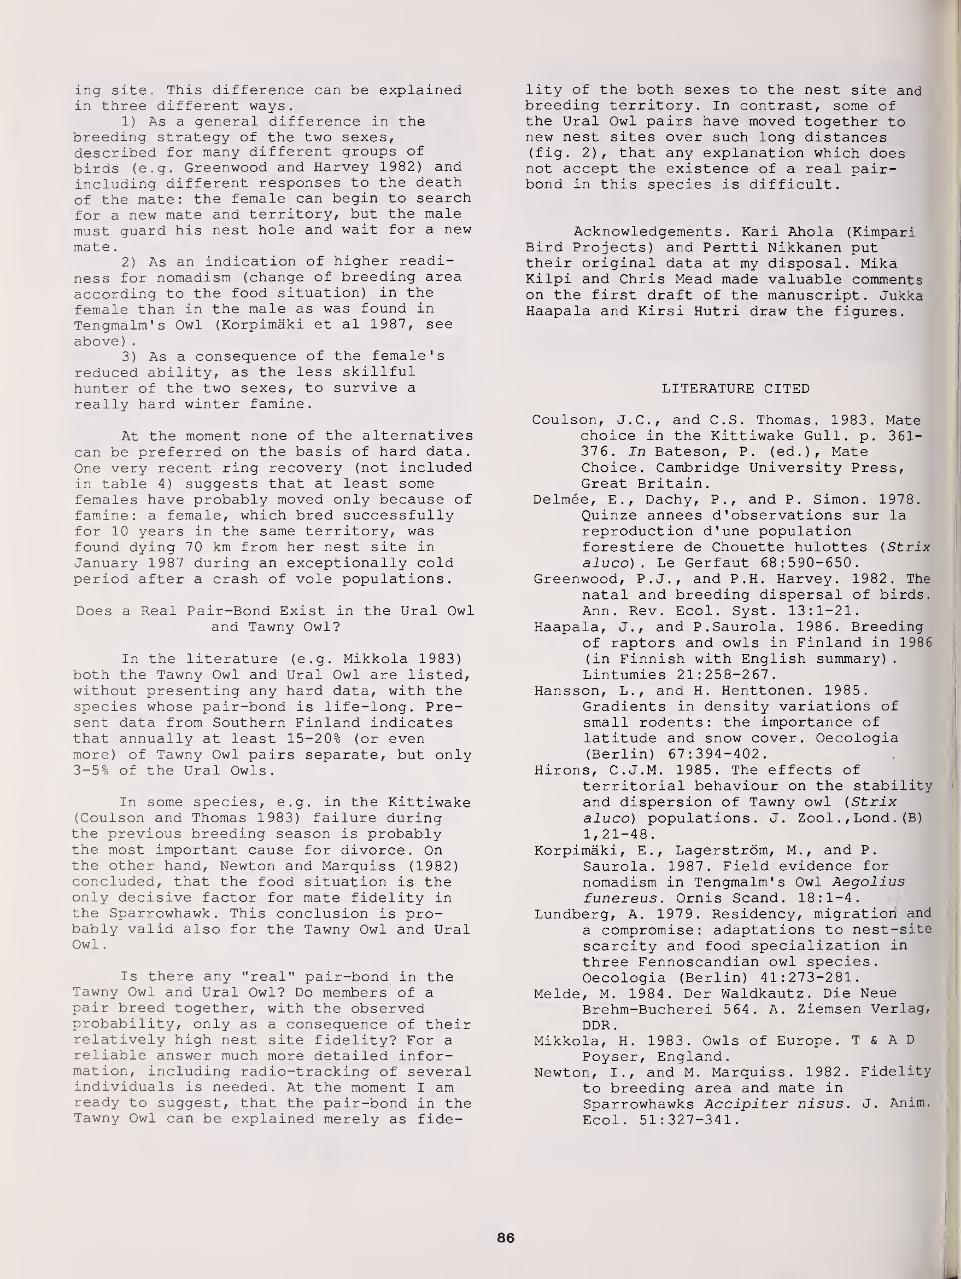
ing site. This difference can be explainedin three different ways.
1) As a general difference in thebreeding strategy of the two sexes,described for many different groups ofbirds (e.g. Greenwood and Harvey 1982) andincluding different responses to the deathof the mate: the female can begin to searchfor a new mate and territory, but the malemust guard his nest hole and wait for a newmate
.
2) As an indication of higher readi-ness for nomadism (change of breeding areaaccording to the food situation) in thefemale than in the male as was found inTengmalm's Owl (Korpimaki et al 1987, seeabove)
.
3) As a consequence of the female'sreduced ability, as the less skillfulhunter of the two sexes, to survive areally hard winter famine.
At the moment none of the alternativescan be preferred on the basis of hard data.One very recent ring recovery (not includedin table 4) suggests that at least somefemales have probably moved only because offamine: a female, which bred successfullyfor 10 years in the same territory, wasfound dying 70 km from her nest site inJanuary 1987 during an exceptionally coldperiod after a crash of vole populations.
Does a Real Pair-Bond Exist in the Ural Owland Tawny Owl?
In the literature (e.g. Mikkola 1983)both the Tawny Owl and Ural Owl are listed,without presenting any hard data, with thespecies whose pair-bond is life-long. Pre-sent data from Southern Finland indicatesthat annually at least 15-20% (or evenmore) of Tawny Owl pairs separate, but only3-5% of the Ural Owls.
In some species, e.g. in the Kittiwake(Coulson and Thomas 1983) failure duringthe previous breeding season is probablythe most important cause for divorce. Onthe other hand, Newton and Marquiss (1982)concluded, that the food situation is theonly decisive factor for mate fidelity inthe Sparrowhawk . This conclusion is pro-bably valid also for the Tawny Owl and UralOwl .
Is there any "real" pair-bond in theTawny Owl and Ural Owl? Do members of apair breed together, with the observedprobability, only as a consequence of theirrelatively high nest site fidelity? For areliable answer much more detailed infor-mation, including radio-tracking of severalindividuals is needed. At the moment I amready to suggest, that the pair-bond in theTawny Owl can be explained merely as fide-
lity of the both sexes to the nest site andbreeding territory. In contrast, some ofthe Ural Owl pairs have moved together tonew nest sites over such long distances(fig. 2), that any explanation which doesnot accept the existence of a real pair-bond in this species is difficult.
Acknowledgements. Kari Ahola (KimpariBird Projects) and Pertti Nikkanen puttheir original data at my disposal. MikaKilpi and Chris Mead made valuable commentson the first draft of the manuscript. JukkaHaapala and Kirsi Hutri draw the figures.
LITERATURE CITED
Coulson, J.C., and C.S. Thomas. 1983. Matechoice in the Kittiwake Gull. p. 361-37 6. In Bateson, P. (ed.), MateChoice. Cambridge University Press,Great Britain.
Delmee, E., Dachy, P., and P. Simon. 1978.Quinze annees d ' observations sur lareproduction d'une populationforestiere de Chouette hulottes (Strixaluco) . Le Gerfaut 68:590-650.
Greenwood, P.J., and P.H. Harvey. 1982. Thenatal and breeding dispersal of birds.Ann. Rev. Ecol . Syst . 13:1-21.
Haapala, J., and P.Saurola. 1986. Breedingof raptors and owls in Finland in 1986(in Finnish with English summary)
.
Lintumies 21:258-267.Hansson, L., and H. Henttonen. 1985.
Gradients in density variations ofsmall rodents: the importance oflatitude and snow cover. Oecologia(Berlin) 67:394-402.
Hirons, C.J.M. 1985. The effects ofterritorial behaviour on the stabilityand dispersion of Tawny owl (Strixaluco) populations. J. Zool
., Lond . (B)
1,21-48.Korpimaki, E., Lagerstrom, M., and P.
Saurola. 1987. Field evidence fornomadism in Tengmalm's Owl Aegoliusfunereus. Ornis Scand. 18:1-4.
Lundberg, A. 1979. Residency, migration anda compromise: adaptations to nest-sitescarcity and food specialization inthree Fennoscandian owl species
.
Oecologia (Berlin) 41:273-281.Melde, M. 1984. Der Waldkautz. Die Neue
Brehm-Bucherei 564. A. Ziemsen Verlag,DDR.
Mikkola, H. 1983. Owls of Europe. T & A D
Poyser, England.Newton, I., and M. Marquiss. 1982. Fidelity
to breeding area and mate inSparrowhawks Accipiter nisus . J. Anim.Ecol. 51:327-341.
86

Nest Platforms for Great Gray Owls 1
Evelyn L. Bull,2Mark G. Henjum,3
and Ralph G. Anderson4
Abstract.—During 1983-1986, 12 great gray owl ( Strixnebulosa ) pairs nested on artificial platforms in northeasternOregon. Platforms put up 15 m were preferred over those
platforms put up 9 m. Nest platforms were preferred over nestboxes. Each platform cost $40 to construct and mount.
The loss of natural nest sites hasencouraged use of artificial nest structuresfor owls ( Strix spp.) in northern Europe(Stefansson 1978, Rauhala 1980, Hilden and Helo
1981, Mikkola 1983, Helo 1984), and Canada(Nero 1980). In the Pacific Northwest, greatgray owls (£_. nebulosa ) frequently nest in
vacated hawk nests or on the broken tops of
dead trees. Intensified timber management hasreduced the number of available nest sites
because many large diameter dead and live trees
have been harvested.
At least 5 types of nest structures havebeen constructed for and used by great grayowls. Helo (1984) described an open neststructure 40 x 30 cm with a height of 10 cmthat great gray owls have used. Neststructures used in Canada and Minnesota includewire frames with sticks inside (Nero et al.
1974, Nero 1982), wire baskets with sticksinside (Bohm 1985), and nests constructed ofsticks alone (R. W. Nero, pers. comm.).Quinton (1984) described nests created bycutting the tops off trees and making a shallowdepression inside the bole.
Great gray owls readily use artificialstructures (fig. 1); we wanted to determine if
the owls had a preference for height of nest(placed at 9 m or 15 m above the ground), typeof nest (wooden platforms or nest boxes), and
Paper presented at the Northern ForestOwl Symposium, Winnipeg, Manitoba, February3-7, 1987.
2Research Wildlife Biologist, Forestry
and Range Sciences Laboratory, La Grande, OR.
3 .
Wildlife Biologist, Oregon Departmentof Fish and Wildlife, La Grande, OR.
4 .
Biological Technician, Wallowa ValleyRanger Station, Joseph, OR.
distance of nest from a clearcut (adjacent to a
clearcut or 100 to 200 m from the edge of a
clearcut)
.
Figure 1. Female great gray owl nesting onwooden platform in northeastern Oregon,
1986.
METHODS
We established 3 study areas in the Blueand Wallowa Mountains in northeastern Oregon
where mixed conifer forests were interspersedwith openings. In study area A, we selected 26
sites and put 2 platforms (fig. 2) at eachsite, in separate trees but within 30 m of each
other. One platform was 9 m and the other was15 m above the ground.
In study area B, we selected 27 sites near
clearcuts created 1 to 10 years ago. At eachsite, 1 platform was adjacent to the clearcut
87
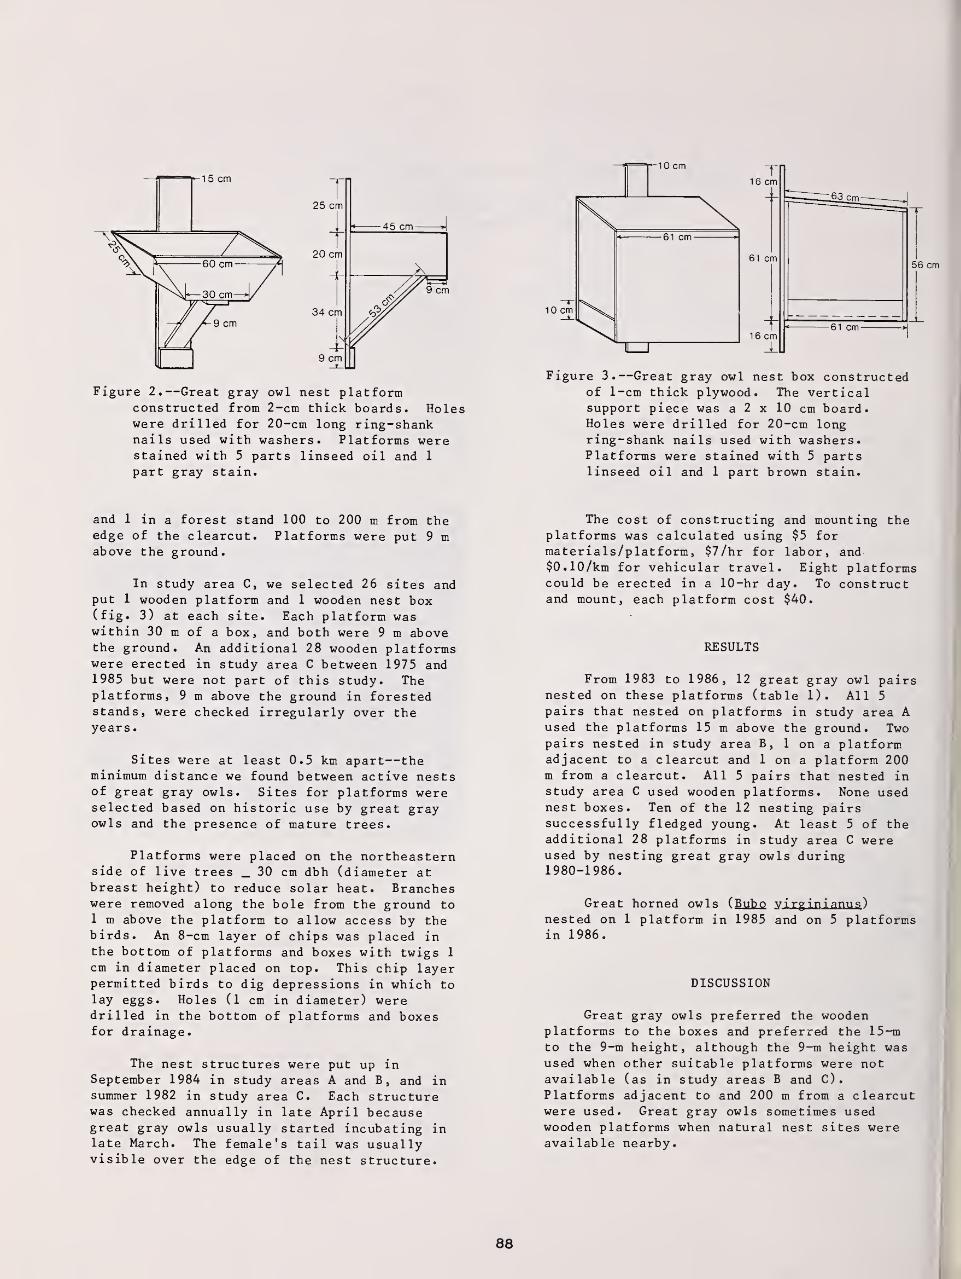
Figure 2.—Great gray owl nest platformconstructed from 2-cm thick boards. Holeswere drilled for 20-cm long ring-shanknails used with washers. Platforms werestained with 5 parts linseed oil and 1
part gray stain.
and 1 in a forest stand 100 to 200 m from theedge of the clearcut. Platforms were put 9 mabove the ground.
In study area C, we selected 26 sites andput 1 wooden platform and 1 wooden nest box(fig. 3) at each site. Each platform waswithin 30 m of a box, and both were 9 m abovethe ground. An additional 28 wooden platformswere erected in study area C between 1975 and1985 but were not part of this study. Theplatforms, 9 m above the ground in forestedstands, were checked irregularly over theyears
.
Sites were at least 0.5 km apart— theminimum distance we found between active nestsof great gray owls. Sites for platforms wereselected based on historic use by great grayowls and the presence of mature trees.
Platforms were placed on the northeasternside of live trees _ 30 cm dbh (diameter atbreast height) to reduce solar heat. Brancheswere removed along the bole from the ground to1 m above the platform to allow access by thebirds. An 8-cm layer of chips was placed inthe bottom of platforms and boxes with twigs 1
cm in diameter placed on top. This chip layerpermitted birds to dig depressions in which to
lay eggs. Holes (1 cm in diameter) weredrilled in the bottom of platforms and boxesfor drainage.
The nest structures were put up inSeptember 1984 in study areas A and B, and insummer 1982 in study area C. Each structurewas checked annually in late April becausegreat gray owls usually started incubating inlate March. The female's tail was usuallyvisible over the edge of the nest structure.
Figure 3.—Great gray owl nest box constructedof 1-cm thick plywood. The verticalsupport piece was a 2 x 10 cm board.Holes were drilled for 20-cm longring-shank nails used with washers.Platforms were stained with 5 partslinseed oil and 1 part brown stain.
The cost of constructing and mounting theplatforms was calculated using $5 formaterials/platform, $7/hr for labor, and$0.10/km for vehicular travel. Eight platformscould be erected in a 10-hr day. To constructand mount, each platform cost $40.
RESULTS
From 1983 to 1986, 12 great gray owl pairsnested on these platforms (table 1). All 5
pairs that nested on platforms in study area Aused the platforms 15 m above the ground. Twopairs nested in study area B, 1 on a platformadjacent to a clearcut and 1 on a platform 200m from a clearcut. All 5 pairs that nested instudy area C used wooden platforms. None usednest boxes. Ten of the 12 nesting pairssuccessfully fledged young. At least 5 of theadditional 28 platforms in study area C wereused by nesting great gray owls during1980-1986.
Great horned owls ( Bubo virginianus )
nested on 1 platform in 1985 and on 5 platformsin 1986.
DISCUSSION
Great gray owls preferred the woodenplatforms to the boxes and preferred the 15-mto the 9-m height, although the 9-m height wasused when other suitable platforms were notavailable (as in study areas B and C)
.
Platforms adjacent to and 200 m from a clearcutwere used. Great gray owls sometimes usedwooden platforms when natural nest sites wereavailable nearby.
88
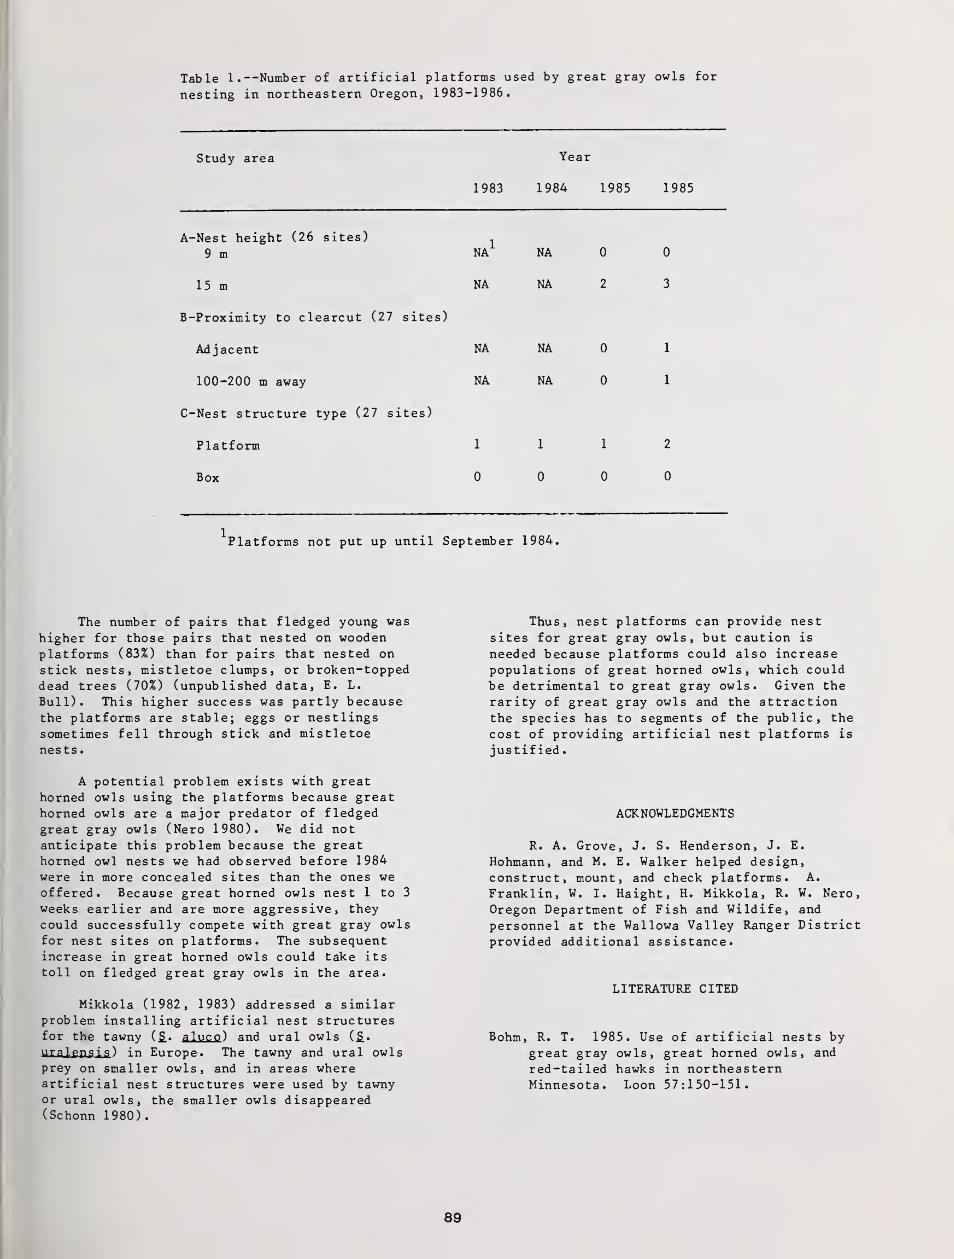
Table 1.—Number of artificial platforms used by great gray owls for
nesting in northeastern Oregon, 1983-1986.
Study area Year
1983 1984 1985 1985
A-Nest height (26 sites) ,
9 m NA NA 0 0
15 m NA NA 2 3
B-Proximity to clearcut (27 sites)
Adjacent NA NA 0 1
100-200 m away NA NA 0 1
C-Nest structure type (27 sites)
Platform 1112Box 0 0 0 0
^"Platforms not put up until September 1984.
The number of pairs that fledged young was
higher for those pairs that nested on woodenplatforms (83%) than for pairs that nested onstick nestSj mistletoe clumps, or broken-toppeddead trees (70%) (unpublished data, E. L.
Bull). This higher success was partly becausethe platforms are stable; eggs or nestlingssometimes fell through stick and mistletoenests
.
A potential problem exists with greathorned owls using the platforms because greathorned owls are a major predator of fledgedgreat gray owls (Nero 1980). We did notanticipate this problem because the greathorned owl nests we had observed before 1984
were in more concealed sites than the ones weoffered. Because great horned owls nest 1 to 3
weeks earlier and are more aggressive, theycould successfully compete with great gray owlsfor nest sites on platforms. The subsequentincrease in great horned owls could take its
toll on fledged great gray owls in the area.
Mikkola (1982, 1983) addressed a similarproblem installing artificial nest structuresfor the tawny (S_. aluco ) and ural owls (S_.
uralensis ) in Europe. The tawny and ural owlsprey on smaller owls, and in areas whereartificial nest structures were used by tawnyor ural owls, the smaller owls disappeared(Schonn 1980)
.
Thus, nest platforms can provide nestsites for great gray owls, but caution is
needed because platforms could also increasepopulations of great horned owls, which couldbe detrimental to great gray owls. Given the
rarity of great gray owls and the attractionthe species has to segments of the public, the
cost of providing artificial nest platforms is
justified
.
ACKNOWLEDGMENTS
R. A. Grove, J. S. Henderson, J. E.
Hohmann, and M. E. Walker helped design,construct, mount, and check platforms. A.
Franklin, W. I. Haight, H. Mikkola, R. W. Nero,
Oregon Department of Fish and Wildife, and
personnel at the Wallowa Valley Ranger Districtprovided additional assistance.
LITERATURE CITED
Bohm, R. T. 1985. Use of artificial nests bygreat gray owls, great horned owls, and
red-tailed hawks in northeasternMinnesota. Loon 57:150-151.
89
Helo, P. 1984. Yon Linnut, Kirja Suomenpolloista . Kainuun Sanomain KirjatainoOy. 240 p.
Hilden, 0., and P. Helo. 1981. The great grayowl Strix nebulosa—a bird of the northerntaiga. Ornis Fennica 58:159-166.
Mikkola , H. 1982. Ecological relationships in
European owls. Publ. of the Univ. of
Kuopio. Natural Sciences Ser. Orig.
reports 6/1982:1-157.
Mikkola, H. 1983. Owls of Europe. ButeoBooks, Vermillion, S.D.
Nero, R. W. 1980. The great gray owl phantomof the northern forest. SmithsonianInstitution Press, Washington, D. C.
167 p.
Nero, R. W. 1982. Building nests for greatgray owls. Sialia 4:41-80.
Nero, R. W. , S. G. Sealy, and H. R. Copeland.1974. Great gray owls occupy artificialnest. Loon 46:161-165.
Quinton, M. S. 1984. Life of a foresthunter—the great gray owl. NationalGeographic. July 1984:123-136.
Rauhala, P. 1980. Kemin-Tornion seudeunlinnusto. Pohjolan Sanomat, Kemi.
Stefansson, 0. 1978. Lappuggla ( Strixnebulosa ) i Norrbotten 1975-78.
Norrbottens Natur 34:49-63.
Schonn, S. 1980. Kauze als Feinde andererKauzarten und Nisthilfen fur
hohlenbrutende Eulen. Der Falke27:294-299.
90
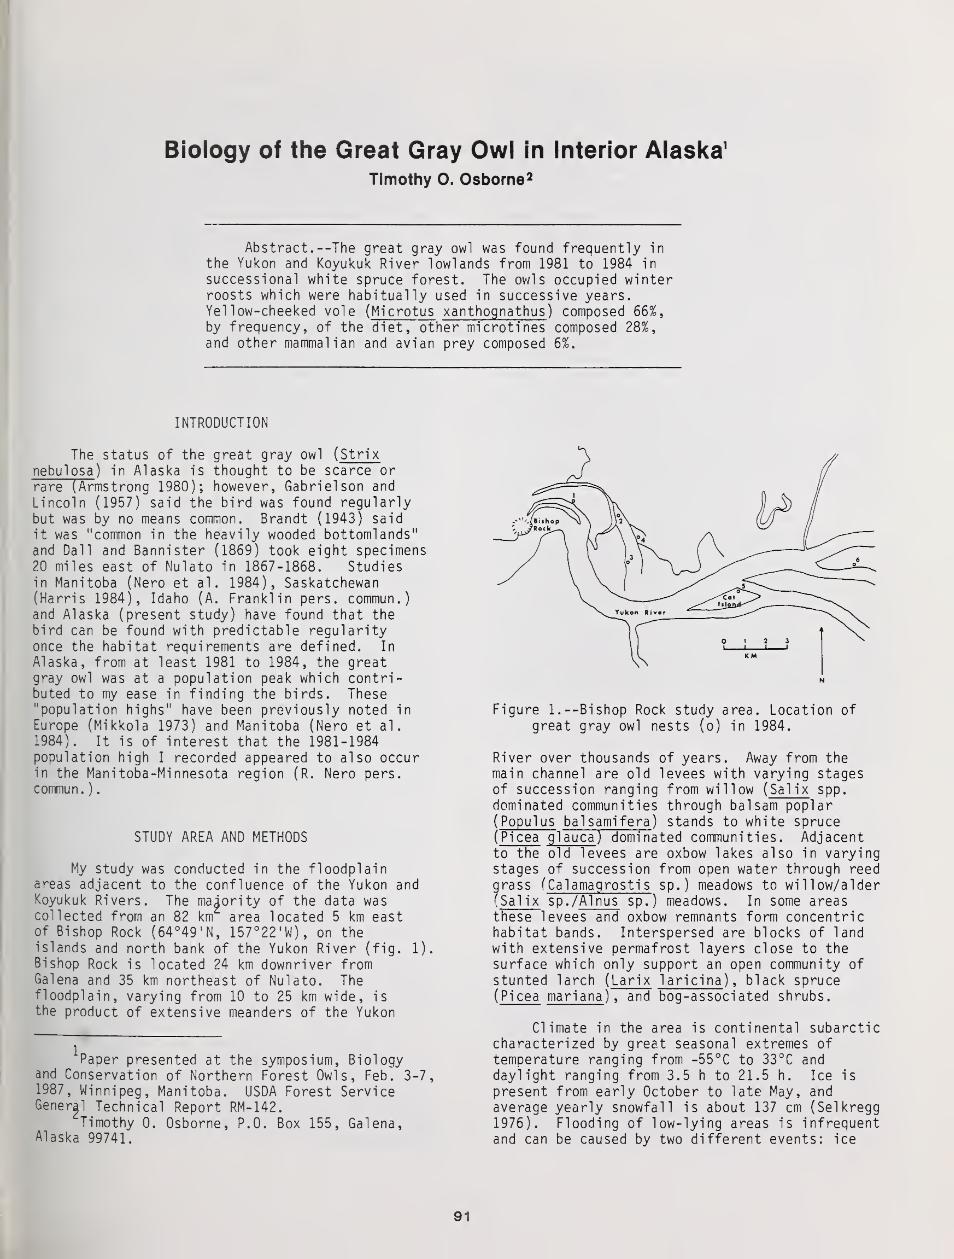
Biology of the Great Gray Owl in Interior Alaska 1
Timothy 0. Osborne 2
Abstract. --The great gray owl was found frequently in
the Yukon and Koyukuk River lowlands from 1981 to 1984 in
successional white spruce forest. The owls occupied winterroosts which were habitually used in successive years.Yellow-cheeked vole ( Microtus xanthognathus ) composed 66%,by frequency, of the diet, other microtines composed 28%,and other mammalian and avian prey composed 6%.
INTRODUCTION
The status of the great gray owl ( Strix
nebulosa ) in Alaska is thought to be scarce orrare (Armstrong 1980); however, Gabriel son and
Lincoln (1957) said the bird was found regularlybut was by no means common. Brandt (1943) said
it was "common in the heavily wooded bottomlands"and Dall and Bannister (1869) took eight specimens20 miles east of Nulato in 1867-1868. Studiesin Manitoba (Nero et al . 1984), Saskatchewan(Harris 1984), Idaho (A. Franklin pers. commun.)and Alaska (present study) have found that thebird can be found with predictable regularityonce the habitat requirements are defined. In
Alaska, from at least 1981 to 1984, the greatgray owl was at a population peak which contri-buted to my ease in finding the birds. These"population highs" have been previously noted in
Europe (Mikkola 1973) and Manitoba (Nero et al.
1984). It is of interest that the 1981-1984population high I recorded appeared to also occurin the Manitoba-Minnesota region (R. Nero pers.commun. )
.
STUDY AREA AND METHODS
My study was conducted in the floodplainareas adjacent to the confluence of the Yukon andKoyukuk Rivers. The majority of the data wascollected from an 82 km area located 5 km eastof Bishop Rock (64°49'N, 157°22'W), on theislands and north bank of the Yukon River (fig. 1).
Bishop Rock is located 24 km downriver fromGalena and 35 km northeast of Nulato. Thefloodplain, varying from 10 to 25 km wide, is
the product of extensive meanders of the Yukon
Paper presented at the symposium, Biologyand Conservation of Northern Forest Owls, Feb. 3-7,1987, Winnipeg, Manitoba. USDA Forest ServiceGeneral Technical Report RM-142.
Timothy 0. Osborne, P.O. Box 155, Galena,Alaska 99741.
N
Figure 1. --Bishop Rock study area. Location ofgreat gray owl nests (o) in 1984.
River over thousands of years. Away from themain channel are old levees with varying stagesof succession ranging from willow ( Sal ix spp.
dominated communities through balsam poplar
( Populus balsamifera ) stands to white spruce
( Picea glauca ) dominated communities. Adjacentto the old levees are oxbow lakes also in varyingstages of succession from open water through reedgrass ( Cal amagrosti
s
sp.) meadows to willow/alder
( Sal ix sp./ Al nus sp.) meadows. In some areasthese levees and oxbow remnants form concentrichabitat bands. Interspersed are blocks of landwith extensive permafrost layers close to thesurface which only support an open community of
stunted larch ( Larix laricina ), black spruce
( Picea mariana ) , and bog-associated shrubs.
Climate in the area is continental subarcticcharacterized by great seasonal extremes oftemperature ranging from -55°C to 33°C anddaylight ranging from 3.5 h to 21.5 h. Ice is
present from early October to late May, and
average yearly snowfall is about 137 cm (Selkregg
1976). Flooding of low-lying areas is infrequentand can be caused by two different events: ice
91
jam floods or high-water floods. During winter1984-1985, deep snow up to 2 m in the Yukon and
Tanana River drainages produced a high-waterflood which inundated many of the old oxbow areas
for up to three weeks.
Data on the owls were collected opportunisti-cally during studies of moose ( Alces alces ).
Observations were conducted at irregular intervalsfrom January 1982 to February 1987; however, mostdata were collected during winter and springmonths. Nest trees were climbed, if possible,and contents recorded. At nest sites, prey
remains and pellets were collected. At winterroosts, pellets were collected monthly by diggingthrough the snow and after snowmelt in June. At
one site a 1.5 x 1.5 m pellet collector wasconstructed using a 2 x 4 wooden frame coveredwith plastic sheeting forming a funnel. A
plastic bucket with water drain holes was placedbelow the funnel throat to catch the pellets.
The pellet collection device was abandoned afterblack bears ( Ursus americanus ) ate the plasticcomponents. Pellets were dissected, and I
identified prey remains by skull and tooth
characters using voucher specimens from the
University of Alaska Museum.
Three small mammal traplines were run along
the Yukon River during late August 1984 and 1985
to ascertain relative prey densities. Each
trapline had 20 stations 17 m apart, with two
Museum Special snap traps baited with peanutbutter and one pitfall funnel trap at eachstation. Each line was run for three consecutivenights. One line was in a permafrost bog/openblack spruce community running perpendicular to
the river, one line was in a mature balsam poplarstand running parallel to the river and the thirdsite was 1 km from the river in a ( Calamagrostissp.) meadow. In 1985 the meadow site was coveredwith 0.5 m of water for 19 days during June,
prior to trapping.
During intensive aerial moose surveys, I
occasionally observed great gray owls eitherperched on meadow edges or as they flushed fromtree roosts. The surveys were conducted using a
Super Cub aircraft flying at 112 kmph at 100 mabove ground level with a minimum ground searchintensity of 4 min/mi 2
. The observations produceda relative index of abundance which was biaseddue to varying sightability of the owls and theirindividual reactions to aircraft (some wouldflush and some would not). Sixteen surveys wereflown in November and one in April. Data wereused from the following moose trend areas: KaiyuhSlough near Nulato; Squirrel Creek near Koyukuk;Three Day Slough (65°29'N, 157°30'W); Deep Creek20 km NW Ruby; and Nowitna/Sulatna Rivers con-fluence (64°36'N, 154°28'W). Another method used
to determine density was vocalizations by the
owls, either during certain daylight periods or
at night. I usually would initiate calling by
imitating the owl's call and then listening forresponses and calculating their positions.
RESULTS
The great gray owl occurred in successionalwhite spruce lowland forests along the YukonRiver. The meadows of grasses and sedges providedhabitat for voles ( Microtus spp.), were openhunting areas, and were fringed with willows andbalsam poplars which provided hunting perches.Decadent balsam poplar and white spruce providednesting sites. The area also had large breedingpopulations of common raven ( Corvus corax ) and
red-tailed hawks ( Buteo jamaicensis ) , whichprovided potential nest platforms. Mature sprucestands provided sheltered winter roost sites.
During the winter months, October to March,owls were found during daylight periods perchedon the edge of open areas, such as meadows,creeks, sloughs, or along the main rivers.During the breeding season, April to July, theowls were always perched at or near the nestsite. I was unable to observe owls while theywere hunting during this period. I rarelyobserved owls once fledging occurred until winterconditions allowed access to the areas away fromthe river.
I was unable to ascertain if the owls wereresidents in the area or migrants, but since mysightings were mainly in the winter months, I
suspect the birds were residents. I do notbelieve the breeding population was augmented by
birds from other areas.
Nesting
The study area had no man-made nestingstructures, thus the density of owls was dependentupon natural regulatory factors. Great gray owlsdo not build nests and are limited to availablenest sites (Nero 1982). If there are sufficientnest sites, then other factors, such as foodsupply, regulate the population. Along the YukonRiver, I found raven nests approximately every1.5 km and decayed balsam poplar stumps, similarto those used for nesting, occurred very frequent-ly. I found six owl nests in the 82 km 2 studyarea during 1984. The nests averaged 2.8 km
apart (range 0.6 to 5.2 km). The density ofbreeding owls I found (fig. 1) was probably a
minimum since it was impossible to search theentire Bishop Rock area. During nocturnal owl
calling sessions, at least two more owls werecalling adjacent to the area to the north. Owls,presumably breeding, were also seen on the south
bank of the Yukon River. In the Three Day Slough
area, during an overcast day in late March 1984,
six different owls were calling in a 78 km 2 area.
Mikkola (1981) noted that in Finland, callingduring the day had never been reported.
I found a great gray owl nest on 5 June 1983
when it held two 300-400 g chicks. It was in an
old raven nest near an area where I had seen owls
in spring 1982. In March the nest had owl
feathers and pellets on top of the snow-coveredstructure. On 24 June the nest was empty and the
young were gone.
92
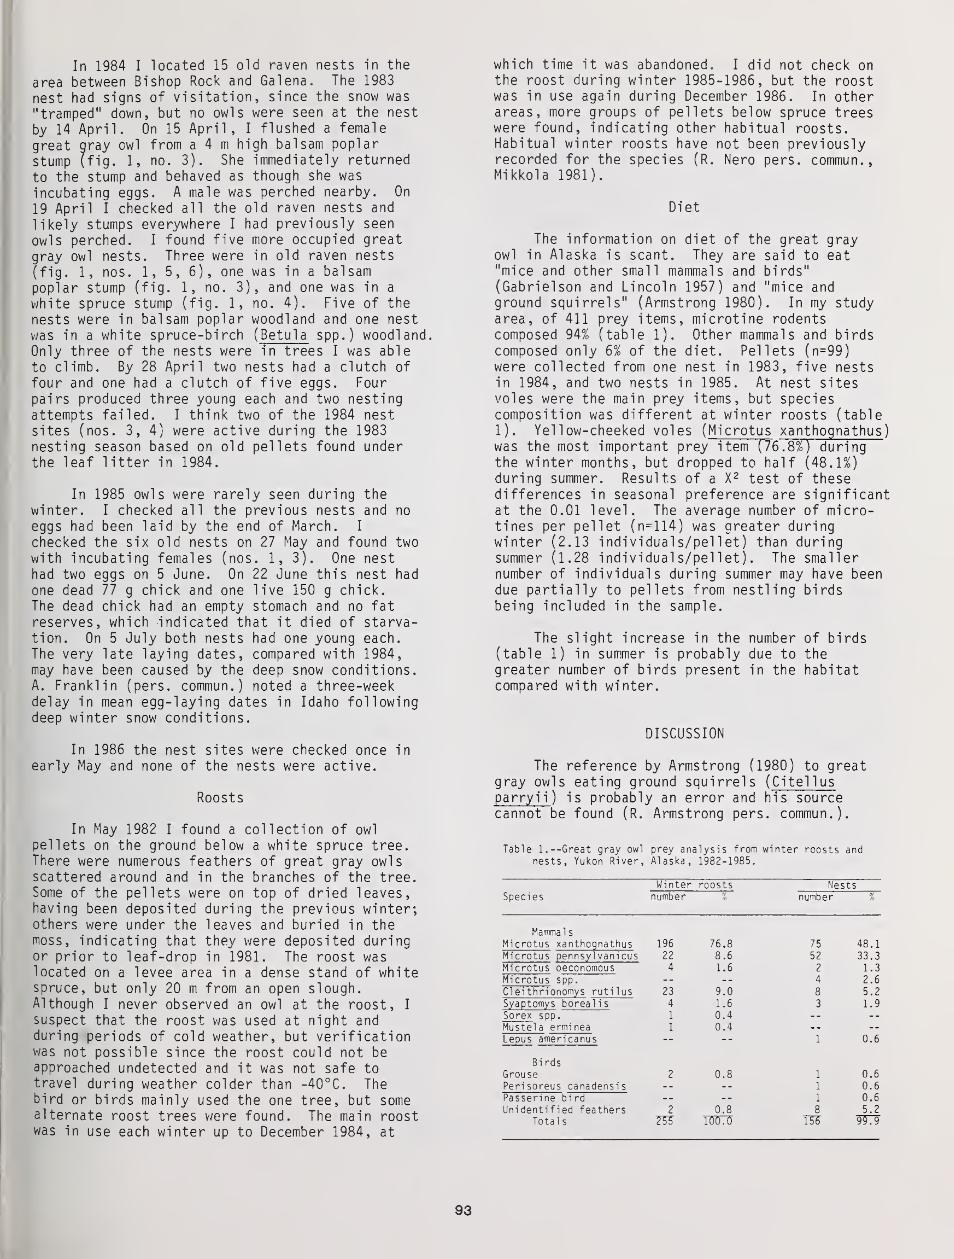
In 1984 I located 15 old raven nests in the
area between Bishop Rock and Galena. The 1983
nest had signs of visitation, since the snow was
"tramped" down, but no owls were seen at the nest
by 14 April. On 15 April, I flushed a female
great gray owl from a 4 m high balsam poplar
stump (fig. 1, no. 3). She immediately returned
to the stump and behaved as though she was
incubating eggs. A male was perched nearby. On
19 April I checked all the old raven nests and
likely stumps everywhere I had previously seen
owls perched. I found five more occupied great
gray owl nests. Three were in old raven nests
(fig. 1, nos. 1, 5, 6), one was in a balsampoplar stump (fig. 1, no. 3), and one was in a
white spruce stump (fig. 1, no. 4). Five of the
nests were in balsam poplar woodland and one nest
was in a white spruce-birch ( Betula spp.) woodland.Only three of the nests were in trees I was able
to climb. By 28 April two nests had a clutch offour and one had a clutch of five eggs. Fourpairs produced three young each and two nestingattempts failed. I think two of the 1984 nestsites (nos. 3, 4) were active during the 1983nesting season based on old pellets found underthe leaf litter in 1984.
In 1985 owls were rarely seen during the
winter. I checked all the previous nests and no
eggs had been laid by the end of March. I
checked the six old nests on 27 May and found twowith incubating females (nos. 1,3). One nesthad two eggs on 5 June. On 22 June this nest had
one dead 77 g chick and one live 150 g chick.
The dead chick had an empty stomach and no fatreserves, which indicated that it died of starva-tion. On 5 July both nests had one young each.The very late laying dates, compared with 1984,may have been caused by the deep snow conditions.A. Franklin (pers. commun.) noted a three-weekdelay in mean egg-laying dates in Idaho followingdeep winter snow conditions.
In 1986 the nest sites were checked once in
early May and none of the nests were active.
Roosts
In May 1982 I found a collection of owl
pellets on the ground below a white spruce tree.There were numerous feathers of great gray owlsscattered around and in the branches of the tree.Some of the pellets were on top of dried leaves,having been deposited during the previous winter;others were under the leaves and buried in themoss, indicating that they were deposited duringor prior to leaf-drop in 1981. The roost waslocated on a levee area in a dense stand of whitespruce, but only 20 m from an open slough.Although I never observed an owl at the roost, I
suspect that the roost was used at night andduring periods of cold weather, but verificationwas not possible since the roost could not beapproached undetected and it was not safe totravel during weather colder than -40°C. Thebird or birds mainly used the one tree, but somealternate roost trees were found. The main roostwas in use each winter up to December 1984, at
which time it was abandoned. I did not check onthe roost during winter 1985-1986, but the roostwas in use again during December 1986. In otherareas, more groups of pellets below spruce treeswere found, indicating other habitual roosts.Habitual winter roosts have not been previouslyrecorded for the species (R. Nero pers. commun.,Mikkola 1981).
Diet
The information on diet of the great grayowl in Alaska is scant. They are said to eat"mice and other small mammals and birds"(Gabrielson and Lincoln 1957) and "mice andground squirrels" (Armstrong 1980). In my studyarea, of 411 prey items, microtine rodentscomposed 94% (table 1). Other mammals and birdscomposed only 6% of the diet. Pellets (n=99)were collected from one nest in 1983, five nestsin 1984, and two nests in 1985. At nest sitesvoles were the main prey items, but speciescomposition was different at winter roosts (table1). Yellow-cheeked voles ( Microtus xanthognathus )
was the most important prey item (76.8%) duringthe winter months, but dropped to half (48.1%)during summer. Results of a X 2 test of thesedifferences in seasonal preference are significantat the 0.01 level. The average number of micro-tines per pellet (n=114) was greater duringwinter (2.13 individuals/pellet) than duringsummer (1.28 individuals/pellet). The smallernumber of individuals during summer may have beendue partially to pellets from nestling birdsbeing included in the sample.
The slight increase in the number of birds(table 1) in summer is probably due to thegreater number of birds present in the habitatcompared with winter.
DISCUSSION
The reference by Armstrong (1980) to greatgray owls eating ground squirrels ( Cite! 1 us
parryi
i
) is probably an error and his sourcecannot be found (R. Armstrong pers. commun.).
Table 1. --Great gray owl prey analysis from winter roosts andnests, Yukon River, Alaska, 1982-1985.
SpeciesWi nter roosts Nestsnumber % number %
Mammal
s
Microtus xanthognathus 196 76.8 75 48.1Microtus pennsyl vani cus 22 8.6 52 33.3Microtus oeconomous 4 1.6 2 1.3
Microtus spp. 4 2.6CI ei thrionomys rutilus 23 9.0 8 5.2
Syaptomys boreal is 4 1.6 3 1.9Sorex spp. 1 0.4Mustela erminea 1 0.4Lepus americanus 1 0.6
Bi rds
Grouse 2 0.8 1 0.6
Perisoreus canadensis 1 0.6Passeri ne bi rd 1 0.6Unidentified feathers 2 0.8 8 5.2
Total s Z55 100.
0
T?6~ 99.9
93
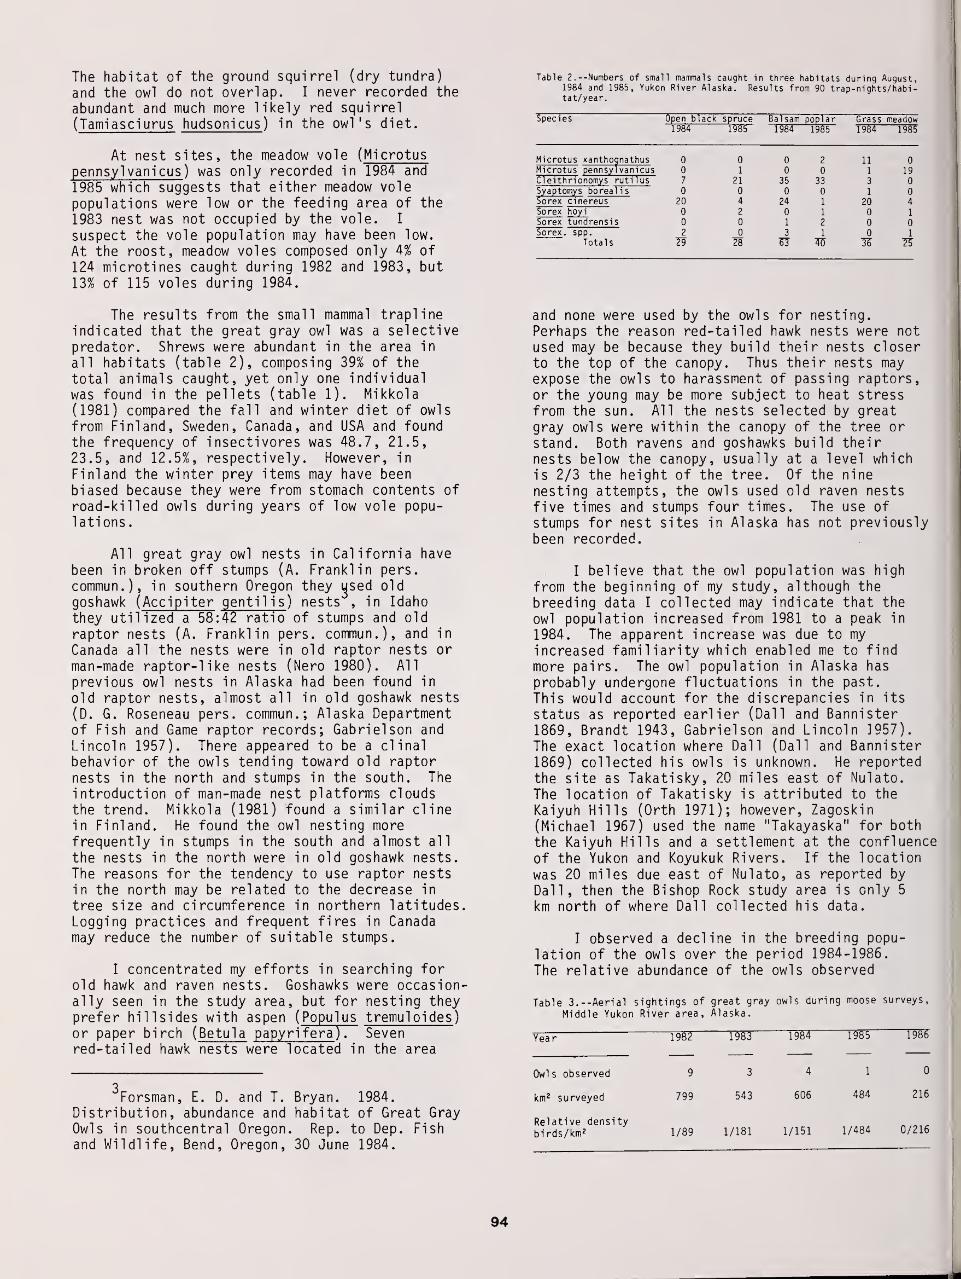
The habitat of the ground squirrel (dry tundra)
and the owl do not overlap. I never recorded the
abundant and much more likely red squirrel
( Tamiasciurus hudsonicus ) in the owl's diet.
At nest sites, the meadow vole (Microtuspennsyl vanicus ) was only recorded in 1984 and
1985 which suggests that either meadow vole
populations were low or the feeding area of the
1983 nest was not occupied by the vole. I
suspect the vole population may have been low.
At the roost, meadow voles composed only 4% of
124 microtines caught during 1982 and 1983, but
13% of 115 voles during 1984.
The results from the small mammal traplineindicated that the great gray owl was a selectivepredator. Shrews were abundant in the area in
all habitats (table 2), composing 39% of thetotal animals caught, yet only one individualwas found in the pellets (table 1). Mikkola(1981) compared the fall and winter diet of owlsfrom Finland, Sweden, Canada, and USA and foundthe frequency of insectivores was 48.7, 21.5,23.5, and 12.5%, respectively. However, in
Finland the winter prey items may have beenbiased because they were from stomach contents ofroad-killed owls during years of low vole popu-lations.
All great gray owl nests in California have
been in broken off stumps (A. Franklin pers.
commun.), in southern Oregon they used oldgoshawk ( Accipiter gentilis ) nests , in Idaho
they utilized a 58:42 ratio of stumps and old
raptor nests (A. Franklin pers. commun.), and in
Canada all the nests were in old raptor nests or
man-made raptor-like nests (Nero 1980). All
previous owl nests in Alaska had been found in
old raptor nests, almost all in old goshawk nests
(D. G. Roseneau pers. commun.; Alaska Departmentof Fish and Game raptor records; Gabriel son and
Lincoln 1957). There appeared to be a clinal
behavior of the owls tending toward old raptornests in the north and stumps in the south. Theintroduction of man-made nest platforms cloudsthe trend. Mikkola (1981) found a similar clinein Finland. He found the owl nesting morefrequently in stumps in the south and almost all
the nests in the north were in old goshawk nests.
The reasons for the tendency to use raptor nestsin the north may be related to the decrease in
tree size and circumference in northern latitudes.Logging practices and frequent fires in Canadamay reduce the number of suitable stumps.
I concentrated my efforts in searching forold hawk and raven nests. Goshawks were occasion-ally seen in the study area, but for nesting theyprefer hillsides with aspen ( Populus tremuloides )
or paper birch ( Betula papyri fera ). Sevenred-tailed hawk nests were located in the area
Forsman, E. D. and T. Bryan. 1984.
Distribution, abundance and habitat of Great GrayOwls in southcentral Oregon. Rep. to Dep. Fish
and Wildlife, Bend, Oregon, 30 June 1984.
Table 2. --Numbers of small mammals caught in three habitats during August,1984 and 1985, Yukon River Alaska. Results from 90 trap-nights/habi-tat/year.
Species Open black spruce Bal sam popl ar Grass meadow1984 1985 1984 1985 1984 1985
Microtus xanthoqnathusMicrotus pennsyl vanicus
0 0 0 2 11 00 1 0 0 1 19
Cleithrionomys rutilus 7 21 35 33 3 0
Syaptomys boreal is 0 0 0 0 1 0Sorex cinereus 20 4 24 1 20 4
Sorex hoyi 0 2 0 1 0 1
Sorex tundrensis 0 0 1 2 0 0Sorex. spp. 2 0 3 1 0 1
Totals 29" 28 63 40 36 15
and none were used by the owls for nesting.Perhaps the reason red-tailed hawk nests were not
used may be because they build their nests closerto the top of the canopy. Thus their nests mayexpose the owls to harassment of passing raptors,
or the young may be more subject to heat stressfrom the sun. All the nests selected by greatgray owls were within the canopy of the tree or
stand. Both ravens and goshawks build theirnests below the canopy, usually at a level whichis 2/3 the height of the tree. Of the nine
nesting attempts, the owls used old raven nests
five times and stumps four times. The use ofstumps for nest sites in Alaska has not previouslybeen recorded.
I believe that the owl population was high
from the beginning of my study, although the
breeding data I collected may indicate that the
owl population increased from 1981 to a peak in
1984. The apparent increase was due to my
increased familiarity which enabled me to findmore pairs. The owl population in Alaska has
probably undergone fluctuations in the past.
This would account for the discrepancies in its
status as reported earlier (Dall and Bannister1869, Brandt 1943, Gabrielson and Lincoln 1957).
The exact location where Dall (Dall and Bannister
1869) collected his owls is unknown. He reportedthe site as Takatisky, 20 miles east of Nulato.
The location of Takatisky is attributed to the
Kaiyuh Hills (Orth 1971); however, Zagoskin(Michael 1967) used the name "Takayaska" for both
the Kaiyuh Hills and a settlement at the confluence
of the Yukon and Koyukuk Rivers. If the location
was 20 miles due east of Nulato, as reported by
Dall, then the Bishop Rock study area is only 5
km north of where Dall collected his data.
I observed a decline in the breeding popu-
lation of the owls over the period 1984-1986.
The relative abundance of the owls observed
Table 3. --Aerial sightings of great gray owls during moose surveys,
Middle Yukon River area, Alaska.
Year 1982 1983 1984 1985 1986
Owls observed 9 3 4 5 1 0
km 2 surveyed 799 543 606 484 216
Relative densitybirds/km 2 1/89 1/181 1/151 1/484 0/216
94
during winter moose surveys also declined from
1984 to 1986 (table 3). I attributed the decline
to the abnormally deep snow during winter 1984-1985
and a consequent reduction in food supplies
(voles) following the 1985 flood of the meadows.
After the flood, the vole species composition of
the grass meadow changed from yellow-cheeked vole
( Microtus xanthognathus ) to meadow vole (M.
pennsyl vanicus ) and the total numbers werereduced (table 2). Yellow-cheeked voles are
dominant over other Microtus species in Alaska,
and their presence in an area would tend to lower
populations of the other voles (Wolff and Lidicker
1980). Presumably after the flood, meadow voles
were able to recolonize the meadow faster than
yellow-cheeked voles. Yellow-cheeked voles are
very active diurnal voles and are the largest
vole in Alaska, with males averaging 120 g (Wolff
and Lidicker 1980). Deep snow during wintercould have impaired owl hunting efficiency which
caused them to emigrate from the area, winterroosts were abandoned, and owl hunting plunge-marks
in the snow were only infrequently observed.
The presence of great gray owl huntingplunge-marks (see Nero 1980 for photographs)could be used as an indicator of owl habitat use,
prey densities, and owl densities. As a method,its advantage is that owls do not have to be
directly observed to detect their activities. I
realized the value of using plunge-marks to
indicate owl habitat use and density duringDecember 1984. The snow was falling frequentlyand deep enough to make plunge counts a useful
method; however, when I visited the area in
January 1985 no owls were using the area and thusthe method remains untested here.
ACKNOWLEDGMENTS
I would like to thank the following peoplefor their assistance: R. Armstrong, E. Bull, A.
Loranger, D. Gibson, G. Jarrel , J. Marcotte, S.
McDonald, R. Nero, C. Nuckols, B. L. Osborne,L. Y. Osborne, and W. Winter.
LITERATURE CITED
Armstrong, R. H. 1980. A guide to the birds ofAlaska. Alaska Northwest Publ . Co.,Anchorage, Alaska.
Brandt, H. 1943. Alaska Bird Trails. The BirdResearch Foundation. Cleveland, Ohio.
Dal 1 , W. H. and H. M. Bannister. 1869. List ofthe birds of Alaska, with biographicalnotes. Transactions of Chicago AcademySciences, 1, pt 2, pp 267-310.
Gabrielson, I. N. and F. C. Lincoln. 1957. Thebirds of Alaska. Stackpole, Harrisburg,Pennsylvania
Harris, W.C. 1984. Great Gray Owl in
Saskatchewan (1974-1983). Blue Jay42:152-160.
Michael, H. N., ed. 1967. Lieutenant Zagoskin'stravels in Russian America 1842-1844. Univ.
of Toronto Press, Toronto.Mikkola, H. 1973. In Burton, J. A., ed. Owls of
the World. Peter Lowe, Weert, Netherlands.Mikkola, H. 1981. Der Bartkauz. A. Ziemsen
Verlag, WittenbergLutherstadt , GDR.
Nero, R. W. 1980. The Great Gray Owl: phantomof the northern forest. SmithsonianInstitution Press, Washington, D.C.
Nero, R. W. 1982. Building nests for Great GrayOwls. Sialia 4(2):43-48.
Nero, R. W., H. W. R. Copland, and J. Mezibroski.1984. The Great Gray Owl in Manitoba,1963-1983. Blue Jay 42:130-151.
Orth, D. J. 1971. Dictionary of Alaska PlaceNames. U.S. Gov. Printing Off., Washington,D.C.
Selkregg, L. L., ed. 1976. Alaska regionalprofiles Yukon region. Univ. of Alaska,Fairbanks, Arctic Environ. Info. DataCenter, Anchorage, Alaska, Vol 1.
Wolff, J. 0. and W. Z. Lidicker. 1980.
Population ecology of the taiga vole,Microtus xanthognathus , in interior Alaska.Can. J. Zool. 58:1800-1812.
95
A Floristic Analysis of Great Gray Owl Habitat in
Aitkin County, Minnesota 1
Mark F. Spreyer 2
Abstract -- The floristic community associated with fourteen Great
Gray Owl (Strix nebulosa) nest sites (Loch, in lit.) was analyzed. Theoverstory was dominated by black ash (Fraxinus nigra) and basswood(Tilia americana) and the prevalent shrub layer species included
currants {Ribes sp.) and silky dogwood {Cornus amomum). Ginger
(Asarum canadense), bedstraw (Galium sp.), wild strawberry (Fragaria
virginiana), and jewelweed [Impatiens capensis) were common in the
ground layer. Most of the nest sites were of \heCornus Carex sp.-Caltha
palustris habitat type according to Mueller-Dombois (1974). Conversion
of this habitat type for farming or mining poses a long-term threat to
Great Gray Owl habitat in Aitkin County.
INTRODUCTION
The objective of this study was to describe the nest site
habitat of the Great Gray Owl in Aitkin County, Minnesota.
The effects of land use practices on the owl's habitat will be
discussed.
SITE DESCRIPTION AND METHODS
Site Description
The Aitkin County study area, approximately 20 square
miles in area, is located in north central Minnesota.
Elevations within the study area range from 1 235-1 266 feet
above sea level . The January mean temperature is
approximately 4 F., the July mean temperature is about 66
F., and the mean annual precipitation is approximately 26
inches (Clapp, 1981).
The area is a mix of tamarack-black spruce (-50%), open
communities composed of grass and sedge meadows or
other open situations (-30%), and hardwood communities
(-20%). The soils are predominantly organic in nature.
Paper presented at the symposium, Biology and
Conservation of Northern Forest Owls, Feb. 3-7, 1987,
Winnipeg, Manitoba. USDA Forest Service General Technical
Report RM-1 42.
2St. Cloud State University, St. Cloud, Minnesota
Present Address: Chicago Academy of Sciences
Chicago, Illinois 60614
METHODS
A 400 square meter plot, 20 meters on a side, wascentered on each nest tree. The plot size is a modification of
the recommended tenth-acre circular plots (James and
Shugart, 1 970; Titus and Mosher, 1 981 ). All trees over five
meters in height (Mueller-Dombois and Ellenberg, 1974)
were measured for diameter at breast height with a diameter
tape and for height with a Spiegel-Relaskop. Each tree wasrated as to its position in the canopy (Smith, 1 962). The nest
tree and three other dominant or codominant trees were
drilled with an increment borer to determine age. At four
locations in the plot, per cent cover was determined using a
densiometer.
For this study the shrub layer was defined as plants,
generally woody perennials, ranging in height from 50
centimeters to 5 meters (Mueller-Dombois and Ellenberg,
1974). The average height, cover (Daubenmire, 1968), and
dispersion (Braun-Blanquet, 1965) will be recorded for each
shrub species within the 400 square meter plot. The plot wastransected four times in order to describe the understory.
The ground layer was defined as plants, usually
herbaceous, that are less than 50 centimeters in height
(Mueller-Dombois and Ellenberg, 1974). Two smaller plots,
measuring 2 meters by 1 meter and located in a regularized
pattern within the larger plot, were used to study the
herbaceous layer. Each species' cover and dispersion were
ocularly estimated using the same scales applied to the shrub
layer.
96
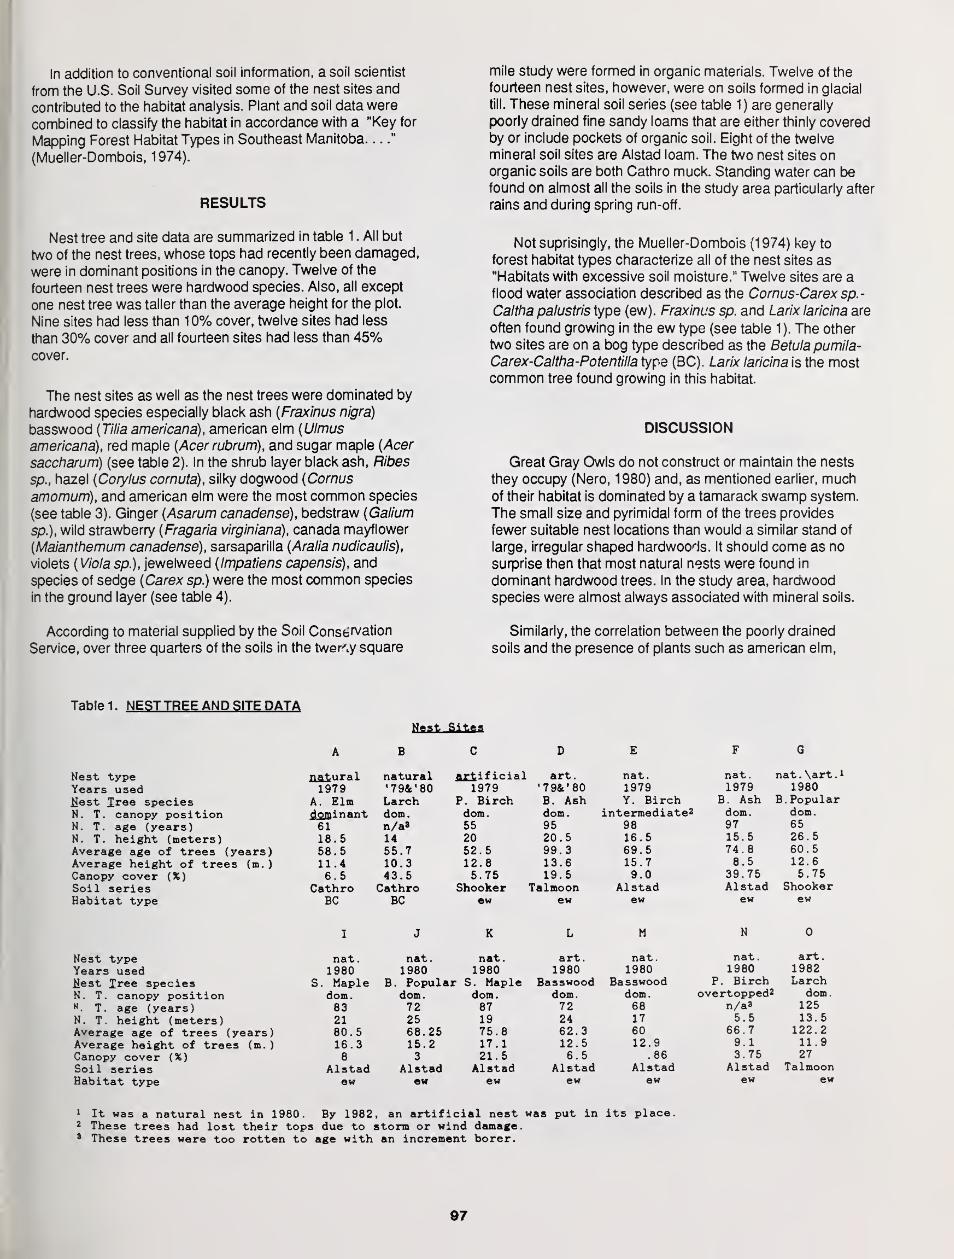
In addition to conventional soil information, a soil scientist
from the U.S. Soil Survey visited some of the nest sites and
contributed to the habitat analysis. Plant and soil data were
combined to classify the habitat in accordance with a "Key for
Mapping Forest Habitat Types in Southeast Manitoba—
"
(Mueller-Dombois, 1974).
RESULTS
Nest tree and site data are summarized in table 1 . All but
two of the nest trees, whose tops had recently been damaged,
were in dominant positions in the canopy. Twelve of the
fourteen nest trees were hardwood species. Also, all except
one nest tree was taller than the average height for the plot.
Nine sites had less than 10% cover, twelve sites had less
than 30% cover and all fourteen sites had less than 45%cover.
The nest sites as well as the nest trees were dominated by
hardwood species especially black ash (Fraxinus nigra)
basswood {Tilia americana), american elm {Ulmus
americana), red maple (Acer rubrum), and sugar maple (Acer
saccharum) (see table 2). In the shrub layer black ash, Ribes
sp., hazel (Corylus cornuta), silky dogwood (Cornus
amomum), and american elm were the most common species
(see table 3). Ginger (Asarum canadense), bedstraw (Galium
sp.), wild strawberry (Fragaria virginiana), Canada mayflower
(Maianthemum canadense), sarsaparilla (Aralia nudicaulis),
violets (Viola sp.), jewelweed (Impatiens capensis), and
species of sedge (Carex sp.) were the most common species
in the ground layer (see table 4).
According to material supplied by the Soil Conservation
Service, over three quarters of the soils in the twe^y square
mile study were formed in organic materials. Twelve of the
fourteen nest sites, however, were on soils formed in glacial
till. These mineral soil series (see table 1) are generally
poorly drained fine sandy loams that are either thinly covered
by or include pockets of organic soil. Eight of the twelve
mineral soil sites are Alstad loam. The two nest sites onorganic soils are both Cathro muck. Standing water can befound on almost all the soils in the study area particularly after
rains and during spring run-off.
Not suprisingly, the Mueller-Dombois (1974) key to
forest habitat types characterize all of the nest sites as
"Habitats with excessive soil moisture." Twelve sites are a
flood water association described as the Cornus-Carex sp.-
Caltha palustris type (ew). Fraxinus sp. and Larix laricina are
often found growing in the ew type (see table 1). The other
two sites are on a bog type described as the Betula pumila-
Carex-Caltha-Potentilla type (BC). Larix laricina is the mostcommon tree found growing in this habitat.
DISCUSSION
Great Gray Owls do not construct or maintain the nests
they occupy (Nero, 1980) and, as mentioned earlier, muchof their habitat is dominated by a tamarack swamp system.
The small size and pyrimidal form of the trees provides
fewer suitable nest locations than would a similar stand of
large, irregular shaped hardwocis. It should come as no
surprise then that most natural nests were found in
dominant hardwood trees. In the study area, hardwood
species were almost always associated with mineral soils.
Similarly, the correlation between the poorly drained
soils and the presence of plants such as american elm,
Table 1. NEST TREE AND SITE DATA
Host Sites
A B c D E F G
Nest type natural natural artificial art
.
nat
.
nat
.
nat . \art
.
1
Years used 1979 «79&'80 1979 '79&'80 1979 1979 1980
N_est J_ree species A. Elm Larch P. Birch B. Ash Y. Birch B. Ash B. PopularN. T. canopy position dominant dom. dom. dom. intermediate2 dom. dom.
N. T. age (years) 61 n/a* 55 95 98 97 65
N. T. height (meters) 18.5 14 20 20.5 16.5 15.5 26.5Average age of trees (years) 58.5 55.7 52.5 99.3 69.5 74.8 60.5Average height of trees (m.
)
11.4 10.3 12.8 13.6 15.7 8.5 12.6
Canopy cover (%) 6.5 43.5 5.75 19.5 9.0 39.75 5.75
Soil series Cathro Cathro Snooker Talmoon Alstad Alstad ShookerHabitat type BC BC ew ew ew ew ew
1
I J
Nest type nat. nat.Years used 1980 1980fiest J_ree species S. Maple B. PopulN. T. canopy position dom. dom.M
. T. age (years) 83 72N. T. height (meters) 21 25Average age of trees (years) 80. 5 68.25Average height of trees (m.
)
16.3 15.2Canopy cover (%) 8 3Soil series Alstad AlstadHabitat type ew ew
K L M N 0
nat. art. nat. nat. art.1980 1980 1980 1980 1982. Maple Basswood Basswood P. Birch Larchdom. dom. dom. overtopped2 dom.
87 72 68 n/aa 12519 24 17 5.5 13.575.8 62.3 60 66.7 122.217.1 12.5 12.9 9.1 11.921.5 6.5 .86 3.75 27
Alstad Alstad Alstad Alstad Talmoonew ew ew ew ew
1 It was a natural nest in 1980. By 1982, an artificial nest was put in its place.2 These trees had lost their tops due to storm or wind damage.' These trees were too rotten to age with an increment borer.
97
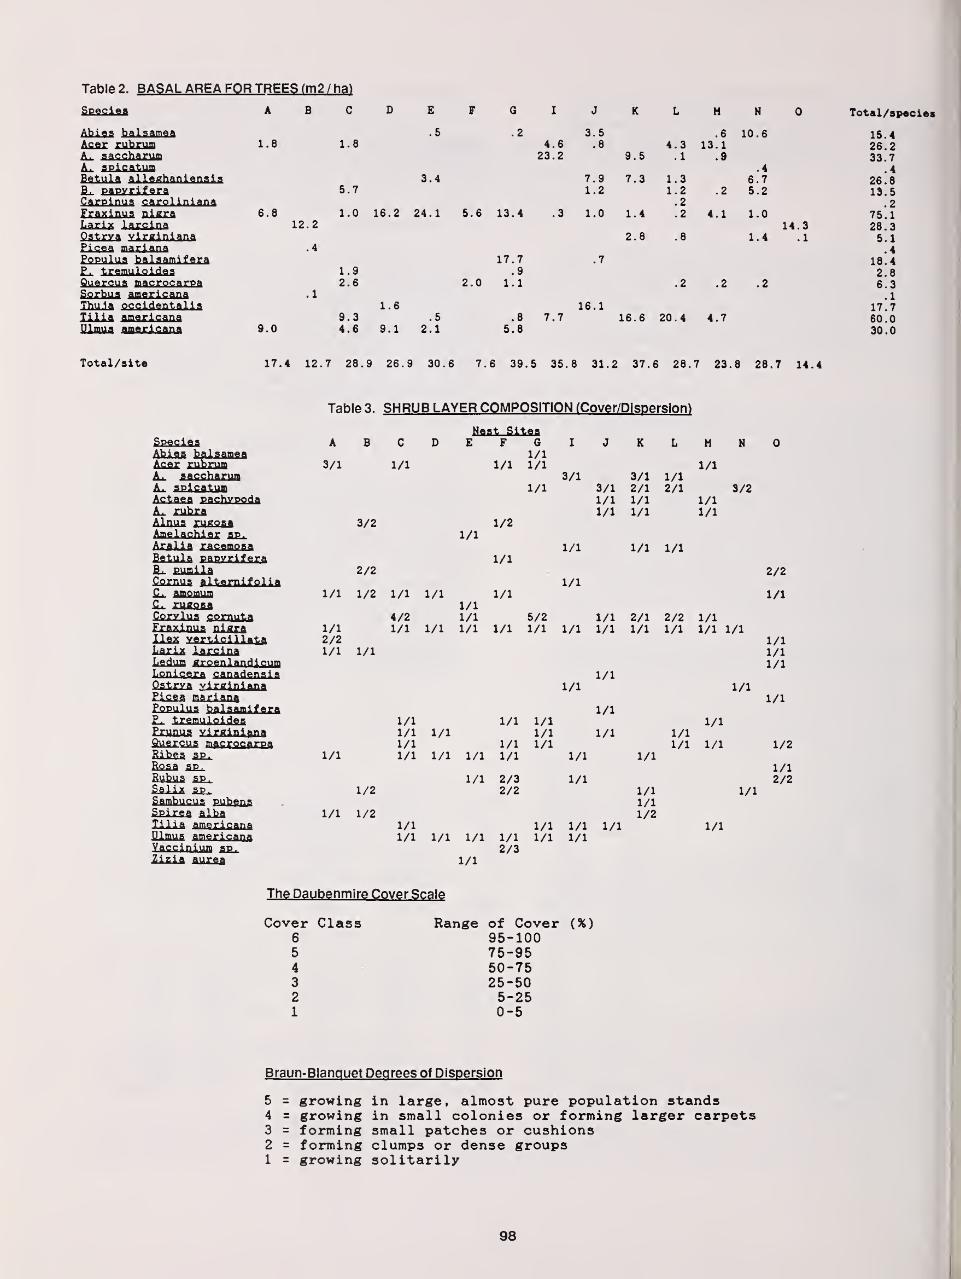
Table 2. BASAL AREA FOR TREES (m2 / ha)
Species ABCAklOS balsameaAcer rubP'F1 1.6 1.8Ao. aaccharumLl. apicatumBetula alleghanlenaiaJL. papvrifera 5.7Carplnua carolinianaFraxjnua aigxa 6.8 l.oLaris larcina 12.2Qstrya vlrglnianaPicea mariana . 4
P<?PUlua balsamiferaPL. trsjmlaidaa 1.9Quercua macrocarpa 2.6Sfljdma americana • 1
Thu.la occidentallaliila amaxigana 9.3Ulma aaarisana 9.0 4.6
1.6
9.1.5
2.1
2.0
G
.2
3.4
16.2 24.1 5.6 13.4
17.7.9
1.1
.85.8
4.623.2
7.7
3.5.8
7.91.2
.3 1.0
16.1
9.5
7.3
1.4
2.8
4.3.1
1.31.2.2.2
.8
M
.613.1
.9
.2
4.1
16.6 20.4 4.7
N
10.6
.46.75.2
1.0
1.414.3
.1
Total/species
15.426.233.7
.4
26.613.5
.275.126.35.1.4
18.42.86.3.1
17.760.030.0
Total/site 17.4 12.7 26.9 26.9 30.6 7.6 39.5 35.8 31.2 37.6 28.7 23.8 28.7 14.4
Table 3. SHRUB LAYER COMPOSITION (Cover/Dlspersionl
SoecieaAhififi balsameaAcer ruhmm£u. saecharumLl. aplcatufflActfle fl cachypodaA. rubraAlnus rugosaAaslflshi&r. sjll.
Alalia racemoaaBctUlft PapvriferaB. pumilaCgrnuS flltemifoliaC. amftmnm
Corylua cornutaFraxinus nigrallfiS verticlll»t.aLaxi^ larcinaLfidjua groenlandicumLanlfiflCfl canadensisQstryfl virginianaFigea marianaPgPUlUS balsaaiferaf_. tremuloidaaPfUnUS virginianaQti e rcus macrgcarpaRibes bp.Rosa sp.Rubus sp L
SaiiJl sp.Sambucus PubensSpirea al^alilla americanaUifflus. americanaVaccinium SP.Zizia aurea
A
3/1
1/1
1/12/21/1
1/1
1/1
B C
1/1
3/2
2/2
1/2 1/1
4/2
1/1
1/2
1/2
1/11/11/11/1
1/11/1
Neat SitesE F G
1/11/1 1/1
1/1
1/1
1/11/1
1/1
1/1 1/1
1/1 1/1
1/1
1/1
1/2
1/1
1/1
1/1 1/1 1/1 1/15/21/1
1/1 1/11/1
1/11/1
1/12/3
1/1
1/1 2/32/2
1/11/1
3/1
1/1
1/1
1/1
1/1
1/1
1/1
1/11/1
3/1 1/13/1 2/1 2/11/1 1/11/1 1/1
1/1
1/1
1/1
1/1 1/1
1/1 2/1 2/21/1 1/1 1/1
1/1
M
1/1
1/11/1
1/1
1/11/11/2
3/2
1/11/1 1/1
1/1
1/11/11/1 1/1
1/1
1/1
2/2
1/1
1/11/11/1
1/1
1/2
1/12/2
The Daubenmire Cover Scale
Cover Class65
4
3
2
1
Range of Cover (%)95-10075-9550-7525-505-250-5
Braun-Blanquet Degrees of Dispersion
5 = growing in large, almost pure population stands4 = growing in small colonies or forming larger carpets3 = forming small patches or cushions2 = forming clumps or dense groups1 = growing solitarily
98
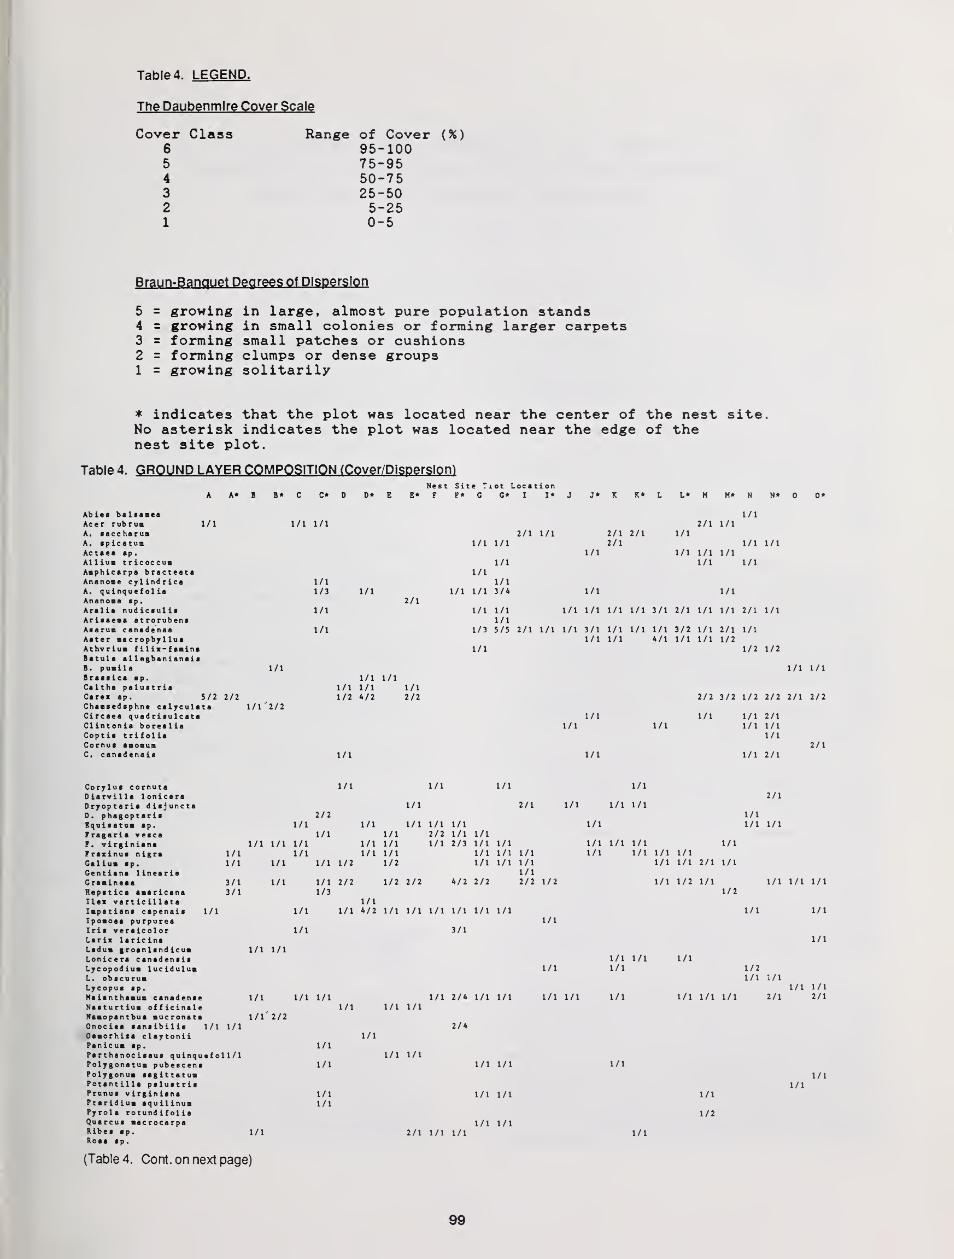
Table 4. LEGEND.
The Daubenmlre Cover Scale
Cover Class Range of Cover (%)6 95-1005 75-954 50-753 25-502 5-251 0-5
Braun-Banquet Degrees of Dispersion
5 = growing in large, almost pure population stands4 = growing in small colonies or forming larger carpets3 = forming small patches or cushions2 = forming clumps or dense groups1 = growing solitarily
* indicates that the plot was located near the center of the nest site.No asterisk indicates the plot was located near the edge of thenest site plot.
Table 4. GROUND LAYER COMPOSITION (Cover/Dispersion)
Nest Site ?iot LocationA A* B B* C C* 0 D * E E* F F* G G* I I* J J* K K* L L* M M* N N* 0 0*
Abies baleaaea l/lAcer rubrua 1/1 1/1 1/1 2/1 1/1A. aaecharua 2/1 1/1 2/1 2/1 1/1A. apicatua 1/1 1/1 2/1 1/1 1/1Aetata ap. 1/1 1/1 1/1 1/1Alliua tricoeeua 1/1 1/1 1/1Aaphicarpa bracteata 1/1Anenoae eylindriea 1/1 1/1A. quinquefolia 1/3 1/1 1/1 1/1 3/4 1/1 1/1Anenoae ap. 2/1Aralia nudieaulia 1/1 1/1 1/1 1/1 1/1 1/1 1/1 3/1 2/1 1/1 1/1 2/1 1/1Ariaaeaa atrorubena 1/1Aaarua canadense 1/1 1/3 5/5 2/1 1/1 1/1 3/1 1/1 1/1 1/1 3/2 1/1 2/1 1/1Aatar aacrophyllua 1/1 1/1 4/1 1/1 1/1 1/2Athvriua filix-feaina 1/1 1/2 1/2Betula allegbanienaiaB. puaila 1/1 1/1 1/1Braaaica ap. 1/1 1/1Caltha paluatria 1/1 1/1 1/1Carex ap. 5/2 2/2 1/2 4/2 2/2 2/2 3/2 1/2 2/2 2/1 2/2Chaaaedaphne calycuiata 1/1 '2/2Cireaea quad riaulcata 1/1 1/1 1/1 2/1Clintonia borealie 1/1 1/1 1/1 1/1Coptia trifolia 1/1Cornua aaoaua 2/1C. canadensis 1/1 1/1 1/1 2/1
Corylua cornuta 1/1 1/1 1/1 1/1
Diervilla lonicera 2/1Dryopteria diajuncta 1/1 2/1 1/1 1/1 1/1
D. phegoptaria 2/2 1/1Equiaetua ap. 1/1 1/1 1/1 1/1 1/1 1/1 1/1 1/1
Fragaria vesca 1/1 1/1 2/2 1/1 1/1F. »irginiana 1/1 1/1 1/1 1/1 1/1 1/1 2/3 1/1 1/1 1/1 1/1 1/1 1/1Fraxinua nigra 1/1 1/1 1/1 1/1 1/1 1/1 1/1 1/1 1/1 1/1 1/1Galiua ap. 1/1 1/1 1/1 1/2 1/2 1/1 1/1 1/1 1/1 1/1 2/1 1/1Gentiana linearia 1/1Graainaae 3/1 1/1 1/1 2/2 1/2 2/2 4/2 2/2 2/2 1/2 1/1 1/2 1/1 1/1 1/1 1/1Rapatica aaaricana 3/1 1/3 1/2Ilex verticillata 1/1Iapatiena capeneia 1/1 1/1 1/1 4/2 1/1 1/1 1/1 1/1 1/1 1/1 1/1 1/1
Ipoaoea purpurea 1/1Iria versicolor 1/1 3/1Larix laricina 1/1Ladua groanland ieua 1/1 1/1Lonicera eanadanaia 1/1 1/1 1/1Lyeopodiua lucidulua 1/1 1/1 1/2L. obacurua 1/1 1/1
Lycopua ap. 1/1 1/1Halanthaaua canadenaa l/l 1/1 1/1 1/1 2/4 1/1 1/1 1/1 1/1 1/1 1/1 1/1 1/1 2/1 2/1
Naaturtiua officinala . 1/1 1/1 1/1•aopanthua aucronata 1/12/2Onoeiea acnaibilia 1/1 1/1 2/4Oeaorhixa claytonii 1/1Fanicua ap. 1/1Parthenocieaua qulnquefoll/1 1/1 1/1Polygonatua pubeacena 1/1 1/1 1/1 1/1Polygonua aagittatua l/lFotantllla paluatria 1/1Prunua virginlana 1/1 1/1 1/1 1/1Ftaridiua aqullinua 1/1Pyrola rotundifolia 1/2Quercus aacrocarpa 1/1 1/1Rib" "P. 1/1 2/1 1/1 1/1 1/1Rosa ap.
(Table 4. Co nt. on next page)
99
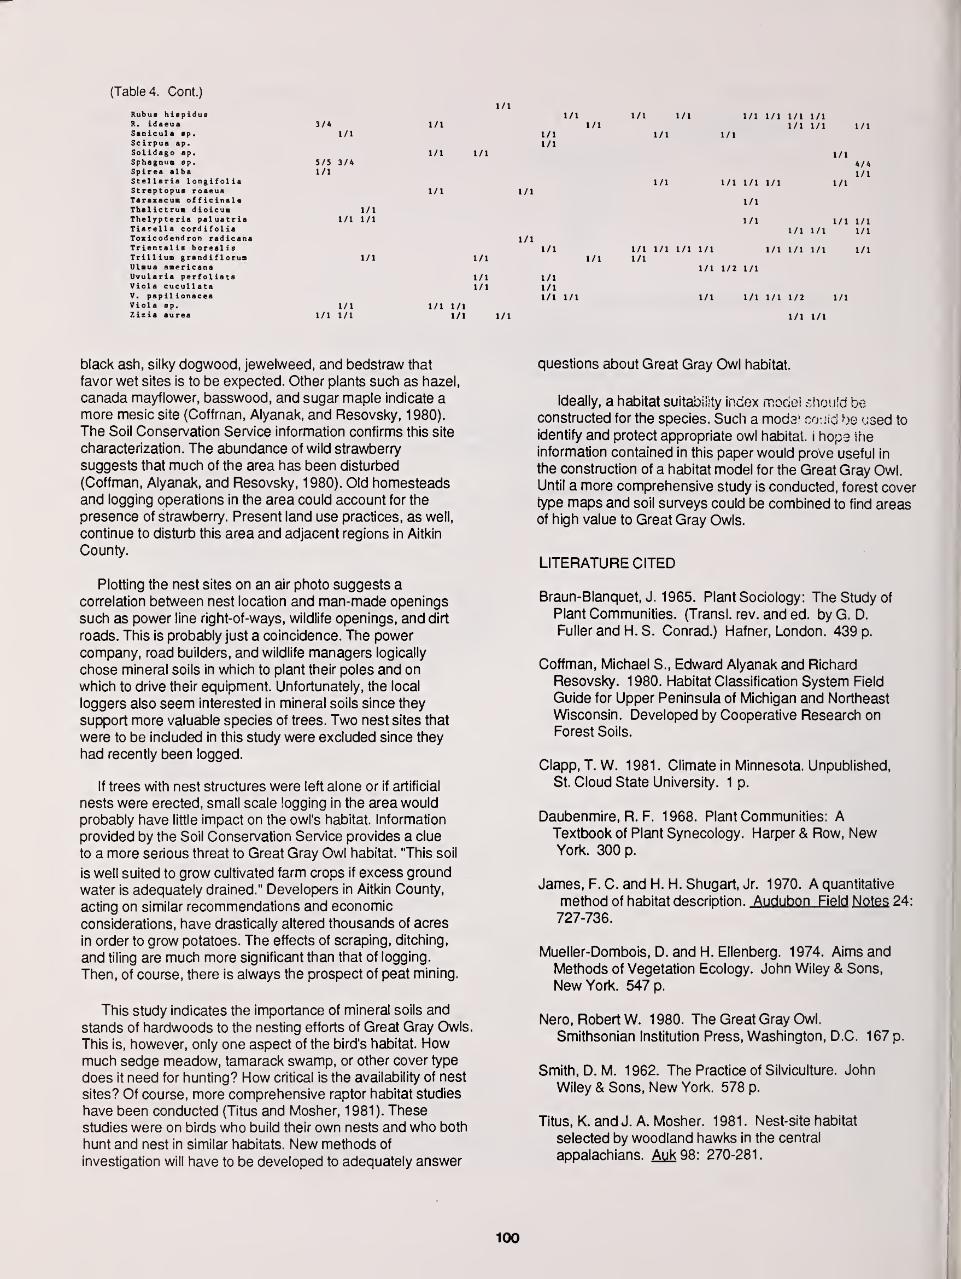
(Table 4. Cont.)
Rub usR. idSan ic
SeirpSolidSphagSpireStellSt repTarsiThaliThelyTiareToxicTrienTrillUlauaUvulaViolaV. paViolaZizia
hiaaeuaulausagonuma alariatopuaeuactrupter11aodentaliiuame
riacue
piliap.aur
pidus
ap.
P-ap.ap.balongif oliaroaeua
officinal*dioicua
ia paluatriacordifoliadron radicanaa borealisgrand i f 1 orumricanaperf oliataullataonacea
3/*1/1
5/5 3/41/1
l/l1/1 1/1
1/1
1/11/1 1/1
1/1
1/1
1/1
1/1
1/1
1/1
1/11/1
1/1 1/11/1
1/1
1/11/1
1/1
1/11/1
1/1
1/1
1/11/11/1 1/1
1/1 1/1
l/l
1/1
1/1 1/1 1/1 1/11/1 1/1
1/1
1/1 1/1 1/1
1/1
1/1
1/1
1/1 1/1 1/1 1/11/1
1/1 1/2 1/1
1/14/41/1
1/1
1/t 1/11/1 1/1 1/1
1/1 1/1 l/l 1/1
1/1
l/l 1/1 1/1 1/2 1/1
1/1 1/1
black ash, silky dogwood, jewelweed, and bedstraw that
favor wet sites is to be expected. Other plants such as hazel,
Canada mayflower, basswood, and sugar maple indicate amore mesicsite (Coffman, Alyanak, and Resovsky, 1980).
The Soil Conservation Service information confirms this site
characterization. The abundance of wild strawberry
suggests that much of the area has been disturbed
(Coffman, Alyanak, and Resovsky, 1980). Old homesteadsand logging operations in the area could account for the
presence of strawberry. Present land use practices, as well,
continue to disturb this area and adjacent regions in Aitkin
County.
Plotting the nest sites on an air photo suggests acorrelation between nest location and man-made openings
such as power line right-of-ways, wildlife openings, and dirt
roads. This is probably just a coincidence. The power
company, road builders, and wildlife managers logically
chose mineral soils in which to plant their poles and on
which to drive their equipment. Unfortunately, the local
loggers also seem interested in mineral soils since they
support more valuable species of trees. Two nest sites that
were to be included in this study were excluded since they
had recently been logged.
If trees with nest structures were left alone or if artificial
nests were erected, small scale logging in the area would
probably have little impact on the owl's habitat. Information
provided by the Soil Conservation Service provides a clue
to a more serious threat to Great Gray Owl habitat. "This soil
is well suited to grow cultivated farm crops if excess ground
water is adequately drained." Developers in Aitkin County,
acting on similar recommendations and economic
considerations, have drastically altered thousands of acres
in order to grow potatoes. The effects of scraping, ditching,
and tiling are much more significant than that of logging.
Then, of course, there is always the prospect of peat mining.
This study indicates the importance of mineral soils and
stands of hardwoods to the nesting efforts of Great Gray Owls.
This is, however, only one aspect of the bird's habitat. Howmuch sedge meadow, tamarack swamp, or other cover type
does it need for hunting? How critical is the availability of nest
sites? Of course, more comprehensive raptor habitat studies
have been conducted (Titus and Mosher, 1981). Thesestudies were on birds who build their own nests and who both
hunt and nest in similar habitats. New methods of
investigation will have to be developed to adequately answer
questions about Great Gray Owl habitat.
Ideally, a habitat suitability index model should beconstructed for the species. Such a modal couid be used to
identify and protect appropriate owl habitat, i hope ihe
information contained in this paper would prove useful in
the construction of a habitat model for the Great Gray Owl.
Until a more comprehensive study is conducted, forest covertype maps and soil surveys could be combined to find areasof high value to Great Gray Owls.
LITERATURE CITED
Braun-Blanquet, J. 1965. Plant Sociology: The Study of
Plant Communities. (Transl. rev. and ed. by G. D.
Fuller and H.S. Conrad.) Hafner, London. 439 p.
Coffman, Michael S., Edward Alyanak and Richard
Resovsky. 1980. Habitat Classification System Field
Guide for Upper Peninsula of Michigan and Northeast
Wisconsin. Developed by Cooperative Research onForest Soils.
Clapp, T. W. 1981 . Climate in Minnesota. Unpublished,
St. Cloud State University. 1 p.
Daubenmire, R. F. 1968. Plant Communities: ATextbook of Plant Synecology. Harper & Row, NewYork. 300 p.
James, F. C. and H. H. Shugart, Jr. 1970. A quantitative
method of habitat description. Audubon Field Notes 24:
727-736.
Mueller-Dombois, D. and H. Ellenberg. 1974. Aims and
Methods of Vegetation Ecology. John Wiley & Sons,
New York. 547 p.
Nero, Robert W. 1 980. The Great Gray Owl.
Smithsonian Institution Press, Washington, D.C. 167 p.
Smith, D. M. 1962. The Practice of Silviculture. John
Wiley & Sons, New York. 578 p.
Titus, K. and J. A. Mosher. 1981 . Nest-site habitat
selected by woodland hawks in the central
appalachians. Ayk98: 270-281.
100
Movement Strategies, Mortality, and Behavior of
Radio-Marked Great Gray Owls in SoutheasternManitoba and Northern Minnesota 1
James R. Duncan 2
Abstract.—Forty-three great gray owls (Strix nebulosa)were radio-marked in southeastern Manitoba and northernMinnesota. The movements and behavior of these birdsrevealed sex-biased mobility in a year of low prey avail-ability and residency in a high microtene year. The greathorned owl (Bubo virginianus) was the most significantpredator in both situations. The adaptive significance ofdifferent life-strategies evolved in the great gray owl arediscussed.
INTRODUCTION
Natural selection has operated on northernforest owls to produce numerous adaptationsenabling their survival in boreal forest habitat.These include anatomical (i.e., wing shape andsize) and behavioral (i.e., hunting methods)adaptations resulting from interactions with preypopulations over an evolutionary time scale(Norberg 1987) . Mikkola (1983) noted a largedegree of niche overlap among many northernforest owl species. He speculates that this lackof ecological isolation is due to the cyclicnature of their food and that, during years of lowprey densities, the local sympatry of owls is notconstant. Observable morphological and behavioraldifferences have arisen from interspecificcompetition and in response to a number ofenvironmental constraints. Lundberg (1979) notesthat nest-sites, food, clutch size, mate and nestterritory fidelity, sexual dimorphism andlongevity all help shape the pattern of mobilityand wintering strategies of northern forest owls.Of these, food abundance and nest-site availabilityare considered the most prominent (Lundberg 1979,Nero 1980, Mikkola 1983) and are thought tointeract as follows:
a) There should be selection for year-roundresidency of both sexes in hole-nesting (scarceresource) food generalists.e.g. ural owl, Strix uralensis : (Lundberg 1979;
Saurola 1987 )
.
Paper presented at the symposium, Biologyand Conservation of Northern Forest Owls,Feb. 3-7, 1987, Winnipeg, Manitoba. USDA ForestService General Technical Report PM-142.
James R. Duncan is a Ph. D. candidate,McGill University, Montreal, Quebec.
e.g. barred owl, Strix varia : , (Nicholls &
Fuller 1987).1
b) Both sexes should be migratory if nest-sitesare abundant but a dependence exists on a highlyfluctuating food source (voles)
.
e.g. long-eared owl, Asio otus : (Lundberg 1979)
.
c) In hole-nesting food specialists, residentmales and migratory females should be selected for.
e.g. boreal owl, Aegolius funereus : (Lundberg1979, Korpimaki 1986a)
.
northern hawk-owl, Surnia ulula : (Byrkjedal& Langhelle 1986; Sonerud 1986).
Lundberg (1979) concluded that assured accessto a nest-site is probably the most fundamentalfactor governing movement patterns in northernforest owls. Therefore, the ural and barred owlsresidency is presumably an adaptation to thescarce nature of their nesting structure and is
facilitated by their generalistic diet. Therelative abundance of stick nests allows the long-eared owl to migrate to snow-free areas, and is
required because of its specialized small mammaldiet. A conflict arises between migration(specialist diet) and residency (scarce suitablenest-holes) for the boreal and northern hawk-owls.Here, males should remain resident for as long aspossible and females should move to areas ofgreater prey densities or vulnerability (Lundberg1979). Sonerud (1986) stated that the abovearguments can be reversed whereby the nesting siteis determined by a) feeding ecology, b) huntinghabitat, and c) the effect of snow cover on preyvulnerability
.
While all owls can hunt by the energeticallyinexpensive sit-and-wait mode, some, like thelong-eared owl, use the energetically moreexpensive quartering (flying) hunting method.During snow-free periods both hunting methods cantake advantage of prey occurring in clear-cuts
101
and similar openings. Sonerud (1986) determinedthat because of snow cover the less abundantsmall mammal populations occurring in foresthabitat are more vulnerable to predation thanthe more abundant populations occurring in openareas. This is due to increased supra-niveanand snow-tunneling activity of small mammals inthe former habitat resulting from the lack of awell developed, continuous, pukak layer (spaceformed at the snow-ground interface) . Short andbroad wings, providing greater maneuverabilityamong vegetation, are but one of many adaptationsenabling certain forest owls to capture prey inwooded habitat (Norberg 1987) . The relativelylong and narrow wings of the long-eared owlrenders it less able to capture prey in foresthabitat. It must migrate to snow-free areas andreturn only when open areas are partially snow-free. By this time presumably only old sticknests are available. Long-eared owls will usenest-holes (nest boxes) on rare occasions whencompetitors are absent (Cave 1968 in Sonerud 1986)
.
Ural and barred owls can remain year-round resi-dents by their ability to locate and capture preyby the sit-and-^wait hunting mode in forest habitat.Their year-round residency is facilitated bytheir ability to survive on alternate prey itemswhen small mammal populations are at a cycliclow. Northern hawk-owls and boreal owls alsoemploy a sit-and-wait hunting strategy, enablingthem to reside year-round in forest habitatwhere the small mammals on which they specializeare more vulnerable during periods of snow cover.However, during periods of low small mammaldensities, they are less able to switch toalternate prey than are ural and barred owls.Observed male residency of northern hawk-owlsand boreal owls perhaps indicates that the potentialreproductive benefits of possessing a suitablenest structure outweigh the risk of winterstarvation (Lundberg 1979)
.
The great gray owl (Strix nebulosa ) is quitecatholic in its use of habitat and nest structures,but it is a small mammal specialist and is there-fore similar to the long-eared owl (Collins 1980,Nero 1980, Mikkola 1983, Roselar 1985 andKorpimaki 1986b) . According to Lundberg (1979) itshould be migratory, but Sonerud (1986) arguesthat given adequate prey it should exhibit year-round residency since, like the boreal andnorthern hawk-owls, it can hunt within foresthabitat and catch concealed prey. However,normal microtene populations can decline toextremely low densities at unpredictable intervals,and can subsequently fail to recover for longperiods of time (Mihok et al. 1985). During suchdeclines we may predict age and sex biased mobilityas was reported for northern hawk-owls by Byrkjedal& Langhelle (1986) . These predictions arise fromthree "single-factor" hypotheses reviewed byKetterson & Nolan (1983) and discussed in Byrkjedal& Langhelle (1986)
.
a) Body Size Hypothesis: larger birds endurefasting better than smaller ones and therefore arein less need of migrating (which may imply amortality risk)
.
b) Dominance Hypothesis: subdominant birds arerelegated to adverse habitats due to intraspecificcompetition and are the first to move whenconditions get harder.
c) Arrival-time Hypothesis: the sex thatestablishes the breeding territory should migratethe shortest distance in order to get early accessto a territory in spring.
In this paper I shall examine the movementsand behavior of radio-marked great gray owls inrelation to the above hypotheses and comparethose of other northern forest owl species. Theadaptive nature of the different life-strategiesevolved in these species will be discussed.
MATERIALS AND METHODS
1 . Radio-telemetry
Forty-three great gray owls were radio-markedin southeastern Manitoba and northern Minnesotabetween April 1984 and August 1986. This area isprimarily boreal forest. Two locations, A & B(fig. 1) , approximately 100km apart, are currentlybeing experimentally managed for this species inlight of existing and potential threats tohabitat. Both locations contain large stands ofold and mixed-age growth tamarack (Larix larincina )
and tamarack/black spruce (Picea mariana) withnatural and man-made openings, i.e., burns andclear-cuts. The owls radio-marked within the studyarea, all of figure 1, may be described as threesamples
:
a) April-July 1984: eight mated pairs, a breedingmale, and 11 of their progeny. Radio-marked atlocation A, figure 1 (Loch 1985) .
b) February-March 1986: three immature (hatch-year 1985) males, two adult females, and an adultmale. Radio-marked at various locations within thestudy area, figure 1.
c) June-August 1986: a breeding pair, twD breedingfemales, and five of their progeny. Radio-markedat location B, figure 1.
Radio—transmitters measured 8cm long by 15cmin diameter and averaged 35g complete with harness.A 28cm long whip antenna extended posteriorly fromeach unit. Each transmitter was powered by a 2000milliampere, 3.9 volt lithium battery; current drainranged from 0.10-0.19 milliampere/hour . Frequencieswere separated by at least 15khz within the 164megahertz band. A modified "back-pack-type"harness, consisting of a plastic coated wirerunning through 6mm (diameter) of teflon tubing, wasdeveloped by Loch (1985)
3 to attach transmitters toowls. Properly fitted, the transmitter and harness
Loch, S. L. 1985. Manitoba great gray owlproject progress report. April 1, 1984 to August 1,
1985. Manitoba Dept. of Nat. Res., Winnipeg, Manitoba
102
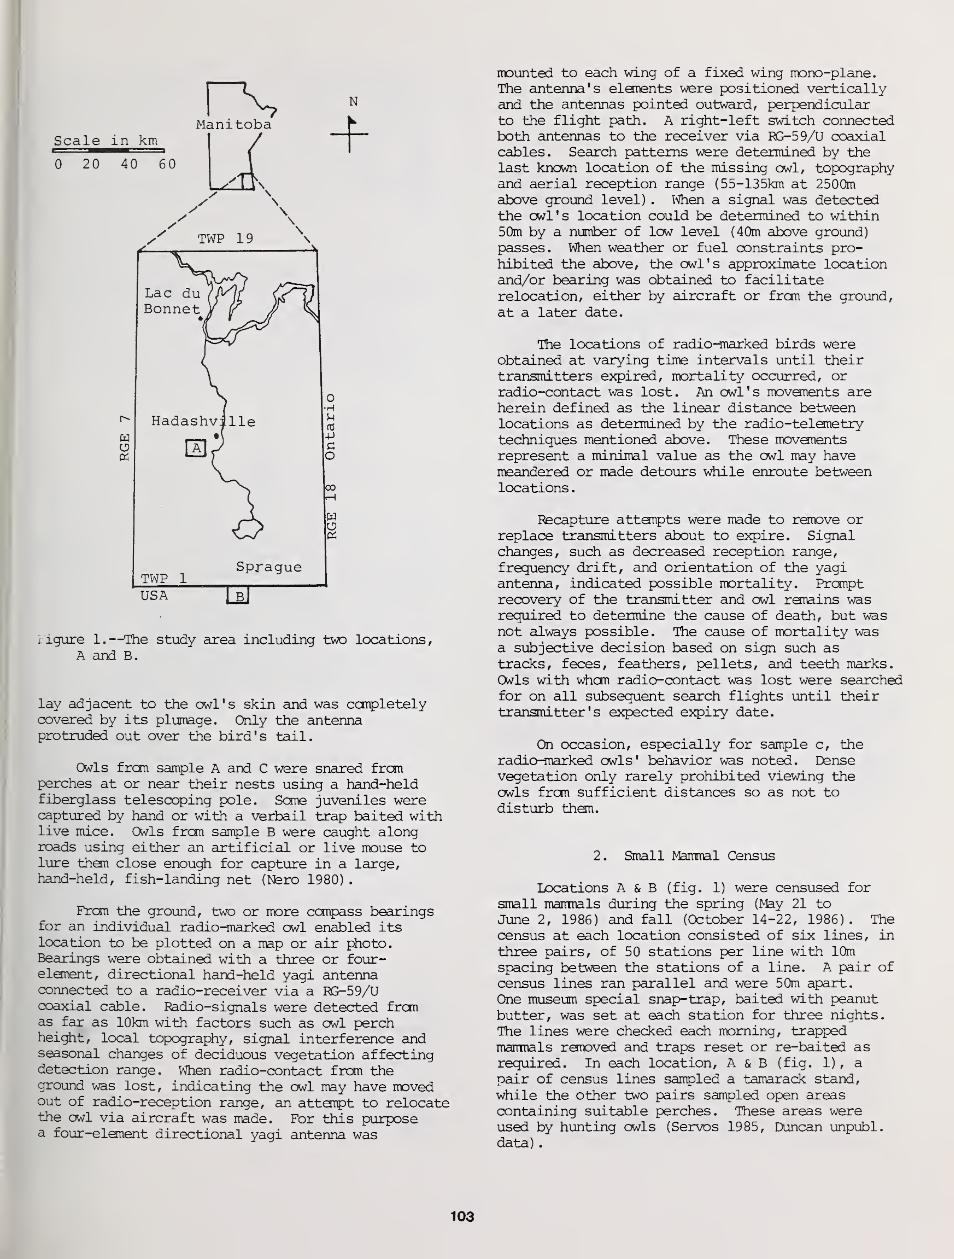
Lac du 7/Bonnet /
Hadashv:[lie
TWP 1Sprague
USA UJ
CO
HO
igure 1.—The study area including two locations,A and B.
lay adjacent to the owl's skin and was completelycovered by its plumage. Only the antennaprotruded out over the bird's tail.
Owls from sample A and C were snared fromperches at or near their nests using a hand-heldfiberglass telescoping pole. Some juveniles werecaptured by hand or with a verbail trap baited withlive mice. Owls from sample B were caught alongroads using either an artificial or live mouse tolure them close enough for capture in a large,hand-held, fish-landing net (Nero 1980)
.
From the ground, two or more compass bearingsfor an individual radio-marked owl enabled itslocation to be plotted on a map or air photo.Bearings were obtained with a three or four-element, directional hand-held yagi antennaconnected to a radio-receiver via a RG-59/Ucoaxial cable. Radio-signals were detected fromas far as 10km with factors such as owl perchheight, local topography, signal interference andseasonal changes of deciduous vegetation affectingdetection range. When radio-contact from theground was lost, indicating the owl may have movedout of radio-reception range, an attempt to relocatethe owl via aircraft was made. For this purposea four-element directional yagi antenna was
mounted to each wing of a fixed wing mono-plane.The antenna's elements were positioned verticallyand the antennas pointed outward, perpendicularto the flight path. A right-left switch connectedboth antennas to the receiver via RG-59/U coaxialcables. Search patterns were determined by thelast known location of the missing owl, topographyand aerial reception range (55-135km at 2500mabove ground level) . When a signal was detectedthe owl's location could be determined to within50m by a number of low level (40m above ground)passes. When weather or fuel constraints pro-hibited the above, the owl's approximate locationand/or bearing was obtained to facilitaterelocation, either by aircraft or from the ground,
at a later date.
The locations of radio-marked birds wereobtained at varying time intervals until theirtransmitters expired, mortality occurred, orradio-contact was lost. An owl's movements areherein defined as the linear distance betweenlocations as determined by the radio-telemetrytechniques mentioned above. These movementsrepresent a minimal value as the owl may havemeandered or made detours while enroute betweenlocations
.
Recapture attempts were made to remove orreplace transmitters about to expire. Signalchanges, such as decreased reception range,
frequency drift, and orientation of the yagiantenna, indicated possible mortality. Promptrecovery of the transmitter and owl remains wasrequired to determine the cause of death, but wasnot always possible. The cause of mortality wasa subjective decision based on sign such astracks, feces, feathers, pellets, and teeth marks.Owls with whom radio-contact was lost were searchedfor on all subsequent search flights until theirtransmitter's expected expiry date.
On occasion, especially for sample c, theradio-marked owls' behavior was noted. Densevegetation only rarely prohibited viewing theowls from sufficient distances so as not todisturb them.
2. Small Mammal Census
Locations A & B (fig. 1) were censused for
small mammals during the spring (May 21 toJune 2, 1986) and fall (October 14-22, 1986). Thecensus at each location consisted of six lines, in
three pairs, of 50 stations per line with 10mspacing between the stations of a line. A pair ofcensus lines ran parallel and were 50m apart.
One museum special snap-trap, baited with peanutbutter, was set at each station for three nights.The lines were checked each morning, trappedmammals removed and traps reset or re-baited asrequired. In each location, A & B (fig. 1) , apair of census lines sampled a tamarack stand,
while the other two pairs sampled open areascontaining suitable perches. These areas wereused by hunting owls (Servos 1985, Duncan unpubl.data)
.
103
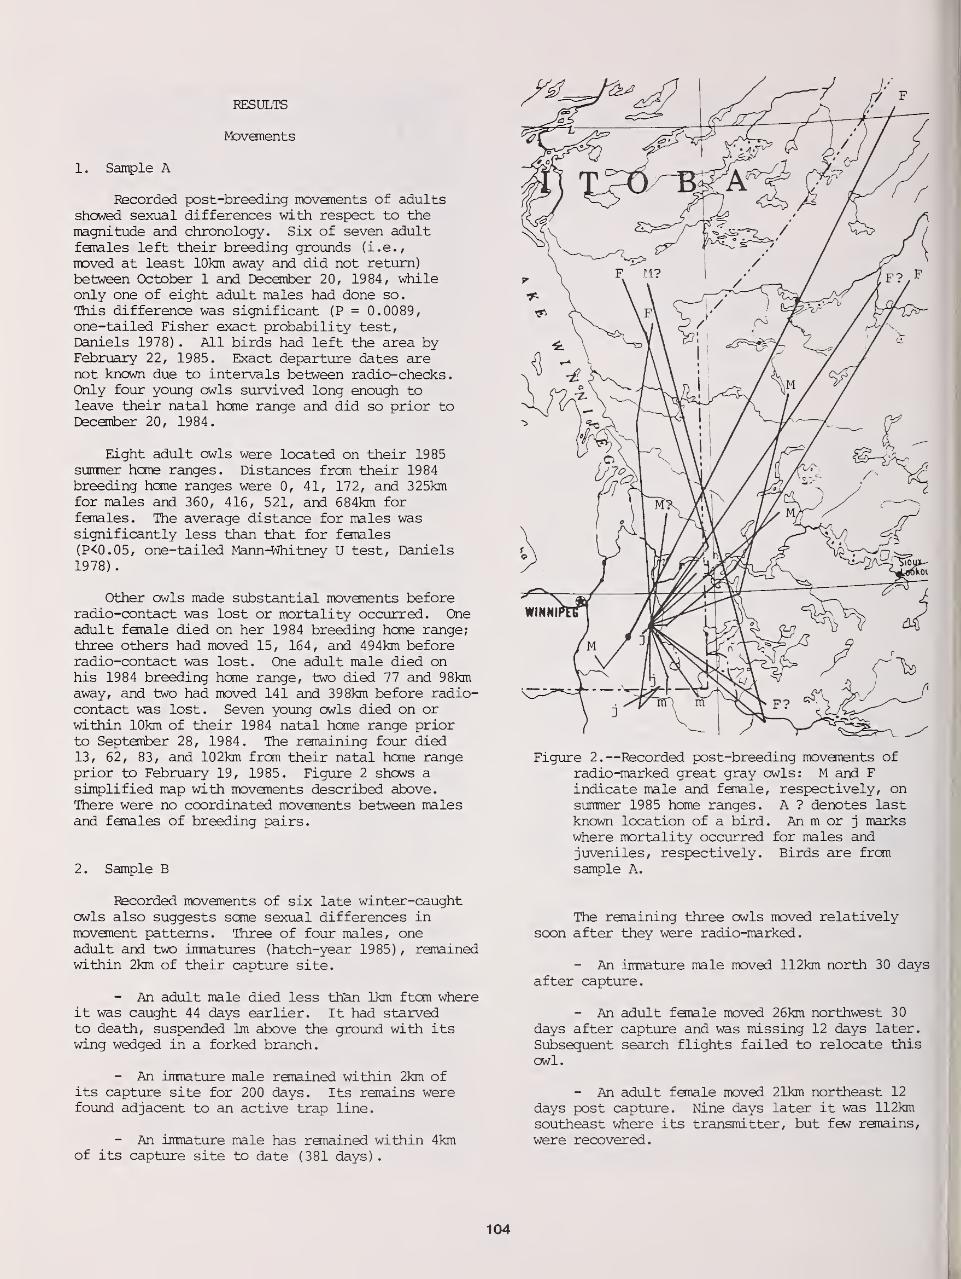
RESULTS
Movements
1. Sample A
Recorded post-breeding movements of adultsshowed sexual differences with respect to themagnitude and chronology. Six of seven adultfemales left their breeding grounds (i.e.,
moved at least 10km away and did not return)between October 1 and December 20, 1984, whileonly one of eight adult males had done so.
This difference was significant (P = 0.0089,one-tailed Fisher exact probability test,Daniels 1978) . All birds had left the area byFebruary 22, 1985. Exact departure dates arenot known due to intervals between radio-checks.Only four young owls survived long enough toleave their natal home range and did so prior toDecember 20, 1984.
Eight adult owls were located on their 1985summer home ranges. Distances from their 1984breeding home ranges were 0, 41, 172, and 325kmfor males and 360, 416, 521, and 684km forfemales. The average distance for males wassignificantly less than that for females(P<0.05, one-tailed Mann-Whitney U test, Daniels1978)
.
Other owls made substantial movements beforeradio-contact was lost or mortality occurred. Oneadult female died on her 1984 breeding home range;three others had moved 15, 164, and 494km beforeradio-contact was lost. One adult male died onhis 1984 breeding home range, two died 77 and 98kmaway, and two had moved 141 and 398km before radio-contact was lost. Seven young owls died on orwithin 10km of their 1984 natal home range priorto September 28, 1984. The remaining four died13, 62, 83, and 102km from their natal home rangeprior to February 19, 1985. Figure 2 shows asimplified map with movements described above.There were no coordinated movements between malesand females of breeding pairs.
2. Sample B
Recorded movements of six late winter-caughtowls also suggests some sexual differences inmovement patterns. Three of four males, oneadult and two immatures (hatch-year 1985) , remainedwithin 2km of their capture site.
- An adult male died less than 1km ftom whereit was caught 44 days earlier. It had starvedto death, suspended 1m above the ground with itswing wedged in a forked branch.
- An immature male remained within 2km ofits capture site for 200 days. Its remains werefound adjacent to an active trap line.
- An immature male has remained within 4kmof its capture site to date (381 days)
.
Figure 2.—Recorded post-breeding movements ofradio-marked great gray owls: M and Findicate male and female, respectively, onsummer 1985 home ranges. A ? denotes lastknown location of a bird. An m or j markswhere mortality occurred for males andjuveniles, respectively. Birds are fromsample A.
The remaining three owls moved relativelysoon after they were radio-marked.
- An immature male moved 112km north 30 daysafter capture.
- An adult female moved 26km northwest 30
days after capture and was missing 12 days later.
Subsequent search flights failed to relocate thisowl.
- An adult female moved 21km northeast 12
days post capture. Nine days later it was 112kmsoutheast where its transmitter, but few remains,were recovered.
104
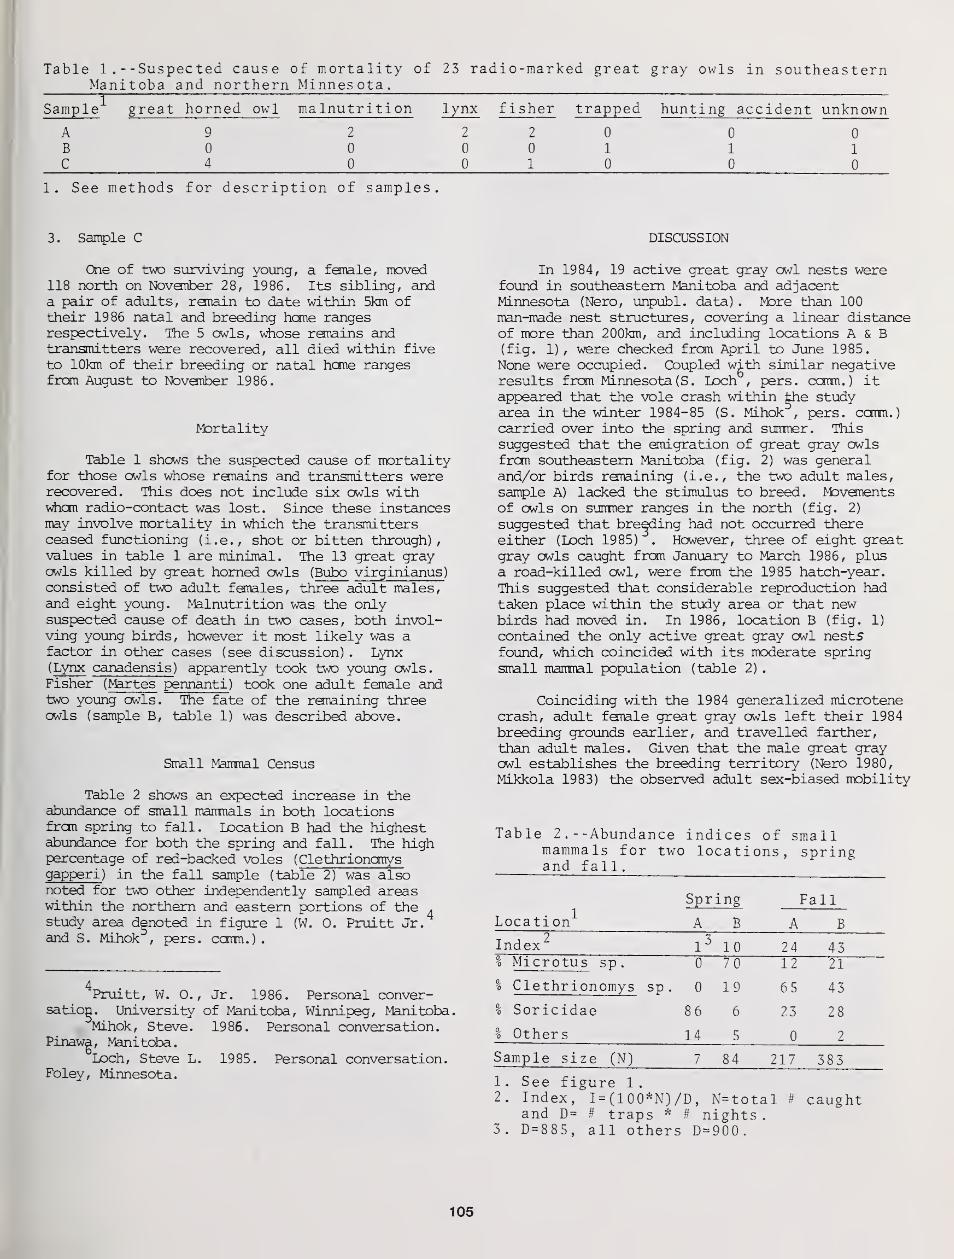
Table 1 .- -Suspected cause of mortality of 23 radio-marked great gray owls in southeasternManitoba and northern Minnesota.
C 11
Sample great horned owl malnutrition lynx fisher trapped hunting accident unknown
A 9 2 2 2 0 0 0
B 0 0 0 0 1 1 1
C 4 0 0 1 0 0 0
1. See methods for description of samples.
3. Sample C
One of two surviving young, a female, moved118 north on November 28, 1986. Its sibling, anda pair of adults, renain to date within 5km oftheir 1986 natal and breeding home rangesrespectively. The 5 owls, whose remains andtransmitters were recovered, all died within fiveto 10km of their breeding or natal home rangesfrom August to November 1986.
Mortality
Table 1 shows the suspected cause of mortalityfor those owls whose remains and transmitters wererecovered. This does not include six owls withwhom radio-contact was lost. Since these instancesmay involve mortality in which the transmittersceased functioning (i.e., shot or bitten through),values in table 1 are minimal. The 13 great grayowls killed by great horned owls (Bubo virginianus )
consisted of two adult fsnales, three adult males,and eight young. Malnutrition was the onlysuspected cause of death in two cases, both invol-ving young birds, however it most likely was afactor in other cases (see discussion) . Lynx(Lynx canadensis ) apparently took two young owls.Fisher (Martes pennanti ) took one adult female andtwo young owls. The fate of the remaining threeowls (sample B, table 1) was described above.
Small Mammal Census
Table 2 shows an expected increase in theabundance of small mammals in both locationsfrom spring to fall. Location B had the highestabundance for both the spring and fall. The highpercentage of red-backed voles (Clethrionomysgapperi) in the fall sample (table 2) was alsonoted for two other independently sampled areaswithin the northern and eastern portions of the .
study area denoted in figure 1 (W. 0. Pruitt Jr.and S. Mihok , pers. comm.)
.
Pruitt, W. 0., Jr. 1986. Personal conver-sation^ University of Manitoba, Winnipeg, Manitoba.
Mihok, Steve. 1986. Personal conversation.Pinawg, Manitoba.
Loch, Steve L. 1985. Personal conversation.Foley, Minnesota.
DISCUSSION
In 1984, 19 active great gray owl nests werefound in southeastern Manitoba and adjacentMinnesota (Nero, unpubl. data) . More than 100man-made nest structures, covering a linear distanceof more than 200km, and including locations A & B(fig. 1), were checked from April to June 1985.None were occupied. Coupled wjLth similar negativeresults from Minnesota (S. Loch , pers. comm.) itappeared that the vole crash within £he studyarea in the winter 1984-85 (S. Mihok , pers. comm.)carried over into the spring and summer. Thissuggested that the emigration of great gray owlsfrom southeastern Manitoba (fig. 2) was generaland/or birds remaining (i.e., the two adult males,sample A) lacked the stimulus to breed. Movonentsof owls on summer ranges in the north (fig. 2)
suggested that breeding had not occurred thereeither (Loch 1985) . However, three of eight greatgray owls caught from January to March 1986, plusa road-killed owl, were from the 1985 hatch-year.This suggested that considerable reproduction hadtaken place within the study area or that newbirds had moved in. In 1986, location B (fig. 1)
contained the only active great gray owl nestsfound, which coincided with its moderate springsmall mammal population (table 2)
.
Coinciding with the 1984 generalized microtenecrash, adult female great gray owls left their 1984
breeding grounds earlier, and travelled farther,than adult males. Given that the male great grayowl establishes the breeding territory (Nero 1980,Mikkola 1983) the observed adult sex-biased mobility
Table 2 .- -Abundance indices of smallmammals for two locations, springand fall.
Spring Fall
Loca ti on A B A B
Index I3
10 24 43% Microtus sp
.
0 70 12 21
% Clethr ionomys sp
.
0 19 65 43
% Soricidae 86 6 23 28
% Others 14 5 0 2
Sample size (N) 7 84 217 383
1 . See f igure 1
.
2. Index, 1= (1 00*N) /D , N=total 9 caughtand D= # traps * # nights
.
3. D=885, all others D=900.
105
pattern would be best explained by the arrival-time hypthesis. This is further supported bythe return of one male to occupy an expandedversion of its 1984 breeding home range afterwintering 40km north. Another male settled intoa 1985 summer home range 41km west of its 1984breeding home range. The greater distancestravelled by females, and their earlier departure,apparently contradicts predictions of the bodysize and dominance hypotheses.
Four young owls from sample A survived longenough to leave their 1984 natal home ranges anddid so prior to adult males but concurrently withadult females. Perhaps these young owls areinfluenced more by social dominance and they arethe first to move when conditions get harder.Subsequent mortality of these owls before theycould establish 1985 summer home ranges preventscomparisons with the eight adults that did. Thehigh mortality observed (table 1 and results) mayhave resulted from the young being relegated topoorer habitats. Predators, especially the greathorned owl, and malnutrition were the only suspectedcause of mortality of owls from sample A. Thesetwo factors are probably interreleated and tied inwith the small mammal crash. Hungry or starvingowls, concentrating on catching prey would be lesswary of potential threats. Perhaps the microtenepopulation was insufficient to provide a longenough "training period" to enable the young owlsto fully benefit from their inherited extreme earasymmetry (Norberg 1987) . This adaptation,which enables owls to audibly detect and locateprey in dense ground vegetation or under snow, mayprove to be a formidable handicap in such situations.Furthermore, a bird moving through unknown habitatwould be at a disadvantage when it encounteredresident predators. Loch (1985) postulated thatfollowing a 10-year cyclic peak in populations ofruffed grouse (Bonasa umbellus) and snowshoe hare(Lepus americanus ) , the resulting large populationof seasoned predators, i.e., great horned owl andlynx, would broaden their search image to alternateprey species, including the great gray owl. Despitea high fall 1986 microtene population (table 2)
,
predator-related mortality, particularly greathorned owl, was high (table 1) . Mikkola (1983)notes one instance of the eagle owl (Bubo bubo)killing the nominate European subspecies of thegreat gray owl (S.n. lapponica) . In North Americathe great horned owl appears to be a more significantpredator of the great gray owl than is the eagleowl in Eurasia.
Movements of great gray owls radio-marked inFebruary and March 1986 (sample B) suggestedsexual differences in mobility as well. Malestended to be relatively sedentary compared tofemales. The adult females' greats* mobility atthis time may represent a search for males withterritories conducive to breeding. The threeadult owls, a male and two females, were observedspending much time on high and exposed perches,with frequent flights over tree tops. These may beactivities related to spring courtship.
The virtual lack of movements by the radio-marked owls (from sample C) from their 1986 nataland breeding home ranges is most likely due tothe increased abundance of their principle prey,voles (table 2) . The five owls that died werewithin 10km of their natal or breeding home ranges.The one exception, a young female, moved 112kmnorth; her sibling remained on their natal homerange. This is an enigma, given the amount ofsuitable habitat and ample prey en route to whereshe relocated.
Movements of owls from sample B & C were oflesser magnitude than those of sample A (fig. 2),which relocated the majority of owls outside thestudy area denoted in figure 1. Kerlinger & Lein(1986) found that social dominance alone mayexplain the winter distribution of snowy owls(Nyctea scandiaca ) . Byrkjedal & Langhelle (1986)
related age and sex differences in hawk-owlmobility to two "single factor" hypotheses.Males are more influenced by competition for nest-sites, while females and juveniles, which leavethe breeding grounds, may be more influenced bysocial dominance. Great gray owls seem to parallelthe hawk-owl and boreal owl in this respect, atleast during times of low prey availability.
Byrkjedal & Langhelle (1986) note that nest-site availability is probably less critical forthe hawk-owl, as it is for the boreal owl. Thegreat gray owl is probably the least affected bynest-site availability. However, adult males ofall species would benefit by remaining at leastwithin the breeding range to sample food andpotential nest-sites (Byrkjedal & Langhelle 1986)
.
Furthermore, given an adequate food supply, itwould possibly benefit successful pairs to remaintogether into the next breeding season, on or neartheir former breeding territory. A pair of greatgray owls that fledged two young in 1986 remainedtogether throughout the winter on their breedinghome range. In mid-March 1987 the female wasobserved following the male, soliciting food fromhim with barely audible vocalizations similar to thebegging calls of the young.
Numerous half to 2 day visits by adult breedingfemales to neighbouring family groups up to 4kmaway were documented in the post-fledging periodduring the 1986 breeding season. During this periodthe male feeds the young directly (Nero 1980,
Mikkola 1983) . Similar, but briefer visitations byfemale flammulated owls (Otus fj.ammeolus ) wasreported by Reynolds & Linkhart (1987) . If a
female's previous year's mate has not survived tothe following year, then an awareness of adjacentmales and/or breeding territories would expeditesuccessful reproduction the following year.
Reynolds & Linkhart' s (1987) study of nest-siteand mate fidelity in flammulated owls lends support
to this idea. Mikkola (1983) gives several examplesof pairs that have bred (or at least have stayed)
together for 2 or even more consecutive years atthe same nest-site, while voles were scarce in someinstances. Recaptures of two banded adult females(Nero, unpubl. data) , each nesting three times
106
within the same irrmediate breeding area, over a
10 and 7 year pericd respectively, documents nest-
site fidelity in this species.
Evidence of fall territoriality and nestinspections (Duncan, unpubl. data) , together withthe above data, suggests year-round residency to
be an adaptive behaYioral strategy fox great grayowls. Winter (1987 and pers. comm. ) found greatgray owls in Yosemite National Park, California,using pocket gophers (Thomcmys botta/monticola )
as maintenance prey items, enabling year-roundresidency, but not breeding, during cyclic lows ^_n
microtene populations. In Oregon, Bull & Henj urn
(1987) found the maximum distance that 16 adultradio-marked great gray owls ranged from theirnests, over 1 to 3 years, averaged 13km (+11)
.
Movements of these birds, living in mountainousterrain, was thought to be a function of top-ography, with owls travelling short distances tochange elevation, snow depth, and prey vulnerability.For great gray owls in southeastern Manitoba toaccomplish the same, greater distances must betravelled, at leagt during years of low microtenepopulations (i.e., 1984-85). Movements of radio-marked adults north (fig. 2) actually placed birdsat lower elevations, and possibly in locations oflesser snow depths and/or greater pceyvulnerability. -
The great gray owl's larger size and weight(Mikkola 1983) should make it even more likely tobe a year-round resident than the smaller andlighter boreal and northern hawk-owls. Thesethree species occupy the same range- the borealforest -and are potentially strong competitors.Snow accumulations partially protect voles fromthese predators but the least affected is thegreat gray owl (Korpimaki 1986b) . Their largesize and peculiar habit of snow-plunging enablesthen to regularly catch voles through even hardsnow layers up to 50cm deep (Collins 1980, Nero1980, Korpimaki 1986b, Duncan, unpubl. data)
.
The great gray owl's larger body mass should bemore efficient at thermoregulation and better ableto withstand temporary food shortages than itssmaller competitors, even though a larger bodyrequires more food (Korpimaki 1986b) . The lowercritical temperature, i.e., the point below whichbody temperature cannot be maintained withoutincreased heat production, declines as body sizeincreases. Therefore, the metabolic rate of alarger animal starts increasing at a lower temper-ature than is the case for a smaller animal. Also,a larger bird takes longer to starve to death(Peters 1983 in Korpimaki 1986b).
The various adaptations, both anatomical andbehavioral, discussed above maximize the ability ofgreat gray owls to achieve residency for as long aspossible. These are means which minimize thedestabilizing influence of dependence on a wildlyfluctuating prey base.
Winter, J. 1987. Personal conversation.5331 El Mercato Parkway, Santa Rosa, California.
ACKNOWLEDGEMENTS
Thanks are due those contributing to thisstudy, especially Dr. R. W. Nero, ManitobaDepartment of Natural Resources. H. Copland,S. Loch, R. Lasnier, Z. Shahzada, B. Carson, R.
Rouire, P. Lane, S. Mihok, and B. Schwartz allprovided essential assistance. Funds orservices were provided by World Wildlife Fund,Canada, The Murphy Foundation Inc.,Abitibi-Price Inc. , Ontario Ministry of NaturalResources, the Manitoba Department of NaturalResources, and the Natural Resources Institute,University of Manitoba.
LITERATURE CITED
Byrkjedal, L,and G. Langhelle. 1986. Sex and agebiased mobility in hawk-owls Surnia ulula .
Ornis Scand. 17:306-308.
Collins, K. M. 1980. Aspects of the biology of thegreat gray owl. M. Sc. thesis, University ofManitoba, Winnipeg, Manitoba. 219pp.
Daniel, W. W. 1978. Applied nonparametricstatistics. 503pp. Houghton Mifflin Co.,
Boston, Mass..Kerlinger, P., and M. R. Lein. 1986. Differences
in winter range among age-sex classes of snowyowls Nyctea scandiaca in North America. OrnisScand. 17:1-7.
Ketterson, E. D. , and V. Nolan Jr. 1983. Theevolution of differential bird migration.In Johnston, R. F. (ed.) . Current Ornithology,Vol. 1. Plenum Press, New York, pp 357-402.
Korpimaki, E. 1986a. Reversal size dimorphism in
birds of prey, especially in Tengmalm's owlAegolius funereus: a test of the "starvationhypothesis". Ornis Scand. 17:326-332.
Korpimaki, E. 1986b. Niche relationships and life-history tactics of three sympatric Strixspecies in Finland. Ornis Scand. 17:126-132.
Lundberg, A. 1979. Residency, migration and acomprimise: adaptations to nest-site scarcityand food specialization in three Fennoscandianowl species. Oecologia (Berl.) 41:273-281.
Mihok, S., Turner, B. N. , and S. L. Iverson. 1985.
The characterization of vole populationdynamics. Ecological monographs 55 (4) :399-420.
Mikkola, H. 1983. Owls of Europe. Buteo Books,
Vermillion, South Dakota. 397pp.Nero, R. W. 1980. The great gray owl: phantom of
the northern forest. Smithsonian InstitutionPress. Washington, D. C. 167pp.
Roselar, C. S. 1985. Great grey owl. In: Cramp,
S. (ed.) . Handbook of the birds of Europe,the Middle East and North Africa: the birdsof the western palearctic. Vol. 4. Terns towoodpeckers. Oxford University Press, Oxford.
Servos, M. 1986. Summer habitat use of the greatgray owl (Strix nebulosa ) in southeasternManitoba. M. Sc. thesis, University ofManitoba, Winnipeg, Manitoba. 81pp.
Sonerud, G. A. 1986. Effect of snow cover onseasonal changes in diet, habitat andregional distribution of raptors that preyon small mammals in boreal zones of Fenno-scandia. Holarctic Ecology. 9:33-47.
107
Summer Habitat Use by Great Gray Owlsin Southeastern Manitoba 1
Maria C. Servos 2
Abstract.—Sixteen radio-marked great grayowls, Str ix nebulosa , were monitored from 27 Juneto 28 August 1984 to determine summer habitat usein southeastern Manitoba. Owls showed a strongpreference for tamarack bogs, but other wet, openareas with adequate perches, such as treed muskeghabitats were also selected. Factors influencinghabitat selection include availability of preyspecies (meadow voles and bog lemmings), suitableperches, cover, and shrub density.
INTRODUCTION
Great gray owls are generally rareacross most of their range and theirnomadic nature makes them difficult tostudy. Knowledge of the great gray owl'spreferred habitats is limited althoughthere is evidence of a preference for blackspruce-tamarck bogs in Manitoba, for maturepoplar stands near muskeg in Alberta andfor mature old forests in California (Nero1980). A better understanding of thepreferred habitats of great gray owls is animportant first step in the effectivemanagement of this species.
In the spring of 1984 six pairs ofgreat gray owls nested in a small area ofsoutheastern Manitoba, approximately 70 kmeast of Winnipeg. This large number ofbreeding owls in a relatively small, easilyaccessible area presented a unique studyopportunity. As part of a continuing greatgray owl research project by the ManitobaWildlife Branch, 18 owls were radio-markedin the spring of 1984. This study focusedon the summer habitat use of theseradio-marked owls.
1 Paper presented at the symposium,Biology and Conservation of Northern ForestOwls, Feb. 3-7, 1987, Winnipeg, Manitoba.USDA Forest Service General TechnicalReport RM-142.
2Natural Resources Institute,University of Manitoba, Winnipeg, Man.Present address: 27-30 Baylor Ave.,Winnipeg, Man. R3T 3K1
MATERIALS AND METHODS
Study Area
The study area was located insoutheastern Manitoba, approximately 70 kmeast of Winnipeg in the SandilandsProvincial Forest. The 1942 ha study arealies within the Manitoba Lowlands sectionof the Boreal Forest Region which is notedfor its flat, poorly drained land with thepredominant vegetation consisting ofpatches of black spruce and tamarackinterspersed with swamps and meadows (Rowe1972). Jack pine and trembling aspen arefound on the drier areas.
A large portion of the study area wascovered by tamarack bog (TL100) and fiveoccupied nests were located on the edge of,
or within this habitat type (fig. 1;
habitat codes are described in table 1).
The southern portion of the study area wasthe driest and its habitat types werecomposed mostly of jack pine, black spruceand trembling aspen. The wettest habitattypes, the marsh muskeg (MARMUS), treedmuskeg (TREMUS), class-0 (an old burnarea), and tamarack bog (TL100), ran fromthe northwest corner diagonally across themiddle of the study area and occupied thelargest area. The northern portion was a
relatively dry area composed mostly ofyoung jack pine and trembling aspen with a
thick shrub undergrowth.
Radio-telemetry
Eighteen great gray owls nesting in
the study area were radio-marked duringspring 1984 as part of a larger project of
Dr. R.W. Nero, Manitoba Department ofNatural Resources. Two of these birds were
108
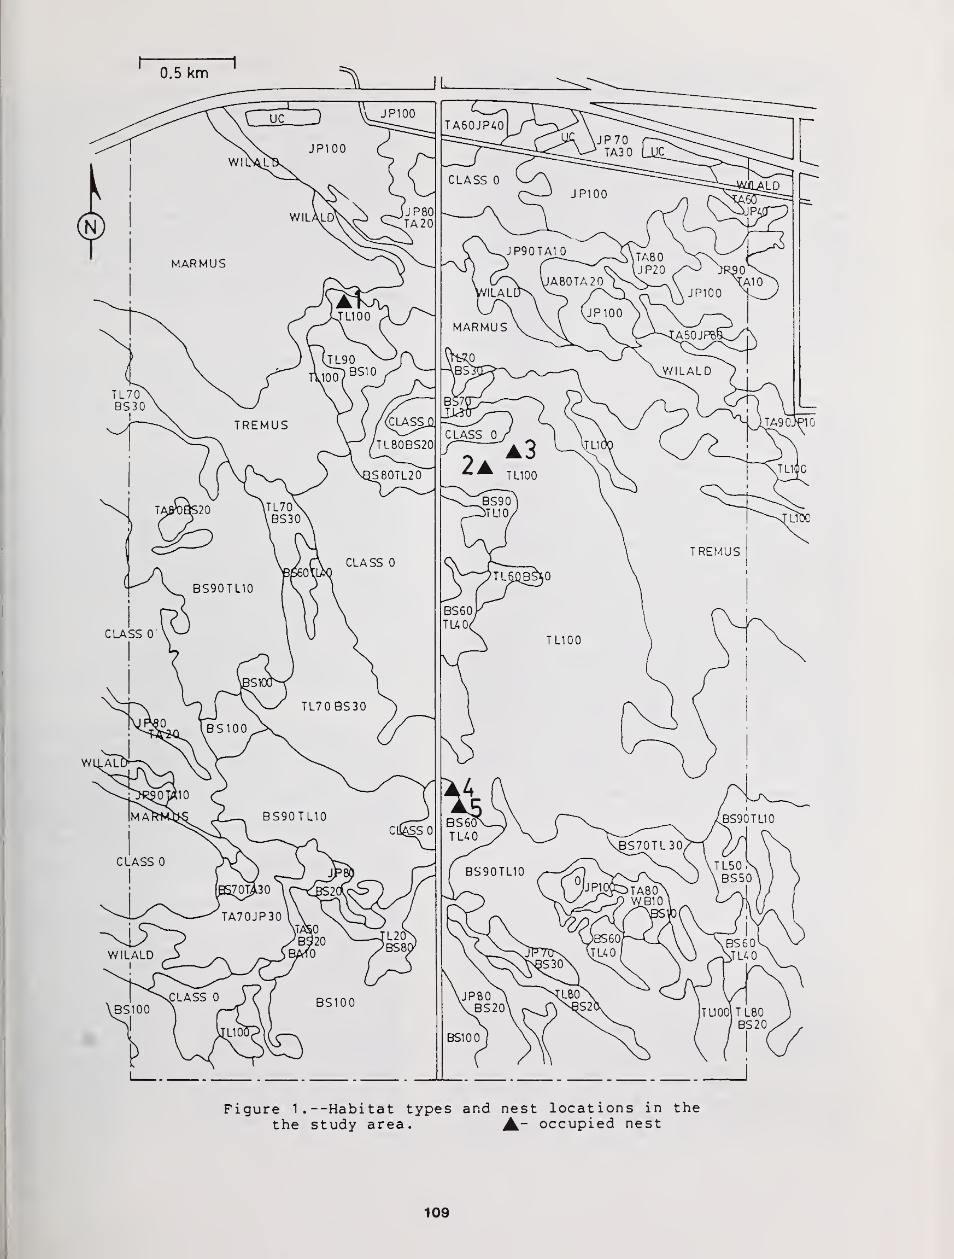
Figure 1. --Habitat types and nest locations in thethe study area. A~ occupied nest
109
eliminated from the study due to mortality.Sixteen radio-marked birds, five males,five females and six juveniles, were usedto determine summer habitat selection.Radio-telemetry readings to determine thelocations of the owls were taken on 31
different days from 27 June 1984 to 28August 1984 and at all times of the day.The location of each owl, as determined bytriangulat ion , was plotted on 1:15,840scale air photos and each location wasassigned to a habitat type defined using1980 forest inventory maps. The receivingequipment consisted of an AVM Model LA-12radio-tracking receiver and a four element,hand-held, 164 MHz Yagi antenna. Thetransmitters ranged in frequency from164.014 to 164.842 MHz. The accuracy of
this radio-telemetry equipment was onaverage 11 degrees.
Analysis was done on 608 owllocations. Radio-telemetry locations forindividual birds were plotted and copiedonto transparencies to be overlaid on thehabitat map. The method for analyzingutilization-availability data described byNeu et al. (1974) and Byers et al. (1984)was employed. A chi-square goodness-of -f i
t
test was used to determine whether therewas a significant difference between theobserved frequency of habitat use and theexpected use of those habitats based ontheir availability (Byers et al. 1984).Bonferroni confidence intervals were thenused to determine whether a specifichabitat type was preferred or avoided.
The chi-square goodness-of -f it testwas applied on all the data combined; onthe data grouped by male, female, young; onthe data grouped by month (June, July,August); and on the data grouped by time ofday (morning: 0500-1100; afternoon:1100-1700; evening: 1700-2300; night:2300-0500). If the null hypothesis wasrejected for any of the above cases,Bonferroni confidence intervals werecalculated and compared for each habitattype.
Table 1.—Shortened codes for habitatdesignations
.
1
Code Description
BS black spruceTA trembling aspenTL tamarackJP jack pine
Class-0 old burnMARMUS marsh-muskegWILALD willow alderTREMUS treed muskeg
1 e.g. TL90BS10 describes a 90% tamarack-10% black spruce habitat.
Vegetaion Analysis
As a check on the forest inventorymaps, vegetation analysis using thepoint-centered quarter method (Cottom andCurtis 1956) was conducted on seven habitattypes: five of the most common habitattypes used by the owls and on two areaswhere the owls were never found. At eachsampling point canopy cover was estimatedocularly, ground cover estimated using a 1
m x 1 m quadrat and shrub density (#
stems/m 2) was estimated using a 2 m x 2 m
quadrat. Plants greater than 1 m in heightwere classified as shrubs and those lessthan 1 m were defined as ground cover.
Prey Abundance and Use
Small mammal trapping was conductedduring July and August 1984 to determinerelative abundance in the seven habitattypes where vegetation analysis was done.Thirty Museum Special traps were set eachnight for three nights and were baited withpeanut butter and rolled oats. The trapswere set 10 m apart on randomly selectedtransects. The transects were moved aftereach trap night to reduce bias caused byvariation within the habitat types. Todetermine what prey species the great grayowls were using, 110 owl pellets werecollected in the study area from nests androost sites from May to August 1984; driedand the skeletal remains were extracted forident i f ication
.
RESULTS AND DISCUSSION
Owl Pellet Analysis and Small MammalTrapping
Analysis of the owl pellets collectedon the study area revealed that themajority of the great gray owls' diet wascomposed of meadow voles ( Microtuspennsylvanicus , 64%) and northern andsouthern bog lemmings ( Synaptomys borealisand S. cooper
i
, 28%). Other species takenincluded mice (Family Cricetidae, 5%),red-backed voles ( Clethr ionomys qapper
i
,
2%) and songbirds (1%).
Meadow voles, red-backed voles andshrews were caught in all seven habitattypes. Bog lemmings were caught only inthe 90% tamarack-10% black spruce(TL90BS10), treed muskeg, 90% blackspruce-10% tamarack (BS90TL10) and the 80%jack pine-20% black spruce (JP80BS20)habitat types. Deer mice ( Peromyscusmaniculatus ) and meadow jumping mice ( Zapushudsonius ) were caught only on the driesthabitats, JP80TA20 and JP90TA10. Moremeadow voles than any other species werecaught in the pure tamarack, class-0 andtreed muskeg habitats.
110
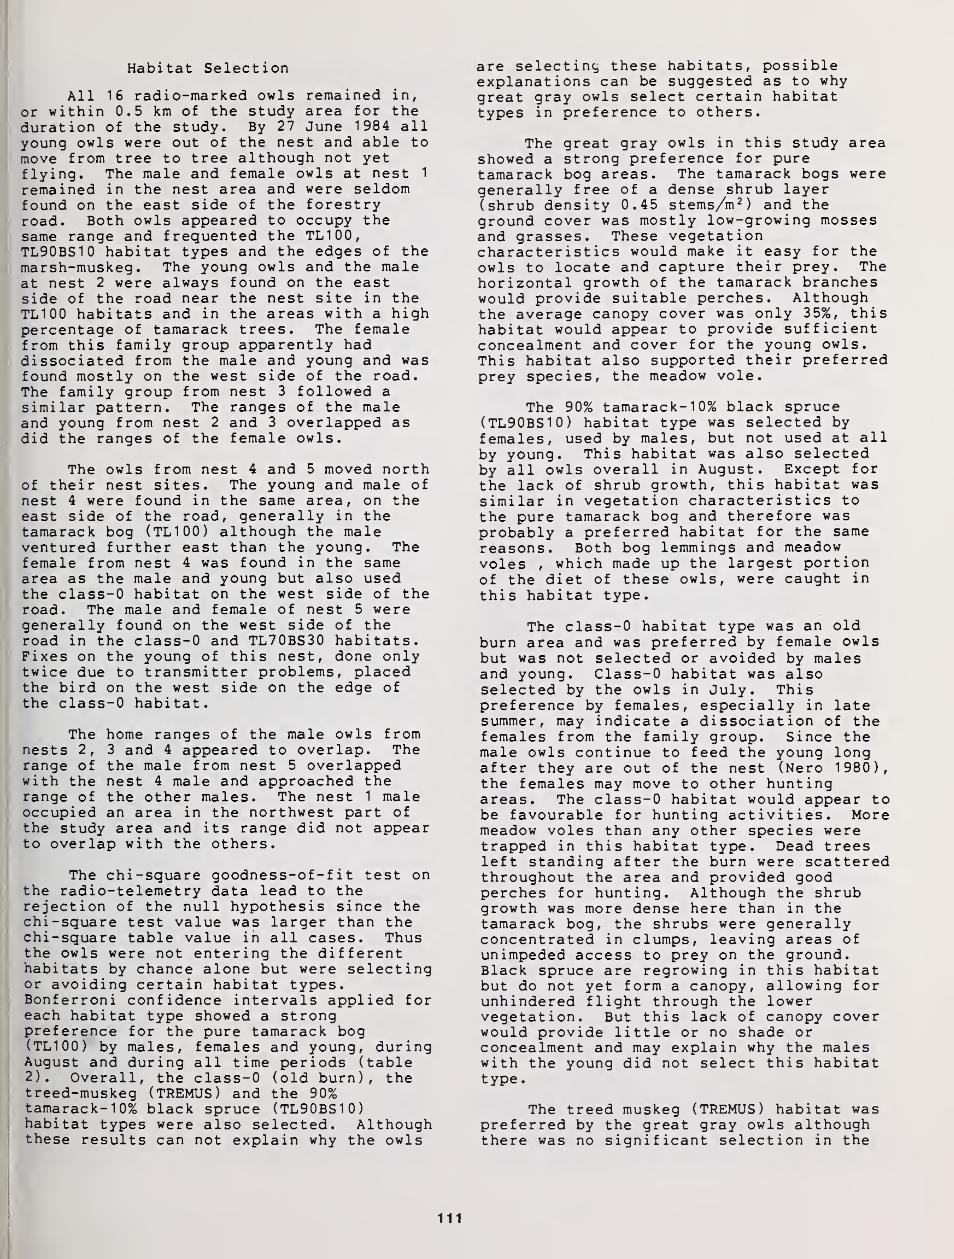
Habitat Selection
All 16 radio-marked owls remained in,
or within 0.5 km of the study area for theduration of the study. By 27 June 1984 allyoung owls were out of the nest and able tomove from tree to tree although not yetflying. The male and female owls at nest 1
remained in the nest area and were seldomfound on the east side of the forestryroad. Both owls appeared to occupy thesame range and frequented the TL100,TL90BS10 habitat types and the edges of themarsh-muskeg. The young owls and the maleat nest 2 were always found on the eastside of the road near the nest site in theTL100 habitats and in the areas with a highpercentage of tamarack trees. The femalefrom this family group apparently haddissociated from the male and young and wasfound mostly on the west side of the road.The family group from nest 3 followed asimilar pattern. The ranges of the maleand young from nest 2 and 3 overlapped asdid the ranges of the female owls.
The owls from nest 4 and 5 moved northof their nest sites. The young and male ofnest 4 were found in the same area, on theeast side of the road, generally in thetamarack bog (TL100) although the maleventured further east than the young. Thefemale from nest 4 was found in the samearea as the male and young but also usedthe class-0 habitat on the west side of theroad. The male and female of nest 5 weregenerally found on the west side of theroad in the class-0 and TL70BS30 habitats.Fixes on the young of this nest, done onlytwice due to transmitter problems, placedthe bird on the west side on the edge ofthe class-0 habitat.
The home ranges of the male owls fromnests 2, 3 and 4 appeared to overlap. Therange of the male from nest 5 overlappedwith the nest 4 male and approached therange of the other males. The nest 1 maleoccupied an area in the northwest part ofthe study area and its range did not appearto overlap with the others.
The chi-square goodness-of-f it test onthe radio-telemetry data lead to therejection of the null hypothesis since thechi-square test value was larger than thechi-square table value in all cases. Thusthe owls were not entering the differenthabitats by chance alone but were selectingor avoiding certain habitat types.Bonferroni confidence intervals applied foreach habitat type showed a strongpreference for the pure tamarack bog(TL100) by males, females and young, duringAugust and during all time periods (table2). Overall, the class-0 (old burn), thetreed-muskeg (TREMUS) and the 90%tamarack-10% black spruce (TL90BS10)habitat types were also selected. Althoughthese results can not explain why the owls
are selecting these habitats, possibleexplanations can be suggested as to whygreat gray owls select certain habitattypes in preference to others.
The great gray owls in this study areashowed a strong preference for puretamarack bog areas. The tamarack bogs weregenerally free of a dense shrub layer(shrub density 0.45 stems/m 2
) and theground cover was mostly low-growing mossesand grasses. These vegetationcharacteristics would make it easy for theowls to locate and capture their prey. Thehorizontal growth of the tamarack brancheswould provide suitable perches. Althoughthe average canopy cover was only 35%, thishabitat would appear to provide sufficientconcealment and cover for the young owls.This habitat also supported their preferredprey species, the meadow vole.
The 90% tamarack-10% black spruce(TL90BS10) habitat type was selected byfemales, used by males, but not used at allby young. This habitat was also selectedby all owls overall in August. Except forthe lack of shrub growth, this habitat wassimilar in vegetation characteristics tothe pure tamarack bog and therefore wasprobably a preferred habitat for the samereasons. Both bog lemmings and meadowvoles , which made up the largest portionof the diet of these owls, were caught in
this habitat type.
The class-0 habitat type was an oldburn area and was preferred by female owlsbut was not selected or avoided by malesand young. Class-0 habitat was alsoselected by the owls in July. Thispreference by females, especially in latesummer, may indicate a dissociation of thefemales from the family group. Since themale owls continue to feed the young longafter they are out of the nest (Nero 1980),the females may move to other huntingareas. The class-0 habitat would appear tobe favourable for hunting activities. Moremeadow voles than any other species weretrapped in this habitat type. Dead treesleft standing after the burn were scatteredthroughout the area and provided goodperches for hunting. Although the shrubgrowth was more dense here than in thetamarack bog, the shrubs were generallyconcentrated in clumps, leaving areas ofunimpeded access to prey on the ground.Black spruce are regrowing in this habitatbut do not yet form a canopy, allowing forunhindered flight through the lowervegetation. But this lack of canopy coverwould provide little or no shade orconcealment and may explain why the maleswith the young did not select this habitattype.
The treed muskeg (TREMUS) habitat waspreferred by the great gray owls althoughthere was no significant selection in the
111
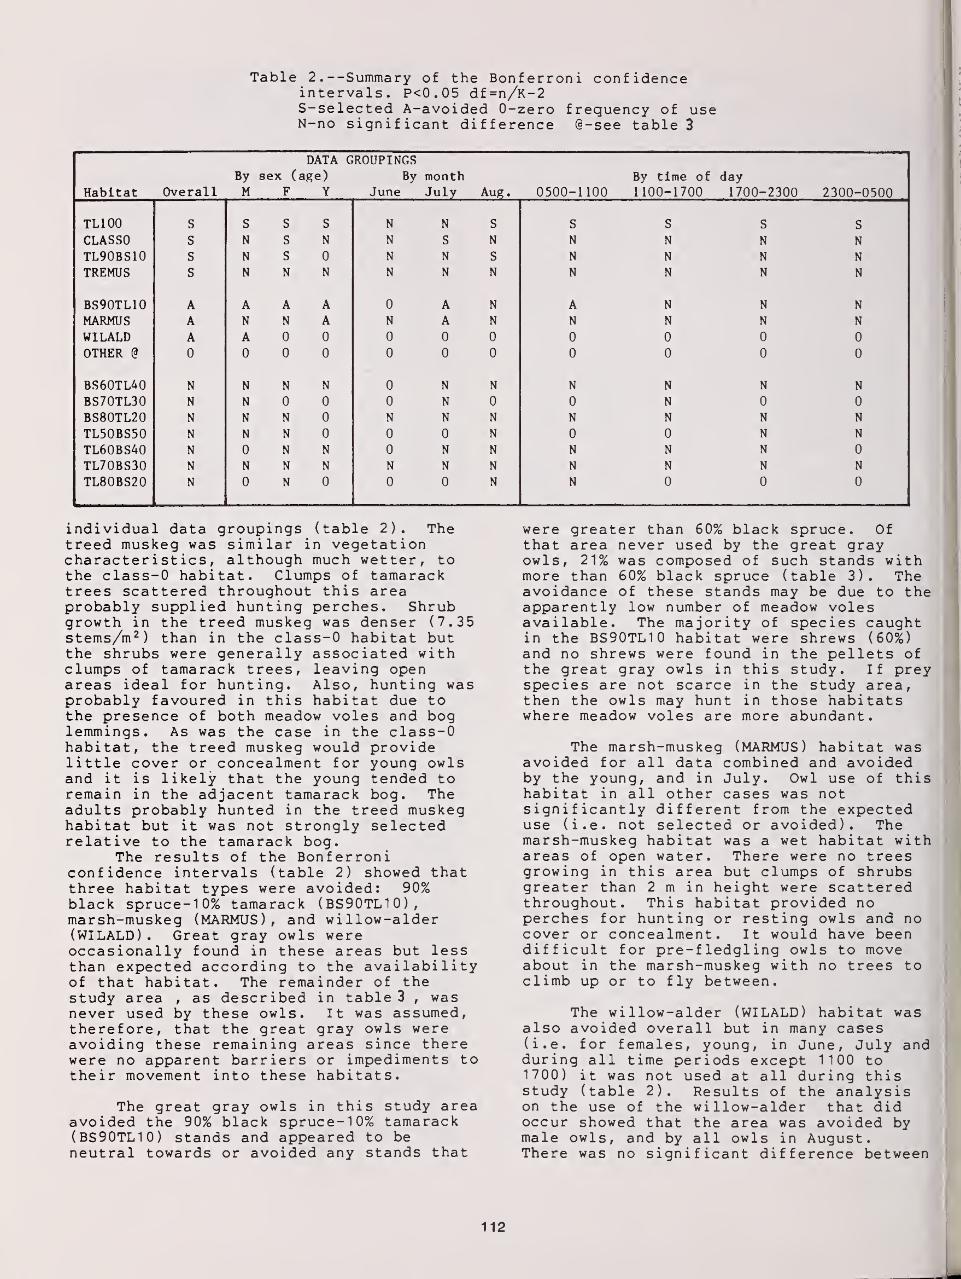
Table 2.—Summary of the Bonferroni confidenceintervals. P<0.05 df=n/K-2S-selected A-avoided 0-zero frequency of useN-no significant difference @-see table 3
HabitatL ICI \J -L. W CI Li Overall
DATA GROUPINGSBy sex (age) By monthM F Y June July Aue
.
0500-1 100
Rv tinip of
1 100-1700day1700-2300 2300-0500
TL100 S qo c c N NLl s S s s S
CLASSO s MLl q N NLl Co N N N N N
TL90BS10 s NLi c Nii NLl s N N N NTREMUS s N Kl NLl Nii N N N N N
BS90TL10 A A A A 0 A N A N N N
MARMUS A N N A N A N N N N N
WILALD A A 0 0 0 0 0 0 0 0 0
OTHER @ 0 0 0 0 0 0 0 0 0 0 0
BS60TL40 N N N N 0 N N N N N N
BS70TL30 N N 0 0 0 N 0 0 N 0 0
BS80TL20 N N N 0 N N N N N N N
TL50BS50 N N N 0 0 0 N 0 0 N N
TL60BS40 N 0 N N 0 N N N N N 0
TL70BS30 N N N N N N N N N N N
TL80BS20 N 0 N 0 0 0 N N 0 0 0
individual data groupings (table 2). Thetreed muskeg was similar in vegetationcharacteristics, although much wetter, tothe class-0 habitat. Clumps of tamaracktrees scattered throughout this areaprobably supplied hunting perches. Shrubgrowth in the treed muskeg was denser (7.35stems/m 2
) than in the class-0 habitat butthe shrubs were generally associated withclumps of tamarack trees, leaving openareas ideal for hunting. Also, hunting wasprobably favoured in this habitat due tothe presence of both meadow voles and boglemmings. As was the case in the class-0habitat, the treed muskeg would providelittle cover or concealment for young owlsand it is likely that the young tended toremain in the adjacent tamarack bog. Theadults probably hunted in the treed muskeghabitat but it was not strongly selectedrelative to the tamarack bog.
The results of the Bonferroniconfidence intervals (table 2) showed thatthree habitat types were avoided: 90%black spruce-10% tamarack (BS90TL10),marsh-muskeg (MARMUS), and willow-alder(WILALD) . Great gray owls wereoccasionally found in these areas but lessthan expected according to the availabilityof that habitat. The remainder of thestudy area , as described in table 3 , wasnever used by these owls. It was assumed,therefore, that the great gray owls wereavoiding these remaining areas since therewere no apparent barriers or impediments totheir movement into these habitats.
The great gray owls in this study areaavoided the 90% black spruce-10% tamarack(BS90TL10) stands and appeared to beneutral towards or avoided any stands that
were greater than 60% black spruce. Ofthat area never used by the great grayowls, 21% was composed of such stands withmore than 60% black spruce (table 3). Theavoidance of these stands may be due to theapparently low number of meadow volesavailable. The majority of species caughtin the BS90TL10 habitat were shrews (60%)and no shrews were found in the pellets ofthe great gray owls in this study. If preyspecies are not scarce in the study area,then the owls may hunt in those habitatswhere meadow voles are more abundant.
The marsh-muskeg (MARMUS) habitat wasavoided for all data combined and avoidedby the young, and in July. Owl use of thishabitat in all other cases was notsignificantly different from the expecteduse (i.e. not selected or avoided). Themarsh-muskeg habitat was a wet habitat withareas of open water. There were no treesgrowing in this area but clumps of shrubsgreater than 2 m in height were scatteredthroughout. This habitat provided noperches for hunting or resting owls and nocover or concealment. It would have beendifficult for pre-f ledgling owls to moveabout in the marsh-muskeg with no trees toclimb up or to fly between.
The willow-alder (WILALD) habitat wasalso avoided overall but in many cases(i.e. for females, young, in June, July andduring all time periods except 1100 to1700) it was not used at all during thisstudy (table 2). Results of the analysison the use of the willow-alder that didoccur showed that the area was avoided bymale owls, and by all owls in August.There was no significant difference between
112
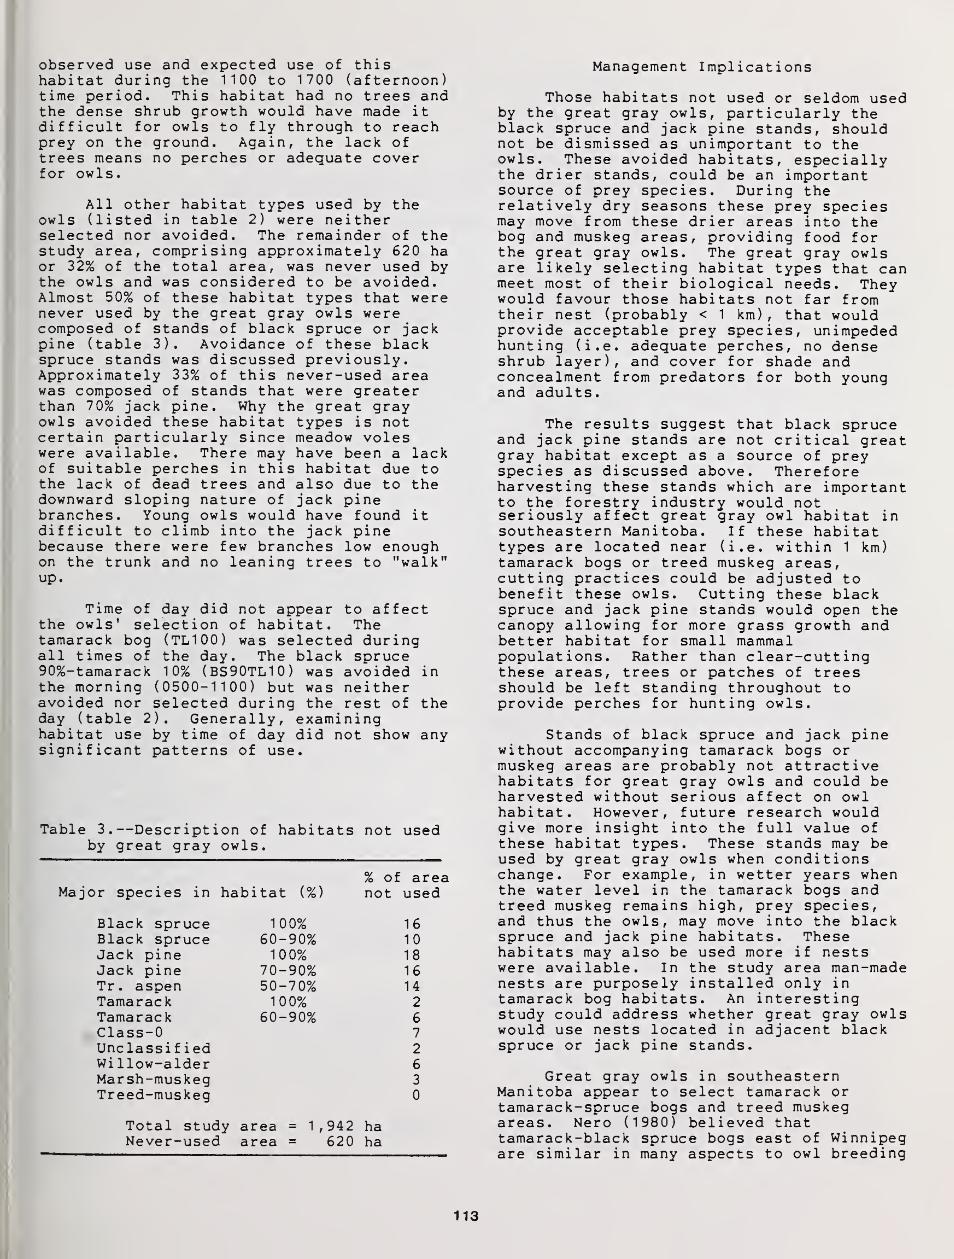
observed use and expected use of thishabitat during the 1100 to 1700 (afternoon)time period. This habitat had no trees andthe dense shrub growth would have made itdifficult for owls to fly through to reachprey on the ground. Again, the lack oftrees means no perches or adequate coverfor owls.
All other habitat types used by theowls (listed in table 2) were neitherselected nor avoided. The remainder of thestudy area, comprising approximately 620 haor 32% of the total area, was never used bythe owls and was considered to be avoided.Almost 50% of these habitat types that werenever used by the great gray owls werecomposed of stands of black spruce or jackpine (table 3). Avoidance of these blackspruce stands was discussed previously.Approximately 33% of this never-used areawas composed of stands that were greaterthan 70% jack pine. Why the great grayowls avoided these habitat types is notcertain particularly since meadow voleswere available. There may have been a lackof suitable perches in this habitat due tothe lack of dead trees and also due to thedownward sloping nature of jack pinebranches. Young owls would have found itdifficult to climb into the jack pinebecause there were few branches low enoughon the trunk and no leaning trees to "walk"up.
Time of day did not appear to affectthe owls' selection of habitat. Thetamarack bog (TL100) was selected duringall times of the day. The black spruce90%-tamarack 10% (BS90TL10) was avoided inthe morning (0500-1100) but was neitheravoided nor selected during the rest of theday (table 2). Generally, examininghabitat use by time of day did not show anysignificant patterns of use.
Table 3.—Description of habitats not usedby great gray owls.
% of areaMajor species in habitat (%) not used
Black spruce 100% 16Black spruce 60-90% 10Jack pine 100% 18Jack pine 70-90% 16Tr. aspen 50-70% 14Tamarack 100% 2
Tamarack 60-90% 6
Class-0 7
Unclassified 2
Willow-alder 6
Marsh-muskeg 3
Treed-muskeg 0
Total study area = 1,942 haNever-used area = 620 ha
Management Implications
Those habitats not used or seldom usedby the great gray owls, particularly theblack spruce and jack pine stands, shouldnot be dismissed as unimportant to theowls. These avoided habitats, especiallythe drier stands, could be an importantsource of prey species. During therelatively dry seasons these prey speciesmay move from these drier areas into thebog and muskeg areas, providing food forthe great gray owls. The great gray owlsare likely selecting habitat types that canmeet most of their biological needs. Theywould favour those habitats not far fromtheir nest (probably < 1 km), that wouldprovide acceptable prey species, unimpededhunting (i.e. adequate perches, no denseshrub layer), and cover for shade andconcealment from predators for both youngand adults.
The results suggest that black spruceand jack pine stands are not critical greatgray habitat except as a source of preyspecies as discussed above. Thereforeharvesting these stands which are importantto the forestry industry would notseriously affect great gray owl habitat insoutheastern Manitoba. If these habitattypes are located near (i.e. within 1 km)tamarack bogs or treed muskeg areas,cutting practices could be adjusted tobenefit these owls. Cutting these blackspruce and jack pine stands would open thecanopy allowing for more grass growth andbetter habitat for small mammalpopulations. Rather than clear-cuttingthese areas, trees or patches of treesshould be left standing throughout toprovide perches for hunting owls.
Stands of black spruce and jack pinewithout accompanying tamarack bogs ormuskeg areas are probably not attractivehabitats for great gray owls and could beharvested without serious affect on owlhabitat. However, future research wouldgive more insight into the full value ofthese habitat types. These stands may beused by great gray owls when conditionschange. For example, in wetter years whenthe water level in the tamarack bogs andtreed muskeg remains high, prey species,and thus the owls, may move into the blackspruce and jack pine habitats. Thesehabitats may also be used more if nestswere available. In the study area man-madenests are purposely installed only intamarack bog habitats. An interestingstudy could address whether great gray owlswould use nests located in adjacent blackspruce or jack pine stands.
Great gray owls in southeasternManitoba appear to select tamarack ortamarack-spruce bogs and treed muskegareas. Nero (1980) believed thattamarack-black spruce bogs east of Winnipegare similar in many aspects to owl breeding
113
range in the northern transition forest.This tamarack-black spruce muskeg area isapproximately 40 to 50 km wide and runsabout 200 km north and south along the edgeof the Precambrian Shield (Nero 1980).This area is composed of old burns, clearedforests, marginal cropland, pine and sprucewoods, and bogs and streams. Thetransitional nature of the forests in thisregion, a result of burning andclearcutting, possibly makes it primebreeding habitat for great gray owls (Nero1980) .
Although this type of habitat appearsto be in sufficient supply in southeasternManitoba, there is the danger of losingtamarack bog areas to forestry, peatextraction and agriculture. Tamarackforests, once considered to be of marginalvalue and cut only occasionally for fenceposts or firewood, are now being clearcutin extreme southeastern Manitoba as thedemand for tamarack for pulp increases(Nero 1984). This practice could leavelarge areas of the tamarack bog regionunsuitable for great gray owl habitation.These bog areas are also threatened by newdemands for peat, for mulch in Manitoba andenergy in Minnesota, and by continueddevelopment of marginal land foragriculture (Nero 1984). Loss of forestedboglands means elimination of habitat forowls and other wildlife species (e.g.moose, deer, furbearers). It is importantto maintain areas of suitable habitat insoutheastern Manitoba where these owlscould be available for many people toenjoy
.
The status of owls is greatly affectedby man's activities and attitudes towardswildlife (Mikkola 1983). Man has an affecton the fate of wildlife populations,directly by destruction of wildlife itself,and indirectly by destruction of habitat.Habitat is probably the single mostimportant factor to consider whenattempting to protect a species (Mikkola1983). Unfortunately little is known aboutthe preferred habitat of the great gray owlacross its North American range. There isinformation only on selected areas such assoutheastern Manitoba, central Alberta,northern California and Oregon. We need toknow more about the population status ofthis species across its range, as well asits preferred habitats, so that we arebetter able to protect those habitats thatare critical and able to assess the affectsof forestry and other habitat disturbanceson the overall population. One of thesecritical habitats appears to be tamarack
bogs in southeastern Manitoba. A betterunderstanding of the habitat needs of thegreat gray owl would aid the futuremanagement of this species.
ACKNOWLEDGMENTS
I gratefully acknowledge theassistance of S.L. Loch who put theradio-transmitters on the owls, J. Dubois,Manitoba Museum of Man and Nature whoidentified prey remains in owl pellets, J.Lotimer, Ontario Ministry of NaturalResources and F. Anderka, Canadian WildlifeService who modified the radio-receiversand CD. Russel who assisted in collectionof field data. The advice and criticismsof M.R. Servos, T. Henley, M.W. Shoesmith,R.R. Riewe, R.W. Nero and W.R. Henson wereparticularly valuable. Funding wasprovided by the Manitoba Department ofNatural Resources through the Great GrayOwl Research Fund and the Natural ResourcesInstitute, University of Manitoba.
LITERATURE CITED
Byers, C.R., R.K. Steinhorst and P.R.Krausman. 1984. Clarification of atechnique for analysis of utilization-availability data. J. Wildl. Manage.48:1050-1052.
Cottam, G. and J.T. Curtis. 1956. The useof distance measures inphytosoc iological sampling. Ecology37:451-460.
Mikkola, H. 1983. Owls of Europe. ButeoBooks, Vermillion, S.D. 397 pp.
Nero, R.W. 1980. The Great Gray Owl:Phantom of the northern forest.Smithsonian Institution Press,Washington, D.C. 167 pp.
Nero, R.W. 1984. The Great Gray Owl inManitoba, 1968-83. Blue Jay 42:130-151.
Neu, C.W., C.R. Byers, and J.M. Peek. 1974.A technique for analysis of utilization-availability data. J. Wildl. Manage.38:541-545.
Rowe, J.S. 1972. Forest regions of Canada.Canadian Forestry Service, Department ofFisheries and the Environment. No. 1300.Ottawa 172 pp.
114
Status of the Great Gray Owl in Finland1
Olavi Hilden2and Tapio Solonen
Abstract.—The paper summarizes the present informa-tion on the occurrence of the Great Grey Owl in Finland,providing a background to a series of colour slides taken byFinnish bird photographers. The number of nests found in
Finland has increased considerably since the early 1960s,mainly due to intensified research, but the range andabundance vary greatly from year to year in parallel withthe local fluctuations of vole populations. The peak yearsfollow the 3-to-4-year vole cycle. In the latest peak year,1985, the total Finnish population was estimated roughly at
about 1500 breeding pairs. Following aspects are treatedin the paper: distribution, abundance and population trends,site tenacity, habitat requirements and the effects of forestry,nest sites, food and hunting technique, movements andinvasions.
Up to the middle of the 1960s, the biologyof the Great Grey Owl Strix nebulosa lapponicain Finland was virtually unknown. But sincethen, the information has rapidly grown, dozensof nests are found nowadays during peak breedingyears, and a number of papers have been pub-lished (see the reviews by Hilden & Helo 1981,Mikkola 1981, 1983, Helo 1983, 1984, Solonen 1986).
The great interest in this species is shown by thefact that in the vast literature dealing with theten owl species breeding in Finland, most papers(23%) have been devoted to the Great Grey Owl(Korpimaki 1985).
The aim of this article is to summarizebriefly the present knowledge of the status of theGreat Grey Owl in Finland, as a background to a
series of photographs shown at the symposium.We have focused the presentation on the distribu-tion, abundance and size of the Finnish popula-tion, and also given some data on habitats, nestsites and invasions, but largely omitted the breed-ing biology, food and hunting technique whichare described in detail in the recent literature(Hilden & Helo 1981, Mikkola 1981, 1983).
Paper presented at the symposium,Biology and Conservation of Northern ForestOwls, Feb. 3-7, 1987, Winnipeg, Manitoba.USDA Forest Service General Technical ReportRM-142.
2Olavi Hilden is with the Zoological Museum,
University of Helsinki, Helsinki, Finland.
DISTRIBUTION AND ABUNDANCE
In Finland the Great Grey Owl has bred in
good vole years in almost all parts of the country,except the northern- and southernmost areas.
Because vole populations fluctuate differently in
different parts of the country (e. g. Henttonen1986) , also the range and number of Great GreyOwls vary irregularly from year to year (Fig. 1).
In most years the breeding is confined to the
eastern and relatively northern parts of Finland,
but the centre of occurrence varies, and the
range seems to have shifted southwards in recent
times (Hilden & Helo 1981).
The number of Great Grey Owl nests foundin Finland has increased considerably since the
middle of the 1960s (Fig. 2), in parallel with the
steadily growing interest of bird-watchers in owls.
How much the population itself may have increasedduring this period is hard to say, but Mikkola
(1983) and Helo (1984) believe that the species in
reality also has become more common. At least a
real increase is undisputable compared to the situ-
ation from the late 1930s to the early 1960s, from
which period very few observations exist (cf.
Mikkola & Sulkava 1969, Hilden & Helo 1981).
Peak years of breeding have followed at intervals
of 3 to 4 years, largely following the annual rhythmof vole cycles.
The most exceptional distribution and abun-dance of territories was recorded in 1985, whenGreat Grey Owls bred even on the southern coast
of Finland (Solonen 1986). The number of nestsand fledged broods found totalled about 70, and at
115
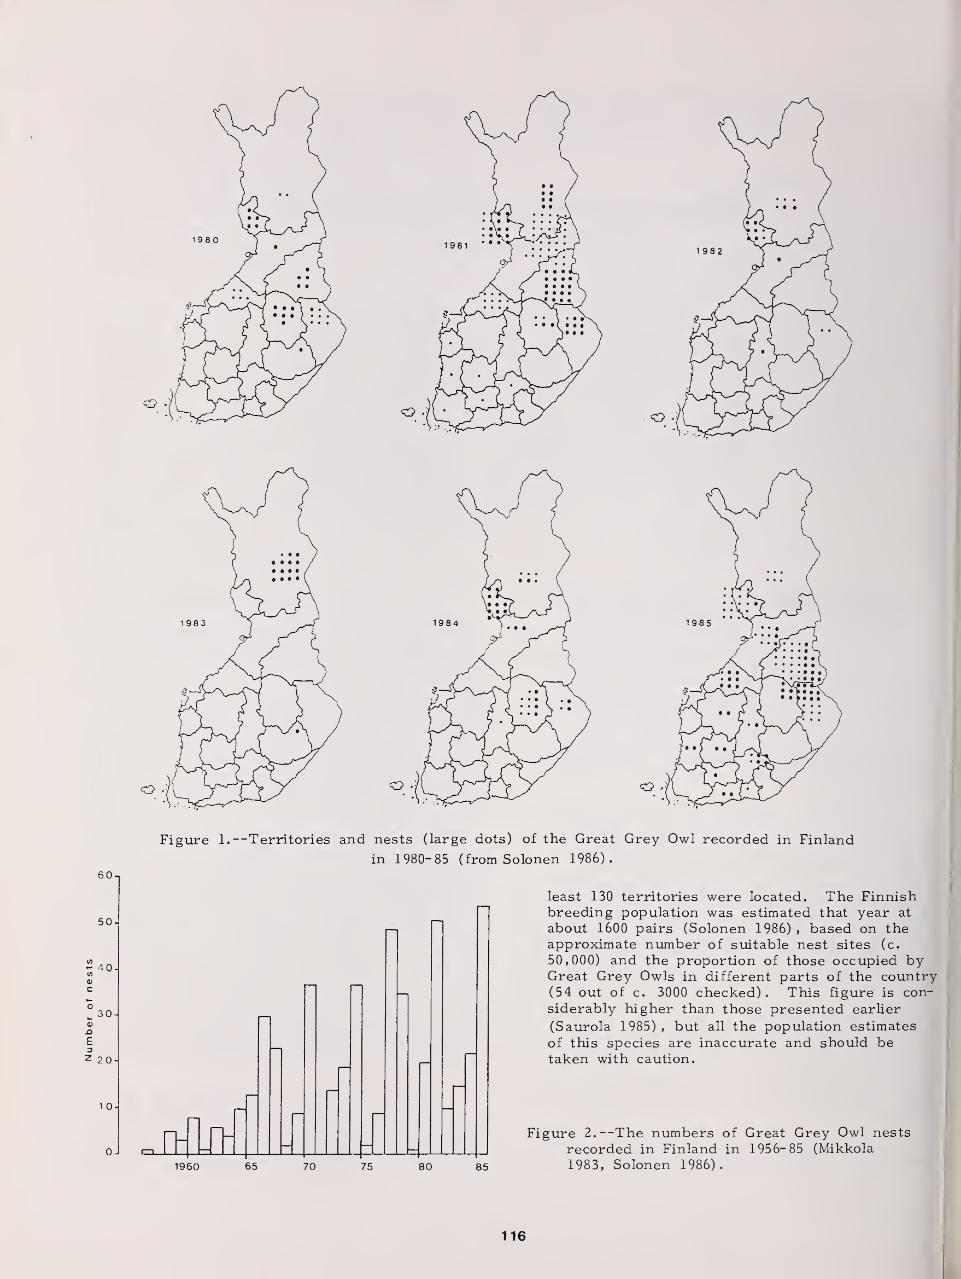
Figure 1.—Territories and nests (large dots) of the Great Grey Owl recorded in Finland
in 1980-85 (from Solonen 1986).
HID1960 65 70 75 80 85
least 130 territories were located. The Finnishbreeding population was estimated that year at
about 1600 pairs (Solonen 1986) , based on theapproximate number of suitable nest sites (c.
50,000) and the proportion of those occupied byGreat Grey Owls in different parts of the country(54 out of c. 3000 checked). This figure is con-
siderably higher than those presented earlier
(Saurola 1985) , but all the population estimates
of this species are inaccurate and should betaken with caution.
Figure 2. --The numbers of Great Grey Owl nests
recorded in Finland in 1956-85 (Mikkola
1983, Solonen 1986).
116
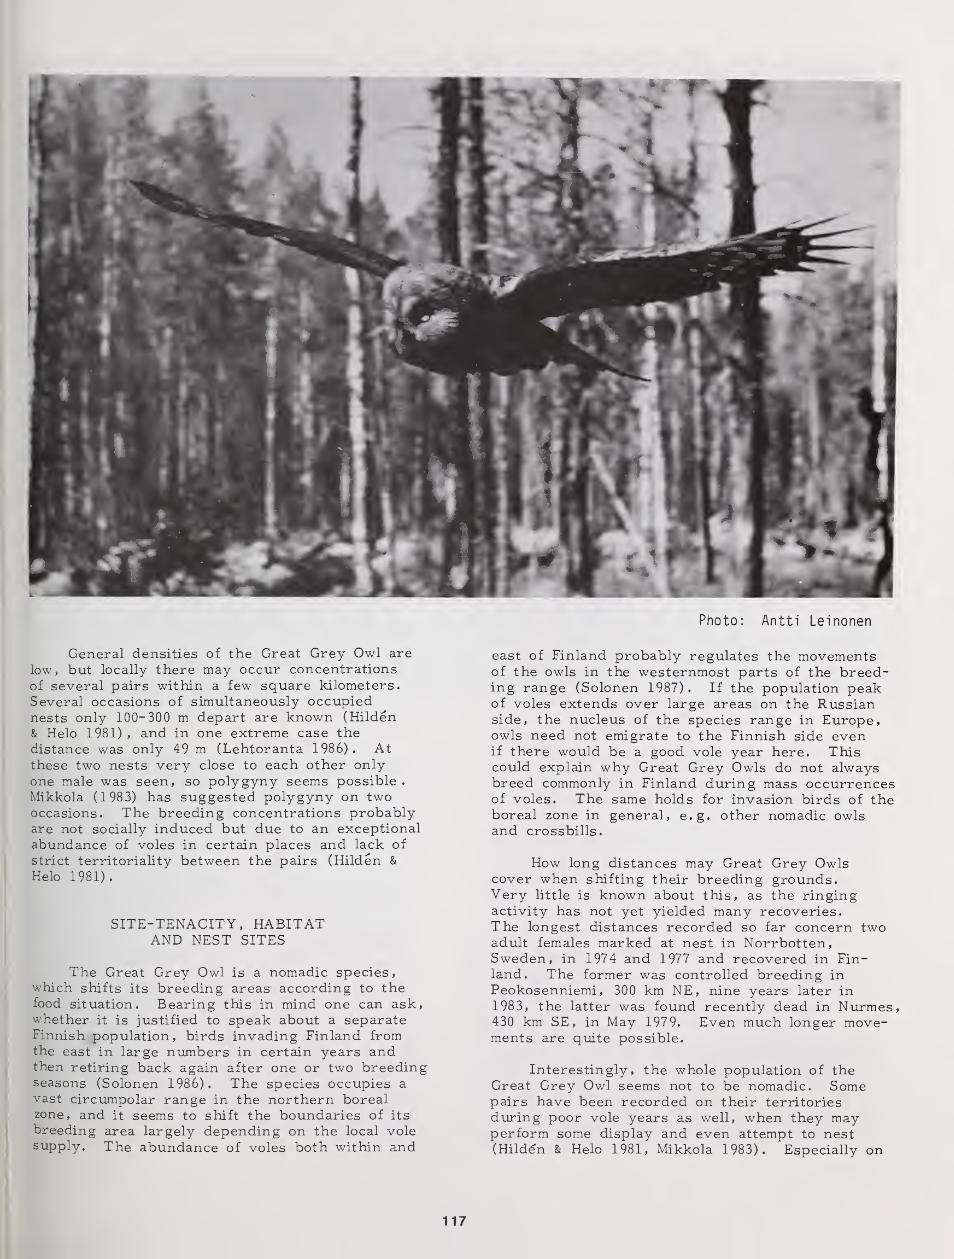
Photo: Antti Leinonen
General densities of the Great Grey Owl are
low, but locally there may occur concentrations
of several pairs within a few square kilometers.
Several occasions of simultaneously occupiednests only 100-300 m depart are known (Hilden& Helo 1981) , and in one extreme case thedistance was only 49 m (Lehtoranta 1986). Atthese two nests very close to each other onlyone male was seen, so polygyny seems possible .
Mikkola (1983) has suggested polygyny on twooccasions. The breeding concentrations probablyare not socially induced but due to an exceptionalabundance of voles in certain places and lack of
strict territoriality between the pairs (Hilden &
Helo 1981).
SITE-TENACITY, HABITATAND NEST SITES
The Great Grey Owl is a nomadic species,which shifts its breeding areas according to thefood situation. Bearing this in mind one can ask,whether it is justified to speak about a separateFinnish population, birds invading Finland fromthe east in large numbers in certain years andthen retiring back again after one or two breedingseasons (Solonen 1986). The species occupies a
vast circumpolar range in the northern borealzone, and it seems to shift the boundaries of its
breeding area largely depending on the local volesupply. The abundance of voles both within and
east of Finland probably regulates the movementsof the owls in the westernmost parts of the breed-ing range (Solonen 1987). If the population peakof voles extends over large areas on the Russianside, the nucleus of the species range in Europe,owls need not emigrate to the Finnish side evenif there would be a good vole year here. Thiscould explain why Great Grey Owls do not alwaysbreed commonly in Finland during mass occurrencesof voles. The same holds for invasion birds of theboreal zone in general, e.g. other nomadic owlsand crossbills.
How long distances may Great Grey Owlscover when shifting their breeding grounds.Very little is known about this, as the ringingactivity has not yet yielded many recoveries.The longest distances recorded so far concern twoadult females marked at nest in Norrbotten,Sweden, in 1974 and 1977 and recovered in Fin-land. The former was controlled breeding in
Peokosenniemi , 300 km NE, nine years later in
1983, the latter was found recently dead in Nurmes,430 km SE, in May 1979. Even much longer move-ments are quite possible.
Interestingly, the whole population of theGreat Grey Owl seems not to be nomadic. Somepairs have been recorded on their territoriesduring poor vole years as well, when they mayperform some display and even attempt to nest(Hilden & Helo 1981, Mikkola 1983). Especially on
117
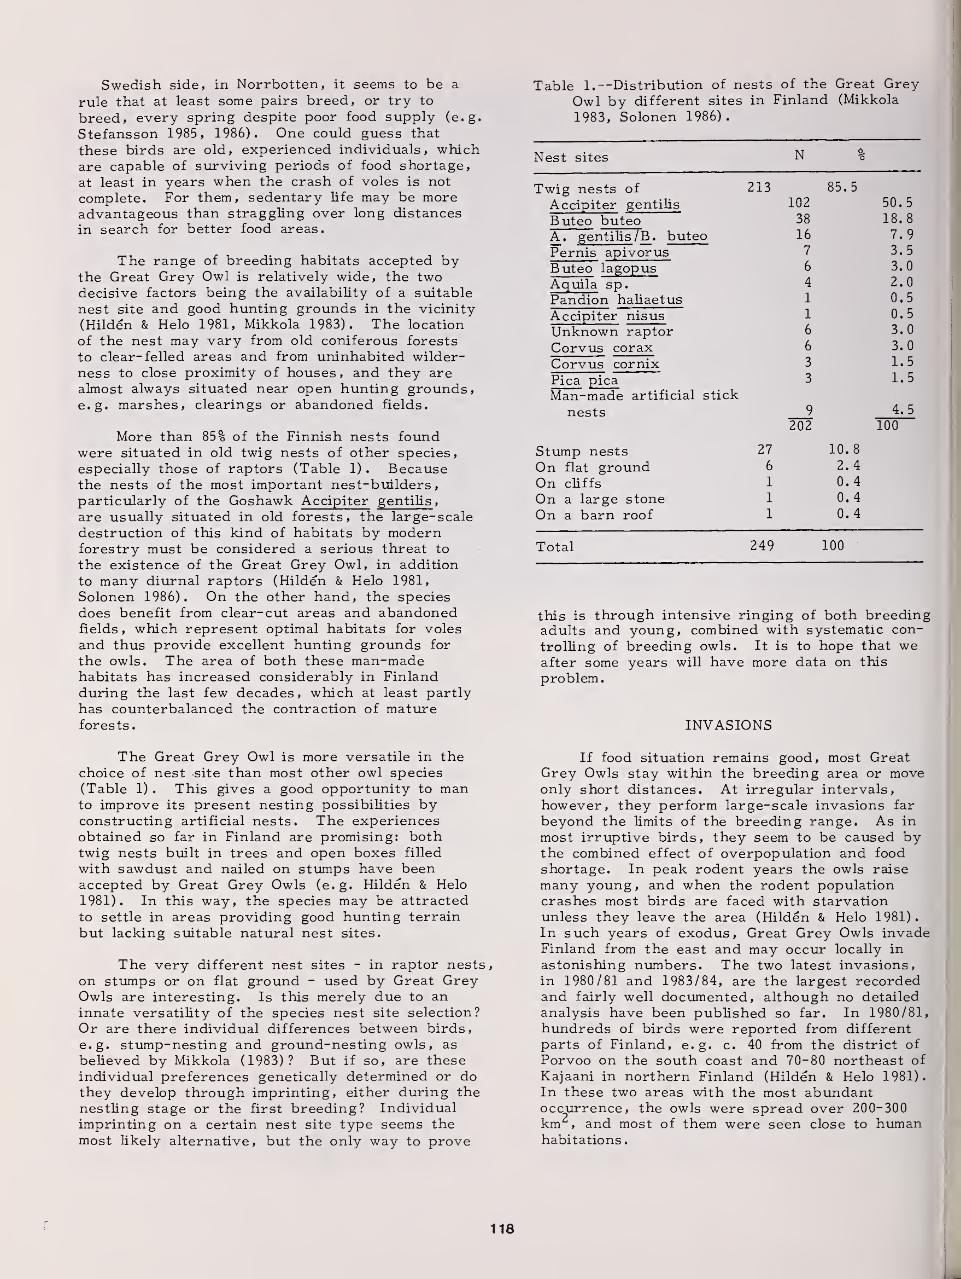
Swedish side, in Norrbotten, it seems to be a
rule that at least some pairs breed, or try to
breed, every spring despite poor food supply (e.g.
Stefansson 1985, 1986). One could guess that
these birds are old, experienced individuals, whichare capable of surviving periods of food shortage,
at least in years when the crash of voles is not
complete. For them, sedentary life may be moreadvantageous than straggling over long distances
in search for better food areas.
The range of breeding habitats accepted bythe Great Grey Owl is relatively wide, the twodecisive factors being the availability of a suitable
nest site and good hunting grounds in the vicinity
(Hilden & Helo 1981, Mikkola 1983). The location
of the nest may vary from old coniferous forests
to clear- felled areas and from uninhabited wilder-
ness to close proximity of houses, and they arealmost always situated near open hunting grounds,e.g. marshes, clearings or abandoned fields.
More than 85% of the Finnish nests foundwere situated in old twig nests of other species,especially those of raptors (Table 1) . Becausethe nests of the most important nest-builders,particularly of the Goshawk Accipiter gentilis ,
are usually situated in old forests, the large-scaledestruction of this kind of habitats by modernforestry must be considered a serious threat to
the existence of the Great Grey Owl, in addition
to many diurnal raptors (Hilden & Helo 1981,
Solonen 1986). On the other hand, the speciesdoes benefit from clear-cut areas and abandonedfields, which represent optimal habitats for voles
and thus provide excellent hunting grounds for
the owls. The area of both these man-madehabitats has increased considerably in Finlandduring the last few decades, which at least partlyhas counterbalanced the contraction of matureforests.
The Great Grey Owl is more versatile in thechoice of nest -site than most other owl species(Table 1) . This gives a good opportunity to manto improve its present nesting possibilities byconstructing artificial nests. The experiencesobtained so far in Finland are promising: bothtwig nests built in trees and open boxes filled
with sawdust and nailed on stumps have beenaccepted by Great Grey Owls (e.g. Hilden & Helo
1981). In this way, the species may be attracted
to settle in areas providing good hunting terrain
but lacking suitable natural nest sites.
The very different nest sites - in raptor nests,
on stumps or on flat ground - used by Great GreyOwls are interesting. Is this merely due to aninnate versatility of the species nest site selection?
Or are there individual differences between birds,
e.g. stump-nesting and ground-nesting owls, as
believed by Mikkola (1983)? But if so, are theseindividual preferences genetically determined or dothey develop through imprinting, either during thenestling stage or the first breeding? Individualimprinting on a certain nest site type seems the
most likely alternative, but the only way to prove
Table 1.—Distribution of nests of the Great GreyOwl by different sites in Finland (Mikkola
1983, Solonen 1986).
Nest sites N %
Twig nests of 213 85.5
Accipiter gentilis 102 50.5
Buteo buteo 38 18.
8
A. gentilis /B. buteo 16 7.9
Pernis apivorus 7 3.5
Buteo lagopus 6 3.
0
Aquila sp. 4 2.0
Pandion haliaetus 1 0.5
Accipiter nisus 1 0.5
Unknown raptor 6 3.0
Corvus corax 6 3.
0
Corvus cornix 3 1.5
Pica pica 3 1.5
Man-made artificial stick
nests __9 4.
5
202 100
Stump nests 27 10.
8
On flat ground 6 2.4
On cliffs 1 0.4
On a large stone 1 0.4
On a barn roof 1 0.4
Total 249 100
this is through intensive ringing of both breedingadults and young, combined with systematic con-
trolling of breeding owls. It is to hope that weafter some years will have more data on this
problem.
INVASIONS
If food situation remains good, most GreatGrey Owls stay within the breeding area or moveonly short distances. At irregular intervals,
however, they perform large-scale invasions far
beyond the limits of the breeding range. As in
most irruptive birds, they seem to be caused bythe combined effect of overpopulation and foodshortage. In peak rodent years the owls raise
many young, and when the rodent populationcrashes most birds are faced with starvationunless they leave the area (Hilden & Helo 1981).In such years of exodus, Great Grey Owls invadeFinland from the east and may occur locally in
astonishing numbers. The two latest invasions,in 1980/81 and 1983/84, are the largest recordedand fairly well documented, although no detailed
analysis have been published so far. In 1980/81,hundreds of birds were reported from different
parts of Finland, e.g. c. 40 from the district ofPorvoo on the south coast and 70-80 northeast of
Kajaani in northern Finland (Hilden & Helo 1981).
In these two areas with the most abundantoccurrence, the owls were spread over 200-300km^, and most of them were seen close to humanhabitations.
118
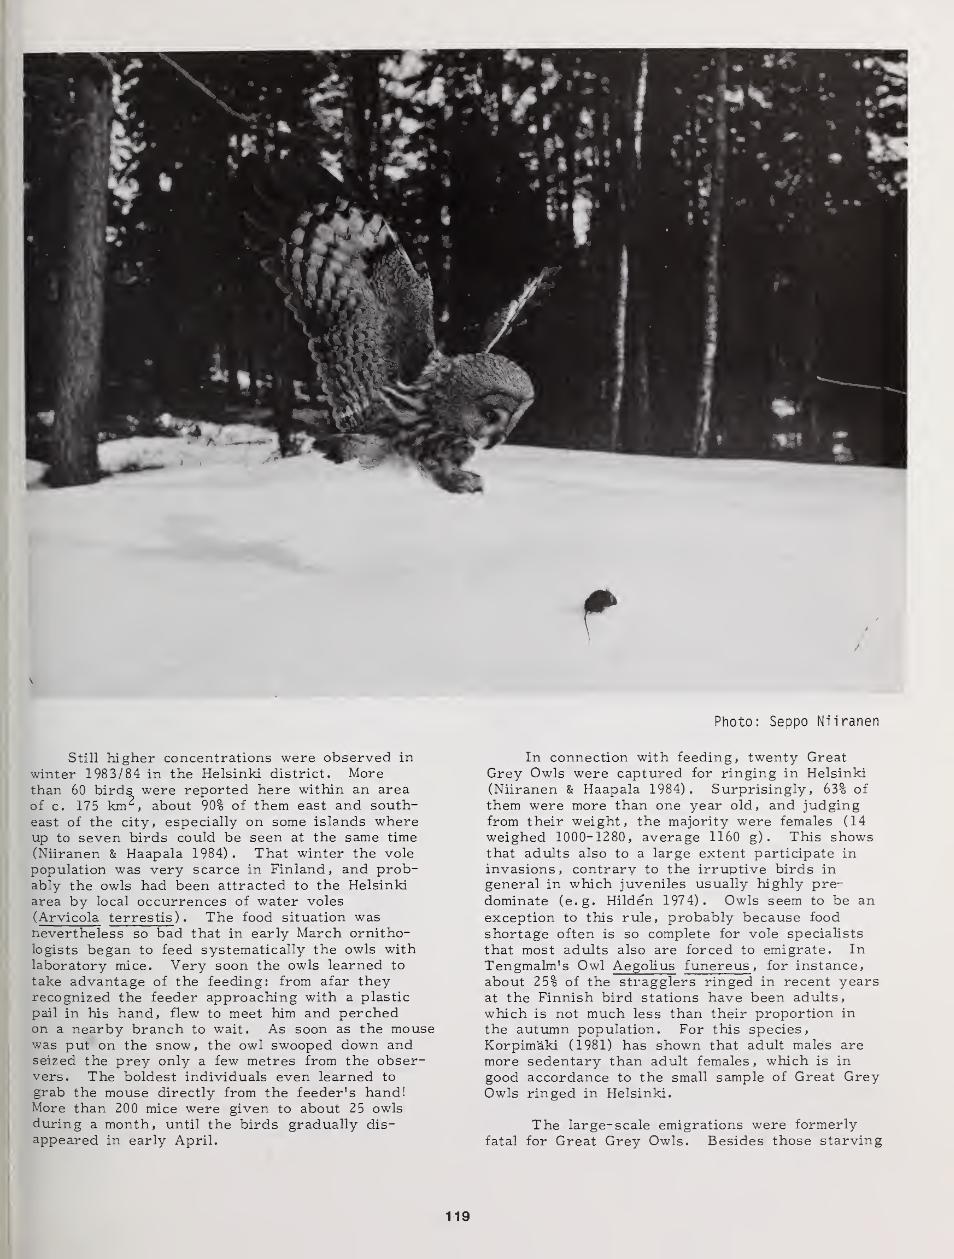
r
Still higher concentrations were observed in
winter 1983/84 in the Helsinki district. Morethan 60 birds were reported here within an areaof c. 175 km^, about 90% of them east and south-east of the city, especially on some islands whereup to seven birds could be seen at the same time
(Niiranen & Haapala 1984) . That winter the vole
population was very scarce in Finland, and prob-ably the owls had been attracted to the Helsinki
area by local occurrences of water voles
(Arvicola terrestis) . The food situation wasnevertheless so bad that in early March ornitho-logists began to feed systematically the owls withlaboratory mice. Very soon the owls learned to
take advantage of the feeding: from afar theyrecognized the feeder approaching with a plastic
pail in his hand, flew to meet him and perchedon a nearby branch to wait. As soon as the mousewas put on the snow, the owl swooped down andseized the prey only a few metres from the obser-vers. The boldest individuals even learned to
grab the mouse directly from the feeder's hand!More than 200 mice were given to about 25 owlsduring a month, until the birds gradually dis-appeared in early April.
Photo: Seppo Niiranen
In connection with feeding, twenty GreatGrey Owls were captured for ringing in Helsinki
(Niiranen & Haapala 1984). Surprisingly, 63% of
them were more than one year old, and judgingfrom their weight, the majority were females (14
weighed 1000-1280, average 1160 g) . This showsthat adults also to a large extent participate in
invasions, contrary to the irruptive birds in
general in which juveniles usually highly pre-
dominate (e.g. Hilden 1974). Owls seem to be anexception to this rule, probably because food
shortage often is so complete for vole specialists
that most adults also are forced to emigrate. InTengmalm's Owl Aegolius funereus , for instance,
about 25% of the stragglers ringed in recent yearsat the Finnish bird stations have been adults,
which is not much less than their proportion in
the autumn population. For this species,Korpim'aki (1981) has shown that adult males are
more sedentary than adult females, which is in
good accordance to the small sample of Great GreyOwls ringed in Helsinki.
The large-scale emigrations were formerlyfatal for Great Grey Owls. Besides those starving
119
to death, great numbers of owls were shot, as shownby the statistics of birds sent to taxidermists andmuseums (cf. v. Haartman et al. 1963-72,Mikkola 1983, p. 209). Fortunately, the attitudestowards owls and raptors have totally changed,both in Finland and most other countries. A goodexample of this was the successful feeding opera-tion of Great Grey Owls in Helsinki, as well asthe positive publicity these magnificent birdsgained in mass-media all over the country.
REFERENCES
v. Haartman, L. , Hilden, O. , Linkola, P. ,
Suomalainen, P. & Tenovuo, R. 1963-72:
Pohjolan linnut varikuvin. - Otava, Helsinki
(in Finnish)
.
Helo, P. 1983: Lapinpollo. - In Hyytia, K. ,
Kellomaki, E. & Koistinen, J. (eds.): Suomenlintuatlas, pp. 252-253. Lintutieto, Helsinki
(in Finnish)
.
Henttonen, H. 1986: Causes and geographicpatterns of microtine cycles. - Thesis, Dept.Zoology, University of Helsinki.
Hilden, O. 1974: Finnish bird stations, their
activities and aims. - Ornis Fennica 51:
10-35.
Hilden, O. & Helo, P. 1981: The Great Grey OwlStrix nebulosa - a bird of the northern taiga.- Ornis Fennica 58:159-166.
Korpimaki, E. 1981: On the ecology and biology ofTengmalm's Owl (Aegolius funereus) in
Southern Ostrobothnia and Suomenselk'a,western Finland. — Acta UniversitatisOuluensis, Ser A, 118:1-84.
Korpimaki, E. 1985: Pollotutkimus Suomessa. -
LIntumies 20:57-62 (in Finnish).Lehtoranta, H. 1986: Lapinp'ollojen Strix nebulosa
lahekkainen pesinta. - Lintumies 21:32 (in
Finnish)
.
Mikkola, H. (1981: Der Bartkauz Strix nebulosa. -
Die Neue Brehm-Bucherei 538-1-124.
Mikkola, H. 1983: Owls of Europe. - Poyser,Calton.
Mikkola, H. & Sulkava, S. 1969: On the occur-rence of the Great Grey Owl (Strix nebulosa)in Finland 1955-68. - Ornis Fennica 46:126-131.
Niiranen, S. & Haapala, J. 1984: Lapinpollo! -
Lintumies 19:84-85 (in Finnish).Saurola, P. 1985: Finnish birds of prey: status
and population changes. - Ornis Fennica62:64-72.
Solonen, T. 1986: Breeding of the Great GreyOwl Strix nebulosa in Finland. - Lintumies
21:11-18 (in Finnish with summary in
English) .
Solonen, T. 1987: Structure of the Finnish
raptor community. - MS submittedStefansson, O. 1985: Projekt Lappuggla. - Var
Fagelvarld 44:231-232 (in Swedish).Stefansson, O. 1986: Projekt Lappuggla. - Var
Fagelvarld 45:301-302 (in Swedish).
120
Territorial Aspects of Barred Owl Home Rangeand Behavior in Minnesota1
Thomas H. Nicholls2and Mark R. Fuller3
Abstract.—We described the movements of barred owls
( Strlx varia ) based on samples taken from millions of
telemetry data recorded by a semi-automatic radio-trackingsystem. Evidence collected convinces us that barred owls are
territorial in habit. They exhibited nearly exclusive use of
their home ranges within their own species. When home rangesof neighboring owls did overlap, it was of short duration and
consisted of a small portion of the total home range.
However, home ranges of mated pairs overlapped extensively.Home range boundaries were generally constant from year to
year and decade to decade, even when occupants changed.Neighbors were seldom near each other. Vocal advertisementwas apparently the most important display. The few barredowls that did not exhibit territoriality were thought to be
young, or dispersing birds.
INTRODUCTION
Territoriality in birds and animals has beenaddressed by many authors who have variouslydefined the term and recommended differentcriteria for determining territories and
territorial behavior. The most commonly accepteddefinition of a territory is: A fixed area that
varies little through time, from which rivals are
excluded, and in which the occupant conducts someor all of its activities (Brown 1975, Morse 1980,
Wittenberger 1981).
Given this definition, several workers have
reported territorial behavior by various speciesof owl: great horned owl, Bubo virginianus(Miller 1930, Baumgartner 1939)"; flammulatedscreech owl, Otus flammeolus (Marshall 1939);snowy owl, Nyctea scandiaca, (Keith 1964, Evans1980); and tawny owl, Strix aluco (Southern 1970,
Southern and Lowe 1968). To further support theconcept of territoriality among owls, we present
i Paper presented at the symposium, Biologyand Conservation of Northern Forest Owls, Feb.
3-7, 1987, Winnipeg, Manitoba. USUA ForestService, General Technical Report RM-142.
^Thomas H. Nicholls, Project Leader, WildlifeHabitat Research, United States Department ofAgriculture, Forest Service, North Central ForestExperiment Station, 1992 Folwell Ave., St. Paul,Minnesota 55108, USA.
3Mark R. Fuller, Ecologist, Patuxent WildlifeResearch Center, Laurel, Maryland 20708, USA.
the results of our studies on the home ranges and
movement patterns of the barred owl, Sj, varia .
(We define "home range" as that area regularlyused by an owl during its normal activities of
hunting, courtship and mating, nesting, caring for
young, and seeking shelter.) We conducted our two
studies on the Cedar Creek Natural History Area(CCNHA) in Minnesota. We used radio telemetry to
track the birds. This permitted short samplingintervals, useful for evaluating the
short-duration activities of owls necessary to
describe territoriality.
METHODS
The CCNHA, a 5,460-acre research facilityoperated by the University of Minnesota, is
located at 93° 12»E longitude and 45° 24»Nlatitude about 30 miles north of Minneapolis,Minnesota. The area contains a blend of forests,prairies, marshes, lakes, ponds, and abandoned
fields of various ages (Pierce 1954, Bray et al.
1959). Nicholls and Warner (1972) described thegeneral seasonal and phenological characteristics
related to barred owl habitat use.
Owls were trapped using balchatri traps,
Swedish goshawk traps, and two-shelf mist nets
(Nicholls 1973, Fuller and Christenson 1976).Owls were measured, sexed when possible, fitted
with radio transmitters (Nicholls and Warner 1968,
Fuller 1979), banded, and released (fig. 1). We
concluded that birds were a pair if they cared for
the same young owls during the breeding season.
121
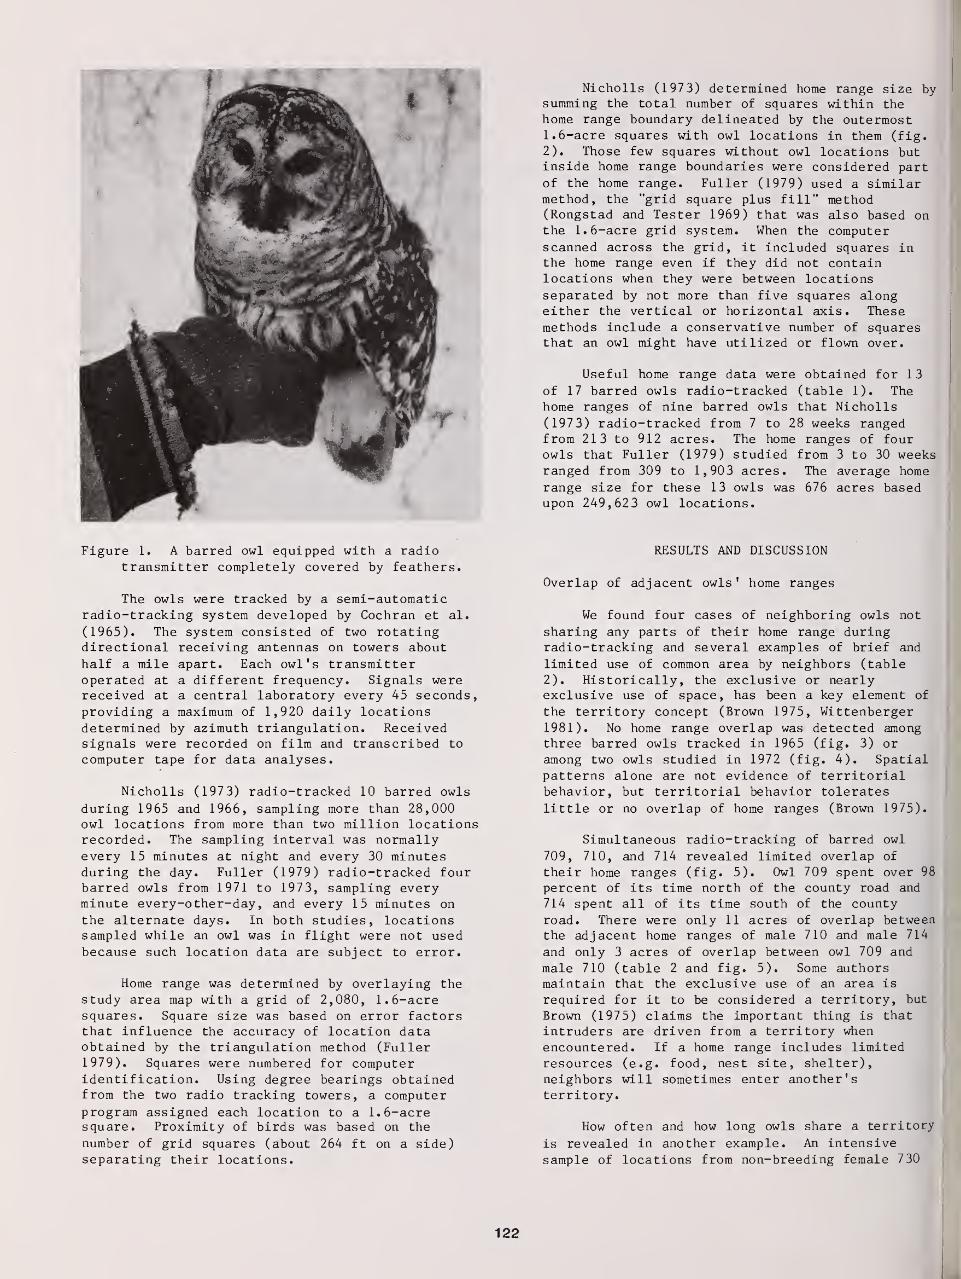
Figure 1. A barred owl equipped with a radiotransmitter completely covered by feathers.
The owls were tracked by a semi-automaticradio-tracking system developed by Cochran et al.
(1965). The system consisted of two rotatingdirectional receiving antennas on towers abouthalf a mile apart. Each owl's transmitteroperated at a different frequency. Signals werereceived at a central laboratory every 45 seconds,
providing a maximum of 1,920 daily locationsdetermined by azimuth triangulation. Receivedsignals were recorded on film and transcribed to
computer tape for data analyses.
Nicholls (197 3) radio-tracked 10 barred owls
during 1965 and 1966, sampling more than 28,000owl locations from more than two million locationsrecorded. The sampling interval was normallyevery 15 minutes at night and every 30 minutesduring the day. Fuller (1979) radio-tracked fourbarred owls from 1971 to 1973, sampling everyminute every-other-day , and every 15 minutes on
the alternate days. In both studies, locationssampled while an owl was in flight were not usedbecause such location data are subject to error.
Home range was determined by overlaying the
study area map with a grid of 2,080, 1.6-acresquares. Square size was based on error factorsthat influence the accuracy of location dataobtained by the triangulation method (Fuller1979). Squares were numbered for computeridentification. Using degree bearings obtainedfrom the two radio tracking towers, a computerprogram assigned each location to a 1.6-acresquare. Proximity of birds was based on the
number of grid squares (about 264 ft on a side)separating their locations.
Nicholls (1973) determined home range size bysumming the total number of squares within the
home range boundary delineated by the outermost1.6-acre squares with owl locations in them (fig.
2). Those few squares without owl locations butinside home range boundaries were considered part
of the home range. Fuller (1979) used a similarmethod, the "grid square plus fill" method(Rongstad and Tester 1969) that was also based onthe 1.6-acre grid system. When the computerscanned across the grid, it included squares inthe home range even if they did not containlocations when they were between locationsseparated by not more than five squares alongeither the vertical or horizontal axis. Thesemethods include a conservative number of squaresthat an owl might have utilized or flown over.
Useful home range data were obtained for 1
3
of 17 barred owls radio-tracked (table 1). Thehome ranges of nine barred owls that Nicholls
(1973) radio-tracked from 7 to 28 weeks rangedfrom 213 to 912 acres. The home ranges of fourowls that Fuller (1979) studied from 3 to 30 weeksranged from 309 to 1,903 acres. The average home
range size for these 13 owls was 676 acres basedupon 249,62 3 owl locations.
RESULTS AND DISCUSSION
Overlap of adjacent owls' home ranges
We found four cases of neighboring owls not
sharing any parts of their home range duringradio-tracking and several examples of brief and
limited use of common area by neighbors (table
2). Historically, the exclusive or nearlyexclusive use of space, has been a key element of
the territory concept (Brown 1975, Wittenberger1981). No home range overlap was detected amongthree barred owls tracked in 1965 (fig. 3) or
among two owls studied in 1972 (fig. 4). Spatialpatterns alone are not evidence of territorialbehavior, but territorial behavior tolerates
little or no overlap of home ranges (Brown 1975).
Simultaneous radio-tracking of barred owl
709, 710, and 714 revealed limited overlap of
their home ranges (fig. 5). Owl 709 spent over 98
percent of its time north of the county road and
714 spent all of its time south of the countyroad. There were only 11 acres of overlap betweenthe adjacent home ranges of male 710 and male 714
and only 3 acres of overlap between owl 709 and
male 710 (table 2 and fig. 5). Some authorsmaintain that the exclusive use of an area is
required for it to be considered a territory, but
Brown (1975) claims the important thing is that
intruders are driven from a territory whenencountered. If a home range includes limited
resources (e.g. food, nest site, shelter),neighbors will sometimes enter another'sterritory.
How often and how long owls share a territory
is revealed in another example. An intensive
sample of locations from non-breeding female 7 30
122
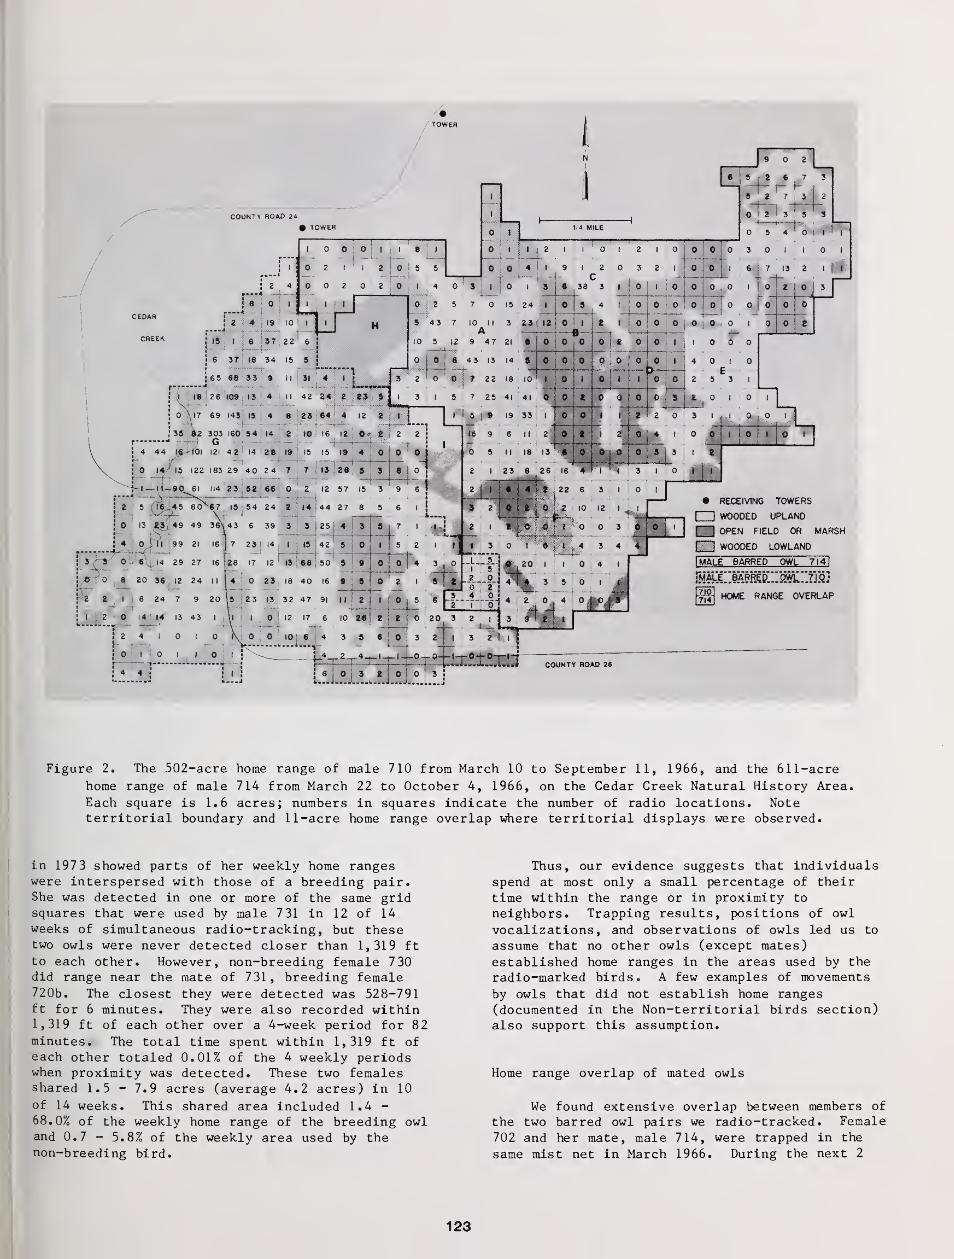
Figure 2. The 502-acre home range of male 710 from March 10 to September 11, 1966, and the 611-acre
home range of male 714 from March 22 to October 4, 1966, on the Cedar Creek. Natural History Area.
Each square is 1.6 acres; numbers in squares indicate the number of radio locations. Noteterritorial boundary and 11-acre home range overlap where territorial displays were observed.
in 197 3 showed parts of her weekly home rangeswere interspersed with those of a breeding pair.She was detected in one or more of the same gridsquares that were used by male 7 31 in 12 of 14
weeks of simultaneous radio-tracking, but thesetwo owls were never detected closer than 1,319 ft
to each other. However, non-breeding female 730did range near the mate of 731, breeding female720b. The closest they were detected was 528-791ft for 6 minutes. They were also recorded within1,319 ft of each other over a 4-week period for 82minutes. The total time spent within 1,319 ft of
each other totaled 0.01% of the 4 weekly periodswhen proximity was detected. These two femalesshared 1.5 - 7.9 acres (average 4.2 acres) in 10
of 14 weeks. This shared area included 1.4 -
68.0% of the weekly home range of the breeding owland 0.7 - 5.8% of the weekly area used by the
non-breeding bird.
Thus, our evidence suggests that individualsspend at most only a small percentage of their
time within the range or in proximity to
neighbors. Trapping results, positions of owl
vocalizations, and observations of owls led us to
assume that no other owls (except mates)established home ranges in the areas used by the
radio-marked birds. A few examples of movements
by owls that did not establish home ranges(documented in the Non-territorial birds section)also support this assumption.
Home range overlap of mated owls
We found extensive overlap between members of
the two barred owl pairs we radio-tracked. Female702 and her mate, male 714, were trapped in the
same mist net in March 1966. During the next 2
123
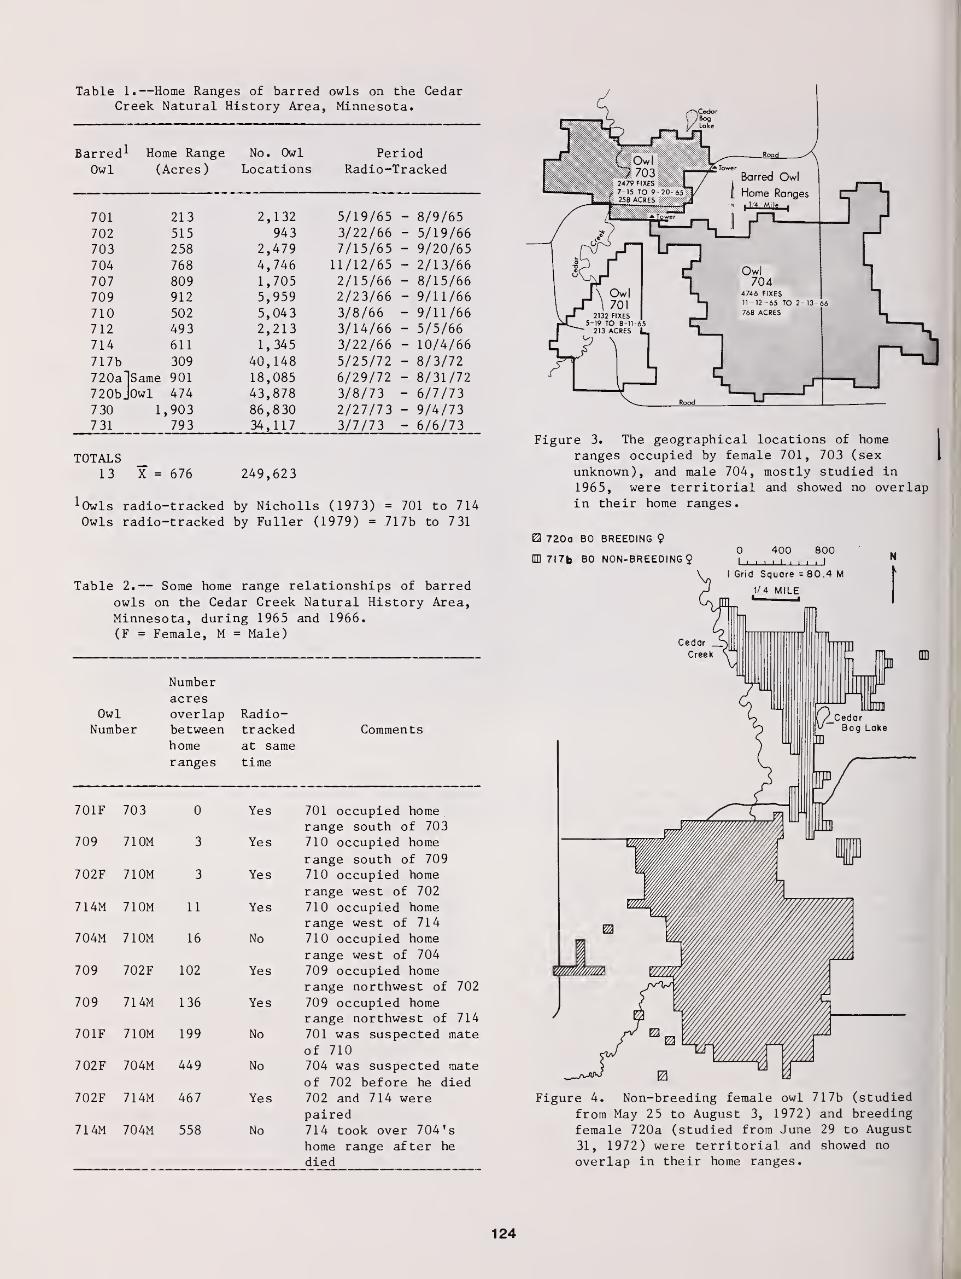
Table 1.—Home Ranges of barred owls on the CedarCreek Natural History Area, Minnesota.
Barred 1 Home Range No. Owl PeriodOwl (Acres) Locations Radio-Tracked
701 213 2,132 5/19/65 - 8/9/65702 515 943 3/22/66 - 5/19/66703 258 2,479 7/15/65 - 9/20/65704 768 4,746 11/12/65 - 2/13/66707 809 1,705 2/15/66 - 8/15/667f|Q/ U J Q1 9 J,7J7 9 /9 "\lf\(\ - Q/ 1 1i / i j/ do 7/ i i / on
710 502 5,043 3/8/66 - 9/11/66712 493 2,213 3/14/66 - 5/5/66714 611 1,345 3/22/66 - 10/4/667 1 7k/ 1 / D 40,148 5/25/72 - 8/3/72720alSame 901 18,085 6/29/72 - 8/31/72
720bJOwl 474 43,878 3/8/73 - 6/7/73730 1 ,903 86,830 2/27/73 - 9/4/73731 793 34,117 3/7/73 - 6/6/73
TOTALS13 X = 676 249,623
^Owls radio-tracked by Nicholls (1973) = 701 to 714Owls radio-tracked by Fuller (1979) = 717b to 731
Table 2.
—
Some home range relationships of barredowls on the Cedar Creek Natural History Area,
Minnesota, during 1965 and 1966.(F = Female, M = Male)
Numberacres
Owl overlap Radio-Number between tracked Comments
home at same
ranges time
701F 703 0 Yes 701 occupied homerange south of 703
709 710M 3 Yes 710 occupied home
range south of 709702F 710M 3 Yes 710 occupied home
range west of 702
714M 710M 11 Yes 710 occupied homerange west of 714
704M 710M 16 No 710 occupied home
range west of 704
709 702F 102 Yes 709 occupied homerange northwest of 702
709 714M 136 Yes 709 occupied homerange northwest of 714
701F 710M 199 No 701 was suspected mateof 710
702F 704M 449 No 704 was suspected mate
of 702 before he died702F 714M 467 Yes 702 and 714 were
paired714M 704M 558 No 714 took over 704'
s
home range after he
died
Figure 3. The geographical locations of homeranges occupied by female 701, 703 (sex
unknown), and male 704, mostly studied in
1965, were territorial and showed no overlapin their home ranges.
720a BO BREEDING 90 400 800
DD
Figure 4. Non-breeding female owl 717b (studied
from May 2 5 to August 3, 1972) and breedingfemale 720a (studied from June 29 to August
31, 1972) were territorial and showed no
overlap in their home ranges.
124
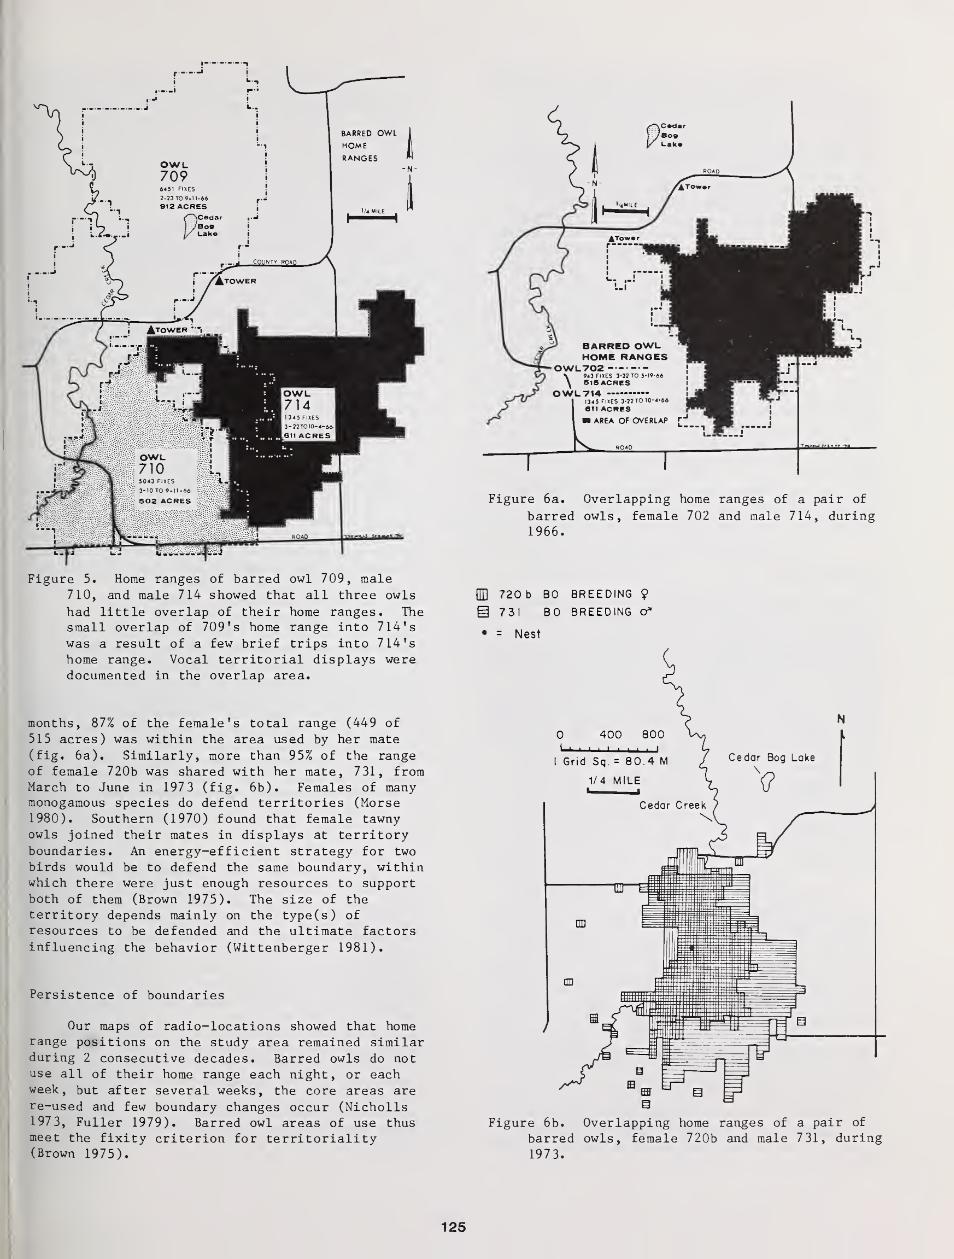
Figure 5. Home ranges of barred owl 709, male710, and male 714 showed that all three owls
had little overlap of their home ranges. Thesmall overlap of 709 's home range into 714'swas a result of a few brief trips into 714'shome range. Vocal territorial displays weredocumented in the overlap area.
months, 87% of the female's total range (449 of
515 acres) was within the area used by her mate(fig. 6a). Similarly, more than 95% of the rangeof female 720b was shared with her mate, 7 31, fromMarch to June in 197 3 (fig. 6b). Females of manymonogamous species do defend territories (Morse1980). Southern (1970) found that female tawnyowls joined their mates in displays at territoryboundaries. An energy-efficient strategy for two
birds would be to defend the same boundary, withinwhich there were just enough resources to supportboth of them (Brown 1975). The size of theterritory depends mainly on the type(s) ofresources to be defended and the ultimate factorsinfluencing the behavior (Wittenberger 1981).
Persistence of boundaries
Our maps of radio-locations showed that homerange positions on the study area remained similarduring 2 consecutive decades. Barred owls do notuse all of their home range each night, or eachweek, but after several weeks, the core areas arere-used and few boundary changes occur (Nicholls1973, Fuller 1979). Barred owl areas of use thusmeet the fixity criterion for territoriality(Brown 1975).
Figure 6a. Overlapping home ranges of a pair of
barred owls, female 702 and male 714, during1966.
QD 720 b BO
@ 731 BO
• = Nest
BREEDING 9
BREEDING o*
Cedar Bog Lake
Figure 6b. Overlapping home ranges of a pair of
barred owls, female 720b and male 7 31, durin1973.
125
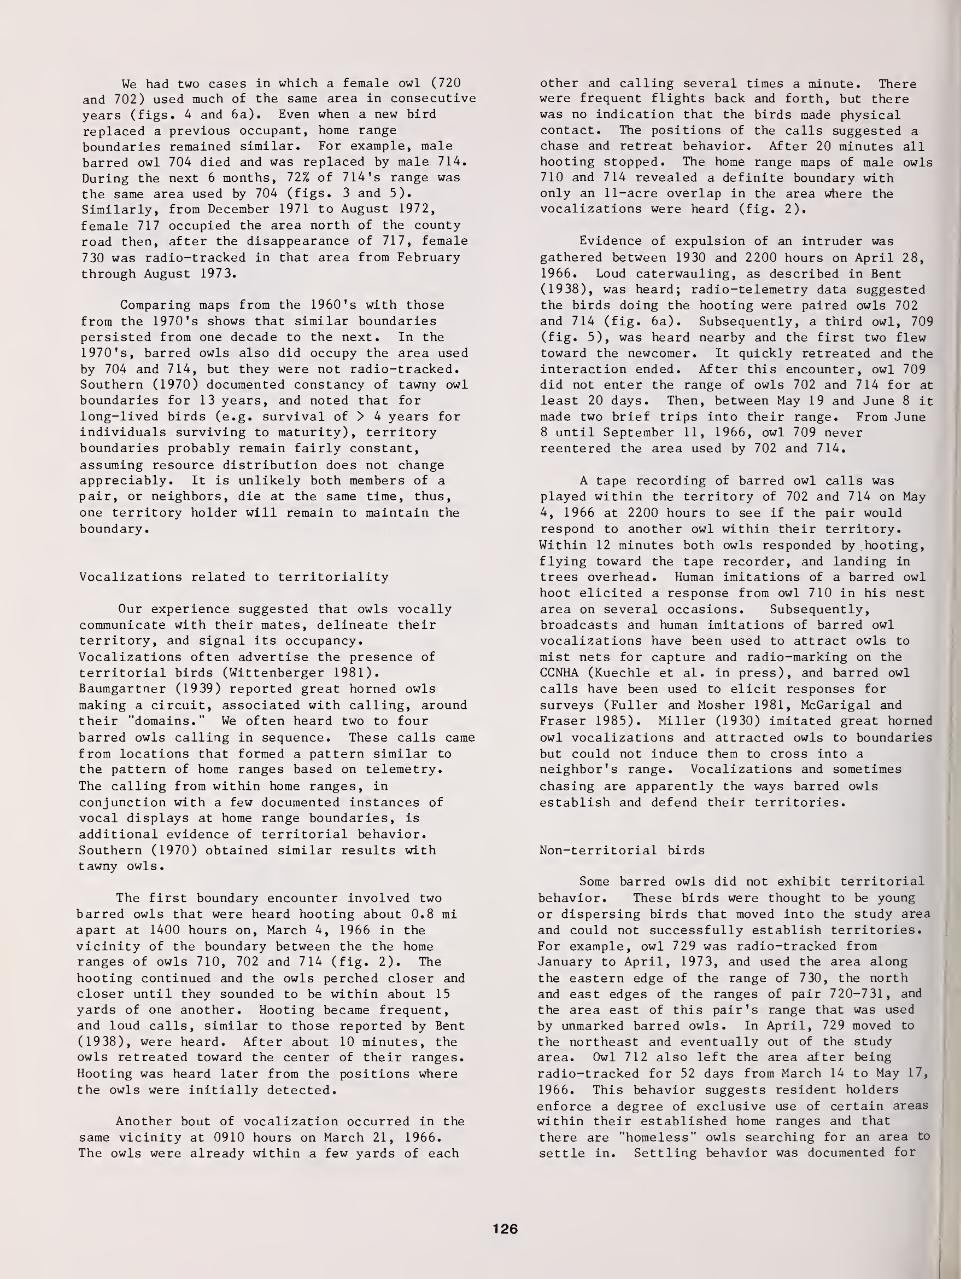
We had two cases in which a female owl (720
and 702) used much of the same area in consecutive
years (figs. 4 and 6a). Even when a new bird
replaced a previous occupant, home range
boundaries remained similar. For example, malebarred owl 704 died and was replaced by male 714.
During the next 6 months, 72% of 714 's range was
the same area used by 704 (figs. 3 and 5).
Similarly, from December 1971 to August 1972,
female 717 occupied the area north of the county
road then, after the disappearance of 717, female
730 was radio-tracked in that area from Februarythrough August 1973.
Comparing maps from the 1960's with those
from the 1970' s shows that similar boundariespersisted from one decade to the next. In the1970 's, barred owls also did occupy the area used
by 704 and 714, but they were not radio-tracked.Southern (1970) documented constancy of tawny owlboundaries for 13 years, and noted that for
long-lived birds (e.g. survival of > 4 years forindividuals surviving to maturity), territoryboundaries probably remain fairly constant,
assuming resource distribution does not changeappreciably. It is unlikely both members of a
pair, or neighbors, die at the same time, thus,
one territory holder will remain to maintain the
boundary.
Vocalizations related to territoriality
Our experience suggested that owls vocallycommunicate with their mates, delineate theirterritory, and signal its occupancy.Vocalizations often advertise the presence of
territorial birds (Wittenberger 1981).Baumgartner (1939) reported great horned owls
making a circuit, associated with calling, aroundtheir "domains." We often heard two to four
barred owls calling in sequence. These calls came
from locations that formed a pattern similar to
the pattern of home ranges based on telemetry.
The calling from within home ranges, in
conjunction with a few documented instances of
vocal displays at home range boundaries, is
additional evidence of territorial behavior.Southern (1970) obtained similar results withtawny owls.
The first boundary encounter involved two
barred owls that were heard hooting about 0.8 miapart at 1400 hours on, March 4, 1966 in the
vicinity of the boundary between the the homeranges of owls 710, 702 and 714 (fig. 2). The
hooting continued and the owls perched closer andcloser until they sounded to be within about 15
yards of one another. Hooting became frequent,and loud calls, similar to those reported by Bent
(1938), were heard. After about 10 minutes, theowls retreated toward the center of their ranges.
Hooting was heard later from the positions wherethe owls were initially detected.
Another bout of vocalization occurred in the
same vicinity at 0910 hours on March 21, 1966.
The owls were already within a few yards of each
other and calling several times a minute. Therewere frequent flights back and forth, but therewas no indication that the birds made physicalcontact. The positions of the calls suggested achase and retreat behavior. After 20 minutes allhooting stopped. The home range maps of male owls710 and 714 revealed a definite boundary withonly an 11-acre overlap in the area where thevocalizations were heard (fig. 2).
Evidence of expulsion of an intruder was
gathered between 1930 and 2200 hours on April 28,1966. Loud caterwauling, as described in Bent(1938), was heard; radio-telemetry data suggestedthe birds doing the hooting were paired owls 702and 714 (fig. 6a). Subsequently, a third owl, 709(fig. 5), was heard nearby and the first two flewtoward the newcomer. It quickly retreated and the
interaction ended. After this encounter, owl 709did not enter the range of owls 702 and 714 for at
least 20 days. Then, between May 19 and June 8 it
made two brief trips into their range. From June8 until September 11, 1966, owl 709 neverreentered the area used by 702 and 714.
A tape recording of barred owl calls wasplayed within the territory of 702 and 714 on May
4, 1966 at 2200 hours to see if the pair wouldrespond to another owl within their territory.Within 12 minutes both owls responded by hooting,flying toward the tape recorder, and landing in
trees overhead. Human imitations of a barred owl
hoot elicited a response from owl 710 in his nest
area on several occasions. Subsequently,broadcasts and human imitations of barred owl
vocalizations have been used to attract owls to
mist nets for capture and radio-marking on the
CCNHA (Kuechle et al. in press), and barred owl
calls have been used to elicit responses for
surveys (Fuller and Mosher 1981, McGarigal and
Fraser 1985). Miller (1930) imitated great horned
owl vocalizations and attracted owls to boundariesbut could not induce them to cross into a
neighbor's range. Vocalizations and sometimes
chasing are apparently the ways barred owls
establish and defend their territories.
Non-territorial birds
Some barred owls did not exhibit territorialbehavior. These birds were thought to be young
or dispersing birds that moved into the study area
and could not successfully establish territories.For example, owl 729 was radio-tracked fromJanuary to April, 1973, and used the area along
the eastern edge of the range of 730, the northand east edges of the ranges of pair 720-731, and
the area east of this pair's range that was used
by unmarked barred owls. In April, 729 moved to
the northeast and eventually out of the studyarea. Owl 712 also left the area after being
radio-tracked for 52 days from March 14 to May 17,
1966. This behavior suggests resident holders
enforce a degree of exclusive use of certain areas
within their established home ranges and that
there are "homeless" owls searching for an area to
settle in. Settling behavior was documented for
126

tawny owls by Southern (1970); other observationsand experiments with territorial species have
demonstrated the existence of "floaters," waiting
to establish territories (Davies 1978).
CONCLUSION
Our studies revealed that barred owls
maintain nearly exclusive home ranges, expel
intruders and neighbors from their ranges, and
vocalize to advertise the occupancy of their
space. These behaviors are consistent withcriteria for territoriality. Territorial behaviorthat leads to nearly exclusive use of space has a
variety of advantages for occupants (Brown 1975).
Apparently, nearly all the barred owls' activitiesoccurred in their territories, which correspondedwith their home ranges. This relationship is the
Type A territory of Hinde (1956).
Hinde discussed many potential advantages for
territory holders: protection of nest and nest
site, prevention of epidemics, reduction of loss
to predation for cryptic species, prevention of
inbreeding, facilitation of pair formation and
maintenance, prevention of interference withreproductive activities, and exclusive use of
limited resources, including short-termrequirements of the occupant (e.g. food foryoung). Being territorial, the barred owl
benefits from many of these advantages.
ACKNOWLEDGMENTS
Studies of the kind we undertook requiredthe help of many individuals over a long periodof time. We extend thanks to the staff and
colleagues who assisted us at the University of
Minnesota CCNHA and the Department of Ecology andBehaviorial Biology. We especially acknowledgeDrs. Dwain W. Warner, William H. Marshall, and
John R. Tester, who served as advisors. Theauthors wish to thank J. Faaborg, J.D. Fraser,D.H. Johnson, and A.R. Weisbrod for reviewingthis paper and providing many helpful commentsfor improvement.
LITERATURE CITED
Baumgartner, F.M. 1939. Territory and populationin the great horned owl. Auk 56:274-282.
Bent, A.C. 1938. Life histories of NorthAmerican birds of prey. (Part 2). UnitedStates National Museum Bulletin 170. 482 p.
Bray, J.R. , D.B. Lawrence, and L.C. Pearson.1959. Primary production in some Minnesotaterrestrial communities for 1957. Oikos 10
(pt. 1): 38-49.
Brown, J.L. 1975. The evolution of behavior.W.W. Norton and Co., Inc. New York.761 p.
Cochran, W.W. , D.W. Warner, J.R. Tester, andV.B. Kuechle. 1965. Automaticradio-tracking system for monitoring animalmovements. Bioscience 15:98-100.
Davies, N.B. 1978. Ecological questions aboutterritorial behavior, p. 317-350. In
Behavioral ecology, an evolutionary approach,J.R. Krebs and N.B. Davies, eds. SinauerAssociates Sunderland, Massachusetts.
Evans, D.L. 1980. Vocalizations and territorialbehavior of wintering snowy owls. AmericanBirds 34:748-749.
Fuller, M.R. 1979. Spatiotemporal ecology of
four species of sympatric raptor species.Ph.D. Thesis, 220 p. University of
Minnesota
.
Fuller, M.R. , and G. Christenson. 1976. Anevaluation of techniques for capturingraptors in east-central Minnesota. RaptorResearch 10:9-19.
Fuller, M.R., and J. A. Mosher. 1981. Methods of
detecting and counting raptors: a review, p.
235-246. In C.J. Ralph and J.M. Scott, eds.
Estimating numbers of terrestrialbirds. Studies in Avian Biology No. 6.
630 p.
Hinde, R.A. 1956. The biological significance of
territories of birds. Ibis 98:340-369.
Keith, L.B. 1964. Territoriality among winteringsnowy owls. Canadian Field Naturalist78:17-24.
Kuechle, V.B., R.A. Reichle, R.J. Schuster, and
G.E. Duke. Telemetry of gastric motilitydata from owls. _In Proceedings of 9thinternational symposium on bio telemetry
.
International Society on Biotelemetry.University of Nijmegan, Department of
Physiology, Nijmegan, Netherlands.In press.
Marshall, J.T., Jr. 1939. Territorial behaviorof the flammulated screech owl.
Condor 41:71-78.
McGarigal, K. , and J.D. Fraser. 1985. Barred owl
responses to recorded vocalizations. Condor87:552-553.
Miller, L. 1930. The territorial concept in the
great-horned owl. Condor 32:290-291.
Morse, D.H. 1980. Behavioral mechanisms in
ecology. Harvard University Press,Cambridge, Massachusetts. 383 p.
Nicholls, T.H. 1973. Ecology of barred owls as
determined by an automatic radio-trackingsystem. Ph.D. Thesis, 163 p. University of
Minnesota
.
127
Nicholls, T.H. , and D.W. Warner. 1968. A harness
for attaching radio transmitters to largeowls. Bird Banding 39:204-214.
Nicholls, T.H., and D.W. Warner. 1972. Barredowl habitat use as determined by
radio-telemetry. Journal of WildlifeManagement 36:213-224.
Pierce, R.L. 1954. Vegetation cover types andland use history of the Cedar Creek NationalHistory Reservation, Anoka and IsantiCounties, Minnesota. M.S. Thesis, 137 p.
University of Minnesota.
Rongstad, 0. J. , and J.R. Tester. 1969. Movementsand habitat use of white-tailed deer inMinnesota. Journal of Wildlife Management33:366-379.
Southern, H.N. 1970. The natural control of apopulation of tawny owls. Journal ZoologicalLondon 162:197-285.
Southern, H.N., and V.P.W. Lowe. 1968. Thepattern of distribution of prey and predationin tawny owl territories. Journal of Ecology37:75-97
Wittenberger , J.F. 1981. Animal socialbehavior. Duxbury Press, Boston. 722 p.
128
Barred Owls and Nest Boxes — Results of aFive-Year Study in Minnesota 1
David H. Johnson 2
Abstract. Thirty—six nest boxes weremonitored 5 years to evaluate Barred Owl (Strixvaria ) nesting biology, habitat characteristics,and box design and placement. Boxes were erectedin 1981 and 1982, and were placed at least 1.8 kmapart in various forest habitats. Fourteen boxesused by owls for 1—3 seasons produced 22 nestings(1£.4% overall nest box use), with 86* of nestingattempts successful. Predominant nesting useoccured in the northern hardwood forest type.Habitat evaluation surrounding the 14 active boxesand 10 additional nest sites (8 natural cavities,2 nest boxes) included 0.04 ha and 314 ha circularplots. Recommendations include using a toplessnest box or one with a side entrance hole of >_ 18cm diameter. Box placement should avoid raccoon(Procvon lotor ) travelways, be 7 m above ground,and allow easy in-flight access.
INTRODUCTION
The Barred Owl is a close relativeof the European Tawny Owl (Sj_ aluco ) andUral Owl (S^ uralensis ) . and the NorthAmerican Spotted Owl (S^. occidental is )
As such, some similar natural historycharacteristics should apply betweenthese species. Like Tawny and Ural owls,Barred Owls have been found to nest inartificial nest cavities (Rubey 1927,Johnson 1980, Snyder and Drazkowski 1981,Follen 1982, Johnson and Follen 1984).The availability of suitable nest sitesis reported to be a limiting factor forcavity nesting species (Thomas et al.1979). Current forest managementdirectives promote short rotations andintensive culture, which reduce thenumbers of existing or potential nestsites. The Barred Owl is a relativelycommon owl in Minnesota, and has recentlybeen viewed as an ecological indicatorspecies for the management of mature/old
Paper presented at the symposium,Biology and Conservation of NorthernForest Owls, Feb. 3-7, 1987, Winnipeg,Manitoba. USDA Forest Service GeneralTechnical Report RM-142.
permanent address: RR 6 Box 410,Mankato, MN 56001.
growth forests. This study was conductedas part of an overall research effortinto Barred Owl ecology in the state.Herein I provide information on nestboxes, their use by owls and otherwildlife, and an overview of habitatconditions surrounding used nest sites.
STUDY AREA AND METHODS
The study area involved Hubbard,Becker, Cass, and Crow Wing counties innorth—central Minnesota (1,336,600 ha).This area lies primarily at 47 degreesNorth latitude, averages 64 cm ofprecipitation annually, and has a 125 daygrowing season. Snow covers the groundan average of 130 days per winter. Theterrain is typically level to slightlyrolling. Water is relatively abundantwith around 2000 lakes and riverstotaling approximately 200,000 ha (15*total land area). Forests in this regioncover some 796,000 ha (60% total landarea) (Jakes 1980) and consist primarilyof 50 to 80 year old mixed and purestands of aspen ( Populus spp. ) , oak( Quercus spp.), maple (Acer spp.),basswood (Ti 1 ia amer icana ) , paper birch( Bet u 1 a papyr i fera ) , elm (Ulmus spp. ),
black ash (Fraxirms nigra ) , and jack pine( Pinus banksiana ) . Widespread logging andslash burning during the late 1800' s and
129
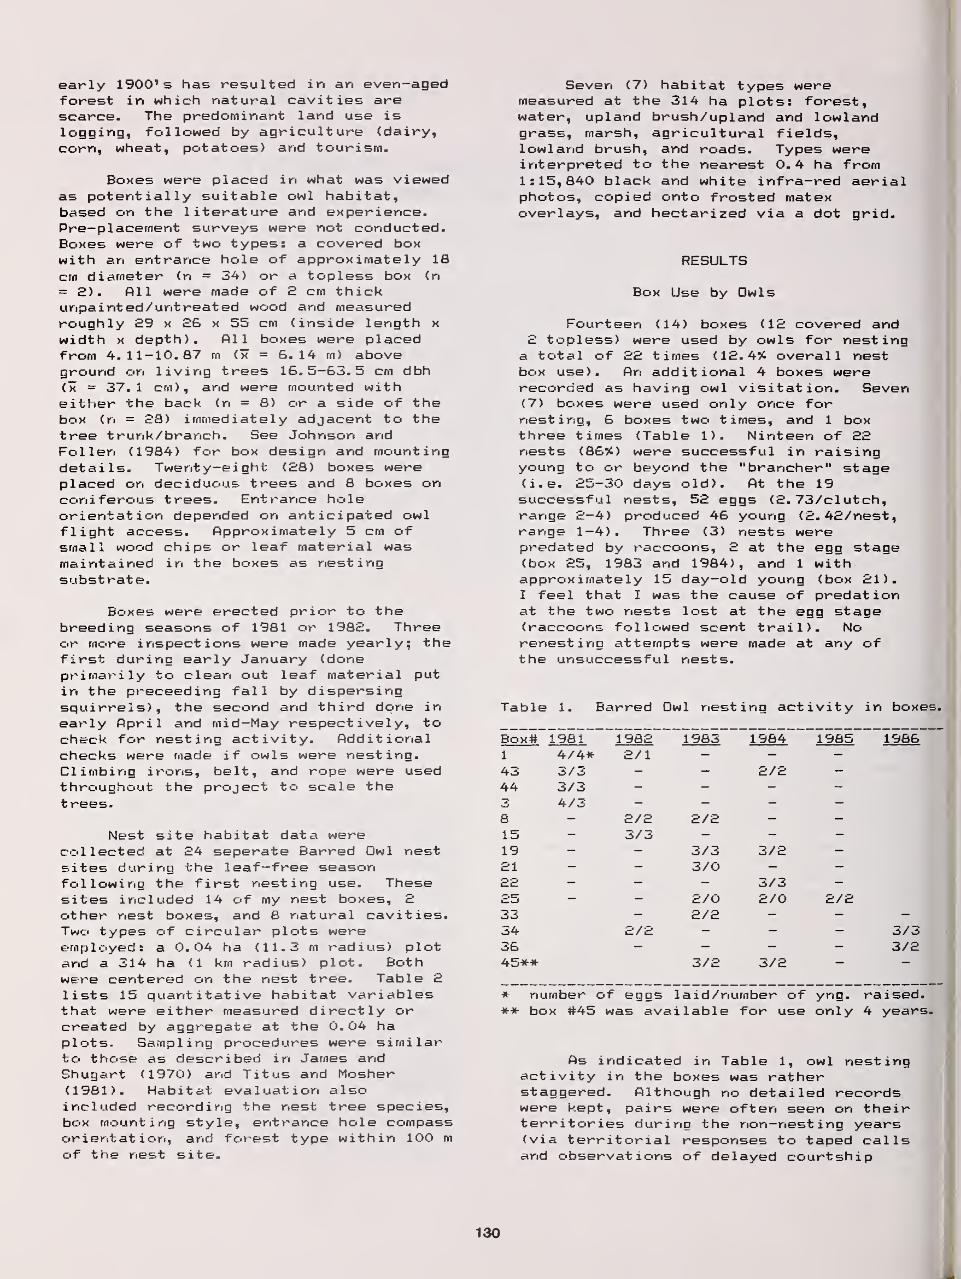
early 1900' s has resulted in an even-agedforest in which natural cavities arescarce. The predominant land use islogging, followed by agriculture (dairy,corn, wheat, potatoes) and tourism.
Boxes were placed in what was viewedas potentially suitable owl habitat,based on the literature and experience.Pre—placement surveys were not conducted.Boxes were of two types: a covered boxwith an entrance hole of approximately 18cm diameter (n = 34) or a topless box <n=2). Oil were made of £ cm thickunpainted/untreated wood and measuredroughly £9 x £6 x 55 cm (inside length x
width x depth). All boxes were placedfrom 4.11-10.87 m (x = S. 14 m) aboveground on living trees 16.5—63.5 cm dbh(x = 37. 1 cm), and were mounted witheither the back (n = 8) or a side of thebox (n = £8) immediately adjacent to thetree trunk/branch. See Johnson andFoil en (1984) for box design and mountingdetails. Twenty—eight (£8) boxes wereplaced on deciduous trees and 8 boxes onconiferous trees. Entrance holeorientation depended on anticipated owlflight access. Approximately 5 cm ofsmall wood chips or leaf material wasmaintained in the boxes as nestingsubstrate.
Boxes were erected prior to thebreeding seasons of 1981 or 198£. Threeor more inspections were made yearly; thefirst during early January (doneprimarily to clean out leaf material putin the preceeding fall by dispersingsquirrels), the second and third done inearly April and mid—May respectively, tocheck for nesting activity. Additionalchecks were made if owls were nesting.Climbing irons, belt, and rope were usedthroughout the project to scale thetrees.
Nest site habitat data werecollected at £4 seperate Barred Owl nestsites during the leaf—free seasonfollowing the first nesting use. Thesesites included 14 of my nest boxes, £other nest boxes, and 8 natural cavities.Two types of circular plots wereemployed: a 0.04 ha (11.3 m radius) plotand a 314 ha (1 km radius) plot. Bothwere centered on the nest tree. Table £lists 15 quantitative habitat variablesthat were either measured directly orcreated by aggregate at the 0. 04 haplots. Sampling procedures were similarto those as described in James andShugart (1970) and Titus and Mosher(1981). Habitat evaluation alsoincluded recording the nest tree species,box mounting style, entr^snce hole compassorientation, and forest type within 100 mof the nest site.
Seven (7) habitat types weremeasured at the 314 ha plots: forest,water, upland brush/upland and lowlandgrass, marsh, agricultural fields,lowland brush, and roads. Types wereinterpreted to the nearest 0.4 ha from1:15,840 black and white infra—red aerialphotos, copied onto frosted matexoverlays, and hectarized via a dot grid.
RESULTS
Box Use by Owls
Fourteen (14) boxes (1£ covered and£ topless) were used by owls for nesting
a total of ££ times (1£. 4% overall nestbox use). An additional 4 boxes wererecorded as having owl visitation. Seven(7) boxes were used only once fornesting, 6 boxes two times, and 1 boxthree times (Table 1). Ninteen of ££nests (86*) were successful in raisingyoung to or beyond the " brancher" stage(i.e. £5-30 days old). At the 19successful nests, 5£ eggs (£. 73/clutch,range £-4) produced 46 young (£. 4£/nest,range 1—4). Three (3) nests werepredated by raccoons, £ at the egg stage(box £5, 1983 and 1984), and 1 withapproximately 15 day—old young (box £1).I feel that I was the cause of predationat the two nests lost at the egg stage(raccoons followed scent trail). Norenesting attempts were made at any ofthe unsuccessful nests.
Table 1. Barred wl nesting activity in boxes.
Box# 1981 198£ 1983 1964 1985 19661 4/4* £/l43 3/3 £/£44 3/3
4/38 £/£ £/£15 3/319 3/3 3/££1 3/0££ 3/3£5 £/0 £/0 £/£33 £/£34 £/£ 3/336 3/£45** 3/£ 3/£
* number of eggs laid/number of yng. raised.** box #45 was available for use only 4 years.
As indicated in Table 1, owl nestingactivity in the boxes was ratherstaggered. Although no detailed recordswere kept, pairs were often seen on theirterritories during the non-nesting years(via territorial responses to taped callsand observations of delayed courtship
130
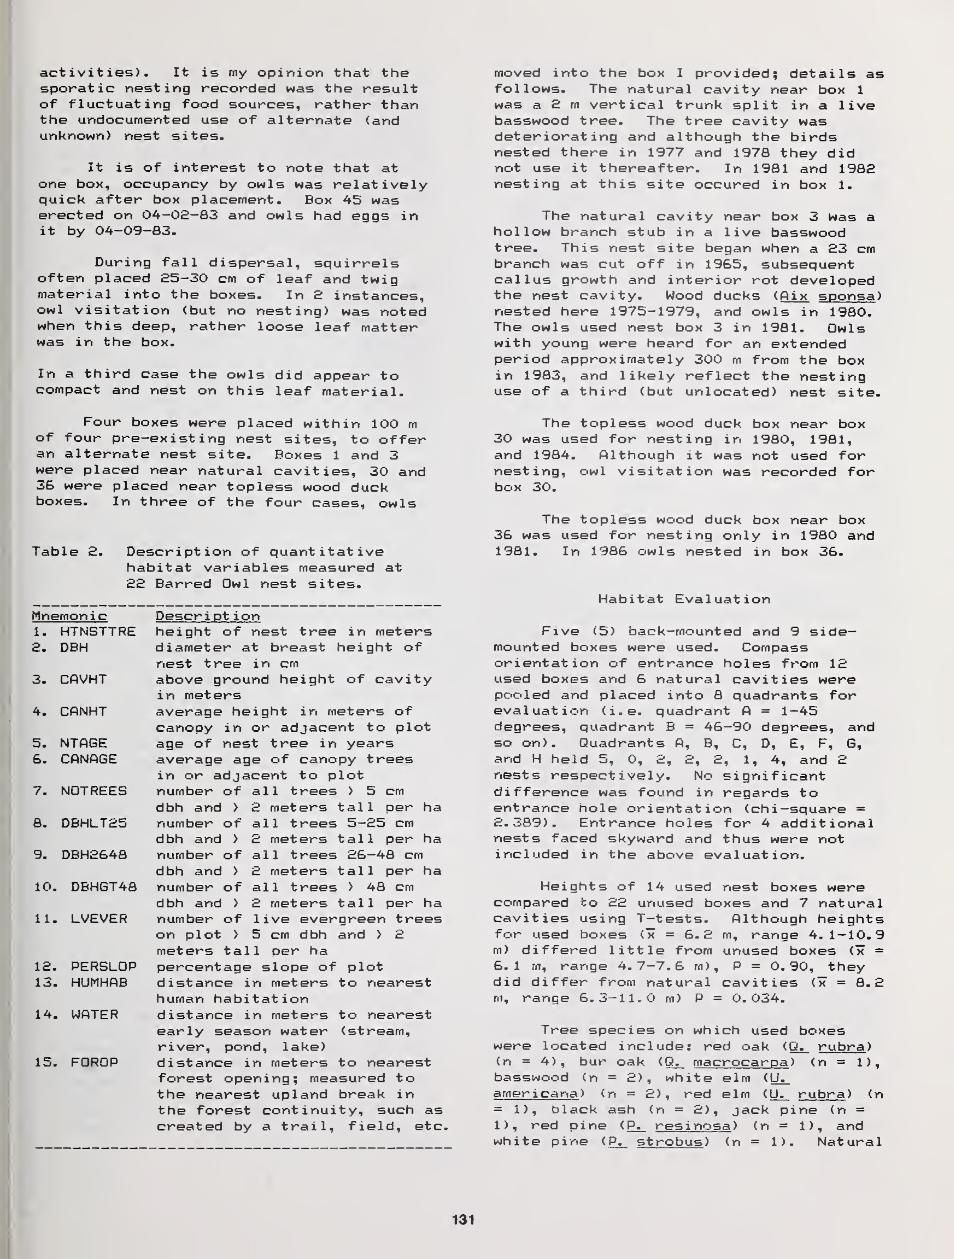
activities). It is my opinion that thesporatic nesting recorded was the resultof fluctuating food sources, rather thanthe undocumented use of alternate (andunknown) nest sites.
It is of interest to note that atone box, occupancy by owls was relativelyquick after box placement. Box 45 waserected on 04-0£-83 and owls had eggs init by 04-09-83.
During fall dispersal, squirrelsoften placed £5-30 cm of leaf and twigmaterial into the boxes. In £ instances,owl visitation (but no nesting) was notedwhen this deep, rather loose leaf matterwas in the box.
In a third case the owls did appear tocompact and nest on this leaf material.
Four boxes were placed within 100 mof four pre-existing nest sites, to offeran alternate nest site. Boxes 1 and 3were placed near natural cavities, 30 and36 were placed near topless wood duckboxes. In three of the four cases, owls
Table £. Description of quantitativehabitat variables measured at££ Barred Owl nest sites.
Mnemonic1. HTNSTTRE£. DBH
3. CAVHT
4. CANHT
5. NTAGE6. CANAGE
7. N0TREES
8. DBHLT£5
9. DBH£648
10. DBHGT48
11. LVEVER
1£. PERSL0P13. HUMHAB
14. WATER
15. F0R0P
Descri pt ionheight of nest tree in metersdiameter at breast height ofnest tree in cmabove ground height of cavityin metersaverage height in meters ofcanopy in or adjacent to plotage of nest tree in yearsaverage age of canopy treesin or adjacent to plotnumber of all trees > 5 cmdbh and > £ meters tall per hanumber of all trees 5—£5 cmdbh and ) £ meters tall per hanumber of all trees £6—48 cmdbh and > £ meters tall per hanumber of all trees > 48 cmdbh and > £ meters tall per hanumber of live evergreen treeson plot > 5 cm dbh and > £meters tall per hapercentage slope of plotdistance in meters to nearesthuman habitationdistance in meters to nearestearly season water (stream,river, pond, lake)distance in meters to nearestforest opening; measured tothe nearest upland break inthe forest continuity, such ascreated by a trail, field, etc.
moved into the box I provided; details asfollows. The natural cavity near box 1
was a 2 m vertical trunk split in a livebasswood tree. The tree cavity wasdeteriorating and although the birdsnested there in 1977 and 1978 they didnot use it thereafter. In 1981 and 198£nesting at this site occured in box 1.
The natural cavity near box 3 Was ahollow branch stub in a live basswoodtree. This nest site began when a £3 cmbranch was cut off in 1965, subsequentcallus growth and interior rot developedthe nest cavity. Wood ducks (Aix sponsa )
nested here 1975-1979, and owls in 1980.The owls used nest box 3 in 1981. Owlswith young were heard for an extendedperiod approximately 300 m from the boxin 1983, and likely reflect the nestinguse of a third (but unlocated) nest site.
The topless wood duck box near box30 was used for nesting in 1980, 1981,and 1984. Although it was not used fornesting, owl visitation was recorded forbox 30.
The topless wood duck box near box36 was used for nesting only in 1980 and1981. In 1986 owls nested in box 36.
Habitat Evaluation
Five (5) back-mounted and 9 side-mounted boxes were used. Compassorientation of srxtrance holes from 1£used boxes and 6 natural cavities werepooled and placed into 8 quadrants forevaluation (i.e. quadrant A = 1—45degrees, quadrant B = 46—90 degrees, andso on). Quadrants A, B, C, D, E, F, G,and H held 5, 0, £, £, £, 1, 4, and £nests respectively. No significantdifference was found in regards toentrance hole orientation (chi—square =£.389). Entrance holes for 4 additionalnests faced skyward and thus were notincluded in the above evaluation.
Heights of 14 used nest boxes werecompared to ££ unused boxes and 7 naturalcavities using T-tests. Although heightsfor used boxes <x = 6. £ m, range 4. 1— 10.
9
m) differed little from unused boxes ("x =6.1 m, range 4.7-7.6 m) , P = 0.90, theydid differ from natural cavities (x* = 8. £rn, range 6.3—11.0 m) P = 0.034.
Tree species on which used boxeswere located include: red oak (Q;_ rubra )
(n = 4), bur oak (Q^ macrocarpa ) (n = 1),basswood (n = £) , white elm ( U.aimericana ) in = £) , red elm ( U. rubra ) (n= 1), black ash (n = £) , jack pine (n =1), red pine (P^_ resinosa ) (n = 1), andwhite pine (P;_ strobus ) (n = 1). Natural
131

Table 3. Means, standard deviations, andranges of habitat variables for22 Barred Owl nests.
variable X. SD ranaeHTNSTTRE 17. c 3. a Q •* OCT f\
DBH 43. 4 15. 5 4 r ec art etlb. 3-BO.
D
CRvHT r -J c. 1 3. *f— 1 1 . UPAkILIT
1 /. O —y v->
O. C Id. o-c3. UNTAGE r~\ 4 —7
§Fl» / J7. 1 47-cOOLHNHbt OO. 1 13. 1
NOTREES 670.5 302. 2 100.0-1150.0DBHLT25 536. 4 2S1 . 9 75. 0—975.
0
DBH2648 119.3 60.2 0. 0-250.
O
DBHGT48 14. a 16. 7 0. 0-50.
0
LvhvtK 34. 1 68.0 O. 0-300.
O
PERSLOP 6. 5 5. 9 0. 0-20.
0
HUMHAB 762. 0 840. 7 12. 5-2667.
O
WATER 122. 3 189. 5 0. 0-612.6FOROP 47. 3 55. 2 0. 0-198.
1
Table 4. Forest types within 100 m of24 Barred Owl nests.
forest tvpe #nests %northern hardwoods 15* 62. 5lowland hardwoods 4** 16.7aspen/ birch 3 12.5oak 1 4.2jack pine 1 4.2
* includes 6 natural cavity nests** includes 2 natural cavity nests
Table 5. Habitat characteristics withina 314 ha <1 km radius) circularplot at 24 Barred Owl nests.
habitat x ha SD ranae %forest 211. 0 47.9 146.0-296. 4 67.
2
water SO. 2 43. 1 0. 0- 130.4 16.
0
ub/ug/lg 29. 5 17.2 0.0-51.6 9.4marsh 12.5 14.0 O.O- 55. 6 4. 0ag 5. a 12.4 0.0-50.4 1.9lb 3. 0 7. 2 0. 0- 28. 8 0. 9road 2. O 2. 2 0. 0-5.6 0.6
cavity nests were located in basswood (n= 3), red elm (n = 2), white elm (n = 1),yellow birch (B^ al leghaniensis ) (n = 1),and sugar maple (Gl_ saccharum ) (n = 1).
The 0.04 ha and 314 ha circular plotdata were taken at 22 and 24 nests,respectively <2 sites were lost tologging before the 0. 04 ha plot data weretaken). Table 3 lists the means,standard deviations, and ranges of the 15variables taken at the 0.04 ha plots.The forest types that nest sites werelocated in are listed in Table 4. Datafrom the 314 ha circular plots are shownin Table 5. It is important to note that
while the 314 ha plots do not representthe actual habitat utilized by aterritorial Barred Owl pair, they canoffer something in the way of generalhabitat assessments. I did not compareused sites against unused sites becauseI was not able to prove that there werein fact no owls present in areassurrounding the unused sites.
BOX USE BY OTHER WILDLIFE
Detailed not es record ing otherspecies use were available on 26 boxes(Table 6), with raccoon and squirrel (3species) activity predominating. Boxeswere used as nest sites by raccoon,squirrel (3 species), wood duck, hoodedmerganser (Lophodytes cucul lat us ) , andvespid wasps (Hymenoptera . subfamilyVespinae ) During fall dispersal,squirrels often placed 25—30 cm of leafand twig material into the boxes. It wasnot uncommon to find red or flyingsquirrels in boxes containing nests madeby gray squirrels. Four dead graysquirrels and 1 dead raccoon were foundin boxes during January inspections(natural mortalities). Fifty—two percent(52%) of the boxes required annualcleaning; 90S required cleaning at sometime or another during the project.
Table 6. Box use by other wildlife.
species boxes used visitsGray Squirrel
(Sciurus carol inensis) 18 31Red Squirrel
(Tamiasciurus hudsonicus) 6 9Northern Flying Squirrel
(Glaucomys sabrinus) 6 10Raccoon 14 18Porcupine
(Erethizon dorsatum) 2 4Wood Duck 4 5Hooded Merganser 2 2Northern F 1 icker
(Colaptes auratus) 1 1
Vespid Wasp 4 4
DISCUSSION
Data collected during this studyreveal that Barred Owls will readilyutilize artificial nest boxes, and arewilling to tolerate differences in boxdesigns, mounting styles, cavity heights,entrance hole orientation, tree species,tree diameters, tree density, and generalhabitat features. This should come as nosurprise when we understand their needfor the limited supply of suitable nestsites - at least in this study area theysimply have little choice.
132
Nest boxes are a viable tool "For
researching various aspects of Barred Owlecology- While Barred Owls may funtionas mature/old growth forest indicatorspecies, the sporatic nesting that wasshown in this study suggests that apopulation monitoring system based on theuse of boxes would be inappropriate.Preferred monitoring options may includea taped call/playback response census and/or a system of monitoring the overallmature/old growth forest habitatcomponent.
We have traditionally associatedBarred Owls with large tracts of maturelowland hardwoods, such as those foundalong riverine systems. Nicholls (1973)found 9 radioed Barred Owls to prefer oakand mixed hardwood—conifer habitats ineast—central Minnesota. Home rangesaveraged ££6 ha (range B5—365 ha) insize. In this study, nesting activityoccured predominately in the northernhardwood type, followed by the lowlandhardwood, aspen/birch, oak, and jack pinetypes. Forest types averaged 65 yearsold and covered £11 ha (67. £*) of the 314ha plots. The types were basicallyhomogenous, with very few recent canopydisturbances (e.g. logging operations).While our assertion of owls associatedwith the lowland hardwood type is notincorrect, we perhaps have overlooked theadditional habitat provided by the maturenorthern hardwood, oak, and mixedhardwood—con i fer forest types. The owls'use of these types may be a recentcondition in Minnesota however, as thesematuring types may only now be providingthe adequate hunting and nesting areasrequired by this species. Additionalhome range/habitat evaluation studiesemploying rad io—telemetry are suggested.
For those interested in putting upBarred Owl boxes I recommend thefol lowing
:
1. Use £.5 cm thick untreated/unpaint edwood for box material. A 30 x 30 x 50cm box is adequate. No wire mesh"ladder" is needed inside. Eight orso drain holes should be drilledthrough the box bottom.
£. Covered boxes should have an entrancehole >_ 18 cm.
3. Topless boxes can be 30 x 30 x 40 cm.Rain and snow did not appear to be aproblem for the owls, but access intothe 50 cm deep boxes did.
4. Boxes should be placed 7—6 m aboveground in a long-lived tree. Treescan be any species and any dbh, butthose that provide a 30 m clear flightpath to the box (few low limbs orother obstructing vegetation) aredesirable.
6. Boxes should be placed in tracts ofmature northern hardwoods, lowlandhardwoods, or mixed hardwood—con i fers(£50 ha or larger) in association withwater (lakes, ponds, streams, rivers)and openings (upland grass/brush andlowland grass). Some aerial photointerpretation work here will bebeneficial in selecting potential boxsites. ftvoid areas of known GreatHorned Owl (Bubo virqinianus ) or Red-tailed Hawk (Buteo lamaicensis )
act i vity.7. To minimize human, corvid, and raccoon
encounters with owls, boxes should notbe placed within 100 m of a house,field, lake, stream, or road edge, butrather in the forest interior.
8. Nest trees should be spiked forclimbing, and wrapped with a 0. 7 mwide piece of light metal sheeting(to minimize raccoon predation).
9. Boxes should be cleaned prior to thenesting season, leaving only 5—7 cmof nesting substrate in the box.
ftKNOWLEDGEMENTS
I sincerely thank Catherine M.
Fouchi, Douglas C. Keran, Mark D. Nelson,Jon Carter, Tony Carter, Conrad Schmidt,Bob Bachman, Paul Bunyan Arboretumpersonnel, and the Mantrap ValleyConservation Club for their assistance invarious portions of this project.
LITERATURE CITED
Follen, D. G. , Sr. 198£. The barreds ofthe big house. Passenger Pigeon44(1) :£0, ££.
Jakes, P. J. 1980. Minnesota foreststatistics, 1977. USDA ForestService Resource Bulletin NC—53.North Central Forest ExperimentStation, St. Paul, Minnesota. 85 p.
James, F. C. , and H. H. Shugart, Jr. 1970.A quantitative method of habitatdescription. Audubon Field Notes£4 : 7£7-736.
Johnson, D. H. 1980. Barred Owls use nestbox. Loon 5£ (4) : 193-194.and D. G. Follen, Sr. 1984. Barred
Owls and nest boxes. Raptor Research18(1) : 34-35.
Nicholls, T. H. 197£. Barred Owl habitatuse as determined by rad iotelemet ry.Journal of Wildlife Management36(£) :£13-££4.
Rubey, W. W. 19£7. Barred Owls nesting inbox near Washington, D. C. Bird—Lore£9:408-409.
Snyder, B. , and B. Drazkowski. 1981.(newsletter). Hiawatha Valley BirdNotes 18(7) :£.
133

Thomas, J. W. , R. J. Anderson, C. Maser,and E. L. Bull. 1979. Snags. In:J.W. Thomas (ed. ). Wildlife habitatsin managed forests—the BlueMountains of Oregon and Washington.USDA Handbook 553. 511 p.
Titus, K. , and J. A. Mosher. 1981. Nestsite habitat selected by woodlandhawks in the central Appalachians.Auk 98 < 2) :£70-£81.
134
Distribution, Density, and Habitat Relationships of
the Barred Owl in Northern New Jersey 1
Thomas Bosakowski,2 Robert Speiser,3
and John Benzinger4
Abstract. — Barred Owls (Slrix varia) were surveyed in northern
New Jersey during a four-year period (1983-86) using vocal imit-
ations (85.5%). tape-recorded calls (8.0%), or non-vocal contacts
(6.5%). A total of 62 different locations (territories) were found
with a pair responding at 56.5% of locations. Of these locations,
34 were found in an intensive study area (468 sq km) which wassystematically searched during the study period. Within this area,
one tract of prime habitat (120 sq km) was systematically searched
during a single breeding season (1986) and contained 17 locations
(0.142 pairs/sq km). The northern half (60 sq km) of this tract
contained most of the owl locations (12) and was almost complete
wilderness while the southern half contained several suburban hous-
ing developments, a major 4-lane highway, and less stands composedof eastern hemlock (Tsuga canadensis). Barred Owl habitat was
classified visually along 6 different habitat gradients at 36 locations
and was compared statistically (Fisher Exact Test) to the habitat at
29 Eastern Screech-Owl (Otus asio) and 22 Great Horned Owl {Bubo
virginianus) locations. Habitat analysis indicated that Barred Owlsshowed the most preference for mature timber stands, mixed
hemlock-hardwood forest, swamps, and proximity to water sources.
Barred Owls showed the least preference with regard to areas of
extensive forest clearings and proximity to human habitation. Habitat
management suggestions are presented based on these findings and the
literature. Most critical to Barred Owl success thus far are considered
the presence of large remote forest preserves with an abundance of
freshwater wetlands and mature timber.
INTRODUCTION
The Barred Owl (Strix varia) was listed as a threatened species in
New Jersey in 1974 (N.J. Dept. Environmental Protection. Non-
game and Endangered Species Project) and has been selected as a
management indicator species in some southern Appalachian nat-
ional forests (Title 36, U.S. Code of Federal Regulations, Sec.
219.19). Given the lack of long-term population surveys of the
Barred Owl, however, it is difficult to assess the true status of
this owl within its wide range. Simultaneous with this study,
Sutton and Sutton (1985) surveyed Barred Owls in southern NewJersey in the coastal plain physiographic province, an ecological
subdivision not found in northern New Jersey. They concluded that
numbers of Barred Owls were "considerably higher than published
accounts intimate" and provided some anecdotal evidence that the
population has been increasing in recent decades. In northern NewJersey, the distribution and ecology of the Barred Owl population
is not well known, most accounts referring to small localized pop-
ulations (Stearns 1947, Gutmore 1977. Kane et al. 1985). The pur-
Paper presented at the symposium. Biology and Conservation
of Northern Forest Owls. Feb. 3-7, 1987. Winnipeg. Manitoba.
USDA Forest Service General Technical Report RM-142.
2Thomas Bosakowski is a Zoology doctoral student at Rutgers
University, Newark. N.J. and Associate Scientist of Toxicology
and Pathology, Roche Research Center, Nutley. N.J.
pose of our investigation was to explain the distribution of Barred
Owls in northern New Jersey by quantitatively investigating what
factors favor or hinder successful inhabitation. In identifying
such factors, valuable management insight for maintaining or improv-
ing the status of Barred Owls throughout their range might be
realized.
STUDY AREA
Northern New Jersey was selected as the study region: it contains
three of the four physiographic provinces of New Jersey (Fig. 1).
The Piedmont is a relatively flat, low elevation zone of clay and
sandstone composition. This region is the most heavily urbanized
region in northern New Jersey; some rural areas and parks occur
toward its southern end. Forest growth is primarily oak (Quercus
spp.) and other hardwoods. This region is abutted to the west by
the Highlands, a belt of granitic rolling hills with an average elev-
ation of about 300 m. This region is sparsely populated with small
villages and towns, but in general, it is heavily forested. While
oak predominates much of the region (Beull 1966. Russell 1981),
eastern hemlock (Tsuga canadensis) and the northern hardwoods
Birch-Beech-Maple (Betula alleghaniensis - Fagus grandifolia - Acer
saccharuni) thrive along ravines, water courses, and plateaus where
richer, deeper soils and moisture have accumulated. The Kittatinny
Valley extends along the western base of the Highlands and is an
area of extensive agriculture, dotted with small rural villages.
136
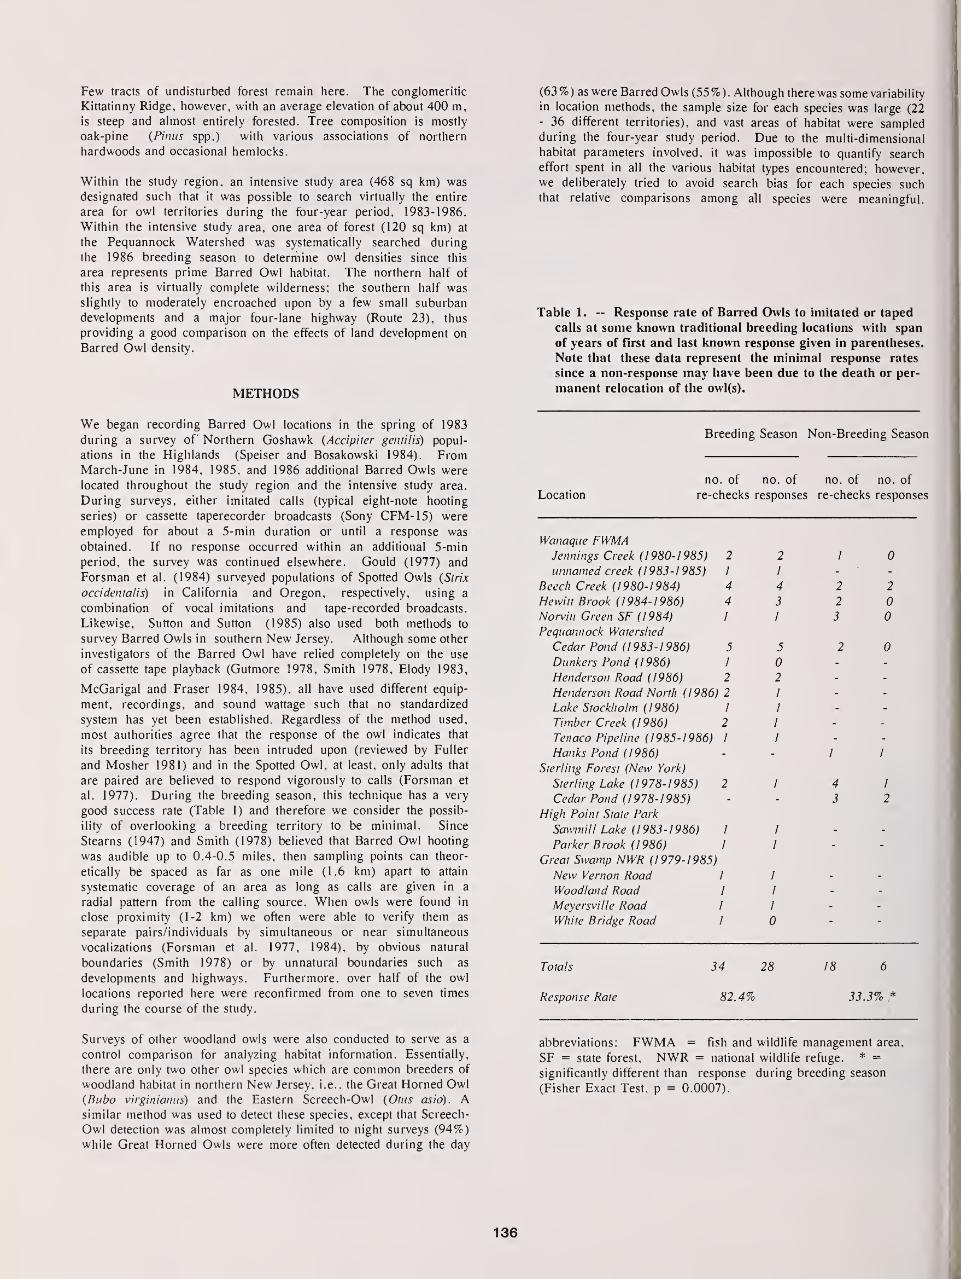
Few tracts of undisturbed forest remain here. The conglomeritic
Kittatinny Ridge, however, with an average elevation of about 400 m,
is steep and almost entirely forested. Tree composition is mostly
oak-pine (Pinus spp.) with various associations of northern
hardwoods and occasional hemlocks.
Within the study region, an intensive study area (468 sq km) was
designated such that it was possible to search virtually the entire
area for owl territories during the four-year period, 1983-1986.
Within the intensive study area, one area of forest (120 sq km) at
the Pequannock Watershed was systematically searched during
the 1986 breeding season to determine owl densities since this
area represents prime Barred Owl habitat. The northern half of
this area is virtually complete wilderness; the southern half was
slightly to moderately encroached upon by a few small suburban
developments and a major four-lane highway (Route 23), thus
providing a good comparison on the effects of land development on
Barred Owl density.
METHODS
(63%) as were Barred Owls (55%). Although there was some variability
in location methods, the sample size for each species was large (22- 36 different territories), and vast areas of habitat were sampledduring the four-year study period. Due to the multi-dimensional
habitat parameters involved, it was impossible to quantify search
effort spent in all the various habitat types encountered; however,
we deliberately tried to avoid search bias for each species suchthat relative comparisons among all species were meaningful.
Table 1. — Response rate of Barred Owls to imitated or taped
calls at some known traditional breeding locations with span
of years of first and last known response given in parentheses.
Note that these data represent the minimal response rates
since a non-response may have been due to the death or per-
manent relocation of the owl(s).
We began recording Barred Owl locations in the spring of 1983
during a survey of Northern Goshawk (Accipiter gentilis) popul-
ations in the Highlands (Speiser and Bosakowski 1984). FromMarch-June in 1984, 1985, and 1986 additional Barred Owls were
located throughout the study region and the intensive study area.
During surveys, either imitated calls (typical eight-note hooting
series) or cassette taperecorder broadcasts (Sony CFM-15) were
employed for about a 5-min duration or until a response was
obtained. If no response occurred within an additional 5-min
period, the survey was continued elsewhere. Gould (1977) and
Forsman et al. (1984) surveyed populations of Spotted Owls (Strix
occidental is) in California and Oregon, respectively, using a
combination of vocal imitations and tape-recorded broadcasts.
Likewise, Sutton and Sutton (1985) also used both methods to
survey Barred Owls in southern New Jersey. Although some other
investigators of the Barred Owl have relied completely on the use
of cassette tape playback (Gutmore 1978, Smith 1978, Elody 1983,
McGarigal and Fraser 1984, 1985). all have used different equip-
ment, recordings, and sound wattage such that no standardized
system has yet been established. Regardless of the method used,
most authorities agree that the response of the owl indicates that
its breeding territory has been intruded upon (reviewed by Fuller
and Mosher 1981) and in the Spotted Owl, at least, only adults that
are paired are believed to respond vigorously to calls (Forsman et
al. 1977). During the breeding season, this technique has a very
good success rate (Table 1) and therefore we consider the possib-
ility of overlooking a breeding territory to be minimal. Since
Stearns (1947) and Smith (1978) believed that Barred Owl hooting
was audible up to 0.4-0.5 miles, then sampling points can theor-
etically be spaced as far as one mile (1.6 km) apart to attain
systematic coverage of an area as long as calls are given in a
radial pattern from the calling source. When owls were found in
close proximity (1-2 km) we often were able to verify them as
separate pairs/individuals by simultaneous or near simultaneous
vocalizations (Forsman et al. 1977, 1984), by obvious natural
boundaries (Smith 1978) or by unnatural boundaries such as
developments and highways. Furthermore, over half of the owl
locations reported here were reconfirmed from one to seven times
during the course of the study.
Breeding Season Non-Breeding Season
no. of no. of no. of no. of
Location re-checks responses re-checks responses
Wanaque FWMAJennings Creek (1980-1985) 2 2 1 0
unnamed creek (1983-1985) 1 1
Beech Creek (1980-1984) 4 4 2 2
Hewitt Brook (1984-1986) 4 3 2 0
Norvin Green SF (1984) 1 1 3 0
Pequannock Watershed
Cedar Pond (1983-1986) 5 5 2 0
Dunkers Pond (1986) 1 0
Henderson Road (1986) 2 2
Henderson Road North (1986) 2 1
Lake Stockholm (1986) 1 I
Timber Creek (1986) 2 1
Tenaco Pipeline (1985-1986) 1 1
Hanks Pond (1986) 1 1
Sterling Forest (New York)
Sterling Lake (1978-1985) 2 1 4 1
Cedar Pond (1978-1985) 3 2
High Point State Park
Sawmill Lake (1983-1986) 1 1
Parker Brook (1986) 1 I
Great Swamp NWR (1979-1985)
New Vernon Road 1 1
Woodland Road 1 1
Meyersville Road 1 1
White Bridge Road 1 0
Totals 34 28 18 6
Response Rate 82.4% 33.3% *
Surveys of other woodland owls were also conducted to serve as a
control comparison for analyzing habitat information. Essentially,
there are only two other owl species which are common breeders of
woodland habitat in northern New Jersey, i.e.. the Great Horned Owl(Bubo virginianus) and the Eastern Screech-Owl (Otus asio). Asimilar method was used to detect these species, except that Screech-
Owl detection was almost completely limited to night surveys (94%)while Great Horned Owls were more often detected during the day
abbreviations: FWMA = fish and wildlife management area,
SF = state forest, NWR = national wildlife refuge. * =
significantly different than response during breeding season
(Fisher Exact Test, p = 0.0007).
136

Table 2. — Habitat classification system for northern NewJersey owl sightings. For each owl location, one selection
was made from each category which best described the hab-
itat within a 100 m radius of the point where the owl(s)
was first detected. If more than one choice was applicable,
then the two most prevalent types were selected, each
given a value of (0.5).
SUCCESSIONAL STAGE:1. young field - low herbaceous plant cover only.
2. old field - mixed herbaceous cover with up to 50% shrub cover.
3. shrubland - low thickly-growing woody-stemmed plants (shrubs)
covering over 50% of area.
4. young forest - saplings and poles mostly less than 15 cm in DBH.5. submature forest - moderate-aged stands mostly between 15-30 cm
in DBH.6. mature forest - oldest stands mostly over 30 cm in DBH (including
old-growth).
DOMINANT TIMBER TYPE:
1. Oak-Hardwood - (Quercus spp., Carya spp.. Fraxinus americana,
Acer rubrum. Betula lenta. Tilia americana, Liriodendron
tulipera, Primus serotina, Nyssa sylvatica).
2. Northern Hardwood - (Acer saccharum, Betula alleghaniensis,
Fagus grandifolia)
3. Hemlock - (Tsuga canadensis)
4. Pine - (Pinus strobus, P. resinosa, P. sylvestris, P. rigida)
5. Spruce - (Picea abies)
6. Cedar - (Chameacyparis thyoides. Thuja occidentalis, Juniperus
virginiana)
TOPOGRAPHICAL TYPE:
1. lakeshore - terrestrial community found on the edge of open bodies
of water.
2. marsh - inundated land with emergent herbaceous plants.
3. swamp - permanently flooded timber staitds. frequently containing
dead wood.
4. riverine - floodplain forest, alluvial basins, valleys, gorges.
5. upland - well-drained plateaus, ridges, upper slopes.
CLEARINGS (percent estimate, select only one)
1. none
2. trail/road represents only clearing
3. <10%4. 10-50%
5. 50-100%
DISTANCE TO WATER SOURCE and HUMAN HABITATION(select one choice for each of these hvo categories)
1. 0-100 m2. 100-500 m3. >500m
DBH = diameter at breast height.
transferred to a section of a road map (Travel Vision Map. General
Drafting Co., Convent Station, N.J.) to provide a general distr-
ibution map. Pellets found at a Barred Owl winter roost site were
examined quantitatively by counting the number of skulls and mand-
ibles (divided by 2) as described in Marti (1974).
RESULTS
Censusing
A total of 62 Barred Owl locations (territories) was recorded dur-
ing the study period 1983-1986 (Fig. 1): 53 with imitated calls,
5 with cassette tape broadcasts, 2 calling on own, and 2 visual
sightings. Barred Owl locations were intentionally found during the
breeding season (58) with only five locations found during non-
breeding months. At 35 locations (56.5%), the owl was joined by
its mate (total = 97 owls), although at a few single locations a
pair was known to be present before the study period. Apparently,
both owls will not always respond vocally, especially since the
female might be incubating or brooding young and may be reluctant
to call (Devereux and Mosher 1982). Furthermore, we noted that it
frequently required a longer period of continued owl broadcasts (5
to 15 min) to prompt the second owl (presumably the female) into
calling. Since our broadcasts were generally of shorter duration,
this may also help explain why more than one-third of the owls did
not show evidence of being paired adults. Similarly. Smith (1978)
found pair response at 64% of Barred Owl locations in New England.
In the Spotted Owl, Gould (1977) found pair response at only 34.5%of locations. Barred Owl response to calls was greatest during the
breeding season (Table 1) and showed no obvious dependence on
time (am or pm) or cloud cover. In addition, we also found that pair
responses were more frequent during the breeding season (Table 3)
and none occurred during winter.
Table 3. -- Seasonal variation in the frequency of paired
and single Barred Owl responses (data includes rep-
eated trials at some locations).
single pai r
Jan 3 0
Feb 1 1
Mar 10 12Apr 16 16May 21 9
Jun 11 11Jul 4 2
Aug 0 1
Sep 2 0
Oct 2 1
Nov 1 0
Dec 4 0
All owl locations were plotted on detailed local or regional mapsand the habitat was classified according to the categories defined
in Table 2. In most cases, habitat classification was achieved
with visual estimates in the field: actual measurement was needed
only for a few borderline cases. All habitat classifications weremade by the first author to avoid interobserver variability (Lehner
1979). Only one habitat profile was made per owl territory; 26
Barred Owl territories were not quantified. The Fisher Exact Test
was used to test for differences in proportions (Zar 1974) between
the Barred Owl sample population and the two control species
(Great Horned Owl and Screech-Owl). Barred Owl locations were
Territorial Behavior
In most cases. Barred Owls responded vocally well before they
arrived to our calling site, but occasionally they flew-in silently
to investigate us. Even though we usually wore inconspicuous
clothing and tried to hide in available brush, most owls were shy
and would generally remain well hidden while calling. If they
caught a glimpse of us, they would usually flush and become silent
or call from a safer distance. Only on six occasions did they
137
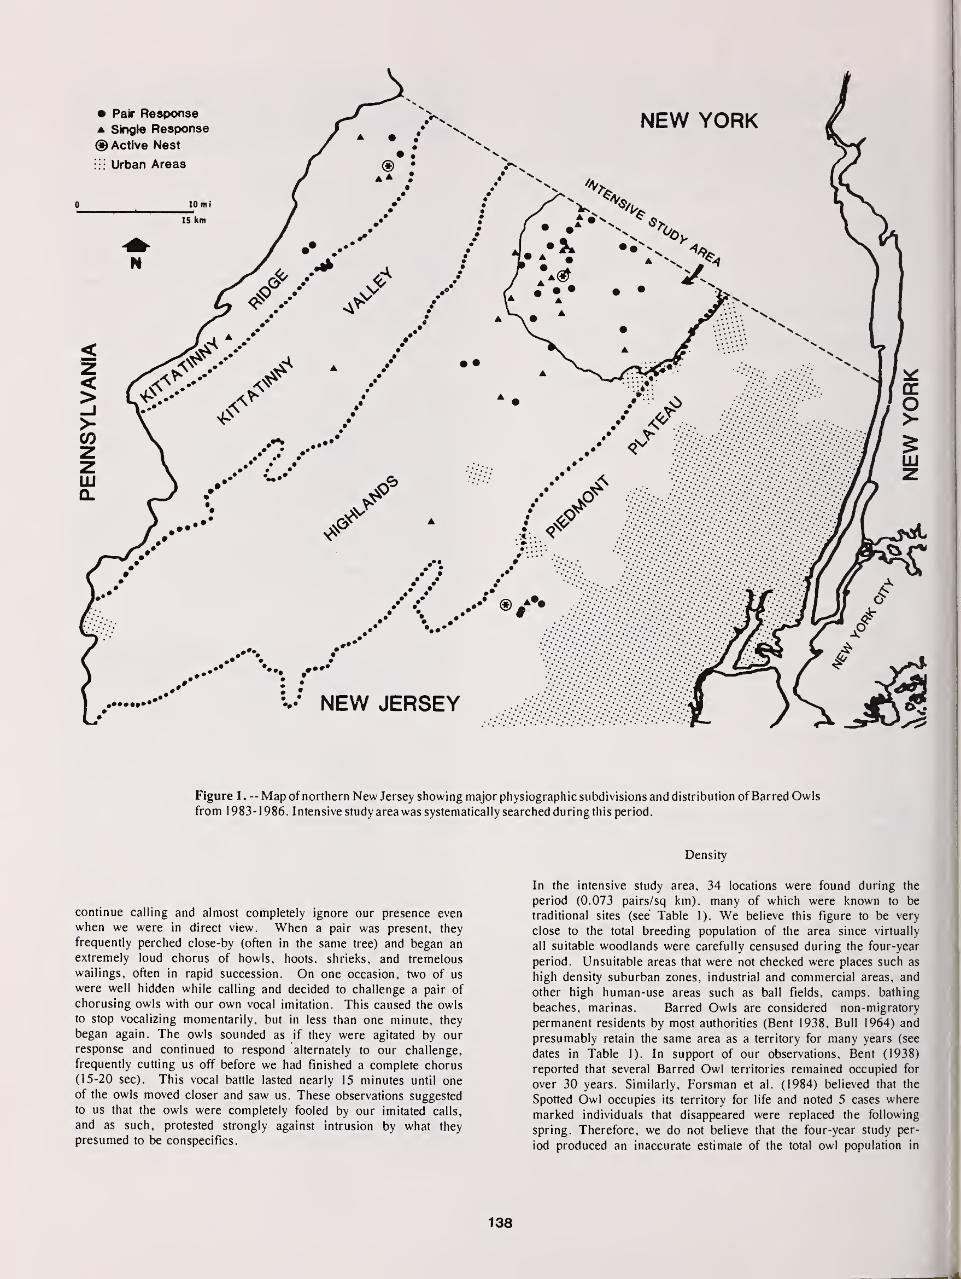
Figure 1 . — Map of northern New Jersey showing major physiographic subdivisions and distribution ofBarred Owlsfrom 1983- 1 986. Intensive study area was systematically searched during this period.
continue calling and almost completely ignore our presence even
when we were in direct view. When a pair was present, they
frequently perched close-by (often in the same tree) and began an
extremely loud chorus of howls, hoots, shrieks, and tremelous
wailings, often in rapid succession. On one occasion, two of us
were well hidden while calling and decided to challenge a pair of
chorusing owls with our own vocal imitation. This caused the owls
to stop vocalizing momentarily, but in less than one minute, they
began again. The owls sounded as if they were agitated by ourresponse and continued to respond alternately to our challenge,
frequently cutting us off before we had finished a complete chorus
(15-20 sec). This vocal battle lasted nearly 15 minutes until oneof the owls moved closer and saw us. These observations suggested
to us that the owls were completely fooled by our imitated calls,
and as such, protested strongly against intrusion by what they
presumed to be conspecifics.
Density
In the intensive study area, 34 locations were found during the
period (0.073 pairs/sq km), many of which were known to be
traditional sites (see Table 1). We believe this figure to be very
close to the total breeding population of the area since virtually
all suitable woodlands were carefully censused during the four-year
period. Unsuitable areas that were not checked were places such as
high density suburban zones, industrial and commercial areas, and
other high human-use areas such as ball fields, camps, bathing
beaches, marinas. Barred Owls are considered non-migratory
permanent residents by most authorities (Bent 1938, Bull 1964) and
presumably retain the same area as a territory for many years (see
dates in Table 1). In support of our observations. Bent (1938)
reported that several Barred Owl territories remained occupied for
over 30 years. Similarly, Forsman et al. (1984) believed that the
Spotted Owl occupies its territory for life and noted 5 cases where
marked individuals that disappeared were replaced the following
spring. Therefore, we do not believe that the four-year study per-
iod produced an inaccurate estimate of the total owl population in
138
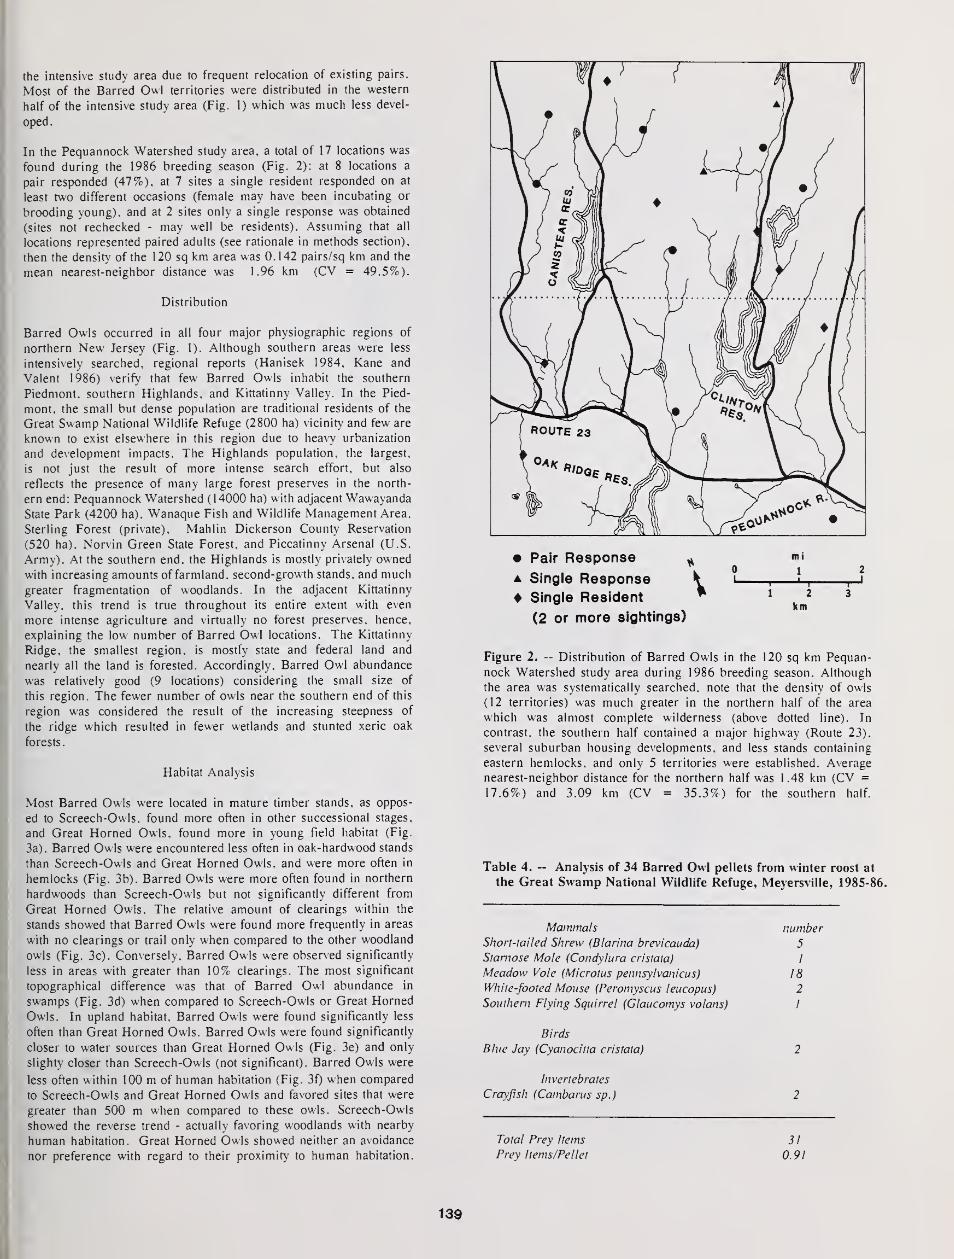
the intensive study area due to frequent relocation of existing pairs.
Most of the Barred Owl territories were distributed in the western
half of the intensive study area (Fig. 1) which was much less devel-
oped.
In the Pequannock Watershed study area, a total of 17 locations was
found during the 1986 breeding season (Fig. 2): at 8 locations a
pair responded (47%), at 7 sites a single resident responded on at
least two different occasions (female may have been incubating or
brooding young), and at 2 sites only a single response was obtained
(sites not rechecked - may well be residents). Assuming that all
locations represented paired adults (see rationale in methods section),
then the density of the 120 sq km area was 0. 142 pairs/sq km and the
mean nearest-neighbor distance was 1.96 km (CV = 49.5%).
Distribution
Barred Owls occurred in all four major physiographic regions of
northern New Jersey (Fig. 1). Although southern areas were less
intensively searched, regional reports (Hanisek 1984. Kane and
Valent 1986) verify that few Barred Owls inhabit the southern
Piedmont, southern Highlands, and Kittatinny Valley. In the Pied-
mont, the small but dense population are traditional residents of the
Great Swamp National Wildlife Refuge (2800 ha) vicinity and few are
known to exist elsewhere in this region due to heavy urbanization
and development impacts. The Highlands population, the largest,
is not just the result of more intense search effort, but also
reflects the presence of many large forest preserves in the north-
ern end: Pequannock Watershed (14000 ha) w ith adjacent Wawayanda
State Park (4200 ha). Wanaque Fish and Wildlife Management Area.
Sterling Forest (private). Mahlin Dickerson County7 Reservation
(520 ha). Norvin Green State Forest, and Piccatinny Arsenal (U.S.
Army). At the southern end. the Highlands is mostly privately owned
with increasing amounts of farmland, second-growth stands, and muchgreater fragmentation of woodlands. In the adjacent Kittatinny
Valley, this trend is true throughout its entire extent with even
more intense agriculture and virtually no forest preserves, hence,
explaining the low number of Barred Owl locations. The Kittatinny
Ridge, the smallest region, is mostly state and federal land and
nearly all the land is forested. Accordingly. Barred Owl abundance
was relatively good (9 locations) considering the small size of
this region. The fewer number of owls near the southern end of this
region was considered the result of the increasing steepness of
the ridge which resulted in fewer wetlands and stunted xeric oak
forests.
Habitat Analysis
Most Barred Owls were located in mature timber stands, as oppos-
ed to Screech-Owls. found more often in other successional stages,
and Great Horned Owls, found more in young field habitat (Fig.
3a). Barred Owls were encountered less often in oak-hardwood stands
than Screech-Owls and Great Horned Owls, and were more often in
hemlocks (Fig. 3b). Barred Owls were more often found in northern
hardwoods than Screech-Owls but not significantly different from
Great Horned Owls. The relative amount of clearings within the
stands showed that Barred Owls were found more frequently in areas
with no clearings or trail only when compared to the other woodland
owls (Fig. 3c). Conversely. Barred Owls were observed significantly
less in areas with greater than 10% clearings. The most significant
topographical difference was that of Barred Owl abundance in
swamps (Fig. 3d) when compared to Screech-Owls or Great Horned
Owls. In upland habitat. Barred Owls were found significantly less
often than Great Horned Owls. Barred Owls were found significantly
closer to water sources than Great Horned Owls (Fig. 3e) and only
slighty closer than Screech-Owls (not significant). Barred Owls were
less often within 100 m of human habitation (Fig. 3f) when compared
to Screech-Owls and Great Horned Owls and favored sites that were
greater than 500 m when compared to these owls. Screech-Owls
showed the reverse trend - actually favoring woodlands with nearby
human habitation. Great Horned Owls showed neither an avoidance
nor preference with regard to their proximity to human habitation.
• Pair Response}
a Single ResponseSingle Resident
(2 or more sightings)km
Figure 2. — Distribution of Barred Owls in the 120 sq km Pequan-
nock Watershed study area during 1986 breeding season. Although
the area was systematically searched, note that the density of owls
(12 territories) was much greater in the northern half of the area
which was almost complete wilderness (above dotted line). In
contrast, the southern half contained a major highway (Route 23).
several suburban housing developments, and less stands containing
eastern hemlocks, and only 5 territories were established. Average
nearest-neighbor distance for the northern half was 1 .48 km (CV =
17.6%) and 3.09 km (CV = 35.3%) for the southern half.
Table 4. — Analysis of 34 Barred Owl pellets from winter roost at
the Great Swamp National Wildlife Refuge, Meyersville, 1985-86.
Mammals numberShon-lailed Shrew (Blarina brevicauda) 5
Starnose Mole (Condylura cristata) 1
Meadow Vole (Microtus pennsylvanicus) 18
White-footed Mouse (Peromyscus leucopus) 2Southern Flying Squirrel (Glaucomys volans) I
Birds
Blue Jay (Cyanocilta cristata) 2
Invertebrates
Crayfish (Cambarus sp.) 2
Total Prey Items 31
Prey Items/Pellet 0.91
139
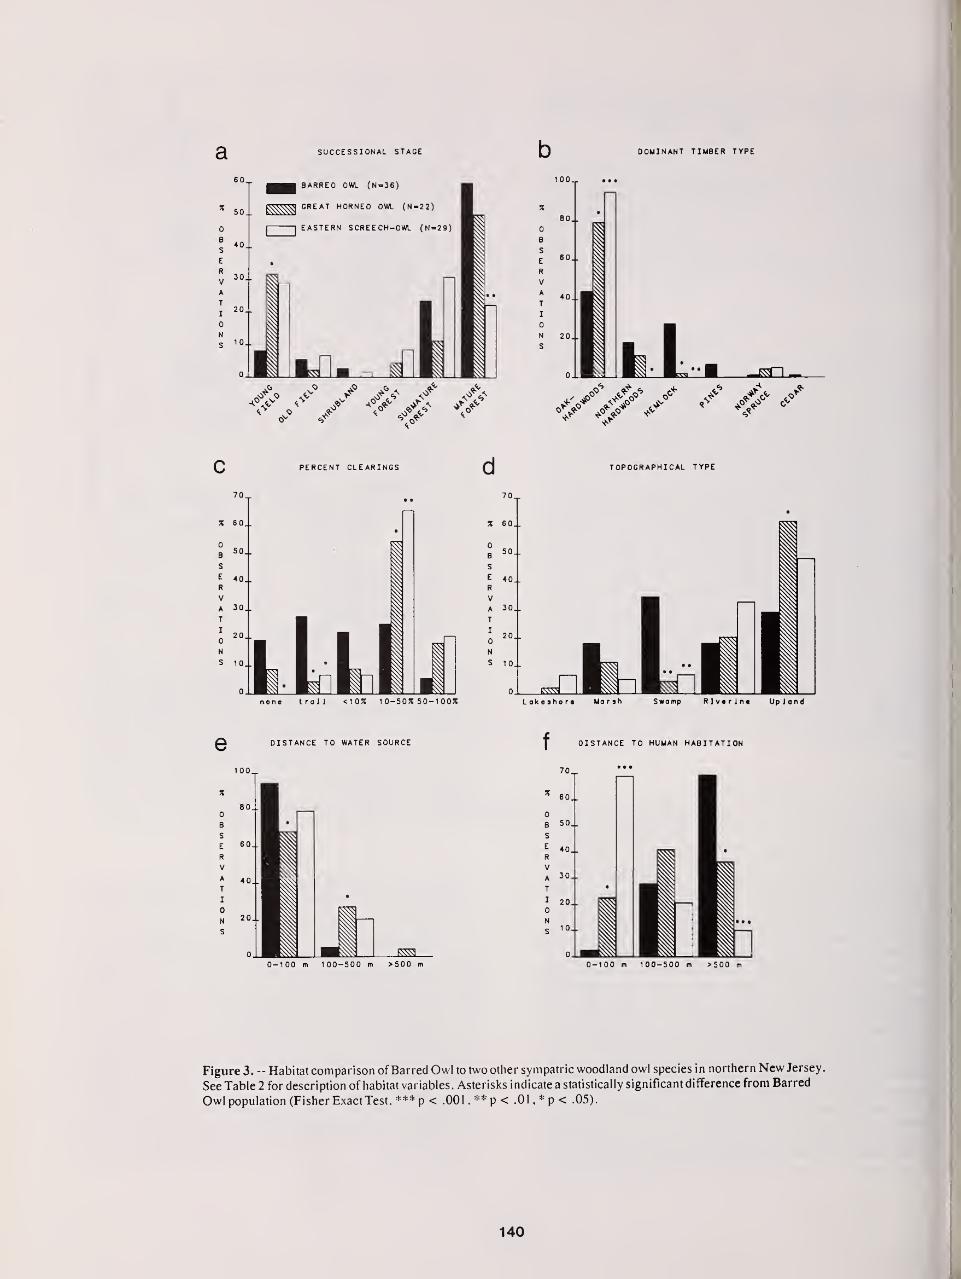
a SUCCESSIONAL STAGE b DOMINANT TIMBER TYPE
SO..
40..
30..
20..
1 0..
in
BARRED OWL (N=36)
GREAT HORNED OWL (N-22)
EASTERN SCREECH-OWL (N-29)
1m
100^.
i
1
0-100 m 100-500 m >500 m 0-100 m 100-500 m >500 m
Figure 3. -- Habitat comparison of Barred Owl to two other sympatric woodland owl species in northern New Jersey.
See Table 2 for description of habitat variables. Asterisks indicate a statistically significant difference from Barred
Owl population (Fisher Exact Test, ***p < .001,**p< .0I.*p< .05).
140
Nest Trees
Only three Barred Owl nests were found during the study. All were
in large holes of large dead trees and included white oak (Quercus
alba), sugar maple (Acer sacchanim) and black willow (Salix nigra).
Despite careful checking of all large stick nests found during
this and other raptor studies (Speiser and Bosakowski 1984. 1987)
we have never observed these nests to be used by Barred Owls as
has been reported elsewhere (Bent 1938). Apparently, cavity
availability is adequate in the woodlands presently occupied by
Barred Owls in northern New Jersey.
Food Habits
Thirty-one food items were identified from pellets collected at a
Barred Owl winter roost (Table 4). The roost was situated in a
Norway spruce (Picea aoies) grove that bordered extensive old
fields and open marsh, hence explaining the abundance of meadowvoles taken. Unfortunately, not enough pellets were found at nest
sites or other habitats to make a valid comparison among different
habitat types. However, our data are in close agreement with someother food habits studies (Wilson 1938, Rusling 1951, Marks et al.
1984) which indicate that the Barred Owl might occasionally be a
"specialist" on Microtus.
DISCUSSION
A total of 97 Barred Owls was detected on 62 territories during the
study period 1983-1986. Only 5 of these locations were found during
non-breeding months, but because the Barred Owl is a permanentresident, it is likely that these owls were defending permanenthome ranges as indicated by other known breeding localities that
were "defended" during winter (Elody 1983. this study - Table 1).
When a pair responded (56.5% of locations), they usually began
calling alternately with the typical eight-note hooting series which
was almost always followed by a loud and frenzied chorus. Although
other authors have noted this duetting (Bent 1938, Fitzpatrick
1975, Smith 1978, Devereux and Mosher 1982, Elody 1983, McGarigaland Fraser 1985), usually referred to it as "caterwauling", its
purpose is poorly understood, save for the fact that it reveals
the location and emotional level of the owls (Elody 1983). Ofinterest, we noted that this chorus was only elicited when the
owls were in very close proximity to each other. Likewise, Devereuxand Mosher (1982) once observed caterwauling just prior to a food
exchange near a nest. Perhaps this behavior functions in mate rec-
ognition, strengthening the pair-bond and warning intruders that
a pair-bond has already been established. Because these choruses
were very loud and frequently given in response to our calling,
this behavior seems to also have a strong territorial function,
possibly supplemental to the typical 8-note call. Outside of the
breeding season, the response rate of Barred Owls to calls
decreases dramatically (Smith 1978, Elody 1983, this study), thus
making winter census results, such as the Christmas Bird Counts,
unreliable. We also found only single responses during the winter
months with pairs responding primarily during the breeding season
(March to June).
The intensive study area yielded 34 Barred Owl locations (0.073
pairs/sq km) during 1983-1986. The Pequannock Watershed study
area, located in one of the more remote sections of the intensive
study area, was occupied at 17 locations in 1986 (0.142 pairs/sq
km). The latter density is comparable to Smith's (1978) data fromtwo selected study areas (7320 ha) in New England from which wecalculated densities of 0.147 (New Hampshire) and 0.191 (Connect-
icut). In northern Michigan, a wilderness area (9308 ha) with primehabitat (climax hemlock-northern hardwoods) was censused and found
to contain a density of 0.355 (Elody 1983). If we consider the
density of owls in the northern half of Figure 2 (60 sq km), wherethere is no highway, almost total wilderness, and more stands
containing hemlock, then our owl density figures increase from0.142 to .200. 56% of the saturation level in Elody s (1983) study
area.
Most Barred Owls were observed in mature timber stands, whereasthe majority of Screech-Owls inhabited younger successional
stages. Great Horned Owls were found only slighty less in matureforests than Barred Owl, but were much more often associated with
young fields. In Virginia, McGarigal and Fraser (1984) foundthat 25 Barred Owls more frequently preferred old stands (>80yrs old) rather than young stands (<80 yrs old). In the central
Appalachians, Devereux and Mosher (1984) found that Barred Owlnests (N = 8) were in more mature forests than 76 random sites.
Similarly. Forsman et al. (1977. 1984) found higher densities of
Spotted Owls (the western congener of the Barred Owl) in old-
growth forests versus young forests. In southern New Jersey,
Sutton and Sutton (1985) also noted a strong association of BarredOwls with "the oldest growth and uncut stands ... of hardwoodforest" although no quantitative tree data was obtained. Therequirement of Barred Owls for mature woods reflects their needfor large dead trees with nesting cavities (Devereux and Mosher1984). It is also hypothesized that these forests provide clear
unobstructed flight paths (little or no understory) for hunting
and better prey vulnerability (Nicholls and Warner 1972. Elody
1983, Devereux and Mosher 1984).
Barred Owls have been noted to prefer mixed woods in northern
latitudes (Wilson 1938. Smith 1978, Tyler and Phillips 1978. Elody
1983). This preference concurs with our findings in that Barred
Owls were found in hemlock stands more frequently than the other
two woodland owls. Elody (1983) concluded that coniferous growth
was important to Barred Owls because it provides dense forest
cover to prevent mobbing by birds and may also provide an escape
medium (Carter 1925, Stirling 1970). However, this rationale does
not explain why coniferous growth was not used as much by the other
two owl species in our study. D.G. Smith and Gilbert (1984) noted
that Screech-Owl use of evergreen cover occurred mainly during
winter months which supports our observations. The distribution
of mixed forest is limited mainly to the northern Highlands and
sections of the Kittatinny Ridge, however, conifers are apparently
not an essential requirement since more than half of the Barred
Owls were found in deciduous stands (e.g.. the Great Swamp main-
tains a dense population of Barred Owls and only a few cedars and
planted conifers are available.)
In this study. Barred Owls tended to avoid areas with extensive
clearings as compared to Screech and Great Horned Owls. Nicholls
and Warner (1972) showed evidence that fields and open marsh
habitat were avoided. Fuller's (1979) data from the same study area
(radiotelemetry location every min. instead of every 15 min) showed
a greater individual use of fields (5-33.3%). Devereux and Mosher
(1984) found eight nests to be significantly closer to edge than
random sites. Most of the Barred Owls we encountered were in deep
forests with fewer and smaller clearings than Great Horned Owl or
Screech-Owl territories. Our findings corroborate those of Elody
(1983) who has reported the highest known breeding density of
Barred Owls. He noted that forest cover was mostly contiguous with
very few openings.
The major topographical difference that we found for the Barred Owlin comparison to the other owls was the preference for swamps (and
other associated wetlands). Most of the literature supports this
association with wet areas (Carter 1925. Errington and McDonald
1937, Bent 1938. Stearns 1947. Applegate 1975. Soucy 1976. Elody
1983. Sutton and Sutton 1985). Fuller (1979) found dense lowland
habitats were used more frequently during reduced activity periods,
and both marshes and swamps were used if available. Elody (1983)
found a positive correlation with marsh use of seven radio-tagged
owls. In southern New Jersey. Sutton and Sutton (1985) independ-
ently came to the same conclusion as we did that Barred Owls pref-
erred freshwater wetland forest habitat over dry woodlands.
Besides being avoided by human intrusion, we contend that swamps
and marshes were almost always associated with a greater abundance
and diversity of prey species (birds, small mammals, amphibians,
crayfish, fish) than other topographical types in our region.
141
As expected on the basis of preference for wetlands, the Barred Owl
was found closest to water sources, significantly closer than Great
Horned Owl. but not Screech-Owl. The latter result is not unexp-
ected since Ellison (1980) found a significant positive correlation
between running water and Screech-Owl habitat use in Massachusetts.
Apparently, water is also an important habitat component for
Barred Owls as well. Karalus and Eckert (1974). Bolles (1890).
and others have noted that water sources are frequently used for
drinking and bathing, and the inclusion of crayfish, fish, and
amphibians in the diet (Errington 1932. Rusling 1951. Korschgen
and Stuart 1972. D.G. Smith et al. 1983. Devereux and Mosher1984. this study - Table 4) indicate the use of water as a hunting
habitat as well. Of interest. Gould (1974) reported that 90% of
Spotted Owls were found within 0.2 miles of water and Forsman et
al. (1984) found 85% of Spotted Owl nests within 250 m of water.
The Barred Owl was found to be the most sensitive of the three owl
species regarding proximity to human habitation (and hence, dist-
urbance). This result agrees with Smith (1978) who found a neg-
ative correlation of Barred Owl occurrence with human dwellings
in Connecticut and New Hampshire. In southern New Jersey. Sutton
and Sutton (1985) also noted qualitatively that Barred Owls were
"located as far from human habitation as possible". On the other
hand, our finding of Screech-Owl preference for proximity to humanhabitation concurs with the finding of D.G. Smith and Gilbert
(1984) that Screech-Owls significantly over-utilized suburban lawns
as a habitat type. Below we have submitted several explanations
which should help explain this phenomenon: (I) Screech-Owls can
avoid predation from Barred Owls (Errington 1932. Bent 1938.
Rusling 1951) by inhabiting woodlands on the edge of suburban
neighborhoods. (2) the lack of Barred Owl (and other raptors) in
these areas decreases potential competition for food sources (note
large overlap in prey use of Screech-Owl in Rusling 1951 and Barred
Owl in this study - Table 4). (3) trimmed lawns provide excellent
prey vulnerability for the owls (easy capture, lack of cover, loss
of concealment by prey). (4) Human activities and structures tend
to proliferate certain prey species (lawns - moles, lights - moths,
garbage - rodents). In contrast, the Barred Owls* success in north-
ern New Jersey results largely from the existence of large remote
forest preserves, especially those lands that have minimal signs
of human impact. Hence, we consider true wilderness areas as an
essential requirement for the maintenance of healthy Barred Owlpopulations.
MANAGEMENT IMPLICATIONS
The optimal habitat profile for the Barred Owl is: large contiguous
forests of mature and old-growth timber, mixed with hemlock,
interspersed with a variety of wetland types and free of humandwellings, roads, or other unnatural disruption. We recommend that
such areas be acquired as public properties and set aside as wilder-
ness with no human manipulation of habitat. Existing public lands
possessing these characteristics should not be subjected to any
kind of thinning, selective or clearcutting. One of the primary
arguments against logging these areas is that the creation of cleared
areas will favor the invasion of the larger, more aggressive Great
Horned Owl. which has been known to prey upon the Barred Owl (Bent
1938) and certainly compete for food and nesting sites. Similarly.
McGarigal and Fraser (1984) noted that the Great Horned Owl will
benefit if old stands are adjacent to farmland. Selective cutting
of optimum habitat is also not advisable since these areas are
needed as population reserves for continued replenishment of
marginal habitats.
At young and submature stands, we suggest careful thinning proced-
ures should be used for accelerating the growth of larger trees
and providing the flyway space below the canopy needed by Barred
Owls. Such sites, if large enough in area (at least 400 ha/pair),
could become potential breeding habitat within a few decades.
especially if situated near wetlands. Dry mountain ridgetops andupper slopes are not of any apparent value to Barred Owls andthese should be considered if timber harvesting or development
is desired. Unfortunately, this type of terrain is seldom desir-
able for construction as humans usually prefer valleys and flat-
lands similar to areas that would be suitable for the Barred Owl.Hence, future land development remains the biggest threat to
this species since our findings clearly indicate that humanhabitation drastically reduces habitat suitability.
Similar to our findings. Smith (1978) noted that Barred Owls always
avoided suburban developments even when the canopy was virtu-
ally uninterrupted. She suggested that multifamily dwellings be
considered in place of even-spaced suburban neighborhoods which
waste much more valuable space. For future development, careful
assessment of alternative construction sites should be encouraged
to prevent further encroachment on (or fragmentation of) our
valuable wilderness areas.
ACKNOWLEDGEMENTS
The authors wish to thank the following persons who generously
contributed field reports or other useful information: Greg Han-
isek. Joe Broschart.' Walt and Nancy Lilly. Walter Lehnes (in
memory of). Jim Zamos. Tom Jasikoff. Pete Bacinski. John Baran-
owski. Dennis Miranda. Richard Kane, and Stiles Thomas. Special
thanks are also due to Gordon I. Gould. Jr. for helpful discuss-
ions. Dwight G. Smith for generously providing many useful refer-
ences and encouragement, and Dee Dee Williamson for drawing the
Pequannock Watershed map. We also thank Jeffrey S. Marks and
Douglas W. Morrison for comments which improved the manuscript.
This research was supported, in part, by a grant from the NewJersey Audubon Society.
LITERATURE CITED
Applegate. R.D. 1975. Co-roosting of Barred Owls and CommonGrackles. Bird-Banding 46:169-170.
Bent. A.C. 1938. Life histories of North American birds of prey.
Part 2. U.S. National Museum Bulletin 170.
Bolles. F. 1890. Barred Owls in captivity. Auk 7:101-114.
Buell. M.F.. A. Langform. D. Davidson, and L. Ohmann. 1966. Theupland forest continuum in northern New Jersey. Ecology 47:416-
432.
Bull. J. 1964. Birds of the New York Area. Dover Publications. NewYork.
Carter. J.D. 1925. Behavior of the Barred Owl. Auk 42:443-444.
Devereux. J.G. and J.A. Mosher. 1982. Nesting habits of the Barred
Owl in western Maryland. Maryland Birdlife 38:124-126.
Devereux. J.G. and J. A. Mosher. 1984. Breeding ecology of Barred
Owls in the central Appalachians. Raptor Research 18:49-52.
Ellison. P.T. 1980. Habitat use by resident Screech Owls (Olus
asio). M.S. Thesis. University of Massachusetts.
Elody. B.I. 1983. Techniques for capturing, marking, monitoring
and habitat analysis for the Barred Owl in the Upper Peninsula
of Michigan. M.S. Thesis. Michigan Tech. University.
Errington. P.L. 1932. Food habits of southern Wisconsin raptors.
Part I. Owls. Condor 34:176-186.
142
Errington. P.L. and M. McDonald. 1937. Conclusion as to the food
habits of the Barred Owl in Iowa. Iowa Bird Life 7:47-49.
Fitzpatrick. J.W. 1975. A record of allopreening in the Barred Owl.Auk 92:598-599.
Forsman. E.D.. E.C. Meslow. and M.J. Strub. 1977. Spotted Owlabundance in young versus old-growth forests. Oregon. Wildlile
Society Bulletin 5:43-47.
Forsman. E.D.. E.C. Meslow. and H.M. Wight. 1984. Distribution
and biology of the Spotted Owl in Oregon. Wildlife Monographs87:1-64.
Fuller. M.R. 1979. Spatiotemporal ecology of four sympatric raptor
species. Ph.D. Thesis. University of Minnesota.
Fuller. M.R. and J.A. Mosher. 1981. Methods of detecting and
counting raptors: A Review. Studies in Avian Bioliogy 6:235-246.
In: Estimating Numbers of Terrestrial Birds (eds. C.J. Ralph and
J.M. Scott). Cooper Ornithological Society.
Gould. G.I.. Jr. 1974. The status of the Spotted Owl in California,
unpubl. report. California Dept. of Fish and Game. Wildlife Manage-ment Branch Administrative Report 74-6.
Gould. G.I.. Jr. 1977. Distribution of the Spotted Owl in Calif-
ornia. Western Birds 8:131-146.
Gutmore. D. 1977. Barred Owl survey in the Pequannock Water-
shed. N.J. Audubon 3:184-185.
Hanisek. G. 1984. Summer Field Notes (Region No. 1). Records of
New Jersey Birds 10:80.
Kane. R.. W.J. Boyle. Jr.. and A.R. Keith. 1985. Breeding birds of
Great Swamp. Records New Jersey Birds 1 1 :29-33.
Kane. R.. and M. Valent. 1986. 1986 North Jersey Barred Owlsurvey. Records of New Jersey Birds 12:69-70.
Karalus. K.E. and A.W. Eckert. 1974. The owls of North America.
Doubleday and Company. Inc.. Garden City. NY. 280 pp.
Korschgen. L.J. and H.B. Stuart. 1972. Twenty years of avian
predator-small mammal relationships in Missouri. Journal of Wild-
life Management 36:269-282.
Lehner. P.N. 1979. Handbook of Ethological Methods. Garland
STPM Press. NY. 403 pp.
Marks. J.S. P.L. Hendricks, and V.S. Marks. 1984. Winter food
habits of Barred Owls in western Montana. Murrelet 65:27-28.
Marti. CD. 1974. Feeding ecology of four svmpatric raptors.
Condor 76:45-61
.
McGarigal. K. and J.D. Fraser. 1984. The effect of forest stand age
on owl distribution in southwestern Virginia. Journal of Wild-
life Management 48:1393-1398.
McGarigal. K. and J.D. Fraser. 1985. Barred Owl responses to
recorded vocalizations. Condor 87:552-553.
Nicholls. T.H. and D.W. Warner. 1972. Barred Owl habitat use as
determined bv radiotelemetry. Journal of Wildlife Management32:213-224.
'
Rusling. W.J. 1951. Food habits of New Jersey owls. Proceedings
of the Linnaean Society (New York) 58-62:38-45.
Russell. E.W.B. 1981. Vegetation of northern New Jersey before
European settlement. American Midland Naturalist 105:1-12.
Smith. C.F. 1978. Distributional ecology of Barred and Great HornedOwls in relation to human distribution. M.S. Thesis. University of
Connecticut.
Smith. D.G.. A. Devine. and D. Devine. 1983. Observations of
fishing by a Barred Owl. Journal of Field Ornithology 54:88.
Smith. D.G. and R. Gilbert. 1984. Eastern Screech-Owl home range
and use of suburban habitats in southern Connecticut. Journal of
Field Ornithology 55:322-329.
Soucy. L.J.. Jr. 1976. Barred Owl nest. North American Bird
Bander 1:68-69.
Speiser. R. and T. Bosakowski. 1984. History, status, and future
management of the Northern Goshawk in New Jersey. Records of NewJersey Birds 10:29-33.
Speiser. R. and T. Bosakowski. 1987. Nest site selection by North-
ern Goshawks in northern New Jersey and southeast New York.
Condor, in press.
Stearns. E.I. 1947. Notes on the abundance of the Barred Owl. Urner
Field Observer 2:5-7.
Stirling. D. 1970. A sight record of the Barred Owl on Vancouver
Island. Murrelet 51:19.
Sutton. C.C. and P.T. Sutton. 1985. The status and distribution of
Barred Owl and Red-shouldered Hawk in southern New Jersey.
Cassinia 61:20-29.
Tyler. H.A. and D. Phillips. 1978. Owls by day and night. Nature-
graph Publishers. Inc.. Happy Camp. Ca.
Wilson. K. A. 1938. Owl studies at Ann Arbor. Michigan. Auk 55: 187-
197.
Zar. J.H. 1974. Biostatistical Analysis. Prentice-Hall. Inc.. Engle-
wood Cliffs. NJ. 620 pp.
143
Ecology of the Three Species of Strix Owls in Finland1
Heimo Mikkola 2
The Tawny, Ural, and Great Grey Owls breedsympatrically in large areas in the USSR, south-eastern Poland, and Finland. In Finland theirarea of sympatry covers, especially in good voleyears, almost the entire southern and centralcountry. This presentation concentrates on fourecological parameters: activity, food, breedinghabitat, and nest site.
The southern Tawny Owl is the most nocturnalin the breeding season. The northern limit of its
range may be determined by the short summer nights.In contrast, the northern Great Grey Owl is themost diurnal species, which has adapted to lightsummer nights in its central range by being activethroughout the day and night, only ceasing to feedits young in the afternoon. The Ural Owl has anintermediate position, showing a biphasic activity,with the highest peak in the late evening andlower peak in the early morning, and, to a smallextent, remaining active also during the day.
The Great Grey Owl, which is the largest, is
a small rodent specialist. Both Ural and Tawny
1 Summary of paper presented at the symposium,Biology and Conservation of Northern Forest Owls,Feb. 2-7, 1987, Winnipeg, Manitoba. USDA ForestService General Technical Report RM-142.
2 Heimo Mikkola is now President of the Board,Fish and Water Research Limited, Nilsia, Finland.
Owls are catholic predators and food general is ts.
Their food niches are about 2.5 times broader thanthat of the Great Grey.
Great Grey Owl breeding habitat is the mostcatholic among the three; it breeds in forests ofall kinds. Habitat selection of the Tawny is themost restricted, but overlaps extensively with thatof the Ural Owl. The Tawny Owl is almostexclusively a hole-nester (92% of nest sitesstudied), while nest selection by the Ural Owl is
quite catholic, including nest boxes and holes
(53%), stumps (23%), and twig nests (20%). TheGreat Grey Owl uses mainly twig nests (79%) andstumps (13%), and may even lay eggs on the ground
(3%). Therefore, Great Grey and Tawny Owls are not
competing for the same nest sites, while competitionfor nest sites may be keen between Ural and TawnyOwls. Occasional competition between Great Greyand Ural Owls may also occur.
As measured by the four aforementionedparameters, the Ural Owl has the widest niche, that
of Tawny being 73% and that of the Great Grey only48% of the niche of the first-mentioned. Theseresults suggest that competition among the threespecies is common, and should be taken into accountwhen providing artificial nest sites. Favouringone of the species may harm another. Similarcompetition is likely to exist between Barred and
Spotted Owls, but more research is needed to
quantify these niche relationships.
144
Home Range Size of Hawk Owls: Dependence onCalculation Method, Number of Tracking Days,
and Number of Plotted Perchings 1
BJ0rn T. Baekken, Jan O. Nybo, and Geir A. Sonerud 2
Abstract.—Three nesting males and two non-nestingfemales of the Hawk Owl were equipped with radio transmittersand tracked for 3-11 weeks during 1984-85 in the northernboreal zone of southeast Norway. Home range sizes were largerwhen calculated by the convex polygon method than when calcu-lated by the quadrate method (squares of 250 m x 250 m) . Homerange size as calculated by the convex polygon method increasedwith number of tracking days, while that calculated by thequadrate method increased with number of perchings plotted.
INTRODUCTION
The introduction of radio telemetry has madeit possible to sample data on home range use ofanimals that move over large areas. Some of thefirst studies making use of this technique dealtwith owls (Nicholls and Warner 1972, Forbes andWarner 1974). Since then several studies on theecology of owls involving radio telemetry havebeen conducted, mainly in North America. InEurope few such studies have been made (Nilsson1977, 1978, Wijnandts 1984, Sonerud et al. 1986,
Jacobsen and Sonerud 1987).
Shape and size of recorded home ranges forowls may vary depending on several factors con-nected with data sampling and calculation method.For instance, it may differ depending on whetherthe owls are located during their usually noctur-nal hunting or during their diurnal roosting(Wijnandts 1984, Jacobsen and Sonerud 1987), andmay also depend on sample size and samplinginterval (Swihart and Slade 1985), and the calcu-lation method (Fcihrenbach 1984).
Hawk Owls Surnia ulula search for food alsoduring the day (e.g. Glutz von Blotzheim andBauer 1980). Hence, a realistic estimate oftheir home range size should be obtainable bydiurnal radio-tracking only, in contrast to e.g.Tengmalm's Owls Aegolius funereus , for whichdiurnal and nocturnal activity level, and there-fore also home ranges, differ markedly (Jacobsenand Sonerud 1987). Here we report the home rangesizes of 5 Hawk Owls as calculated by two dif-
Tpaper presented at the symposium, Biologyand Conservation of Northern Forest Owls, Feb.3-7, 1987, Winnipeg, Manitoba. USDA ForestService General Technical Report RM-142.
^Bj0rn T. Baekken and Jan 0. Nybo areGraduate Students and Geir A. Sonerud is ResearchAssociate, Department of Biology, Division ofZoology, University of Oslo, Oslo, Norway.
rerent methods, and relate these estimates to the
sample sizes, viz. number of days tracking theowl and number of owl perchings plotted.
STUDY AREA
The study was conducted during 1984-85 with-
in an area of 70 km^ at an altitude of 520-720 m
in the northern boreal zone (sensu Anonymous1977) in Hedmark county, southeast Norway(61°00'N, 11°10'E). The study area consists of
coniferous forest with Norway Spruce Picea abiesdominating, mixed with bogs and fens. The area
is usually covered by snow from mid-November to
mid-May. In 1984 the snow-melt occurred extreme-
ly early, and in 1985 extremely late, with clear-cuts being snow-free May 1 and 25, respectively.
METHODS
Three male Hawk Owls trapped in mist nets at
the nest site (M1 in 1984, M2 and M3 in 1985),
and two female Hawk Owls trapped in a bow-netoutside the nesting season (F1 in 1984 and F2 in
1985), were equipped with radio transmitters(Biotrack, England) mounted as a back-pack (fig.
1), and tracked 3-11 weeks (table 1). The track-
ing was conducted during daytime by first locali-zing, and then following, the hunting owls by
walking or skiing, using a hand-held receiver(Televilt, Sweden) and a 4-element yagi-antenna.All observed perchings of the owls were plottedon aerial photos with scale 1:15,000 in the
field, and later plotted on maps with scale1:5,000. Since an important aim of the trackingwas to sample data on the foraging behavior ofthe owls, each owl was followed as continuouslyas possible for several hours per day. Theaverage number of perchings plotted per day
varied from 2-54 for the five owls, with anaverage of 19. Hence, the plottings of perchedowls were to a large extent autocorrelated, and
145
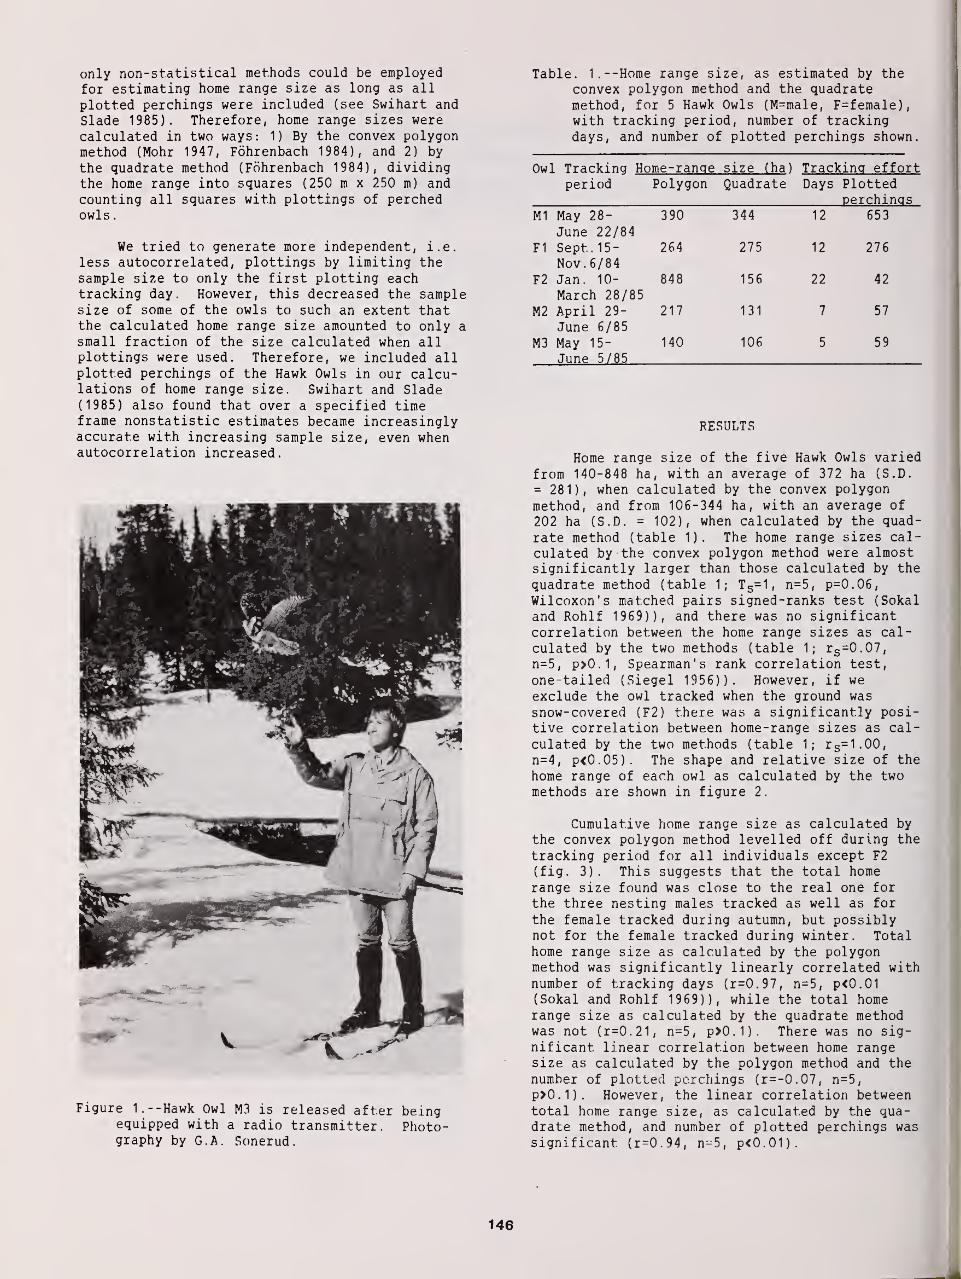
only non-statistical methods could be employedfor estimating home range size as long as all
plotted perchings were included (see Swihart andSlade 1985). Therefore, home range sizes werecalculated in two ways: 1) By the convex polygonmethod (Mohr 1947, Fohrenbach 1984), and 2) by
the quadrate method (Fohrenbach 1984), dividingthe home range into squares (250 m x 250 m) and
counting all squares with plottings of perchedowls
.
We tried to generate more independent, i.e.
less autocorrelated, plottings by limiting thesample size to only the first plotting eachtracking day. However, this decreased the samplesize of some of the owls to such an extent thatthe calculated home range size amounted to only asmall fraction of the size calculated when allplottings were used. Therefore, we included allplotted perchings of the Hawk Owls in our calcu-lations of home range size. Swihart and Slade(1985) also found that over a specified timeframe nonstatistic estimates became increasinglyaccurate with increasing sample size, even whenautocorrelation increased.
Table. 1. —Home range size, as estimated by theconvex polygon method and the quadratemethod, for 5 Hawk Owls (M=male, F=female),with tracking period, number of trackingdays, and number of plotted perchings shown,
period Polygon Quadrate Days Plottedperchinqs
M1 May 28- 390 344 12 653
June 22/84F1 Sept. 15- 264 275 12 276
Nov.6/84F2 Jan. 10- 848 156 22 42
March 28/85M2 April 29- 217 131 7 57
June 6/85
M3 May 15- 140 106 5 59
June 5/85
Figure 1.--Hawk Owl M3 is released after beingequipped with a radio transmitter. Photo-graphy by G.A. Sonerud.
RESULTS
Home range size of the five Hawk Owls varied
from 140-848 ha, with an average of 372 ha (S.D.= 281), when calculated by the convex polygonmethod, and from 106-344 ha, with an average of
202 ha (S.D. = 102), when calculated by the quad-
rate method (table 1). The home range sizes cal-culated by the convex polygon method were almostsignificantly larger than those calculated by the
quadrate method (table 1; T s=1, n=5, p=0.06,
Wilcoxon's matched pairs signed-ranks test (Sokal
and Rohlf 1969)), and there was no significantcorrelation between the home range sizes as cal-culated by the two methods (table 1; rs =0.07,
n=5, p>0.1, Spearman's rank correlation test,
one-tailed (Siegel 1956)). However, if weexclude the owl tracked when the ground was
snow-covered (F2) there was a significantly posi-tive correlation between home-range sizes as cal-
culated by the two methods (table 1; r s=1.00,
n=4, p<0.05). The shape and relative size of the
home range of each owl as calculated by the twomethods are shown in figure 2.
Cumulative home range size as calculated by
the convex polygon method levelled off during the
tracking period for all individuals except F2
(fig. 3). This suggests that the total homerange size found was close to the real one for
the three nesting males tracked as well as for
the female tracked during autumn, but possiblynot for the female tracked during winter. Totalhome range size as calculated by the polygonmethod was significantly linearly correlated withnumber of tracking days (r=0.97, n=5, p<0.01(Sokal and Rohlf 1969)), while the total homerange size as calculated by the quadrate methodwas not (r=0.21, n=5, p>0.1). There was no sig-nificant linear correlation between home rangesize as calculated by the polygon method and thenumber of plotted perchings (r=-0.07, n=5,
p>0.1). However, the linear correlation betweentotal home range size, as calculated by the qua-drate method, and number of plotted perchings was
significant (r=0.94, n^5, p<0.01).
146
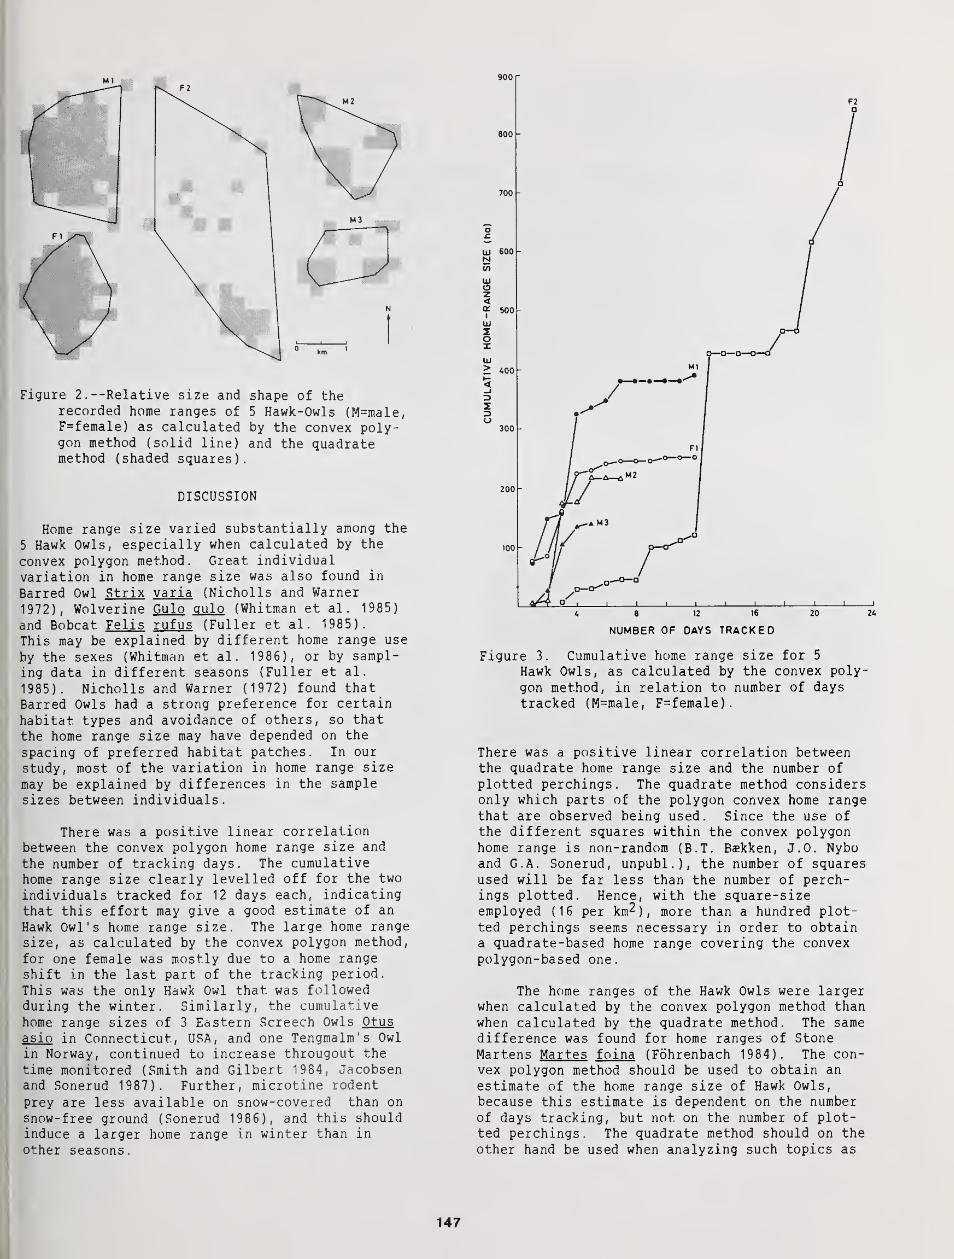
Ml 900
Figure 2. —Relative size and shape of therecorded home ranges of 5 Hawk-Owls (M=male,F=female) as calculated by the convex poly-gon method (solid line) and the quadratemethod (shaded squares).
DISCUSSION
Home range size varied substantially among the
5 Hawk Owls, especially when calculated by the
convex polygon method. Great individual
variation in home range size was also found in
Barred Owl Strix varia (Nicholls and Warner
1972), Wolverine Gulo gulo (Whitman et al . 1985)
and Bobcat Felis rufus (Fuller et al . 1985).
This may be explained by different home range use
by the sexes (Whitman et al. 1986), or by sampl-
ing data in different seasons (Fuller et al.
1985). Nicholls and Warner (1972) found that
Barred Owls had a strong preference for certain
habitat types and avoidance of others, so that
the home range size may have depended on the
spacing of preferred habitat patches. In our
study, most of the variation in home range size
may be explained by differences in the samplesizes between individuals.
There was a positive linear correlationbetween the convex polygon home range size and
the number of tracking days. The cumulativehome range size clearly levelled off for the two
individuals tracked for 12 days each, indicatingthat this effort may give a good estimate of an
Hawk Owl's home range size. The large home rangesize, as calculated by the convex polygon method,
for one female was mostly due to a home rangeshift in the last part of the tracking period.
This was the only Hawk Owl that was followedduring the winter. Similarly, the cumulativehome range sizes of 3 Eastern Screech Owls Otusasio in Connecticut, USA, and one Tengmalm's Owlin Norway, continued to increase througout the
time monitored (Smith and Gilbert 1984, Jacobsenand Sonerud 1987). Further, microtine rodent
prey are less available on snow-covered than on
snow-free ground (Sonerud 1986), and this shouldinduce a larger home range in winter than in
other seasons.
8 12 16
NUMBER OF OAYS TRACKED
20
Figure 3. Cumulative home range size for 5
Hawk Owls, as calculated by the convex poly-
gon method, in relation to number of daystracked (M=male, F=female).
There was a positive linear correlation betweenthe quadrate home range size and the number of
plotted perchings. The quadrate method considersonly which parts of the polygon convex home rangethat are observed being used. Since the use ofthe different squares within the convex polygonhome range is non-random (B.T. Baskken, J.O. Nyboand G.A. Sonerud, unpubl.), the number of squaresused will be far less than the number of perch-ings plotted. Hence, with the square-sizeemployed (16 per km^), more than a hundred plot-ted perchings seems necessary in order to obtaina quadrate-based home range covering the convexpolygon-based one.
The home ranges of the Hawk Owls were largerwhen calculated by the convex polygon method thanwhen calculated by the quadrate method. The samedifference was found for home ranges of StoneMartens Martes foina (Fohrenbach 1984). The con-vex polygon method should be used to obtain an
estimate of the home range size of Hawk Owls,because this estimate is dependent on the numberof days tracking, but not on the number of plot-ted perchings. The quadrate method should on the
other hand be used when analyzing such topics as
147
search strategies and namtat selection. Suffi-cient effort for an accurate estimate during thesnow-free season seems to be approximately 10
days, with approximately 10 perchings plotted perday.
ACKNOWLEDGEMENTS
We thank P.E. Fjeld and B.V. Jacobsen forassistance during the field work, and the landowner A. Solberg for kindly allowing us to usethe study area and for providing free accommo-dation. We also thank B. Danielson for improvingthe English, M. Aas for typing the manuscript,and E. Kresse for drawing the figures. Theradio-tracking equipment was financed by grantsto G.A. Sonerud from the University of Oslo, theNorwegian Research Council for Sciences, and theHumanities (NAVF), and the Nansen Foundation.The field work was supported by grants to B.T.Baekken and J.O. Nybo from the Robert Collettlegacy.
LITERATURE CITED
Anonymous. 1977. Naturgeografisk regioninndel-
ning av Norden. Nordiske Utredninger B 34:
1-137 (Tn Danish, Norwegian and Swedish with
summaries in English and Finnish)
.
Fohrenbach, H. 1984. Notes on several home-range
calculation methods shown for Stone Martens,
Martes foina (Carnivora, Mustelidae).Saugetierkiindliche Mitteilungen 32: 49-53.
Forbes, J.E., and D.W. Warner. 1974. Behavior of
a radiotagged Saw-whet Owl. Auk 91: 783-795.
Fuller, T.K., W.E. Berg, and D.W. Kuehn. 1985.
Bobcat home-range size and daytime cover-type use in northcentral Minnesota. Journal
of Mammalogy. 66: 568-571.
Glutz von Blotzheim, U.N., and K.M. Bauer. 1980.
Handbuch der Vogel Mitteleuropas , Vol. 9.
Akademische Verlagsgesellschaft , Wiesbaden.
Jacobsen, B.V., and G.A. Sonerud. 1987. Home
range size of Tengmalm's Owl Aegol^usfunereus : a comparison between nocturnalhunting and diurnal roosting. This issue.
Mohr, CO. 1947. Table of equivalent populationsof North American small mammals. AmericanMidland Naturalist 37: 223-239.
Nicholls, T.H., and D.W. Warner. 1972. BarredOwl habitat use as determined by radiotele-
metry. Journal of Wildlife Management 36:
213-224.
Nilsson, I.N. 1977. Hunting methods and habitatutilization of two Tawny Owls (Strix alucoL.). Fauna och Flora 72: 156-163. (In
Swedish with summary in English)
.
Nilsson, I.N. 1978. Hunting in flight by TawnyOwls Strix aluco . Ibis 120: 528-531.
Siegel, S. 1956. Nonparametric statistics for
the behavioral sciences. McGraw-HillKogakusha, Tokyo.
Smith, D.G., and R. Gilbert. 1984. EasternScreech-Owl home range and use of suburbanhabitats in southern Connecticut. Journalof Field Ornithology 55: 322-329.
Sokal, R.R., and F.J. Rohlf. 1969. Biometry.Freeman, San Francisco.
Sonerud, G.A. 1986. Seasonal changes in diet,
habitat, and regional distribution of
raptors that prey on small mammals in borealzones of Fennoscandia. Holarctic Ecology 9:
33-47.
Sonerud, G.A., R. Solheim, and B.V. Jacobsen.1986. Home-range use and habitat selectionduring hunting in a male Tengmalm's Owl
Aegolj us funereus . Fauna Norvegica, Ser. C,
Cinclus 9: 100-106.
Swihart, R.K., and N.A. Slade. 1985. Influenceof sampling interval on estimates of home-
range size. Journal of Wildlife Management49: 1019-1024.
Whitman, J.S., W.B. Ballard, and C.C. Gardner.
1986. Home-range and habitat use by
Wolverines in southcentral Alaska. Journal
of Wildlife Management 50: 460-463.
Wijnandts, H. 1984. Ecological energetics of the
Long-eared Owl ( Asio otus ) . Ardea 72: 1-92.
148
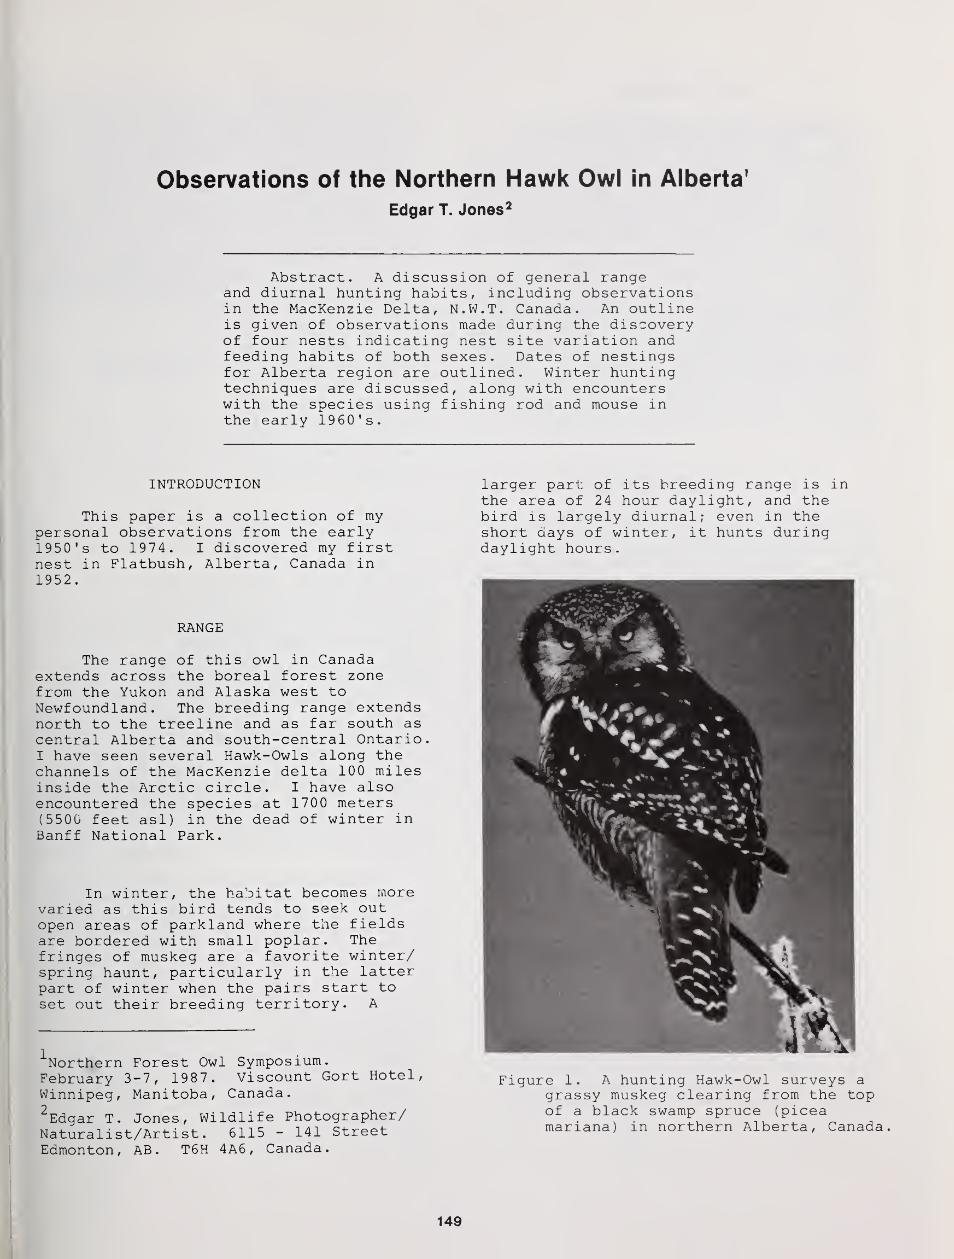
Observations of the Northern Hawk Owl in Alberta 1
Edgar T. Jones 2
Abstract. A discussion of general rangeand diurnal hunting habits, including observationsin the MacKenzie Delta, N.W.T. Canada. An outlineis given of observations made during the discoveryof four nests indicating nest site variation andfeeding habits of both sexes. Dates of nestingsfor Alberta region are outlined. Winter huntingtechniques are discussed, along with encounterswith the species using fishing rod and mouse inthe early 1960's.
INTRODUCTION
This paper is a collection of mypersonal observations from the early1950 's to 1974. I discovered my firstnest in Flatbush, Alberta, Canada in1952 .
larger part of its breeding range is inthe area of 24 hour daylight, and thebird is largely diurnal; even in theshort days of winter, it hunts duringdaylight hours.
RANGE
The range of this owl inextends across the boreal forfrom the Yukon and Alaska wesNewfoundland. The breeding r
north to the treeline and ascentral Alberta and south-cenI have seen several Hawk-Owlschannels of the MacKenzie delinside the Arctic circle. I
encountered the species at 17(5500 feet asl) in the dead oBanff National Park.
Canadaest zonet toange extendsfar south astral Ontarioalong the
ta 100 mileshave also00 metersf winter in
In winter, the habitat becomes morevaried as this bird tends to seek outopen areas of parkland where the fieldsare bordered with small poplar. Thefringes of muskeg are a favorite winter/spring haunt, particularly in the latterpart of winter when the pairs start toset out their breeding territory. A
Northern Forest Owl Symposium.February 3-7, 1987. Viscount Gort Hotel,
Winnipeg, Manitoba, Canada.2Edgar T. Jones, Wildlife Photographer/
Naturalist/Artist. 6115 - 141 StreetEdmonton, AB. T6H 4A6 , Canada.
Figure 1 . A hunting Hawk-Owl surveys agrassy muskeg clearing from the topof a black swamp spruce (piceamariana) in northern Alberta, Canada
149
IDENTIFICATION
Several characteristics quicklydifferentiate this species from otherowls. When hunting, its habit ofperching on the tip of the tree ratherthan half way down or on a lower branch,is very consistent. Even when it issitting on small poplars or willows, itdisplays a horizontal stance rather thanan upright stance as most owls tend totake. The long tail and its habit offlicking it, in a manner similar to theKestrel, are two important characteristics.I have seen it hovering on two occasions,another unexpected trait that separatesthis owl from other species. As for sound,in my association with these birds, I
have found them to be very quiet. I haveonly heard the occasional feed call whenI was near the nest site and have neverheard any calls while the birds werehunting
.
FOOD AND HUNTING TECHNIQUES
During the breeding season, its foodgenerally consists of small mammals suchas red-backed and meadow voles, and deermice. Undoubtedly some small birds arealso taken, but certainly in the winteringareas voles and deer mice would be themost likely prey. I would suspect thatredpolls, snow buntings and other smallerwintering species would be part of thewinter food fare but I have notpersonally observed this.
They have acute hearing and extremelykeen eyesight. On one occasion I watcheda Hawk-Owl hunting from the top of a 6
meter (20 feet) black spruce after a deep,soft snowfall. The bird cocked its headto the side several times and thenliterally dropped off of the spruce intothe deep snow. Only the tips of the wingsand tail were visible and yet within a fewseconds the bird flew up to the treeclutching a vole. This catch wasobviously made by sound only as the volewas at least one foot below the snowsurface
.
In the early 1960 's I attracted Hawk-Owls into close range for photography byusing a dead mouse as a lure. The mousewas tied to a monofilament line and, withthe aid of a spinning rod, cast out ontothe snow surface. It soon became evidentthat a hunting Hawk-Owl could see themouse up to 730 meters (800 yards) away.The owl would leave its perch and headtoward the mouse even before it could bereeled in more than 3 meters (10 feet)
.
A friend, Bob Gehlert of Edmonton,Canada, developed a technique in the early19 60 's which has allowed him to catch andband almost one hundred Hawk-Owls over thelast 25 years. His technique simplyinvolved releasing a live house mouse athis feet when a Hawk-Owl was spotted.Within a second or two the owl would headfor the mouse. As it came near the mousehe used a fish-landing net to interceptand catch the owl within a meter or so ofwhere he stood. Timing was critical inorder to save the mouse for another catch.This demonstrates the incredible fearless-ness of this little owl and its concentra-tion on the prey target.
BREEDING AND NESTING AREAS
In north-central Alberta, this birdis considered an early nester. I havefound that they are usually on theirnesting territory by mid-March and startto lay in mid-April. The following arethe dates I have from my nesting records:
April 25, 1952: 6 eggs. This nest was ina burnt out tamarack stump at 6 meters (20feet) . The five young were ready to leaveon May 24th.May 15, 1970: Five young were foundfeathering out in a nest located in aspruce snag at 6.7 meters (22 feet).May 17, 1970: We caught and banded thefemale at a nest which was at 9 meters (30feet) in a live Balsam Poplar where abranch had broken off leaving a hole.There were seven young between ten to 12days old. On May 23rd, at this same nesta different adult was caught and bandedalong with four of the six young remainingin the nest. The two young not bandedwere too small to retain the band.June 6, 1975: My associate, Bob Gehlert,found a nest at 4.3 meters (14 feet) in aburnt out spruce stump containing two half-grown young. This nest was in a densespruce much less open than other locations.
Finding the nest is relatively simpleonce the breeding territory or the maleby himself has been located. By watchingthe male carefully, when prey has beencaught, the male flies directly to the nestso that once this line of flight has beenestablished it is a matter of following itfor 90 to 450 meters (100-500 yards) untilthe nest site is located. The male bringsprey to the female on the nest. She mayleave briefly to take it from the maleeither at the nest entrance or a shortdistance away. If there are young in thenest, the female will return directly tothe nest with the food. All this willoften be done with an observer close by asthe birds have little or no obvious fear of
160
man
.
The nesting site varies with thenests I have observed, but it is usuallyin or on the fringe of a muskeg. Somesites are in dense Black Spruce, othersare in open locations. The most favoredlocation seems to be a burnt out stumpwith a hole at any height from two tonine meters (8-30 feet) . Apparently thisspecies sometimes nests in an old crow'sor hawk's nest, but I have neverpersonally observed this. The clutchsize varies from three to seven, butusually is five or six.
A word of warning to anyoneattempting to climb the nest stump ortree: The Hawk-Owl will not hesitate toattack an intruder.
ENEMIES
Its greatest enemy, without question,is man. The annual destruction ofthousands of acres of potential breedingterritory, much of which is marginalagricultural land, is the greatestcontributing factor to the everretreating breeding area of the Hawk-Owl
,
at least in Alberta, Canada.
BANDING RESULTS
Bob Gehlert reports several Hawk-Owlsthat have been recaught, some from thesame tree and several from the sameimmediate area where the birds wereoriginally banded. I have not receivedany returns from the ones I have banded.
151

Foraging Activity and Growth of Nestlingsin the Hawk Owl: Adaptive Strategies
Under Northern Conditions 1
Kauko Huhtala, Erkki Korpimaki, and Erkki Pulliainen 2
Abstract.—Foraging activity was recorded at four nests
of the Hawk Owl Surnia ulula in C. and N. Finland. The owls broughtfood to the nest throughout the day, apart from a 2-3 hour pausearound midnight. The frequency of nest visits was greatest in
early morning (3-4 a.m.), around noon (11 a.m.-l p.m.) and in
late evening (8-11 p.m.). The parent owls visited the nest an averageof 10.6 times per day during the incubation period, increasing
their visits to 16.6 per day during the hatching period and to
41.4 during the nestling period. They also brought food from the
nest to store in its immediate vicinity. The nestlings clearly invest-
ed in increasing their body weight at the early stage of the nestling
period, the growth of the wings being rather slow. The foraging
and growth strategies of the Hawk Owl show adaptation to harsh
northern conditions, with continuous daylight, variable food resour-
ces and relatively few competitors.
INTRODUCTION
The distribution of nesting Hawk Owls, Surnia
ulula , is concentrated in the north-boreal zone of
the northern hemisphere (for distribution map, see
Mikkola 1983) to such an extent that it can be expectedthat special strategies should have evolved to ensure
their success in these adverse and in some respects
unpredictable conditions. Because the species also
nests in areas characterized by continuous daylight,
it has been suggested that it is day-active (Mikkola
1972). Although the hole-nesting Hawk Owl is rather
easy to study, surprisingly little is known about its
biology, and this is also true of its foraging activity
and the growth of its nestlings which we intend to
describe in this contribution.
MATERIAL AND METHODS
Visits by the Hawk Owls to four nests wererecorded as follows:
1) Direct observations were made from a hide at a
nest in Varrio Nature Park (67.5°N, 29.5°E), E. Finnish
Paper presented at the symposium, Biology
and Conservation of Northern Forest Owls, Feb. 3-
7, 1987, Winnipeg, Manitoba. USDA Forest ServiceGeneral Technical Report RM-142.
2Kauko Huhtala is Assistant of Zoology, Erkki
Korpimaki is Researcher of the Academy of Finland, andErkki Pulliainen is Professor of Zoology at the Depart-ment of Zoology, University of Oulu, Oulu, Finland.
Forest Lapland, for two days during the hatchingperiod in 1982. Small rodent populations in that yearmay be described as "average".
2) Nest visits were recorded by an automatic recorder(type "Norma", see Korpimaki and Huhtala 1986) fromthe laying period to the end of the nestling periodat Ylivieska, (64 N, 24.5°E), W. Central Finland,
in 1974. Local small rodents were at their peak in
that year.
3) Nest visits were recorded with an automatic recorderduring the incubation period (7 days) and hatchingperiod (10 days) at Kauhava, (63°N, 23°E), W. Central
Finland, in 1977. This nest was later lost for someunknown reason. Local small rodent populations wereat their peak.
4) Nest visits were recorded during the incubationperiod (8 days) and nestling period (16 days) at Kauhavain 1986. The young in this nest were also weighedon a Pesola spring balance and their wing lengths
were measured every other day. A recorder madefrom a tachograph was used at both nests at Kauhava(see Korpimaki 1981).
RESULTS
The Hawk Owls visited their nests throughoutthe day, apart from a 2 or 3 hours pause around midnight(figs. 1-3), the length of which was reduced by theneed to feed the nestlings (see especially fig. 3). Thefrequency of the visits varied in periods of 2-3 hours,
with peaks in the early morning (3-4 a.m.), aroundnoon (11 a.m.-l p.m.) and in the late evening (8-11
p.m.) (figs. 1-3). Here again the variation seems to
decrease during the nestling period (figs. 1 and 3).
152
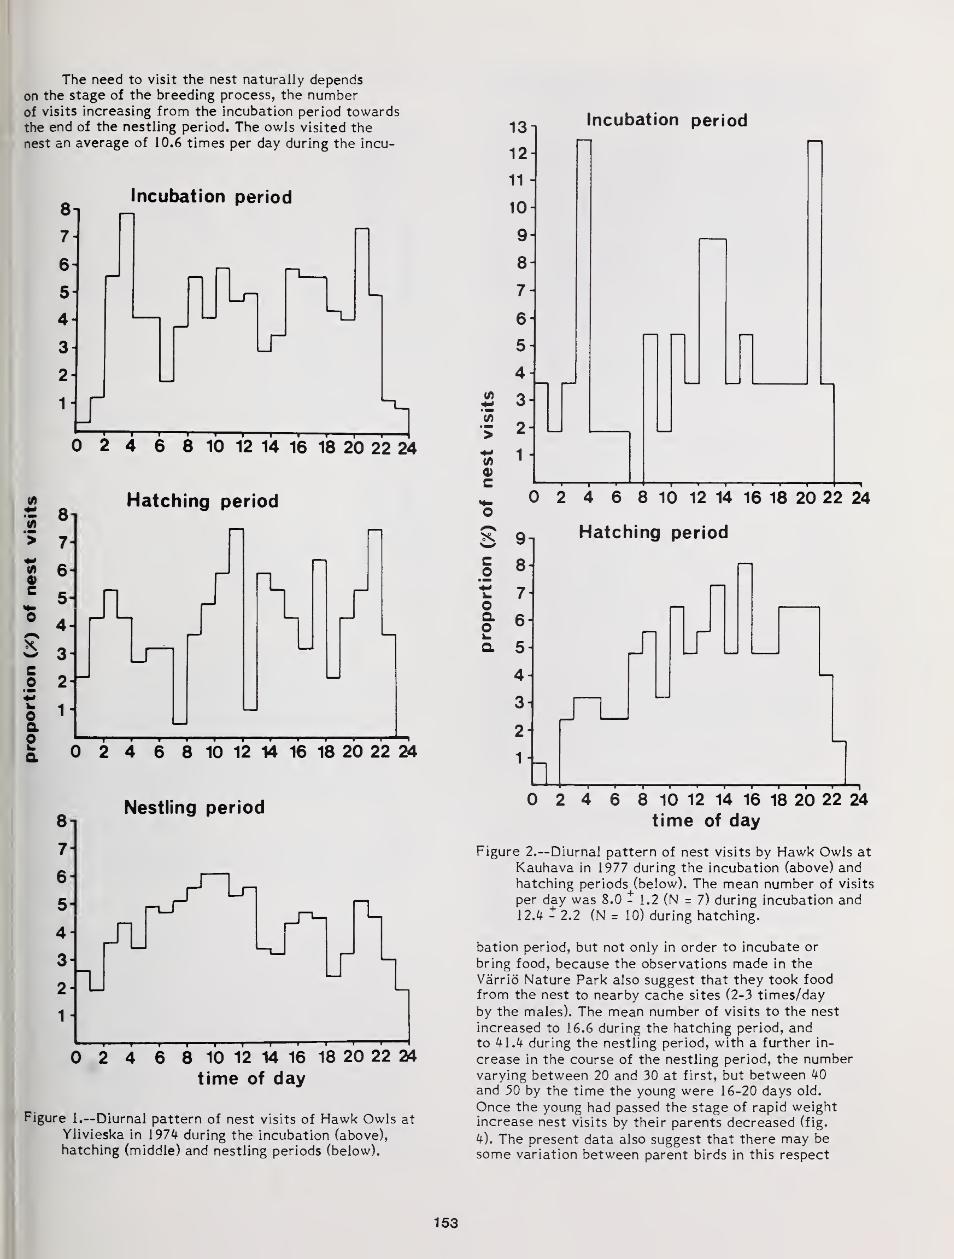
The need to visit the nest naturally dependson the stage of the breeding process, the numberof visits increasing from the incubation period towardsthe end of the nestling period. The owls visited the
nest an average of 10.6 times per day during the incu-
81
7-
6-
5
4-
3
Incubation period
2-
Lr
0 2 4 6 8 10 12 14 16 18 20 22 24
8
7-
6-
5
4
3
2
1
Hatching period
n
0 2 4 6 8 10 12 14 16 18 20 22 24
Nestling period
0 2 4 6 8 10 12 14 16 18 20 22 24
time of day
Figure 1.—Diurnal pattern of nest visits of Hawk Owls at
Ylivieska in 1974 during the incubation (above),
hatching (middle) and nestling periods (below).
+±
>
0)c
o
sco
oQ.O
13-
12-
11 -
10-
9-
8-
7-
6-
5-
4-
3-
2-
1
Incubation period
2 T 6 8 10 12 14 16 18 20 22 24
Hatching period9-.
8-
7-
6-
5-
4-
3-
2-
1-
J]
LL0 2 4 6 8 10 12 14 16 18 20 22 24
time of day
Figure 2.—Diurnal pattern of nest visits by Hawk Owls at
Kauhava in 1977 during the incubation (above) andhatching periods (below). The mean number of visits
per day was 8.0 - 1.2 (N = 7) during incubation and12A - 2.2 (N = 10) during hatching.
bation period, but not only in order to incubate or
bring food, because the observations made in the
Varrio Nature Park also suggest that they took foodfrom the nest to nearby cache sites (2-3 times/day
by the males). The mean number of visits to the nest
increased to 16.6 during the hatching period, andto during the nestling period, with a further in-
crease in the course of the nestling period, the numbervarying between 20 and 30 at first, but between kO
and 50 by the time the young were 16-20 days old.
Once the young had passed the stage of rapid weightincrease nest visits by their parents decreased (fig.
k). The present data also suggest that there may besome variation between parent birds in this respect
153
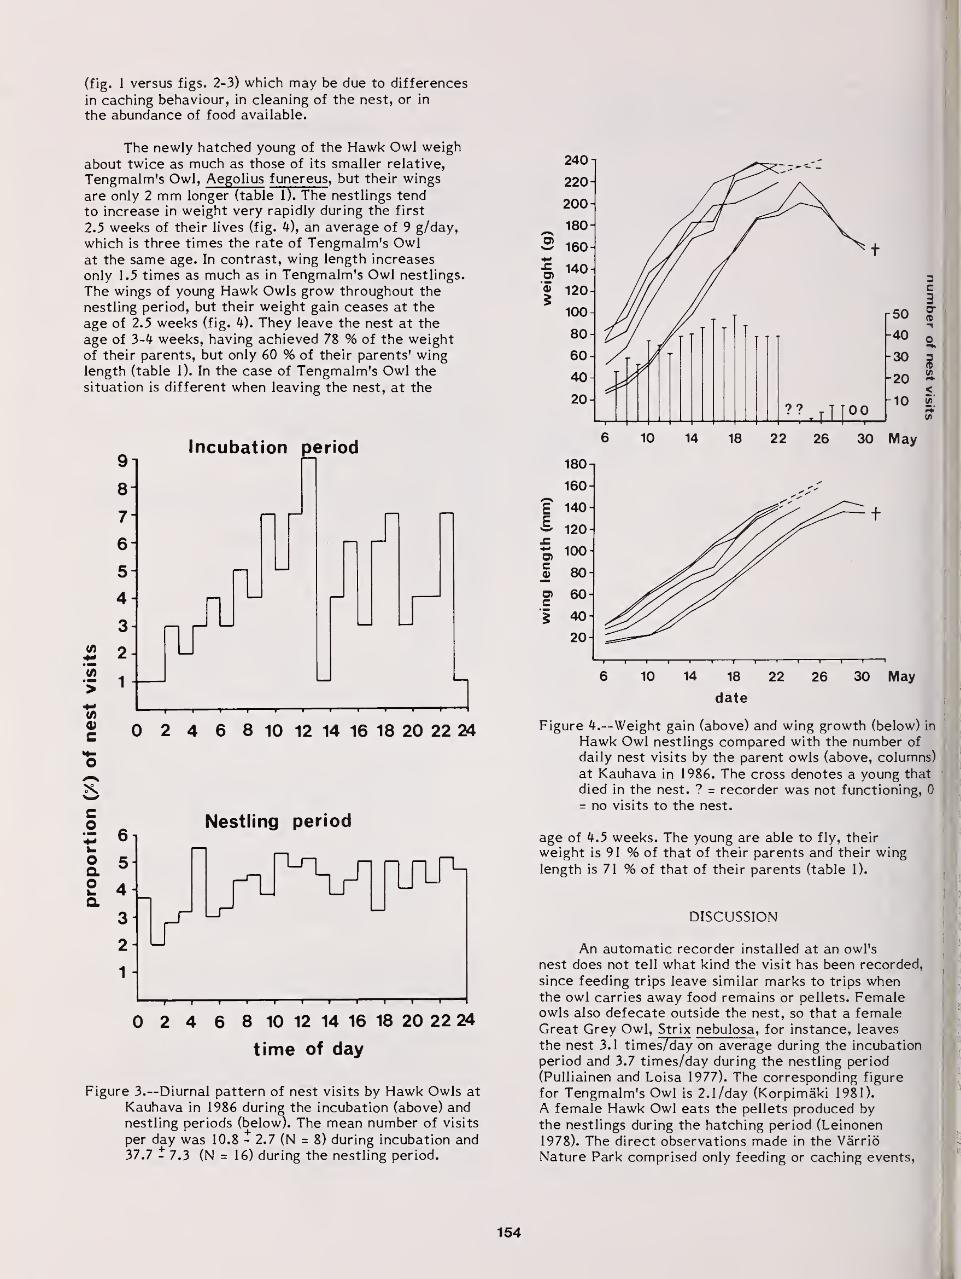
(fig. 1 versus figs. 2-3) which may be due to differences
in caching behaviour, in cleaning of the nest, or in
the abundance of food available.
The newly hatched young of the Hawk Owl weigh
about twice as much as those of its smaller relative,
Tengmalm's Owl, Aegolius funereus , but their wings
are only 2 mm longer (table 1). The nestlings tend
to increase in weight very rapidly during the first
2.5 weeks of their lives (fig. 4), an average of 9 g/day,
which is three times the rate of Tengmalm's Owlat the same age. In contrast, wing length increases
only 1.5 times as much as in Tengmalm's Owl nestlings.
The wings of young Hawk Owls grow throughout the
nestling period, but their weight gain ceases at the
age of 2.5 weeks (fig. 4). They leave the nest at the
age of 3-4 weeks, having achieved 78 % of the weightof their parents, but only 60 % of their parents' winglength (table 1). In the case of Tengmalm's Owl the
situation is different when leaving the nest, at the
(/)
9 mm
>
c
o
oao
9
8"
7-
6
5H
4
3
2-1
1
Incubation period
—i—i i i—i—i
—
iii.i0 2 4 6 8 10 12 14 16 18 20 22 24
6
5^
4
3
2
1-
Nestling period
i i i i i—i i i—i i i
0 2 4 6 8 10 12 14 16 18 20 22 24
time of day
Figure 3.—Diurnal pattern of nest visits by Hawk Owls at
Kauhava in 1986 during the incubation (above) andnestling periods (below). The mean number of visits
per day was 10.8 - 2.7 (N = 8) during incubation and37.7-7.3 (N = 16) during the nestling period.
3C3
i
May
E£
c
c
180-j
160-
140
120
100-
80-
60
40
20
10 14 18
date
22 26 30 May
Figure 4.—Weight gain (above) and wing growth (below) in
Hawk Owl nestlings compared with the number of
daily nest visits by the parent owls (above, columns)
at Kauhava in 1986. The cross denotes a young that
died in the nest. ? = recorder was not functioning, 0
= no visits to the nest.
age of k.5 weeks. The young are able to fly, their
weight is 91 % of that of their parents and their wing
length is 71 % of that of their parents (table 1).
DISCUSSION
An automatic recorder installed at an owl's
nest does not tell what kind the visit has been recorded,
since feeding trips leave similar marks to trips whenthe owl carries away food remains or pellets. Femaleowls also defecate outside the nest, so that a femaleGreat Grey Owl, Strix nebulosa , for instance, leaves
the nest 3.1 times/day on average during the incubation
period and 3.7 times/day during the nestling period
(Pulliainen and Loisa 1977). The corresponding figure
for Tengmalm's Owl is 2.1/day (Korpimaki 1981).
A female Hawk Owl eats the pellets produced bythe nestlings during the hatching period (Leinonen
1978). The direct observations made in the Varrio
Nature Park comprised only feeding or caching events,
154
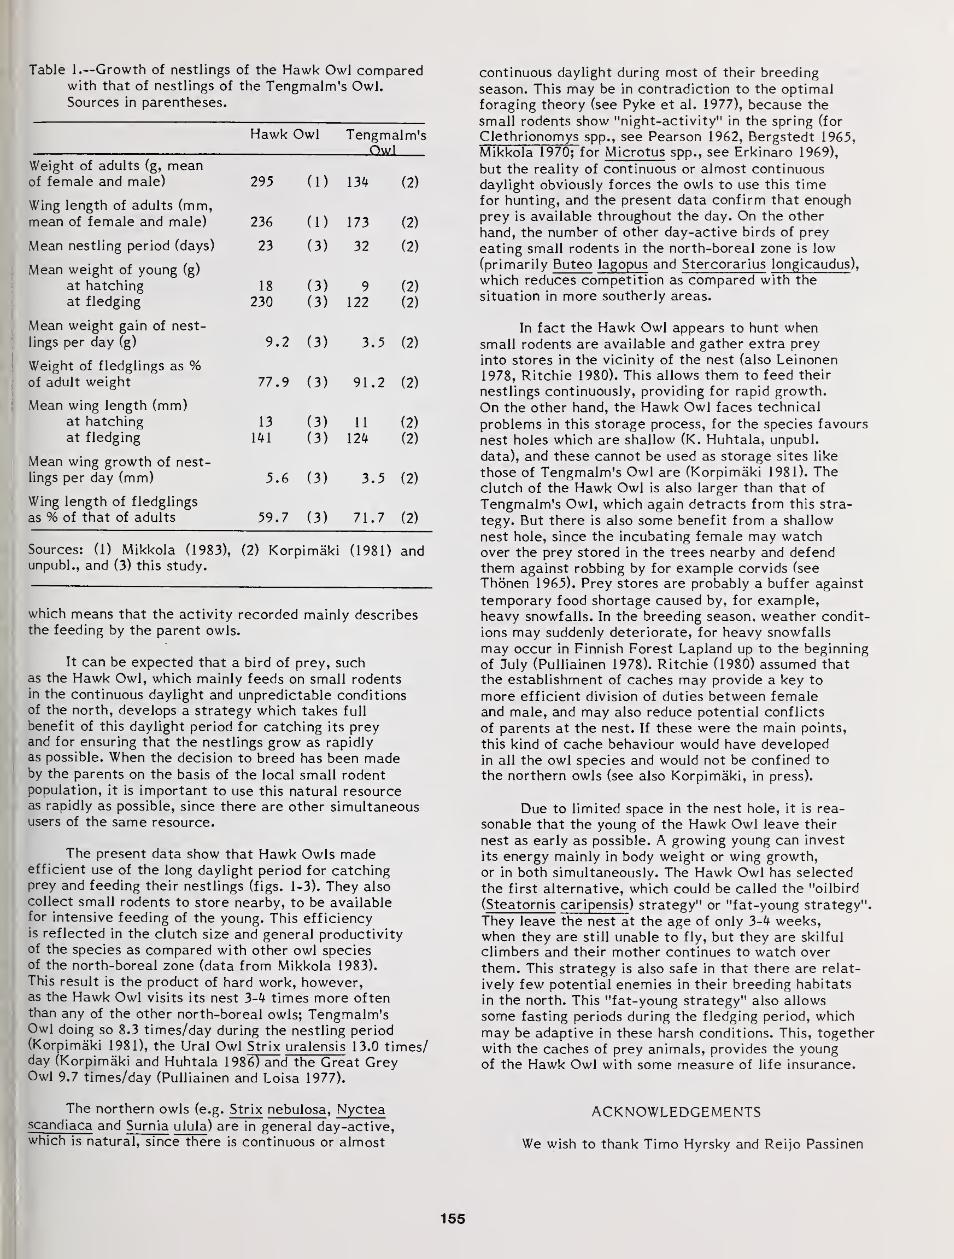
Table 1.--Growth of nestlings of the Hawk Owl comparedwith that of nestlings of the Tengmalm's Owl.Sources in parentheses.
Hawk Owl Tengmalm'sOwl
Weight of adults (g, meanof female and male) 295 (1) 134 (2)
Wing length of adults (mm,mean of female and male) 236 (1) 173 (2)
Mean nestling period (days) 23 (3) 32 (2)
Mean weight of young (g)
at hatching
at fledging
18
230(3)
(3)
9
122(2)
(2)
Mean weight gain of nest-
lings per day (g) 9.2 (3) 3. 5 (2)
Weight of fledglings as %of adult weight 77.9 (3) 91. 2 (2)
Mean wing length (mm)at hatching
at fledging
13
141
(3)
(3)
11
124(2)
(2)
Mean wing growth of nest-
lings per day (mm) 5.6 (3) 3. 5 (2)
Wing length of fledglings
as % of that of adults 59.7 (3) 71. 7 (2)
Sources: (1) Mikkola (1983), (2) Korpimaki (1981) andunpubl., and (3) this study.
which means that the activity recorded mainly describesthe feeding by the parent owls.
It can be expected that a bird of prey, suchas the Hawk Owl, which mainly feeds on small rodentsin the continuous daylight and unpredictable conditionsof the north, develops a strategy which takes full
benefit of this daylight period for catching its preyand for ensuring that the nestlings grow as rapidlyas possible. When the decision to breed has been madeby the parents on the basis of the local small rodentpopulation, it is important to use this natural resourceas rapidly as possible, since there are other simultaneoususers of the same resource.
The present data show that Hawk Owls madeefficient use of the long daylight period for catchingprey and feeding their nestlings (figs. 1-3). They also
collect small rodents to store nearby, to be availablefor intensive feeding of the young. This efficiencyis reflected in the clutch size and general productivityof the species as compared with other owl speciesof the north-boreal zone (data from Mikkola 1983).
This result is the product of hard work, however,as the Hawk Owl visits its nest 3-4 times more oftenthan any of the other north-boreal owls; Tengmalm'sOwl doing so 8.3 times/day during the nestling period(Korpimaki 1981), the Ural Owl Strix uralensis 13.0 times/day (Korpimaki and Huhtala 1986) and the Great GreyOwl 9.7 times/day (Pulliainen and Loisa 1977).
The northern owls (e.g. Strix nebulosa,Nyctea
scandiaca and Surnia ulula) are in general day-active,which is natural, since there is continuous or almost
continuous daylight during most of their breeding
season. This may be in contradiction to the optimalforaging theory (see Pyke et al. 1977), because the
small rodents show "night-activity" in the spring (for
Clethrionomys spp., see Pearson 1962, Bergstedt 1965,Mikkola 1970; for Microtus spp., see Erkinaro 1969),
but the reality of continuous or almost continuous
daylight obviously forces the owls to use this timefor hunting, and the present data confirm that enoughprey is available throughout the day. On the other
hand, the number of other day-active birds of prey
eating small rodents in the north-boreal zone is low(primarily Buteo lagopus and Stercorarius longicaudus ),
which reduces competition as compared with the
situation in more southerly areas.
In fact the Hawk Owl appears to hunt whensmall rodents are available and gather extra prey
into stores in the vicinity of the nest (also Leinonen
1978, Ritchie 1980). This allows them to feed their
nestlings continuously, providing for rapid growth.
On the other hand, the Hawk Owl faces technical
problems in this storage process, for the species favours
nest holes which are shallow (K. Huhtala, unpubl.
data), and these cannot be used as storage sites like
those of Tengmalm's Owl are (Korpimaki 1981). Theclutch of the Hawk Owl is also larger than that of
Tengmalm's Owl, which again detracts from this stra-
tegy. But there is also some benefit from a shallow
nest hole, since the incubating female may watchover the prey stored in the trees nearby and defendthem against robbing by for example corvids (see
Thonen 1965). Prey stores are probably a buffer against
temporary food shortage caused by, for example,heavy snowfalls. In the breeding season, weather condit-
ions may suddenly deteriorate, for heavy snowfalls
may occur in Finnish Forest Lapland up to the beginning
of July (Pulliainen 1978). Ritchie (1980) assumed that
the establishment of caches may provide a key to
more efficient division of duties between femaleand male, and may also reduce potential conflicts
of parents at the nest. If these were the main points,
this kind of cache behaviour would have developedin all the owl species and would not be confined to
the northern owls (see also Korpimaki, in press).
Due to limited space in the nest hole, it is rea-
sonable that the young of the Hawk Owl leave their
nest as early as possible. A growing young can invest
its energy mainly in body weight or wing growth,or in both simultaneously. The Hawk Owl has selected
the first alternative, which could be called the "oilbird
(Steatornis caripensis ) strategy" or "fat-young strategy".
They leave the nest at the age of only 3-4 weeks,when they are still unable to fly, but they are skilful
climbers and their mother continues to watch over
them. This strategy is also safe in that there are relat-
ively few potential enemies in their breeding habitats
in the north. This "fat-young strategy" also allows
some fasting periods during the fledging period, which
may be adaptive in these harsh conditions. This, togetherwith the caches of prey animals, provides the youngof the Hawk Owl with some measure of life insurance.
ACKNOWLEDGEMENTS
We wish to thank Timo Hyrsky and Reijo Passinen
155
for help in the field. Financial support to EK from the
Finnish Cultural Foundation, the Emil Aaltonen Foundat-ion and the Academy of Finland is gratefully acknow-ledged.
LITERATURE CITED
Bergstedt, B. 1965. Distribution, reproduction, growthand dynamics of the rodent species Clethrionomysglareolus (Schreber), Apodemus flavicollis (Melc-hior) and Apodemus sylvaticus (Linne) in southern
Sweden. Oikos 16:132-160.
Erkinaro, E. 1969. Der Phasenwechsel der lokomotischenAktivitat bei Microtus agrestis (L.), M. arvalis
(Pall.) und M. oeconomus (Pall.). Aquilo, Ser.
Zool. 8:1-29.
Korpimaki, E. 1981. On the ecology and biology of
Tengmalm's Owl (Aegolius funereus ) in SouthernOstrobothnia and Suomenselka, western Finland.
Acta Univ. Oul. A 188. Biol. 13:1-84.
, in press. Prey caching of breeding Tengmalm'sOwls Aegolius funereus as a buffer against tempo-rary food shortage. Ibis 129.
and Huhtala, K. 1986. Nest visit frequencies
and activity patterns of Ural Owls Strix uralensis.
Ornis Fenn. 63:42-46.
Leinonen, A. 1978. Hawk Owl breeding biology andbehaviour at nest. Lintumies 13:13-18. (In Finnish
with summary in English).
Mikkola, H. 1970. On the activity and food of the
Pygmy Owl Glaucidium passerinum during breed-ing. Ornis Fenn. 47:10-14.
1972. Hawk Owls and their prey in northern
Europe. British Birds 65:453-460.
1983. Owls of Europe. T & A D Poyser, Calton.Pearson, A. M. 1962. Activity patterns, energy meta-
bolism, and growth rate of the voles Clethrionomysrufocanus and C. glareolus in Finland. Ann.Zool. Soc. "Vanamo" 24:1-58.
Pulliainen, E. 1978. Influence of heavy snowfall in
June 1977 on the life of birds in NE Finnish
Forest Lapland. Aquilo, Ser. Zool. 18:1-14.
and Loisa, K. 1977. Breeding biology and food
of the Great Grey Owl, Strix nebulosa , in north-eastern Finnish Forest Lapland. Aquilo, Ser.
Zool. 17:23-33.
Pyke, G. H., Pulliam, H. R. and Charnov, E. L. 1977.
Optimal foraging: a selective review of theoryand test. Quart. Rev. Biol. 52:137-154.
Ritchie, R. J. 1980. Food caching behaviour of nesting
wild hawk owls. Raptor Res. 14:59-60.
Thonen, W. 1965. Tannenhaher plundern Beutevorrate des
Sperlingkauzes. Ornithol. Beobachter 62:196-197.
This paper constitutes Report No. 170 fromthe Varrio Subarctic Research Station of the University
of Helsinki.
156
Sexual Size Dimorphism and Life-History Traits
of Tengmalm's Owl: A Review 1
Erkkl Korpimaki2
Abstract . --The ecology of Tengmalm's Owl was
studied for 21 years in western Finland. At the
beginning of the nestling period, females are on
average 43 % heavier than males, but their wings
are only 5 % longer than those of males. The
degree of sexual dimorphism in weight is higher
than that of other European owls. Large femaleshave more striking force and catch more voles,
whereas small males can also take more agile prey,
such as birds. Because of sexual size dimorphism,scarcity of nest-holes and vole cycles, a majorityof males is resident but females nomadic in
western Finland. Thus, local populationfluctuations of females seem to be more pronouncedthan those of males. Females usually enter the
breeding population as yearlings, whereas malesonly when they are 2-year-old. These intersexualdifferences in life-history traits suggest that
females may be more r-selected than males.
INTRODUCTION
The ecology of Tengmalm's Owl (BorealOwl in North America) Aegolius funereuswas studied during 1966-86 in SouthOstrobothnia (63°N, 23°E) , westernFinland. Methods were described in otherpapers (e.g. Korpimaki 1981, 1983, 1984,1985a, 1986a, 1987a, b). This paper givesa review of results and also summarizessome other European studies on thisspecies. The main purpose is to comparethe life-history traits of female and maleTengmalm's Owls, because the sexes showsize dimorphism, with females beingmarkedly larger than males.
Paper presented at the symposium,Biology and Conservation of NorthernForest Owls, Feb. 3-7, 1987, Winnipeg,Manitoba. USDA Forest Service GeneralTechnical Report RM-142.
2Erkki Korpimaki is Research Worker
of Academy of Finland at Department ofZoology, University of Oulu, Oulu,Finland. Present address: kp . 4, SF-62200Kauhava, Finland.
DIVISION OF DUTIES BETWEEN SEXES
Both the incubation and nestlingperiod of Tengmalm's Owl take approx. 30days (Korpimaki 1981), and thereafterfledglings are fed by mates for at leastthree weeks (Marz 1968). As other birdsof prey, male and female divide duties inthe breeding season. The male providesnearly all food for the whole family frombefore the egg-laying until the young arethree weeks old, but he does not take partin incubating the eggs or brooding theyoung (Korpimaki 1981).
The female stays in nest-hole fromone week before the start of egg-layinguntil the young are three weeks old, andis entirely fed by the male. So she isresponsible for producing and incubatingthe eggs and for brooding the young. Atthe end of the nestling period, she takespart in feeding, but only at a low rate(Korpimaki 1981 )
.
SEXUAL SIZE DIMORPHISM
At the beginning of the nestlingperiod, female Tengmalm's Owls are onaverage 43 % heavier than males, but theirwings are only 5 % longer than those of
157

males (Korpimaki 1986b) . The degree ofsexual dimorphism in weight is higher thanthat of other European owls (Lundberg1986).
Until now,hypotheses have
no fewer than at least 20been advanced to explain
the reversed sexual size dimorphism inbirds of prey. Lundberg (1986), afteranalysing size dimorphism in Europeanowls, suggested, that female owls arelarger than males in order to reduce theeffects of temporary food shortage duringthe breeding period. This "starvationhypothesis" yields at least sixpredictions (Korpimaki 1986b, Lundberg1986): (1) northern species should be moredimorphic in weight than southern ones,(2) earlier breeding species at a givenlatitude should be more dimorphic, (3)female size and (4) the degree ofdimorphism should increase with foodunpredictability at breeding, (5) pairslaying early in the season, underunpredictable weather and food conditions,should be more dimorphic, and (6) havelarger females, than those laying later,when environmental conditions are morecons tant
.
Lundberg (1986) showed that theprediction 1 was true in European owls. Inwestern Finland, early-breeding species intwo communities of vole-eating birds ofprey were more dimorphic in weight thanlate-breeding ones, with Tengmalm's Owlbeing the earliest-breeding and mostweight dimorphic species (Korpimaki1986b). This is consistent with theprediction 2. The degree of weight
between mates within pairs ofOwl correlated negatively withof egg-laying, while the wing
length of males correlated positively withthe laying date of their partners. Clutchsize and number of fledglings produceddecreased with the degree of weightdimorphism within owl pairs (Korpimaki1986b). These results are in agreementwith the predictions 5 and 6.
Because of clear division of dutiesin the breeding season, differentselective factors act on females andmales. It seems that the large size offemale Tengmalm's Owls has evolved inorder to increase their fasting endurance.Food items are delivered to the female bythe male at long and unpredictableintervals, because breeding starts at theend of March or at the beginning of Aprilunder adverse weather conditions. At thattime, usually occurring snowfalls decreasethe hunting success of the male (Korpimaki
1987c). In contrast, selection acts onmales to become efficient foragers. Aerialagility increases with decreasing winglength (Andersson and Norberg 1981). Thus,
dimorphi smTengmalm'
s
the timing
Table 1. --Number of available nest-boxes orholes, number of Tengmalm's Owl nests,percentage of nest-holes used, number oi
unpaired males, and number of nests inwhich parent owls were trapped during1979-86 in western Finland.
Year Number Number Perof of centholes nests used
( 1
)
Numberofun-pairedma 1 es(2)
Number ofnests inwhi chparentowls weretrapped (3)
Females Males
1979 355 37 10 . 4 6 31 14
1980 395 24 6 . 1 16 24 9
1981 395 *10 2 . 5 18 7 6
1982 415 34 8 . 2 18 34 25
1983 450 27 6 . 0 30 25 191984 450 10 2 . 2 4 10 7
1985 450 47 10 . 4 11 35 361986 450 88 19 . 6 15 81 76
Tot
.
3360 277 8 . 2 118 247 192
Note. (1) See Korpimaki (1981, 1984,1985a, 1986a, 1987a, b) for methods used in
collecting data on population fluctuationsand breeding performance.
(2) In late February and March (i.e.before the breeding season) nest-sitesoccupied by male Tengmalm's Owls werelocalized by listening to displays, usingthe point-stop method and playback technique(e.g. Lundberg 1978, Holmberg 1979). Laterchecking visits to nest-holes revealed themales, which were stayed unpaired.
(3) See Korpimaki (1981, 1983, 1987a)for trapping methods.
small males probably are more effectiveand economical hunters and bettercompetitors for good territories and nest-holes (Korpimaki 1986b). In conclusion,the "starvation hypothesis" seems toexplain the high degree of reversed sizedimorphism in Tengmalm's Owl.
Olsen and Olsen (1984) suggested thatreversed size dimorphism of birds of preymight be explained by "sexual selection"(as first outlined by Darwin 1871); namelythat competition between females for themore scarce resource, the males, selectsfor large females. Males may be the morescarce resource, because they holdterritories with good nest-site and foodsupply. This explanation seems to holdtrue for the European SparrowhawkAccipiter nisus in Scotland (Newton 1986).The sex ratio of this raptor is biased infavour of females, because they arelonger-lived than males. In contrast,
158
there is generally a surplus of males inTengmalm's Owl populations, probablybecause of larger mortality of females incomparison to males (Korpimaki et al
.
1987). For instance, on average 30 % ofmales in western Finland were unpairedduring 1979-86 (table 1). The mostprobable reason is a lack of females,because a majority of these males occupiedterritories, which had earlier beensuitable for breeding and where a nest-boxwas available. Thus, male Tengmalm's Owlsmay compete for the scarce resource, thefemales. So it seems that the high degreeof sexual dimorphism of this owl cannot beexplained by "sexual selection", but onlyfurther studies will show, which factorsare most important.
HUNTING HABITS
Male Tengmalm's Owls have a widerprey spectrum than females; females catchmore voles, whereas males take more birds(Korpimaki 1987d). These differences maybe caused by the following factors. (1)Small, nimble males are better adapted tocatch birds, which are very agile prey.(2) Large females have more striking forceand are therefore better suited forhunting relatively large voles, such asMicrotus spp. in Fennos cand i a . (3) Agilemales may more often hunt in forest and"clumsy" females in open ground. (4)Females have smaller wing-load in relationto their body weight than males; so theymay more often perch when hunting, whereasmales may more often quarter. Perching ismore suitable for catching small mammalsand quartering for capturing birds.However, these explanations are onlysuggestions, because there are no data onpossible differences in prey preference,and hunting habitats or habits betweenfemale and male Tengmalm's Owls. Theformer should be studied experimentally incaptivity and the latter by rad i o-t rackingin autumn or winter, when both sexes huntonly for themselves.
WINTERING STRATEGIES
Tengmalm's Owl is a hole-nester,which suffers from a scarcity of nest-sites at least in Fennoscandian coniferousforests (von Haartman 1968, Lundberg1979). Site-tenacious owls benefit byfamiliarity with local food resources,refuges from predators and nest-sites(Hinde 1956, Korpimaki 1987a). Both ascarcity of nest-sites and familiaritywith territories favour residency.
Tengmalm's Owl uses small rodents,mainly voles, as its staple food. The mostimportant alternative prey groups are
shrews and birds (Sulkava and Sulkava1971, Korpimaki 1981, 1986c). Volepopulations are relatively stable incentral Europe, but show 3-5-year cyclesin Fennoscandia , with most pronouncedfluctuations in the north and leastpronounced in the south (Hansson andHenttonen 1985). However, abundances ofvoles in various areas fluctuateasynchronously (e.g. Myllymaki et al
.
1977); so this cyclical food productionfavours adult nomadism (Andersson 1980).Because of its small body size, Tengmalm'sOwl cannot hunt effectively small rodentsprotected by deep snow layer (Korpimaki1987d). In general, the persistence anddepth of snow cover increase northwards inFennoscandia, although the snow layer insouthern and western Finland is muchshallower than at the same latitudes ineastern Finland and Sweden. Thus, it wouldbe adaptive for Tengmalm's Owls tooverwinter in areas of shallow snow cover.
The above-mentioned oppositeselective pressures result in differencesin breeding dispersal (sensu Greenwood andHarvey 1982) between the sexes: (1)Probably all males and a majority offemales are resident in central Europe,(2) a majority of males is resident but amajority of females nomadic in thetransition zone (e.g. in southern andwestern Finland), and (3) many males arealso nomadic in northern Fennoscandia(Korpimaki 1986a, Ldfgren et al . 1986).According to Korpimaki et al . (1987), thesimilar intersexual differences are alsoevident in the natal dispersal (sensuGreenwood and Harvey 1982).
The resident habit of male has beensuggested to have evolved to ensure accessto nest-holes, which are in short supply(Lundberg 1979). Thus, males must guardtheir nest-holes against competitors alsooutside the breeding season. Agile malesare better able to hunt alternative preyand in forest than "clumsy" females. Theavailability of small mammals and birds inwinter is better in forests than in openground (Korpimaki 1986c). Because the maleis responsible for food provision in thebreeding season, he benefits by thedetailed knowledge of the territory.Resident males can better compete for a
scarce resource, females, and thus theirpartners lay earlier and larger clutchesthan those of immigrant males (Korpimaki1987a). These factors may further favourthe residency of males.
Females are more specialized to preyon small rodents than are males, and thusthey willingly overwinter in areas of highabundance of voles and shallow snow cover.They benefit by familiarity with theterritory only during a short time period
159
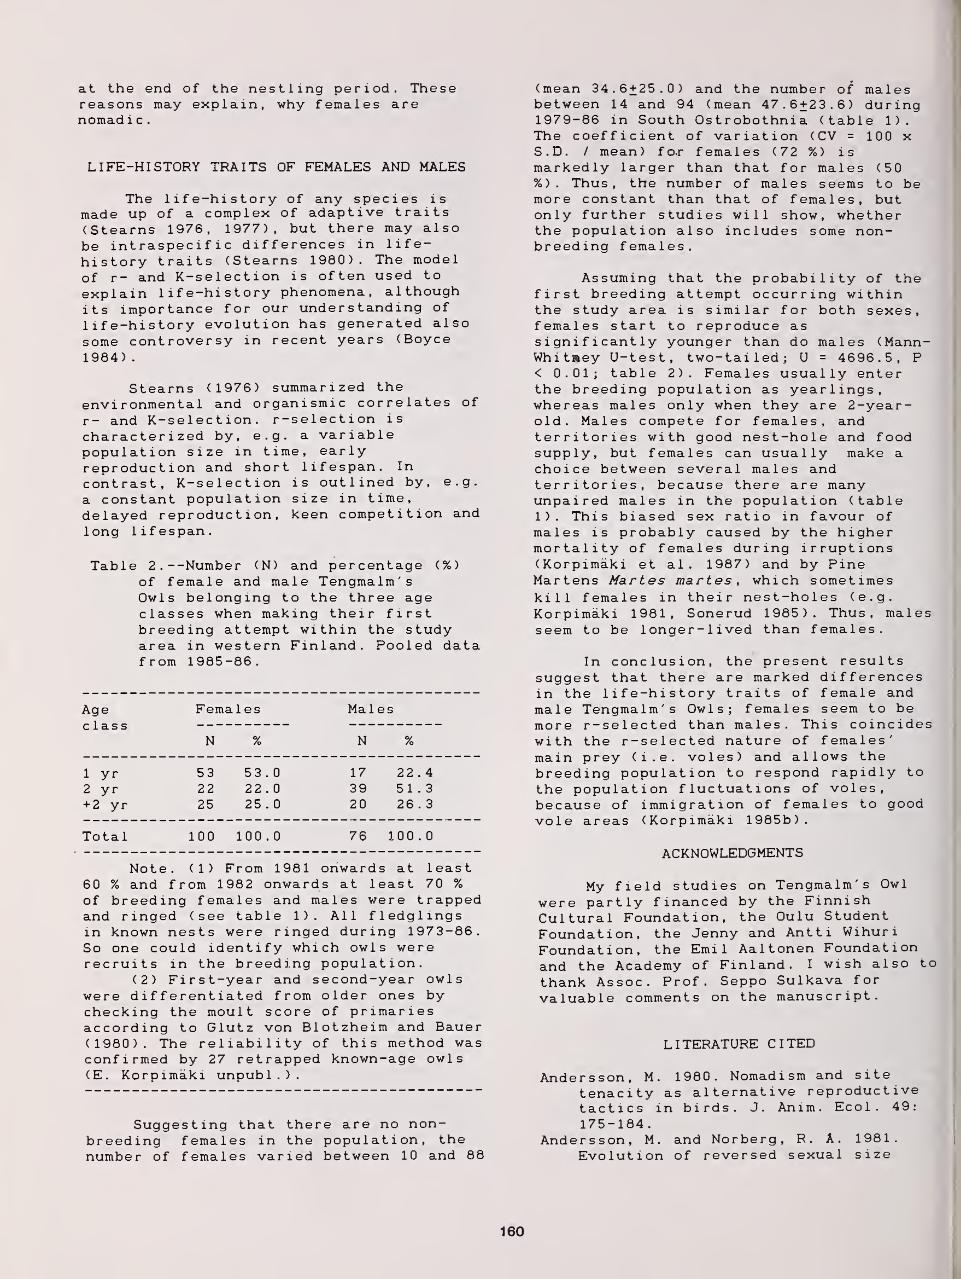
at the end of the nestling period. Thesereasons may explain, why females arenomad i c
.
LIFE-HISTORY TRAITS OF FEMALES AND MALES
The life-history of any species ismade up of a complex of adaptive traits(Stearns 1976, 1977), but there may alsobe intraspecif ic differences in life-history traits (Stearns 1980) . The modelof r- and K-selection is often used to
explain life-history phenomena, althoughits importance for our understanding of
life-history evolution has generated alsosome controversy in recent years (Boyce1984)
.
Stearns (1976) summarized theenvironmental and organismic correlates of
r- and K-selection. r-selection is
characterized by, e.g. a variablepopulation size in time, earlyreproduction and short lifespan. In
contrast, K-selection is outlined by, e.g.
a constant population size in time,delayed reproduction, keen competition andlong lifespan.
Table 2. --Number (N) and percentage (%)
of female and male Tengmalm'sOwls belonging to the three ageclasses when making their firstbreeding attempt within the studyarea in western Finland. Pooled datafrom 1985-86.
Ageclass
Females Males
N % N %
1 yr2 yr+ 2 yr
532225
53 .
22 .
25 .
0
0
0
173920
225126
4
3
3
Total 100 100 . 0 76 100 0
Note. (1) From 1981 onwards at least60 % and from 1982 onwards at least 70 %of breeding females and males were trappedand ringed (see table 1). All fledglingsin known nests were ringed during 1973-86.So one could identify which owls wererecruits in the breeding population.
(2) First-year and second-year owlswere differentiated from older ones bychecking the moult score of primariesaccording to Glutz von Blotzheim and Bauer(1980). The reliability of this method wasconfirmed by 27 retrapped known-age owls(E. Korpimaki unpubl . )
.
Suggesting that there are no non-breeding females in the population, thenumber of females varied between 10 and 88
(mean 34.6+25.0) and the number of malesbetween 14 and 94 (mean 47.6+23.6) during1979-86 in South Ostrobothnia (table 1).The coefficient of variation (CV = 100 xS.D. / mean) fo.r females (72 %) ismarkedly larger than that for males (50%) . Thus, the number of males seems to bemore constant than that of females, butonly further studies will show, whetherthe population also includes some non-breeding females.
Assuming that the probability of thefirst breeding attempt occurring withinthe study area is similar for both sexes,females start to reproduce assignificantly younger than do males (Mann-Whitaey U-test, two-tailed; U = 4696.5, P< 0.01; table 2). Females usually enterthe breeding population as yearlings,whereas males only when they are 2-year-old. Males compete for females, andterritories with good nest-hole and foodsupply, but females can usually make achoice between several males andterritories, because there are manyunpaired males in the population (table1). This biased sex ratio in favour ofmales is probably caused by the highermortality of females during irruptions(Korpimaki et al . 1987) and by PineMartens Martes martes , which sometimeskill females in their nest-holes (e.g.Korpimaki 1981, Sonerud 1985). Thus, malesseem to be longer-lived than females.
In conclusion, the present resultssuggest that there are marked differencesin the life-history traits of female andmale Tengmalm's Owls; females seem to bemore r-selected than males. This coincideswith the r-selected nature of females'main prey (i.e. voles) and allows thebreeding population to respond rapidly tothe population fluctuations of voles,because of immigration of females to goodvole areas (Korpimaki 1985b)
.
ACKNOWLEDGMENTS
My field studies on Tengmalm's Owl
were partly financed by the FinnishCultural Foundation, the Oulu StudentFoundation, the Jenny and Antti WihuriFoundation, the Emil Aaltonen Foundationand the Academy of Finland. I wish also to
thank Assoc. Prof. Seppo Sulkava for
valuable comments on the manuscript.
LITERATURE CITED
Andersson, M. 1980. Nomadism and sitetenacity as alternative reproductivetactics in birds. J. Anim. Ecol. 49:175-184
.
Andersson, M. and Norberg, R. A. 1981.Evolution of reversed sexual size
160
dimorphism and role partitioning amongpredatory birds, with a size scalingof flight performance. Biol. Journ.Linn. Soc. 15: 105-130.
Boyce, M. S. 1984. Restitution of r- andK-selection as a model of density-dependent natural selection. Ann. Rev.Ecol. Syst. 15: 427-447.
Darwin, C. 1871. The descent of man andselection in relation to sex. Murray,London
.
Glutz von Blotzheim, U. N. and Bauer, K.M. 1980. Handbuch der Vbgel Mittel-europas . Vol. 9. Akademische Verlags-gese 1 1 s chaf t , Wiesbaden.
Greenwood, P. J. and Harvey, P. H. 1982.The natal and breeding dispersal inbirds. Ann. Rev. Ecol. Syst. 13: 1-21.
von Haartman, L. 1968. The evolution ofresident versus migratory habit inbirds. Some considerations. OrnisFenn. 45: 1-7.
Hansson, L. and Henttonen, H. 1985.Gradients in density variations ofsmall rodents: the importance oflatitude and snow cover. Oecologia(Berlin) 67: 394-402.
Hinde, R. A. 1956. The biologicalsignificance of the territories ofbirds. Ibis 98: 340-369.
Holmberg, T. 1979. Point transect censusof Tengmalm's Owl - a methodologicalstudy. Var Fagelvarld 38: 237-244.
Korpimaki, E. 1981. On the ecology andbiology of Tengmalm's Owl (Aegoliusfunereus) in Southern Ostrobothnia andSuomenselka, western Finland. ActaUniv. Oul. A 118. Biol. 13: 1-84.
Korpimaki, E. 1983. Polygamy in Tengmalm'sOwl Aegolius funereus. Ornis Fenn.60: 86-87.
Korpimaki, E. 1984. Clutch size andbreeding success of Tengmalm's OwlAegolius funereus in natural cavitiesand nest-boxes. Ornis Fenn. 61: 80-83.
Korpimaki, E. 1985a. Clutch size andbreeding success in relation to nest-box size in Tengmalm's Owl Aegoliusfunereus. Holarctic Ecol. 8: 175-180.
Korpimaki, E. 1985b. Rapid tracking ofmicrotine populations by their avianpredators: possible evidence forstabilizing predation. Oikos 45: 281-284 .
Korpimaki, E. 1986a. Gradients inpopulation fluctuations of Tengmalm'sOwl Aegolius funereus in Europe.Oecologia (Berlin) 69: 195-201.
Korpimaki, E. 1986b. Reversed sizedimorphism in birds of prey,especially in Tengmalm's Owl Aegoliusfunereus: a test of the "starvationhypothesis". Ornis Scand . 17: 309-315.
Korpimaki, E. 1986c. Seasonal changes inthe food of the Tengmalm's owlAegolius funereus in western Finland.Ann. Zool. Fennici 23: 339-344.
Korpimaki, E. 1987a. Selection for nest-
hole shift and tactics of breedingdispersal in Tengmalm's Owl Aegoliusfunereus. J. Anim. Ecol. 56: 185-196.
Korpimaki, E. 1987b. Timing of breeding ofTengmalm's Owl Aegolius funereus inrelation to vole dynamics in westernFinland. Ibis 129: 58-68.
Korpimaki, E. 1987c. Prey caching ofbreeding Tengmalm's Owls Aegoliusfunereus as a buffer against temporaryfood shortage. Ibis 129 (in press).
Korpimaki, E. 1987d. Wintering strategiesof Tengmalm's Owl Aegolius funereus.Aquilo Ser. Zool. (in press).
Korpimaki, E. , Lagerstrdm, M. and Saurola,P. 1987. Field evidence for nomadismin Tengmalm's Owl Aegolius funereus.Ornis Scand. 18 (in press).
Lundberg, A. 1978. Census methods for theural owl Strix uralensis and theTengmalm's owl Aegolius funereus.Anser Suppl . 3: 171-175.
Lundberg, A. 1979. Residency, migrationand a compromise: adaptations tonest-site scarcity and foodspecialization in three Fennoscandianowl species. Oecologia (Berlin) 41:273-281 .
Lundberg, A. 1986. Adaptive advantages ofreversed sexual size dimorphism inEuropean owls. Ornis Scand. 17: 133-140 .
Lbfgren, 0., Hdrnfeldt, B. and Carlsson,B. G. 1986. Site tenacity andnomadism in Tengmalm's Owl (Aegoliusfunereus (L.)) in relation to cyclicfood production. Oecologia (Berlin)69: 321-326.
Myllymaki, A., Christianssen , E. andHansson, L. 1977. Five yearsurveillance of small mammal abundancein Scandinavia. Eppo Bull. 7: 385-396.
Marz, R. 1968. Der Rauhfus skauz . Die neueBrehm-Bucherei , Wittenberg Luther-stadt
.
Newton, I. 1986. The Sparrowhawk. T. & A.
D. Poyser, Calton.Olsen, P. and Olsen, J. 1984. Book review.
The Falcons of the World. Aust. Wildl.Res. 11: 205-206.
Sonerud, G. A. 1985: Nest hole shift in
Tengmalm's Owl Aegolius funereus as
defence against nest predationinvolving long-term memory in thepredator. J. Anim. Ecol. 54: 179-192.
Stearns, S. C. 1976. Life-history tactics:a review of the ideas. Quart. Rev.Biol. 51: 2-47.
Stearns, S. C. 1977. The evolution of lifehistory traits: a critique of thetheory and a review of the data. Ann.Rev. Ecol. Syst. 8: 145-171.
Stearns, S. C. 1980. A new view of life-history evolution. Oikos 35: 266-281.
Sulkava. P. and Sulkava, S. 1971. Dieni s tzei t 1 i che Nahrung des Rauhfuss-kauzes Aegolius funereus in Finnland1958-67. Ornis Fenn. 48: 117-124.
161
Annual, Seasonal, and Nightly Variation in Calling
Activity of Boreal and Northern Saw-Whet Owls 1
David A. Palmer 2
Abstract.— Calling activity of Boreal and NorthernSaw-whet Owls was monitored over a 6-year (1980-1985) periodin north-central Colorado. Intensive surveys were completedin 1983 and 1984 to determine nightly variations in callingintensity and to assess the influence^ of environmentalconditions on calling activity. Calling activity of bothspecies fluctuated considerably over the 6-year period andappeared to be associated with changes in owl preypopulations. Both species reached peak calling activity in1984 when 14 saw-whet and 27 boreal owls were heard. Over-all length of the courtship period ranged from 31 to 119
days (avg. = 63) for boreal owls and from 70 to 93 days(avg. = 81.5) for saw-whet owls. Calling activity of borealowls was slightly influenced by wind, precipitation and moonphase while cloud cover and temperature had no apparenteffect. Saw-whet owl calling activity was influenced bywind and slightly by moon phase.
INTRODUCTION
Both the Boreal Owl (Aegolius funereusrichardsonii ) and the Northern Saw-whet Owl ( A.acadicus ) are small, nocturnal owls which havewide distributions in the northern regions ofNorth America (Burton 1977, AOU 1983). Because oftheir small size, secretive habits and generallynorthern range, the owls' biologies are poorlyunderstood, especially regarding habitat require-ments and breeding biology. Although generallysecretive, both species are extremely vocal duringthe early breeding season and can be located withrelatively little effort using nocturnal surveys(Holmberg 1979, Webb 1982). Kuhk (1953)considered Tengmalm's owl (A^_ f\_ funereus), one ofthe European subspecies of the boreal owl, to beone of the most persistent singers among Europeanowls and found the males easy to locate for abrief period in the spring. Information on call-ing activity of boreal owls in North America is
limited to the behavioral significance of vocal-izations (Bondrup-Nielsen 1978, 1984, Meehan 1980)
while little is known about any facet of saw-whetowl calling activity.
Nocturnal surveys have been used to estimateTengmalm's owl populations in Europe (Lundberg1978, Holmberg 1979) and recently to locatebreeding boreal owls well south of theirpreviously recognized breeding range (Eckert andSavaloja 1979, Hayward and Carton 1983, Palmer andRyder 1984). Webb (1982) used nocturnal surveysto determine the populations status of fivespecies of montane owls, including boreal and saw-whet owls in the Colorado mountains. Nocturnalsurveys can be utilized to determine habitatpreferences, population densities andfluctuations, and to aid in nest location. Noc-turnal surveys, utilizing both road counts ofcalling owls and elicitation of owl calls usingplayback recordings, have been used extensively todetermine the status of several owls species inNorth America (Call 1978, Fuller and Mosher 1981,Johnson et al. 1981) In this study, boreal andsaw-whet owl calling activity was monitored over a6-year period (1980-85) in northern Colorado todetermine how calling activity fluctuates on anannual, seasonal and nightly basis. Additionally,information was collected to determine how variousenvironmental conditions influence the callingactivity of both owl species.
1Paper presented at the symposium, Biology andConservation of Northern Forest Owls, Feb. 3-7,
1987, Winnipeg, Manitoba. USDA Forest ServiceGeneral Technical Report RM-142
.
^David A. Palmer is a Wildlife Biologist atWildlife International Ltd., Easton, Md.
STUDY AREA AND METHODS
The study area, located in western Larimerand eastern Jackson counties in north-centralColorado, ranged in elevation from 2370 to 3300 m.
The higher elevation areas were covered by spruce-fir (Picea engelmannii-Abies lasiocarpa ) and
162
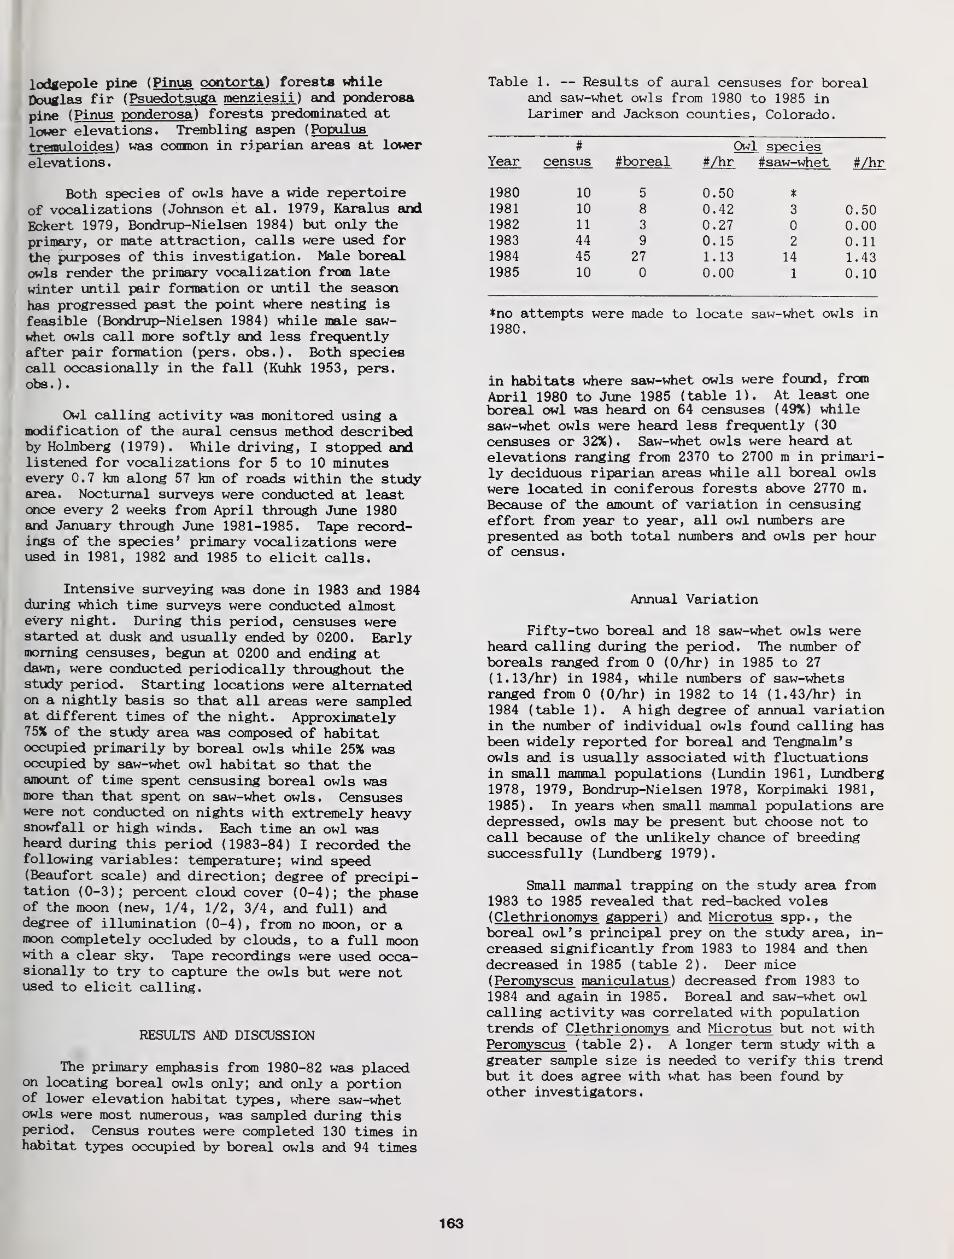
lodgepole pine (Pinus contorta) forests while
Douglas fir (Psuedotsuga menziesii ) and ponderosa
pine (Pinus ponderosa ) forests predominated at
lower elevations. Trembling aspen (Populus
tremuloides ) was common in riparian areas at lower
elevations
.
Both species of owls have a wide repertoire
of vocalizations (Johnson et al . 1979, Karalus andEckert 1979, Borrirup-Nielsen 1984) but only the
primary, or mate attraction, calls were used for
the purposes of this investigation. Male borealowls render the primary vocalization from late
winter until pair formation or until the season
has progressed past the point where nesting is
feasible (Bondrup-Nielsen 1984) while male saw-whet owls call more softly and less frequentlyafter pair formation (pers. obs.). Both speciescall occasionally in the fall (Kuhk 1953, pers.obs. )
.
Owl calling activity was monitored using amodification of the aural census method describedby Hoimberg (1979). While driving, I stopped andlistened for vocalizations for 5 to 10 minutesevery 0.7 km along 57 km of roads within the studyarea. Nocturnal surveys were conducted at leastonce every 2 weeks from April through June 1980and January through June 1981-1985. Tape record-ings of the species' primary vocalizations wereused in 1981, 1982 and 1985 to elicit calls.
Intensive surveying was done in 1983 and 1984during which time surveys were conducted almostevery night. During this period, censuses werestarted at dusk and usually ended by 0200. Earlymorning censuses, begun at 0200 and ending atdawn, were conducted periodically throughout thestudy period. Starting locations were alternatedon a nightly basis so that all areas were sampledat different times of the night. Approximately75% of the study area was composed of habitatoccupied primarily by boreal owls while 25% wasoccupied by saw-whet owl habitat so that theamount of time spent censusing boreal owls wasmore than that spent on saw-whet owls. Censuseswere not conducted on nights with extremely heavysnowfall or high winds. Each time an owl washeard during this period (1983-84) I recorded thefollowing variables: temperature; wind speed(Beaufort scale) and direction; degree of precipi-tation ( 0-3 ) ; percent cloud cover ( 0-4 ) ; the phaseof the moon (new, 1/4, 1/2, 3/4, and full) anddegree of illumination (0-4), from no moon, or amoon completely occluded by clouds, to a full moonwith a clear sky. Tape recordings were used occa-sionally to try to capture the owls but were notused to elicit calling.
RESULTS AND DISCUSSION
The primary emphasis from 1980-82 was placedon locating boreal owls only; and only a portionof lower elevation habitat types, where saw-whetowls were most numerous, was sampled during thisperiod. Census routes were completed 130 times inhabitat types occupied by boreal owls and 94 times
Table 1 . — Results of aural censuses for borealand saw-whet owls from 1980 to 1985 inLarimer and Jackson counties, Colorado.
# Owl speciesYear census #boreal #/hr #saw-whet #/hr
1980 10 5 0.50 *
1981 10 8 0.42 3 0.501982 11 3 0.27 0 0.001983 44 9 0.15 2 0.111984 45 27 1.13 14 1.431985 10 0 0.00 1 0.10
*no attempts were made to locate saw-whet owls in1980.
in habitats where saw-whet owls were found, from
April 1980 to June 1985 (table 1). At least oneboreal owl was heard on 64 censuses (49%) whilesaw-whet owls were heard less frequently (30
censuses or 32%) . Saw-whet owls were heard atelevations ranging from 2370 to 2700 m in primari-ly deciduous riparian areas while all boreal owlswere located in coniferous forests above 2770 m.
Because of the amount of variation in censusingeffort from year to year, all owl numbers arepresented as both total numbers and owls per hourof census.
Annual Variation
Fifty-two boreal and 18 saw-whet owls wereheard calling during the period. The number ofboreals ranged from 0 (0/hr) in 1985 to 27(1.13/hr) in 1984, while numbers of saw-whetsranged from 0 (0/hr) in 1982 to 14 (1.43/hr) in1984 (table 1). A high degree of annual variationin the number of individual owls found calling hasbeen widely reported for boreal and Tengmalm'sowls and is usually associated with fluctuationsin small mammal populations (Lundin 1961, Lundberg1978, 1979, Bondrup-Nielsen 1978, Korpimaki 1981,
1985). In years when small mammal populations aredepressed, owls may be present but choose not tocall because of the unlikely chance of breedingsuccessfully (Lundberg 1979).
Small mammal trapping on the study area from1983 to 1985 revealed that red-backed voles
( Clethrionomys gapperi ) and Microtus spp. , theboreal owl's principal prey on the study area, in-creased significantly from 1983 to 1984 and thendecreased in 1985 (table 2). Deer mice( Peromyscus maniculatus ) decreased from 1983 to1984 and again in 1985. Boreal and saw-whet owlcalling activity was correlated with populationtrends of Clethrionomys and Microtus but not withPeromyscus (table 2). A longer term study with agreater sample size is needed to verify this trendbut it does agree with what has been found byother investigators.
163
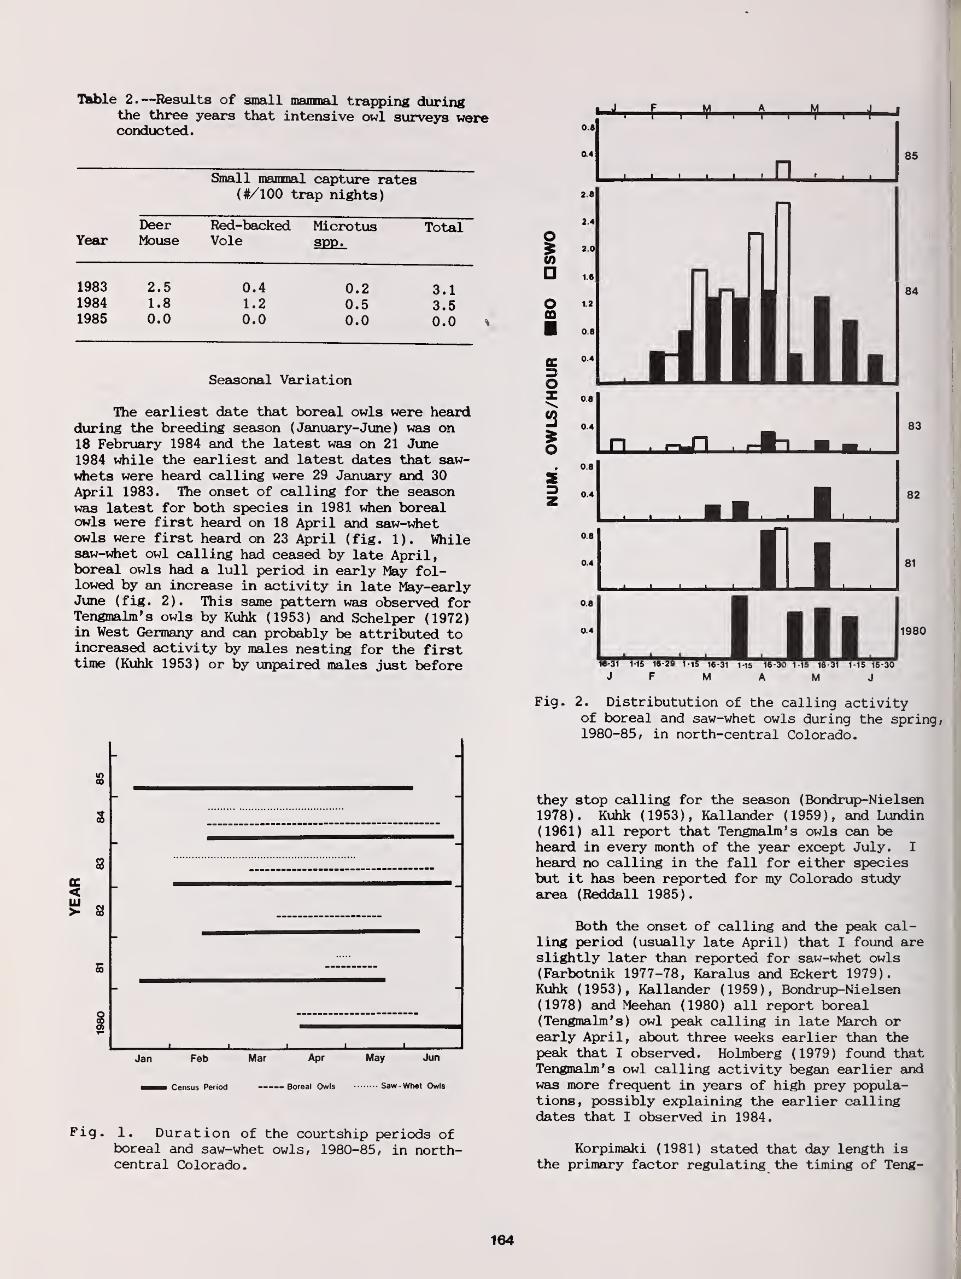
Table 2.—Results of small mammal trapping duringthe three years that intensive owl surveys wereconducted.
Small mammal capture rates(#/100 trap nights)
YearDeerMouse
Red-backedVole
Microtiasspp.
Total
1983
19841985
2.51.80.0
0.41.20.0
0.20.50.0
3.13.50.0
Seasonal Variation
The earliest date that boreal owls were heardduring the breeding season (January-June) was on18 February 1984 and the latest was on 21 June1984 while the earliest and latest dates that saw-whets were heard calling were 29 January and 30April 1983. The onset of calling for the seasonwas latest for both species in 1981 when borealowls were first heard on 18 April and saw-whetowls were first heard on 23 April (fig. 1). Whilesaw-whet owl calling had ceased by late April,boreal owls had a lull period in early May fol-lowed by an increase in activity in late May-earlyJune ( fig . 2 ) . This same pattern was observed forTengmalm's owls by Kuhk (1953) and Schelper (1972)in West Germany and can probably be attributed toincreased activity by males nesting for the firsttime (Kuhk 1953) or by unpaired males just before
8
3
8cc<UJ> 8
5
Jan Feb Mar Apr
hm Census Period Boreal Owls
May Jun
Saw -Whet Owls
Fig. 1. Duration of the courtship periods ofboreal and saw-whet owls, 1980-85, in north-central Colorado.
0.4
A M1 1 1 r—f—
•
I . n .
1
oCD
o
3
o
85
1980
IB^SI 1-15 16-29 1-15 16-31 1-15
J F M A16-31 1-15 16-30
M J
Fig, 2. Distributution of the calling activityof boreal and saw-whet owls during the spring,1980-85, in north-central Colorado.
they stop calling for the season (Bondrup-Nielsen1978). Kuhk (1953), Kallander (1959), and Lundin(1961) all report that Tengmalm's owls can beheard in every month of the year except July. I
heard no calling in the fall for either speciesbut it has been reported for my Colorado studyarea (Reddall 1985).
Both the onset of calling and the peak cal-ling period (usually late April) that I found areslightly later than reported for saw-whet owls(Farbotnik 1977-78, Karalus and Eckert 1979).Kuhk (1953), Kallander (1959), Bondrup-Nielsen(1978) and Meehan (1980) all report boreal(Tengmalm's) owl peak calling in late March orearly April, about three weeks earlier than thepeak that I observed. Holmberg (1979) found thatTengmalm's owl calling activity began earlier andwas more frequent in years of high prey popula-tions, possibly explaining the earlier callingdates that I observed in 1984.
Korpimaki (1981) stated that day length isthe primary factor regulating the timing of Teng-
164
malm's owl breeding in moderate climates, whiletemperature and food have lesser effects. All ofthe previous studies of boreal (Tengmalm's) owlsmentioned were located at between 55 and 65 de-grees north latitude where day length in lateMarch-early April, (approximately 14 h) , when peakboreal owl calling occurs, is approximately thesame as day length in my study area (40° N) inlate April, the period when I found peak callingactivity. It appears that day length may regulatebreeding in Colorado as well.
According to Bondrup-Nielsen (1978) thecourtship period for boreal owls ended at aboutthe same time that the nightly minimum temperatureremained above 0 C and the snow was gone from theground. These conditions were not met on my studyarea until early summer, precluding these as fac-tors in the timing of the breeding season on mystudy area. Nightly minimum temperatures when thecourtship period ended during my investigationusually ranged between -10 and -5 C. Korpimaki(1981) stated that egg laying can occur with temp-eratures as low as -20 C if sufficient prey areavailable to maintain the incubating female's bodytemperature. Snow depth reached its maximum atabout the same time that boreal owl courtshipperiod was at its peak ( table 3 ) , indicating thatsnow depth probably does not play a role in thetiming of the breeding season in the high eleva-tions of the Rocky Mountains. Saw-whet owls werefound calling at lower elevations where snowfallwas less and temperatures were higher, more ap-proximating other areas where they are foundbreeding, and the timing of their breeding corres-ponds with breeding in other areas (Santee andGranfield 1939, Johns and Johns 1978, Follen 1981,Norton and Holt 1981).
The duration of the boreal owl courtshipperiod (all owls) ranged from 31 days in 1981 to119 days in 1984 while saw-whet courtship lastedfrom 70 to 93 days, excluding 1981 when littleeffort was expended locating saw-whet owls andthey were heard for a period of only five days(fig. 1). Average courtship period for individualboreal owls, excluding those owls heard on onlyone occasion, ranged from 18.6 days in 1983 to49.3 days in 1984. The longest courtship periodfor an individual boreal owl lasted 102 days for
Table 3.—Snow depth (cm) at the time courtshipbegan and ended for boreal and saw-whet owlsfrom 1980-1985 in northern Colorado.
an owl that was apparently unpaired. Saw-whetowls, while not heard in two of the six years(1980 and 1982) and heard only briefly in twoothers (5 days in 1981 and 1 day in 1985), hadapproximately the same length courtship period asboreal owls in the two years that they were heardregularly. The longest courtship period of anindividual saw-whet was 93 days and it nestedsuccessfully.
Bondrup-Nielsen (1978) found average borealowl courtship periods ranging from 8.2 to 10.2days while overall courtship length lasted from 28to 55 days, shorter than the courtship periodsthat I found. Meehan (1980) found that matedboreal owls have longer courtship periods (aver
37.8, days, range 20-51 days) than those thatfailed to attract mates (range 6-35 days). I wasonly able to locate four nests during my study andthe courtship periods of these successful malesranged from 4 to 59 days (aver. 26). Throughout mystudy, however, the owls that had the longestcourtship periods were found to be unsuccessfulmales which sang well into June.
I could find only one reference to the lengthof a saw-whet courtship period and this was approx-imately 25 days (Farbotnik 1977-78). Less is
known about the the saw-whet owl primary call andreferences made to calling owls in the literaturecould include a variety of different calls, there-fore the duration of the courtship period is dif-ficult to ascertain from the accounts given.
Singing Activity Through the Night
The majority of censuses were conducted be-tween dusk and 0200 with only infrequent surveysfrom 0200 to dawn. Both species generally begancalling within one hour after sunset and sangthroughout the census period. Saw-whet owls wereheard calling during the early morning censusesmore frequently than boreals and they were heardcalling in the predawn hours throughout the studyperiod, whereas boreal owls were heard calling inthe morning only in the latter half of the studjperiod. Marz (1968) reported that Tengmalm's owlsoften call for a time after dusk, become silentuntil midnight, then resume calling until earlymorning. Meehan (1980) found that boreal owlsbegin calling after dusk and end by midnight, withfew exceptions. I found that once the owls begancalling in the evening, for either species, itgenerally continued until well after midnight withno detectable decrease in intensity.
boreal owl saw-whet owlYear first last first last The Influence Of Environmental Factors
On Calling Activity
1980 213 117 Several environmental factors which may in-1981 140 61 56 56 fluence the calling activity of boreal and saw-1982 180 214 whet owls were investigated. Because of the rela-1983 147 122 11 0 tively few contacts of both species in 1983, I
1984 175 122 0 0 used only data gathered in 1984, when significant-1985 ly more owls were heard. Analysis of the effects
of weather is particularly difficult because
165
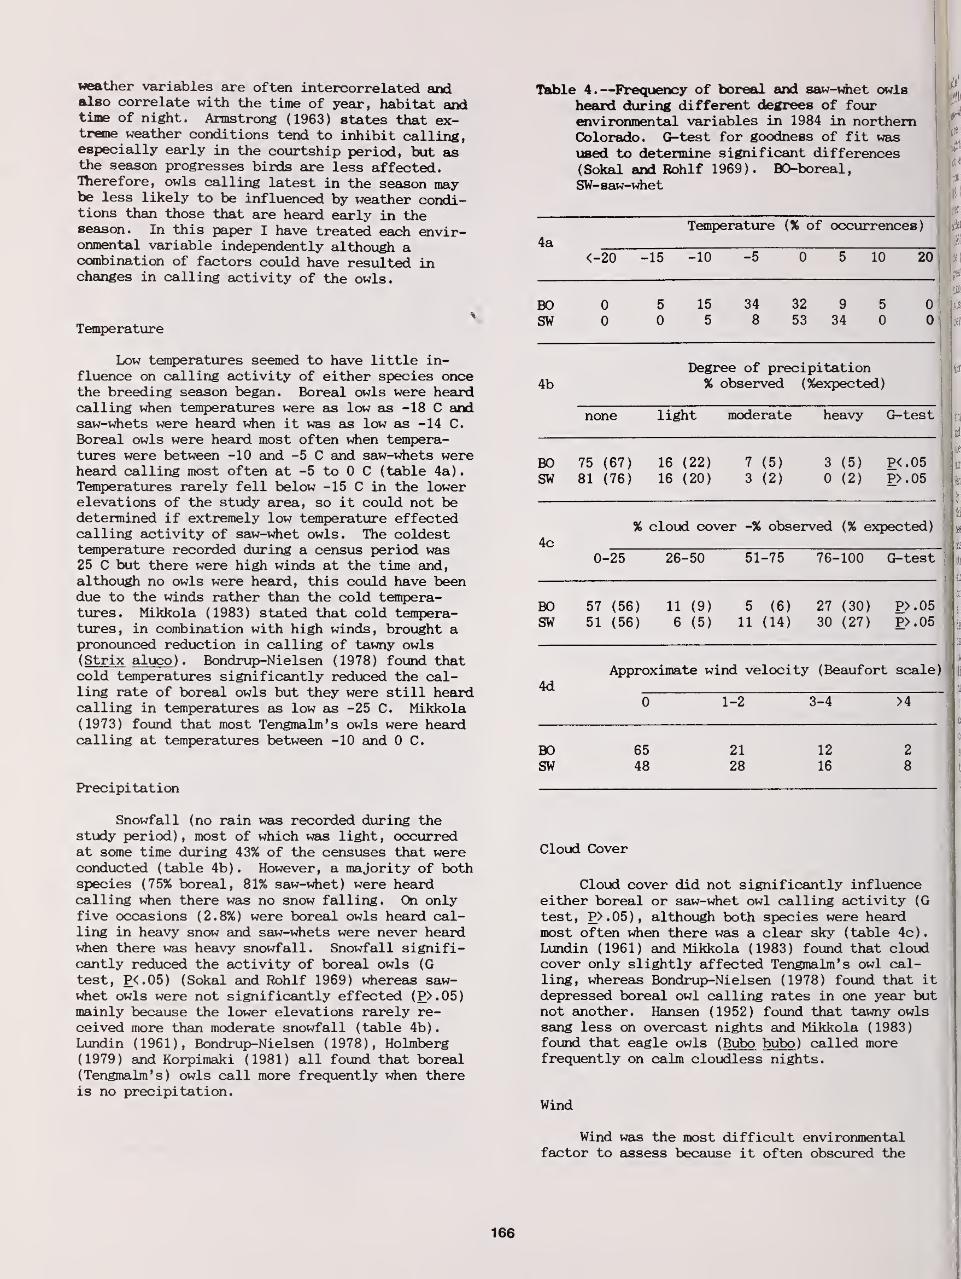
weather variables are often intercorrelated andalso correlate with the time of year, habitat andtime of night. Armstrong (1963) states that ex-treme weather conditions tend to inhibit calling,especially early in the courtship period, but asthe season progresses birds are less affected.Therefore, owls calling latest in the season maybe less likely to be influenced by weather condi-tions than those that are heard early in theseason. In this paper I have treated each envir-onmental variable independently although acombination of factors could have resulted inchanges in calling activity of the owls.
Temperature
Low temperatures seemed to have little in-fluence on calling activity of either species oncethe breeding season began. Boreal owls were heardcalling when temperatures were as low as -18 C andsaw-whets were heard when it was as low as -14 C.
Boreal owls were heard most often when tempera-tures were between -10 and -5 C and saw-whets wereheard calling most often at -5 to 0 C (table 4a).Temperatures rarely fell below -15 C in the lowerelevations of the study area, so it could not bedetermined if extremely low temperature effectedcalling activity of saw-whet owls. The coldesttemperature recorded during a census period was25 C but there were high winds at the time and,although no owls were heard, this could have beendue to the winds rather than the cold tempera-tures. Mikkola (1983) stated that cold tempera-tures, in combination with high winds, brought apronounced reduction in calling of tawny owls( Strix aluco ) . Bondrup-Nielsen (1978) found thatcold temperatures significantly reduced the cal-ling rate of boreal owls but they were still heardcalling in temperatures as low as -25 C. Mikkola(1973) found that most Tengmalm's owls were heardcalling at temperatures between -10 and 0 C.
Precipitation
Table 4.—Frequency of boreal and saw-whet owlsheard during different degrees of fourenvironmental variables in 1984 in northernColorado. G-test for goodness of fit wasused to determine significant differences(Sokal and Rohlf 1969). BO-boreal,SW-saw-whet
4a
Temperature (% of occurrences)
<-20 - 15 -10 -5 0 5 10 20
BOSW
0
0
5 15 34
0 5 832 9 5 053 34 0 0
4bDegree of precipitation% observed (^expected)
none light moderate heavy G-test
BOSW
75 (67)
81 (76)
16 (22) 7 (5)
16 (20) 3 (2)
3 (5) P<.050 (2) P>.05
4c% cloud cover -% observed (% expected)
0-25 26-50 51-75 76-100 G-test
BOSW
57 (56)
51 (56)
11 (9) 5 (6)
6 (5) 11 (14)
27 (30) P>.0530 (27) P>.05
Approximate wind velocity (Beaufort scale)
4d0 1-2 3-4 >4
BO 65 21 12 2
SW 48 28 16 8
Snowfall (no rain was recorded during thestudy period), most of which was light, occurredat some time during 43% of the censuses that wereconducted (table 4b). However, a majority of bothspecies (75% boreal, 81% saw-whet) were heardcalling when there was no snow falling. On onlyfive occasions (2.8%) were boreal owls heard cal-ling in heavy snow and saw-whets were never heardwhen there was heavy snowfall. Snowfall signifi-cantly reduced the activity of boreal owls (G
test, P<.05) (Sokal and Rohlf 1969) whereas saw-whet owls were not significantly effected (P>.05)mainly because the lower elevations rarely re-ceived more than moderate snowfall (table 4b).Lundin (1961), Bondrup-Nielsen (1978), Holmberg(1979) and Korpimaki (1981) all found that boreal(Tengmalm's) owls call more frequently when thereis no precipitation.
Cloud Cover
Cloud cover did not significantly influenceeither boreal or saw-whet owl calling activity (G
test, P>.05), although both species were heardmost often when there was a clear sky (table 4c).Lundin (1961) and Mikkola (1983) found that cloudcover only slightly affected Tengmalm's owl cal-ling, whereas Bondrup-Nielsen (1978) found that itdepressed boreal owl calling rates in one year butnot another. Hansen (1952) found that tawny owlssang less on overcast nights and Mikkola (1983)found that eagle owls (Bubo bubo ) called morefrequently on calm cloudless nights.
Wind
Wind was the most difficult environmentalfactor to assess because it often obscured the
166
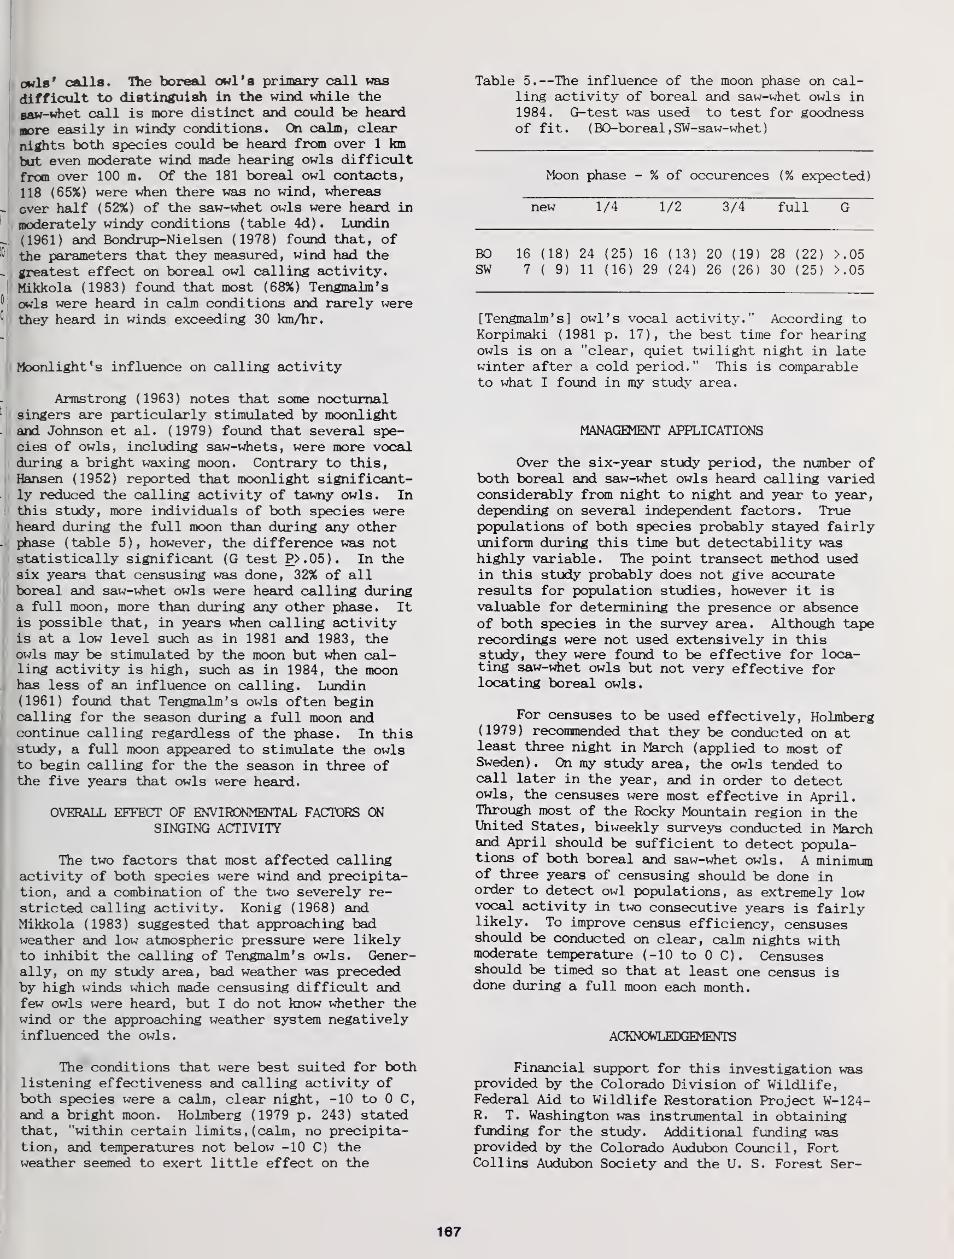
owls' calls. Hie boreal owl's primary call was
difficult to distinguish in the wind while the
saw-whet call is more distinct and could be heard
more easily in windy conditions. On calm, clear
nights both species could be heard from over 1 kmbut even moderate wind made hearing owls difficult
from over 100 m. Of the 181 boreal owl contacts,
118 (65%) were when there was no wind, whereas
over half (52%) of the saw-whet owls were heard in
moderately windy conditions (table 4d) . Lundin(1961) and Bondrup-Nielsen (1978) found that, ofthe parameters that they measured, wind had thegreatest effect on boreal owl calling activity.
Mikkola (1983) found that most (68%) Tengmalm'sowls were heard in calm conditions and rarely werethey heard in winds exceeding 30 km/hr.
Moonlight's influence on calling activity
Armstrong (1963) notes that some nocturnalsingers are particularly stimulated by moonlightand Johnson et al. (1979) found that several spe-cies of owls, including saw-whets, were more vocalduring a bright waxing moon. Contrary to this,Hansen (1952) reported that moonlight significant-ly reduced the calling activity of tawny owls. Inthis study, more individuals of both species wereheard during the full moon than during any otherphase (table 5), however, the difference was notstatistically significant (G test P>.05). In thesix years that censusing was done, 32% of allboreal and saw-whet owls were heard calling duringa full moon, more than during any other phase. Itis possible that, in years when calling activityis at a low level such as in 1981 and 1983, theowls may be stimulated by the moon but when cal-ling activity is high, such as in 1984, the moonhas less of an influence on calling. Lundin(1961) found that Tengmalm's owls often begincalling for the season during a full moon andcontinue calling regardless of the phase. In thisstudy, a full moon appeared to stimulate the owlsto begin calling for the the season in three ofthe five years that owls were heard.
OVERALL EFFECT OF ENVIRONMENTAL FACTORS ONSINGING ACTIVITY
The two factors that most affected callingactivity of both species were wind and precipita-tion, and a combination of the two severely re-stricted calling activity. Konig (1968) andMikkola (1983) suggested that approaching badweather and low atmospheric pressure were likelyto inhibit the calling of Tengmalm's owls. Gener-ally, on my study area, bad weather was precededby high winds which made censusing difficult andfew owls were heard, but I do not know whether thewind or the approaching weather system negativelyinfluenced the owls.
The conditions that were best suited for bothlistening effectiveness and calling activity ofboth species were a calm, clear night, -10 to 0 C,
and a bright moon. Holmberg (1979 p. 243) statedthat, "within certain limits, (calm, no precipita-tion, and temperatures not below -10 C) theweather seemed to exert little effect on the
Table 5.—The influence of the moon phase on cal-ling activity of boreal and saw-whet owls in1984. G-test was used to test for goodnessof fit. ( BO-boreal , SW-saw-whet
)
Moon phase - % of occurences (% expected)
new 1/4 1/2 3/4 full
BO 16 (18) 24 (25) 16 (13) 20 (19) 28 (22) >.05SW 7 ( 9) 11 (16) 29 (24) 26 (26) 30 (25) >.05
[Tengmalm's] owl's vocal activity." According toKorpimaki (1981 p. 17), the best time for hearingowls is on a "clear, quiet twilight night in latewinter after a cold period." This is comparableto what I found in my study area.
MANAGEMENT APPLICATIONS
Over the six-year study period, the number ofboth boreal and saw-whet owls heard calling variedconsiderably from night to night and year to year,depending on several independent factors. Truepopulations of both species probably stayed fairlyuniform during this time but detectability washighly variable. The point transect method usedin this study probably does not give accurateresults for population studies, however it isvaluable for determining the presence or absenceof both species in the survey area. Although taperecordings were not used extensively in thisstudy, they were found to be effective for loca-ting saw-whet owls but not very effective forlocating boreal owls.
For censuses to be used effectively, Holmberg(1979) recommended that they be conducted on atleast three night in March (applied to most ofSweden) . On my study area, the owls tended tocall later in the year, and in order to detectowls, the censuses were most effective in April.Through most of the Rocky Mountain region in theUnited States, biweekly surveys conducted in Marchand April should be sufficient to detect popula-tions of both boreal and saw-whet owls. A minimumof three years of censusing should be done inorder to detect owl populations, as extremely lowvocal activity in two consecutive years is fairlylikely. To improve census efficiency, censusesshould be conducted on clear, calm nights withmoderate temperature (-10 to 0 C) . Censusesshould be timed so that at least one census isdone during a full moon each month.
ACKNOWLEDGEMENTS
Financial support for this investigation wasprovided by the Colorado Division of Wildlife,Federal Aid to Wildlife Restoration Project W-124-R. T. Washington was instrumental in obtainingfunding for the study. Additional funding wasprovided by the Colorado Audubon Council, FortCollins Audubon Society and the U. S. Forest Ser-
167
vice. I gratefully acknowledge the aid of my twofield assistants, D. DeLong and J. Jeanson. Anumber of people assisted with surveys throughoutthe study period including W. Graul, J. Craig, T.Washington, P. Hegdal, R. Ryder, T. Manley, S.Palmer, J. Sedgewick, J. Ellis, J. Richards, P.Paton and A. Alldredge. I especially thank Dr. R.Ryder for his aid throughout the course of theinvestigation
.
LITERATURE CITED
American Ornithologist's Union. 1983. The check-list of North American birds, 6th Edition.877pp.
Armstrong, E. A. 1963. A study of bird song.Oxford University Press, London. 335pp.
Bondrup-Nielsen, S. 1978. Vocalizations, nestingand habitat preferences of the boreal owl(Aegolius funereus ) in North America. M. S.Thesis, Univ. Toronto. 158pp.
Bondrup-Nielsen, S. 1984. Vocalizations of theboreal owl (Aegolius funereus richardsonii )
in North America. Canadian Field-Naturalist98:191-197.
Call, M. W. 1978. Nesting habitats and survey-ing techniques for common western raptors.U.S. Bur. Land Manage., Tech. Note TN-316,Denver, Colo.
Eckert, K. R., and T. L. Savaloja. 1979. Firstdocumented nesting of the boreal owl south ofCanada. Am. Birds 33:135-137.
Farbotnik, S. 1977-78. A diary of the nesting ofsaw-whet owls in Bucks County, Penn.Cassinia 57:29-33.
Follen, D. G. Sr. 1981. Wisconsin breeding andbreeding season records of saw-whet owls.The Passenger Pigeon 43:113-116.
Fuller, M. R. , and J. A. Mosher. 1981. Methodsfor detecting and counting raptors: a review,
p. 235-246. In C. J. Ralph and J. M. Scott( eds . ) . Estimating the number of terrestrialbirds. Stud. Avian Biol. 6.
Hansen, A. L. 1952. Natuglens (Strix a^ aluco )
dogn-og ar Arsrytyme. Dansk Orn: For. Tids.46:158-172.
Hayward, G. D. , and E. 0. Garton. 1983. Firstnesting records for the boreal owl (Aegoliusfunereus ) in Idaho. Condor 85:501.
Holmberg, T. 1979. Punktaxing av ParlugglaAegolius funereus- en Metodstudie. VarFagelvarld 38:237-244.
Johns, J., and S. Johns. 1978. Observations onthe nesting behavior of the saw-whet owl in
Alberta. Blue Jay 36:36-38.
Johnson, R. J., L. T. Haight, and J. M. Simpson.
1979. Owl populations and species status in
the south-western U. S., p. 40-59. In
Schaeffer, P. P. and S. M. Ehlers (eds.).
Owls of the west: their ecology and conserva-tion. Nat. Audubon Soc. West. Educ. Center,Tiburon, Calif. 97pp.
Johnson, R. J., B. T. Brown, L. T. Haight, and J.
M. Simpson. 1981. Playback recordings as aspecial avian census technique, p. 68-75. InC. J. Ralph and J. M. Scott (eds.). Estima-
ting the number of terrestrial birds. Stud.Avian Biol. 6.
Kallander, H. 1959. Photographic studies of someless familiar birds. 93. Tengmalm's owl.Brit. Birds 52:12-15.
Karalus, K. E. , and A. W. Eckert. 1974. The owlsof North America. Doubleday and Co., Inc.,New York. 278 pp.
Konig, C. 1968. Lautausserungen von Rauhfusskauz(Aegolius funereus ) und Sperlingskauz(Glaucidium passerinum ) . Vogelwelt, Beiheft1:115-138.
Korpimaki, E. 1981. On the ecology and biologyof Tengmalm's owl (Aegolius funereus ) inSouthern Ostrobothnia and Suomenselka,Western Finland. Acta. Univ. Ouluensis (A)
118:1-84.Korpimaki, E. 1985. Rapid tracking of microtine
populations by their avian predators: possi-ble evidence for stabilizing predation.Oikos 45:281-284.
Kuhk, R. 1953. Lautausserungen undjahreszsitliche Gesangstatigkeit desRauhfusskauzes , Aegolius funereus (L.). J.
Ornith., Lpz. 94:83-93.
Lundberg, A. 1978. Bestandsuppskattning avSlaguggla och Parluggla. Anser, supplement3:171-175.
Lundberg, A. 1980. Vocalizations and courtshipfeeding of the Ural owl Strix uralensis .
Ornis. Scand. 11:65-70.
Lundin, A. 1961. Sang och laten hos Parlugglan,Aegolius funereus (L. ) . Fauna och Flora.56:95-128.
Marz, R. 1968. Der Rauhfusskauz (Aegoliusfunereus ) . Die Neue Brehm-Bucherei 394
.
Ziemsen, Wittenberg. 48pp.Meehan, R. H. 1980. Behavioral significance of
boreal owl vocalizations during the breedingseason. M. S. Thesis, Univ. Alaska,Fairbanks . 58pp
.
Mikkola, H. 1983. Owls of Europe. Buteo Books,
Vermillion, S. D. 397pp.Norton, W. D. , and D. W. Holt. 1982. Simul-
taneous nesting of northern pygmy owls andnorthern saw-whet owls in the same snag.
Murrelet 63:94.Palmer, D. A. and R. A. Ryder. 1984. The first
documented breeding of the boreal owl inColorado. Condor 86:215-217.
Reddall, J. (compiler) 1985. Additional 1985reports. Lark Bunting 20:99.
Santee, R. , and W. Granfield. 1939. Behavior ofthe saw-whet owl on its nesting grounds.Condor 41:3-9.
Schelper, W. 1972. Die boilogie desRauhfusskauzes (Aegolius funereus L. ) . PhD.
Diss., Universitat Gottingen.
Sokal, R. R. , and F. J. Rohlf. 1969. Biometry.W. H. Freeman, San Francisco, CA. 776 pp.
U.S.D.A. Soil Conservation Service. 1984. Watersupply outlook for Colorado and New Mexico.Washington D.C.
Webb, B. E. 1982. Distribution and nesting re-quirements of montane forest owls inColorado. M. A. Thesis, Univ. Colo.,Boulder. 117pp.
168
Distribution and Status of the Boreal Owl in Colorado 1
Ronald A. Ryder, David A. Palmer,
and John J. Rawlnski2
Abstract.—The Boreal Owl (Aegolius funereus ) has beenknown in Colorado for over 90 years. Formerly listed as arare winter visitor* the species has probably been a residentsince the Pleistocene. Since 1979* intensive searches innorthern Larimer County have documented four nestings.Apparently territorial Boreal Owls have been observed duringthe breeding season in 14 other counties. The species occursmainly above 2900 m in climax spruce-fir (Picea engelmannii -
Abies lasiocarpa ) forests as far south as Wolf Creek Pass,80 km north of the New Mexico border.
INTRODUCTION
The Boreal Owl ( Aegolius funereus ) has for
years been considered a rare winter vagrant in
Colorado (AOU 1957 > Bailey and Niedrach 1.965*
Bent 1938, Karalus and Eckert 1.97*0 and even
some recent works do not show Colorado in the
regular range of the bird (Alcorn 1.986, Burton
1984, Godfrey 1986, Heintzelman 1984, Robbins et
al. 1983). We therefore believe it useful to
document the distribution and status of the spe-
cies based upon records of speciments, photos,
and field observations known as of 1986.
There is now considerable evidence that the
Boreal Owl is a rather widespread species in sub-
alpine forests throughout much of the state, with
breeding season records as far south as Wolf
Creek Pass (37°27'N, 106°52'W, elev. 3300 m),
probably the southernmost known part of the spe-
cies* range (cf. Voous i960).
METHODS AND MATERIALS
Pertinent literature (both published andunpublished) was reviewed, primarily that in the
Colorado State University Libraries, Fort Collins,
and in the Denver Museum of Natural History. All
known specimens (study skins, taxidermic mounts,
Paper presented at the "Ecology and Con-servation of Northern Forest Owls Symposium"3-6 February 1987, Winnipeg, Manitoba, Canada.
2Ronald A. Ryder is Emeritus Professor of
Wildlife 3iology, Colorado State University,Fort Collins, Colo. David A. Palmer is a biol-ogist with Wildlife International, 305 CommerceDr., Easton, Md. John J. Rawinski is a soilscientist, Rio Grande National Forest, MonteVista, Colo.
and skeletons) were examined to verify identifi-
cations and details regarding their collection.Records submitted to the Colorado Field Ornithol-ogists were reviewed, as well as those receivedby Hugh Kingery, Regional Editor for AmericanBirds . Notices concerning our interest in the
dates and locations of sightings were distributedto Colorado Division of Wildlife and U. S. ForestService field personnel as well as to activeornithologists. Intensive searches were con-ducted in the Cameron Pass area of Larimer andJackson counties (Palmer and Ryder) and SpringCreek, Wolf Creek, and Slumgullion Passes areasof Mineral and Hinsdale counties (Rawinski).
Locating Owls
Owls were located by listening for theirvocalizations along roads and ski trails withinthe Cameron Pass area from January through June1980-86. On calm nights Boreal Owls can be heardfrom over 1.5 km (Bondrup-Nielsen 1978). Eachlocation at which an owl was heard was plotted on
a USGS topographic map (l t24,000). If possible,the exact singing tree was located. Slight dis-turbances did not seem to deter the singing acti-vity or cause the owls to move to other areas.In the 1983-84 surveys on Cameron Pass, no taperecordings were used to stimulate singing activitybecause this might have caused the owls to move,hence biasing the singing location. Tape record-ings were used in 1980-82 and in 1.985-86 to elicitresponses and when trying to capture owls.
During road surveys, the observer stoppedevery 0.8 km along designated roadways and listenedfor 5 minutes before driving to the next stop(cf. Holmberg 1979) • When a census was skiied orsnowshoed there were no planned stops, but theobservers listened for owls while moving, stoppingoccasionally to listen for distant owls.
The procedure used for locating Boreal Owls
169
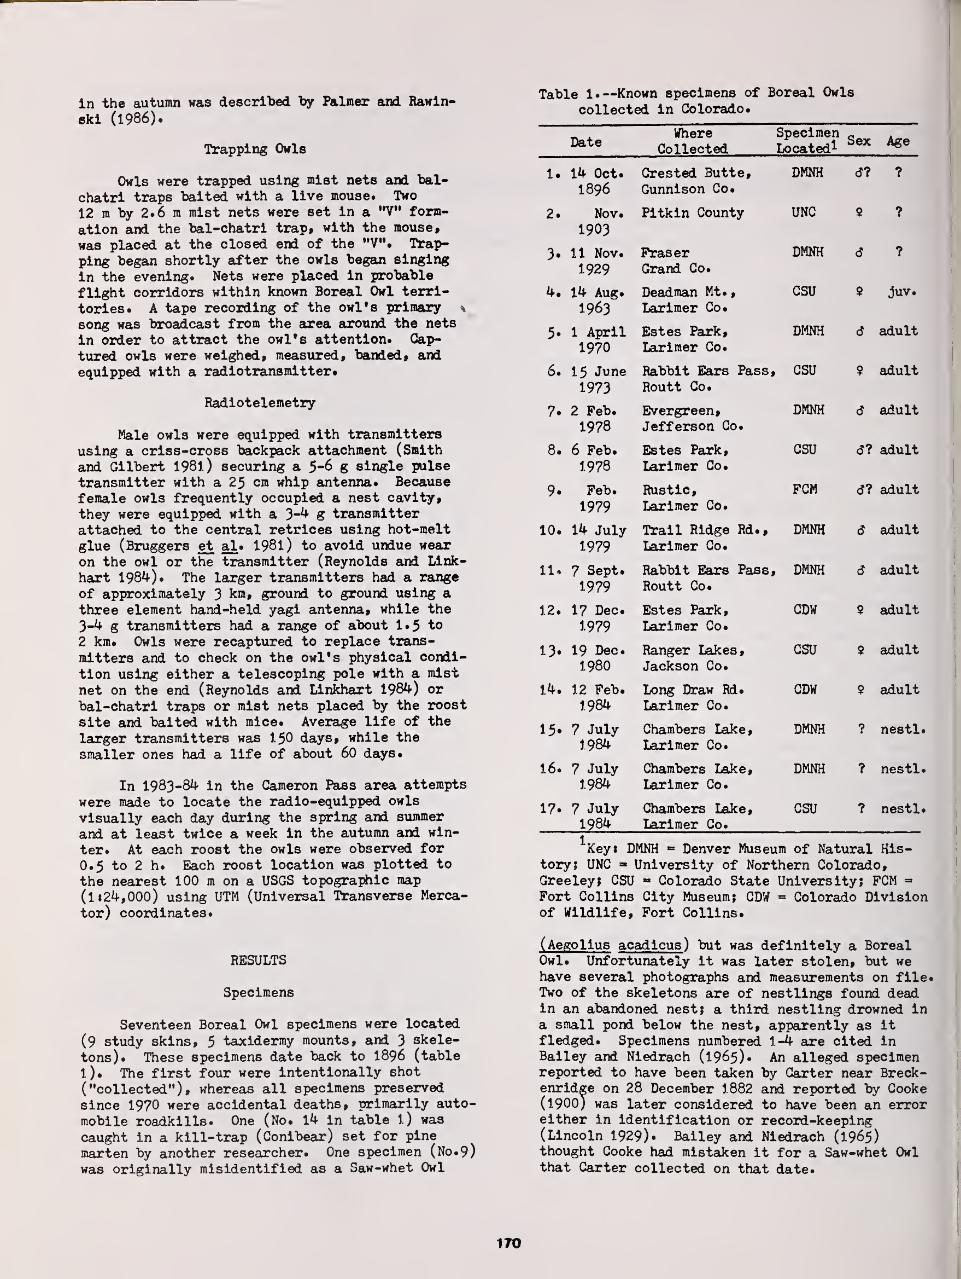
in the autumn was described by Palmer and Rawin-
ski (1986).
Trapping Owls
Owls were trapped using mist nets and bal-
chatri traps baited with a live mouse. Two
12 m by 2.6 m mist nets were set in a "V" form-
ation and the bal-chatri trap, with the mouse,
was placed at the closed end of the "VH« Trap-
ping began shortly after the owls began singing
in the evening. Nets were placed in probable
flight corridors within known Boreal Owl terri-
tories. A tape recording of the owl's primary \
song was broadcast from the area around the nets
in order to attract the owl's attention. Cap-
tured owls were weighed, measured, banded, andequipped with a radiotransmitter.
Radiotelemetry
Male owls were equipped with transmittersusing a criss-cross backpack attachment (Smith
and Gilbert 1981.) securing a 5-6 g single pulsetransmitter with a 25 cm whip antenna. Becausefemale owls frequently occupied a nest cavity,
they were equipped with a 3-4 S transmitterattached to the central retrices using hot-meltglue (Bruggers et al. 1981) to avoid undue wearon the owl or the transmitter (Reynolds and Link-hart 1984). The larger transmitters had a rangeof approximately 3 km, ground to ground using athree element hand-held yagi antenna, while the
3-4 g transmitters had a range of about 1.5 to
2 km. Owls were recaptured to replace trans-mitters and to check on the owl's physical condi-
tion using either a telescoping pole with a mist
net on the end (Reynolds and Linkhart 1984) or
bal-chatri traps or mist nets placed by the roost
site and baited with mice. Average life of the
larger transmitters was 150 days, while the
smaller ones had a life of about 60 days.
In 1983-84 in the Cameron Pass area attempts
were made to locate the radio-equipped owls
visually each day during the spring and summer
and at least twice a week in the autumn and win-
ter. At each roost the owls were observed for
0.5 to 2 h. Each roost location was plotted to
the nearest 100 m on a USGS topographic map
(l»24,000) using UTM (Universal Transverse Merca-
tor) coordinates.
RESULTS
Specimens
Seventeen Boreal Owl specimens were located
(9 study skins, 5 taxidermy mounts, and 3 skele-
tons). These specimens date back to I896 (table
l). The first four were intentionally 6hot( "collected") , whereas all specimens preserved
since 1970 were accidental deaths, primarily auto-
mobile roadkills. One (No. 14 in table l) was
caught in a kill-trap (Conibear) set for pine
marten by another researcher. One specimen (No. 9)was originally misidentified as a Saw-whet Owl
Table 1*—Known specimens of Boreal Owls
collected in Colorado.
DateWhere
CollectedSpecimenLocated*
Sex Age
1. 14 Oct.
I896Crested Butte,Gunnison Co.
DMNH d? ?
2. Nov.
1903
Pitkin County UNC 9 ?
3. 11 Nov.
1929
FraserGrand Co.
DMNH d ?
4. 14 Aug.
1963
Deadman Mt.,
Larimer Co.
CSU 9 juv.
5. 1 April1970
Estes Park,Larimer Co.
DMNH 6 adult
6. 15 June
1973
Rabbit Ears PassRoutt Co.
, CSU 9 adult
7. 2 Feb.
1978Evergreen,Jefferson Co.
DMNH d adult
8. 6 Feb.
1978
Estes Park,Larimer Co.
CSU d? adult
9. Feb.
1979
Rustic,Larimer Co.
FCM d? adult
10. 14 July1979
Trail Ridge Rd.,
Larimer Co.
DMNH d adult
11. 7 Sept.
1979
Rabbit Ears PassRoutt Co.
, DMNH 6 adult
12. 17 Dec.
1979
Estes Park,Larimer Co.
CDW 9 adult
13. 19 Dec.
1980Ranger Lakes,Jackson Co.
CSU 9 adult
14. 12 Feb.
1984Long Draw Rd.
Larimer Co.
CDW 9 adult
15. 7 July1984
Chambers Lake,Larimer Co.
DMNH ? nestl.
16. 7 July1984
Chambers Lake,Larimer Co.
DMNH ? nestl.
17. 7 July1984
Chambers Lake,Larimer Co.
CSU ? nestl.
Keyt DMNH Denver Museum of Natural His-tory; UNC - University of Northern Colorado,Greeley; CSU » Colorado State University; FCM »
Fort Collins City Museum; CDW - Colorado Divisionof Wildlife, Fort Collins.
(Aegollus acadicus ) but was definitely a BorealOwl. Unfortunately it was later stolen, but wehave several photographs and measurements on file.Two of the skeletons are of nestlings found deadin an abandoned nest; a third nestling drowned ina small pond below the nest, apparently as itfledged. Specimens numbered 1-4 are cited inBailey and Niedrach (1965). An alleged specimenreported to have been taken by Carter near Breck-enridge on 28 December 1882 and reported by Cooke(1900) was later considered to have been an erroreither in identification or record-keeping(Lincoln 1929). Bailey and Niedrach (1965)thought Cooke had mistaken it for a Saw-whet Owlthat Carter collected on that date.
170
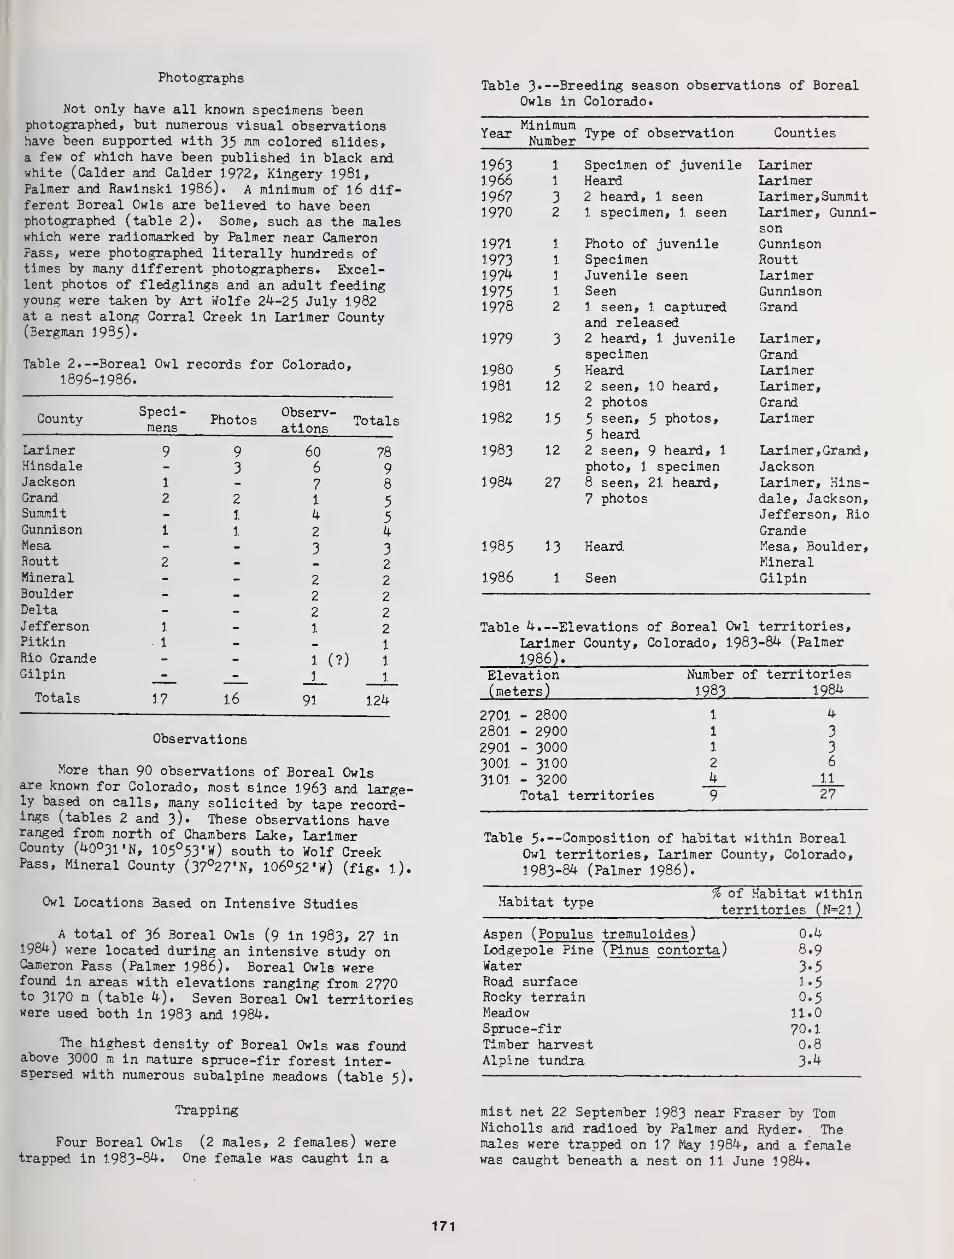
Photographs
Not only have all known specimens beenphotographed, hut numerous visual observationshave been supported with 35 ^m colored slides,a few of which have been published in black andwhite (Galder and Galder 1972, Kingery 1981,Palmer and Rawinski 1986). A minimum of 16 dif-ferent Boreal Owls are believed to have beenphotographed (table 2). Some, such as the maleswhich were radiomarked by Palmer near CameronPass, were photographed literally hundreds oftimes by many different photographers. Excel-lent photos of fledglings and an adult feedingyoung were taken by Art Wolfe 24-25 July 1982at a nest along Corral Creek in Larimer County(Bergman 1935).
Table 2.—Boreal Owl records for Colorado,1896-1986.
Table 3»—Breeding season observations of BorealOwls in Colorado.
CountySpeci-mens
PhotosObserv-ations
Totals
Larimer 9 9 60 78Hinsdale 3 6 9Jackson 1 7 8Grand 2 2 1 5Summit 1 4 5Gunnison 1 1 2 4Mesa 3 3Routt 2 2Mineral 2 2Boulder 2 2Delta 2 2Jefferson 1 1 2Pitkin 1 1
Rio Grande 1 (?) 1
Gilpin 1 1
Totals 17 16 91 124
Observations
More than 90 observations of Boreal Owlsare known for Colorado, most since 1963 and large-ly based on calls, many solicited by tape record-ings (tables 2 and 3). These observations haveranged from north of Chambers Lake, LarimerCounty (40°31'N, 105°53'W) south to Wolf CreekPass, Mineral County (37°27'N, 106°52'W) (fig. l).
Owl Locations Based on Intensive Studies
A total of 36 Boreal Owls (9 in 1983, 27 in1984) were located during an intensive study onCameron Pass (Palmer 1986). Boreal Owls werefound in areas with elevations ranging from 2770to 3170 m (table 4). Seven Boreal Owl territorieswere used both in 1983 and 1984.
The highest density of Boreal Owls was foundabove 3000 ra in mature spruce-fir forest inter-spersed with numerous subalpine meadows (table 5).
YearMinimumNumber
Type of observation Counties
1 ST>pcimpn of iiivpni 1 p TflT*1 ITlPt*1 in ii x i 1 1
1966 \ Heard IatItupt*
1967 j 2 heard • 1 seen Larimer . Summit1 970 2 1 ^Tipci mpn * 1 copn TatItiipt. Chinnl •
son1971 1. Photo of juvenile Gunnison1973 Specimen Routt1974 1. Juvenile seen Larimer1975 1. Seen Gunnison1978 2 1. seen, 1. captured Grand
and released1979 3 2 heard, 1 juvenile Larimer,
specimen Grand1980 5 Heard Larimer1981 12 2 seen, 1.0 heard, Larimer,
2 photos Grand1982 15 5 seen, 5 photos, Larimer
5 heard1983 12 2 seen, 9 heard, 1 Larimer , Grand
,
photo, 1. specimen Jackson1984 27 8 seen, 21 heard, Larimer, Hins-
7 photos dale, Jackson,Jefferson, RioGrande
1985 13 Heard Mesa, Boulder,Mineral
1986 1 Seen Gilpin
Table 4.—Elevations of Boreal Owl territories,
Larimer County, Colorado, 1983-84 (Palmer
Elevation Number of territories
( meters
)
1983 1984
2701 - 2800 1 4
2801. - 2900 1 3
2901 - 3000 1 3
3001 - 3100 2 6
3101 - 3200 4 1.1
Total territories 9 27
Table 5*—Composition of habitat within BorealOwl territories, Larimer County, Colorado,1.983-84 (Palmer 1986).
% of Habitat withinHabitat type
territories (N*2l)
Aspen ( Populus tremuloides )
Lodgepole Pine ( Pinus contorta )
WaterRoad surfaceRocky terrainMeadowSpruce-firTimber harvestAlpine tundra
0.4
8.9
3.51.50.5
11.070.10.8
3.4
Trapping
Four Boreal Owls (2 males, 2 females) weretrapped in 1983-84. One female was caught in a
mist net 22 September I.983 near Fraser by TomNicholls and radioed by Palmer and Ryder. Themales were trapped on 1.7 May 1984, and a femalewas caught beneath a nest on 11 June 1984.
171
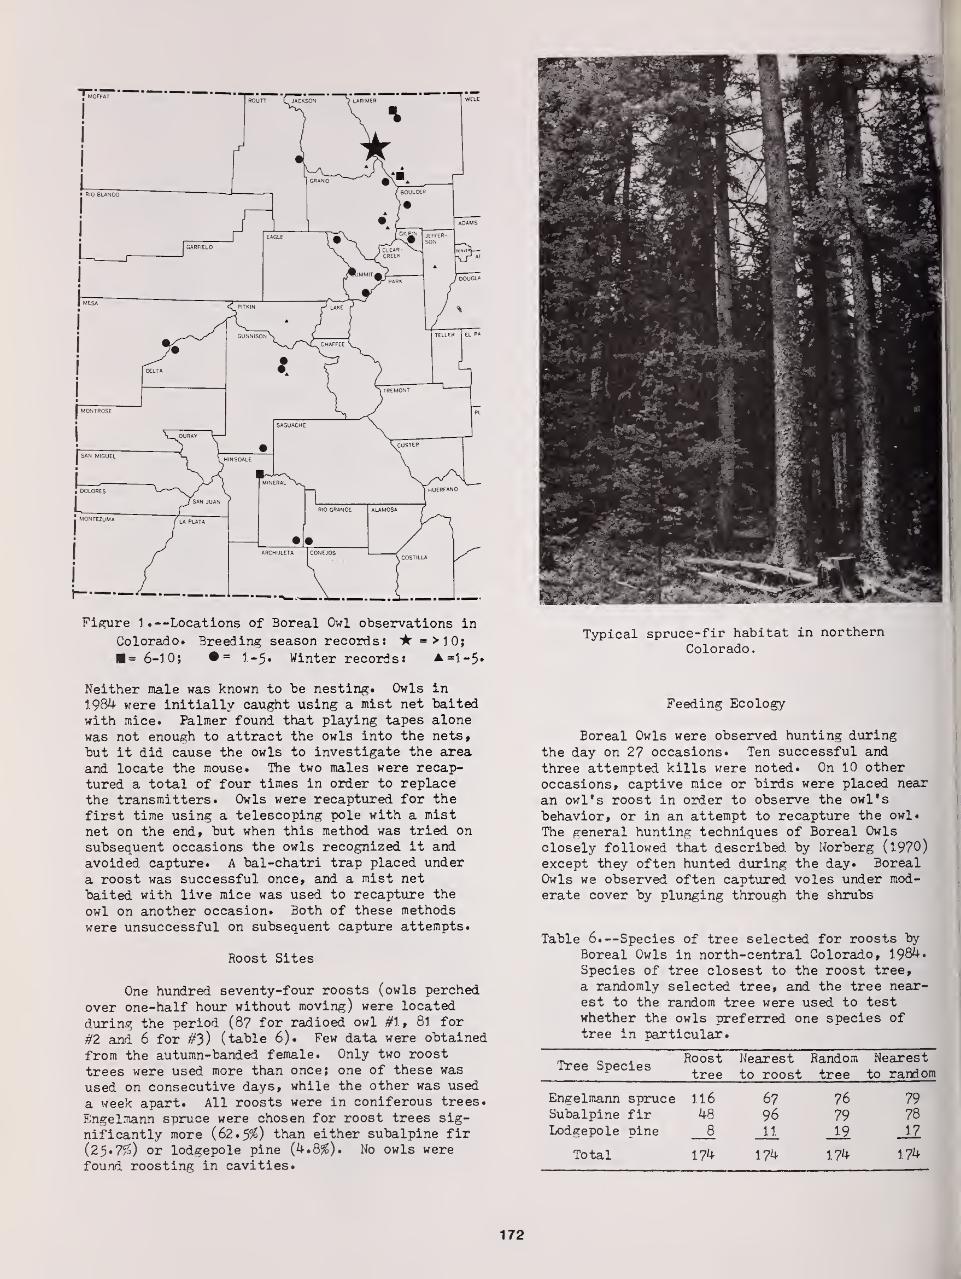
Figure 1.—Locations of Boreal Owl observations in
Colorado. Breeding season records: * = >10;= 6-1.0; •= 1.-5. Winter records: A =1.-5.
Neither male was known to be nesting. Owls in
1.984 were initially caught using a mist net baitedwith mice. Palmer found that playing tapes alonewas not enough to attract the owls into the nets*
but it did cause the owls to investigate the areaand locate the mouse. The two males were recap-tured a total of four times in order to replacethe transmitters. Owls were recaptured for the
first time using a telescoping pole with a mistnet on the end, but when this method was tried onsubsequent occasions the owls recognized it andavoided capture. A bal-chatri trap placed undera roost was successful once, and a mist net
baited with live mice was used to recapture the
owl on another occasion. Both of these methods
were unsuccessful on subsequent capture attempts.
Roost Sites
One hundred seventy-four roosts (owls perched
over one-half hour without moving) were located
during the period (87 for radioed owl #1, 81. for
#2 and 6 for #3) (table 6). Few data were obtained
from the autumn-banded female. Only two roost
trees were used more than once; one of these was
used on consecutive days, while the other was used
a week apart. All roosts were in coniferous trees.
Engelmann spruce were chosen for roost trees sig-
nificantly more (62. 5$) than either subalpine fir
(25.7£) or lodgepole pine (4.8^). No owls were
found roosting in cavities.
Typical spruce-fir habitat in northernColorado.
Feeding Ecology
Boreal Owls were observed hunting duringthe day on 27 occasions. Ten successful and
three attempted kills were noted. On 10 otheroccasions, captive mice or birds were placed near
an owl's roost in order to observe the owl's
behavior, or in an attempt to recapture the owl.
The general hunting techniques of Boreal Owls
closely followed that described by Norberg (1.970)
except they often hunted during the day. BorealOwls we observed often captured voles under mod-erate cover by plunging through the shrubs
Table 6.—Species of tree selected for roosts by
Boreal Owls in north-central Colorado, 1984.
Species of tree closest to the roost tree,
a randomly selected tree, and the tree near-est to the random tree were used to testwhether the owls preferred one species oftree in particular.
Tree SpeciesRoosttree
Nearestto roost
Randomtree
Nearestto random
Engelmann spruce 116 67 76 79Subalpine fir 48 96 79 78
Lodgepole pine 8 11 19 17
Total 174 174 174 174
172
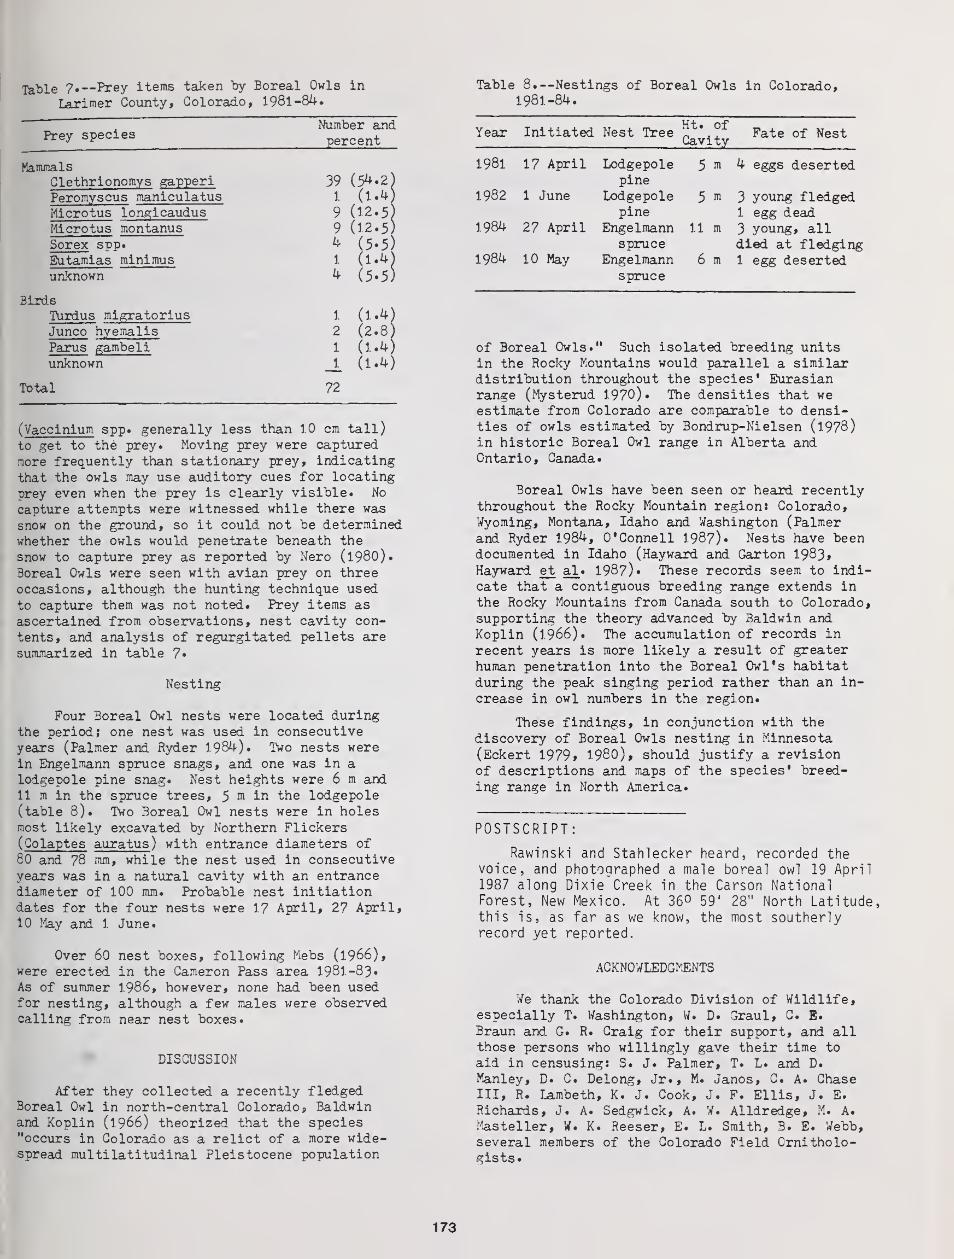
Table 7.—Prey items taken "by Boreal Owls in
Larimer County, Colorado, 1981-84.Table 8.—Nestings of Boreal Owls in Colorado,
1981-84.
Prey speciesNumber andpercent
MammalsClethrionomys gapperiPeromyscus maniculatusMlcrotus longicaudusMlcrotus montanusSorex spp.
Sutamias minimusunknown
BirdsTurdus migratoriusJunco hyemalisParus gambeliunknown
Total
39 (54.2)
i (1.4)
9 (12.5)
9 (12.5)4 (5.5)1 (l.4)4 (5.5)
1 (1.1*)
2 (2.8)1 (1.4)
J_ (1.4)
72
(Vaccinium spp. generally less than 1.0 cm tall)
to get to the prey. Moving prey were captured
more frequently than stationary prey, indicatingthat the owls may use auditory cues for locatingprey even when the prey is clearly visible. No
capture attempts were witnessed while there was
snow on the ground, so it could not be determinedwhether the owls would penetrate beneath thesnow to capture prey as reported by Nero (1980).
Boreal Owls were seen with avian prey on threeoccasions, although the hunting technique usedto capture them was not noted. Prey items as
ascertained from observations, nest cavity con-
tents, and analysis of regurgitated pellets aresummarized in table 7»
Nesting
Four Boreal Owl nests were located duringthe period; one nest was used in consecutiveyears (Palmer and Ryder 1984). Two nests werein Engelmann spruce snags, and one was in alodgepole pine snag. Nest heights were 6 m and11 m in the spruce trees, 5 m in the lodgepole(table 8). Two Boreal Owl nests were in holesmost likely excavated by Northern Flickers
( Colaptes auratus ) with entrance diameters of80 and 78 mm, while the nest used in consecutiveyears was in a natural cavity with an entrancediameter of 100 mm. Probable nest initiationdates for the four nests were 1.7 April, 27 April,10 May and 1 June.
Over 60 nest boxes, following Mebs (1966),were erected in the Cameron Pass area 1.981.-83*
As of summer 1986, however, none had been usedfor nesting, although a few males were observedcalling from near nest boxes.
DISCUSSION
After they collected a recently fledgedBoreal Owl in north-central Colorado, Baldwinand Koplin (1966) theorized that the species"occurs in Colorado as a relict of a more wide-spread multi latitudinal Pleistocene population
Year Initiated Nest TreeHt. ofCavity
1981 17 April LodfireBole 5 mpine
1982 1 June Lodgepole 5 a 3 young fledgedpine 1 egg dead
1.984 27 April Engelmann 1.1 m 3 young, allspruce died at fledging
1984 10 May Engelmann 6 m 1 egg desertedspruce
of Boreal Owls." Such isolated breeding unitsin the Rocky Mountains would parallel a similardistribution throughout the species* Eurasianrange (Mysterud 1970). The densities that weestimate from Colorado are comparable to densi-ties of owls estimated by Bondrup-Nielsen (1978)in historic Boreal Owl range in Alberta andOntario, Canada.
Boreal Owls have been seen or heard recentlythroughout the Rocky Mountain region* Colorado,Wyoming, Montana, Idaho and Washington (Palmerand Ryder 1984, O'Connell 1987). Nests have beendocumented in Idaho (Hayward and Garton 1983*Hayward et al. 1987). These records seem to indi-cate that a contiguous breeding range extends inthe Rocky Mountains from Canada south to Colorado,supporting the theory advanced by Baldwin andKoplin (1.966). The accumulation of records in
recent years is more likely a result of greaterhuman penetration into the Boreal Owl's habitatduring the peak singing period rather than an in-
crease in owl numbers in the region.
These findings, in conjunction with thediscovery of Boreal Owls nesting in Minnesota(Eckert 1979* 1980), should justify a revisionof descriptions and maps of the species* breed-ing range in North America.
POSTSCRIPT:
Rawinski and Stahlecker heard, recorded thevoice, and photographed a male boreal owl 19 April1987 along Dixie Creek in the Carson NationalForest, New Mexico. At 36° 59' 28" North Latitude,this is, as far as we know, the most southerlyrecord yet reported.
ACKNOWLEDGMENTS
We thank the Colorado Division of Wildlife,especially T. Washington, W. D. Graul, C. E.
Braun and G. R. Craig for their support, and allthose persons who willingly gave their time toaid in censusing: S. J. Palmer, T. L. and D.
Manley, D. C. Delong, Jr., M. Janos, C. A. ChaseIII, R. Lambeth, K. J. Cook, J. F. Ellis, J. E.
Richards, J. A* Sedgwick, A. W. Alldredge, M. A.
Masteller, W. K. Reeser, E. L. Smith, 3. E. Webb,several members of the Colorado Field Ornitholo-gists.
173

LITERATURE CITED Piscataway, N. J.
Alcorn, G. D. 1.986. Owls, an introduction forthe amateur naturalist. 176 p. Prentice-Hall Press, New York, N. Y.
Bailey, A. M. , and R. J. Niedrach. 1965. Birdsof Colorado. Vol. I, 454 p. Denver Museumof Natural History, Denver, Colo.
Baldwin, P. H. , and J. R. Koplin. 1966. Theboreal owl as a Pleistocene relict in Colo-rado. Condor 68:299-300.
Bent, A. C. 1.938. Life histories of North AmeV-ican birds of preyi falcons, hawks, cara-caras and owls. Part 2. U. S. NationalMuseum Bulletin 170:1-482.
Bergman, C. A. 1985* Invaders from the farnorth. National Wildlife 23(6) : 3^-39.
Bondrup-Nielsen, S. 1978. Vocalizations, nest-ing and habitat preferences of the borealowl ( Aegolius funereus ) in North America.158 p. M.S. thesis. University of Toronto,Canada.
Bruggers, R., J. Ellis, J. Sedgwick, and J. Bou-rassa. 1981. A radio transmitter for moni-toring the movements of small passerinebirds. Proceedings of the InternationalConference on Wildlife Biotelemetry 3:69-79.
Burton, J. A., editor. 1984. Owls of the world.Second edition. 208 p. Peter Lowe, London,England.
Calder, W. A. IV, and W. A. Calder, Jr. 1972.Juvenile boreal owl in Gunnison County,Colorado. Colorado Field Ornithologist12:14.
Cooke, W. W. 1900. The birds of Colorado: asecond appendix to Bulletin 37* AgriculturalCollege of Colorado. Experiment StationBulletin 56:179-239*
Eckert, K. 1979* First boreal owl nestingrecord south of Canada : a diary . Loon 51 *
20-27.
Eckert, K. 1980. Another boreal owl nest foundin Cook County. Loon 51:198-199.
Godfrey, W. E. 1986. The birds of Canada.Revised edition. 595 P* National Museumof Natural Science, National Museums ofCanada, Ottawa, Canada.
Hayward, G. D. , and E. 0. Garton. 1.983. Firstnesting records for boreal owl ( Aegoliusfunereus ) in Idaho. Condor 851 501*
Hayward, G. D., P. H. Hayward, and E. 0. Garton.1987. Daily and seasonal movements of borealowls in central Idaho. (This proceedings)
Heintzelman, D. S. 1984. Guide to owl watchingin North America. 193 P» Winchester Press,
Holmberg, T. 1979* Point transect census of
Tengmalm's owl—a methodological study. VarFagelvarld 38:237-244.
Karalus, K. E., and A. W. Eckert. 1974. The
owls of North America. 278 p. Doubleday &
Co., Inc., New York, N. Y.
Kingery, H. E. 1981. Mountain west region.
American Birds 35:848.
Lincoln, F. C. 1929. In memoriam - EdwinCarter. Condor 31:196-200.
Mebs, T. 1966. Eulen und Kauze. Strigidae.
134 p. Frackh'sche Verlagshandlung, Stutt-gart.
Mysterud, I. 1970. Hypothesis concerning char-acteristics and causes of population move-ments in Tengmalm's owl (Aegolius funereus
/ZJ). Nytt Magasin Zoologi (Oslo) 18:49-74.
Nero, R. W. 1980. The great grey owl: phantomof the northern forest. 1.67 p» SmithsonianInstitution Press, Washington, D. C.
Norberg, R. A. 1970. Hunting of Tengmalm's OwlAegolius funereus (L. ). Ornis Scandinavica1:51-64.
0'Connell, M. W. 1987. Occurrence of the borealowl in northeastern Washington. (This
proceedings)
Palmer, D. A. 1986. Habitat selection, move-
ments and activity of boreal and saw-whet
owls. 101 p. M.S. thesis, Colorado State
University, Fort Collins, Colo.
Palmer, D. A., and J. J. Rawinski. 1986. Atechnique for locating boreal owls in fallin the Rocky Mountains. Colorado FieldOrnithologist 20 :
38-41
.
Palmer, D. A., and R. A. Ryder. 1984. Thefirst documented breeding of the boreal owl
in Colorado. Condor 86:215-217.
Reynolds, R. T., and B. D. Linkhart. 1984.
Methods and materials for capturing andmonitoring flammulated owls. Great BasinNaturalist 44:49-51.
Robbins, C. S., B. Bruun and H. S. Zim. 1983*
A guide to field identification: birds of
North America. 360 p. Golden Press, New
York, N. Y.
Smith, D. G., and R. Gilbert. 1981. Backpackradio transmitter attachment success in
screech owls ( Otus asio). North AmericanBird Bander 6:142-143.
Voous, K. H. I960. Atlas of European birds.284 p. Elsevier, Amsterdam.
174
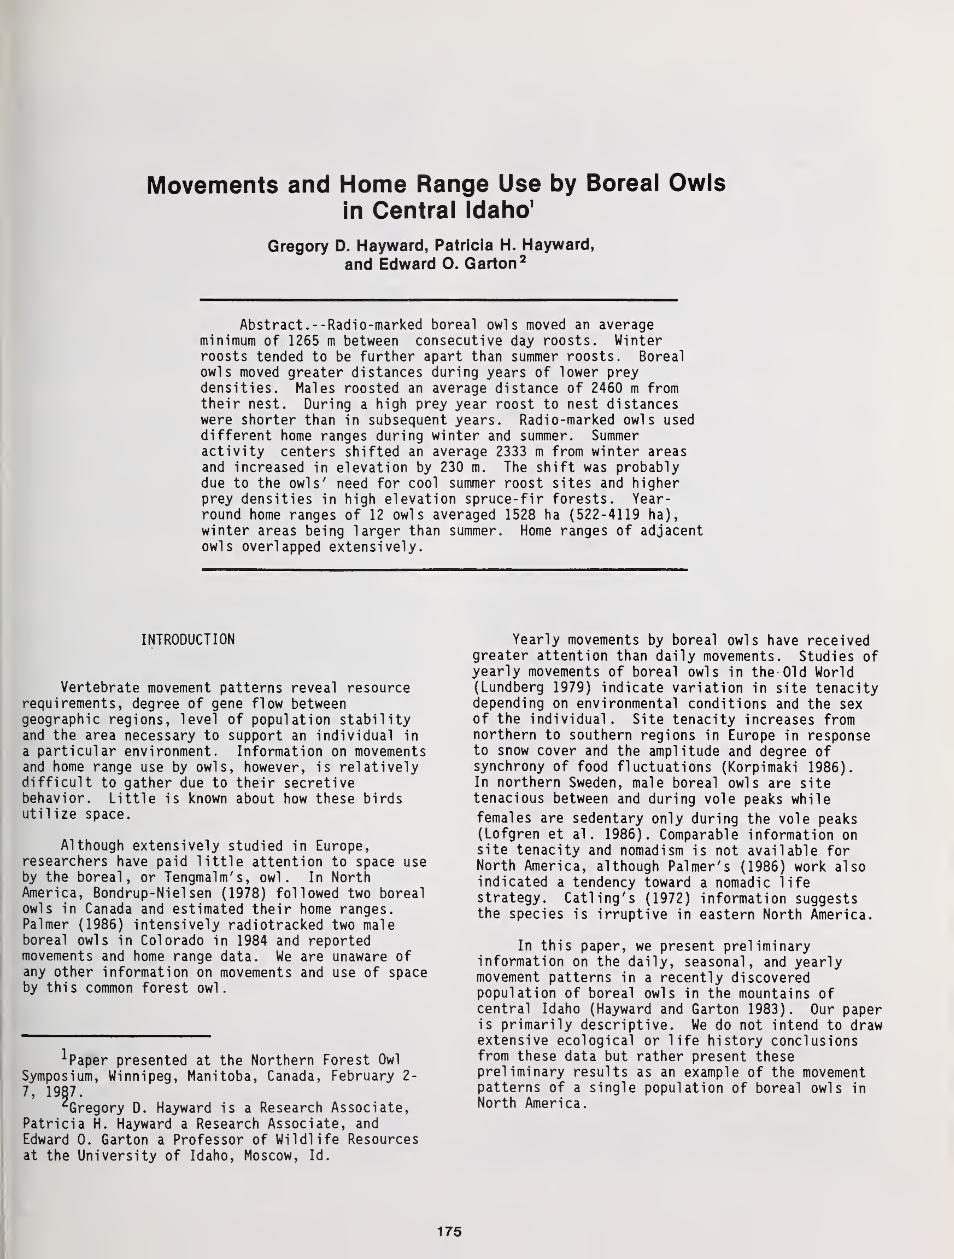
Movements and Home Range Use by Boreal Owlsin Central Idaho 1
Gregory D. Hayward, Patricia H. Hayward,
and Edward O. Gallon 2
Abstract. --Radio-marked boreal owls moved an averageminimum of 1265 m between consecutive day roosts. Winterroosts tended to be further apart than summer roosts. Borealowls moved greater distances during years of lower preydensities. Males roosted an average distance of 2460 m fromtheir nest. During a high prey year roost to nest distanceswere shorter than in subsequent years. Radio-marked owls useddifferent home ranges during winter and summer. Summeractivity centers shifted an average 2333 m from winter areasand increased in elevation by 230 m. The shift was probablydue to the owls' need for cool summer roost sites and higherprey densities in high elevation spruce-fir forests. Year-round home ranges of 12 owls averaged 1528 ha (522-4119 ha),
winter areas being larger than summer. Home ranges of adjacentowls overlapped extensively.
INTRODUCTION
Vertebrate movement patterns reveal resourcerequirements, degree of gene flow betweengeographic regions, level of population stabilityand the area necessary to support an individual in
a particular environment. Information on movementsand home range use by owls, however, is relativelydifficult to gather due to their secretivebehavior. Little is known about how these birdsutilize space.
Although extensively studied in Europe,researchers have paid little attention to space useby the boreal, or Tengmalm's, owl. In NorthAmerica, Bondrup-Niel sen (1978) followed two borealowls in Canada and estimated their home ranges.Palmer (1986) intensively radiotracked two maleboreal owls in Colorado in 1984 and reportedmovements and home range data. We are unaware ofany other information on movements and use of spaceby this common forest owl.
A Paper presented at the Northern Forest Owl
Symposium, Winnipeg, Manitoba, Canada, February 2-
7, 1987.
^Gregory D. Hayward is a Research Associate,Patricia H. Hayward a Research Associate, and
Edward 0. Garton a Professor of Wildlife Resourcesat the University of Idaho, Moscow, Id.
Yearly movements by boreal owls have receivedgreater attention than daily movements. Studies ofyearly movements of boreal owls in the Old World(Lundberg 1979) indicate variation in site tenacitydepending on environmental conditions and the sexof the individual. Site tenacity increases fromnorthern to southern regions in Europe in responseto snow cover and the amplitude and degree ofsynchrony of food fluctuations (Korpimaki 1986).In northern Sweden, male boreal owls are sitetenacious between and during vole peaks while
females are sedentary only during the vole peaks(Lofgren et al . 1986). Comparable information onsite tenacity and nomadism is not available forNorth America, although Palmer's (1986) work alsoindicated a tendency toward a nomadic lifestrategy. Catling's (1972) information suggeststhe species is irruptive in eastern North America.
In this paper, we present preliminaryinformation on the daily, seasonal, and yearlymovement patterns in a recently discoveredpopulation of boreal owls in the mountains ofcentral Idaho (Hayward and Garton 1983). Our paperis primarily descriptive. We do not intend to drawextensive ecological or life history conclusionsfrom these data but rather present thesepreliminary results as an example of the movementpatterns of a single population of boreal owls inNorth America.
175
STUDY AREA
During the past three years we have studiedhabitat use by boreal owls (Aegolius funereus) in
the mountains of central Idaho, USA. Our primarystudy area is Chamberlain Basin, located in the850,000 ha Frank Church-River of No ReturnWilderness. The basin, encompassing the headwatersof Chamberlain Creek, occupies about 25,000 ha ofrolling mountain ridges rising from 1720 m to 2350m elevation. The entire basin lies in the Abieslife zone, and coniferous forest covers over 95percent of the area. Lodgepole pine {Pinuscontorta) dominates due to past fires(predominantly Abies lasiocarpa / Calamagrostisrubescens habitat type(h.t.)). Generally thesestands are over 50 years old, some exceeding 120
years, and the forest structure is relatively open(tree spacing >2m). Large cavities are absent fromthese forests . At lower elevations, old-growthDouglas-fir (Psuedotsuga menziesii) and ponderosapine {Pinus ponderosa) stands occupy southernaspects (predominantly Pseudotsuga menziesii / C.
rubescens - Pinus ponderosa h.t.) and mature to
old-growth Douglas-fir (predominantly A. lasiocarpa
/ Vaccinium globulare h.t.) grow on more mesicsites which have escaped fire. Forest stands on
these sites are multi-layered and often quite open.
Cavities excavated primarily by pileatedwoodpeckers {Dryocopus pileatus) are abundant in
stands where ponderosa pine snags are available.
At higher elevations mature to old-growth subalpinefir (predominantly A. lasiocarpa / V. globulare andA. lasiocarpa / V. scoparium h.t.) dominates. Wetspruce bottoms {A. lasiocarpa /Streptopusamplexifolius h.t), aspen stands {Piceaengelmannii/Equisetum arvense h.t), sagebrush-bunchgrass slopes, and willow carrs occupy relativelysmall areas within the basin.
Travel within the study area is restricted tofoot, skis, or horseback. An extensive trailsystem provides access to most of the basin, mostareas being no more than 3 km from a trail. Thewilderness character of the area provides anopportunity to study the habitat use and movementsof the owls in an area free from road building,logging, and other human disturbances, or man-madehabitats which might influence movements of theowl s.
METHODS
Beginning in February 1984, we captured boreal owlsusing mist nests and bal-chatri traps. Trappingwas restricted to within 4.5 km of our livingquarters in the extreme eastern edge of the studyarea below 1800 m elevation. The owls were markedwith 6 g backpack-mounted radio transmitters(Wildlife Materials Inc. model MPB-1220-LD) with anexpected battery life of 150 days.
We monitored the movements of radio-markedowls from approximately January through August each
of 3 years (1984-1986), recapturing the owls toreplace the transmitters periodically. During eachfield season, we worked at alternate study sitesfor two, 2-week periods. Therefore, radio-markedowls were not followed continuously.
Using hand held 3-element yagi antennas, theradio signal was audible from 0.5 to 11 km,
depending on the topographic position of the owland receiver. If an owl could not be located bychecking from ridgetops within about 8 km of ourstation, we thoroughly searched the entire areawithin 14 km radius of the station (the entireupper basin) from fixed-wing aircraft.
We located radio-tagged owls on their daytimeroosts and plotted the locations on 1:24,000topographic maps. These locations were converteda cartesian coordinate system using the UTM system;locations were recorded accurate to 100 m.
In 1984, the marked owls were relocated on anirregular schedule ranging from 1-4 locations everyten days. In 1985 and 1986, we maintained a moreregular schedule locating each owl every 2-3 days.Three times in 1986 we located an owl on itsdaytime roost on at least four consecutive days(different owls in each case). These locationsprovided some insight into day-to-day movements bythe birds.
Each time we located an owl we spent one hourat the roost recording habitat information andobserving the bird. On 17 occasions we watchedbirds on their daytime roosts for over two hours todocument movements. In addition, on six days, anowl found actively hunting during daylight hourswas followed to document foraging movements. Onsix nights we followed boreal owls during the firstfew hours of foraging activity. Night visiongoggles used in conjunction with radio- telemetryaided in nocturnal observations. Three owls weremarked with betalights (Hayward, in review) tofurther facilitate observation of the owls.
Analysis
In the analysis of distances between roostsites used on consecutive days or two days apart,the sampling units were mean distances forindividual owls. The measurements of distancesbetween roosts were considered subsamples and themean distance between consecutive roosts (or roostsused two days apart in the second analysis) wascalculated from these values. This procedureavoids problems of psuedorepl ication; the distancesbetween several roosts used by an individual owlcan not be considered independent (Hurlbert 1984).
The analysis of roost to nest distances was limitedto four male owls. The limited sample of owlsconstrained the analysis such that the samplingunit was each roost to nest distance.
Home range analysis was performed using thecomputer program HOME RANGE (Samuel et al . 1985)which computes home range estimates using threemethods. Home range size was estimated using a
176
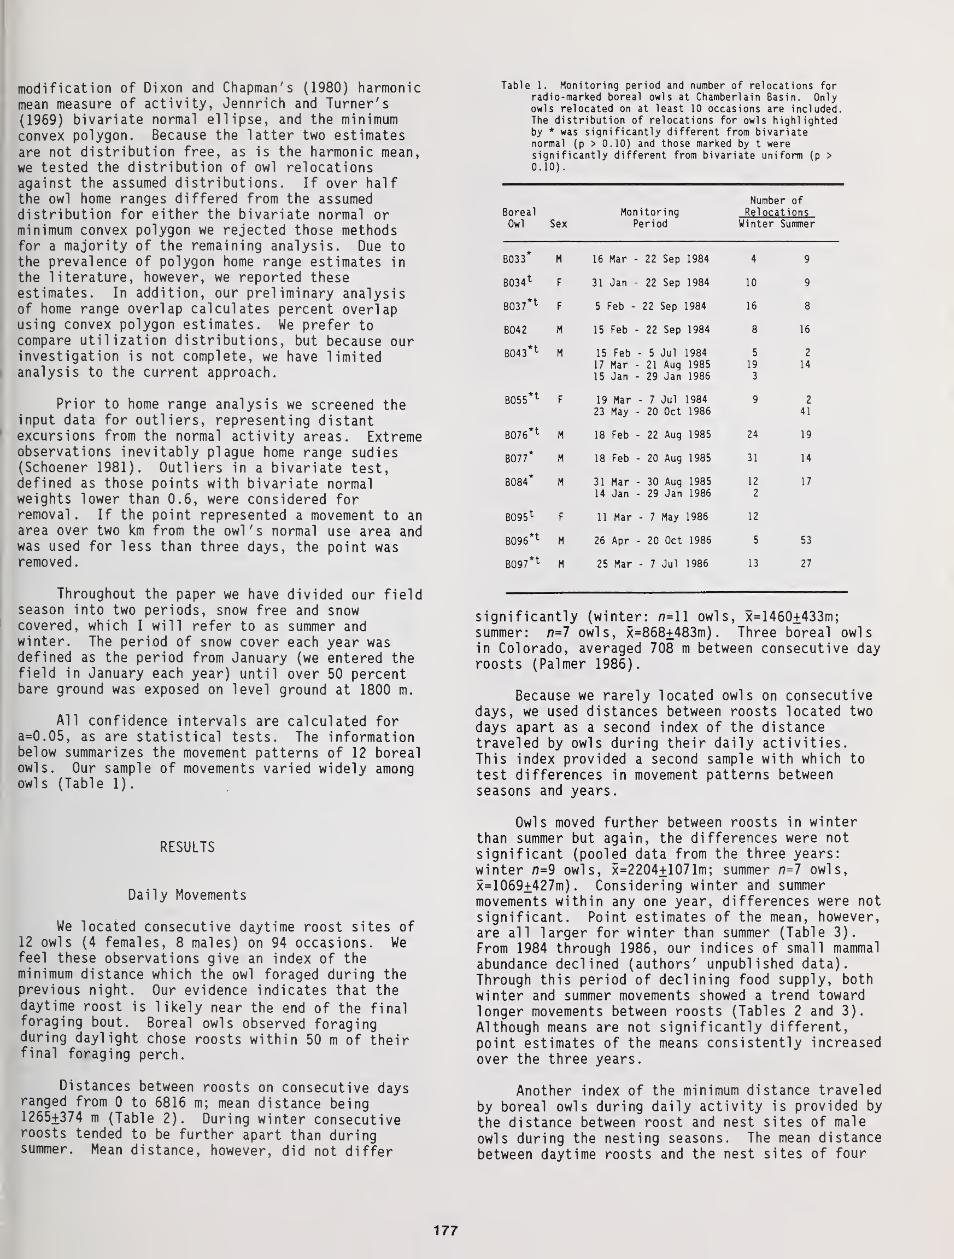
modification of Dixon and Chapman's (1980) harmonicmean measure of activity, Jennrich and Turner's
(1969) bivariate normal ellipse, and the minimumconvex polygon. Because the latter two estimatesare not distribution free, as is the harmonic mean,we tested the distribution of owl relocationsagainst the assumed distributions. If over halfthe owl home ranges differed from the assumeddistribution for either the bivariate normal orminimum convex polygon we rejected those methodsfor a majority of the remaining analysis. Due tothe prevalence of polygon home range estimates in
the literature, however, we reported theseestimates. In addition, our preliminary analysisof home range overlap calculates percent overlapusing convex polygon estimates. We prefer tocompare utilization distributions, but because ourinvestigation is not complete, we have limitedanalysis to the current approach.
Prior to home range analysis we screened theinput data for outliers, representing distantexcursions from the normal activity areas. Extremeobservations inevitably plague home range sudies(Schoener 1981). Outliers in a bivariate test,defined as those points with bivariate normalweights lower than 0.6, were considered forremoval. If the point represented a movement to anarea over two km from the owl's normal use area andwas used for less than three days, the point wasremoved.
Throughout the paper we have divided our fieldseason into two periods, snow free and snowcovered, which I will refer to as summer andwinter. The period of snow cover each year wasdefined as the period from January (we entered thefield in January each year) until over 50 percentbare ground was exposed on level ground at 1800 m.
All confidence intervals are calculated fora=0.05, as are statistical tests. The informationbelow summarizes the movement patterns of 12 borealowls. Our sample of movements varied widely amongowls (Table 1).
RESULTS
Daily Movements
We located consecutive daytime roost sites of12 owls (4 females, 8 males) on 94 occasions. Wefeel these observations give an index of theminimum distance which the owl foraged during theprevious night. Our evidence indicates that thedaytime roost is likely near the end of the finalforaging bout. Boreal owls observed foragingduring daylight chose roosts within 50 m of theirfinal foraging perch.
Distances between roosts on consecutive daysranged from 0 to 6816 m; mean distance being1265+374 m (Table 2). During winter consecutiveroosts tended to be further apart than duringsummer. Mean distance, however, did not differ
Table 1. Monitoring period and number of relocations forradio-marked boreal owls at Chamberlain Basin. Onlyowls relocated on at least 10 occasions are includedThe distribution of relocations for owls highlightedby * was significantly different from bivariatenormal (p > 0.10) and those marked by t weresignificantly different from bivariate uniform (p >
0.10).
Number of
Boreal Monitoring RelocationsOwl Sex Period Winter Summer
B033 M 16 Mar - 22 Sep 1984 4 9
B034 tF 31 Jan - 22 Sep 1984 10 9
B037 1F 5 Feb - 22 Sep 1984 16 8
B042 M 15 Feb - 22 Sep 1984 8 16
B043n M 15 Feb - 5 Jul 1984 5 2
17 Mar - 21 Aug 1985 19 14
15 Jan - 29 Jan 1986 3
B055n F 19 Mar - 7 Jul 1984 9 2
23 May - 20 Oct 1986 41
B076n M 18 Feb - 22 Aug 1985 24 19
B077* M 18 Feb - 20 Aug 1985 31 14
B084* M 31 Mar - 30 Aug 1985 12 17
14 Jan - 29 Jan 1986 2
Bogs* F 11 Mar - 7 May 1986 12
B096n M 26 Apr - 20 Oct 1986 5 53
B097n M 25 Mar - 7 Jul 1986 13 27
significantly (winter: n=ll owls, x=1460+433m;summer: n=7 owls, x=868+483m). Three boreal owlsin Colorado, averaged 708 m between consecutive dayroosts (Palmer 1986).
Because we rarely located owls on consecutivedays, we used distances between roosts located twodays apart as a second index of the distancetraveled by owls during their daily activities.This index provided a second sample with which to
test differences in movement patterns betweenseasons and years.
Owls moved further between roosts in winterthan summer but again, the differences were notsignificant (pooled data from the three years:winter n=9 owls, x=2204±1071m; summer n=7 owls,
x=1069+427m) . Considering winter and summermovements within any one year, differences were not
significant. Point estimates of the mean, however,are all larger for winter than summer (Table 3).
From 1984 through 1986, our indices of small mammal
abundance declined (authors' unpublished data).
Through this period of declining food supply, both
winter and summer movements showed a trend towardlonger movements between roosts (Tables 2 and 3).
Although means are not significantly different,point estimates of the means consistently increased
over the three years.
Another index of the minimum distance traveled
by boreal owls during daily activity is provided by
the distance between roost and nest sites of male
owls during the nesting seasons. The mean distancebetween daytime roosts and the nest sites of four
177
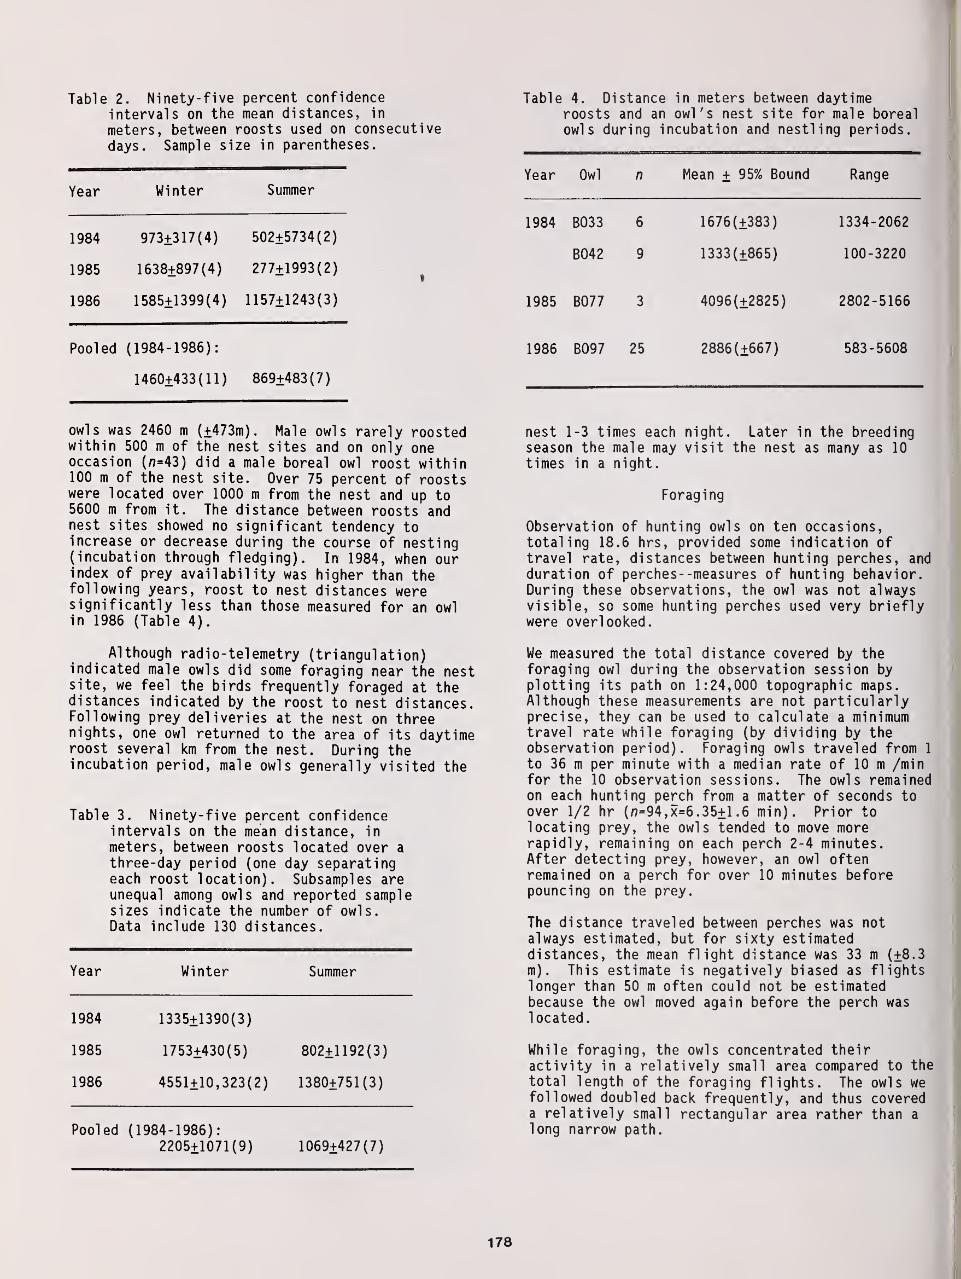
Table 2. Ninety-five percent confidence
intervals on the mean distances, in
meters, between roosts used on consecutive
days. Sample size in parentheses.
Table 4. Distance in meters between daytimeroosts and an owl's nest site for male borealowls during incubation and nestling periods.
Year Winter Summer
1984 973±317(4)
1985 1638±897(4) 277±1993(2)
1986 1585±1399(4) 1157±1243(3)
Pooled (1984-1986):
1460±433(11) 869±483(7)
owls was 2460 m (±473m). Male owls rarely roostedwithin 500 m of the nest sites and on only oneoccasion (/?=43) did a male boreal owl roost within100 m of the nest site. Over 75 percent of roostswere located over 1000 m from the nest and up to5600 m from it. The distance between roosts andnest sites showed no significant tendency toincrease or decrease during the course of nesting(incubation through fledging). In 1984, when ourindex of prey availability was higher than thefollowing years, roost to nest distances weresignificantly less than those measured for an owlin 1986 (Table 4).
Although radio-telemetry (triangulation)indicated male owls did some foraging near the nestsite, we feel the birds frequently foraged at thedistances indicated by the roost to nest distances.Following prey deliveries at the nest on threenights, one owl returned to the area of its daytimeroost several km from the nest. During theincubation period, male owls generally visited the
Table 3. Ninety-five percent confidenceintervals on the mean distance, in
meters, between roosts located over a
three-day period (one day separatingeach roost location). Subsamples areunequal among owls and reported samplesizes indicate the number of owls.Data include 130 distances.
Year Winter Summer
1984 1335±1390(3)
1985 1753±430(5) 802±1192(3)
1986 4551±10, 323(2) 1380±751(3)
Pooled (1984-1986):
2205±1071(9) 1069±427(7)
Year Owl Mean + 95% Bound Range
1984 B033
B042
1985 B077
1986 B097
6
9
3
25
1676(±383)
1333(±865)
4096(±2825)
2886 (±667)
1334-2062
100-3220
2802-5166
583-5608
nest 1-3 times each night. Later in the breedingseason the male may visit the nest as many as 10
times in a night.
Foraging
Observation of hunting owls on ten occasions,totaling 18.6 hrs, provided some indication oftravel rate, distances between hunting perches, andduration of perches--measures of hunting behavior.During these observations, the owl was not alwaysvisible, so some hunting perches used very brieflywere overlooked.
We measured the total distance covered by theforaging owl during the observation session byplotting its path on 1:24,000 topographic maps.Although these measurements are not particularlyprecise, they can be used to calculate a minimumtravel rate while foraging (by dividing by theobservation period). Foraging owls traveled from 1
to 36 m per minute with a median rate of 10 m /minfor the 10 observation sessions. The owls remainedon each hunting perch from a matter of seconds toover 1/2 hr (n=94,x=6.35±l .6 min). Prior tolocating prey, the owls tended to move morerapidly, remaining on each perch 2-4 minutes.After detecting prey, however, an owl oftenremained on a perch for over 10 minutes beforepouncing on the prey.
The distance traveled between perches was notalways estimated, but for sixty estimateddistances, the mean flight distance was 33 m (±8.3m). This estimate is negatively biased as flightslonger than 50 m often could not be estimatedbecause the owl moved again before the perch waslocated.
While foraging, the owls concentrated theiractivity in a relatively small area compared to the
total length of the foraging flights. The owls wefollowed doubled back frequently, and thus covereda relatively small rectangular area rather than a
long narrow path.
178
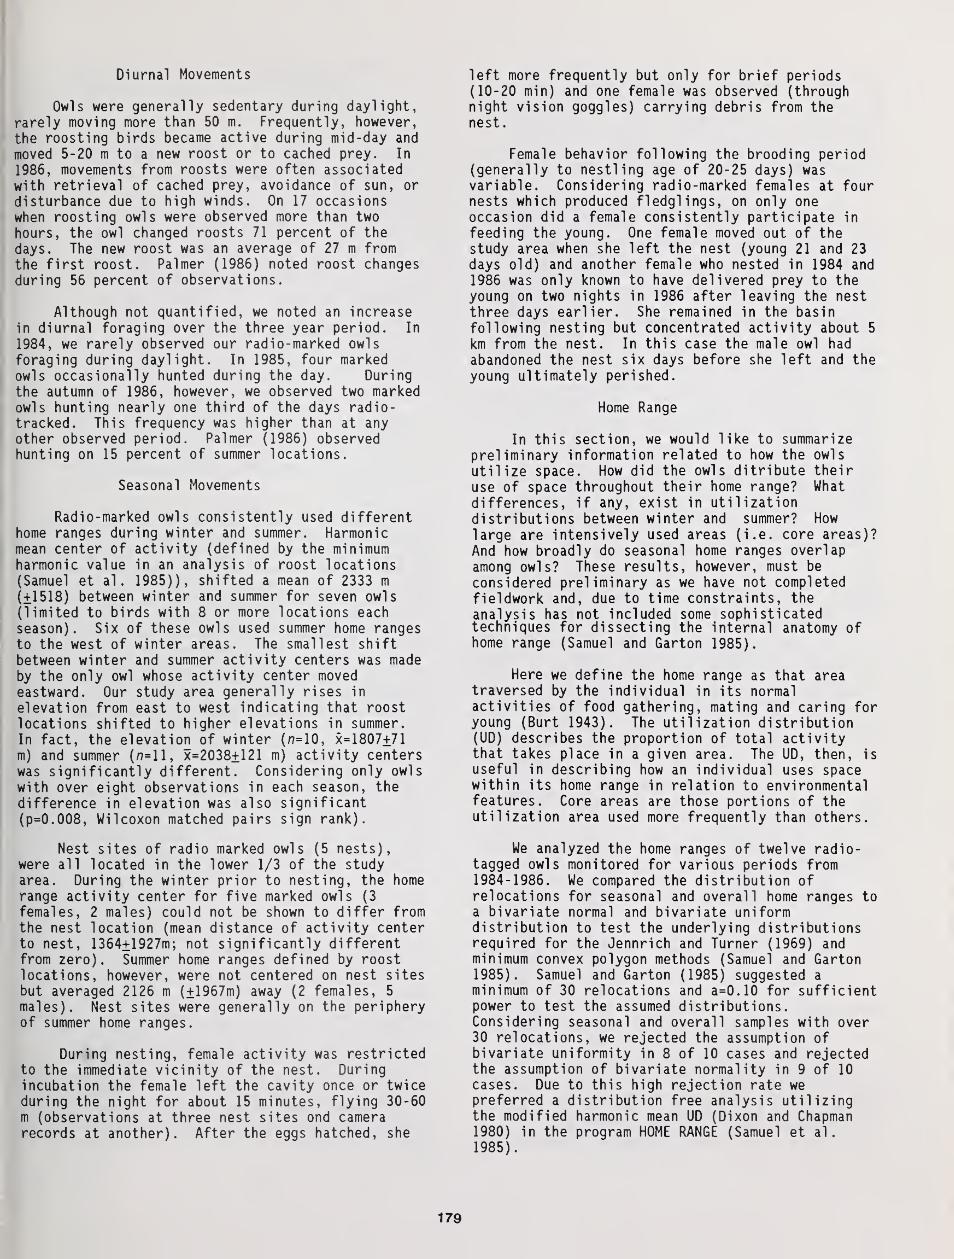
Diurnal Movements
Owls were generally sedentary during daylight,rarely moving more than 50 m. Frequently, however,
the roosting birds became active during mid-day and
moved 5-20 m to a new roost or to cached prey. In
1986, movements from roosts were often associatedwith retrieval of cached prey, avoidance of sun, or
disturbance due to high winds. On 17 occasionswhen roosting owls were observed more than two
hours, the owl changed roosts 71 percent of thedays. The new roost was an average of 27 m fromthe first roost. Palmer (1986) noted roost changesduring 56 percent of observations.
Although not quantified, we noted an increasein diurnal foraging over the three year period. In
1984, we rarely observed our radio-marked owlsforaging during daylight. In 1985, four markedowls occasionally hunted during the day. Duringthe autumn of 1986, however, we observed two markedowls hunting nearly one third of the days radio-tracked. This frequency was higher than at anyother observed period. Palmer (1986) observedhunting on 15 percent of summer locations.
Seasonal Movements
Radio-marked owls consistently used differenthome ranges during winter and summer. Harmonicmean center of activity (defined by the minimumharmonic value in an analysis of roost locations(Samuel et al . 1985)), shifted a mean of 2333 m(+1518) between winter and summer for seven owls(limited to birds with 8 or more locations eachseason). Six of these owls used summer home rangesto the west of winter areas. The smallest shiftbetween winter and summer activity centers was madeby the only owl whose activity center movedeastward. Our study area generally rises in
elevation from east to west indicating that roostlocations shifted to higher elevations in summer.
In fact, the elevation of winter (n=10, x=1807+71m) and summer (n=ll, x=2038±121 m) activity centerswas significantly different. Considering only owls
with over eight observations in each season, the
difference in elevation was also significant
(p=0.008, Wilcoxon matched pairs sign rank).
Nest sites of radio marked owls (5 nests),were all located in the lower 1/3 of the studyarea. During the winter prior to nesting, the homerange activity center for five marked owls (3
females, 2 males) could not be shown to differ fromthe nest location (mean distance of activity centerto nest, 1364+1927m; not significantly differentfrom zero). Summer home ranges defined by roostlocations, however, were not centered on nest sitesbut averaged 2126 m (+1967m) away (2 females, 5
males). Nest sites were generally on the peripheryof summer home ranges.
During nesting, female activity was restrictedto the immediate vicinity of the nest. Duringincubation the female left the cavity once or twiceduring the night for about 15 minutes, flying 30-60
m (observations at three nest sites ond camerarecords at another). After the eggs hatched, she
left more frequently but only for brief periods(10-20 min) and one female was observed (throughnight vision goggles) carrying debris from thenest.
Female behavior following the brooding period(generally to nestling age of 20-25 days) wasvariable. Considering radio-marked females at fournests which produced fledglings, on only oneoccasion did a female consistently participate in
feeding the young. One female moved out of thestudy area when she left the nest (young 21 and 23
days old) and another female who nested in 1984 and1986 was only known to have delivered prey to theyoung on two nights in 1986 after leaving the nestthree days earlier. She remained in the basinfollowing nesting but concentrated activity about 5
km from the nest. In this case the male owl hadabandoned the nest six days before she left and the
young ultimately perished.
Home Range
In this section, we would like to summarizepreliminary information related to how the owls
utilize space. How did the owls ditribute their
use of space throughout their home range? What
differences, if any, exist in utilizationdistributions between winter and summer? Howlarge are intensively used areas (i.e. core areas)?
And how broadly do seasonal home ranges overlapamong owls? These results, however, must be
considered preliminary as we have not completedfieldwork and, due to time constraints, the
analysis has not included some sophisticatedtechniques for dissecting the internal anatomy ofhome range (Samuel and Garton 1985).
Here we define the home range as that areatraversed by the individual in its normalactivities of food gathering, mating and caring foryoung (Burt 1943). The utilization distribution(UD) describes the proportion of total activitythat takes place in a given area. The UD, then, is
useful in describing how an individual uses spacewithin its home range in relation to environmentalfeatures. Core areas are those portions of theutilization area used more frequently than others.
We analyzed the home ranges of twelve radio-tagged owls monitored for various periods from1984-1986. We compared the distribution ofrelocations for seasonal and overall home ranges toa bivariate normal and bivariate uniformdistribution to test the underlying distributionsrequired for the Jennrich and Turner (1969) andminimum convex polygon methods (Samuel and Garton1985). Samuel and Garton (1985) suggested a
minimum of 30 relocations and a=0.10 for sufficientpower to test the assumed distributions.Considering seasonal and overall samples with over30 relocations, we rejected the assumption ofbivariate uniformity in 8 of 10 cases and rejectedthe assumption of bivariate normality in 9 of 10
cases. Due to this high rejection rate wepreferred a distribution free analysis utilizingthe modified harmonic mean UD (Dixon and Chapman1980) in the program HOME RANGE (Samuel et al
.
1985).
179
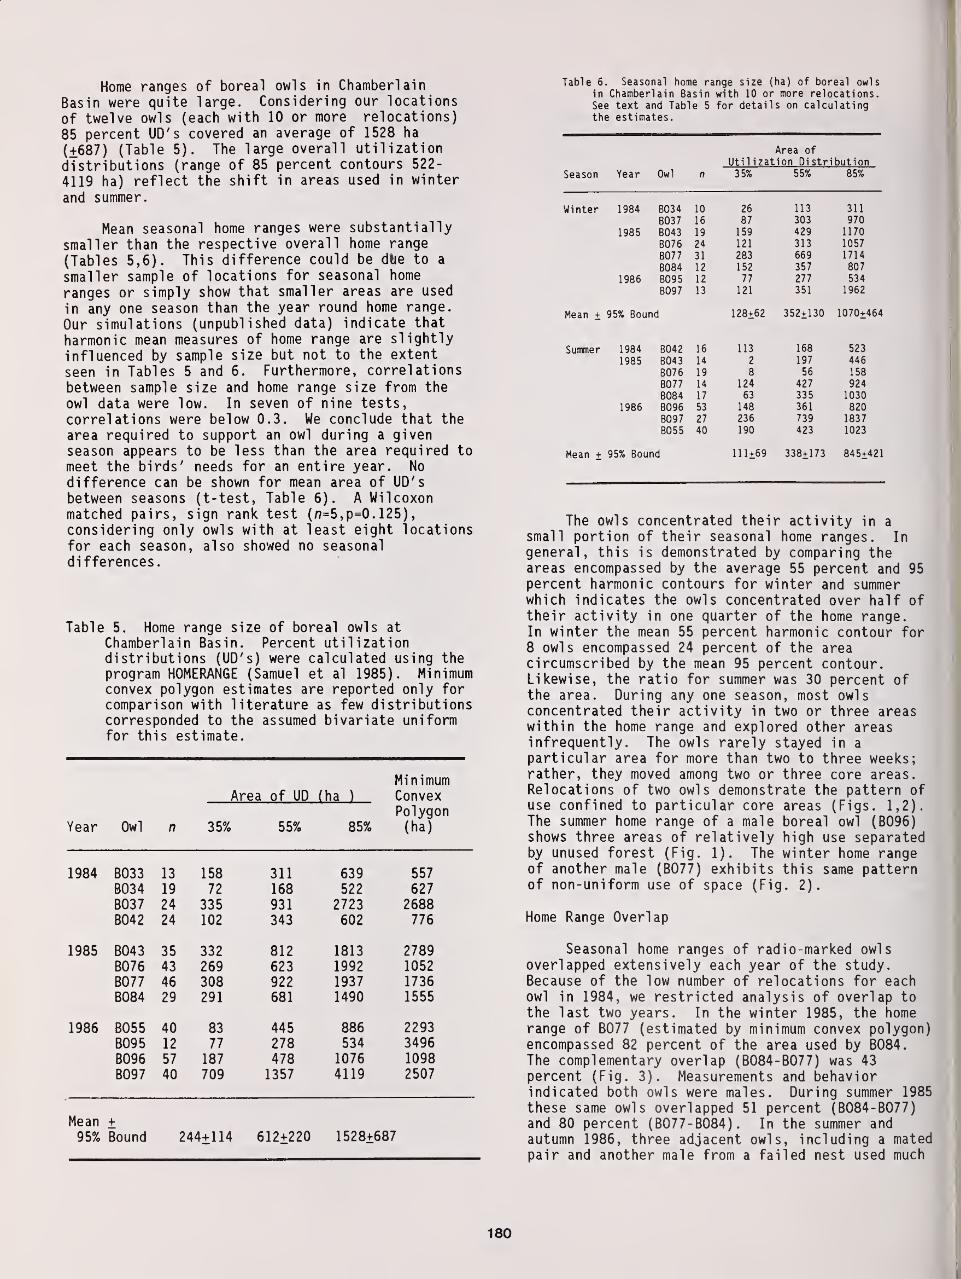
Home ranges of boreal owls in Chamberlain
Basin were quite large. Considering our locations
of twelve owls (each with 10 or more relocations)
85 percent UD's covered an average of 1528 ha
(+687) (Table 5). The large overall utilization
distributions (range of 85 percent contours 522-
4119 ha) reflect the shift in areas used in winter
and summer.
Mean seasonal home ranges were substantially
smaller than the respective overall home range
(Tables 5,6). This difference could be die to a
smaller sample of locations for seasonal home
ranges or simply show that smaller areas are used
in any one season than the year round home range.
Our simulations (unpublished data) indicate that
harmonic mean measures of home range are slightly
influenced by sample size but not to the extent
seen in Tables 5 and 6. Furthermore, correlations
between sample size and home range size from the
owl data were low. In seven of nine tests,correlations were below 0.3. We conclude that thearea required to support an owl during a givenseason appears to be less than the area required tomeet the birds' needs for an entire year. No
difference can be shown for mean area of UD'sbetween seasons (t-test, Table 6). A Wilcoxonmatched pairs, sign rank test (n=5,p=0. 125)
,
considering only owls with at least eight locationsfor each season, also showed no seasonaldifferences.
Table 5. Home range size of boreal owls at
Chamberlain Basin. Percent utilizationdistributions (UD's) were calculated using theprogram HOMERANGE (Samuel et al 1985). Minimumconvex polygon estimates are reported only forcomparison with literature as few distributionscorresponded to the assumed bivariate uniformfor this estimate.
Minimum
Year Owl n
Area of UD (ha )
35% 55% 85%
ConvexPolygon(ha)
1984 B033 13 158 311 639 557
B034 19 72 168 522 627
B037 24 335 931 2723 2688B042 24 102 343 602 776
1985 B043 35 332 812 1813 2789B076 43 269 623 1992 1052
B077 46 308 922 1937 1736B084 29 291 681 1490 1555
1986 B055 40 83 445 886 2293
B095 12 77 278 534 3496
B096 57 187 478 1076 1098
B097 40 709 1357 4119 2507
Mean95%
+
Bound 244+114 612±220 1528±687
Table 6. Seasonal home range size (ha) of boreal owlsin Chamberlain Basin with 10 or more relocations.See text and Table 5 for details on calculatingthe estimates.
Season Year Owl n
Area ofUtilization Distribution35% 55% 85%
W i nter 1984 B034 10 CO 1 1 ^ Oil
B037 16 0 /Q7nj / u
1985 B043 19 1 c;q1 J7 I 1 7fiI I / \J
B076 24 121 313 1057
B077 31 283 669 1714
B084 12 152 357 807
1986 B095 1
2
77 277 534
B097 13 121 351 1962
Mean + 95% Bound 128±62 352±130 1070+464
Summer 1984 B042 16 113 168 523
1985 B043 14 2 197 446
B076 19 8 56 158
B077 14 124 427 924
B084 17 63 335 1030
1986 B096 53 148 361 820
B097 27 236 739 1837
B055 40 190 423 1023
Mean + 95% Bound 1 11+69 338+173 845±421
The owls concentrated their activity in a
small portion of their seasonal home ranges. In
general, this is demonstrated by comparing theareas encompassed by the average 55 percent and 95percent harmonic contours for winter and summerwhich indicates the owls concentrated over half oftheir activity in one quarter of the home range.In winter the mean 55 percent harmonic contour for8 owls encompassed 24 percent of the areacircumscribed by the mean 95 percent contour.Likewise, the ratio for summer was 30 percent ofthe area. During any one season, most owlsconcentrated their activity in two or three areaswithin the home range and explored other areasinfrequently. The owls rarely stayed in a
particular area for more than two to three weeks;rather, they moved among two or three core areas.Relocations of two owls demonstrate the pattern ofuse confined to particular core areas (Figs. 1,2).The summer home range of a male boreal owl (B096)shows three areas of relatively high use separatedby unused forest (Fig. 1). The winter home rangeof another male (B077) exhibits this same patternof non-uniform use of space (Fig. 2).
Home Range Overlap
Seasonal home ranges of radio-marked owlsoverlapped extensively each year of the study.Because of the low number of relocations for eachowl in 1984, we restricted analysis of overlap tothe last two years. In the winter 1985, the homerange of B077 (estimated by minimum convex polygon)encompassed 82 percent of the area used by B084.The complementary overlap (B084-B077) was 43percent (Fig. 3). Measurements and behaviorindicated both owls were males. During summer 1985
these same owls overlapped 51 percent (B084-B077)and 80 percent (B077-B084). In the summer andautumn 1986, three adjacent owls, including a matedpair and another male from a failed nest used much
180
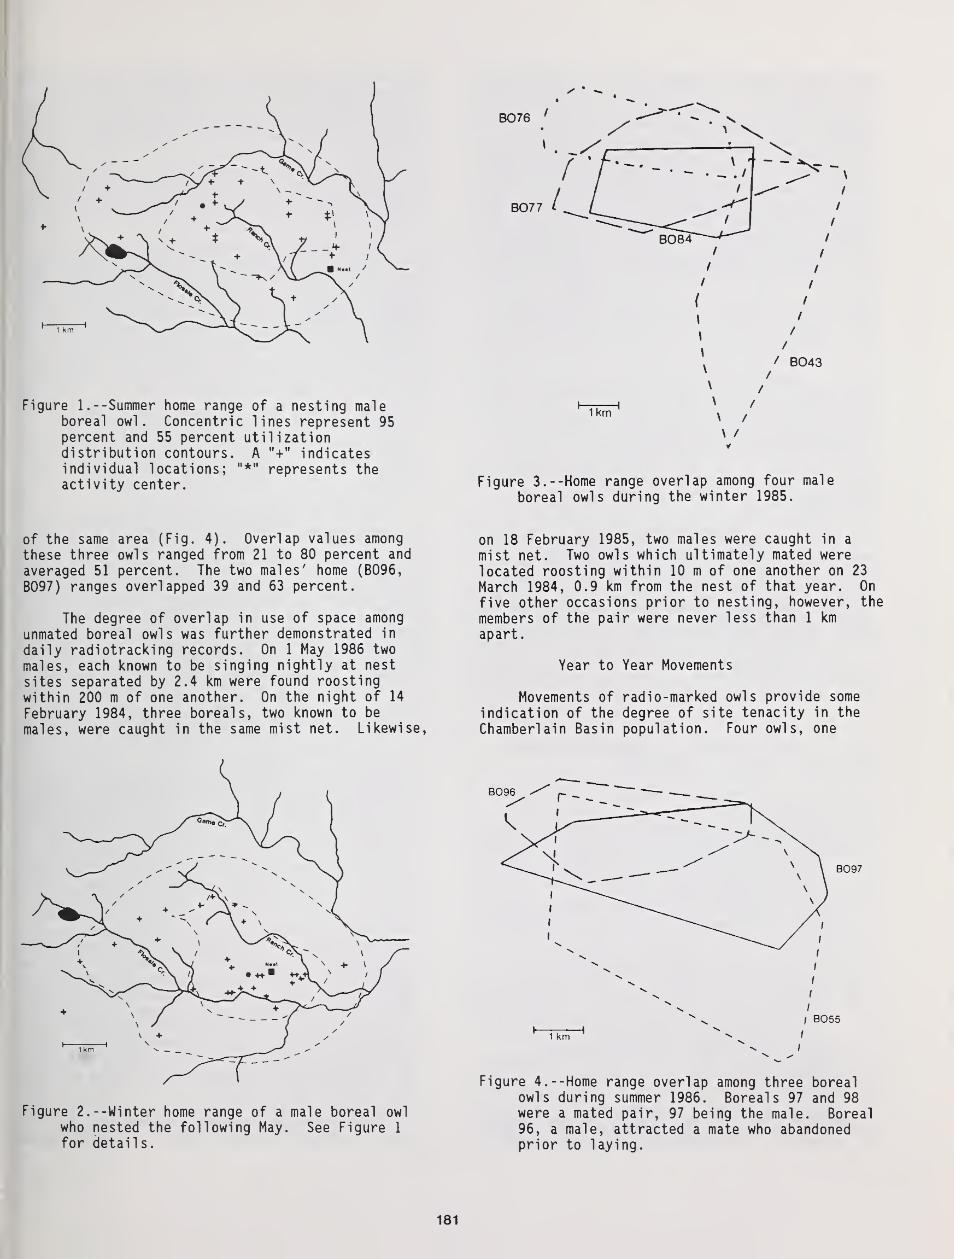
Figure 1.- -Summer home range of a nesting maleboreal owl. Concentric lines represent 95percent and 55 percent utilizationdistribution contours. A "+" indicatesindividual locations; "*" represents theactivity center.
B076
B077
/ B043
h-TT 1
1 kmI /
\ /
\ /
Figure 3. --Home range overlap among four male
boreal owls during the winter 1985.
of the same area (Fig. 4). Overlap values among
these three owls ranged from 21 to 80 percent and
averaged 51 percent. The two males' home (B096,
B097) ranges overlapped 39 and 63 percent.
The degree of overlap in use of space among
unmated boreal owls was further demonstrated in
daily radiotracking records. On 1 May 1986 two
males, each known to be singing nightly at nest
sites separated by 2.4 km were found roostingwithin 200 m of one another. On the night of 14
February 1984, three boreal s, two known to be
males, were caught in the same mist net. Likewise,
on 18 February 1985, two males were caught in a
mist net. Two owls which ultimately mated werelocated roosting within 10 m of one another on 23
March 1984, 0.9 km from the nest of that year. On
five other occasions prior to nesting, however, the
members of the pair were never less than 1 km
apart.
Year to Year Movements
Movements of radio-marked owls provide some
indication of the degree of site tenacity in the
Chamberlain Basin population. Four owls, one
Figure 2. --Winter home range of a male boreal owl
who nested the following May. See Figure 1
for details.
B096
1 km
B097
/ B055
/
Figure 4. --Home range overlap among three borealowls during summer 1986. Boreal s 97 and 98were a mated pair, 97 being the male. Boreal96, a male, attracted a mate who abandonedprior to laying.
181
female and three males, were found in the Basin in
more than one year. The female nested with a
different mate in 1984 and 1986 in cavities 1.4 kmapart. A male captured 14 February 1984 wasrecaptured 17 March 1985, 0.5 km away from hisfirst capture site. This owl (B043) wore an activetransmitter from March 1985 through January 1986when it moved out of the basin with a fresh (11 dayold) transmitter. A second male (B085), capturedat its nest in 1985, was using a home range withinseveral km of the nest Febrary 1986 when it died(cause thought to be starvation). The third male,first captured in March 1985 (B084) was using a
similar home range in February 1986 when it leftthe basin (same two week period as B085 died andB043 left). This owls' radio signal was relocatedon 7 May 1986 80 km to the west near Upper PayetteLake, Valley Co. , Idaho.
One female was thought to have left the basinwithin 8 days after she first left her nest. On 5
July, when her young were 20 and 22 days old, theowl was roosting near the cavity at 2100 h, thefirst day she was found off the nest. By 2207 h
she was moving from the nest and could not be
located until 13 July when a faint signal was heardabout 7 km from the nest. The radio signal wasnever heard again.
A male also appeared to have left the Basinwhen he abandoned his nest 17 days into thenestling period. A camera at the nest failed toregister any nest visits the night after we firstfailed to locate his radio signal. Whether the owl
was killed by a predator, which also destroyed theradio, or the bird left the region is unknown.
DISCUSSION
Our results reveal six important featuresabout boreal owls at Chamberlain.
1) Boreal s used large seasonal areas for birdsof their size.
2) Differences in seasonal home range andmovements indicate that resource requirementslikely differ substantially between seasons,and at Chamberlain all those requirements arenot met within one forest type.
3) Use of space within seasonal home ranges wasnot uniform but concentrated in particularcore areas.
4) The owls did not maintain exclusiveterritories but overlapped broadly in
seasonal home ranges.
5) During the period of declining prey resources(1984-1986), the distances moved betweenroosts tended to increase.
6) The pattern ofyear to year occupancyindicated a mixture of nomadic and sedentarybehavior.
Boreal owls used extremely large areas atChamberlain. Despite our relatively small sampleof relocations, estimated home ranges were larger
than the 1-5 knr reported by Bondrup-Nielsen (1978)for boreal owls in Canada. Home range sizes forthree males in Norway ranged between 94 and 226 ha(Jacobsen and Sonerud, these proceedings).Breeding season minimum convex polygon home rangeestimates for two Colorado male boreal owls (240and 352 ha, minimum convex polygon) (Palmer 1986)were similar to summer home ranges calculated fortwo males nesting in our study area the same year(317 and 335 ha).
Home ranges reported for other species arealso substantially smaller than Chamberlain borealowls. Forsman et al . (1984) cited home ranges lessthan 2000 ha for spotted owls {Strix occidental is)
,
while Forbs and Warner (1974) reported 113 ha homeranges for Michigan saw-whet owls {Aegoliusacadicus). Smith and Gilbert (1984) calculated 103and 130 ha home ranges for Connecticut screech owls(Otus asio) radiotracked for five months (January -
May). Boreal owi home ranges fell within the rangereported for the large eagle owl {Bubo bubo) ofEurope (1400-15,000 ha) (Mikkola 1983). The use ofsuch a large area by a relatively small owl
indicates either low resource abundance or thatareas of resource concentration are widelydispersed.
In the heterogeneous habitat at Chamberlain,all resource requirements were not met bycontiguous forest stands. Thus, seasonalrequirements were satisfied in different areas.This feature is reflected in changes in location ofhome ranges from winter to summer accomplished by a
shift to higher elevations in summer, and by theconsistent trend for winter movements to be longerthan summer. Also, the nest site was nevercentered in home ranges, rather, roosting andforaging habitat was chosen distant from the nestsite. In Colorado, the home ranges of boreal owlsshifted after the breeding season (Palmer 1986).Such a shift might also indicate changing resourceneeds and availability.
In winter, movements are likely primarilydirected toward securing sufficient prey to meetdaily maintainance costs. Specific areas may beused because they provide higher than average preyavailability or lower the owls' average energycosts. Our observations indicate that daytimeroost requirements play little role in dictatingwinter movements and home range. In summer,however, roost site requirements may be partlyresponsible for the shift to high elevations awayfrom the nest site. Boreal owls are easily heatstressed; gullar fluttering by inactive roostingowls occurred at temperatures as low as 75°F. Preyavailability might also play a role in choice ofspace during summer since the same cool, matureforests which provide optimum summer roosts alsohave the most abundant small mammal populations(unpublished data). Areas of abundant cavitieswere distant from the high elevation forests so
that nest sites were usually distant from roostingand foraging areas.
The concentration of activity in small
portions of seasonal home ranges in Chamberlain and
182
suggestion that forest stands varied in their value
to boreal owls. Future analysis comparing the
habitat within core areas to less used portions of
the home range may indicate what features of forest
structures and compositon are important in boreal
owl habitat.
Territories of boreal owls in Europe (Solheim
1983) and Canada (Bondrup-Niel son 1978) have been
characterized as simple breeding territories with
no defense of foraging areas. Only a small region
around the nest is defended as an exclusive area.
Our information shows that boreal owl movements are
not influenced by conspecifics and overlap among
owls is substantial. In Norway, male boreal owls
averaged 56% overlap (Jacobsen and Sonerud, theseproceedings). Palmer (1986) also found two maleboreal owls overlapping as much as 98 percent in
early summer. Defense of the large foraging areas
used by the owls would be difficult if not
impossible.
From 1984-1986, during a period of declining
small mammal abundance, home range size tended to
increase as well as the length of day to day
movements. Faced with lower prey availability, two
basic strategies may be employed. First, the owls
may conserve energy through reduced foragingactivity and/or reproductive expenditure. An
alternative strategy is to increase foraging effort
at the expense of other activities. Increased
activity may make the owls more vulnerable to
predation. During winter, a majority of the energyexpenditure is for self maintainance. Becauseboreal owls are relatively small birds, they cannotrely on accumulated reserves for extended periods.
A strategy of energy conservation, therefore, is
not feasible. Instead, the owls appeared to search
over progressively larger areas as prey resources
decl ined.
During summer, energy expenditure may be
directed toward reproduction as well as self
maintainance. The range of strategies to cope with
reduced prey is, therefore, increased. Breeding
efforts may range from failure to initiate nesting
through raising a large brood, with correspondingvariation in energy expenditure. At Chamberlain,
the number of calling owls decreased and frequencyof nest abandonment increased as prey resources
declined indicating a reduction in reproductiveexpenditure. In addition, summer home ranges and
daily movements increased from 1984-1986.
Populations of boreal owls vary in the degree
of site tenacity or nomadism which they exhibit.
In Europe, there is a general trend for increased
nomadism in more northern populations (Korpimaki
1986). Korpimaki (1986) found that within Finland
the degree of nomadism was positively correlated
with winter snow depth. Lundberg (1979)
hypothesized that due to the conflicting pressures
of food stress favoring nomadism and nest site
scarcity favoring site tenacity, the movement
pattern of male and female boreal owls differ. He
hypothesized that males would exhibit site tenacity
and females nomadism. Lundberg's reasoning finds
support from theory and empirical evidence. The
large potential clutch size of boreal owls andcyclic pattern of food production fit Anderssons's(1980) model for a species likely to exhibitnomadism. On the other hand, von Haartman (1968)showed that residency was favored by the increasedreproductive output afforded by early nesting in
cavity nesters. Wall in and Andersson (1981),Solheim (1983), Lofgren et al . (1986) and Korpimaki(1986) have demonstrated that boreal owls exhibitboth site tenacity and nomadic tendencies. In themost intensive investigation, Lofgren et al . (1986)showed that males were site tenacious throughout a
prey cycle whereas females were tenacious onlyduring prey peaks.
Our owls also showed a mixed strategy of site
tenacity and nomadism, but differences betweensexes were not clear. Some males and femalesremained in the study area during a period ofdeclining prey. Both sexes also exhibited nomadismduring the same period. The only individual
located far from the study area was a male, but
several others disappeared from the area and werenever relocated. In Colorado, Palmer (1986) also
observed a tendency toward nomadism in both maleand female owls.
Deep snow (0.5-2.0 m) which remains in our
study area for five months each year and relatively
low prey populations likely contribute to the
nomadic character of the boreal owl population at
Chamberlain. Winter prey scarcity may frequently
force many owls to search elsewhere for food.
Conversely, if prey populations fluctuate but do
not exhibit a cyclic pattern, the tendency for
nomadism should be reduced (Andersson 1980). Small
mammals in the Rockies have not been shown to be
cyclic. The conflicting forces of severe winter
food scarcity but lack of a consistent cycle may be
responsible for the mixed pattern of site tenacityand nomadism.
SUMMARY
The boreal owls we studied moved over large
home ranges throughout the year. Within seasonal
home ranges, the owls concentrated their activity
in several core areas, frequently moving back and
forth among preferred areas. The owls consistently
shifted seasonal ranges, concentrating activity at
higher elevations during summer months. Despite
this shift to higher elevations during breeding,
nest sites were all within the lower one third of
the study area and were generally on the periphery
of the home range. Although not conclusive, our
data suggested that the owls used larger home
ranges and moved further from one day to the next
during a period of declining prey.
As indicated by other authors, we found no
evidence of defense of foraging areas. Home ranges
of owls overlapped extensively and male boreal owls
were found roosting within 200 m of one another. A
mixed pattern of sedentary and nomadic behavior was
indicated by year to year movements.
183
ACKNOWLEDGEMENTS
L. Flaccus and A. Wright helped radiotrackowls. The U.S. Forest Service, Forest and RangeSciences Laboratory, Boise, Idaho, and IdahoDepartment of Fish and Game provided major funding.The N.A. Bluebird Society, U.S. Army, Max McGrawWildlife Foundation, U.S. Forest Service Region I,
Columbia Basin Audubon Society , TDK ElectronicsCorp., and Duracell Corp. also gave support.Payette National Forest provided housing. Thestudy could not have been completed without thesupport of all the above individuals andorganizations.
LITERATURE CITED
Andersson, M. 1980. Nomadism and sitetenacity as alternative reproductivetactics in birds. Journal of AnimalEcology 49:175-184.
Bondrup-Niel sen, S. 1978. Vocalizations,nesting, and habitat preferences ofthe boreal owl {Aegolius funereus) in
North America. Masters Thesis. Univ.
of Toronto. 151 pp.Burt, W. H. 1943. Territoriality and
home range concepts as applied to
mammals. Journal of Mammalogy 24:346-352.
Catling, P.M. 1972. A study of boreal owl
in southern Ontario with particularreference to the irruption of 1968-
69. Canadian Field Naturalist 86:223-232.
Dixon, K. R. and J. A. Chapman. 1980.Harmonic mean measure of animalactivity areas. Ecology 61:1040-1044.
Forbes, J. E. and D. W. Warner. 1974.
Behavior of a radio tagged saw-whetowl . Auk 91:783-794.
Forsman, R. D., E. C. Meslow and H. M.
Wight. 1984. Distribution and biologyof the spotted owl in Oregon.Wildlife Monographs 87:1-64.
Hayward, G. D. (in review). A method forstudy of owl foraging habitat andbehavior. Raptor Research.
Hayward, G. D. and E. 0. Garton. 1983.
First nesting record for boreal owl
in Idaho. Condor 85:501.Hurlbert, S. H. 1984. Psuedorepl ication
and the design of ecological fieldexperiments. Ecological Monographs54:187-211.
Jacobsen, B. V. and G. A. Sonerud. (theseproceedings). Calculating the home-range size of Tengmalm's Owl: a
comparison of two methods. NorthernForest Owl Symposium. Winnipeg,Manitoba, Canada, February 3-7, 1987.
Jennrich, R. I. and F. B. Turner. 1969.Measurements of noncircular homerange. Journal of TheoreticalBiology 22:227-237.
Korpimaki, E. 1986. Gradients in
population fluctuations of Tengmalm'sowl Aegolius funereus in Europe.Oecologia 69:195-201.
Lofgren, 0., B. Hornfeldt, and B. G.
Carlsson. 1986. Site tenacity andnomadism in Tengmalm's owl {Aegoliusfunereus) in relation to cyclic foodproduction. Oecologia 69:321-326.
Lundberg, A. 1979. Residency, migrationand a compromise: Adaptations to nestsite scarcity and food specializationin three Fennoscandian owl species.Oecologia 41:273-281.
Mikkola, M. 1983. The owls of Europe.
Buteo Books, Vermillion, SD. 397 pp.Palmer, D. A. 1986. Habitat selection,
movements and activity of boreal and
saw-whet owls. Masters Thesis.
Colo. State Univ. Ft. Collins, pp.38-68.
Samuel, M. D. and E. 0. Garton. 1985. Home
range: A weighted normal estimate and
tests of underlying assumptions.Journal of Wildlife Management 49:
513-519.
Samuel, M. D., D. J. Pierce, E. 0. Garton,
L. J. Nelson, and K. R. Dixon. 1985.
User's manual for program HOME RANGE.
Univ. of Idaho, Forest, Wildlife and
Range Experiment Station Tech. Rep.
15. 70 pp.Schoener, T. W. 1981. An empirically
based estimate of home range.
Theoretical Population Biolology20:281-325.
Smith, D. G. and R. Gilbert. 1984.
Eastern screech owl home range and
use of suburban habitats in southernConnecticut. Journal of Field
Ornithology 55:322-329.
Solheim, R. 1983. Bigyny and biandry in
the Tengmalm's owl Aegolius funereus.
Ornis Scandinavica 14:51-57.
von Haartman, L. 1968. The evolution of
resident versus migratory habit in
birds. Ornis Fennica 45:1-7.
Wall in, K. and M. Andersson. 1981. Adult
nomadism in Tengmalm's Owl Aegolius
funereus. Ornis Scandinavica 12:125-
126.
184
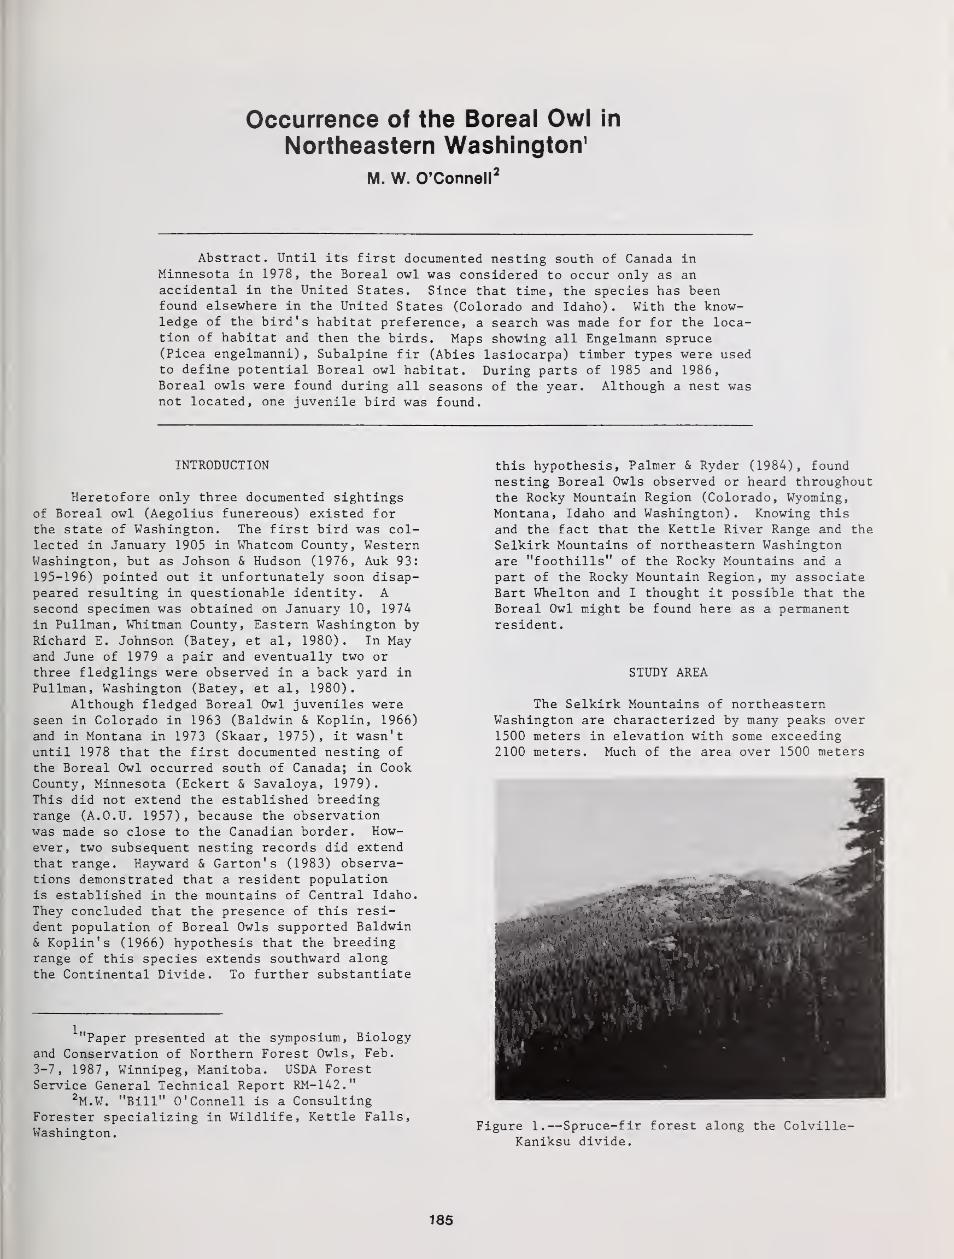
Occurrence of the Boreal Owl in
Northeastern Washington 1
M. W. O'Connell2
Abstract. Until its first documented nesting south of Canada inMinnesota in 1978, the Boreal owl was considered to occur only as anaccidental in the United States. Since that time, the species has beenfound elsewhere in the United States (Colorado and Idaho) . With the know-ledge of the bird's habitat preference, a search was made for for the loca-tion of habitat and then the birds. Maps showing all Engelmann spruce(Picea engelmanni) , Subalpine fir (Abies lasiocarpa) timber types were usedto define potential Boreal owl habitat. During parts of 1985 and 1986,Boreal owls were found during all seasons of the year. Although a nest wasnot located, one juvenile bird was found.
INTRODUCTION
Heretofore only three documented sightingsof Boreal owl (Aegolius funereous) existed forthe state of Washington. The first bird was col-lected in January 1905 in Whatcom County, WesternWashington, but as Johson & Hudson (1976, Auk 93:
195-196) pointed out it unfortunately soon disap-peared resulting in questionable identity. Asecond specimen was obtained on January 10, 1974
in Pullman, Whitman County, Eastern Washington byRichard E. Johnson (Batey, et al, 1980). In Mayand June of 1979 a pair and eventually two or
three fledglings were observed in a back yard inPullman, Washington (Batey, et al, 1980).
Although fledged Boreal Owl juveniles wereseen in Colorado in 1963 (Baldwin & Koplin, 1966)
and in Montana in 1973 (Skaar, 1975), it wasn'tuntil 1978 that the first documented nesting of
the Boreal Owl occurred south of Canada; in CookCounty, Minnesota (Eckert & Savaloya, 1979).This did not extend the established breedingrange (A.O.U. 1957), because the observationwas made so close to the Canadian border. How-ever, two subsequent nesting records did extendthat range. Hayward & Garton's (1983) observa-tions demonstrated that a resident populationis established in the mountains of Central Idaho.
They concluded that the presence of this resi-dent population of Boreal Owls supported Baldwin& Koplin' s (1966) hypothesis that the breedingrange of this species extends southward alongthe Continental Divide. To further substantiate
this hypothesis, Palmer & Ryder (1984), foundnesting Boreal Owls observed or heard throughoutthe Rocky Mountain Region (Colorado, Wyoming,Montana, Idaho and Washington). Knowing thisand the fact that the Kettle River Range and the
Selkirk Mountains of northeastern Washingtonare "foothills" of the Rocky Mountains and a
part of the Rocky Mountain Region, my associateBart Whelton and I thought it possible that the
Boreal Owl might be found here as a permanentresident
.
STUDY AREA
The Selkirk Mountains of northeasternWashington are characterized by many peaks over
1500 meters in elevation with some exceeding2100 meters. Much of the area over 1500 meters
YVjA^""Paper presented at the symposium, Biology
and Conservation of Northern Forest Owls, Feb.
3-7, 1987, Winnipeg, Manitoba. USDA ForestService General Technical Report RM-142."
2M.W. "Bill" O'Connell is a ConsultingForester specializing in Wildlife, Kettle Falls,
Washington. Figure 1.—Spruce-fir forest along the Colville-Kaniksu divide.
185
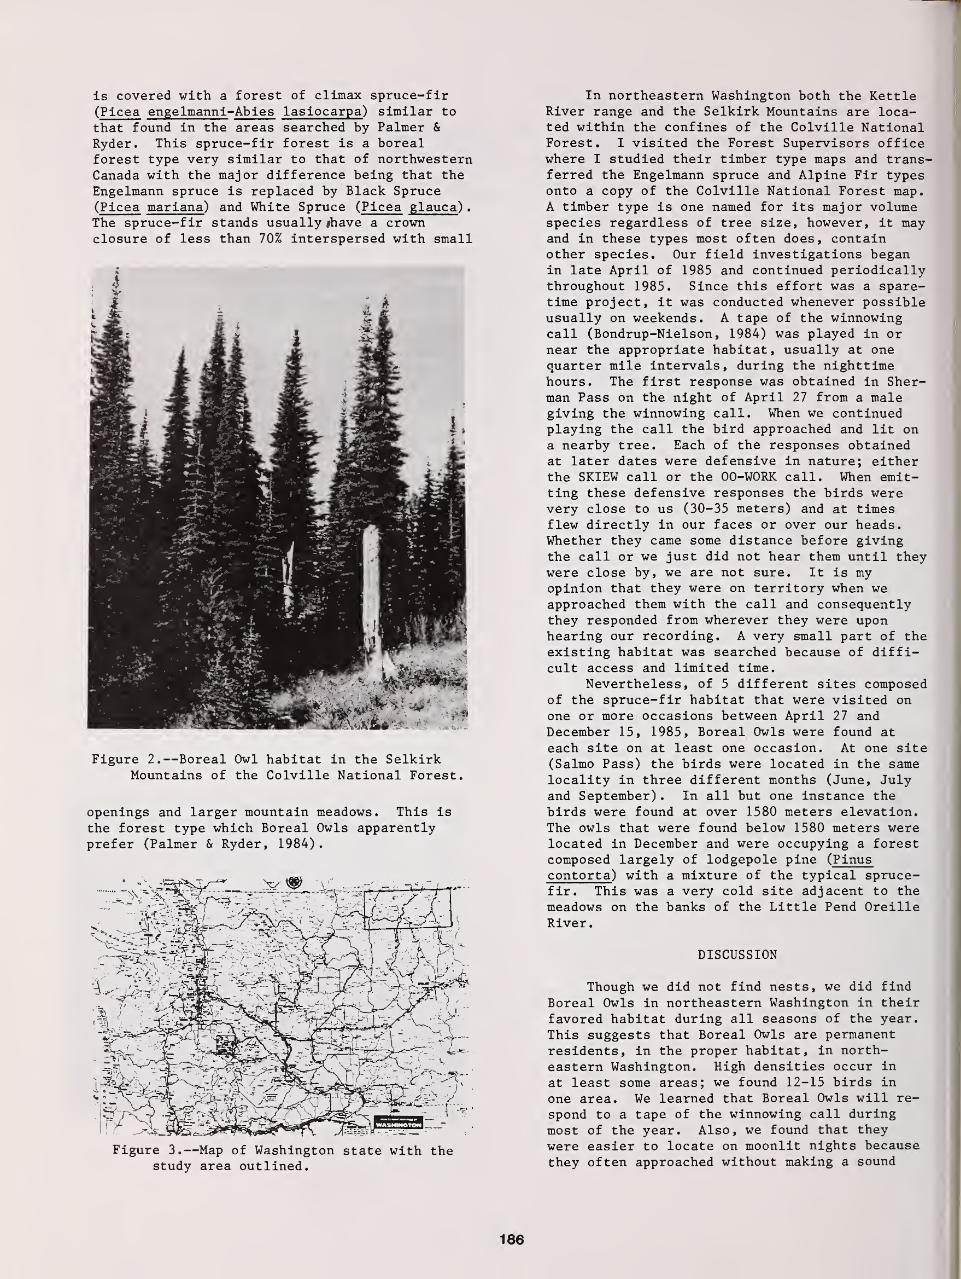
is covered with a forest of climax spruce-fir(Picea engelmanni-Abies lasiocarpa) similar to
that found in the areas searched by Palmer &
Ryder. This spruce-fir forest is a borealforest type very similar to that of northwesternCanada with the major difference being that theEngelmann spruce is replaced by Black Spruce
(Picea mariana) and White Spruce (Picea glauca) .
The spruce-fir stands usually #have a crownclosure of less than 70% interspersed with small
Figure 2.—Boreal Owl habitat in the SelkirkMountains of the Colville National Forest.
openings and larger mountain meadows. This is
the forest type which Boreal Owls apparentlyprefer (Palmer & Ryder, 1984).
{-.
Figure 3.—Map of Washington state with thestudy area outlined.
In northeastern Washington both the KettleRiver range and the Selkirk Mountains are loca-ted within the confines of the Colville NationalForest. I visited the Forest Supervisors officewhere I studied their timber type maps and trans-ferred the Engelmann spruce and Alpine Fir typesonto a copy of the Colville National Forest map.A timber type is one named for its major volumespecies regardless of tree size, however, it mayand in these types most often does, containother species. Our field investigations beganin late April of 1985 and continued periodicallythroughout 1985. Since this effort was a spare-time project, it was conducted whenever possibleusually on weekends. A tape of the winnowingcall (Bondrup-Nielson, 1984) was played in ornear the appropriate habitat, usually at onequarter mile intervals, during the nighttimehours. The first response was obtained in Sher-man Pass on the night of April 27 from a malegiving the winnowing call. When we continuedplaying the call the bird approached and lit ona nearby tree. Each of the responses obtainedat later dates were defensive in nature; eitherthe SKIEW call or the 00-WORK call. When emit-ting these defensive responses the birds werevery close to us (30-35 meters) and at timesflew directly in our faces or over our heads.Whether they came some distance before givingthe call or we just did not hear them until theywere close by, we are not sure. It is myopinion that they were on territory when weapproached them with the call and consequentlythey responded from wherever they were uponhearing our recording. A very small part of theexisting habitat was searched because of diffi-cult access and limited time.
Nevertheless, of 5 different sites composedof the spruce-fir habitat that were visited onone or more occasions between April 27 andDecember 15, 1985, Boreal Owls were found at
each site on at least one occasion. At one site(Salmo Pass) the birds were located in the samelocality in three different months (June, Julyand September) . In all but one instance the
birds were found at over 1580 meters elevation.The owls that were found below 1580 meters werelocated in December and were occupying a forestcomposed largely of lodgepole pine (Pinuscontorta) with a mixture of the typical spruce-fir. This was a very cold site adjacent to themeadows on the banks of the Little Pend OreilleRiver.
DISCUSSION
Though we did not find nests, we did find
Boreal Owls in northeastern Washington in theirfavored habitat during all seasons of the year.
This suggests that Boreal Owls are permanentresidents, in the proper habitat, in north-eastern Washington. High densities occur in
at least some areas; we found 12-15 birds in
one area. We learned that Boreal Owls will re-
spond to a tape of the winnowing call duringmost of the year. Also, we found that they
were easier to locate on moonlit nights becausethey often approached without making a sound
186
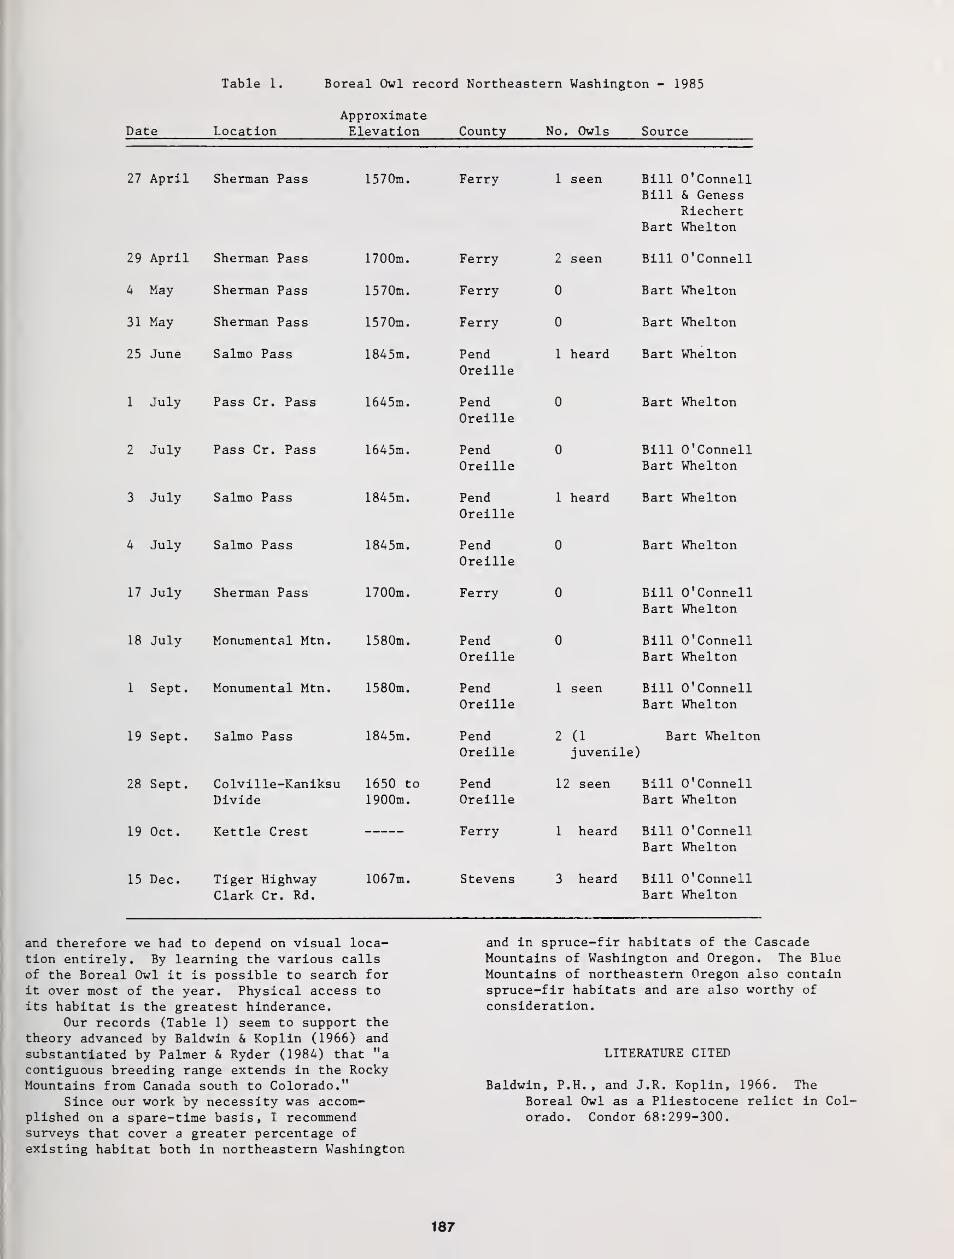
Table 1. Boreal Owl record Northeastern Washington - 1985
Date LocationApproximateElevation County No. Owls Source
27 April Sherman Pass 1570m. Ferry 1 seen
29 April
4 May
31 May
25 June
Sherman Pass
Sherman Pass
Sherman Pass
Salmo Pass
1 July Pass Cr. Pass
2 July Pass Cr. Pass
3 July Salmo Pass
4 July Salmo Pass
17 July Sherman Pass
19 Sept. Salmo Pass
28 Sept. Colville-KaniksuDivide
19 Oct. Kettle Crest
15 Dec. Tiger HighwayClark Cr. Rd.
1700m.
1570m.
1570m.
1845m.
1645m.
1645m.
1845m.
1845m.
1700m.
18 July Monumental Mtn. 1580m.
1 Sept. Monumental Mtn. 1580m.
1845m.
1650 to
1900m.
1067m.
Ferry
Ferry
Ferry
PendOreille
PendOreille
PendOreille
PendOreille
PendOreille
Ferry
PendOreille
PendOreille
PendOreille
PendOreille
Ferry
Stevens
2 seen
0
0
1 heard
Bill O'ConnellBill & Geness
RiechertBart Whelton
Bill O'Connell
Bart whelton
Bart whelton
Bart Whelton
Bart Whelton
Bill O'ConnellBart Whelton
1 heard Bart Whelton
Bart Whelton
0 Bill O'ConnellBart Whelton
0 Bill O'ConnellBart Whelton
1 seen Bill O'ConnellBart Whelton
Bart Whelton2 (1
juvenile)
12 seen
1 heard
3 heard
Bill O'ConnellBart Whelton
Bill O'ConnellBart Whelton
Bill O'ConnellBart Whelton
and therefore we had to depend on visual loca-tion entirely. By learning the various callsof the Boreal Owl it is possible to search forit over most of the year. Physical access toits habitat is the greatest hinderance.
Our records (Table 1) seem to support thetheory advanced by Baldwin & Koplin (1966) and
substantiated by Palmer & Ryder (1984) that "acontiguous breeding range extends in the RockyMountains from Canada south to Colorado."
Since our work by necessity was accom-plished on a spare-time basis, I recommendsurveys that cover a greater percentage of
existing habitat both in northeastern Washington
and in spruce-fir habitats of the CascadeMountains of Washington and Oregon. The BlueMountains of northeastern Oregon also containspruce-fir habitats and are also worthy of
consideration.
LITERATURE CITED
Baldwin, P.H., and J.R. Koplin, 1966. TheBoreal Owl as a Pliestocene relict in Colorado. Condor 68:299-300.
187
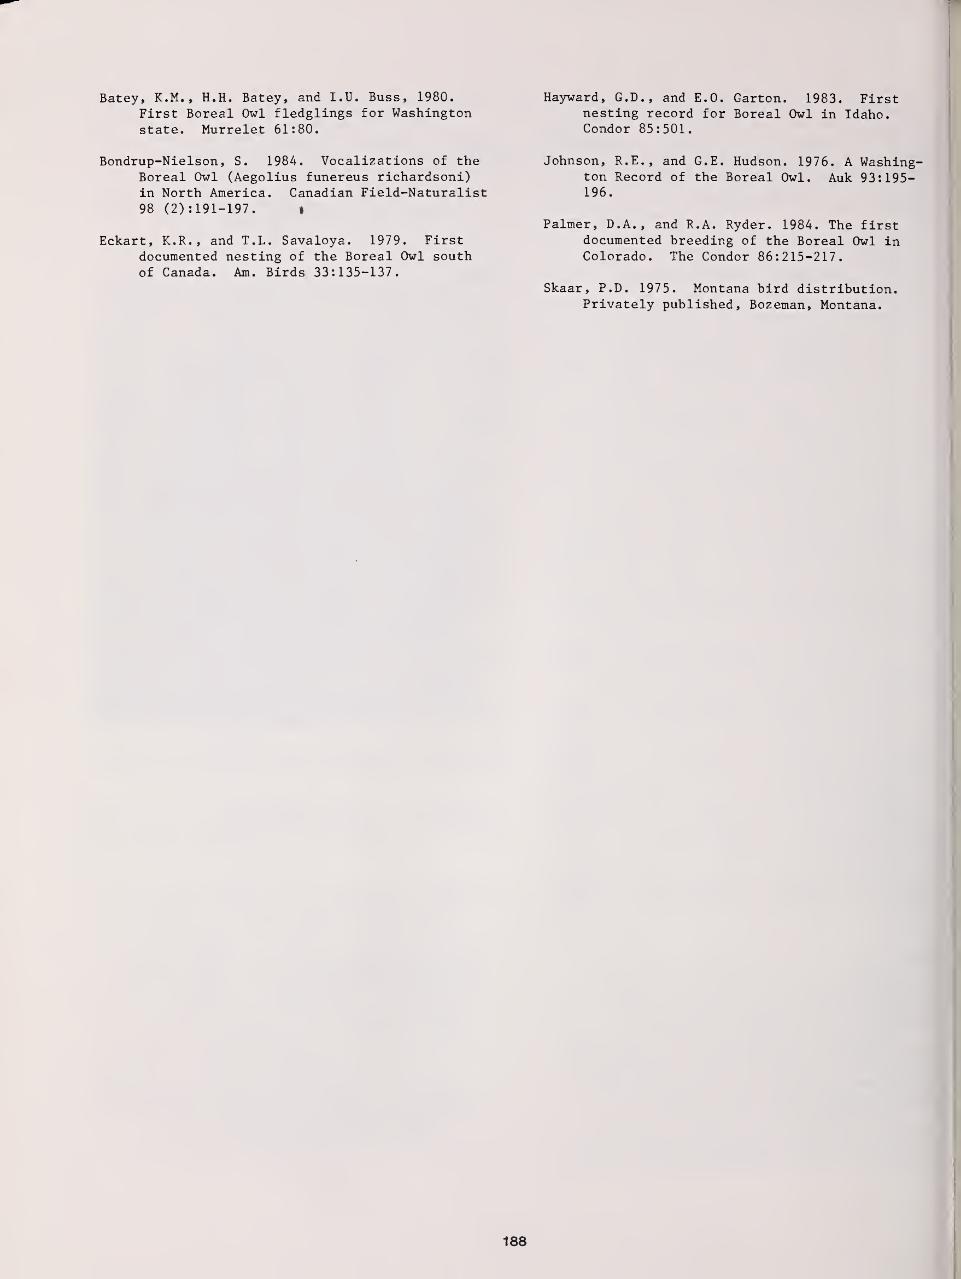
Batey, K.M. , H.H. Batey, and I.U. Buss, 1980.
First Boreal Owl fledglings for Washingtonstate. Murrelet 61:80.
Bondrup-Nielson, S. 1984. Vocalizations of theBoreal Owl (Aegolius funereus richardsoni)in North America. Canadian Field-Naturalist98 (2) : 191-197. »
Eckart, K.R., and T.L. Savaloya. 1979. Firstdocumented nesting of the Boreal Owl southof Canada. Am. Birds 33:135-137.
Hayward, CD., and E.O. Garton. 1983. Firstnesting record for Boreal Owl in Idaho.Condor 85:501.
Johnson, R.E., and G.E. Hudson. 1976. A Washing-ton Record of the Boreal Owl. Auk 93:195-196.
Palmer, D.A., and R.A. Ryder. 1984. The firstdocumented breeding of the Boreal Owl inColorado. The Condor 86:215-217.
Skaar, P.D. 1975. Montana bird distribution.Privately published, Bozeman, Montana.
188
Home Range of Tengmalm's Owl: A ComparisonBetween Nocturnal Hunting and Diurnal Roosting 1
Bj0rn V. Jacobsen and Gelr A. Sonerud2
Abstract. —Three nesting Tengmalm's Owl males equippedwith radio transmitters during a microtine rodent peak year(1985) in the northern boreal zone of southeast Norway weretracked during their nocturnal hunting, and located at theirdiurnal roosts, for 1-2 months. Home range sizes calculatedby the convex polygon method were larger for nocturnalhunting than for diurnal roosting. The overlap betweenthese two types of home ranges was small.
INTRODUCTION
The nocturnal behavior of owls is inherentlydifficult to study except in areas with con-
tinuous daylight in summer. The introduction of
radio telemetry has made it possible to sample
data on the activity of animals without seeingthem, and to follow them continuously over large
areas and long periods of time. Some of the
first studies making use of radio telemetry dealtwith owls (Nicholls and Warner 1972, Forbes andWarner 1974)
.
Tengmalm's Owls Aegolius funereus usuallysearch for prey during night and roost during day
(Glutz von Blotzheim and Bauer 1980). So far,
their home range sizes have been calculated by
either locating the owls during their diurnalroosting (Bondrup-Nielsen 1978) or by trackingthe owls during their nocturnal hunting activity(Sonerud et al . 1986). However, since their hab-
itat selection during diurnal roosting (Bondrup-Nielsen 1978, Hayward and Garton 1984) and noc-
turnal hunting (Sonerud et al. 1986) often differ(B.V. Jacobsen and G.A. Sonerud, unpubl.), size
and shape of their home ranges calculated fromdiurnal roosting and nocturnal hunting may alsodiffer. In this paper we compare these two typesof home ranges by using data from three radio-equipped nesting males of Tengmalm's Owl thatwere tracked both during diurnal roosting and
nocturnal hunting.
^aper presented at the symposium, Biologyand Conservation of Northern Forest Owls, Feb.
3-7, 1987, Winnipeg, Manitoba. USDA ForestService General Technical Report RM-142.
^Bjtfrn V. Jacobsen is Graduate Student andGeir A. Sonerud is Research Associate, Departmentof Biology, Division of Zoology, University ofOslo, Oslo, Norway.
STUDY AREA
The study was performed during April-July1985 within an area of 20 km^ at. an altitude of480-620 m in the northern boreal zone (sensu
Anonymous 1977) in Hedmark County, southeastNorway (60°55'N, 11°19'E). The study area is
fairly flat and consists of Norway Spruce Piceaabies forest with a few scattered cultivatedfields. Deciduous trees, mainly birch Betulaspp., occur sparcely. The forest structure is
greatly modified by modern silviculture intro-duced during the last two decades, resulting in a
mosaic of mostly clear-cuts and mature stands.
The study area is usually snow-covered until
mid-May. In 1985 the snow-melt took placeextremely late. The ground was completely snow-
covered until May 8, and partly snow-covereduntil June 1 . The snow disappeared first in the
clear-cuts, and last in mature spruce forest(cf. Sonerud 1986). By May 25 the clear-cutswere completely snow-free, while snow stillcovered approximately half the area in maturespruce forest.
The microtine rodent prey population (e.g.
Glutz von Blotzheim and Bauer 1980, Sonerud 1986)
was at. a peak from summer 1984 until spring 1985
(G.A. Sonerud, unpubl.)
METHODS
Three males of Tengmalm's Owl were caught in
mist-net at. the nest site during the nights of
April 11, May 8 and June 3 1985. They were
equipped with radio-transmitters (model TeleviltTK-142-2S (male 1) and Biotrack SS-1), and rele-ased the same night. The three owls will be re-
ferred to as M1, M2 and M3, respectively. M1 got.
his transmitter replaced with a new one (same
model) during the night of May 28.
189
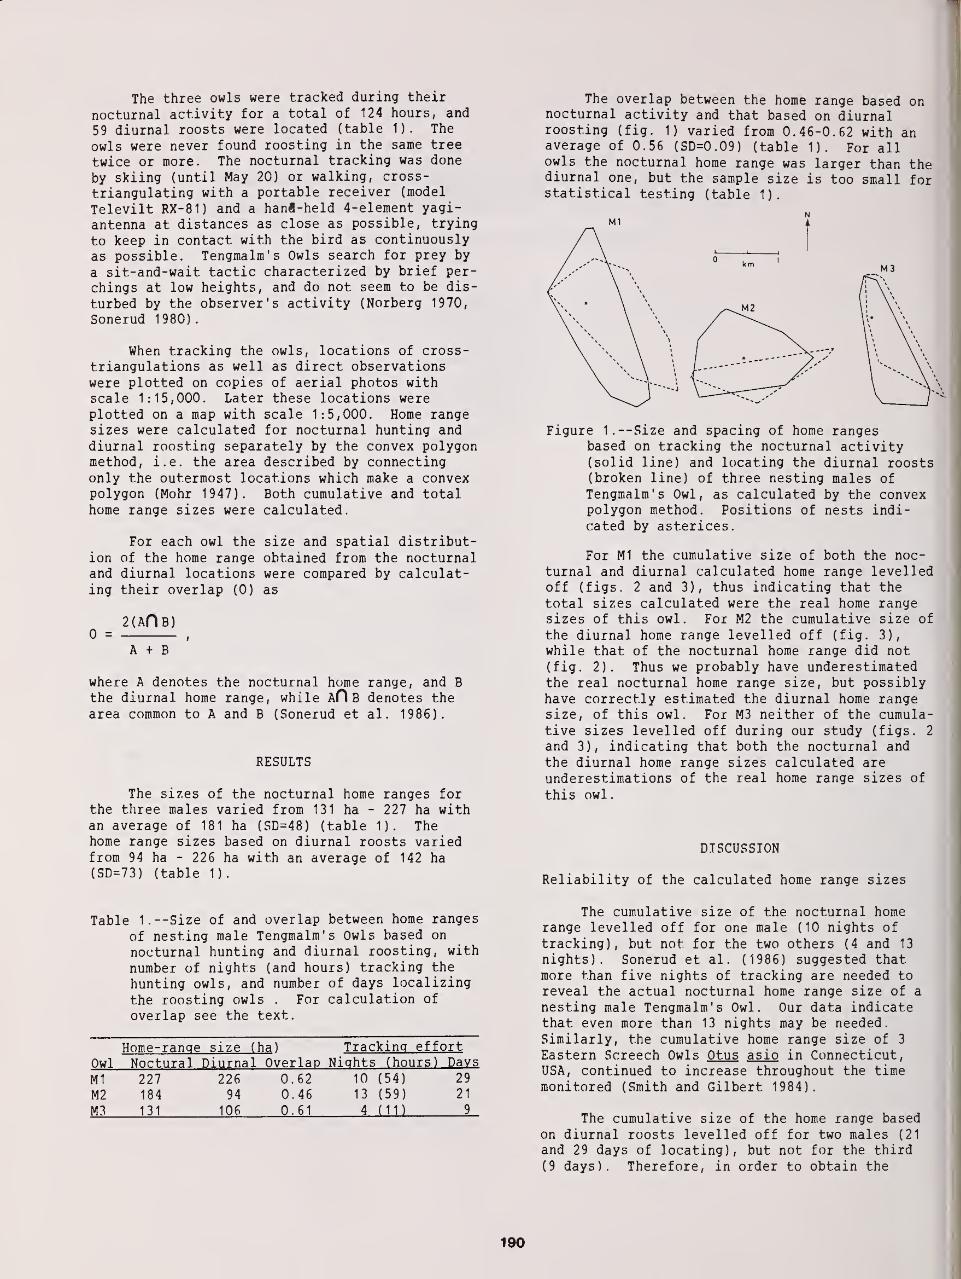
The three owls were tracked during their
nocturnal activity for a total of 124 hours, and
59 diurnal roosts were located (table 1). The
owls were never found roosting in the same tree
twice or more. The nocturnal tracking was done
by skiing (until May 20) or walking, cross-
triangulating with a portable receiver (model
Televilt RX-81) and a hani-held 4-element yagi-
antenna at distances as close as possible, trying
to keep in contact with the bird as continuously
as possible. Tengmalm's Owls search for prey by
a sit-and-wait tactic characterized by brief per-
chings at low heights, and do not seem to be dis-
turbed by the observer's activity (Norberg 1970,
Sonerud 1980).
When tracking the owls, locations of cross-triangulations as well as direct observationswere plotted on copies of aerial photos withscale 1:15,000. Later these locations wereplotted on a map with scale 1:5,000. Home rangesizes were calculated for nocturnal hunting anddiurnal roosting separately by the convex polygonmethod, i.e. the area described by connectingonly the outermost locations which make a convexpolygon (Mohr 1947). Both cumulative and totalhome range sizes were calculated.
For each owl the size and spatial distribut-ion of the home range obtained from the nocturnaland diurnal locations were compared by calculat-ing their overlap (0) as
2(aOB)
A + B
where A denotes the nocturnal home range, and B
the diurnal home range, while AO B denotes thearea common to A and B (Sonerud et al . 1986).
RESULTS
The sizes of the nocturnal home ranges forthe three males varied from 131 ha - 227 ha withan average of 181 ha (SD=48) (table 1). Thehome range sizes based on diurnal roosts variedfrom 94 ha - 226 ha with an average of 142 ha(SD=73) (table 1).
Table 1.--Size of and overlap between home ranges
of nesting male Tengmalm's Owls based on
nocturnal hunting and diurnal roosting, with
number of nights (and hours) tracking the
hunting owls, and number of days localizing
the roosting owls . For calculation of
overlap see the text.
Home-range size (ha ) Tracking effort
Owl Noctural Diurnal Overlap Nights (hours) Days
M1 227 226 0 62 10 (54) 29
M2 184 94 0 46 13 (59) 21
M3 131 106 0 61 4 (11) 9
The overlap between the home range based onnocturnal activity and that based on diurnalroosting (fig. 1) varied from 0.46-0.62 with anaverage of 0.56 (SD=0.09) (table 1). For allowls the nocturnal home range was larger than thediurnal one, but the sample size is too small forstatistical testing (table 1).
Figure 1. —Size and spacing of home rangesbased on tracking the nocturnal activity(solid line) and locating the diurnal roosts(broken line) of three nesting males ofTengmalm's Owl, as calculated by the convexpolygon method. Positions of nests indi-cated by asterices.
For M1 the cumulative size of both the noc-
turnal and diurnal calculated home range levelledoff (figs. 2 and 3), thus indicating that thetotal sizes calculated were the real home rangesizes of this owl. For M2 the cumulative size of
the diurnal home range levelled off (fig. 3),
while that of the nocturnal home range did not(fig. 2). Thus we probably have underestimatedthe real nocturnal home range size, but possiblyhave correctly estimated the diurnal home rangesize, of this owl. For M3 neither of the cumula-tive sizes levelled off during our study (figs. 2
and 3), indicating that both the nocturnal andthe diurnal home range sizes calculated areunderestimations of the real home range sizes of
this owl
.
DISCUSSION
Reliability of the calculated home range sizes
The cumulative size of the nocturnal homerange levelled off for one male (10 nights of
tracking), but not for the two others (4 and 13
nights). Sonerud et al. (1986) suggested thatmore than five nights of tracking are needed toreveal the actual nocturnal home range size of a
nesting male Tengmalm's Owl. Our data indicatethat even more than 13 nights may be needed.
Similarly, the cumulative home range size of 3
Eastern Screech Owls Otus asio in Connecticut,USA, continued to increase throughout the timemonitored (Smith and Gilbert 1984).
The cumulative size of the home range basedon diurnal roosts levelled off for two males (21
and 29 days of locating), but not for the third
(9 days). Therefore, in order to obtain the
190
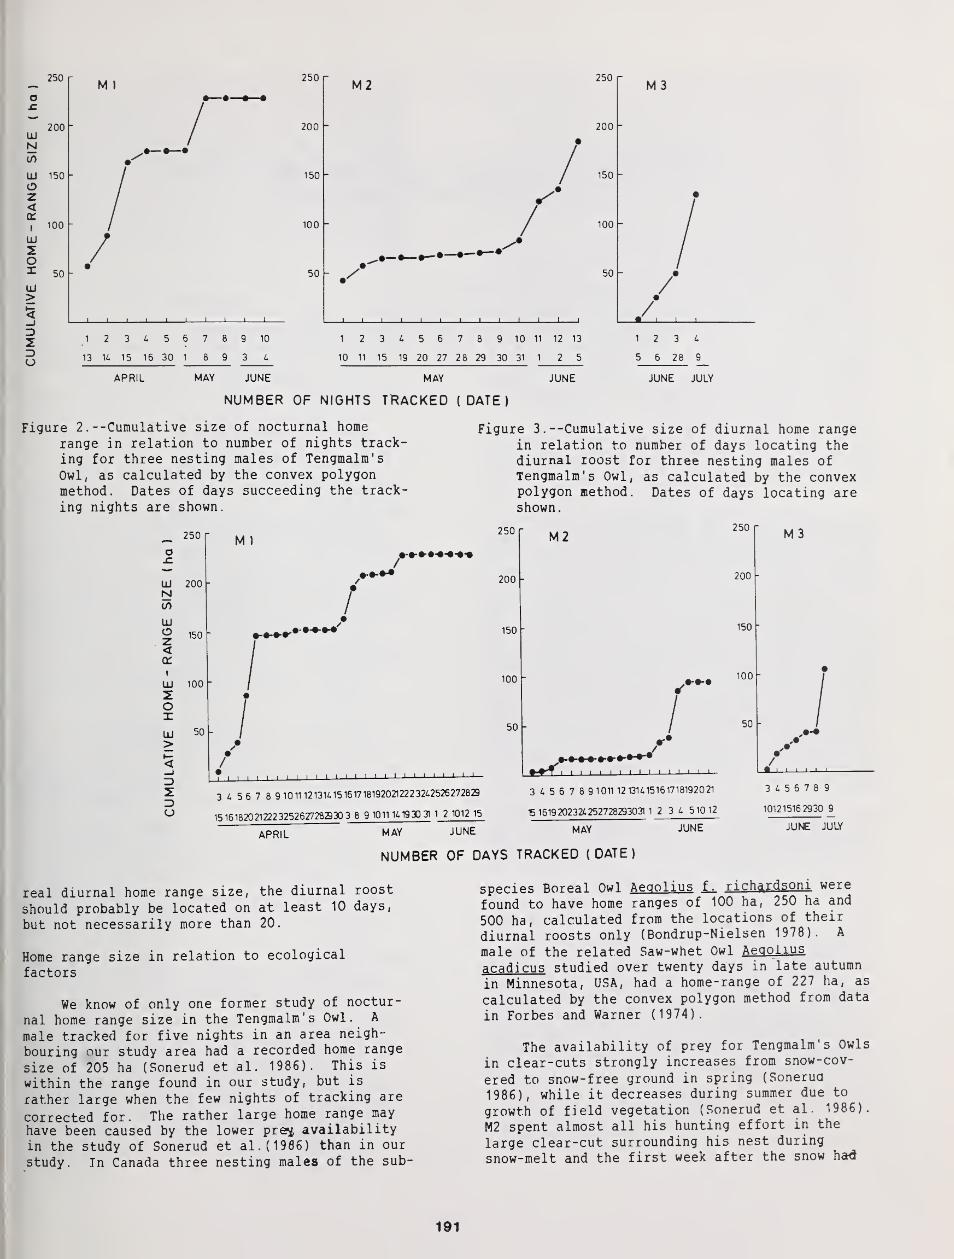
250M I
250M2
250M 3
200IDNCO
ID 150
Oz<
I100
ID
OIID>
3
IDo
/50
200
150
100
50
/
200
150
100
50
/_1_ _i_
/123456789 10
13 K 15 16 30 1 8 9 3 4
1 2 3 4 5 6 7 8 9 10 11 12 13
10 11 15 19 20 27 28 29 30 31 1 2 5
APRIL MAY JUNE MAY JUNE
2 3 4
6 28 9_
JUNE JULY
NUMBER OF NIGHTS TRACKED (DATE)
Figure 2 . --Cumulative size of nocturnal home
range in relation to number of nights track-ing for three nesting males of Tengmalm's
Owl, as calculated by the convex polygonmethod. Dates of days succeeding the track-
ing nights are shown.
Figure 3 . --Cumulative size of diurnal home rangein relation to number of days locating thediurnal roost for three nesting males ofTengmalm's Owl, as calculated by the convexpolygon method. Dates of days locating areshown
.
o
IDNCO
IDOz<
I
ID
ZOXID><
Z)a
250
200
150
100
50
M 1
250 r
200 -
150
100
M2
50
/*
i i i i i
250
200
150
100
50
3 4 5 6 7 8 91011121314151617181920212223242526272829
15 161820212223252627282930 3 8 9 1011 141930 31 1 2 1012 15
MAY
•"•"T I'
3 4 5 6 7 8 91011 12131415161718192021
15 1619202324252728293031 1 2 3 4 510 12
M 3
/•
i
APRIL JUNE MAY JUNE
3 4 5 6 7 8 9
10121516 2930 9
JUNE JULY
NUMBER OF DAYS TRACKED (DATE)
real diurnal home range size, the diurnal roost
should probably be located on at least 10 days,
but not necessarily more than 20.
Home range size in relation to ecological
factors
We know of only one former study of noctur-
nal home range size in the Tengmalm's Owl. A
male tracked for five nights in an area neigh-
bouring our study area had a recorded home range
size of 205 ha (Sonerud et al. 1986). This is
within the range found in our study, but is
rather large when the few nights of tracking are
corrected for. The rather large home range may
have been caused by the lower pre^ availabilityin the study of Sonerud et al. (1906) than in our
study. In Canada three nesting males of the sub-
species Boreal Owl Aeqolius f^ richardsoni were
found to have home ranges of 100 ha, 250 ha and
500 ha, calculated from the locations of their
diurnal roosts only (Bondrup-Nielsen 1978). A
male of the related Saw-whet Owl Aeaolius
acadi cus studied over twenty days in late autumn
in Minnesota, USA, had a home-range of 227 ha, as
calculated by the convex polygon method from data
in Forbes and Warner (1974).
The availability of prey for Tengmalm's Owls
in clear-cuts strongly increases from snow-cov-
ered to snow-free ground in spring (Sonerud
1986), while it decreases during summer due to
growth of field vegetation (Sonerud et al .1986).
M2 spent almost all his hunting effort in the
large clear-cut surrounding his nest during
snow-melt and the first week after the snow had
191
disappeared in the clear-cut. Both nocturnal anddiurnal cumulative home range size levelled offduring this period. By the end of May when theearly growth of field vegetation had made preyless available in the clear-cut, M2 startedspending more time hunting in the mature spruceforest stands, and the size of the home rangeincreased. However, this increase also coincidedwith the female's resuming of hunting after incu-bation and brooding. Therefore, both loweredprey availability in the clear-cut as well asavoidance of overlap with the female's huntingarea may explain the increase of the home-rangesize. The small home range size of M2 at thetime when the female resumed hunting was due tothe clear-cut being a core area (cf . Samuel etal. 1985), with a high availability of prey dur-
ing snow-melt. For M1, the home range did notinclude any such high prey availability corearea, and had thus reached its final size by thetime the female resumed hunting. Therefore, nofurther increase occurred when both matesexploited the home range.
Nocturnal and diurnal home ranges: Which shouldbe measured?
For all three males there was a relativelysmall overlap between the nocturnal and the diur-nal home range. This was independent of the num-ber of nights the owls were tracked and the num-ber of roosts located. The overlap was smallerfor M2 than for the two others. M2 nested in a
box situated in a 20 ha clear-cut (see descript-ion in Sonerud (1986)), and his home rangeincluded few middle-aged stands of Norway spruce,which we found the Tengmalm's Owl to prefer as
roosting habitat (B.V. Jacobsen and G.A. Sonerud,unpubl . ) . This may explain why the home rangebased on diurnal roosts, and hence why the over-lap between the nocturnal and diurnal home range,were so small for this male. For the two othermales, the middle-aged stands preferred forroosting were more common throughout the homerange.
Smith et al. (1981) found that the diurnalhome ranges of coyotes Canis latrans in generalwere included in the nocturnal home ranges. Thiswould also have been the case in the Tengmalm'sOwl if we had tracked the males until theyroosted each night, and not located their roostsseparately. However, in our study several roostswere located at days when the owl had not beentracked the night before. This explains why thediurnal home range is not included in the noctur-
nal home range for any of the three males.
Hence, we conclude that tracking the owls during
their nocturnal hunting until they have roosted
will be sufficient to give a reliable estimate of
the real home range size, while home range sizes
based on diurnal roosts only will be underesti-
mations of the real ones.
ACKNOWLEDGEMENTS
We thank B.T. Baekken for assistance during
the field work, and the land owner A. Solberg forkindly allowing us to use the study area and forproviding free accommodation. We also thank B.Danielson for comments on the manuscript, M.Aasfor typing, and E. Kresse for drawing thefigures. The radio-tracking equipment wasfinanced by grants to G.A. Sonerud from theUniversity of Oslo, the Norwegian ResearchCouncil for Science and the Humanities (NAVF),and the Nansen Foundation. The field work wassupported by grants to B.V. Jacobsen from theRobert Collett legacy.
LITERATURE CITED
Anonymous. 1977. Naturgeografisk regioninndel-ning av Norden. Nordiske Utredninger, B 34:1-137. (In Danish, Norwegian and Swedishwith summaries in English and Finnish).
Bondrup-Nielsen, S. 1978. Vocalizations, nestingand habitat preferences of the Boreal Owl( Aegolius funereus) in North America. M.Sc. thesis, University of Toronto.
Forbes, J.F., and D.W. Warner. 1974. Behavior ofa radio-tagged Saw-whet owl. Auk 91:783-795.
Glutz von Blotzheim, U.N., and K.M. Bauer. 1980.
Handbuch der Vogel Mitteleuropas, Vol. 9.
Akademische Verlagsgesellschaft , Wiesbaden.
Hayward, G.D., and E.O. Garton. 1984. Roosthabitat selection by three small forestowls. Wilson Bulletin 96: 690-692.
Mohr, CO. 1947. Table of equivalent populationsof North American small mammals. AmericanMidland Naturalist 37: 223-249.
Nicholls, T.H., and D.W. Warner. 1972. BarredOwl habitat use as determined by radiotele-metry. Journal of Wildlife Management 36:
213-224.
Norberg, R.A. 1970. Hunting technique ofTengmalm's Owl Aegolius funereus (L.).
Ornis Scandinavica 1: 51-64.
Samuel, M.D., D.J. Pierce, and E.O. Garton. 1985.
Identifying areas of concentrated use withinthe home range. Journal of Animimal Ecology54: 711-719.
Smith, D.G., and R. Gilbert. 1984. EasternScreech-Owl home range and use of suburbanhabitats in southern Connecticut. Journalof Field Ornithology 55: 322-329.
Smith, G.J., J.R. Cary, and O.J. Rongstad. 1981.
Sampling strategies for radio-trackingcoyotes. Wildlife Society Bulletin 9:
88-93.
Sonerud, G.A. 1980. Jaktstrategier hos flyvendesmipattedyr-predatorer i barskog. Cand.
real, thesis, University of Oslo. (In
Norwegian)
.
Sonerud, G.A. 1986. Effect of snow cover onseasonal changes in diet, habitat, andregional distribution of raptors that preyon small mammals in boreal zones of
Fennoscandia . Holarctic Ecology 9: 33-47.
Sonerud, G.A., R. Solheim, and B.V. Jacobsen.
1986. Home-range use and habitat selection
during hunting in a male Tengro Im's Owl
Aegolius funereus . Fauna Norvegica, Ser. C,
C.inclus 9: 100-106.
192
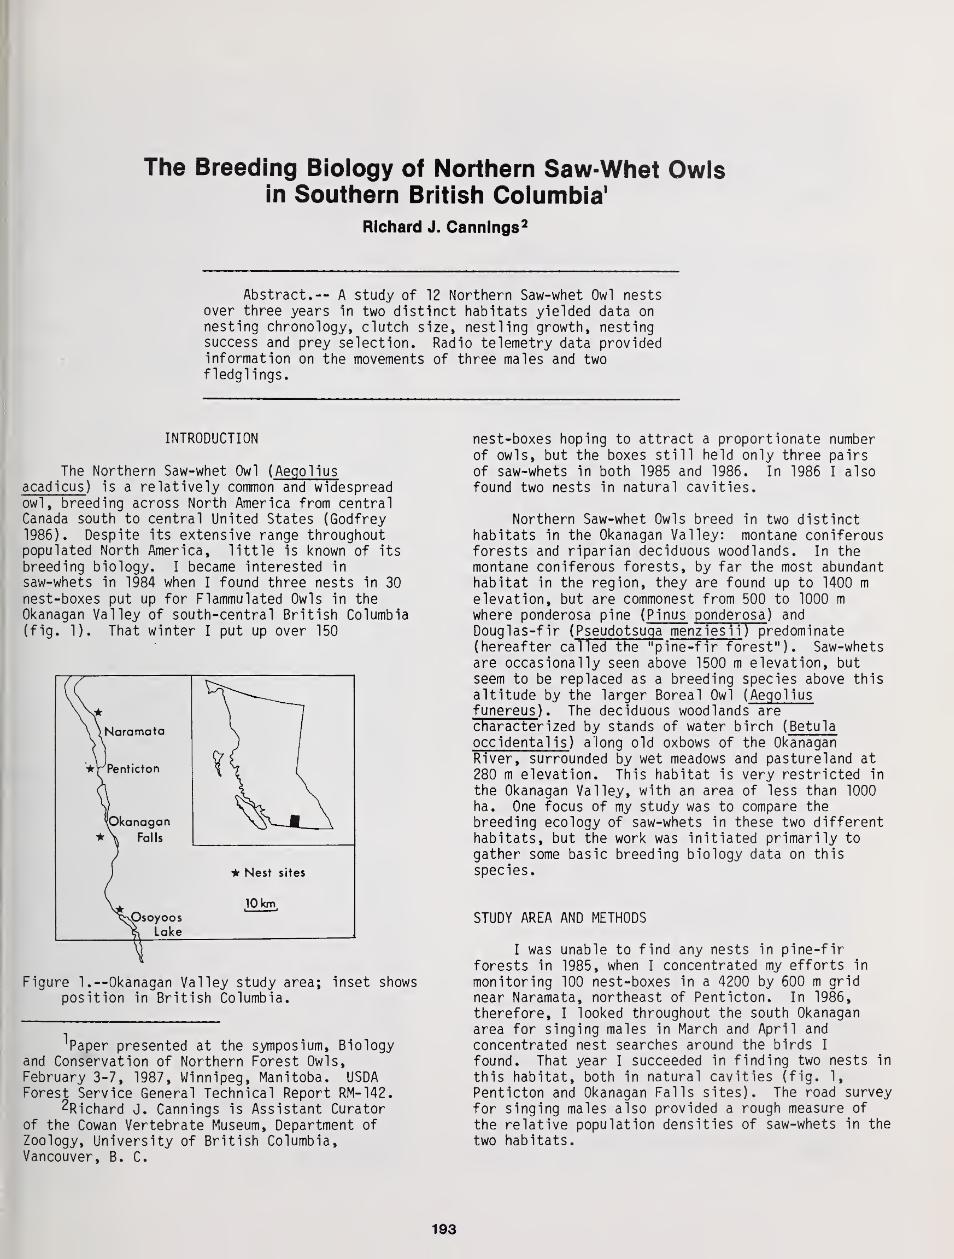
The Breeding Biology of Northern Saw-Whet Owlsin Southern British Columbia 1
Richard J. Cannings
Abstract.— A study of 12 Northern Saw-whet Owl nestsover three years 1n two distinct habitats yielded data onnesting chronology, clutch size, nestling growth, nestingsuccess and prey selection. Radio telemetry data providedinformation on the movements of three males and twofledglings.
INTRODUCTION
The Northern Saw-whet Owl ( Aeqoliusacadicus ) is a relatively common and widespreadowl, breeding across North America from centralCanada south to central United States (Godfrey1986). Despite its extensive range throughoutpopulated North America, little is known of its
breeding biology. I became interested in
saw-whets in 1984 when I found three nests in 30
nest-boxes put up for Flammulated Owls in theOkanagan Valley of south-central British Columbia(fig. 1). That winter I put up over 150
\ ^ Naramata
*r Penticton
\Okanagan
\ Falls
* Nest sites
^vOsoyoos^ Lake
10 km
Figure 1.—Okanagan Valley study area; inset showsposition in British Columbia.
'Paper presented at the symposium, Biologyand Conservation of Northern Forest Owls,February 3-7, 1987, Winnipeg, Manitoba. USDAForest Service General Technical Report RM-142.
^Richard J. Cannings is Assistant Curatorof the Cowan Vertebrate Museum, Department ofZoology, University of British Columbia,Vancouver, B. C.
nest-boxes hoping to attract a proportionate numberof owls, but the boxes still held only three pairsof saw-whets in both 1985 and 1986. In 1986 I alsofound two nests in natural cavities.
Northern Saw-whet Owls breed in two distincthabitats in the Okanagan Valley: montane coniferousforests and riparian deciduous woodlands. In themontane coniferous forests, by far the most abundanthabitat in the region, they are found up to 1400 melevation, but are commonest from 500 to 1000 mwhere ponderosa pine ( Pinus ponderosa ) and
Douglas-fir ( Pseudotsuqa menziesii ) predominate(hereafter called the "pine-fir forest"). Saw-whetsare occasionally seen above 1500 m elevation, butseem to be replaced as a breeding species above thisaltitude by the larger Boreal Owl ( Aeqoliusfunereus ) . The deciduous woodlands arecharacterized by stands of water birch ( Betulaoccidentalis ) along old oxbows of the OkanaganRiver, surrounded by wet meadows and pastureland at
280 m elevation. This habitat is very restricted in
the Okanagan Valley, with an area of less than 1000ha. One focus of my study was to compare thebreeding ecology of saw-whets in these two differenthabitats, but the work was initiated primarily to
gather some basic breeding biology data on this
species.
STUDY AREA AND METHODS
I was unable to find any nests in pine-firforests in 1985, when I concentrated my efforts in
monitoring 100 nest-boxes in a 4200 by 600 m gridnear Naramata, northeast of Penticton. In 1986,
therefore, I looked throughout the south Okanaganarea for singing males in March and April and
concentrated nest searches around the birds I
found. That year I succeeded in finding two nests in
this habitat, both in natural cavities (fig. 1,
Penticton and Okanagan Falls sites). The road surveyfor singing males also provided a rough measure of
the relative population densities of saw-whets in the
two habitats.
193
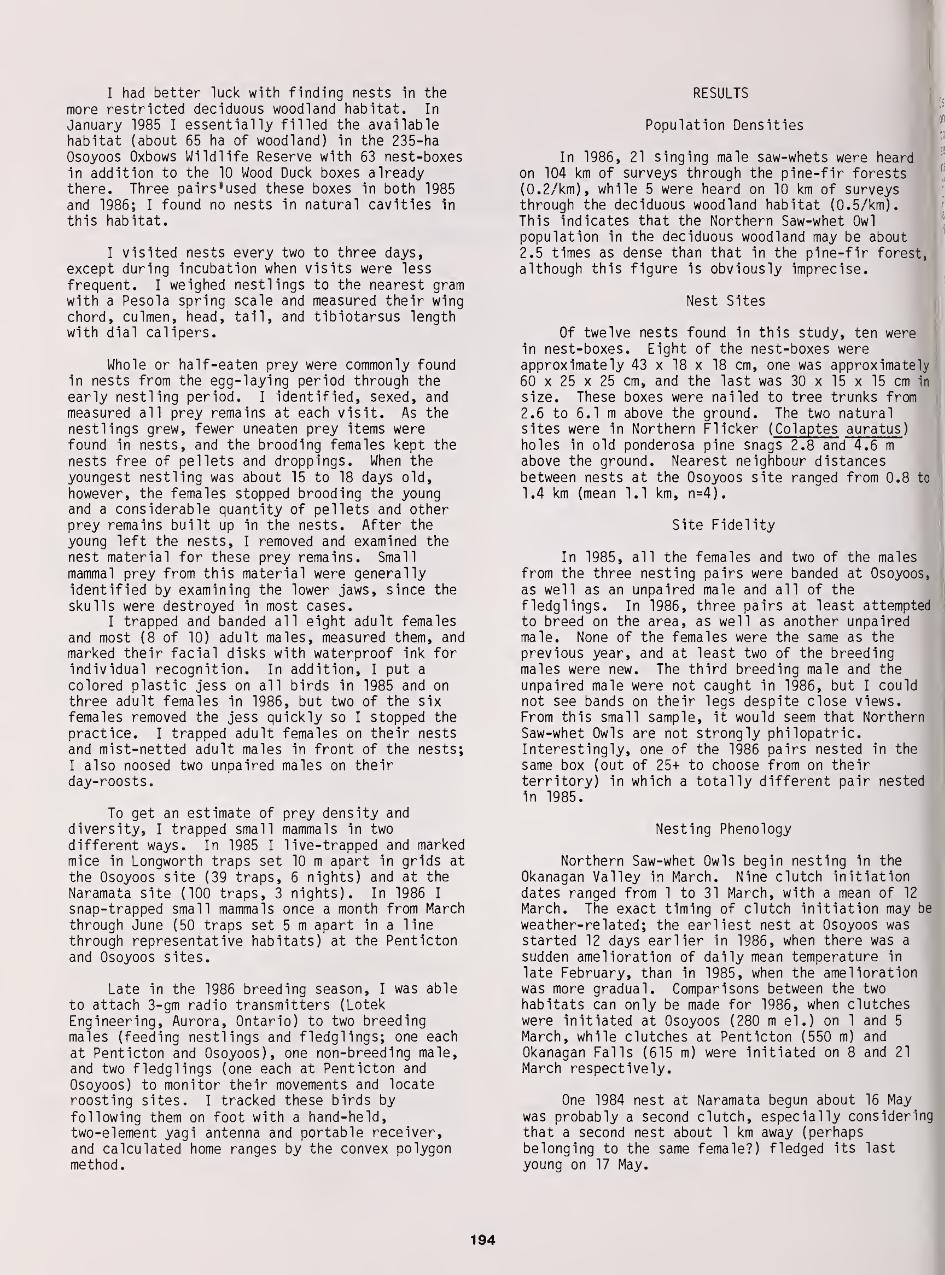
I had better luck with finding nests in themore restricted deciduous woodland habitat. In
January 1985 I essentially filled the availablehabitat (about 65 ha of woodland) in the 235-haOsoyoos Oxbows Wildlife Reserve with 63 nest-boxesin addition to the 10 Wood Duck boxes alreadythere. Three pairs'used these boxes in both 1985and 1986; I found no nests in natural cavities in
this habitat.
I visited nests every two to three days,
except during incubation when visits were less
frequent. I weighed nestlings to the nearest gramwith a Pesola spring scale and measured their wingchord, culmen, head, tail, and tibiotarsus lengthwith dial calipers.
Whole or half-eaten prey were commonly foundin nests from the egg-laying period through theearly nestling period. I identified, sexed, andmeasured all prey remains at each visit. As thenestlings grew, fewer uneaten prey items werefound in nests, and the brooding females kept thenests free of pellets and droppings. When theyoungest nestling was about 15 to 18 days old,
however, the females stopped brooding the youngand a considerable quantity of pellets and otherprey remains built up in the nests. After theyoung left the nests, I removed and examined thenest material for these prey remains. Small
mammal prey from this material were generallyidentified by examining the lower jaws, since theskulls were destroyed in most cases.
I trapped and banded all eight adult femalesand most (8 of 10) adult males, measured them, andmarked their facial disks with waterproof ink forindividual recognition. In addition, I put a
colored plastic jess on all birds in 1985 and onthree adult females in 1986, but two of the sixfemales removed the jess quickly so I stopped thepractice. I trapped adult females on their nestsand mist-netted adult males in front of the nests;
I also noosed two unpaired males on theirday-roosts.
To get an estimate ofdiversity, I trapped small
different ways. In 1985 I
mice in Longworth traps set
the Osoyoos site (39 traps,Naramata site (100 traps, 3
snap-trapped small mammalsthrough June (50 traps setthrough representative habi
and Osoyoos sites.
prey density and
mammals in two
live-trapped and marked10 m apart in grids at
6 nights) and at the
nights). In 1986 I
once a month from March
5 m apart in a line
tats) at the Penticton
Late in the 1986 breeding season, I was ableto attach 3-gm radio transmitters (Lotek
Engineering, Aurora, Ontario) to two breedingmales (feeding nestlings and fledglings; one each
at Penticton and Osoyoos), one non-breeding male,and two fledglings (one each at Penticton and
Osoyoos) to monitor their movements and locateroosting sites. I tracked these birds by
following them on foot with a hand-held,two-element yagi antenna and portable receiver,and calculated home ranges by the convex polygonmethod.
RESULTS
Population Densities
In 1986, 21 singing male saw-whets were heardon 104 km of surveys through the pine-fir forests(0.2/km), while 5 were heard on 10 km of surveysthrough the deciduous woodland habitat (0.5/km).This indicates that the Northern Saw-whet Owl
population in the deciduous woodland may be about2.5 times as dense than that in the pine-fir forest,
although this figure is obviously imprecise.
Nest Sites
Of twelve nests found in this study, ten werein nest-boxes. Eight of the nest-boxes wereapproximately 43 x 18 x 18 cm, one was approximately60 x 25 x 25 cm, and the last was 30 x 15 x 15 cm in
size. These boxes were nailed to tree trunks from2.6 to 6.1 m above the ground. The two naturalsites were in Northern Flicker ( Colaptes auratus )
holes in old ponderosa pine snags 2.8 and 4.6 mabove the ground. Nearest neighbour distancesbetween nests at the Osoyoos site ranged from 0.8 to
1.4 km (mean 1.1 km, n=4).
Site Fidelity
In 1985, all the females and two of the malesfrom the three nesting pairs were banded at Osoyoos,
as well as an unpaired male and all of thefledglings. In 1986, three pairs at least attemptedto breed on the area, as well as another unpairedmale. None of the females were the same as theprevious year, and at least two of the breedingmales were new. The third breeding male and the
unpaired male were not caught in 1986, but I couldnot see bands on their legs despite close views.From this small sample, it would seem that NorthernSaw-whet Owls are not strongly philopatric.Interestingly, one of the 1986 pairs nested in the
same box (out of 25+ to choose from on theirterritory) in which a totally different pair nestedin 1985.
Nesting Phenology
Northern Saw-whet Owls begin nesting in theOkanagan Valley in March. Nine clutch initiationdates ranged from 1 to 31 March, with a mean of 12
March. The exact timing of clutch initiation may be
weather-related; the earliest nest at Osoyoos wasstarted 12 days earlier in 1986, when there was a
sudden amelioration of daily mean temperature in
late February, than in 1985, when the ameliorationwas more gradual. Comparisons between the twohabitats can only be made for 1986, when clutcheswere initiated at Osoyoos (280 m el.) on 1 and 5
March, while clutches at Penticton (550 m) andOkanagan Falls (615 m) were initiated on 8 and 21
March respectively.
One 1984 nest at Naramata begun about 16 Maywas probably a second clutch, especially consideringthat a second nest about 1 km away (perhapsbelonging to the same female?) fledged its last
young on 17 May.
194
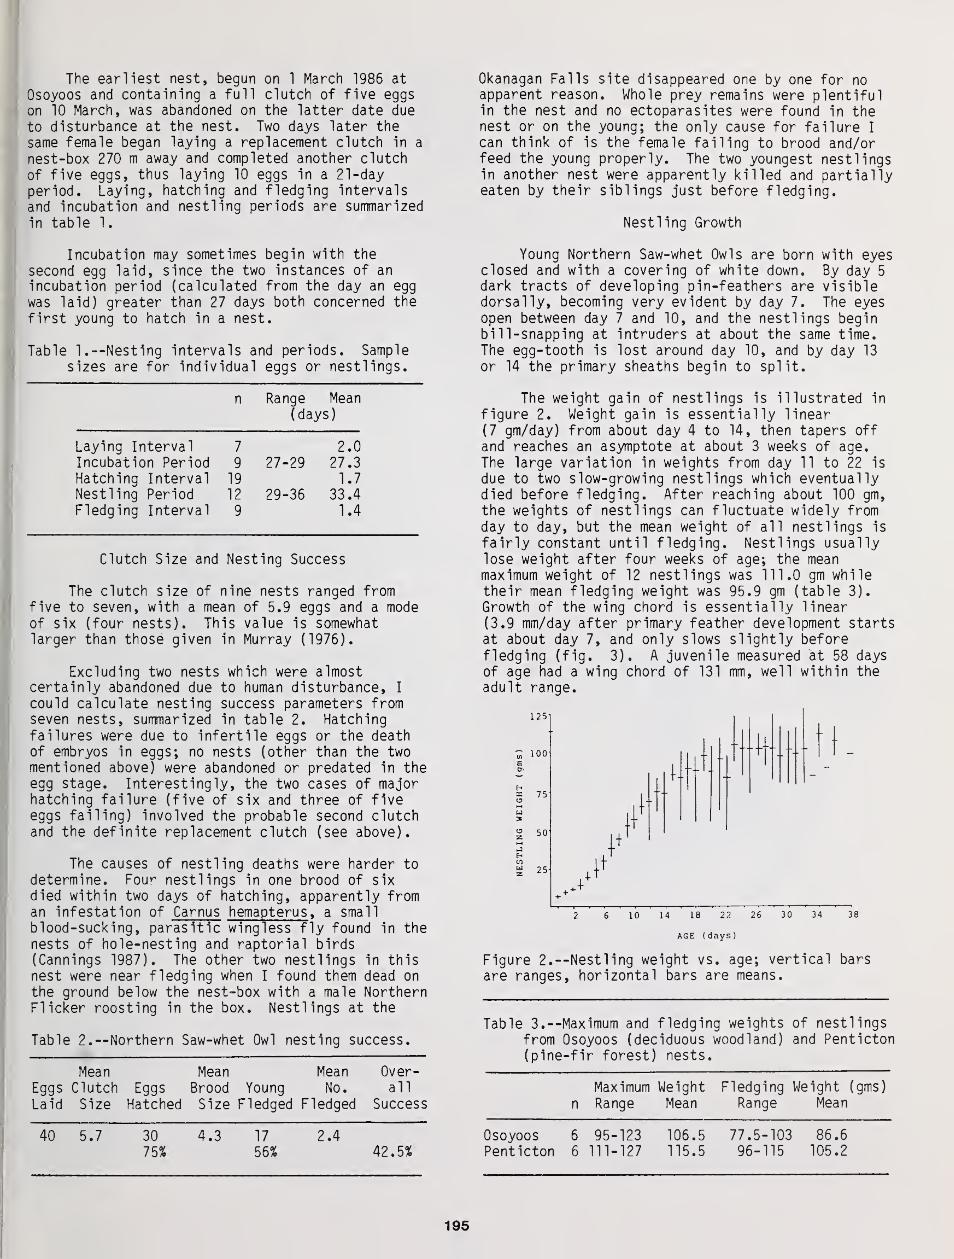
The earliest nest, begun on 1 March 1986 at
Osoyoos and containing a full clutch of five eggson 10 March, was abandoned on the latter date due
to disturbance at the nest. Two days later thesame female began laying a replacement clutch in a
nest-box 270 m away and completed another clutchof five eggs, thus laying 10 eggs in a 21-dayperiod. Laying, hatching and fledging intervalsand incubation and nestling periods are summarized
in table 1
.
Incubation may sometimes begin with the
second egg laid, since the two instances of anincubation period (calculated from the day an egg
was laid) greater than 27 days both concerned the
first young to hatch in a nest.
Table 1. --Nesting intervals and periods. Samplesizes are for individual eggs or nestlings.
Okanagan Falls site disappeared one by one for noapparent reason. Whole prey remains were plentifulin the nest and no ectoparasites were found in thenest or on the young; the only cause for failure I
can think of is the female failing to brood and/orfeed the young properly. The two youngest nestlingsin another nest were apparently killed and partiallyeaten by their siblings just before fledging.
Nestling Growth
Young Northern Saw-whet Owls are born with eyesclosed and with a covering of white down. By day 5
dark tracts of developing pin-feathers are visibledorsally, becoming very evident by day 7. The eyesopen between day 7 and 10, and the nestlings beginbill-snapping at intruders at about the same time.The egg-tooth is lost around day 10, and by day 13
or 14 the primary sheaths begin to split.
Range Mean(days)
Laying Interval 7 2.0Incubation Period 9 27-29 27.3Hatching Interval 19 1.7Nestling Period 12 29-36 33.4Fledging Interval 9 1.4
Clutch Size and Nesting Success
The clutch size of nine nests ranged fromfive to seven, with a mean of 5.9 eggs and a modeof six (four nests). This value is somewhatlarger than those given in Murray (1976).
Excluding two nests which were almostcertainly abandoned due to human disturbance, I
could calculate nesting success parameters fromseven nests, summarized in table 2. Hatchingfailures were due to infertile eggs or the deathof embryos in eggs; no nests (other than the twomentioned above) were abandoned or predated in theegg stage. Interestingly, the two cases of majorhatching failure (five of six and three of fiveeggs failing) involved the probable second clutchand the definite replacement clutch (see above).
The causes of nestling deaths were harder todetermine. Fou*- nestlings in one brood of sixdied within two days of hatching, apparently froman infestation of Carnus hemapterus , a smallblood-sucking, parasitic wingless fly found in thenests of hole-nesting and raptorial birds(Cannings 1987). The other two nestlings in thisnest were near fledging when I found them dead onthe ground below the nest-box with a male NorthernFlicker roosting in the box. Nestlings at the
Table 2.—Northern Saw-whet Owl nesting success.
Mean Mean Mean Over-Eggs Clutch Eggs Brood Young No. all
Laid Size Hatched Size Fledged Fledged Success
40 5.7 30 4.3 17 2.475% 56% 42.5%
The weight gain of nestlings is illustrated in
figure 2. Weight gain is essentially linear
(7 gm/day) from about day 4 to 14, then tapers off
and reaches an asymptote at about 3 weeks of age.
The large variation in weights from day 11 to 22 is
due to two slow-growing nestlings which eventuallydied before fledging. After reaching about 100 gm,
the weights of nestlings can fluctuate widely fromday to day, but the mean weight of all nestlings is
fairly constant until fledging. Nestlings usuallylose weight after four weeks of age; the meanmaximum weight of 12 nestlings was 111.0 gm whiletheir mean fledging weight was 95.9 gm (table 3).
Growth of the wing chord is essentially linear
(3.9 mm/day after primary feather development startsat about day 7, and only slows slightly beforefledging (fig. 3). A juvenile measured at 58 daysof age had a wing chord of 131 mm, well within the
adult range.
125
100
75
50
25
{-
2 6 10 14 18 22 26 30 34
AGE (days)
38
Figure 2.—Nestling weight vs. age; vertical bars
are ranges, horizontal bars are means.
Table 3.—Maximum and fledging weights of nestlings
from Osoyoos (deciduous woodland) and Penticton(pine-fir forest) nests.
Maximum Weight Fledging Weight (gms)
n Range Mean Range Mean
OsoyoosPenticton
6 95-1236 111-127
106.5115.5
77.5-10396-115
86.6105.2
195
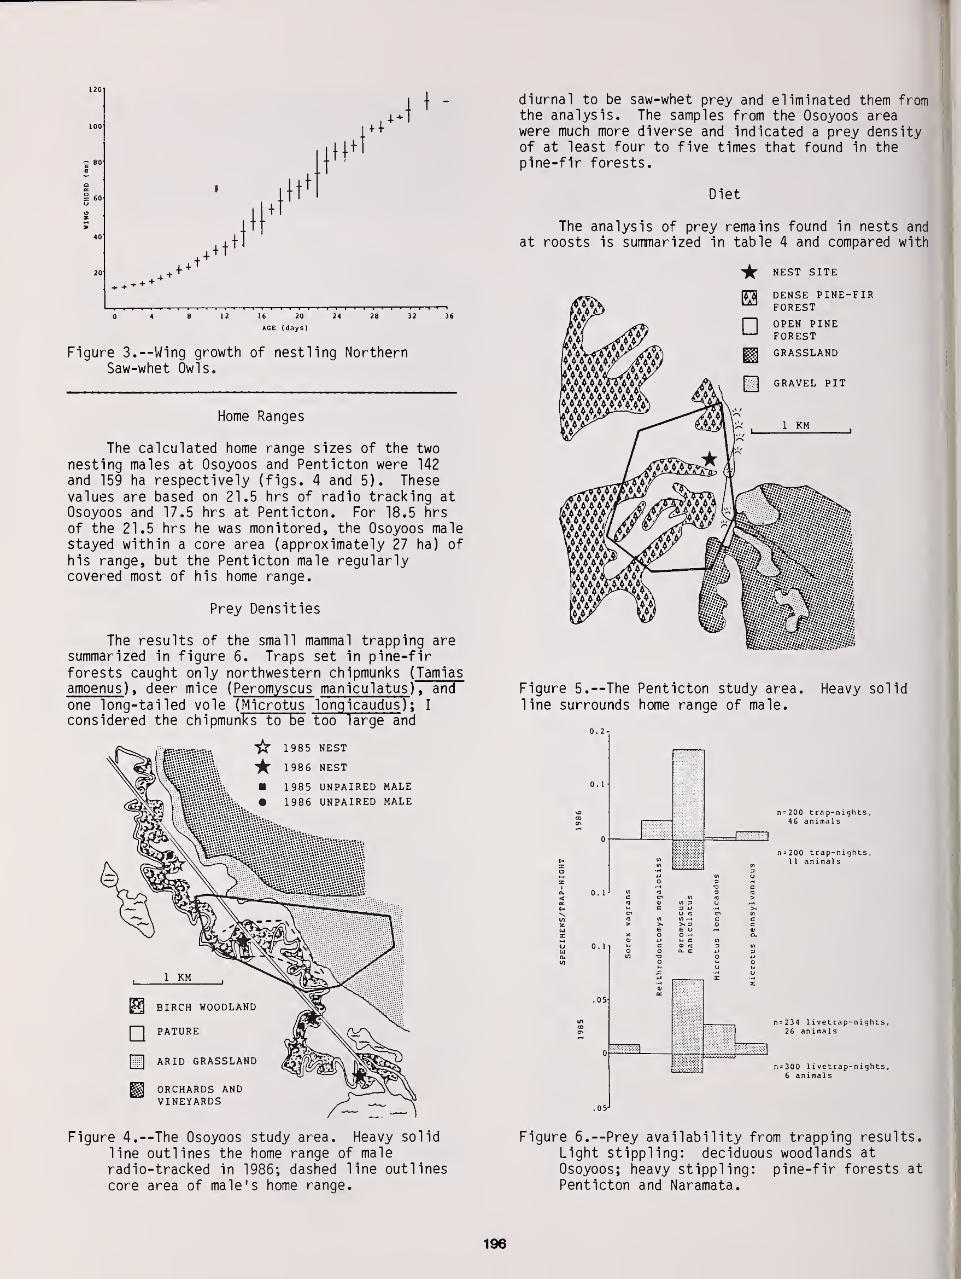
4 + +ft
+-
16 20
AGE (days)
36
Figure 3. --Wing growth of nestling NorthernSaw-whet Owls.
Home Ranges
The calculated home range sizes of the twonesting males at Osoyoos and Penticton were 142
and 159 ha respectively (figs. 4 and 5). Thesevalues are based on 21.5 hrs of radio tracking atOsoyoos and 17.5 hrs at Penticton. For 18.5 hrs
of the 21.5 hrs he was monitored, the Osoyoos malestayed within a core area (approximately 27 ha) ofhis range, but the Penticton male regularlycovered most of his home range.
Prey Densities
The results of the small mammal trapping aresummarized in figure 6. Traps set in pine-firforests caught only northwestern chipmunks ( Tamiasamoenus ) , deer mice ( Peromyscus maniculatus ) , and
one long-tailed vole ( Microtus lonqicaudus ) ; I
considered the chipmunks to be too large and
1985 NEST
1986 NEST
1985 UNPAIRED MALE
&V... • 1986 UNPAIRED MALE
BIRCH WOODLAND
j~] PATURE
HI ARID GRASSLAND
^ ORCHARDS ANDVINEYARDS
diurnal to be saw-whet prey and eliminated them fromthe analysis. The samples from the Osoyoos areawere much more diverse and indicated a prey densityof at least four to five times that found in thepine-fir forests.
Diet
The analysis of prey remains found in nests andat roosts is summarized in table 4 and compared with
NEST SITE
DENSE PINE-FIRFOREST
OPEN PINEFOREST
GRASSLAND
Figure 5.—The Penticton study area. Heavy solidline surrounds home range of male.
0.1
0.1
0.1
.05
n=200 trap-nights,4 6 animals
n=200 trap-nights,11 animals
.05
n= 234 1 i vet rap-nights
,
26 animals
nOOO livetrap-nights,6 animals
Figure 4.—The Osoyoos study area. Heavy solid
line outlines the home range of maleradio-tracked in 1986; dashed line outlinescore area of male's home range.
Figure 6. --Prey availability from trapping results.Light stippling: deciduous woodlands at
Osoyoos; heavy stippling: pine-fir forests at
Penticton and Naramata.
196

Table 4. --Diet of Northern Saw-whet Owls in the Okanagan Valley
DECIDUOUS WOODLANDS PINE-FIR FORESTS
SPECIES Weight No. % Total % No. % Total %(gm) Weight Weight Weight Weight
Insects
19.4 1
6 2.3 — —Birds 4 1.2 77.6 1.0 5 1.9 97.0 1.9
Sorex cinereus 4.
1
21 .4 4.1 .1
S. vagrans 7.2^ 8 2.4 57.6 .8
Sorex spp. 5.0 3 2 .8 10.0 .2
Peroqnathus parvus 18.34
85 26.0 1555.5 20.4 3 1.2 54.9 1.1
Reithrodontomys 10.94 13 4.0 141.7 1.9 6 2.3 65.4 1.3meqalotis
Peromyscus 19.54
119 36.4 2320.5 30.5 217 84.4 4231.5 83.7maniculatus
Microtus spp.
5
35.
3
4 98 30.0 3459.4 45.4 16 6.2 564.8 11.2
Clethrionomys 27.
5
21 .4 27.5 .5
qappen
TOTALS 327 7612.3 257 5055.2
,Mean weight from Dunning (1984) of four bird species found in saw-whet nests.;Weight from Banfield (1974).'Weight estimated from Banfield (1974).Mean weight of this species from specimens collected in the study area.'Includes Microtus lonqicaudus , M. montanus , and M. pennsylvanicus .
estimates of prey density in figure 7. It is
clear that Peromyscus maniculatus is the favouredprey in the pine-fir forests, not surprisingconsidering the results of the small mammaltrapping there. Deer mice, voles ( Microtus spp.),and Great Basin pocket mice ( Peroqnathus parvus )
were about equal in numbers in the Osoyoos sample,although voles were most important when the meanweight of prey was considered. Voles predominatedin early samples (March and early April), whilepocket mice were rare in March but common in April
samples (fig. 8). Wandering shrews ( Sorexvagrans ) and migrant passerines (Yellow-rumpedWarbler, Dendroica coronata ; White-crowned Sparrow,Zonotrichia leucophrys ; Lincoln's Sparrow,Melospiza~Tincolni
i
) formed a minor part of thediet at Osoyoos. In pine-fir forest habitat minordiet constituents included common shrews ( Sorexcinereus ) , Great Basin pocket mice, long-tailedvoles, meadow voles ( Microtus pennsylvanicus ),
montane voles ( M. montanus ), birds (Dark-eyedJunco, Junco hyemalis ; Pine Siskin, Carduelispinus ) , and a few insects. The latter were foundin pellets under a roost of an unpaired male.
DISCUSSION
Although the effects are not always apparentin my small sample of nests, it is clear that the
pine-fir forest and deciduous woodland aremarkedly different habitats for Northern Saw-whetOwls. Beyond the obvious structural differencesof the vegetation itself, which affect theavailability and quality of roost and nest sites,the main difference is in the availability of
prey. Small mammal population densities are
100
n=138
n = 46
200 trap-nights
n=209
n=ll
200 trap-nights
Figure 7. Comparison of 1986 prey density estimates(heavy stippling) and prey remains at nests
(light stippling). Top: Osoyoos deciduouswoodlands; bottom: Penticton pine-fir forests.
197
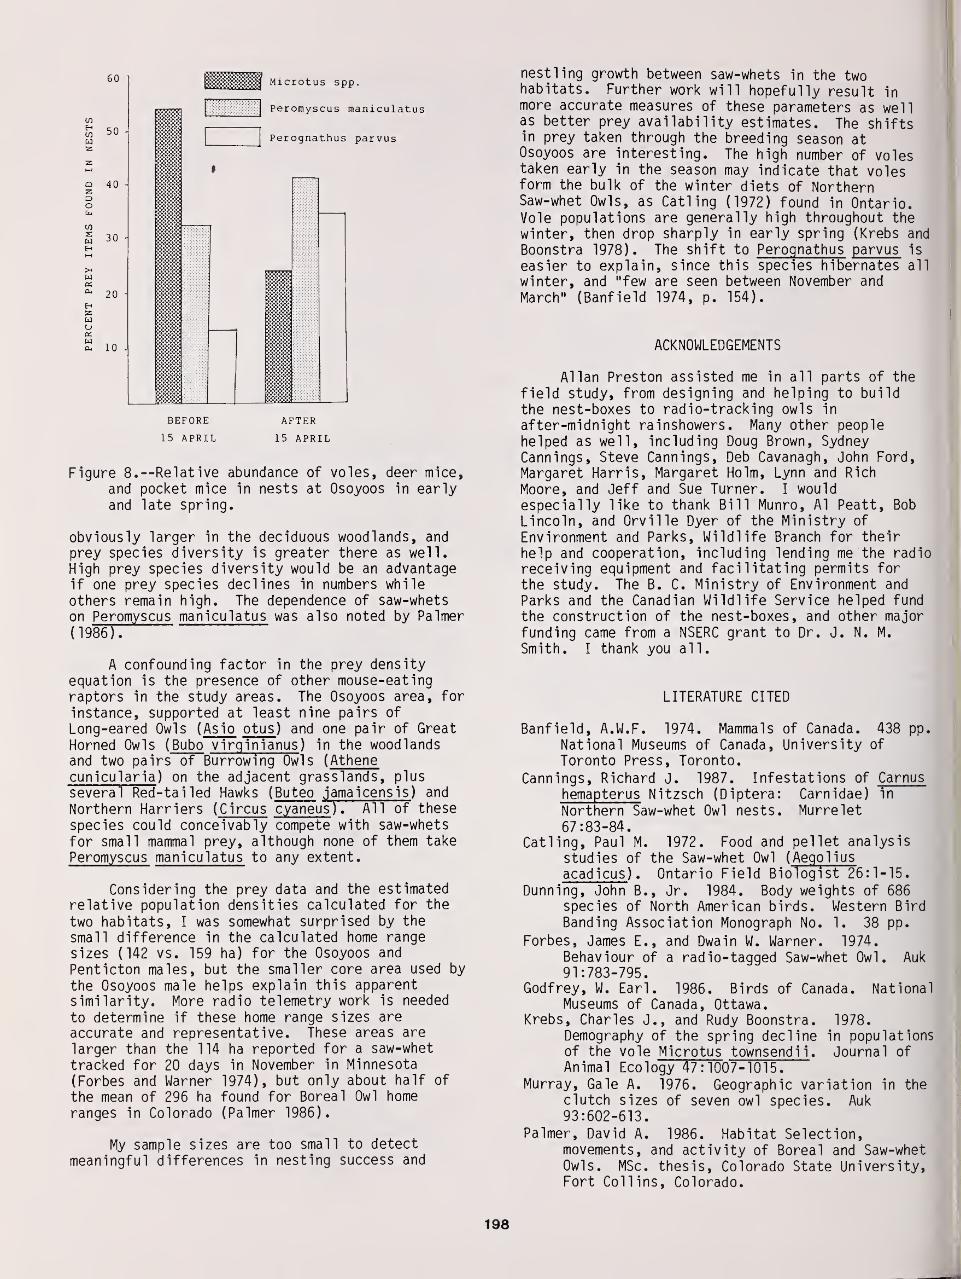
wEh
w2
60
50 -
40 -
30 -
20
10
JSPIf!
9SSssst
Microtus spp.
Peromyscus maniculatus
Perognathus parvus
BEFORE
15 APRIL
AFTER
15 APRIL
Figure 8.—Relative abundance of voles, deer mice,and pocket mice in nests at Osoyoos in earlyand late spring.
obviously larger in the deciduous woodlands, andprey species diversity is greater there as well.High prey species diversity would be an advantageif one prey species declines in numbers whileothers remain high. The dependence of saw-whetson Peromyscus maniculatus was also noted by Palmer
(1986).
A confounding factor in the prey densityequation is the presence of other mouse-eatingraptors in the study areas. The Osoyoos area, for
instance, supported at least nine pairs of
Long-eared Owls ( Asio otus ) and one pair of GreatHorned Owls ( Bubo virqinianus ) in the woodlandsand two pairs of Burrowing Owls ( Athenecunicularia ) on the adjacent grasslands, plus
several Red-tailed Hawks ( Buteo jamaicensis ) and
Northern Harriers ( Circus cyaneusH All of these
species could conceivably compete with saw-whets
for small mammal prey, although none of them take
Peromyscus maniculatus to any extent.
Considering the prey data and the estimatedrelative population densities calculated for the
two habitats, I was somewhat surprised by the
small difference in the calculated home rangesizes (142 vs. 159 ha) for the Osoyoos and
Penticton males, but the smaller core area used by
the Osoyoos male helps explain this apparentsimilarity. More radio telemetry work is needed
to determine if these home range sizes areaccurate and representative. These areas are
larger than the 114 ha reported for a saw-whet
tracked for 20 days in November in Minnesota(Forbes and Warner 1974), but only about half of
the mean of 296 ha found for Boreal Owl home
ranges in Colorado (Palmer 1986).
My sample sizes are too small to detect
meaningful differences in nesting success and
nestling growth between saw-whets in the twohabitats. Further work will hopefully result inmore accurate measures of these parameters as wellas better prey availability estimates. The shiftsin prey taken through the breeding season atOsoyoos are interesting. The high number of volestaken early in the season may indicate that volesform the bulk of the winter diets of NorthernSaw-whet Owls, as Catling (1972) found in Ontario.Vole populations are generally high throughout thewinter, then drop sharply in early spring (Krebs and
Boonstra 1978). The shift to Perognathus parvus is
easier to explain, since this species hibernates all
winter, and "few are seen between November and
March" (Banfield 1974, p. 154).
ACKNOWLEDGEMENTS
Allan Preston assisted me in all parts of the
field study, from designing and helping to buildthe nest-boxes to radio-tracking owls in
after-midnight rainshowers. Many other peoplehelped as well, including Doug Brown, SydneyCannings, Steve Cannings, Deb Cavanagh, John Ford,
Margaret Harris, Margaret Holm, Lynn and Rich
Moore, and Jeff and Sue Turner. I wouldespecially like to thank Bill Munro, Al Peatt, Bob
Lincoln, and Orville Dyer of the Ministry of
Environment and Parks, Wildlife Branch for their
help and cooperation, including lending me the radioreceiving equipment and facilitating permits forthe study. The B. C. Ministry of Environment and
Parks and the Canadian Wildlife Service helped fund
the construction of the nest-boxes, and other majorfunding came from a NSERC grant to Dr. J. N. M.
Smith. I thank you all.
LITERATURE CITED
Banfield, A.W.F. 1974. Mammals of Canada. 438 pp.National Museums of Canada, University of
Toronto Press, Toronto.
Cannings, Richard J. 1987. Infestations of Carnus
hemapterus Nitzsch (Diptera: Carnidae) in
Northern Saw-whet Owl nests. Murrelet67:83-84.
Catling, Paul M. 1972. Food and pellet analysis
studies of the Saw-whet Owl ( Aeqoliusacadicus ) . Ontario Field Biologist 26:1-15.
Dunning, John B., Jr. 1984. Body weights of 686species of North American birds. Western Bird
Banding Association Monograph No. 1. 38 pp.
Forbes, James E., and Dwain W. Warner. 1974.Behaviour of a radio-tagged Saw-whet Owl. Auk91:783-795.
Godfrey, W. Earl. 1986. Birds of Canada. NationalMuseums of Canada, Ottawa.
Krebs, Charles J., and Rudy Boonstra. 1978.Demography of the spring decline in populationsof the vole Microtus townsendii . Journal ofAnimal Ecology 47:1007-1015.
Murray, Gale A. 1976. Geographic variation in theclutch sizes of seven owl species. Auk93:602-613.
Palmer, David A. 1986. Habitat Selection,movements, and activity of Boreal and Saw-whetOwls. MSc. thesis, Colorado State University,Fort Collins, Colorado.
198
Study of a Northern Saw-Whet Owl Populationin Sauk County, Wisconsin 1
Scott R. Swengel and Ann B. Swengel 2
We censused a population of Northern Saw-whet Owls
( Aegolius acadlcus ) In 1986 in southern Wisconsin, using thespot-mapping method. Saw-whet Owls called voluntarily from21 February to 27 April, and last responded to taped calls on14 May. Their detectability was high in March and droppedconsiderably in April. Auditory censusing in March and Aprilusing tape-recorded calls yielded 18 Saw-whet Owls along a
7.2-km survey route. Population density was 5.0 singing Saw-whet Owls/km ; one 116-hgctare area had a density of 12.9singing Saw-whet Owls/km . We surveyed most of this routefor Eastern Screech-Owls ( Otus asio) with tape playback. Thedistribution of Saw-whet Owls and Screech-Owls was remarkablydisjunct, with only slight overlap of these species; thissegregation was statistically significant (P<.001). Saw-whetOwls occurred in large tracts of forest, including pine plan-tations, whereas Screech-Owls occupied forests near openareas. We noted 11 instances of interspecific call answeringto tape playback by these two species. Pellets of Saw-whetOwls were measured and their contents analyzed. Roost sitesof Saw-whet Owls were adapted to the different sizes, growthhabits, and canopy of each tree species.
DESCRIPTION OF STUDY AREA
We studied a population of Northern Saw-whetOwls ( Aegolius acadicus ) from February to December1986 in the Baraboo Hills of Sauk County, Wisconsin.The Baraboo Hills are a range of bluffs and hills upto 150 m above the surrounding terrain in Sauk andColumbia Counties, Wisconsin. Although the BarabooHills are south of the tension zone between northernmixed hardwood-coniferous forests and southern deci-duous forests and prairies, several northern foreststypes are found here and Mossman and Lange (1982)state that "...a typical forest in the Baraboo Hillsmight best be described as intermediate between nor-thern and southern types" (p. 19). White pine is-
lands grow on the exposed talus slopes and cliffs,jack pine-oak barrens on the infertile sandy areas,southern oak hardwoods in the flatter, lower areas,upland forests dominated by oak (a southern foresttype) or maple (a northern forest type) in the drierareas, with northern communities in the streamgorges and rocky bluffsides. Pine plantations arescattered throughout the area.
Paper presented at the symposium, Biology andConservation of Northern Forest Owls, Feb. 3-7,
1987, Winnipeg, Manitoba, Canada. USDA ForestServicg General Technical Report RM-142.
Scott R. and Ann B. Swengel, 315 FourthAvenue, Baraboo, Wisconsin 53913 USA
Our four study areas are Baxter's Hollow, a
stream gorge in the western Baraboo Hills; Devil'sLake State Park south shore area, a rugged area con-
taining all the communities discussed above except
pine barren; Steinke Basin in Devil's Lake StatePark, a basin with wet meadow and prairie with deci-duous oak forest and pine plantations on the peri-
meter; and Mirror Lake Pine Barren, immediatelynorth of the Baraboo Hills, a jack pine-oak-redcedar barren with dry prairie. Immediately aroundthe pine barren are pine plantations and oak hard-
wood forests. The studv sites are located at 4323' to 43° 34' N and 89 41' to 89°49' W, and varyfrom 270 to 450 m in elevation.
The Eastern Screech-Owl (Otus asio ) is a resi-
dent breeder in agricultural, urban, and woods-edgehabitat in the Baraboo Hills, while the Saw-whet Owl
is considered a possible breeding bird (Mossman and
Lange 1982). Follen (1981, 1982) has reviewed the
status of Saw-whet Owls in Wisconsin and found onlyone nest record at or south of the latitude of our
study area during the 20th century: 11-27 July
1953, Milwaukee County, 4-5 eggs in the nest, re-
ported by Schwendener in the Passenger Pigeon 15:
178 (1953) (as cited by Follen 1981).
METHODS OF DETECTING OWLS
Our first method of detecting owls was listen-
199
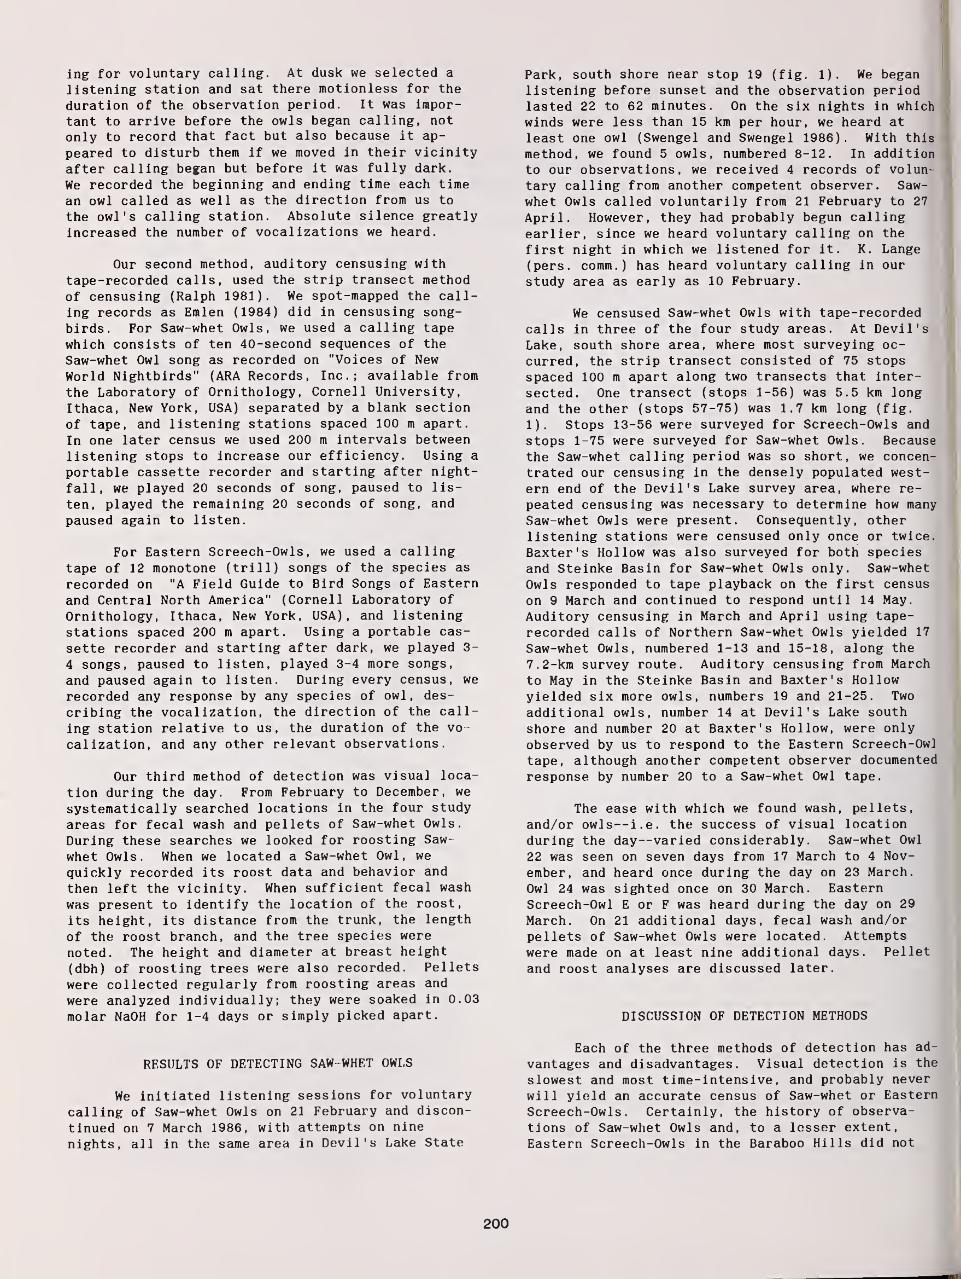
ing for voluntary calling. At dusk we selected a
listening station and sat there motionless for the
duration of the observation period. It was impor-
tant to arrive before the owls began calling, not
only to record that fact but also because it ap-
peared to disturb them if we moved in their vicinity
after calling began but before it was fully dark.
We recorded the beginning and ending time each time
an owl called as well as the direction from us to
the owl's calling station. Absolute silence greatlyincreased the number of vocalizations we heard.
Our second method, auditory censusing withtape-recorded calls, used the strip transect methodof censusing (Ralph 1981). We spot-mapped the call-
ing records as Emlen (1984) did in censusing song-
birds. For Saw-whet Owls, we used a calling tape
which consists of ten 40-second sequences of the
Saw-whet Owl song as recorded on "Voices of NewWorld Nightbirds" (ARA Records, Inc.; available from
the Laboratory of Ornithology, Cornell University,
Ithaca, New York, USA) separated by a blank sectionof tape, and listening stations spaced 100 m apart.
In one later census we used 200 m intervals betweenlistening stops to increase our efficiency. Using a
portable cassette recorder and starting after night-
fall, we played 20 seconds of song, paused to lis-
ten, played the remaining 20 seconds of song, and
paused again to listen.
For Eastern Screech-Owls , we used a callingtape of 12 monotone (trill) songs of the species as
recorded on "A Field Guide to Bird Songs of Eastern
and Central North America" (Cornell Laboratory of
Ornithology, Ithaca, New York, USA), and listeningstations spaced 200 m apart. Using a portable cas-
sette recorder and starting after dark, we played 3-
4 songs, paused to listen, played 3-4 more songs,
and paused again to listen. During every census, we
recorded any response by any species of owl, des-
cribing the vocalization, the direction of the call-
ing station relative to us, the duration of the vo-
calization, and any other relevant observations.
Our third method of detection was visual loca-
tion during the day. From February to December, we
systematically searched locations in the four study
areas for fecal wash and pellets of Saw-whet Owls.
During these searches we looked for roosting Saw-
whet Owls. When we located a Saw-whet Owl, we
quickly recorded its roost data and behavior and
then left the vicinity. When sufficient fecal wash
was present to identify the location of the roost,
its height, its distance from the trunk, the length
of the roost branch, and the tree species were
noted. The height and diameter at breast height
(dbh) of roosting trees were also recorded. Pellets
were collected regularly from roosting areas and
were analyzed individually; they were soaked in 0.03
molar NaOH for 1-4 days or simply picked apart.
RESULTS OF DETECTING SAW-WHET OWLS
We initiated listening sessions for voluntary
calling of Saw-whet Owls on 21 February and discon-
tinued on 7 March 1986, with attempts on nine
nights, all in the same area in Devil's Lake State
Park, south shore near stop 19 (fig. 1). We beganlistening before sunset and the observation periodlasted 22 to 62 minutes. On the six nights in whichwinds were less than 15 km per hour, we heard at
least one owl (Swengel and Swengel 1986). With this
method, we found 5 owls, numbered 8-12. In additionto our observations, we received 4 records of volun-
tary calling from another competent observer. Saw-
whet Owls called voluntarily from 21 February to 27
April. However, they had probably begun callingearlier, since we heard voluntary calling on the
first night in which we listened for it. K. Lange(pers. comm.) has heard voluntary calling in our
study area as early as 10 February.
We censused Saw-whet Owls with tape-recordedcalls in three of the four study areas. At Devil'sLake, south shore area, where most surveying oc-
curred, the strip transect consisted of 75 stops
spaced 100 m apart along two transects that inter-
sected. One transect (stops 1-56) was 5.5 km long
and the other (stops 57-75) was 1.7 km long (fig.
1). Stops 13-56 were surveyed for Screech-Owls and
stops 1-75 were surveyed for Saw-whet Owls. Because
the Saw-whet calling period was so short, we concen-
trated our censusing in the densely populated west-ern end of the Devil's Lake survey area, where re-
peated censusing was necessary to determine how manySaw-whet Owls were present. Consequently, otherlistening stations were censused only once or twice.
Baxter's Hollow was also surveyed for both speciesand Steinke Basin for Saw-whet Owls only. Saw-whetOwls responded to tape playback on the first census
on 9 March and continued to respond until 14 May.
Auditory censusing in March and April using tape-
recorded calls of Northern Saw-whet Owls yielded 17
Saw-whet Owls, numbered 1-13 and 15-18, along the
7.2-km survey route. Auditory censusing from March
to May in the Steinke Basin and Baxter's Hollowyielded six more owls, numbers 19 and 21-25. Two
additional owls, number 14 at Devil's Lake south
shore and number 20 at Baxter's Hollow, were only
observed by us to respond to the Eastern Screech-Owl
tape, although another competent observer documented
response by number 20 to a Saw-whet Owl tape.
The ease with which we found wash, pellets,
and/or owls— i.e. the success of visual locationduring the day—varied considerably. Saw-whet Owl
22 was seen on seven days from 17 March to 4 Nov-ember, and heard once during the day on 23 March.
Owl 24 was sighted once on 30 March. EasternScreech-Owl E or F was heard during the day on 29
March. On 21 additional days, fecal wash and/orpellets of Saw-whet Owls were located. Attemptswere made on at least nine additional days. Pellet
and roost analyses are discussed later.
DISCUSSION OF DETECTION METHODS
Each of the three methods of detection has ad-
vantages and disadvantages. Visual detection is the
slowest and most time-intensive, and probably never
will yield an accurate census of Saw-whet or Eastern
Screech-Owls. Certainly, the history of observa-tions of Saw-whet Owls and, to a lesser extent,
Eastern Screech-Owls in the Baraboo Hills did not
200

--listening station• Saw-whet calling station
>4irea of one Saw-whet calling station;qrrow points away from listening station
•movement of one owl between two callingC stations in one nightXEastern Screech-Owl calling station
Eastern Screech pair at one calling stationboundary of detection distance for Saw-whet Owls
100 0
I I L JL500
J I
meters
N
T
Figure 1. Map of Devil's Lake State Park, south shore areaand Steinke Basin, showing the census route, numberedlistening stations, area in which Saw-whet Owls weredetectable, and the calling records of different Saw-whet Owls and Eastern Screech-Owls
.
prepare us for the results we obtained with the oth-
er two methods. However, visual searching is the
only way to study pellets and roost site selection.Furthermore, in the absence of vocalizations—and
the Saw-whet Owl in particular is very seasonal in
vocal response—visual detection is the only realis-tic method of detection. However, at the same time
that it becomes difficult to elicit vocal responses,
it also becomes more difficult to find pellets and
roosts. We believe the warmer weather and presenceof hungry invertebrates erases the evidence quickly.
Many pellets we collected during the late spring and
summer contained small beetles that had burrowedinto the pellets. Wilson (1938) found that small
pellets decompose within four to six weeks duringthe spring, but last 3-5 months during winter. Of
course, it is always difficult to find the owls
themselves. Diurnal observations are also the onlyway to gather data on nesting behavior and successand the only way to observe the owl, although this
is only during the owl's less active time.
Listening for voluntary vocalizations is a sea-
sonal method, but at the right time of year it is
more efficient in detecting Saw-whet Owls than day-
time searches. It is also the only way of those
methods we used to observe nocturnal behavior of the
owls unaffected by human intrusion. During our
listening sessions, we noted instances in which Saw
-
whet Owls appeared to approach and respond to eachother, apparently oblivious to their human audience.
Auditory censusing at the right time of year is
by far the most efficient means of censusing Saw-
whet and Eastern Screech-Owls. One must, however,determine the peak calling period of the Saw-whetOwls in the area if one wishes to census an area in
the fewest evenings. For example, on 9 March, we
elicted responses from all the owls we ever detectedin the area we censused that night; however, we can
only know that from repeated surveys of the area.
We only experienced 100% detectability twice, on 9
March at Devil's Lake south shore and on 27 March at
the Steinke Basin, so it probably is not a commonoccurrence. Tape playback and, more time intensive-ly, listening for voluntary vocalizations enablecensusing of areas that are all but inaccessible onfoot. Calling data also greatly improves the effi-ciency of visual searching during the day.
One method we did not use is banding/recapture.This requires location of the owl on a day roost,
capture of the owl, attaching a band and/or other
visual markers on the owl, release, and attempts to
re-identify the same individual by recapture. This
is one way of monitoring the location of individualowls. We have considered this method, but feel it
is not appropriate for our purposes. Mumford and
Zusi (1958) found that the bands and marks theyplaced on Saw-whet Owls were rarely observable with-out recapturing the owl and they were often unableto catch a given owl to confirm its identify. Fre-
quent recapture of the owls is likely to affecttheir behavior, thus biasing the results. From our
observations of the diurnal behavior of the Saw-whet
Owl, we believe that Saw-whet Owls become increas-
ingly skittish the more human intrusion they exper-
ience and become more inclined to flush off their
201
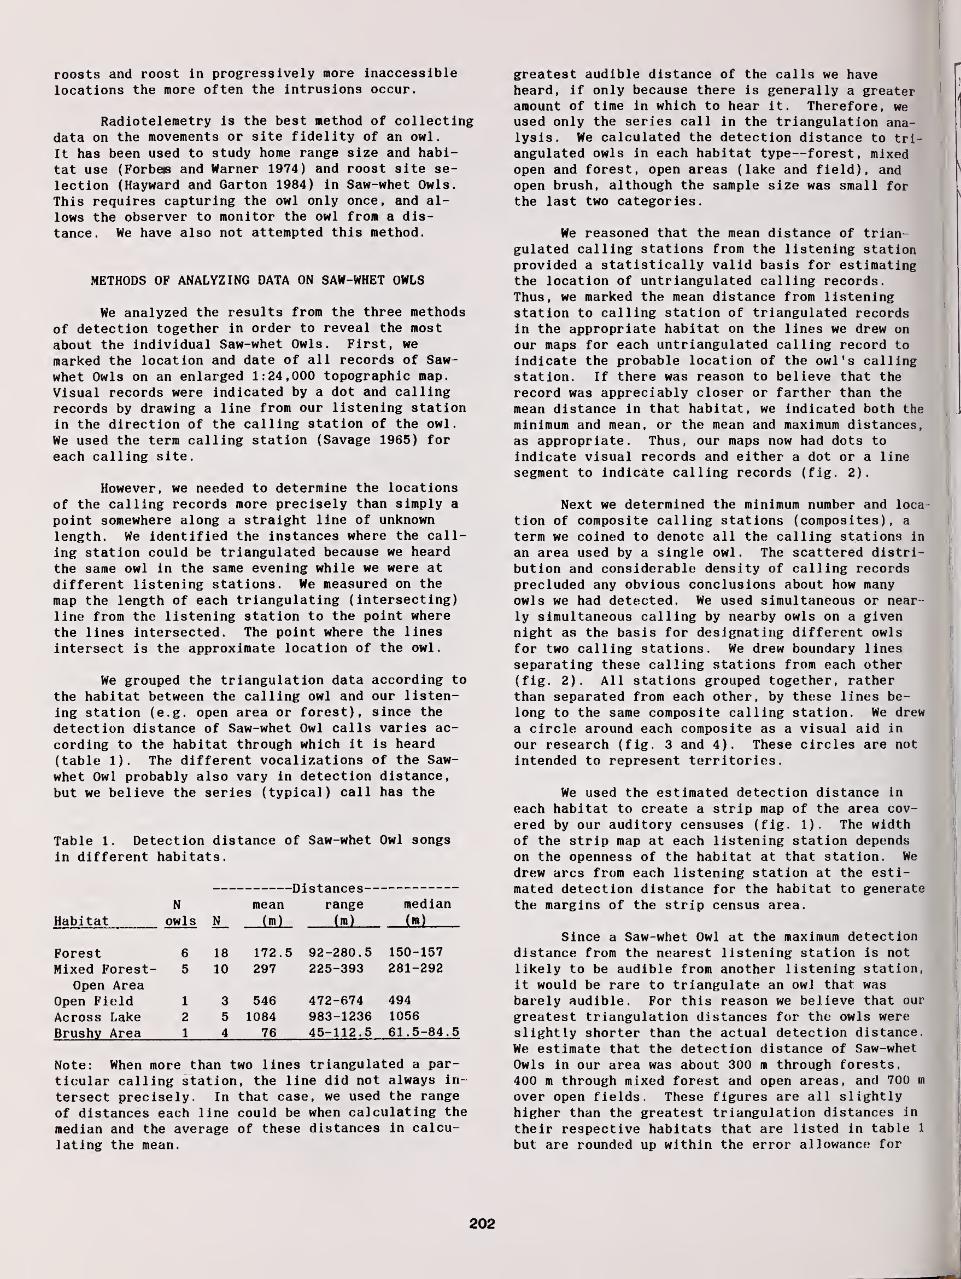
roosts and roost in progressively more inaccessiblelocations the more often the intrusions occur.
Radiotelemetry is the best method of collectingdata on the movements or site fidelity of an owl.
It has been used to study home range size and habi-
tat use (Forbes and Warner 1974) and roost site se-
lection (Hayward and Garton 1984) in Saw-whet Owls.
This requires capturing the owl only once, and al-
lows the observer to monitor the owl from a dis-
tance. We have also not attempted this method.
METHODS OF ANALYZING DATA ON SAW-WHET OWLS
We analyzed the results from the three methods
of detection together in order to reveal the most
about the individual Saw-whet Owls. First, we
marked the location and date of all records of Saw-
whet Owls on an enlarged 1:24,000 topographic map.
Visual records were indicated by a dot and callingrecords by drawing a line from our listening stationin the direction of the calling station of the owl.
We used the term calling station (Savage 1965) for
each calling site.
However, we needed to determine the locationsof the calling records more precisely than simply a
point somewhere along a straight line of unknownlength. We identified the instances where the call-
ing station could be triangulated because we heardthe same owl in the same evening while we were at
different listening stations. We measured on the
map the length of each triangulating (intersecting)
line from the listening station to the point wherethe lines intersected. The point where the lines
intersect is the approximate location of the owl.
We grouped the triangulation data according to
the habitat between the calling owl and our listen-
ing station (e.g. open area or forest), since the
detection distance of Saw-whet Owl calls varies ac-
cording to the habitat through which it is heard
(table 1). The different vocalizations of the Saw-
whet Owl probably also vary in detection distance,
but we believe the series (typical) call has the
Table 1. Detection distance of Saw-whet Owl songs
in different habitats.
DistancesN mean range median
Habitat owls N_ On) (m) (m)
Forest 6 18 172.5 92-280.5 150-157
Mixed Forest- 5 10 297 225-393 281-292
Open AreaOpen Field 1 3 546 472-674 494
Across Lake 2 5 1084 983-1236 1056
Brushy Area 1 4 76 45-112.5 61.5-84.5
Note: When more than two lines triangulated a par-
ticular calling station, the line did not always in-
tersect precisely. In that case, we used the range
of distances each line could be when calculating the
median and the average of these distances in calcu-
lating the mean.
greatest audible distance of the calls we haveheard, if only because there is generally a greateramount of time in which to hear it. Therefore, weused only the series call in the triangulation ana-lysis. We calculated the detection distance to tri-angulated owls in each habitat type—forest, mixedopen and forest, open areas (lake and field), andopen brush, although the sample size was small forthe last two categories.
We reasoned that the mean distance of trian-gulated calling stations from the listening stationprovided a statistically valid basis for estimatingthe location of untriangulated calling records.Thus, we marked the mean distance from listeningstation to calling station of triangulated recordsin the appropriate habitat on the lines we drew onour maps for each untriangulated calling record to
indicate the probable location of the owl's callingstation. If there was reason to believe that the
record was appreciably closer or farther than the
mean distance in that habitat, we indicated both the
minimum and mean, or the mean and maximum distances,as appropriate. Thus, our maps now had dots to
indicate visual records and either a dot or a line
segment to indicate calling records (fig. 2).
Next we determined the minimum number and loca-
tion of composite calling stations (composites), a
term we coined to denote all the calling stations in
an area used by a single owl. The scattered distri-bution and considerable density of calling recordsprecluded any obvious conclusions about how manyowls we had detected. We used simultaneous or near-
ly simultaneous calling by nearby owls on a givennight as the basis for designating different owls
for two calling stations. We drew boundary lines
separating these calling stations from each other(fig. 2). All stations grouped together, ratherthan separated from each other, by these lines be-
long to the same composite calling station. We drew
a circle around each composite as a visual aid in
our research (fig. 3 and 4). These circles are not
intended to represent territories.
We used the estimated detection distance in
each habitat to create a strip map of the area cov-
ered by our auditory censuses (fig. 1). The widthof the strip map at each listening station dependson the openness of the habitat at that station. We
drew arcs from each listening station at the esti-
mated detection distance for the habitat to generatethe margins of the strip census area.
Since a Saw-whet Owl at the maximum detectiondistance from the nearest listening station is not
likely to be audible from another listening station,
it would be rare to triangulate an owl that, wasbarely audible. For this reason we believe that our
greatest triangulation distances for the owls wereslightly shorter than the actual detection distance.
We estimate that the detection distance of Saw-whet
Owls in our area was about 300 m through forests,
400 m through mixed forest and open areas, and 700 m
over open fields. These figures are all slightlyhigher than the greatest triangulation distances in
their respective habitats that are listed in table 1
but are rounded up within the error allowance for
202
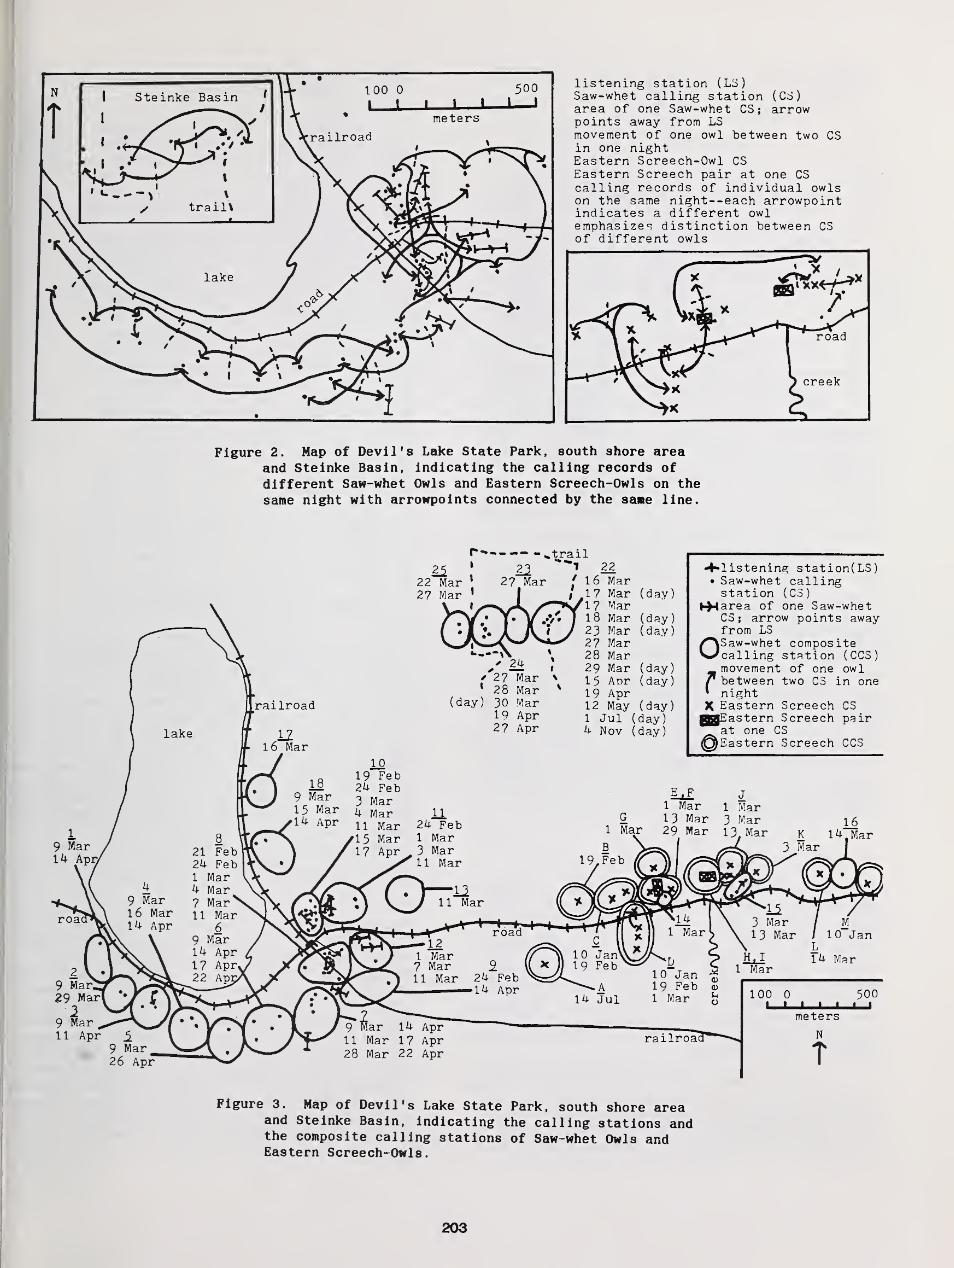
listening station (LS)Saw-whet calling station (CS)area of one Saw-whet CS ; arrowpoints away from L5movement of one owl between two CSin one nightEastern Screech-Owl CSEastern Screech pair at one CScalling records of individual owlson the same night--each arrowpointindicates a different owlemphasizes distinction between CSof different owls
Figure 2. Nap of Devil's Lake State Park, south shore areaand Steinke Basin, indicating the calling records ofdifferent Saw-whet Owls and Eastern Screech-Owl s on thesame night with arrowpoints connected by the same line.
r-—— -..trail
2i22 Mar2? Mar 1
2? Mar22
1 6 Mar17 Mar (day)17 Mar18 Mar (day'23 Mar (day)27 Mar28 Mar29 Mar (day)15 ADr (day)19 Apr12 May (day)1 Jul (day')^ Nov (day)
or
listening station(LS)Saw-whet callingstation ( CS
)
area of one Saw-whetCS ; arrow points awayfrom LSSaw-whet compositecalling station (CCS)movement of one owlbetween two C3 in onenightEastern Screech CS(Eastern Screech pairat one CSEastern Screech CCS
Figure 3. Map of Devil's Lake State Park, south shore areaand Steinke Basin, indicating the calling stations andthe composite calling stations of Saw-whet Owls andEastern Screech-Owls
.
203
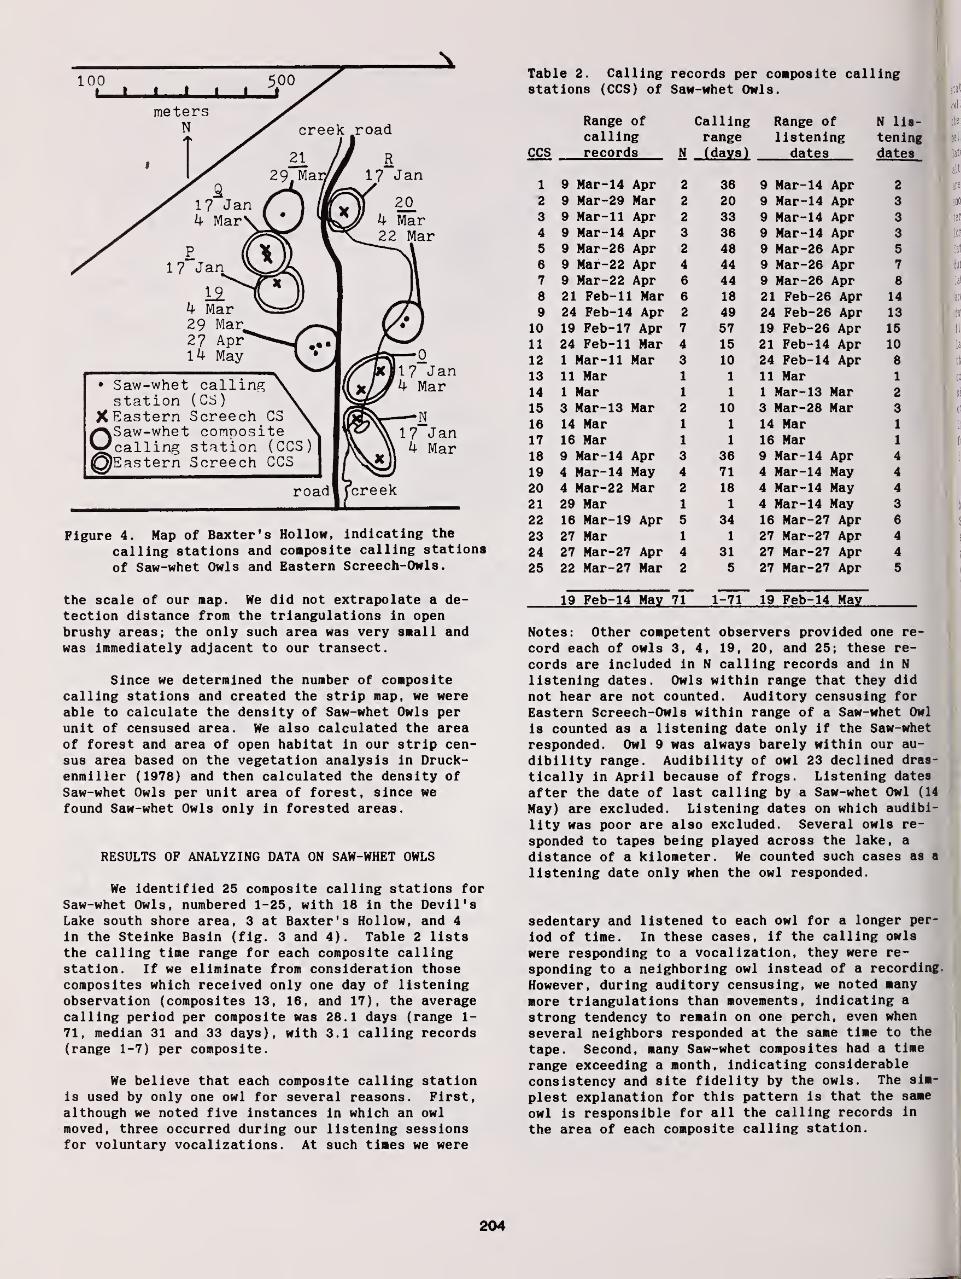
Table 2. Calling records per composite callingstations (CCS) of Saw-whet Owls.
Figure 4. Map of Baxter's Hollow, indicating the
calling stations and composite calling stations
of Saw-whet Owls and Eastern Screech-Owls.
the scale of our map. We did not extrapolate a de-tection distance from the triangulatlons in openbrushy areas; the only such area was very small andwas Immediately adjacent to our transect.
Since we determined the number of compositecalling stations and created the strip map, we wereable to calculate the density of Saw-whet Owls perunit of censused area. We also calculated the areaof forest and area of open habitat in our strip cen-sus area based on the vegetation analysis in Druck-enmiller (1978) and then calculated the density ofSaw-whet Owls per unit area of forest, since wefound Saw-whet Owls only in forested areas.
RESULTS OF ANALYZING DATA ON SAW-WHET OWLS
We identified 25 composite calling stations forSaw-whet Owls, numbered 1-25, with 18 in the Devil'sLake south shore area, 3 at Baxter's Hollow, and 4
in the Steinke Basin (fig. 3 and 4). Table 2 liststhe calling time range for each composite callingstation. If we eliminate from consideration thosecomposites which received only one day of listeningobservation (composites 13, 16, and 17), the averagecalling period per composite was 28.1 days (range 1-
71, median 31 and 33 days), with 3.1 calling records(range 1-7) per composite.
We believe that each composite calling stationis used by only one owl for several reasons. First,although we noted five instances in which an owlmoved, three occurred during our listening sessionsfor voluntary vocalizations. At such times we were
Range of Calling Range of N lis-calling range listening tening
CCS records N ( days
)
dates dates
1 9 Mar-14 Apr 2 36 9 Nar-14 Apr 2
2 9 Mar-29 Nar 2 20 9 Nar-14 Apr 3
3 9 Mar-11 Apr 2 33 9 Nar-14 Apr 3
4 9 Nar- 14 Apr 3 36 9 Nar-14 Apr 3
5 9 Nar-26 Apr 2 48 9 Nar-26 Apr 5
6 9 Nar-22 Apr 4 44 9 Nar-26 Apr 7
7 9 Nar-22 Apr 6 44 9 Nar-26 Apr 8
8 21 Feb- 11 Nar 6 18 21 Feb-26 Apr 14
9 24 Feb-14 Apr 2 49 24 Feb-26 Apr 13
10 19 Feb-17 Apr 7 57 19 Feb-26 Apr 15
11 24 Feb- 11 Nar 4 15 21 Feb-14 Apr 10
12 1 Nar- 11 Nar 3 10 24 Feb-14 Apr 8
13 11 Nar 1 1 11 Nar 1
14 1 Nar 1 1 1 Nar-13 Nar 2
15 3 Nar-13 Nar 2 10 3 Nar-28 Nar 3
16 14 Nar 1 1 14 Nar 1
17 16 Nar 1 1 16 Nar 1
18 9 Nar-14 Apr 3 36 9 Nar-14 Apr 4
19 4 Nar-14 Nay 4 71 4 Nar-14 Nay 4
20 4 Nar-22 Nar 2 18 4 Nar-14 Nay 4
21 29 Nar 1 1 4 Nar-14 Nay 3
22 16 Nar-19 Apr 5 34 16 Nar-27 Apr 6
23 27 Nar 1 1 27 Nar-27 Apr 4
24 27 Nar-27 Apr 4 31 27 Nar-27 Apr 4
25 22 Nar-27 Nar 2 5 27 Nar-27 Apr 5
19 Feb-14 Nay 71 1-71 19 Feb-14 Hay
Notes: Other competent observers provided one re-
cord each of owls 3, 4, 19, 20, and 25; these re-
cords are included in N calling records and in N
listening dates. Owls within range that they did
not hear are not counted. Auditory censuslng for
Eastern Screech-Owls within range of a Saw-whet Owl
is counted as a listening date only if the Saw-whet
responded. Owl 9 was always barely within our au-
dibility range. Audibility of owl 23 declined dras-
tically In April because of frogs. Listening dates
after the date of last calling by a Saw-whet Owl (14
Nay) are excluded. Listening dates on which audibi-
lity was poor are also excluded. Several owls re-
sponded to tapes being played across the lake, a
distance of a kilometer. We counted such cases as a
listening date only when the owl responded.
sedentary and listened to each owl for a longer per-
iod of time. In these cases, if the calling owls
were responding to a vocalization, they were re-
sponding to a neighboring owl Instead of a recording.
However, during auditory censuslng, we noted many
more triangulatlons than movements, indicating a
strong tendency to remain on one perch, even when
several neighbors responded at the same time to the
tape. Second, many Saw-whet composites had a time
range exceeding a month, indicating considerable
consistency and site fidelity by the owls. The sim-
plest explanation for this pattern is that the same
owl is responsible for all the calling records in
the area of each composite calling station.
204
Thus, we believe that the composite callingstations we have identified are each used by one
owl. Furthermore, from the evidence of several of
the composites— 5, 19, and 22 in particular—we
believe that a good number of the composites corre-late with the territories of resident Saw-whet Owls,
although we do not know how large the territoriesare. The data for many of the composites are scantyenough to permit other interpretations, such as win-tering or transient owls. Most owls called for toolong a period from the same area to be transients.Catling (1971) found that owls he located and bandedduring the sgring migration near Toronto, where thelatitude (43 41' N) is similar to that of our studyarea, were invariably gone from the area within twodays. In the absence of vocal records, it is dif-ficult to confirm the presence of a Saw-whet Owl in
late spring and beyond. As further corroborationthat the species is resident, we sighted an owl incomposite 22 on 1 July and two competent observerssighted an immature Saw-whet Owl on 1 June in an-other area of the Baraboo Hills of Sauk County (K.
Lange and P. Druckenmiller , pers. comm.). We alsofound a few pellets regularly throughout the summerin the area of composite 22.
The detectability of Saw-whet Owls was veryhigh in March and dropped considerably in April.Saw-whet Owls began calling voluntarily aroundsundown while it was still twilight and remainedresponsive to the tape well after that. We did notcontinue to listen for voluntary calling after anhour past sundown—sometimes an owl was calling aswe terminated the listening session, and we did no
observations of any kind after 2200 hrs. Once weheard a Saw-whet Owl call during the day (1112 hrson 23 March) after we had done a visual search ofthe area. The series (typical) call is generallyaudible for only several hundred meters, but we haveoccasionally heard this call across Devil's Lake fora distance exceeding 1 km (table 1).
During the listening sessions for voluntarycalling, we were nearest owl composites 8 and 10.
These composites are across the road from eachother. On two evenings (24 February and 4 March),these two owls called simultaneously. On the latterdate, we noted much interaction between these twoowls. At 1739 hrs, owl 8 initiated calling and thetwo exchanged vocal responses nine times until 1837hrs. During this time, both owls moved toward eachother and then away from each other. On 7 March,owls 8 and 12, also adjacent to each other, ex-changed vocal responses three times. Owl 10 did notcall during the listening session that evening.
The census area along our strip transects con-tained 3.60 km from which Saw-whet Owls were audi-ble. The population density was 5.0 calling Saw-whet Owls/km and 7.2/km of forested area. One116-hectare area, from stops 4 to 27 and stops 57 to
60, intersecting each other, contained 15 calliggSaw-whej; Owls, for a maximum density of 12.9/km and15.8/km of forested area. In this high densityarea we found calling owls at approximately 250 m
intervals along the transect. Because of the evendistribution of owls in this area and our numerouscensuses of it, we believe this density approaches
the maximum density of the species in this habitatand area.
DISCUSSION
Catling (1971) found that the spring migrationof Saw-whet Owls near Toronto began about 24 March,
peaked 12-20 April, and ended about 25 April. Ourresults suggest that most of the Saw-whet Owls we
heard were either winter residents or breedingbirds. We heard five different owls call after 20
April, which is the end of the peak migration period
at our latitude (Catling 1971). Catling also states
that Saw-whet Owls wintering in his area left duringMarch. Owl 22, in whose composite we saw a Saw-whetOwl on 12 May and 1 July, did not call after 19
April. For this reason, we believe that failure to
hear certain owls after mid-April does not necessar-
ily mean they had left the area. Also, our maincensus route receives so much usage by people from
May to September that censusing is very difficult
during these months. Although 18 of the 25 Saw-whet
Owls that we found were along this route, our three
latest calling records were from other areas, where
human-generated noise was not as much of a problem.
Brewster (1925) noted a calling period for Saw-whet
Owls in Maine that was similar to ours, tapering in
late April and becoming irregular in May.
Studies in Wisconsin (Follen 1981, 1982) and
Michigan (Curtis 1963a, b) indicate that the most
likely egg laying period at our latitude is early
April. Follen and Haug (1981) reported a nest with
eggs on 18 March about 100 km NNW of our study area.
Since the incubation period for Saw-whet Owl eggs is
26-28 days and the fledging period is about 34 days
(Eckert and Karalus 1974), the fledged immature Saw-
whet Owl seen on 1 June 1986 in the Baraboo Hills
must have hatched from an egg laid no later than the
first week of April. Since nest initiation occurs
around the beginning of April, many of the Saw-whet
Owls we heard (12 out of 20 composites censused
after 10 April) were calling during the normal
breeding period and may well be breeders. Coinci-
dental ly or not, the responsiveness of Saw-whet Owls
to taped calls dropped markedly during the first
half of April, when most eggs are probably laid.
Ogr maximum degsity of 12.9 calling Saw-whet
Owls/km and 15.8/km of forest is similar to the2
density of one pair/40 acres (12.4 individuals/km )
reported by Johnson et al. (1979) in Arizona, but we
do not know whether they assumed a pair was present
for each calling owl. Simpson (1972) conducted au-
ditory censuses in North Carolina at the southern
tip of the eastern breeding range of Saw-whet Owls
and found one active calling station per 2.63 km of
transect, a much lower density than we found. Van-
derschaegen (1981) and Follen (1981) mention in-
stances of large numbers of Saw-whet Owls occurring
in two areas of northern Wisconsin, but do not give
density estimates.
CENSUS OF EASTERN SCREECH-OWLS
Along the 4.4 km of census route surveyed for
205
Eastern Screech-Owls ( Otus asio ) with tape playback,we found 13 Screech-Owl composite calling stations,lettered A-M (fig. 3). In Baxter's Hollow, we foundfive, lettered N-R (fig. 4). We mapped these re-cords according to the methods described for Saw-whet Owls. We did not have a sufficient sample oftriangulations for this species to determine detec-tion distances. However, we used the few triangu-lations available to assist in mapping the recordsaccurately. Habitat features also helped, in thatopen areas beyond and interspersed in the forestslining the route limited the possibilities for roostlocations. We noted pairs when two voices over-lapped from the same location. We considered thecomposite for each member of the pair to overlapcompletely with the other's, although this may be
proven wrong with further research. The number ofScreech-Owls was determined in the same way as forSaw-whet Owls, by noting records from different lo-
cations on the same night.
Eastern Screech-Owls also showed a strong pat-tern of consistency in their composite calling sta-tions. This is not surprising since they are a res-ident species. Although Screech-Owls showed more ofa tendency than Saw-whet Owls to move in response tothe tape, they usually stayed in one place. It is
easier to determine whether a Screech-Owl has movedbecause of the distinctive pitch and style of indi-vidual Screech-Owl voices.
The distribution of Saw-whet Owls and EasternScreech-Owls was remarkably disjunct, with onlyslight overlap of these species; this segregationwas statistically significant (P<.001). Saw-whetOwls occurred in large tracts of forest, includingpine plantations, whereas Screech-Owls occupied for-ests with more open areas (P<.001). We found nei-ther species of owl in the area from stops 27 to 33,
between the area of Saw-whet Owl concentration andthe area of Eastern Screech-Owl concentration. Thisarea is vegetated with lowland deciduous forest, a
southern forest type.
We noted 11 instances of interspecific callanswering to taped call by these two species duringour playback census. Five individual Saw-whet Owlsresponded six times to Eastern Screech-Owl tapes,and three to five individual Screech-Owls respondedto Saw-whet tapes. Hayward (1983) has also notedinterspecific call answering by Saw-whet Owls.
VOCALIZATIONS OF SAW-WHET OWLS
We noted a variety of vocalizations for thisspecies. The territorial song was by far the mostcommonly heard vocalization. It consisted of a sin-
gle short high-pitched note which was repeated atconsistent intervals, often for a great length oftime. Volume sometimes varied, although after care-ful observation it generally became apparent thatthe owl had not moved appreciably. The owl hadprobably been projecting its call in several di-rections, and this probably accounts for the ven-trilocal effect reported by some authors. If thevocalization lasted sufficiently long for us topinpoint its direction, we did not find this "ven-
triloquism" confounding. If the owl moved betweenvocalizations, great care was required in attribut-ing the vocalization to the right individual. Asdiscussed above, we noted several times in whichmovement by an individual owl was apparent. We do
not believe that the owls were moving about verymuch because of the consistency of each composite'slocation. Sometimes an owl accelerated the rate of
the notes in the song. Conversely, we have alsonoted an interval greater than the observed norm.
The series vocalization is well known and is repre-sented on various bird song recordings, such as
"Voices of New World Nightbirds" and "A Field Guideto Bird Songs of Eastern and Central North America"mentioned above.
We also identified four additional vocaliza-tions: a harsh, short shriek (probably an alarmcall); an ascending, single-noted wail ("saw-whetcall"), a single, long whistle similar in pitch and
tone to the song note, and a lower-pitched, isolateddescending call. We attributed these vocalizationsto the Saw-whet Owl on the basis of one or both of
the following means. First, the vocalization imme-
diately preceded or followed the song and came from
the same direction and at comparable volume. Se-
cond, the location of the vocalization triangulatedwith a record of a series call on the same evening.
The "saw-whet" call is also on "A Field Guide to
Bird Songs of Eastern and Central North America."
ROOSTS OF SAW-WHET OWLS
We found Saw-whet Owl roosts in seven species
of coniferous trees in our study area: White Spruce
( Picea glauca ) , Jack Pine ( Plnus banks iana ) , RedPine (Pinus resinosa ) , Eastern Red Cedar ( Juniperusvlrginiana ) , Eastern White Pine ( Pinus strobus )
,
Eastern Hemlock ( Tsuga canadensi s) , and NorwaySpruce ( Picea abies ) . Over 95% of the roosts were
in five species of trees--White Spruce, Jack Pine,
Red Pine, Eastern Red Cedar, and Norway Spruce. The
roost height was positively correlated with the
height of the tree and was low in densely foliated
trees and high in sparse trees. Table 3 shows that
the mean roost height and mean tree height is lowest
for Eastern Red Cedars, the densest of the five
trees, followed in order by Jack Pine, White Spruce,
Norway Spruce, and Red Pine.
Although we found many pellets under Red Pines,
we were usually unable to determine how high the owl
had roosted, since there were few branches to catch
Table 3. Typical roost sites of Saw-whet Owls.
Tree
—
-Roost-
mean meanheight height sd
species (m) N_ (m) (n>) range (m)
Eastern Red 4.3 5 1.57 0.32 1.37-2 . 13
CedarJack Pine 5.3 33 1 .91 0.64 0.76-3 .66
White Spruce 6.6 41 2.76 0.79 0.69-4 .88
Norway Spruce 10.1 5 4.38 2.09 1 .95-7 .30
Red Pine 11.6 6 5.92 1.32 3.96-7 .62
206
white wash below the roost to give us clues wherethe exact roost site was. Saw-whet Owl roosts inRed Pines were usually about 6 m high, just abovewhere the foliage begins, and averaged 63 cm (N=7)
from the trunk; below these roosts most of the limbswere broken stubs with no needles, as is typical inRed Pine plantations. A well hidden Saw-whet Owl is
nearly impossible to spot when it is high in a RedPine. Furthermore, in the summer the evidence of a
roost—wash and pellets—on or near the ground is
erased rapidly by weather and insects, which makesit more difficult to identify a roost tree. Forthese reasons we believe that Saw-whet Owls probablyroost in such tall trees more often than is indi-cated by the frequency with which they are foundthere. Hayward and Garton (1984) used radiotele-metry to locate Saw-whet Owl roosts and found Saw-whet Owls roosting as high as 7.3 m, with a meanheight of 4.2 m (N=15) . It took up to 45 minutes to
find the owl after they had located the roostingtree, indicating how difficult Saw-whet Owls are tofind when they choose high roosts.
At Mirror Lake Pine Barren Saw-whet Owls fre-quently roosted in dense 3-6 m tall Eastern RedCedars that were scattered widely and singly acrossthe open dry prairie or on the edges of Jack Pineclumps. Only the largest Red Cedars were chosen.Roosts tended to be less than 2 m high—at or lowerthan the widest point of the tree. The roost loca-tion ranged from near the trunk to near the tips ofthe branches, but was usually in the outer part ofthe foliage (mean=107 cm from the trunk, N=9).
Roosts in Jack Pines were in trees of allsizes, but most were in small trees in dense clumps.Some roosts were in large sprawling Jack Pines thathad many limbs intersecting one another 1-4 m offthe ground. Roost locations ranged from near thetrunk to 2/3 of the way out on the branch, with themean 53.2 cm from the trunk (N=36)
.
White Spruce roosts were generally 2-4 m highand close to the trunk of the tree (mean=27.4 cm,
N=38). In general, these trees afford considerablecover from all directions and the plantations ordense forests are difficult to traverse. One plan-tation yielded pellets throughout the year and pro-duced our only summer sighting of a Saw-whet Owl on1 July. Many winter roosts were along a hiking-skiing trail that bisects the plantation. Duringthe late spring and summer the owl seemed to choosemore secluded roosts in the interior of the planta-tion. This may have resulted from our frequentvisits to the area to collect pellets.
Roosts in Norway Spruces were all in fairlytall trees and were intermediate in height betweenWhite Spruces and Red Pines. The two highest roostsin Norway Spruces were in a tree at the edge of a
plantation. Roosts tended to be close to the trunkin this species (mean=18 cm, N=4).
very compact and are usually dark and moist whenfresh. Typical pellets were 2.5-4.0 cm long and1.3-1.7 cm wide (mean length= 3.05 cm, range=l . 8-5 .
1
cm, N=344 unbroken pellets; mean width=1.54 cm,
range=0. 9-2.0 cm, N=396 pellets).
We analyzed 380 pellets, using Driver (1949),Jackson (1961), Glass (1973), and Burt and Grossen-heider (1976) to identify the mammal skulls. Table4 lists the prey items found in the pellets. Therewere 0.64 prey items per pellet, which agrees withthe findings of Collins (1963) and Errington (1932)
that Saw-whet Owls frequently cast two pellets per
prey item eaten. Over 90% of prey individuals were
rodents, and over 80% of the prey items werePeromyscus . Peromyscus has been the dominant prey
in most studies of Saw-whet Owl diets, e.g. Erring-
ton (1932) and Graber (1962), in the midwest UnitedStates. Microtus was the second most important prey
item. We also found a few Sorex and Blarlna shrews,
one Myotis bat, several small birds, and one cricket
in the pellets. Terrill (1931) also found Myotis in
the diet of Saw-whet Owls.
The Saw-whet Owl prey was heavily slanted
toward woodland species. Over 90% of the Peromyscus
identified were Pj_ leucopus , a forest species; the
rest were P_^ maniculatus , a field species. Microtus
is an open country genus in our area, while Sorex
cinereus is generally a forest species, Blarina
brevicauda is ubiquitous, and Myotis likewise could
be found almost anywhere. Excluding the one rodent,
birds, and cricket, whose prime habitats are unknown
since we couldn't identify them to species, about
188 prey individuals were forest-dwelling species,
37 were open-country species, and seven were widely
Table 4. Prey items found in 380 Saw-whet Owl
pellets collected 17 March to 17 December
Prey Item
Mammals (95.9%)Rodents (90.9%)
Peromyscus spp.
P. leucopusP. mani culatusunidentified J\
Microtus spp.
M. pennsylvanicusM. ochrogasterunidentified M_^
unidentified rodentShrews (4.5%)
Blarina brevicaudaSorex cinereus
Bats (0.4%)
Myotis spp.
Birds (3.7%)Finch spp.
unidentified Passerine
N individuals (%)
195 ( 80.2)
25 ( 10.3)
1 ( 0.4)
6 ( 2.5)5 ( 2.1)
1 ( 0.4)
2 ( 0.8)
7 ( 2.9)
121
8
66
17
2
6
PELLET ANALYSIS
We collected 431 Saw-whet Owl pellets between17 March and 17 December. Saw-whet Owl pellets are
Insects (0.4%)cricket
Total
1 ( 0.4)
243 (100.0)
207
adapted species. Therefore, over 80* of the preywas gleaned from the forest floor. Saw-whet Owlsthat lived in more open Red Pine plantations or thatroosted in Eastern Red Cedars in open parts of Mir-ror Lake Pine Barren took proportionately more open-country prey than their counterparts in denser WhiteSpruce or Jack Pine stands. These Saw-whet Owlsliving in more open habitat took 40% Microtus and51% Peromys cus versus the 5% Microtus and 85%Peromyscus for the Saw-whet Owls living in denserforests in the same region.
ACKNOWLEDGEMENTS
We are grateful to Ken Lange for sharing hisgreat personal knowledge and helpful encouragement.We thank Lisa Hartman and Jim Harris for providingus with additional records of Saw-whet Owls.
Douglas Trapp has also given us helpful informationand encouragement.
LITERATURE CITED
Brewster, W. 1925. The birds of the Lake Umbagogregion of Maine. Bulletin of the Museum of
Comparative Zoology 66: 215-402.
Burt, W. H. , and R. P. Grossenheider . 1976. AField Guide to the Mammals. Houghton MifflinCompany, Boston.
Catling, P. M. 1971. Spring migration of Saw-whetOw]s at Toronto, Ontario. Bird Banding 42:
110-114.
Collins, C. T. 1963. Notes on the feedingbehavior, metabolism, and weight of the Saw-whet Owl. Condor 65: 528-530.
Curtis, R. D. 1963a. Observation on the nesting ofthe Saw-whet Owl at the Rose Lake WildlifeResearch Center. Jack-Pine Warbler 41: 110-
112.
Curtis, R. D. 1963b. Recent Saw-whet Owl nest,
Crawford County, Mich. Jack-Pine Warbler 41:
133.
Driver, E. C. 1949. Mammal remains in owl pellets.American Midland Naturalist 41:139-142.
Druckenmil ler , H. S. 1978. Environmental ImpactStatement for the Proposed Ice Age NationalScientific Reserve Master Plan, Wisconsin.Bureau of Parks and Recreation, WisconsinDepartment of Natural Resources, Madison.
Eckert, A. W. , and K. E. Karalus. 1974. The Owlsof North America (North of Mexico). Doubledayand Company, Inc., Garden City, New Jersey, pp.56-65.
Em] en, J. T. 1984. An observer-specific, full-season, strip-map method for censusing songbirdcommunities. Auk 101: 730-740.
Errington, P. L. 1932. Food habits of southernWisconsin raptors, part I. Owls. Condor 34:
176-186.
Follen, D. G. Sr. 1981. Wisconsin breeding and
breeding period records of Saw-whet Owls.
Passenger Pigeon 43: 113-116.
Follen, D. G. Sr. 1982. Additional breeding and
breeding period records of Saw-whet Owls in
Wisconsin. Passenger Pigeon 44: 71.
Follen, D. G. Sr., and J. C. Haug. 1981. Saw-whet
Owl nest in Wood Duck box. Passenger Pigeon
43: 47-48.
Forbes, J. E. , and D. W. Warner. 1974. Behavior of
a radio-tagged Saw-whet Owl. Auk 91: 783-795.
Glass, B. P. 1973. A Key to the Skulls of North
American Mammals. Department of Zoology,
Oklahoma State University, Stillwater.
Graber, R. R. 1962. Food and oxygen consumption in
three species of owls (Strigidae). Condor 64:
473-487.
Hayward, G. D. 1983. Resource partitioning among
six forest owls in the River of No Return
Wilderness, Idaho. M.S. Thesis, University of
Idaho, Moscow.
Hayward, G. D. , and Edward 0. Garton. 1984. Roost
habitat selection by three small forest owls.
Wilson Bulletin 96: 690-692.
Jackson, H. H. T. 1961. Mammals of Wisconsin. The
University of Wisconsin Press, Madison.
Johnson, R. R., L. T. Haight, and J. M. Simpson.
1979. Owl populations and species status in
the southwestern United States, pp. 40-59 in
P. P. Schaeffer and S. M. Ehlers, eds.
Proceedings of the Symposium on Owls of the
West: Their Ecology and Conservation.
National Audubon Society Western Education
Center, Tiburon, California.
Mossman, M. J., and K. I. Lange. 1982. Breeding
birds of the Baraboo Hills, Wisconsin: Their
History, Distribution, and Ecology. Department I
of Natural Resources and Wisconsin Society for
Ornithology, Madison, Wisconsin.
Mumford, R. E. , and R. L. Zusi. 1958. Notes on the
movements, territory, and habitat of wintering
Saw-whet Owls. Wilson Bulletin 70: 188-191.
Ralph, C. J. 1981. Appendix I. Terminology used
in estimating numbers of birds. Studies in
Avian Biology no. 6: 577-578.
Savage, T. 1965. Recent observations of the Saw-
whet Owl in G. S.M.N. P. Migrant 36: 15-16.
Simpson, M. B. Jr. 1972. The Saw-whet Owl
population of North Carolina's southern Great
Balsam Mountains. Chat 36: 39-47.
Swengel, A. B. , and S. R. Swengel. 1986. An
auditory census of Northern Saw-whet Owls
( Aegolius acadicus ) in Sauk County, Wisconsin.
Passenger Pigeon 48:119-121.
Terrill, L. Mcl. 1931. Nesting of the Saw-whet Owl
( Cryptoglaux acadica acadica ) in the Montreal
District. Auk 48: 168-174.
Vanderschaegen, P. 1981. Where are the Saw-whet
Owls? Passenger Pigeon 43: 48-49.
Wilson, K. A. 1938. Owl studies at Ann Arbor,
Michigan. Auk 55: 187-197.
208
Remigial Molt in Fall Migrant Long-Earedand Northern Saw-Whet Owls 1
David L. Evans and Robert N. Rosenfield
Abstract . --Netting operations at the Hawk RidgeNature Reserve, Duluth, Minnesota resulted in thecapture of 1,090 Long-eared Owls from 1976-86 and2,639 Northern Saw-whet Owls from 1980-86. Adultsand juveniles can be separated by the presence orabsence of (1) 2 generations of remiges and/or (2)sequentially grown remiges, which are characterizedby a pink color on the undersurface that fades withtime. The proportion of adult Long-eared Owls withcompleted remigial molt varied from year to year,ostensibly in relation to prey abundance. Incontrast, virtually all adult Saw-whet Owls hadretained remiges from the previous year, with 3
basic molt patterns that appeared to correspond withdifferent age classes.
INTRODUCTION
Patterns of molt provide a basis for ageingmany species of birds for banding(Anonymous 1977). Previous studies on themolt patterns of Long-eared Owls (A_s_io_
otus ) mainly have been concerned withcaptive birds (Haarhaus 1983, Wijnandts1984) and a few individuals encountered inthe wild at various times of year(Stresemann and Stresemann 1966). We arenot aware of published data on moltpatterns of remiges in Northern Saw-WhetOwls f Aegolius acadicus ) . Mueller andBerger (1967) aged adult Saw-whet Owls bythe presence of 2 generations of remiges,but at that time it was not known whetherthey resulted from an interrupted molt oran incomplete annual molt (J. Sheppard,Bird Banding Lab., pers. comm.).Subsequent studies also have relied on thepresence of 2 generations of remiges inageing saw-whets (Evans 1975, Sheppard andKlimkiewicz 1976, Anonymous 1977, Weir etal. 1980, Buckholtz et al. 1984). Weir etal. (1980) suggested that the 2 generationsarise from an interrupted molt, whileBuckholtz et al . (1984) attributed it to a
i Paper presented at the symposium,Biology and Conservation of Northern ForestOwls, Feb. 3-7, 1987, Winnipeg, Manitoba.USDA Forest Service General TechnicalReport RM-142.
2 David L. Evans, Hawk Ridge NatureReserve, 2928 Greysolon Rd. , Duluth, Minn.55812 and Robert N. Rosenfield, Dept. ofZoology, North Dakota State Univ. , Fargo,ND 58105.
partial postbreeding remex molt. In thispaper we present molt patterns in fallmigrant Long-eared Owls captured from 1976to 1986 and in Saw-whet Owls captured from1980 to 1986. We also discuss thepatterns' relationship to ageing owls andecological factors that may influenceobserved patterns.
METHODS
Trapping by mist net ('CTX',Northeastern Bird-Banding Assoc. ) wasconducted nightly from mid September to midNovember at the Hawk Ridge ResearchStation, Hawk Ridge Nature Reserve, Duluth,Minnesota. The study area, net placement,and owl capture techniques are described inEvans (1980).
In addition to banding and takingweight, wing, and tail measurements, werecorded the molt of right wing remiges andrectrices for all adult owls. Long-earedOwls could not be reliably sexed, althoughwe did assign sex based on underwingcoloration — males being paler and lessbuffy than females. We also had difficultysexing Saw-whet Owls. Measurement criteriapresented by Sheppard and Klimkiewicz(1976) and Buckholtz et al. (1984), whenapplied to our captures, resulted in a sexratio heavily skewed toward males and wehave little confidence in the applicabilityof those criteria to the Saw-whetpopulation migrating through Duluth.Beginning in 1977, we applied permanentgreen dye (Sanford's Marker) to remiges ofall Saw-whet Owls to evaluate the age
209
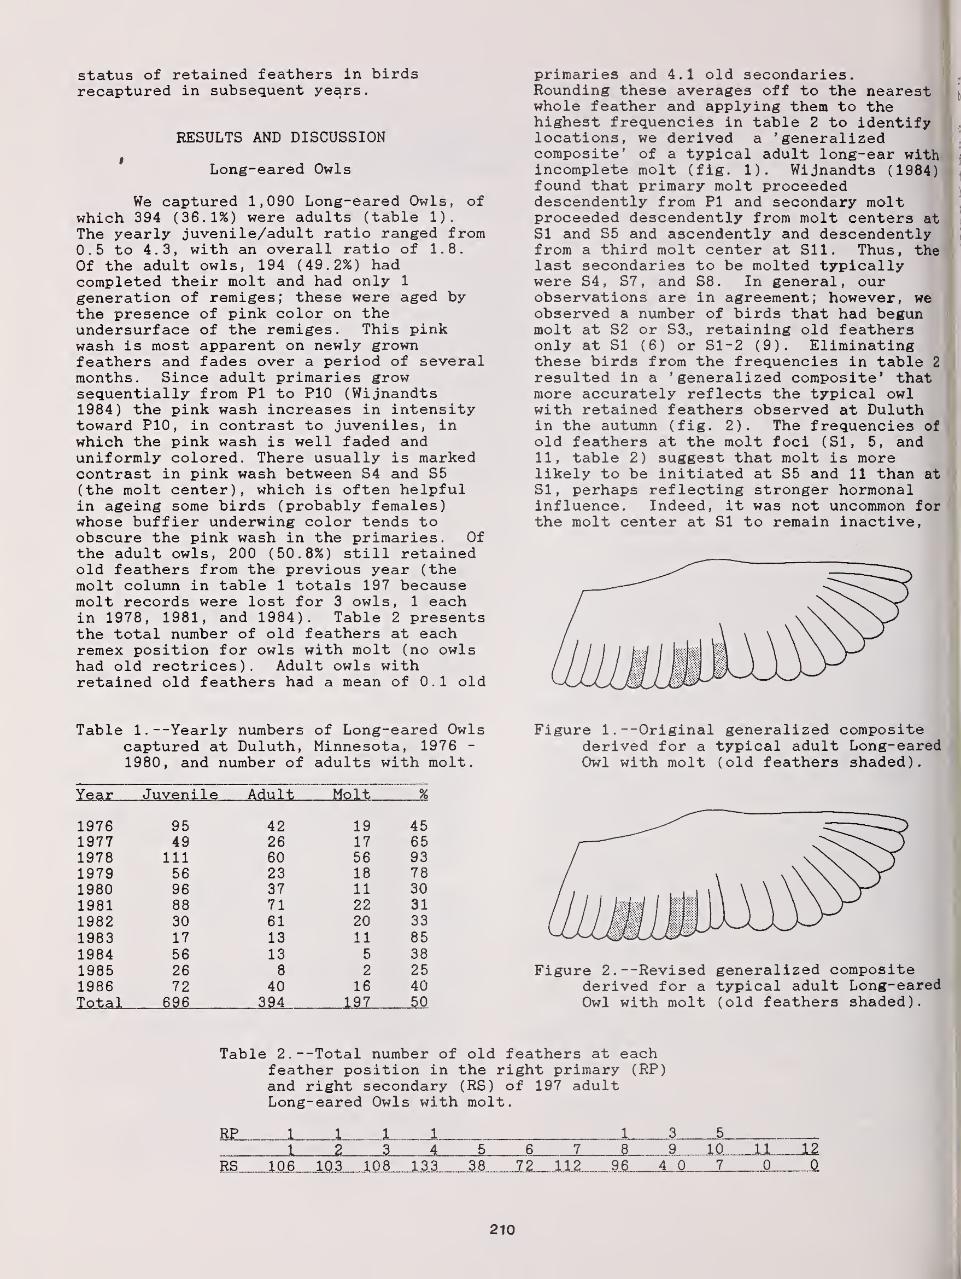
status of retained feathers in birdsrecaptured in subsequent years.
RESULTS AND DISCUSSION
Long-eared Owls
We captured 1,090 Long-eared Owls, ofwhich 394 (36.1%) were adults (table 1).
The yearly juvenile/adult ratio ranged from0.5 to 4.3, with an overall ratio of 1.8.Of the adult owls, 194 (49.2%) hadcompleted their molt and had only 1
generation of remiges; these were aged bythe presence of pink color on theundersurface of the remiges. This pinkwash is most apparent on newly grownfeathers and fades over a period of severalmonths. Since adult primaries growsequentially from PI to P10 (Wijnandts1984) the pink wash increases in intensitytoward P10, in contrast to juveniles, inwhich the pink wash is well faded anduniformly colored. There usually is markedcontrast in pink wash between S4 and S5(the molt center), which is often helpfulin ageing some birds (probably females)whose buffier underwing color tends toobscure the pink wash in the primaries. Ofthe adult owls, 200 (50.8%) still retainedold feathers from the previous year (themolt column in table 1 totals 197 becausemolt records were lost for 3 owls, 1 eachin 1978, 1981, and 1984). Table 2 presentsthe total number of old feathers at eachremex position for owls with molt (no owlshad old rectrices). Adult owls withretained old feathers had a mean of 0.1 old
Table 1. --Yearly numbers of Long-eared Owlscaptured at Duluth, Minnesota, 1976 -
1980, and number of adults with molt.
Juvenile %
1976 95 42 19 451977 49 26 17 651978 111 60 56 931979 56 23 18 781980 96 37 11 301981 88 71 22 311982 30 61 20 331983 17 13 11 851984 56 13 5 381985 26 8 2 251986 72 40 16 40Total 696 394 197 50
primaries and 4.1 old secondaries.Rounding these averages off to the nearestwhole feather and applying them to thehighest frequencies in table 2 to identifylocations, we derived a 'generalizedcomposite' of a typical adult long-ear withincomplete molt (fig. 1). Wijnandts (1984)found that primary molt proceededdescendently from PI and secondary moltproceeded descendently from molt centers atSI and S5 and ascendently and descendentlyfrom a third molt center at Sll. Thus, thelast secondaries to be molted typicallywere S4, S7, and S8. In general, ourobservations are in agreement; however, weobserved a number of birds that had begunmolt at S2 or S3., retaining old feathersonly at SI (6) or Sl-2 (9). Eliminatingthese birds from the frequencies in table 2
resulted in a 'generalized composite' thatmore accurately reflects the typical owlwith retained feathers observed at Duluthin the autumn (fig. 2). The frequencies ofold feathers at the molt foci (SI, 5, and11, table 2) suggest that molt is morelikely to be initiated at S5 and 11 than atSI, perhaps reflecting stronger hormonalinfluence. Indeed, it was not uncommon forthe molt center at SI to remain inactive,
Figure 1. --Original generalized compositederived for a typical adult Long-earedOwl with molt (old feathers shaded).
Figure 2. --Revised generalized compositederived for a typical adult Long-earedOwl with molt (old feathers shaded).
Table 2. --Total number of old feathers at eachfeather position in the right primary (RP)and right secondary (RS) of 197 adultLong-eared Owls with molt.
RP_ 1 1 1 1 I 3 5 „
1 2 _3 4 5 6 7 1_8 9_ 10_ U IZRS 106 103 108 133 38 72 112 96____4„0 7 0 Q.
210
resulting in an otherwise cleanly moltedbird with old feathers at Sl-4.
Almost all Long-eared Owls hadcompleted primary molt. Only ,5 of the 197owls with retained feathers had notfinished molting their primaries. Three ofthese birds occurred in 1978, which had thehighest yearly proportion of owls withmolt. One apparently aberrant individualhad only replaced P5-7, had Sl-10 old, andhad all 12 rectrices just emerging fromsheath. The remaining 4 had a patternconsistent with descendent primary molt,with P9-10 old (table 2). Of the owls withretained feathers, 84 (42.6%) also hadactively growing feathers. These includeda total of 107 primaries (predominantly P9-10) and 68 secondaries, which wereinvariably in a sequence consistent withthe molting pattern described by Wijnandts(1984) and observed in this study. Themean length of growing feathers (recordedin tenths) was 8.2 for primaries and 8.0for secondaries; only 12 of 107 primariesand 5 of 68 secondaries were less than 7/10grown. Thus it appears, for the most part,that active molting ceases with the onsetof migration. We captured only one owlthat had two generations of old feathers.We conclude that the old, retained feathersobserved in fall migrant long-ears are theresult of an interrupted molt, which iscompleted sometime after migration.
The proportion of adult long-ears thathad not completed their molt variedconsiderably among years, from a high of93% to a low of 25% (table 1). We feelthat prey availability during the moltingperiod may explain the variation observed.With peaks in 1978 and 1983 and lows in1980 and 1985, the proportion ofincompletely molted owls appears to vary ina regular fashion, perhaps in associationwith fluctuations in microtine prey.However, we found no correlation betweenthe proportion of owls with retainedfeathers and the mean yearly capture weightof juveniles, adults, completely moltedadults, or incompletely molted adults,although it did approach significance foradults (r = -0.56, 9 d.f., P > 0.05) andfor incompletely molted adults (r = -0.56,9 d.f., P > 0.05). With the caveat thatrelatively minor changes in the male/femaleratio could have a substantial effect onthe yearly mean capture weight, thereappears to be no substantial relationshipbetween the proportion of incompletelymolted owls and capture weight. In 6 ofthe 11 years, mean capture weight ofcleanly molted owls was less than that ofincompletely molted owls, although overallit was slightly higher. To what extent thesex ratio affected mean capture weight isunknown and precludes further analysis onthe relationship between the proportion ofcleanly molted owls and food supply.
Saw-whet Owls
We captured 2,639 Saw-whet Owls, ofwhich 1,463 (55.4%) were adults (table 3).The yearly juvenile/adult ratio ranged from0.5 to 1.5, with an overall ratio of 0.8.Only 8 adults (0.5%) had completed theirmolt and had one generation of remiges(group E, table 3). As in the Long- earedOwls, these were aged by the pink wash onthe undersurface of newly replaced remiges,which was most apparent on the outerprimaries (P8-10) and at various locationsin the secondaries, depending on the moltpattern involved. Care was taken in thiscategory not to include juveniles, whichoften exhibit the pink wash uniformlyacross their greater underwing coverts as aresult of their recent postjuvenal bodymolt. The remaining 1,455 adults had 2,and sometimes 3, generations of feathers.Considering only the 2 most recentgenerations of feathers, we used the moltrecords of individual owls to delineate 3
basic groups. A 4th group consisted ofbirds that could not be assigned to theabove groups. In practice, placement of anowl into 1 of the 3 basic groupsoccasionally involved some judgement,particularly in regard to the presence of 1
and sometimes 2 'atypical' (i.e., newinstead of old) feathers in an otherwiseclearly apparent pattern.
Group A was by far the largest with827 (56.5%) owls and had a patternconsisting of a solid block of old innerprimaries and secondaries. Table 4
presents the total number of old feathersat each remex position for group A. Adultowls in group A had a mean of 4.2 oldprimaries and 3.9 old secondaries.Rounding these averages off to the nearestwhole feather and and applying them to thehighest frequencies in table 4, we deriveda generalized composite of a typical saw-whet in group A (fig. 3). This composite,with Pl-4 and Sl-4 old, was the most commonconfiguration in group A (table 5).
Group B was the smallest of the 3
groups with 202 (13.8%) owls and had a
Table 3. --Yearly numbers of Saw-whet Owlscaptured at Duluth, Minnesota, 1980 -
1986, and number of adults in eachmolt pattern group.
Xe_ar Juvenile A BAdult
C D E Total
1980 187 76 9 33 2 1 3081981 158 165 33 45 5 3 4091982 145 117 19 64 1 3 3491983 61 65 29 23 3 0 1811984 336 190 70 143 6 0 7451985 140 106 19 51 4 0 3201986 149 108 23 40 6 1 327Total 1176 827 202 399 27 a 2639
211
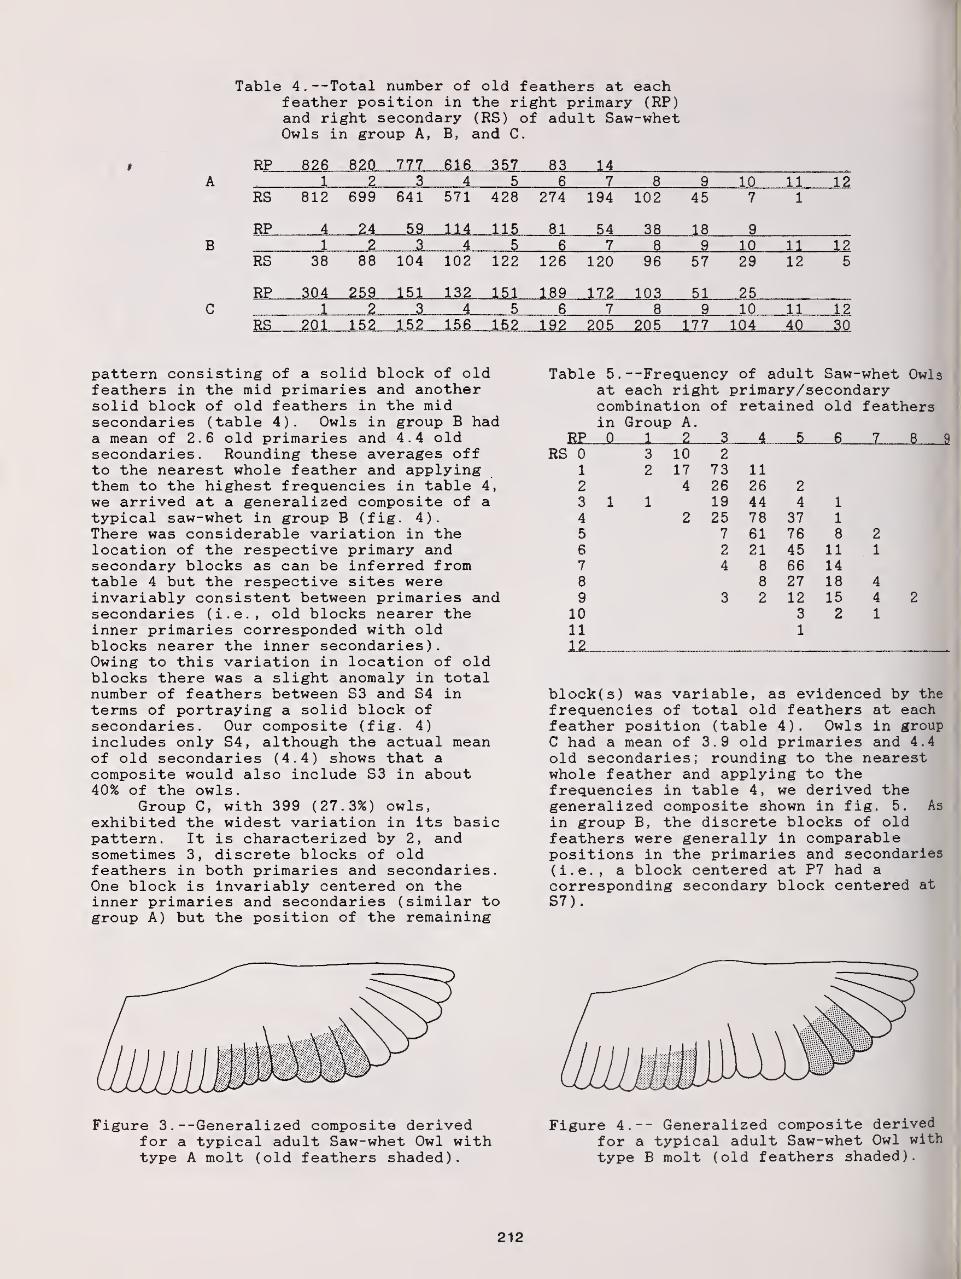
Table 4. —Total number of old feathers at eachfeather position in the right primary (RP)and right secondary (RS) of adult Saw-whetOwls in group A, B, and C.
RP 326 820 777 616 357 83 14A 1 2 3 4 5 6 7 8 9 10 11 12
RS 812 699 641 571 428 274 194 102 45 7 1
RP 4 24 59 114 U5 81 54 38 18 9
B 1 2 3 4 5 a 7 8 9 10 11 12RS 38 88 104 102 122 126 120 96 57 29 12 5
RP 304 259 151 132 151 189 172 103 51 25C 1 2 3 4 5 6 7 8 9 10 11 12
RS 201 152 152 156 152 192 205 205 177 104 40 30
pattern consisting of a solid block of oldfeathers in the mid primaries and anothersolid block of old feathers in the midsecondaries (table 4). Owls in group B hada mean of 2.6 old primaries and 4.4 oldsecondaries. Rounding these averages offto the nearest whole feather and applyingthem to the highest frequencies in table 4,we arrived at a generalized composite of atypical saw-whet in group B (fig. 4).There was considerable variation in thelocation of the respective primary andsecondary blocks as can be inferred fromtable 4 but the respective sites wereinvariably consistent between primaries andsecondaries (i.e., old blocks nearer theinner primaries corresponded with oldblocks nearer the inner secondaries).Owing to this variation in location of oldblocks there was a slight anomaly in totalnumber of feathers between S3 and S4 interms of portraying a solid block ofsecondaries. Our composite (fig. 4)includes only S4, although the actual meanof old secondaries (4.4) shows that acomposite would also include S3 in about40% of the owls.
Group C, with 399 (27.3%) owls,exhibited the widest variation in its basicpattern. It is characterized by 2, andsometimes 3, discrete blocks of oldfeathers in both primaries and secondaries.One block is invariably centered on theinner primaries and secondaries (similar togroup A) but the position of the remaining
Figure 3 . --Generalized composite derivedfor a typical adult Saw-whet Owl withtype A molt (old feathers shaded).
Table 5. —Frequency of adult Saw-whet Owlsat each right primary/secondarycombination of retained old feathersin Group A.
RP 0 1 2 3 4 5 6 7 8 9
RS 0 3 10 21 2 17 73 112 4 26 26 2
3 1 1 19 44 4 1
4 2 25 78 37 1
5 7 61 76 8 2
6 2 21 45 11 1
7 4 8 66 148 8 27 18 4
9 3 2 12 15 4 2
10 3 2 1
11 1
block(s) was variable, as evidenced by thefrequencies of total old feathers at eachfeather position (table 4). Owls in groupC had a mean of 3.9 old primaries and 4.4old secondaries; rounding to the nearestwhole feather and applying to thefrequencies in table 4, we derived thegeneralized composite shown in fig. 5. As
in group B, the discrete blocks of oldfeathers were generally in comparablepositions in the primaries and secondaries(i.e., a block centered at P7 had acorresponding secondary block centered atS7)
.
Figure 4.— Generalized composite derivedfor a typical adult Saw-whet Owl with
type B molt (old feathers shaded).
212
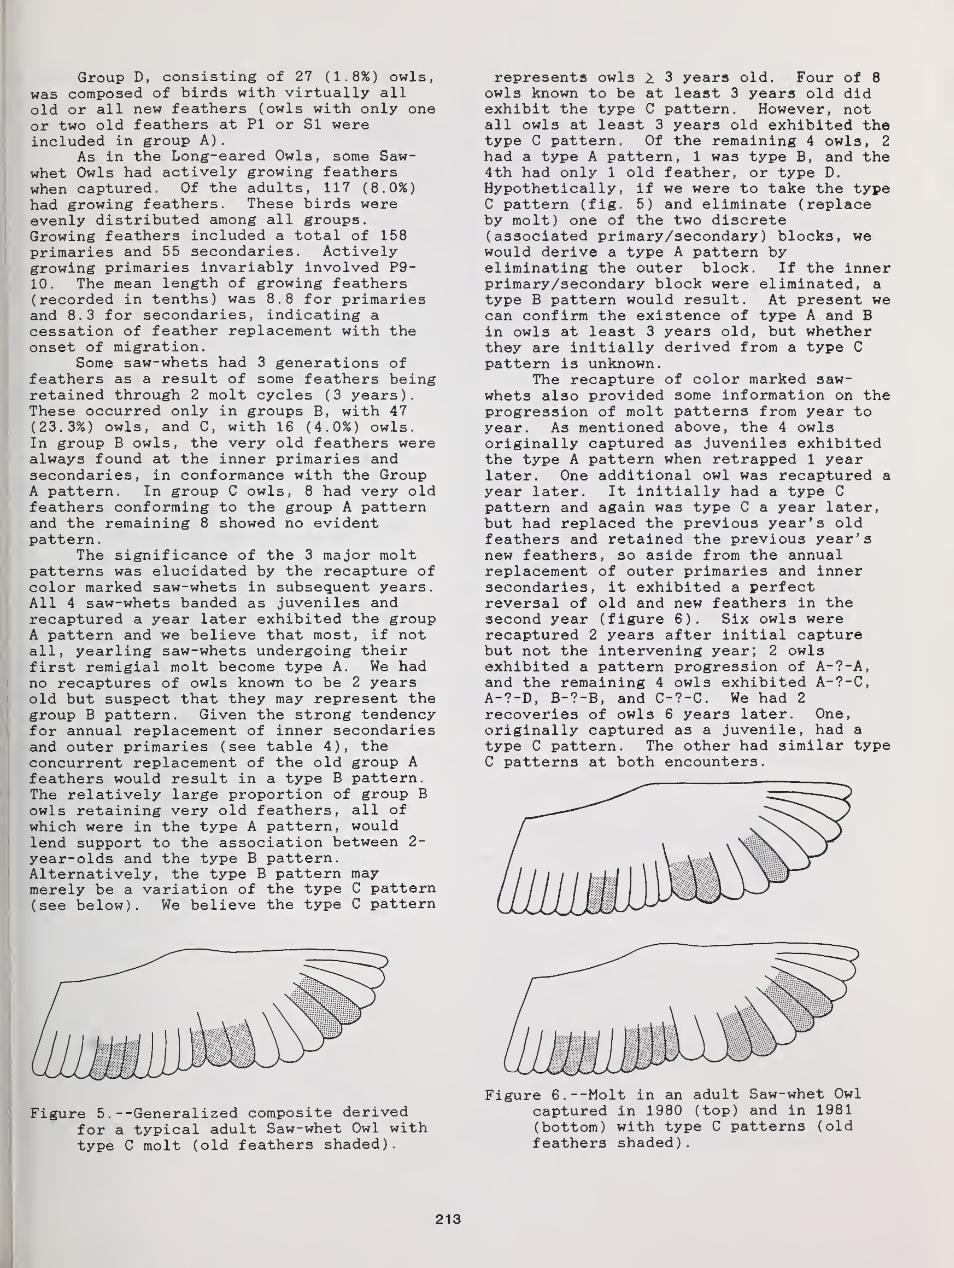
Group D, consisting of 27 (1.8%) owls,was composed of birds with virtually allold or all new feathers (owls with only oneor two old feathers at PI or SI wereincluded in group A)
.
As in the Long-eared Owls, some Saw-whet Owls had actively growing featherswhen captured. Of the adults, 117 (8.0%)had growing feathers. These birds wereevenly distributed among all groups.Growing feathers included a total of 158primaries and 55 secondaries. Activelygrowing primaries invariably involved P9-10. The mean length of growing feathers(recorded in tenths) was 8.8 for primariesand 8.3 for secondaries, indicating acessation of feather replacement with theonset of migration.
Some saw-whets had 3 generations offeathers as a result of some feathers beingretained through 2 molt cycles (3 years).These occurred only in groups B, with 47(23.3%) owls, and C, with 16 (4.0%) owls.In group B owls, the very old feathers werealways found at the inner primaries andsecondaries, in conformance with the GroupA pattern. In group C owls, 8 had very oldfeathers conforming to the group A patternand the remaining 8 showed no evidentpattern.
The significance of the 3 major moltpatterns was elucidated by the recapture ofcolor marked saw-whets in subsequent years.All 4 saw-whets banded as juveniles andrecaptured a year later exhibited the groupA pattern and we believe that most, if notall, yearling saw-whets undergoing theirfirst remigial molt become type A. We hadno recaptures of owls known to be 2 yearsold but suspect that they may represent thegroup B pattern . Given the strong tendencyfor annual replacement of inner secondariesand outer primaries (see table 4), theconcurrent replacement of the old group Afeathers would result in a type B pattern.The relatively large proportion of group Bowls retaining very old feathers, all ofwhich were in the type A pattern, wouldlend support to the association between 2-
year-olds and the type B pattern.Alternatively, the type B pattern maymerely be a variation of the type C pattern(see below). We believe the type C pattern
Figure 5 . --Generalized composite derivedfor a typical adult Saw-whet Owl withtype C molt (old feathers shaded).
represents owls 2 3 years old. Four of 8owls known to be at least 3 years old didexhibit the type C pattern. However, notall owls at least 3 years old exhibited thetype C pattern. Of the remaining 4 owls, 2
had a type A pattern, 1 was type B, and the4th had only 1 old feather, or type D.Hypothetically , if we were to take the typeC pattern (fig. 5) and eliminate (replaceby molt) one of the two discrete(associated primary/secondary) blocks, wewould derive a type A pattern byeliminating the outer block. If the innerprimary/secondary block were eliminated, atype B pattern would result. At present wecan confirm the existence of type A and Bin owls at least 3 years old, but whetherthey are initially derived from a type Cpattern is unknown.
The recapture of color marked saw-whets also provided some information on theprogression of molt patterns from year toyear. As mentioned above, the 4 owlsoriginally captured as juveniles exhibitedthe type A pattern when retrapped 1 yearlater. One additional owl was recaptured ayear later. It initially had a type Cpattern and again was type C a year later,but had replaced the previous year's oldfeathers and retained the previous year'snew feathers, so aside from the annualreplacement of outer primaries and innersecondaries, it exhibited a perfectreversal of old and new feathers in thesecond year (figure 6). Six owls wererecaptured 2 years after initial capturebut not the intervening year; 2 owlsexhibited a pattern progression of A-?-A,and the remaining 4 owls exhibited A-?-C,A-7-D, B-7-B, and C-7-C. We had 2
recoveries of owls 6 years later. One,originally captured as a juvenile, had atype C pattern. The other had similar typeC patterns at both encounters
.
Figure 6. --Molt in an adult Saw-whet Owlcaptured in 1980 (top) and in 1981(bottom) with type C patterns (oldfeathers shaded).
213
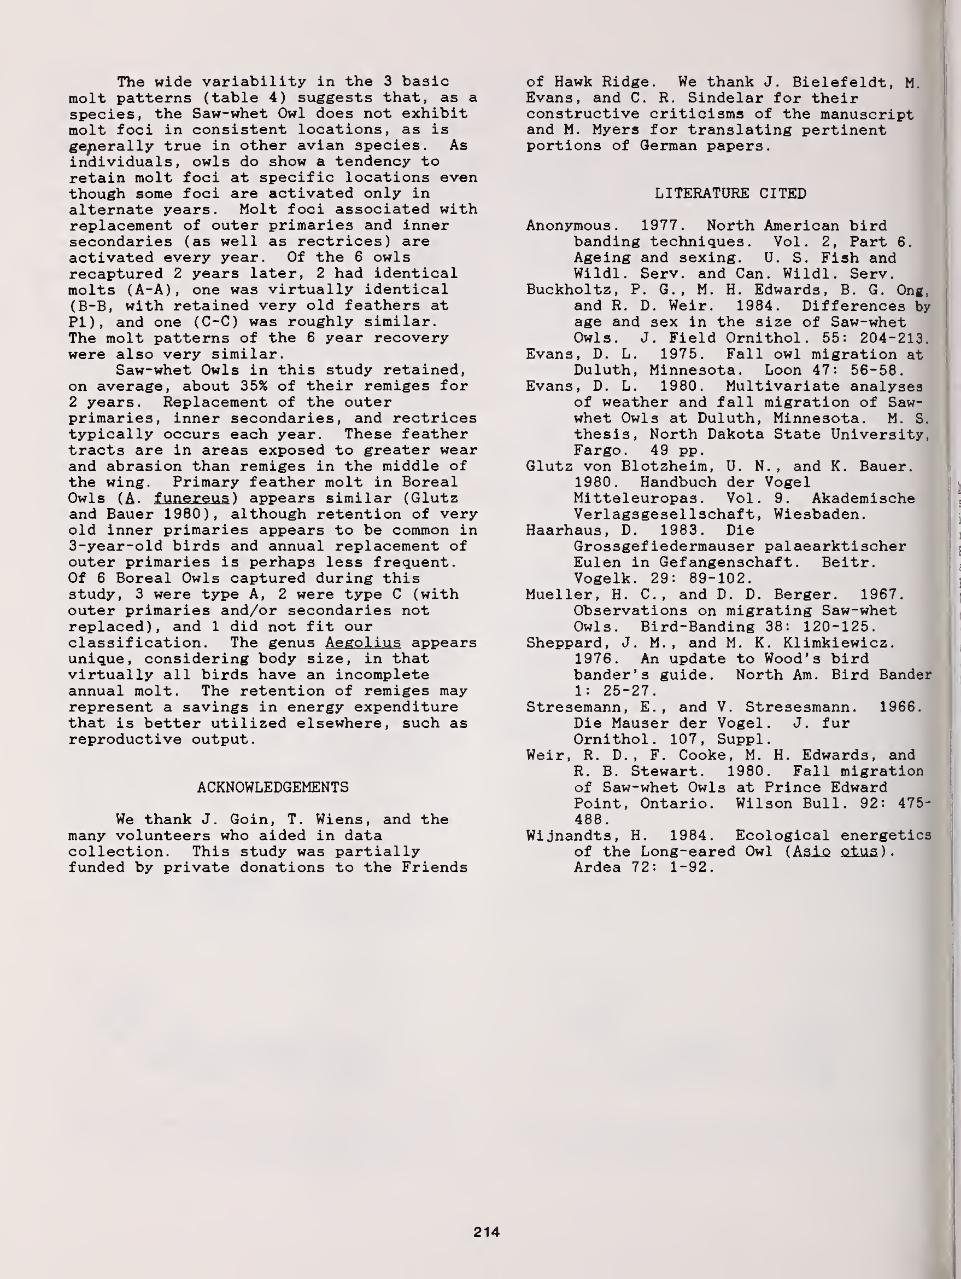
The wide variability in the 3 basicmolt patterns (table 4) suggests that, as aspecies, the Saw-whet Owl does not exhibitmolt foci in consistent locations, as isgenerally true in other avian species. Asindividuals, owls do show a tendency toretain molt foci at specific locations eventhough some foci are activated only inalternate years. Molt foci associated withreplacement of outer primaries and innersecondaries (as well as rectrices) areactivated every year. Of the 6 owlsrecaptured 2 years later, 2 had identicalmolts (A-A), one was virtually identical(B-B, with retained very old feathers atPI), and one (C-C) was roughly similar.The molt patterns of the 6 year recoverywere also very similar.
Saw-whet Owls in this study retained,on average, about 35% of their remiges for2 years. Replacement of the outerprimaries, inner secondaries, and rectricestypically occurs each year. These feathertracts are in areas exposed to greater wearand abrasion than remiges in the middle ofthe wing. Primary feather molt in BorealOwls (A. funereus ) appears similar (Glutzand Bauer 1980), although retention of veryold inner primaries appears to be common in3-year-old birds and annual replacement ofouter primaries is perhaps less frequent.Of 6 Boreal Owls captured during thisstudy, 3 were type A, 2 were type C (withouter primaries and/or secondaries notreplaced), and 1 did not fit ourclassification. The genus Aegolius appearsunique, considering body size, in thatvirtually all birds have an incompleteannual molt. The retention of remiges mayrepresent a savings in energy expenditurethat is better utilized elsewhere, such asreproductive output.
ACKNOWLEDGEMENTS
We thank J. Goin, T. Wiens, and themany volunteers who aided in datacollection. This study was partiallyfunded by private donations to the Friends
of Hawk Ridge. We thank J. Bielefeldt, M.Evans, and C. R. Sindelar for theirconstructive criticisms of the manuscriptand M. Myers for translating pertinentportions of German papers.
LITERATURE CITED
Anonymous. 1977. North American birdbanding techniques. Vol. 2, Part 6.
Ageing and sexing. U. S. Fish andWildl. Serv. and Can. Wildl. Serv.
Buckholtz, P. G., M. H. Edwards, B. G. Ong,and R. D. Weir. 1984. Differences byage and sex in the size of Saw-whetOwls. J. Field Ornithol . 55: 204-213.
Evans, D. L. 1975. Fall owl migration atDuluth, Minnesota. Loon 47: 56-58.
Evans, D. L. 1980. Multivariate analysesof weather and fall migration of Saw-whet Owls at Duluth, Minnesota. M. S.
thesis, North Dakota State University,Fargo. 49 pp.
Glutz von Blotzheim, U. N. , and K. Bauer.1980. Handbuch der VogelMitteleuropas . Vol. 9. AkademischeVerlagsgesellschaft , Wiesbaden.
Haarhaus, D. 1983. DieGrossgefiedermauser palaearktischerEulen in Gefangenschaft . Beitr.Vogelk. 29: 89-102.
Mueller, H. C. , and D. D. Berger. 1967.Observations on migrating Saw-whetOwls. Bird-Banding 38: 120-125.
Sheppard, J. M. , and M. K. Klimkiewicz.1976. An update to Wood's birdbander's guide. North Am. Bird Bander1: 25-27.
Stresemann, E. , and V. Stresesmann. 1966.Die Mauser der Vogel. J. furOrnithol. 107, Suppl.
Weir, R. D. , F. Cooke, M. H. Edwards, andR. B. Stewart. 1980. Fall migrationof Saw-whet Owls at Prince EdwardPoint, Ontario. Wilson Bull. 92: 475-488.
Wijnandts, H. 1984. Ecological energeticsof the Long-eared Owl (Asio. oiiia).Ardea 72: 1-92.
214
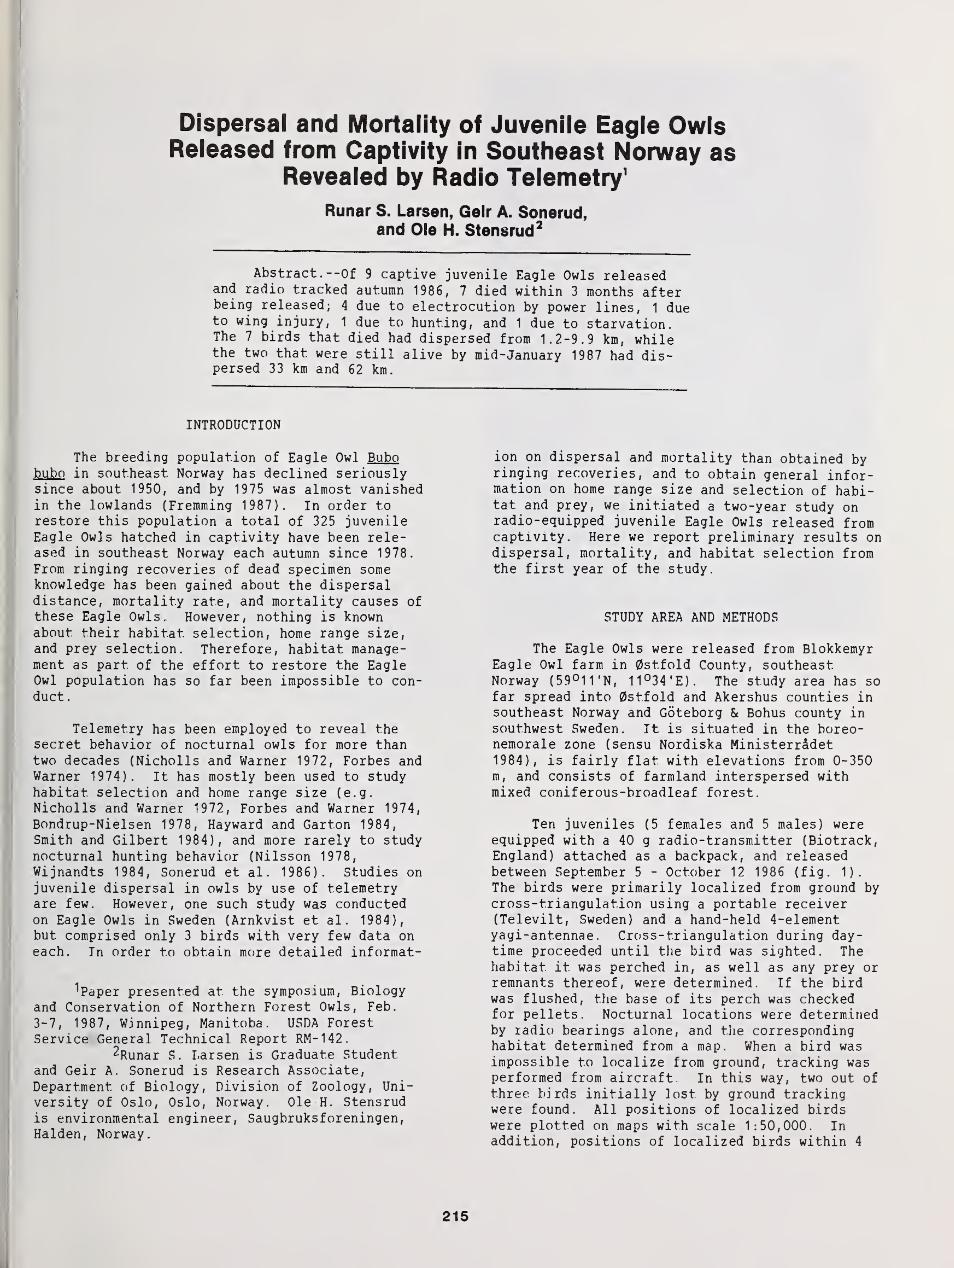
Dispersal and Mortality of Juvenile Eagle OwlsReleased from Captivity in Southeast Norway as
Revealed by Radio Telemetry 1
Runar S. Larsen, Gelr A. Sonerud,and Ole H. Stensrud 2
Abstract . --Of 9 captive juvenile Eagle Owls releasedand radio tracked autumn 1986, 7 died within 3 months afterbeing released; 4 due to electrocution by power lines, 1 dueto wing injury, 1 due to hunting, and 1 due to starvation.The 7 birds that died had dispersed from 1.2-9.9 km, whilethe two that were still alive by mid-January 1987 had dis-persed 33 km and 62 km.
INTRODUCTION
The breeding population of Eagle Owl Bubobubo in southeast. Norway has declined seriouslysince about 1950, and by 1975 was almost vanishedin the lowlands (Fremming 1987). In order torestore this population a total of 325 juvenileEagle Owls hatched in captivity have been rele-ased in southeast Norway each autumn since 1978.
From ringing recoveries of dead specimen someknowledge has been gained about the dispersaldistance, mortality rate, and mortality causes ofthese Eagle Owls. However, nothing is knownabout their habitat selection, home range size,and prey selection. Therefore, habitat manage-ment as part of the effort to restore the EagleOwl population has so far been impossible to con-duct.
Telemetry has been employed to reveal thesecret behavior of nocturnal owls for more thantwo decades (Nicholls and Warner 1972, Forbes andWarner 1974). It has mostly been used to studyhabitat selection and home range size (e.g.
Nicholls and Warner 1972, Forbes and Warner 1974,
Bondrup-Nielsen 1978, Hayward and Garton 1984,Smith and Gilbert 1984), and more rarely to studynocturnal hunting behavior (Nilsson 1978,Wijnandts 1984, Sonerud et al. 1986). Studies onjuvenile dispersal in owls by use of telemetryare few. However, one such study was conductedon Eagle Owls in Sweden (Arnkvist et al. 1984),but comprised only 3 birds with very few data oneach. In order to obtain more detailed informat-
''Paper presented at the symposium, Biologyand Conservation of Northern Forest Owls, Feb.
3-7, 1987, Winnipeg, Manitoba. USDA ForestService General Technical Report RM-142.
^Runar S. I.arsen is Graduate Studentand Geir A. Sonerud is Research Associate,Department of Biology, Division of Zoology, Uni-versity of Oslo, Oslo, Norway. Ole H. Stensrudis environmental engineer, Saugbruksforeningen,Halden, Norway.
ion on dispersal and mortality than obtained byringing recoveries, and to obtain general infor-mation on home range size and selection of habi-tat and prey, we initiated a two-year study onradio-equipped juvenile Eagle Owls released fromcaptivity. Here we report preliminary results ondispersal, mortality, and habitat selection fromthe first year of the study.
STUDY AREA AND METHODS
The Eagle Owls were released from BlokkemyrEagle Owl farm in 0stfold County, southeastNorway (59°H'N, 11°34'E). The study area has sofar spread into 0stfold and Akershus counties insoutheast Norway and Goteborg & Bohus county insouthwest Sweden. It is situated in the boreo-nemorale zone (sensu Nordiska Ministerridet1984), is fairly flat with elevations from 0-350m, and consists of farmland interspersed withmixed coniferous-broadleaf forest.
Ten juveniles (5 females and 5 males) wereequipped with a 40 g radio-transmitter (Biotrack,England) attached as a backpack, and releasedbetween September 5 - October 12 1986 (fig. 1).
The birds were primarily localized from ground bycross-triangulation using a portable receiver(Televilt, Sweden) and a hand-held 4-elementyagi-antennae. Cross-triangulation during day-time proceeded until the bird was sighted. Thehabitat it was perched in, as well as any prey orremnants thereof, were determined. If the birdwas flushed, the base of its perch was checkedfor pellets. Nocturnal locations were determinedby radio bearings alone, and the correspondinghabitat determined from a map. When a bird wasimpossible to localize from ground, tracking wasperformed from aircraft. In this way, two out ofthree birds initially lost by ground trackingwere found. All positions of localized birdswere plotted on maps with scale 1:50,000. Inaddition, positions of localized birds within 4
215
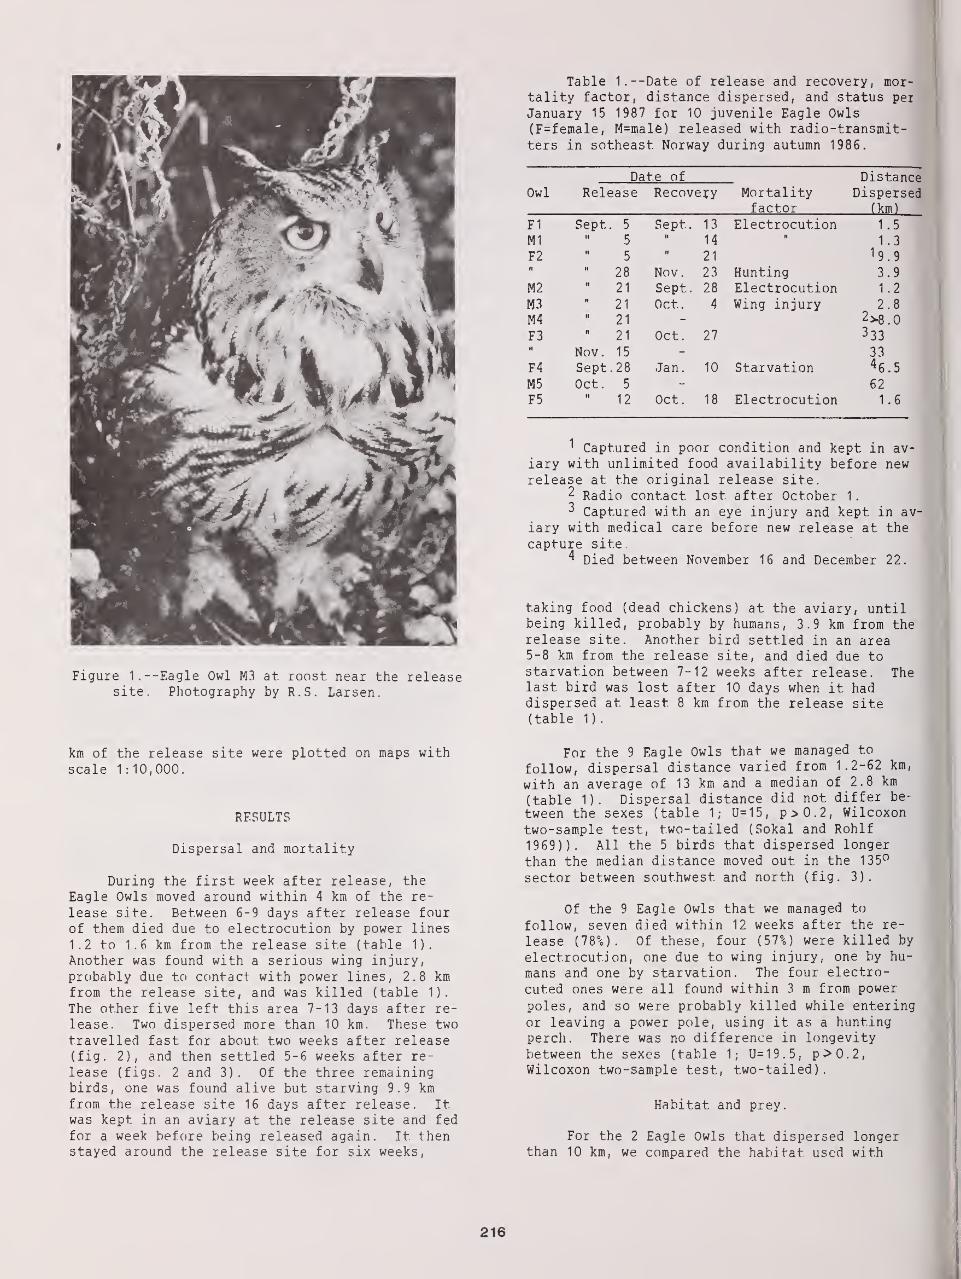
Figure 1. --Eagle Owl M3 at roost near the releasesite. Photography by R.S. Larsen.
km of the release site were plotted on maps withscale 1:10,000.
RESULTS
Dispersal and mortality
During the first week after release, theEagle Owls moved around within 4 km of the re-
lease site. Between 6-9 days after release fourof them died due to electrocution by power lines
1.2 to 1.6 km from the release site (table 1).
Another was found with a serious wing injury,
probably due to contact, with power lines, 2.8 kmfrom the release site, and was killed (table 1).
The other five left this area 7-13 days after re-lease. Two dispersed more than 10 km. These twotravelled fast for about two weeks after release(fig. 2), and then settled 5-6 weeks after re-
lease (figs. 2 and 3). Of the three remainingbirds, one was found alive but starving 9.9 kmfrom the release site 16 days after release. Itwas kept in an aviary at the release site and fed
for a week before being released again. It thenstayed around the release site for six weeks,
Table 1.—Date of release and recovery, mor-tality factor, distance dispersed, and status per
January 15 1987 for 10 juvenile Eagle Owls(F=female, M=male) released with radio-transmit-ters in sotheast Norway during autumn 1986.
Date of DistanceOwl Release Recovery Mortality Dispersed
factor (km)
F1 Sept 5 Sept. 13 Electrocution 1
.
5
M1 5n
14H
1 3
F2 N5
n21 19 9
n It
28 Nov. 23 Hunting 3. 9
M2It
21 Sept. 28 Electrocution 1 2
M3n
21 Oct. 4 Wing injury 2 8
M4ii
21 2*8 0
F3 R 21 Oct. 27 3 33
Nov. 15 33
F4 Sept 28 Jan. 10 Starvation 46 5
M5 Oct. 5 62
F5 12 Oct. 18 Electrocution 1 6
1 Captured in poor condition and kept in av-iary with unlimited food availability before newrelease at the original release site.
2 Radio contact lost, after October 1.
3 Captured with an eye injury and kept in av-
iary with medical care before new release at the
capture site.4 Died between November 16 and December 22.
taking food (dead chickens) at the aviary, untilbeing killed, probably by humans, 3.9 km from therelease site. Another bird settled in an area5-8 km from the release site, and died due tostarvation between 7-12 weeks after release. Thelast bird was lost after 10 days when it haddispersed at least 8 km from the release site(table 1)
.
For the 9 Eagle Owls that we managed to
follow, dispersal distance varied from 1.2-62 km,
with an average of 13 km and a median of 2.8 km
(table 1). Dispersal distance did not differ be-
tween the sexes (table 1; U=15, p>0.2, Wilcoxon
two-sample test, two-tailed (Sokal and Rohlf
1969)). All the 5 birds that dispersed longer
than the median distance moved out in the 135°
sector between southwest and north (fig. 3).
Of the 9 Eagle Owls that we managed to
follow, seven died within 12 weeks after the re-
lease (18%). Of these, four (57%) were killed by
electrocution, one due to wing injury, one by hu-
mans and one by starvation. The four electro-
cuted ones were all found within 3 m from power
poles, and so were probably killed while enteringor leaving a power pole, using it as a huntingperch. There was no difference in longevitybetween the sexes (table 1; U=19.5, p>0.2,Wilcoxon two-sample test, two-tailed)
.
Habitat and prey.
For the 2 Eagle Owls that dispersed longerthan 10 km, we compared the habitat used with
216
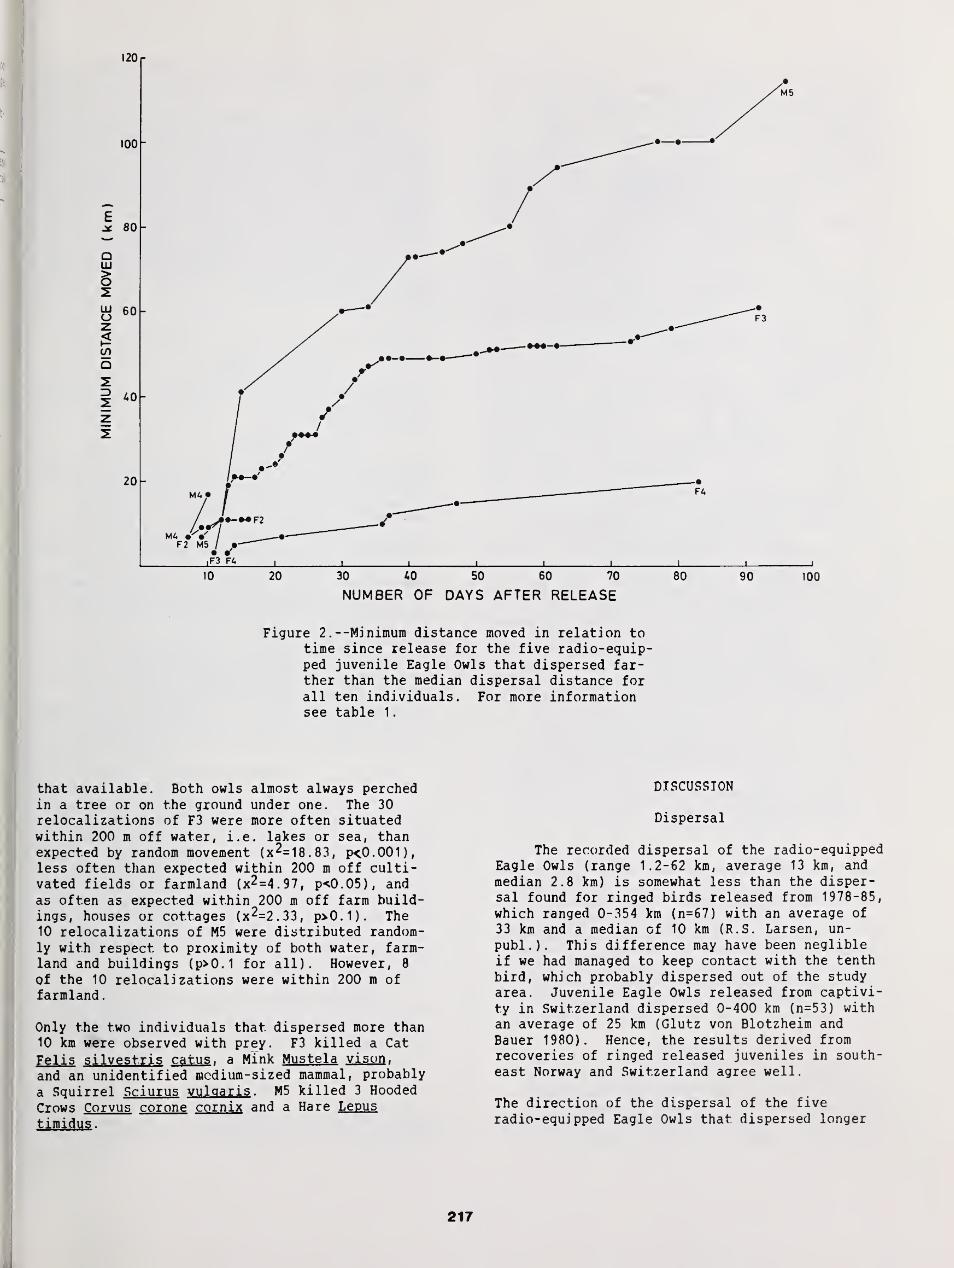
Figure 2. —Minimum distance moved in relation totime since release for the five radio-equip-ped juvenile Eagle Owls that dispersed far-ther than the median dispersal distance forall ten individuals. For more informationsee table 1
.
that available. Both owls almost always perchedin a tree or on the ground under one. The 30relocalizations of F3 were more often situatedwithin 200 m off water, i.e. lakes or sea, thanexpected by random movement (x^=18.83, p<.0.001),
less often than expected within 200 m off culti-vated fields or farmland (x2=4.97, pO.05), andas often as expected within 200 m off farm build-ings, houses or cottages (x2=2.33, p>0.1). The10 relocalizations of M5 were distributed random-ly with respect to proximity of both water, farm-land and buildings (p>0.1 for all). However, 8
of the 10 relocalizations were within 200 m offarmland.
Only the two individuals that dispersed more than10 km were observed with prey. F3 killed a Cat
Felis silvestris catus . a Mink Mustela vison ,
and an unidentified medium-sized mammal, probably
a Squirrel Sciurus vulgaris . M5 killed 3 Hooded
Crows Corvus corone comix and a Hare Lepus
timidus .
DISCUSSION
Dispersal
The recorded dispersal of the radio-equippedEagle Owls (range 1.2-62 km, average 13 km, and
median 2.8 km) is somewhat less than the disper-sal found for ringed birds released from 1978-85,
which ranged 0-354 km (n=67) with an average of
33 km and a median of 10 km (R.S. Larsen, un-
publ.). This difference may have been neglibleif we had managed to keep contact with the tenthbird, which probably dispersed out of the studyarea. Juvenile Eagle Owls released from captivi-ty in Switzerland dispersed 0-400 km (n=53) withan average of 25 km (Glutz von Blotzheim andBauer 1980). Hence, the results derived fromrecoveries of ringed released juveniles in south-
east Norway and Switzerland agree well.
The direction of the dispersal of the five
radio-equipped Eagle Owls that dispersed longer
217
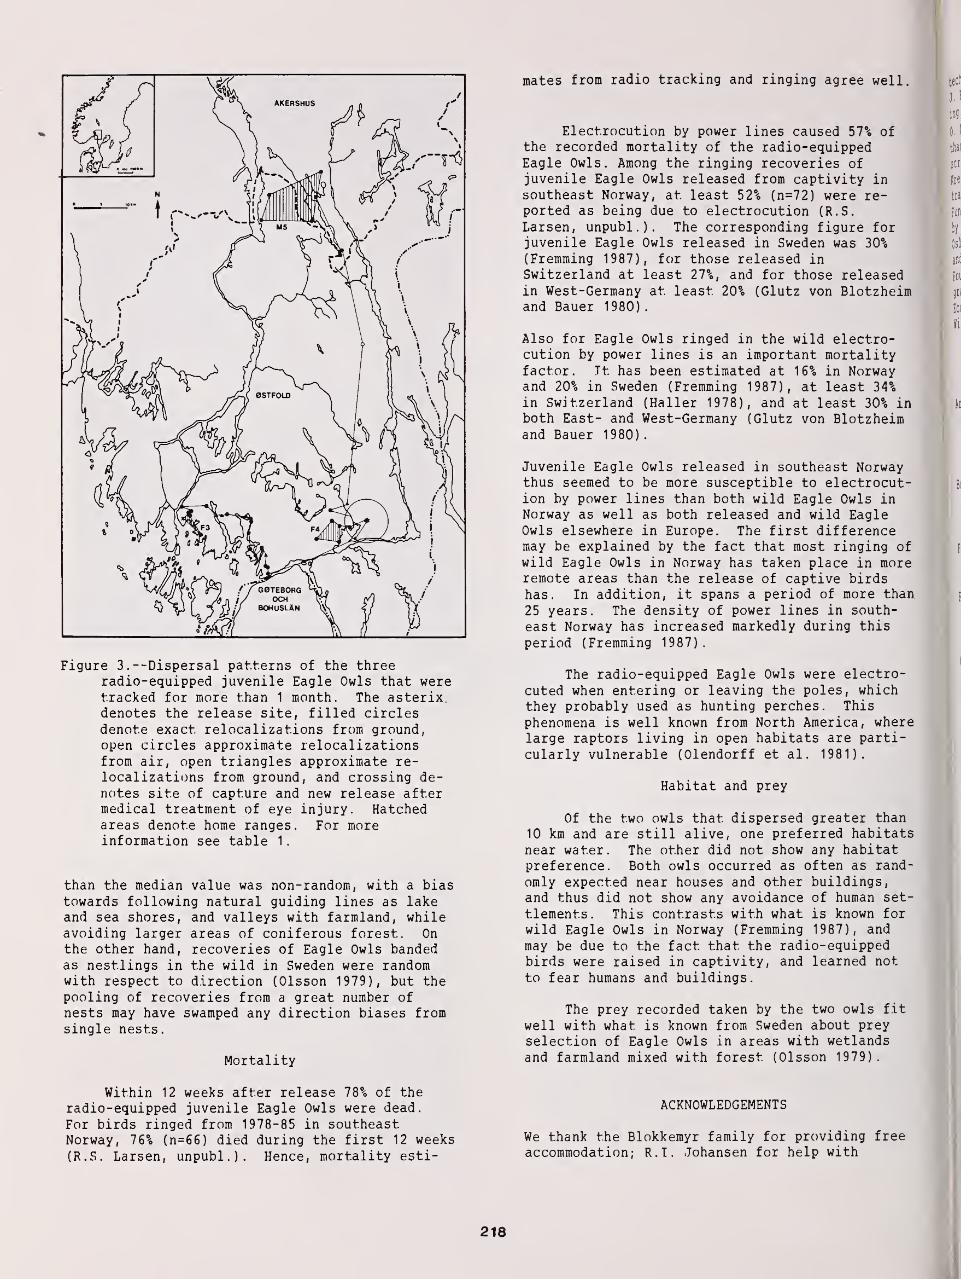
Figure 3 . --Dispersal patterns of the threeradio-equipped juvenile Eagle Owls that weretracked for more than 1 month. The asterix.denotes the release site, filled circlesdenote exact, relocalizations from ground,open circles approximate relocalizationsfrom air, open triangles approximate re-localizations from ground, and crossing de-notes site of capture and new release aftermedical treatment of eye injury. Hatchedareas denote home ranges. For moreinformation see table 1
.
than the median value was non-random, with a biastowards following natural guiding lines as lakeand sea shores, and valleys with farmland, whileavoiding larger areas of coniferous forest. Onthe other hand, recoveries of Eagle Owls bandedas nestlings in the wild in Sweden were randomwith respect to direction (Olsson 1979), but thepooling of recoveries from a great number ofnests may have swamped any direction biases fromsingle nests.
Mortality
Within 12 weeks after release 78% of theradio-equipped juvenile Eagle Owls were dead.
For birds ringed from 1978-85 in southeastNorway, 76% (n=66) died during the first 12 weeks
(R.S. Larsen, unpubl . ) . Hence, mortality esti-
mates from radio tracking and ringing agree well.
Electrocution by power lines caused 57% ofthe recorded mortality of the radio-equippedEagle Owls. Among the ringing recoveries ofjuvenile Eagle Owls released from captivity insoutheast Norway, at. least 52% (n=72) were re-ported as being due to electrocution (R.S.
Larsen, unpubl.). The corresponding figure forjuvenile Eagle Owls released in Sweden was 30%(Fremming 1987), for those released inSwitzerland at least 21%, and for those releasedin West-Germany at. least 20% (Glutz von Blotzheimand Bauer 1980)
.
Also for Eagle Owls ringed in the wild electro-cution by power lines is an important mortalityfactor. It has been estimated at 16% in Norwayand 20% in Sweden (Fremming 1987), at least 34%in Switzerland (Haller 1978), and at least 30% inboth East- and West-Germany (Glutz von Blotzheimand Bauer 1980)
.
Juvenile Eagle Owls released in southeast Norwaythus seemed to be more susceptible to electrocut-ion by power lines than both wild Eagle Owls inNorway as well as both released and wild EagleOwls elsewhere in Europe. The first differencemay be explained by the fact that most ringing ofwild Eagle Owls in Norway has taken place in moreremote areas than the release of captive birdshas. In addition, it spans a period of more than
25 years. The density of power lines in south-
east Norway has increased markedly during this
period (Fremming 1987).
The radio-equipped Eagle Owls were electro-cuted when entering or leaving the poles, whichthey probably used as hunting perches. This
phenomena is well known from North America, wherelarge raptors living in open habitats are parti-cularly vulnerable (Olendorff et al . 1981).
Habitat and prey
Of the two owls that dispersed greater than10 km and are still alive, one preferred habitatsnear water. The other did not show any habitatpreference. Both owls occurred as often as rand-
omly expected near houses and other buildings,and thus did not show any avoidance of human set-
tlements. This contrasts with what is known forwild Eagle Owls in Norway (Fremming 1987), and
may be due to the fact that the radio-equippedbirds were raised in captivity, and learned not
to fear humans and buildings.
The prey recorded taken by the two owls fit
well with what is known from Sweden about preyselection of Eagle Owls in areas with wetlandsand farmland mixed with forest (Olsson 1979).
ACKNOWLEDGEMENTS
We thank the Blokkemyr family for providing free
accommodation; R.T. Johansen for help with
218
technical equipment; P. Berglund, K. Engdahl andJ. Eriksen for assistance during the radio track-ing from ground; and the pilots F. Johnsrud and0. Paulsbo for safe aerial tracking. We alsothank B. Danielson for comments on the manu-script, M. Aas for typing the manuscript, and E.
Kresse for drawing the figures. The radio-transmitters were financed by the World WildlifeFund in Norway; and the radio-receiving equipmentby grants to G.A. Sonerud from the University of
Oslo, the Norwegian Research Council for Scienceand the Humanities (NAVF), and the NansenFoundation. The field work was supported bygrants to R.S. Larsen from the Nordic Council for
Ecology (NCE) and to O.H. Stensrud from the WorldWildlife Fund in Norway.
LITERATURE CITED
Arnkvist, G., H. Danielsson, J. Hjalten, and J.
Moen. 1984. Berguven ( Bubo bubo L.): Ung-faglars spridning och rorelser under forstalevnadsaret - en telemetrisk studie.Graspetten 4: 35-41 (In Swedish).
Bondrup-Nielsen, S. 1978. Vocalizations, nestingand habitat preferences of the Boreal Owl
( Aeqolj us funereus ) in North America. M.
Sc. thesis, University of Toronto.Forbes, J.E., and D.N. Warner. 1974. Behavior
of a radio-tagged Saw-whet Owl. Auk 91:
783-795.
Fremming, O.R. 1987. Population decline of EagleOwl ( Bubo Bubo ) in East Norway 1920-1980.
Viltrapport 40: 1-45. (In Norwegian withsummary in English).
Glutz von Blotzheim, U.N., and K.M. Bauer.
1980. Handbuch der Vogel Mitteleuropas,Vol. 9. Akademische Verlagsgesellschaft,
Wiesbaden.
Haller, H. 1978. Zur Populationsokologie desUhus ( Bubo bubo ) im Hochgebirge: Bestand,Bestandsentwicklung und Lebensraum in denRatischen Alpen. Ornithologische Beobachter75: 237-265.
Hayward, G.D., and E.0. Garton. 1984. Roosthabitat selection by three small forestowls. Wilson Bulletin 96: 690-692.
Nicholls, T.H., and D.W. Warner. 1972. BarredOwl habitat use as determined byradiotelemetry. Journal of WildlifeManagement 36: 213-224.
Nilsson, I.N. 1978. Hunting in flight by TawnyOwls Strix aluco . Ibis 120: 528-531.
Nordiska Ministerradet . 1984. Naturgeografiskregionindelning av Norden. Berlings, Arlov.(In Danish and Swedish with summaries inEnglish)
.
Olendorff, R.R., A.D. Miller, and R.N. Lehman.1981. Suggested practices for raptor pro-tection on power lines. Raptor ResearchReport No. 4.
Olsson, V. 1979. Studies on a population ofEagle Owls, Bubo bubo (L.), in southeastSweden. Viltrevy 11: 1-99.
Smith, D.G. , and R. Gilbert. 1984. EasternScreech-Owl home range and use of suburbanhabitats in southern Connecticut. Journalof Field Ornithology 55: 322-329.
Sokal, R.R., and F.J. Rohlf. 1969. Biometry.Freeman, San Francisco.
Sonerud, G.A., R. Soineim, and B.V. Jacobsen.1986. Home-range use and habitat selectionduring hunting in a male Tengmalm's OwlAeqolius funereus . Fauna Norvegica, Ser. C,
Cinclus 9: 100-106.
Winjandts, H. 1984. Ecological energetics of theLong-eared Owl (Asio otus ) . Ardea 72: 1-92.
219
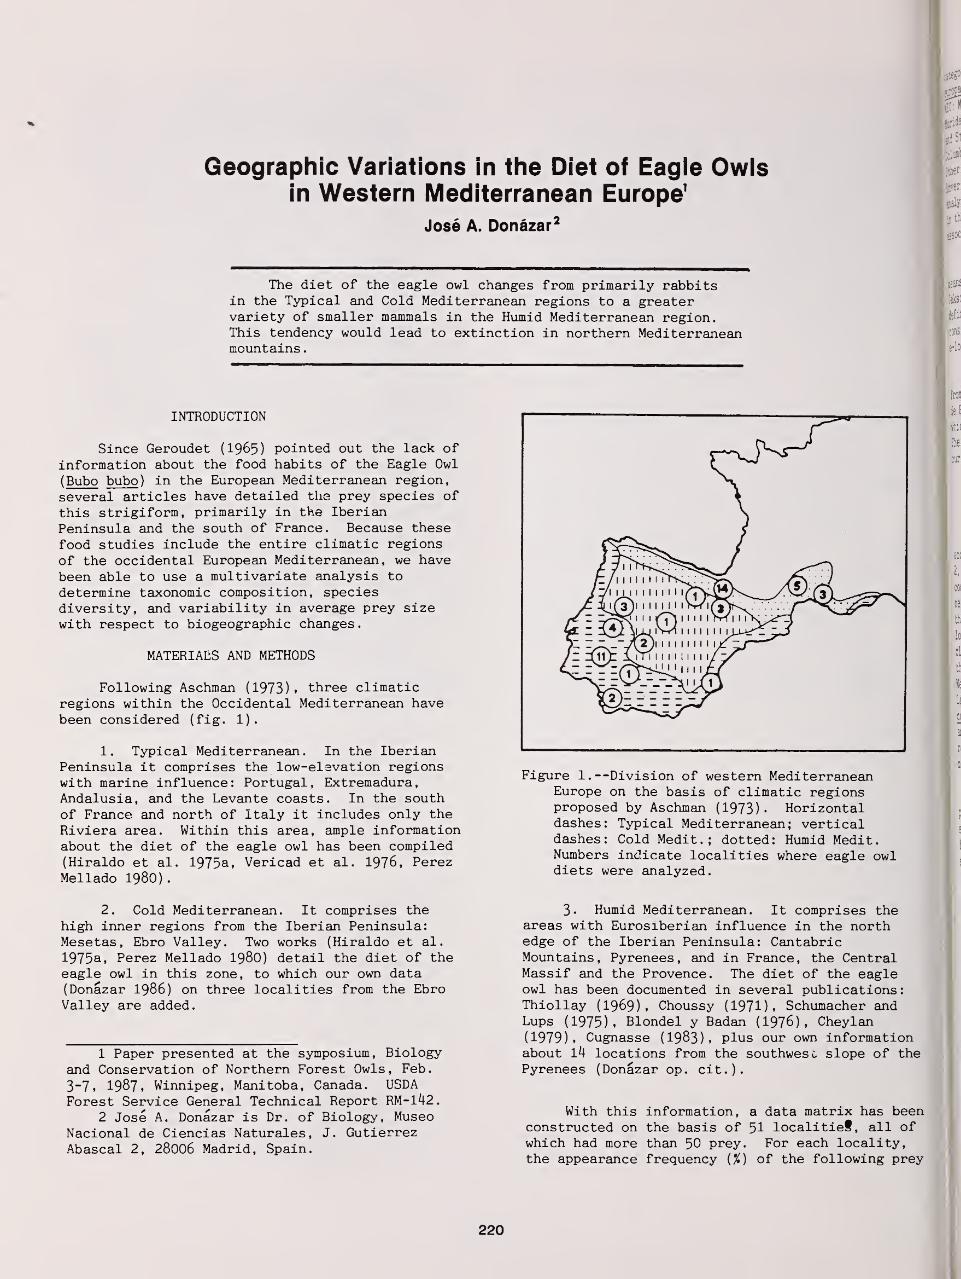
Geographic Variations in the Diet of Eagle Owlsin Western Mediterranean Europe1
Jose A. Donazar 2
The diet of the eagle owl changes from primarily rabbitsin the Typical and Cold Mediterranean regions to a greatervariety of smaller mammals in the Humid Mediterranean region.This tendency would lead to extinction in northern Mediterraneanmountains
.
INTRODUCTION
Since Geroudet (1965) pointed out the lack ofinformation about the food habits of the Eagle Owl
( Bubo bubo ) in the European Mediterranean region,
several articles have detailed the prey species of
this strigiform, primarily in the IberianPeninsula and the south of France. Because these
food studies include the entire climatic regions
of the occidental European Mediterranean, we havebeen able to use a multivariate analysis to
determine taxonomic composition, speciesdiversity, and variability in average prey sizewith respect to biogeographic changes.
MATERIALS AND METHODS
Following Aschman (1973). three climaticregions within the Occidental Mediterranean havebeen considered (fig. 1).
1. Typical Mediterranean. In the IberianPeninsula it comprises the low-elevation regionswith marine influence: Portugal, Extremadura,Andalusia, and the Levante coasts. In the southof France and north of Italy it includes only the
Riviera area. Within this area, ample informationabout the diet of the eagle owl has been compiled(Hiraldo et al. 1975a, Vericad et al. 1976, PerezMellado 1980)
.
2. Cold Mediterranean. It comprises thehigh inner regions from the Iberian Peninsula:Mesetas, Ebro Valley. Two works (Hiraldo et al.
1975a, Perez Mellado 1980) detail the diet of theeagle owl in this zone, to which our own data(Donazar 1986) on three localities from the EbroValley are added.
1 Paper presented at the symposium, Biologyand Conservation of Northern Forest Owls, Feb.
3-7, 1987, Winnipeg, Manitoba, Canada. USDAForest Service General Technical Report RM-142.
2 Jose A. Donazar is Dr. of Biology, MuseoNacional de Ciencias Naturales, J. GutierrezAbascal 2, 28006 Madrid, Spain.
Figure 1.—Division of western MediterraneanEurope on the basis of climatic regionsproposed by Aschman (1973)- Horizontaldashes: Typical Mediterranean; verticaldashes: Cold Medit.; dotted: Humid Medit.Numbers indicate localities where eagle owldiets were analyzed.
3. Humid Mediterranean. It comprises theareas with Eurosiberian influence in the northedge of the Iberian Peninsula: CantabricMountains, Pyrenees, and in France, the CentralMassif and the Provence. The diet of the eagleowl has been documented in several publications:Thiollay (1969), Choussy (1971), Schumacher andLups (1975), Blondel y Badan (1976), Cheylan(1979), Cugnasse (1983), plus our own informationabout lk locations from the southwest slope of thePyrenees (Donazar op. cit.).
With this information, a data matrix has beenconstructed on the basis of 51 localitief , all ofwhich had more than 50 prey. For each locality,the appearance frequency (%) of the following prey
220
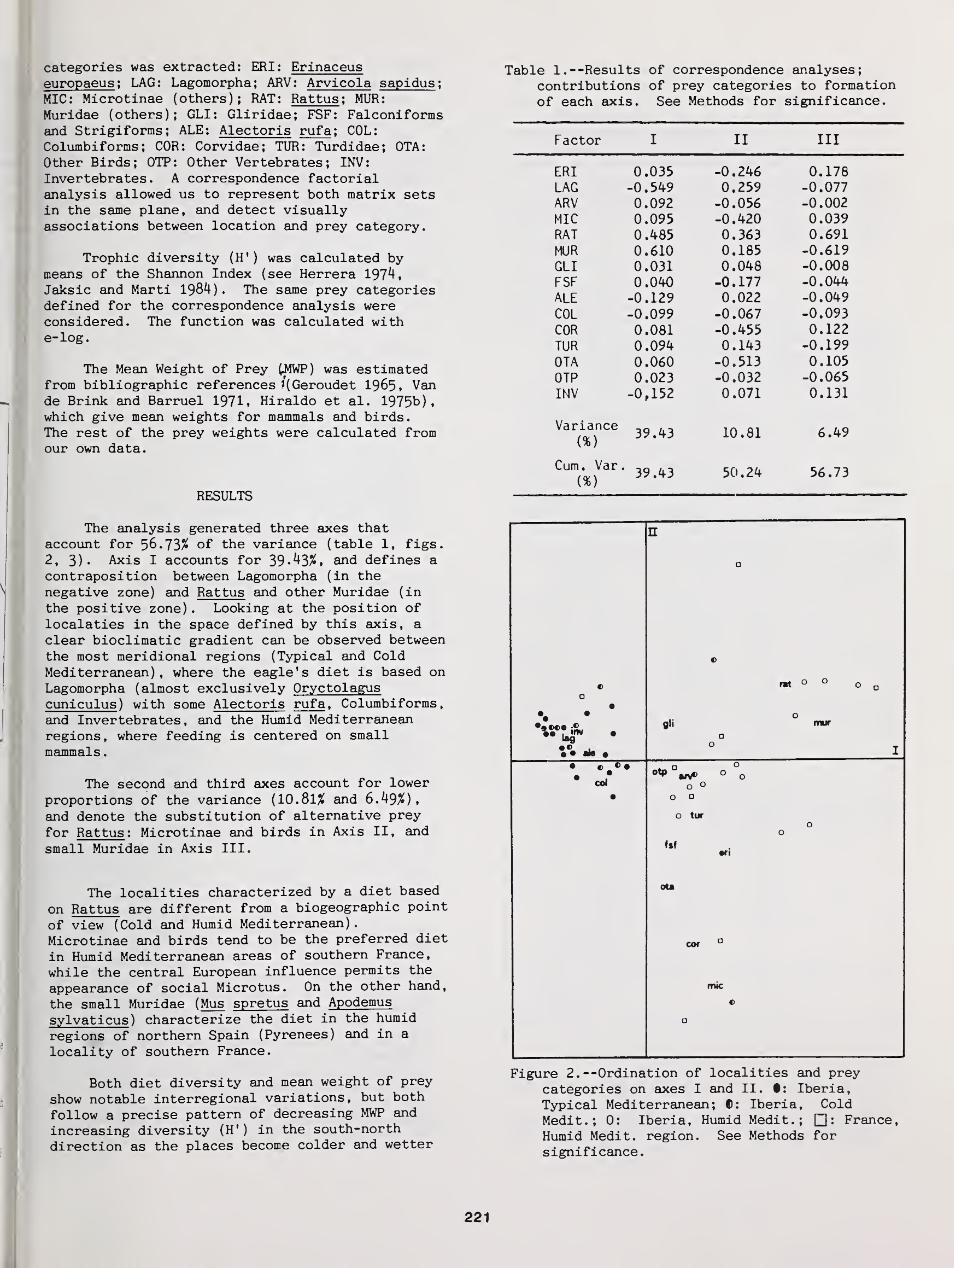
categories was extracted: ERI: Erinaceuseuropaeus ; LAG: Lagomorpha; ARV: Arvicola sapidus ;
MIC: Microtinae (others); RAT: Rattus ; MUR:
Muridae (others); GLI: Gliridae; FSF: Falconiformsand Strigiforms; ALE: Alectoris rufa ; COL:Columbiforms; COR: Corvidae; TUR: Turdidae; OTA:Other Birds; OTP: Other Vertebrates; INV:
Invertebrates. A correspondence factorialanalysis allowed us to represent both matrix setsin the same plane, and detect visuallyassociations between location and prey category.
Trophic diversity (H' ) was calculated bymeans of the Shannon Index (see Herrera 197^,Jaksic and Marti 1984). The same prey categoriesdefined for the correspondence analysis wereconsidered. The function was calculated withe-log.
The Mean Weight of Prey (J4WP) was estimatedfrom bibliographic references *(Geroudet 1965, Vande Brink and Barruel 1971, Hiraldo et al. 1975b),which give mean weights for mammals and birds.The rest of the prey weights were calculated fromour own data.
RESULTS
Table 1.—Results of correspondence analyses;contributions of prey categories to formationof each axis. See Methods for significance.
rdl< I/UI TX TT11 TTT
FRT U .vj j J _fi ?46—U . LTD 0 1 7ftU . X / 0
1 AH -0 549 0 ?59 -0 077ARVrw\ v 0 09? -0 056 -0 002MTf 0 095 -0 420 0 039RATi\r\ 1 0 485 0 363 0.691Ml IR 0 610 0 185 -0.619
GLI 0.031 0.048 -0.008
FSF 0.040 -0.177 -0.044
ALE -0.129 0.022 -0.049
COL -0.099 -0.067 -0.093
COR 0.081 -0.455 0.122TUR 0.094 0.143 -0.199
OTA 0.060 -0.513 0.105OTP 0.023 -0.032 -0.065
INV -0,152 0.071 0.131
Variance39.43 10.81 6.49
Cum. Var
.
39.43 50.24 56.73
The analysis generated three axes thataccount for 56.73# of the variance (table 1, figs.
2, 3). Axis I accounts for 39-^3#. and defines acontraposition between Lagomorpha (in thenegative zone) and Rattus and other Muridae (in
the positive zone) . Looking at the position oflocalaties in the space defined by this axis, aclear bioclimatic gradient can be observed betweenthe most meridional regions (Typical and ColdMediterranean), where the eagle's diet is based onLagomorpha (almost exclusively Oryctolaguscuniculus ) with some Alectoris rufa , Columbiforms
,
and Invertebrates, and the Humid Mediterraneanregions, where feeding is centered on smallmammals
.
The second and third axes account for lower
proportions of the variance (10.8l# and 6A9%),and denote the substitution of alternative prey
for Rattus: Microtinae and birds in Axis II, and
small Muridae in Axis III.
The localities characterized by a diet based
on Rattus are different from a biogeographic point
of view (Cold and Humid Mediterranean).
Microtinae and birds tend to be the preferred diet
in Humid Mediterranean areas of southern France,
while the central European influence permits the
appearance of social Microtus. On the other hand,
the small Muridae (Mus spretus and Apodemus
sylvaticus ) characterize the diet in the humid
regions of northern Spain (Pyrenees) and in a
locality of southern France.
Both diet diversity and mean weight of prey
show notable interregional variations, but both
follow a precise pattern of decreasing MWP and
increasing diversity (H 1
) in the south-north
direction as the places become colder and wetter
a•
•
*• lag*
V. m .
ii
0
c
rat 0 00 D
0gli mur
I
• c »•* col
•
0otP arv* 0 0
0 00 0
0 tur0
0
fsfan
ota
cor D
mic
0
Figure 2.—Ordination of localities and preycategories on axes I and II. t: Iberia,
Typical Mediterranean; 0: Iberia, ColdMedit.; 0: Iberia, Humid Medit.; : France,Humid Medit. region. See Methods forsignificance.
221
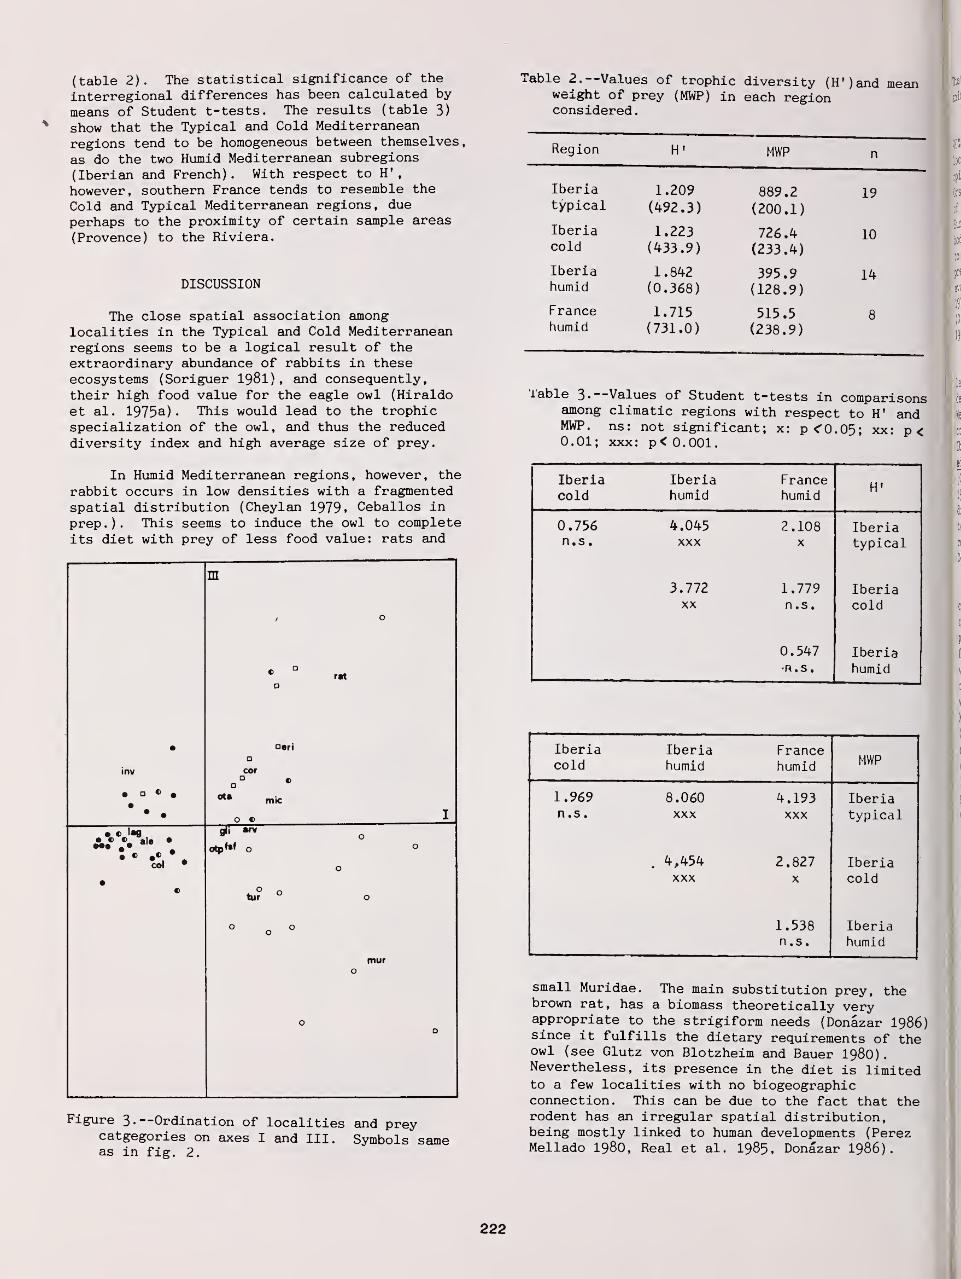
(table 2). The statistical significance of the
interregional differences has been calculated by
means of Student t-tests. The results (table 3)
show that the Typical and Cold Mediterranean
regions tend to be homogeneous between themselves,
as do the two Humid Mediterranean subregions
(Iberian and French). With respect to H'
,
however, southern France tends to resemble the
Cold and Typical Mediterranean regions, due
perhaps to the proximity of certain sample areas
(Provence) to the Riviera.
DISCUSSION
The close spatial association amonglocalities in the Typical and Cold Mediterraneanregions seems to be a logical result of theextraordinary abundance of rabbits in theseecosystems (Soriguer 1981), and consequently,their high food value for the eagle owl (Hiraldoet al. 1975a). This would lead to the trophicspecialization of the owl, and thus the reduceddiversity index and high average size of prey.
In Humid Mediterranean regions, however, the
rabbit occurs in low densities with a fragmentedspatial distribution (Cheylan 1979. Ceballos in
prep.
) . This seems to induce the owl to completeits diet with prey of less food value: rats and
•
inv
• • ••
• •
m
> 0
cor
*• mk
0 « ^
•
d! _rv* 0otpHf 0 0
0
0 0
mur0
0
Figure 3 . --Ordination of localities and preycatgegories on axes I and III. Symbols sameas in fig. 2.
Table 2. —Values of trophic diversity (H*)and meanweight of prey (MWP) in each regionconsidered.
Region H' MWP n
Iberia 1.209 889.2 19typical (492.3) (200.1)
Iberia 1.223 726.4 10cold (433.9) (233.4)
Iberia 1.842 395.9 14humid (0.368) (128.9)
France 1.715 515.5 8humid (731.0) (238.9)
i _____^^^^^^^^^
Table 3.—Values of Student t-tests in comparisonsamong climatic regions with respect to H' andMWP. ns: not significant; x: p <0.05; xx: p<0.01; xxx: p< 0.001.
Iberia Iberia Francecold humid humid
H»
0.756 4.045 2.108 Iberian.s
.
xxx X typical
3.772 1.779 IberiaXX n.s. cold
0.547 Iberian.s
.
humid
Iberia Iberia FranceMWPcold humid humid
1.969 8.060 4.193 Iberian.s. xxx xxx typical
. 4,454 2.827 Iberiaxxx X cold
1.538 Iberian.s
.
humid
small Muridae. The main substitution prey, thebrown rat, has a biomass theoretically veryappropriate to the strigiform needs (Donazar 1986)since it fulfills the dietary requirements of theowl (see Glutz von Blotzheim and Bauer 198O)
.
Nevertheless, its presence in the diet is limitedto a few localities with no biogeographicconnection. This can be due to the fact that therodent has an irregular spatial distribution,being mostly linked to human developments (PerezMellado 198O, Real et al. 1985, Donazar 1986)
.
222
That would force the eagle owl to feed on smalleranimals, primarily Microtinae and small Muridae.
One of these species, Mus spretus
,
can reachl\0% of the owl's captures in some Pyreneanlocalities (Donazar 1986) . This contradictsopinions of other authors (Jaksic and Marti 1984,Orsini 1985) , who consider improbable the captureof this small mammal, very common in the westernEuropean Mediterranean region, because of its lowbody weight (not more than 20 g.). Our data tendto indicate that Mus , like other small mammals , ispreyed upon by eagle owls on the basis ofavailability of prey of greater food value (Pyke
1977). as is the case with other birds of prey(Davies 1977, Goss-Custard 1977, Krebs et al.
1977).
The substitution of small mammals for rabbitsleads to an increase in prey diversity anddecrease in mean weight of prey toward the HumidMediterranean region. This tendency is is acommon phenomenon for large predators on theIberian Peninsula: Aquila chrysaetos , A.
adalberti , Hieraaetus fasiciatus, Lynx pardina
(Caldron et al. 1980, Delibes 1980, Alamany et al.
1984 , Garzon et al . 1984 ) . The eagle owl thusdiffers from other European strigiforms, whichtend to fluctuate rapidly in Typical Mediterraneanregions when rodents are scarce (Herrara 1974,Delibes 1975. Manez 1983)
.
This progessive substitution of smaller preycan lead to a loss in hunting efficiency, whichcan cause an energy deficit if the eagle's largerprey are scarce and the energy costs of searchingfor and capturing smaller prey exceed their foodvalue (see Valverde 1967, Schoener 1971). Thisopinion is substantiated by the fact the eagle owlwas partially extinct in certain HumidMediterranean areas (Pyrenees of Navarre, FrenchCentral Massif) due to the epizootic disease,mixomatosis, which caused the virtualdisappearance of the rabbit (Choussy 1971, Purroy1974) . The subsequent recovery of the rabbitpopulation was followed by expansion of the eagleowl range to recover part of the lost area(Bergier y Badan 1979, Cheylan 1979). This seemsto indicate that, in the absence of large prey,the eagle owl is unable to survive on a diet basedexclusively on small mammals. Thus the mountainsof northern Mediterranean regions have a notableparallelism with the nordic ecosystems (taiga)where, in some areas, the eagle owl similarlyconsumes a large proportion of small rodents andhas suffered population losses conditioned by thedisappearance of some larger prey species (Olsson1979, Mysterud and Dunker 1983)
.
ACKNOWLEDGEMENTS
The main part of this work was supported bythe Gobierno Vasco through an FPI grant. Dr. F.
Hiraldo read and made many contructive commentsupon a draft of this paper and on an earlieranalysis of data, presented in thesis form. I
also thank T. Lopez Unzu for the translation intoEnglish.
LITERATURE CITED
Alamany, 0., A. De 3uan, X. Parellada and 3. Real.
1984. Status de l'aliga cuabarrada ( Hieraae -
tus fasciatus ) a Catalunya. Rapinyaires Me-
diterranis 2: 98-108.Aschman, H. 1973. Distribution and peculiarity
of mediterranean ecosystems p. 11-19. In_
Di Castri, F. and H.A. Mooney (eds.) Medite-rranean Type Ecosystems.
Bergier, P and 0. Badan. 1979. Complements sur
la reproduction du Grand-Due (Bubo bubo ) en
Provence. Alauda 47: 271-275.Blondel, 3. and 0. Badan. 1976. La biologie du
Hibou Grand Due en Provence. Nos Oiseaux
33: 189-219.Calderon, 3., M. Delibes and F. Amores. 1980. E
Ecologia y status del aguila real (Aquilachrysaetos L.) en Espana. I Reunion Iberoamer.
Zool. Vert. La Rabida 1977: 705-719.
Cheylan, G. 1979. Recherches sur 1 'organisation
du peuplement de vertebres d'une montagne me-diterraneenne. These Doctorale (unpubl.).
Universite Pierre et Marie Curie. Paris.
Choussy, D. 1971. Etude d'une population de Grands-Ducs Bubo bubo dans le Massif Central. Nos
Oiseaux 31: 37-56.Cugnasse, 3.M. 1983. Contribution a 1 'etude du
Hibou Grand-Due, Bubo bubo , dans le sud du
Massif Central. Nos Oiseaux 37: 117-128.
Davies, N.B. 1977. Prey selection and the search
strategy of c the spotted flycatcher.
(
Muscicapastriata ) : a field study on optimal foraging.
Anim. Behav. 25: 1016-1033.Delibes, M. 1975. Some characteristics features
of predation in Mediterranean Ecosystems.
Proc. XI Int. Cong. Game. Biol. Lisboa.
Delibes, M. 1980. El lince iberico. Ecologia y
comportamiento alimenticios en el Coto Donana,
Huelva. Donana, Acta Vertebrata 7-3.
Donazar, 3. A. 1986. El buho real ( Bubo bubo L.)
en Navarra: Poblacion, analisis de la distri-
bucion, ecologia trofica, reproduccion y cre-
cimiento. Tesis Doctoral (unpubl.). Univer-sidad de Navarra.
Garzon, 3., L.M. Gonzalez, 3.L. Gonzalez anf F.
Hiraldo. 1984. Situacion actual y problema-
tica del iguila imperial iberica ( Aquila adal -
berti BREMH, 1861) en Espana. RapinyairesMediterranis 2: 60-69.
Geroudet, P. 1965. La vie des oiseaux. Delachaux
et Niestle. Neuchatel.Glutz von Blotzheim, U.N. and K . Bauer. 1980.
Handbuch der Vogel Mitteleuropas. Vol. 9.
Columbiformes-Piciformes . Akademische Verlags-
geseUschaft . , Weisbaden
.
Goss-Custard, 3.D. 1977. Optimal foraging and
the size selection of worms by redshank, Trin -
qa totanus , in the field. Anim. Behav. 25:
10-29.
Herrera, CM. 1974. Trophic diversity of the Barn
Owl Tyto alba in Continental Western Europe.
Ornis Scand . 7: 29-4-1.
Hiraldo, F., 3. Andrada and F.F. Parreno. 1975 a.
Diet of Eagle Owl Bubo bubo in MediterraneanSpain. Donana, Acta Vertebrata 2: 161-177.
Hiraldo, F., F. Fernandez and F. Amores. 1975 b.
Diet of Montagus' Harrier ( Circus pygargus )
in southwestern Spain. Donana, Acta Verte-brata 2: 25-55.
223
Hiraldo, F., F.F. Parreno, V. Andrada and F. Amo-res. 1976. Variations in the food habitsof the european Eagle Owl (Bubo bubo ) . Do-nana, Acta Vertebrata 3: 137-156.
Oaksic, F.M. and CD. Marti. 1984. Comparativefood habits of Bubo owls in Mediterran-typeecosystems. Condor 86: 288-296.
Krebs, 3.R., 3.T. Erichsen, M.I. Webber and E.L.Charnov. 1977. Optimal prey selection inthe great tit (Parus major ) . Anim. Behav.25: 30-38.
Mafiez, M. 1983. Variaciones geograficas y esta-cionales en la dieta del mochuelo comun(Athene noctua ) eh Espana. XV Congr. Int.Fauna Cinegetica y Silvestre, Trujillo 1981:617-634.
Mysterud, I. and H. Dunker. 1983. Food and Nes-ting Ecology of the Eagle Owl, Bubo bubo (L.)
in Four Neighbouring Territories in SouthernNorway. Viltrevy 12: 71-113.
Olsson, V. 1979. Studies on a population ofEagle Owls. Viltrevy 11: 1-99
Orsini, P. 1985. Le regime alimentaire du hibougrand due Bubo bubo en Provence. Alauda 53:11-28.
Perez Mellado, V. 1980. Alimentacion del buhoreal ( Bubo bubo ) en Espana Central. Ardeola25: 93-112 .
Purroy, F.3. 1974. Fauna navarra en peligro de
extincion. Ediciones y Libros. Pamplona.Pyke, G.H., H.R. Pulliam and E.L. Charnov. 1977.
Optimal foraging : A selective review of the-
ory and tests. Q. Rew. Biol. 52: 137-154Real, 3., A. Galobart and 3. Fernandez. 1985.
Estudi preliminar d'una poblacio de due Bubobubo al Valles i Bages. l£ El Medi Naturaldel Valles. I Coloqui de Naturalistes Valle-sans. Annals del C.E.E.M. n^ 1 Sabadell:175-187.
Schoener, T.W. 1971. Theory of feeding strate-gies. Annu. Rev. Ecol. Syst. 2: 369-404.
Schumacher, E. and P. Lups. 1975. Angaben zurErnahrung des Uhus Bubo bubo (L. 1758) in
der Provence (Sudfrankreich ) . 3ahrb. derNaturhist. Mus. Bern. 5: 217-222.
Soriguer, R. 1981. Biologia y dinamica de unapoblacion de conejos (Oryctolagus cuniculus ,
L.) en Andalucia Occidental. Donana, ActaVertebrata 8-3.
Thiollay, 3.M. 1969. Essai sur les rapaces du
midi de la France. Distribution-ecologie
.
Hibou Grand-Due Bubo bubo bubo L.. Alauda37: 15-27.
Valverde, 3.A. 1967. Estructura de una comunidadmediterranea de vertebrados terrestres. 13
monografia de la Estacion Biologica de Dona-
na. C.S.I.C. Madrid.Van de Brink, F.H. and P. Barruel. 1971. Guia
de campo de los mamiferos salvajes de Europa
Occidental. Ediciones Omega, Barcelona.
Vericad, 3,R., A. Escarre and E. Rodriguez. 1976.
Datos sobre la dieta de Tyto alba y Bubo bubo
en Alicante (SE de Iberia)"! Mediterranea 1:
47-59.
224
Addled Eggs in Great Horned Owl Nestsin Saskatchewan 1
C. Stuart Houston? Roy D. Crawford? and Donald S. Houston4
Abstract.— In visits to 1716 nests o-f the Great HornedOwl, addled eggs were present in -from 1.2 to 9. Z7. o-f
successful nests, and in another 11 nests without young.Addled eggs (4 o-f 5 opened contained identifiable deadembryos) were most common in years of poor reproductivesuccess.
INTRODUCTION
Comprehensive studies of reproductive failure
in domestic fowl, a matter of great economic
importance, have been carried out for over 100
years. A landmark paper by Riddle (1930) studied
doves, pigeons and domestic fowl and reported that
the embryos of all showed "two distinct periods of
high mortality ... very early in development and
... very near the end of incubation." After a
detailed list of possible causes of embryo death,
Riddle concluded that thick shells, "the very
device ... utilized by eggs to prevent water-
loss— and avoid death in the final period— may too
greatly affect respiratory exchange and thus cause
death in the early period." Insko and Martin (1935)
found that for White Leghorn chick embryos, the
peaks of mortality fell on the 2nd and 19th days of
a 21-day incubation and for Bronze Turkey embryos
on the 4th and 25th days of a 28-day incubation.
Ricklefs (1969) reported that the incidence of
unhatched eggs averaged 8'/. in six species of
passerine birds. Little has been written about
this problem in North American raptors. The
incidence of unhatched eggs of the Red-tailed Hawk,
Buteo iamaicensis . Northern Goshawk, Accioiter
aenti 1 is . Prairie Falcon, Falco mexi canus . and
Screech Owl, Asio otus . has been reported as 47.,
10'/., 117., and 187., respectively (Luttitch et al
1971; McGowan 1975; Ogden & Hornocker 1977; Klaas
and Swinef ord 1976)
.
*Paper presented at the symposium,
Biology and Conservation of Northern Forest Owls,
Feb. 3-7, 1987, Winnipeg, Manitoba. USDA Forest
Service General Technical Report RM-142.2 Stuart Houston is Professor of Medical
Imaging, University of Saskatchewan, Saskatoon,
Sask. 3 Roy Crawford is Professor of Animal and
Poultry Science, University of Saskatchewan,
Saskatoon, Sask. *Donald Houston is resident
in medicine, Health Sciences Centre, University of
Manitoba, Winnipeg, Man.
We studied hatching failure in the Great
Horned Owl, Bubo virqinianus . as measured by the
frequency of addled eggs encountered during visitsto 1727 active nests in Saskatchewan. Hatchingfailure (Ricklefs 1969) can result from:
1 . Inf erti le eggs
2. Death of initially viable eggs (usually early
in incubation)3. Death of a fully-formed chick at or during
hatching.CNest failure with egg loss, beyond Ricklefs
definition of hatching failure, can also result
from death of the adult owls, desertion (Southern
1970) or predation (Lundberg 1985), but in owls it
should rarely be due to parasitic infestation, nest
site competition or severe storms, and never to
brood par asi ti sm. ]
We follow standard dictionaries in equating
addled and rotten as synonymous. We do not have
enough data to be as specific as Campbell and Lack
(1985) who, without citing any authority for their
decision, define an addled egg as one "in which the
developing embryo has died, as opposed to an
infertile egg in which no development has taken
place." Although we presume that an infertile egg
would "dry down" rapidly during incubation and
might break before fertile eggs had hatched and
before bacterial growth could proceed to the
"slosh" stage, we nevertheless have only
preliminary evidence to suggest that most or all
addled eggs represent embryo death.
METHODS
The senior author and his many volunteer
assistants have recorded presence or absence of
unhatched eggs during visits to raptor nests since
1966. Eggs in nests with tiny young were not
disturbed, since hatching is staggered in owls and
such eggs may have been viable. If the smallest
nestling was one week or more old, the egg was
shaken. Eggs that had an audible "slosh" from air
and fluid content (indicating cell death, autolytic
breakdown of membranes, mixing of liquefied yolk
and white, and secondary bacterial overgrowth),
were classed as addled and taken from the nest.
225
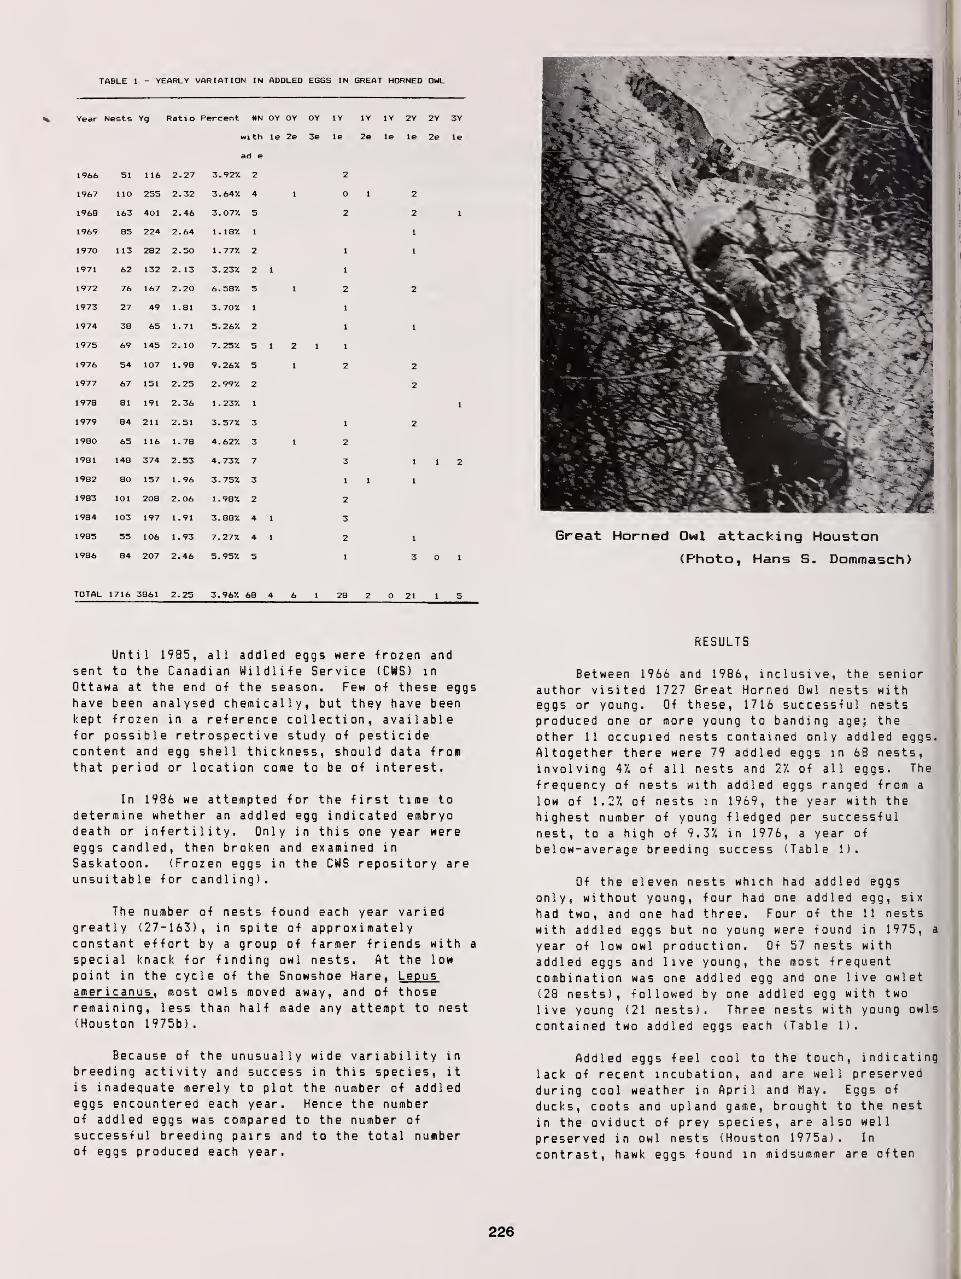
TABLE 1 - YEARLY VARIATION IN ADDLED ESGS IN GREAT HORNED OWL
Year Nests Ratio Percent *N OY OY OY 1Y 1Y 1Y 2Y 2Y 3Y
with le 2e 3e le 2e le le 2e le
ad e
1966 51 116 2.27 3.927. 2 2
1967 110 255 2.32 3.647. 4 1 0 1 2
1968 163 401 2.46 3.077. 5 2 2 . 1
1969 85 224 2.64 1. 187. 1 1
1970 113 282 2.50 1 . 777. 2 1 1
1971 62 132 2. 13 3.237. 2 1 1
1972 76 167 2.20 6.587. 5 1 2 2
1973 27 49 1.81 3.707. 1 1
1974 38 65 1.71 5.267. 2 1 1
1975 69 145 2. 10 7.257. 5 1 2 1 1
1976 54 107 1.98 9.267. 5 1 2 2
1977 67 151 2.25 2.997. 2 2
1978 81 191 2.36 1 . 237. 1 1
1979 84 21
1
2.51 3. 577. 3 1 2
1980 65 116 1.78 4.627. 3 1 2
1981 148 374 2.53 4.737. 7 3 1 1 2
1982 80 157 1 . 96 3.757. 3 1 1 1
1983 101 208 2.06 1 . 987. 2 2
1984 103 197 1.91 3.887. 4 1 3
1985 55 106 1.93 7.277. 4 1 2 1
1986 84 207 2.46 5.957. 5 1 3 0 1
TOTAL 1716 3861 2.25 3.967. 68 4 6 1 28 2 0 21 1 5
Great Horned Owl attacking Houston
(Photo, Hans S. Dommasch)
Until 1985, all addled eggs were frozen and
sent to the Canadian Wildlife Service (CMS) in
Ottawa at the end of the season. Few of these eggshave been analysed chemically, but they have been
kept frozen in a reference collection, availablefor possible retrospective study of pesticidecontent and egg shell thickness, should data fromthat period or location come to be of interest.
In 1986 we attempted for the first time to
determine whether an addled egg indicated embryodeath or infertility. Only in this one year wereeggs candled, then broken and examined in
Saskatoon. (Frozen eggs in the CWS repository areunsuitable for candling).
The number of nests found each year variedgreatly (27-163), in spite of approximatelyconstant effort by a group of farmer friends with a
special knack for finding owl nests. At the low
point in the cycle of the Snowshoe Hare, Lepusamer i canus , most owls moved away, and of thoseremaining, less than half made any attempt to nest(Houston 1975b).
Because of the unusually wide variability in
breeding activity and success in this species, it
is inadequate merely to plot the number of addledeggs encountered each year. Hence the numberof addled eggs was compared to the number of
successful breeding pairs and to the total numberof eggs produced each year.
RESULTS
Between 1966 and 1986, inclusive, the seniorauthor visited 1727 Great Horned Owl nests witheggs or young. Of these, 1716 successful nestsproduced one or more young to banding age; the
other 11 occupied nests contained only addled eggs.
Altogether there were 79 addled eggs in 68 nests,
involving 47. of all nests and 27. of all eggs. The
frequency of nests with addled eggs ranged from a
low of 1.27. of nests in 1969, the year with the
highest number of young fledged per successfulnest, to a high of 9.37. in 1976, a year of
below-average breeding success (Table 1).
Of the eleven nests which had addled eggs
only, without young, four had one addled egg, six
had two, and one had three. Four of the 11 nests
with addled eggs but no young were found in 1975, a
year of low owl production. Of 57 nests with
addled eggs and live young, the most frequent
combination was one addled egg and one live owlet
(28 nests), followed by one addled egg with two
live young (21 nests). Three nests with young owls
contained two addled eggs each (Table 1).
Addled eggs feel cool to the touch, indicating
lack of recent incubation, and are well preserved
during cool weather in April and May. Eggs of
ducks, coots and upland game, brought to the nest
in the oviduct of prey species, are also well
preserved in owl nests (Houston 1975a). In
contrast, hawk eggs found in midsummer are often
226
exposed to ambient temperatures as high as 40° C.
Excessive decomposition and bacterial overgrowth
may make it impossible to detect embryonic remnants(Houston, Fox, Crawford, Oliphant, mss.)
In 1986, the only year in which owl eggs were
sacrificed for direct examination, three contained
a small embryo, indicating failure early in
incubation. One contained a fully formed dead
embryo with pinfeathers and a prominent egg tooth.
One egg contained no recognizable embryonic
mater i al
.
The years with the most nests and most eggs
per nest were the years with the lowest proportion
of addled eggs, while years of fewer nests and
fewer eggs per nest had a higher proportion of
addled eggs. Regression analysis reveals a
significant negative correlation (p < 0 . 0 1 ) between
the percentage of addled eggs and the number of
young per nest (Figure 1). This correlation is
only moderately strong, with an r value of 0.51.
In a year of bel cw-aver age owl success (Houston
1971), the increased percentage of addled eggs is
only one of the measures of poor reproductive
performance.
DISCUSSION
In spite of early nesting under extremeclimatic conditions, and cyclic variability in
numbers of its main prey species, the 6reat HornedOwl has an unusually low incidence of addled eggs.
However, there is a significant inverse relationbetween the annual proportion of addled eggs and
the average number of young produced per successful
nest that year -- which in turn is related to food
availability. This is a natural phenomenon; given
a herbivorous prey species in late winter, there is
little potential for accumulation of biocides.
Brief interruptions of incubation, obligatoryeven in the coldest weather, cause no harm because
"the avian blastoderm is capable of withstanding a
relatively severe degree of cold" (Romanoff). We
have not observed any obvious correlation with
inclement weather, but we have not done regression
calculations against weather variables such as
temperature and snow depth. In fact, we have
observed a Great Horned Owl incubating two eggs
successfully through temperatures as low as -34 C.
(Houston 1965). We hypothesize that a normal
degree of cold might have adverse consequences only
in years when the male brings insufficient food to
the incubating female who is thereby forced to
leave the nest for longer than normal periods to
obtain food for herself.
Results from random visits to owl nests are
not directly comparable to results of poultry
science research. In the laboratory, a failed egg
is studied before decomposition sets in. In the
field, the addled egg that "sloshes" teems with
bacteria; decomposition may have been under way for
many weeks. Nevertheless, our small sample of five
rotten eggs in 1986 suggests that such eggs are
more commonly the result of embryo death than
infertility. We encountered three instances of
early and one of late embryo death, roughlyconsistent with the classic studies in domesticfowl
.
It is our working hypothesis, supported by oursmall sample in 1986, that addled Great Horned Owl
eggs represent embryonic death with secondaryinfection, not primary infection or infertility.When death of the embryo occurs, there is immediatefailure of the normal bacteriostatic and
immunologic mechanisms of the live organism;diversified microorganisms already residing on or
even in the eggshell soon proliferate in the
excellent culture medium. In poultry, fertile and
infertile eggs are contaminated about equally(Romanoff and Romanoff 1949).
Other Long-term Studies
Our inverse relationship between addled eggsand food availability is consistent with the onlyother long-term studies of variation in the
incidence of addled raptor eggs, from Europe. In
the Buzzard, Buteo buteo , addled eggs constituted5"/. of all incubated eggs in good food years and 15%
in poor ones (Mebs 1964). In the Tawny Owl, Str i x
al uco , the loss of 115 of 279 eggs was ascribed to
"desertion and chilling" and was most frequent when
the female left her nest because food supplies were
scarce (Southern 1970). Our results agree with the
prediction of Lundberg (1985) that, given a low
daily risk of predation, a larger clutch sizeshould accompany increased food availability. On
the other hand, our results are contrary to
Lundberg's other prediction, on evolutionarygrounds, that low predation and increased clutchsize might be accompanied by a higher rate of egg
failure.
Usefulness of this information
Knowledge of the average and range of extremesof frequency of rotten eggs should help to
understand relationships between reproductivesuccess and food availability. In some species it
might also prove useful in early detection of
biocide effects, since some biocides increase therisk of reproductive failure (Newton and Bogan1974). Differentiation between chemicals causinginfertility and those causing early or late embryodeath might be important.
Our retrospective data, collected incidentalto a long-term banding effort, point to the needfor more detailed studies, including histologicexamination of dead embryos. We encourage othersto take an interest in this neglected area.
ACKNOWLEDGEMENTS
Glen A. Fox, J. Bernard Gollop, Mary I.
Houston, Lynn 0. Oliphant and Josef A. Schmutzoffered constructive criticism of an initial draftof this manuscript.
227
LITERATURE CITED
Campbell, 8., and Lack, E. 1985. A dictionary of
Birds, p. 3. Buteo Books, Vermillion, SouthDakota.
Houston, C.S. 1965. Observation and salvage of
Great Horned Owl nest. Blue Jay 23:164-165.
Houston, C.S. 1975a. Eggs of other species in
Great Horned Owl nests. Auk 92:377-378.
Houston, C.S. 1975b. Reproductive performanceof Great Horned Owls in Saskatchewan. Bird
Banding 46:302-304.
Insko, W.M. Jr., and J.H. Martin. 1935.
Mortality of the Turkey embryo. PoultryScience 14:361-364.
Klaas, E.E., and D.M. Swineford. 1976. Chemicalresidue content and hatchability of Screechowl eggs. Wilson Bulletin 88:421-426.
Lundberg, S. 1985. The importance of egg
hatchability and nest predation in clutch size
evolution in altricial birds. Oikos 45:110-117
Luttitch, S.N., L.B. Keith, and J.D. Stephenson.
1971. Population dynamics of the Red-tailed
Hawk ( Buteo jamaicensis ) at Rochester,
Alberta. Auk 88:73-87.
McGowan, J.D. 1975. Distribution, density and
productivity of Goshawks in interior Alaska.
Report of Alaska Dept. of Fish & Game.
Mebs, T. 1964. Zur biologie und populations-dynamik des Maussebussar ds ( Buteobuteo) . Journal fiir Ornithologie105:247-306.
Newton, I., and J. Bogan. 1974. Qrganochlorineresidues, eggshell thinning and hatchingsuccess in British sparrowhawks. Nature249:582-583.
Ogden, V.T., and M.B. Hornocker. 1977. Nestingdensity and success or Prairie Falcons in
southwestern Idaho. Journal of WildlifeManagement 41 : 1-11.
Ricklefs, R.E. 1969. An analyis of nestingmortality in birds. SmithsonianContributions to Zoology #9.
Riddle, 0. 1930. Studies on the physiology of
reproduction in birds. 27: the age distrib-ution of mortality in bird embryos and its
probable significance. American Journal of
Physiology 94:535-547.Romanoff, A.L. 1960. The avian embryo: structural
and functional development. Macmillan, NewYork.
Romanoff, A.L. & A.J. Romanoff. 1949. The avianegg. John Wiley & Sons, New York.
Southern, H.N. 1970. The natural control of a
population of Tawny Owls ( Strix aluco )
.
Journal of Zoology (London) 162:197-285.
228
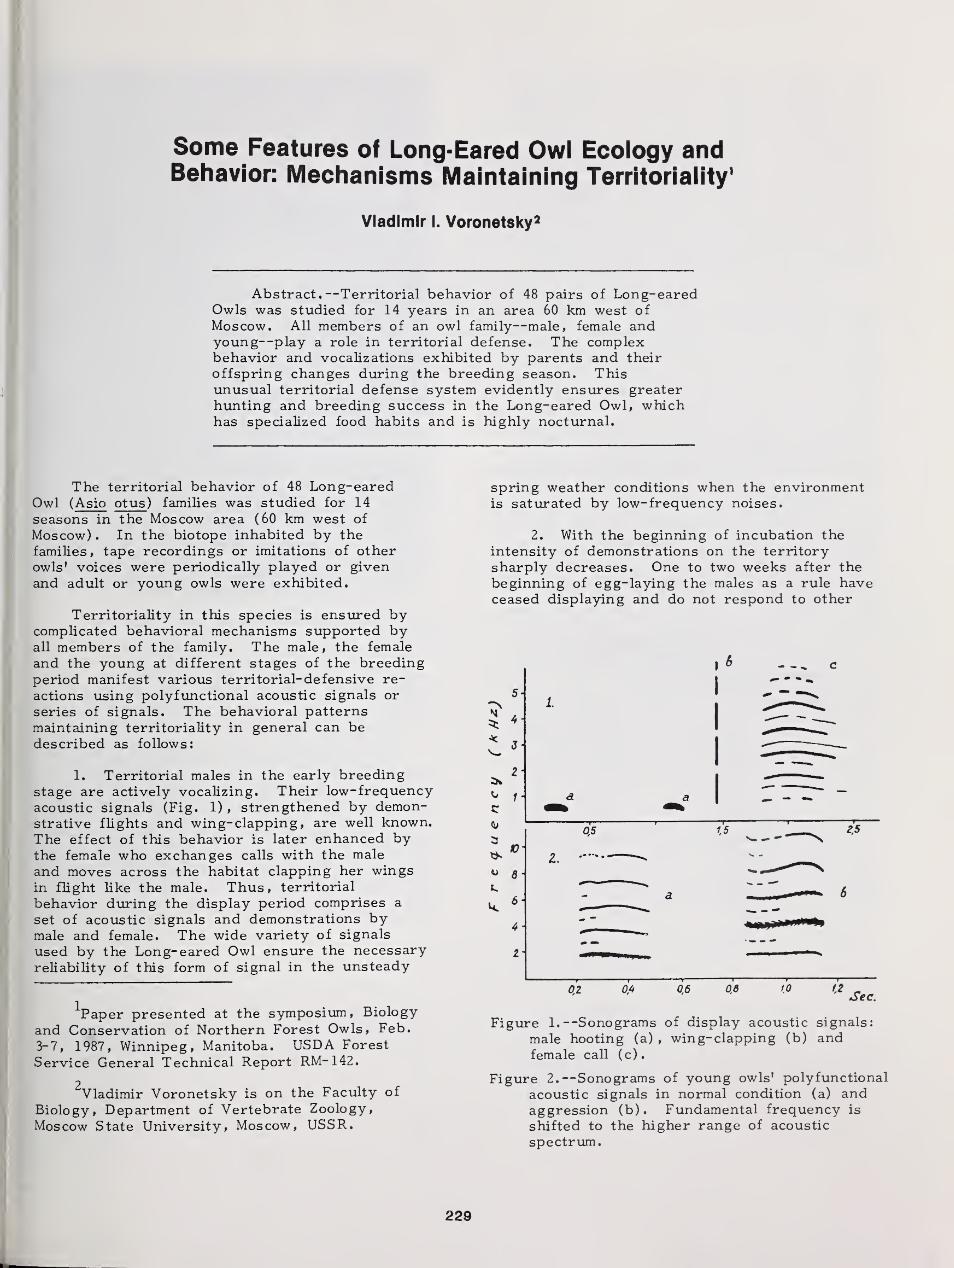
Some Features of Long-Eared Owl Ecology andBehavior: Mechanisms Maintaining Territoriality
1
Vladimir I. Voronetsky 2
Abstract.—Territorial behavior of 48 pairs of Long-earedOwls was studied for 14 years in an area 60 km west ofMoscow. All members of an owl family—male, female andyoung—play a role in territorial defense. The complexbehavior and vocalizations exhibited by parents and their
offspring changes during the breeding season. Thisunusual territorial defense system evidently ensures greaterhunting and breeding success in the Long-eared Owl, whichhas specialized food habits and is highly nocturnal.
The territorial behavior of 48 Long-earedOwl (Asio otus ) families was studied for 14
seasons in the Moscow area (60 km west of
Moscow) . In the biotope inhabited by thefamilies, tape recordings or imitations of otherowls' voices were periodically played or givenand adult or young owls were exhibited.
Territoriality in this species is ensured bycomplicated behavioral mechanisms supported byall members of the family. The male, the female
and the young at different stages of the breedingperiod manifest various territorial-defensive re-
actions using polyfunctional acoustic signals or
series of signals. The behavioral patternsmaintaining territoriality in general can bedescribed as follows:
1. Territorial males in the early breedingstage are actively vocalizing. Their low-frequencyacoustic signals (Fig. 1) , strengthened by demon-strative flights and wing- clapping , are well known.The effect of this behavior is later enhanced bythe female who exchanges calls with the maleand moves across the habitat clapping her wingsin flight like the male. Thus, territorial
behavior during the display period comprises a
set of acoustic signals and demonstrations bymale and female. The wide variety of signals
used by the Long-eared Owl ensure the necessary
reliability of this form of signal in the unsteady
Paper presented at the symposium, Biology
and Conservation of Northern Forest Owls, Feb.
3-7, 1987, Winnipeg, Manitoba. USDA Forest
Service General Technical Report RM-142.
2Vladimir Voronetsky is on the Faculty of
Biology, Department of Vertebrate Zoology,
Moscow State University, Moscow, USSR.
spring weather conditions when the environmentis saturated by low-frequency noises.
2. With the beginning of incubation the
intensity of demonstrations on the territory
sharply decreases. One to two weeks after the
beginning of egg-laying the males as a rule haveceased displaying and do not respond to other
I*
2-
02 6/4 0,6 0,8 1.0 1.2 _oec.
Figure 1.—Sonograms of display acoustic signals:
male hooting (a) , wing-clapping (b) andfemale call (c).
Figure 2.—Sonograms of young owls' polyfunctional
acoustic signals in normal condition (a) andaggression (b). Fundamental frequency is
shifted to the higher range of acoustic
spectrum.
229
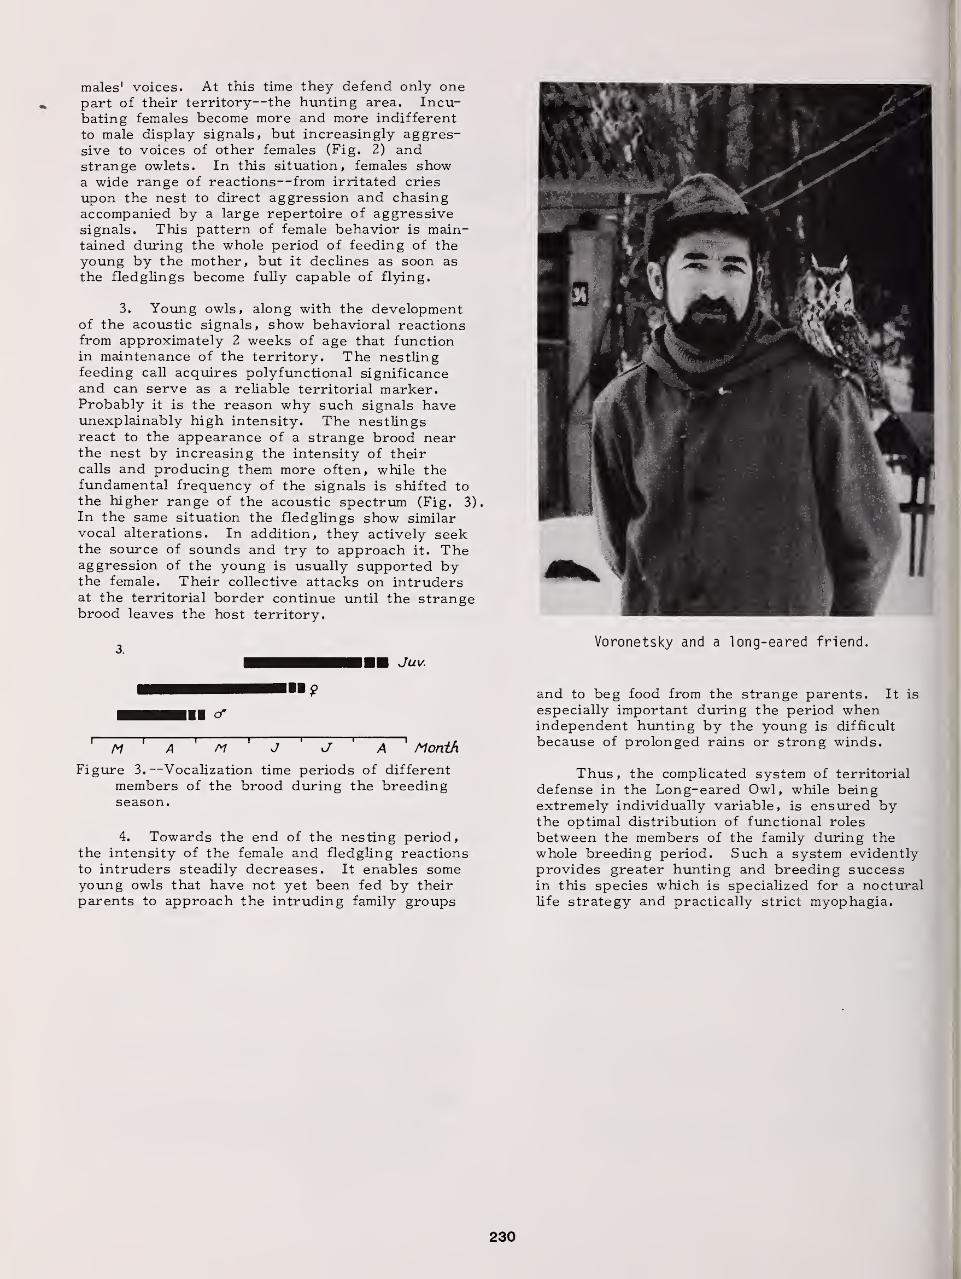
males' voices. At this time they defend only onepart of their territory—the hunting area. Incu-bating females become more and more indifferent
to male display signals, but increasingly aggres-sive to voices of other females (Fig. 2) andstrange owlets. In this situation, females showa wide range of reactions—from irritated cries
upon the nest to direct aggression and chasingaccompanied by a large repertoire of aggressivesignals. This pattern of female behavior is main-tained during the whole period of feeding of theyoung by the mother, but it declines as soon as
the fledglings become fully capable of flying.
3. Young owls, along with the developmentof the acoustic signals, show behavioral reactionsfrom approximately 2 weeks of age that functionin maintenance of the territory. The nestlingfeeding call acquires polyfunctional significanceand can serve as a reliable territorial marker.Probably it is the reason why such signals haveunexplainably high intensity. The nestlingsreact to the appearance of a strange brood nearthe nest by increasing the intensity of theircalls and producing them more often, while thefundamental frequency of the signals is shifted tothe higher range of the acoustic spectrum (Fig. 3).
In the same situation the fledglings show similarvocal alterations. In addition, they actively seekthe source of sounds and try to approach it. Theaggression of the young is usually supported bythe female. Their collective attacks on intrudersat the territorial border continue until the strangebrood leaves the host territory.
3. ill Juv.
II o"
1 M ' A ' ~M ' J ' ~J ' A ' Month
Figure 3.—Vocalization time periods of different
members of the brood during the breedingseason.
4. Towards the end of the nesting period,the intensity of the female and fledgling reactionsto intruders steadily decreases. It enables someyoung owls that have not yet been fed by theirparents to approach the intruding family groups
Voronetsky and a long-eared friend.
and to beg food from the strange parents. It is
especially important during the period whenindependent hunting by the young is difficult
because of prolonged rains or strong winds.
Thus, the complicated system of territorial
defense in the Long-eared Owl, while beingextremely individually variable, is ensured bythe optimal distribution of functional roles
between the members of the family during thewhole breeding period. Such a system evidentlyprovides greater hunting and breeding successin this species which is specialized for a nocturallife strategy and practically strict myophagia.
230
Food and Food Ecology of the Long-Eared Owlin an Agricultural Area1
Josef Kren 2
Artificial perches installed in an intensively exploitedagricultural area were heavily used by Long-eared Owls. Pri-mary prey species, determined by analysis of pellets beneaththe perches, were Common Voles and other species regarded asmajor agricultural pests. The nature of the prey indicates a
narrow food SDectrum related to the monoculture.
The present paper is a partial result of a
food ecology study of two of our most common owls,the Long-eared Owl and the Tawny Owl, in an in-tensively used agricultural landscape. Eventhough the food ecology of the Long-eared Owl hasbeen dealt with by manv writers, both in Czecho^Slovakia and in other European countries, theseproblems have been verv tODical in connectionwith the possibility of utilizing birds of preyin the intearated protection of agriculturalmonocul tures.
In Czechoslovakia the food of the Long-earedOwl was studied in detail --on the basis of pelletsby Farsky (1928), Folk (1956), Zeleny' (1961)
,
Boha'c and Micha'lkova' (1970) and Bejcek (1980).The material processed by them came from diff-
erent environments.
I have analysed 682 pellets collected atfour sites in South Moravia (Czechoslovakia).All sites were located in an intensivelv ex-
ploited aarir.ul tural area and were similar in all
respects. An important element of this landscapewere freelv scattered groups of trees and shrubs
of different ages which, however, did not con-
stitute continuous stands. The sites near the
villaqe of Kostelany (denoted as "C") are situ-
ated in a close neighbourhood of a flood-plainforest. The remaining sites are denoted: ("A")
near the village of tolni' NemcY, ("B") near the
village of Hluk. and ("D") near the villaae of
Trapl ice.
Paper presented at the symposium, Biology and
Conservation of Northern Forest Owls, Feb. 3-7,
1987, Winnipeg, Manitoba. USDA Forest Service
General Technical Report RM-il+2.
Departement of Zoology, Faculty of Sciences
Kotlarska 2
611 37 Brno, Czechoslovakia
Pellets were collected under T-shapedperches installed in alfalfa fields to supportthe predation activity of birds of prey for thepurpose of controlling small rodents. In autumnof 1982 and 1983 temperatures were normal
.
In 682 analyzed pellets skeletal remnants of
1368 animals were found belonging to the classes
Aves and Mammalia. Mammals were represented by
five species, the number of skeletal remains be-
longing to 1357 individuals, which constitute the
main part of the prey. The most common species
was the Common Vole ( Microtus arval is ) whose per-
centual representation for the 2 years was 90.3%.
The second most numerous representatives were
Mouse species ( Apodemus sp.). Their total share in
the 2 years was 5.7%. Bank Vole ( CI ethrionomys
glareolus ) was represented by 1.8%, House Mouse
( Mus musc o lus ) by 1.1%. In isolated cases there
occurred Common Shrew ( Sorex araneus ).
Birds found in the pellets were not deter-
mined to species. They were representatives of
the order Passeri formes . Their share in the prey
was o.8%. The share of the individual food com-
ponents in the pellets is given in detail in
Table 1.
No remains of invertebrates were found in the
pellets. In 1982 the mean number of vertebrates
found in the pellets varied between 1.4 and 2.2
vertebrates per pellet. In 1983 these values
varied from 1.7 to 2.6 vertebrates per pellet.
These values for the individual sites are given
in detail in figures 1 and 2.
For judging the food requirements of the
Long-eared Owl I used Shannon's Formula (H) ac-
cording to Pielou (1969). The value of Shannon's
formula is--in the sum for the 2 years--0. 3823
at the evenness index of 0.2133. The values for
the individual years are given in Table 2.
231
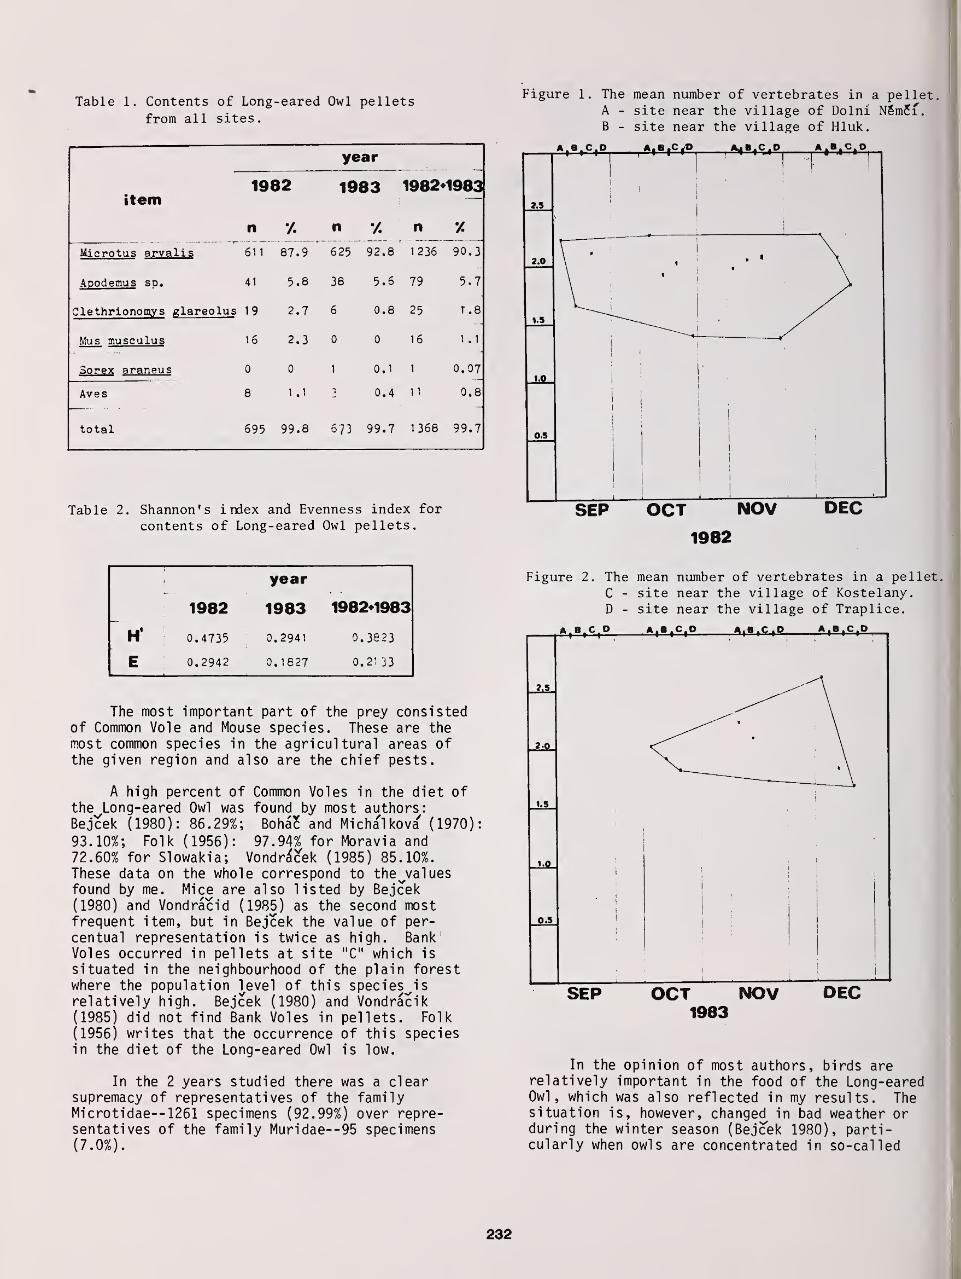
Table 1. Contents of Long-eared Owl pellets
from all sites.
year
item1982 1983 1982+1983
n n 7. n
Microtus arvalis"611 87.9 625 92.8 1 236 90.3
ADodemus so. 41 5.8 38 5.6 79 5.7
Clethrionomys glareolus 19 2.7 6 0.8 25 T.8
Mus musculus 16 2.3 0 0 16 1 .1
Sorex araneus 0 0 1 0.1 1 0.07
Aves 8 1 J 0.4 1
1
0.8
total 695 99.8 673 99.7 1368 99.7
Table 2. Shannon's index and Evenness index for
contents of Long-eared Owl pellets.
Figure 1. The mean number of vertebrates in a pellet,A - site near the village of Dolni N6m5i.B - site near the village of Hluk.
«i B ic r°
SEP OCT NOV
1982
DEC
year
1982 1983 1982+1983
H' 0.4735 0.2941 0.3623
i E 0.2942 0. 1827 0.2133
The most important part of the prey consistedof Common Vole and Mouse species. These are themost common species in the agricultural areas ofthe given region and also are the chief pests.
A high percent of Common Voles in the diet ofthe Long-eared Owl was found by most authors:Bejcek (1980): 86.29%; Bona? and Micha'lkova' (1970)
93.10%; Folk (1956): 97.94% for Moravia and72.60% for Slowakia; Vondra'cek (1985) 85.10%.These data on the whole correspond to the^valuesfound by me. Mice are also listed by Bejcek(1980) and Vondracid (1985) as the second mostfrequent item, but in Bejcek the value of per-
centual representation is twice as high. BankVoles occurred in pellets at site "C" which is
situated in the neighbourhood of the plain forestwhere the population level of this species^isrelatively high. Bejcek (1980) and Vondracik(1985) did not find Bank Voles in pellets. Folk
(1956) writes that the occurrence of this speciesin the diet of the Long-eared Owl is low.
In the 2 years studied there was a clearsupremacy of representatives of the familyMicrotidae--1261 specimens (92.99%) over repre-sentatives of the family Muridae--95 specimens(7.0%).
Figure 2. The mean number of vertebrates in a pellet,
C - site near the village of Kostelany.D - site near the village of Traplice.
2,5
1~ i
—
*•?
» \
1.5
'0 i
O.S
i
i
j
i
|
j
i
!
1
\
!
1
i
SEP OCT NOV1983
DEC
In the opinion of most authors, birds arerelatively important in the food of the Long-earedOwl, which was also reflected in my results. Thesituation is, however, changed in bad weather orduring the winter season (Bejcek 1980), parti-cularly when owls are concentrated in so-called
232
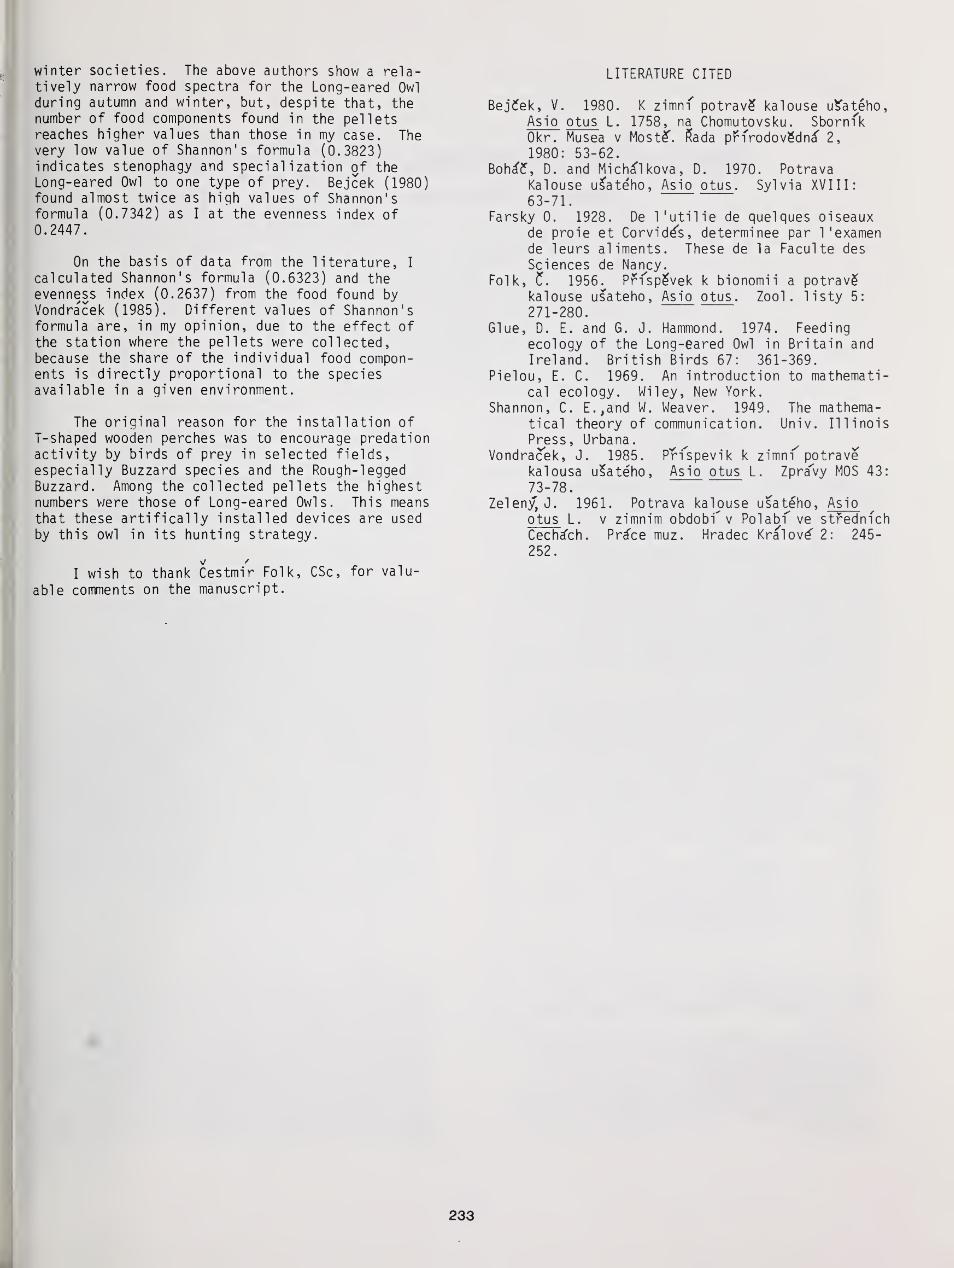
winter societies. The above authors show a rela-tively narrow food spectra for the Long-eared Owl
during autumn and winter, but, despite that, thenumber of food components found in the pelletsreaches higher values than those in my case. Thevery low value of Shannon's formula (0.3823)indicates stenophagy and specialization of theLong-eared Owl to one type of prey. Bejcek (1980)found almost twice as high values of Shannon'sformula (0.7342) as I at the evenness index of0.2447.
On the basis of data from the literature, I
calculated Shannon's formula (0.6323) and theevenness index (0.2637) from the food found byVondracek (1985). Different values of Shannon'sformula are, in my opinion, due to the effect ofthe station where the pellets were collected,because the share of the individual food compon-ents is directly proportional to the speciesavailable in a given environment.
The original reason for the installation ofT-shaped wooden perches was to encourage predationactivity by birds of prey in selected fields,especially Buzzard species and the Rough-leggedBuzzard. Among the collected pellets the highestnumbers were those of Long-eared Owls. This meansthat these artifically installed devices are used
by this owl in its hunting strategy.
I wish to thank Cestmir Folk, CSc, for valu-
able comments on the manuscript.
LITERATURE CITED
Bejfek, V. 1980. K zimnf potrav? kalouse us'ateho,
Asio otus L. 1758, na Chomutovsku. Sborn'kOkr. Musea v Most£\ Rada pFfrodove'dncf 2,
1980: 53-62.
Boha'?, D. and Micha'lkova, D. 1970. PotravaKalouse us'ateho, Asio otus . Sylvia XVIII:63-71.
Farsky 0. 1928. De l'utilie de quelques oiseauxde proie et Corvide's, determinee par l'examende leurs aliments. These de la Faculte des
Sciences de Nancy.Folk, C*. 1956. Prfspe'vek k bionomii a potrav?
kalouse usateho, Asio otus . Zool . 1 i sty 5:
271-280.Glue, D. E. and G. J. Hammond. 1974. Feeding
ecology of the Long-eared Owl in Britain and
Ireland. British Birds 67: 361-369.
Pielou, E. C. 1969. An introduction to mathemati-cal ecology. Wiley, New York.
Shannon, C. E.,and W. Weaver. 1949. The mathema-tical theory of communication. Univ. IllinoisPress, Urbana.
Vondracek, J. 1985. Prfspevik k zimm potravekalousa us'ateho, Asio otus L. Zpravy M0S 43:
73-78.
Zeleny, J. 1961. Potrava kalouse usateho, Asio
otus L. v zimnim obdobf v Polabi" ve strednichCecha'ch. Pra'ce muz. Hradec Kralove' 2: 245-
252.
233
Fidelity to Territory and Mate in Flammulated Owls1
Richard T. Reynolds2and Brian D. Linkhart
3
Abstract.—Adult flammulated owls were banded on a452-ha area In Colorado. Nine adults nested 1 vear only,five nested In 2 years, four in 3, one In 4, and one In 5.Males bad a lower return rate tban females. Once malesestablished breeding territories, they returned to them eachyear. Females sometimes changed territories, and theircorresponding dispersal distance (474 m) was similar to themean distance across territories, 424 m.
INTRODUCTION
Fidelity to a mate or nesting site is
widespread among birds, but is particularlycommon in adults of migratory species thatreturn to breed in the same general area yearafter year. Fidelity to sites and mates hasbeen studied in some charadriiformes (Wilcox1959, Lenington and Mace 1975), passeriformes(Delius 1965, Darley et al. 1971, Harvey et al.
1979) , seabirds (Coulson 1966, Richdale andWarham 1973, Ollason and Dunnet 1978), andfalconiformes (Newton and Marquiss 1982)
.
Little is known, however, about mate and sitefidelity in strigiformes , particularly in
migratory species.
In general, studies of birds show thatmales have greater fidelity to territories thando females, and that both males and females moreoften change territories and mates after a
breeding failure than after a success (Greenwood1980) . Harvey et al. (1979) suggested that sitefidelity is more likely in species that occupystable environments, and that mate fidelity is
more common among longer-lived species.
We report the annual rate of return tobreeding territories, the duration of the pairbond, the frequency of reoccupancy of terri-tories, and the breeding dispersal of
flammulated owls nesting in Colorado. Although
1 Paper presented at the Symposium on the
Biology and Conservation of Northern Forestowls. [Winnipeg, Manitoba, Canada, February3-7, 19871.
2Richard T. Reynolds is Research WildlifeBiologist, Rocky Mountain Forest and RangeExperiment Station, 222 South 22nd Street,
Laramie, Wyoming 82070.3Brian D. Linkhart is a Wildlife Biologist,
240 West Prospect, Fort Collins, Colorado80526-2098.
we know of no recaptures of banded flammulatedowls during migration or in winter, there isextensive evidence that this species is migra-tory (Jacot 1931, Phillips 1942, Phillips et al.1964, Sutton 1960, Banks 1964, Phillips et al.1964, Wolfenden 1970, Hubbard 1972, Balda et al.1975).
STUDY AREA
This study was conducted on 452-ha of theManltou Experimental Forest, Teller Co., incentral Colorado. The forest on the study tractconsisted of open old-growth (200+ yr) stands ofponderosa pine (Pinus ponderosa )—Douglas-fir
(Pseudotsuga menziesii ) on south- and west-facing slopes, dense younger (< 100 yr) standsof Douglas-fir—blue spruce (Picea pungens ) onnorth aspects, and mixed quaking aspen (Populustremuloides ) and blue spruce in the drainages.Elevations ranged from 2550 to 2855 m, withridges rising 100 to 250 m from bottoms. Treeshad not been harvested on the tract since the
1880' s (light selective cutting for railroadties) , and snags and cavity trees were relative-ly common on all slopes (Reynolds et al. 1985).Reynolds et al. (1985) and Reynolds and Linkhart(this volume) described the topography, vegeta-tion, and soils on the study tract.
METHODS
Twenty-one adults were banded on the study
tract during 5 nesting seasons (1981-1985). In
addition, 9 nestlings were banded in 1981, 9 in
1982, 9 in 1983, 10 in 1984, and 15 in 1985.
Three pairs and their nestlings from nests
outside of our study tract were banded also. Asuite of behavioral characteristics was used to
identify the sex of individuals: males by their
territorial, courtship, and copulatory behav-
iors, and high level of activity during nesting;
and females by their recipient role in courtship
feeding, food-begging behavior, and low level of
234
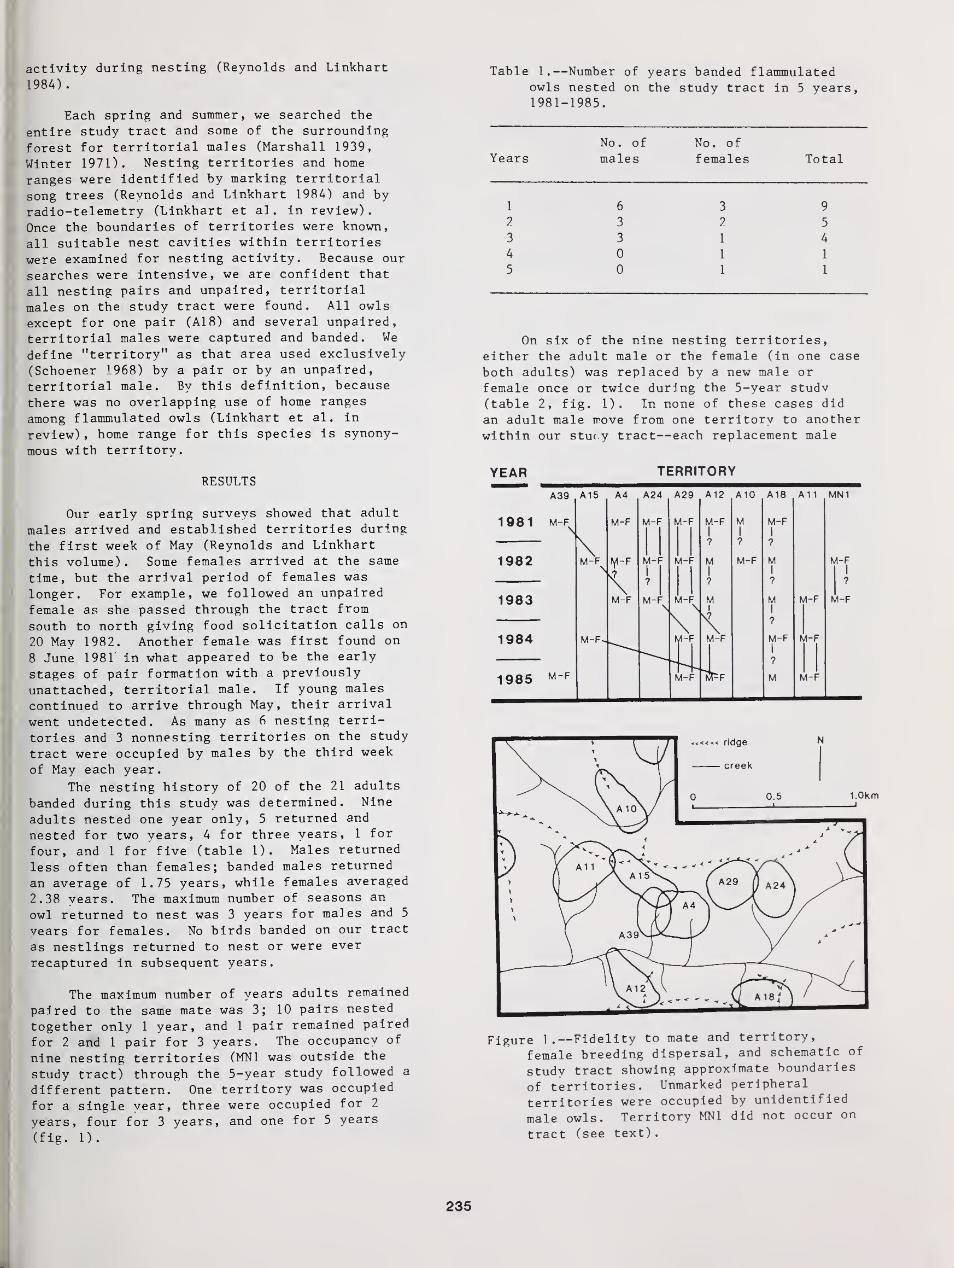
activity during nesting (Reynolds and Linkhart
1984) .
Each spring and summer, we searched the
entire study tract and some of the surrounding
forest for territorial males (Marshall 1939,
Winter 1971). Nesting territories and home
ranges were identified by marking territorial
song trees (Reynolds and Linkhart 1984) and byradio-telemetry (Linkhart et al . in review).
Once the boundaries of territories were known,
all suitable nest cavities within territories
were examined for nesting activity. Because our
searches were intensive, we are confident that
all nesting pairs and unpaired, territorial
males on the study tract were found. All owls
except for one pair (A18) and several unpaired,
territorial males were captured and banded. We
define "territory" as that area used exclusively(Schoener 1968) by a pair or by an unpaired,
territorial male. By this definition, because
there was no overlapping use of home ranges
among flammulated owls (Linkhart et al. in
review) , home range for this species is synony-
mous with territory.
RESULTS
Our early spring surveys showed that adult
males arrived and established territories during
the first week of May (Reynolds and Linkhart
this volume) . Some females arrived at the same
time, but the arrival period of females was
longer. For example, we followed an unpaired
female as she passed through the tract from
south to north giving food solicitation calls on
20 May 1982. Another female was first found on
8 June 1981' in what appeared to be the early
stages of pair formation with a previously
unattached, territorial male. If young males
continued to arrive through May, their arrival
went undetected. As many as 6 nesting terri-
tories and 3 nonnesting territories on the study
tract were occupied by males by the third week
of May each year.
The nesting history of 20 of the 21 adults
banded during this study was determined. Nine
adults nested one year only, 5 returned and
nested for two years, 4 for three years, 1 for
four, and 1 for five (table 1). Males returned
less often than females; banded males returned
an average of 1.75 years, while females averaged
2.38 years. The maximum number of seasons an
owl returned to nest was 3 years for males and 5
years for females. No birds banded on our tract
as nestlings returned to nest or were ever
recaptured in subsequent years.
The maximum number of years adults remained
paired to the same mate was 3; 10 pairs nested
together only 1 year, and 1 pair remained paired
for 2 and 1 pair for 3 years. The occupancy of
nine nesting territories (MN1 was outside the
study tract) through the 5-year study followed a
different pattern. One territory was occupied
for a single vear, three were occupied for 2
years, four for 3 years, and one for 5 years
(fig. 1).
Table 1.- -Number of years banded flammulatedowls nested on the study tract in 5 years,1981 -1985.
No. of No. of
Years males females Total
1 6 3 9
2 3 2 5
3 3 1 4
4 0 1 1
5 0 1 1
On six of the nine nesting territories,either the adult male or the female (in one case
both adults) was replaced by a new male or
female once or twice during the 5-year studv(table 2, fig. 1). In none of these cases did
an adult male move from one territory to anotherwithin our stu< y tract—each replacement male
YEAR TERRITORY
A39 A15 A4 A24 A29 A12 ,A10 A18 A11 MN1
1981 M-F
1982
1983
1984
1985 M-F
MI
?
M-F
M-FI
?
MI
?
MI
?
M-FI
?
M
M-F
M-F
M-F
M-FI
?
M-F
1.0km
Figure 1.—Fidelity to mate and territory,
female breeding dispersal, and schematic of
study tract showing approximate boundaries
of territories. Unmarked peripheral
territories were occupied by unidentified
male owls. Territory MN1 did not occur on
tract (see text).
235
J
was unhanded. In contrast, 4 of the 7 femalereplacements were banded adults that had nestedelsewhere on the study tract in a previous year.In one case, a female (originally A39) nested 3
consecutive years on the tract in different butadjacent territories (fig. 1). In another case,two females (originally A29-83 and A15-84)nested with a male on his (A12) territory in 2
consecutive years (female A29 in 1984 and femaleA15 in 1985) . The overall replacement rate(total replacements per year for all terri-tories) was 22.2% for males and 38.9% forfemales. Thus, even though males have a lesserchance of returning to nest than females, maleswere replaced less often on a territory.
Breeding dispersal (Greenwood 1980) is thedistance moved by an individual owl between itsnest of one year (either the first or subsequentnestings) and the nest of the following year.Two categories of movements by flammulated owlsbetween years were noted. The first category (3
cases) involved the same pair, or at least thesame male of the pair, moving (x = 71.7 m,
SD = 44.2, range 30-118 m) to a different nesttree from one year to the next, but stayingwithin an existing territory. Because thesemovements occurred within a territory, they werenot considered breeding dispersal. The secondcategory involved the changing of territoriesbetween years. This dispersal occurred onlyamong females (5 of 10 that returned to nest)and averaged 474 m (SD = 201.8, range 256-798 m)
(fig. 1). The mean dispersal distance was onlyslightly greater than the mean distance acrossthe measured home ranges (424 m) (Linkhart et
Table 2.—The number of known replacement malesand females on territories used more thanonce
.
Males Females
Terri- Replace- Opport- Replace- Opport-tory ment unities 1 ment unities
A24 0 2 0 2
A29 1 4 l2 4
A4 1 2 l2
2
A39 1 2 1 2
A15 1 2 l2
2
A12 0 3 23
3
All 0 2 1 2
MN1 0 1 0 1
Total 4 18 7 18
al., in review). Thus, on average, femalesdispersed to adjacent territories. Harvey etal. (1979) found that great tits (Parus major )
in England also dispersed the distance of a
territory's width.
The proximate reasons for dispersal offemales could not be determined; however, in allbut one case, the original male at the abandonedterritory had not returned. The exceptioninvolved a male (A12) who was unpaired for atleast 1 year (1983) but who nested the following2 years in the same territory but with differentfemales (fig. 1). The original female (A29-83)had dispersed (798 m) to this territory in 1984,and the second female (A15-84) dispersed 495 mto the territory the following year (1985).There was no evidence that the first female(A29-83) returned to the study tract in 1985.
Also, all but one dispersing female paired withan experienced male. In 1984, the male of
A29-83 did not return and was replaced by anunhanded male (A29-84) who had paired withfemale A24-83 from an adjacent territory. Thenest of A24 female had failed in 1983, and the
fate of her original male was unknown. In onlythis case did a previously nesting femaledisperse to pair with a first-time nestingmale—all other dispersals were to territoriesof males that had either nested, or were at
least presumed to be the same male that defendeda territory (e.g., A12), in previous years.
The nesting success of pairs (number of
fledglings) may be related to the nestingexperience of adults (table 3) . Pairs consist-ing of males and females known to be nesting forthe first time had an average of 0.58 fewer (t =
-2.02, df = 8, p < 0.1) fledglings than pairsconsisting of males and females known to havenested previously. If this relationship exists,there is a reproductive advantage for a male toreturn to its previous territory and for a
female to choose an experienced male. Weassumed that birds nesting for the first time on
the tract were first-time breeders. Thestrength of our assumption obviously depends on
the size of a study area and the likelihood that
males in fact are not long-distance dispersers.However, because females are known to changeterritories, they may have dispersed onto the
tract after nesting elsewhere. As a result, the
category of first-time nesting females in the
table may actually include experienced breeders.If so, any differences in brood size betweenexperience categories would be diluted.
DISCUSSION
Opportunities is the number of years that
a territory was reoccupied by any male or
female. Tally was not limited to territoriesreoccupied in consecutive years.
2 Involved a female changing territoriesbetween years.
3Involved two females changing territoriesbetween years.
As in many other birds, flammulated owls
demonstrated a marked between-year site fidel-
ity, with males showing more faithfulness than
females. The apparent absence of breedingdispersal in male flammulated owls may be
related to the benefits accrued to males whoestablish territories in areas where they have
had previous experience with the spatial and
temporal variation in resources. Previous
236
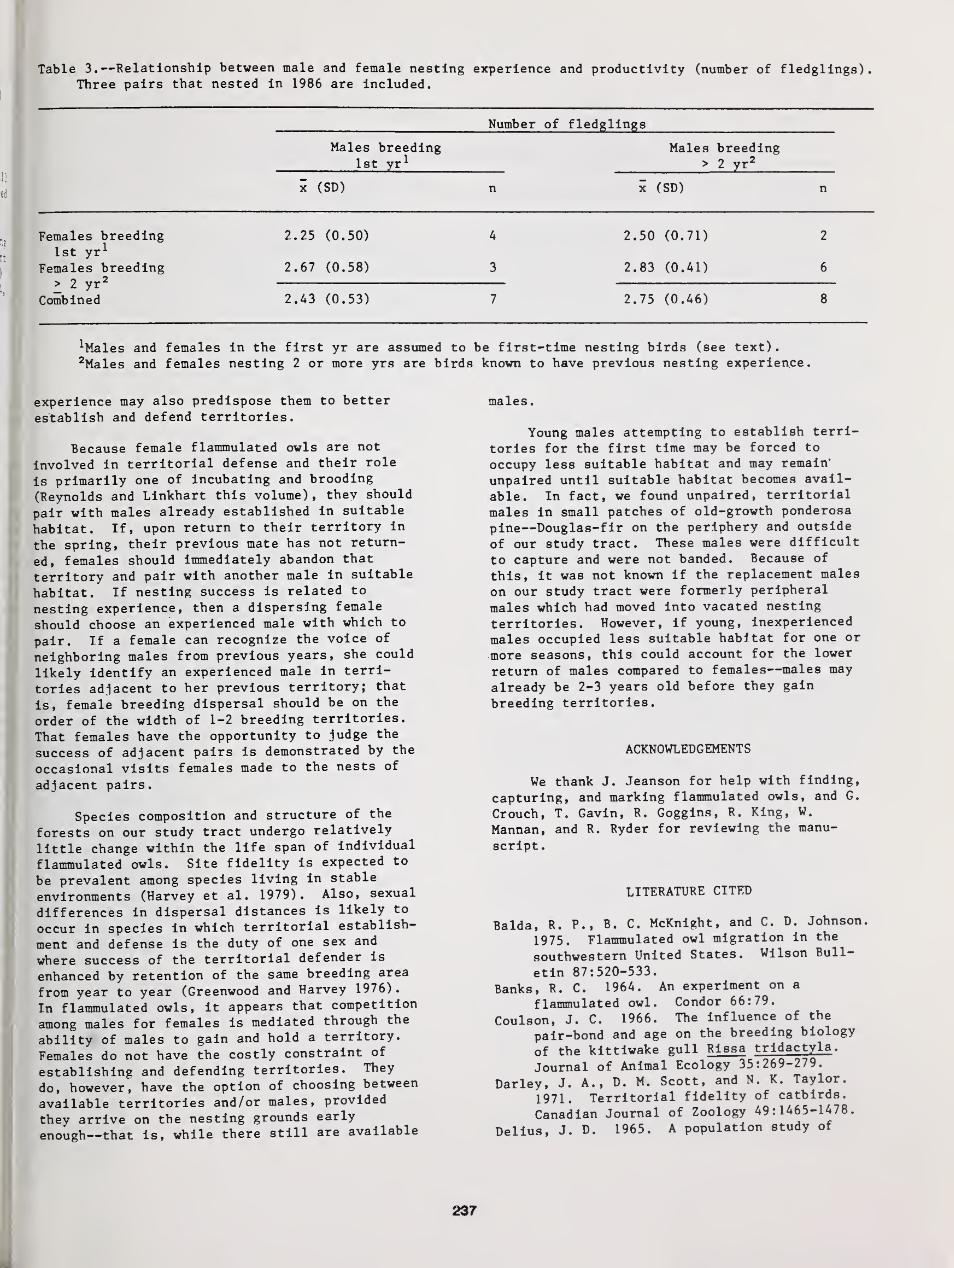
Table 3.—Relationship between male and female nesting experience and productivity (number of fledglings).Three pairs that nested in 1986 are included.
Number of fledglings
Males breeding Males breeding1st yr 1 > 2 yr 2
x (SD) n x (SD) n
Females breeding 2.25 (0.50) A 2.50 (0.71) 2
1st yr 1
Females breeding 2.67 (0.58) 3 2.83 (0.41) 6
> 2 yr 2
Combined 2.43 (0.53) 7 2.75 (0.46) 8
1Males and females in the first yr are assumed to be first-time nesting birds (see text).2Males and females nesting 2 or more yrs are birds known to have previous nesting experience.
experience may also predispose them to better
establish and defend territories.
Because female flammulated owls are not
involved in territorial defense and their role
is primarily one of incubating and brooding
(Reynolds and Linkhart this volume) , they should
pair with males already established in suitable
habitat. If, upon return to their territory in
the spring, their previous mate has not return-
ed, females should immediately abandon that
territory and pair with another male in suitable
habitat. If nesting success is related to
nesting experience, then a dispersing female
should choose an experienced male with which to
pair. If a female can recognize the voice of
neighboring males from previous years, she could
likely identify an experienced male in terri-
tories adjacent to her previous territory; that
is, female breeding dispersal should be on the
order of the width of 1-2 breeding territories.
That females have the opportunity to judge the
success of adjacent pairs is demonstrated by the
occasional visits females made to the nests of
adjacent pairs.
Species composition and structure of the
forests on our study tract undergo relatively
little change within the life span of individual
flammulated owls. Site fidelity is expected to
be prevalent among species living in stable
environments (Harvey et al. 1979). Also, sexual
differences in dispersal distances is likely to
occur in species in which territorial establish-
ment and defense is the duty of one sex and
where success of the territorial defender is
enhanced by retention of the same breeding area
from year to year (Greenwood and Harvey 1976)
.
In flammulated owls, it appears that competition
among males for females is mediated through the
ability of males to gain and hold a territory.
Females do not have the costly constraint of
establishing and defending territories. They
do, however, have the option of choosing between
available territories and/or males, provided
they arrive on the nesting grounds early
enough—that is, while there still are available
males.
Young males attempting to establish terri-
tories for the first time may be forced to
occupy less suitable habitat and may remain'
unpaired until suitable habitat becomes avail-
able. In fact, we found unpaired, territorial
males in small patches of old-growth ponderosa
pine—Douglas-fir on the periphery and outside
of our study tract. These males were difficult
to capture and were not banded. Because of
this, it was not known if the replacement males
on our study tract were formerly peripheral
males which had moved into vacated nesting
territories. However, if young, inexperienced
males occupied less suitable habitat for one or
more seasons, this could account for the lower
return of males compared to females—males may
already be 2-3 years old before they gain
breeding territories.
ACKNOWLEDGEMENTS
We thank J. Jeanson for help with finding,
capturing, and marking flammulated owls, and G.
Crouch, T. Gavin, R. Goggins, R. King, W.
Mannan, and R. Ryder for reviewing the manu-
script .
LITERATURE CITED
Balda, R. P., B. C. McKnight, and C. D. Johnson,
1975. Flammulated owl migration in the
southwestern United States. Wilson Bull-
etin 87:520-533.
Banks, R. C. 1964. An experiment on a
flammulated owl. Condor 66:79.
Coulson, J. C 1966. The influence of the
pair-bond and age on the breeding biology
of the kittiwake gull Rlssa tridactyla .
Journal of Animal Ecology 35:269-279.
Darley, J. A., D. M. Scott, and N. K. Taylor.
1971. Territorial fidelity of catbirds.
Canadian Journal of Zoology 49:1465-1478.
Delius, J. D. 1965. A population study of
237
skylarks Aland
a
arvensls. Ibis 107:
466-492.
Greenwood, P. J. 1980. Mating systems,philopatry, and dispersal In birds and
mammals. Animal Bebavlor 28:1140-1162.Greenwood, P. J., and P. H. Harvey. 1976. The
adaptive significance of variation Inbreeding area fidelity of the blackbird(Turdus merula L.). Journal of AnimalEcology 45:887-898.
Harvey, P. H. , P. J. Greenwood, and C. M.
Perrlus. 1979. Breeding area fidelity ofgreat tits (Parus major ) . Journal of
Animal Ecology 48:305-313.Hubbard, J. P. 1972. King rail and flammulated
owl at El Paso, Texas. Condor 74:481.Jacot, E. C. 1931. Notes on the spotted and
flammulated screech owls in Arizona.Condor 33:8-11.
Lenington, S., and T. Mace. 1975. Mate fidel-ity and nesting site tenacitv in thekilldeer. Auk 92:149-151.
Marshall, J. T. , Jr. 1939. Territorial behav-ior of the flammulated screech owl. Condor41:71-78.
Newton, I., and M. Marquiss. 1982. Fidelity tobreeding area and mate in sparrowhawksAccipiter nlsus. Journal of Animal Ecology51:327-341.
Ollason, J. C, and G. M. Dunnet. 1978. Age,experience, and other factors affecting thebreeding success of the fulmar, Fulmarusglacialls , in Orkney. Journal of AnimalEcology 47:961-976.
Phillips, A. R. 1942. Notes on the migrationof the elf and flammulated screech owls.Wilson Bulletin 54:132-137.
Phillips, A. R. , J. Marshall, Jr., and C.
Manson. 1964. The birds of Arizona.University of Arizona Press, Tucson.
Reynolds, R. T., and B. D. Linkhart. 1984.
Methods and materials for capturing andmonitoring flammulated owls. Great BasinNaturalist 44:49-51.
Reynolds, R. T., and B. D. Linkhart. 1987. Thenesting biology of flammulated owls inColorado. Symposium on the Biology andConservation of Northern Forest Owls,Winnipeg, Manitoba, Canada, February 3-7.
Reynolds, R. T., B. D. Linkhart, and J. Jeanson.1985. Characteristics of snags and treescontaining cavities in a Colorado coniferforest. USDA Forest Service, Rocky Moun-tain Forest and Range Experiment Station.Research Note RM-455, 6 p.
Richdale, L. E. , and J. Warham. 1973. Survi-val, pair bond retention, and nest-sitetenacity in buller's molly mawk. Ibis115:257-263.
Schoener, T. W. 1968. Sizes of feeding terri-tories among birds. Ecology 49:123-141.
Sutton, G. M. 1960. Flammulated owl in LubbockCounty, Texas. Southwest Naturalist5:173-174.
Wilcox, L. 1959. A twenty-year study of the
piping plover. Auk 76:129-152.Winter, J. 1971. Some critical notes on
finding and seeing the flammulated owl.
Birding 3:205-209.Wolfenden, G. E. 1970. A putative skeletal
specimen of the flammulated owl withAlabama locality data. Wilson Bulletin82:223-224.
238
The Nesting Biology of Flammulated Owls in Colorado
Richard T. Reynolds2and Brian D. Llnkhart3
Abstract.—Spring arrival of flammulated owls to a452-ha area in Colorado occurred in early May. Each year,4-6 territories were occupied by pairs and 2-3 territoriesby unpaired males. Clutch size was 2.7 eggs, incubation was22 nights, brood size was 2.4 young, and young were in thenest 23 nights. Owlets dispersed in late August and adultsin early October. The affinity of flammulated owls for oldyellow pine forests stems from the abundance of nest cavi-ties, the structure of the trees and stands, and the arthro-pods found in these forests.
INTRODUCTION
The flammulated owl (Otus f lammeolus[Kamp]) is a little known insectivorous species(Ross 1969) that is widely distributed inmontane forests from southern British Columbiasouthward through the highlands of Mexico andGuatemala (Bent 1938). The owl is one of thesmallest in this region (Earhart and Johnson1970), is an obligate cavity-nester , and isassumed to be migratory in the northern part ofits range (Marshall 1957, Winter 1974, Balda et
al. 1975). It breeds from the Rocky Mountains(Reynolds and Linkhart 1984, and others) to thePacific (Winter 1974) and from southern BritishColumbia (Cannings et al. 1978) south to VeraCruz, Mexico (Sutton and Burleigh 1940). Thewinter range is thought to be from Guatemala andEl Salvador north to Jalisco, Mexico (Phillipset al. 1942).
In spite of its wide distribution, littleis known of the flammulated owl's nestingbiology and population status. In fact, its
status is so obscure that gross populationchanges would remain undetected.
Flammulated owls typically are found in the
yellow pine belt—from lower elevations wherethe pine is mixed with oak (Quercus sp.)
(Marshall 1957, Marcot and Hill 1980) or pinyonpine (Pinus monophylla ) (Huey 1932) to its upper
*Paper presented at the Symposium on the
Biology and Conservation of Northern Forest
Owls. [Winnipeg, Manitoba, Canada, February
3-7, 1987].2Richard T. Reynolds is Research Wildlife
Biologist, Rocky Mountain Forest and Range
Experiment Station, 222 South 22nd Street,
Laramie, Wyoming 82070.3Brian D. Linkhart is a Wildlife Biologist,
240 West Prospect, Fort Collins, Colorado
80526-2098.
reaches where the pine mixes with firs (Abiessp.), Douglas-fir (Pseudotsuga menziesii ) , larch
(Larix sp.), or incense-cedar (Libocedrusdecurrens ) (Marshall 1939, Phillips et al. 1964,
Johnson and Russell 1962, Bull and Anderson1978, Reynolds and Linkhart 1984). The owl alsohas been recorded in quaking aspen (Populustremuloides ) (Webb 1982) and second-growthponderosa pine (P. ponderosa ) (Winter 1974).However, only Bull and Anderson (1978), Reynoldsand Linkhart (1984), and Goggins (1986) exten-sively searched for nests, and only Reynolds and
Linkhart (1984) estimated the density of nestingpairs. The owl's preference to forage in
old-growth (> 200 yr old) ponderosa pine-Douglas-fir stands (Linkhart et al. in review)
—
a type and age class that is extensively managed
in North America—its dependence on cavities for
nests, and reports that the owl is not found in
cutover forests (Marshall 1957, Phillips et al.
1964, Franzreb and Ohmart 1978) suggest a
critical need for information about its nesting
biology, nesting density, and habitat affini-
ties.
We studied flammulated owls in the montaneforest in central Colorado from 1980 to 1986
(Reynolds and Linkhart 1984, this volume;Linkhart and Reynolds, in press; Linkhart et
al., in review). Nesting pairs and non-nestingterritorial males on the study tract, as well as
several pairs outside the tract, were studiedeach year. Movements and habitat use by nestingowls were determined with radio-telemetry in
1982-1983. Here we report the density of
territorial males, territorial and nestingbehavior, productivity, and foraging, and
discuss the habitat associations of this owl.
STUDY AREA
The study was conducted on a 452-ha area of
the Manitou Experimental Forest in central
Colorado. Forest on the study tract consisted
239
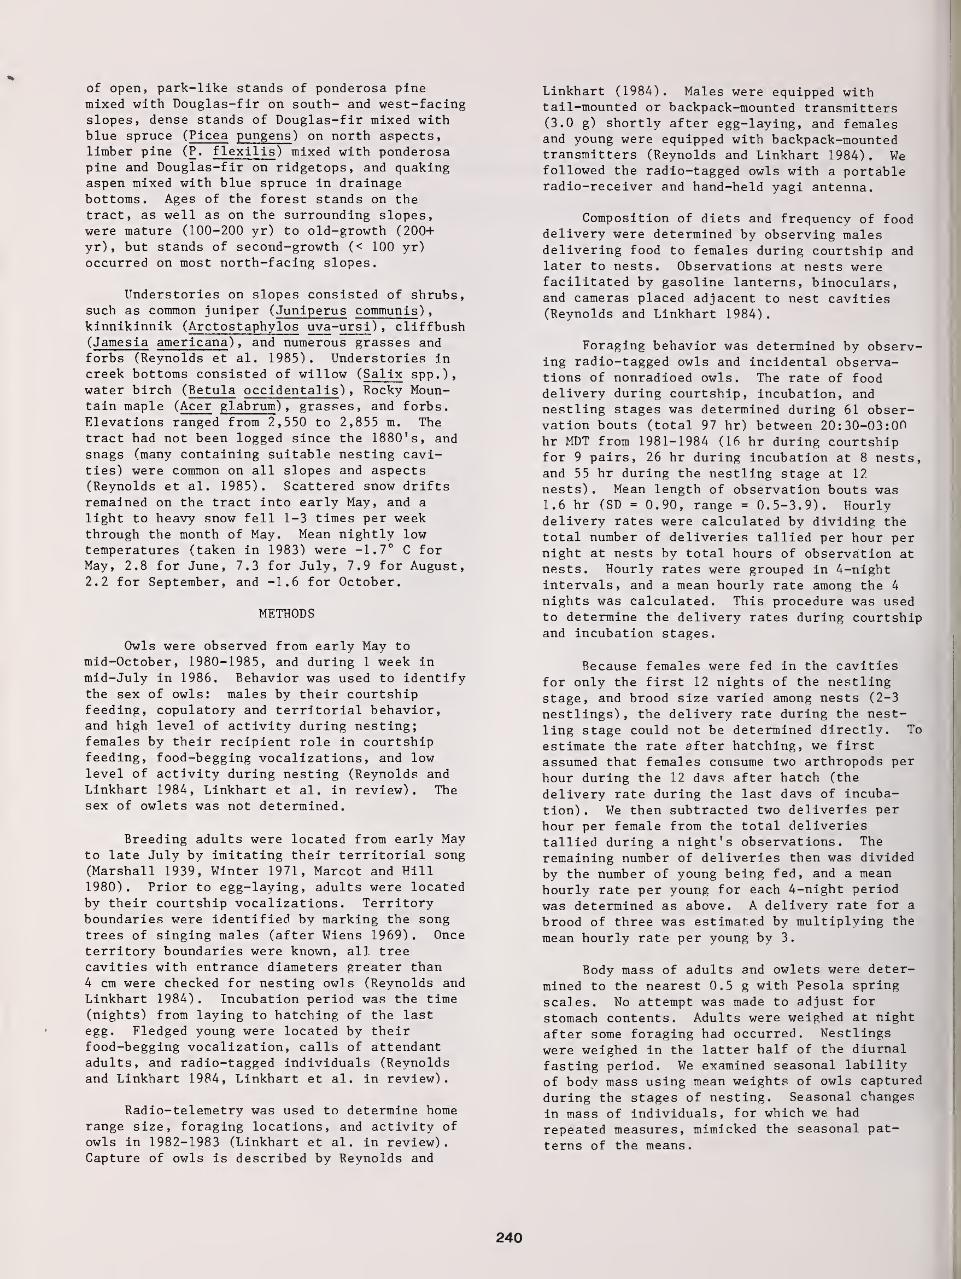
of open, park-like stands of ponderosa pinemixed with Douglas-fir on south- and west-facingslopes, dense stands of Douglas-fir mixed withblue spruce (Picea pungens ) on north aspects,limber pine (P. flexilis ) mixed with ponderosapine and Douglas-fir on ridgetops, and quakingaspen mixed with blue spruce in drainagebottoms. Ages of the forest stands on the
tract, as well as on the surrounding slopes,were mature (100-200 yr) to old-growth (200+yr) , but stands of second-growth (< 100 yr)
occurred on most north-facing slopes.
Understories on slopes consisted of shrubs,such as common juniper (Juniperus communis )
,
kinnikinnik (Arctostaphylos uva-ursi ) , cliffbush(Jamesia americana ) , and numerous grasses andforbs (Reynolds et al. 1985). Understories increek bottoms consisted of willow ( Salix spp.),water birch (Betula occidentalis ) , Rocky Moun-tain maple (Acer glabrum ) , grasses, and forbs.Elevations ranged from 2,550 to 2,855 m. Thetract had not been logged since the 1880' s, andsnags (many containing suitable nesting cavi-ties) were common on all slopes and aspects(Reynolds et al. 1985). Scattered snow driftsremained on the tract into early May, and a
light to heavy snow fell 1-3 times per weekthrough the month of May. Mean nightly lowtemperatures (taken in 1983) were -1.7° C forMay, 2.8 for June, 7.3 for July, 7.9 for August,2.2 for September, and -1.6 for October.
METHODS
Owls were observed from early May tomid-October, 1980-1985, and during 1 week inmid-July in 1986. Behavior was used to identifythe sex of owls: males by their courtshipfeeding, copulatory and territorial behavior,and high level of activity during nesting;females by their recipient role in courtshipfeeding, food-begging vocalizations, and lowlevel of activity during nesting (Reynolds andLinkhart 1984, Linkhart et al. in review). Thesex of owlets was not determined.
Breeding adults were located from early Mayto late July by imitating their territorial song(Marshall 1939, Winter 1971, Marcot and Hill1980). Prior to egg-laying, adults were locatedby their courtship vocalizations. Territoryboundaries were identified by marking the songtrees of singing males (after Wiens 1969) . Onceterritory boundaries were known, all treecavities with entrance diameters greater than4 cm were checked for nesting owls (Reynolds and
Linkhart 1984) . Incubation period was the time(nights) from laying to hatching of the lastegg. Fledged young were located by theirfood-begging vocalization, calls of attendantadults, and radio-tagged individuals (Reynoldsand Linkhart 1984, Linkhart et al. in review).
Radio-telemetry was used to determine homerange size, foraging locations, and activity of
owls in 1982-1983 (Linkhart et al. in review).Capture of owls is described by Reynolds and
Linkhart (1984). Males were equipped withtail-mounted or backpack-mounted transmitters(3.0 g) shortly after egg-laying, and femalesand young were equipped with backpack-mountedtransmitters (Reynolds and Linkhart 1984) . Wefollowed the radio-tagged owls with a portableradio-receiver and hand-held yagi antenna.
Composition of diets and frequency of fooddelivery were determined by observing malesdelivering food to females during courtship andlater to nests. Observations at nests werefacilitated by gasoline lanterns, binoculars,and cameras placed adjacent to nest cavities(Reynolds and Linkhart 1984)
.
Foraging behavior was determined by observ-ing radio-tagged owls and incidental observa-tions of nonradioed owls. The rate of fooddelivery during courtship, incubation, andnestling stages was determined during 61 obser-vation bouts (total 97 hr) between 20:30-03:00hr MDT from 1981-1984 (16 hr during courtshipfor 9 pairs, 26 hr during incubation at 8 nests,and 55 hr during the nestling stage at 12
nests) . Mean length of observation bouts was1.6 hr (SD = 0.90, range = 0.5-3.9). Hourlydelivery rates were calculated by dividing thetotal number of deliveries tallied per hour pernight at nests by total hours of observation atnests. Hourly rates were grouped in 4-nightintervals, and a mean hourly rate among the 4
nights was calculated. This procedure was usedto determine the delivery rates during courtshipand incubation stages.
Because females were fed in the cavitiesfor only the first 12 nights of the nestlingstage, and brood size varied among nests (2-3
nestlings) , the delivery rate during the nest-ling stage could not be determined directly. To
estimate the rate after hatching, we first
assumed that females consume two arthropods per
hour during the 12 davs after hatch (the
delivery rate during the last days of incuba-
tion) . We then subtracted two deliveries per
hour per female from the total deliveriestallied during a night's observations. The
remaining number of deliveries then was divided
by the number of young being fed, and a meanhourly rate per young for each 4-night period
was determined as above. A delivery rate for a
brood of three was estimated by multiplying the
mean hourly rate per young by 3.
Body mass of adults and owlets were deter-
mined to the nearest 0.5 g with Pesola spring
scales. No attempt was made to adjust for
stomach contents. Adults were weighed at night
after some foraging had occurred. Nestlings
were weighed in the latter half of the diurnal
fasting period. We examined seasonal lability
of body mass using mean weights of owls captured
during the stages of nesting. Seasonal changes
in mass of individuals, for which we had
repeated measures, mimicked the seasonal pat-
terns of the means.
240
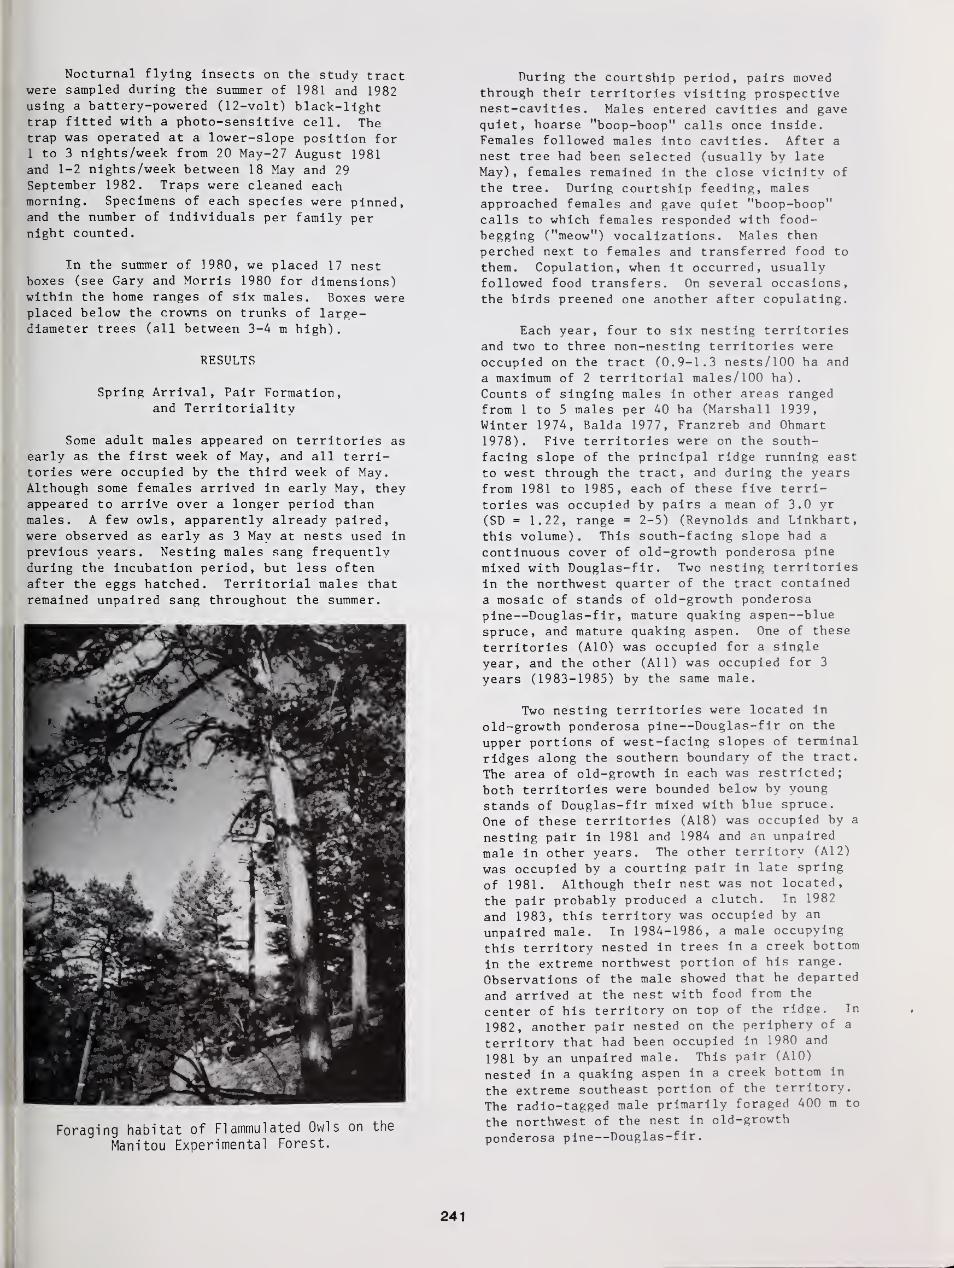
Nocturnal flying Insects on the study tractwere sampled during the summer of 1981 and 1982using a battery-powered (12-volt) black-lighttrap fitted with a photo-sensitive cell. Thetrap was operated at a lower-slope position for1 to 3 nights/week from 20 May-27 August 1981and 1-2 nights/week between 18 May and 29September 1982. Traps were cleaned eachmorning. Specimens of each species were pinned,and the number of individuals per family pernight counted.
In the summer of 1980, we placed 17 nestboxes (see Gary and Morris 1980 for dimensions)within the home ranges of six males. Boxes wereplaced below the crowns on trunks of large-diameter trees (all between 3-4 m bigh).
RESULTS
Spring Arrival, Pair Formation,and Territoriality
Some adult males appeared on territories as
early as the first week of May, and all terri-tories were occupied by the third week of May.Although some females arrived in early May, theyappeared to arrive over a longer period thanmales. A few owls, apparently already paired,were observed as early as 3 May at nests used in
previous years. Nesting males sang frequentlyduring the incubation period, but less oftenafter the eggs hatched. Territorial males that
remained unpaired sang throughout the summer.
Foraging habitat of Fl ammulated Owls on the
Manitou Experimental Forest.
During the courtship period, pairs movedthrough their territories visiting prospectivenest-cavities. Males entered cavities and gavequiet, hoarse "boop-boop" calls once inside.Females followed males into cavities. After a
nest tree had been selected (usually by lateMay), females remained in tbe close vicinitv of
the tree. During courtsbip feeding, malesapproached females and gave quiet "boop-boop"calls to which females responded with food-begging ("meow") vocalizations. Males then
perched next to females and transferred food to
them. Copulation, when it occurred, usuallyfollowed food transfers. On several occasions,the birds preened one another after copulating.
Each year, four to six nesting territoriesand two to three non-nesting territories wereoccupied on the tract (0.9-1.3 nests/100 ha and
a maximum of 2 territorial males/100 ha).
Counts of singing males in other areas rangedfrom 1 to 5 males per AO ha (Marshall 1939,
Winter 1974, Balda 1977, Franzreb and Ohmart1978) . Five territories were on the south-facing slope of the principal ridge running east
to west through the tract, and during the yearsfrom 1981 to 1985, each of these five terri-tories was occupied by pairs a mean of 3.0 yr
(SD = 1.22, range = 2-5) (Revnolds and Linkhart,
this volume). This south-facing slope had a
continuous cover of old-growth ponderosa pine
mixed with Douglas-fir. Two nesting territories
in the northwest quarter of the tract contained
a mosaic of stands of old-growth ponderosapine—Douglas-fir, mature quaking aspen—blue
spruce, and mature quaking aspen. One of these
territories (A10) was occupied for a single
year, and the other (All) was occupied for 3
years (1983-1985) by the same male.
Two nesting territories were located in
old-growth ponderosa pine—Douglas-fir on the
upper portions of west-facing slopes of terminal
ridges along the southern boundary of the tract.
The area of old-growth in each was restricted;
both territories were bounded helow by young
stands of Douglas-fir mixed with blue spruce.
One of these territories (A18) was occupied by a
nesting pair in 1981 and 1984 and an unpaired
male in other years. The other territory (A12)
was occupied by a courting pair in late spring
of 1981. Although their nest was not located,
the pair probably produced a clutch. In 1982
and 1983, this territory was occupied by an
unpaired male. In 1984-1986, a male occupying
this territory nested in trees in a creek bottom
in the extreme northwest portion of his range.
Observations of the male showed that he departed
and arrived at the nest with food from the
center of his territory on top of the ridge. In
1982, another pair nested on the periphery of a
territory that had been occupied in 1980 and
1981 by an unpaired male. This pair (A10)
nested in a quaking aspen in a creek bottom in
the extreme southeast portion of the territory.
The radio-tagged male primarily foraged 400 m to
the northwest of the nest in old-growth
ponderosa pine—Douglas-fir.
241
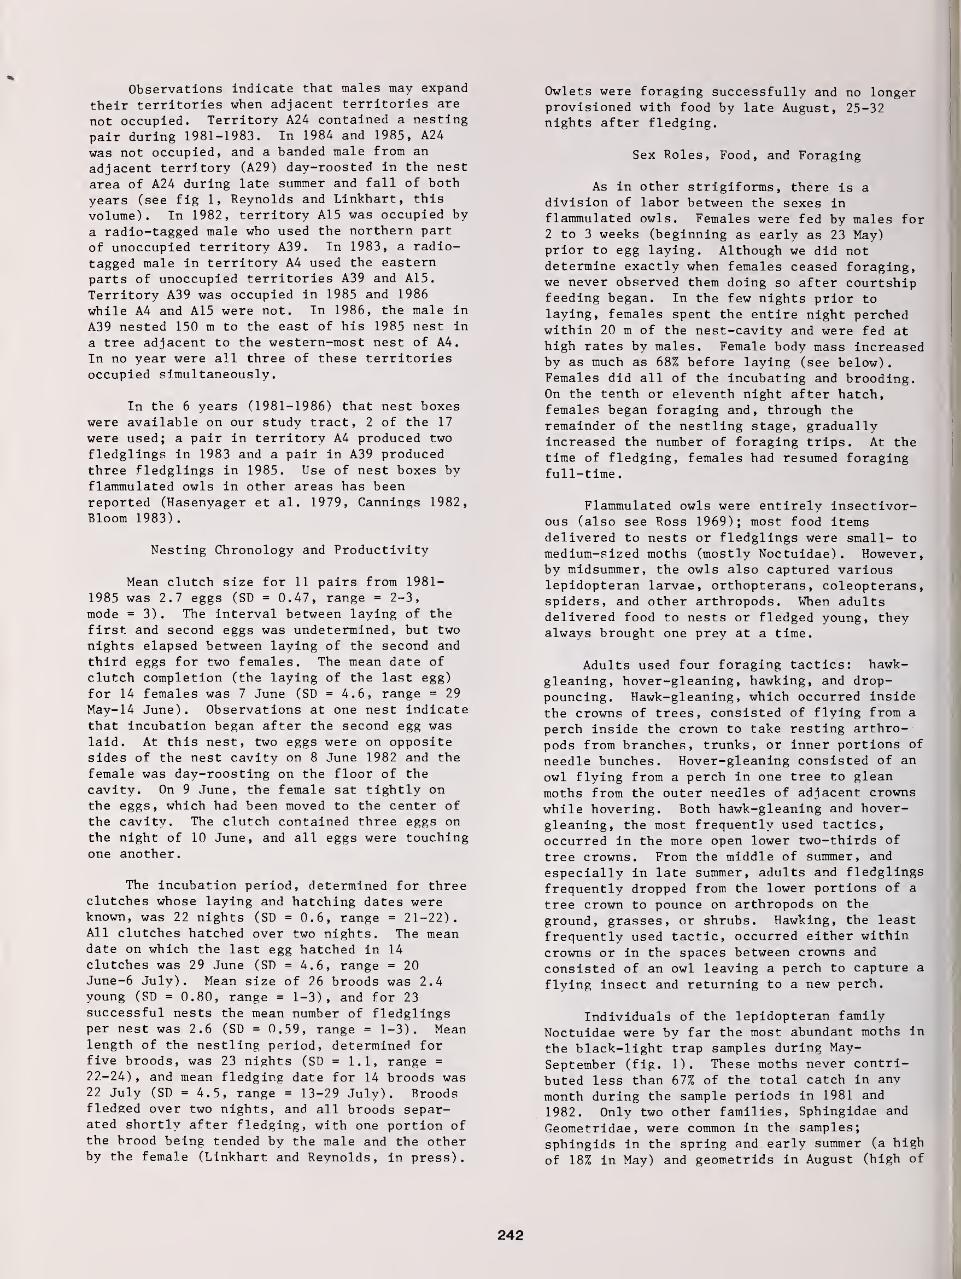
Observations indicate that males may expand
their territories when adjacent territories are
not occupied. Territory A24 contained a nesting
pair during 1981-1983. In 1984 and 1985, A24
was not occupied, and a banded male from an
adjacent territory (A29) day-roosted in the nest
area of A24 during late summer and fall of both
years (see fig 1, Reynolds and Linkhart , this
volume). In 1982, territory A15 was occupied by
a radio-tagged male who used the northern part
of unoccupied territory A39. In 1983, a radio-
tagged male in territory A4 used the easternparts of unoccupied territories A39 and A15.
Territory A39 was occupied in 1985 and 1986
while A4 and A15 were not. In 1986, the male in
A39 nested 150 m to the east of his 1985 nest in
a tree adjacent to the western-most nest of A4.
In no year were all three of these territoriesoccupied simultaneously.
In the 6 years (1981-1986) that nest boxeswere available on our study tract, 2 of the 17
were used; a pair in territory A4 produced two
fledglings in 1983 and a pair in A39 producedthree fledglings in 1985. Use of nest boxes byflammulated owls in other areas has beenreported (Hasenyager et al. 1979, Cannings 1982,
Bloom 1983)
.
Nesting Chronology and Productivity
Mean clutch size for 11 pairs from 1981—
1985 was 2.7 eggs (SD = 0.47, range = 2-3,
mode = 3) . The interval between laying of the
first and second eggs was undetermined, but two
nights elapsed between laying of the second and
third eggs for two females. The mean date of
clutch completion (the laying of the last egg)
for 14 females was 7 June (SD = 4.6, range = 29
May-14 June). Observations at one nest indicatethat incubation began after the second egg waslaid. At this nest, two eggs were on oppositesides of the nest cavity on 8 June 1982 and the
female was day-roosting on the floor of the
cavity. On 9 June, the female sat tightly onthe eggs, which had been moved to the center of
the cavity. The clutch contained three eggs onthe night of 10 June, and all eggs were touchingone another.
The incubation period, determined for threeclutches whose laying and hatching dates wereknown, was 22 nights (SD = 0.6, range = 21-22).All clutches hatched over two nights. The meandate on which the last egg hatched in 14
clutches was 29 June (SD = 4.6, range = 20June-6 July). Mean size of 26 broods was 2.4young (SD = 0.80, range = 1-3), and for 23successful nests the mean number of fledglingsper nest was 2.6 (SD = 0.59, range = 1-3). Meanlength of the nestling period, determined forfive broods, was 23 nights (SD = 1.1, range =
22-24) , and mean fledging date for 14 broods was22 July (SD =4.5, range = 13-29 July). Broodsfledged over two nights, and all broods separ-ated shortly after fledging, with one portion ofthe brood being tended by the male and the otherby the female (Linkhart and Reynolds, in press).
Owlets were foraging successfully and no longerprovisioned with food by late August, 25-32nights after fledging.
Sex Roles, Food, and Foraging
As in other strigiforms, there is adivision of labor between the sexes inflammulated owls. Females were fed by males for2 to 3 weeks (beginning as early as 23 May)prior to egg laying. Although we did notdetermine exactly when females ceased foraging,we never observed them doing so after courtshipfeeding began. In the few nights prior tolaying, females spent the entire night perchedwithin 20 m of the nest-cavity and were fed athigh rates by males. Female body mass increasedby as much as 68% before laying (see below).Females did all of the incubating and brooding.On the tenth or eleventh night after hatch,females began foraging and, through theremainder of the nestling stage, graduallyincreased the number of foraging trips. At thetime of fledging, females had resumed foragingfull-time.
Flammulated owls were entirely insectivor-ous (also see Ross 1969); most food itemsdelivered to nests or fledglings were small- tomedium-sized moths (mostly Noctuidae) . However,by midsummer, the owls also captured variouslepidopteran larvae, orthopterans , coleopterans
,
spiders, and other arthropods. When adultsdelivered food to nests or fledged young, theyalways brought one prey at a time.
Adults used four foraging tactics: hawk-gleaning, hover-gleaning, hawking, and drop-pouncing. Hawk-gleaning, which occurred inside
the crowns of trees, consisted of flying from a
perch inside the crown to take resting arthro-pods from branches, trunks, or inner portions of
needle bunches. Hover-gleaning consisted of an
owl flying from a perch in one tree to glean
moths from the outer needles of adjacent crowns
while hovering. Both hawk-gleaning and hover-gleaning, the most frequently used tactics,
occurred in the more open lower two-thirds of
tree crowns. From the middle of summer, and
especially in late summer, adults and fledglings
frequently dropped from the lower portions of a
tree crown to pounce on arthropods on the
ground, grasses, or shrubs. Hawking, the least
frequently used tactic, occurred either within
crowns or in the spaces between crowns and
consisted of an owl leaving a perch to capture a
flying insect and returning to a new perch.
Individuals of the lepidopteran family
Noctuidae were by far the most abundant moths in
the black-light trap samples during May-September (fig. 1). These moths never contri-
buted less than 67% of the total catch in any
month during the sample periods in 1981 and
1982. Only two other families, Sphingidae and
Geometridae, were common in the samples;
sphingids in the spring and early summer (a high
of 18% in May) and geometrids in August (high of
242
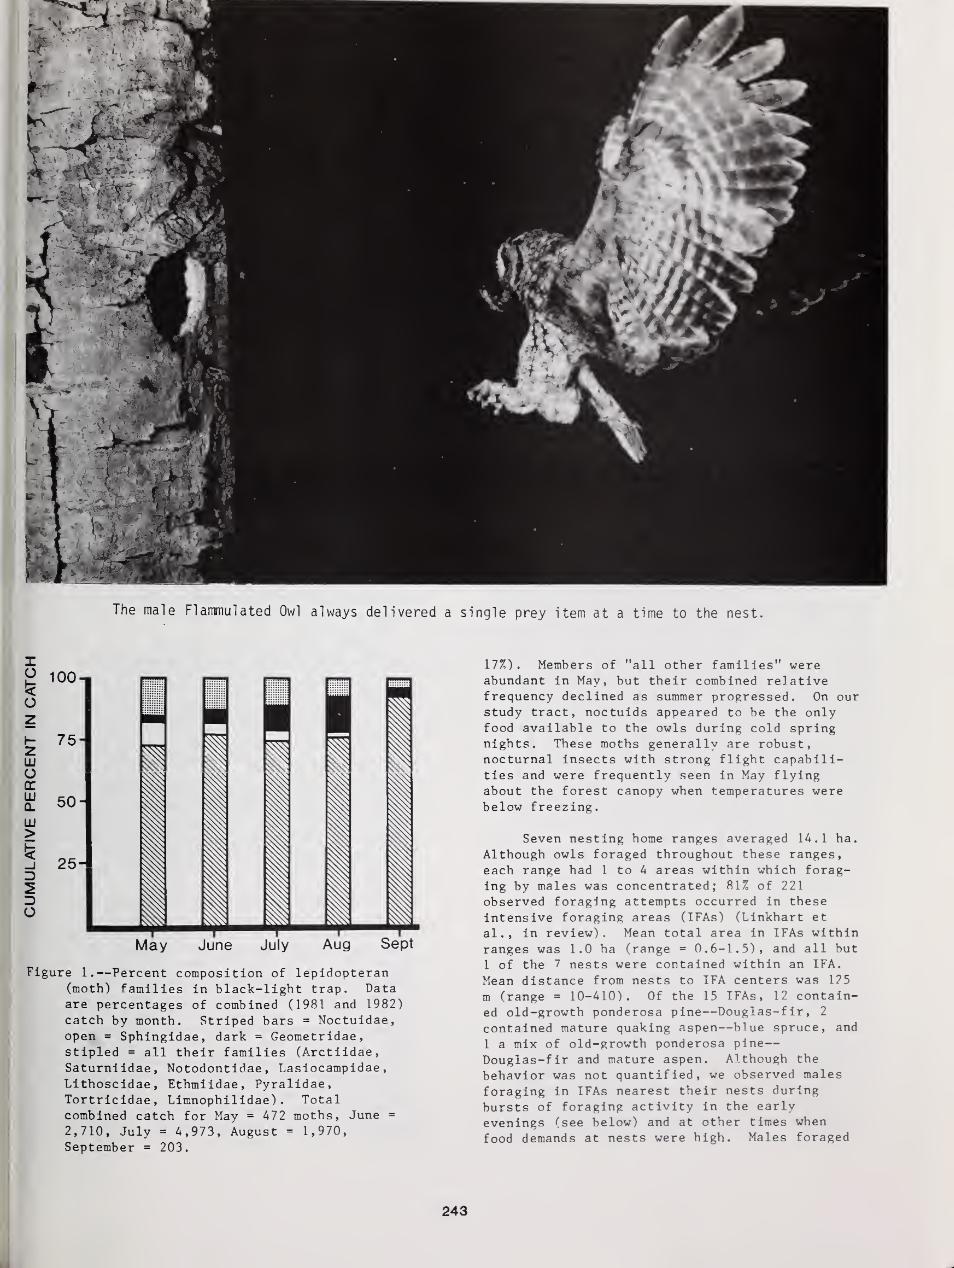
The male Flammulated Owl always delivered a single prey item at a time to the nest.
I
Figure 1.—Percent composition of lepidopteran(moth) families in black-light trap. Dataare percentages of combined (1981 and 1982)
catch by month. Striped bars = Noctuidae,open = Sphingidae, dark = Geometridae,stipled = all tbeir families (Arctiidae,Saturniidae, Notodontidae ,
Lasiocampidae
,
Lithoscidae, Ethmiidae, Pyralidae,Tortricidae, Limnophilidae) . Totalcombined catch for May = 472 moths, June =
2,710, July = 4,973, August = 1,970,September = 203.
17%). Members of "all otber families" wereabundant in May, but their combined relativefrequency declined as summer progressed. On ourstudy tract, noctuids appeared to be the onlyfood available to the owls during cold springnights. These moths generally are robust,nocturnal insects witb strong flight capabili-ties and were frequently seen in May flyingabout the forest canopy when temperatures werebelow freezing.
Seven nesting home ranges averaged 14.1 ha.
Although owls foraged throughout these ranges,each range had 1 to 4 areas within which forag-
ing by males was concentrated; 81% of 221
observed foraging attempts occurred in these
intensive foraging areas (TFAs) (Linkhart et
al., in review). Mean total area in TFAs withinranges was 1.0 ha (range = 0.6-1.5), and all but
1 of the 7 nests were contained within an IFA.
Mean distance from nests to IFA centers was 125
m (range = 10-410). Of the 15 TFAs, 12 contain-
ed old-growth ponderosa pine—Douglas-fir, 2
contained mature quaking aspen—blue spruce, and
1 a mix of old-growth ponderosa pine
—
Douglas-fir and mature aspen. Although the
behavior was not quantified, we observed males
foraging in TFAs nearest their nests during
bursts of foraging activity in the early
evenings (see below) and at other times when
food demands at nests were high. Males foraged
243
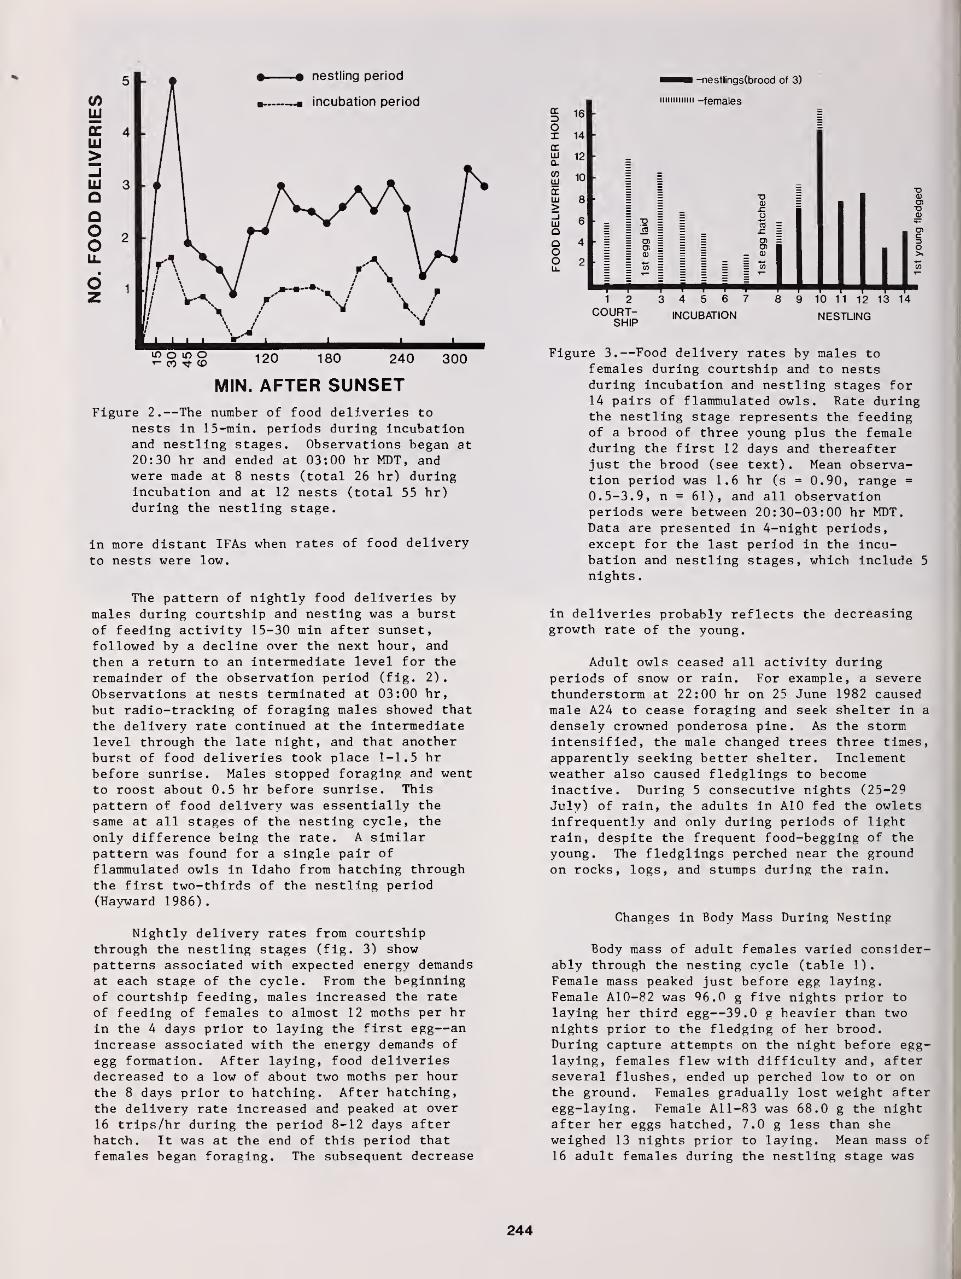
• nestling period
UJ
ELU>-IUJQQOO
- incubation period
10 o to o«- CO ^fr CO 120 180 240 300
MIN. AFTER SUNSETFigure 2.—The number of food deliveries to
nests in 15-min. periods during incubationand nestling stages. Observations began at
20:30 hr and ended at 03:00 hr MDT, andwere made at 8 nests (total 26 hr) duringincubation and at 12 nests (total 55 hr)during the nestling stage.
in more distant IFAs when rates of food delivery
to nests were low.
The pattern of nightly food deliveries bymales during courtship and nesting was a burstof feeding activity 15-30 min after sunset,
followed by a decline over the next hour, and
then a return to an intermediate level for the
remainder of the observation period (fig. 2).
Observations at nests terminated at 03:00 hr,
but radio-tracking of foraging males showed that
the delivery rate continued at the intermediatelevel through the late night, and that anotherburst of food deliveries took place 1-1.5 hrbefore sunrise. Males stopped foraging and wentto roost about 0.5 hr before sunrise. This
pattern of food delivery was essentially the
same at all stages of the nesting cycle, the
only difference being the rate. A similarpattern was found for a single pair of
flammulated owls in Idaho from hatching throughthe first two-thirds of the nestling period(Hayward 1986).
Nightly delivery rates from courtshipthrough the nestling stages (fig. 3) showpatterns associated with expected energy demandsat each stage of the cycle. From the beginningof courtship feeding, males increased the rate
of feeding of females to almost 12 moths per hrin the 4 days prior to laying the first egg—an
increase associated with the energy demands of
egg formation. After laying, food deliveriesdecreased to a low of about two moths per hourthe 8 days prior to hatching. After hatching,the delivery rate increased and peaked at over
16 trips/hr during the period 8-12 days afterhatch. It was at the end of this period that
females began foraging. The subsequent decrease
3oXccIII
0-
(0yj
DC111
>_l111
QOOo
16
14
12
10
8
6
4
2
-nestlings(brood of 3)
iiiiiiiiniii -females
= -q = =
= o> = == oi = =
DCD
_ 0)
1 2
COURT-SHIP
T P T T I
3 4 5 6 7
INCUBATION
ID
O)
c3o
8 9 10 11 12 13 14
NESTLING
Figure 3.—Food delivery rates by males tofemales during courtship and to nestsduring incubation and nestling stages for14 pairs of flammulated owls. Rate duringthe nestling stage represents the feedingof a brood of three young plus the femaleduring the first 12 days and thereafterjust the brood (see text) . Mean observa-tion period was 1.6 hr (s = 0.90, range =
0.5-3.9, n = 61), and all observationperiods were between 20:30-03:00 hr MDT.Data are presented in 4-night periods,except for the last period in the incu-bation and nestling stages, which include 5
nights
.
in deliveries probably reflects the decreasinggrowth rate of the young.
Adult owls ceased all activity duringperiods of snow or rain. For example, a severethunderstorm at 22:00 hr on 25 June 1982 causedmale A24 to cease foraging and seek shelter in a
densely crowned ponderosa pine. As the stormintensified, the male changed trees three times,
apparently seeking better shelter. Inclementweather also caused fledglings to becomeinactive. During 5 consecutive nights (25-29
July) of rain, the adults In A10 fed the owletsinfrequently and only during periods of lightrain, despite the frequent food-begging of the
young. The fledglings perched near the groundon rocks, logs, and stumps during the rain.
Changes in Body Mass During Nesting
Body mass of adult females varied consider-ably through the nesting cycle (table 1).
Female mass peaked just before egg laying.Female A10-82 was 96.0 g five nights prior to
laying her third egg—39.0 g heavier than twonights prior to the fledging of her brood.During capture attempts on the night before egg-laying, females flew with difficulty and, afterseveral flushes, ended up perched low to or onthe ground. Females gradually lost weight afteregg-laying. Female All-83 was 68.0 g the nightafter her eggs hatched, 7.0 g less than she
weighed 13 nights prior to laying. Mean mass of
16 adult females during the nestling stage was
244
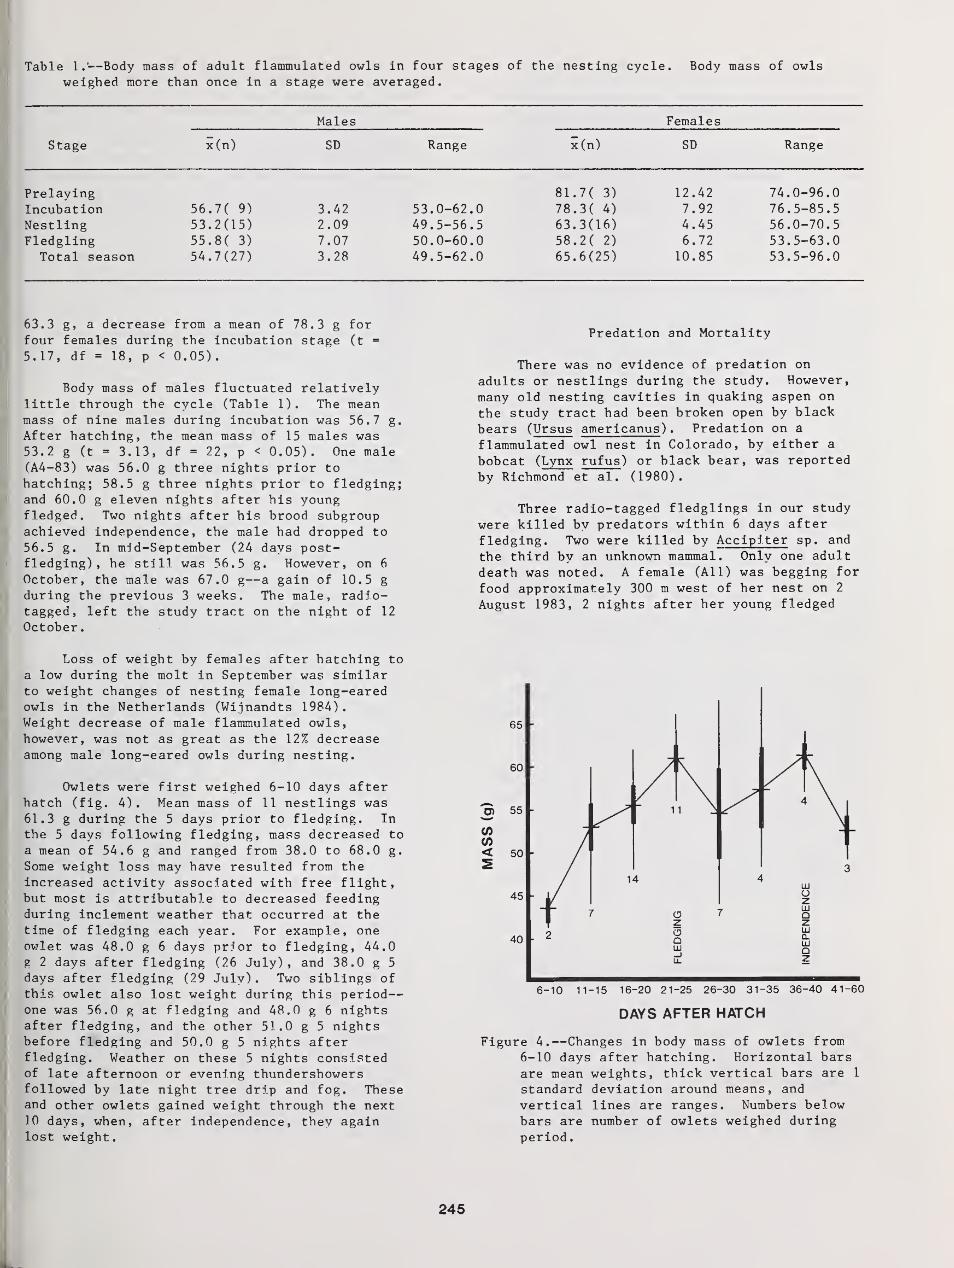
Table 1.*—Body mass of adult flammulated owls In four stages of the nesting cycle. Body mass of owls
weighed more than once In a stage were averaged.
Males Females
Stage x(n) SD Range x(n) SD Range
PrelaylngIncubationNestlingFledgling
Total season
56. 7( 9)
53.2(15)55. 8( 3)
54.7(27)
3.422.097.073.28
53.0-62.049.5-56.550.0-60.049.5-62.0
81. 7( 3)
78. 3( 4)
63.3(16)58. 2( 2)
65.6(25)
12.42
7.924.456.7210.85
74.0-96.076.5-85.556.0-70.553.5-63.053.5-96.0
63.3 g, a decrease from a mean of 78.3 g forfour females during the incubation stage (t =
5.17, df = 18, p < 0.05).
Body mass of males fluctuated relativelylittle through the cycle (Table 1). The meanmass of nine males during incubation was 56.7 g.
After hatching, the mean mass of 15 males was53.2 g (t = 3.13, df = 22, p < 0.05). One male(A4-83) was 56.0 g three nights prior to
hatching; 58.5 g three nights prior to fledging;and 60.0 g eleven nights after his youngfledged. Two nights after his brood subgroupachieved independence, the male had dropped to56.5 g. In mid-September (24 days post-fledging), he still was 56.5 g. However, on 6
October, the male was 67.0 g—a gain of 10.5 gduring the previous 3 weeks. The male, radio-tagged, left the study tract on the night of 12
October.
Loss of weight by females after hatching to
a low during the molt in September was similarto weight changes of nesting female long-earedowls in the Netherlands (Wi jnandts 1984)
.
Weight decrease of male flammulated owls,however, was not as great as the 12% decreaseamong male long-eared owls during nesting.
Owlets were first weighed 6-10 days afterhatch (fig. 4). Mean mass of 11 nestlings was61.3 g during the 5 days prior to fledging. In
the 5 days following fledging, mass decreased to
a mean of 54.6 g and ranged from 38.0 to 68.0 g.
Some weight loss may have resulted from the
increased activity associated with free flight,but most is attributable to decreased feedingduring inclement weather that occurred at thetime of fledging each year. For example, oneowlet was 48.0 g 6 days prior to fledging, 44.0
g 2 days after fledging (26 July), and 38.0 g 5
days after fledging (29 July). Two siblings ofthis owlet also lost weight during this period
—
one was 56.0 g at fledging and 48.0 g 6 nightsafter fledging, and the other 51.0 g 5 nightsbefore fledging and 50.0 g 5 nights afterfledging. Weather on these 5 nights consistedof late afternoon or evening thundershowersfollowed by late night tree drip and fog. Theseand other owlets gained weight through the next10 days, when, after independence, they againlost weight.
Predation and Mortality
There was no evidence of predation on
adults or nestlings during the study. However,
many old nesting cavities in quaking aspen on
the study tract had been broken open by black
bears (Ursus americanus ) . Predation on a
flammulated owl nest in Colorado, by either a
bobcat (Lynx rufus ) or black bear, was reported
by Richmond et al. (1980).
Three radio-tagged fledglings in our study
were killed bv predators within 6 days after
fledging. Two were killed by Accipi ter sp. and
the third by an unknown mammal. Only one adult
death was noted. A female (All) was begging for
food approximately 300 m west of her nest on 2
August 1983, 2 nights after her young fledged
65 -
6-10 11-15 16-20 21-25 26-30 31-35 36-40 41-60
DAYS AFTER HATCH
Figure 4.—Changes in body mass of owlets from6-10 days after hatching. Horizontal bars
are mean weights, thick vertical bars are 1
standard deviation around means, and
vertical lines are ranges. Numbers belowbars are number of owlets weighed duringperiod
.
245
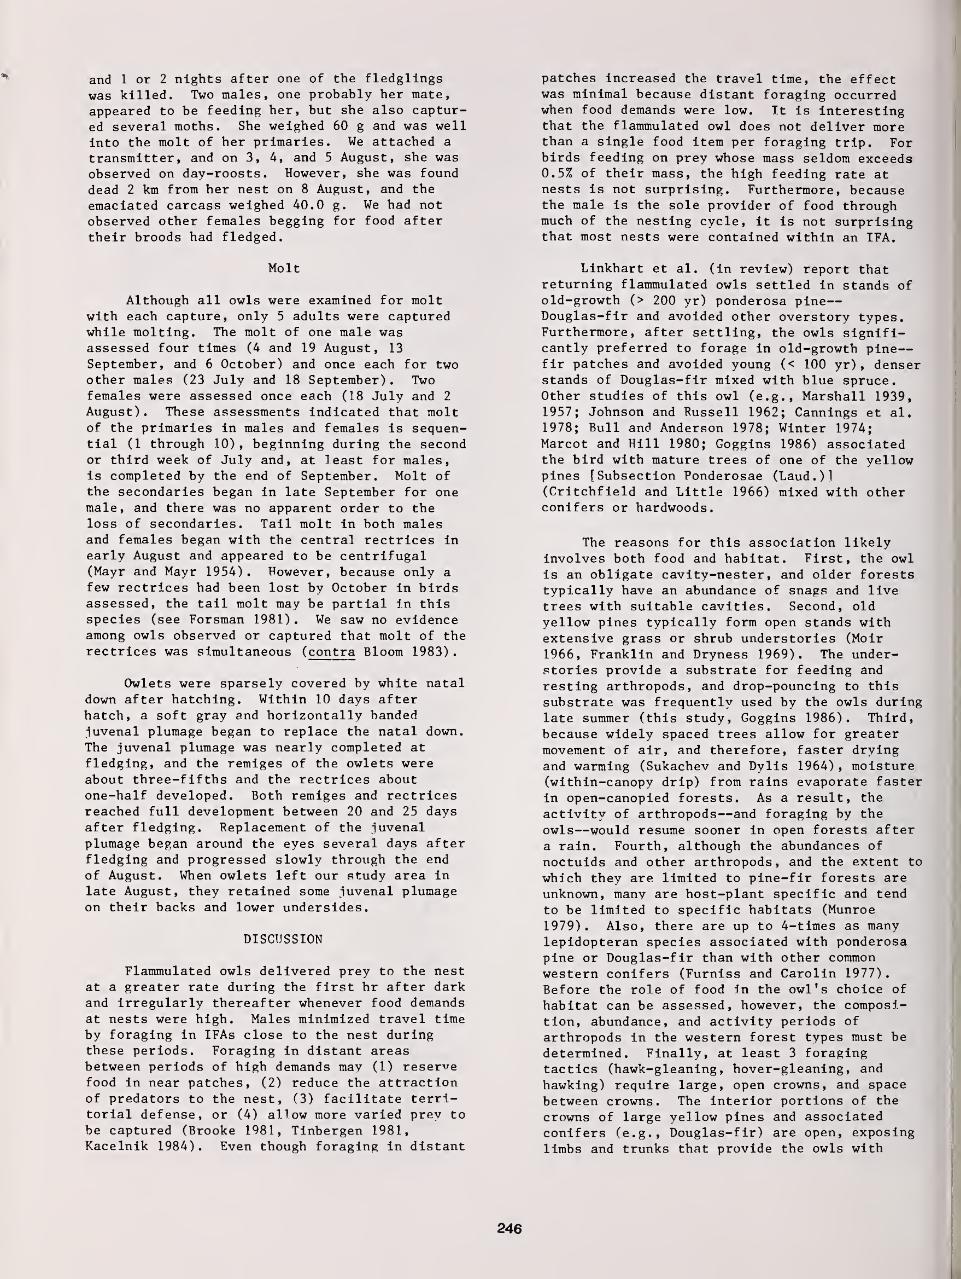
and 1 or 2 nights after one of the fledglings
was killed. Two males, one probably her mate,
appeared to be feeding her, but she also captur-
ed several moths. She weighed 60 g and was well
into the molt of her primaries. We attached a
transmitter, and on 3, 4, and 5 August, she wasobserved on day-roosts. However, she was found
dead 2 km from her nest on 8 August, and the
emaciated carcass weighed 40.0 g. We had notobserved other females begging for food aftertheir broods had fledged.
Molt
Although all owls were examined for moltwith each capture, only 5 adults were capturedwhile molting. The molt of one male wasassessed four times (4 and 19 August, 13
September, and 6 October) and once each for twoother males (23 July and 18 September) . Twofemales were assessed once each (18 July and 2
August) . These assessments indicated that moltof the primaries in males and females is sequen-tial (1 through 10), beginning during the secondor third week of July and, at least for males,is completed by the end of September. Molt ofthe secondaries began in late September for onemale, and there was no apparent order to theloss of secondaries. Tail molt in both malesand females began with the central rectrices inearly August and appeared to be centrifugal(Mayr and Mayr 1954). However, because only afew rectrices had been lost by October in birdsassessed, the tail molt may be partial in thisspecies (see Forsman 1981). We saw no evidenceamong owls observed or captured that molt of therectrices was simultaneous (contra Bloom 1983)
.
Owlets were sparsely covered by white nataldown after hatching. Within 10 days afterhatch, a soft gray and horizontally bandedjuvenal plumage began to replace the natal down.
The juvenal plumage was nearly completed at
fledging, and the remiges of the owlets wereabout three-fifths and the rectrices aboutone-half developed. Both remiges and rectricesreached full development between 20 and 25 daysafter fledging. Replacement of the juvenalplumage began around the eyes several days afterfledging and progressed slowly through the end
of August. When owlets left our study area inlate August, they retained some iuvenal plumageon their backs and lower undersides.
DISCUSSION
Flammulated owls delivered prey to the nestat a greater rate during the first hr after darkand irregularly thereafter whenever food demandsat nests were high. Males minimized travel timeby foraging in IFAs close to the nest duringthese periods. Foraging in distant areasbetween periods of high demands may (1) reservefood in near patches, (2) reduce the attractionof predators to the nest, (3) facilitate terri-torial defense, or (4) allow more varied prey tobe captured (Brooke 1981, Tinbergen 1981,Kacelnik 1984). Even though foraging in distant
patches increased the travel time, the effectwas minimal because distant foraging occurredwhen food demands were low. It is interestingthat the flammulated owl does not deliver morethan a single food item per foraging trip. Forbirds feeding on prey whose mass seldom exceeds0.5% of their mass, the high feeding rate atnests is not surprising. Furthermore, becausethe male is the sole provider of food throughmuch of the nesting cycle, it is not surprisingthat most nests were contained within an IFA.
Linkhart et al. (in review) report thatreturning flammulated owls settled in stands ofold-growth (> 200 yr) ponderosa pine
—
Douglas-fir and avoided other overstory types.Furthermore, after settling, the owls signifi-cantly preferred to forage in old-growth pine
—
fir patches and avoided young (< 100 yr) , denserstands of Douglas-fir mixed with blue spruce.Other studies of this owl (e.g., Marshall 1939,1957; Johnson and Russell 1962; Cannings et al.
1978; Bull and Anderson 1978; Winter 1974;Marcot and Hill 1980; Goggins 1986) associatedthe bird with mature trees of one of the yellowpines [Subsection Ponderosae (Laud.)l(Critchfield and Little 1966) mixed with otherconifers or hardwoods.
The reasons for this association likelyinvolves both food and habitat. First, the owl
is an obligate cavity-nester , and older foreststypically have an abundance of snags and livetrees with suitable cavities. Second, oldyellow pines typically form open stands withextensive grass or shrub understories (Moir
1966, Franklin and Dryness 1969). The under-stories provide a substrate for feeding and
resting arthropods, and drop-pouncing to thissubstrate was frequently used by the owls duringlate summer (this study, Goggins 1986). Third,because widely spaced trees allow for greatermovement of air, and therefore, faster dryingand warming (Sukachev and Dylis 1964) , moisture(within-canopy drip) from rains evaporate fasterin open-canopied forests. As a result, the
activity of arthropods—and foraging by the
owls—would resume sooner in open forests aftera rain. Fourth, although the abundances of
noctuids and other arthropods, and the extent to
which they are limited to pine-fir forests areunknown, many are host-plant specific and tend
to be limited to specific habitats (Munroe
1979). Also, there are up to 4-times as manylepidopteran species associated with ponderosapine or Douglas-fir than with other commonwestern conifers (Furniss and Carolin 1977)
.
Before the role of food in the owl's choice of
habitat can be assessed, however, the composi-tion, abundance, and activity periods of
arthropods in the western forest types must bedetermined. Finally, at least 3 foragingtactics (hawk-gleaning, hover-gleaning, and
hawking) require large, open crowns, and space
between crowns. The interior portions of the
crowns of large yellow pines and associatedconifers (e.g., Douglas-fir) are open, exposinglimbs and trunks that provide the owls with
246
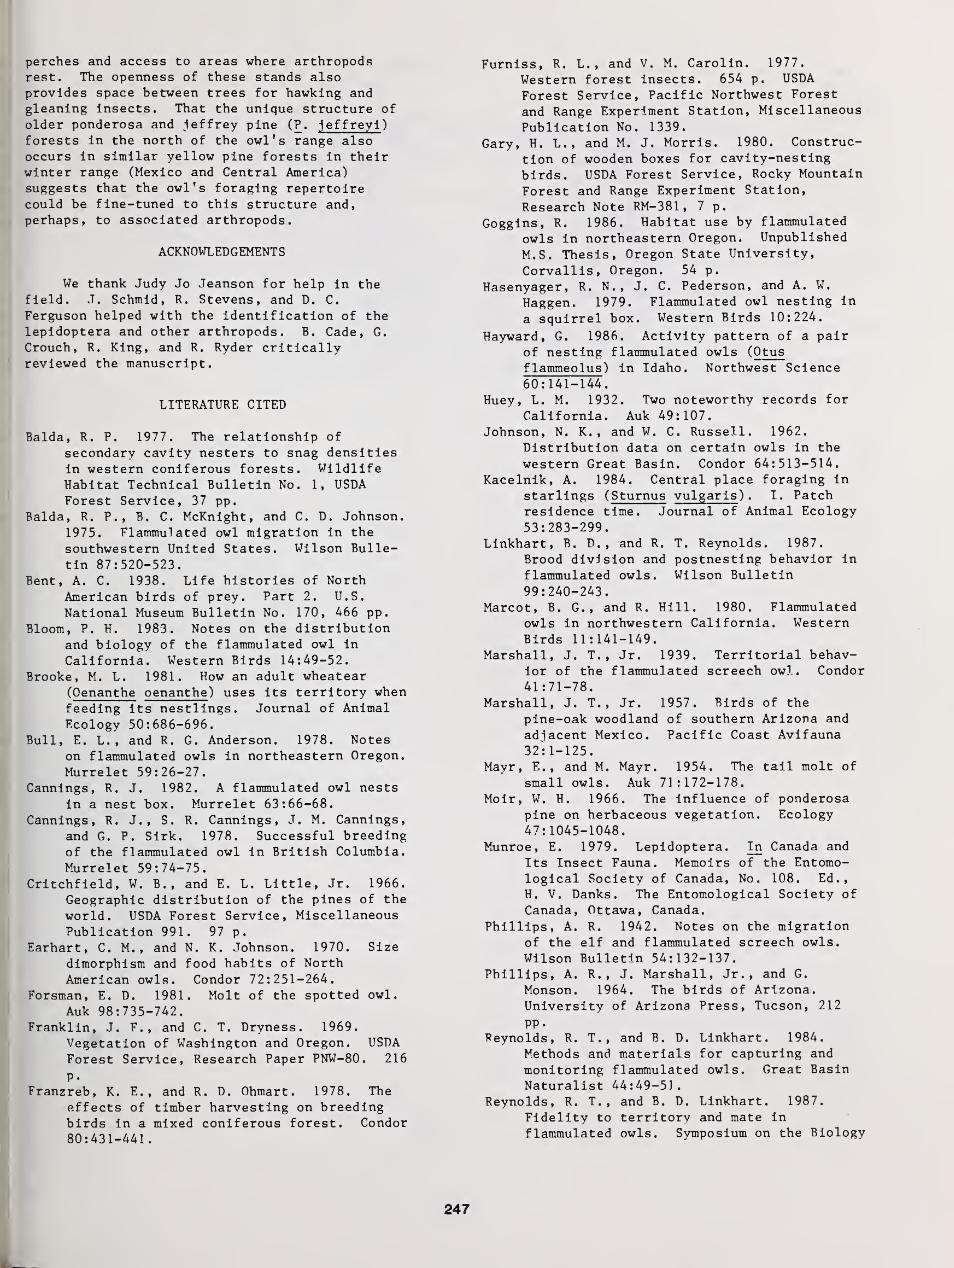
perches and access to areas where arthropodsrest. The openness of these stands alsoprovides space between trees for hawking andgleaning insects. That the unique structure of
older ponderosa and Jeffrey pine (P. jef freyi )
forests in the north of the owl's range alsooccurs in similar yellow pine forests in theirwinter range (Mexico and Central America)suggests that the owl's foraging repertoirecould be fine-tuned to this structure and,perhaps, to associated arthropods.
ACKNOWLEDGEMENTS
We thank Judy Jo Jeanson for help in thefield. J. Schmid, R. Stevens, and D. C.
Ferguson helped with the identification of thelepidoptera and other arthropods. B. Cade, G.
Crouch, R. King, and R. Ryder criticallyreviewed the manuscript.
LITERATURE CITED
Balda, R. P. 1977. The relationship of
secondary cavity nesters to snag densitiesin western coniferous forests. WildlifeHabitat Technical Bulletin No. 1, USDAForest Service, 37 pp.
Balda, R. P., B. C. McKnight, and C. D. Johnson.
1975. Flammulated owl migration in the
southwestern United States. Wilson Bulle-tin 87:520-523.
Bent, A. C. 1938. Life histories of NorthAmerican birds of prey. Part 2. U.S.
National Museum Bulletin No. 170, 466 pp.Bloom, P. H. 1983. Notes on the distribution
and biology of the flammulated owl in
California. Western Birds 14:49-52.
Brooke, M. L. 1981. How an adult wheatear(Oenanthe oenanthe ) uses its territory whenfeeding its nestlings. Journal of AnimalEcology 50:686-696.
Bull, E. L., and R. G. Anderson. 1978. Noteson flammulated owls in northeastern Oregon.
Murrelet 59:26-27.Cannings, R. J. 1982. A flammulated owl nests
in a nest box. Murrelet 63:66-68.Cannings, R. J., S. R. Cannings, J. M. Cannings,
and G. P. Sirk. 1978. Successful breedingof the flammulated owl in British Columbia.
Murrelet 59:74-75.Critchfield, W. B., and E. L. Little, Jr. 1966.
Geographic distribution of the pines of the
world. USDA Forest Service, MiscellaneousPublication 991. 97 p.
Earhart, C. M. , and N. K. Johnson. 1970. Size
dimorphism and food habits of NorthAmerican owls. Condor 72:251-264.
Forsman, E. D. 1981. Molt of the spotted owl.
Auk 98:735-742.Franklin, J. F., and C. T. Dryness. 1969.
Vegetation of Washington and Oregon. USDAForest Service, Research Paper PNW-80. 216
P-Franzreb, K. E. , and R. D. Ohmart. 1978. The
effects of timber harvesting on breedingbirds in a mixed coniferous forest. Condor80:431-441.
Furniss, R. L., and V. M. Carolin. 1977.
Western forest insects. 654 p. USDAForest Service, Pacific Northwest Forest
and Range Experiment Station, Miscellaneous
Publication No. 1339.
Gary, H. L., and M. J. Morris. 1980. Construc-
tion of wooden boxes for cavity-nesting
birds. USDA Forest Service, Rocky Mountain
Forest and Range Experiment Station,
Research Note RM-381, 7 p.
Goggins, R. 1986. Habitat use by flammulated
owls in northeastern Oregon. Unpublished
M.S. Thesis, Oregon State University,
Corvallis, Oregon. 54 p.
Hasenyager, R. N. , J. C. Pederson, and A. W.
Haggen. 1979. Flammulated owl nesting in
a squirrel box. Western Birds 10:224.
Hayward, G. 1986. Activity pattern of a pairof nesting flammulated owls (Otus
f lammeolus ) in Idaho. Northwest Science60: 141-144.
Huey, L. M. 1932. Two noteworthy records for
California. Auk 49:107.Johnson, N. K. , and W. C. Russell. 1962.
Distribution data on certain owls in the
western Great Basin. Condor 64:513-514.Kacelnik, A. 1984. Central place foraging in
starlings (Sturnus vulgaris ) . I. Patchresidence time. Journal of Animal Ecology53:283-299.
Linkhart, B. D., and R. T. Reynolds. 1987.
Brood division and postnesting behavior in
flammulated owls. Wilson Bulletin99:240-243.
Marcot, B. G., and R. Hill. 1980. Flammulatedowls in northwestern California. WesternBirds 11:141-149.
Marshall, J. T. , Jr. 1939. Territorial behav-ior of the flammulated screech owl. Condor41:71-78.
Marshall, J. T. , Jr. 1957. Birds of the
pine-oak woodland of southern Arizona and
adjacent Mexico. Pacific Coast Avifauna32-1-125.
Mavr, E., and M. Mayr. 1954. The tail molt of
small owls. Auk 71:172-178.Moir, W. H. 1966. The influence of ponderosa
pine on herbaceous vegetation. Ecology47:1045-1048.
Munroe, E. 1979. Lepidoptera. In Canada and
Its Insect Fauna. Memoirs of the Entomo-logical Society of Canada, No. 108. Ed.,
H. V. Danks. The Entomological Society of
Canada, Ottawa, Canada.
Phillips, A. R. 1942. Notes on the migrationof the elf and flammulated screech owls.
Wilson Bulletin 54:132-137.Phillips, A. R., J. Marshall, Jr., and G.
Monson. 1964. The birds of Arizona.University of Arizona Press, Tucson, 212
pp.Reynolds, R. T., and B. D. Linkhart. 1984.
Methods and materials for capturing and
monitoring flammulated owls. Great BasinNaturalist 44:49-51
.
Reynolds, R. T. , and B. D. Linkhart. 1987.
Fidelity to territory and mate in
flammulated owls. Symposium on the Biology
247
and Conservation of Northern Forest Owls,
Winnipeg, Manitoba, Canada, February 3-7.
Reynolds, R. T., B. D. Linkhart, and J. J.
Jeanson. 1985. Characteristics of snags
and trees containing cavities in a Colorado
conifer forest. USDA Forest Service, Rocky
Mountain Forest and Range ExperimentStation, Research Note RM-455, 6 pp.
Richmond, M. L. , L. R. DeWeese, and R. E.
Pillmore. 1980. Brief observations on the
breeding biology of the flammulated owl in
Colorado. Western Birds 11:35-46.
Ross, A. 1969. Ecological aspects of the food
habits of insectivorous screech owls.
Proceedings of Western Foundation of
Vertebrate Zoology 1:301-344.
Sukachev, V., and N. Dylis. 1964. Fundamentals
of forest biogeocoenology . Oliver and
Boyd, London. 672 p.
Sutton, G. M., and T. D. Burleigh. 1940. Birds
of Las Vigas, Vera Cruz. Auk 57:234-243.
Tinbergen, J. M. 1981. Foraging decisions instarlings ( Sturnis vulgaris L.). Ardea69:1-67.
Webb, B. 1982. Distribution and nestingrequirements of montane forest owls inColorado. Part III: flammulated owl (Otusflammeolus ) . Colorado Field OrnithologistJournal 16:76-81.
Wiens, J. A. 1969. An approach to the study ofecological relationships among grasslandbirds. Ornithological Monographs 8.
Wijnandts, H. 1984. Ecological energetics ofthe long-eared owl (Asio otus ) . Ardea72:1-92.
Winter, J. 1971. Some critical notes onfinding and seeing the flammulated owl.Birding 3:205-209.
Winter, J. 1974. The distribution of theflammulated owl in California. WesternBirds 5:25-44.
248
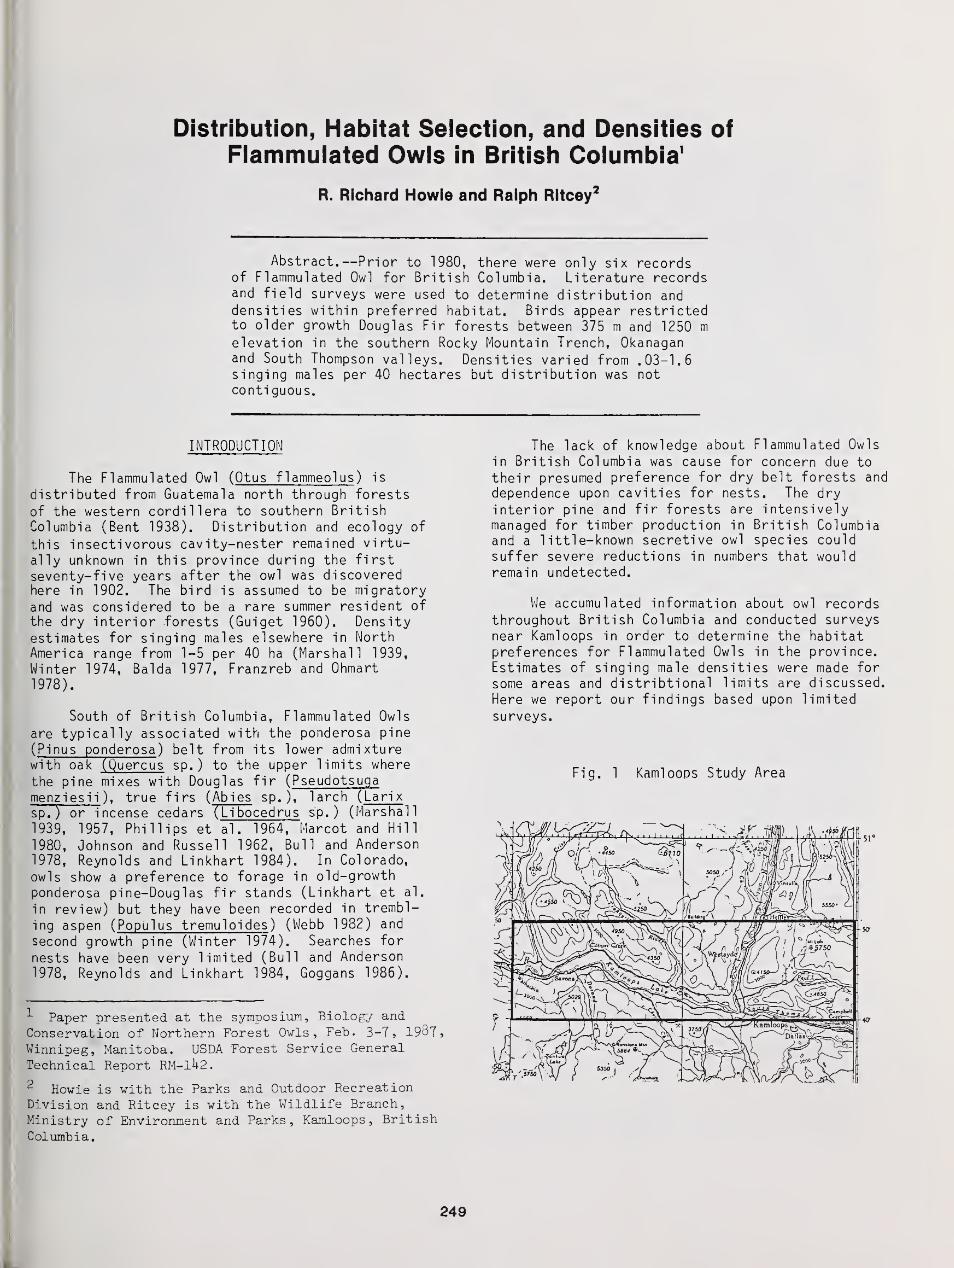
Distribution, Habitat Selection, and Densities of
Flammulated Owls in British Columbia 1
R. Richard Howie and Ralph Rltcey2
Abstract.—Prior to 1980, there were only six recordsof Flammulated Owl for British Columbia. Literature recordsand field surveys were used to determine distribution anddensities within preferred habitat. Birds appear restrictedto older growth Douglas Fir forests between 375 m and 1250 m
elevation in the southern Rocky Mountain Trench, Okanaganand South Thompson valleys. Densities varied from .03-1.6singing males per 40 hectares but distribution was notconti guous.
INTRODUCTION
The Flammulated Owl ( Otus flammeolus ) is
distributed from Guatemala north through forests
of the western cordillera to southern BritishColumbia (Bent 1938). Distribution and ecology of
this insectivorous cavity-nester remained virtu-
ally unknown in this province during the firstseventy-five years after the owl was discoveredhere in 1902. The bird is assumed to be migratoryand was considered to be a rare summer resident of
the dry interior forests (Guiget 1960). Densityestimates for singing males elsewhere in NorthAmerica range from 1-5 per 40 ha (Marshall 1939,
Winter 1974, Balda 1977, Franzreb and Ohmart1978).
South of British Columbia, Flammulated Owls
are typically associated with the ponderosa pine
( Pinus ponderosa ) belt from its lower admixturewith oak (Quercus sp. ) to the upper limits where
the pine mixes with Douglas fir ( Pseudotsugamenziesii ), true firs ( Abies sp. ), larch ( Larix
sp.) or incense cedars ( Libocedrus sp. ) (Marshall
1939, 1957, Phillips et al. 1964, Marcot and Hill
1980, Johnson and Russell 1962, Bull and Anderson1978, Reynolds and Linkhart 1984). In Colorado,
owls show a preference to forage in old-growth
ponderosa pine-Douglas fir stands (Linkhart et al.
in review) but they have been recorded in trembl-
ing aspen ( Populus tremuloides ) (Webb 1982) and
second growth pine (Winter 1974). Searches for
nests have been very limited (Bull and Anderson
1978, Reynolds and Linkhart 1984, Goggans 1986).
1 Paper presented at the symposium, Biology and
Conservation of Northern Forest Owls, Feb. 3-7, 1937,
Winnipeg, Manitoba. USDA Forest Service General
Technical Report RM-iU2.
2 Howie is with the Parks and Outdoor Recreation
Division and Ritcey is with the Wildlife Branch,
Ministry of Environment and Parks, Kamloops , British
Columbia.
The lack of knowledge about Flammulated Owls
in British Columbia was cause for concern due to
their presumed preference for dry belt forests and
dependence upon cavities for nests. The dry
interior pine and fir forests are intensivelymanaged for timber production in British Columbiaand a little-known secretive owl species could
suffer severe reductions in numbers that wouldremain undetected.
We accumulated information about owl recordsthroughout British Columbia and conducted surveys
near Kamloops in order to determine the habitatpreferences for Flammulated Owls in the province.Estimates of singing male densities were made for
some areas and di stri btional limits are discussed.
Here we report our findings based upon limited
surveys.
Fig. 1 Kamloops Study Area
249

STUDY AREA METHODS
Surveys were conducted along the South
Thompson River drainage within an area
approximately 70 km long and 20 km wide near
Kamloops, British Columbia (Fig. 1 ). The area is
an incised valley within the intermontane ThompsonPlateau where maximum elevations approximate 2000
metres. Elevations within surveyed areas ranged
from 350-1300 m. The forests in the study area
consisted of ponderosa pine at lower elevationsand mixed Douglas fir - ponderosa pine at middleelevations and south-facing slopes. Above 850 m,
Douglas fir was dominant and ponderosa pine
occurred as a serai species after fires and
persisted as a veteran subdominant on drier,south-facing slopes. Trembling aspen occurred as
a serai species on wetter ecosystems. At the
highest elevation, Douglas fir maintained itsdominance but lodgepole pine ( Pi nus contorta )
occurred as a serai or fire climax species on
drier sites. Selective logging had occurredextensively throughout the study area for at least100 years resulting in mixed age stands and
variable tree densities. Old growth stands (200+years) generally occurred only on sites unsuitablefor timber harvesting. Elsewhere, stand ageclasses ranged from mature (100-200 years) to
second growth (< 100 years). Within most ageclasses, selective harvesting had resulted in
variable canopy closures and stand structures.Snags and cavity-bearing trees occurred in varyingdensities throughout the area. The forest under-story depended upon stand history, canopy closureand topoedaphic factors but generally consisted of
mixtures of grasses, forbs and shrubs as describedby various authors (Mitchell and Green 1981,Brayshaw 1965, Tisdale and Maclean 1957). Commonspecies were bluebunch wheatgrass ( Agropyron
spicatum ). pinegrass ( Calamaqrostis rubescens ),
birch-leaved spirea ( Spirea betulifolia ) and~saskatoon ( Amelanchier alnifolia ). Terrain wasmoderately steep (25-75 per cent slope.). Annualprecipitation averages 32-43 cm with annual maximain May-June and December-January. The mean annualtemperature is -4 to -6 0
C with a mean Julytemperature of approximately 16° C. (Mitchell and
Green 1981). With increased elevation, precip-itation increases and temperatures decrease in thestudy area. More frequent surveys were conductedon Wheeler Mountain within the TranquilleProvincial Forest. The forest type was predomin-antly Douglas fir with ponderosa pine occurring on
some south-facing slopes. The area was selec-tively logged 20-30 years prior to the surveys butmany old and mature trees still existed. Standages varied from 80-200+ years with complexityprovided by second-growth firs. Thickets ofregenerating firs were common as were openings up
to 1 or 2 ha in size. The forest structure wasgenerally open but quantitative measurements werenot made.
Literature records and information fromobservers were obtained for areas throughoutBritish Columbia where Flammulated Owls had beenobserved. From 1979-1986, random site visits weremade to locations near Kamloops where owls wereexpected or known to occur. Birds were located bylistening for singing males or eliciting responsesby playing tape recorded territorial songs duringMay, June and early July. From 1983-1985, 10linear census routes were driven along roadspenetrating forests within the ponderosa pine andDouglas fir forest belts. The routes were drivenbetween 2200 and 0100 hours during May, June andearly July and stops were made every 0.5 km.Routes varied from 3-10 km in length. At eachstop the first three minutes were spent listeningfor singing birds. If none were heard, a taperecorded song was played in order to elicitresponses. The locations of all birds wereplotted as closely as possible on 1:50,000 scaletopographic maps. Weather conditions were notedand generally, routes were not surveyed duringrain or if wind noise was considered excessive.
Given the terrain, forest cover and otherfactors, it was assumed that the radius withinwhich owls might be heard would not exceed 0.5 km.Across open grasslands under very quiet condi-tions, birds have been heard up to 0.75 km awaybut this was considered exceptional.
An approximation of the area in hectaressurveyed aurally (soundscape) along each route wascalculated using the formula:
100 [n(.78) - ( n-1). 24]
where n equals the number of stops per route.This overestimates the actual area censused dueto the curvilinear nature of the outer boundariesof the soundscape. Density figures were convertedto singing males per 40 ha. Habitat character-istics were derived from simple field observationsand forest cover maps prepared by the BritishColumbia Ministry of Forests and Lands. Detailedfield measurements of tree and stand character-istics were not made.
RESULTS
DISTRIBUTION
Literature evidence and surveys resulted inrecords for 104 Flammulated Owls between 1902 and1986 (Table 1). This included 10 juvenile,recently-fledged or nestling birds. Three centresof abundance are shown in Figure 2: the OkanaganValley, the South Thompson River Valley and thesouthern Rocky Mountain Trench. The most northerlyrecords occurred near Kamloops at 50° 51
1
latitudeand at Radium in the Rocky Mountain Trench at 50°40
!
latitude. Near Kamloops birds were recorded
250
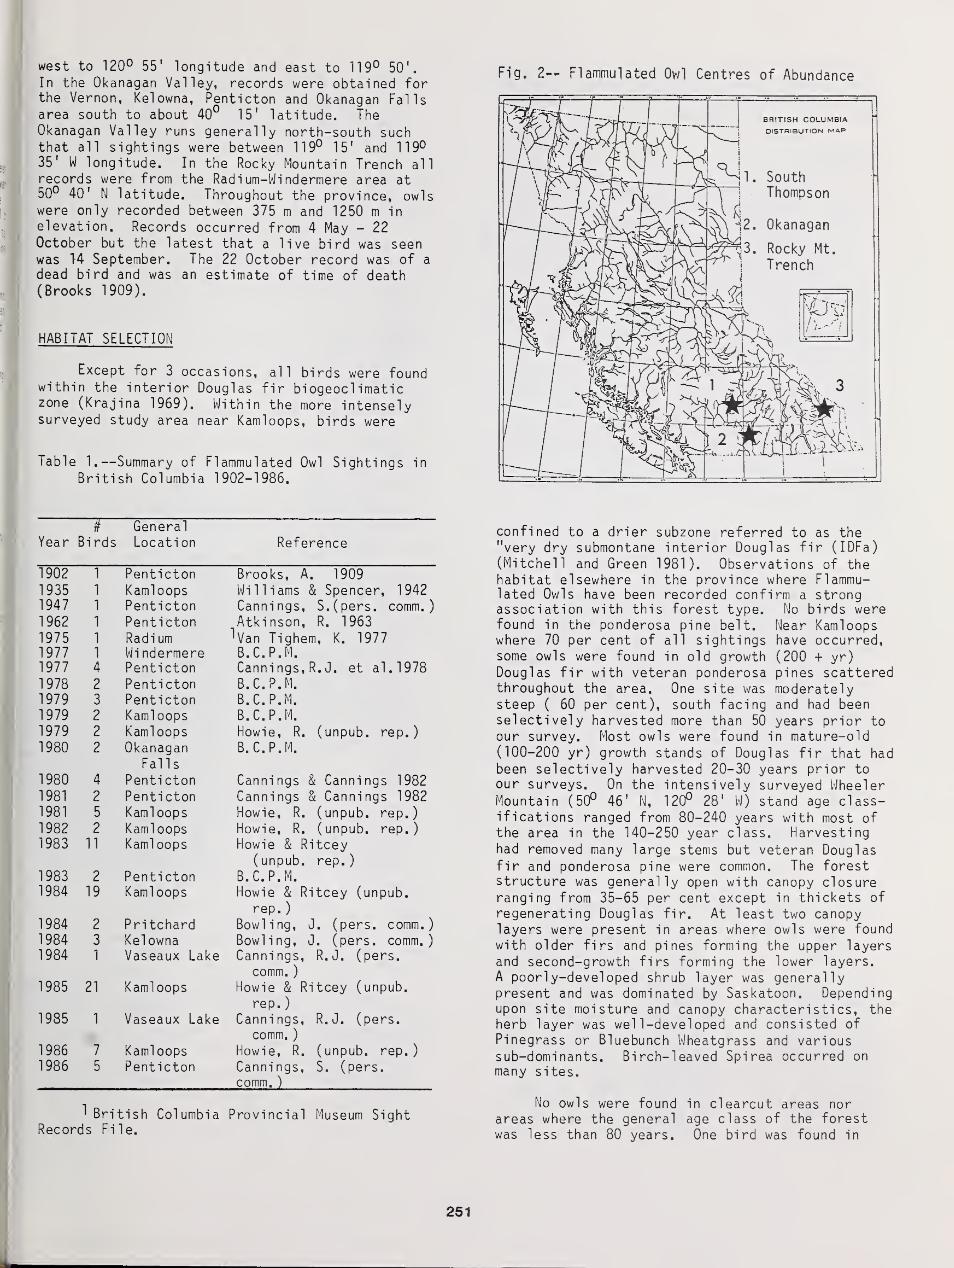
west to 120° 55' longitude and east to 119° 50'.
In the Okanagan Valley, records were obtained forthe Vernon, Kelowna, Penticton and Okanagan Fallsarea south to about 40° 15' latitude. TheOkanagan Valley runs generally north-south suchthat all sightings were between 119° 15' and 119°35' W longitude. In the Rocky Mountain Trench allrecords were from the Radi um-Wi ndermere area at50° 40' N latitude. Throughout the province, owlswere only recorded between 375 m and 1250 m in
elevation. Records occurred from 4 May - 22October but the latest that a live bird was seenwas T4 September. The 22 October record was of a
dead bird and was an estimate of time of death(Brooks 1909).
HABITAT SELECTION
Except for 3 occasions, all birds were foundwithin the interior Douglas fir biogeocl imaticzone (Krajina 1969). Within the more intenselysurveyed study area near Kamloops, birds were
Table 1.—Summary of Flammulated Owl Sightings in
British Columbia 1902-1986.
Fig, 2— Flammulated Owl Centres of Abundance
uW General
Year tn rds Locati on Reference
1902 Penticton Brooks, A. 1909
1935 Kamloops Williams & Spencer, 19421947 Penticton Cannings, S.(pers. comm.)1962 Penticton Atkinson, R. 1963
"Van Tighem, K. 19771975 Radi urn
1977 Wi ndermere B.C. P.M.
1977 4 Penticton Canni ngs, R. J. et al.19781978 2 Penti cton B.C. P.M.
1979 3 Penticton B.C. P.M.
1979 2 Kami oops B.C. P.M.
1979 2 Kamloops Howie, R. (unpub. rep.)1980 2 Okanagan
FallsB.C. P.M.
1980 4 Penticton Cannings & Cannings 1982
1981 2 Penticton Cannings & Cannings 19821981 5 Kami oops Howie, R. (unpub. rep.)1982 2 Kami oops Howie, R. (unpub. rep.)1983 11 Kami oops Howie & Ritcey
(unpub. rep.)
1983 2 Penticton B.C.P.M.1984 19 Kamloops Howie & Ritcey (unpub.
rep.
)
1984 2 Pri tchard Bowling, J. (pers. comm.)1984 3 Kelowna Bowling, J. (pers. comm.)1984 1 Vaseaux Lake Cannings, R.J. (pers.
comm.
)
1985 21 Kamloops Howie & Ritcey (unpub.
rep.
)
1985 1 Vaseaux Lake Cannings, R.J. (pers.
comm.
)
1986 7 Kamloops Howie, R. (unpub. rep.)1986 5 Penticton Cannings, S. (pers.
comm.
)
'British Columbia Provincial Museum SightRecords File.
confined to a drier subzone referred to as the"very dry submontane interior Douglas fir (IDFa)
(Mitchell and Green 1981). Observations of thehabitat elsewhere in the province where Flammu-lated Owls have been recorded confirm a strongassociation with this forest type. No birds werefound in the ponderosa pine belt. Near Kamloopswhere 70 per cent of all sightings have occurred,some owls were found in old growth (200 + yr)
Douglas fir with veteran ponderosa pines scatteredthroughout the area. One site was moderatelysteep ( 60 per cent), south facing and had beenselectively harvested more than 50 years prior to
our survey. Most owls were found in mature-old(100-200 yr) growth stands of Douglas fir that had
been selectively harvested 20-30 years prior toour surveys. On the intensively surveyed WheelerMountain (50° 46' N, 120° 28' W) stand age class-ifications ranged from 80-240 years with most ofthe area in the 140-250 year class. Harvestinghad removed many large stems but veteran Douglasfir and ponderosa pine were common. The foreststructure was generally open with canopy closureranging from 35-65 per cent except in thickets of
regenerating Douglas fir. At least two canopylayers were present in areas where owls were foundwith older firs and pines forming the upper layersand second-growth firs forming the lower layers.A poorly-developed shrub layer was generallypresent and was dominated by Saskatoon. Dependingupon site moisture and canopy characteristics, theherb layer was well-developed and consisted of
Pinegrass or Bluebunch Wheatgrass and varioussub-dominants. Birch-leaved Spirea occurred onmany sites.
No owls were found in clearcut areas norareas where the general age class of the forestwas less than 80 years. One bird was found in
251
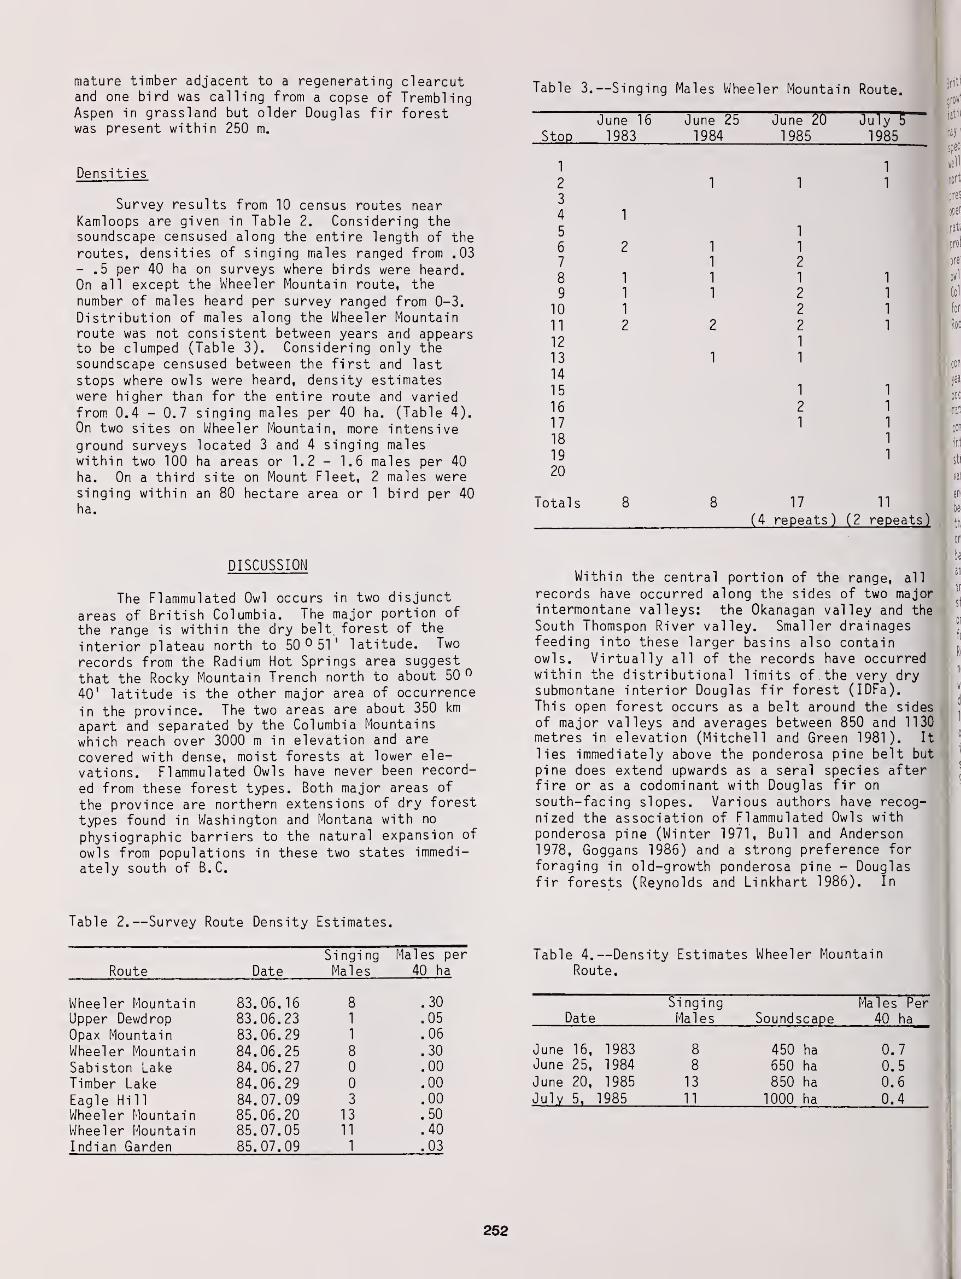
mature timber adjacent to a regenerating clearcutand one bird was calling from a copse of TremblingAspen in grassland but older Douglas fir forestwas present within 250 m.
Densities
Survey results from 10 census routes nearKamloops are given in Table 2. Considering thesoundscape censused along the entire length of theroutes, densities of singing males ranged from .03- .5 per 40 ha on surveys where birds were heard.On all except the Wheeler Mountain route, the
number of males heard per survey ranged from 0-3.
Distribution of males along the Wheeler Mountainroute was not consistent between years and appearsto be clumped (Table 3). Considering only the
soundscape censused between the first and last
stops where owls were heard, density estimateswere higher than for the entire route and variedfrom 0.4 - 0.7 singing males per 40 ha. (Table 4).On two sites on Wheeler Mountain, more intensiveground surveys located 3 and 4 singing maleswithin two 100 ha areas or 1.2 - 1.6 males per 40
ha. On a third site on Mount Fleet, 2 males weresinging within an 80 hectare area or 1 bird per 40ha.
Table 3.—Singing Males Wheeler Mountain Route.
Stop
1
2
3
4
5
6
7
8
9
10
11
12
13
14
15
16
17
18
19
20
Total
s
June 16
1983
June 25
1984June 20
1985July 5
1985
17 11
(4 repeats) (2 repeats)
DISCUSSION
The Flammulated Owl occurs in two disjunct
areas of British Columbia. The major portion of
the range is within the dry belt, forest of the
interior plateau north to 50 0 511 latitude. Two
records from the Radium Hot Springs area suggest
that the Rocky Mountain Trench north to about 50°40' latitude is the other major area of occurrence
in the province. The two areas are about 350 km
apart and separated by the Columbia Mountains
which reach over 3000 m in elevation and are
covered with dense, moist forests at lower ele-
vations. Flammulated Owls have never been record-
ed from these forest types. Both major areas of
the province are northern extensions of dry forest
types found in Washington and Montana with no
physiographic barriers to the natural expansion of
owls from populations in these two states immedi-ately south of B.C.
Within the central portion of the range, all
records have occurred along the sides of two majorintermontane valleys: the Okanagan valley and the
South Thomspon River valley. Smaller drainagesfeeding into these larger basins also containowls. Virtually all of the records have occurredwithin the distributional limits of the very drysubmontane interior Douglas fir forest (IDFa).
This open forest occurs as a belt around the sidesof major valleys and averages between 850 and 1130metres in elevation (Mitchell and Green 1981). It
lies immediately above the ponderosa pine belt but
pine does extend upwards as a serai species afterfire or as a codominant with Douglas fir on
south-facing slopes. Various authors have recog-nized the association of Flammulated Owls withponderosa pine (Winter 1971, Bull and Anderson1978, Goggans 1986) and a strong preference for
foraging in old-growth ponderosa pine - Douglasfir forests (Reynolds and Linkhart 1986). In
Table 2.—Survey Route Density Estimates.
Singing Males per
Route Date Males 40 ha
Wheeler Mountain 83.06.16 8 .30
Upper Dewdrop 83.06.23 1 .05
Opax Mountain 83.06.29 1 .06
Wheeler Mountain 84.06.25 8 .30
Sabiston Lake 84.06.27 0 .00
Timber Lake 84.06.29 0 .00
Eagle Hill 84.07.09 3 .00
Wheeler Mountain 85.06.20 13 .50
Wheeler Mountain 85.07.05 11 .40
Indian Garden 85. 07.09 1 .03
Table 4.—Density Estimates Wheeler MountainRoute.
Si ngi ng Males PerDate Males Soundscape 40 ha
June 16, 1983 8 450 ha 0.7June 25, 1984 8 650 ha 0.5June 20, 1985 13 850 ha 0.6July 5, 1985 11 1000 ha 0.4
252
British Columbia, the association with mature-oldgrowth Douglas fir is more clear than the affil-iation with ponderosa pine forests. While pinemay occur on some sites, it is never a dominantspecies and usually occurs as isolated veteranswell above their normal altitudinal limits. On
north-facing slopes, pine is absent but owls are
present. Regardless of the prescence of pine, theopen nature of the fir forests coupled withnatural or artificial" openings created by logging
probably resembles the physical structure of
preferred forests in the southern portion of the
owl's range. Distribution of the bird in BritishColumbia is most likely restricted to the IDFa
forest belt and equivalent forest types in theRocky Mountain Trench.
Surveys and random observations near Kami oopsconfirm a preference for forest in excess of 100
years of age and the highest density of owlsoccurred in age classes of 140-200+ years withmany veteran trees. Selective logging has been a
common practice throughout the dry forests of the
interior and has resulted in a complex foreststructure. The amount of large stems removed
varies greatly, depends upon the faller's prefer-ence and may reach 80 per cent. The results havebeen stands with multi-layered canopies andthickets of regenerating firs suffering fromcrowding and growth restrictions. Owls appear tobe restricted to areas with multi-layered canopiesand an abundance of large well-spaced treesinterspersed with grassy openings up to 2 ha in
size. Cavity-bearing snags were moderately commonon sites where owls were found. Seven nests werefound within the commonly used habitat type.
Regenerating thickets were used for roosting but
no studies have been done in British Columbiawhich quantify habitat preference as have beendone elsewhere. (Goggans 1986, Reynolds et al
.
1987). Random field observations suggest thatowls in the fir belt of this province are utiliz-ing the physical characteristics of the forests in
similar ways to those noted by Goggans (1986) and
Reynolds et al. (1986).
Historical data on Flammulated Owl popu-
lations in this province are lacking so it is
impossible to say whether the selective cuttingpractices have resulted in a change in numbers.Several studies have noted a decline in popu-
lations following timber harvesting (Marshall,
1957, Phillips et al. 1964, Franzreb and Ohmart1978). The surveys we conducted were not specif-
ically designed to estimate populations or densi-
ties, but some crude estimates were made in order
to create a perspective for future studies. On
Wheeler Mountain, selectively cut areas appearedto have singing male densities as high as 1.6males per 40 ha. Transect surveys may have
underestimated the real numbers of birds presentby as much as 50 per cent, but this may have beendue in part to erroneous assumptions made in thesurveying procedure. The estimated soundscapesurveyed from each stop on the transects was a
circle with a radius of 0.5 km. This may be a
generous assumption so that density estimates are
likely low. Regardless, densities are in the
lower end of the scale reported for this specieselsewhere within its range. They comparefavorably with estimates of 0.72 singing males per40 ha in northeastern Oregon (Goggans 1986) androughly 0.8 per 40 ha in Colorado (Reynolds,Linkhart and Ryder 1986, in press). Densitiesvaried within the total area of Wheeler Mountain.Our transects did not result in a census of theentire mountain, much of which is felt to besuitable habitat. Along transect routes, densi-ties were only 0.4 - 0.7 males per 40 ha. Thelowest density was determined from the July 5
survey during which only 1 male was singingvoluntarily and was perhaps unmated. The otherten birds were found by playing tape recordedsongs. The number of birds responding representsan unknown proportion of the real population but13 birds were found along the same route two weeksearlier in the same year. The results along otherroutes should also be considered preliminary.Attempts were made to census only during optimalconditions, but wind noise and light rain werenegative factors on some routes. It is felt thatthe lower densities along routes other thanWheeler Mountain resulted from extensive areas ofmarginal or unsuitable habitat being surveyed.Once we entered the optimal habitat type, Flammu-lated Owls were found. The patchy distribution ofthe habitat is likely responsible for the clumpeddistribution of owls and may be the reason thatbirds have been considered loosely colonial(Winters 1974).
Further studies are necessary in order tomore clearly delineate the range of this little-known owl in British Columbia. Basic ecologicalrelationships remain poorly understood but it isclear that the bird occupies older forests inareas that are very important to the lumberindustry. As currently practised, selectiveharvesting techniques may enable us to affordthis species protection and still manage forestsfor timber production. The alternative may resultin the loss of a unique member of Canada's avi-faunal component.
LITERATURE CITED
Atkinson, R.N. 1963. Flammulated Owl nesting in
British Columbia. Can. Field Nat. 77:
59-60.
Balda, R.P. 1977. The relationship of secondarycavity nesters to snag densities in westernconiferous forests. Wildl. Hab. Tech. Bull.No. 1 Forest Service, U.S.D.A. 37 pp.
Bent, A.C. 1938. Life histories of North Americanbirds of prey. Part 2. U.S. Nat. Mus.Bull. No. 170, 466 pp.
Brayshaw, T.C. 1965. The dry forest of southernBritish Columbia. Ecology of Western NorthAmerica. Vol. 1: 65-75.
British Columbia Provincial Museum Sight RecordsFile. B.C. Provincial Museum, 601 BellevilleSt., Victoria, British Columbia.
Brooks, A. 1909. Some notes on the birds of theOkanagan, British Columbia. Auk. 26: 60-63.
253
Bull, E. and R.G. Anderson, 1978. Notes on
Flammulated Owls in northeastern Oregon.
Murrelet. 59: 26-28.
Cannings, R.J. 1974. A record of the Flammulated
Owl in Canada. Can. Field Nat. 88: 234-235.
Cannings, R.J., S.R. Cannings, J.M. Cannings and
G.P. Sirk. 1978. Successful breeding of the
Flammulated Owl in British Columbia.
Murrelet 59: 74-75.
Cannings, R.J. and S.R. Cannings. 1982. A Flammu-
lated Owl nests in a box. Murrelet 63:
66-68.
Franzreb, K.E. and R.D. Ohmart. 1978. The
effects of timber harvesting on breedingbirds in a mixed coniferous forest. Condor
80: 431-441.
Goggans, R. 1986. Habitat use by Flammulated Owls
in northeastern Oregon. Unpublished Masters
Thesis, Oregon State University. 54 pp.
Guiget, C. 1960. The birds of British Columbia.
Pt. 7. The Owls. British Columbia Prov.
Mus. Handbook No. 18.
Johnson, N.K. and W.C. Russell. 1962. Distri-
butional data on certain owls in the western
Great Basin. Condor 64: 513-514.
Krajina, V. 1969. Ecology of forest trees in
British Columbia. Vol. 2 No. 1. Dept. of
Botany, University of British Columbia.
Linkhart, B.D., R.T. Reynolds and R.A. Ryder. (In
Review). Size, spacing and utilization of
breeding ranges by Flammulated Owls. J.
Wildlife Management.Marcot, B.G. and R. Hill. 1980. Flammulated Owls
in northwestern California. Western Birds
11: 141-149.
Marshall, J.T. 1939. Territorial behavior of theFlammulated Screech Owl. Condor 41: 71-78.
Marshall, J.T. Jr. 1957. Birds of the pine-oakwoodland in southern Arizona and adjacentMexico. Pac. Coast Avif. 32: 1-125.
Mitchell, W.R. and R.E. Green. 1981. Identifi-cation and interpretation of ecosystems ofthe western Kamloops forest region. Vol. 1.
Prov. of British Columbia, Ministry ofForests, Victoria.
Phillips, A., J. Marshall and G. Monson. 1964.The birds of Arizona. Univ. of ArizonaPress, Tucson.
Reynolds, R.T. and B.D. Linkhart. 1984. Methodsand Materials for capturing and monitoringFlammulated Owls. Great Basin Naturalist.44(1 ): 49-51.
Reynolds, R.T. and B.D. Linkhart and R.A. Ryder.
1987. Home ranges of Flammulated Owls.
Symposium on the Evolution and Ecology ofNorthern Forest Owls. Winnipeg, Manitoba.
Tisdale, E.W. and A. Maclean. 1957. The Douglasfir zone of southern British Columbia.Ecological Monographs 27: 247-266.
Van Tighem, K. 1977. The avifauna of KootenayNational Park. Unpublished Report. ParksCanada.
Webb, B. 1982. Distribution and nesting require-ments of montane forest owls in Colorado.
Part III: Flammulated Owl ( Otus flammeolus ).
Colorado Field Ornith. Journal 16: 76-81.Winter, J. 1974. The distribution of the Flammu-
lated Owl in California. Western Birds 5:
25-44.
254
Censusing Screech Owls in Southern Connecticut1
Dwight Q. Smith?Arnold Devlnefand Dan Walsh4
Abstract.—Eastern screech owls ( Otus asio ) were cen-
sused in southern Connecticut using playback of tape recor-
ded song. Response freguency and type of response varied
seasonally; rates were lowest during the breeding season and
highest in fall and winter. Extreme temperatures, certain
types and intensity of background noise, and wind decreased
response freguency. Tests with radio-marked owls confirmed
accommodation of some owls to repeated song playback. Com-
parison with population estimates obtained using a combina-
tion of playback and foot searches suggest that song play-
back provides estimates within 5-20% of actual screech owl
populations
.
INTRODUCTION
The eastern screech owl ( Otus asio ) is a
small, cryptic owl that ranges from the foothillsof the Rocky Mountains to the east coast andnorthward into adjacent portions of southernCanada. Throughout much of its range it is oftenthe most common bird of prey, occupying a widevariety of habitats in which trees or other struc-tures provide cavities for roosting and nesting.It is also among the most adaptable of raptors toman-modified habitats and may be found in suburbanwoodlots and the cemeteries, parks and other openspaces of towns and cities.
Despite its relative abundance in suitablehabitats this screech owl is rarely noticed be-cause of its nocturnal activity patterns and habitof roosting in concealed locations during daylighthours. Conseguently , comparatively little is knownof its behavior and population ecology.
Results of a 10 year census of Screech Owls in
suburban-rural environments of southern Connecticutusing playback of tape recorded song are presentedherein. We investigated screech owl response tosong playback and census variables such as month,
*Paper presented at the symposium, Biologyand Conservation of Northern Forest Owls, Feb. 3-
7, 1987, Winnipeg, Manitoba. USDA Forest Service
General Technical Report RM-142.2Dwight G. Smith is Professor of Biology,
Southern Connecticut State University, New Haven,
Conn.^Arnold Devine is Environmental Analyst,
Hazardous Waste Disposal Unit, Department of En-
vironmental Protection, Hartford, Conn.
^Daniel T. Walsh is a zoology doctoral stu-
dent at Brigham Young University, Provo, Utah.
seasonal activity, moon phase and selected weatherconditions. We also noted color phase when pos-sible, and describe perch site selection and be-havior of responding owls.
We compared estimates of screech owl abundancedetermined from playback censuses with estimatesbased on results of foot searches for roost sitesand signs such as pellet deposits, feathers andkill sites.
REVIEW OF LITERATURE
The use of song for acoustic communication in
birds has been detailed by Kroodsma et al. (1982)
and more specifically for mating and spacing be-
havior by Catchpole (1982). Eastern screech owlsuse song for territorial establishment, defense and
mating (Bent 1938; and others).
The use of playback of tape recorded song as
an avian census technigue has been reviewed by
Johnson et al. (1981) and Marion et al. (1981) and
as a census technigue for raptors by Fuller et al.
(1981). These authors emphasized the effectiveness
of playback in sampling nocturnal or otherwise se-
cretive birds and advocated wider use of this tech-
nigue to census or locate birds which may respond
to vocalizations. Johnson et al. (1981) used song
playback to census western screech owls ( Otus
kennicotti ) in riparian habitats of southern Ari-
zona; they discovered the highest documented breed-
ing density of screech owls in North America.
Other censuses of screech owls using song playback
included a fall survey in Michigan (Nowicki 1974),
a spring survey in Kansas (Cink 1975) and a 16 week
summer survey in Kentucky (Allaire and Landrum
1975)
.
255
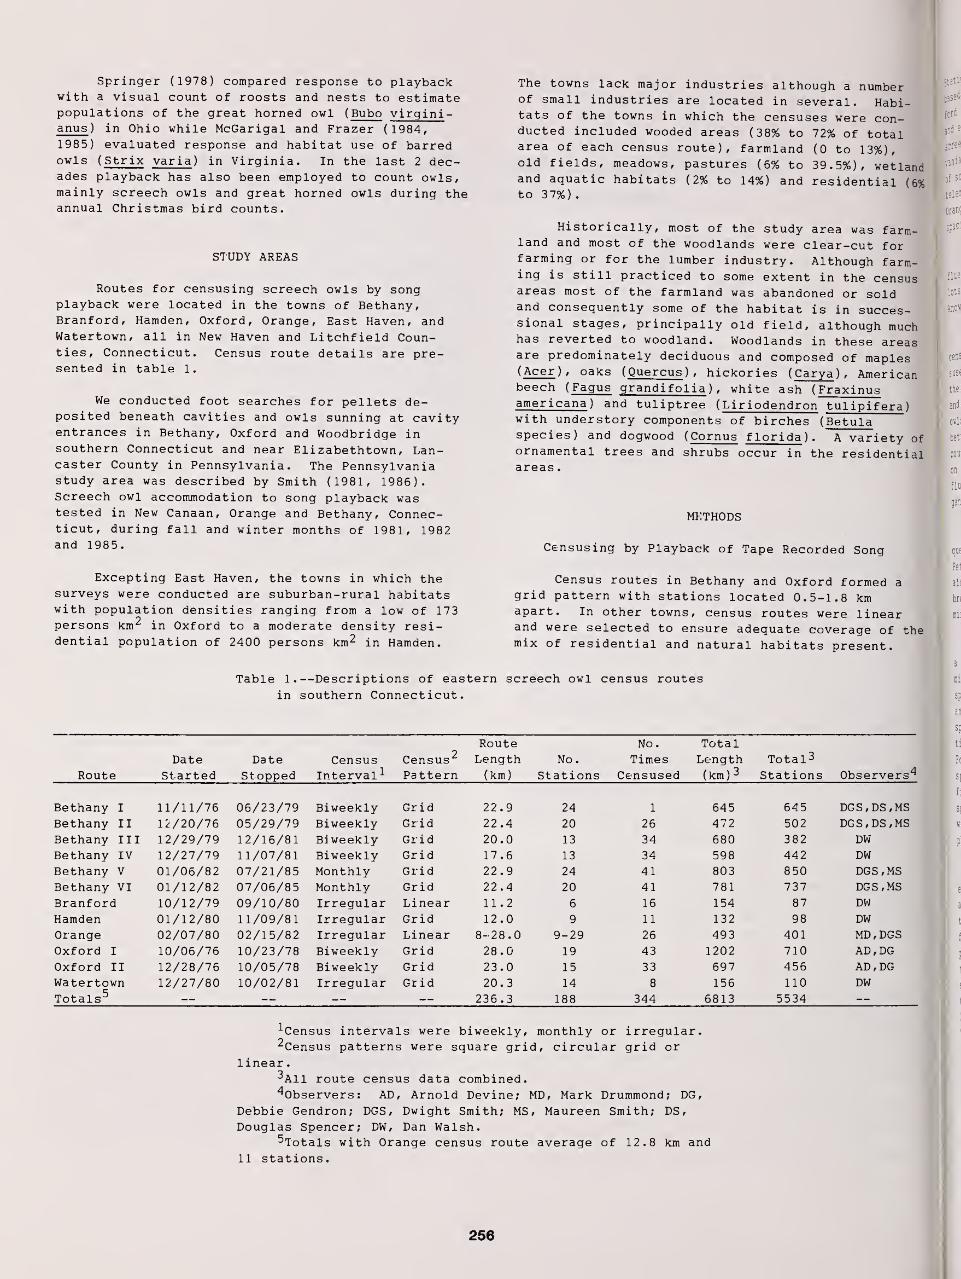
Springer (1978) compared response to playbackwith a visual count of roosts and nests to estimatepopulations of the great horned owl ( Bubo virgini -
anus ) in Ohio while McGarigal and Frazer (1984,1985) evaluated response and habitat use of barredowls ( Strix varia ) in Virginia. In the last 2 dec-ades playback has also been employed to count owls,mainly screech owls and great horned owls during theannual Christmas bird counts.
STUDY AREAS
Routes for censusing screech owls by songplayback were located in the towns of Bethany,Branford, Hamden, Oxford, Orange, East Haven, andWatertown, all in New Haven and Litchfield Coun-ties, Connecticut. Census route details are pre-sented in table 1.
We conducted foot searches for pellets de-posited beneath cavities and owls sunning at cavityentrances in Bethany, Oxford and Woodbridge insouthern Connecticut and near Elizabethtown , Lan-caster County in Pennsylvania. The Pennsylvaniastudy area was described by Smith (1981, 1986).Screech owl accommodation to song playback wastested in New Canaan, Orange and Bethany, Connec-ticut, during fall and winter months of 1981, 1982and 1985.
Excepting East Haven, the towns in which thesurveys were conducted are suburban-rural habitatswith population densities ranging from a low of 173persons km 2 in Oxford to a moderate density resi-dential population of 2400 persons km 2 in Hamden.
The towns lack major industries although a numberof small industries are located in several. Habi-tats of the towns in which the censuses were con-ducted included wooded areas (38% to 72% of totalarea of each census route), farmland (0 to 13%),old fields, meadows, pastures (6% to 39.5%), wetlandand aguatic habitats (2% to 14%) and residential (e%to 37%)
.
Historically, most of the study area was farm-land and most of the woodlands were clear-cut forfarming or for the lumber industry. Although farm-ing is still practiced to some extent in the censusareas most of the farmland was abandoned or soldand conseguently some of the habitat is in succes-sional stages, principally old field, although muchhas reverted to woodland. Woodlands in these areasare predominately deciduous and composed of maples(Acer), oaks ( Quercus ) , hickories ( Carya ) , Americanbeech ( Fagus grandifolia ) , white ash ( Fraxinusamericana ) and tuliptree ( Liriodendron tulipifera )
with understory components of birches ( Betulaspecies) and dogwood ( Cornus florida ) . A variety ofornamental trees and shrubs occur in the residentialareas
.
METHODS
Censusing by Playback of Tape Recorded Song
Census routes in Bethany and Oxford formed agrid pattern with stations located 0.5-1.8 kmapart. In other towns, census routes were linearand were selected to ensure adeguate coverage of themix of residential and natural habitats present.
Table 1.—Descriptions of eastern screech owl census routes
in southern Connecticut.
Route No. TotalDate Date Census 2Census Length No. Times Length Total 3
Route Started Stopped Intervals- Pattern (km) Stations Censused (km) 3 Stations Observers 4
Bethany I 11/11/76 06/23/79 Biweekly Grid 22.9 24 1 645 645 DGS,DS,MSBethany II 12/20/76 05/29/79 Biweekly Grid 22.4 20 26 472 502 DGS,DS,MSBethany III 12/29/79 12/16/81 Bi weekly Grid 20.0 13 34 680 382 DWBethany IV 12/27/79 11/07/81 Biweekly Grid 17.6 13 34 598 442 DWBethany V 01/06/82 07/21/85 Monthly Grid 22.9 24 41 803 850 DGS,MSBethany VI 01/12/82 07/06/85 Monthly Grid 22.4 20 41 781 737 DGS,MS
Branford 10/12/79 09/10/80 Irregular Linear 11.2 6 16 154 87 DW
Hamden 01/12/80 11/09/81 Irregular Grid 12.0 9 11 132 98 DWOrange 02/07/80 02/15/82 Irregular Linear 8-28.0 9-29 26 493 401 MD , DGS
Oxford I 10/06/76 10/23/78 Biweekly Grid 28.0 19 43 1202 710 AD,DGOxford II 12/28/76 10/05/78 Biweekly Grid 23.0 15 33 697 456 AD,DGWatertown 12/27/80 10/02/81 Irregular Grid 20.3 14 8 156 110 DWTotals 5 236.3 188 344 6813 5534
^Census intervals were biweekly, monthly or irregular.^Census patterns were sguare grid, circular grid or
linear.3A11 route census data combined.^Observers: AD, Arnold Devine; MD, Mark Drummond; DG,
Debbie Gendron; DGS, Dwight Smith; MS, Maureen Smith; DS,
Douglas Spencer; DW, Dan Walsh.^Totals with Orange census route average of 12.8 km and
11 stations.
256
Stations were spaced approximately 0.7-1.2 km apart,based on a preliminary study conducted by AD in Ox-ford and Bethany from October through May, 1975-76,and estimates of the size of home ranges of 2
screech owls observed near Elizabethtown , Pennsyl-vania, by DGS. Results of this study and the sizesof screech owl home ranges determined using radio-telemetry (Smith and Gilbert 1984) in New Canaan,Orange and Bethany, Connecticut, support thisspacing
.
Exact location of each census station was in-fluenced by its accessibility, proximity to wood-lots or ornamentals, houses and parked vehicles andknowledge of previous owl responses.
The pairs of routes in Oxford and Bethany werecensused alternately, so that each route was cen-sused biweekly. This time interval was selected onthe basis of preliminary studies conducted by DGSand AD in 1975 and 1976 to test accommodation of
owls to song playback as a function of time intervalbetween seguential surveys. Censusing of AD and DGSroutes was performed in a random starting sequenceon alternate weeks to determine if time of night in-fluenced owl response. Censusing of all routes be-gan within 0.5-1.5 hr after sunset.
At each station song playback, included a se-quence of whinny and warble songs obtained from thePeterson Field Guide to Bird Songs. Tests conductedalong census routes revealed that omnidirectionalbroadcast of song playback was audible (to us) for a
minimum radius of 0.8 km.
Each station was censused for 7-8 min to elicita vocal or visual response. This consisted of a 1
min listening interval, 5 min song playback inter-spersed by silent periods of approximately 15 secand a 2 min listening interval. When an owl re-sponded, the playback was continued for an addi-tional 2 min to elicit response from a second owl.For each response we recorded the number of owls re-sponding, direction of each owl, time interval fromfirst playback to the first visual or audible re-sponse and type of response. Owls were illuminatedwith a flashlight when possible to observe colorphase, perch site and behavior.
Variables recorded at the time of censusing ateach station were time (EST), sky condition, typesand intensities of background noise, moon phase,temperature and wind. Time was recorded as time of
first playback. Sky condition was estimated as
percent overcast, moon phase was recorded as quar-ter, half, three-quarter, full and no moon. Thesources of background noises were recorded andtheir intensity estimated on a scale of 1-10 onBethany census routes conducted by DW and DGS.Temperature was recorded to the nearest 0.5 C. Windvelocity was estimated using the terrestrial appli-cation of the Beaufort scale.
Foot and Vehicle Surveys
Foot searches were conducted in 2 isolatedwoodlots in Pennsylvania, each averaging about2.59 km 2 in size and in randomly selected 2.59
km z portions of study areas in Bethany and Oxford.The Pennsylvania surveys were conducted by DGS.Separate surveys in Bethany were conducted by DW,
AD and DGS and in Oxford by AD.
In each area we located all tree cavities andother likely roosting and nesting areas such as
small, dense conifer stands. These were uniformlysearched for signs of screech owls. In Pennsyl-vania, all cavities were checked by ascents.
Accommodation Tests
To test for accommodation of screech owls to
playback of tape recorded song 4 groups, each com-prised of 4 screech owls were captured and fittedwith radiotransmitters . 0*;ls were captured in
roosts, nest boxes and using bal-chatri traps in
New Canaan, Bethany and Orange, Connecticut. Oneowl from each group was censused using song play-back at 1 day intervals, 1 at 3 day intervals, 1
at 7 day intervals and 1 at 14 day intervals for 3
months. Censusing of 2 groups was conducted fromlate September through late December and of 2 groupsfrom November through January. Preliminary studiesby DGS and AD had suggested that these were monthsof uniformly high screech owl response. Prior to
each playback, the presence of the screech owl wasconfirmed by radiotelemetry
.
Data Analysis
We used SPSS-X routines (SPSS 1983) for dataorganization and analysis. Principal componentsanalysis (PCA) was used to search for the variableor combinations of variables which accounted for
the highest amount of the total observed variation.Five climate variables (precipitation, cloud cover,wind, sky condition, and temperature), 3 temporalmeasures (month, time of night and sequence), noiseand moon phase were included in the initial corre-lation matrix. Data entry for the PCA was a sub-sample obtained by a random sort. The PCA wasvarimax-rotated to improve interpretation axes.
RESULTS
Playback of Taped Song Surveys
Response Frequency
Screech owl responses were obtained on 37.7%of all calling attempts (2199 responses of 5534attempts) with all stations on all census routescombined (table 2). At least 1 response was heardat 89.9% of all (169 or 188) calling stations, allroutes combined, but the response freguency at
each station varied from 3% to 78.8% and averaged18.2%, suggesting that not all stations were lo-cated in screech owl habitat or home range. Thus11 stations (5.9% of total stations) had a re-sponse frequency of less than 5% during the surveywhile 52 stations (27.7%) had an overall responsefrequency of over 50%; with the latter station re-sponse frequency suggesting the presence of a resi-dent individual or pair.
257
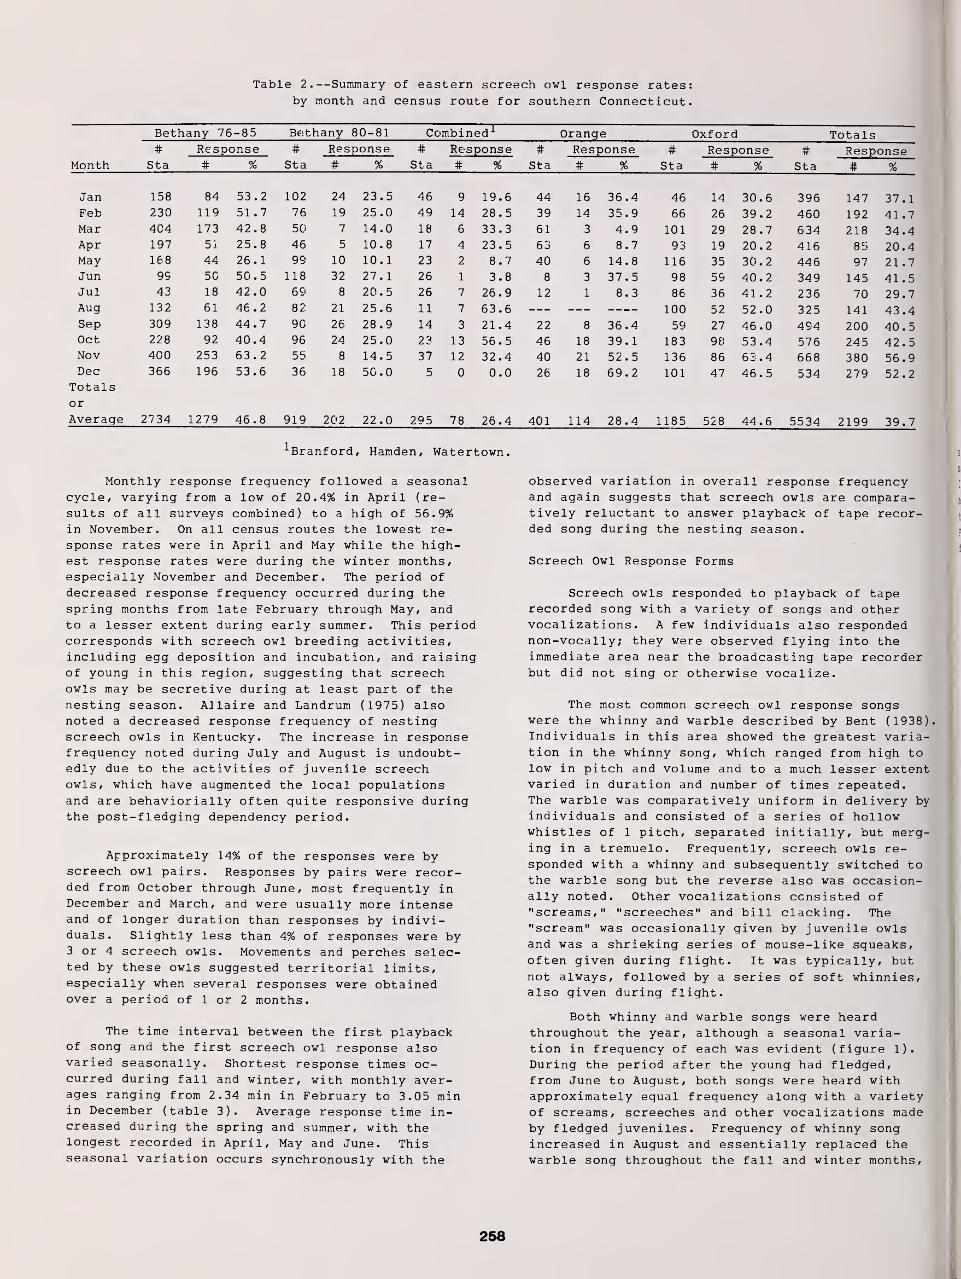
Table 2.—Summary of eastern screech owl response rates:by month and census route for southern Connecticut.
Bethany 76-85 Bethany 80-81 Combinedr Orange Oxford Totals
Month#
Sta
Response #Sta
Response #Sta
Response #Sta
Response# % # % # % # %
Jan 158 84 53.2 102 24 23.5 46 9 19.6 44 16 36.4Feb 230 119 51.7 76 19 25.0 49 14 28.5 39 14 35.9Mar 404 173 42.8 50 7 14.0 18 6 33.3 61 3 4.9Apr 197 51 25.8 46 5 10.8 17 4 23.5 63 6 8.7May 168 44 26. 1 99 10 10.1 23 2 8.7 40 6 14.8Jun 9S 50 50 .
5
118 32 27 .
1
26 1 3.8 8 3 37 .
5
Jul 43 18 42.0 69 8 20.5 26 7 26.9 12 1 8.3Aug 132 61 46 .2 82 21 25.6 11 7 63.6Sep 309 138 44.7 90 26 28.9 14 3 21.4 22 8 36.4Oct 228 92 40.4 96 24 25.0 23 13 56.5 46 18 39.
1
Nov 400 253 63.2 55 8 14.5 37 12 32.4 40 21 52.5Dec 366 196 53.6 36 18 50.0 5 0 0.0 26 18 69.2
Totalsor
Average 2734 1279 46.8 919 202 22.0 295 78 26.4 401 114 28.4
#Sta
Response# %
#Sta
Response# %
46 14 30 .6 396 147 37.166 26 39 .2 460 192 41.7
101 29 28 .7 634 218 34.493 19 20 .2 416 85 20.4
116 35 30 .2 446 97 21.798 59 40 .2 349 145 41 .5
86 36 41 .2 236 70 29.7100 52 52 .0 325 141 43.459 27 46 .0 494 200 40.5
183 98 53 .4 576 245 42.5136 86 63 .4 668 380 56.9101 47 46 .5 534 279 52.2
185 528 44 .6 5534 2199 39.7
1 Branford, Hamden, Watertown.
Monthly response freguency followed a seasonalcycle, varying from a low of 20.4% in April (re-
sults of all surveys combined) to a high of 56.9%in November. On all census routes the lowest re-
sponse rates were in April and May while the high-est response rates were during the winter months,especially November and December. The period ofdecreased response freguency occurred during thespring months from late February through May, andto a lesser extent during early summer. This periodcorresponds with screech owl breeding activities,including egg deposition and incubation, and raisingof young in this region, suggesting that screechowls may be secretive during at least part of thenesting season. Allaire and Landrum (1975) alsonoted a decreased response freguency of nestingscreech owls in Kentucky. The increase in responsefreguency noted during July and August is undoubt-edly due to the activities of juvenile screechowls, which have augmented the local populationsand are behaviorially often guite responsive duringthe post-fledging dependency period.
Approximately 14% of the responses were byscreech owl pairs. Responses by pairs were recor-ded from October through June, most freguently inDecember and March, and were usually more intenseand of longer duration than responses by indivi-duals. Slightly less than 4% of responses were by3 or 4 screech owls. Movements and perches selec-ted by these owls suggested territorial limits,especially when several responses were obtainedover a period of 1 or 2 months.
The time interval between the first playbackof song and the first screech owl response alsovaried seasonally. Shortest response times oc-curred during fall and winter, with monthly aver-ages ranging from 2.34 min in February to 3.05 minin December (table 3). Average response time in-creased during the spring and summer, with thelongest recorded in April, May and June. Thisseasonal variation occurs synchronously with the
observed variation in overall response freguencyand again suggests that screech owls are compara-tively reluctant to answer playback of tape recor-ded song during the nesting season.
Screech Owl Response Forms
Screech owls responded to playback of taperecorded song with a variety of songs and othervocalizations. A few individuals also respondednon-vocally; they were observed flying into theimmediate area near the broadcasting tape recorderbut did not sing or otherwise vocalize.
The most common screech owl response songswere the whinny and warble described by Bent (1938).Individuals in this area showed the greatest varia-tion in the whinny song, which ranged from high tolow in pitch and volume and to a much lesser extentvaried in duration and number of times repeated.The warble was comparatively uniform in delivery byindividuals and consisted of a series of hollowwhistles of 1 pitch, separated initially, but merg-ing in a tremuelo. Freguently, screech owls re-sponded with a whinny and subseguently switched tothe warble song but the reverse also was occasion-ally noted. Other vocalizations consisted of"screams," "screeches" and bill clacking. The"scream" was occasionally given by juvenile owlsand was a shrieking series of mouse-like sgueaks,often given during flight. It was typically, but
not always, followed by a series of soft whinnies,also given during flight.
Both whinny and warble songs were heardthroughout the year, although a seasonal varia-tion in freguency of each was evident (figure 1).
During the period after the young had fledged,from June to August, both songs were heard withapproximately egual freguency along with a varietyof screams, screeches and other vocalizations madeby fledged juveniles. Freguency of whinny songincreased in August and essentially replaced thewarble song throughout the fall and winter months,
258
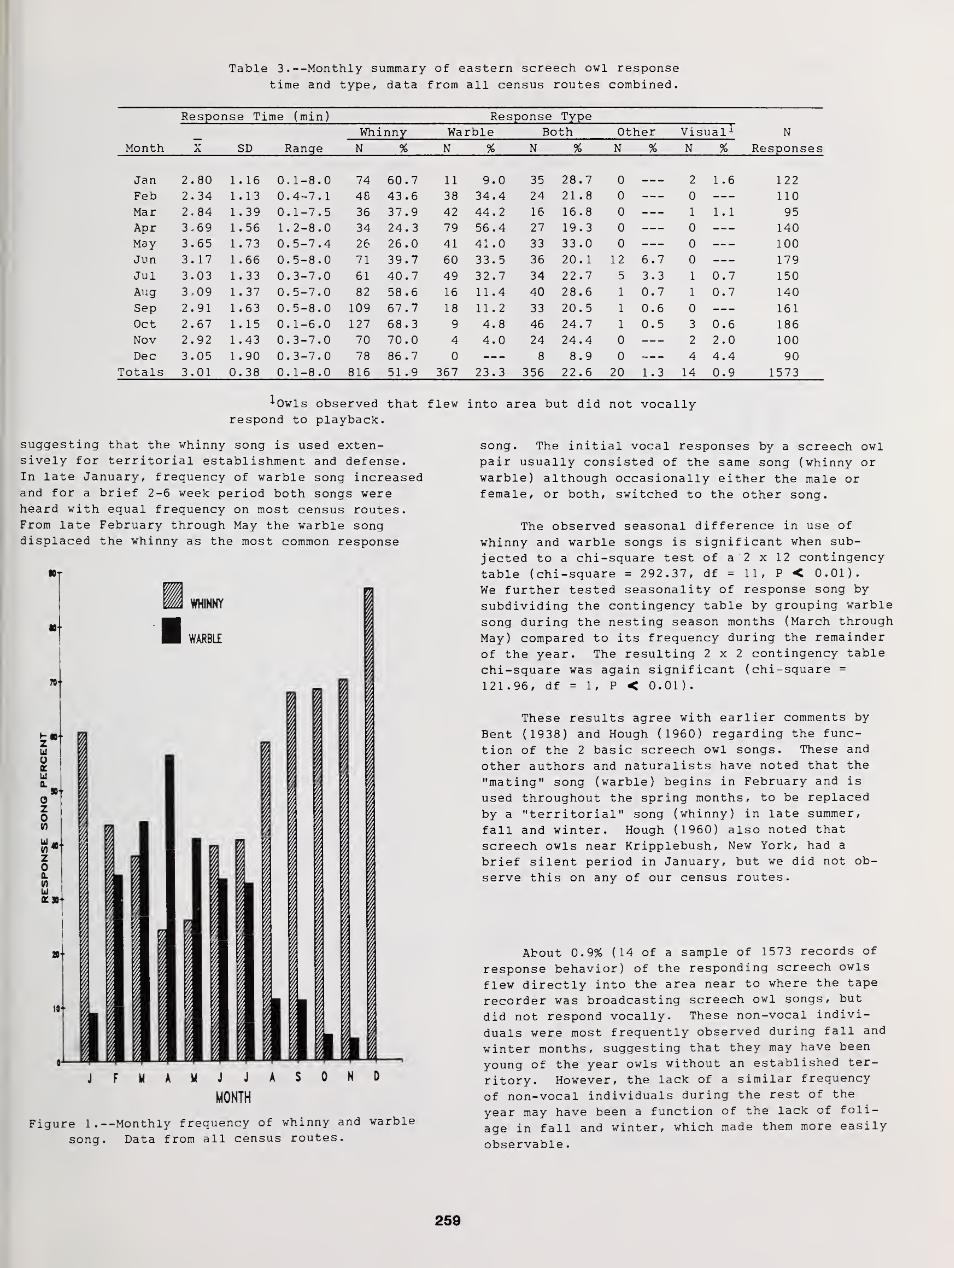
Table 3. --Monthly summary of eastern screech owl responsetime and type, data from all census routes combined.
Response Time (min) Response Type~ Whinny Warble Both Other Visual 1 N
Month X SD Range N%N%N%N%N% Responses
Jan 2.80 1 . 16 0.1-8.0 74 60.7 11 9.0 35 28.7 0 — - 2 1 .6 122
Feb 2.34 1 .13 0.4-7.1 48 43.6 38 34.4 24 21.8 0 — - 0 -— 110
Mar 2. 84 1 .39 0.1-7.5 36 37.9 42 44.2 16 16.8 0 1 1 . 1 95
Apr 3,69 1 .56 1.2-8.0 34 24.3 79 56.4 27 19.3 0 0 140
May 3.65 1 .73 0.5-7.4 26 26.0 41 41.0 33 33 .0 0 0 100
Jun 3.17 1 .66 0.5-8.0 71 39.7 60 33.5 36 20. 1 12 6. 7 0 179
Jul 3.03 1 . 33 0.3-7.0 61 40.7 49 32.7 34 22.7 5 3. 3 1 0 .7 150
Aug 3,09 1 . 37 0.5-7.0 82 58.6 16 11.4 40 28.6 1 0. 7 1 0 .7 140
Sep 2.91 1 .63 0.5-8.0 109 67.7 18 11.2 33 20.5 1 0. 6 0 161
Oct 2.67 1 . 15 0.1-6.0 127 68 .3 9 4.8 46 24.7 1 0. 5 3 0 .6 186
Nov 2.92 1 .43 0.3-7.0 70 70.0 4 4.0 24 24.4 0 2 2 .0 100
Dec 3.05 1 .90 0.3-7.0 78 86.7 0 8 8.9 0 4 4 .4 90
Totals 3.01 0 .38 0.1-8.0 816 51.9 367 23.3 356 22.6 20 1
.
3 14 0 .9 1573
•'•Owls observed that flew into area but did not vocallyrespond to playback.
suggesting that the whinny song is used exten-sively for territorial establishment and defense.In late January, frequency of warble song increasedand for a brief 2-6 week period both songs wereheard with equal frequency on most census routes.From late February through May the warble songdisplaced the whinny as the most common response
Figure I.—Monthly frequency of whinny and warble
song. Data from all census routes.
song. The initial vocal responses by a screech owlpair usually consisted of the same song (whinny orwarble) although occasionally either the male orfemale, or both, switched to the other song.
The observed seasonal difference in use of
whinny and warble songs is significant when sub-
jected to a chi-square test of a 2 x 12 contingency
table (chi-square = 292.37, df = 11, P < 0.01).
We further tested seasonality of response song by
subdividing the contingency table by grouping warble
song during the nesting season months (March through
May) compared to its frequency during the remainder
of the year. The resulting 2x2 contingency table
chi-square was again significant (chi-square =
121.96, df = 1, P < 0.01) .
These results agree with earlier comments by
Bent (1938) and Hough (1960) regarding the func-
tion of the 2 basic screech owl songs. These and
other authors and naturalists have noted that the
"mating" song (warble) begins in February and is
used throughout the spring months, to be replaced
by a "territorial" song (whinny) in late summer,
fall and winter. Hough (1960) also noted that
screech owls near Kripplebush, New York, had a
brief silent period in January, but we did not ob-
serve this on any of our census routes.
About 0.9% (14 of a sample of 1573 records of
response behavior) of the responding screech owls
flew directly into the area near to where the tape
recorder was broadcasting screech owl songs, but
did not respond vocally. These non-vocal indivi-
duals were most frequently observed during fall and
winter months, suggesting that they may have been
young of the year owls without an established ter-
ritory. However, the lack of a similar frequency
of non-vocal individuals during the rest of the
year may have been a function of the lack of foli-
age in fall and winter, which made them more easily
observable
.
259
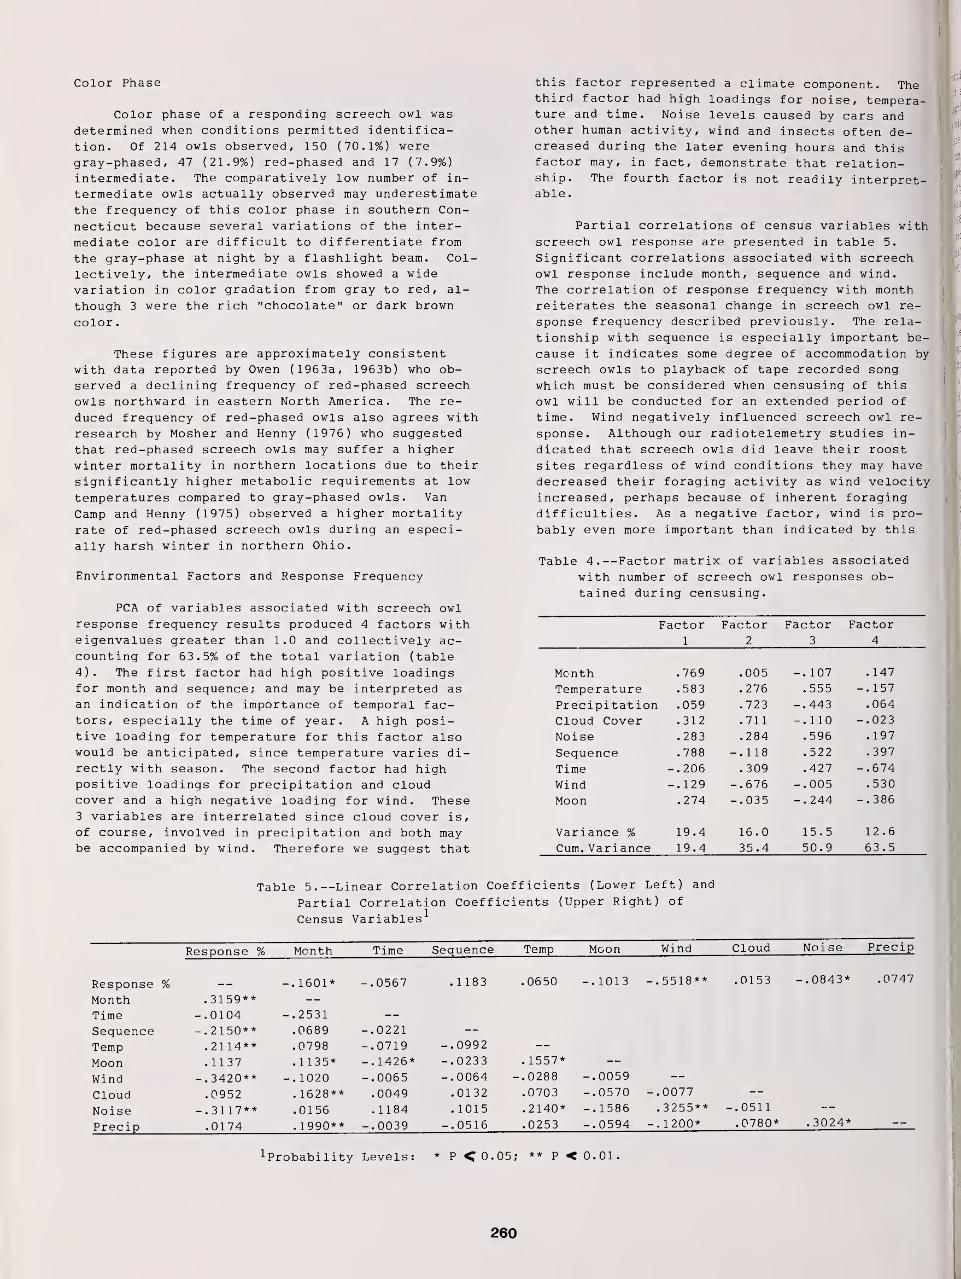
Color Phase
Color phase of a responding screech owl was
determined when conditions permitted identifica-tion. Of 214 owls observed, 150 (70.1%) weregray-phased, 47 (21.9%) red-phased and 17 (7.9%)intermediate. The comparatively low number of in-
termediate owls actually observed may underestimatethe frequency of this color phase in southern Con-
necticut because several variations of the inter-
mediate color are difficult to differentiate from
the gray-phase at night by a flashlight beam. Col-
lectively, the intermediate owls showed a widevariation in color gradation from gray to red, al-
though 3 were the rich "chocolate" or dark brown
color
.
These figures are approximately consistentwith data reported by Owen (1963a, 1963b) who ob-
served a declining freguency of red-phased screechowls northward in eastern North America. The re-
duced frequency of red-phased owls also agrees withresearch by Mosher and Henny (1976) who suggestedthat red-phased screech owls may suffer a higherwinter mortality in northern locations due to theirsignificantly higher metabolic requirements at low
temperatures compared to gray-phased owls. Van
Camp and Henny (1975) observed a higher mortalityrate of red-phased screech owls during an especi-ally harsh winter in northern Ohio.
Environmental Factors and Response Frequency
PCA of variables associated with screech owl
response frequency results produced 4 factors witheigenvalues greater than 1.0 and collectively ac-counting for 63.5% of the total variation (table4). The first factor had high positive loadingsfor month and sequence; and may be interpreted as
an indication of the importance of temporal fac-tors, especially the time of year. A high posi-tive loading for temperature for this factor alsowould be anticipated, since temperature varies di-rectly with season. The second factor had highpositive loadings for precipitation and cloudcover and a high negative loading for wind. These3 variables are interrelated since cloud cover is,
of course, involved in precipitation and both maybe accompanied by wind. Therefore we suggest that
this factor represented a climate component. Thethird factor had high loadings for noise, tempera-ture and time. Noise levels caused by cars andother human activity, wind and insects often de-creased during the later evening hours and thisfactor may, in fact, demonstrate that relation-ship. The fourth factor is not readily interpret-able
.
Partial correlations of census variables withscreech owl response are presented in table 5.
Significant correlations associated with screechowl response include month, seguence and wind.
The correlation of response freguency with monthreiterates the seasonal change in screech owl re-
sponse frequency described previously. The rela-
tionship with sequence is especially important be-
cause it indicates some degree of accommodation by
screech owls to playback of tape recorded song
which must be considered when censusing of this
owl will be conducted for an extended period of
time. Wind negatively influenced screech owl re-
sponse. Although our radiotelemetry studies in-
dicated that screech owls did leave their roostsites regardless of wind conditions they may havedecreased their foraging activity as wind velocityincreased, perhaps because of inherent foragingdifficulties. As a negative factor, wind is pro-
bably even more important than indicated by this
Table 4. --Factor matrix of variables associatedwith number of screech owl responses ob-
tained during censusing.
Factor Factor Factor Factor12 3 4
Month .769 .005 -.107 .147
Temperature .583 .276 .555 -.157
Precipitation .059 .723 -.443 .064
Cloud Cover .312 .711 -.110 -.023
Noi se .283 .284 .596 .197
Sequence .788 -.118 .522 .397
Time -.206 .309 .427 -.674
Wind -.129 -.676 -.005 .530
Moon .274 -.035 -.244 -.386
Variance % 19.4 16.0 15.5 12.6
Cum. Variance 19.4 35.4 50.9 63.5
Table 5.—Linear Correlation Coefficients (Lower Left) and
Partial Correlation Coefficients (Upper Right) of
Census Variables 1
Response 'Vo Month Time Sequence Temp Moon Wind Cloud Noise Precip
Response % -.1601* -.0567 .1183 .0650 -.1013 -.5518** .0153 -.0843* .0747
Month .3159**
Time -.0104 -.2531
Sequence -.2150** .0689 -.0221
Temp .2114** .0798 -.0719 -.0992
Moon .1137 .1135* -.1426* -.0233 .1557*
Wind -.3420** -.1020 -.0065 -.0064 .0288 -.0059
Cloud .0952 . 1628** .0049 .0132 .0703 -.0570 -.0077
Noise -.3117** .0156 .1184 . 1015 .2140* -.1586 .3255** -.0511
Precip .0174 .1990** -.0039 -.0516 .0253 -.0594 -.1200* .0780* .3024*
'•Probability Levels
:
* P < 0.05; ** P < 0.01 .
260
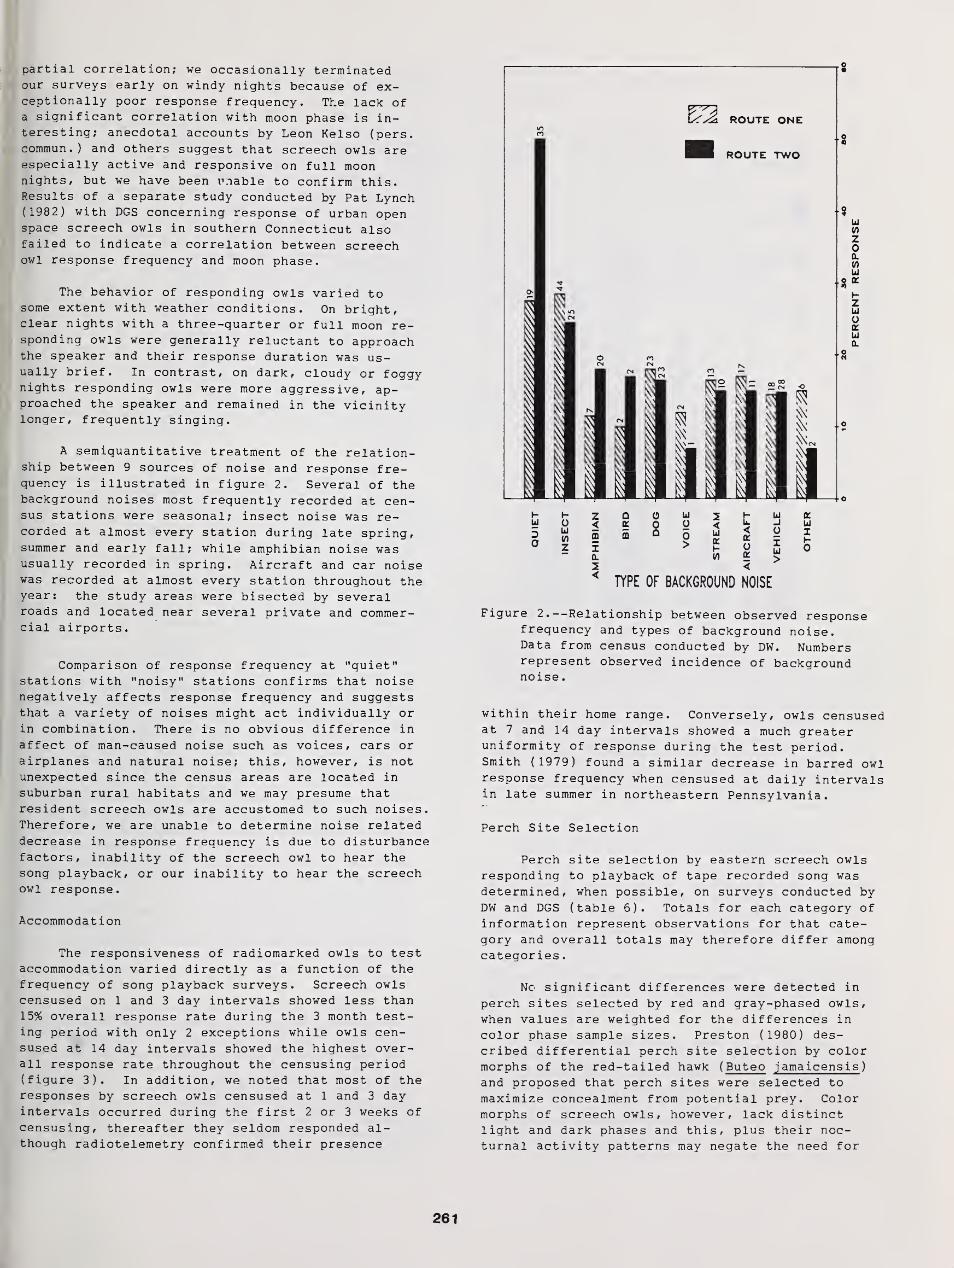
partial correlation; we occasionally terminatedour surveys early on windy nights because of ex-ceptionally poor response frequency. The lack ofa significant correlation with moon phase is in-teresting; anecdotal accounts by Leon Kelso (pers.commun.) and others suggest that screech owls areespecially active and responsive on full moonnights, but we have been unable to confirm this.Results of a separate study conducted by Pat Lynch(1982) with DGS concerning response of urban openspace screech owls in southern Connecticut alsofailed to indicate a correlation between screechowl response frequency and moon phase.
The behavior of responding owls varied tosome extent with weather conditions. On bright,clear nights with a three-quarter or full moon re-sponding owls were generally reluctant to approachthe speaker and their response duration was us-ually brief. In contrast, on dark, cloudy or foggynights responding owls were more aggressive, ap-proached the speaker and remained in the vicinitylonger, frequently singing.
A semiquantitative treatment of the relation-ship between 9 sources of noise and response fre-quency is illustrated in figure 2. Several of thebackground noises most frequently recorded at cen-sus stations were seasonal; insect noise was re-corded at almost every station during late spring,summer and early fall; while amphibian noise wasusually recorded in spring. Aircraft and car noisewas recorded at almost every station throughout theyear: the study areas were bisected by severalroads and located near several private and commer-cial airports.
Comparison of response frequency at "quiet"stations with "noisy" stations confirms that noisenegatively affects response frequency and suggeststhat a variety of noises might act individually or
in combination. There is no obvious difference in
affect of man-caused noise such as voices, cars or
airplanes and natural noise; this, however, is notunexpected since the census areas are located in
suburban rural habitats and we may presume thatresident screech owls are accustomed to such noises.Therefore, we are unable to determine noise relateddecrease in response frequency is due to disturbancefactors, inability of the screech owl to hear thesong playback, or our inability to hear the screechowl response.
Accommodation
The responsiveness of radiomarked owls to testaccommodation varied directly as a function of thefrequency of song playback surveys. Screech owlscensused on 1 and 3 day intervals showed less than15% overall response rate during the 3 month test-ing period with only 2 exceptions while owls cen-sused at 14 day intervals showed the highest over-all response rate throughout the censusing period(figure 3). In addition, we noted that most of theresponses by screech owls censused at 1 and 3 dayintervals occurred during the first 2 or 3 weeks of
censusing, thereafter they seldom responded al-though radiotelemetry confirmed their presence
ROUTE ONE
I-UJ
5o
TYPE OF BACKGROUND NOISE
Figure 2.—Relationship between observed responsefrequency and types of background noise.Data from census conducted by DW. Numbersrepresent observed incidence of backgroundnoise
.
within their home range. Conversely, owls censusedat 7 and 14 day intervals showed a much greateruniformity of response during the test period.Smith (1979) found a similar decrease in barred owlresponse frequency when censused at daily intervalsin late summer in northeastern Pennsylvania.
Perch Site Selection
Perch site selection by eastern screech owlsresponding to playback of tape recorded song wasdetermined, when possible, on surveys conducted by
DW and DGS (table 6). Totals for each category of
information represent observations for that cate-gory and overall totals may therefore differ amongcategories
.
No significant differences were detected in
perch sites selected by red and gray-phased owls,
when values are weighted for the differences in
color phase sample sizes. Preston (1980) des-cribed differential perch site selection by colormorphs of the red-tailed hawk ( Buteo j amaicensis )
and proposed that perch sites were selected to
maximize concealment from potential prey. Colormorphs of screech owls, however, lack distinctlight and dark phases and this, plus their noc-turnal activity patterns may negate the need for
261
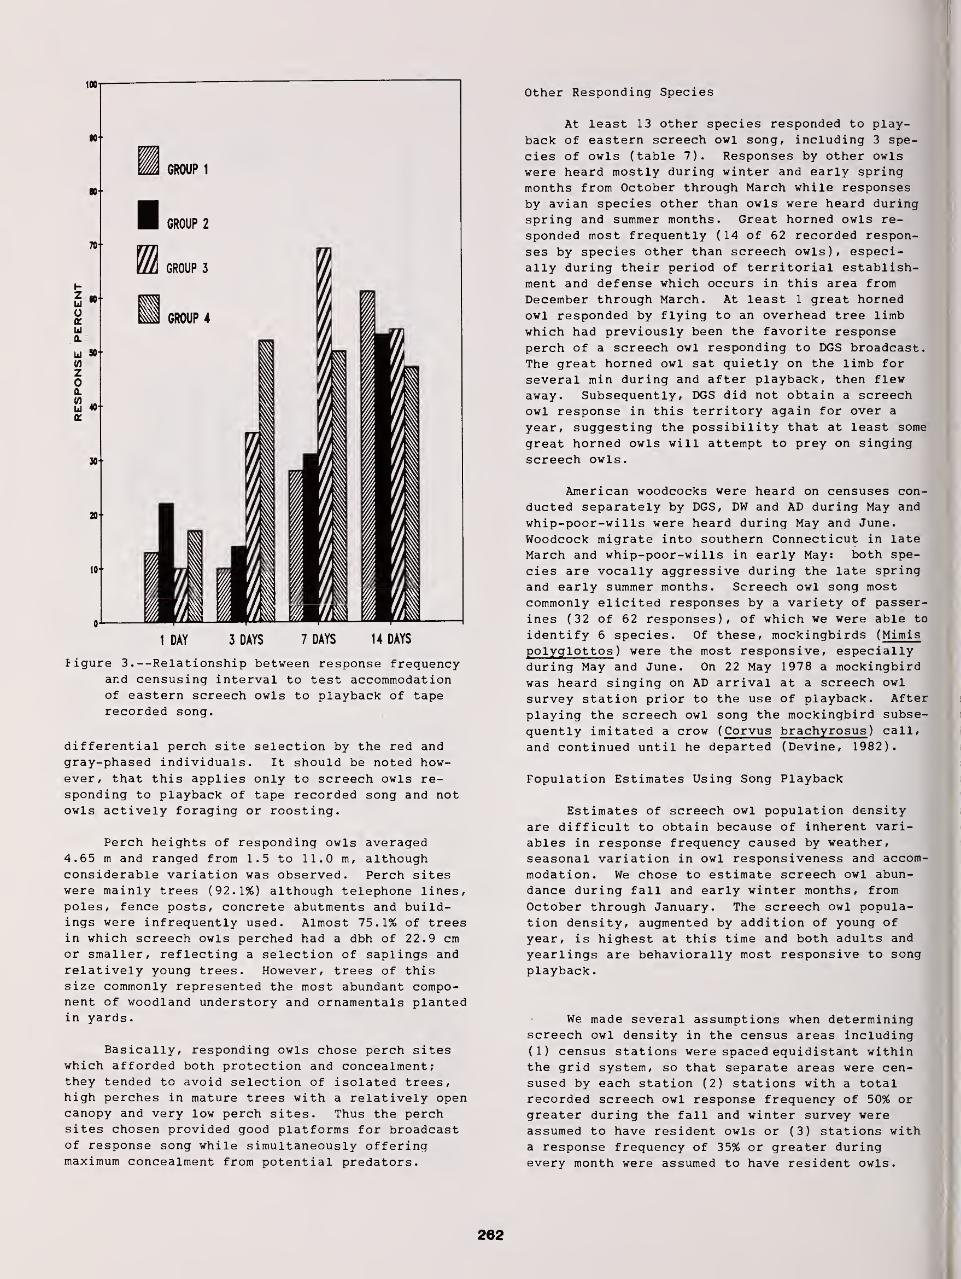
1 DAY 3 DAYS 7 DAYS U DAYS
figure 3 . --Relationship between response frequencyand censusing interval to test accommodationof eastern screech owls to playback of taperecorded song.
differential perch site selection by the red and
gray-phased individuals. It should be noted how-ever, that this applies only to screech owls re-sponding to playback of tape recorded song and notowls actively foraging or roosting.
Perch heights of responding owls averaged4.65 m and ranged from 1.5 to 11.0 m, althoughconsiderable variation was observed. Perch siteswere mainly trees (92.1%) although telephone lines,poles, fence posts, concrete abutments and build-ings were infrequently used. Almost 75.1% of treesin which screech owls perched had a dbh of 22.9 cmor smaller, reflecting a selection of saplings and
relatively young trees. However, trees of thissize commonly represented the most abundant compo-nent of woodland understory and ornamentals plantedin yards.
Basically, responding owls chose perch siteswhich afforded both protection and concealment;they tended to avoid selection of isolated trees,high perches in mature trees with a relatively opencanopy and very low perch sites. Thus the perchsites chosen provided good platforms for broadcastof response song while simultaneously offeringmaximum concealment from potential predators.
Other Responding Species
At least 13 other species responded to play-
back of eastern screech owl song, including 3 spe-
cies of owls (table 7). Responses by other owls
were heard mostly during winter and early springmonths from October through March while responses
by avian species other than owls were heard duringspring and summer months. Great horned owls re-
sponded most frequently (14 of 62 recorded respon-
ses by species other than screech owls), especi-ally during their period of territorial establish-ment and defense which occurs in this area from
December through March. At least 1 great hornedowl responded by flying to an overhead tree limbwhich had previously been the favorite responseperch of a screech owl responding to DGS broadcast.The great horned owl sat quietly on the limb for
several min during and after playback, then flewaway. Subsequently, DGS did not obtain a screechowl response in this territory again for over a
year, suggesting the possibility that at least some
great horned owls will attempt to prey on singingscreech owls.
American woodcocks were heard on censuses con-
ducted separately by DGS, DW and AD during May and
whip-poor-wills were heard during May and June.
Woodcock migrate into southern Connecticut in late
March and whip-poor-wills in early May: both spe-
cies are vocally aggressive during the late spring
and early summer months. Screech owl song mostcommonly elicited responses by a variety of passer-
ines (32 of 62 responses), of which we were able to
identify 6 species. Of these, mockingbirds (Minds
polyglottos ) were the most responsive, especiallyduring May and June. On 22 May 1978 a mockingbirdwas heard singing on AD arrival at a screech owl
survey station prior to the use of playback. After
playing the screech owl song the mockingbird subse-
quently imitated a crow (Corvus brachyrosus ) call,
and continued until he departed (Devine, 1982).
Population Estimates Using Song Playback
Estimates of screech owl population densityare difficult to obtain because of inherent vari-ables in response frequency caused by weather,seasonal variation in owl responsiveness and accom-
modation. We chose to estimate screech owl abun-dance during fall and early winter months, from
October through January. The screech owl popula-tion density, augmented by addition of young of
year, is highest at this time and both adults and
yearlings are behaviorally most responsive to song
playback.
We made several assumptions when determiningscreech owl density in the census areas including(1) census stations were spaced equidistant withinthe grid system, so that separate areas were cen-sused by each station (2) stations with a totalrecorded screech owl response frequency of 50% orgreater during the fall and winter survey wereassumed to have resident owls or (3) stations witha response freguency of 35% or greater duringevery month were assumed to have resident owls.
262
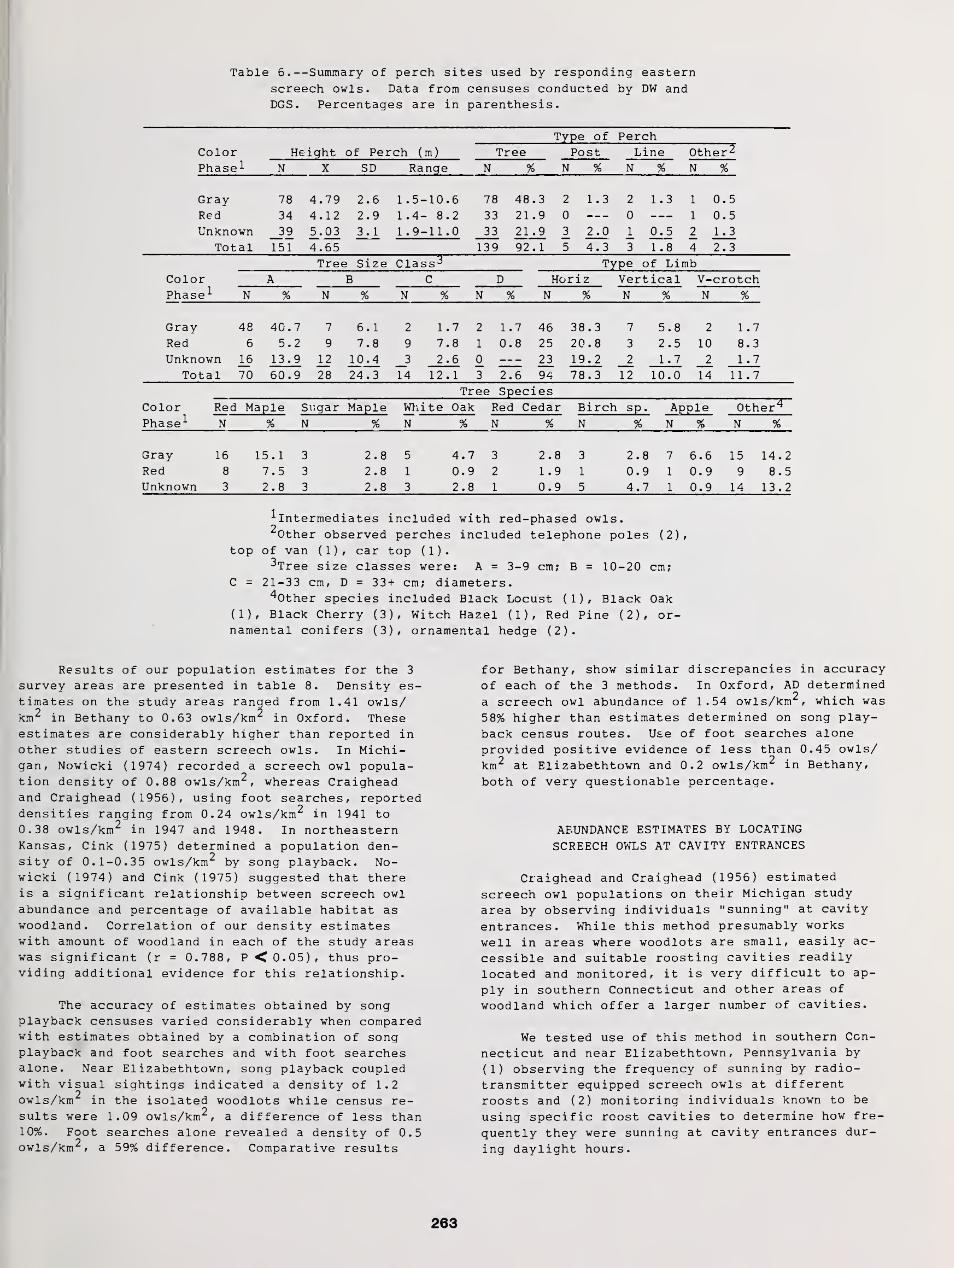
Table 6.—Summary of perch sites used by responding easternscreech owls. Data from censuses conducted by DW and
DGS. Percentages are in parenthesis.
Type of PerchColor Height of Perch (m) Tree Post Line Other 2
Phase 1 N X SD Range N % N % N % N %
Gray 78 4.79 2.6 1.5-10.6 78 48.3 2 1 . 3 i 2 1.3 1 0.5
Red 34 4.12 2.9 1.4- 8.2 33 21.9 0 0 1 0.5
Unknown _J9 5.03 3.1 1.9-11.0 33 21.9 3 2.0 1 0.5 2 1.3
Total 151 4.65 139 92.
1
5 4.3 3 1.8 4 2.3
Tree Size Class J Type of LimbColor A B C D Horiz Vertical V-crotchPhase 1 N % N % N % N % N % N % N %
Gray 48 40.7 7 6.1 2 1.7 2 1.7 46 38.3 7 5.8 2 1 .7
Red 6 5.2 9 7.8 9 7.8 1 0.8 25 20.8 3 2.5 10 8 .3
Unknown _16 13.9 12 10.4 _3 2.6 0 23 19.2 _2 1.7 _2 1 .7
Total 70 60.9 28 24.3 14 12.1 3 "iTi 94 78.3 12 10.0 14 11 .7
Tree SpeciesColor Red Maple Sugar Maple Wh ite Oak Red Cedar Birch sp. Apple Other^Phase 1 N % N % N % N % N % N % N %
Gray 16 15.1 3 2.8 5 4.7 3 2.8 3 2.8 7 6.6 15 14.2Red 8 7.5 3 2.8 1 0.9 2 1.9 1 0.9 1 0.9 9 8.5Unknown 3 2.8 3 2.8 3 2.8 1 0.9 5 4.7 1 0.9 14 13.2
'Intermediates included with red-phased owls.Other observed perches included telephone poles (2),
top of van (1), car top (1).^Tree size classes were: A = 3-9 cm; B = 10-20 cm;
C = 21-33 cm, D = 33+ cm; diameters.40ther species included Black Locust (1), Black Oak
(1), Black Cherry (3), Witch Hazel (1), Red Pine (2), or-namental conifers (3), ornamental hedge (2).
Results of our population estimates for the 3
survey areas are presented in table 8. Density es-timates on the study areas ranged from 1.41 owls/km^ in Bethany to 0.63 owls/km^ in Oxford. Theseestimates are considerably higher than reported in
other studies of eastern screech owls. In Michi-gan, Nowicki (1974) recorded a screech owl popula-tion density of 0.88 owls/km 2
, whereas Craigheadand Craighead (1956), using foot searches, reported
9densities ranging from 0.24 owls/km in 1941 to
0.38 owls/km 2 in 1947 and 1948. In northeasternKansas, Cink (1975) determined a population den-
, 9sity of 0.1-0.35 owls/km^ by song playback. No-wicki (1974) and Cink (1975) suggested that thereis a significant relationship between screech owlabundance and percentage of available habitat as
woodland. Correlation of our density estimateswith amount of woodland in each of the study areaswas significant (r = 0.788, P <0.05), thus pro-viding additional evidence for this relationship.
The accuracy of estimates obtained by songplayback censuses varied considerably when comparedwith estimates obtained by a combination of songplayback and foot searches and with foot searchesalone. Near Elizabethtown , song playback coupledwith visual sightings indicated a density of 1.2
9owls/km in the isolated woodlots while census re-sults were 1.09 owls/km 2
, a difference of less than10%. Foot searches alone revealed a density of 0.5owls/km 2
, a 59% difference. Comparative results
for Bethany, show similar discrepancies in accuracy
of each of the 3 methods. In Oxford, AD determined
a screech owl abundance of 1.54 owls/km , which was
58% higher than estimates determined on song play-back census routes. Use of foot searches alone
provided positive evidence of less than 0.45 owls/
km 2 at Elizabethtown and 0.2 owls/km 2 in Bethany,
both of very guestionable percentage.
ABUNDANCE ESTIMATES BY LOCATING
SCREECH OWLS AT CAVITY ENTRANCES
Craighead and Craighead (1956) estimated
screech owl populations on their Michigan study
area by observing individuals "sunning" at cavity
entrances. While this method presumably works
well in areas where woodlots are small, easily ac-
cessible and suitable roosting cavities readily
located and monitored, it is very difficult to ap-
ply in southern Connecticut and other areas of
woodland which offer a larger number of cavities.
We tested use of this method in southern Con-
necticut and near Elizabethtown, Pennsylvania by
(1) observing the frequency of sunning by radio-
transmitter equipped screech owls at different
roosts and (2) monitoring individuals known to be
using specific roost cavities to determine how fre-
quently they were sunning at cavity entrances dur-
ing daylight hours.
263
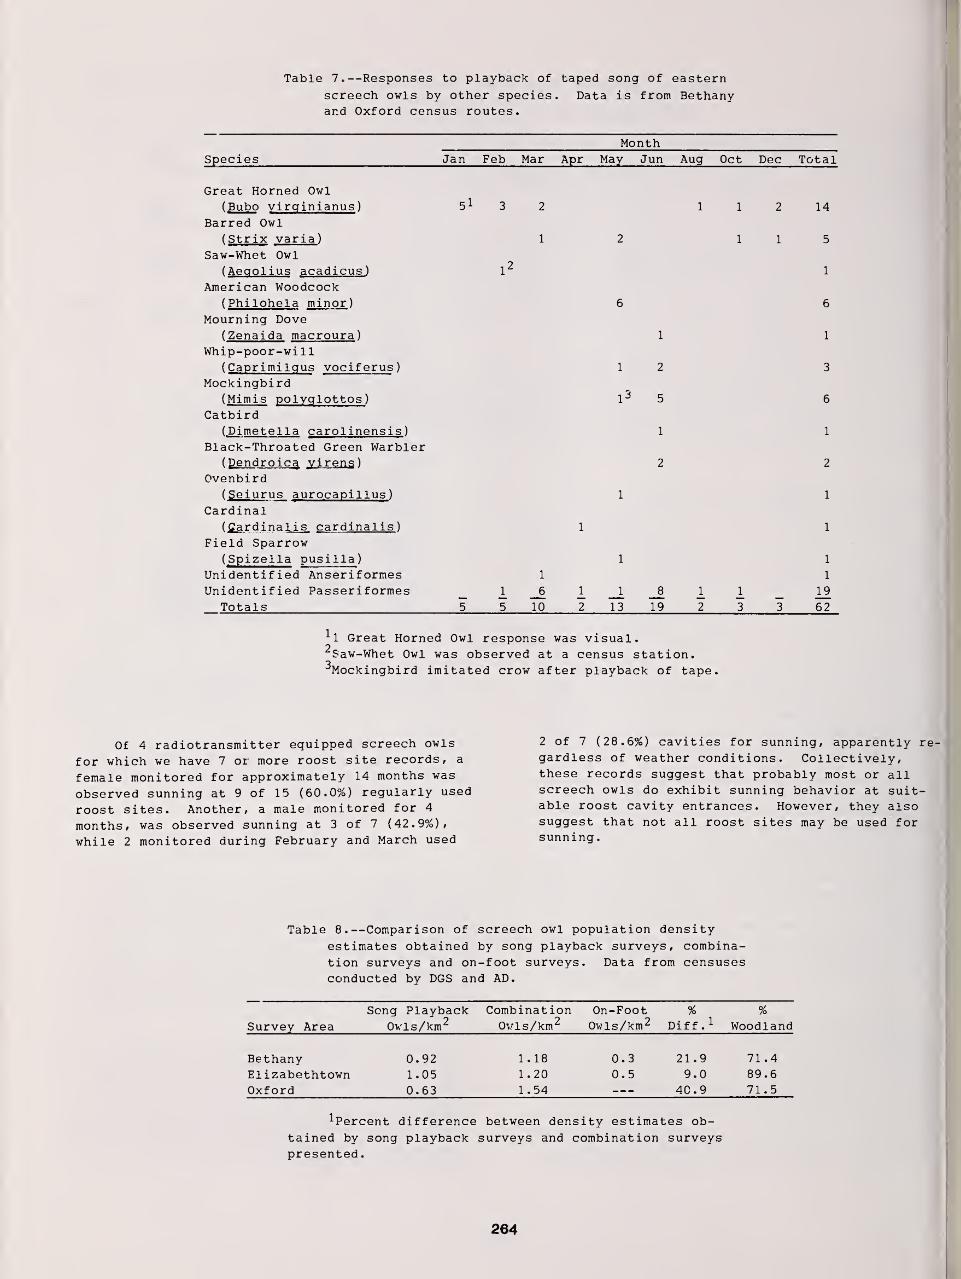
Table 7.—Responses to playback of taped song of eastern
screech owls by other species. Data is from Bethanyand Oxford census routes.
MonthSpec i es Jan Feb Mar Apr May Jun Aug Oct Dec Total
Great Horned Owl(Bubo virqinianus) 5 1 3 2 1 1 2 14
Barred Owl(Strix varia) 1 2 1 1 5
Saw-Whet Owl
(Aeoolius acadicus
)
l2
1
American Woodcock(Philohela minor) 6 6
Mourning Dove( 7pna i da marroura ) 1 1
Whip-poor-wi 11( PariT""i mi 1 mi q vnc *i fp kii q } 1 2 3
MockingbirdI3(Mimis polycflottos
)
5 6
Catbird(Dimefcel la carol i npn^i )\ U A 111G *3 ± X U V— U JL W 1 illC 1 1 O J. O / 1 1
B 1 aolc —Th roa t" pd firpon Warhl prJ—' X CI '— /V 1111 w a ^ CU \J 1 U Cl 1 MQl U X cl
(Dendroica virens
)
2 2
Ovenbird(Seiurus aurocapillus
)
1 1
Cardinal(£ardinalis cardinalis) 1
Field Sparrow(Spizella pusilla) 1 1
Unidentified Anseriformes 1 1
Unidentified Passeriformes 1 6 1 1 8 1 1 19
Totals 5 5 10 2 13 19 2 3 3 62
M Great Horned Owl response was visual.9Saw-Whet Owl was observed at a census station.
3 .
^Mockingbird imitated crow after playback of tape,
Of 4 radiotransmitter equipped screech owls
for which we have 7 or more roost site records, a
female monitored for approximately 14 months was
observed sunning at 9 of 15 (60.0%) regularly used
roost sites. Another, a male monitored for 4
months, was observed sunning at 3 of 7 (42.9%),
while 2 monitored during February and March used
2 of 7 (28.6%) cavities for sunning, apparently re-gardless of weather conditions. Collectively,these records suggest that probably most or allscreech owls do exhibit sunning behavior at suit-able roost cavity entrances. However, they alsosuggest that not all roost sites may be used forsunning.
Table 8.—Comparison of screech owl population density
estimates obtained by song playback surveys, combina-tion surveys and on-foot surveys. Data from censusesconducted by DGS and AD.
Song Playback Combination On-Foot % %Survey Area Owls/km 2 Ovls/km 2 Owls/km 2 Diff
.
1 Woodland
Bethany 0.92 1.18 0.3 21.9 71.4
Elizabethtown 1 .05 1 .20 0.5 9.0 89.6
Oxford 0.63 1 .54 4C.9 71.5
^Percent difference between density estimates ob-
tained by song playback surveys and combination surveyspresented
.
264
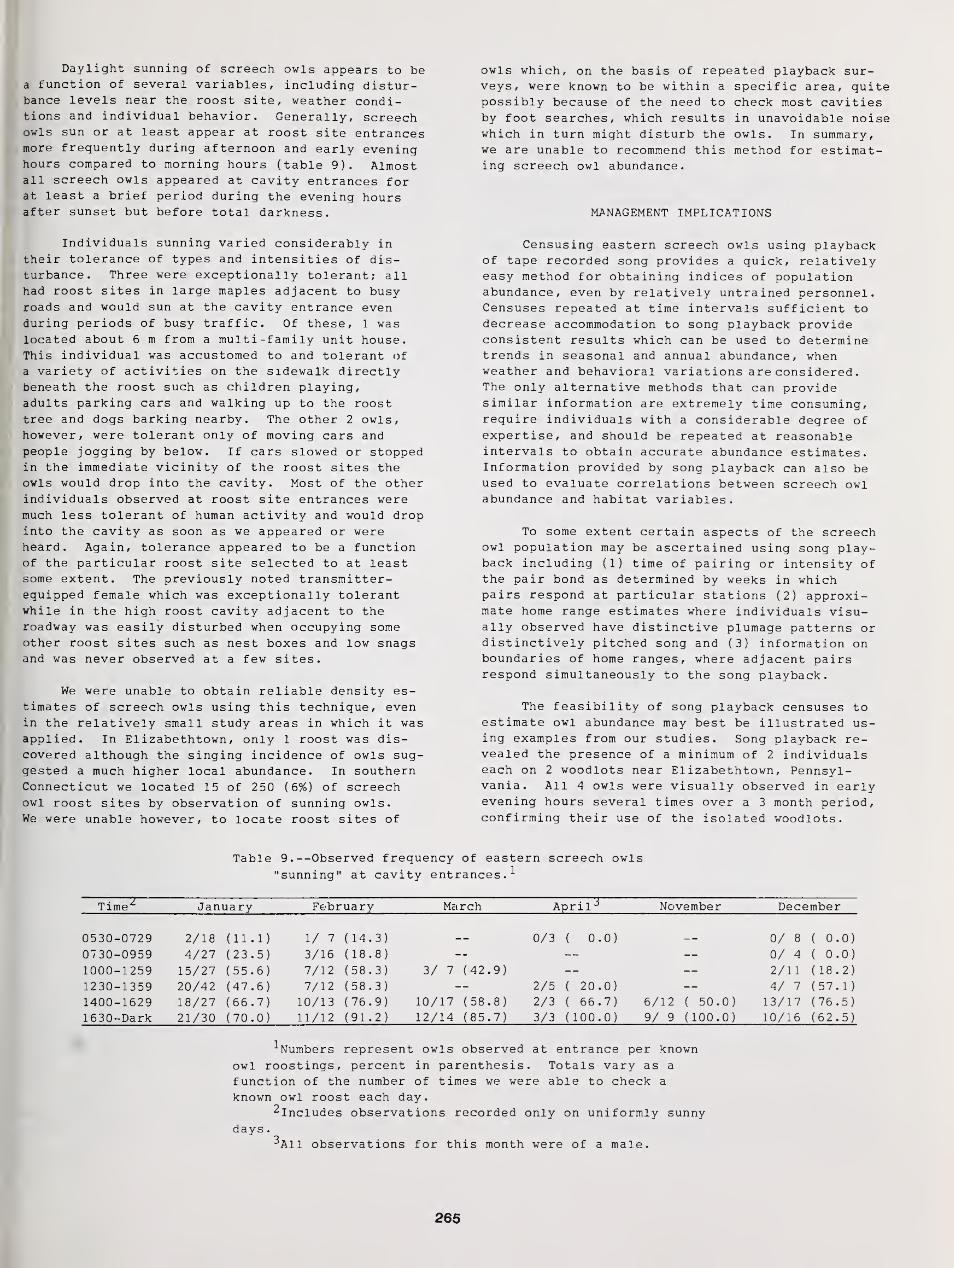
Daylight sunning of screech owls appears to bea function of several variables, including distur-bance levels near the roost site, weather condi-tions and individual behavior. Generally, screechowls sun or at least appear at roost site entrancesmore freguently during afternoon and early eveninghours compared to morning hours (table 9). Almostall screech owls appeared at cavity entrances forat least a brief period during the evening hoursafter sunset but before total darkness.
Individuals sunning varied considerably in
their tolerance of types and intensities of dis-turbance. Three were exceptionally tolerant; allhad roost sites in large maples adjacent to busyroads and would sun at the cavity entrance evenduring periods of busy traffic. Of these, 1 waslocated about 6 m from a multi -family unit house.This individual was accustomed to and tolerant of
a variety of activities on the sidewalk directlybeneath the roost such as children playing,adults parking cars and walking up to the roosttree and dogs barking nearby. The other 2 owls,however, were tolerant only of moving cars and
people jogging by below. If cars slowed or stoppedin the immediate vicinity of the roost sites theowls would drop into the cavity. Most of the otherindividuals observed at roost site entrances weremuch less tolerant of human activity and would dropinto the cavity as soon as we appeared or wereheard. Again, tolerance appeared to be a functionof the particular roost site selected to at leastsome extent. The previously noted transmitter-eguipped female which was exceptionally tolerantwhile in the high roost cavity adjacent to theroadway was easily disturbed when occupying someother roost sites such as nest boxes and low snagsand was never observed at a few sites.
We were unable to obtain reliable density es-
timates of screech owls using this technigue, evenin the relatively small study areas in which it wasapplied. In Elizabethtown , only 1 roost was dis-covered although the singing incidence of owls sug-gested a much higher local abundance. In southernConnecticut we located 15 of 250 (6%) of screechowl roost sites by observation of sunning owls.We were unable however, to locate roost sites of
owls which, on the basis of repeated playback sur-veys, were known to be within a specific area, guitepossibly because of the need to check most cavitiesby foot searches, which results in unavoidable noisewhich in turn might disturb the owls. In summary,we are unable to recommend this method for estimat-ing screech owl abundance.
MANAGEMENT IMPLICATIONS
Censusing eastern screech owls using playbackof tape recorded song provides a guick, relativelyeasy method for obtaining indices of populationabundance, even by relatively untrained personnel.Censuses repeated at time intervals sufficient to
decrease accommodation to song playback provideconsistent results which can be used to determinetrends in seasonal and annual abundance, whenweather and behavioral variations are considered
.
The only alternative methods that can providesimilar information are extremely time consuming,reguire individuals with a considerable degree ofexpertise, and should be repeated at reasonableintervals to obtain accurate abundance estimates.Information provided by song playback can also beused to evaluate correlations between screech owlabundance and habitat variables.
To some extent certain aspects of the screechowl population may be ascertained using song play-back including (1) time of pairing or intensity ofthe pair bond as determined by weeks in whichpairs respond at particular stations (2) approxi-mate home range estimates where individuals visu-ally observed have distinctive plumage patterns ordistinctively pitched song and (3) information onboundaries of home ranges, where adjacent pairsrespond simultaneously to the song playback.
The feasibility of song playback censuses toestimate owl abundance may best be illustrated us-ing examples from our studies. Song playback re-vealed the presence of a minimum of 2 individualseach on 2 woodlots near Elizabethtown, Pennsyl-vania. All 4 owls were visually observed in earlyevening hours several times over a 3 month period,confirming their use of the isolated woodlots.
Time^
Table 9. --Observed freguency of eastern screech owls
"sunning" at cavity entrances.
*
January February March Apr i 1T November December
0530-07290730-09591000-12591230-13591400-16291630-Dark
2/184/2715/2720/4218/2721/30
(11.1)
(23.5)
(55.6)(47.6)
(66.7)(70.0)
1/ 7
3/16
7/12
7/1210/13
11/12
(14.3)
(18.8)
(58.3)
(58.3)
(76.9)
(91.2)
3/ 7 (42.9)
10/17 (58.8)
12/14 (85.7)
0/3 ( 0.0)
2/5 ( 20.0)
2/3 ( 66.7)3/3 (100.0)
6/12 ( 50.0)
9/ 9 ( 100.0)
0/ 8 ( 0.0)
0/4 ( 0.0)
2/11 (18.2)
4/ 7 (57. 1
)
13/17 (76.5)
10/16 (62.5)
^Numbers represent owls observed at entrance per known
owl roostings, percent in parenthesis. Totals vary as a
function of the number of times we were able to check a
known owl roost each day.^Includes observations recorded only on uniformly sunny
days
.
JA11 observations for this month were of a male.
265
DGS attempted to locate the roost sites of these
owls during daylight hours by searching for pelletdepositions, owl feathers and owl kills. Only 1
of the 4 was located in approximately 250 man
hours, although all observed cavities were checked
by ascents from 3 to 8 times during the 3 monthperiod. In Oxford, AD found a pair that consis-tently responded within 10-50 sec to playback over
a 12 day period. AD unsuccessfully spent approxi-mately 30 hrs over a 3 week period attempting to
locate a roost, by screech owl pellet deposition,
signs of whitewash, screech owl feathers or kills.
The results of our studies lead us to suggestthat playback provides the only effective methodfor estimating screech owl populations in ourstudy areas in Pennsylvania and southern Connecti-cut. Furthermore, our synchronous attempts at ob-taining population indices with a combination ofalternative methods lead us to suggest that it is
virtually impossible to obtain accurate indices ofscreech owl abundance by using any other method orcombination of methods in extensively wooded areas
SUMMARY
We surveyed eastern screech owl populationsin southern Connecticut using song playback. Songplayback provided consistent information on pre-
sence and abundance of screech owls throughout the
year. Screech owls exhibited a seasonal freguencyof response to playback, being most responsiveduring fall and winter months and less so duringspring and summer. Response to song playbackvaried significantly with time of year, seguenceand noise levels but not with weather conditions or
moon phase.
The variation in screech owl response fre-
guency with survey seguence suggests that at least
some individuals may accommodate to song playback.Accommodation tests using radiomarked screech owls
confirmed that some individuals accommodate to
playback as a function of censusing freguency; owls
censused at 7 and 14 day intervals showed muchgreater overall response rates compared to owlscensused at 1 and 3 day intervals.
Population estimates obtained during fall and
winter indicate sizeable screech owl populationsthat vary in density as a function of percent wood-land. Comparison with population estimates ob-
tained by a combination of playback, foot searchesand visual confirmation suggests that song playbackprovided estimates within 15-30% of actual screechowl populations during months of maximum screechowl response.
We were unable to confirm reliability of
counts of owls sunning at cavities during daylighthours as a method for locating and estimatingscreech owl populations.
ACKNOWLEDGMENTS
Bill Leng provided VAX mainframe technicalexpertise and helped in many ways in the prepara-
tion of this report. We are indebted to Debbie
Gendron, Douglas Spencer, Mark Drummond and Anne
Walsh for contributing many hours of fieldwork.
We thank Thomas Bosakowski, Tom Carpenter and W.
Bruce McGillivray for critically reviewing one or
more earlier versions of this manuscript.
LITERATURE CITED
Allaire, P. N. , and D. F. Laundrum. 1975. Summer
census of screech owls in Breathitt County,
Kentucky. Kentucky Warbler 51:23-29.
Bent, A. C. 1938. Life histories of North Ameri-
can birds of prey (Part 2). U. S. Nat. Mus
.
Bull. 170, 482 p.
Catchpole, C. 1982. The evolution of bird sounds
in relation to mating and spacing behavior,
pp. 297-320 in D. E. Kroodsma, E. H. Millerand H. Ouellet, eds. Acoustic Communication
in Birds, Volume 1. Academic Press. New
York.
Cink, C. L. 1975. Population of screech owls in
Northeastern Kansas. Kansas Ornithol. Bull.
26: 13-16.
Craighead, J., and F. C. Craighead. 1956. Hawks,
owls, and wildlife. Stackpole Co., Harris-burg, PA.
Devine, A. 1982. Ecology of the screech owl
( Otus asio ) in southern Connecticut. Unpub-
lished Master's Thesis, Southern Connecticut
State University, New Haven, Connecticut.
Fuller, M. R., and J. A. Mosher. 1981. Methodsof detecting and counting raptors: a review.
Studies in Avian Biology 6: 235-246.
Hough, F. 1960. Two significant calling periods
of the screech owl. Auk. 77:227-228.
Johnson, R. R., B. T. Brown, L. T. Haight and
J. M. Simpson. 1981. Playback recordings
as a special avian censusing technigue.
Studies in Avian Biology 6: 68-75.
Kroodsma, D. E., E. H. Miller and H. Ouellet, eds.
1982. Acoustic communication in birds. Vol.
1. Academic Press. New York. 371 pp.
Lynch, P. 1982. A tape census of screech owls
( Otus asio ) in urban open-space areas of New
Haven, Connecticut. Unpublished Master's
Thesis. Southern Connecticut State Univer-
sity, New Haven, Connecticut.
Marion, W. R., T. E. O'Meara, and D. S. Maehr.
1981. Use of playback recordings in sampling
elusive or secretive birds. Studies in Avian
Biology 6: 81-85.
266
Preston, C. R. 1980. Differential perch siteselection by color morphs of the red-tailedhawk ( Buteo j amaicensis ) . Auk. 97:782-789.
Smith, D. 6. , and R. Gilbert. 1984. Screech owlhome range and use of suburban habitats in
southern Connecticut. J. Field Ornithol.55:322-329.
Smith, D. G. 1981. Winter roost site fidelity of
long-eared owls in central Pennsylvania. Am.
Birds 35:339.
Smith, D. G. 1979. Late summer call response ofbarred owls in northern Pennsylvania. Cassi-nia 58:25.
Smith, D. G. 1986. Winter food of the long-earedowl in Pennsylvania. Cassinia 61:38-41.
Springer, M. A. 1978. Foot surveys versus owlcalling surveys: A comparative study of twogreat horned owl censusing techniques. In-land Bird Banding News 50:83-93.
SPSS, Inc. 1983. SPSS-X User's guide. McGrawHill Publ. Co., New York.
Van Camp, L. F., and C. J. Henny. 1975. Thescreech owl: Its life history and population
ecology in Northern Ohio. No. Am. Fauna No.
71. U. S. Fish Wildl. Serv. , Wash., D. C.
McGarigal, K., and J. D. Fraser. 1984. The effectof forest stand age on owl distribution in
southwestern Virginia . J. Wildl. Manage. 48:
1393-1398.
McGarigal, K. , and J. D. Fraser. 1985. Barredowl responses to recorded vocalizations.Ccndor 87: 552-553.
McNicholl, M. K. 1981. Caution needed in the useof playback to census bird populations. Am.
Birds 35:235-236.
Mosher, J. A., and C. J. Henny. 1976. Thermaladaptiveness of plumage color in screech owls.
Auk. 93:614-619.
Norwicki, T. 1974. A census of screech owls
( Otus asio ) using tape-recorded calls. Jack-Pine Warbler 52:99-101.
Owen, D. F. 1963a. Variation in North Americanscreech owls and the subspecies concept.Systematic Zool . 12: 8-14.
Owen, D. F. 1963b. Polymorphism in the screechowl ( Otus asio ) in eastern North America.Wilson Bull. 75: 132-137.
267
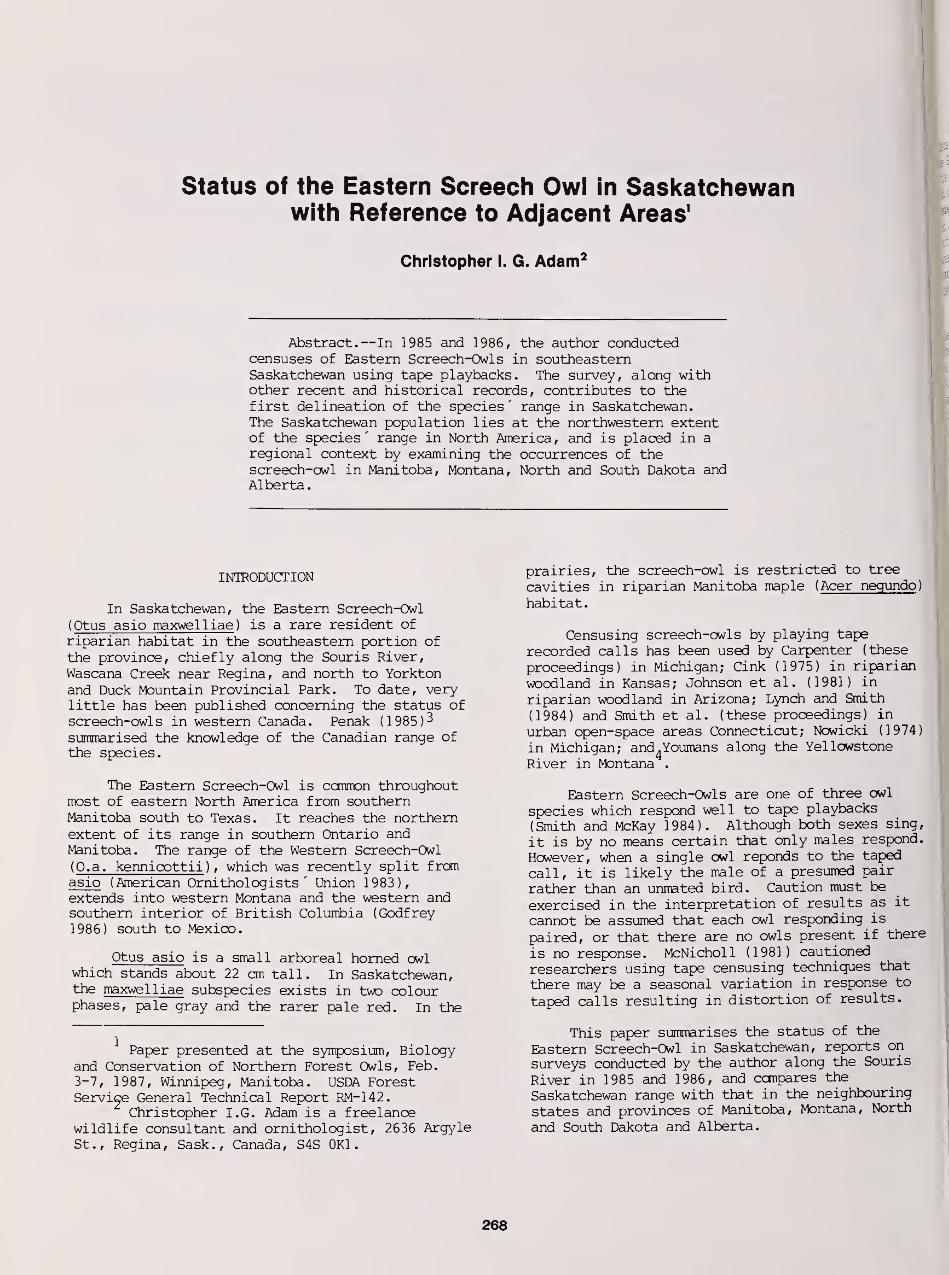
Status of the Eastern Screech Owl in Saskatchewanwith Reference to Adjacent Areas1
Christopher I. G. Adam2
Abstract.—In 1985 and 1986, the author conductedcensuses of Eastern Screech-Owls in southeasternSaskatchewan using tape playbacks. The survey, along withother recent and historical records, contributes to thefirst delineation of the species ' range in Saskatchewan.The Saskatchewan population lies at the northwestern extentof the species' range in North America, and is placed in aregional context by examining the occurrences of thescreech-owl in Manitoba, Montana, North and South Dakota andAlberta.
INTRODUCTION
In Saskatchewan, the Eastern Screech-Owl
( Otus asio maxwelliae ) is a rare resident of
riparian habitat in the southeastern portion ofthe province, chiefly along the Souris River,Wascana Creek near Regina, and north to Yorktonand Duck Mountain Provincial Park. To date, verylittle has been published concerning the status ofscreech-owls in western Canada. Penak (1985)3
summarised the knowledge of the Canadian range ofthe species.
The Eastern Screech-Owl is common throughoutmost of eastern North America from southernManitoba south to Texas. It reaches the northernextent of its range in southern Ontario andManitoba. The range of the Western Screech-Owl
( O.a. kennicottii ) , which was recently split fromasio (American Ornithologists' Union 1983),extends into western Montana and the western andsouthern interior of British Columbia (Godfrey1986) south to Mexico.
Otus asio is a small arboreal horned owlwhich stands about 22 cm tall. In Saskatchewan,the maxwelliae subspecies exists in two colourphases, pale gray and the rarer pale red. In the
Paper presented at the symposium, Biologyand Conservation of Northern Forest Owls, Feb.3-7, 1987, Winnipeg, Manitoba. USDA ForestService General Technical Report RM-142.
Christopher I.G. Adam is a freelancewildlife consultant and ornithologist, 2636 ArgyleSt., Regina, Sask., Canada, S4S OKI.
prairies, the screech-owl is restricted to tree
cavities in riparian Manitoba maple ( Acer negundo )
habitat
.
Censusing screech-owls by playing tape
recorded calls has been used by Carpenter (these
proceedings) in Michigan; Cink (1975) in riparian
woodland in Kansas; Johnson et al. (1981) in
riparian woodland in Arizona; Lynch and Smith
(1984) and Smith et al. (these proceedings) in
urban open-space areas Connecticut; Nowicki (1974)
in Michigan; and4Youmans along the Yellowstone
River in Montana .
Eastern Screech-Owls are one of three owl
species which respond well to tape playbacks
(Smith and McKay 1984). Although both sexes sing,
it is by no means certain that only males respond.
However, when a single owl reponds to the taped
call, it is likely the male of a presumed pair
rather than an unmated bird. Caution must be
exercised in the interpretation of results as it
cannot be assumed that each owl responding is
paired, or that there are no owls present if there
is no response. McNicholl (1981) cautioned
researchers using tape censusing techniques that
there may be a seasonal variation in response to
taped calls resulting in distortion of results.
This paper summarises the status of the
Eastern Screech-Owl in Saskatchewan, reports on
surveys conducted by the author along the Souris
River in 1985 and 1986, and compares the
Saskatchewan range with that in the neighbouring
states and provinces of Manitoba, Montana, North
and South Dakota and Alberta.
268
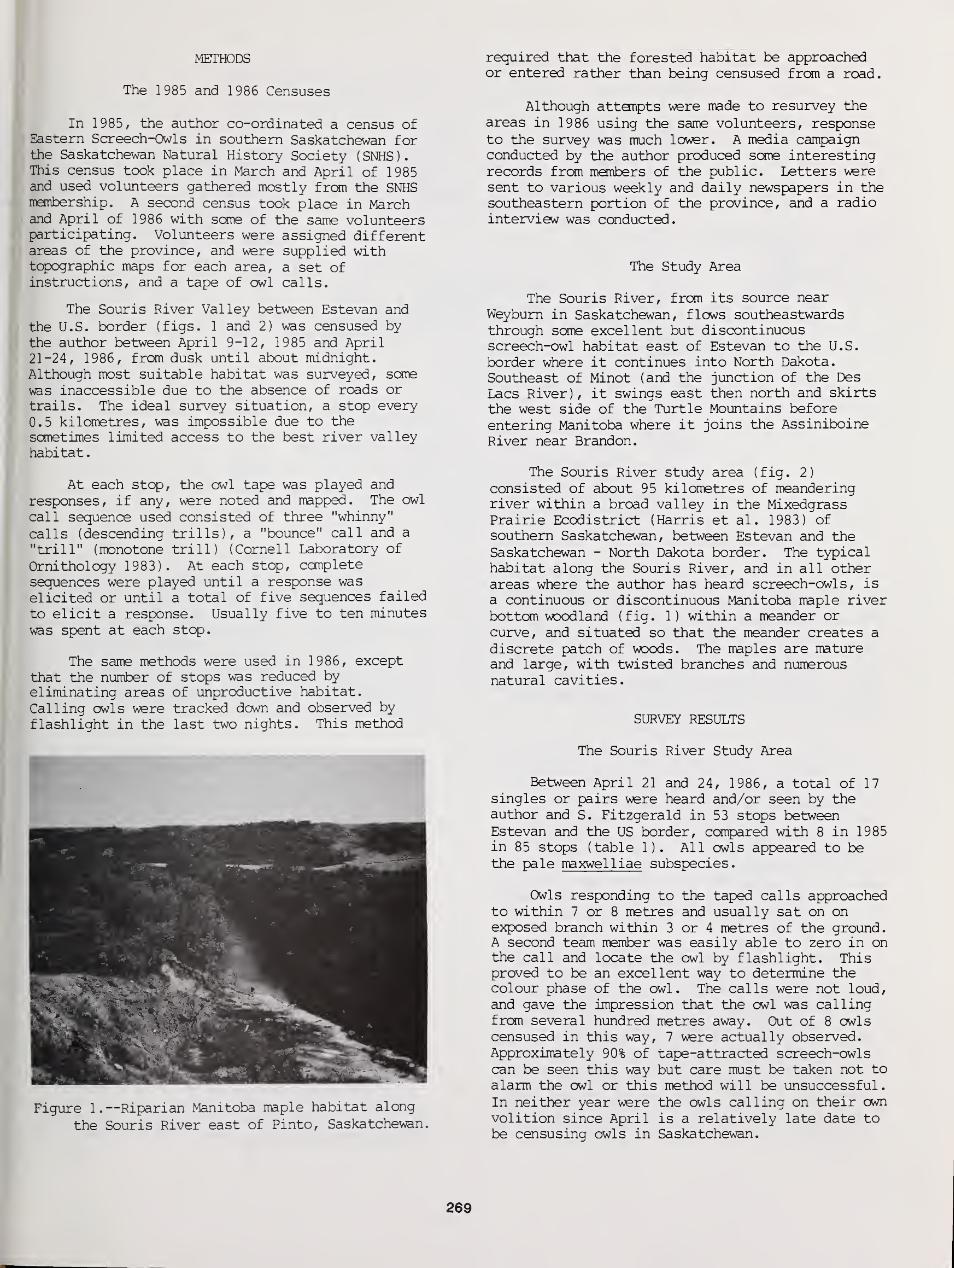
METHODS
The 1985 and 1986 Censuses
In 1985, the author co-ordinated a census ofEastern Screech-Owls in southern Saskatchewan forthe Saskatchewan Natural History Society (SNHS).This census took place in March and April of 1985and used volunteers gathered mostly from the SNHSmembership. A second census took place in Marchand April of 1986 with some of the same volunteersparticipating. Volunteers were assigned differentareas of the province, and were supplied withtopographic maps for each area, a set ofinstructions, and a tape of owl calls.
The Souris River Valley between Estevan and
the U.S. border (figs. 1 and 2) was censused by
the author between April 9-12, 1985 and April21-24, 1986, from dusk until about midnight.Although most suitable habitat was surveyed, somewas inaccessible due to the absence of roads or
trails. The ideal survey situation, a stop every0.5 kilometres, was impossible due to thesometimes limited access to the best river valleyhabitat
.
At each stop, the owl tape was played andresponses, if any, were noted and mapped. The owl
call sequence used consisted of three "whinny"
calls (descending trills), a "bounce" call and a
"trill" (monotone trill) (Cornell Laboratory of
Ornithology 1983). At each stop, complete
sequences were played until a response waselicited or until a total of five sequences failed
to elicit a response. Usually five to ten minuteswas spent at each stop.
The same methods were used in 1986, exceptthat the number of stops was reduced byeliminating areas of unproductive habitat.
Calling owls were tracked down and observed byflashlight in the last two nights. This method
Figure 1.—Riparian Manitoba maple habitat along
the Souris River east of Pinto, Saskatchewan.
required that the forested habitat be approachedor entered rather than being censused from a road.
Although attempts were made to resurvey theareas in 1986 using the same volunteers, responseto the survey was much lower. A media campaignconducted by the author produced some interestingrecords from members of the public. Letters weresent to various weekly and daily newspapers in thesoutheastern portion of the province, and a radiointerview was conducted.
The Study Area
The Souris River, from its source nearWeyburn in Saskatchewan, flows southeastwardsthrough some excellent but discontinuousscreech-owl habitat east of Estevan to the U.S.
border where it continues into North Dakota.Southeast of Minot (and the junction of the DesLacs River ) , it swings east then north and skirtsthe west side of the Turtle Mountains beforeentering Manitoba where it joins the AssiniboineRiver near Brandon.
The Souris River study area (fig. 2)
consisted of about 95 kilometres of meanderingriver within a broad valley in the MixedgrassPrairie Ecodistrict (Harris et al. 1983) ofsouthern Saskatchewan, between Estevan and theSaskatchewan - North Dakota border. The typicalhabitat along the Souris River, and in all otherareas where the author has heard screech-owls, is
a continuous or discontinuous Manitoba maple riverbottom woodland (fig. 1) within a meander orcurve, and situated so that the meander creates a
discrete patch of woods. The maples are matureand large, with twisted branches and numerousnatural cavities.
SURVEY RESULTS
The Souris River Study Area
Between April 21 and 24, 1986, a total of 17
singles or pairs were heard and/or seen by theauthor and S. Fitzgerald in 53 stops betweenEstevan and the US border, compared with 8 in 1985in 85 stops (table 1). All owls appeared to bethe pale maxwelliae subspecies.
Owls responding to the taped calls approachedto within 7 or 8 metres and usually sat on onexposed branch within 3 or 4 metres of the ground.A second team member was easily able to zero in onthe call and locate the owl by flashlight. Thisproved to be an excellent way to determine thecolour phase of the owl. The calls were not loud,and gave the impression that the owl was callingfrom several hundred metres away. Out of 8 owlscensused in this way, 7 were actually observed.Approximately 90% of tape-attracted screech-owlscan be seen this way but care must be taken not toalarm the owl or this method will be unsuccessful.In neither year were the owls calling on their ownvolition since April is a relatively late date tobe censusing owls in Saskatchewan.
269
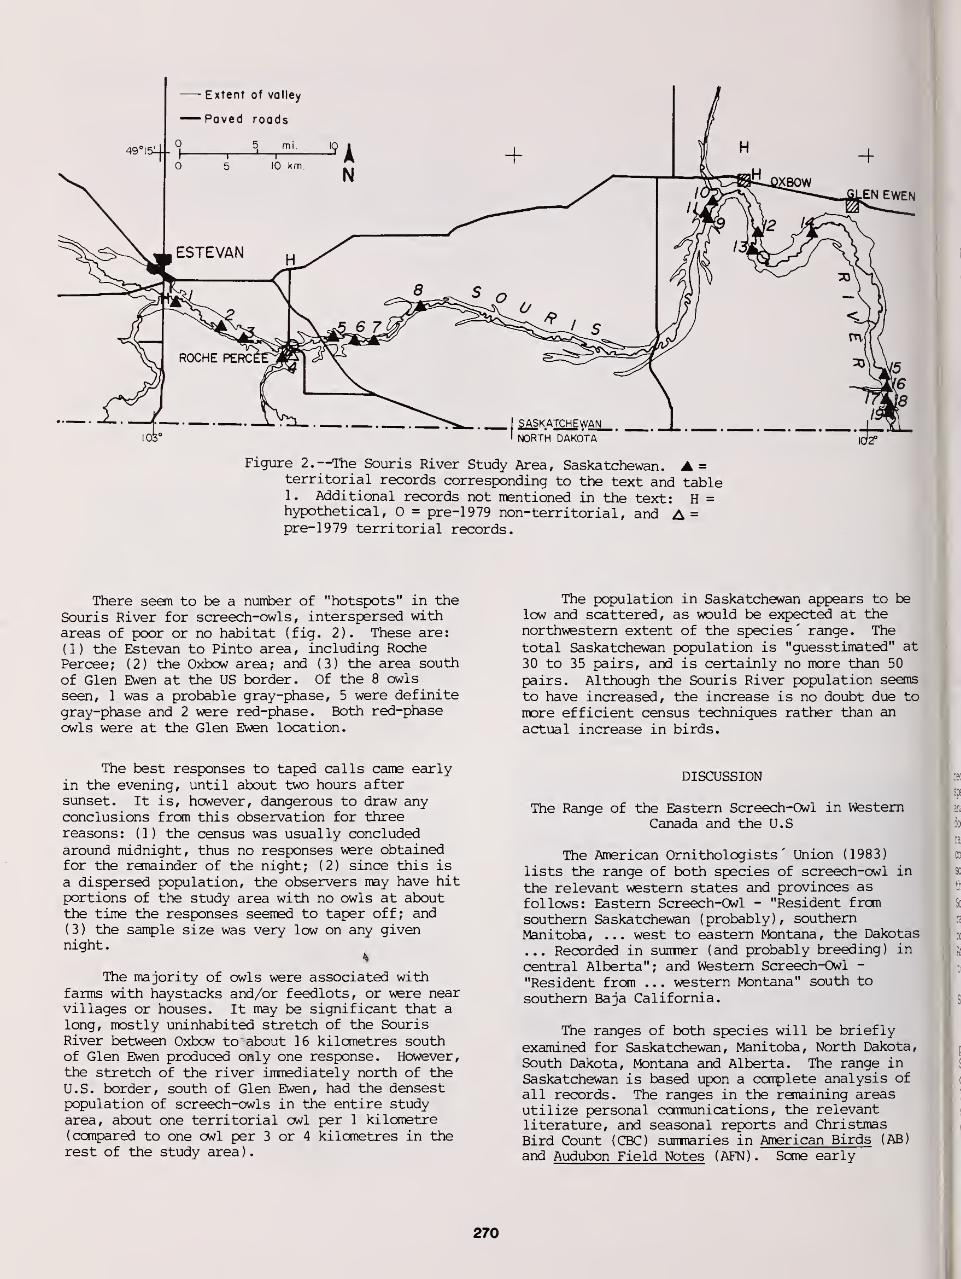
Figure 2. —The Souris River Study Area, Saskatchewan. =territorial records corresponding to the text and table1. Additional records not mentioned in the text: H =hypothetical, 0 = pre-1979 non-territorial, and A =pre-1979 territorial records.
There seem to be a number of "hotspots" in theSouris River for screech-owls, interspersed withareas of poor or no habitat (fig. 2). These are:
(1) the Estevan to Pinto area, including RochePercee; (2) the Oxbow area; and (3) the area southof Glen Ewen at the US border. Of the 8 owls
seen, 1 was a probable gray-phase, 5 were definitegray-phase and 2 were red-phase. Both red-phaseowls were at the Glen Ewen location.
The population in Saskatchewan appears to below and scattered, as would be expected at thenorthwestern extent of the species' range. The
total Saskatchewan population is "guesstimated" at
30 to 35 pairs, and is certainly no more than 50
pairs. Although the Souris River population seems
to have increased, the increase is no doubt due tomore efficient census techniques rather than an
actual increase in birds.
The best responses to taped calls came earlyin the evening, until about two hours aftersunset. It is, however, dangerous to draw anyconclusions from this observation for threereasons: (1) the census was usually concludedaround midnight, thus no responses were obtainedfor the remainder of the night; (2) since this is
a dispersed population, the observers may have hitportions of the study area with no owls at aboutthe time the responses seemed to taper off; and(3) the sample size was very low on any givennight
.
4
The majority of owls were associated withfarms with haystacks and/or feedlots, or were nearvillages or houses. It may be significant that along, mostly uninhabited stretch of the SourisRiver between Oxbow to about 16 kilometres southof Glen Ewen produced only one response. However,the stretch of the river iirmediately north of theU.S. border, south of Glen Ewen, had the densestpopulation of screech-owls in the entire studyarea, about one territorial owl per 1 kilometre(compared to one owl per 3 or 4 kilometres in therest of the study area )
.
DISCUSSION :ec
sps
The Range of the Eastern Screech-Owl in Western m
Canada and the U.S b
ra
The American Ornithologists' Union (1983) eo
lists the range of both species of screech-owl in
the relevant western states and provinces asfollows: Eastern Screech-Owl - "Resident from 3c
southern Saskatchewan (probably), southern i;
Manitoba, ... west to eastern Montana, the Dakotas
... Recorded in summer (and probably breeding) in >
central Alberta"; and Western Screech-Owl -
"Resident from . . . western Montana" south to
southern Baja California. >
The ranges of both species will be brieflyexamined for Saskatchewan, Manitoba, North Dakota,
p
South Dakota, Montana and Alberta. The range inSaskatchewan is based upon a complete analysis ofall records. The ranges in the remaining areasutilize personal communications, the relevantliterature, and seasonal reports and ChristmasBird Count (CBC) summaries in American Birds (AB)
and Audubon Field Notes (AFN). Some early
270
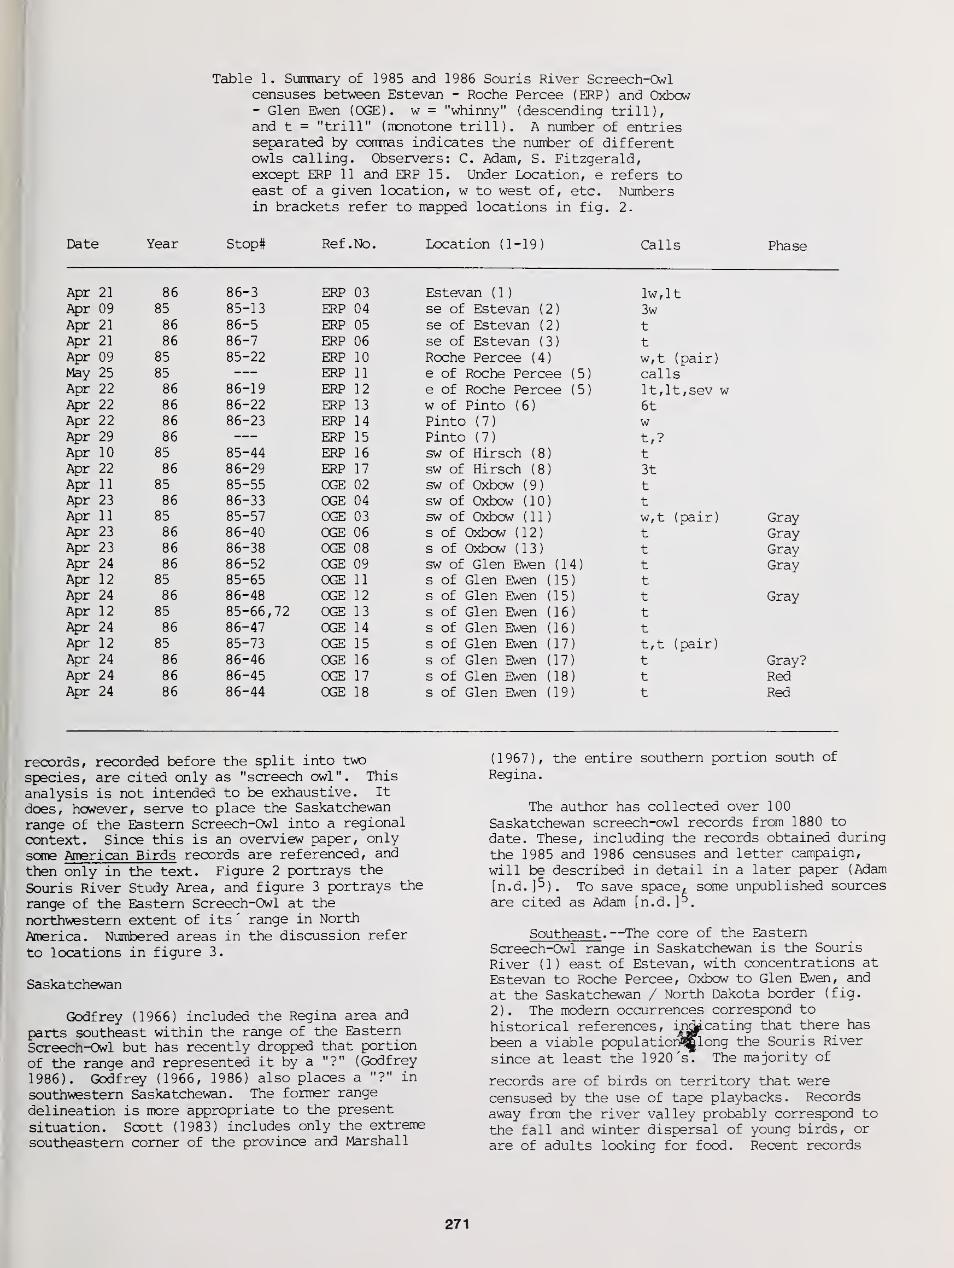
Table 1. Summary of 1985 and 1986 Souris River Screech-Owlcensuses between Estevan - Roche Percee (ERP) and Oxbow- Glen Ewen (OGE). w = "whinny" (descending trill),and t = "trill" (monotone trill). A number of entriesseparated by commas indicates the number of differentowls calling. Observers: C. Adam, S. Fitzgerald,except ERP 11 and ERP 15. Under Location, e refers toeast of a given location, w to west of, etc. Numbersin brackets refer to mapped locations in fig. 2-
Date Year Stop# Ref.No. Location (1-19) Calls Phase
Apr 21 86 86-3 ERP 03 Estevan ( 1
)
lw,ltApr 09 85 85-13 ERP 04 se of Estevan (2) 3wApr 21 86 86-5 ERP 05 se of Estevan (2) tApr 21 86 86-7 ERP 06 se of Estevan (3) tApr 09 85 85-22 ERP 10 Roche Percee (4) w,t (pair)May 25 85 ERP 11 e of Roche Percee (5) callsApr 22 86 86-19 ERP 12 e of Roche Percee (5) lt,lt,sev wApr 22 86 86-22 ERP 13 w of Pinto (6) 6tApr 22 86 86-23 ERP 14 Pinto (7) wApr 29 86 ERP 15 Pinto (7) t,?Apr 10 85 85-44 ERP 16 sw of Hirsch (8) tApr 22 86 86-29 ERP 17 sw of Hirsch (8) 3tApr 11 85 85-55 OGE 02 sw of Oxbow (9) tApr 23 86 86-33 OGE 04 sw of Oxbow (10) tApr 11 85 85-57 OGE 03 sw of Oxbow (11) w,t (pair)Apr 23 86 86-40 OGE 06 s of Oxbow (12) tApr 23 86 86-38 OGE 08 s of Oxbow (13) tApr 24 86 86-52 OGE 09 sw of Glen Ewen (14) tApr 12 85 85-65 OGE 11 s of Glen Ewen (15) tApr 24 86 86-48 OGE 12 s of Glen Ewen (15) tApr 12 85 85-66,72 OGE 13 s of Glen Ewen (16) tApr 24 86 86-47 OGE 14 s of Glen Ewen (16) tApr 12 85 85-73 OGE 15 s of Glen Ewen (17) t,t (pair)Apr 24 86 86-46 OGE 16 s of Glen Ewen (17) tApr 24 86 86-45 OGE 17 s of Glen Ewen (18) tApr 24 86 86-44 OGE 18 s of Glen Ewen (19) t
GrayGrayGrayGray
Gray
Gray?RedRed
records, recorded before the split into two
species, are cited only as "screech owl". This
analysis is not intended to be exhaustive. It
does, however, serve to place the Saskatchewan
range of the Eastern Screech-Owl into a regional
context. Since this is an overview paper, onlysome American Birds records are referenced, and
then only in the text. Figure 2 portrays the
Souris River Study Area, and figure 3 portrays the
range of the Eastern Screech-Owl at the
northwestern extent of its' range in North
America. Numbered areas in the discussion refer
to locations in figure 3.
Saskatchewan
Godfrey (1966) included the Regina area and
parts southeast within the range of the EasternScreech-Owl but has recently dropped that portion
of the range and represented it by a "?" (Godfrey
1986). Godfrey (1966, 1986) also places a "?" in
southwestern Saskatchewan. The former range
delineation is more appropriate to the present
situation. Scott (1983) includes only the extreme
southeastern corner of the province and Marshall
(1967), the entire southern portion south of
Regina
.
The author has collected over 100
Saskatchewan screech-owl records from 1880 to
date. These, including the records obtained during
the 1985 and 1986 censuses and letter campaign,
will be described in detail in a later paper (Adam
[n.d. To save space, some unpublished sourcesare cited as Adam [n.d.p.
Southeast .—The core of the EasternScreech-Owl range in Saskatchewan is the Souris
River (1) east of Estevan, with concentrations atEstevan to Roche Percee, Oxbow to Glen Ewen, and
at the Saskatchewan / North Dakota border (fig.
2 ) . The modern occurrences correspond to
historical references, indicating that there has
been a viable populatiorfl^long the Souris River
since at least the 1920 's. The majority of
records are of birds on territory that werecensused by the use of tape playbacks. Recordsaway from the river valley probably correspond tothe fall and winter dispersal of young birds, or
are of adults looking for food. Recent records
271
from the headwaters of the Souris River (2)
indicate that screech-owls occur thereoccasionally (Adam [n.d.] 5 ).
Central .—Pockets of maple woods alongWascana Creek ( 3 ) near Regina have supported from
zero to three pairs of screech-owls in the recentpast (Adam [n.d.])5. such fluctuations areprobably typical of a peripheral population.There are also several pre-1961 fall and winterrecords for the city of Regina (Belcher 1980) and
recent records for north of Moose Jaw (3) (eg. AB33:781-782). The city of Moose Jaw (4) hasharboured a territorial owl for the last severalyears in a pocket of typical maple habitat alongthe Moose Jaw River. A fledgling extracted from a
chimney there in 1979 (AB 34: 172-174) is the onlyevidence of the breeding of this species inSaskatchewan.
The Qu'Appelle River valley seems ideal for
screech-owls in some localities, but only Katepwa
(5) has produced confirmed records of territorial
owls (Adam [n.d.]5; Callin 1980). No records
exist for the eastern portion of the valley,although the area has potential for screech-owls.
East .—Generally, screech-owls are absentfrom the almost treeless prairie north and east of
the Souris River (6), although there are some
historical records of non-territorial owls (Adam
[n.d. ]5) . a few scattered records exist for thearea between the Qu'Appelle and Souris rivers,including two historical records of calling birdsfrom the southern edge of Moose MountainProvincial Park (Adam [n.d. ]5; Nero and Lein1971). The maple habitat in this region appearsto be rare, and few surveys have been conducted.
Northeast .—Yorkton area (7) records include
several non-territorial and one territorialscreech-owls, indicating the presence of a small
semi-permanent population (Adam [n.d.] 5; Hjertaas
1986; Houston 1949; Pollock 1986). There arerecent records of calling birds from Duck MountainProvincial Park (8) (Adam [n.d.] 5
; Hatch and Weidl1981 6
; Soper 1970 7). A 1979 record of a calling
bird from the Porcupine Hills (9) is the mostnortherly in Saskatchewan (AB 33:872-873).
North .—Two extralimital records (1970's)
from the city of Saskatoon (10) indicate theaccidental presence of both the western(hypothetical) and eastern species (Adam [n.d.]5).
Southwest .—Two areas in southwesternSaskatchewan have produced four screech-owlrecords, indicating that the species' status is
extremely rare and local. Recent screech-owlrecords from the Frenchman River (11), and Eastend
(12) may represent birds which have moved up theFrenchman River from the Milk River in Montana(Adam [n.d.] 5
). The Cypress Hills owl (13) (AB
39:451-452), although not identified to species,is probably an Eastern Screech-Owl which may havemoved up the Battle River from the Havre, Montana,area, also on the Milk River.
Manitoba
Southern Manitoba is within the continuousrange of the Eastern Screech-Cwl according toGodfrey (1986), Marshall (1967) and Scott (1983),although the portrayal of the three ranges differsslightly. Godfrey (1986) suggests that thesubspecies O.a. swenki , a pale race with twocolour phases, is the bird in southwesternManitoba, and that it grades into the darkernaevius (the widely distributed easternsubspecies) at Winnipeg and Whitemouth. Marshall(1967) considers swenki to be included withinmaxwelliae . Sources include American Birdsreports and CBCs, personal communications,Manitoba Museum of Man and Nature files (specimensand nest records) 8 (Adam [n.d.]5) ; and publishedliterature.
Southwest .—There are a few scattered recordsfor southwestern Manitoba, ranging from RidingMountain National Park in the north to Lyleton inthe extreme southwest. There are severalobservations dating from 1972 from the Lyletonarea (14), including Knapton 's (1979) records of
calling birds and flightless young and othersimilar records from the 1980 's. Lyleton is onlyabout 80 km northwest of the Bottineau / Dunseitharea of the Turtle Mountains of North Dakota (24)
where there have been screech-owl records foryears, and also about 60 km due east of a
concentration of screech-owls in the southern partof the Souris River in Saskatchewan ( 1 )
.
Other records come from the Sinclair andReston area, where a family of screech-owls has
hatched annually in the 1980s in or near a park inthe latter (15). There are recent winter recordsfrom Brandon, Oak Lake and Rivers (16). RidingMountain National Park (17) is also the site of arare historical occurrence of a screech-owl (Penak19853
; soper 1953), which appears to be Manitoba'smost northerly record.
Central .—There are a few scatteredobservations between southcentral Manitoba (18)and Lake Manitoba (19). The former area (18)includes two 1927 specimens from La Riviere on thePembina River; a recent specimen from CypressRiver; and documented nests from Roland (Copland19868).
The Winnipeg Area .—Screech-owls appear to bewell established in Winnipeg and area (20), thelarge number of records in no doubt due to themany observers. Specimens exist from Argyle,Dugald, Headingley, and St. Adolph (on the RedRiver); city parks and other areas are the sourceof several specimens and nest records (Copland1986 8 ).
The Eastern Forest .—Taylor (1983) describessome historical screech-owl records fromBrokenhead and the Whitemouth area (21). There isno evidence that screech-owls are regular breedersin this region of the province.
272
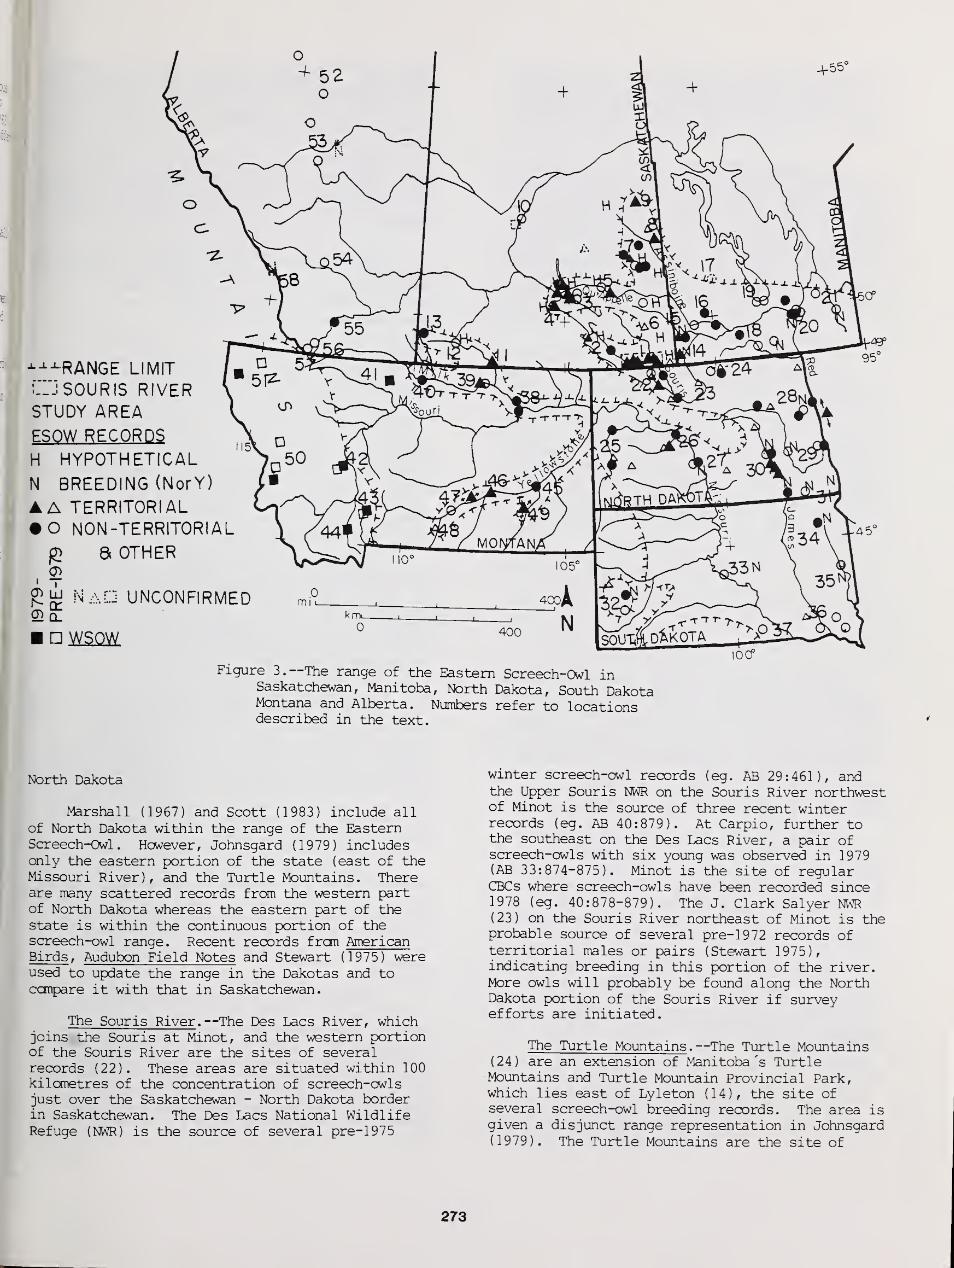
-GRANGE LIMIT
LlJ SOUR IS RIVE i
STUDY AREAESQW RECORDSH HYPOTHETIC/5
N BREEDING (No
A TERRITORIAL• O NON-TERRITOR
p S OTHER
£ w Had unconG) Q_
wsow
Figure 3. —The range of the Eastern Screech-Owl inSaskatchewan, Manitoba, North Dakota, South DakotaMontana and Alberta. Numbers refer to locationsdescribed in the text.
North Dakota
Marshall (1967) and Scott (1983) include allof North Dakota within the range of the EasternScreech-Owl. However, Johnsgard (1979) includesonly the eastern portion of the state (east of theMissouri River), and the Turtle Mountains. Thereare many scattered records from the western partof North Dakota whereas the eastern part of thestate is within the continuous portion of thescreech-owl range. Recent records from AmericanBirds , Audubon Field Notes and Stewart (1975) wereused to update the range in the Dakotas and tocompare it with that in Saskatchewan.
The Souris River .—The Des Lacs River, whichjoins the Souris at Minot, and the western portionof the Souris River are the sites of severalrecords (22). These areas are situated within 100kilometres of the concentration of screech-owlsjust over the Saskatchewan - North Dakota borderin Saskatchewan. The Des Lacs National WildlifeRefuge (NWR) is the source of several pre-1975
winter screech-owl records (eg. AB 29:461), andthe Upper Souris NWR on the Souris River northwestof Minot is the source of three recent winterrecords (eg. AB 40:879). At Carpio, further tothe southeast on the Des Lacs River, a pair ofscreech-owls with six young was observed in 1979(AB 33:874-875). Minot is the site of regularCBCs where screech-owls have been recorded since1978 (eg. 40:878-879). The J. Clark Salyer NWR(23) on the Souris River northeast of Minot is theprobable source of several pre-1972 records ofterritorial males or pairs (Stewart 1975),indicating breeding in this portion of the river.More owls will probably be found along the NorthDakota portion of the Souris River if surveyefforts are initiated.
The Turtle Mountains .—The Turtle Mountains(24) are an extension of Manitoba's TurtleMountains and Turtle Mountain Provincial Park,which lies east of Lyleton (14), the site ofseveral screech-owl breeding records. The area isgiven a disjunct range representation in Johnsgard(1979). The Turtle Mountains are the site of
273
several pre-1972 records of territorial males orpairs (Stewart 1975). There is a summer recordfrcm Bottineau (AFN 23:712-713) and two recentwinter records frcm Dunseith (AB 38:684 and AB39:677).
The Missouri River .—Western North Dakota hasrecent winter records from Medora (AB 38:685 andAB 39:678) and the North Unit of TheodoreRoosevelt National Park, both on the LittleMissouri River (25) (eg. AB 40:879); Garrison Damon the Missouri River (26) (eg. AB 40:877-878);and Bismarck - Mandan, also on the Missouri River(27) (AB 40:877); and other records from theBeulah/Hazen area on the Knife River (26) (eg. AB36:866-868). Nesting has also been confirmed frcmBurleigh and Kidder counties (east of the Bismarckarea) (Stewart 1975)
.
The East.—Eastern North Dakota hasscreech-owl records centered at Grand Forks (28)(eg. AB 35:612) and Fargo (29) (eg. AB 32:741) onthe Red River, well within the continuous EasternScreech-Cwl range. Nests and young have beenfound in Cass and Barnes counties ( 29 ) , Stutsmanand La Moure counties (30) and Richland county(31) (Stewart 1975). On Feb. 2, 1981, C.A. Faanesrecorded responses to taped calls at eighteenlocations along the James River between Jamestownand LaMoure (30) (AB 35:311-313). Jamestown is
the site of numerous winter records (eg. AB37:653-654). Lambeth (1986)9 estimates that thereis more than 1 breeding pair of EasternScreech-Owls per river-mile along the Red Riverand its tributaries (28, 29).
South Dakota
Eastern and central South Dakota, and theWhite River area and Black Hills are included inJohnsgard (1979), while Marshall (1967) and Scott(1983) include the entire state in the breedingrange of the Eastern Screech-Cwl. Because of therelative lack of information, figure 3 presentsthe range as given in Johnsgard (1979). Sourcesused in this summary consist of citations inAmerican Birds and Audubon Field Notes .
The Black Hills (32) contain some recordsfrom Rapid City, including nesting records (eg.
AFN 22:617-620).' Central South Dakota has recordsfrom Pierre, on the Missouri River (eg. AB40:880), and breeding records from Highmore to theeast (eg. AB 34:906-907) (33). Other records arefrom Roberts County (downy young: AB 31:1150-1154)and Waubay National Wildlife Refuge (AB 40:881) inthe northeast ( 34 ) ; the Brookings area in the east(35) (AB 32:220-223); Clay, Yankton and Hutchinsoncounties, and Hurley, in the southeast (36) (eg.
AB 34:284-285); and the Burke area in thesouth-central portion of the state (37) (eg. AB30:969-972).
Montana
Marshall (1967) and Scott (1983) place theeastern extent of the Western Screech-Owl range
along the Continental Divide of Montana's RockyMountains. However, these two authorities differin portraying the western extent of the EasternScreech-Owl range. Marshall (1967) shows a lineextending due south from the Saskatchewan /Alberta border, while Scott (1983) includes onlythe Yellowstone River and southeastern Montana.Recent records from American Birds and the statusof both kennicottii and asio by latilong in Skaaret al. (1985) were used to summarize the ranges inMontana.
The Milk River .—The Milk River, which joinsthe Missouri near Fort Peck, has several scattered'•screech-owl" records: the Glasgow area (38) (eg.
AB 34:284-285); Bowdoin NWR where screech-owlsnave been seen in nest boxes (39) (AB 33:782-784);
and Havre (40), a 1981 winter record (AB 36:684).
The Milk River is the probable source of the three
recent Saskatchewan records: the Frenchman River(11) and Eastend (12) via the Frenchman River fromthe Bowdoin / Glasgow / Fort Peck area; and theCypress Hills (13) via the Battle River from theHavre area. Chester (41), southwest of the MilkRiver but still within the region, is the site of
a Western Screech-Owl identified on a 1982 CBC (AB
37:696). Based on the assumed ranges of bothspecies, the Havre and Chester owls are probablyEastern Screech-Owls and not westerns, unless a
diagnostic song was heard.
The Missouri River .—Records for the Missouri
are very few, and include Fort Peck (38) (Skaar et
al. 1985); and Helena (42) (AB 37:202-204),
Bozeman (43) (eg. AB 37:696) and Ennis (44) (AB
37:696), in the Rocky Mountains. Both Bozeman andEnnis are the sites of recent winter records of
the Western Screech-Owl.
The Yellowstone River .—The Yellowstone Riveralso supports scattered Eastern Screech-Owls, withrecords from Miles City (45) (AB 37:312-314); the
Hysham area (46), where 10 screech-owls werecensused along a ten-mile route (Lambeth 1986)9;
the Billings Latilong (47), where breeding hasbeen confirmed (Skaar et al. 1985); Joliet (48)
(AB 30:87-90); and the Tongue River (49), where
census routes have consistently yieldedscreech-owls (Lambeth 1986) 9
.
The Mountains .—There are several definite
Western Screech-Owl records from near the western
border of Montana, west of the Continental Divide
(50, 51) (eg. AB 38:727). These will not beconsidered in this paper.
Alberta
Although I have not been able to confirm any
of the Alberta records (Salt and Salt 1976; Penak
19853), most are probably Eastern Screech-Owlsexcept possibly those from Waterton Park. The
most northerly records are from Flatbush and
Kinuso in the Swan Hills region (52). There also
have been records from the Edmonton area (53),
including Belvedere, Ellerslie and Pigeon Lake.
There is also a 1950 's record from east of Calgary
274
(54) and one from the Lethbridge area (55). Themost southerly records are from Cardston (56) andWaterton Lakes National Park (57). An 1897
breeding record from Banff (58) is the earliestrecord.
The Waterton birds may have been extralimitalWestern Screech-Owls, but they are undoubtedlyunconfirmable sight records. The southern birdsmay have moved in from Montana and Saskatchewan.The Banff bird may have been a WesternScreech-Owl . The Eastern Screech-Owl shouldprobably be listed as accidental for Alberta.
CONCLUSIONS
Investigations into the range and status ofthe Eastern Screech-Owl in Saskatchewan have shedsome light on the situation in Manitoba, NorthDakota and Montana. South Dakota and Alberta havenot been examined as closely due to the relativelack of data. The range delineation (fig. 3) isstill preliminary in nature, pending furtherdocumentation. The situation is complicated bythe fact that Otus kennicottii was split from Otusasio only in 1983 (AOU 1983). Earlier records arethus not directly separable.
It is clear that the Souris River insoutheastern Saskatchewan is the centre of therange in that province, with peripheral areas suchas Moose Jaw, Regina, Yorkton and Duck Mountainhaving low and occasional populations. Someisolated records indicate that owls have dispersedin winter from the Souris River, or have movedalong the valley to other areas. Similarmovements may account for the presence of owlsalong the Qu'Appelle and the Assiniboine rivers
Penak, B.L. 1985. The status of theEastern Screech-Owl ( Otus asio ) in Canada with anoverview of the status in North America. 127 p.Unpublished Report. World Wildlife Fund of Canadafor the Committee on the Status of EndangeredWildlife in Canada.
Adam, C.I.G. [n.d.] The EasternScreech-Owl in Saskatchewan. MS in preparation.
Youmans, C.C. 1986. Personalcommunication. Forsyth, Montana.
Hatch, D. and D. Weidl. 1981. Fauna
inventory of Duck Mountain Provincial Park,
Saskatchewan. 95 p. Unpublished report.Saskatchewan Tourism and Renewable Resources,Regina, Sask.
Soper, J.D. 1970. Unpublished field noteson the birds observed and collected in theprovince of Saskatchewan, Canada, in 1914, 1921,1927 and from July 1937 to September 1947.
Unpublished report. Canadian Wildlife Service,Saskatoon, Sask.
Copland, H.W.R. 1986. Personalcommunication. Manitoba Museum of Man and Nature,Winnipeg, Manitoba.
Lambeth, D.O. 1986. Personalcommunication. Grand Forks, N.D.
(Yorkton area, Duck Mountain). However, thepresence of owls in Regina and Moose Jaw may bebetter explained by owls moving across theintervening space between the Souris system andthe Moose Jaw River and Wascana Creek.
Western Screech-Owls inhabit riparianhabitat within the mountains of Montana, andEastern Screech-Owls similar areas in the centralplains (AOU 1983; Scott 1983). However, thenorthcentra 1 portion of Montana appears to be in astate of flux. The preliminary range in thispaper indicates that asio is gradually spreadingwestwards along the Yellowstone, Missouri and Milkrivers, and into Saskatchewan via the Frenchmanand Battle rivers.
The situation in Montana and southern Albertashows that the ranges of the two species are notyet set. This brings to light some interestingquestions. The Chester and possibly the Havreowls may be kennicottii . Did they move east outof the mountains of Montana, were theymisidentified, or were they unidentified asio?How far is asio moving west? Is kennicottiimoving east, and how far? Are the Alberta owls,
most of which are old records, asio , or are someof them kennicottii ? Further studies and datacollection may shed some light on this situation.
LITERATURE CITED
American Ornithologists' Union. 1983. Check-list
of North American birds, 6th edition. 877 p.
Allen Press, Lawrence, Kansas.
Belcher, M. 1980. Birds of Regina. Revisededition. Saskatchewan Natural HistorySociety Special Publication No. 12, 151 p.
Regina, Saskatchewan.Callin, E.M. 1980. Birds of the Qu'Appelle,
1857-1979. Saskatchewan Natural History
Society Special Publication No. 13, 168 p.
Regina, Saskatchewan.Cink, C.L. 1975. Population densities of Screech
Owls in northeastern Kansas. KansasOrnithological Society Bulletin 25:13-16.
Cornell Laboratory of Ornithology. 1983. A field
guide to bird songs of eastern and centralNorth America. Second Edition. The PetersonField Guide Series. Houghton Mifflin Co.,
Boston, Mass. (2 records.)Godfrey, W.E. 1966. The birds of Canada. 429 p.
National Museums of Canada, Ottawa.
Godfrey, W.E. 1986. The birds of Canada.Revised edition. 595 p. National Museums of
Canada, Ottawa.Harris, W.C., A. Kabzems, A.L. Kosowan, G.A.
Padbury, and J.S. Rowe. 1983. Ecologicalregions of Saskatchewan. Saskatchewan Parks
and Renewable Resources Technical BulletinNo. 10, 57 p. Forestry Division,
Saskatchewan Parks and Renewable Resources,
Prince Albert, Saskatchewan.Hjertaas, W. 1986. Eastern Screech-Owl near
Yorkton. Blue Jay 44(1 ):47.
276
Houston, C.S. 1949. The birds of the Yorktondistrict, Saskatchewan. The CanadianField-Naturalist 63:215-241.
Johnsgard, P. A. 1979. Birds of the Great Plains.Breeding species and their distribution. 539
p. University of Nebraska Press, Lincoln andLondon, Nebraska.
Johnson, R.R., B.T. Brown, L.T. Haight and J.M.Simpson. 1981. Playback recordings as aspecial avian censusing technique, p. 68-75.In Estimating numbers of terrestrial birds.Ralph, C.J. and J.M. Scott, editors. Studiesin Avian Biology No. 6, Cooper OrnithologicalSociety. Allen Press, Lawrence, Kansas.
Knapton, R.W. 1979. Birds of the Gainsborough -
Lyleton region (Saskatchewan and Manitoba).Saskatchewan Natural History Society SpecialPublication No. 10, 72 p. Regina,Saskatchewan.
Lynch, P.J. and D.G. Smith. 1984. Census of
Eastern Screech-Owls ( Otus asio ) in urbanopen-space areas using tape-recorded song.American Birds 38(4) : 388-391
.
Marshall, J.T. 1967. Parallell variation inNorth and Middle American screech owls.Western Foundation of Vetebrate Zoology,Monograph No. 1, 72 p.
McNicholl, M.K. 1981. Caution needed in use ofplaybacks to census bird populations.American Birds 35(2) :235-236.
Nero, R.W. and M.R. Lein. 1971. Birds of MooseMountain Saskatchewan. Saskatchewan Natural
History Society Special Publication No. 7, 55
p. Regina, Saskatchewan.Nowicki, T. 1974. A census of Screech Owls ( Otus
asio ) using tape recorded calls. TheJack-Pine Warbler 52:98-101.
Pollock, C. 1986. An unusual visitor. Blue Jay44(3):196.
Salt, W.R. and J.R. Salt. 1976. The birds ofAlberta. 498 p. Hurtig Publishers,Edmonton, Alberta
Scott, S.L. , editor. 1983. National GeographicSociety field guide to the birds of NorthAmerica. 464 p. National GeographicSociety, Washington, D.C.
Skaar, D. , D. Flath and L.S. Thompson. 1985.P.D. Skaar 's Montana bird distribution.Revised edition. Monograph No. 3, MontanaAcademy of Sciences, Supplement to theProceedings, Vol. 44.
Smith, D.G. and B. McKay. 1984. The effects ofweather and effort on Christmas Bird Countsof owls in Connecticut. American Birds38(4):383-387.
Soper, J.D. 1953. The birds of Riding MountainNational Park, Manitoba, Canada. CanadianWildlife Service Wildlife ManagementBulletin, Series 2, No. 6., 54 p. Ottawa.
Stewart, R.E. 1975. Breeding birds of NorthDakota. Tri-College Centre for EnvironmentalStudies, Fargo, N.D.
Taylor, P. 1983. Wings along the Winnipeg. Thebirds of the Pinawa-Lac du Bonnet region,Manitoba. Manitoba Naturalists Society EcoSeries No. 2, 223 p. Winnipeg, Manitoba.
276
Effects of Environmental Variables on Responsesof Eastern Screech Owls to Playback
1
Thomas W. Carpenter 2
Abstract.—Seventeen woodlots were censusedfor Eastern Screech-Owls using the playbacktechnique from January of 1983 to August of 1984to examine the effects of cloud cover, temperature,season, wind, and the lunar cycle on playbackresponses. Cloud cover, the lunar cycle, and windsunder 25 kmph had no significant effects on theability to find Eastern Screech-Owls with playback.The mean response latency was significantly lessin winter than spring. Fewer birds were found whentemperatures were below -12 °C.
INTRODUCTION
Many investigators have used playbackin studies of the Eastern Screech-Owl, Otusasio (Casner 1974, Nowicki 1974, Cink 1975,Beatty 1977, Ellison 1980, Smith and Walsh1981, Andrews et. al. 1982, Lynch and Smith1984, Mutter et. al. 1984). Despite suchwidespread use, the influence of environ-mental factors on the results of playbackstudies has received little attention. Inthis study I examined whether the lunarcycle, season, cloud cover, temperature,and moderate (9-24 kmph) versus light (0-8kmph) winds had any significant effects onthe responses of the Eastern Screech-Owlto playback.
METHODS
Using playback, I censused 17 southeast Wisconsin woodlots for EasternScreech-Owls from 16 January 1983 to 20August 198 4. Each woodlot was censusedat 3 to 6 wk intervals. All woodlotswere known to have at least one residentEastern Screech-Owl. During each censusattempt I recorded the day of the lunarcycle, the temperature in °C, wind speed
Paper presented at the symposium,Biology and Conservation of Northern ForestOwls, Feb. 3-7, 1987, Winnipeg, Manitoba.USDA Forest Service General Technical ReportRM-142.
2Thomas W. Carpenter, Department ofBiological Sciences, University of Wisconsin-Milwaukee, Milwaukee, Wise. Presentaddress: 3646 S. John Hix, Wayne, Mich.
in kmph and the percent of the sky covered
by clouds (estimated to the nearest 5%)
.
Response latency (the length of time _ from
the initiation of playback to detection of
a bird) was also recorded. No censusing
was done when winds exceeded 25 kmph or
during heavy precipitation as other invest-
igators have shown these conditions to
severely restrict the ability to detect owls
(Simpson 1972, Siminski 1976, Whisler and
Horn 1977, Forsman 1983). Censusing was
usually carried out between 0200 and 0500
and all censusing was done after 2000.
Time of censusing between these limits
was found to have no significant effect on
the results of playback (Carpenter 1985)
.
The recording used in playback was
taken from the Peterson record series
A Field Guide to Bird Songs and consisted
of a 12 min sequence: 3 min of calling, 1
min of silence, 3 min of calling, 1 min of
silence, 3 min of calling and a final min
of silence. The spacing between calls in
the 3 min segments was 5 s. The recording
was played from a Uher 4000 model tape
recorder and amplified with a Nagra DH
amplifier-speaker to a level of 92 dB.
When birds were detected, playback was
terminated. Otherwise, the 12 min play-
back procedure was completed. If birds
were not detected after this it was as-
sumed they would not respond.
The G test (Sokal and Rohlf 1983)
was used to test for a relationship be-
tween each variable and the response
rate to playback. One-way ANOVA's were
used to test for any influence of each
variable on mean response latency. The
Tukey-Kramer method was used to deter-
277
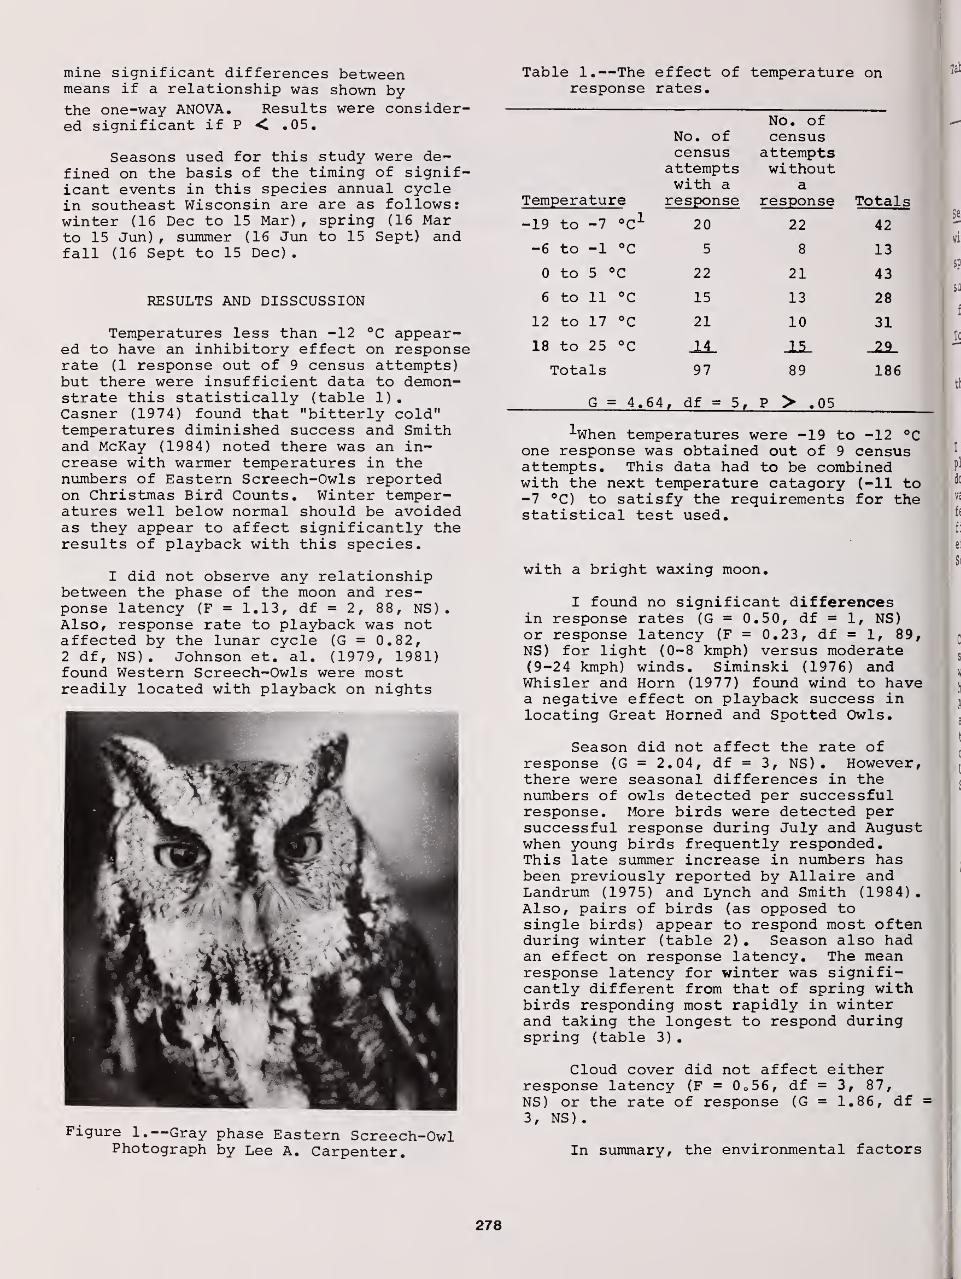
mine significant differences betweenmeans if a relationship was shown bythe one-way ANOVA. Results were consider-ed significant if P < .05.
Seasons used for this study were de-fined on the basis of the timing of signif-icant events in this species annual cyclein southeast Wisconsin are are as follows:winter (16 Dec to 15 Mar) , spring (16 Marto 15 Jun) , summer (16 Jun to 15 Sept) andfall (16 Sept to 15 Dec)
.
RESULTS AND DISSCUSSION
Temperatures less than -12 °C appear-ed to have an inhibitory effect on responserate (1 response out of 9 census attempts)but there were insufficient data to demon-strate this statistically (table 1)
.
Casner (1974) found that "bitterly cold"temperatures diminished success and Smithand McKay (1984) noted there was an in-crease with warmer temperatures in thenumbers of Eastern Screech-Owls reportedon Christmas Bird Counts. Winter temper-atures well below normal should be avoidedas they appear to affect significantly theresults of playback with this species.
I did not observe any relationshipbetween the phase of the moon and res-ponse latency (F = 1.13, df = 2, 88, NS)
.
Also, response rate to playback was notaffected by the lunar cycle (G = 0.82,2 df, NS) . Johnson et. al. (1979, 1981)found Western Screech-Owls were mostreadily located with playback on nights
Figure 1.—Gray phase Eastern Screech-OwlPhotograph by Lee A. Carpenter.
Table 1.—The effect of temperature onresponse rates.
No. ofNo. of censuscensus attempts
attempts withoutwith a a
Temperature response response Totals
-19 to -7 °C 1 20 22 42
-6 to -1 °C 5 8 13
U T-O o u 00 0 1 A O4 o
6 to 11 °C 15 1
3
9ft£. O
12 to 17 °C 21 10 31
18 to 25 °C _29_
Totals 97 89 186
G = 4. 64, df = 5, P > .05
-When temperatures were -19 to -12 °Cone response was obtained out of 9 censusattempts. This data had to be combinedwith the next temperature catagory (-11 to-7 °C) to satisfy the requirements for thestatistical test used.
with a bright waxing moon.
I found no significant differencesin response rates (G = 0.50, df = 1, NS)or response latency (F = 0.23, df = 1, 89,NS) for light (0-8 kmph) versus moderate(9-24 kmph) winds. Siminski (1976) andWhisler and Horn (1977) found wind to havea negative effect on playback success inlocating Great Horned and Spotted Owls.
Season did not affect the rate ofresponse (G = 2.04, df = 3, NS) . However,there were seasonal differences in thenumbers of owls detected per successfulresponse. More birds were detected persuccessful response during July and Augustwhen young birds frequently responded.This late summer increase in numbers hasbeen previously reported by Allaire andLandrum (1975) and Lynch and Smith (1984)
.
Also, pairs of birds (as opposed tosingle birds) appear to respond most oftenduring winter (table 2) • Season also hadan effect on response latency. The meanresponse latency for winter was signifi-cantly different from that of spring withbirds responding most rapidly in winterand taking the longest to respond duringspring (table 3)
.
Cloud cover did not affect eitherresponse latency (F = 0„56, df = 3, 87,NS) or the rate of response (G = 1.86, df -
3, NS)
.
In summary, the environmental factors
278
Table 2.—Single bird responses and re-sponses of pairs of Eastern Screech-Owls with respect to season. 1
No. oftimes
only a No. ofsingle timesbird a pair
Season responded responded Totals
winter 14 7 21
spring 18 3 21
summer 14 4 18
fall 13 1 14
Totals 59 15 74
^The table only includes data fromthe 12 woodlots where pairs were present.
I studied had little effect on response toplayback. Extremely low winter temperaturesdo seem to inhibit responses. The onlyvariable examined that significantly af-fected response latency was season. Myfindings further reinforce playback as aneffective method for studying EasternScreech-Owls.
ACKNOWLEDGEMENTS
I wish to express thanks to Dr.Charles Weise who served as my thesissupervisor during this study and, alongwith Dr. Millicent Ficken, made manyhelpful suggestions on this manuscript.Also, Dr. James Reinartz provided valuableassistance with the statistics used inthis study. The equipment necessary toconduct this research was provided by theUniversity of Wisconsin-Milwaukee FieldStation.
LITERATURE CITED
Allaire, P. N. and D. F. Landrum. 1975.Summer census of Screech Owls inBreathitt County. Kentucky Warbler
51:23-28.
Andrews, Jo W., 0. Komar and N. Komar.1982. Bird Observations in EasternMassachusetts 10:263-269.
Beatty, W. H. 1977. Attracting ScreechOwls. Redstart 44:102-104.
Carpenter, T. W. 1985. The effects ofenvironmental conditions on theresponses of Eastern Screech-Owlsto playback of recorded calls. M. S.thesis. Univ. of Wise. -Milwaukee.
Casner, T. R. 1974. Winter owl census.Jack-Pine Warbler 52:45-46.
Cink, C. L. 1975. Population densitiesof Screech Owls in northeasternKansas. Kansas OrnithologicalSociety Bulletin 26:13-16.
Ellison, P. T. 1980. Habitat use by resi-dent Screech Owls (Otus asio) . M. S.thesis. Univ. of Massachusetts.
Forsman, E. D. 1983. Methods and materialsfor locating and studying Spotted OwlsUSDA Forest Service General TechnicalReport PNW-162.
Johnson, R. R. , B. T. Brown, L. T. Haight,and J. M. Simpson. 1981. Playbackrecordings as a special avian census-ing technique. Studies in Avian Biol-ogy 6:68-75.
., C. T. Haight, and J. M. Simpson.1979. Owl populations and speciesstatus in the southwestern UnitedStates. Pp. 40-59 In Proceedingsof symposium on owls of the west:their ecology and conservation .
P. P. Schaeffer and S. M. Ehlers,eds. Tiburon, California, NationalAudubon Society Western EducationCenter.
Lynch, P. J. and D. G. Smith. 1984. Censusof Eastern Screech-Owls (Otus asio) inurban open space areas using tape-recorded song. American Birds 38:388-
Table 3.—The effect of season on mean responselatency.
winter
Mean response latency in min
fall summer spring df
3.23 + 2.02 3.90 + 2.95 5.32 + 3.41 5.65 + 2.83 3.65* 3, 87
* significant seasonal effect (P .05; one-way ANOVA)
Means connected by the same line do not differsignificantly (P "> .05; Tukey-Kramer method)
279
391.
Mutter, D., D. Nolin, and A. Shartle.1984. Raptor populations on selectedpark reserves in Montgomery County,Ohio. Ohio Journal of Science 84:29-32.
Nowicki, T. 1974. A census of Screech Owlsusing tape-recorded calls. Jack-PineWarbler 52:98-101.
Siminski, D. P. 1976. A study of GreatHorned Owl (Bubo virginianus) popu-lation density with recorded callsin northwestern Ohio. M. S. thesis.Bowling Green State Univ. , BowlingGreen, Ohio
Simpson, M. B. 1972. Saw-whet Owl popu-lation of North Carolina's southernGreat Balsam Mountains. Chat 36:39-47.
Smith, D. G. and B e McKav. 19 84. The ef-fects of weather and effort onChristmas Bird Counts of owls inConnecticut. American Birds 38:383-
and D. T. Walsh. 1981. A modifiedBal-Chatri trap for capturing Scre-ech Owls. North American Bird Bander6:14-15.
Sokal, R. R. and F. J. Rohlf. 1983.Biometry. W. H. Freeman, San Fran-sisco, California.
Whisler, S. and D. Horn. 1977. An in-vestigation into the occurrence andhabits of Northern Spotted Owls(Strix occidentalis caurina) in theUkiah District, BLM, April-June 1977Bureau of Land Management, Ukiah,California.
280
Current Status and Habitat Associations of Forest
Owls in Western Montana1
Denver W. Holt and J. Michael Hillls2
Abstract. Nine species of owls nest in the forests ofwestern Montana. Except for the Great Horned Owl, little isknown about the other species. Only one Flammulated Owl nesthas been reported in Montana. Western Screech Owls are mostlyassociated with riparian zones. Barred and Great Gray Owlnest site information is minimal. Boreal Owls are believed tobe associated with old-growth spruce/fir forests above 1,500 melevation. Nesting Saw-whet Owls seem to be associated withold, large, ponderosa pine snags. There is currently littledata available for resource managers to make sound land-usedecisions. Surveys must be established to gain basic habitatpreference information for the species group.
INTRODUCTION
Little is known about the status and the
habitat requirements for forest owls in western
Montana. Except for the Great Horned Owl (Bubo
virginianus ) , which exists in almost all habitats
throughout the State, resource managers have
little information available on which to make
sound land-use decisions that will maintain
viable populations of forest owls. Even the most
basic information regarding the potential impacts
of timber harvest or firewood cutting on this
species group is lacking. The purpose of this
paper is to centralize the current status and
present preliminary information on habitat dis-
tribution of these owls for resource managers,
researchers, and interested persons in western
Montana. In addition we ask, what are the
responsibilities of United States Forest Service
to this species group, and briefly comment on two
management strategies often implemented.
Further, we provide general census informationguidelines (Tables 1, 2, and 3) and data sheets(Appendices 1, 2, and 3) for western Montanashould the need or interest occur.
Before any research or management goals canbegin, we feel it is essential to provide afoundation to work from. The following speciesaccounts, however minimal, are state-of-the-artinformation for eight forest owls in westernMontana. We define western Montana as theportion of the Rocky Mountains from theIdaho/Montana border east to our arbitrary line(Fig. 1).
We have not included the Great Horned Owl
because of its wide distribution and diversehabitat association in western Montana or the
Eastern Screech Owl ( Otus asio) because this
species has yet to be found in the area coveredby this map.
"Paper presented at the Symposium, Biology
and Conservation of Northern Forest Owls.
February 3~7, 1987. Winnipeg, Manitoba. USDA
Forest Service, General Technical Report,
RM-142."
2Denver W. Holt, Research Associate, USDA,
Lolo National Forest, Supervisor's Office,
Missoula, Montana 59801.
J. Michael Hillis, Wildlife Biologist, USDA,
Lolo National Forest, Supervisor's Office,
Missoula, Montana 59801.
SPECIES ACCOUNTS
The following is a summary of informationcollected thus far including nest data collectedby other individuals.
FLAMMULATED OWL ( Otus flammeolus )- Skaar et
al. (1985) list five records—all occurring in
western Montana. More recently, Holt, et al.
(submitted for publication) has added six recentrecords, including the first nest record forMontana. The Flammulated Owl is a cavity-nestingowl strongly associated with old-growth ponderosapine (Pinus ponderosa ) (Bull and Anderson 1978;Linkhart 1984; Reynolds and Linkhart 1984). In
281
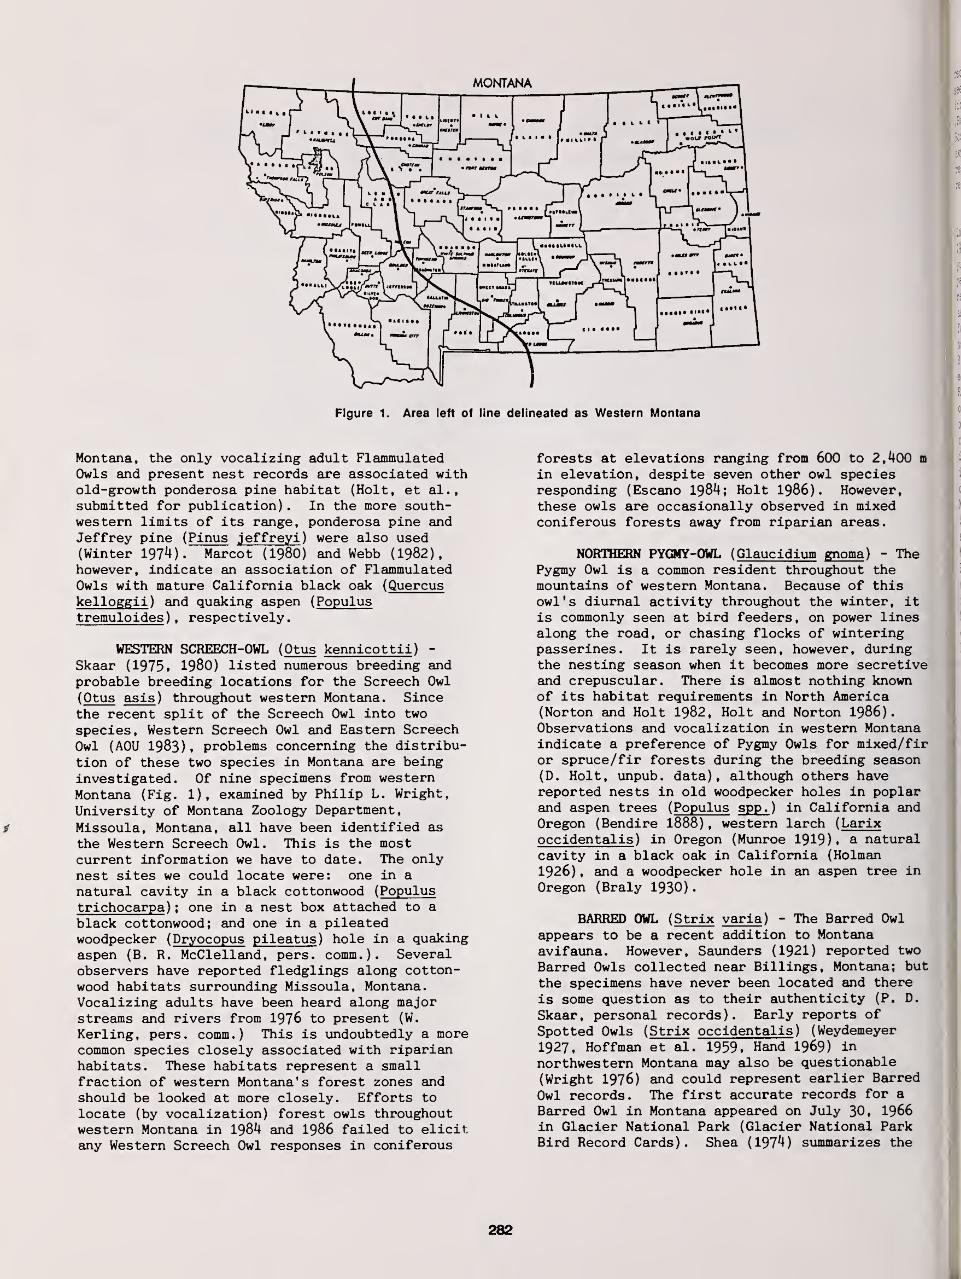
Figure 1. Area left of line delineated as Western Montana
Montana, the only vocalizing adult FlammulatedOwls and present nest records are associated withold-growth ponderosa pine habitat (Holt, et al.,
submitted for publication) . In the more south-western limits of its range, ponderosa pine andJeffrey pine (Pinus jeffreyi ) were also used(Winter 1974). Marcot (1980) and Webb (1982),however, indicate an association of FlammulatedOwls with mature California black oak ( Quereuskelloggii ) and quaking aspen ( Populustremuloides ) , respectively.
WESTERN SCREECH-OWL ( Otus kennicottii )-
Skaar (1975. 1980) listed numerous breeding andprobable breeding locations for the Screech Owl
( Otus asis ) throughout western Montana. Sincethe recent split of the Screech Owl into two
species, Western Screech Owl and Eastern ScreechOwl (AOU 1983). problems concerning the distribu-
tion of these two species in Montana are beinginvestigated. Of nine specimens from westernMontana (Fig. 1), examined by Philip L. Wright,
University of Montana Zoology Department,
Missoula, Montana, all have been identified as
the Western Screech Owl. This is the mostcurrent information we have to date. The onlynest sites we could locate were: one in anatural cavity in a black cottonwood ( Populustrichocarpa ) ; one in a nest box attached to ablack cottonwood; and one in a pileatedwoodpecker ( Dryocopus pileatus ) hole in a quakingaspen (B. R. McClelland, pers. comm.). Severalobservers have reported fledglings along cotton-wood habitats surrounding Missoula, Montana.Vocalizing adults have been heard along majorstreams and rivers from 1976 to present (W.
Kerling, pers. comm.) This is undoubtedly a morecommon species closely associated with riparianhabitats. These habitats represent a smallfraction of western Montana's forest zones andshould be looked at more closely. Efforts tolocate (by vocalization) forest owls throughoutwestern Montana in 1984 and 1986 failed to elicitany Western Screech Owl responses in coniferous
forests at elevations ranging from 600 to 2,400 m
in elevation, despite seven other owl speciesresponding (Escano 1984; Holt 1986) . However,these owls are occasionally observed in mixedconiferous forests away from riparian areas.
NORTHERN PYGMY-OWL (Glaucidium gnoma ) - ThePygmy Owl is a common resident throughout themountains of western Montana. Because of thisowl's diurnal activity throughout the winter, itis commonly seen at bird feeders, on power linesalong the road, or chasing flocks of winteringpasserines. It is rarely seen, however, duringthe nesting season when it becomes more secretiveand crepuscular. There is almost nothing knownof its habitat requirements in North America(Norton and Holt 1982, Holt and Norton 1986)
.
Observations and vocalization in western Montanaindicate a preference of Pygmy Owls for mixed/firor spruce/fir forests during the breeding season(D. Holt, unpub. data), although others havereported nests in old woodpecker holes in poplarand aspen trees (Populus spp. ) in California andOregon (Bendire 1888) , western larch (Larixoccidentalis ) in Oregon (Munroe 1919) . a naturalcavity in a black oak in California (Holman
1926) , and a woodpecker hole in an aspen tree in
Oregon (Braly 1930)
.
BARRED OWL (Strix varia ) - The Barred Owl
appears to be a recent addition to Montanaavifauna. However, Saunders (1921) reported two
Barred Owls collected near Billings, Montana; but
the specimens have never been located and there
is some question as to their authenticity (P. D.
Skaar , personal records ) . Early reports of
Spotted Owls (Strix occidentalis ) (Weydemeyer
1927, Hoffman et al. 1959. Hand 1969) in
northwestern Montana may also be questionable(Wright 1976) and could represent earlier Barred
Owl records. The first accurate records for a
Barred Owl in Montana appeared on July 30, 1966in Glacier National Park (Glacier National ParkBird Record Cards). Shea (197*0 summarizes the
282
recent range expansion in western Montana, whichseem to center around northwestern Montana. Thefirst verified nest was reported on May 29, 1976(Rogers 1976). Taylor and Forsman (1976) andBoxall and Stephney (1982) discuss rangeexpansion of the Barred Owl and permanentresidence in western North America and Alberta,respectively.
Despite 20 years of possible range expansionin Montana, few nests have been reported (Rogers
1976, 1979. 1982) and habitat associations arejust beginning to be identified. Over the last 5years near Libby, Montana, three Barred Owlnesting territories have been located. All wereassociated with mixed species of old-growthforest between 900 to 1,200 m in elevation;however, no actual nests have been found (A.
Bratkovich, pers. comm.). In 1985, vocalizingadults and a probable nest site was located nearRainy Lake in the upper Clearwater River drainageof Montana. The nest was in a stand of scatteredold-growth western larch (M. Hillis, pers.comm.). One Barred Owl nest reported, was foundin the broken top of a live western larch approx-imately 1,200 m in elevation (R. Kuennen, pers.comm.). Over the past 10 years in GlacierNational Park, four Barred Owl nests were foundin broken-top old-growth western larch trees,approximately 1,000 m in elevation (B. R.
McClelland, pers. comm.). Also, vocalizing adultBarred Owls during the breeding season have beenassociated with old-growth western larch standsin the Rattlesnake Wilderness Area, Missoula,Montana, from 1976 to present (W. Kerling, pers.comm.). Current surveys (D. Holt, unpubl. data)have located Barred Owls during the nestingseason from 900 to 1,800 m elevation in riparian(one record), mixed larch, and lodgepole pine(Pinus contorta ) habitats.
GREAT GRAY OWL (Strix nebulosa )- Skaar et
al. (I985) list this owl as a fairly commonresident throughout western Montana. However,there are only ten known nest records (Weydemeyer1932; Hand 1969; Rogers 1972, 1975, 1976, 1977,1979, 1982; Skaar pers. records) that we couldlocate, despite numerous sightings and suspectednesting areas. Most of these, however, were eastof the Continental Divide. Great Gray Owls aretypically associated with lodgepole pine/wetmeadow ecotones east of the Continental Divide inMontana (S. Gniadek, pers. comm.). Escano (1984)reported Great Gray Owls occurring in lodgepolepine/wet meadow complexes between 1,500 to 2,300m in elevation only east of the ContinentalDivide, despite surveys on both sides. West ofthe Continental Divide, J. Foote (pers. comm.)
reported Great Gray Owls probably nesting in the
last 4 to 6 consecutive years in spruce bogs nearOvando, Montana. In addition, D. Holt (unpubl.
data) located Great Gray Owls in spruce/fir bogsapproximately 1,800 m in elevation in westernMontana. Nero (I98O) also reported Great GrayOwls using nests in spruce bogs from Manitoba,Canada. There are enough sightings to indicatethat this owl occurs regularly west of theContinental Divide in Montana, but surveys are
needed to locate breeding territories and nesttrees
.
LONG-EARED OWL ( Asio otus) - While this is
one of the more common owls in the State (Skaaret al., 1985), information concerning foresthabitat preferences is lacking. Nesting of this
species in old magpie ( Pica pica ) or Americancrow (Corvus brachyrhynchos ) nests in densedeciduous vegetation in shrubsteppe desert is
well documented (Marks 1986) . Similar nest siteshave been recorded in eastern (S. Gniadek, pers.
comm.) and western (D. Holt, unpubl. data)
Montana. They are reported to nest in woodlandsbordered by meadows in Europe (Mikkola 1983)
•
However, there seems to be a scarity of informa-tion concerning habitat preferences in theconiferous forests of western Montana. Vocaliz-ing adults have been heard in mixed Douglas-fir
( Pseudotsuga menziesii ) stands near Missoula,Montana (D. Holt, unpubl. data), and a stick nestwas found in a lodgepole pine tree in GlacierNational Park, Montana in July 1985 (Glacier ParkBird Record Cards). But, to what extent is thisreally a forest owl?
BOREAL OWL ( Aegolius funereus )- Skaar et
al., 1985) list 16 verified records for Montana.Though no nests have been located, threejuveniles were observed in Glacier National Parkby Dave Shea in July 1973' This constitutes theonly evidence of breeding for the State. Morerecently, Escano (1984) and Holt (1986) haveconducted specific surveys to locate Boreal Owlsin western Montana. An additional specimenrecord (Holt et al., in press) and a sightingrecord (T. Ryan, pers. comm.) were also reportedin 1986. Thus far, survey results indicate thatBoreal Owls in western Montana prefer mature old-growth spruce/fir forests greater than 1,500 m inelevation, though east of the Continental Divide,some survey results were associated with lodge-pole pine/wet meadow habitat. Hayward and Garton
(1983) and Palmer and Ryder (I986) summarized the
first nesting and documented nesting records forBoreal Owls in Idaho and Colorado, respectively.Status and distribution of this owl are slowlycoming to light now that surveys to locate themare being conducted in the Rocky Mountain states.
SAW-WHET OWL ( Aegolius acadicus) - Littleinformation exists in the literature concerningSaw-whet Owls in western Montana. It appears to
be a fairly common owl with wide distributionthroughout the State (Skaar et al., 1985)
.
Though generally associated with coniferousforests in Montana, Saw-whet Owls have also beenlocated along cottonwood habitats (Youman, etal., 1981 ; W. Heron, pers. comm.). Of nine nestsites in western Montana from which we arefamiliar, seven were in dead ponderosa pine snags(D. Holt, unpubl. data), one was in a deadwestern larch snag (J. Kipphut pers. comm.), andone probable nest was also in a western larchsnag (B. R. McClelland, pers. comm.). Twoadditional nesting territories located in 1986were associated with mixed ponderosa pine/Douglas-fir habitat (D. Holt, unpubl. data).
283
SUMMARY OF SPECIES ACCOUNTS
We know very little about habitat require-ments for most forest owls of western Montana.We are sure that there may be more informationavailable for several of the species mentioned.Unfortunately, if it is not in the literature orlocally reported, it is difficult to find.Five of the eight owl species (Flammulated,Western Screech, Northern Pygmy, Boreal, andSaw-whet) are dependent on tree cavities, eithernatural or excavated, for nest sites. The Barredand Great Gray Owls either nest in large broken-top snags or large stick nests made by otherbirds. Long-eared Owls nest in stick nests madeby other birds. Seven of the eight species aredirectly associated to snags and mature orold-growth trees for nest sites. The WesternScreech Owl is mostly associated with riparianhabitats, which represent a small fraction ofwestern Montana's forest zones. Threats to thishabitat could have a great effect on this owl.
WHAT ARE THE RESPONSIBILITIES OFTHE FOREST SERVICE?
Do forest management plans provide adequatehabitats to maintain viable populations ofwestern Montana's forest owls? Without baselinesurveys to locate nesting areas, or more adequatehabitat use data, there is inadequate informationto answer this question.
With the exception of the Spotted Owl ( Strixoccidentalis ) , the U. S. Forest Service has notgiven much emphasis to owl management. This is
contrary to the National Forest Management Act of
1976 (NFMA) which mandates that all wildlifespecies be managed for viable populations. How-ever, with over 500 vertebrate species this wouldbe difficult for any organization. Recognizingthe absence of detailed information on owl
habitat, the apparent association of owls withsnags, mature, and old-growth timber (bothrapidly declining) , it seems inconsistent thatthe U. S. Forest Service has placed littleemphasis on owl management. One might concludethat the agency's painful experiences with theSpotted Owl in Oregon and Washington have evolvedinto a "hear no evil, see no evil" approach forother forest owls as well. Fortunately, thatattitude may be changing. Some positive signs ofthat change include: 1) adoption of a Montanasensitive species list that includes two owls
—
the Great Gray and Boreal; and 2) a commitmentto fund intensive inventories for severalsensitive species each year. Unfortunately, nospecies of owls were selected for inventory in1987.
We suggest an approach to protectingMontana's forest owl populations to include thefollowing steps:
1. An inventory of owl nestingdistribution;
2. Cooperation with researchers to definenest-stand selection, territory size,prey base, and population status; and
3. Development of a management strategyfor maintaining viable populations foreach forest owl species into individualForest Plans.
The above three steps would allow the U. S.
Forest Service to appropriately modify timberharvest and firewood activities in a way thatguarantees population viability for forest owls.
"INDICATOR" SPECIES
Using indicator species to indicate effectsof management on a variety of species is acommonly used concept. For instance, using thePileated Woodpecker in western Montana as anindicator for species dependent on old-growthlarch-fir forests is "the key to retaining acomplete community of hole-nesting birds"(McClelland 1977)- For some snag dependent owls,such as the Flammulated, Western Screech, Barred,and Saw-whet, the Pileated Woodpecker may be auseful key. However, this may not help theNorthern Pygmy, Great Gray, Long-eared, andBoreal Owls, which appear to be dependent ondifferent habitats. Also, indicator species usedin one area may not be applicable to anotherarea. Without basic knowledge of what owls occurin which habitats, how can an indicator speciesbe useful for the species group?
ARTIFICIAL NEST SITES
Artificial nest sites have been used toeither manage, protect, or increase wildlifepopulations. Many of these programs have beensuccessful to help reestablish certain species orgain certain biological information. But tointroduce artificial nest sites for convenienceor to increase populations not in jeopardy is ofquestionable value. This turns into single spe-cies or group species management, which undoubt-edly effects other species of the community. Ifartificial nest sites are needed temporarily togather some important information, they should beused temporarily and then removed. For somespecies, artificial nests may be needed, but touse this tool for managing forest owls in lieu ofan active habitat research and management programis unwise. We state this obvious point tochallenge the inevitable "quick fix" philosophythat federal agencies or industry groups utilizewhich often implies that many wildlife problemscan be solved with a bird box. Artificial nestsites should be used only where and when it isthe last alternative to maintain or reestablish apopulation in jeopardy. Only habitats that agiven species in known to nest in should beinfluenced. And, when planning such projects, weshould seek to approximate the levels of viable
284
populations that may have been found in otherstudies of natural populations.
If we go beyond this, then we become like
game managers, producing the animals we like bestand ignoring the overall continuity of naturalcommunity.
CONCLUSION
We have tried to emphasize the lack of in-
formation on forest owls in western Montana and
the immediate need for baseline surveys. Many of
the species may be dependent on snags, mature, or
old-growth timber for nest sites. Indicatorspecies currently used to measure ecosystemhealth may not work for all the owls mentioned.
Artificial nest sites should not replace an
ecosystem's approach to owl management. It's
time to create a strong research and management
strategy designed to meet the habitat needs of
these owls. The National Forests must lead the
way.
Two unfortunate examples help illustrate the
need for more information. In March 1986, a
Boreal Owl nest territory was located in a mature
spruce/fir stand west of Missoula. Later that
spring a logging company moved into the area and
began operations (Holt 1986) . While this pro-vides an opportunity to monitor the effect oflogging disturbance on the owls, it is doubtfulwhether the disturbance-related data will beworth the potential loss of the nest territory.In July 1985, north of Missoula, a firewoodcutter felled the first documented nest site forFlammulated Owls in Montana (Holt et al., sub-mitted for publication)
.
In the case of the Boreal Owl, this was aknown nest territory, previously surveyed in 1984and 1985. While the timber in the area hadalready been sold to a contractor, could not somecontract modification been made to protect thenest stand? The answer, of course, is "yes" ifthe Forest Service had had an owl managementstrategy or program to rely on. Regarding theFlammulated Owls, at least the woodcutterreported the incident. This raises anothersignificant question which is, are firewoodcutting guidelines and dissemination ofinformation adequate to maintain snags alongforest roads?
These are standard old-growth questions,which in the immediate past were most oftenassociated with woodpeckers. Beebe (197*0 andMcClelland (1977) thoroughly address theseissues. Further, Fischer and McClelland (1983)list over 1,700 references pertaining to cavitynesting birds.
ACKNOWLEDGMENTS
We thank Al Bratkovich, Jeff Foote, DonGodtel, Steve Gniadek, Guenter Heinz, WillisHeron, Will Kerling, Joe Kipphut, Reed Kuennon,L. Jack Lyon, B. Riley McClelland, Wally Murphy,Tim Ryan, Don Skaar, Marjorie Swanson, WintonWeydemeyer, and P. L. Wright for their personalrecords and suggestions for survey techniques.We are most grateful to Don Skaar for allowing us
to use his father's (P. D. Skaar) personalrecords
.
We also thank Lorna McNay and Carmen O'Learyfor typing, editing, and revising the manuscript.
We are especially grateful to Greg and
Patricia Hayward for coordinating the 1984 Boreal
Owl Surveys in western Montana.
LITERATURE CITED
American Ornithologists' Union (AOU) . 1983-Check-list of North American Birds, 6thedition. American Ornithologists' Union(Washington, D. C).
Beebe, S. B. 1974. Relationships betweeninsectivorous hole-nesting birds and forestmanagement. Yale Univ. School of For. and
Envir. Studies. New Haven, CT. 49 p.
Bendire, C. E. 1888. Notes on the habits, nestsand eggs of the genus Glaucidium Boie. Auk
5:366-372 p.
Boxall, P. C. and P. H. R. Stephney. 1982. Thedistribution and status of the Barred Owl in
Alberta. Can. Field-Nat. 96:46-50 p.
Braly, J. C. 1930. Nesting of the CaliforniaPygmy Owl in Oregon. Condor 32:304 p.
Bull, E. L. and R. G. Anderson. 1978. Notes onFlammulated Owls in north-eastern Oregon.Murrelet 59:26-27 p.
Escano, R. 1984. 1984 Boreal Owl surveysummary. Wildlife, Fish, and Habitat Relat.
Prog., Northern Reg. USFS, Missoula,MT 11 p.
Fischer, W. C. and B. R. McClelland. I983. A
cavity-nesting bird bibliography includingrelated titles on forest snags, fire,
insects, disease, and decay. USDA For. Ser.
Gen. Tech. Rep. INT-140 79 P- Intermt. For.
and Range Exp. Stn. , Ogden, UT 84401.Hand, R. L. 1969- A distributional check-list
of the birds of western Montana. R. L.
Hand, Missoula, MT.
Hayward, G. D. and E. 0. Garton. 1983. Firstnesting record for Boreal Owl in Idaho.Condor 85:501 p.
Hoffman, R. S., Hand, R. L., and P. L. Wright.
1959' Recent bird records from westernMontana. Condor 61:147-151 p.
Holman, F. C. 1926. Nesting of the Pygmy Owl in
Yosemite. Condor 28:92-93 P-
285
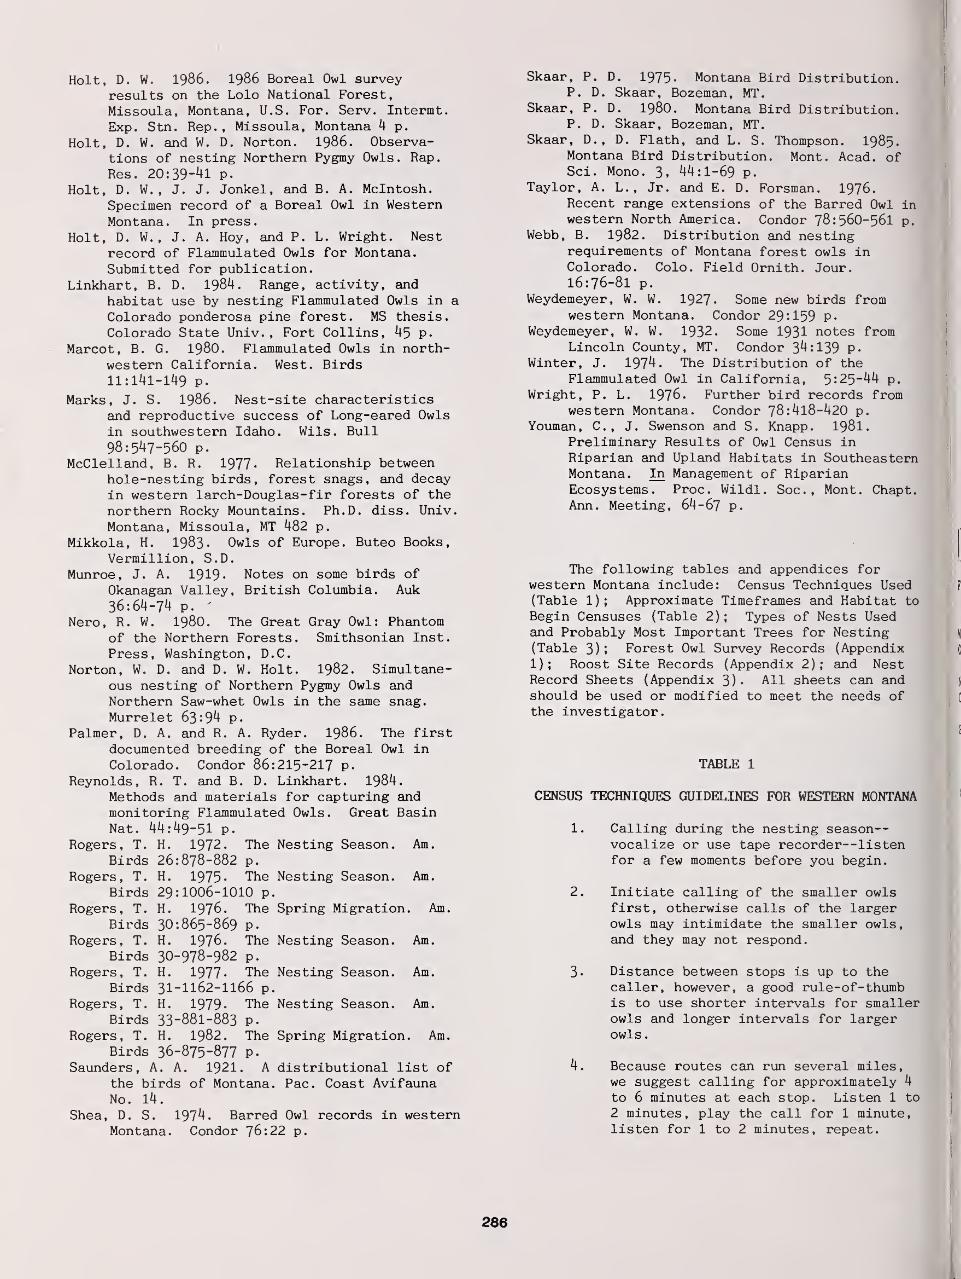
Holt, D. W. 1986. 1986 Boreal Owl surveyresults on the Lolo National Forest,
Missoula, Montana, U.S. For. Serv. Intermt.
Exp. Stn. Rep., Missoula, Montana 4 p.
Holt, D. W. and W. D. Norton. 1986. Observa-tions of nesting Northern Pygmy Owls. Rap.
Res. 20:39"4l P-Holt, D. W. , J. J. Jonkel, and B. A. Mcintosh.
Specimen record of a Boreal Owl in WesternMontana. In press.
Holt, D. W., J. A. Hoy, and P. L. Wright. Nestrecord of Flammulated Owls for Montana.Submitted for publication.
Linkhart, B. D. 1984. Range, activity, andhabitat use by nesting Flammulated Owls in a
Colorado ponderosa pine forest. MS thesis.
Colorado State Univ., Fort Collins, 45 p.
Marcot, B. G. I98O. Flammulated Owls in north-western California. West. Birds11: 141-149 p.
Marks, J. S. 1986. Nest-site characteristicsand reproductive success of Long-eared Owlsin southwestern Idaho. Wils. Bull98:547-560 p.
McClelland, B. R. 1977. Relationship betweenhole-nesting birds, forest snags, and decayin western larch-Douglas-fir forests of thenorthern Rocky Mountains. Ph.D. diss. Univ.
Montana, Missoula, MT 482 p.
Mikkola, H. 1983. Owls of Europe. Buteo Books,Vermillion, S.D.
Munroe, J. A. 1919. Notes on some birds ofOkanagan Valley, British Columbia. Auk36:64-74 p.
'
Nero, R. W. I98O. The Great Gray Owl: Phantomof the Northern Forests. Smithsonian Inst.
Press, Washington, D.C.
Norton, W. D. and D. W. Holt. 1982. Simultane-ous nesting of Northern Pygmy Owls andNorthern Saw-whet Owls in the same snag.
Murrelet 63:94 p.
Palmer, D. A. and R. A. Ryder. 1986. The firstdocumented breeding of the Boreal Owl inColorado. Condor 86:215-217 p.
Reynolds, R. T. and B. D. Linkhart. 1984.Methods and materials for capturing andmonitoring Flammulated Owls. Great BasinNat. 44:49-51 p.
Rogers, T. H. 1972. The Nesting Season. Am.
Birds 26:878-882 p.
Rogers, T. H. 1975- The Nesting Season. Am.
Birds 29:1006-1010 p.
Rogers, T. H. 1976. The Spring Migration. Am.
Birds 30:865-869 p.
Rogers, T. H. 1976. The Nesting Season. Am.
Birds 30-978-982 p.
Rogers, T. H. 1977- The Nesting Season. Am.
Birds 31-1162-1166 p.
Rogers, T. H. 1979. The Nesting Season. Am.
Birds 33-881-883 P.Rogers, T. H. 1982. The Spring Migration. Am.
Birds 36-875-877 P-Saunders, A. A. 1921. A distributional list of
the birds of Montana. Pac. Coast AvifaunaNo. 14.
Shea, D. S. 1974. Barred Owl records in westernMontana. Condor 76:22 p.
Skaar, P. D. 1975. Montana Bird Distribution.P. D. Skaar, Bozeman, MT.
Skaar, P. D. I98O. Montana Bird Distribution.P. D. Skaar, Bozeman, MT.
Skaar, D., D. Flath, and L. S. Thompson. 1985.Montana Bird Distribution. Mont. Acad, ofSci. Mono. 3, 44:1-69 p.
Taylor, A. L., Jr. and E. D. Forsman. 1976.Recent range extensions of the Barred Owl inwestern North America. Condor 78:560-561 p.
Webb, B. 1982. Distribution and nestingrequirements of Montana forest owls inColorado. Colo. Field Ornith. Jour.16:76-81 p.
Weydemeyer, W. W. 1927. Some new birds fromwestern Montana. Condor 29:159 P-
Weydemeyer, W. W. 1932. Some 1931 notes fromLincoln County, MT. Condor 34:139 p.
Winter, J. 1974. The Distribution of theFlammulated Owl in California, 5:25-44 p.
Wright, P. L. 1976. Further bird records fromwestern Montana. Condor 78: 418-420 p.
Youman, C. , J. Swenson and S. Knapp. 1981.Preliminary Results of Owl Census inRiparian and Upland Habitats in SoutheasternMontana. In Management of RiparianEcosystems. Proc. Wildl. Soc, Mont. Chapt.Ann. Meeting, 64-67 P«
The following tables and appendices forwestern Montana include: Census Techniques Used(Table 1); Approximate Timeframes and Habitat toBegin Censuses (Table 2) ; Types of Nests Usedand Probably Most Important Trees for Nesting(Table 3) ; Forest Owl Survey Records (Appendix1); Roost Site Records (Appendix 2); and NestRecord Sheets (Appendix 3). All sheets can andshould be used or modified to meet the needs ofthe investigator.
TABLE 1
CENSUS TECHNIQUES GUIDELINES FOR WESTERN MONTANA
1. Calling during the nesting season-vocalize or use tape recorder—listenfor a few moments before you begin.
2. Initiate calling of the smaller owlsfirst, otherwise calls of the largerowls may intimidate the smaller owls,and they may not respond.
3. Distance between stops is up to thecaller, however, a good rule-of- thumbis to use shorter intervals for smallerowls and longer intervals for largerowls.
4. Because routes can run several miles,we suggest calling for approximately 4
to 6 minutes at each stop. Listen 1 to
2 minutes, play the call for 1 minute,listen for 1 to 2 minutes, repeat.
286
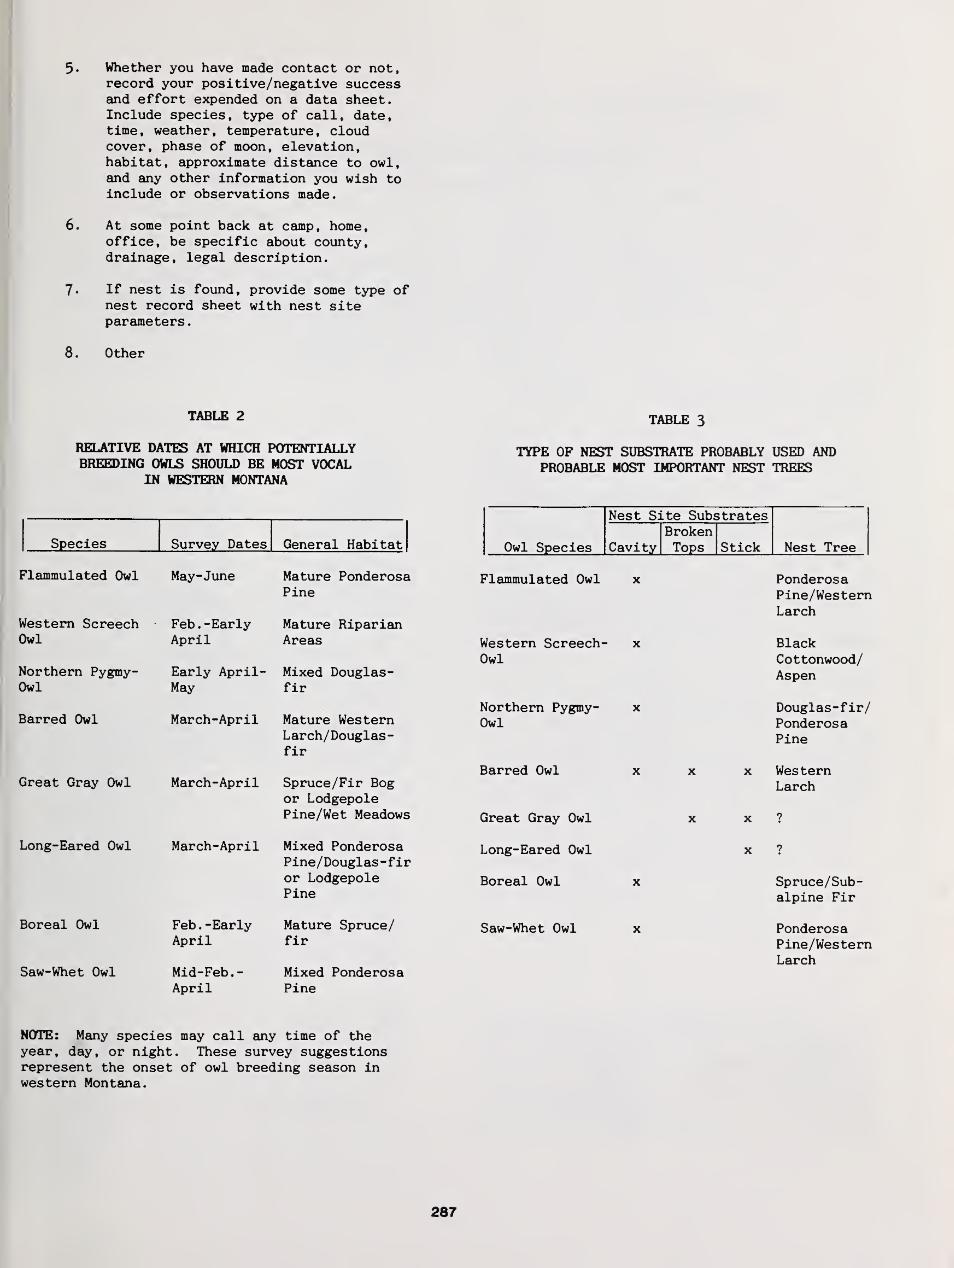
5. Whether you have made contact or not,record your positive/negative successand effort expended on a data sheet.Include species, type of call, date,time, weather, temperature, cloudcover, phase of moon, elevation,habitat, approximate distance to owl,and any other information you wish toinclude or observations made.
6. At some point back at camp, home,office, be specific about county,drainage, legal description.
7. If nest is found, provide some type ofnest record sheet with nest siteparameters
.
8. Other
TABLE 2 TABLE 3
RELATIVE DATES AT WHICH POTENTIALLYBREEDING OWLS SHOULD BE MOST VOCAL
IN WESTERN MONTANA
TYPE OF NEST SUBSTRATE PROBABLY USED ANDPROBABLE MOST IMPORTANT NEST TREES
Nest Site Substrates
Species Survey Dates General Habitat Owl Species CavityBrokenTops Stick Nest Tree
Flammulated Owl May-June Mature Ponderosa Flammulated Owl X Ponderosa
Western ScreechOwl
Northern Pygmy-Owl
Barred Owl
Great Gray Owl
Long-Eared Owl
Boreal Owl
Saw-Whet Owl
Feb . -EarlyApril
Early April
-
May
March-April
March-April
March-April
Feb . -EarlyApril
Mid-Feb.-April
Pine
Mature RiparianAreas
Mixed Douglas
-
fir
Mature WesternLarch/Douglas-fir
Spruce/Fir Bogor LodgepolePine/Wet Meadows
Mixed PonderosaPine/Douglas -firor LodgepolePine
Mature Spruce/fir
Mixed PonderosaPine
Western Screech-Owl
Northern Pygmy-Owl
Barred Owl
Great Gray Owl
Long-Eared Owl
Boreal Owl
Saw-Whet Owl
x
x
Pine/WesternLarch
BlackCottonwood/Aspen
Douglas-fir/PonderosaPine
WesternLarch
7
?
Spruce/Sub-alpine Fir
PonderosaPine/WesternLarch
NOTE: Many species may call any time of theyear, day, or night. These survey suggestionsrepresent the onset of owl breeding season inwestern Montana.
287
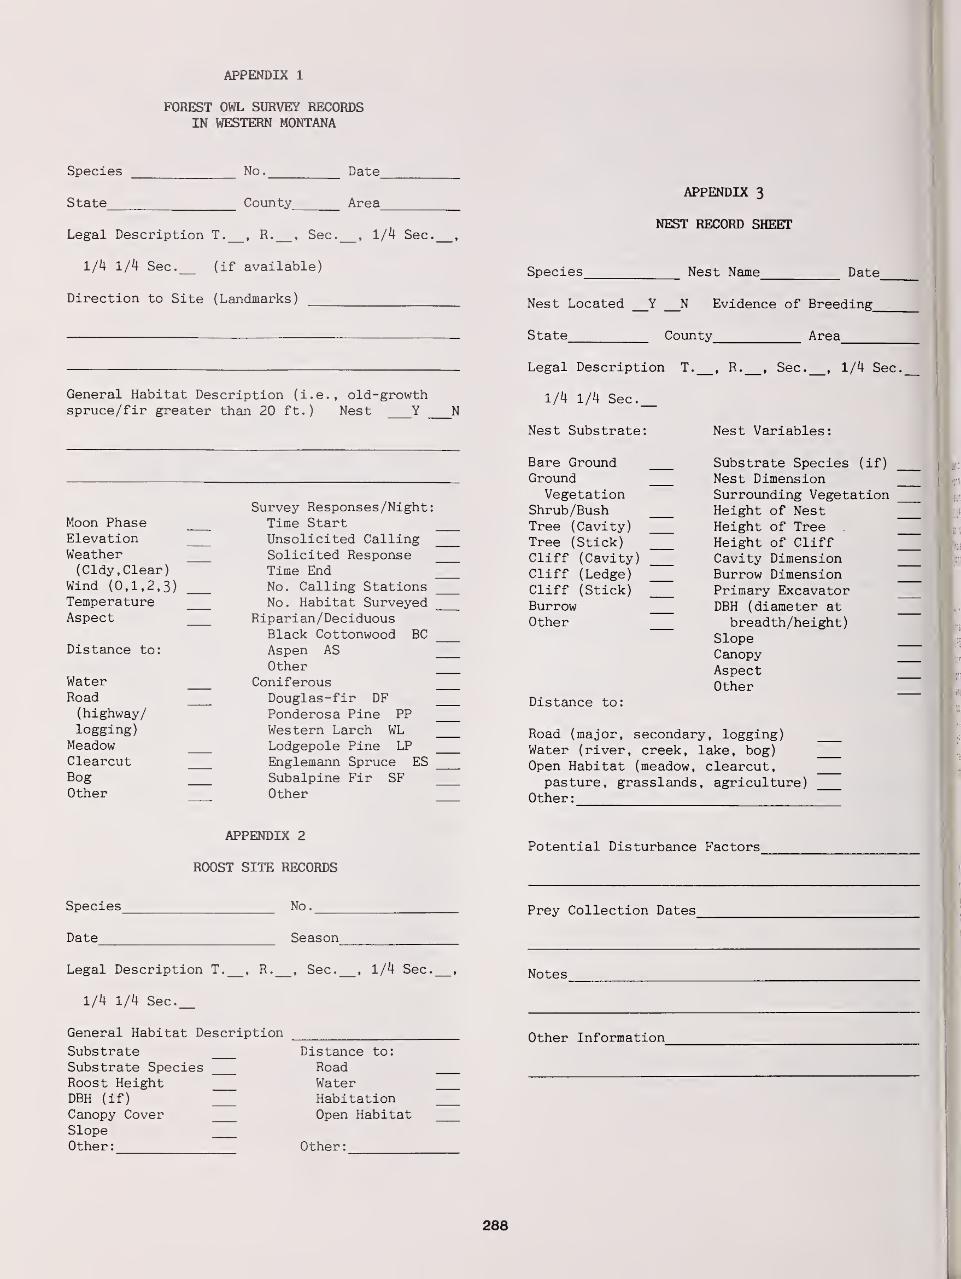
APPENDIX 1
FOREST OWL SURVEY RECORDSIN WESTERN MONTANA
Species
State
No, Date
County Area
Legal Description T. , R. , Sec., 1/4 Sec. ,
1/4 1/4 Sec._ (if available)
Direction to Site (Landmarks)
General Habitat Description (i.e., old-growthspruce/fir greater than 20 ft.) Nest Y N
Moon PhaseElevationWeather(Cldy, Clear)
Wind (0,1,2,3:TemperatureAspect
Distance to:
WaterRoad(highway/logging)
MeadowClearcutBogOther
Survey Responses/Night:Time StartUnsolicited CallingSolicited ResponseTime EndNo. Calling StationsNo. Habitat Surveyed
Riparian/DeciduousBlack Cottonwood BCAspen ASOther
ConiferousDouglas-fir DFPonderosa Pine PPWestern Larch WLLodgepole Pine LPEnglemann Spruce ESSubalpine Fir SFOther
APPENDIX 2
ROOST SITE RECORDS
APPENDIX 3
NEST RECORD SHEET
Species Nest Name Date
Nest Located Y N Evidence of Breeding_
State County Area
Legal Description T. , R. , Sec. , 1/4 Sec,
1/4 1/4 Sec.
Nest Substrate:
Bare GroundGroundVegetation
Shrub/BushTree (Cavity)Tree (Stick)Cliff (Cavity)Cliff (Ledge)Cliff (Stick)BurrowOther
Nest Variables:
Substrate Species (if)
Nest DimensionSurrounding VegetationHeight of NestHeight of TreeHeight of CliffCavity DimensionBurrow DimensionPrimary ExcavatorDBH (diameter atbreadth/height
)
SlopeCanopyAspectOther
Distance to:
Road (major, secondary, logging)Water (river, creek, lake, bog)Open Habitat (meadow, clearcut,
pasture, grasslands, agriculture)Other:
Potential Disturbance Factors
Species_
Date
No.
Season
Legal Description T.
1/4 1/4 Sec.
R. , Sec. , 1/4 Sec._
General Habitat Description
SubstrateSubstrate SpeciesRoost HeightDBH (if)
Canopy CoverSlopeOther:
Distance to:
RoadWaterHabitationOpen Habitat
Other:
Prey Collection Dates_
Notes
Other Information
288
People Power: Help for the Owl Bander 1
C. Stuart Houston 2
Abstract.—A large-scale Great Horned Owl bandingprogram in Saskatchewan evolved because o-f help availableeach year -from: 1) a relatively constant number o-f interested-farmers who have located and directed me to about 1200 activenests; 2) an ever-changing group o-f young men who havevolunteered to help climb trees and band the young.
INTRODUCTION
My owl studies began innocently from randombanding of any bird at hand, including 15 GreatHorned Owls, Bubo virqinianus , during my -first 15
years o-f banding. Of two recoveries, one was fromBluffton, Minnesota, 450 miles to the southeast,an unusual movement for a year-round resident.This encouraged me to band more owls (Houston1978) .
My efforts near Yorkton, Saskatchewan, werefirst aided by Bill Horseman, a 15-year-oldtrapper and birdwatcher, who located 5 nests in
1958 and 23 in 1959. In i960, I had a weeklybirdwatching program on CKOS Television, to
promote the Peterson bird cards in Brooke Bond teaand coffee. Peterson's Field Guides were offered
The resultsto those finding the most owl
exceeded my expectations whenof farm lads found 20, 16 and
respectively; 150 flightless young were bandedthat May.
nests.
three winning pairs10 successful nests,
NEST FINDERS
After moving to Saskatoon and completing my
training in radiology, I several times placed a
request in Doug Bilroy's nature column in theWestern Producer , a farm newspaper with 160,000circulation, asking Saskatchewan farmers to notifyme of owl nest locations. This produced responsesfrom a select group of observant, interested and
helpful farmers, most of whom have been findingnests for me ever since. Schoolteacher Bryan
Isinger stimulated his pupil, Rosemary Nemeth to
find owl nests near Yellow Creek. Peter Boychukand Maurice Mareschal , teachers in the nearbyvillages of Crystal Springs and Yellow Creek, soon
enlisted their students to find owl nests as well.
Most of the successful nest finders listen for the
location of owls hooting on their land and watch
all large nests seen during farm work and local
travel in March and April, before the leaves come
out. Leif Nordal searches by ski-doo and Ed
Brockmeyer on cross-country skis. Permission is
obtained from their neighbors before our banding
visit. Three farmers have located 100 successful
nests and another six have found 40 or more (Table
1 ) .
Table 1. --Great Horned Owl nest finders, 1968-1986
Leif Nordal, Bill Cochrane at Bulyea 111 nests
Pete Hill at Duval 108 nests
Leslie S< Rose Nemeth at Yellow Creek 94+ nests 1
Ian Lochtie at Kelliher 88 nests
Bob Gillard & Shirley Norlin at Wynyard 80 nests
Peter Boychuk at Crystal Springs 61 nests
Bob Robinson at Simpson 52 nests
Maurice Mareschal at Birch Hills 48 nests
Wayne Harris at Ray more 42 nests
1 owls at another six nests banded by Wayne Harrisin 1986
TREE CLIMBERS
1 Paper presented at the symposium,Biology and Conservation of Northern Forest Owls,Feb. 3-7, 1987, Winnipeg, Manitoba. USDA ForestService General Technical Report RM-142.
2 Stuart Houston is Professor of MedicalImaging, University of Saskatchewan, Saskatoon,Sask.
Volunteers have always been needed to help
with climbing trees. To climb 23 trees, many
difficult, and band up to 61 nestlings in one day,
would surpass the stamina of most men. We like to
have three or even four climbers taking turns.
This has become increasingly important as my knees
and ankles become increasingly arthritic due to
wear and tear as I grow older.
289
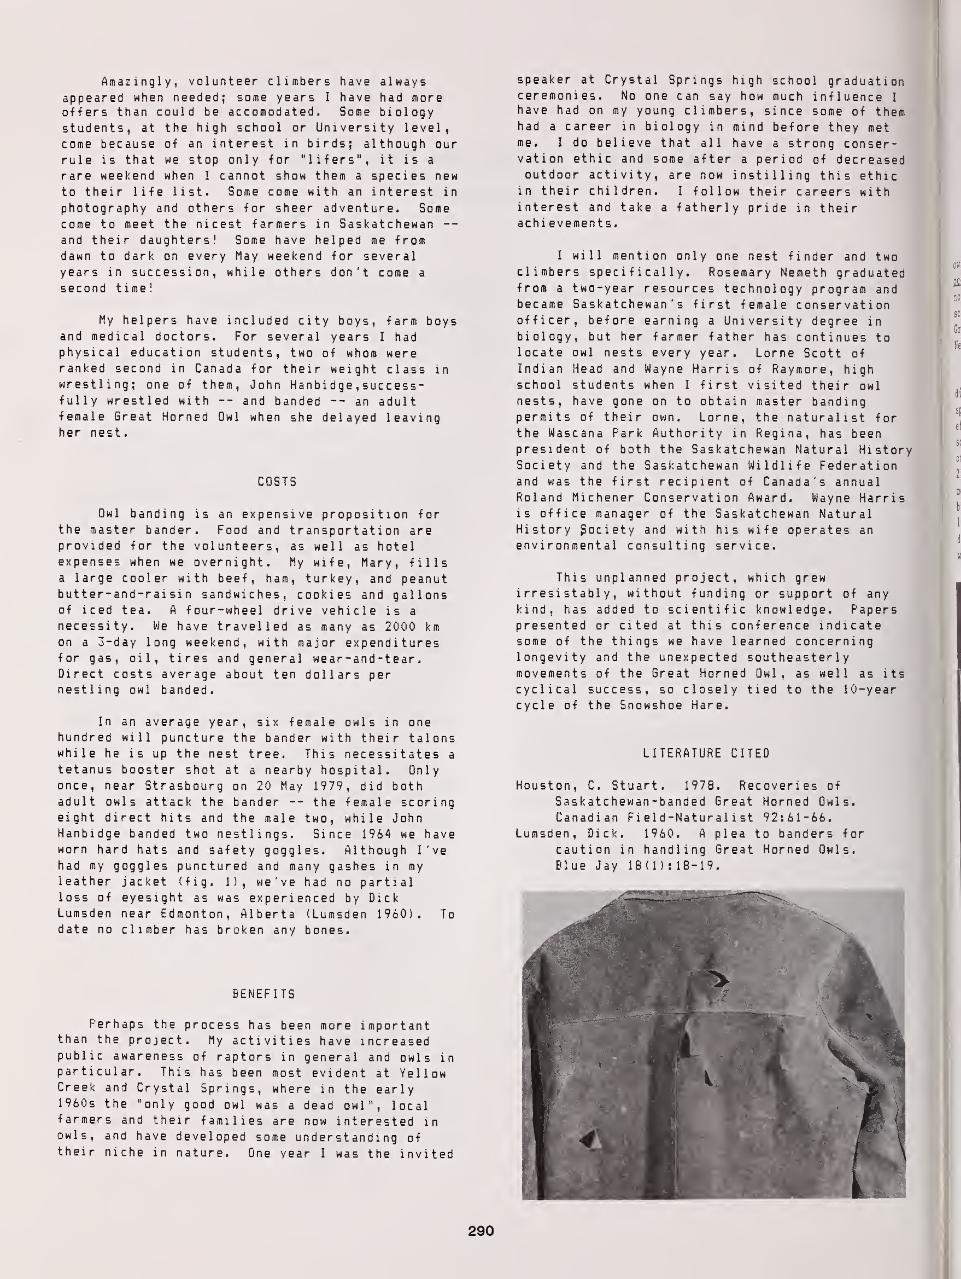
Amazingly, volunteer climbers have alwaysappeared when needed; some years I have had moreoffers than could be accomodated. Some biologystudents, at the high school or University level,come because of an interest in birds; although our
rule is that we stop only for "lifers", it is a
rare weekend when I cannot show them a species newto their life list. Some come with an interest in
photography and others for sheer adventure. Somecome to meet the nicest farmers in Saskatchewanand their daughters! Some have helped me fromdawn to dark on every May weekend for severalyears in succession, while others don't come a
second time!
My helpers have included city boys, farm boysand medical doctors. For several years I hadphysical education students, two of whom wereranked second in Canada for their weight class in
wrestling; one of them, John Hanb i dge , success-fully wrestled with -- and banded -- an adultfemale Sreat Horned Owl when she delayed leavingher nest.
COSTS
Owl banding is an expensive proposition forthe master bander. Food and transportation areprovided for the volunteers, as well as hotelexpenses when we overnight. My wife, Mary, fillsa large cooler with beef, ham, turkey, and peanutbutter-and-rai si n sandwiches, cookies and gallonsof iced tea. A four-wheel drive vehicle is a
necessity. We have travelled as many as 2000 kmon a 3-day long weekend, with major expendituresfor gas, oil, tires and general wear-and-tear
.
Direct costs average about ten dollars pernestling owl banded.
In an average year, six female owls in onehundred will puncture the bander with their talonswhile he is up the nest tree. This necessitates a
tetanus booster shot at a nearby hospital. Onlyonce, near Strasbourg on 20 May 1979, did bothadult owls attack the bander -- the female scoringeight direct hits and the male two, while JohnHanbidge banded two nestlings. Since 1964 we haveworn hard hats and safety goggles. Although I'vehad my goggles punctured and many gashes in myleather jacket (fig. 1), we've had no partialloss of eyesight as was experienced by DickLumsden near Edmonton, Alberta (Lumsden 1960). Todate no climber has broken any bones.
BENEFITS
Perhaps the process has been more importantthan the project. My activities have increasedpublic awareness of raptors in general and owls inparticular. This has been most evident at YellowCreek and Crystal Springs, where in the early1960s the "only good owl was a dead owl", localfarmers and their families are now interested inowls, ana have developed some understanding oftheir niche in nature. One year I was the invited
speaker at Crystal Springs high school graduationceremonies. No one can say how much influence I
have had on my young climbers, since some of themhad a career in biology in mind before they metme. I do believe that all have a strong conser-vation ethic and some after a period of decreasedoutdoor activity, are now instilling this ethic
in their children. I follow their careers withinterest and take a fatherly pride in theirachi evements.
I will mention only one nest finder and twoclimbers specifically. Rosemary Nemeth graduatedfrom a two-year resources technology program andbecame Saskatchewan's first female conservationofficer, before earning a University degree in
biology, but her farmer father has continues tolocate owl nests every year. Lome Scott of
Indian Head and Wayne Harris of Raymore, highschool students when I first visited their owl
nests, have gone on to obtain master bandingpermits of their own. Lome, the naturalist for
the Wascana Park Authority in Regina, has beenpresident of both the Saskatchewan Natural HistorySociety and the Saskatchewan Wildlife Federationand was the first recipient of Canada's annualRoland Michener Conservation Award. Wayne Harrisis office manager of the Saskatchewan NaturalHistory Society and with his wife operates an
environmental consulting service.
This unplanned project, which grewi rresi stabl y , without funding or support of anykind, has added to scientific knowledge. Paperspresented or cited at this conference indicatesome of the things we have learned concerninglongevity and the unexpected southeasterlymovements of the Great Horned Owl, as well as its
cyclical success, so closely tied to the 10-yearcycle of the Snowshoe Hare.
LITERATURE CITED
Houston, C. Stuart. 1978. Recoveries of
Saskatchewan-banded Sreat Horned Owls.
Canadian Field-Naturalist 92:61-66.Lumsden, Dick. 1960. A plea to banders for
caution in handling Sreat Horned Owls.
Blue Jay 18(1) : 18-19.
290
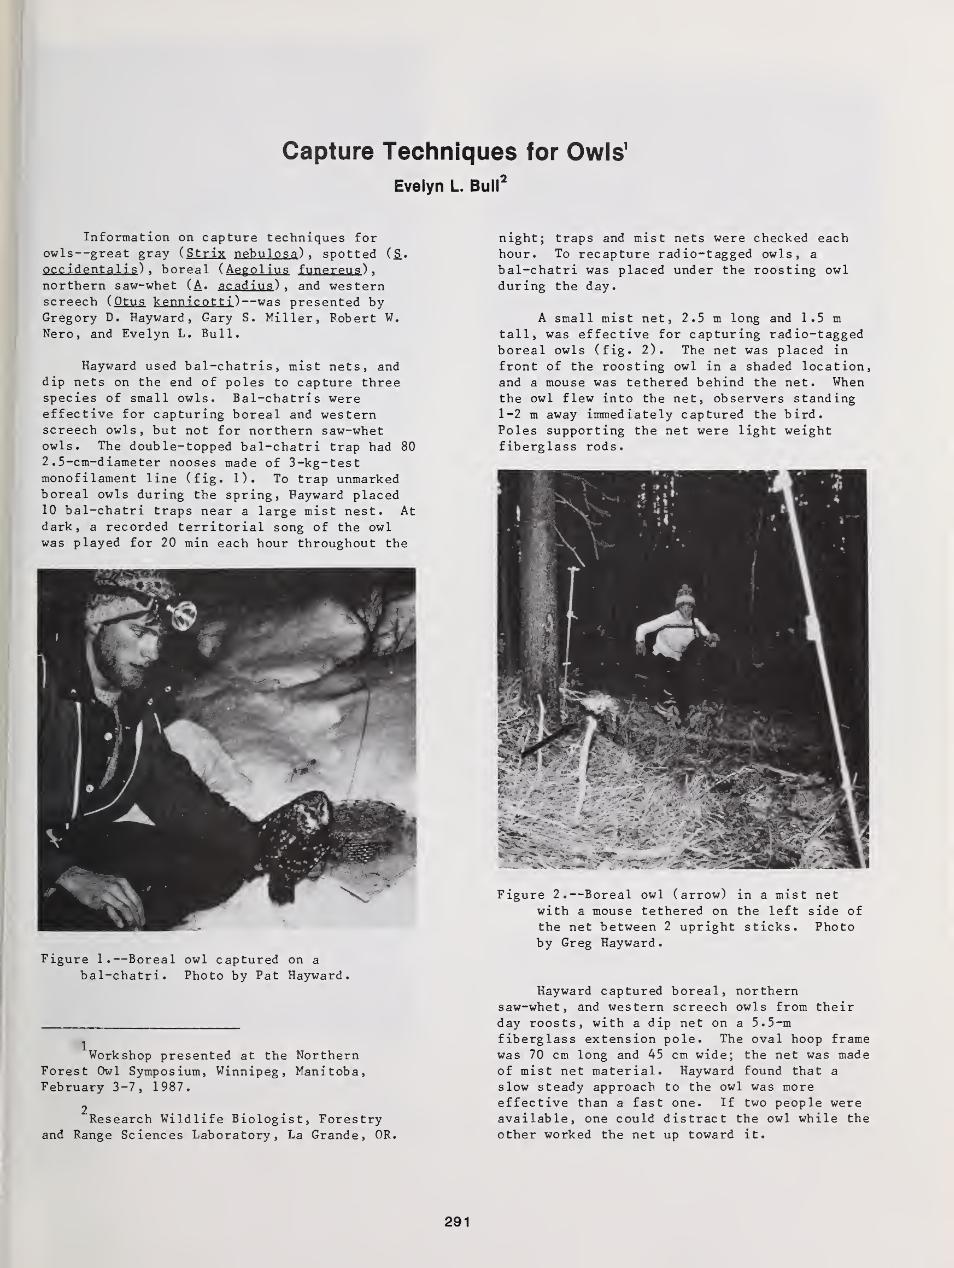
Capture Techniques for Owls1
Evelyn L. Bull2
Information on capture techniques forowls—great gray ( Strix nebulosa ) , spotted (S_.
occidentalis) , boreal (Aegolius funereus )
,
northern saw-whet (A. acadius ) , and westernscreech ( Otus kennicotti )—was presented byGregory D. Hayward, Gary S. Miller , Robert W.
Nero, and Evelyn L. Bull.
Hayward used bal-chatris, mist nets, anddip nets on the end of poles to capture threespecies of small owls. Bal-chatris wereeffective for capturing boreal and westernscreech owls, but not for northern saw-whetowls. The double-topped bal-chatri trap had 80
2 . 5-cm-d iameter nooses made of 3-kg-testmonofilament line (fig. 1). To trap unmarkedboreal owls during the spring, Hayward placed10 bal-chatri traps near a large mist nest. Atdark, a recorded territorial song of the owlwas played for 20 min each hour throughout the
Figure 1.—Boreal owl captured on a
bal-chatri. Photo by Pat Hayward.
Workshop presented at the NorthernForest Owl Symposium, Winnipeg, Manitoba,February 3-7, 1987.
2Research Wildlife Biologist, Forestry
and Range Sciences Laboratory, La Grande, OR.
night; traps and mist nets were checked eachhour. To recapture radio-tagged owls, a
bal-chatri was placed under the roosting owlduring the day.
A small mist net, 2.5 m long and 1.5 mtall, was effective for capturing radio-taggedboreal owls (fig. 2). The net was placed in
front of the roosting owl in a shaded location,and a mouse was tethered behind the net. Whenthe owl flew into the net, observers standing1-2 m away immediately captured the bird.Poles supporting the net were light weightfiberglass rods.
Figure 2.—Boreal owl (arrow) in a mist netwith a mouse tethered on the left side ofthe net between 2 upright sticks. Photoby Greg Hayward
.
Hayward captured boreal, northernsaw-whet, and western screech owls from theirday roosts, with a dip net on a 5.5-mfiberglass extension pole. The oval hoop frame
was 70 cm long and 45 cm wide; the net was madeof mist net material. Hayward found that a
slow steady approach to the owl was moreeffective than a fast one. If two people wereavailable, one could distract the owl while the
other worked the net up toward it.
291
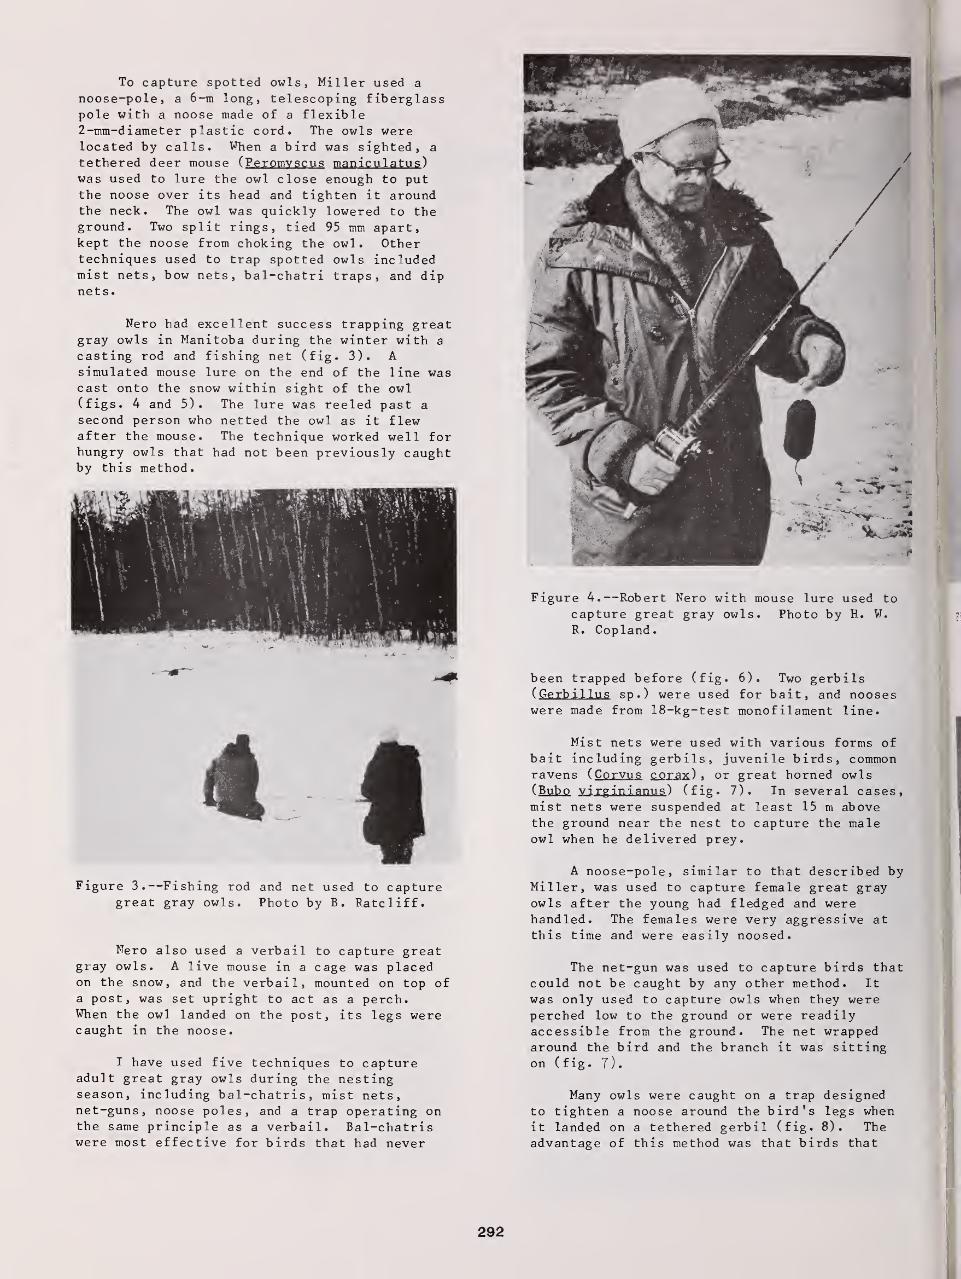
To capture spotted owls, Miller used a
noose-pole, a 6-m long, telescoping fiberglasspole with a noose made of a flexible2-mm-d i ameter plastic cord. The owls werelocated by calls. When a bird was sighted, a
tethered deer mouse (Peromvscus maniculatus)was used to lure the owl close enough to putthe noose over its head and tighten it aroundthe neck. The owl was quickly lowered to theground. Two split rings, tied 95 mm apart,kept the noose from choking the owl. Othertechniques used to trap spotted owls includedmist nets, bow nets, bal-chatri traps, and dipnets.
Nero had excellent success trapping greatgray owls in Manitoba during the winter with a
casting rod and fishing net (fig. 3). Asimulated mouse lure on the end of the line wascast onto the snow within sight of the owl(figs. 4 and 5). The lure was reeled past a
second person who netted the owl as it flewafter the mouse. The technique worked well forhungry owls that had not been previously caughtby this method.
Figure 3.—Fishing rod and net used to capturegreat gray owls. Photo by B. Ratcliff.
Nero also used a verbail to capture greatgray owls. A live mouse in a cage was placedon the snow, and the verbail, mounted on top ofa post, was set upright to act as a perch.When the owl landed on the post, its legs werecaught in the noose.
T have used five techniques to captureadult great gray owls during the nestingseason, including bal-chatris, mist nets,net-guns, noose poles, and a trap operating onthe same principle as a verbail. Bal-chatriswere most effective for birds that had never
Figure 4.—Robert Nero with mouse lure used tocapture great gray owls. Photo by H. W.
R. Copland.
been trapped before (fig. 6). Two gerbils( Gerbillus sp.) were used for bait, and nooseswere made from 18-kg-test monofilament line.
Mist nets were used with various forms ofbait including gerbils, juvenile birds, commonravens ( Corvus corax ) , or great horned owls( Bubo virginianus ) (fig. 7). In several cases,mist nets were suspended at least 15 m abovethe ground near the nest to capture the maleowl when he delivered prey.
A noose-pole, similar to that described byMiller, was used to capture female great grayowls after the young had fledged and werehandled. The females were very aggressive atthis time and were easily noosed.
The net-gun was used to capture birds thatcould not be caught by any other method. It
was only used to capture owls when they wereperched low to the ground or were readilyaccessible from the ground. The net wrappedaround the bird and the branch it was sittingon (fig. 7).
Many owls were caught on a trap designedto tighten a noose around the bird's legs whenit landed on a tethered gerbil (fig. 8). Theadvantage of this method was that birds that
292
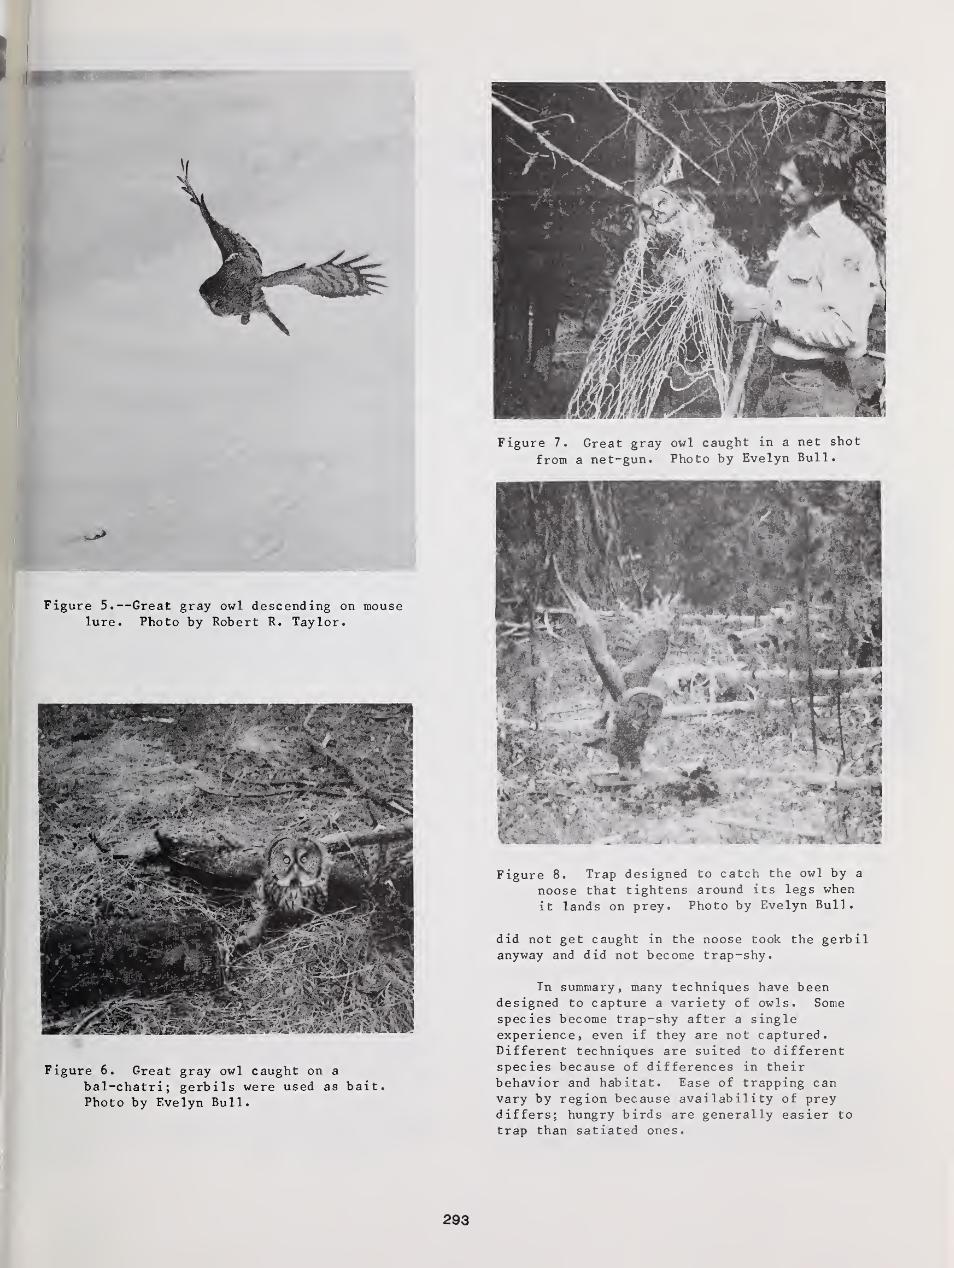
Figure 5.—Great gray owl descending on mouselure. Photo by Robert R. Taylor.
Figure 6. Great gray owl caught on a
bal-chatri; gerbils were used as bait.Photo by Evelyn Bull.
Figure 8. Trap designed to catch the owl by a
noose that tightens around its legs when
it lands on prey. Photo by Evelyn Bull.
did not get caught in the noose took the gerbilanyway and did not become trap-shy.
In summary, many techniques have beendesigned to capture a variety of owls. Somespecies become trap-shy after a singleexperience, even if they are not captured.Different techniques are suited to differentspecies because of differences in theirbehavior and habitat. Ease of trapping canvary by region because availability of preydiffers; hungry birds are generally easier totrap than satiated ones.
293
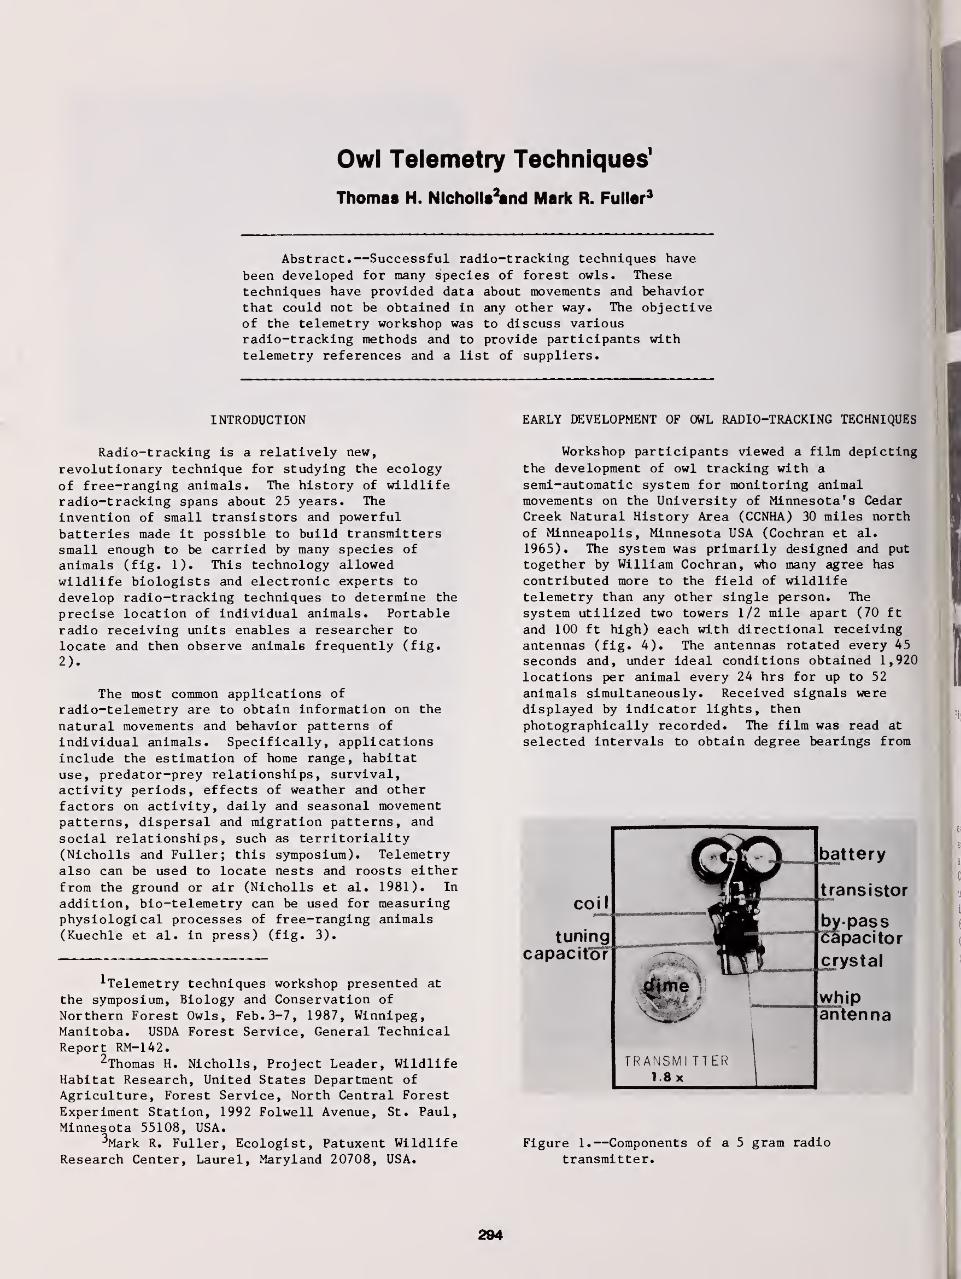
Owl Telemetry Techniques1
Thomas H. Nlcholla2and Mark R. Fuller3
Abstract.—Successful radio-tracking techniques have
been developed for many species of forest owls. Thesetechniques have provided data about movements and behaviorthat could not be obtained in any other way. The objectiveof the telemetry workshop was to discuss variousradio-tracking methods and to provide participants withtelemetry references and a list of suppliers.
INTRODUCTION
Radio-tracking is a relatively new,
revolutionary technique for studying the ecologyof free-ranging animals. The history of wildliferadio-tracking spans about 25 years. The
invention of small transistors and powerful
batteries made it possible to build transmitterssmall enough to be carried by many species of
animals (fig. 1). This technology allowedwildlife biologists and electronic experts to
develop radio-tracking techniques to determine the
precise location of individual animals. Portableradio receiving units enables a researcher to
locate and then observe animals frequently (fig.
2).
The most common applications of
radio-telemetry are to obtain information on the
natural movements and behavior patterns of
individual animals. Specifically, applicationsinclude the estimation of home range, habitatuse, predator-prey relationships, survival,activity periods, effects of weather and other
factors on activity, daily and seasonal movementpatterns, dispersal and migration patterns, and
social relationships, such as territoriality(Nicholls and Fuller; this symposium). Telemetryalso can be used to locate nests and roosts eitherfrom the ground or air (Nicholls et al. 1981). In
addition, bio-telemetry can be used for measuringphysiological processes of free-ranging animals(Kuechle et al. in press) (fig. 3).
^Telemetry techniques workshop presented at
the symposium, Biology and Conservation of
Northern Forest Owls, Feb. 3-7, 1987, Winnipeg,Manitoba. USDA Forest Service, General TechnicalReport RM-142.
2Thomas H. Nicholls, Project Leader, WildlifeHabitat Research, United States Department of
Agriculture, Forest Service, North Central ForestExperiment Station, 1992 Folwell Avenue, St. Paul,Minnesota 55108, USA.
3Mark R. Fuller, Ecologist, Patuxent WildlifeResearch Center, Laurel, Maryland 20708, USA.
EARLY DEVELOPMENT OF OWL RADIO-TRACKING TECHNIQUES
Workshop participants viewed a film depicting
the development of owl tracking with a
serai-automatic system for monitoring animalmovements on the University of Minnesota's CedarCreek Natural History Area (CCNHA) 30 miles north
of Minneapolis, Minnesota USA (Cochran et al.
1965). The system was primarily designed and put
together by William Cochran, who many agree has
contributed more to the field of wildlifetelemetry than any other single person. The
system utilized two towers 1/2 mile apart (70 ft
and 100 ft high) each with directional receivingantennas (fig. 4). The antennas rotated every 45
seconds and, under ideal conditions obtained 1,920locations per animal every 24 hrs for up to 52
animals simultaneously. Received signals weredisplayed by indicator lights, then
photographically recorded. The film was read at
selected intervals to obtain degree bearings from
coil
tuningcapacitor
\— battery
transistor
by-pass* capacitor
crystal
Vwhipantenna
TRANSMI TTER1 8x
Figure 1.—Components of a 5 gram radio
transmitter.
294

Figure 2.—Portable receiving units can be usedwith different antenna systems, such as theloop antenna (top) and Yagi antenna (bottom),to locate and observe owls under fieldconditions.
each tower. These data, time, and date wereentered in a computer and programs calculatedanimal locations and plotted them on a map of theCCNHA (fig. 5). The resulting information wasused for ecological studies of many speciesincluding owls (Nicholls and Warner 1972) (fig.
6). Techniques and equipment developed at the
CCNHA are now in world-wide use for research on
many species of animals.
Radio-tracking techniques for owls weredeveloped for three species of owls using theCCNHA radio-tracking system: the great horned owl
( Bubo virginanus ) , the barred owl (Strix varia)(Nicholls and Warner 1968) (figs. 7 and 8), andthe northern saw-whet owl (Aegol ius acadicus )
(Forbes and Warner 1974) (fig. 9). These studiespaved the way for other raptor telemetry becausethe technique was shown to have little influenceon the natural behavior of radio-tagged birds.Since the 1960's, radio transmitters andattachment techniques have been improved and
Figure 3.—A radio transmitter used to studygastric motility in barred owls. The gastricsensor (A) is surgically implanted and pluggedinto (arrow) a back-pack transmitter (B) thattransmits an owl's location and gastricactivity.
Figure 4.— (A) A 100 foot radio-tracking towerlocated on the CCNHA. (B) Each owl wasassigned a different radio frequency and a
receiver was tuned in to each of two radio-tracking towers. All owls with transmitterscould be monitored simultaneously.
refined (Dunstan 1972, Amlaner and Macdonald 1980,
Cochran 1980, Kenward 1985). For example, EvelynBull (personal communication) put radio trans-mitters on 58 great gray owls (S_. nebulosa ) from1983 to 1986. Transmitters weighing about 22 gramstransmitted for at least 1 year at which time theywere replaced. The transmitter with whip antennawas put on the back of a bird with a tubular teflonribbon back-pack harness in a figure eight typeof configuration. Some birds carried them 3
years, and none showed any abrasions or apparentill effects from the transmitters. Transmittersbuilt today are more reliable, smaller, lighter,more durable and are economical, considering the
amount of information that can be gained and thatsome data cannot be obtained in any other way.
295
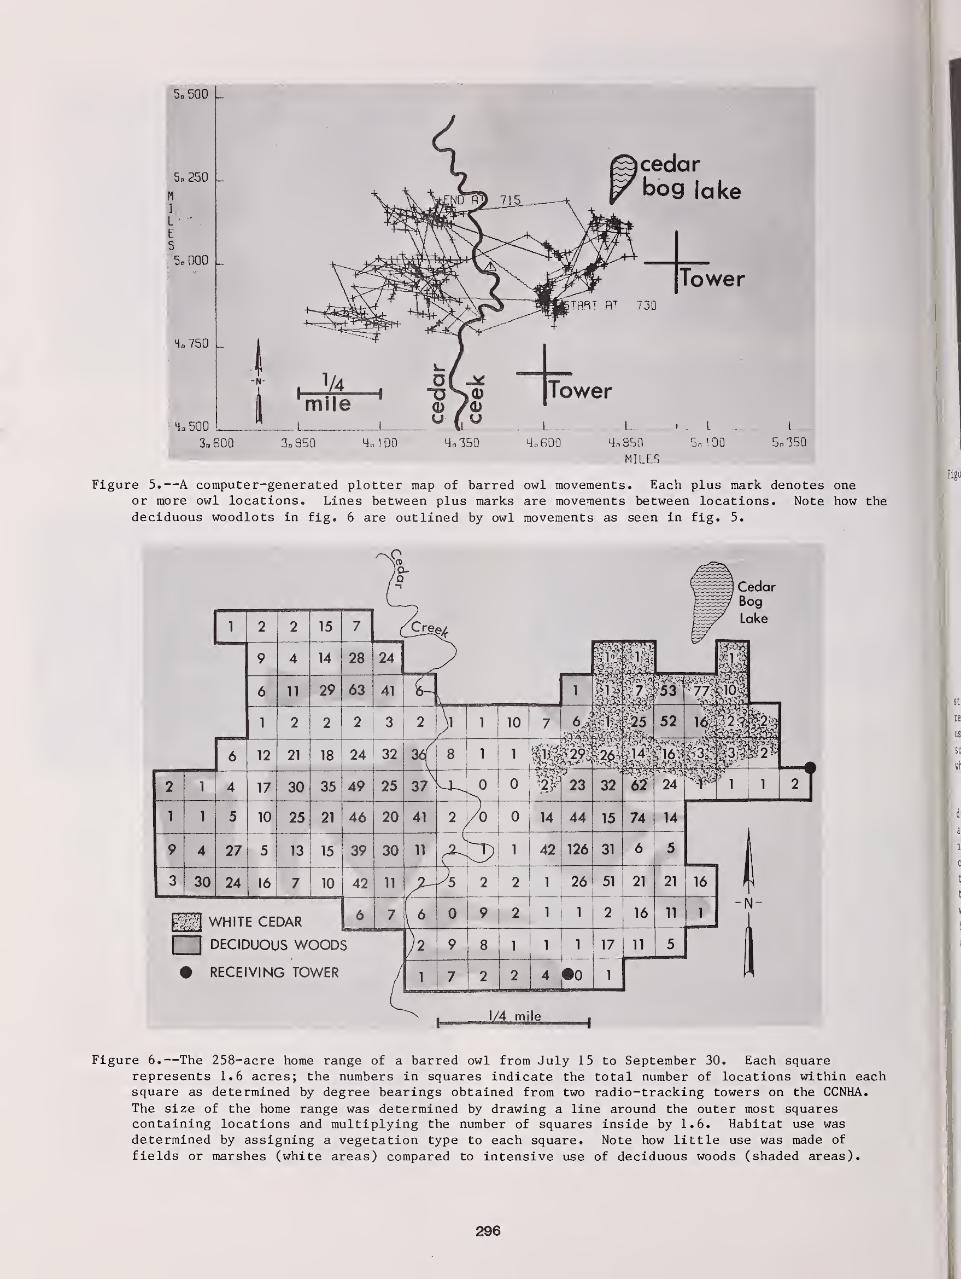
5a 500 _
5*250
5«000 _
4n750
4,500
cedarbog lake
TowerJmi RT 730
Tower
3o 600 3 D 350 4.1 DO 4n35Q
..J «.. A4*850 Sn'OQ
MILES
3n 350
Figure 5.—A computer-generated plotter map of barred owl movements. Each plus mark denotes oneor more owl locations. Lines between plus marks are movements between locations. Note how the
deciduous woodlots in fig. 6 are outlined by owl movements as seen in fig. 5.
CedarBog
Lake
JlU WHITE CEDAR
| |DECIDUOUS WOODS
• RECEIVING TOWER
Figure 6.—The 258-acre home range of a barred owl from July 15 to September 30. Each squarerepresents 1.6 acres; the numbers in squares indicate the total number of locations within eachsquare as determined by degree bearings obtained from two radio-tracking towers on the CCNHA.
The size of the home range was determined by drawing a line around the outer most squarescontaining locations and multiplying the number of squares inside by 1.6. Habitat use wasdetermined by assigning a vegetation type to each square. Note how little use was made of
fields or marshes (white areas) compared to intensive use of deciduous woods (shaded areas).
296
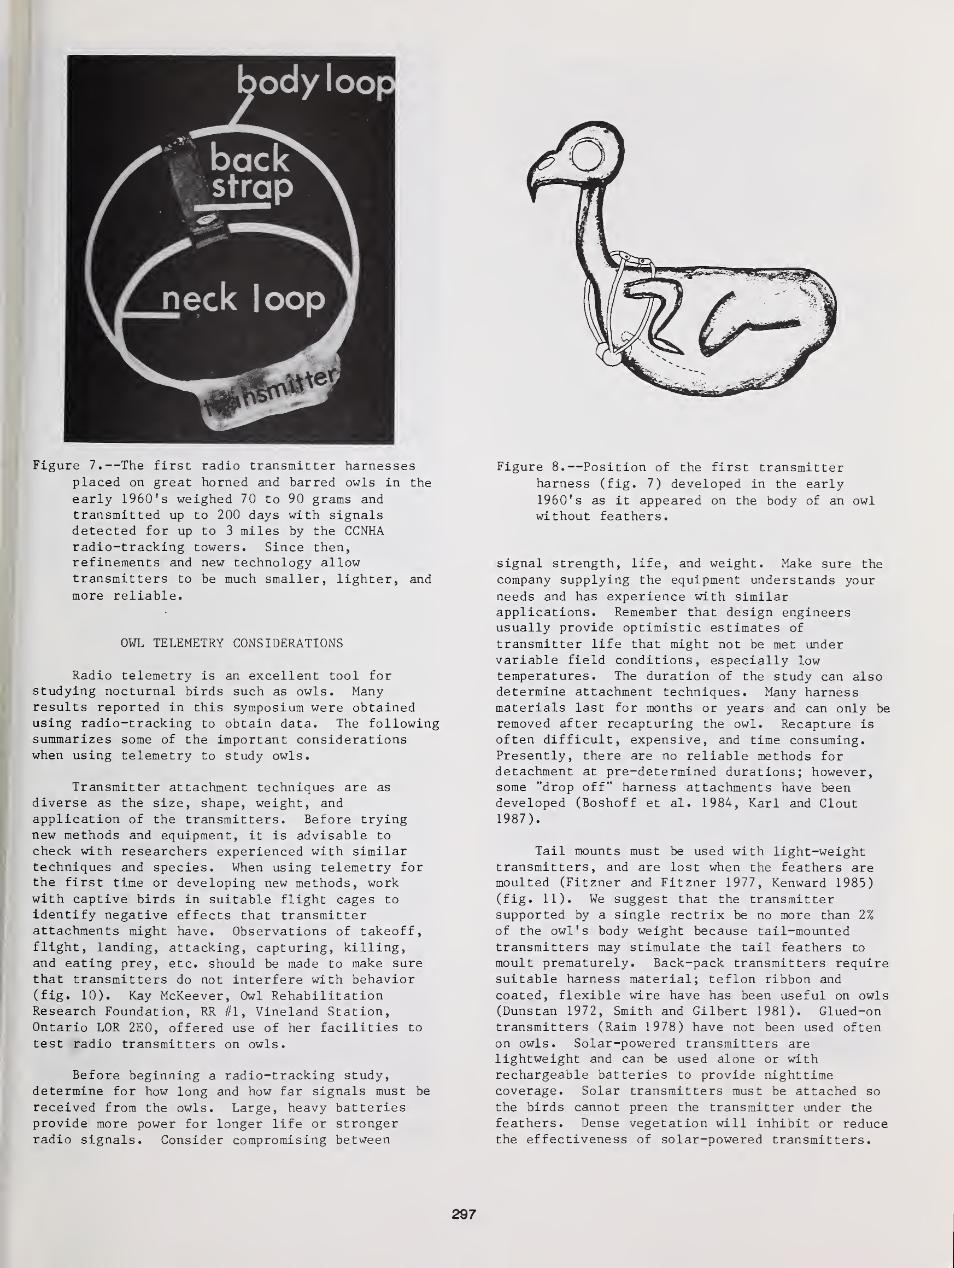
Figure 7.—The first radio transmitter harnessesplaced on great horned and barred owls in the
early 1960's weighed 70 to 90 grams andtransmitted up to 200 days with signalsdetected for up to 3 miles by the CCNHAradio-tracking towers. Since then,refinements and new technology allowtransmitters to be much smaller, lighter, and
more reliable.
OWL TELEMETRY CONSIDERATIONS
Radio telemetry is an excellent tool forstudying nocturnal birds such as owls. Manyresults reported in this symposium were obtainedusing radio-tracking to obtain data. The followingsummarizes some of the important considerationswhen using telemetry to study owls.
Transmitter attachment techniques are as
diverse as the size, shape, weight, and
application of the transmitters. Before tryingnew methods and equipment, it is advisable to
check with researchers experienced with similartechniques and species. When using telemetry forthe first time or developing new methods, workwith captive birds in suitable flight cages to
identify negative effects that transmitterattachments might have. Observations of takeoff,flight, landing, attacking, capturing, killing,and eating prey, etc. should be made to make surethat transmitters do not interfere with behavior(fig. 10). Kay McKeever, Owl RehabilitationResearch Foundation, RR #1, Vineland Station,Ontario LOR 2E0, offered use of her facilities to
test radio transmitters on owls.
Before beginning a radio-tracking study,determine for how long and how far signals must be
received from the owls. Large, heavy batteriesprovide more power for longer life or strongerradio signals. Consider compromising between
Figure 8.—Position of the first transmitterharness (fig. 7) developed in the early1960's as it appeared on the body of an owl
without feathers.
signal strength, life, and weight. Make sure the
company supplying the equipment understands your
needs and has experience with similarapplications. Remember that design engineersusually provide optimistic estimates of
transmitter life that might not be met undervariable field conditions, especially lowtemperatures. The duration of the study can alsodetermine attachment techniques. Many harnessmaterials last for months or years and can only be
removed after recapturing the owl. Recapture is
often difficult, expensive, and time consuming.Presently, there are no reliable methods fordetachment at pre-determined durations; however,some "drop off" harness attachments have beendeveloped (Boshoff et al. 1984, Karl and Clout1987).
Tail mounts must be used with light-weighttransmitters, and are lost when the feathers aremoulted (Fitzner and Fitzner 1977, Kenward 1985)(fig. 11). We suggest that the transmittersupported by a single rectrix be no more than 2%of the owl's body weight because tail-mountedtransmitters may stimulate the tail feathers to
moult prematurely. Back-pack transmitters requiresuitable harness material; teflon ribbon and
coated, flexible wire have has been useful on owls(Dunstan 1972, Smith and Gilbert 1981). Glued-ontransmitters (Raim 1978) have not been used oftenon owls. Solar-powered transmitters arelightweight and can be used alone or withrechargeable batteries to provide nighttimecoverage. Solar transmitters must be attached so
the birds cannot preen the transmitter under the
feathers. Dense vegetation will inhibit or reducethe effectiveness of solar-powered transmitters.
297
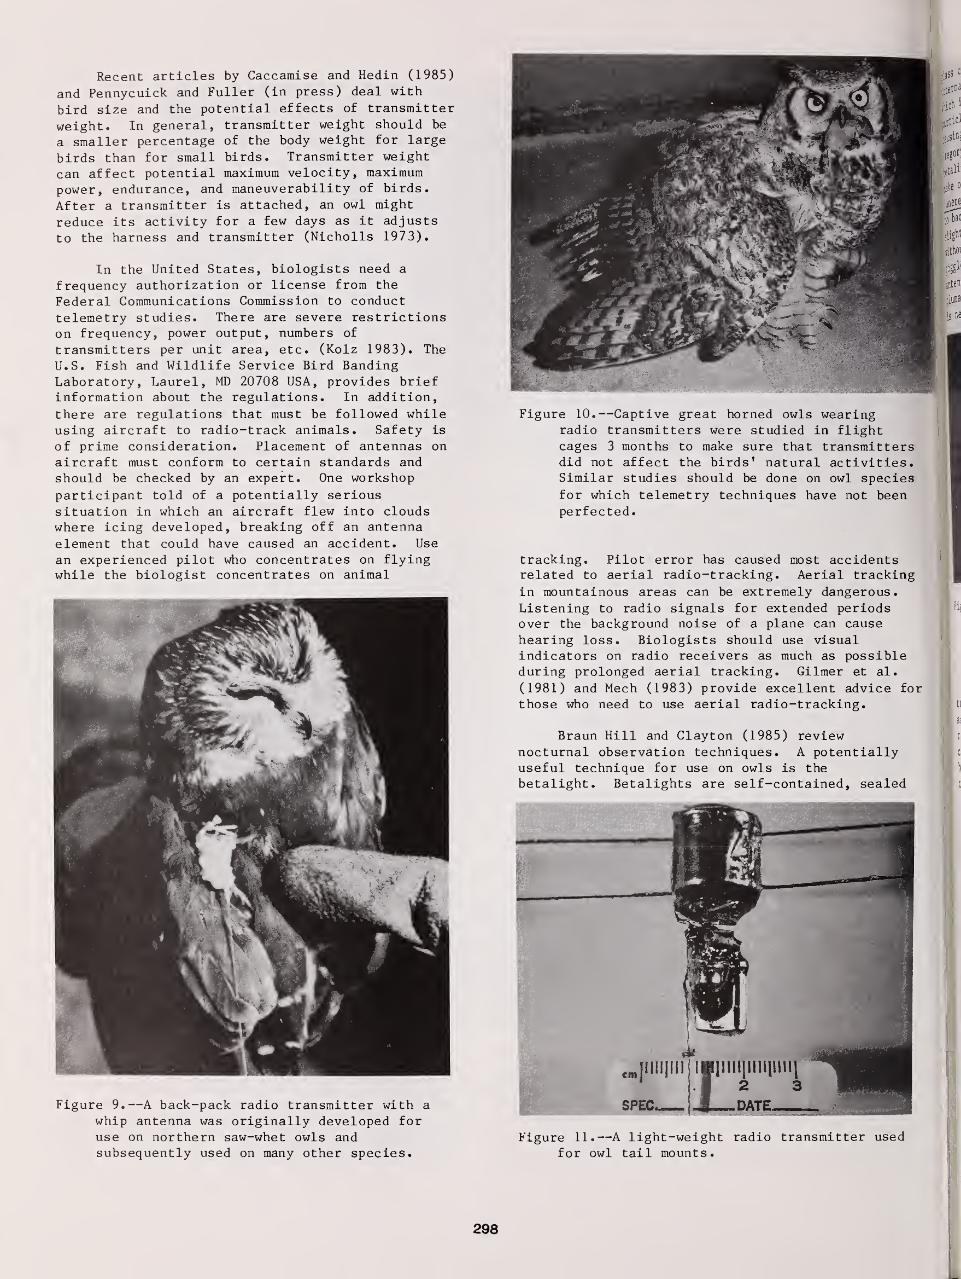
Recent articles by Caccamise and Hedin (1985)
and Pennycuick and Fuller (in press) deal with
bird size and the potential effects of transmitter
weight. In general, transmitter weight should be
a smaller percentage of the body weight for large
birds than for small birds. Transmitter weight
can affect potential maximum velocity, maximumpower, endurance, and maneuverability of birds.
After a transmitter is attached, an owl might
reduce its activity for a few days as it adjusts
to the harness and transmitter (Nicholls 1973).
In the United States, biologists need a
frequency authorization or license from the
Federal Communications Commission to conduct
telemetry studies. There are severe restrictionson frequency, power output, numbers of
transmitters per unit area, etc. (Kolz 1983). The
U.S. Fish and Wildlife Service Bird BandingLaboratory, Laurel, MD 20708 USA, provides briefinformation about the regulations. In addition,
there are regulations that must be followed whileusing aircraft to radio-track animals. Safety is
of prime consideration. Placement of antennas on
aircraft must conform to certain standards and
should be checked by an expert. One workshop
participant told of a potentially serioussituation in which an aircraft flew into cloudswhere icing developed, breaking off an antenna
element that could have caused an accident. Use
an experienced pilot who concentrates on flyingwhile the biologist concentrates on animal
Figure 10.—Captive great horned owls wearingradio transmitters were studied in flightcages 3 months to make sure that transmittersdid not affect the birds' natural activities.Similar studies should be done on owl species
for which telemetry techniques have not beenperfected.
tracking. Pilot error has caused most accidentsrelated to aerial radio-tracking. Aerial tracking
in mountainous areas can be extremely dangerous
.
Listening to radio signals for extended periodsover the background noise of a plane can cause
hearing loss. Biologists should use visualindicators on radio receivers as much as possibleduring prolonged aerial tracking. Gilmer et al.
(1981) and Mech (1983) provide excellent advice for
those who need to use aerial radio-tracking.
Braun Hill and Clayton (1985) reviewnocturnal observation techniques. A potentiallyuseful technique for use on owls is the
betalight. Betalights are self-contained, sealed
whip antenna was originally developed for
use on northern saw-whet owls and Figure 11.—A light-weight radio transmitter usedsubsequently used on many other species. for owl tail mounts.
298
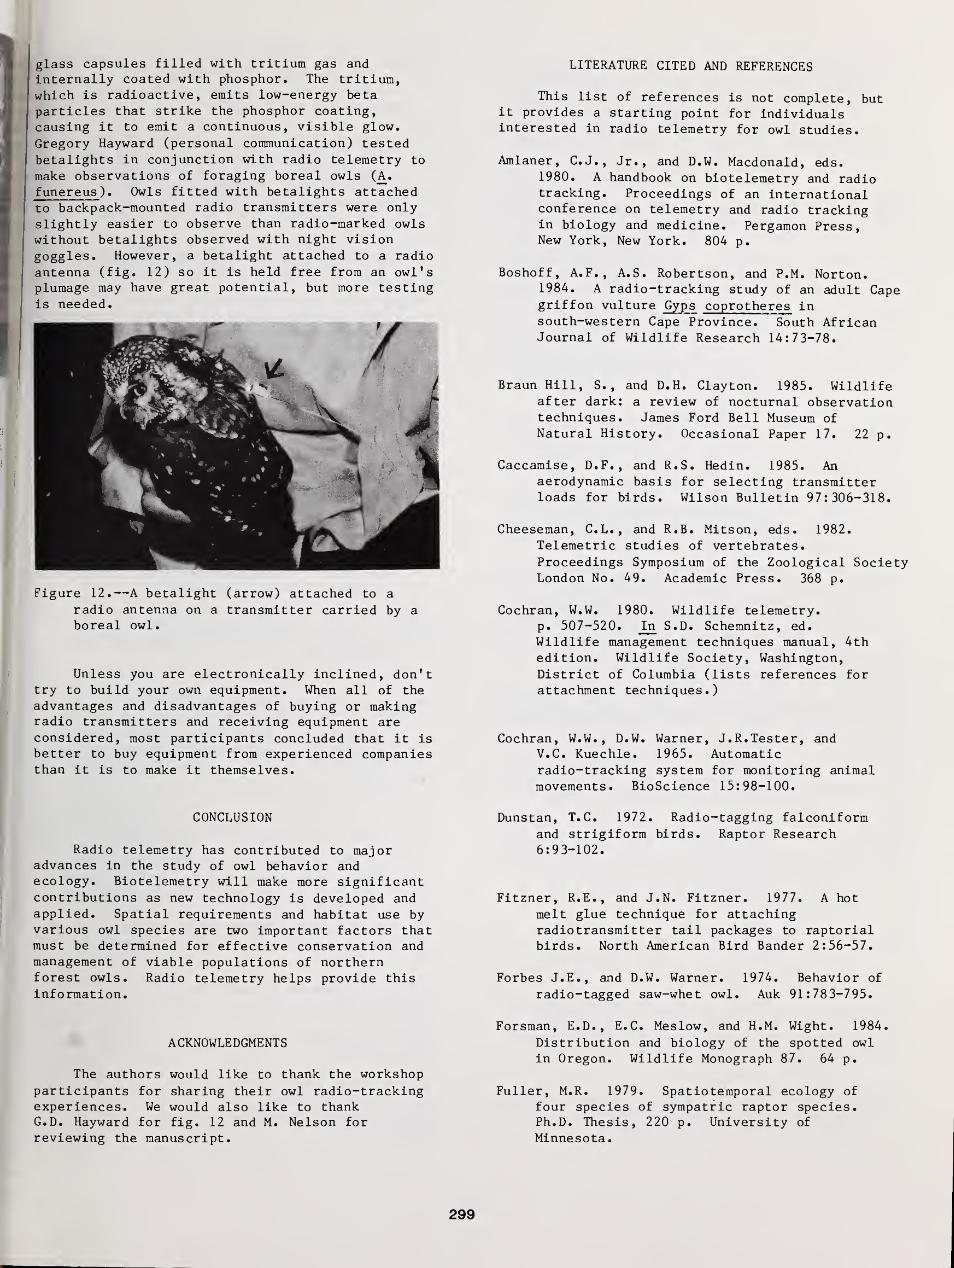
glass capsules filled with tritium gas andinternally coated with phosphor. The tritium,which is radioactive, emits low-energy betaparticles that strike the phosphor coating,causing it to emit a continuous, visible glow.
Gregory Hayward (personal communication) testedbetalights in conjunction with radio telemetry to
make observations of foraging boreal owls (A.
funereus ) . Owls fitted with betalights attachedto backpack-mounted radio transmitters were only
slightly easier to observe than radio-marked owlswithout betalights observed with night visiongoggles. However, a betalight attached to a radio
antenna (fig. 12) so it is held free from an owl'splumage may have great potential, but more testingis needed.
Figure 12.—A betalight (arrow) attached to a
radio antenna on a transmitter carried by a
boreal owl.
Unless you are electronically inclined, don'ttry to build your own equipment. When all of the
advantages and disadvantages of buying or makingradio transmitters and receiving equipment areconsidered, most participants concluded that it is
better to buy equipment from experienced companiesthan it is to make it themselves.
CONCLUSION
Radio telemetry has contributed to majoradvances in the study of owl behavior andecology. Biotelemetry will make more significantcontributions as new technology is developed andapplied. Spatial requirements and habitat use byvarious owl species are two important factors thatmust be determined for effective conservation andmanagement of viable populations of northernforest owls. Radio telemetry helps provide thisinformation.
ACKNOWLEDGMENTS
The authors would like to thank the workshopparticipants for sharing their owl radio-trackingexperiences. We would also like to thankG.D. Hayward for fig. 12 and M. Nelson forreviewing the manuscript.
LITERATURE CITED AND REFERENCES
This list of references is not complete, butit provides a starting point for individualsinterested in radio telemetry for owl studies.
Amlaner, C.J., Jr., and D.W. Macdonald, eds.1980. A handbook on biotelemetry and radiotracking. Proceedings of an internationalconference on telemetry and radio trackingin biology and medicine. Pergamon Press,New York, New York. 804 p.
Boshoff, A.F., A.S. Robertson, and P.M. Norton.1984. A radio-tracking study of an adult Capegriffon vulture Gyps coprotheres insouth-western Cape Province. South AfricanJournal of Wildlife Research 14:73-78.
Braun Hill, S. , and D.H. Clayton. 1985. Wildlifeafter dark: a review of nocturnal observationtechniques. James Ford Bell Museum of
Natural History. Occasional Paper 17. 22 p.
Caccamise, D.F., and R.S. Hedin. 1985. Anaerodynamic basis for selecting transmitterloads for birds. Wilson Bulletin 97:306-318.
Cheeseman, C.L., and R.B. Mitson, eds. 1982.
Teleraetric studies of vertebrates.Proceedings Symposium of the Zoological SocietyLondon No. 49. Academic Press. 368 p.
Cochran, W.W. 1980. Wildlife telemetry,p. 507-520. _In S.D. Schemnitz, ed.
Wildlife management techniques manual, 4thedition. Wildlife Society, Washington,District of Columbia (lists references forattachment techniques.)
Cochran, W.W. , D.W. Warner, J. R. Tester, andV.C. Kuechle. 1965. Automaticradio-tracking system for monitoring animalmovements. Bioscience 15:98-100.
Dunstan, T.C. 1972. Radio-tagging falconiformand strigiform birds. Raptor Research6:93-102.
Fitzner, R.E., and J.N. Fitzner. 1977. A hot
melt glue technique for attachingradiotransmitter tail packages to raptorialbirds. North American Bird Bander 2:56-57.
Forbes J.E., and D.W. Warner. 1974. Behavior of
radio-tagged saw-whet owl. Auk 91:783-795.
Forsraan, E.D., E.C. Meslow, and H.M. Wight. 1984.
Distribution and biology of the spotted owl
in Oregon. Wildlife Monograph 87. 64 p.
Fuller, M.R. 1979. Spatiotemporal ecology of
four species of sympatric raptor species.Ph.D. Thesis, 220 p. University of
Minnesota.
299
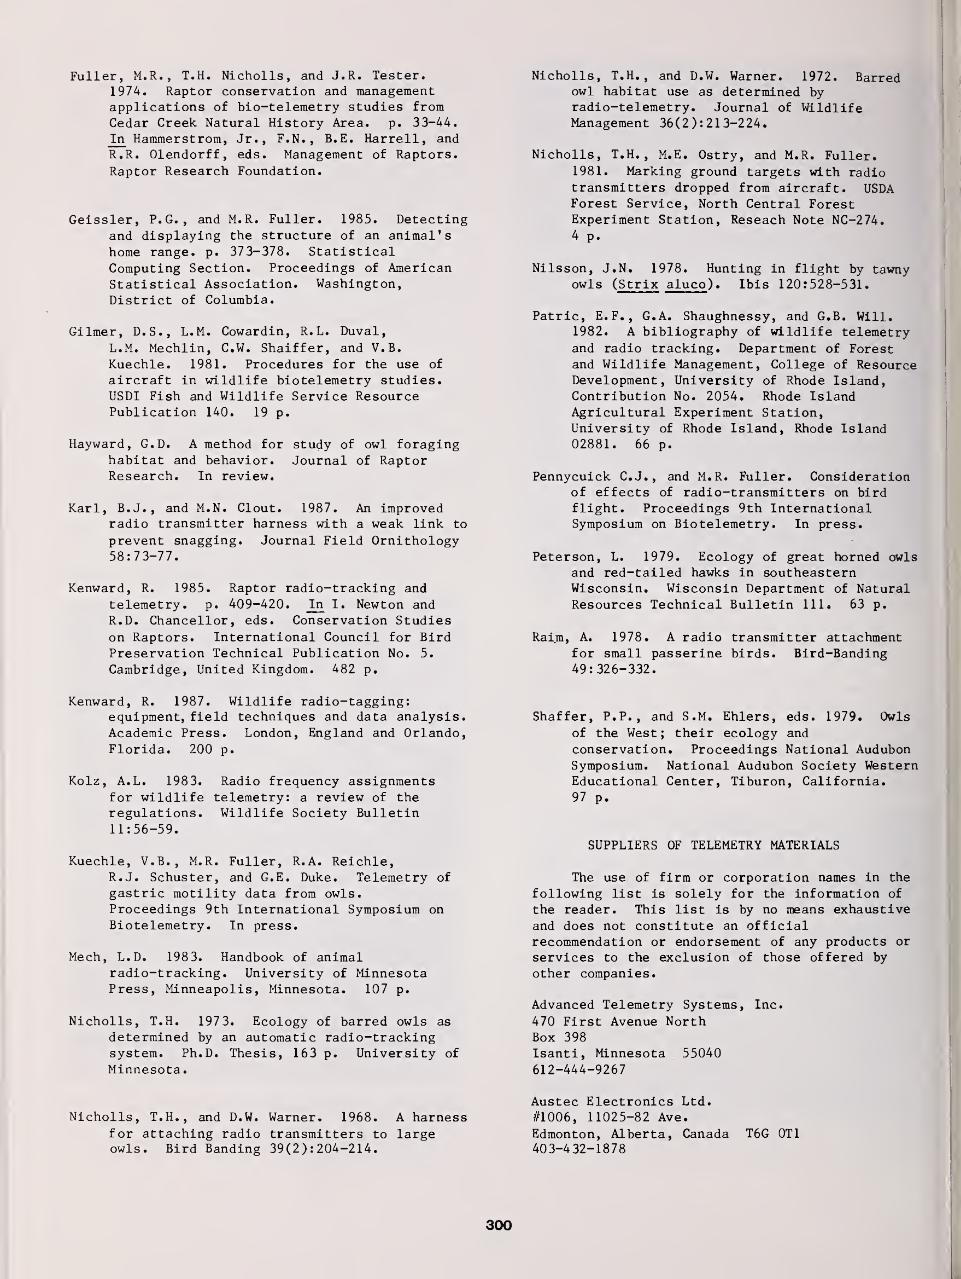
Fuller, M.R., T.H. Nlcholls, and J.R. Tester.1974. Raptor conservation and managementapplications of bio-telemetry studies fromCedar Creek Natural History Area. p. 33-44.
In Hammerstrom, Jr., F.N., B.E. Harrell, andR.R. Olendorff, eds. Management of Raptors.
Raptor Research Foundation.
Geissler, P.G. , and M.R. Fuller. 1985. Detectingand displaying the structure of an animal'shome range, p. 373-378. StatisticalComputing Section. Proceedings of AmericanStatistical Association. Washington,District of Columbia.
Gilmer, D.S., L.M. Cowardin, R. L. Duval,
L.M. Mechlin, C.W. Shaiffer, and V.B.
Kuechle. 1981. Procedures for the use of
aircraft in wildlife biotelemetry studies.USDI Fish and Wildlife Service ResourcePublication 140. 19 p.
Hayward, CD. A method for study of owl foraginghabitat and behavior. Journal of RaptorResearch. In review.
Karl, B.J., and M.N. Clout. 1987. An improvedradio transmitter harness with a weak link to
prevent snagging. Journal Field Ornithology58:73-77.
Kenward, R. 1985. Raptor radio-tracking and
telemetry, p. 409-420. _In I. Newton and
R.D. Chancellor, eds. Conservation Studieson Raptors. International Council for BirdPreservation Technical Publication No. 5.
Cambridge, United Kingdom. 482 p.
Kenward, R. 1987. Wildlife radio-tagging:equipment, field techniques and data analysis.Academic Press. London, England and Orlando,Florida. 200 p.
Kolz, A.L. 1983. Radio frequency assignmentsfor wildlife telemetry: a review of theregulations. Wildlife Society Bulletin11:56-59.
Kuechle, V.B., M.R. Fuller, R.A. Reichle,R.J. Schuster, and G.E. Duke. Telemetry of
gastric motility data from owls.Proceedings 9th International Symposium on
Biotelemetry. In press.
Mech, L.D. 1983. Handbook of animalradio-tracking. University of MinnesotaPress, Minneapolis, Minnesota. 107 p.
Nicholls, T.H. 1973. Ecology of barred owls as
determined by an automatic radio-trackingsystem. Ph.D. Thesis, 163 p. University of
Minnesota.
Nicholls, T.H., and D.W. Warner. 1968. A harnessfor attaching radio transmitters to largeowls. Bird Banding 39(2 ): 204-214.
Nicholls, T.H. , and D.W. Warner. 1972. Barredowl habitat use as determined byradio-telemetry. Journal of WildlifeManagement 36(2 ): 21 3-224.
Nicholls, T.H. , M.E. Ostry, and M.R. Fuller.1981. Marking ground targets with radiotransmitters dropped from aircraft. USDAForest Service, North Central ForestExperiment Station, Reseach Note NC-274.4 p.
Nilsson, J.N. 1978. Hunting in flight by tawnyowls (Strix aluco ) . Ibis 120:528-531.
Patrlc, E.F., G.A. Shaughnessy, and G.B. Will.1982. A bibliography of wildlife telemetryand radio tracking. Department of Forestand Wildlife Management, College of ResourceDevelopment, University of Rhode Island,Contribution No. 2054. Rhode IslandAgricultural Experiment Station,University of Rhode Island, Rhode Island02881. 66 p.
Pennycuick C.J., and M.R. Fuller. Considerationof effects of radio-transmitters on birdflight. Proceedings 9th InternationalSymposium on Biotelemetry. In press.
Peterson, L. 1979. Ecology of great horned owls
and red-tailed hawks in southeasternWisconsin. Wisconsin Department of NaturalResources Technical Bulletin 111. 63 p.
Raim, A. 1978. A radio transmitter attachmentfor small passerine birds. Bird-Banding49:326-332.
Shaffer, P.P., and S.M. Ehlers, eds. 1979. Owls
of the West; their ecology and
conservation. Proceedings National AudubonSymposium. National Audubon Society WesternEducational Center, Tiburon, California.97 p.
SUPPLIERS OF TELEMETRY MATERIALS
The use of firm or corporation names in the
following list is solely for the information of
the reader. This list is by no means exhaustiveand does not constitute an officialrecommendation or endorsement of any products or
services to the exclusion of those offered by
other companies.
Advanced Telemetry Systems, Inc.
470 First Avenue NorthBox 398
Isanti, Minnesota 55040612-444-9267
Austec Electronics Ltd.
#1006, 11025-82 Ave.
Edmonton, Alberta, Canada T6G 0T1
403-432-1878
300
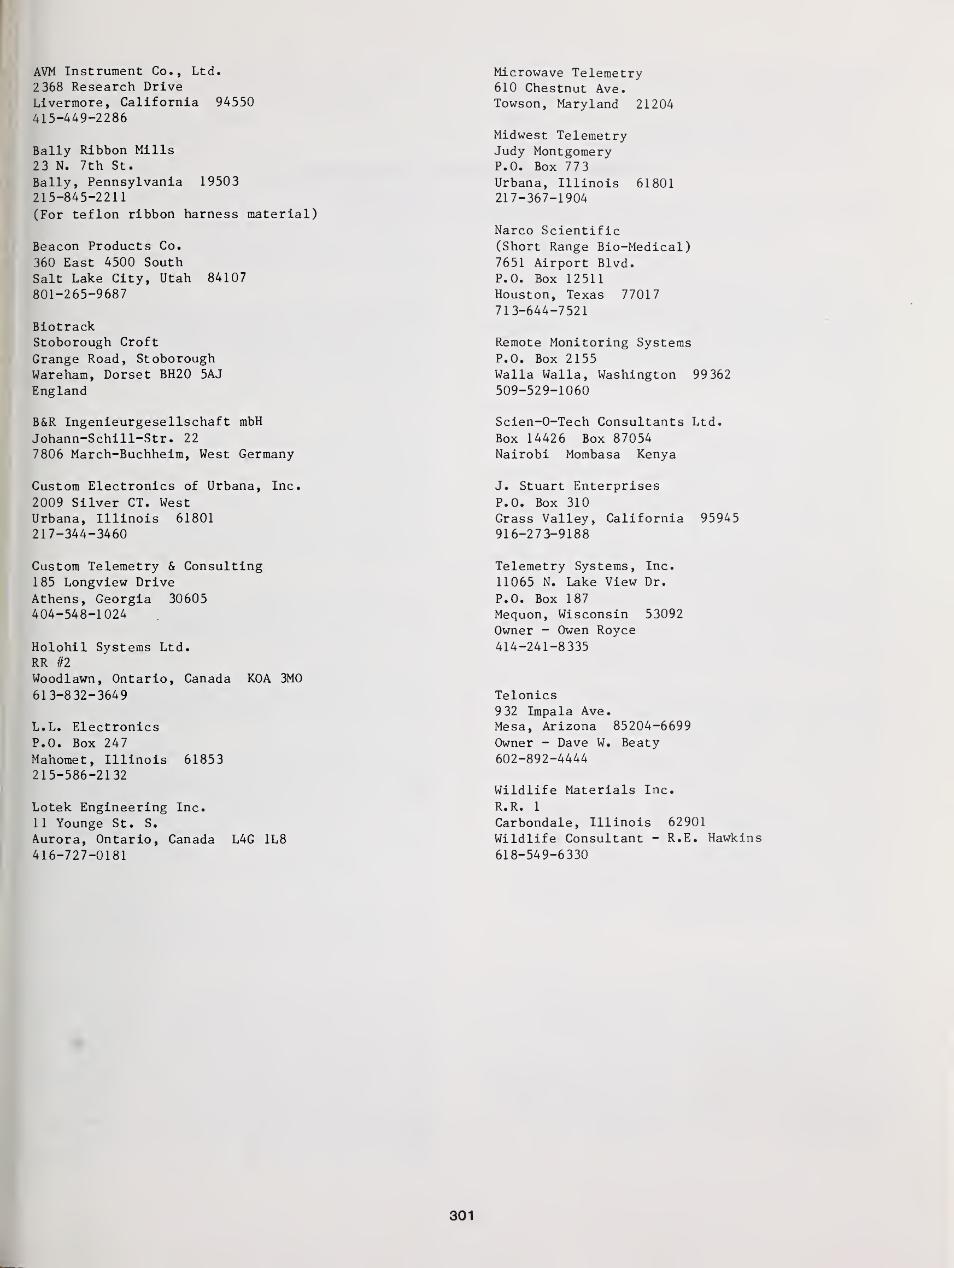
AVM Instrument Co., Ltd.
2 368 Research DriveLivermore, California 94550415-449-2286
Bally Ribbon Mills23 N. 7th St.
Bally, Pennsylvania 19503215-845-2211
(For teflon ribbon harness material)
Beacon Products Co.
360 East 4500 SouthSalt Lake City, Utah 84107801-265-9687
BiotrackStoborough Croft
Grange Road, StoboroughWareham, Dorset BH20 5AJ
England
B&R Ingenieurgesellschaf t mbH
Johann-Schill-Str. 22
7806 March-Buchheim, West Germany
Custom Electronics of Urbana, Inc.
2009 Silver CT. WestUrbana, Illinois 61801217-344-3460
Custom Telemetry & Consulting185 Longview DriveAthens, Georgia 30605404-548-1024
Holohil Systems Ltd.RR #2
Woodlawn, Ontario, Canada KOA 3M0
613-832-3649
L.L. ElectronicsP.O. Box 247Mahomet, Illinois 61853215-586-2132
Lotek Engineering Inc.
11 Younge St. S.
Aurora, Ontario, Canada L4G 1L8
416-727-0181
Microwave Telemetry610 Chestnut Ave.Towson, Maryland 21204
Midwest TelemetryJudy MontgomeryP.O. Box 77 3
Urbana, Illinois 61801217-367-1904
Narco Scientific(Short Range Bio-Medical)7651 Airport Blvd.P.O. Box 12511Houston, Texas 77017713-644-7521
Remote Monitoring SystemsP.O. Box 2155Walla Walla, Washington 99362509-529-1060
Scien-O-Tech Consultants Ltd.
Box 14426 Box 87054Nairobi Mombasa Kenya
J. Stuart EnterprisesP.O. Box 310Grass Valley, California 95945916-273-9188
Telemetry Systems, Inc.
11065 N. Lake View Dr.
P.O. Box 187
Mequon, Wisconsin 53092Owner - Owen Royce414-241-8335
Telonics932 Impala Ave.Mesa, Arizona 85204-6699
Owner - Dave W. Beaty602-892-4444
Wildlife Materials Inc.
R.R. 1
Carbondale, Illinois 62901
Wildlife Consultant - R.E. Hawkins
618-549-6330
301
Owl Management Techniques1
Katherine V. Haws 2
Wildlife management issues and programsinvolving northern owls were the subjectof this workshop. Programs currentlyunderway in various parts of the UnitedStates and Europe were summarized by thepanelists.
Management for northern owls in thePacific Northwest has centered aroundendangered species concerns, primarilythe spotted owl. The U.S. Forest Serviceand conservationists have been embroiledin a decade long controversy involvingthe spotted owl as an indicator speciesof old growth fir spruce and hemlock for-ests. These forests have almost all beencut, and yet studies by ornithologists onthe Spotted Owl Recovery Committee haverecommended that old growth forest tractsof 1400-4500 acres in size be set asidefor each pair of owls. A recommendedowl population size for the region is1500 pairs.
Management plans and actions for severalforests in this region have not compliedwith these requests for habitat protec-tion, and the result has been an embit-tered conflict between many factions.
Elsewhere in the northwest, the borealowl has received priority as a candidatespecies for research. The effects ofalternative logging practices, sale sizesand sale distribution on boreal owl popu-lations is being studied in Idaho. Nestboxes are being erected for this speciesand other cavity nesting species onIdaho's National Forests.
1 Summary of workshop comments at thesymposium, Biology and Conservation ofNorthern Forest Owls, Feb. 3-7, 1987,Winnipeg, Manitoba. USDA Forest ServiceGeneral Technical Report RM-142.
2 Nongame Specialist, Minnesota Departmentof Natural Resources, Bemidji, MN. Otherworkshop panel members were: Thomas Hamer,Ronald Ryder. Harriet Allen, and GeirSonerud.
The flammulated owl has been the focus ofresearch and management for northern owlsin the Rocky Mountain States. Census/survey efforts, and nest box placementhave also been initiated on several NationalForests in this region.
In Manitoba, an agreement between a paper/wood corporation and the Manitoba Depart-ment of Natural Resources^has been signedwhich sets aside a 12 mi. area for owlhabitat preservation. Great gray owlresearch receives high priority withinthe Manitoba Nongame Program, and hasreceived wide backing from many sources,including World Wildlife Fund.
Management programs for the great grayowl in Manitoba have included placementof artificial nest structures and creatinghabitat reserves.
In the midwest states several northernowls have been placed on state endangeredspecies lists, including the short-earedowl
.
Management projects have included basiccensus and survey projects, as well as
placement of nest structures for barredowls and great gray owls. These twospecies have been selected as indicatorspecies by the U.S. Forest Service-Chip-pewa National Forest, and management is
yet in the planning stages.
Between 5-15% of the timber resources on
the Chippewa National Forest have been
set aside on an old growth rotation,resulting in habitat protection for north-
ern owls inhabiting these community types.
In Minnesota, the Nongame Wildlife Programof the Department of Natural Resources has
initiated several management projects. A
publication entitled "Woodworking forWildlife" describes how to build manynest boxes, including nest boxes for barredowls, great gray owls, and great hornedowls. This publication has been madeavailable to the public and as a result,many nest structures have been put up.
302

Forest management guidelines which consi-der the needs of wildlife have been com-pleted, and these guidelines addressissues such as protection of riparianareas, and snag trees.
A management plan for the Roseau Bog OwlManagement Unit in Roseau County, Minne-sota has been completed. This managementplan addresses needs of, among other wild-life species, the great gray owl on the14 mi.£ unit, and makes recommendationsto harvest timber without adversely affecting owl populations in the area.
Currently, most state and federal agenciesare at the point of obtaining basic habi-tat, range and population data for ournorthern owl species. Until these base-
line data are obtained, management programscannot be effectively initiated. At thistime it is difficult to predict specificimpacts of forest management activitiessuch as clear cutting, chemical release,and other s i 1 v i cu 1 tura 1 practices onparticular species.
In future years, research will most likelybecome more applied in scope, in order toanswer some of these questions.
Currently, management programs involvehabitat preservation, placement of neststructures, protection of nest trees,education efforts, old growth forest pro-tection and initiation of an ecosystemapproach to habitat management.
303
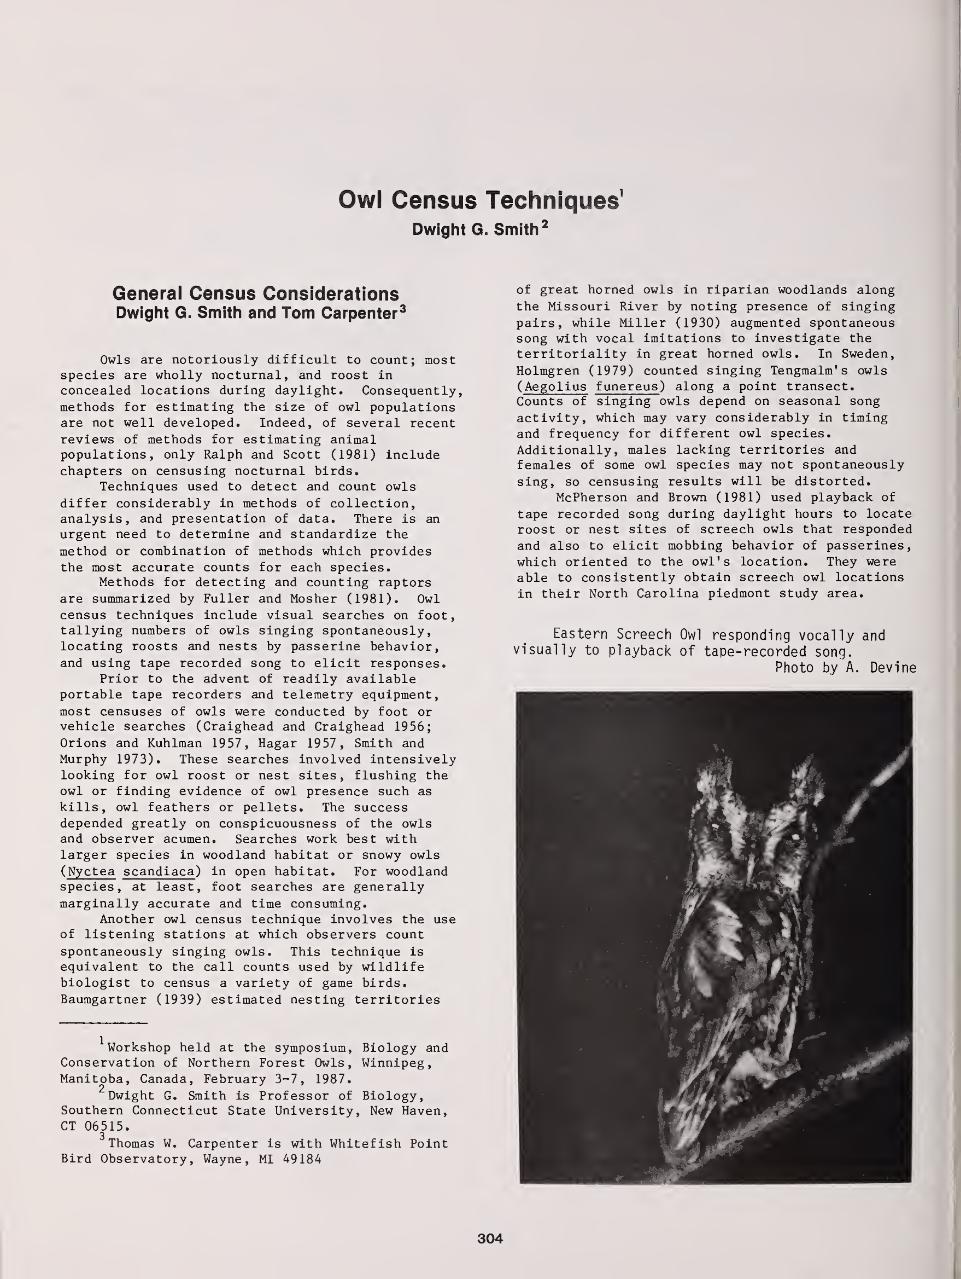
Owl Census Techniques1
Dwight G. Smith 2
General Census ConsiderationsDwight G. Smith and Tom Carpenter 3
Owls are notoriously difficult to count; mostspecies are wholly nocturnal, and roost inconcealed locations during daylight. Consequently,methods for estimating the size of owl populationsare not well developed. Indeed, of several recentreviews of methods for estimating animalpopulations, only Ralph and Scott (1981) includechapters on censusing nocturnal birds.
Techniques used to detect and count owls
differ considerably in methods of collection,analysis, and presentation of data. There is an
urgent need to determine and standardize the
method or combination of methods which providesthe most accurate counts for each species.
Methods for detecting and counting raptorsare summarized by Fuller and Mosher (1981). Owlcensus techniques include visual searches on foot,tallying numbers of owls singing spontaneously,locating roosts and nests by passerine behavior,and using tape recorded song to elicit responses.
Prior to the advent of readily availableportable tape recorders and telemetry equipment,
most censuses of owls were conducted by foot orvehicle searches (Craighead and Craighead 1956;
Orions and Kuhlman 1957, Hagar 1957, Smith andMurphy 1973). These searches involved intensivelylooking for owl roost or nest sites, flushing theowl or finding evidence of owl presence such as
kills, owl feathers or pellets. The successdepended greatly on conspicuousness of the owlsand observer acumen. Searches work best withlarger species in woodland habitat or snowy owls
( Nyctea scandiaca ) in open habitat. For woodlandspecies, at least, foot searches are generallymarginally accurate and time consuming.
Another owl census technique involves the useof listening stations at which observers count
spontaneously singing owls. This technique is
equivalent to the call counts used by wildlifebiologist to census a variety of game birds.
Baumgartner (1939) estimated nesting territories
of great horned owls in riparian woodlands along
the Missouri River by noting presence of singingpairs, while Miller (1930) augmented spontaneoussong with vocal imitations to investigate theterritoriality in great horned owls. In Sweden,
Holmgren (1979) counted singing Tengmalm' s owls
( Aegolius funereus) along a point transect.Counts of singing owls depend on seasonal song
activity, which may vary considerably in timingand frequency for different owl species.
Additionally, males lacking territories andfemales of some owl species may not spontaneously
sing, so censusing results will be distorted.McPherson and Brown (1981) used playback of
tape recorded song during daylight hours to locateroost or nest sites of screech owls that respondedand also to elicit mobbing behavior of passerines,which oriented to the owl's location. They wereable to consistently obtain screech owl locations
in their North Carolina piedmont study area.
Eastern Screech Owl responding vocally andvisually to playback of tape-recorded song.
Photo by A. Devine
Workshop held at the symposium, Biology andConservation of Northern Forest Owls, Winnipeg,Manitoba, Canada, February 3-7, 1987.
2Dwight G. Smith is Professor of Biology,
Southern Connecticut State University, New Haven,CT 06515.
3Thomas W. Carpenter is with Whitefish Point
Bird Observatory, Wayne, MI 49184
304
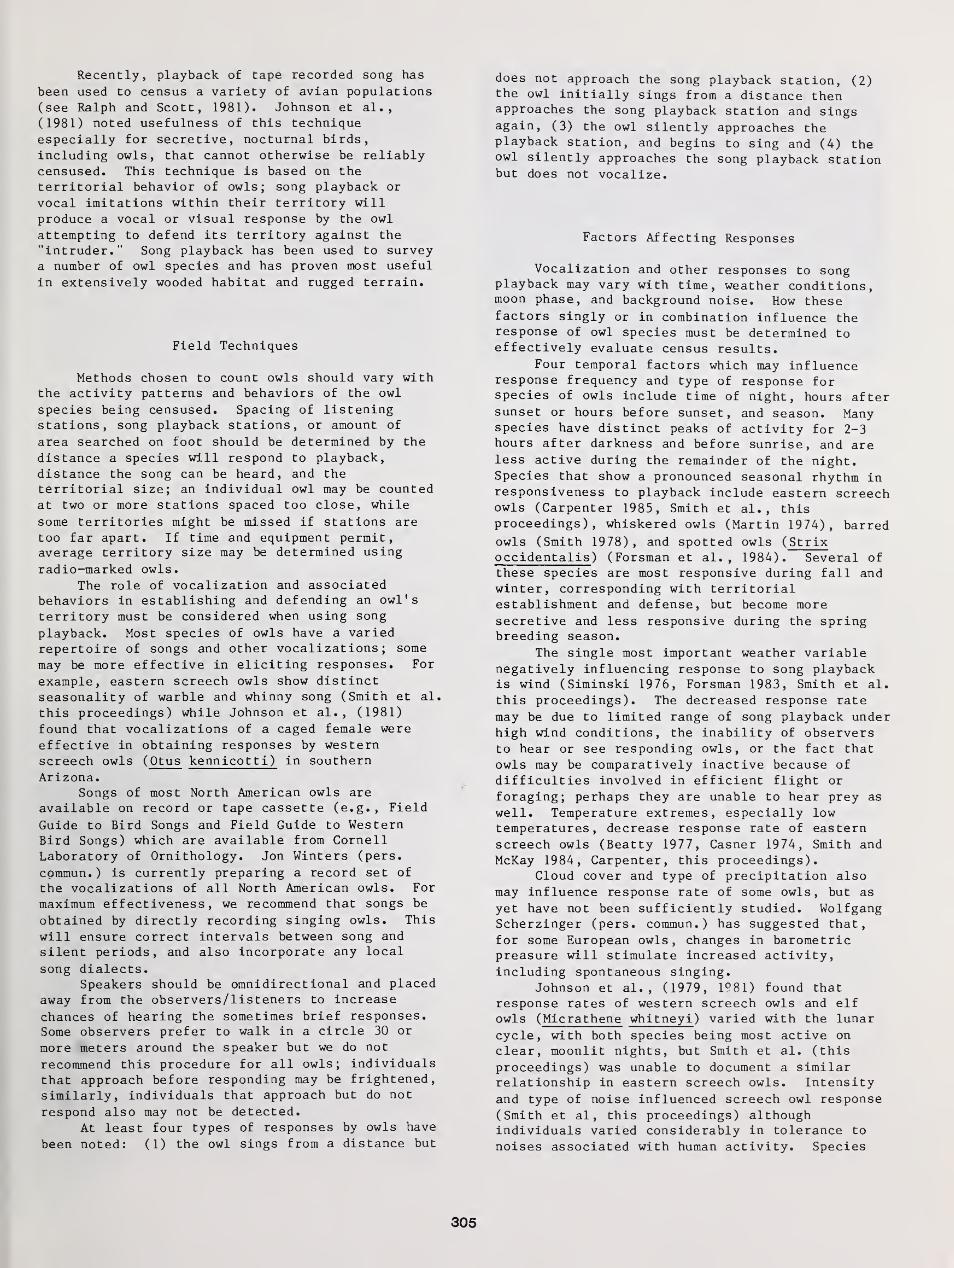
Recently, playback of tape recorded song has
been used to census a variety of avian populations(see Ralph and Scott, 1981). Johnson et al.
,
(1981) noted usefulness of this techniqueespecially for secretive, nocturnal birds,
including owls, that cannot otherwise be reliablycensused. This technique is based on the
territorial behavior of owls; song playback or
vocal imitations within their territory willproduce a vocal or visual response by the owl
attempting to defend its territory against the
"intruder." Song playback has been used to surveya number of owl species and has proven most useful
in extensively wooded habitat and rugged terrain.
Field Techniques
Methods chosen to count owls should vary withthe activity patterns and behaviors of the owl
species being censused. Spacing of listeningstations, song playback stations, or amount of
area searched on foot should be determined by the
distance a species will respond to playback,distance the song can be heard, and theterritorial size; an individual owl may be countedat two or more stations spaced too close, while
some territories might be missed if stations aretoo far apart. If time and equipment permit,average territory size may be determined using
radio-marked owls.
The role of vocalization and associatedbehaviors in establishing and defending an owl'sterritory must be considered when using song
playback. Most species of owls have a variedrepertoire of songs and other vocalizations; some
may be more effective in eliciting responses. For
example, eastern screech owls show distinctseasonality of warble and whinny song (Smith et al.
this proceedings) while Johnson et al. , (1981)
found that vocalizations of a caged female were
effective in obtaining responses by westernscreech owls ( Otus kennicotti) in southernArizona.
Songs of most North American owls are
available on record or tape cassette (e.g. , Field
Guide to Bird Songs and Field Guide to WesternBird Songs) which are available from CornellLaboratory of Ornithology. Jon Winters (pers.
cpmmun.) is currently preparing a record set of
the vocalizations of all North American owls. For
maximum effectiveness, we recommend that songs be
obtained by directly recording singing owls. This
will ensure correct intervals between song and
silent periods, and also incorporate any local
song dialects.Speakers should be omnidirectional and placed
away from the observers/listeners to increase
chances of hearing the sometimes brief responses.Some observers prefer to walk in a circle 30 or
more meters around the speaker but we do not
recommend this procedure for all owls; individualsthat approach before responding may be frightened,
similarly, individuals that approach but do not
respond also may not be detected.
At least four types of responses by owls have
been noted: (1) the owl sings from a distance but
does not approach the song playback station, (2)the owl initially sings from a distance thenapproaches the song playback station and singsagain, (3) the owl silently approaches theplayback station, and begins to sing and (4) theowl silently approaches the song playback stationbut does not vocalize.
Factors Affecting Responses
Vocalization and other responses to songplayback may vary with time, weather conditions,moon phase, and background noise. How thesefactors singly or in combination influence theresponse of owl species must be determined toeffectively evaluate census results.
Four temporal factors which may influenceresponse frequency and type of response forspecies of owls include time of night, hours aftersunset or hours before sunset, and season. Manyspecies have distinct peaks of activity for 2-3hours after darkness and before sunrise, and areless active during the remainder of the night.Species that show a pronounced seasonal rhythm inresponsiveness to playback include eastern screechowls (Carpenter 1985, Smith et al. , thisproceedings), whiskered owls (Martin 1974), barredowls (Smith 1978), and spotted owls ( Strixoccidentalis ) (Forsman et al. , 1984). Several of
these species are most responsive during fall andwinter, corresponding with territorialestablishment and defense, but become moresecretive and less responsive during the springbreeding season.
The single most important weather variablenegatively influencing response to song playbackis wind (Siminski 1976, Forsman 1983, Smith et al.
this proceedings). The decreased response rate
may be due to limited range of song playback underhigh wind conditions, the inability of observersto hear or see responding owls, or the fact that
owls may be comparatively inactive because of
difficulties involved in efficient flight or
foraging; perhaps they are unable to hear prey as
well. Temperature extremes, especially lowtemperatures, decrease response rate of easternscreech owls (Beatty 1977, Casner 1974, Smith and
McKay 1984, Carpenter, this proceedings).Cloud cover and type of precipitation also
may influence response rate of some owls, but as
yet have not been sufficiently studied. WolfgangScherzinger (pers. commun. ) has suggested that,
for some European owls, changes in barometricpreasure will stimulate increased activity,including spontaneous singing.
Johnson et al. , (1979, 1°81) found thatresponse rates of western screech owls and elfowls ( Micrathene whitneyi ) varied with the lunar
cycle, with both species being most active on
clear, moonlit nights, but Smith et al. (this
proceedings) was unable to document a similarrelationship in eastern screech owls. Intensity
and type of noise influenced screech owl response(Smith et al , this proceedings) althoughindividuals varied considerably in tolerance to
noises associated with human activity. Species
305
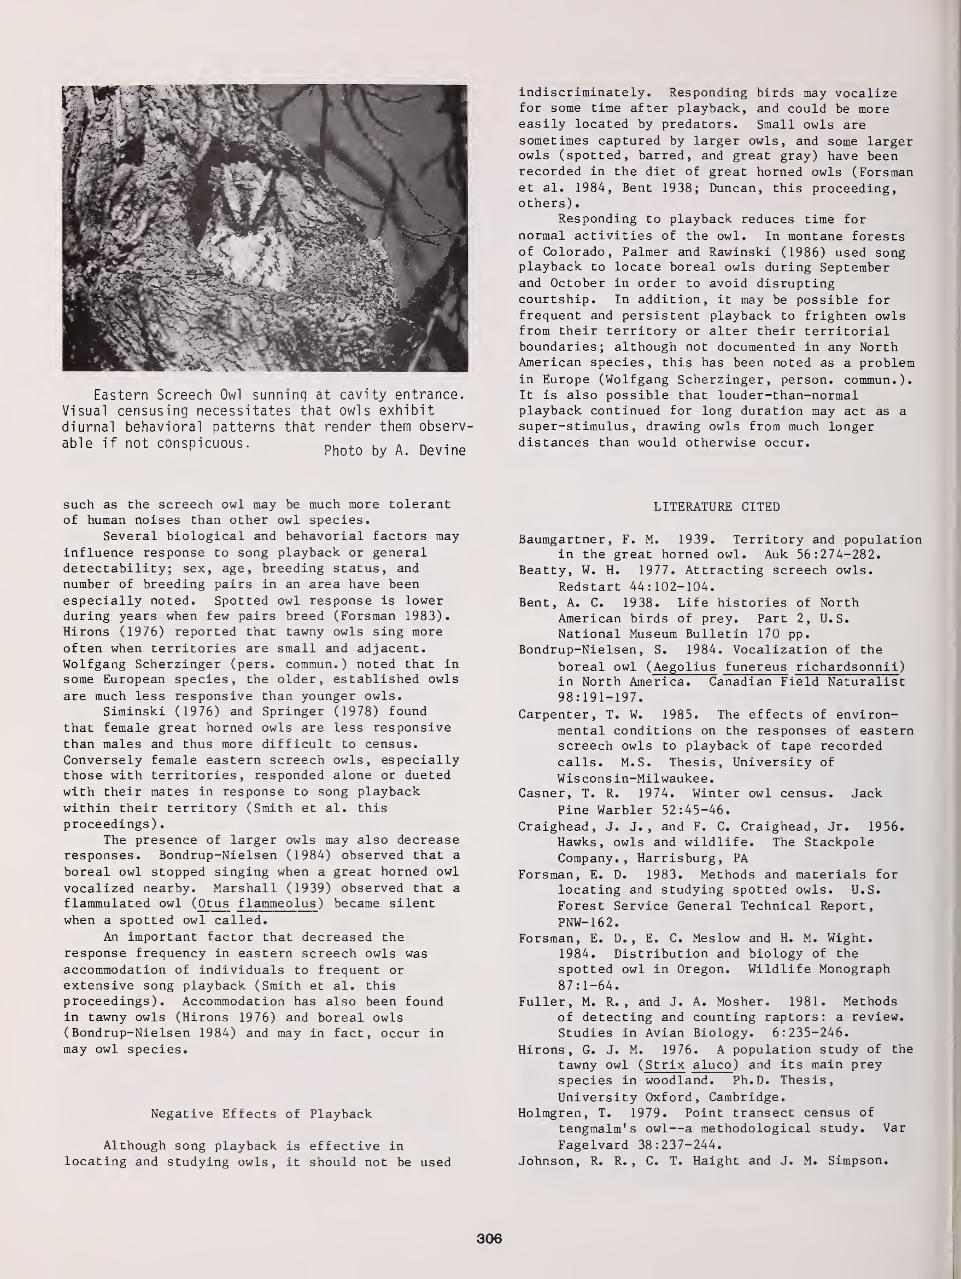
Eastern Screech Owl sunning at cavity entrance.
Visual censusing necessitates that owls exhibitdiurnal behavioral patterns that render them observ-
able if not conspicuous.photo by A< Devine
such as the screech owl may be much more tolerantof human noises than other owl species.
Several biological and behavorial factors mayinfluence response to song playback or generaldetectability
; sex, age, breeding status, andnumber of breeding pairs in an area have beenespecially noted. Spotted owl response is lowerduring years when few pairs breed (Forsman 1983).Hirons (1976) reported that tawny owls sing moreoften when territories are small and adjacent.Wolfgang Scherzinger (pers. commun.) noted that insome European species, the older, established owls
are much less responsive than younger owls.Siminski (1976) and Springer (1978) found
that female great horned owls are less responsivethan males and thus more difficult to census.
Conversely female eastern screech owls, especiallythose with territories, responded alone or duetedwith their mates in response to song playbackwithin their territory (Smith et al. this
proceedings)
.
The presence of larger owls may also decreaseresponses. Bondrup-Nielsen (1984) observed that a
boreal owl stopped singing when a great horned owl
vocalized nearby. Marshall (1939) observed that a
f lammulated owl ( Otus f lammeolus ) became silent
when a spotted owl called.
An important factor that decreased the
response frequency in eastern screech owls was
accommodation of individuals to frequent or
extensive song playback (Smith et al. thisproceedings). Accommodation has also been foundin tawny owls (Hirons 1976) and boreal owls(Bondrup-Nielsen 1984) and may in fact, occur inmay owl species.
Negative Effects of Playback
Although song playback is effective in
locating and studying owls, it should not be used
indiscriminately. Responding birds may vocalizefor some time after playback, and could be moreeasily located by predators. Small owls aresometimes captured by larger owls, and some largerowls (spotted, barred, and great gray) have beenrecorded in the diet of great horned owls (Forsmanet al. 1984, Bent 1938; Duncan, this proceeding,others)
.
Responding to playback reduces time for
normal activities of the owl. In montane forestsof Colorado, Palmer and Rawinski (1986) used songplayback to locate boreal owls during Septemberand October in order to avoid disruptingcourtship. In addition, it may be possible forfrequent and persistent playback to frighten owlsfrom their territory or alter their territorialboundaries; although not documented in any NorthAmerican species , this has been noted as a problemin Europe (Wolfgang Scherzinger, person, commun.).It is also possible that louder-than-normalplayback continued for long duration may act as a
super-stimulus, drawing owls from much longerdistances than would otherwise occur.
LITERATURE CITED
Baumgartner, F. M. 1939. Territory and populationin the great horned owl. Auk 56:274-282.
Beatty, W. H. 1977. Attracting screech owls.
Redstart 44:102-104.Bent, A. C. 1938. Life histories of North
American birds of prey. Part 2, U.S.National Museum Bulletin 170 pp.
Bondrup-Nielsen, S. 1984. Vocalization of the
boreal owl ( Aegolius funereus richardsonnii )
in North America. Canadian Field Naturalist98:191-197.
Carpenter, T. W. 1985. The effects of environ-mental conditions on the responses of easternscreech owls to playback of tape recordedcalls. M.S. Thesis, University of
Wis cons in-Milwaukee
.
Casner, T. R. 1974. Winter owl census. JackPine Warbler 52:45-46.
Craighead, J. J., and F. C. Craighead, Jr. 1956.
Hawks, owls and wildlife. The StackpoleCompany.
,Harrisburg, PA
Forsman, E. D. 1983. Methods and materials forlocating and studying spotted owls. U.S.
Forest Service General Technical Report,
PNW-162.Forsman, E. D. , E. C. Meslow and H. M. Wight.
1984. Distribution and biology of thespotted owl in Oregon. Wildlife Monograph87:1-64.
Fuller, M. R. , and J. A. Mosher. 1981. Methodsof detecting and counting raptors: a review.
Studies in Avian Biology. 6:235-246.
Hirons, G. J. M. 1976. A population study of the
tawny owl ( Strix aluco ) and its main preyspecies in woodland. Ph.D. Thesis,
University Oxford, Cambridge.Holmgren, T. 1979. Point transect census of
tengmalm' s owl—a methodological study. Var
Fagelvard 38:237-244.Johnson, R. R. , C. T. Haight and J. M. Simpson.
306
1979. Owl populations and species status inthe southwestern United States. Pp. 40-59 inProceedings of symposium on owls of the west:their ecology and conservation. P. P.
Schaeffer and S. M. Ehlers, eds. Tiburon,California National Audubon Society WesternEducation Center.
Johnson, B. T. Brown, L. T. Haight and J. M.
Simpson. 1981. Playback recordings as a
special avian censusing technique. Studiesin Avian Biology 6:68-75.
Marshall, J. T. 1939. Territorial behavior of
the flammulated screech owl. Condor41:71-78.
Martin, D. J. 1974. Copulatory and vocal behaviorof a pair of whiskered owls. Auk 91:619-624.
McPherson, R. J., and R. D. Brown. 1981. Mobbingresponses of some passerines to the calls andlocation of the screech owl. Raptor Research15:23-30.
Miller, L. 1930. The territorial concept in the
horned owl. Condor 32:290-291.Orians, G. , and F. Kuhlman. 1956. Red-tailed
hawk and horned owl populations in Wisconsin.Condor 58:371-385.
Palmer, D. A., and J. J. Rawinski. 1986. Atechnique for locating boreal owls in the
fall in the Rocky Mountains. Colorado FieldOrnithology 20:38-41.
Ralph, C. J. and J. M. Scott. 1981. Estimatingnumbers of terrestrial birds. Studies in
Avian Biology No. 6:1-630.Siminski, D. P. 1976. A study of the great horned
owls ( Bubo virginianus ) population densitywith recorded calls in northwestern Ohio.M. S. Thesis, Bowling Green State University,Bowling Green, Ohio.
Smith, C. F. 1978. Distributional ecology of
barred and great horned owls in relation to
human disturbance. M. S. Thesis, Universityof Connecticut, Storrs.
Smith, D. G. , and B. McKay. 1984. The effects of
weather and effort on Christmas Bird Countsof owls in Connecticut. American Birds38:383-387.
Smith, D. G. , and J. R. Murphy. 1973. Breedingecology of raptors of the eastern GreatBasin Desert of Utah. Brigham YoungUniversity Biology Series 18:1-76.
Springer, M. A. 1978. Foot surveys versus owlcalling surveys: a comparative study of two
great horned owl censusing techniques.Inland Bird Banding News 50:83-92.
Census of Barred Owls and Spotted Owls4
Tom Bosakowski 5
Both the barred owl ( Strix varia) and spottedowl ( Strix occidentalis ) are birds of forestedterrain. Their habitats are typically mature andold-growth forest that are often dominated byconifers. Given these conditions, the onlypractical method to estimate the abundance of
these owls is the use of some playback techniqueswhich induce the owls to reveal their presence.
Gould (1977) and Forsman et al. (1977, 1984)surveyed populations of spotted owls in Californiaand Oregon, respectively, using vocal imitationsor tape recorded broadcasts. Sutton and Sutton(1985) and Bosakowski et al. , (this proceedings)also used both methods to survey barred owls in
southern and northern New Jersey, respectively.Although some investigators of the barred owl haverelied completely on the use of tape playback(Gutmore 1977, Smith 1978, Elody 1983, McGarigaland Fraser 1984, 1985, Kane and Valent 1986), all
Presented at the Owl Census TechniquesWorkshop at the Symposium, Biology and
Conservation of Northern Forest Owls, Winnipeg,
Manitoba, Canada, February 3-7, 1987.
Thomas Bosakowski is a zoology doctoralstudent at Rutgers University, Department of
Biological Sciences, Newark, NJ 07662.
have used different equipment, recordings, and
sound wattage.In northern New Jersey, Bosakowski et al.
(this proceedings) found a high response rate
(82.4%) of barred owls to vocal imitation or song
playback during the breeding season. This ratewas determined by 34 rechecks of known barred owl
locations from which a positive response was
recorded. This is a minimal response rate since
we were unable to account for factors such as
mortality or permanent relocation. Conversely,
response rate during the non-breeding season was
significantly lower (33.3%) suggesting that barred
owls may be censused with reasonable accuracy
during the breeding season, but surveys during the
non-breeding season (Christmas bird counts) should
be viewed with caution.Elody (1983) believed that territory size of
barred owls increased during winter and that males
often vacated territories for most of the winter.Bosakowski et al. , (this proceedings) found that
both response rate and the number of responses by
pairs decreased during winter, which hints at
territory expansion and temporary pair-bonddissolution. Forsman et al. , (1984) also found
territory expansion in winter and similarly notedthat response to calling was highest between March
and September.
While most barred owl censusing has been con-
ducted at night, both Elody (1983) and Bosakowskiet al. (this proceedings) have found no apparentdifference in barred owl response rate between
307
nocturnal and diurnal censusing. These resultsare not entirely unexpected since Fuller (1979)noted that radio-marked barred owls exhibitedconsiderable diurnal activity during the breedingseason. Day censusing makes it possible to searchremote, rugged terrain lacking roads or suitabletrails. Although the spotted owl will also respond
to imitation of its calls during the day (Gould1974, Forsman et al. 1984), most censuses havebeen conducted at night.
During day censuses of barred owls, investi-gators should remain concealed while callingbecause this species is generally secretive and
will often flush or remain silent if the observersare detected (Bosakowski et al. , thisproceedings). In contrast, the spotted owl is
very tame and concealment is not necessary(Forsman et al. 1984).
Stearns (1947) and Smith (1978) believed thatbarred owl singing was audible up to 0.7-0.8 km,
therefore, census stations can potentially be
spaced 1.6 km to attain systematic coverage of an
area. Responses less than 2 km apart may need to
be checked to determine if the owls belong to thesame or adjacent territories. This determinationcan be facilitated by (1) simultaneous or nearsimultaneous singing of adjacent pairs (2) byobvious natural boundaries (Smith 1978), (3) by
boundaries such as developments and highways(Bosakowski et al. , this proceedings), or (4) by
confirming simultaneous occupancy of the adjacentterritories. Since spotted owl ranges are
considerably larger (Forsman et al. , 1984) thanbarred owl ranges (Nicholls and Warner 1972,Fuller 1979, Elody 1983) caution should be
exercised when analyzing the results of censuseswith song playback. Both barred and spotted owlsmay maintain traditional territories forsuccessive years (Bent 1938, Forsman et al. 1984,
Bosakowski et al. , this proceedings), even whenthe individuals have changed (Forsman et al.
,
1984, Nicholls and Fuller, this proceedings),thereby facilitating surveys conducted overseveral years.
LITERATURE CITED
Bent, A. C. 1938. Life histories of NorthAmerican birds of prey. Part 2, U.S.National Museum Bulletin 170 pp.
Elody, B. I. 1983. Techniques for capturing,marking, monitoring and habitat analysis forthe barred owl in the Upper Peninsula of
Michigan. M.S. Thesis, Michigan TechnicalUniversity.
Forsman, E. D. , E. C. Meslow and M. J. Stubb.1977. Spotted owl abundance in young versusold-growth forests, Oregon. WildlifeSociety Bulletin 5:43-47.
Forsman, E. D. , E. C. Meslow and H. M. Wight.1984. Distribution and biology of thespotted owl in Oregon. Wildlife Monograph87:1-64.
Fuller, M. R. 1979. Spatiotemporal ecology offour sympatric raptor species. Ph.D. Thesis,University of Minnesota, Duluth.
Gould, G. I. Jr. 1974. Distribution of thespotted owl in California. Western Birds8:131-146.
Gutmore, D. 1978. Barred owl survey in thePequannock Watershed. New Jersey Audubon3:184-185.
Kane, R. , and M. Valent. 1986. North Jerseybarred owl survey. Records of New JerseyBirds 12:69-70.
McGarigal, K. and J. D. Fraser. 1984. The effectof forest stand age on owl distribution insouthwestern Virginia. Journal WildlifeManagement 48:1393-1398.
Nicholls, T. H. , and D. W. Warner. 1972. Barredowl habitat use as determined by telemetry.Journal Wildlife Management 32:213-224.
Smith, C. F. 1978. Distributional ecology of
barred and great horned owls in relation to
human disturbance. M. S. Thesis, Universityof Connecticut, Storrs.
Stearns, E. I. 1947. Notes on the abundance of
the barred owl. Urner Field Observer 2:5-7.Sutton, C. C. , and P. T. Sutton. 1985. The
status and distribution of the barred owl andred-shouldered hawk in southern New Jersey.Cassinia 61:20-29.
Census of Flammulated Owls6
Richard T. Reynolds 7
Flammulated owls ( Otus flammeolus ) bestrespond to taped or vocal imitations (Marshall
1939, Winter 1971) of their primary song from the
latter part of May through early July. However,after the eggs hatch (early July)
,paired males
cease to quickly respond to song imitations
(= broadcast) but non-paired males continue to
respond through the summer (Reynolds and Linkhart
1987a). During May to early July, it is best to
count singing males between 1 hr after sunset and
about 1 hr before sunup. If a count of singing
males must continue after egg hatch, the count
should not begin before 2 hrs after sunset and
should end 2 hrs before sunup. Nesting males
forage intensively for their families and have
little time for territorial defense during these
periods.During the responsive period (May to early
July) males generally begin singing within several
minutes of a broadcast, but a listening period of
Presented at the Owl Census TechniquesWorkshop at the Symposium, Biology and
Conservation of Northern Forest Owls, Winnipeg,Manitoba, Canada, February 3-7, 1987.
7 Richard T. Reynolds is Research WildlifeBiologist, Rocky Mountain Forest and RangeExperiment Station, 222 South 22nd Street,Laramie, WY 82070.
308
at least 10 min. should follow each broadcast. Asingle broadcast bout should not exceed 1 mln. It
is not uncommon to have more than one maleflammulated owl respond to a broadcast, andresponding owls may continue singing after initialresponse. Neighboring males may be stimulated to
sing, and as a result, the song response mayspread over a wide area. Therefore it is advisedto listen for several minutes before broadcastingat each new broadcast station.
Responding males may 1) begin singing withoutapproaching, 2) approach while singing, or 3) come
to their territory boundary before singing. On
several occasions territorial males approachedbeyond their boundaries; some of these continued
to sing as they did so, others approached silentlyand were noted perched quietly within 10 m of the
broadcast station.
Because flammulated owls have quiet, lowpitched voices, counters should be trained and
tested for hearing capabilities before initiatinga formal count. On clear, quiet nights, males
singing from a ridge can be heard to 1.0 km.
Due to the voice characteristics of the owl,
however, it is difficult to estimate the distanceto singing males. Rain, snow, wind, creeks,autos, and airplanes hindered counts of singingmales. We recommend counting only on completely
still nights. Moon phase has no apparent effecton the response of the males.
Linkhart et al. (in review) found that
territorial boundaries of males frequentlyoccurred along ridge tops. Therefore, countingroutes are most efficient (number of respondingmales/distance traveled) when located along
ridges. Ridge-top routes not only make for easiertravel and increase the broadcast and hearingrange, but expose the counter to more territories.
Because territories are approximately 400 macross (Reynolds and Linkhart 1987b)
,counting
stations should be about 600-800 m apart inuniform terrain. In broken terrain, the distancebetween stations should be less; however, theyshould be no closer than 400 m. Counters must be
aware that singing males may approach beyond theirterritories, especially if there are nointervening territories between the broadcaststation and the approaching owl.
Not all singing males are necessarilynesting. In our studies, several responding maleswere unpaired for reasons probably related to
their age and/or quality of their territory(Reynolds and Linkhart 1987b). We have followedmost of our counts of singing males with intensivenest searches (Reynolds and Linkhart 1984).
To estimate the density of flammulated owlson one of our study tracts, we used a modifiedterritorial mapping technique during two nestingseasons (1980-1981). The procedure involvedrepeated entries by 2-3 widely-spaced persons ontothe tract from different directions. After one ofus broadcasted the primary song, responding maleswere quickly located and all subsequent song-treesused in a song bout were marked and mapped. Whentwo or more males responded to broadcast, or whenmales were heard singing before broadcast, thecensus personnel divided and mapped the song-treesof each owl simultaneously. In both years wetallied 25-30 clusters of song-trees (territories),most of which were used in both years. In 1982and 1983 we repeated the mapping technique after"marking" males with radio-transmitters. Wesubsequently discovered that males had 2-4 favoredperipherial areas from which they sang, in whatproved to be much larger territories. Oursubsequent estimate of the number of males,reduced by about two-thirds, approximated thenumber of active nests on the tract.
LITERATURE CITED
Marshall, J. T. 1939. Territorial behavior ofthe flammulated screech owl. Condor41:71-78.
Reynolds, R. T. , and B. D. Linkhart. 1984.Methods and materials for capturing andmonitoring flammulated owls. Great BasinNaturalist 44:49-51.
Reynolds, R. T. , and B. D. Linkhart. 1987a. Thenesting biology of flammulated owls in
Colorado. Symposium on The Biology andConservation of Northern Forest Owls.
Winnipeg, Manitoba. 2-7 February.Reynolds, R. T. , and B. D. Linkhart. 1987b.
Fidelity to territory and mate in flammulatedowls. Symposium on The Biology and Ecologyof Northern Forest Owls. Winnipeg, Manitoba.2-7 February 1987.
Winter, J. 1971. Some critical notes on findingand seeing the flammulated owl. Birding3:205-209.
309
<SU.S. GOVERNMENT PRINTING OFFICE: 1987 776-380/65218

Rocky
Mountains
Great
Plains
U.S. Department of Agriculture
Forest Service
Rocky Mountain Forest andRange Experiment Station
The Rocky Mountain Station is one of eight
regional experiment stations, plus the Forest
Products Laboratory and the Washington Office
Staff, that make up the Forest Service research
organization.
RESEARCH FOCUS
Research programs at the Rocky Mountain
Station are coordinated with area universities andwith other institutions. Many studies are
conducted on a cooperative basis to accelerate
solutions to problems involving range, water,
wildlife and fish habitat, human and communitydevelopment, timber, recreation, protection, andmultiresource evaluation.
RESEARCH LOCATIONS
Research Work Units of the Rocky Mountain
Station are operated in cooperation with
universities in the following cities:
Albuquerque, New Mexico
Flagstaff, Arizona
Fort Collins, Colorado*
Laramie, WyomingLincoln, Nebraska
Rapid City, South DakotaTempe, Arizona
'Station Headquarters: 240 W. Prospect St., Fort Collins, CO 80526
Related Documents