Biology 213 Chapter 53 Introduction to Ecology: Population Ecology Part 1

Biology 213 Chapter 53 Introduction to Ecology: Population Ecology Part 1.
Dec 16, 2015
Welcome message from author
This document is posted to help you gain knowledge. Please leave a comment to let me know what you think about it! Share it to your friends and learn new things together.
Transcript
Biology 213 Chapter 53Introduction to Ecology:
Population Ecology Part 1
You will be able to…
• List various fields of study in Ecology• Explain what factors change populations• Calculate population rate changes• Compare and contrast density-dependent to
density-independent factors
Ecology:
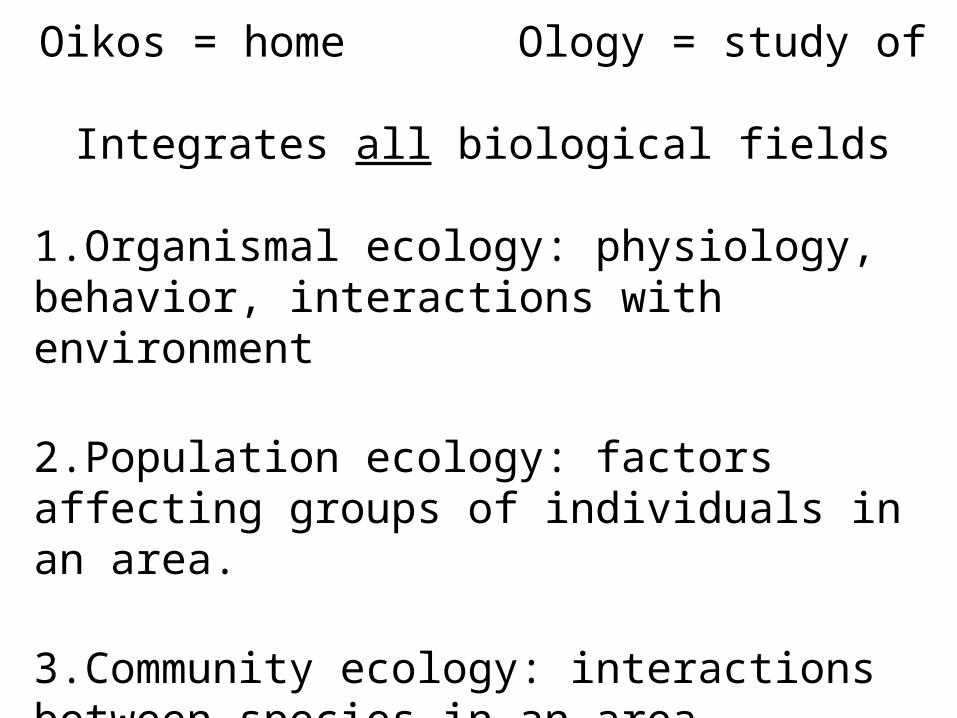
Oikos = home Ology = study ofIntegrates all biological fields
1.Organismal ecology: physiology, behavior, interactions with environment
2.Population ecology: factors affecting groups of individuals in an area.
3.Community ecology: interactions between species in an area
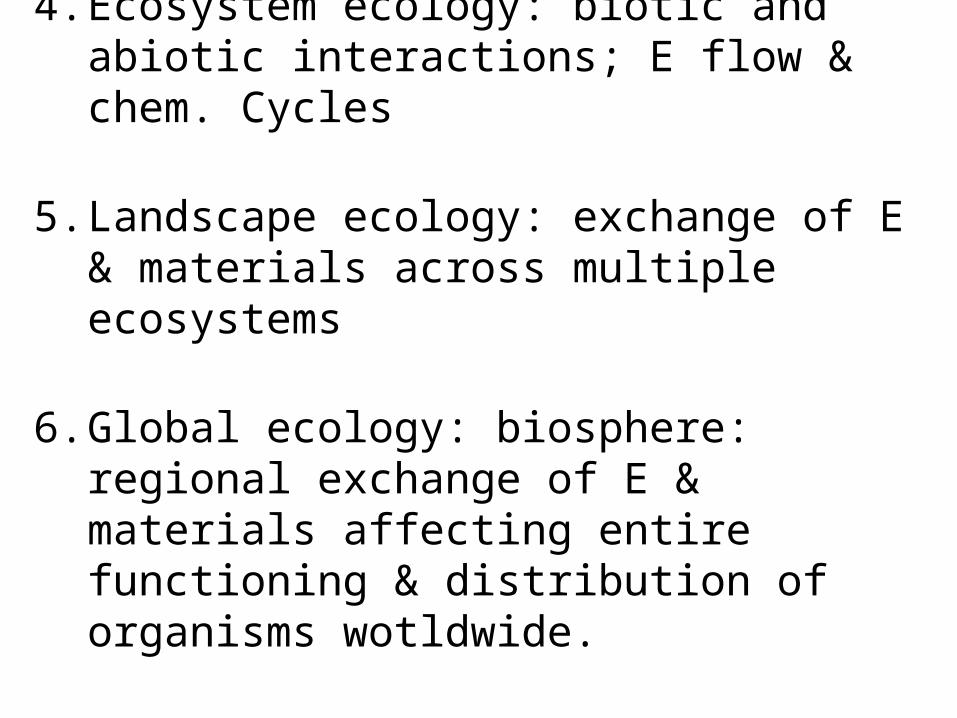
4. Ecosystem ecology: biotic and abiotic interactions; E flow & chem. Cycles
5. Landscape ecology: exchange of E & materials across multiple ecosystems
6. Global ecology: biosphere: regional exchange of E & materials affecting entire functioning & distribution of organisms wotldwide.

Ecology & evolution: changes in environment impacting populations’ alleles over time.
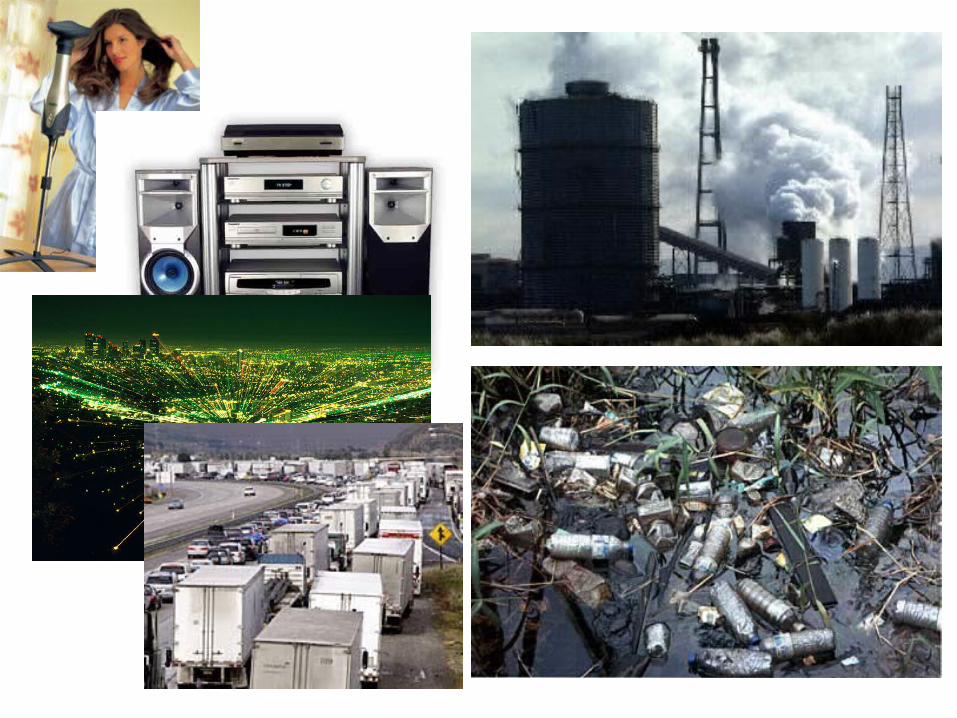
Ecology & environmental issues
Complexity of Nature: Why are some species present in an area?Dispersal difficulties (accessibility?)Behaviour limits distribution (habitat preference)?Biotic factors: competition/parasitism/predation/etcAbiotic factors:
Chem: H2O, O2, pH, salinity, nutrients
Phys: Macro & micro climate: Temp, light, fire, soil composition, moisture
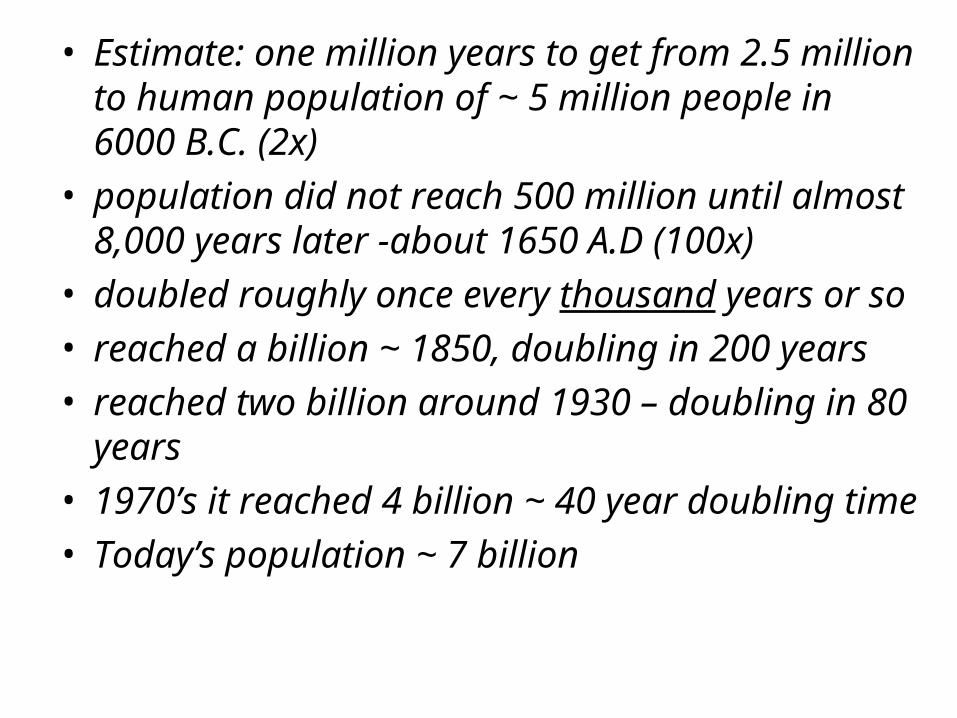
• Estimate: one million years to get from 2.5 million to human population of ~ 5 million people in 6000 B.C. (2x)
• population did not reach 500 million until almost 8,000 years later -about 1650 A.D (100x)
• doubled roughly once every thousand years or so• reached a billion ~ 1850, doubling in 200 years• reached two billion around 1930 – doubling in 80
years• 1970’s it reached 4 billion ~ 40 year doubling time• Today’s population ~ 7 billion
What factors have allowed human population
to increase so rapidly?
• Population size
• Population density
• Patterns of dispersion
• Demographics
• Population growth
• Limits on population growth
Ecologists study population trends rather than individual organisms.
Properties of populations include
• Population density– # individuals of a species per unit
at a given time
• Population dispersion (spacing)– How are individuals distributed in a habitat?
– Why would this be important to know if you were studying a population?
– What does a dispersion pattern tell you?
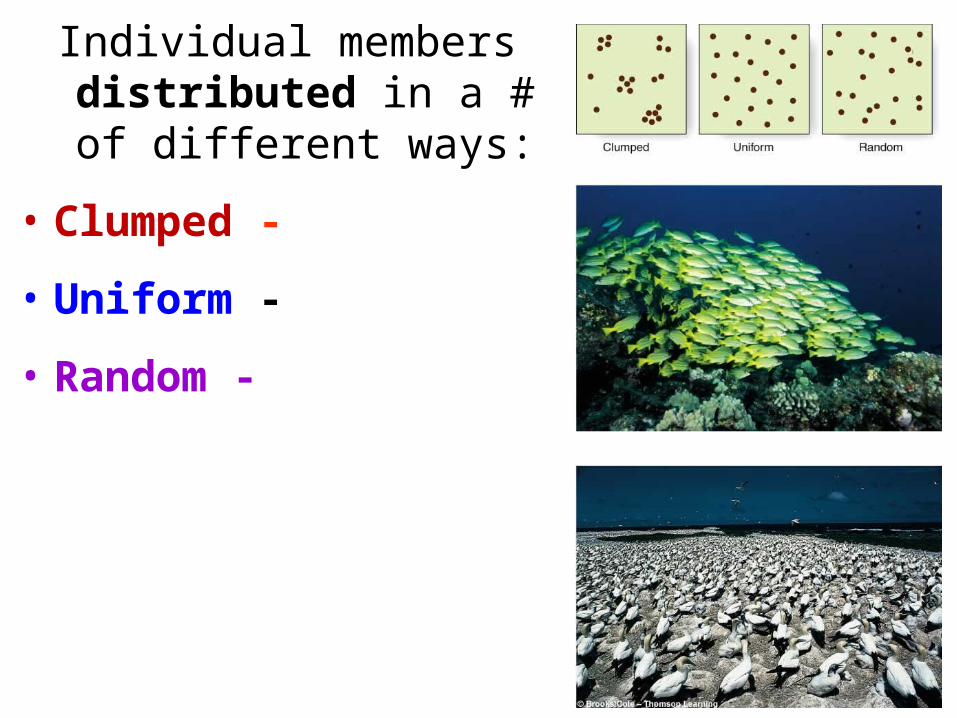
Individual members distributed in a # of
different ways:
• Clumped -
• Uniform -
• Random -
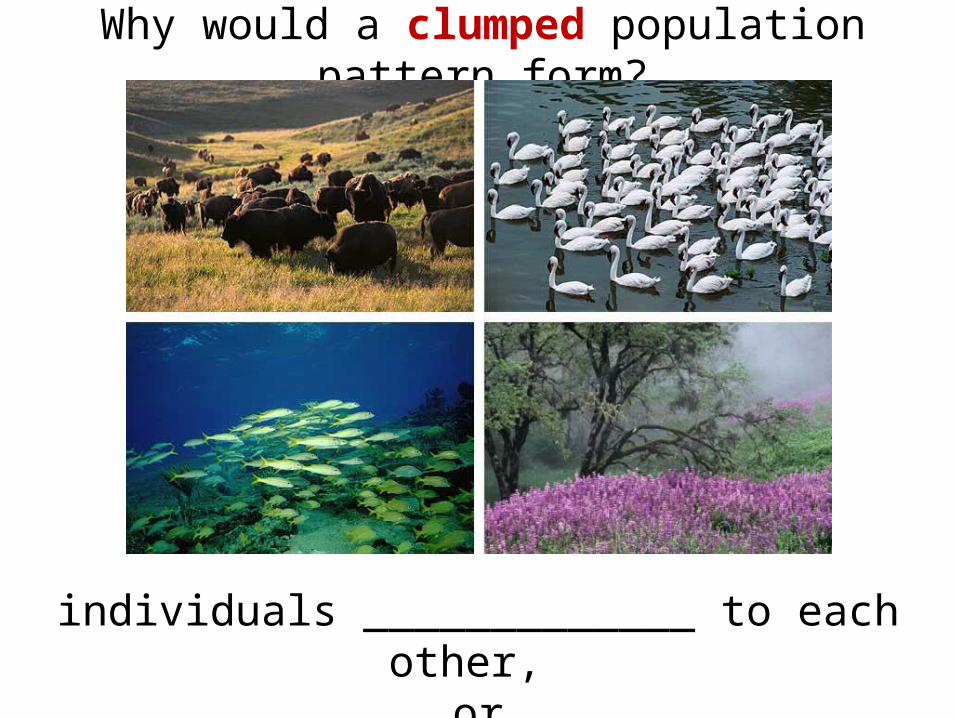
Why would a clumped population pattern form?
individuals _____________ to each other, or __________________________________.
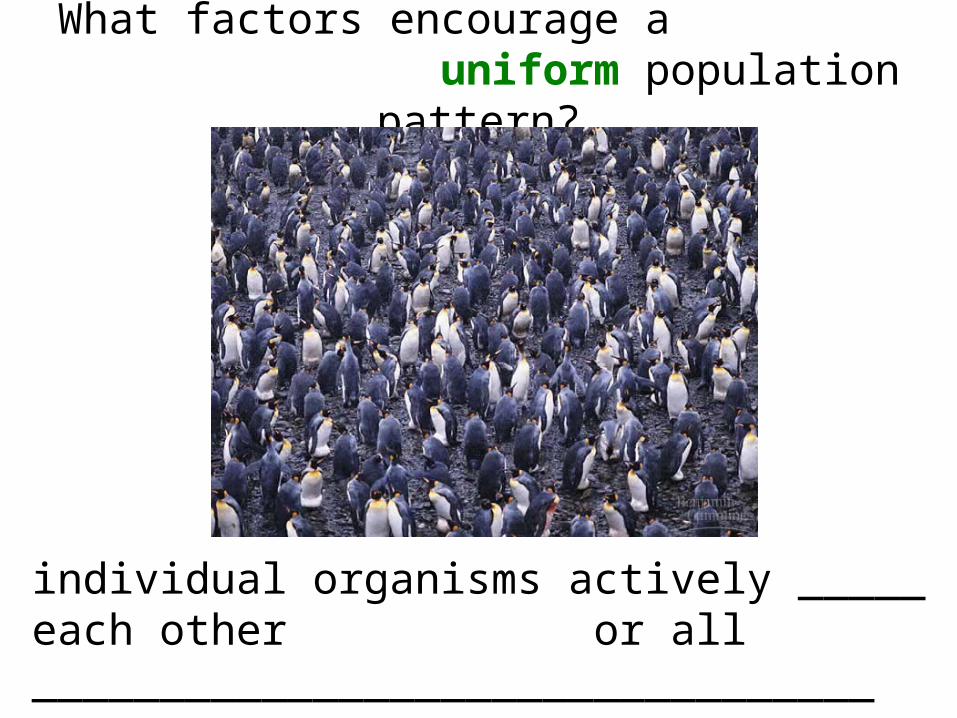
What factors encourage a uniform population pattern?
individual organisms actively _____ each other or all _________________________________
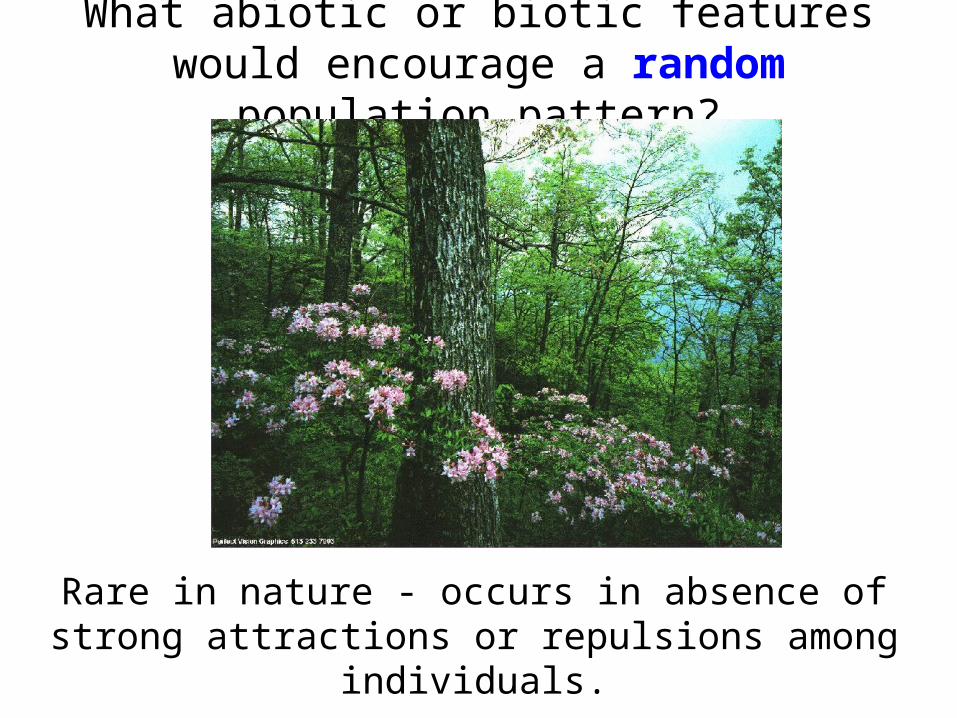
What abiotic or biotic features would encourage a random population pattern?
Rare in nature - occurs in absence of strong attractions or repulsions among individuals.
Dispersion patterns and density may change over time
Habitat changes: food, nutrients, water, sunlight (plants)
Age / size / developmental stages change:
• Four factors that produce changes in population size
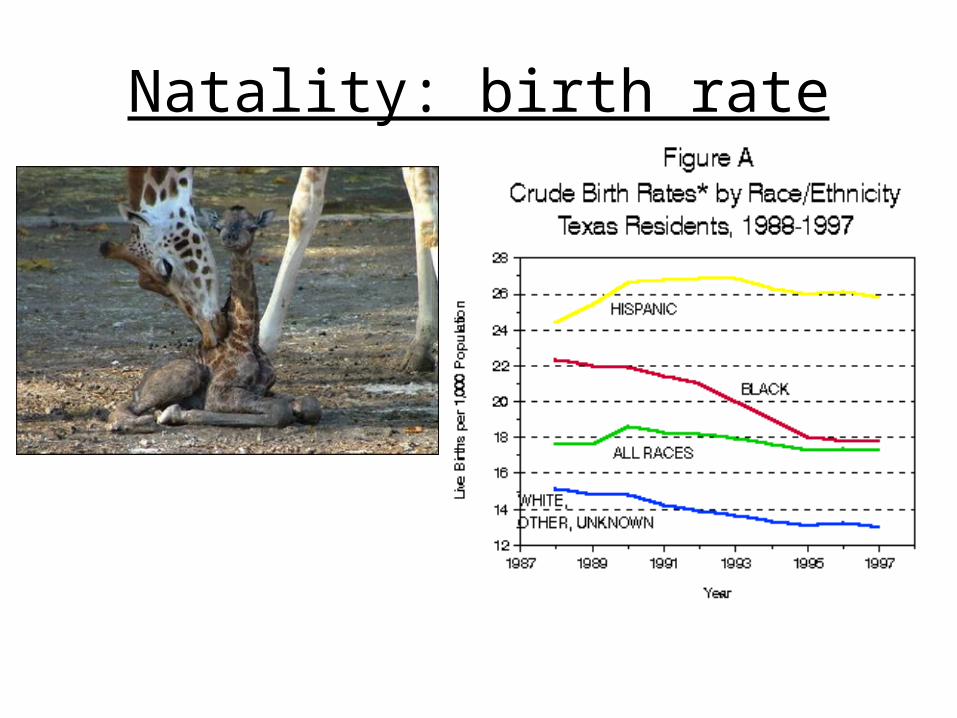
Natality: birth rate
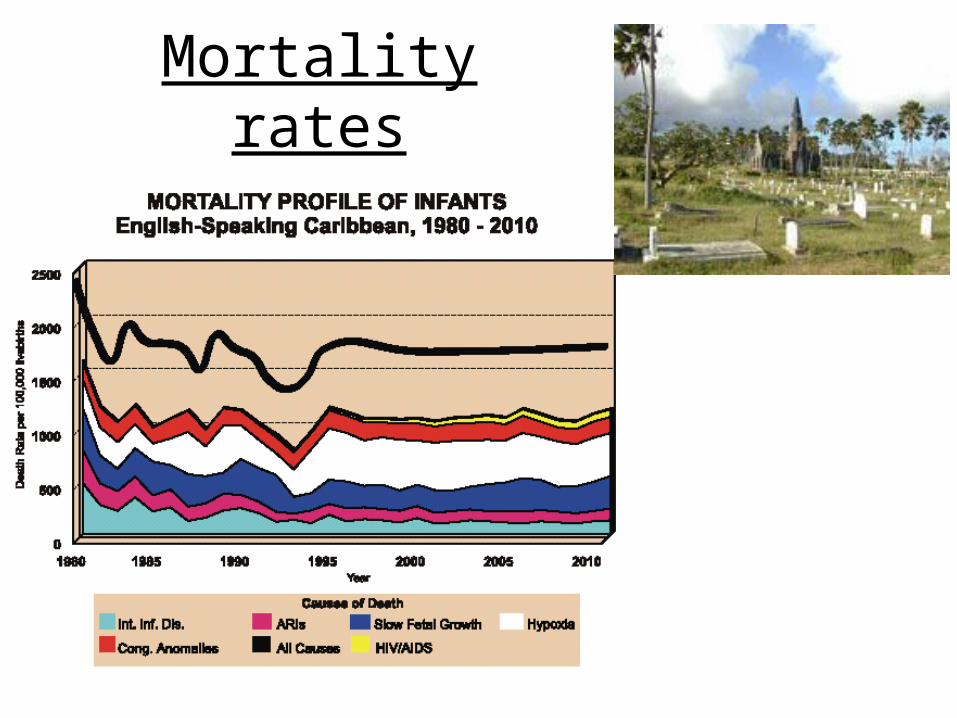
Mortality rates
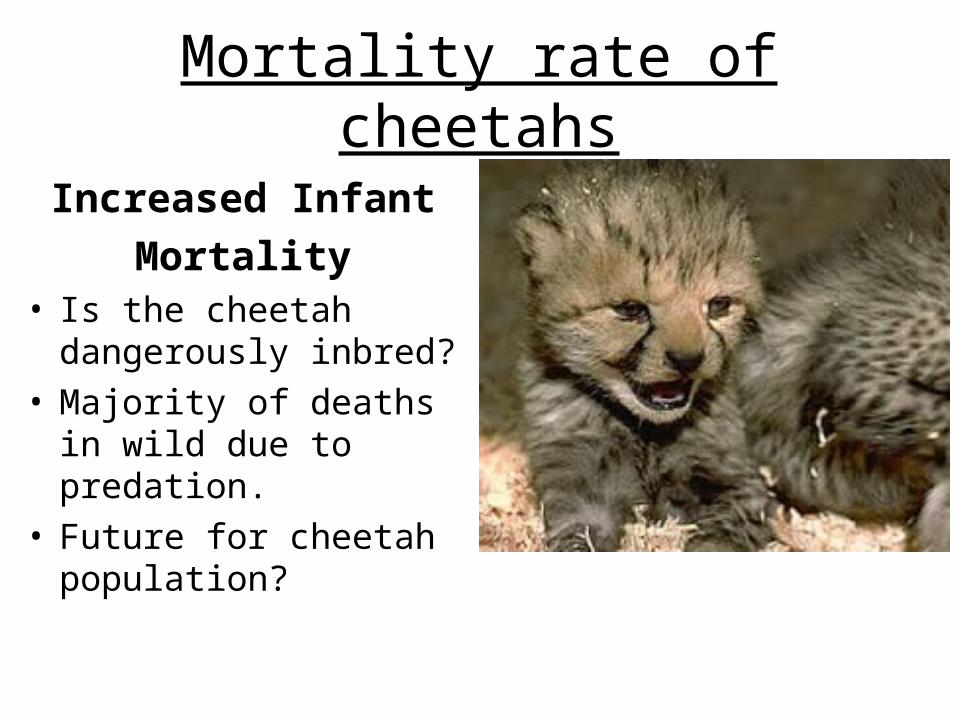
Mortality rate of cheetahs
Increased Infant
Mortality• Is the cheetah
dangerously inbred?• Majority of deaths in
wild due to predation.• Future for cheetah
population?
How a population changes:
in # of individuals
in a certain period of time
N =
r =
How a population changes:
in # individuals / time
N = # individuals r =
* Per 1,000 individuals
Growth rate =
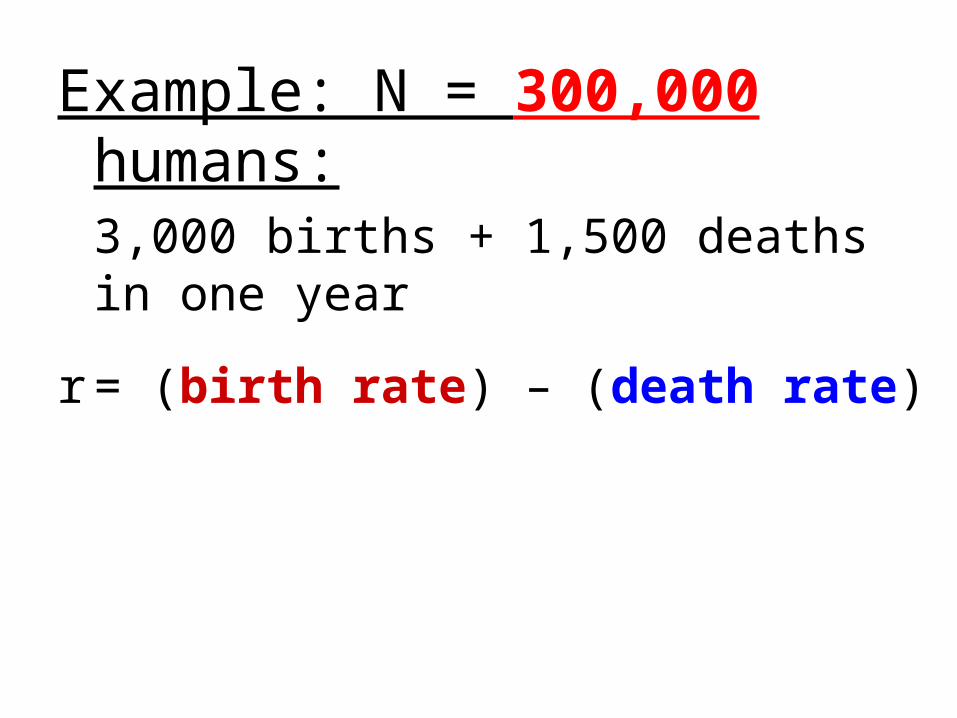
Example: N = 300,000 humans:3,000 births + 1,500 deaths in one year
r = (birth rate) – (death rate)
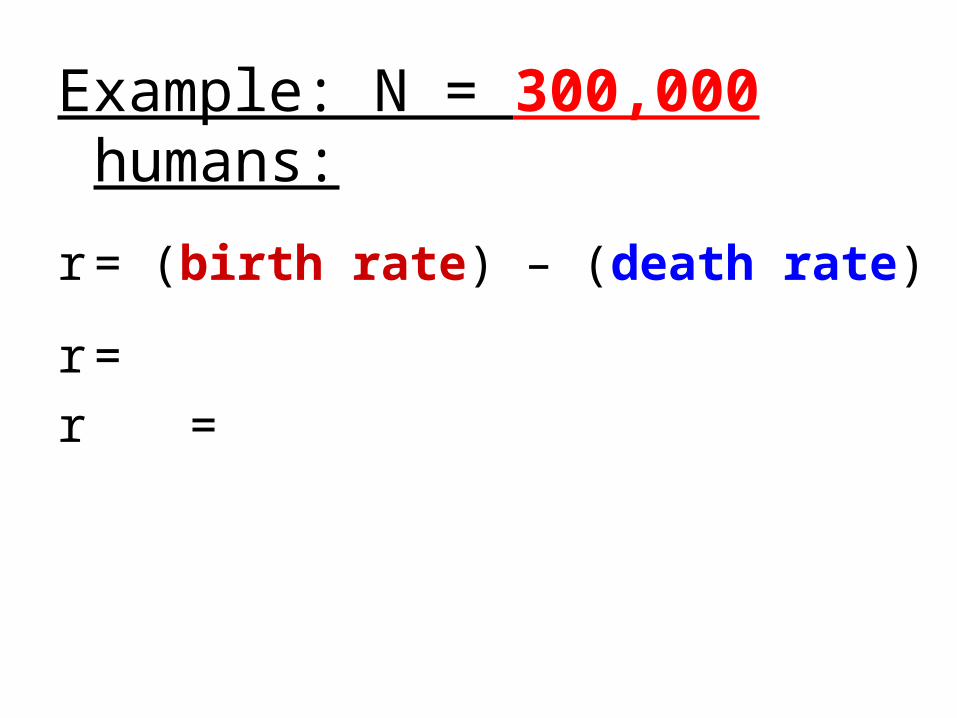
Example: N = 300,000 humans:
r = (birth rate) – (death rate)
r =
r =
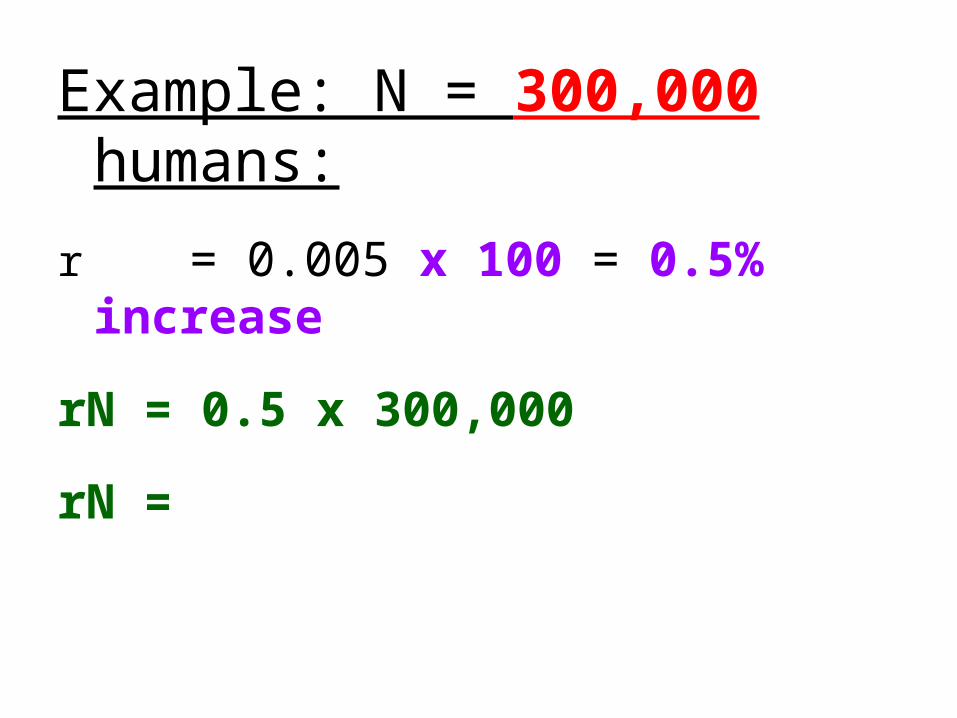
Example: N = 300,000 humans:
r = 0.005 x 100 = 0.5% increase
rN = 0.5 x 300,000
rN =
If r is positive, increase in pop.
If r is negative, pop. is decreasing
If r = 0, population is stable
Are there other factors besides birth and death
and
size of a population
that can change a population?
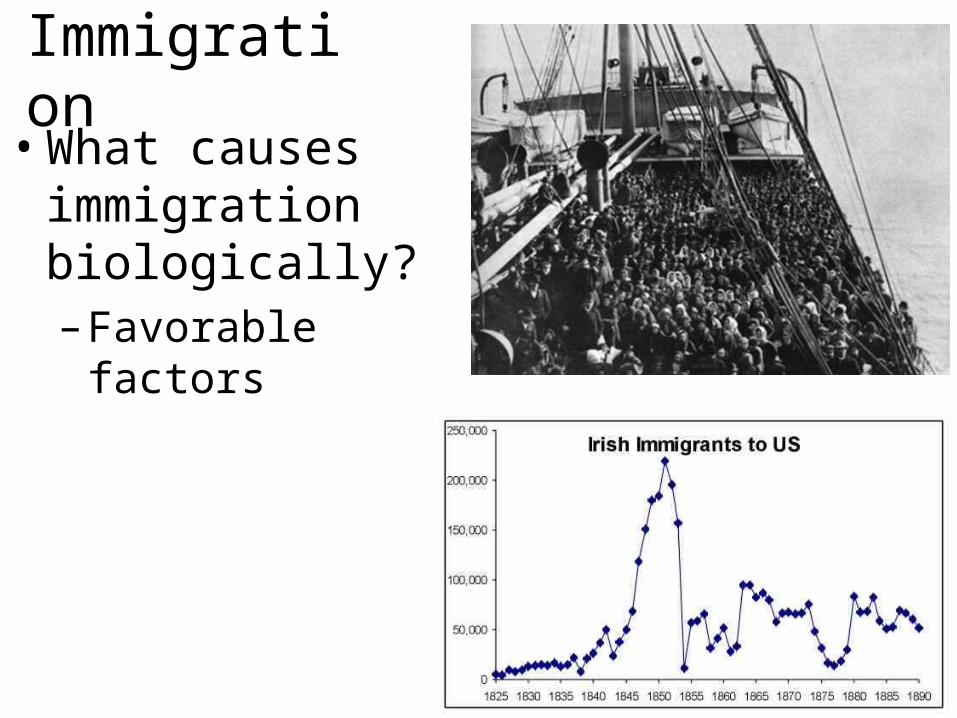
Immigration• What causes
immigration biologically?– Favorable factors
Factors encouraging immigration:New environment made available
–Natural disasters large and small–Competitive or predatory species goes
extinct / moves away–Climate change or new resources–Hitch-hiking (“alien” species)
Less competition in new area
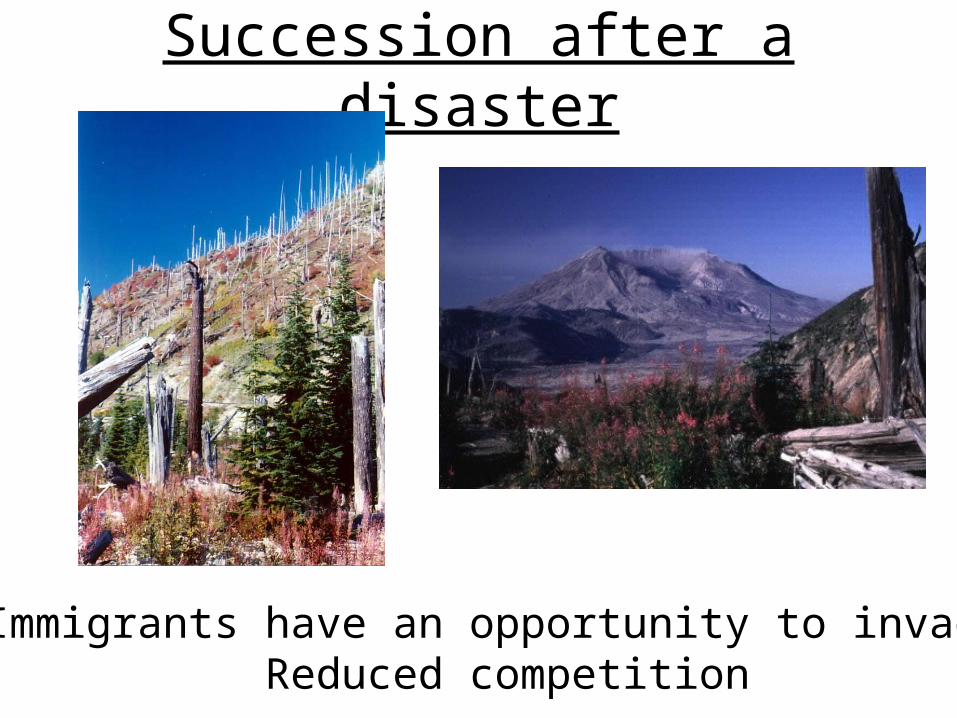
Succession after a disaster
Immigrants have an opportunity to invade:Reduced competition
Factors that encourage successful immigration:
Distribution methods:
• dispersal is at or near ground level vs. aerial dispersal
• dispersers actively engage in searching, or not
• dispersers able to orient toward preferred habitat from some distance, or not
Wind dispersing Golden Orb spiders
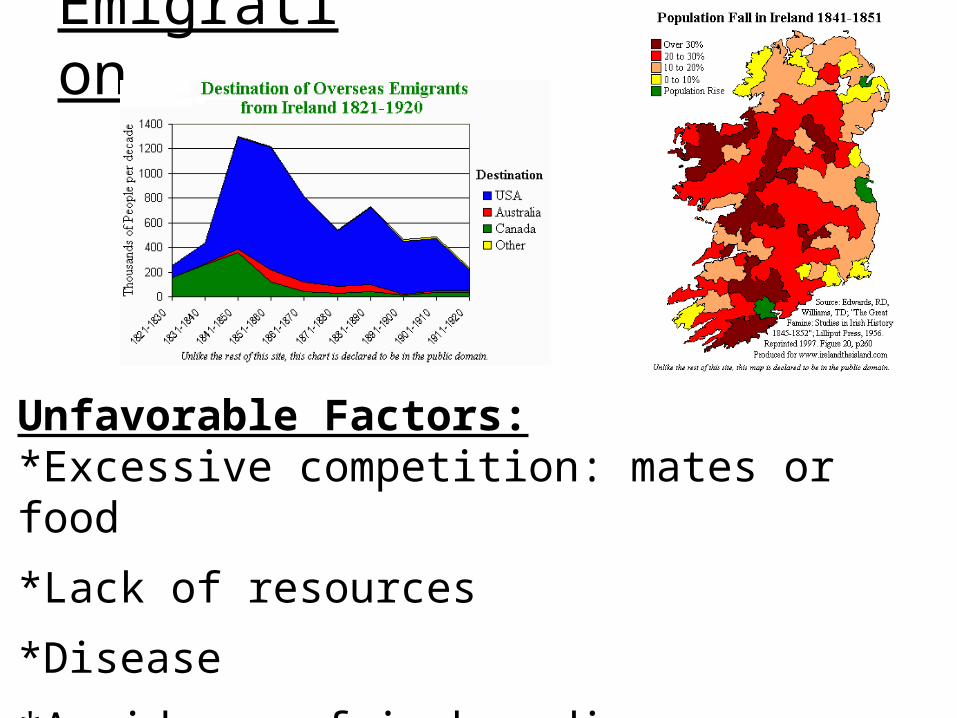
Emigration
Unfavorable Factors:*Excessive competition: mates or food
*Lack of resources
*Disease
*Avoidance of in-breeding
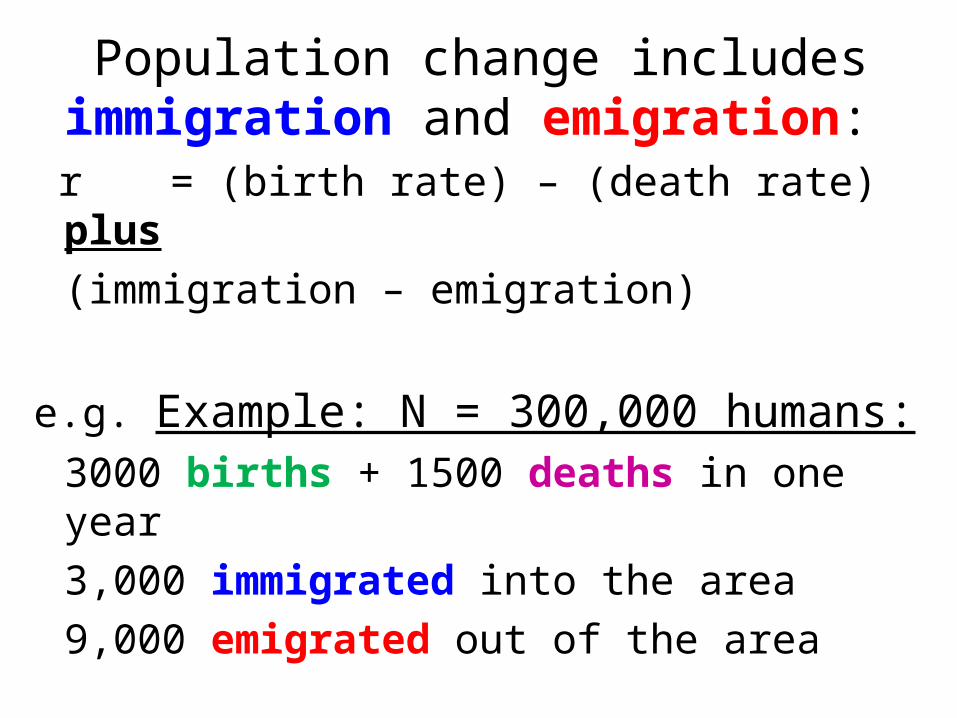
Population change includes immigration and emigration:
r = (birth rate) – (death rate) plus
(immigration – emigration)
e.g. Example: N = 300,000 humans:3000 births + 1500 deaths in one year
3,000 immigrated into the area
9,000 emigrated out of the area
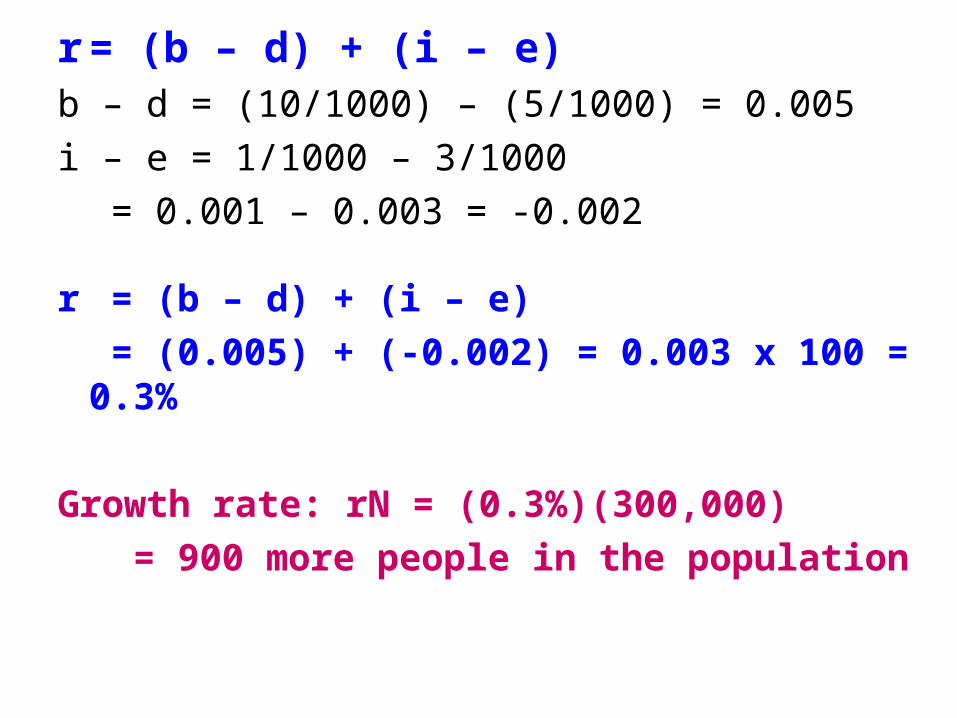
r = (b – d) + (i – e)b – d = (10/1000) – (5/1000) = 0.005
i – e = 1/1000 – 3/1000
= 0.001 – 0.003 = -0.002
r = (b – d) + (i – e)
= (0.005) + (-0.002) = 0.003 x 100 = 0.3%
Growth rate: rN = (0.3%)(300,000)
= 900 more people in the population
Intrinsic rate of increase (rmax)
Maximum rate at which species or
population can increase under ideal
conditions
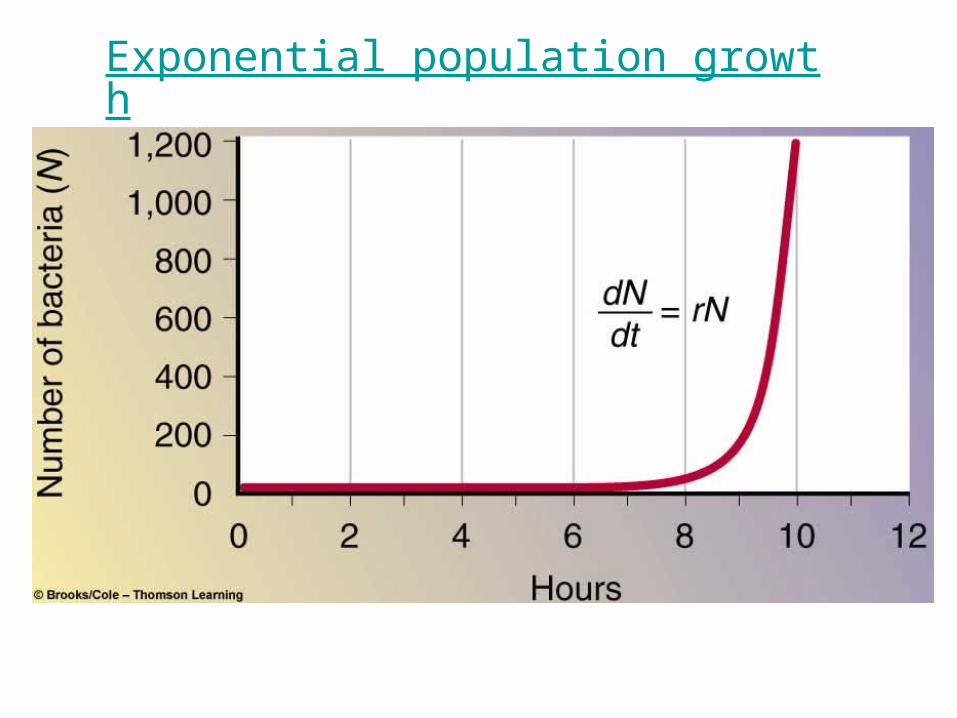
• Exponential population growth
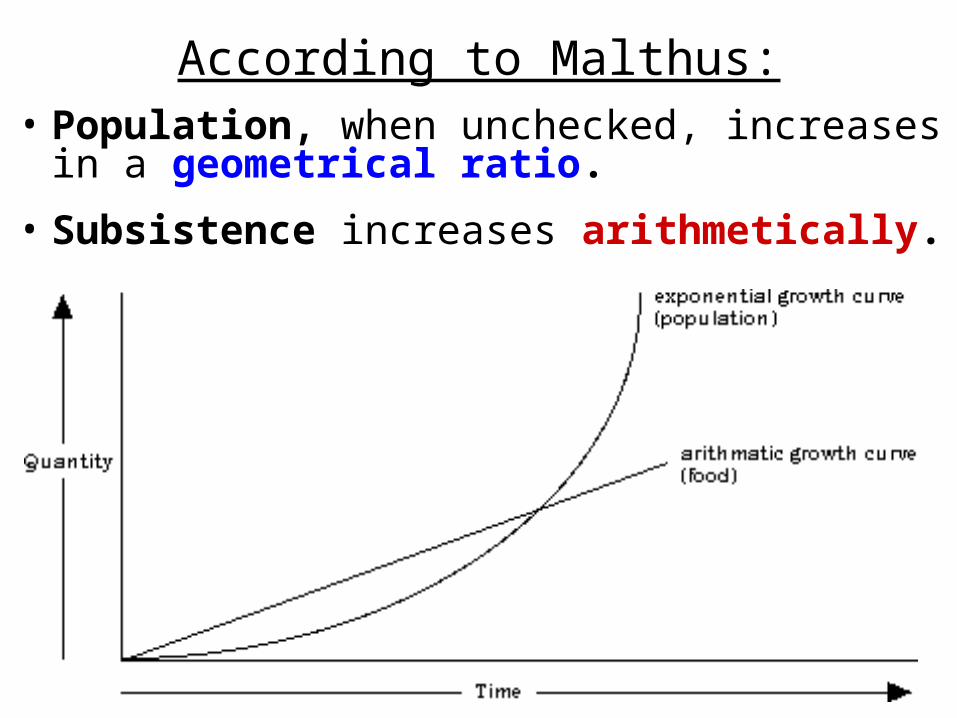
According to Malthus:• Population, when unchecked, increases in a
geometrical ratio.
• Subsistence increases arithmetically.
Carrying capacity
–Carrying capacity (K) = largest population maintained without degrading environment they live in
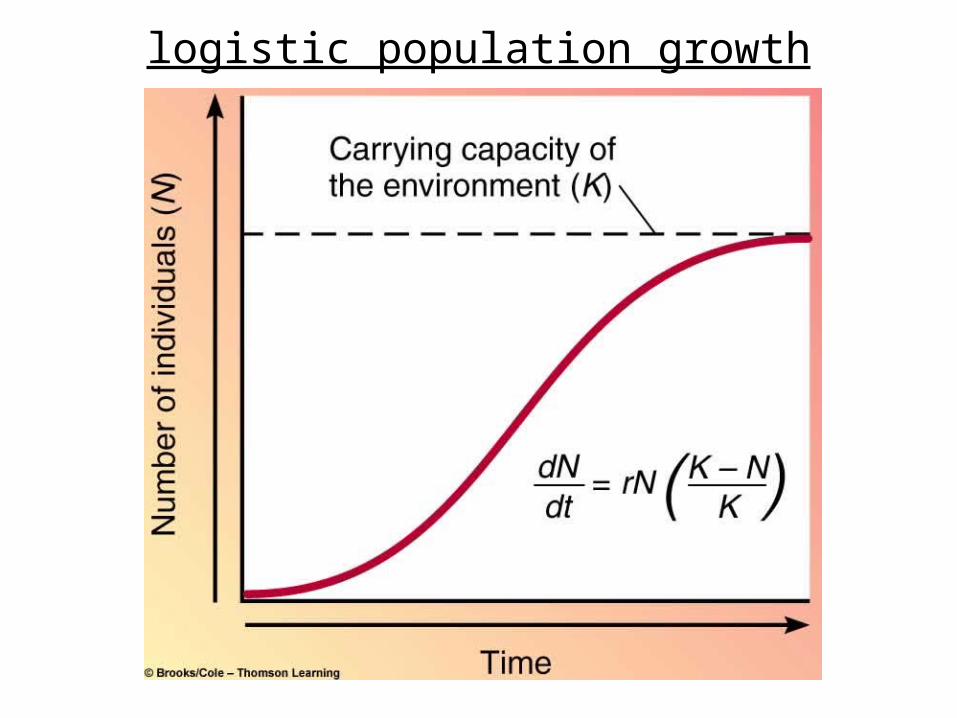
–Changes as environment changes• Logistic population curve
(S-shaped curve)
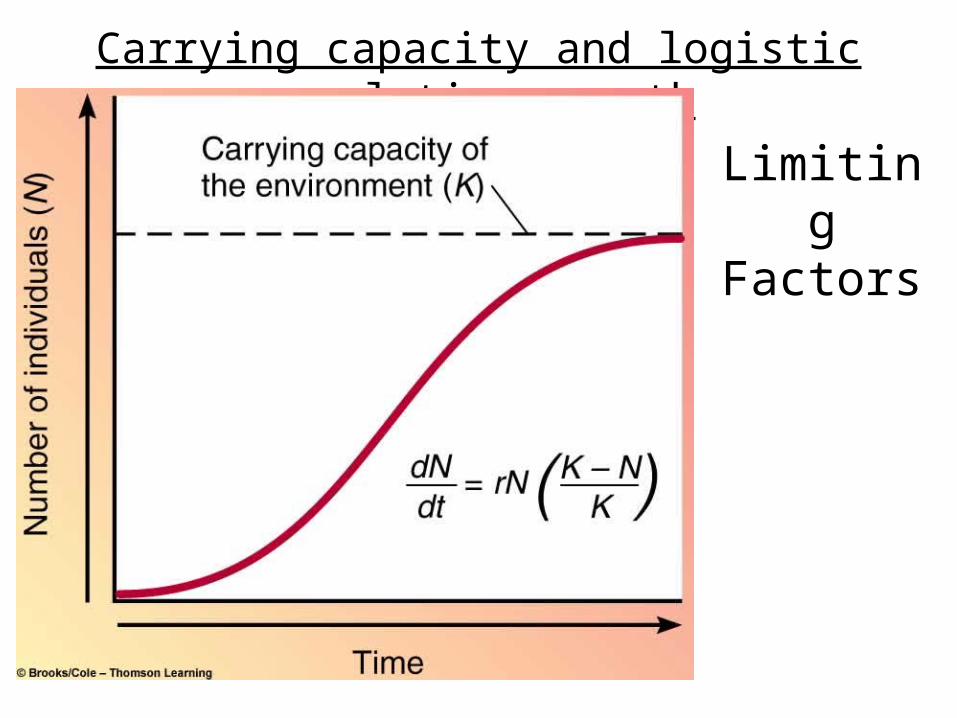
Carrying capacity and logistic population growth
Limiting Factors
Density-dependent factors
–Regulate population growth by affecting large proportion of population as population rises:

Density-dependent factors
–What do you think would impact a population as it got bigger?
• Predation• Disease• Competition• Toxic wastes
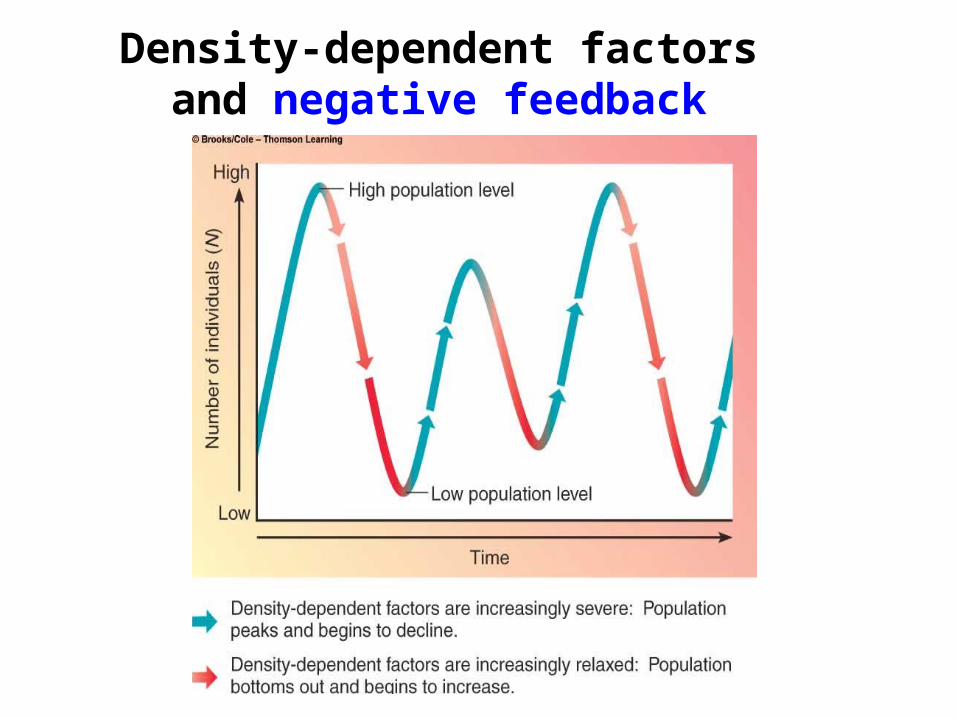
Density-dependent factors and negative feedback
• Density-independent factors– Limit population growth but are not
influenced by changes in population density: usually ABIOTIC
– Examples include natural disasters:• Hurricanes• Blizzards• Forest fires• Mudslides• Volcanoes, tsunamis, and earthquakes
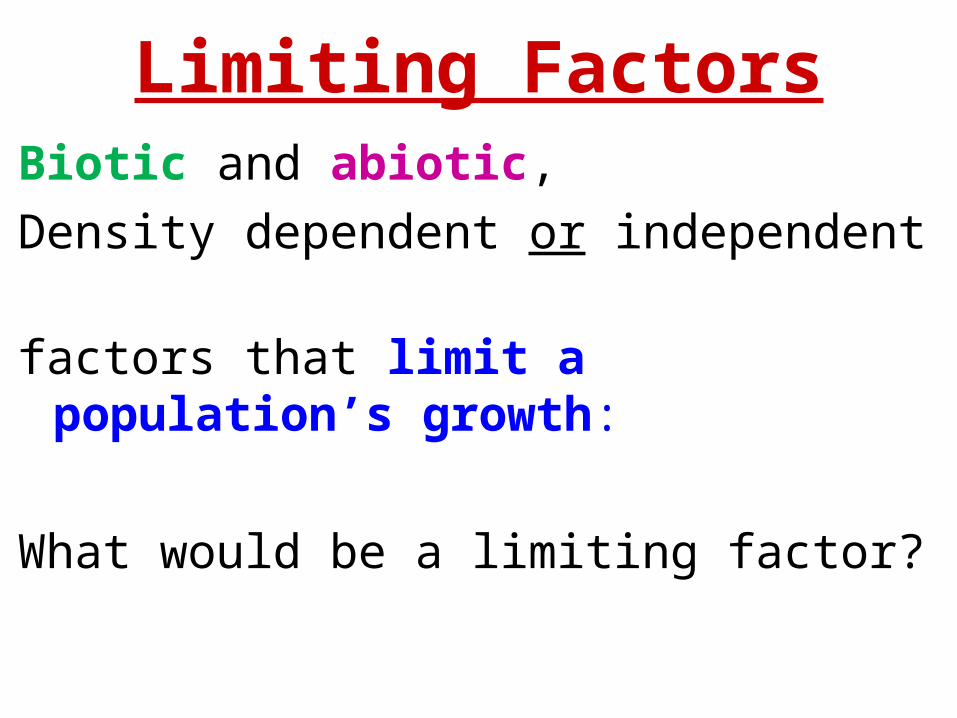
Limiting FactorsBiotic and abiotic,
Density dependent or independent
factors that limit a population’s growth:
What would be a limiting factor?
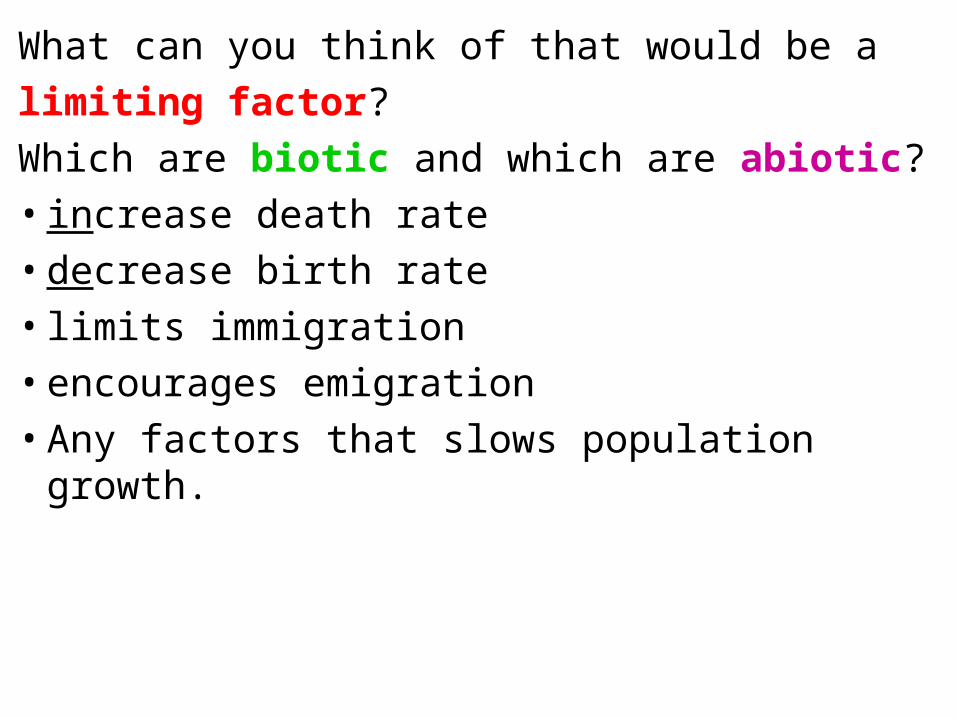
What can you think of that would be a
limiting factor?
Which are biotic and which are abiotic?• increase death rate• decrease birth rate• limits immigration• encourages emigration• Any factors that slows population growth.
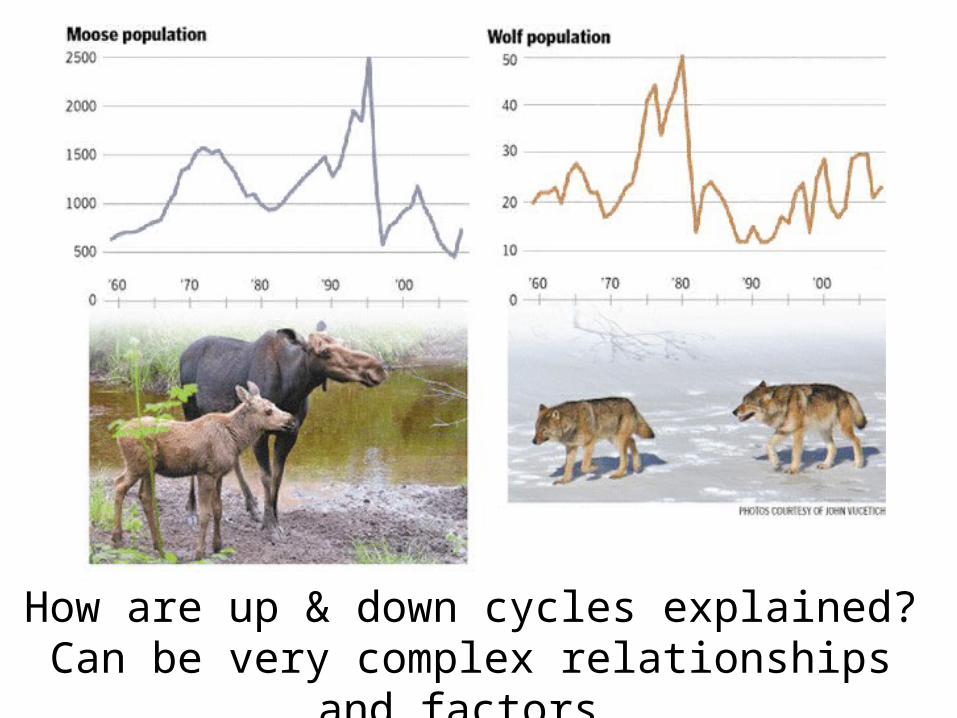
How are up & down cycles explained?Can be very complex relationships and factors.
Biology 213 Chapter 53Introduction to Ecology:
Population Ecology Part 2
You will be able to…• Explain what factors change populations
• Calculate population rate changes
• Compare and contrast density-dependent to density-independent factors
• Analyze human population patterns and make predictions about future trends
• Semelparous reproduction–Expend their energy in a
• Iteroparous reproduction–Exhibit ________________________ throughout their lifetimes
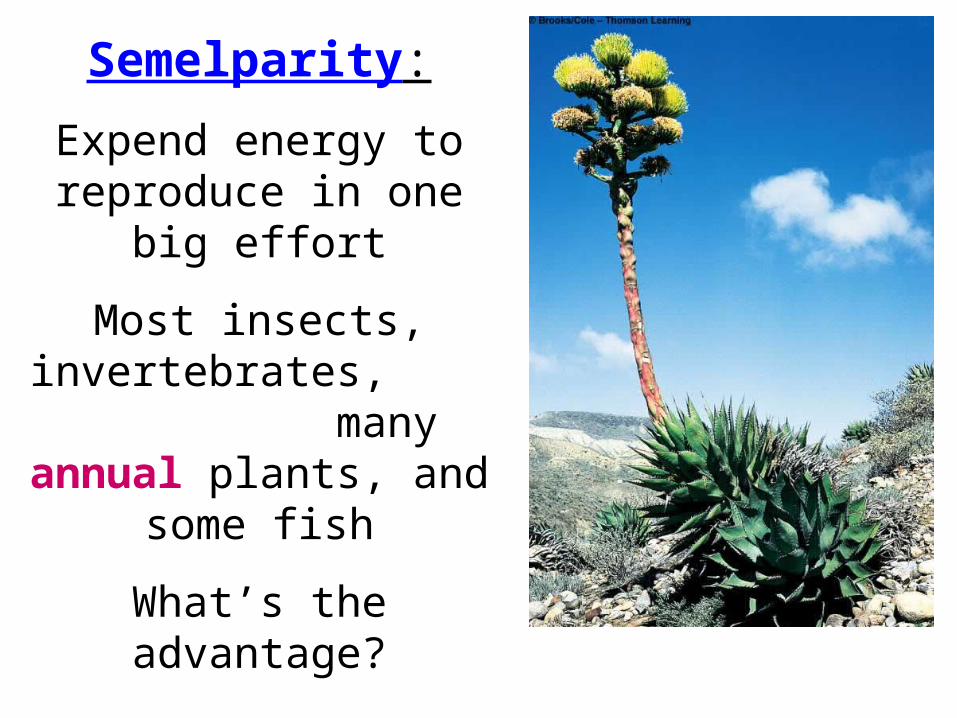
Semelparity:
Expend energy to reproduce in one big
effort
Most insects, invertebrates, many annual plants,
and some fish
What’s the advantage?
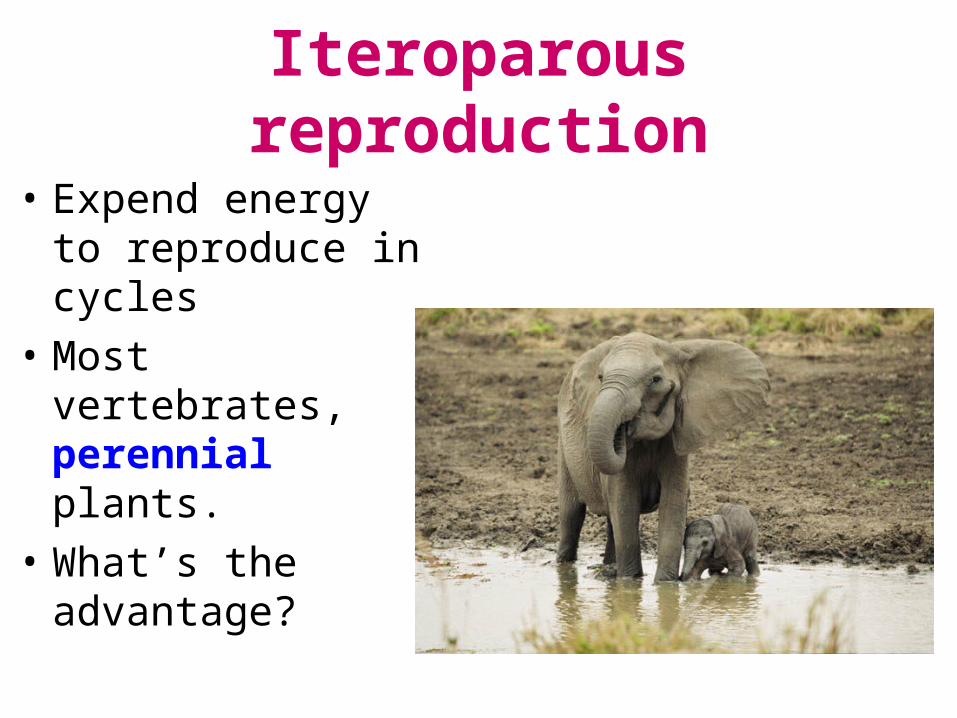
Iteroparous reproduction
• Expend energy to reproduce in cycles
• Most vertebrates, perennial plants.
• What’s the advantage?
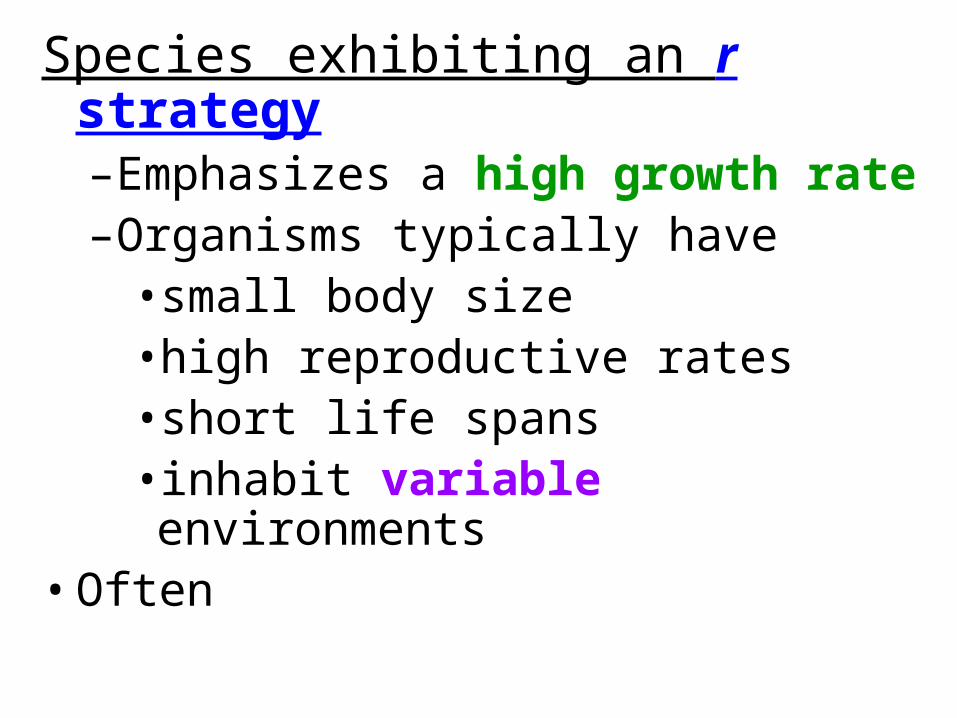
Species exhibiting an r strategy–Emphasizes a high growth rate–Organisms typically have
• small body size• high reproductive rates• short life spans• inhabit variable environments
• Often
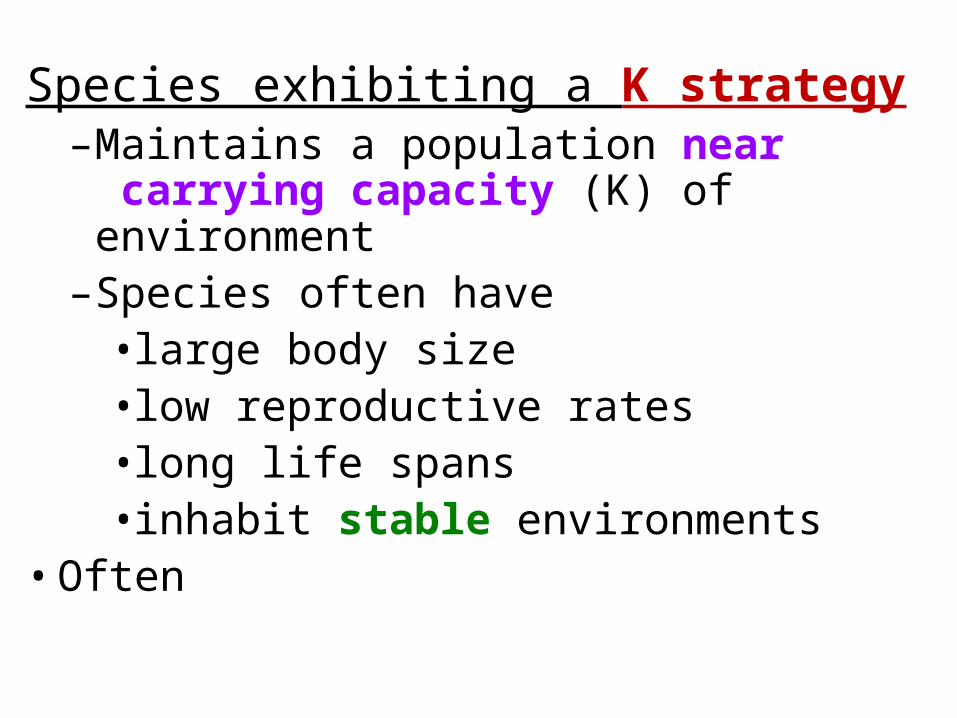
Species exhibiting a K strategy–Maintains a population near
carrying capacity (K) of environment–Species often have
• large body size• low reproductive rates• long life spans• inhabit stable environments
• Often
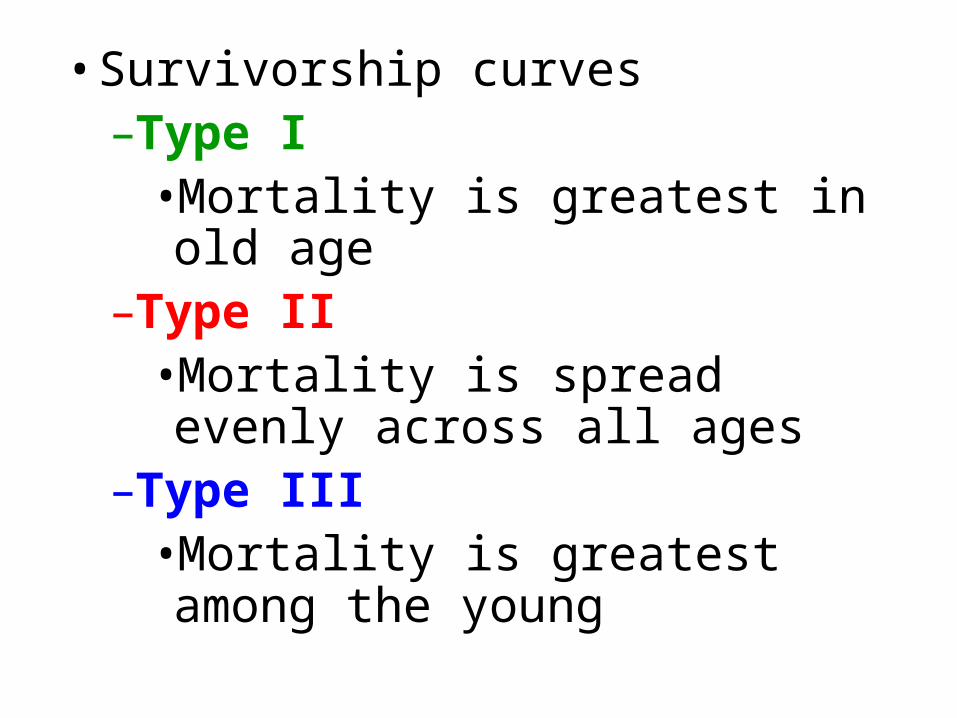
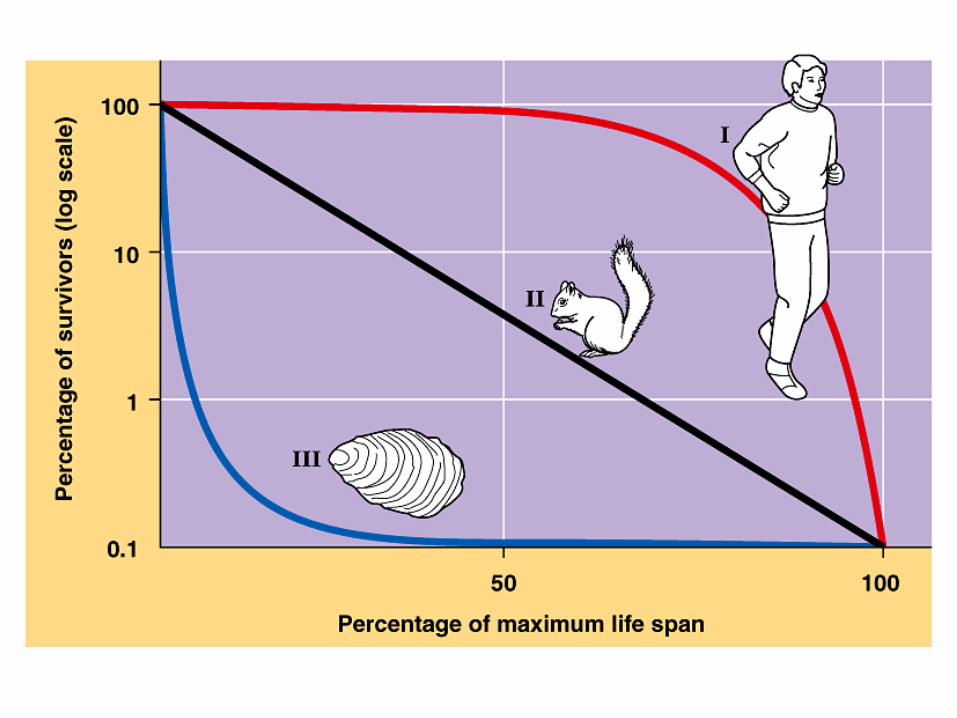
• Survivorship curves–Type I
•Mortality is greatest in old age–Type II
•Mortality is spread evenly across all ages
–Type III•Mortality is greatest among the young

Survivorship curves
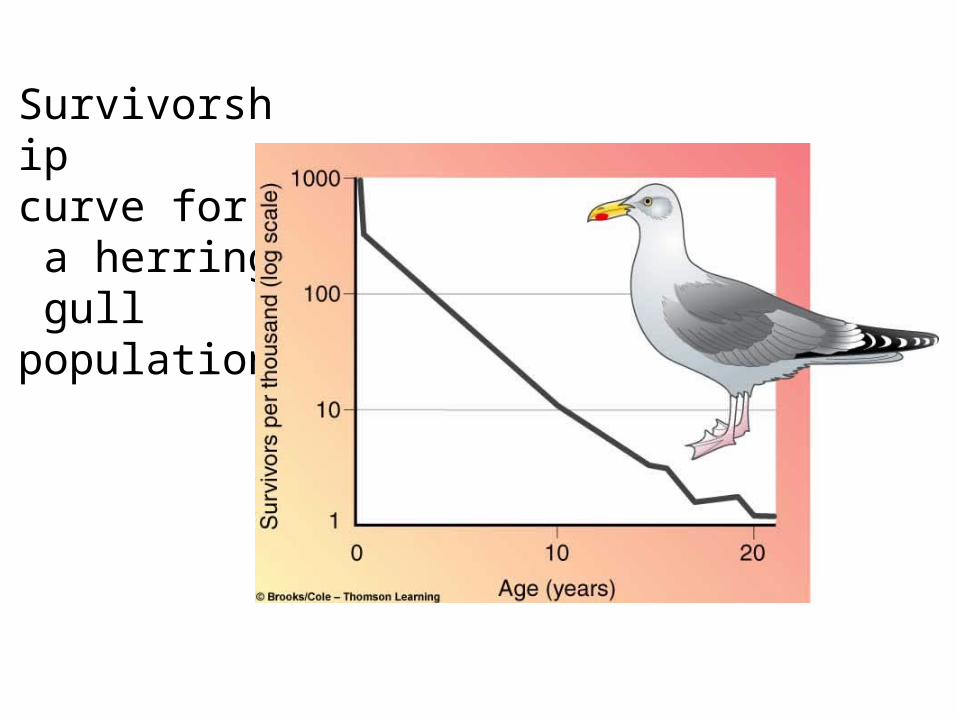
Survivorshipcurve for a herring gull population
Source habitats:–Preferred habitats–Local reproductive success is
> local mortality–Local individuals disperse from
source habitats to other regions
• Sink habitats–Lower-quality habitats–Individuals may suffer death or
poor reproductive success–What would make an organism
move then?
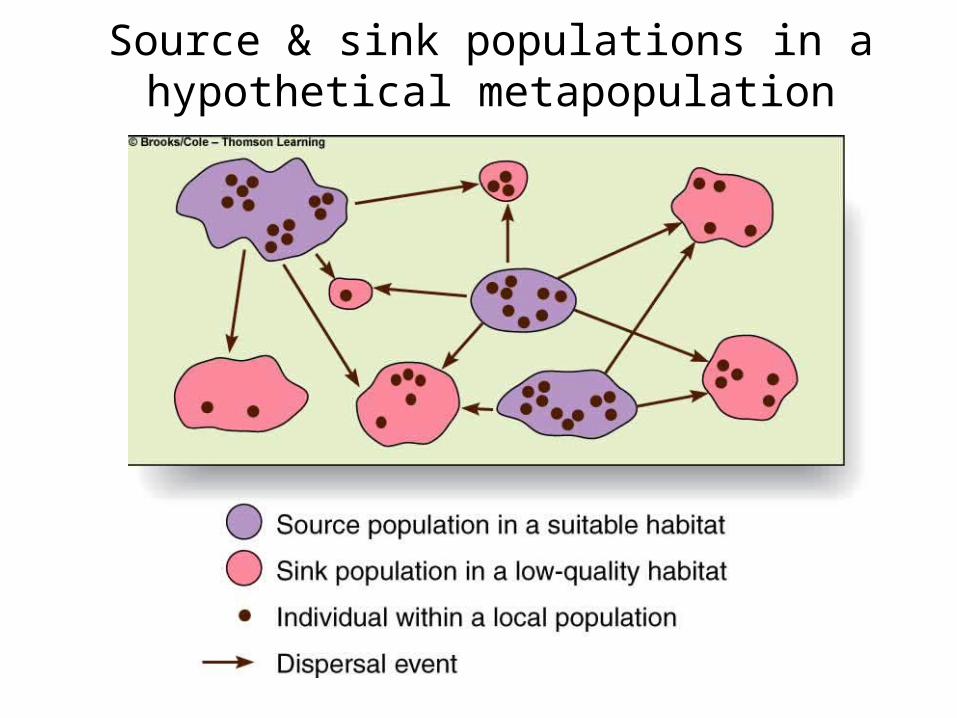
Source & sink populations in a hypothetical metapopulation
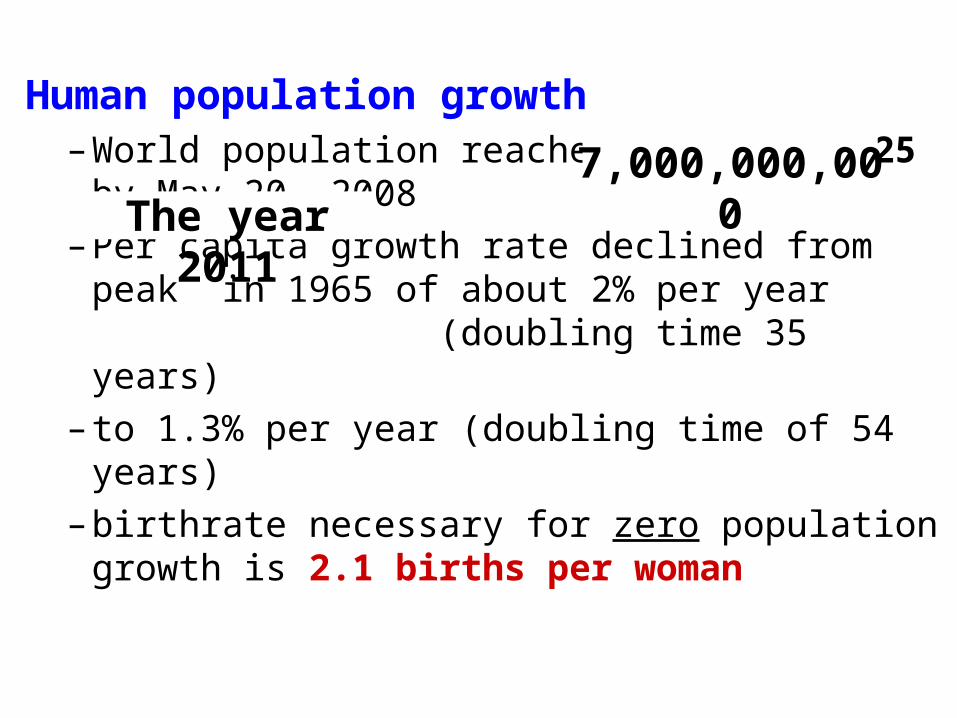
Human population growth– World population reaches 6,668,926,425 by
May 20, 2008
– Per capita growth rate declined from peak in 1965 of about 2% per year (doubling time 35 years)
– to 1.3% per year (doubling time of 54 years)
– birthrate necessary for zero population growth is 2.1 births per woman
7,000,000,000The year 2011
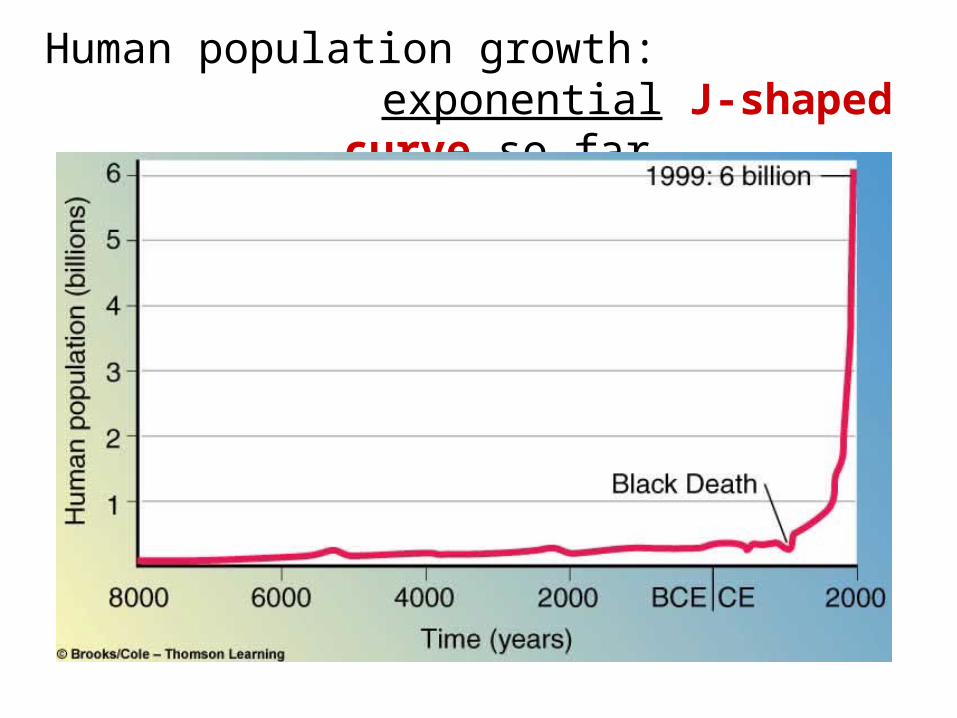
Human population growth: exponential J-shaped curve so far
logistic population growth
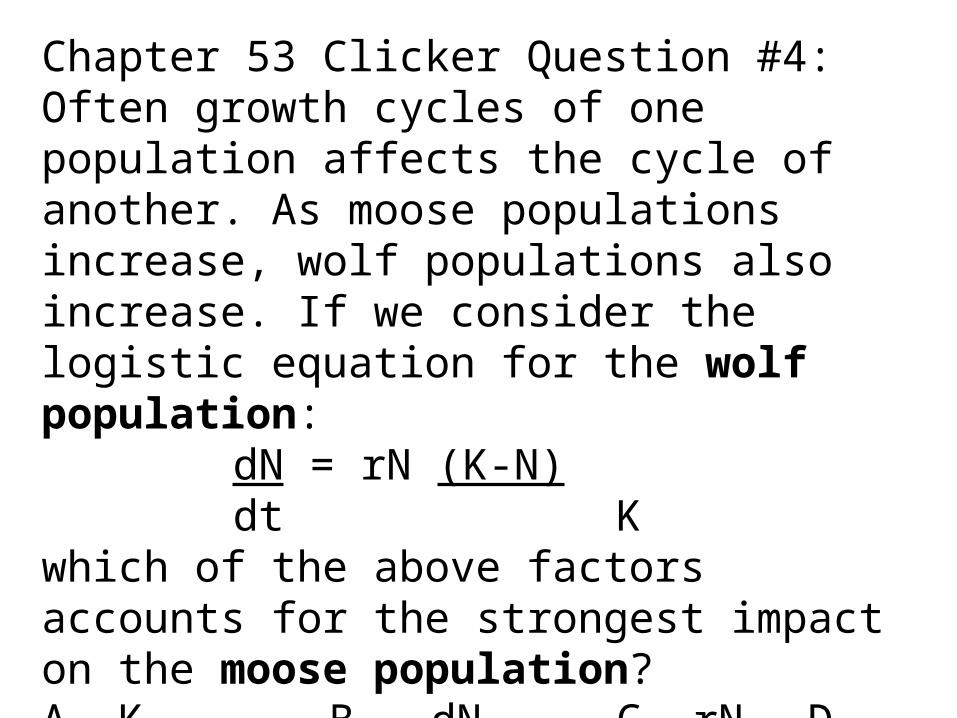
Chapter 53 Clicker Question #4:Often growth cycles of one population affects the cycle of another. As moose populations increase, wolf populations also increase. If we consider the logistic equation for the wolf population:
dN = rN (K-N)dt K
which of the above factors accounts for the strongest impact on the moose population? A. K B. dN C. rN D. dt
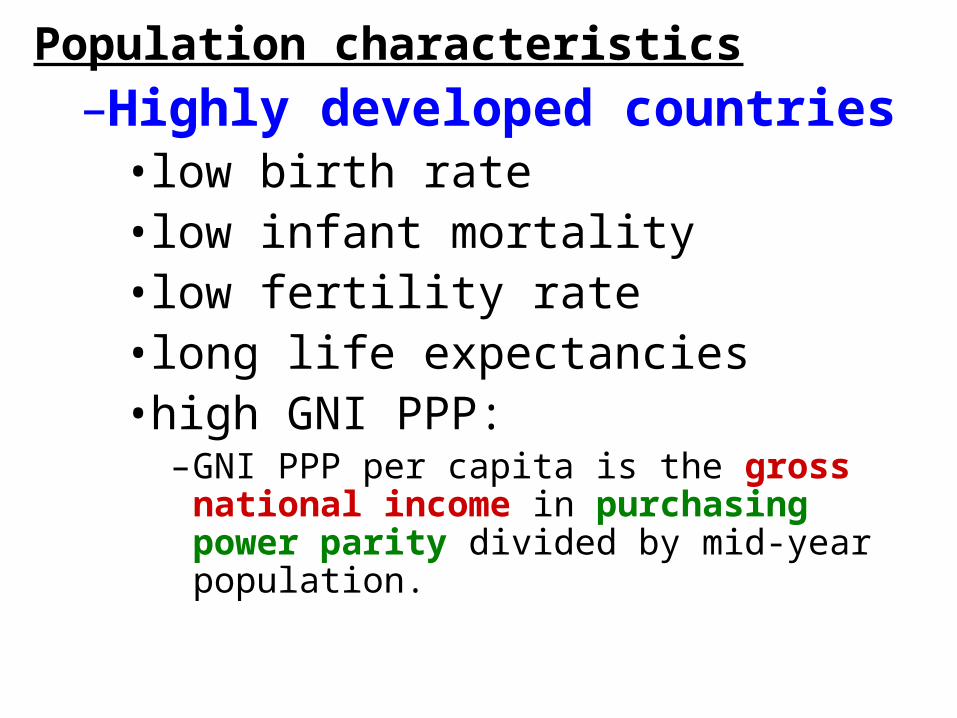
Population characteristics
–Highly developed countries• low birth rate• low infant mortality• low fertility rate• long life expectancies• high GNI PPP:
–GNI PPP per capita is the gross national income in purchasing power parity divided by mid-year population.
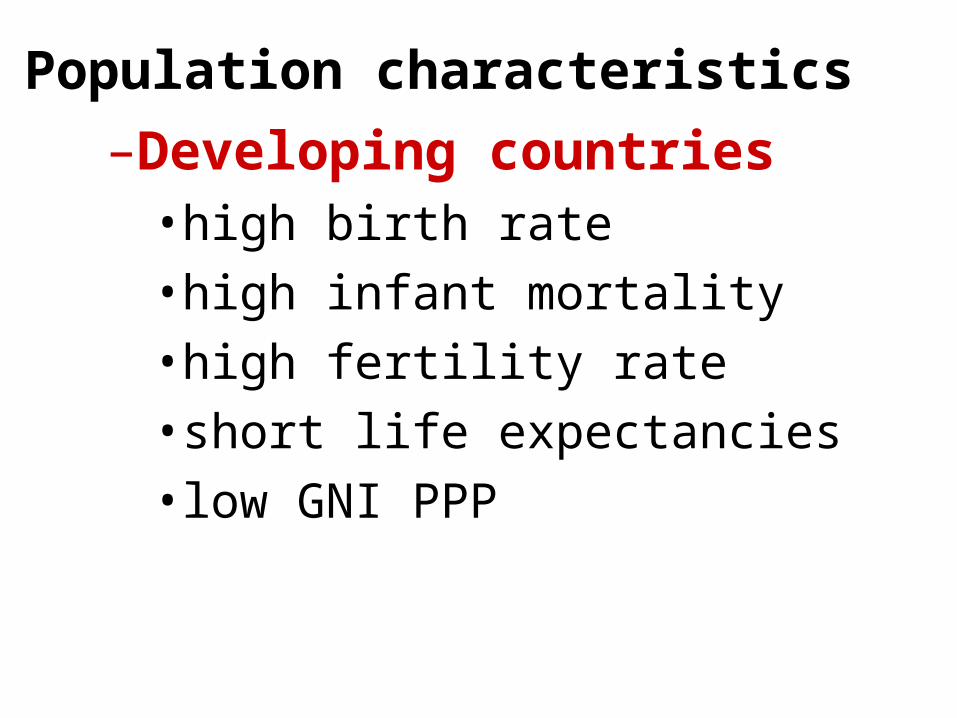
Population characteristics
–Developing countries• high birth rate
• high infant mortality
• high fertility rate
• short life expectancies
• low GNI PPP
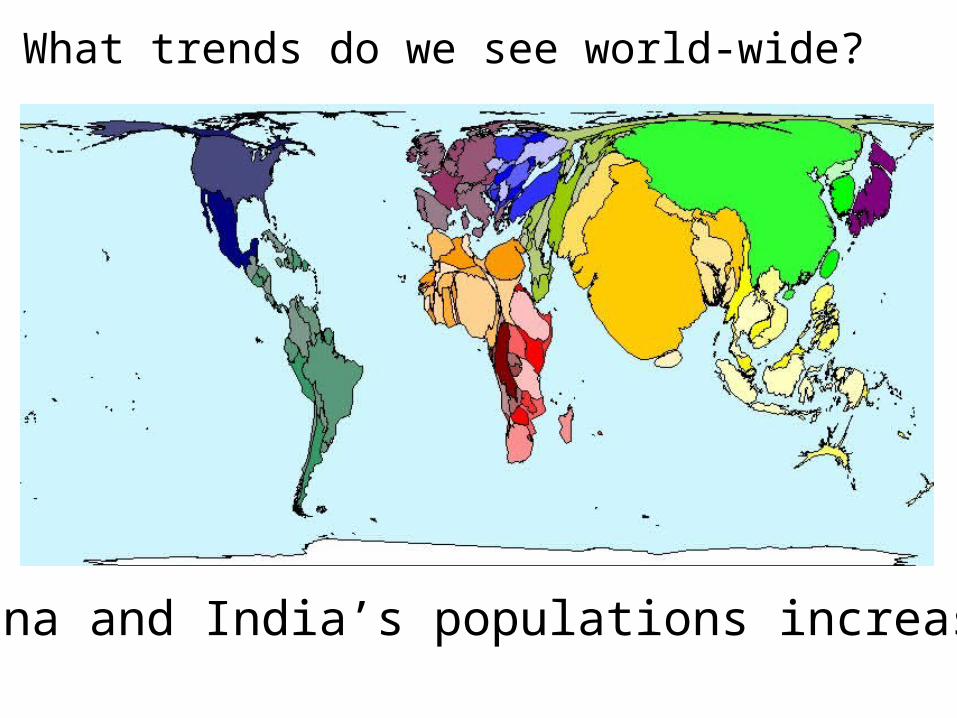
China and India’s populations increasing
What trends do we see world-wide?
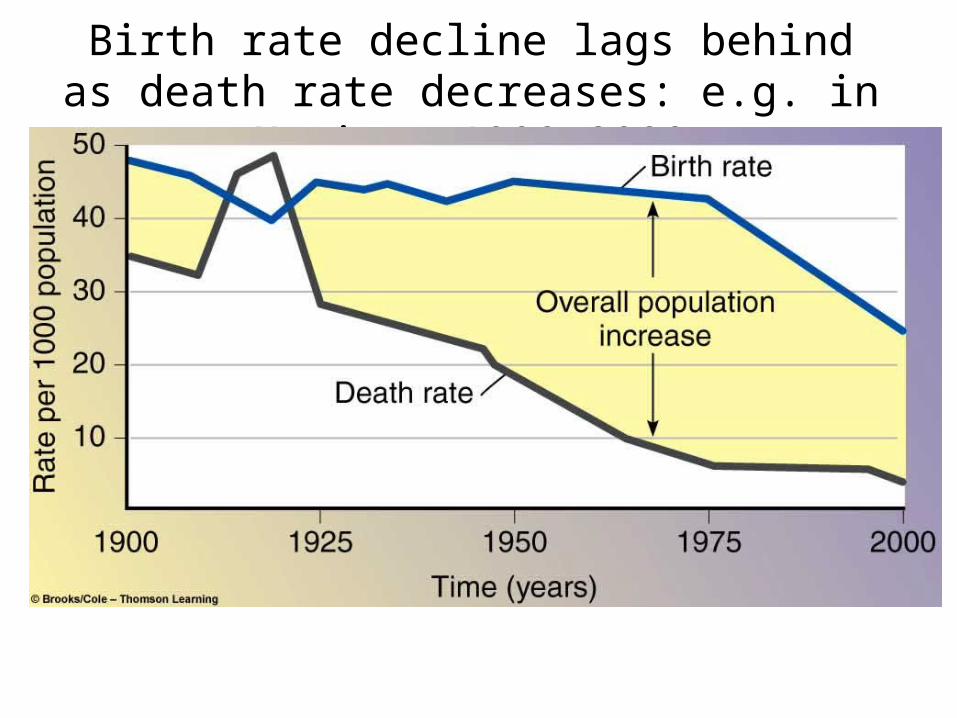
Birth rate decline lags behind as death rate decreases: e.g. in Mexico, 1900–2000
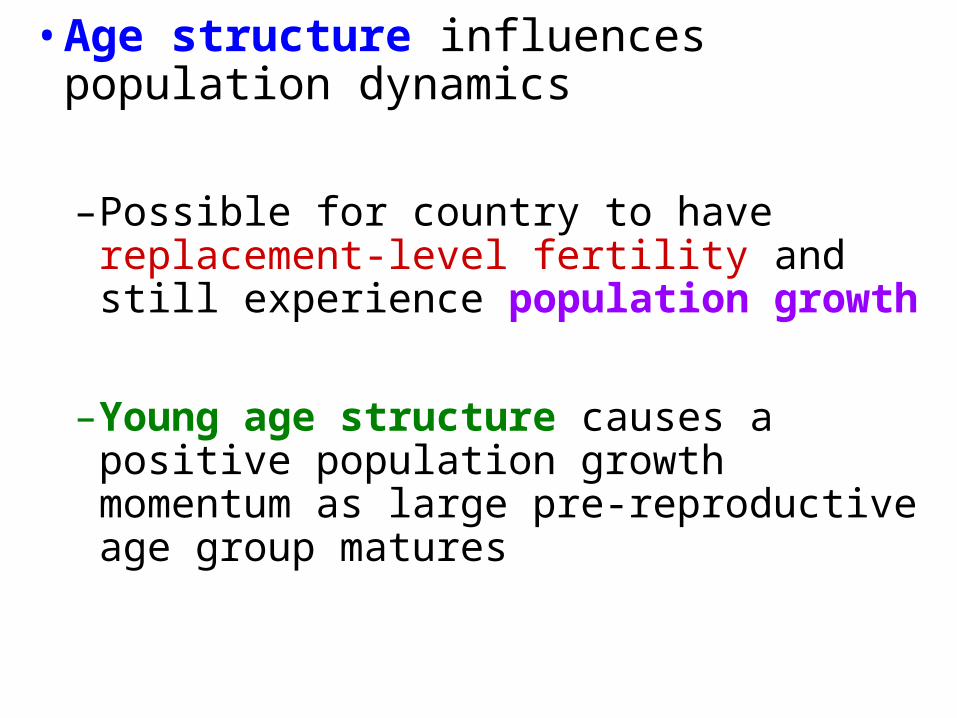
• Age structure influences population dynamics
–Possible for country to have replacement-level fertility and still experience population growth
–Young age structure causes a positive population growth momentum as large pre-reproductive age group matures
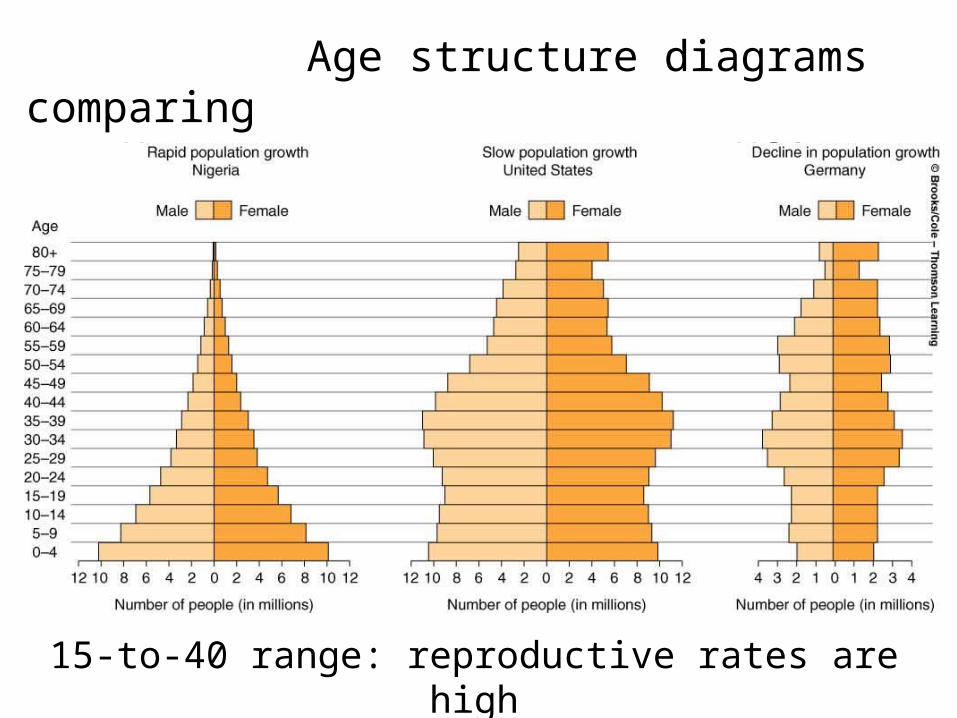
Age structure diagrams comparing Kenya to USA to Germany
15-to-40 range: reproductive rates are high
“Carrying-capacity" definition of overpopulation:
• not population density, but #’s of people in an area relative to resources capacity to sustain human activities
• a condition of overpopulation might be corrected with no change in the number of people!
• Developing countries tend to have people overpopulation that degrades the environment
• Developed countries have consumption overpopulation that degrades the environment
Ecological Footprint

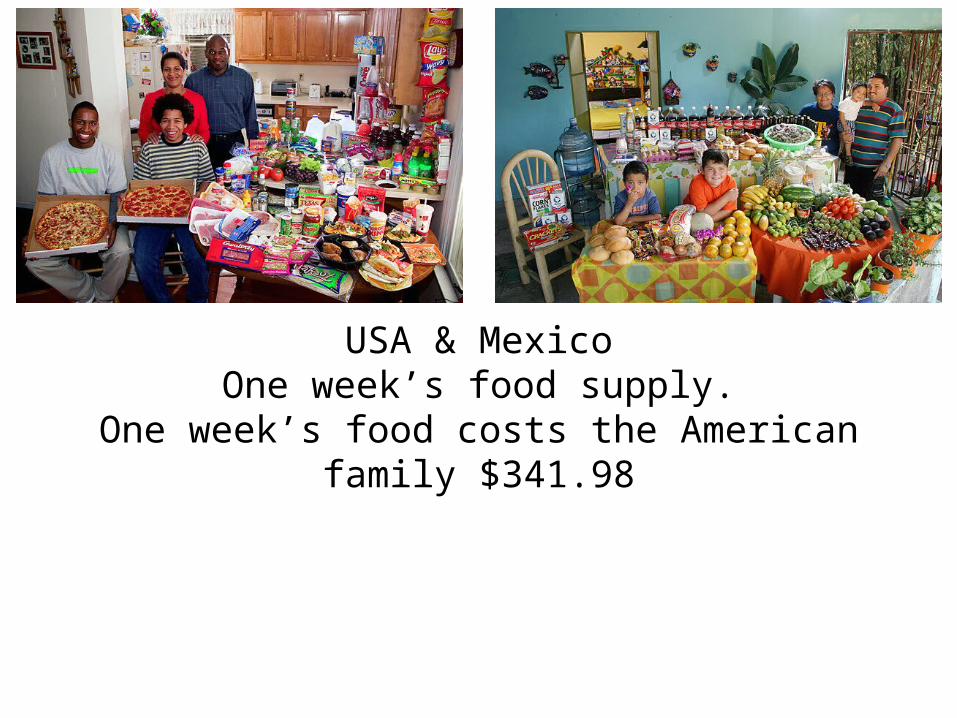
USA & MexicoOne week’s food supply.
One week’s food costs the American family $341.98
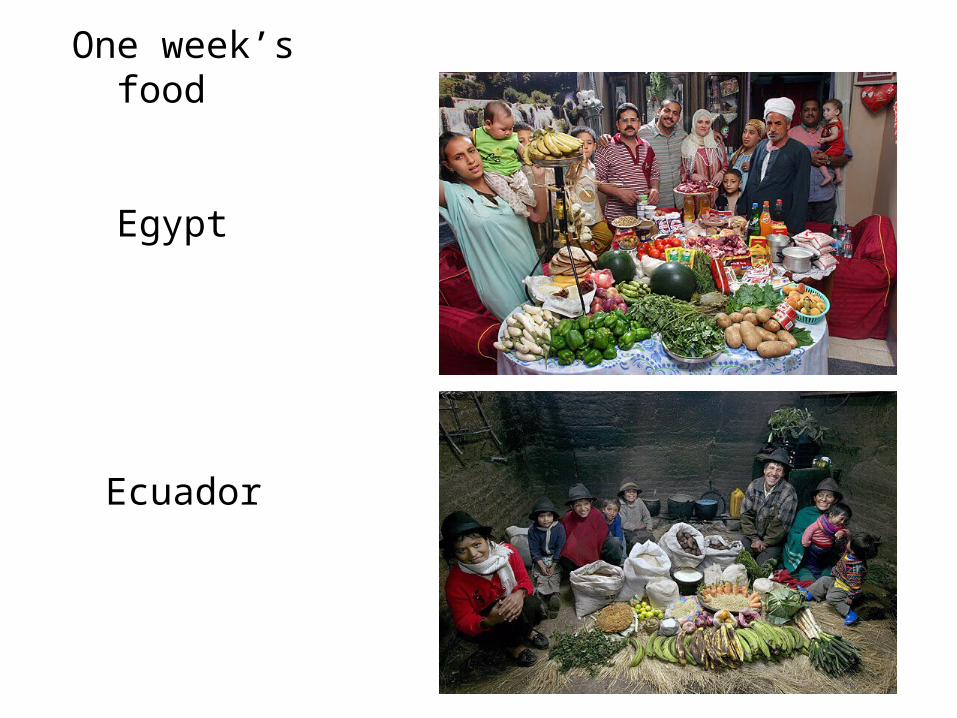
One week’s food
Egypt
Ecuador
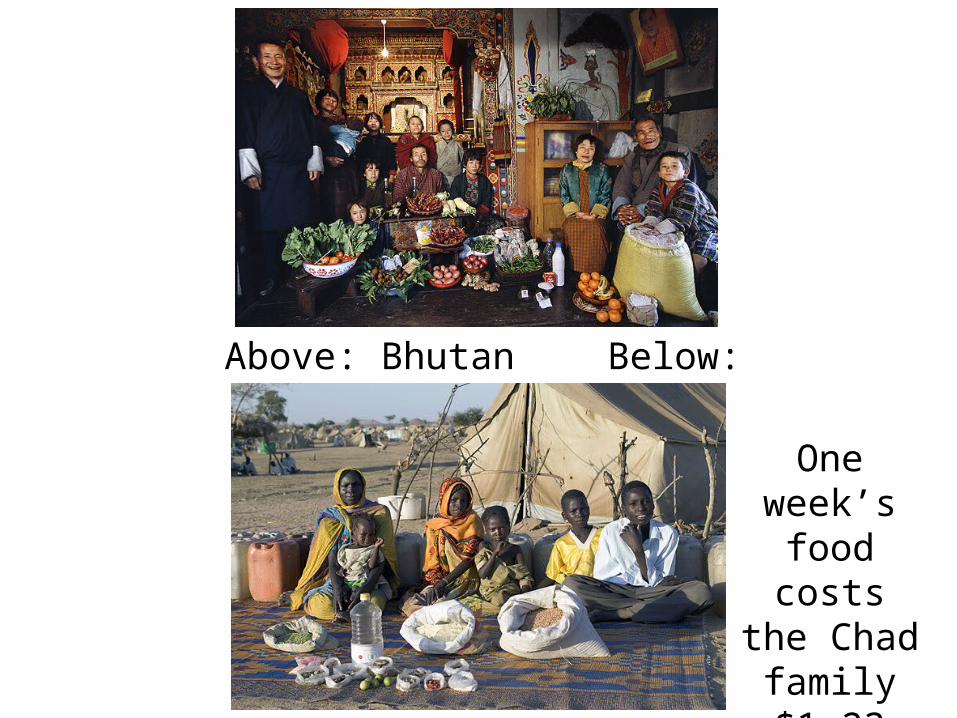
Above: Bhutan Below: Chad
One week’s
food costs the Chad
family $1.23
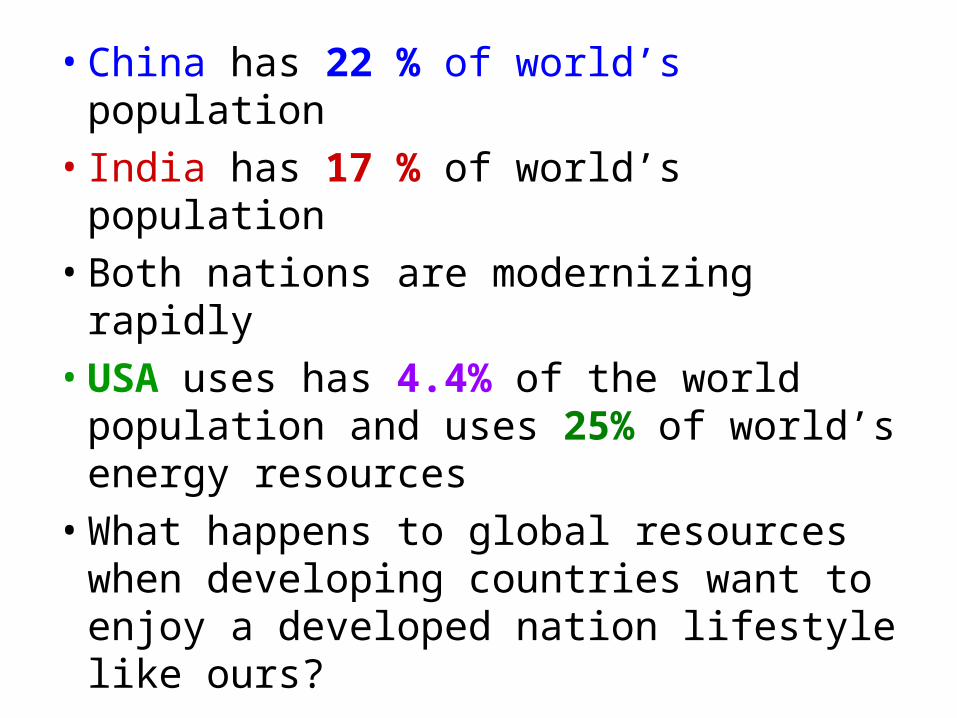
• China has 22 % of world’s population
• India has 17 % of world’s population
• Both nations are modernizing rapidly
• USA uses has 4.4% of the world population and uses 25% of world’s energy resources
• What happens to global resources when developing countries want to enjoy a developed nation lifestyle like ours?
Related Documents

![AP* Biology: Ecology Practice MC [Version Map] Biology Ecology... · AP* Biology: Ecology Practice MC [Version Map] 1 ABCD MC 1 8 9 7 ... AP* Biology: Ecology Practice MC ... which](https://static.cupdf.com/doc/110x72/5b449d207f8b9ae0668bd35b/ap-biology-ecology-practice-mc-version-map-biology-ecology-ap-biology.jpg)