University of Rhode Island University of Rhode Island DigitalCommons@URI DigitalCommons@URI Open Access Master's Theses 2014 BIOLOGICAL INDICATORS FOR ASSESSING FRESHWATER BIOLOGICAL INDICATORS FOR ASSESSING FRESHWATER WETLAND CONDITION IN RHODE ISLAND WETLAND CONDITION IN RHODE ISLAND Thomas E. Kutcher University of Rhode Island, [email protected] Follow this and additional works at: https://digitalcommons.uri.edu/theses Recommended Citation Recommended Citation Kutcher, Thomas E., "BIOLOGICAL INDICATORS FOR ASSESSING FRESHWATER WETLAND CONDITION IN RHODE ISLAND" (2014). Open Access Master's Theses. Paper 308. https://digitalcommons.uri.edu/theses/308 This Thesis is brought to you for free and open access by DigitalCommons@URI. It has been accepted for inclusion in Open Access Master's Theses by an authorized administrator of DigitalCommons@URI. For more information, please contact [email protected].

Welcome message from author
This document is posted to help you gain knowledge. Please leave a comment to let me know what you think about it! Share it to your friends and learn new things together.
Transcript

University of Rhode Island University of Rhode Island
DigitalCommons@URI DigitalCommons@URI
Open Access Master's Theses
2014
BIOLOGICAL INDICATORS FOR ASSESSING FRESHWATER BIOLOGICAL INDICATORS FOR ASSESSING FRESHWATER
WETLAND CONDITION IN RHODE ISLAND WETLAND CONDITION IN RHODE ISLAND
Thomas E. Kutcher University of Rhode Island, [email protected]
Follow this and additional works at: https://digitalcommons.uri.edu/theses
Recommended Citation Recommended Citation Kutcher, Thomas E., "BIOLOGICAL INDICATORS FOR ASSESSING FRESHWATER WETLAND CONDITION IN RHODE ISLAND" (2014). Open Access Master's Theses. Paper 308. https://digitalcommons.uri.edu/theses/308
This Thesis is brought to you for free and open access by DigitalCommons@URI. It has been accepted for inclusion in Open Access Master's Theses by an authorized administrator of DigitalCommons@URI. For more information, please contact [email protected].
BIOLOGICAL INDICATORS FOR ASSESSING FRESHWATER WETLAND
CONDITION IN RHODE ISLAND
BY
THOMAS E. KUTCHER
A THESIS SUBMITTED IN PARTIAL FULFILLMENT OF THE
REQUIREMENTS FOR THE DEGREE OF
MASTER OF SCIENCE
IN
BIOLOGICAL AND ENVIRONMENTAL SCIENCES
UNIVERSITY OF RHODE ISLAND
2014
MASTER OF BIOLOGICAL AND ENVIRONMENTAL SCIENCES
OF
THOMAS E. KUTCHER
APPROVED:
Thesis Committee:
Major Professor: Graham E. Forrester
Keith T. Killingbeck
Richard A. McKinney
Nasser H. Zawia
DEAN OF THE GRADUATE SCHOOL
UNIVERSITY OF RHODE ISLAND
2014
ABSTRACT
There is a growing need to identify assessment methods that can provide
managers and researchers with a relative indication of wetland condition. Biological
indicators (bioindicators) are considered to be the most effective and precise indicators
of environmental condition. This study focuses on the development of bioindicators
based on the concept of species conservatism, or intolerance to human disturbance. In
theory, the aggregate conservatism of a species assemblage should indicate the
environmental quality of a natural area. In the first part of this study, I applied the
conservatism concept to adult Odonata composition to create a novel bioindicator for
open-canopy wetland systems. I used an extensive existing Odonata dataset to develop
a conservatism-based Odonata index of wetland integrity and test it against rapid
assessment and landscape-scale reference measures. The Odonata index was well
predicted by both reference measures and showed no evidence of dependence on
sampling effort, wetland size, or geomorphic class. My findings suggest that
conservatism of adult Odonata averaged across species may provide a robust indicator
of freshwater wetland integrity that is practical for wetland assessment.
The conservatism concept is more typically applied to Floristic Quality
Assessment (FQA), using vascular plant species. FQA index variants incorporating
species richness, nativeness, and abundance have been empirically tested as indicators
of freshwater wetland integrity, but less attention has been given to clarifying the
mechanisms controlling FQA functionality; consequently, disagreement remains in
identifying the most effective variant. In the second part of this study, I tested
commonly-used FQA variants against landscape, rapid, and biological reference

measures in open canopy wetlands. FQA variants incorporating species richness did
not correlate with any reference measures and were influenced by wetland size and
hydrogeomorphic class. In contrast, FQA variants disregarding species richness
showed strong, monotonic relationships with all three reference measures, independent
of wetland size and class. Incorporating non-native species improved performance
over using only native species, and incorporating relative species abundance improved
performance further. Non-richness variants responded linearly to individual and
aggregate stresses, suggesting broad response to cumulative degradation, or decreasing
integrity. These findings support the following recognized theories: aggregate plant
species conservatism declines with increased disturbance; plant species richness
increases with intermediate disturbance and increasing unit area; non-native species
are favored by human disturbances; and the proportional abundance of species is an
important functional component of ecosystem health. This suggests that an abundance-
weighted FQA variant incorporating non-native species and disregarding species
richness should provide the most highly-relevant and effective FQA measure of
ecological integrity for open-canopy vegetated wetlands.
iv
ACKNOWLEDGMENTS
I sincerely thank my major professor Graham Forrester, my committee
members Rick McKinney and Keith Killingbeck, and my committee chair Caroline
Gottschalk Druschke for their considerable guidance and input. I thank Jason Bried for
generously sharing his expertise on Odonata and statistics. I also thank Carolyn
Murphy, Ginger Brown, Evan Preisser, Q. Kellogg, and Peter Paton for providing
technical advice. David Gregg, Susan Kiernan, and Carolyn Murphy administered this
work and Deanna Levanti, Stacey Liecht Young, Rick Enser, and Grace Lentini
assisted with field work and data entry. Special thanks to my family for their patience
and support. I conducted this work during my employment with the Rhode Island
Natural History Survey, which is housed by the University of Rhode Island, College of
the Environment and Life Sciences. This project was funded by the Rhode Island
Department of Environmental Management, Office of Water Resources, through a
Wetlands Program Development Grant awarded by the United States Environmental
Protection Agency.

v
PREFACE
This thesis was written in the manuscript format as stipulated by the Graduate
School at the University of Rhode Island, Kingston, Rhode Island. Chapter 1, Adult
Odonata conservatism as an indicator of freshwater wetland condition, is formatted for
publication in Ecological Indicators and was published in March 2014. Chapter 2, The
ecological mechanisms driving floristic quality assessment of wetland integrity, is
formatted for upcoming submission to Ecological Applications.

vi
TABLE OF CONTENTS
ABSTRACT .................................................................................................................. ii
ACKNOWLEDGMENTS .......................................................................................... iv
PREFACE ..................................................................................................................... v
TABLE OF CONTENTS ............................................................................................ vi
LIST OF TABLES ..................................................................................................... vii
LIST OF FIGURES .................................................................................................... ix
CHAPTER 1 ................................................................................................................. 1
CHAPTER 2 ............................................................................................................... 39
APPENDIX 1 .............................................................................................................. 83

vii
LIST OF TABLES
Chapter 1
Table 1. Components of the Rhode Island Rapid Assessment Method for evaluating
freshwater wetland condition. ..................................................................................... 33
Table 2. Coefficients of conservatism (CoC) for 135 Odonata species known to occur
in Rhode Island and the number of training sites where each was collected ............. 34
Table 3. Odonata Index of Wetland Integrity (OIWI) values and effort data from 51
wetland assessment units in Rhode Island .................................................................. 35
Table 4. Confidence limits (2.5th and 97.5th percentiles) of linear model fit between
individual RIRAM metrics (see Table 1) and the OIWI based on computer-intensive
resampling (1,000 iterations) ...................................................................................... 36
Chapter 2
Table 1. Variants of the FQAI formula and their recent applications in freshwater
wetland assessment. .................................................................................................... 76
Table 2. Values of floristic, Odonata, rapid, and landscape assessment indices of
freshwater wetland condition from 20 wetland assessment units ............................... 77
Table 3. Spearman rank correlation coefficients and probability values comparing
various floristic measures against reference measures of freshwater wetland condition
among 20 wetland assessment units ............................................................................ 78
Table 4. Kruskal-Wallace H-values (non-parametric analog to ANOVA) and
Spearman rank correlation coefficients (rs) comparing measures of freshwater wetland
condition against hydrogeomorphic class (n = 3) and unit size (n = 20), among 20
freshwater wetland assessment units ........................................................................... 79
viii
Table 5. Significant Spearman rank correlation coefficients comparing best-fit floristic
measures with RIRAM metrics and submetrics among 20 wetland assessment units,
considering a Bonferroni-adjusted critical P value of 0.0036 ..................................... 80
Table 6. Spearman rank correlation coefficients comparing reduced-effort floristic
measures against existing measures of freshwater wetland condition among 20
reference wetland units ............................................................................................... 81
ix
LIST OF FIGURES
Chapter 1
Figure 1. Performance of the OIWI: Odonata Index of Wetland Integrity for 51
wetland sites in relation to the Rhode Island Rapid Assessment Method and %
impervious surface area (measured in a 305-m buffer around each site) ................... 37
Figure 2. Discriminating among disturbance designations: Box and whisker plots
depicting the distribution of OIWI values (n = 51) in relation to three reference
designations derived from RIRAM and ISA values, respectively .............................. 38
Chapter 2
Figure 1. Box plots depicting the distributions of FQA index values among RIRAM
and ISA-based reference designations of freshwater wetland condition for 20 wetlands
..................................................................................................................................... 82
1
CHAPTER 1
Published in Ecological Indicators, March 2014
Adult Odonata conservatism as an indicator of freshwater wetland condition
Thomas E. Kutcher a, c, d and Jason T. Bried b
aRhode Island Natural History Survey, University of Rhode Island, 200 Ranger Hall,
Kingston, RI 02881, USA
bDepartment of Zoology, Oklahoma State University, 501 Life Sciences West,
Stillwater, OK 74078, USA
cCurrent address: Department of Natural Resources Science, University of Rhode
Island, Coastal Institute, Kingston, RI 02881, USA
dCorresponding author: Tel.: 401-536-4352; E-mail address: [email protected]

2
Abstract
There is a growing need to identify effective and efficient biological indicators
for wetland assessment, and adult damselflies and dragonflies (Insecta: Odonata)
possess several attributes that make them attractive for this application. We introduce
a general indicator of freshwater wetland condition based on objectively estimated
adult Odonata species conservatism, or sensitivity to human disturbances. We used an
extensive opportunistic survey dataset from Rhode Island (USA) to empirically assign
a coefficient of conservatism (CoC) to each of 135 Odonata species, based on their
exclusivity to categories of degradation among 510 wetlands; the mean CoC of species
observed in the adult stage was applied as an index of wetland integrity. An
independent sample of 51 wetlands was also drawn from the opportunistic survey to
test the performance of the index relative to human disturbance, as measured by
multimetric rapid assessment and surrounding impervious surface area. The index was
well predicted by both disturbance measures and showed no evidence of dependence
on sampling effort, wetland size, or geomorphic class. Our findings suggest that
conservatism of adult Odonata averaged across species may provide a robust indicator
of freshwater wetland condition. And because adult Odonata are generally easy to
identify, especially relative to larval Odonata, the index could be particularly useful
for wetland assessment. Our straightforward empirical approach to CoC estimation
could be applied to other existing spatially-referenced Odonata datasets or to other
species assemblages.
Keywords: Biological indicator; Damselfly; Dragonfly; Rapid assessment; Rhode
Island; Wetland assessment

3
1. Introduction
Biological indicators (or bioindicators) can provide reliable, quantitative
characterizations of ecological condition, and there is a growing need to identify
effective bioindicators for use in wetlands management and protection (Sifneos et al.,
2010; U.S. EPA, 2002). Macroinvertebrates have long been recognized as useful
bioindicators for aquatic and wetland ecosystems (Hilsenhoff, 1977; Karr and Chu,
1999; Rader et al., 2001; Wissinger, 1999), but the impracticalities of collecting,
sorting, and identifying aquatic stages limit their use in rapid assessments (Cummins
and Merritt, 2001; King and Richardson, 2002; Turner and Trexler, 1997). It is
therefore worthwhile to evaluate taxa and life stages that are both ecologically
important and logistically feasible for bioassessment. Aerial stages of aquatic
macroinvertebrates are important for species dispersal and the transfer of energy
across aquatic and upland systems and among trophic levels (Malmqvist, 2002;
Sanzone et al., 2003), and are more sensitive than the aquatic stages to land use
practices around wetlands (Anderson and Vondracek, 1999; Raebel et al., 2012;
Tangen et al., 2003).
Dragonflies and damselflies (Odonata) are prominent in many freshwater
habitats and may contribute a large proportion of total invertebrate biomass and
species richness (e.g., Batzer et al., 1999; Blois-Heulin et al., 1990; Rader et al., 2001;
Sang and Teder, 2011; Wittwer et al., 2010). Odonates are sensitive to conditions at
the breeding site and surrounding terrestrial area, can react quickly to changes in
environmental quality via active dispersal, and contain a tractable number of species
for practical use (Chovanec and Waringer, 2001; Oertli, 2008). Adult odonates are

4
conspicuous over water and relatively easy to identify at the species level (Bried et al.,
2012a; Oertli, 2008; Raebel et al., 2010), and may be especially well suited for broad
and integrative assessments of the wetland breeding site and surrounding landscape
(Bried and Ervin, 2006; Dolný et al., 2012; Foote and Hornung, 2005; Foster and
Soluk, 2006; Reece and McIntyre, 2009). Adult odonates are therefore well-suited for
rapid assessment methods (Fennessy et al., 2007) and addressing the increased focus
on wetland quality and not just quantity in the United States (Scozzafava et al. 2011).
Odonata are already established as focal organisms for freshwater conservation
(Samways, 2008) and as good indicators of site value and habitat quality for ponds,
lakes, rivers, and streams (Butler and deMaynadier, 2008; Chovanec et al., 2002;
D’Amico et al., 2004; Flenner and Sahlén, 2008; Primack et al., 2000; Raebel et al.,
2012; Remsburg and Turner, 2009; Rosset et al., 2013; Silva et al., 2010).
Bioassessment tools based on adult Odonata have been developed and tested in
Europe and South Africa. Chovanec and Waringer (2001) combined species-specific
abundance classes, niche width, and habitat preference into an Odonata Habitat Index
meant to classify the ecological status of river-floodplain systems in Austria. Simaika
and Samways (2009) combined species’ geographical range, risk of extinction, and
sensitivity to habitat change into a Dragonfly Biotic Index that has been effective for
assessing river condition in South Africa (Simaika and Samways, 2011) and the
conservation value of ponds and small lakes in Europe and South Africa (Rosset et al.,
2013). These approaches show potential for assessing wetland condition, but they have
not been tested in that capacity, specifically.

5
A reliable attribute in the biological assessment of environmental condition is
species conservatism, referring to the relative sensitivity (vulnerability) of different
species to habitat degradation (Cohen et al., 2004; Lopez and Fennesy, 2002; Miller
and Wardrop, 2006). Conservatism is commonly associated with floristic quality
assessment, wherein a coefficient of conservatism (CoC) ranging from 0 to 10 is
assigned to vascular plant species, based on the expert opinion of a team of botanists.
High CoC are given to species that are relatively sensitive to habitat degradation,
whereas low CoC are assigned to species that are non-native or highly tolerant. The
collective conservatism of a species assemblage should, in theory, reflect the
ecological condition of a given area (Swink and Wilhelm, 1979; Taft et al., 1997). In
the United States, interest in developing and applying CoC for the assessment of
wetland condition is rapidly growing (Bried et al., 2012b); yet to date, conservatism
has been applied almost exclusively in the context of floristic quality (e.g., Bried et al.,
2013; Cohen et al., 2004; Cretini et al., 2012; Ervin et al., 2006; Lopez and Fennesy,
2002; Medley and Scossafava, 2009; Matthews et al., 2005; Miller and Wardrop,
2006; but see Micacchion, 2004).
In this study we apply the conservatism concept to adult Odonata. We use an
extensive opportunistic survey dataset to introduce an objective, empirical method of
assigning CoC based on species occurrence and exclusivity to categories of wetland
degradation. We then aggregate the CoC into an index of freshwater wetland
condition, and evaluate index performance using independent odonate data and
metrics of human disturbance.

6
2. Materials and methods
2.1.Data
We conducted our study in Rhode Island located in the northeastern United
States. We relied on data from the Rhode Island Odonata Atlas Project (hereafter
“Atlas”) for this study. The Atlas was conducted from 1999 through 2004 as a
statewide inventory of adult Odonata administered by the Rhode Island Natural
History Survey and the Rhode Island Chapter of The Nature Conservancy (Brown and
Briggs, in prep.). Professionals and trained volunteers catalogued 135 Odonata species
throughout Rhode Island, collecting ~13,000 verified voucher specimens across 1,090
aquatic, wetland, and upland sites. As with other citizen-based statewide Odonata
inventory projects (e.g., White et al., 2010) or any opportunistic atlas-type surveys
(Robertson et al., 2010), sampling effort was not standardized over time or space.
2.2. Generation of CoC and the wetland integrity index
Assignment of CoC using expert judgment relies on specific knowledge of
species distributions relative to the degradation of their habitats. Subjectivity and bias
are introduced by the limitations of experience, a focus on geographic or habitat range,
perception of habitat degradation, and interpretation of the CoC designations (Bried et
al., 2012b). To avoid these problems, we generated Odonata CoC empirically, using
georeferenced point records from the Atlas and a Geographic Information System
(GIS).
We assigned the CoC based on species’ occurrences among freshwater
wetlands. To account for dataset spatial inaccuracies and increase the likelihood that

7
sampling points were associated specifically with wetlands, only points that occurred
within or near (<50 m) previously mapped wetlands were considered. Points
associated with unvegetated surface waters or uplands were excluded from analysis.
Qualified points were assumed to be representative wetlands, and were sorted by the
proportion of developed and agricultural land within 300 m. Points in the lower
quartile were selected as least-disturbed wetlands, points in the upper quartile as most-
disturbed wetlands, and an equal number of points surrounding the median as
intermediately-disturbed wetlands; this resulted in a training sample of 510.
Following the indicator species analysis proposed by Dufrene and Legendre
(1997), a CoC was determined for each species by:
where NLD is the number of least-disturbed wetlands in which a given species was
detected, NMD is the number of most-disturbed wetlands where that species was
detected, and N is the total number of wetlands (including intermediately-disturbed
sites) where that species was detected. This approach averages the “affinity” for least-
disturbed wetlands and the inverse affinity for most-disturbed wetlands, multiplying
by 10 to scale the output to the traditional CoC scale of floristic quality assessment.
Thus the CoC range from 0 if a species occurs exclusively in the most-disturbed group
to 10 if a species occurs exclusively in the least-disturbed group. In line with
recommendations for floristic quality assessment (e.g., Bried et al., 2013; Rooney and
1021
N
N
N
N MDLD

8
Rogers, 2002; Taft et al., 2006), we recommend the mean CoC of all species found at
a particular wetland site as an Odonata Index of Wetland Integrity (OIWI).
2.3. Index performance
To evaluate the OIWI, we used a sample of Atlas wetlands that was
independent of the training sample described above. Prior to extracting the training
sample, we isolated wetland features that were surveyed at least three times and
produced at least 10 specimens over the Atlas project period. From that subset, we
selected 51 study sites spanning a gradient of surrounding land use intensity. We used
photointerpretation of recent leaf-off, high-resolution aerial imagery to delineate a
polygonal wetland assessment unit for each study site according to Kutcher (2011).
Wetland assessment units ranged in size from 0.12 to 36 ha with an average of 5.3 ha.
Many (43) of the units contained multiple vegetation classes. The most frequently
represented vegetation classes (per Cowardin et al., 1979) within the study sample
were Emergent Wetland (40 sites), Forested Wetland (37 sites), and Shrub Swamp (36
sites), and the most common hydrogeomorphic settings (modified from Brinson, 1993)
were Connected Depression (16 sites), Isolated Depression (16 sites), and Floodplain-
riverine (16 sites).
We tested the OIWI against the Rhode Island Rapid Assessment Method, or
RIRAM (Kutcher, 2011), which follows federal guidelines for establishing reference
conditions for wetlands (Faber-Langendoen et al., 2009; U.S. EPA, 2002). This
evidence-based tool produces a relative index of freshwater wetland condition and
focuses on estimation, rather than interpretation, to maximize objectivity. RIRAM
9
scoring is based on the premise that diverse human disturbances additively contribute
to the degradation of general wetland condition (Fennessy et al., 2007; U.S. EPA,
2006). Metrics of buffer integrity (2 metrics), in-wetland stress (7 metrics), and
functional integrity (1 metric) are summed to generate a single index based on 100
possible points, with each metric carrying ten points (Table 1). A RIRAM score of 100
indicates no observed stresses or impacts, whereas scores approaching 0 indicate a
high degree of degradation, thus RIRAM decreases incrementally with an increase in
perceived disturbance. We collected RIRAM data according to Kutcher (2011) at each
of the 51 study sites.
Because RIRAM is inherently partly subjective, we also tested the OIWI
against the proportion of impervious surface area (ISA) within the surrounding 305 m
(1000 ft) of each polygonal wetland unit in the study sample. The relative area of
impervious surface provides an effective surrogate for human influence because it
summarizes and reflects multiple effects of anthropogenic stress (Karr and Chu, 1997).
We generated ISA directly from high-resolution impervious surface data (RIGIS,
2010), resulting in a coarse but objective disturbance measure to support our
validation analysis.
2.3. Statistical analysis
Residuals from simple linear modeling of OIWI over RIRAM and ISA for the
51 wetlands showed clear heterogeneity and non-normality based on goodness-of-fit
(Shapiro-Wilk test), residual by predicted plots (“cone-shaped” spread), and Q-Q plots
(skewed left). For this reason, we used bootstrap resampling to evaluate the linear

10
model fit for the OIWI versus RIRAM and ISA gradients and for the OIWI versus
each RIRAM metric individually. We assumed a bootstrap approach would handle the
zero-inflation inherent to some of the individual RIRAM metrics. Using Resampling
Stats v4.0 (written by S. Blank, ©2012 statistics.com, Resampling Stats Inc.,
Arlington, VA), the data were sampled with replacement into a new set of cells,
shuffling the rows as units. We then fit a simple linear model to this resampled data set
and repeated and scored the model fit output (i.e., R2 or coefficient of determination)
for 1,000 iterations. We report the 2.5th and 97.5th percentiles of the resampled
distribution as a 95% confidence interval for model fit (see also Bried et al., 2013).
The OIWI was further evaluated using box plots of OIWI distributions in
relation to RIRAM and ISA reference designations, following Barbour et al. (1996).
Reference designations were established using 25th and 75th percentile index values
to identify most-disturbed (degraded) and least-disturbed (reference-standard)
thresholds, respectively; all other study units were considered intermediately-
disturbed. The degree of overlap between interquartile ranges and medians of OIWI
distributions was used to evaluate OIWI performance. Non-overlapping interquartile
ranges within most and least-disturbed designations indicate high sensitivity to
disturbance and excellent metric performance, whereas various degrees of
interquartile-median overlap indicate lower sensitivity and performance (Barbour et
al., 1996; Jacobs et al., 2010; Veselka et al., 2010).
3. Results
3.1. CoC and index values

11
Odonata CoC ranged from 0 to 10 with a mean ± SD of 6.4 2.2 (Table 2).
Species observed occurrence rates in the 510-site training sample ranged from zero to
23% with a median of about 3%. Only one of the 135 documented Atlas species,
Libellula auripennis, was not represented in the training sample; this was assigned a
CoC of 10, since it was observed only once during the Atlas inventory period at a
minimally-disturbed site (based on 0% cultural land cover within 300 m). Other
rarely-represented species were assigned CoC following our methods. OIWI values
generated with and without incorporating rarely observed species—i.e., those species
with fewer than 20 site occurrences in the Atlas (n = 28 species), based on a natural
break in the data and best professional judgment—were nearly identical (Spearman’s
rank-correlation test, rs = 0.99, P < 0.001, n = 51 study sites), suggesting that the
inclusion of rare species is unlikely to strongly affect OIWI outcomes. Rare-species
CoC were therefore retained in the OIWI to avoid introducing bias or circularity
associated with culling rare species according to our best professional judgment or
calibration with our disturbance gradients.
OIWI values ranged from 3.74 to 7.15 with a mean of 5.90 0.77 among the
51 study sites (Table 3). Number of species recorded per site ranged from 4 (among 17
specimens collected across four site visits) to 47 (among 124 specimens collected
across seven visits). We did not find evidence of association between OIWI values and
measures of sampling effort per site, including number of specimens, number of visits,
and number of species (rs = 0.13–0.17, P = 0.22–0.37). RIRAM scores ranged from
37.9 to 100 with a mean of 79.2 17.0, and ISA ranged from 0 to 62.4% with a mean
of 10.0 14.0%, indicating a broad range of wetland conditions across the study
12
sample. The OIWI, ISA, and RIRAM were each uncorrelated with wetland unit size
(rs = -0.09–0.04, P = 0.53–0.90).
3.2. Index performance
The OIWI was well predicted by the overall RIRAM gradient and showed
evidence of a linear relationship with the impervious surface area measure (Fig. 1).
OIWI also showed evidence of a linear relationship with many of the individual
RIRAM metrics, including strong relationships with the buffer, landscape, and
integrated functional (‘Observed State’) metrics (Table 4).
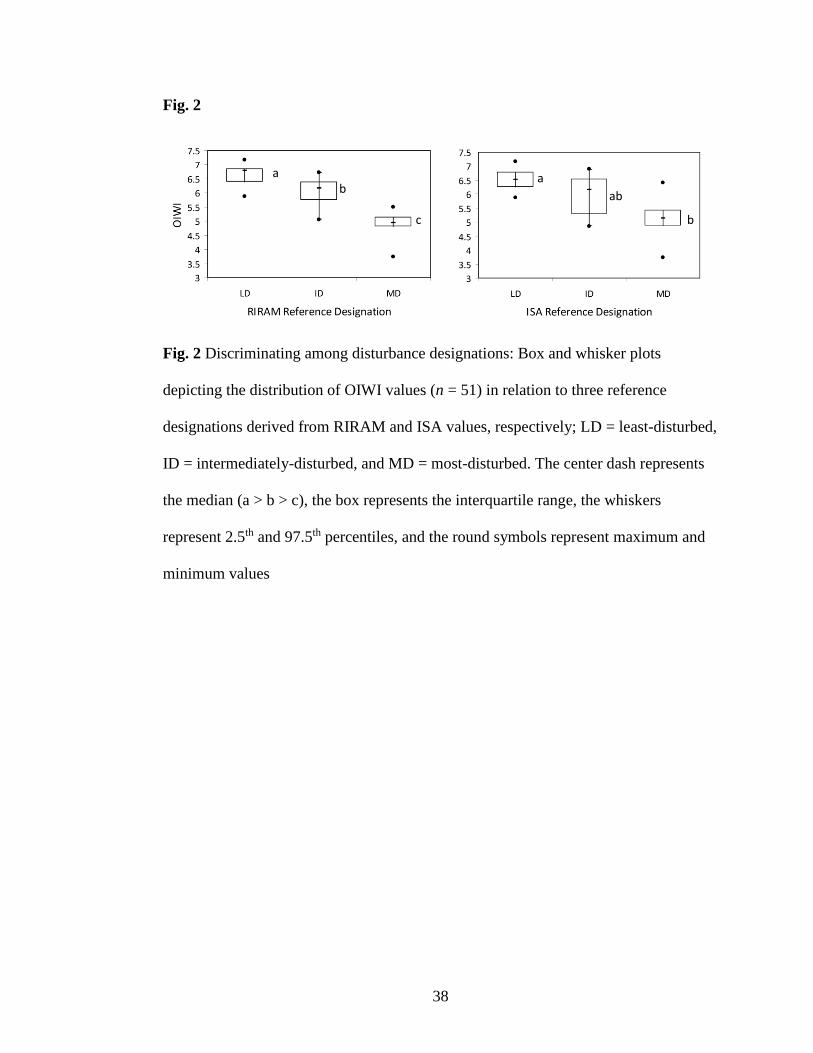
OIWI interquartile ranges within the most-disturbed and least-disturbed
wetland categories, as determined by both RIRAM and ISA, did not overlap, and
median OIWI values differed between those categories according to both indices (Fig
2; Mann-Whitney U-tests, Z = -4.33 and -4.08, P < 0.001). Additionally, the median
OIWI in most-disturbed and least-disturbed wetlands differed from the median OIWI
in intermediately-disturbed wetlands as determined by RIRAM (Z = 3.49 and 4.60, P
< 0.001). There was no evidence that median OIWI or RIRAM values varied among
connected depression, isolated depression, and floodplain-riverine geomorphic settings
(Kruskal-Wallis test, H = 3.02, P = 0.22 and H = 1.07, P = 0.59, respectively),
indicating that hydrogeomorphology did not strongly bias OIWI or RIRAM outcomes.
Vegetation-based classes could not be an analyzed in this way because more than one
type was often represented within a single study unit.
4. Discussion
4.1. Index performance

13
An effective indicator must separate human disturbance and degraded
ecological condition from the inherent variation found in nature (Brazner et al., 2007;
Karr and Chu, 1999; Swink and Wilhelm, 1979; Taft et al., 1997). Our study
demonstrates the potential of a new index (OIWI) for freshwater wetland condition
assessment built on the empirically estimated conservatism of adult odonate species.
Correlations between OIWI and a multi-metric disturbance gradient (RIRAM) suggest
that multiple stressors influence wetland patch use by odonate species. The stronger
linear relationship with the full RIRAM than with any of the component metrics
suggests the OIWI is more likely to indicate overall wetland condition rather than any
particular stressor. And, the clear relationship of the OIWI to the buffer and landscape
metrics supports the idea that adult odonates are also strong indicators of land use
practices and integrity of the area surrounding the wetland breeding site.
Non-overlapping interquartile ranges suggest excellent capability of the OIWI
to discriminate among reference categories, defined according to the RIRAM and ISA
measures. Indeed, the entire OIWI distributions within RIRAM-designated least-
disturbed and most-disturbed wetlands were non-overlapping. Discriminating among
disturbance classes is often a key objective of wetland assessment (Jacobs et al., 2010;
U.S. EPA, 2006). The tighter relationship (better model fit) of the OIWI to the
RIRAM than to ISA suggests that odonates as a group will respond more predictably
to cumulative in-wetland and adjacent (<150 m) stresses than to broader (300 m)
surrounding landscape stresses, even though the CoC were generated at the latter
scale. This supports the fact that much adult odonate activity and abundance is
localized in and around breeding habitat (Bried and Ervin, 2006; Butler and
14
deMaynadier, 2008), and undermines the prevailing opinion that adult stages cannot
indicate conditions at the breeding site (Raebel et al., 2010). Strong correlations
between OIWI and RIRAM buffer metrics suggest that adult Odonata are highly
sensitive to the condition of nearby uplands surrounding the breeding site. This
contrasts with odonate larvae which may respond only or primarily to breeding site
conditions (Raebel et al., 2012). We recommend a full evaluation of adults vs. larvae
(or exuviae) based on concurrent sampling of both stages along the same disturbance
gradient.
Simaika and Samways (2011) found that adult dragonfly species composition,
as represented by the Dragonfly Biotic Index, was more efficient and effective than
benthic macroinvertebrate composition for assessing river condition. Similar to the
OIWI, their index incorporates aggregate sensitivity of adult odonates to human
disturbances. Metrics evaluating geographical range and threat of extinction, typically
associated with habitat conservation value, collectively outweigh the species
sensitivity metric. But, it is unclear how these metrics affect the signal of human
disturbance because they may correspond with conservatism, in that conservative
species may be restricted in geographical range, or threatened, due to habitat
degradation. The Odonata Habitat Index (Chovanec and Waringer, 2001), intended to
assess the health of river-floodplain systems, incorporates metrics evaluating species
abundance, niche width, and habitat preference. While niche width may correspond
with conservatism, species abundance and habitat preferences are heavily weighted,
shifting the index focus toward habitat suitability for Odonata and away from general
ecological condition. In contrast to these methods, the OIWI uses only collective

15
species sensitivity as the indicator, thereby inherently restricting the index assessment
to site quality. Accordingly, any effective use of a wetland by adult Odonata was
counted in generating the CoC and validating the OIWI. Although the OIWI
performed well without separating resident (autochthonous, successfully emerged) and
immigrant species, a validation analysis focused strictly on the resident assemblage
may find an even better signal of site quality. This is because the in-wetland stress
experienced during the larval period may carry over to determine the species present at
the adult stage.
Our study indicates the potential value of adult Odonata species conservatism
as an effective and efficient indicator of freshwater wetland condition. We propose
that the OIWI may provide a reliable alternative or complement to the conservatism-
based floristic quality indices that have become popular for wetland assessments in the
United States (Bried et al., 2013; Cohen et al., 2004; Ervin et al., 2006; Lopez and
Fennessey, 2002; Miller and Wardrop, 2006; Stein et al., 2009). The linear model fit
between OIWI and measures of human disturbance was comparable to wetland
assessments using floristic conservatism (e.g., Cohen et al., 2004; Ervin et al., 2006;
Lopez and Fennessey, 2002; Miller and Wardrop, 2006). Because adult odonates
require the habitat surrounding wetlands for maturation, foraging, nocturnal roosting,
and other activities (Bried and Ervin, 2006 and references therein), and because the
CoC are estimated objectively rather than using best professional judgment, the OIWI
may provide a more integrated and accurate measure of wetland quality than site-
restricted floristic assessments. A direct comparison of the OIWI and floristic quality
methods is needed to test this prediction. Furthermore, the OIWI uses a readily
16
observed insect group whose species identifications are easy to learn, and thus should
not present any greater logistical difficulty than floristic-based assessments. However,
we acknowledge that odonatists are outnumbered by botanists, and that odonates may
not be present in all types of wetlands.
Similar to some floristic methods, OIWI is a straightforward, single-metric
indicator of wetland condition that is easily understood and thus may be a more
intuitive tool for practitioners than more complex indicators. The OIWI is based on the
straightforward premise that because Odonata species exhibit differential tolerance to
various human disturbances, species assemblage can reflect cumulative human
disturbance at a given wetland. Assignment of CoC was also straightforward, based on
the empirical analysis of species occurrences using observational data. Bioindicators
that employ numerous metrics, complex metrics, or metrics based on a coarse or
subjective characterization of condition (such as expert opinion) are more likely to
contain biases and hidden information that cannot easily be understood and reconciled
by the end user. Practitioners may therefore feel more confident applying the OIWI
over more complex or subjective indicators.
4.2. Methodology considerations
We used the mean CoC for the OIWI and ignored species richness, which for
odonates may correspond with site attributes other than ecological condition (Aliberti
Lubertazzi and Ginsberg, 2010; Bried et al., 2007; Hornung and Rice, 2003; Sahlén
and Ekestubbe, 2001). For example, several odonate studies have reported a positive
relationship between number of species and patch area (Bried et al., 2012a; Kadoya et
17
al., 2004; Samways et al., 2011). Additionally, the number of adult odonate species
observed depends largely on the frequency and duration of surveys (Bried et al.,
2012a; Simaika and Samways, 2009). Survey effort and assessment unit size varied
greatly in the Rhode Island Odonata Atlas, but neither correlated with the OIWI,
suggesting that these discrepancies did not affect OIWI values relative to our
disturbance gradients; however, we hypothesize that patch area and sampling effort
variability would confound the index if it incorporated species richness. Studies of
floristic quality have also recognized the confounding influence of richness and
recommended using mean CoC alone (Bried et al., 2013; Cohen et al., 2004; Miller
and Wardrop, 2006; Rooney and Rogers, 2002).
A main goal of our study was to develop accurate Odonata CoC for practical
application in wetland assessment. We therefore used three training groups,
representing least-disturbed, intermediately-disturbed, and most-disturbed wetlands, to
maximize CoC information under the data constraints of the Odonata Atlas. However,
in applications collecting new Odonata training data or utilizing a more rigorous
survey dataset, it may be more efficient and effective to use only least-disturbed and
most-disturbed groups, at the expense of losing information from intermediately-
disturbed wetlands. Advantages could include a reduction in ecological noise, more
efficient, targeted monitoring effort, and simpler CoC computations, using a single
proportional value of affinity rather than averaging two (affinity to least-disturbed
wetlands would automatically correspond to inverse affinity to most-disturbed
wetlands).
18
Our method of empirically assigning CoC could be applied to other large
opportunistic or “citizen-science” datasets for Odonata, or to similar datasets for other
species assemblages. For example, Micacchion (2004) used best professional
judgment to assign coarse CoC to amphibian species to indicate the condition of
seasonally-flooded ponds in Ohio, USA. Many states, including Ohio, have extensive
spatially-referenced amphibian datasets that could be utilized for assessment by
applying our methods to generate amphibian CoC. Similarly, Lussier et al. (2006)
assigned subjective coefficients of tolerance to songbird guilds to help describe the
ecological integrity of riparian corridors. Our methods could be applied to the
extensive, existing songbird datasets to empirically assign CoC to individual bird
species, which could potentially facilitate rapid assessment of large conservation areas
using analysis of existing spatial data or new songbird point-counts. Also, floristic
CoC could be validated or improved using similar methods (Bried et al., 2012b),
although this could be an onerous task that would need to be weighed against potential
benefits over expert-based CoC. Cohen et al. (2004) found negligible functional
differences between index values using data-based versus opinion-based CoC for
plants.
There are expected disadvantages to using odonate adults relative to larvae and
exuviae. Flight activity is sensitive to weather conditions and may affect species’
detection probability, generating noise in the data set. Also, presence of adults or their
mating and oviposition attempts do not indicate successfully emerged or breeding
resident species (Chovanec and Waringer, 2001; Raebel et al., 2010). Separating the
19
resident and immigrant species may improve OIWI performance, but currently no
criteria exist for doing so based only on adult surveys.
It is unclear whether species with low representation in the training sample
were given accurate CoC. Although the likelihood of any one or combination of these
species strongly affecting OIWI outcomes across multiple wetlands is low, rare
species may provide vital information for site-scale assessment (Poos and Jackson,
2012). Incorporating rare species allowed us to test the application of all available
species information, which may be important for assessing wetlands with low species
richness. Similarly, Simaika and Samways (2009) found that the Dragonfly Biotic
Index was not substantially affected by occasional species, even as rarity (in terms of
relative geographic distribution and conservation status) is heavily positively weighted
in the index. In contrast, our empirical method of CoC allocation will favor rare
species over common species only if they are primarily observed in undisturbed
landscapes.
The number of species documented at certain study units may be biased low
due to targeted sampling of early-season species during the Atlas (V. Brown, pers.
comm.). In fact, the observed number of odonate species is likely biased low at any
sites with one or few surveys. But if we assume this bias is evenly distributed
(approximately) across the sample, then our novel approach to CoC designation can be
applied using many large opportunistic data sets that already exist (e.g., White et al.,
2010). A standardized sampling effort for adult Odonata over the flight season (see
Bried et al., 2012a for guidance) at an independent set of wetlands could then be used
to rigorously evaluate the performance of CoC estimated from opportunistic data.
20
4.3. Conclusion
Many forms of wetland bioassessment exist with varying levels of complexity
and required expertise (Rader et al., 2001; U.S. EPA, 2002). Our study demonstrates a
straightforward and effective method of empirically assigning CoC to odonate species
based on their affinity to disturbance classes assigned to a large opportunistic dataset.
We found that adult Odonata sensitivity to disturbance, taken collectively across
species, responds predictably to multiple aspects of wetland and adjacent buffer
degradation, and declines monotonically in response to cumulative wetland
degradation (i.e., general wetland condition) across a range of freshwater wetland
types. These findings indicate the utility of adult Odonata as a meaningful and robust
indicator of freshwater wetland condition. In addition to developing the CoC and
testing the OIWI in other regions, future studies should compare the OIWI with the
related floristic quality indices (Ervin et al., 2006; Taft et al., 2006), and with multi-
metric or multi-taxa indices (e.g., Brazner et al., 2007; Johnston et al., 2009) to
evaluate how wetland assessments involving only adult odonates perform in relation to
approaches requiring more taxa and expertise.

21
Acknowledgments
We thank Carolyn Murphy, Graham Forrester, Rick McKinney, Q. Kellogg,
and Peter Paton for providing technical advice. Ginger Brown provided comments on
our methods and reviewed the Odonata coefficients of conservatism. David Gregg
reviewed a draft of this manuscript. David Gregg, Susan Kiernan, and Carolyn
Murphy administered this work and Deanna Levanti assisted with field work. Rhode
Island Natural History Survey is housed by the University of Rhode Island, College of
the Environment and Life Sciences. This project was funded by the Rhode Island
Department of Environmental Management, Office of Water Resources, through a
Wetlands Program Development Grant awarded by the United States Environmental
Protection Agency.
22
References
Aliberti-Lubertazzi, M.A., Ginsberg, H.S., 2010. Emerging dragonfly diversity at
small Rhode Island (U.S.A.) wetlands along an urbanization gradient. Urban
Ecosystems 13, 517–533.
Anderson, D.J., Vondracek, B., 1999. Insects as indicators of land use in three
ecoregions in the prairie pothole region. Wetlands 19, 648–664.
Barbour, M.T., Gerritsen, J., Griffeth, G.E., Frydenborg, R., McCarron, E., White,
J.S., Bastain, L., 1996. A framework for biological criteria for Florida streams
using benthic macroinvertebrates. J. N. Am. Benthol. Soc. 15, 185–211.
Batzer, D.P., Rader, R.B., Wissinger, S.A. (Eds.), 1999. Invertebrates in Freshwater
Wetlands of North America: Ecology and Management. John Wiley & Sons,
New York, USA.
Blois-Heulin, C., Crowley, P.H., Arrington, M., Johnson, D.M., 1990. Direct and
indirect effects of predators on the dominant invertebrates of two freshwater
littoral communities. Oecologia 84, 295–306.
Brazner, J.C., Danz, N.P., Niemi, G.J., Regal, R.R., Trebitz, A.S., Howe, R.W.,
Hanowski, J.M., Johnson, L.B., Ciborowski, J.J.H., Johnston, C.A., Reavie,
E.D., Brady, V.J., Sgro, G.V., 2007. Evaluation of geographic, geomorphic,
and human influences on Great Lakes wetland indicators: a multi-assemblage
approach. Ecol. Indic. 7, 610–635.
Bried, J.T., Ervin, G.N., 2006. Abundance patterns of dragonflies along a wetland
buffer. Wetlands 26, 878–833.
23
Bried, J.T., Herman, B.D., Ervin, G.N., 2007. Umbrella potential of plants and
dragonflies for wetland conservation: a quantitative case study using the
umbrella index. J. Appl. Ecol. 44, 833–842.
Bried, J.T., Hager, B.J., Hunt, P.D., Fox, J.N., Jensen, H.J., Vowels, K.M., 2012a.
Bias of reduced-effort community surveys for adult Odonata of lentic waters.
Insect Conserv. Diver. 5, 213–222.
Bried, J.T., Strout, K.L., Portante, T., 2012b. Coefficients of conservatism for the
vascular flora of New York and New England: inter-state comparisons and
expert opinion bias. Northeast. Nat. 19(Special Issue 6), 101–114.
Bried, J.T., Jog, S.K., Matthews, J.W., 2013. Floristic quality assessment signals
human disturbance over natural variability in a wetland system. Ecol. Indic. 34,
260–267.
Brinson, M.M., 1993. A hydrogeomorphic classification for wetlands. U.S. Army
Corps of Engineers, Washington DC, Wetlands Research Program Technical
Report.
Brown, V., Briggs, N., in prep. Rhode Island Odonata Atlas. Rhode Island Department
of Environmental Management, Division of Fish and Wildlife, Providence,
Rhode Island, USA.
Butler, R.G., deMaynadier, P.G., 2008. The significance of littoral and shoreline
habitat integrity to the conservation of lacustrine damselflies (Odonata). J.
Insect Conserv. 12, 23–36.
24
Clark, T.E., Samways, M.J., 1996. Dragonflies (Odonata) as indicators of biotope
quality in the Kruger National Park, South Africa. J. Appl. Ecol. 33, 1001–
1012.
Chovanec, A., Schiemer, F., Waidbacher, H., Spolwind, R., 2002. Rehabilitation of a
heavily modified river section of the Danube in Vienna (Austria): biological
assessment of landscape linkages on different scales. Internat. Rev. Hydrobiol.
87(2-3), 183-195.
Chovanec, A., Waringer, J., 2001. Ecological integrity of river-floodplain systems—
assessment by dragonfly surveys (Insecta: Odonata). Regul. Rivers: Res.
Mgmt. 17, 493-507.
Cohen, M.J., Carstenn, S., Lane, C.R., 2004. Floristic quality indices for biotic
assessment of depressional marsh condition in Florida. Ecol. Appl. 14, 784–
794.
Cowardin, L.M., Carter, V., Golet, F.C., LaRoe, E.T., 1979. Classification of wetlands
and deepwater habitats of the United States. Office of Biological Services, Fish
and Wildlife Service, U.S. Department of the Interior. Washington, DC
Cretini, K.F., Visser, J.M., Krauss, K.W., Steyer, G.D., 2012. Development and use of
a floristic quality index for coastal Louisiana marshes. Environ. Monit. Assess.
184, 2389–2403.
Cummins, K.W., Merritt, R.W., 2001. Application of invertebrate functional groups to
wetland ecosystem function and biomonitoring. In: Rader, R.B., Batzer, D.P.,
Wissinger, S.A. (Eds.), Bioassessment and Management of North American
Freshwater Wetlands. John Wiley & Sons, Inc., New York, USA, pp. 85–111.

25
D’Amico, F., Darblade, S., Avignon, S., Blanc-Manel, S., Ormerod, S.J., 2004.
Odonates as indicators of shallow lake restoration by liming: comparing adult
and larval responses. Restor. Ecol. 12, 439–446.
Dolný, A., Harabiš, F., Bárta, D., Lhota, S., Drozd, P., (2012). Aquatic insects indicate
terrestrial habitat degradation: changes in taxonomical structure and functional
diversity of dragonflies in tropical rainforest of East Kalimantan. Trop. Zool.
25, 141–157.
Dufrene, M., Legendre, P., 1997. Species assemblages and indicator species: the need
for a flexible asymmetrical approach. Ecol. Monogr. 67, 345–366.
Ervin, G.N., Herman, B.D., Bried, J.T., Holly, D.C., 2006. Evaluating non-native
species and wetland indicator status as components of wetlands floristic
assessment. Wetlands 26, 1114–1129.
Faber-Langendoen, D., Lyons, R., Comer, P., 2009. Developing options for
establishing reference conditions for wetlands across the lower 48 states.
NatureServe, Arlington, VA, USA.
Fennessy, M.S., Jacobs, A.D., Kentula, M.E., 2007. An evaluation of rapid methods
for assessing the ecological condition of wetlands. Wetlands 27, 543–560.
Fleishman, E., Noss, R. F., Noon, B. R., 2006. Utility and limitations of species
richness metrics for conservation planning. Ecol. Indic. 6, 543–553.
Flenner, I., Sahlén, G., 2008. Dragonfly community re-organization in boreal forest
lakes: rapid species turnover driven by climate change? Insect Conserv.
Divers. 1, 169–179.

26
Foote, A.L., Hornung, C.L.R., 2005. Odonates as biological indicators of grazing
effects on Canadian prairie wetlands. Ecol. Entomol. 30, 273–283.
Foster, S.E., Soluk, D.A., 2006. Protecting more than the wetland: the importance of
biased sex ratios and habitat segregation for conservation of the Hine’s
emerald dragonfly, Somatochlora hineana Williamson. Biol. Conserv. 127,
158–166.
Hilsenhoff, W.L., 1977. The use of arthropods to evaluate water quality of streams.
Wisconsin Department of Natural Resources, Technical Bulletin No. 100.
Hornung, J.P., Rice, C.L., 2003. Odonata and wetland quality in southern Alberta,
Canada: a preliminary study. Odonatologica 32, 119–129.
Jacobs, A.D., Kentula, M.E., Herlihy, A.T., 2010. Developing an index of condition
from ecological data: an example using HGM functional variables from the
Nanticoke watershed, USA. Ecol. Indic. 10, 703–712.
Johnston, C.A., Zedler, J.B., Tulbure, M.G., Frieswyk, C.B., Bedford, B.L., Vaccaro,
L., 2009. A unifying approach for evaluating the condition of wetland plant
communities and identifying related stressors. Ecol. Appl. 19, 1739–1757.
Kadoya, T., Suda, S., Washitani, I., 2004. Dragonfly species richness on man-made
ponds: effects of pond size and pond age on newly established assemblages.
Ecol. Res. 19, 461–467.
Karr, J.R., Chu, E.W., 1999. Restoring Life in Running Waters; Better Biological
Monitoring. Island Press, Washington, DC.

27
King, R.S., Richardson, C.J., 2002. Evaluating subsampling approaches and
macroinvertebrate taxonomic resolution for wetland bioassessment. J. N. Am.
Benthol. Soc. 21, 150–171.
Kutcher, T.E., 2011. Rhode Island rapid assessment method user’s guide; RIRAM
version 2.10. Rhode Island Department of Environmental Management, Office
of Water Resources, Providence, Rhode Island, USA.
Lopez, R.D., Fennessy, M.S., 2002. Testing the floristic quality assessment index as
an indicator of wetland condition. Ecol. Appl. 12, 487–497.
Lussier, S. M., Enser, R. W., Dasilva, S. N., Charpentier, M., 2006. Effects of habitat
disturbance from residential development on breeding bird communities in
riparian corridors. Environ. Manage., 38, 504-521.
Malmqvist, B, 2002. Aquatic invertebtrates in riverine landscapes. Freshw. Biol. 47,
679–694.
Matthews, J.W., Tessene, P.A., Wiesbrook, S.M., Zercher, B.W., 2005. Effect of area
and isolation on species richness and indices of floristic quality in Illinois,
USA wetlands. Wetlands 25, 607–615.
Medley, L., Scozzafava, M., 2009. Moving toward a national floristic quality
assessment: considerations for the EPA National Wetland Condition
Assessment. Natl. Wetlands Newsl. 31(1), 6–9.
Micacchion, M., 2004. Integrated Wetland Assessment Program, Part 7: Amphibian
Index of Biotic Integrity (AmphIBI) for Ohio Wetlands. Ohio EPA Technical
Report WET/2004-7. Ohio Environmental Protection Agency, Wetland
Ecology Group, Division of Surface Water, Columbus, Ohio, USA.

28
Miller, S.J., Wardrop, D.H., 2006. Adapting the floristic quality assessment index to
indicate anthropogenic disturbance in central Pennsylvania wetlands. Ecol.
Indic. 6, 313–326.
Oertli, B. 2008. The use of dragonflies in the assessment and monitoring of aquatic
habitats. Pages 79–95 in A. Córdoba-Aquilar (Ed.), Dragonflies and
Damselflies: Model Organisms for Ecological and Evolutionary Research.
Oxford University Press, Oxford, UK.
Poos, M.S., Jackson, D.A., 2012. Addressing the removal of rare species in
multivariate bioassessments: the impact of methodological choices. Ecol.
Indic. 18, 82–90.
Primack, R.B., Kobori, H., Mori, S., 2000. Dragonfly pond restoration promotes
conservation awareness in Japan. Conserv. Biol. 14, 1553–1554.
Rader, R.B., Batzer, D.P., Wissinger, S.A. (Eds.), 2001. Bioassessment and
Management of North American Freshwater Wetlands. John Wiley & Sons,
New York, USA.
Raebel, E.M., Merckx, T., Riordan, P., Macdonald, D.W., Thompson, D.J., 2010. The
dragonfly delusion: why it is essential to sample exuviae to avoid biased
surveys. J. Insect Conserv. 14, 523–534.
Raebel, E.M., Merckx, T., Feber, R.E., Riordan, P., Thompson, D.J., Macdonald,
D.W., 2012. Multi-scale effects of farmland management on dragonfly and
damselfly assemblages of farmland ponds. Agr. Ecosyst. Environ. 161, 80–87.
29
Reece, B.A., McIntyre, N.E., 2009. Community assemblage patterns of odonates
inhabiting a wetland complex influenced by anthropogenic disturbance. Insect
Conserv. Diver. 2, 73–80.
Remsburg, A.J., Turner, M.G., 2009. Aquatic and terrestrial drivers of dragonfly
(Odonata) assemblages within and among north-temperate lakes. J. N. Am.
Benthol. Soc. 28, 44–56.
RIGIS, 2010. Rhode Island Geographic Information System Data. Available via
http://www.edc.uri.edu/rigis/. Accessed 15 July 2010.
Robertson, M.P., Cumming, G.S., Erasmus, B.F.N., (2010) Getting the most out of
atlas data. Divers. Distrib. 16, 363–375.
Rooney, T.P., Rogers, D.A., 2002. The modified floristic quality index. Nat. Areas J.
22, 340–344.
Rosset, V., Simaika, J. P., Arthaud, F., Bornette, G., Vallod, D., Samways, M. J.,
Oertli, B., 2013. Comparative assessment of scoring methods to evaluate the
conservation value of pond and small lake biodiversity. Aquatic Conserv: Mar.
and Freshw. Ecosyst. 23, 23-36.
Sahlén, G., Ekestubbe, K., 2001. Identification of dragonflies (Odonata) as indicators
of general species richness in boreal forest lakes. Biodivers. Conserv. 10, 673–
690.
Samways, M.J. 2008. Dragonflies as focal organisms in contemporary conservation
biology. Pages 97–108 in A. Córdoba-Aquilar (Ed.), Dragonflies and
Damselflies: Model Organisms for Ecological and Evolutionary Research.
Oxford University Press, Oxford, UK.

30
Samways, M.J., Pryke, J.S., Simaika, J.P., 2011. Threats to dragonflies on land islands
can be as great as those on oceanic islands. Biol. Conserv. 144, 1145–1151.
Sang, A., Teder, T., 2011. Dragonflies cause spatial and temporal heterogeneity in
habitat quality for butterflies. Insect Conserv. Diver. 4, 257–264.
Sanzone, D. M., Meyer, J. L., Marti, E., Gardiner, E. P., Tank, J. L., Grimm, N. B., 2003.
Carbon and nitrogen transfer from a desert stream to riparian predators. Oecologia,
134, 238–250.
Scozzafava, M., Kentula, M. E., Riley, E., Magee, T. K., Serenbetz, G., Sumner, R., Faulkner,
C., Price, M., 2011. The National Wetland Condition Assessment: national data on
wetland quality to inform and improve wetlands protection. National Wetlands
Newsletter 33(2), 11–13.
Sifneos, J.C., Herlihy, A.T., Jacobs, A.D., Kentula, M.E., 2010. Calibration of the
Delaware Rapid Assessment Protocol to a comprehensive measure of wetland
condition. Wetlands 30, 1011–1022.
Silva, D., De Marco, P., Resende, D.C., 2010. Adult odonate abundance and
community assemblage measures as indicators of stream ecological integrity:
A case study. Ecol. Indic. 10, 744–752.
Simaika, J.P., Samways, M.J., 2009. An easy-to-use index of ecological integrity for
prioritizing freshwater sites and for assessing habitat quality. Biodivers.
Conserv. 18, 1171–1185.
Simaika, J.P., Samways, M.J., 2011. Comparative assessment of indices of freshwater
habitat conditions using different invertebrate taxon sets. Ecol. Indic. 11, 370–
378.

31
Stein, E.D., Fetscher, A.E., Clark, R.P., Wiskind, A., Grenier, J.L., Sutula, M.,
Collins, J.N., Grosso, C., 2009. Validation of a wetland rapid assessment
method: use of EPA’s level 1-2-3 framework for method testing and
refinement. Wetlands 29, 648–665.
Swink, F., Wilhelm, G., 1979. Plants of the Chicago Region (revised and expanded
edition with keys). The Morton Arboretum, Lisle, Illinois, USA.
Taft, J.B., Wilhelm, G.S., Ladd, D.M., Masters, L.A., 1997. Floristic quality
assessment for vegetation in Illinois: a method for assessing vegetation
integrity. Erigenia 15, 3–95.
Taft, J.B., Hauser, C., Robertson, K.R., 2006. Estimating floristic integrity in tallgrass
prairie. Biol. Conserv. 131, 42–51.
Tangen, B.A., Butler, M.G., Ell, M.J., 2003. Weak correspondence between
macroinvertebrate assemblages and land use in Prairie Pothole Region
wetlands, USA. Wetlands 23, 104–115.
Turner, A.M., Trexler, J.C., 1997. Sampling aquatic invertebrates from marshes:
evaluating the options. J. N. Am. Benthol. Soc. 16, 694–709.
U.S. EPA, 2002. Methods for evaluating wetland condition: Developing metrics and
indexes of biological integrity. Office of Water, U.S. Environmental Protection
Agency, Washington, DC. EPA 822-R-02-016.
U.S. EPA, 2006. Application of elements of a state water monitoring and assessment
program for wetlands. Wetlands Division, Office of Wetlands, Oceans and
Watersheds, U.S. Environmental Protection Agency, Washington, DC.
32
Veselka, W., Anderson, J.T., Kordek, W.S., 2010. Using dual classifications in the
development of avian wetland indices of biological integrity for wetlands in
West Virginia, USA. Environ. Monit. Assess. 164, 533–548.
White, E.L., Corser, J.D., Schlesinger, M.D., 2010. The New York Dragonfly and
Damselfly Survey, 2005–2009: Distribution and Status of the Odonates of
New York. New York Natural Heritage Program, Albany, New York USA.
Available via http://www.dec.ny.gov/animals/31061.html. Accessed 29
December 2011
Wissinger, S.A., 1999. Ecology of wetland invertebrates: synthesis and applications
for conservation and management. In: Batzer, D.P., Rader, R.B., Wissinger,
S.A., (Eds.), Invertebrates in Freshwater Wetlands of North America: Ecology
and Management. John Wiley & Sons, New York, USA. pp. 1043–1086.
Wittwer, T., Sahlén, G., Suhling, F., 2010. Does one community shape the other?
Dragonflies and fish in Swedish lakes. Insect Conserv. Diver. 3, 124–133.

33
Table 1. Components of the Rhode Island Rapid Assessment Method for evaluating
freshwater wetland condition
Metric Metric Scoring Criteria
1. Integrity of Buffers Estimates % cultural cover class within 100ft (30m) of unit
2. Integrity of Surrounding Landscape Generates a weighted average of four land-use-intensity
categories by relative proportion within 500ft (150m) of unit
3. Impoundment Estimates water regime change and proportion of unit
affected, and identifies barriers to resource movement
4. Draining or Diversion of Water Estimates water regime change and proportion of the unit
affected
5. Anthropogenic Fluvial Inputs Estimates impacts of four types of fluvial inputs including
nutrients, sediments and solids, toxins and salts, and
flashiness
6. Filling and Dumping Estimates the intensity of fill within or abutting the wetland
and the proportion of the unit affected
7. Excavation and Substrate Disturbances Estimates the intensity of substrate disturbances within the
wetland and the proportion of the unit affected
8. Vegetation and Detritus Removal Estimates the extent and the proportion of vegetation and
detritus removal from each of five vegetation strata
9. Invasive Species within Wetland Estimates the collective cover class of all identified invasive
plant species
10. Observed State Rates the apparent integrity of five wetland functional
characteristics, including hydrologic integrity, water and soil
quality, habitat structure, vegetation composition, and habitat
connectivity
34
Table 2. Coefficients of conservatism (CoC) for 135 Odonata species known to occur
in Rhode Island and the number of training sites where each was collected; LD = least-
disturbed, ID = intermediately-disturbed, and MD = most-disturbed
Training Sites Training Sites
Species CoC LD ID MD Total Species CoC LD ID MD Total
Aeshna canadensis 8.3 4 2 0 6 Hagenius brevistylus 7.6 11 7 1 19
Aeshna clepsydra 8.3 16 3 2 21 Helocordulia uhleri 7.7 9 5 1 15
Aeshna constricta 5.0 3 4 3 10 Hetaerina americana 5.0 4 6 4 14 Aeshna mutata 7.5 1 1 0 2 Ischnura hastata 5.4 8 9 6 23
Aeshna tuberculifera 8.2 12 7 0 19 Ischnura kellicotti 5.2 8 8 7 23
Aeshna umbrosa 6.2 11 9 5 25 Ischnura posita 4.1 29 36 51 116 Aeshna verticalis 8.6 14 3 1 18 Ischnura ramburii 0.0 0 0 4 4
Amphiagrion saucium 6.4 6 2 3 11 Ischnura verticalis 3.4 13 35 42 90
Anax junius 5.1 20 21 19 60 Lanthus vernalis 7.5 1 1 0 2 Anax longipes 8.3 5 0 1 6 Lestes congener 5.7 10 6 7 23
Argia apicalis 1.9 0 3 5 8 Lestes disjunctus 6.7 18 15 5 38
Argia fumipennis 4.6 23 31 29 83 Lestes dryas 3.3 0 2 1 3 Argia moesta 2.6 2 6 11 19 Lestes eurinus 8.0 11 2 2 15
Argia translata 2.0 0 2 3 5 Lestes forcipatus 5.9 21 21 11 53
Arigomphus furcifer 6.7 5 2 2 9 Lestes inaequalis 5.8 17 16 10 43 Arigomphus villosipes 5.5 12 9 9 30 Lestes rectangularis 6.2 31 28 14 73
Basiaeschna janata 7.2 18 17 2 37 Lestes unguiculatus 0.0 0 0 2 2
Boyeria vinosa 5.8 9 11 5 25 Lestes vigilax 5.4 28 29 22 79 Calopteryx aequabilis 7.3 6 7 0 13 Leucorrhinia frigida 8.8 15 5 0 20
Calopteryx dimidiata 5.3 7 6 6 19 Leucorrhinia glacialis 10.0 1 0 0 1
Calopteryx maculata 5.7 31 33 20 84 Leucorrhinia hudsonica 7.8 6 2 1 9 Celithemis elisa 5.7 22 18 14 54 Leucorrhinia intacta 6.3 20 19 8 47
Celithemis eponina 4.6 6 9 8 23 Leucorrhinia proxima 8.8 3 1 0 4
Celithemis fasciata 7.7 9 5 1 15 Libellula auripennis 10.0 0 0 0 0 Celithemis martha 6.5 10 2 5 17 Libellula axilena 8.8 3 1 0 4
Chromagrion conditum 6.7 31 21 10 62 Libellula cyanea 6.4 20 15 8 43 Cordulegaster diastatops 8.5 9 4 0 13 Libellula deplanata 8.3 2 1 0 3
Cordulegaster maculata 7.5 7 4 1 12 Libellula exusta 8.1 27 9 3 39
Cordulegaster obliqua 10.0 2 0 0 2 Libellula incesta 5.4 29 28 22 79 Cordulia shurtleffi 8.3 2 1 0 3 Libellula julia 10.0 5 0 0 5
Didymops transversa 7.5 6 6 0 12 Libellula luctuosa 4.0 10 26 22 58
Dorocordulia lepida 8.8 22 5 1 28 Libellula lydia 6.0 26 19 14 59 Dorocordulia libera 10.0 6 0 0 6 Libellula needhami 1.0 0 1 4 5
Dromogomphus spinosus 3.5 3 6 8 17 Libellula pulchella 4.2 7 8 11 26
Enallagma aspersum 5.6 16 14 11 41 Libellula quadrimaculata 8.9 7 2 0 9 Enallagma boreale 7.9 8 3 1 12 Libellula semifasciata 7.5 13 4 3 20
Enallagma civile 4.0 17 23 32 72 Libellula vibrans 5.0 2 3 2 7
Enallagma cyathigerum 7.5 3 3 0 6 Macromia illinoiensis 6.0 7 4 4 15 Enallagma daeckii 6.9 8 2 3 13 Nannothemis bella 7.5 6 6 0 12
Enallagma divagans 5.6 20 18 14 52 Nasiaeschna pentacantha 7.1 5 7 0 12
Enallagma doubledayi 5.9 8 3 5 16 Nehalennia gracilis 7.3 21 15 3 39 Enallagma durum 1.3 0 1 3 4 Nehalennia integricollis 10.0 1 0 0 1
Enallagma ebrium 5.7 4 8 2 14 Nehalennia irene 6.0 9 11 4 24
Enallagma exsulans 2.1 1 7 13 21 Neurocordulia obsoleta 7.5 1 1 0 2 Enallagma geminatum 4.7 28 30 33 91 Ophiogomphus aspersus 9.4 7 1 0 8
Enallagma hageni 6.5 5 3 2 10 Ophiogomphus mainensis 8.8 3 1 0 4
Enallagma laterale 6.4 14 8 6 28 Pachydiplax longipennis 4.1 21 22 36 79 Enallagma minusculum 6.1 3 5 1 9 Pantala flavescens 3.1 2 4 7 13
Enallagma pictum 7.5 7 1 2 10 Pantala hymenaea 2.3 0 5 6 11
Enallagma recurvatum 8.2 10 3 1 14 Perithemis tenera 3.9 11 19 23 53 Enallagma signatum 3.7 9 25 24 58 Progomphus obscurus 8.8 3 1 0 4
Enallagma traviatum 4.3 4 12 7 23 Somatochlora georgiana 9.0 4 1 0 5
Enallagma vesperum 4.5 4 9 6 19 Somatochlora linearis 8.8 10 3 0 13 Enallagma weewa 7.1 5 0 2 7 Somatochlora tenebrosa 8.8 24 8 0 32
Epiaeschna heros 6.7 5 2 2 9 Somatochlora walshii 9.0 4 1 0 5
Epitheca canis 8.8 3 1 0 4 Somatochlora williamsoni 10.0 3 0 0 3 Epitheca cynosura 6.3 32 31 12 75 Stylogomphus albistylus 6.4 8 7 3 18
Epitheca princeps 5.8 7 7 4 18 Stylurus scudderi 6.7 1 2 0 3
Epitheca spinigera 8.8 3 1 0 4 Stylurus spiniceps 5.0 0 2 0 2 Erythemis simplicicollis 5.3 20 23 16 59 Sympetrum costiferum 4.5 4 2 5 11
Erythrodiplax berenice 3.7 5 7 11 23 Sympetrum internum 5.0 34 34 34 102
Gomphaeschna antilope 7.5 1 1 0 2 Sympetrum rubicundulum 4.2 2 6 4 12
Gomphaeschna furcillata 8.5 16 7 0 23 Sympetrum semicinctum 7.0 13 9 3 25
Gomphus abbreviatus 5.0 1 2 1 4 Sympetrum vicinum 5.6 21 16 15 52
Gomphus adelphus 8.0 3 2 0 5 Tramea carolina 5.3 7 2 6 15 Gomphus exilis 7.1 34 28 6 68 Tramea lacerata 5.0 8 8 8 24
Gomphus lividus 7.8 6 2 1 9 Williamsonia lintneri 7.5 3 3 0 6
Gomphus spicatus 10.0 2 0 0 2

35
Table 3. Odonata Index of Wetland Integrity (OIWI) values and effort data from 51
wetland assessment units in Rhode Island; information is listed in decreasing order of
OIWI
Wetland Unit OIWI # Visits # Specimens # Species
SMA-ARC-BFFEN 7.16 8 26 17
SMA-ARC-WD3 7.06 11 24 14
AUD-EPP-QR4 6.82 5 11 6
SMA-CAR-WLPD 6.79 9 34 11
PRV-BOTH-PND 6.78 7 124 47
AUD-FISH-BRK 6.77 5 14 10
TNC-XXX-QR2 6.74 30 69 37
PRV-MAIL-FEN 6.72 3 10 5
SMA-ARC-RBPD 6.72 5 62 29
PRV-GRSY-PND 6.69 8 19 7
SMA-BIG-CAP 6.64 18 105 43
TNC-ELL-PND 6.64 3 14 8
SMA-DUR-TEPE 6.53 5 55 29
PRV-PED-PND 6.46 4 28 14
PRV-MOW-BRK2 6.45 5 13 9
PRV-HART-BOG 6.40 4 50 24
SMA-GSW-CHIP7 6.36 3 18 11
PRV-SNAKE-POW 6.34 5 16 8
PRV-JACK-SCPD 6.29 3 15 15
SMA-CAR-FISH 6.29 16 37 18
PRV-R216-POW 6.28 5 16 13
PRV-PYSZ-FEN 6.26 10 34 19
AUD-CARD-SWP 6.24 5 41 23
SMA-WOO-IMP 6.24 17 99 34
PRV-GLAC-PND 6.16 8 54 22
PRV-FORG-GRN1 6.10 18 55 23
PRV-BRCH-STA1 6.01 6 64 36
SMA-ARC-MOON 5.93 7 13 8
SMA-GWMA-OKPD 5.92 7 32 19
SMA-BUCK-PD1 5.88 6 34 21
TNC-CRTR-WET1 5.83 4 17 4
AUD-NEW-PND 5.82 4 53 24
PRV-XXX-PWT5 5.65 6 26 15
PRV-SLTR-PRK0 5.49 5 16 11
PRV-HUNT-STA3 5.37 5 57 21
PRV-BUTT-PND 5.32 4 20 12
PRV-THIR-PND 5.27 4 10 9
PRV-TEN-RIV1 5.17 10 36 19
PRV-WOON-STA3 5.14 10 34 16
PRV-CARR-PND 5.13 5 19 9
PRV-LONS-MRSH 5.13 5 15 10
PRV-EVAN-PND 5.11 4 17 12
PRV-ASHA-RIV2 5.04 6 17 13
PRV-XXX-PWT17 5.03 4 15 12
PRV-WAR-RES 4.95 14 43 21
PRV-WOON-STA4 4.95 4 22 11
PRV-BLRD-PARK 4.94 8 22 9
PRV-MITC-PND 4.85 3 25 13
PRV-MOSH-PND 4.78 10 55 17
PRV-NOTT-PD1 4.50 4 16 11
PRV-DMCR-PLAY 3.74 4 11 5

36
Table 4. Confidence limits (2.5th and 97.5th percentiles) of linear model fit between
individual RIRAM metrics (see Table 1) and the OIWI based on computer-intensive
resampling (1,000 iterations); metrics 1, 2 and 10 decreased with increased
disturbance whereas metrics 4 through 9 increased
Metric Low R2 High R2
1. Integrity of Buffers 0.579 0.787
2. Integrity of Surrounding Landscape 0.507 0.793
3. Impoundment 0.000 0.121
4. Draining or Diversion of Water 0.128 0.502
5. Anthropogenic Fluvial Inputs 0.212 0.650
6. Filling and Dumping 0.314 0.610
7. Excavation and Substrate Disturbances 0.013 0.245
8. Vegetation and Detritus Removal 0.001 0.238
9. Invasive Species within Wetland 0.183 0.545
10. Observed State 0.539 0.792

37
Fig. 1
Fig. 1 Performance of the OIWI: Odonata Index of Wetland Integrity for 51 wetland
sites in relation to the Rhode Island Rapid Assessment Method and % impervious
surface area (measured in a 305-m buffer around each site); model fit (R2) is based on
computer-intensive resampling with 1,000 iterations; best fit line is based on linear
regression
R2 = 0.294 - 0.589
3
4
5
6
7
8
0 20 40 60
%ISA
R2 = 0.537 - 0.803
3
4
5
6
7
8
20 40 60 80 100
RIRAM
OIW
I
38
Fig. 2
Fig. 2 Discriminating among disturbance designations: Box and whisker plots
depicting the distribution of OIWI values (n = 51) in relation to three reference
designations derived from RIRAM and ISA values, respectively; LD = least-disturbed,
ID = intermediately-disturbed, and MD = most-disturbed. The center dash represents
the median (a > b > c), the box represents the interquartile range, the whiskers
represent 2.5th and 97.5th percentiles, and the round symbols represent maximum and
minimum values
a b
c
a
ab
b

39
CHAPTER 2
Formatted in the style of Ecological Applications
Ecological mechanisms driving floristic quality assessment of wetland integrity
Thomas E. Kutcher 1,2 and Graham E. Forrester2
1Rhode Island Natural History Survey, University of Rhode Island, Kingston, RI,
02881
2Department of Natural Resources Science, University of Rhode Island, Kingston, RI,
02881
Email: [email protected]

40
Abstract
A biological indicator should be validated before it is used, but empirical validation
against a reference measure may introduce bias. Focusing on the assumptions and
mechanisms of indicator response rather than on increasing responsiveness to any one
measure can reduce bias and produce a more meaningful and useful metric. Floristic
Quality Assessment (FQA) is an example of a biological assessment approach that has
been widely tested for indicating freshwater wetland integrity, but less attention has
been given to clarifying the mechanisms controlling its response. FQA indices
quantify the aggregate of vascular plant species intolerance to habitat degradation
(conservatism), and variants have incorporated species richness, abundance, and
nativeness. To assess bias, we tested FQA variants in open-canopy freshwater
wetlands against three independent reference measures. FQA variants incorporating
species richness did not correlate with our reference measures and were influenced by
wetland size and hydrogeomorphic class. In contrast, FQA variants lacking measures
of species richness responded linearly to reference measures quantifying individual
and aggregate stresses, suggesting a broad response to cumulative degradation. FQA
variants incorporating non-native species improved performance over using only
native species, and incorporating relative species abundance improved performance
further. Our findings support recognized ecological theories that help clarify the
mechanisms and implications of FQA; specifically, aggregate conservatism declines
with increased disturbance; species richness increases with intermediate disturbance
and with unit area, confounding FQA response; non-native species are favored by
human disturbance, and are thus relevant to FQA; and proportional abundance of
41
species provides important information on community composition, bolstering FQA
relevance at the site level. Considering these mechanisms and their implications
allowed us to identify the most relevant and effective FQA measure of ecological
integrity for vegetated wetlands. We recommend an abundance-weighted FQA variant
incorporating non-native species and disregarding species richness for the assessment
of open-canopy vegetated wetlands.
Keywords
Biological indicator; ecological integrity; non-native species; intermediate disturbance
hypothesis; species richness; vascular plant; wetland assessment.

42
Introduction
Biological indicators (or bioindicators) are desirable for ecological assessment
because they can provide objective, reliable, and precise measures of environmental
condition (U.S. EPA 2006; Sifneos et al. 2010). Bioindicators can act as continuous,
integrative in-situ ecosystem monitors that may react predictably to multiple,
cumulative or synergistic environmental factors, and detect episodic events that
periodic physical or chemical monitoring may not capture (Barbour et al. 1996).
Bioindicators range in complexity from single indicator species to multivariate and
multi-metric indices based on multiple attributes of multiple taxa. Multivariate and
multi-metric indicators are attractive to practitioners interested in assessing ecological
integrity because they are more likely to capture overall ecosystem response to
environmental conditions (Karr 1991; Birk et al. 2012). The complexity of these
indicators may also, however, be a drawback if the component metrics show
interactive or countervailing responses that make the final indicator difficult to
interpret (Karr and Chu 1999).
To ensure its effectiveness in reflecting environmental conditions, a
bioindicator can be validated by assessing its response to degradation against a
reference measure of condition (U.S. EPA 2002). The conclusiveness of such
empirical validation, however, depends on the reference measure accurately reflecting
the targeted ecological condition; and on the reference study sample spanning the full
range of conditions in the habitat of interest (Karr 2006). But, due to the complexities
and variability of the natural world, such impeccable standards are unlikely to exist
(Cairns et al. 1993). The common practice of aggregating and calibrating attributes to
43
improve indicator response to a reference standard increases the risk of introducing
further bias due to circularity among the metrics.
Practitioners may be better served by focusing more on the implications of
indicator response to various reference measures, rather than on increasing
responsiveness to any one measure. Interpretation of response is central to indicator
utility and relies on a clear understanding of the underlying ecological mechanisms
driving response (Dale and Beyeler 2001; U.S. EPA 2002), but this is often
overlooked (Niemi and McDonald 2004; Birk et al. 2012). Floristic Quality
Assessment (FQA) is an example of a biological assessment approach that has been
widely tested, yet remains poorly understood because some of the underlying
mechanisms driving its functionality have not been clarified.
FQA is a biological assessment approach based on vascular plant species
conservatism (intolerance to habitat degradation). FQA applies “coefficients of
conservatism” (CC), ranging from 0 to 10, to rank the perceived intolerance of
individual plant species to habitat degradation caused by human disturbances.
Regional CC are typically assigned to species through the consensus of a panel of
expert botanists employing best professional judgment. Higher CC are assigned to
plants with narrower environmental tolerances and higher sensitivity to disturbance;
lower CC are assigned to species with broad tolerance to disturbance. FQA theory
holds that aggregate CC of all vascular plants occupying a natural area can reflect
environmental quality by quantifying the relative prevalence of conservative versus
tolerant species. Although FQA was originally developed as a means of applying
existing plant inventory data to indicate the conservation value of broad conservation

44
areas (Swink and Wilhelm 1979), recent work has demonstrated its efficacy in the
assessment of freshwater wetland integrity and restoration success using targeted
vegetation sampling (Lopez and Fennessey 2002, Cohen et el. 2004, Miller and
Wardrop 2006, Matthews et al. 2009; Bried et al. 2013).
The formula describing the original Floristic Quality Assessment Index (FQAI)
used only native species and is comprised of conservatism and species richness
(Swink and Wilhelm 1979). Specifically, FQAI weights the mean CC of native species
(Mean CCn) by the square root of the number of native species observed per site (a
proxy for native species richness) (Table 1). This original formula has attracted the
interest of freshwater wetland managers because it is based on plant species
composition, which is a keystone functional component of vegetated wetlands (Mitsch
and Gosselink 2000), and as such, is closely linked to wetlands management.
Additionally, FQAI is intuitively meaningful, combining measures of tolerance and
diversity, and can be derived using basic plant inventory methods (e.g. Lopez and
Fennessey 2002, Bourdaghs et al. 2006). As it has been tested and applied, however,
several studies have suggested that certain components and variants of the original
formula may better predict wetland integrity.
Rooney and Rogers (2002) report that Mean CCn alone may be a better
measure of ecological condition, since it does not incorporate species richness and
thus is not sensitive to sample size, preserves the information inherent in the CC, and
generates a more logical and understandable result. A Mean CC variant including non-
native species (Mean CCs, where s indicates total species), a variant weighting Mean
CCn by species abundance (Weighted mean CCn), and a weighted variant

45
incorporating non-native species (Weighted mean CCs) have been considered for
wetland assessment (Cohen et al. 2004; Bourdaghs et al. 2006; Bried et al. 2013). In
these variants, non-native species are typically assigned a CC of 0, regardless of their
actual conservatism. Miller and Wardrop (2006) demonstrated the effectiveness of
FQA expressed as the proportion of “maximum-attainable FQAI” (FQAI'), which
discounts species richness and incorporates non-native species, whereas Matthews et
al. (2009) demonstrated a version of the original FQAI incorporating both non-native
species and richness (FQAIt). Ervin et al. (2006) found that simply % Native,
discounting both richness and conservatism, outperformed FQAI.
As FQA gains recognition as an indicator of freshwater wetland condition,
there is a growing need to clarify the implications of selecting different FQA variants
for practitioners. While several variants of the original FQA metric have been
empirically validated, less attention has been given to comparing their ecological and
functional interpretation. Consequently, there has been considerable disagreement
among researchers in identifying the most effective and meaningful FQA metrics for
wetland assessment. In this paper, we empirically test several FQA variants from the
literature against independently-derived landscape, rapid, and biological reference
measures. By using three separate reference measures, we assess the robustness of
empirical validation to bias in reference measures. We apply data-collection methods
designed to be practical and effective for state and tribal assessment protocols, and
analyze how the FQA variants respond to practical reductions in sampling effort. We
then relate our empirical findings to ecological theory to clarify the validation results
and interpret the relative performance of the FQA variants. This information should
46
help practitioners to better plan assessments, interpret assessment findings, and
manage wetland resources.
Methods
Study Sample
Our study was conducted in Rhode Island, USA. Our study sample comprised
20 freshwater wetland sites selected from a larger set of 51 sites that had been
previously assessed using landscape, rapid, and biological assessment measures
(Kutcher and Bried 2014). These sites were generally open-canopy vegetated wetlands
with low tree cover (<50%) and substantial occurrence of emergent vegetation (>25%
cover). Study sites were selected to span a range of wetland conditions (according to
measures applied in Kutcher and Bried 2014) and types, and were spread
geographically across Rhode Island. The site boundaries were delineated by basin
continuity, bound by any combination of upland, riverine open water, or lacustrine
open water, large roads or railways lacking culverts, or changes in
hydrogeomorphology. The sites were not divided by vegetation type, thus a single site
could contain multiple vegetation community types.
Vegetation Sampling for FQA
To address the assumptions of FQA methodology, while considering metric
operability and user practicality, our vegetation sampling aimed to efficiently produce
a nearly-complete list of vascular plant species per site and estimate the relative cover
of each species. We also sought to standardize sampling effort according to site area.
Vegetation data were collected along three 4-m wide belt transects, the first running
47
centrally along the longest dimension of the site, and the remaining two running
perpendicular to the first at one-third and two-thirds the distance from the start of the
first transect. For riverine wetlands that were sinuous and narrow, the first transect was
composed of the fewest connected straight lines needed to approximately follow the
contours of the site. Transects were hand-drawn on aerial photographs prior to site
visits, and landmarks visible on the maps (such as evergreen trees, rocks, roads) were
used to navigate in the field. Transects were walked and, when necessary, canoed.
Every vascular plant observed was identified to species and recorded onto field
datasheets. Plants that could not be identified in the field were tagged and placed in
plastic bags for laboratory identification. The few immature samples that could not be
identified in the field or laboratory were not included in our analysis.
Following each transect, the abundance of each species was recoded as one of
three classes: rank 1 = scarce (<10% cover), rank 2 = common (10-60% cover), and
rank 3 = dominant (>60% cover). Site-wide mean ranks were used as replicates for
data analyses. Incidental observations of species observed outside the transects were
added to species totals and assigned a site-wide abundance rank of 1.
Generating FQA Indices
We assessed six FQA indices taken directly from prior studies, or developed
based on a logical extension of published, empirically-tested formulas (Table 1).
Values for each FQA index were calculated for each of our 20 study sites using recent
Rhode Island-specific plant CC. The CC of all vascular plant species known to exist in
Rhode Island were assigned by expert opinion of a regional expert botanist, according
to methods detailed in Bried et al. (2012). The CC were based mainly on each species’

48
relative sensitivity to human disturbances and, to a lesser degree, on niche width (R.
Enser, personal communication). Non-native species (not native to Rhode Island) were
assigned a CC of zero. In total, 1558 species were assigned CC ranging in value from
0 to 10 with a mean of 3.7 2.9 and a median of 3; non-native species comprised 28%
of these species. For the FQA indices that use species abundance, calculations were
made using midpoints of cover class ranges, where Rank 1 = 5% cover, Rank 2 = 35%
cover, and Rank 3 = 80% cover.
Three reference measures of wetland condition
Impervious Surface Area. Impervious surface area (ISA) values were
generated for each site as a landscape-level reference measure of wetland disturbance.
Using ESRI ArcMap® 9.3 GIS software, 305-m surrounding-area polygons were
generated for each site using the “buffer” command and selecting “outside only”.
Resulting surrounding-area polygons were used to clip recent high-resolution
impervious surface raster data. Resulting impervious surrounding-area raster data were
then coded and analyzed to determine the proportion of impervious cover surrounding
each site; this was used as the ISA value.
Rhode Island Rapid Assessment Method. Rhode Island Rapid Assessment
Method (RIRAM) data were collected according to the RIRAM User’s Guide
(Kutcher, 2010). RIRAM is an evidence-based rapid assessment method that was
developed to document wetland characteristics and produce a relative index of
freshwater wetland condition. RIRAM favors estimation over interpretation to
maximize objectivity. The RIRAM index is produced by rating and summing stressor
intensity and wetland integrity, which closely follows EPA wetland monitoring and

49
assessment guidelines (U.S. EPA 2006). Specifically, three sub-indices evaluating
landscape stresses, in-wetland stresses, and the integrity of wetland functional
characteristics are evaluated in the field and summed to generate a single index of
general wetland condition (App. 1). The RIRAM index is based on 100 possible
points, comprising ten metrics, each carrying ten points. A score of 100 indicates
undisturbed condition, and scores approaching zero would indicate extremely
disturbed conditions. RIRAM scoring is based on the assumption that the impacts of
diverse human disturbances additively contribute to the degradation of general
wetland condition (U.S. EPA 2006; Fennessy et al. 2004). RIRAM meets EPA criteria
for establishing wetland reference conditions (sensu, U.S. EPA 2006; Faber-
Langendoen et al. 2010).
RIRAM data were collected in a separate survey (Kutcher and Bried 2014),
one season prior to the vegetation surveys. Because RIRAM is partly subjective, a
single investigator conducted all RIRAM assessments for consistency. The perimeter
and multiple transects of each site were accessed when possible on foot or by canoe,
otherwise assessments were made by accessing and observing as many areas within
and around the site as possible. Field maps of each assessment site, produced using
GIS, were used for field orientation and determining wetland community and buffer
characteristics. Each map contained a backdrop of leaf-off, color aerial photography at
a scale sufficient to illustrate wetland habitats and surrounding land uses, and included
a delineation of the site, delineations of 30-m and 150-m buffer-zones, a scale bar, and
other identifying information. Data obtained during field investigations were recorded
50
on RIRAM field datasheets (App. 1) and complemented using GIS analysis before
data entry, as outlined in the RIRAM User’s Guide.
Odonata Index of Wetland Integrity. We used the Odonata Index of Wetland
Integrity (OIWI) as a biological reference measure of wetland disturbance (Kutcher
and Bried 2014). OIWI uses the aggregate conservatism of adult (winged) dragonflies
and damselflies (Insecta: Odonata) to indicate the relative ecological condition at a
given wetland assessment unit. Odonate CC were generated empirically by relating
recent survey data from a statewide Odonata atlas dataset to landscape features
according to Kutcher and Bried (2014). Briefly, GIS analysis was used to determine
the proportion of cultural land cover (i.e. developed and agricultural) within 300 m of
Odonata survey points. Land cover proportions were used to assign disturbance
classes, representing most-disturbed, intermediately disturbed, and least-disturbed
wetlands, to the survey points. The CC were generated by the relative proportion of
times a species was observed in each of the three disturbance categories. For the
current study, we refined odonate CC using additional survey data to Kutcher and
Bried’s (2014) analysis. Using existing atlas data, the OIWI value for each of our 20
study sites was calculated as the mean CC of odonate species observed at the site.
Relating FQA indices to reference conditions
Statistical analyses were conducted using WinSTAT® statistical software
(2006, R. Fitch Software) appended to Microsoft Excel® spreadsheet software. Rank-
based and non-parametric methods were used in most statistical analyses to
compensate for the ordinal nature of the RIRAM data and for the skews and gaps
inherent in the samples. Spearman rank correlation analysis was used to determine

51
which FQA index was best correlated with OIWI, RIRAM, and ISA values.
Additionally, box-and-whisker analysis was applied to evaluate FQA sensitivity to
reference designations, following Barbour et al. (1996). Specifically, three reference
classes were designated to the sites, based on 25th and 75th percentile RIRAM and
ISA index values, to identify most-disturbed (degraded) and least-disturbed
(reference-standard) thresholds, respectively (Stoddard et al. 2006). All other sites
(those with index values falling between the 25th and 75th percentiles) were considered
intermediately-disturbed. The degree of overlap in the distribution of FQA values
among these classes was used to evaluate FQA index performance, where non-
overlapping FQA index interquartile ranges (boxes) within most-disturbed and least-
disturbed reference designations indicate high sensitivity to disturbance and excellent
metric performance, whereas various degrees of interquartile-median overlap indicate
lower sensitivity and performance (Barbour et al. 1996; Veselka et al. 2010).
Reduced Effort Analysis
The effects of reduced sampling effort on the performance of FQA indices
were tested by re-calculating each FQA index with a sub-set of the data from each site,
and then re-running statistical analyses for comparison against full-effort results. We
assessed the effect of reducing effort in three ways: reducing the number of transects
sampled, reducing the number of plants used per transect, and reducing both.
Specifically, FQA indices calculated using vegetation data from a single (first)
transect were compared with values using all three transects. Next, FQA indices
calculated using only species with ≥10% cover (ranks 2 and 3) were compared to
indices calculated with species from all cover classes. Finally, FQA indices calculated

52
using only species with ≥10% cover surveyed in the first transect were compared with
indices using all species in all transects.
Results
Our 20 wetland study sites ranged in size from 0.3 to 30 acres with a mean of
6.3 acres, and fell into three hydrogeomorphic classes (modified from Brinson 1993):
isolated depression (n = 10), connected depression (n = 5), and floodplain riverine (n =
5). The most commonly represented vegetation classes (per Cowardin et al. 1979)
were emergent (in 20 sites), scrub-shrub (in 15 sites), and forested (in 12 sites)
wetlands. According to RIRAM data, the most commonly observed stresses within
sites were dams, roads, and multiple (a combination of stresses), whereas the most
common surrounding landscape stresses were raised roads, footpaths, and residential
development. Sixty percent (60%) of the sites were impounded by dams or roads, and
60% were partly filled to upland grade, primarily from public roads and development
filling. Sixteen invasive plant species were identified within 11 of the sites (Invasive
Plant Atlas of New England 2011). Common reed (Phragmites australis) was the most
common invader (25% of the sites). Invasive species cover ranged from none noted
(45% of the units) to high (51-75% cover at 10% of the units).
The vegetation surveys revealed 281 vascular plant species, of which 27 (10%)
were classified as non-native and 10 (3.6%) were classified as Rhode Island State
Heritage (rare) species. The number of species identified per site ranged from 19 to 96
with a mean of 50 21 and the percentage of non-native species ranged from 0 to
28%. The OIWI values ranged from 4.68 to 7.29 with a mean of 5.92 0.80; RIRAM

53
values ranged from 44.2 to 100 with a mean of 79.9 18.2; and ISA values ranged
from 0.00 to 62.4% with a mean of 11.5 17.1% (Table 2).
FQA Variant Performance
Differences among sites in four FQA index variants and in the proportion of
native species (% Native) were strongly correlated with our reference measures
(OIWI, RIRAM, and ISA), and none of these variants incorporated proxies of species
richness. The remaining two FQA indices, both of which incorporate information of
species richness, were not correlated with any reference measures and nor was the
number of native species identified. The total number of species identified increased
with increasing disturbance according to RIRAM (Table 3). In contrast, both proxies
of species richness, and the two floristic variants incorporating those proxies, were
strongly influenced by hydrogeomorphic class, whereas the other four FQA indices
were unaffected by hydrogeomorphology (Table 4).
Mean CCs, Weighted Mean CCs, and % Native index values were most
strongly correlated across the reference measures (rs > 0.80 across all, Table 3), and
were thus considered best-fit metrics in further analyses. The variant FQAI' was not
included as a best-fit metric because it is functionally similar to the more-
straightforward Mean CCs (discussed below). The best-fit metrics were significantly
correlated with several of the component metrics of the RIRAM index, suggesting that
a wide range of anthropogenic factors contributed to floristic variability (Table 5).
Distributions of Mean CCs and Weighted Mean CCs values were completely
non-overlapping between least-disturbed and most-disturbed reference categories
identified by RIRAM and ISA (Fig. 1). In contrast, the distributions of FQAI values
54
between least-disturbed and most-disturbed categories overlapped nearly completely
according to both reference measures. The FQAI distribution showed a tendency
toward higher values with intermediate disturbance according to RIRAM designations
(Kruskal-Wallace, H = 5.1, P = 0.08, n = 3).
Reduced Sampling Effort
Single-transect vegetation sampling of all cover classes (ranks 1-3) produced
15 to 71 vascular plant species per unit with a mean of 39 17; three-transect
sampling of only rank 2 and 3 cover classes (≥10% total cover) produced 3 to 10
species per unit with a mean of 6.1 2.1; and single-transect sampling of only rank 2
and 3 cover classes produced 3 to 12 species per unit with a mean of 6.9 2.4. The
strength of correlations between the best fit floristic indices and the reference
measures declined incrementally as sampling effort was reduced; this decline was
most pronounced for % Native with a reduction in cover classes sampled (Table 6).
Discussion
Assumptions of FQA
The various FQA metrics rely on underlying assumptions that are central to
their functionality as indicators of freshwater wetland integrity. Evaluating the validity
of these assumptions should clarify the utility of the FQA variants. Because they are
being applied to indicate broad wetland integrity rather than any single stressor, all
FQA variants operate under the general assumption that they will respond
monotonically to the cumulative effects of a range of human disturbances (U.S. EPA
2002). All variants also rely on the broad assumption that the signal of disturbance is

55
stronger than the signal of environmental noise caused by inherent variations in other
factors such as wetland size, species composition, basin morphology, and hydrology
(Bried et al. 2013).
Each individual species is ranked according to its perceived tolerance of
human impacts (= conservatism). Averaging these coefficients of conservatism across
species assumes that aggregating the responses of individual species to various human
disturbances will reflect the cumulative impacts of those disturbances. To support the
signal of aggregate conservatism, variants incorporating species richness must, then,
rely on the assumption that the number of native (or total) species identified at a
wetland will also decline with increasing disturbance. Variants excluding non-native
species operate under the assumption that non-native species are irrelevant to
aggregate conservatism, as they are not original inhabitants and thus cannot be
evaluated on that scale (Swink and Wilhelm 1979). And, in the context of assessing
wetland integrity (as opposed to conservatism, per se), the deliberate exclusion of non-
native species must also assume that non-native species confound the signal of
wetland health. Conversely, variants incorporating non-native species hold the
assumption that non-native species are non-conservative (i.e. tolerant to disturbances)
and meaningfully vary with wetland health. Lastly, variants incorporating species
abundance operate under the assumption that the relative abundance of species
provides important information over their presence alone.
Implications of empirical analysis
Evaluated against our three reference measures (ISA, RIRAM, OIWI), the
original FQAI did not effectively indicate wetland condition across our study sample,
56
whereas FQA variants excluding species richness (Mean CCn, Mean CCs, Weighted
Mean CCs, and FQAI') were strongly correlated with all three reference measures;
those richness-free variants incorporating non-native species (Mean CCs, Weighted
Mean CCs, and FQAI') outperformed the variant based strictly on native species
(Mean CCn); and additionally incorporating species cover increased performance
further (Weighted Mean CCs). Interestingly, the percentage of native species alone (%
Native) was most-strongly correlated with RIRAM and ISA in full-effort sampling.
Based on the empirical outcomes, our findings suggest that richness confounded the
FQA models; non-native species were important and perhaps driving components of
FQA functionality; and species abundance enhanced FQA performance.
Consistently strong correlations with our reference measures demonstrate the
ability of the best-fit (richness-free) FQA variants to respond to indirect (ISA) and
direct (RIRAM) stresses and impacts, and support the validity of FQA as a meaningful
biological indicator, responding in concert with, or perhaps as a factor in, the response
of Odonata species aggregate conservatism (OIWI). Non-overlapping interquartile
ranges between least-disturbed and most-disturbed categories in box plot analyses
indicate excellent sensitivity of the best-fit floristic variants to categories of wetland
disturbance (per Barbour et al. 1996).
Strong, significant correlations of the best-fit variants with multiple RIRAM
metrics and submetrics suggest the efficacy of floristic assessment measures in
integrating and reflecting the cumulative impacts of wetland disturbances, a desirable
trait for the broad assessment of ecological integrity (Karr and Chu 1999).
Interestingly, none of the floristic measures was strongly correlated with RIRAM

57
metrics rating hydrologic modification, including impoundment, draining or diversion
of water, and apparent hydrologic integrity, even though 60% of the units were at least
partly impounded. This suggests that hydrologic modification does not strongly affect
the aggregate conservatism or proportional nativeness of plant species, even though it
is known to largely control species composition (Mitsch and Gosselink 2000). It
further implies a resilient adaptability of wetlands to hydrologic change, suggests that
impoundment does not favor non-native over native species, and suggests the potential
for high quality wetlands to persist in artificial water regimes. In this light, FQA may
not be a reliable indicator of hydrologic modifications. More study is needed to clarify
the response of floristic quality to specific human disturbances.
Floristic conservatism as an indicator of wetland integrity
Aggregate conservatism of native species (Mean CCn)—a strictly independent
measure from species richness and from the proportion of native species—was
strongly correlated with all three of our reference measures, suggesting that aggregate
conservatism (according to our CC) is an effective indicator of wetland condition.
Additionally, correlation with our additive, multi-metric assessment measure
(RIRAM) suggests that plant conservatism is sensitive to cumulative wetland
degradation, allowing assessment across the continuum of wetland integrity (U.S. EPA
2002; Faber-Langendoen 2009). Conservatism is grounded in the most basic
ecological tenet of competitive exclusion, wherein environmental conditions will favor
certain species to the competitive exclusion of others. Conservatism simply holds that
habitat disturbances will create conditions that favor disturbance-tolerant species to
58
the exclusion of conservative species. Thus, conservatism is intuitively relevant as an
indicator of environmental degradation, or loss of integrity.
In theory, aggregate plant species conservatism is an exemplary indicator for
assessing freshwater wetland integrity. It is easily measured and non-destructive; it is
broadly applicable, as vascular plants occur in most wetlands; its response is easily
understood and interpreted; it measures a wetland characteristic that is closely tied to
management concerns; and our findings suggest that it is integrative, aggregating the
responses of multiple species to various human disturbances (Cairns et al. 1993; Dale
and Bayler 2001; Karr 2006).
Species richness as a component of FQA
Species richness is a commonly used attribute in biological assessment,
generally used as a proxy for community diversity, which is considered to reflect
conservation value and increase habitat productivity, resiliency, and functionality
(Tilman et al. 1996; Knops et al. 1999; Myers et al. 2000; Rosset et al. 2013). These
benefits suggest that increasing species richness should therefore indicate increasing
habitat quality. But these assumptions are not functionally applicable to the
assessment of ecological integrity (Keough and Quinn 1991). Foremost, the
Intermediate Disturbance Hypothesis (Connell 1978) predicts that species richness
should increase with moderate disturbance and then decrease with severe disturbance,
thus species richness does not consistently follow the monotonic trend best suited for
reliable indicator function. In the human-dominated landscapes that are now almost
universal in our study region, disturbances favor fast-growing opportunistic
colonizers, such as ubiquitous invasive species (Didham et al. 2005). And while

59
invasive species domination can decrease species richness at the patch level (Silliman
and Bertness 2004), patchy or incomplete incursions (indicating intermediate
disturbance) should increase richness at the habitat level, a hypothesis our findings
support (Catford et al. 2012). Moreover, high species richness is not a necessary
hallmark of productive, resilient habitats (Grime 1997). For example, salt marshes are
among the most productive, stable, and important ecosystems on earth, even as they
are low in species diversity (Waide et al. 1999).
Additionally, the number of species identified at a site is a function of site area
and sampling effort (Connor and McCoy 1979; Gotelli and Colwell 2001; Rooney and
Rogers 2002). In theory, FQA requires a complete floristic inventory, but this is not
often practical, particularly for large or complex areas. Our belt-transect sampling
method was designed to normalize effort according to site area, yet floristic measures
incorporating species richness tended to vary with site area. Fully standardizing
sampling effort could potentially lessen those effects, but a small standardized sample
size would diminish the FQA mechanism and accuracy of richness estimates in larger
or more complex sites, whereas a large standardized sample size would increase effort
to an impractical level. Bourdaghs et al. (2006) addressed this conundrum by
averaging FQAI scores from several equal-sized subunits within a site. But, their
method diminishes the metric’s intended mechanism of quantifying the benefits of
site-level species richness, and does not address the potential confounding effects of
species richness increasing with intermediate disturbance.
We found that species richness clearly impeded the ability of FQA indices to
predict wetland condition. In their seminal FQA study, Lopez and Fennessy (2002)

60
applied the original FQAI to 20 depressional wetlands and found that FQAI was
significantly correlated with a disturbance index that evaluated buffer condition within
100 m, but subsequent studies have found that variants excluding species richness
more reliably vary with wetland condition (Cohen et al. 2004; Miller and Wardrop
2006; Matthews et al. 2009; Vaselka et al. 2010; Bried et al 2013). Indeed, our current
study found that native species richness (N) was not correlated with any measure of
wetland condition, and that total species richness (S; driven by non-native species
richness) increased with greater disturbance according to RIRAM, a trend that
counteracts the decrease in conservatism (with increased disturbance) that drives FQA
evaluation.
Moreover, we found that richness-weighted measures varied with
hydrogeomorphic class, consistent with other recent findings (Bried et al. 2013). This
suggests that species richness is innately variable across wetland types (independent of
condition). In practice, richness-weighted metrics should therefore necessitate
additional classification restrictions compared to metrics based on conservatism alone.
Reduced classification restrictions can benefit ecological assessment programs
because classification parameters are partly subjective and therefore add assessment
bias, and because such restrictions diminish the user’s capability to compare the
relative condition of wetlands varying in size and type. So, although FQAI could
conceivably be appropriate in situations where native species richness is known to
monotonically decrease with increased disturbance (e.g. wetlands of similar type and
size), ecological theory clearly predicts that richness will more-often confound the
indicator value of FQA, as supported by our empirical findings. We therefore

61
recommend that practitioners avoid using richness-weighted FQA variants, reserving
richness proxies of native, total, and non-native species as separate metrics to be
interpreted with respective cautions and in the appropriate context.
Non-native species and FQA
Of the FQA variants designed to eliminate the effects of species richness, those
incorporating non-native species (Mean CCs, Weighted Mean CCs, and FQAI') were
most-strongly associated with our reference measures. Cohen et al. (2004) reported
slightly-improved performance by including non-native species in Mean CC (Mean
CCs over Mean CCn), whereas later studies report no performance differences among
FQA metrics with and without non-native species incorporated (Bourdaghs et al.
2006; Miller and Wardrop 2006). FQA variants that include non-native species
generally assume that all non-native species are tolerant to, or thrive on human
disturbances (i.e. are non-conservative), as implied by the default CC designation of
zero (0). While this cannot be absolutely true, due to inherent variation among species,
our findings strongly suggest that non-native species enhance FQA indication of
wetland integrity.
The prevalence of non-native species alone (% Native), was strongly correlated
with our reference measures and with multiple RIRAM component metrics,
suggesting its broad indication of wetland integrity, and supporting the assumption
that non-native species are inversely linked to ecological integrity. Ervin et al. (2006)
similarly found that non-native species richness outperformed FQAI in indicating
wetland disturbance, and contend that, because non-native species are integral in
wetland species composition, non-native species should be included in FQA unless
62
otherwise indicated. Our study region is widely developed and dominated by novel
ecosystems containing few to many non-native species. The % Native metric may not
perform as well in less-developed areas containing fewer opportunities for non-native
species establishment, and the influence of native species conservatism may dominate.
Additionally, relative nativeness may not be as reliable a measure of human
disturbance across broad conservation areas containing multiple habitat types (Vacher
et al. 2007). However, % Native is ecologically relevant at the wetland site level even
in the absence of empirical support. Non-native species both indicate human
disturbances and diminish wetland integrity, in that they are often fast-growing
colonizers that can establish quickly following disturbances and, subsequently, can
outcompete native species for critical resources, degrade habitat value for native
fauna, and diminish a host of other ecosystem values (Didham et al. 1996).
The formulas of two richness-free FQA variants that incorporate non-native
species, Mean CCs and FQAI', may appear dissimilar, but in function they are nearly
equivalent. Miller and Wardrop (2006) present FQAI' as “FQAI relative to maximum-
attainable FQAI” (Table 1 second column), but this is algebraically equivalent to the
product of Mean CCn and the square root of the proportion of native species ( 10,
which in relative terms is irrelevant). Similarly, because the assigned CC for any non-
native species is typically zero (0), Mean CCs is equivalent to the product of Mean
CCn and the proportion of native species (% Native; Table 1, fourth column). So
functionally, FQAI' only differs from Mean CCs in that the effects of non-native
species are reduced by applying the square root in the former. Equal performance of
FQAI' and Mean CCn (Miller and Wardrop 2006), coupled with improved
63
performance of Mean CCs over Mean CCn (Cohen et al. 2004; this study), suggest that
buffering the proportion of native species is unnecessary or perhaps
counterproductive.
The straightforward Mean CCs (simply the mean conservatism of all species)
thus prevails as the most effective and parsimonious measure among non-weighted
FQA variants. Additionally, because Mean CCs is equivalent to the product of Mean
CCn and % Native, these attributes could also be evaluated separately to increase user
understanding of assessment outcomes, as they can indicate the extent of non-native
invasion and the integrity of the remaining native population. Combined, the utility
and simplicity of Mean CCs may benefit practitioners seeking an understandable and
reliable single metric with which to evaluate general wetland condition.
Incorporating Abundance in FQA
Although Mean CCs may indeed be a straightforward and efficient indicator of
wetland condition, it is functionally incomplete. Species composition is commonly
described in terms of identity, species richness, and abundance (often relative
abundance). While species richness often confounds disturbance measures, both
identity (represented by Mean CCs) and relative abundance are relevant and practical
for describing site conditions. Cohen et al. (2004) found that Weighted Mean CCn
slightly outperformed Mean CCn, suggesting that incorporating species abundance
could improve metric performance. Further improvement should be gained by
incorporating non-native species (Weighted Mean CCs, Table 1) for reasons offered
above, and indeed Weighted Mean CCs performed better than Mean CCs in this current
study. But the ecological and practical implications of abundance in FQA are relevant

64
even in the absence of such empirical improvement; this can be clarified if taken to a
reasonable extreme. Consider two wetlands with identical plant species but differing
in that one is dominated by an aggressive non-native invader, such as the common
reed Phragmites australis, with a remnant section of native vegetation, whereas the
other is dominated by native vegetation with a single stem of P. australis. Measured
by Mean CCs, the two wetlands would be scored equally. In contrast, Weighted Mean
CCs would incorporate and reflect habitat degradation associated with P. australis
domination, lowering the index value. Among wetlands with more even species
distributions, Weighted Mean CCs would function nearly equivalently to Mean CCs.
The weighted FQA variant therefore provides a more relevant and defensible
indication of wetland condition at the site scale, which is particularly important for
comparing assessment outcomes.
Sampling Effort and Performance
Practitioners must consider three matters associated with sampling effort in
floristic assessment. The first and primary consideration is index performance
(reliability); the second is the logistical feasibility of the method in terms of available
botanical expertise; and the third is the feasibility of the method in terms of the
amount of time the method takes. Our full-effort sampling time was practical, usually
completed in less than three hours of field work and an hour or two of laboratory
support. Botanical expertise may therefore pose the most likely limitation to
practitioners. A reduction in the number of transects sampled per unit (from three to
one) had the smallest (of the reduced-effort methods evaluated) negative effect on
best-fit metric performance and could reduce in-wetland sampling time by as much as
65
67%. But because most species are typically identified in the first transect, single-
transect sampling would not alleviate limitations of botanical expertise or reduce
laboratory identification time. Even single-transect assessment using % Native would
not alleviate botanical expertise limitations because the investigator would still need to
identify all species observed to determine their nativeness.
In contrast, reduced cover-class sampling greatly reduces species identification
requirements (from a mean of 50 species per wetland for full-effort sampling to a
mean of 6 or 7 and as few as 3), greatly alleviating expertise and time limitations; but
it also reduces precision. Our findings suggest that this loss may be inversely related to
the complexity of the FQA model. The precision of % Native, based only on the
proportion of nativeness, declined considerably using reduced-cover-class sampling;
Mean CCs, which incorporates proportional nativeness and conservatism (see Table 1,
last column), was less-strongly affected; and the precision of Weighted Mean CCs,
which incorporates proportional nativeness, conservatism, and relative abundance, was
not strongly affected. Lastly, reduced sampling of transects and cover-classes
incrementally decreased floristic metric performance, relative to RIRAM and ISA.
Most effective FQA Variants
Overall, the abundance-weighted Weighted Mean CCs slightly outperformed
Mean CCs against our reference measures and was the most stable floristic measure in
maintaining indicator precision when cover-class sampling effort was reduced. Prior
studies suggest that the apparent increase in effectiveness gained by incorporating
abundance classes is not worth the extra sampling effort (Cohen et al. 2004;
Bourdaghs et al. 2006). But the sampling methods developed for this study, which
66
focused on species identification and the estimation of broad cover classes, added little
extra effort over identity sampling alone (~3 min. per transect × 3 transects = ~9 min.
per unit for full-effort sampling), and applying the cover classes to Mean CCs was a
straightforward spreadsheet operation. Furthermore, the apparent increased stability of
Weighted Mean CCs (over the other floristic measures) with a reduction in cover-class
sampling effort suggests resilience to sampling biases, and may be important in cases
where reduced-effort sampling is appropriate. We believe that the increased precision
of Weighted Mean CCs is worth the small added increase in effort, particularly for
evaluating individual wetlands. And although Weighted Mean CCs is operationally
somewhat more complex than Mean CCs, the concept remains straightforward and
intuitive: mean conservatism of all species, weighted by relative cover. We therefore
recommend Weighted Mean CCs for wetland condition categorizations, and the
components Mean CCn and % Native for further interpreting the ecological
significance of the results.
Methodology
Our vegetation sampling method for abundance-weighted metrics applied three
cover classes to increase producer precision (repeatability) at the cost of accuracy.
Using five or six cover classes is a more common approach for estimating vegetation
cover (Mueller-Dombois and Ellenberg 1974), but this is typically applied to smaller
plots from which cover classes are easier to estimate, compared with the long, wide
transects used in this study. Estimating five cover classes could potentially increase
the precision of the Weighted Mean CCs, but could also require additional time
estimating cover per transect in the field. The small increase in the performance of

67
Weighted Mean CCs relative to Mean CCs suggests that further gains associated with
more precise cover classes may be unnecessary to retain the benefits of weighted
sampling discussed above.
The tradeoff between practicality and reliability of the FQA method will need
to be considered for implementation, perhaps on a per-project basis. Critical
applications of floristic assessment would be best-served by running the full sampling
method and applying the data to Weighted Mean CCs. Running reduced-cover-class
sampling across three transects and applying the data to Weighted Mean CCs could
potentially be an efficient method for less critical evaluations, but this needs further
study before it is put into practice. Testing the best-fit FQA metrics and sampling
methods on a larger study sample would clarify these tradeoffs, which would be
helpful in developing more specific protocols for FQA implementation.
This study not only validates FQA, it also further supports the use of ISA,
RIRAM, and OIWI. While these measures are not entirely independent from each
other (e.g. both ISA and RIRAM, in part, incorporate landscape condition), they were
developed using a priori ecological principles and not by their inter-correlation or
correlation with any other single measure. It is therefore possible to evaluate these
measures against each other, and to use them in combination to increase assessment
reliability, or to better inform management. While this approach reduces the circularity
of calibration and reduces reference measure bias, our methods did not alleviate the
limitations of our study sample, which included only open-canopy vegetated wetlands.
Recent work has indicated that FQA may not be as effective in forested wetlands (T.
Portante, unpublished data). We recommend a rigorous study using multiple

68
independent reference measures for developing floristic variants best suited for
forested wetlands.
Conclusion
We used empirical validations and ecological theory to assess the underlying
assumptions and clarify the mechanisms of FQA. Our analysis discredits the
assumption that species richness supports FQA functionality by declining predictably
with wetland integrity. To the contrary, our findings suggest that richness will more
often confound FQA function without providing predictably meaningful information.
Our analysis supports the assumptions that aggregate conservatism will decline
predictably with increasing human disturbance; non-native species are relevant to
aggregate conservatism and effective in reflecting wetland ecological integrity; and
the relative abundance of species provides important information over species
presence alone. Our analysis suggests that the abundance-weighted FQA metric
incorporating non-native species responds meaningfully and predictably across a
gradient of ecological degradation, is relevant at the site level, and is resistant to the
confounding influences of unit size, sampling effort, and wetland type. As such, the
straightforward principles and methods of FQA can provide practitioners with a set of
practical, reliable, and informative tools for assessing freshwater wetland integrity.
Our methods demonstrate that a straightforward bioindicator can predictably
integrate and reflect the complex signal of cumulative environmental degradation. Our
empirical validation against three independently-derived reference measures
broadened the signal of wetland integrity and avoided circularity among our measures.
And, because we evaluated the significance of our empirical findings against
69
ecological principles, we are confident that our resulting indicator is responding to the
signal of disturbance over the biases of our reference measures, and we understand the
implications of that response for interpreting assessment outcomes. We recommend a
method of bioindicator validation that focuses on the relevance of indicator response
to reference conditions represented by multiple measures.
Acknowledgments
We thank Carolyn Murphy, Keith Killingbeck, Rick McKinney, Evan Preisser, and
Jason Bried for providing technical advice. David Gregg, Susan Kiernan, and Carolyn
Murphy administered this work, and Stacey Liecht Young, Grace Lentini, and Rick
Enser assisted with vegetation sampling and data summary. Kerry Strout and Jason
Bried coordinated the regional assignment of floristic coefficients of conservatism,
and Rick Enser assigned the coefficients of conservatism applied in this study. Rhode
Island Natural History Survey is housed by the University of Rhode Island, College of
the Environment and Life Sciences. This project was funded by the Rhode Island
Department of Environmental Management, Office of Water Resources, through a
Wetlands Program Development Grant awarded by the United States Environmental
Protection Agency.
Literature Cited
Barbour, M. T., J. Gerritsen, G. E. Griffeth, R. Frydenborg, E. McCarron, J. S. White,
and M. L. Bastain. 1996. A framework for biological criteria for Florida
70
streams using benthic macroinvertebrates. Journal of the North American
Benthological Society 15:185-211.
Birk, S., W. Bonne, A. Borja, S. Brucet, A. Courrat, S. Poikane, A. Solimini, W. Van
de Bund, N. Zampoukas, and D. Hering. 2012. Three hundred ways to assess
Europe's surface waters: an almost complete overview of biological methods to
implement the Water Framework Directive. Ecological Indicators 18:31-41.
Bourdaghs, M., C. A. Johnston, and R. R. Regal. 2006. Properties and performance of
the floristic quality index in Great Lakes coastal wetlands. Wetlands 26:718-
735.
Bried, J. T., K. L. Strout, and T. Portante. 2012. Coefficients of conservatism for the
vascular flora of New York and New England: inter-state comparisons and
expert opinion bias. Northeastern Naturalist, in press.
Bried, J. T., S. K. Jog, and J. W. Matthews. 2013. Floristic quality assessment signals
human disturbance over natural variability in a wetland system. Ecological
Indicators 34:260-267.
Brinson, M. M. 1993. A hydrogeomorphic classification for wetlands. Final Report to
the U.S. Army Corps of Engineers. Waterways Experiment Station, Vicksburg,
MS, USA. Technical Report WRP-DE-4.
Cairns Jr., J., P. V. McCormick, and B. R. Niederlehner. 1993. A proposed framework
for developing indicators of ecosystem health. Hydrobiologia 263:1-44.
Catford, J. A., et al. 2012. The intermediate disturbance hypothesis and plant
invasions: Implications for species richness and management. Perspectives in
Plant Ecology, Evolution and Systematics 14:231-241.
71
Cohen, M. J., S. Carstenn, and C. R. Lane. 2004. Floristic quality indices for the
assessment of depressional marsh condition in Florida. Ecological Applications
14:784-794.
Connell, J. H. 1978. Diversity in tropical rain forests and coral reefs. Science
199:1302-1310.
Connor, E. F. and E. D. McCoy. 1979. The statistics and biology of the species-area
relationship. American Naturalist 113:791-833.
Cowardin, L.M., V. Carter, F. C. Golet, and E. T. LaRoe, E.T. 1979. Classification of
wetlands and deepwater habitats of the United States. Office of Biological
Services, Fish and Wildlife Service, U.S. Department of the Interior,
Washington, DC.
Dale, V. H., and S. C. Beyeler. 2001. Challenges in the development and use of
ecological indicators. Ecological Indicators 1:3-10.
Didham, R. K., J. M. Tylianakis, M. A. Hutchison, R. M. Ewers, and N. J. Gemmell
2005. Are invasive species the drivers of ecological change? Trends in
Ecology & Evolution 20:470-474.
Ervin, G. N., B. D. Herman, J. T. Bried, and D. C. Holly. 2006. Evaluating non-native
species and wetland indicator status as components of wetland floristic
assessment. Wetlands 26:1114-1129.
Faber-Langendoen, D., R. Lyons, and P. Comer. 2009. Developing options for
establishing reference conditions for wetlands across the lower 48 states. A
report to the U.S. Environmental Protection Agency. NatureServe, Arlington,
VA. 51 pp.

72
Fennessy, M. S., A. D. Jacobs, and M. E. Kentula. 2004. An evaluation of rapid
methods for assessing the ecological condition of wetlands. Wetlands 27:543-
560.
Gotelli, N. J. and R. K. Colwell. 2001. Quantifying biodiversity: procedures and
pitfalls in the measurement and comparison of species richness. Ecology
Letters 4:379-391.
Grime, J. P. 1997. Biodiversity and Ecosystem Function: The Debate Deepens.
Science 277:1260-1261.
Karr, J. R. 1991. Biological integrity: a long-neglected aspect of water resource
management. Ecological Applications 1:66-84.
Karr, J. R. 2006. Seven foundations of biological monitoring and assessment. Biologia
Ambientale 20:7-18.
Karr, J. R. and E. W. Chu. 1999. Restoring Life in Running Waters; Better Biological
Monitoring. Island Press, Washington, DC.
Keough, M. and G. Quinn. 1991. Causality and the choice of measurements for
detecting human impacts in marine environments. Marine And Freshwater
Research 42:539-554.
Kentula, M. E. 2000. Perspectives on setting success criteria for wetland restoration.
Ecological Engineering 15:199-209.
Knops, J., D. Tilman, D. Haddad, S. Naeem, C. E. Mitchell, J. Haarstad, M. E. Ritchie
et al. 1999. Effects of plant species richness on invasion dynamics, disease
outbreaks, insect abundances and diversity. Ecology Letters 2:286-293.

73
Kutcher, T. E. 2011. Rhode Island rapid assessment method user’s guide; RIRAM
version 2.10. Rhode Island Department of Environmental Management, Office
of Water Resources, Providence, RI. 30 pp.
Kutcher, T. E. and J. T. Bried. 2014. Adult Odonata conservatism as an indicator of
freshwater wetland condition. Ecological Indicators 38:31-39.
Lopez, R. D. and M. S. Fennessey. 2002. Testing the floristic quality assessment index
as an indicator of wetland condition. Ecological Applications 12:487-497.
Matthews, J. W., G. Spyreas, and A. G. Emdress. 2009. Trajectories of vegetation-
based indicators used to assess wetland restoration progress. Ecological
Applications 19:2093-2107.
Myers, N., R. A. Mittermeier, C. G. Mittermeier, G. A. B. Da Fonseca, and J. Kent.
2000. Biodiversity hotspots for conservation priorities. Nature 403:853-858.
Miller, S. J., and D. H. Wardrop. 2006. Adapting the floristic quality assessment index
to indicate anthropogenic disturbance in central Pennsylvania wetlands.
Ecological Indicators 6:313-326.
Mitsch, W. J. and J. G. Gosselink. 2000. Wetlands, Third Edition. John Wiley and
Sons, New York. 920 pp.
Mueller-Dombois, D., and H. Ellenberg, 1974. Aims and Methods of Vegetation
Ecology. Wiley, New York. 547 pp.
Niemi, G. J. and M. E. McDonald 2004. Application of ecological indicators. Annual
Review of Ecology, Evolution, and Systematics 89-111.
Rooney, T. P. and D. A. Rogers. 2002. The Modified Floristic Quality Index. Natural
Areas Journal 22:340-344.
74
Rosset, V., J. P. Simaika, F. Arthaud, G. Bornette, D. Vallod, M. J. Samways, and B.
Oertli. 2013. Comparative assessment of scoring methods to evaluate the
conservation value of pond and small lake biodiversity. Aquatic Conservation:
Marine and Freshwater Ecosystems 23:23-36.
Sifneos, J. C., A. T. Herlihy, A. D. Jacobs, M. E. Kentula. 2010. Calibration of the
Delaware Rapid Assessment Protocol to a comprehensive measure of wetland
condition. Wetlands 30:1011-1022.
Silliman, B. R. and M. D. Bertness. 2004. Shoreline development drives invasion of
Phragmites australis and the loss of plant diversity on New England salt
marshes. Conservation Biology 18:1424-1434.
Stoddard, J. L., D. P. Larsen, C. P. Hawkins, R. K. Johnson, and R. H. Norris. 2006.
Setting expectations for the ecological condition of streams: the concept of
reference condition. Ecological Applications 16:1267–1276
Swink, F. and G. Wilhelm. 1979. Plants of the Chicago Region; Revised and
Expanded Edition with Keys. The Morton Arboretum, Lisle, IL.
Tilman, D., D. Wedin, and J. Knops. 1996. Productivity and Sustainability Influenced
by Biodiversity in Grassland Ecosystems. Nature 379:718-720.
U.S. EPA. 2002. Methods for evaluating wetland condition: Developing metrics and
indexes of biological integrity. Office of Water, U.S. Environmental Protection
Agency, Washington, DC. EPA 822-R-02-016.
U.S. EPA. 2006. Application of elements of a state water monitoring and assessment
program for wetlands. Wetlands Division, Office of Wetlands, Oceans and

75
Watersheds, U.S. Environmental Protection Agency, Washington, DC. EPA
841-B-03-003.
Vacher, K. A., K. T. Killingbeck, and P. V. August. 2007. Is the relative abundance of
nonnative species an integrated measure of anthropogenic disturbance?
Landscape Ecology 22:821-835.
Vaselka, W., J. S. Rentch, W. N. Grafton, W. S. Kordek, and J. T. Anderson. 2010.
Using two classification schemes to develop vegetation indices of biological
integrity for wetlands in West Virginia, USA. Environmental Monitoring and
Assessment 170:555-569.
Waide, R. B., M. R. Willig, C. F. Steiner, G. Mittelbach, L. Gough, S. I. Dodson, G. P.
Juday, and R. Parmenter. The relationship between productivity and species
richness. Annual Review of Ecology and Systematics 1999:257-300.
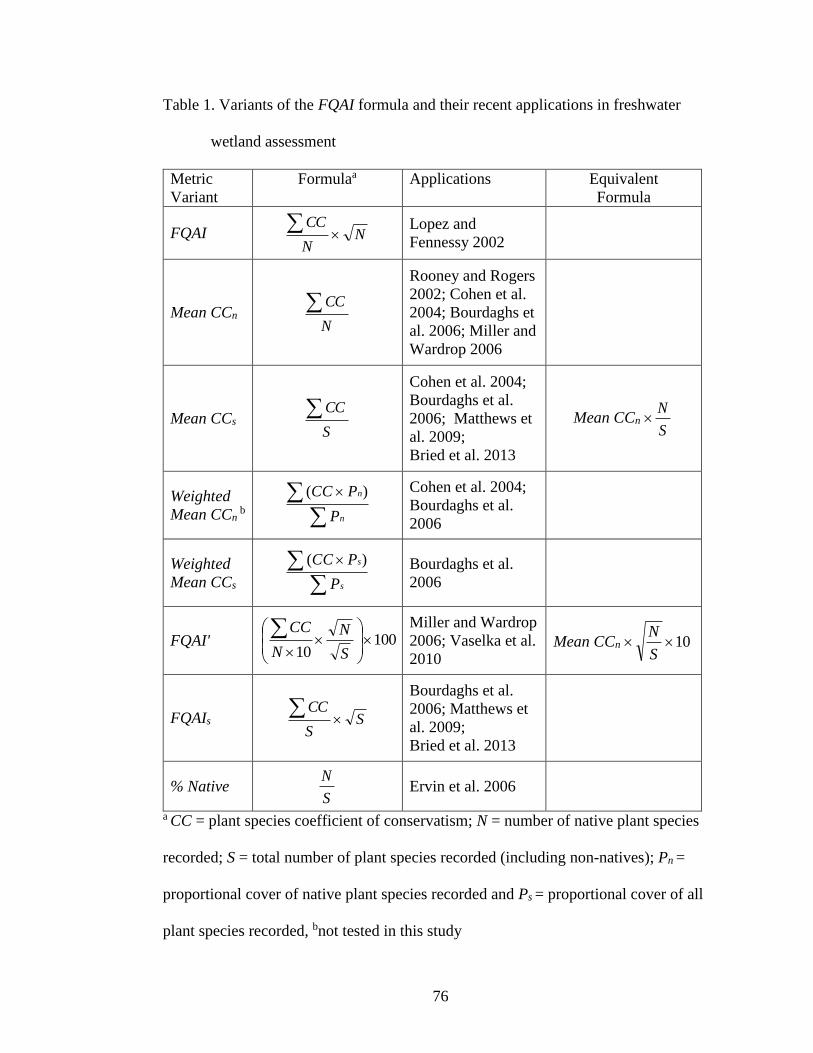
76
Table 1. Variants of the FQAI formula and their recent applications in freshwater
wetland assessment
Metric
Variant
Formulaa Applications Equivalent
Formula
FQAI Lopez and
Fennessy 2002
Mean CCn N
CC
Rooney and Rogers
2002; Cohen et al.
2004; Bourdaghs et
al. 2006; Miller and
Wardrop 2006
Mean CCs
Cohen et al. 2004;
Bourdaghs et al.
2006; Matthews et
al. 2009;
Bried et al. 2013
Mean CCn
Weighted
Mean CCn b
n
n
P
PCC )(
Cohen et al. 2004;
Bourdaghs et al.
2006
Weighted
Mean CCs
s
s
P
PCC )(
Bourdaghs et al.
2006
FQAI' Miller and Wardrop
2006; Vaselka et al.
2010 Mean CCn
FQAIs
Bourdaghs et al.
2006; Matthews et
al. 2009;
Bried et al. 2013
% Native Ervin et al. 2006
a CC = plant species coefficient of conservatism; N = number of native plant species
recorded; S = total number of plant species recorded (including non-natives); Pn =
proportional cover of native plant species recorded and Ps = proportional cover of all
plant species recorded, bnot tested in this study
NN
CC
S
CCS
N
10010
S
N
N
CC10
S
N
SS
CC
S
N
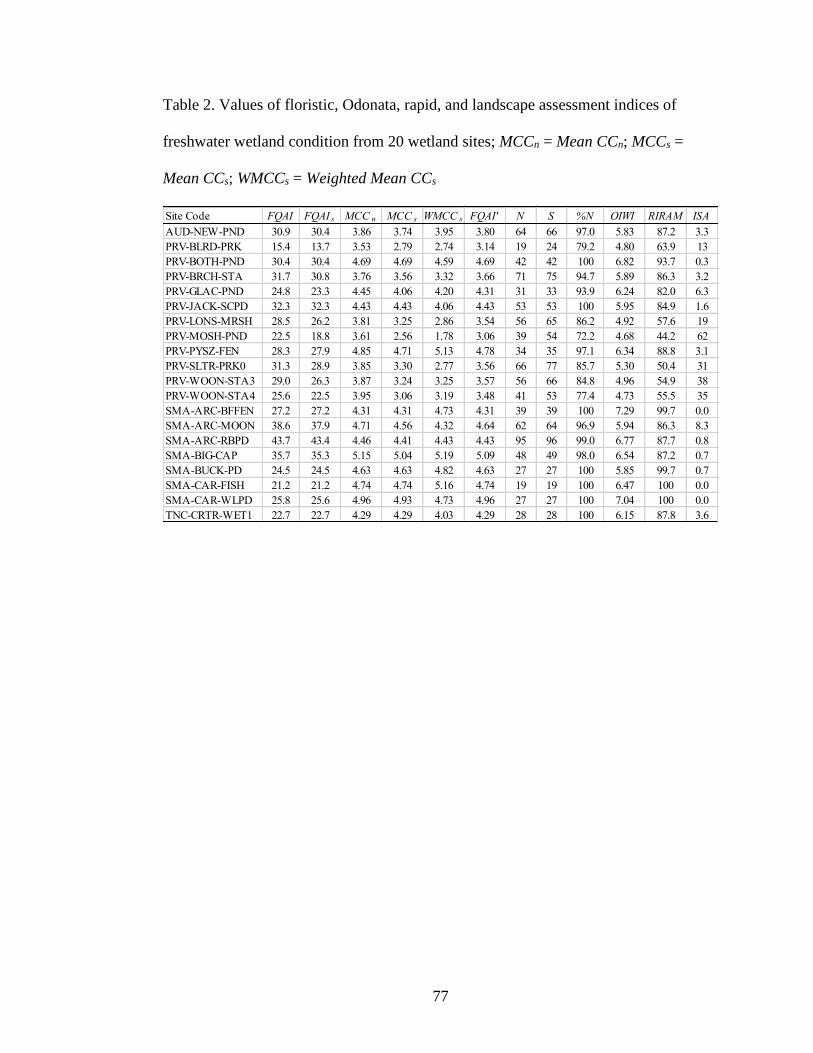
77
Table 2. Values of floristic, Odonata, rapid, and landscape assessment indices of
freshwater wetland condition from 20 wetland sites; MCCn = Mean CCn; MCCs =
Mean CCs; WMCCs = Weighted Mean CCs
Site Code FQAI FQAI s MCC n MCC s WMCC s FQAI' N S %N OIWI RIRAM ISA
AUD-NEW-PND 30.9 30.4 3.86 3.74 3.95 3.80 64 66 97.0 5.83 87.2 3.3
PRV-BLRD-PRK 15.4 13.7 3.53 2.79 2.74 3.14 19 24 79.2 4.80 63.9 13
PRV-BOTH-PND 30.4 30.4 4.69 4.69 4.59 4.69 42 42 100 6.82 93.7 0.3
PRV-BRCH-STA 31.7 30.8 3.76 3.56 3.32 3.66 71 75 94.7 5.89 86.3 3.2
PRV-GLAC-PND 24.8 23.3 4.45 4.06 4.20 4.31 31 33 93.9 6.24 82.0 6.3
PRV-JACK-SCPD 32.3 32.3 4.43 4.43 4.06 4.43 53 53 100 5.95 84.9 1.6
PRV-LONS-MRSH 28.5 26.2 3.81 3.25 2.86 3.54 56 65 86.2 4.92 57.6 19
PRV-MOSH-PND 22.5 18.8 3.61 2.56 1.78 3.06 39 54 72.2 4.68 44.2 62
PRV-PYSZ-FEN 28.3 27.9 4.85 4.71 5.13 4.78 34 35 97.1 6.34 88.8 3.1
PRV-SLTR-PRK0 31.3 28.9 3.85 3.30 2.77 3.56 66 77 85.7 5.30 50.4 31
PRV-WOON-STA3 29.0 26.3 3.87 3.24 3.25 3.57 56 66 84.8 4.96 54.9 38
PRV-WOON-STA4 25.6 22.5 3.95 3.06 3.19 3.48 41 53 77.4 4.73 55.5 35
SMA-ARC-BFFEN 27.2 27.2 4.31 4.31 4.73 4.31 39 39 100 7.29 99.7 0.0
SMA-ARC-MOON 38.6 37.9 4.71 4.56 4.32 4.64 62 64 96.9 5.94 86.3 8.3
SMA-ARC-RBPD 43.7 43.4 4.46 4.41 4.43 4.43 95 96 99.0 6.77 87.7 0.8
SMA-BIG-CAP 35.7 35.3 5.15 5.04 5.19 5.09 48 49 98.0 6.54 87.2 0.7
SMA-BUCK-PD 24.5 24.5 4.63 4.63 4.82 4.63 27 27 100 5.85 99.7 0.7
SMA-CAR-FISH 21.2 21.2 4.74 4.74 5.16 4.74 19 19 100 6.47 100 0.0
SMA-CAR-WLPD 25.8 25.6 4.96 4.93 4.73 4.96 27 27 100 7.04 100 0.0
TNC-CRTR-WET1 22.7 22.7 4.29 4.29 4.03 4.29 28 28 100 6.15 87.8 3.6
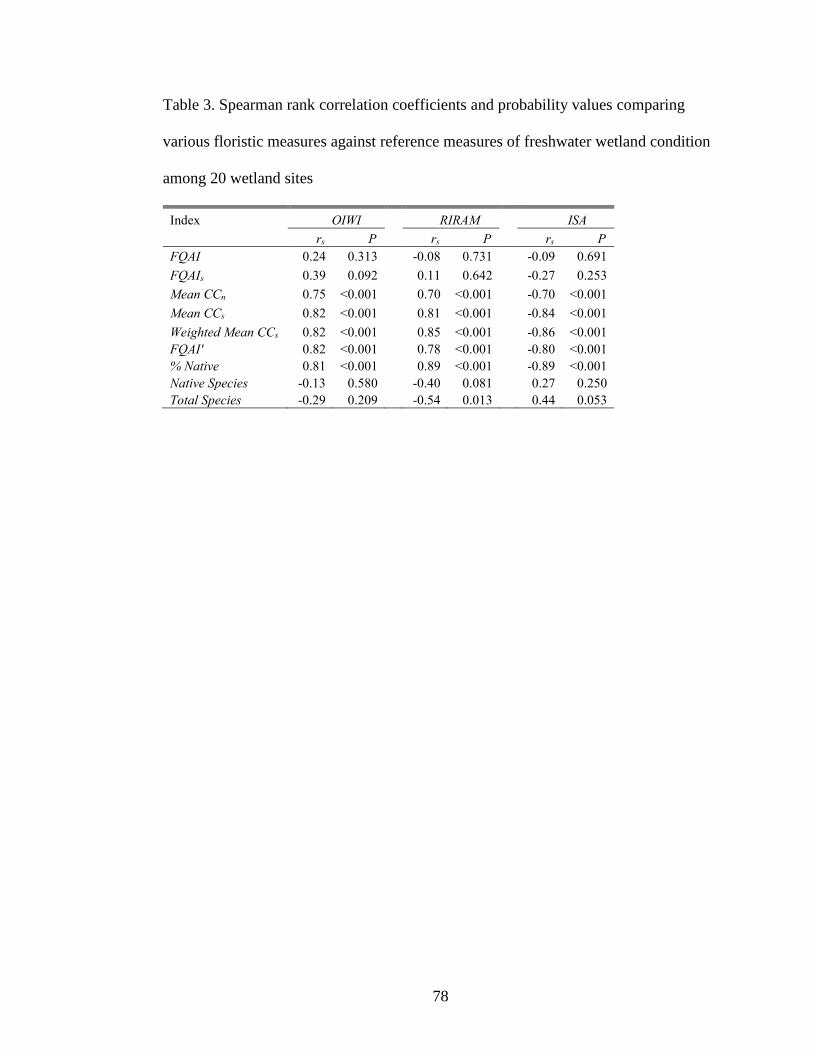
78
Table 3. Spearman rank correlation coefficients and probability values comparing
various floristic measures against reference measures of freshwater wetland condition
among 20 wetland sites
Index OIWI RIRAM ISA
rs P rs P rs P
FQAI 0.24 0.313 -0.08 0.731 -0.09 0.691
FQAIs 0.39 0.092 0.11 0.642 -0.27 0.253
Mean CCn 0.75 <0.001 0.70 <0.001 -0.70 <0.001
Mean CCs 0.82 <0.001 0.81 <0.001 -0.84 <0.001
Weighted Mean CCs 0.82 <0.001 0.85 <0.001 -0.86 <0.001
FQAI' 0.82 <0.001 0.78 <0.001 -0.80 <0.001
% Native 0.81 <0.001 0.89 <0.001 -0.89 <0.001
Native Species -0.13 0.580 -0.40 0.081 0.27 0.250
Total Species -0.29 0.209 -0.54 0.013 0.44 0.053
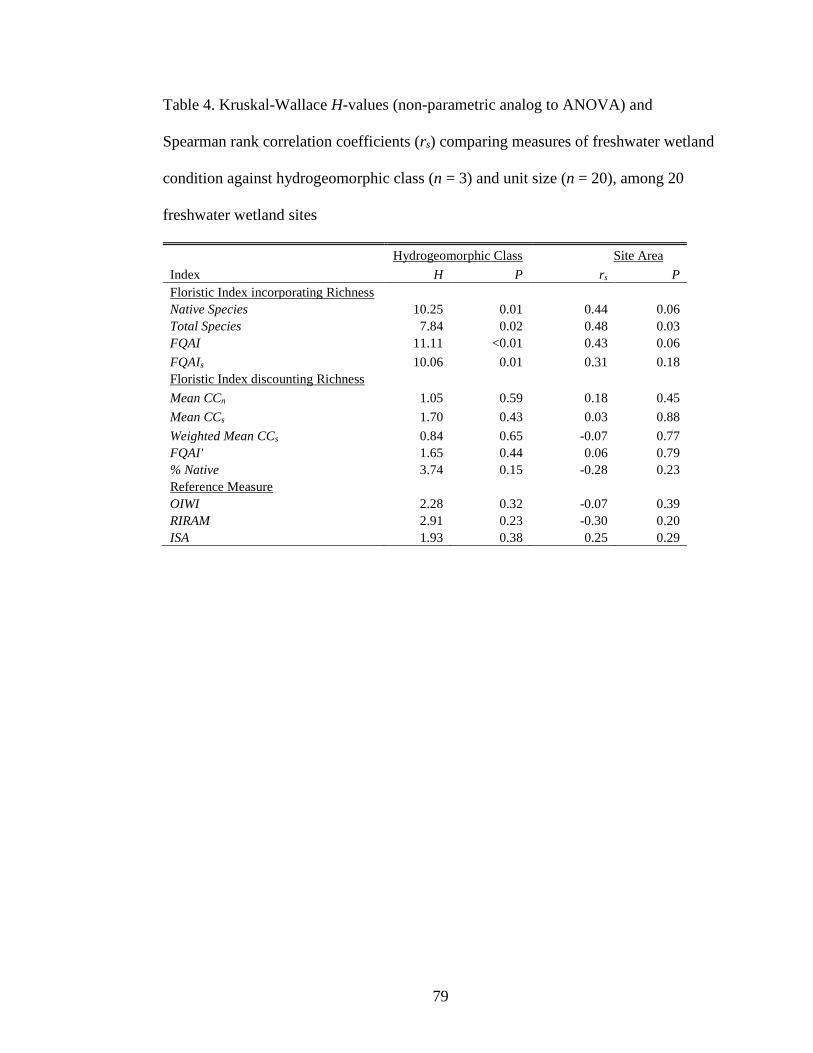
79
Table 4. Kruskal-Wallace H-values (non-parametric analog to ANOVA) and
Spearman rank correlation coefficients (rs) comparing measures of freshwater wetland
condition against hydrogeomorphic class (n = 3) and unit size (n = 20), among 20
freshwater wetland sites
Hydrogeomorphic Class Site Area
Index H P rs P
Floristic Index incorporating Richness
Native Species 10.25 0.01 0.44 0.06
Total Species 7.84 0.02 0.48 0.03
FQAI 11.11 <0.01 0.43 0.06
FQAIs 10.06 0.01 0.31 0.18
Floristic Index discounting Richness
Mean CCn 1.05 0.59 0.18 0.45
Mean CCs 1.70 0.43 0.03 0.88
Weighted Mean CCs 0.84 0.65 -0.07 0.77
FQAI' 1.65 0.44 0.06 0.79
% Native 3.74 0.15 -0.28 0.23
Reference Measure
OIWI 2.28 0.32 -0.07 0.39
RIRAM 2.91 0.23 -0.30 0.20
ISA 1.93 0.38 0.25 0.29
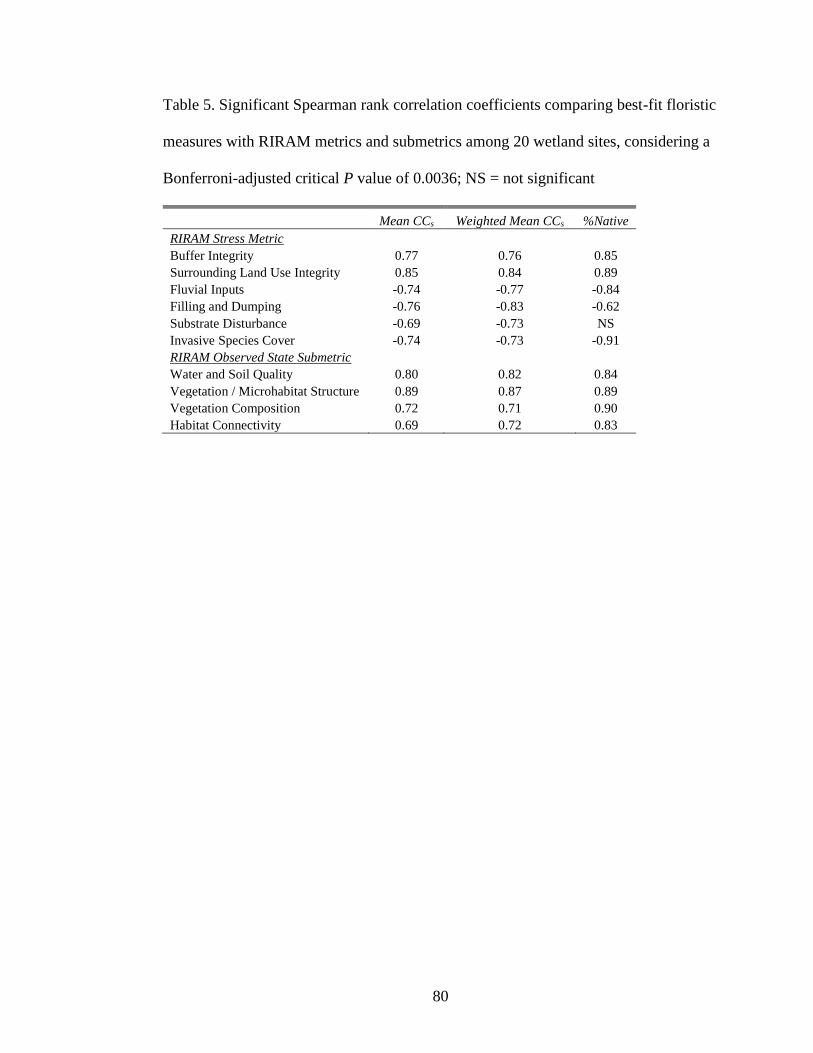
80
Table 5. Significant Spearman rank correlation coefficients comparing best-fit floristic
measures with RIRAM metrics and submetrics among 20 wetland sites, considering a
Bonferroni-adjusted critical P value of 0.0036; NS = not significant
Mean CCs Weighted Mean CCs %Native
RIRAM Stress Metric
Buffer Integrity 0.77 0.76 0.85
Surrounding Land Use Integrity 0.85 0.84 0.89
Fluvial Inputs -0.74 -0.77 -0.84
Filling and Dumping -0.76 -0.83 -0.62
Substrate Disturbance -0.69 -0.73 NS
Invasive Species Cover -0.74 -0.73 -0.91
RIRAM Observed State Submetric
Water and Soil Quality 0.80 0.82 0.84
Vegetation / Microhabitat Structure 0.89 0.87 0.89
Vegetation Composition 0.72 0.71 0.90
Habitat Connectivity 0.69 0.72 0.83

81
Table 6. Spearman rank correlation coefficients comparing reduced-effort floristic
measures against existing measures of freshwater wetland condition among 20
reference wetland sites; P < 0.001 except *P = 0.001
OIWI RIRAM ISA
Mean CCs
Full Sampling 0.82 0.81 -0.84
Single Transect 0.82 0.79 -0.82
≥10% Cover 0.74 0.81 -0.79
Single Transect ≥10% Cover 0.77 0.74 -0.78
Weighted Mean CCs
Full Sampling 0.82 0.85 -0.86
Single Transect 0.82 0.83 -0.84
≥10% Cover 0.79 0.85 -0.82
Single Transect ≥10% Cover 0.80 0.77 -0.80
% Native
Full Sampling 0.81 0.89 -0.89
Single Transect 0.82 0.86 -0.86
≥10% Cover 0.73 0.70 -0.71
Single Transect ≥10% Cover 0.73 0.67* -0.70
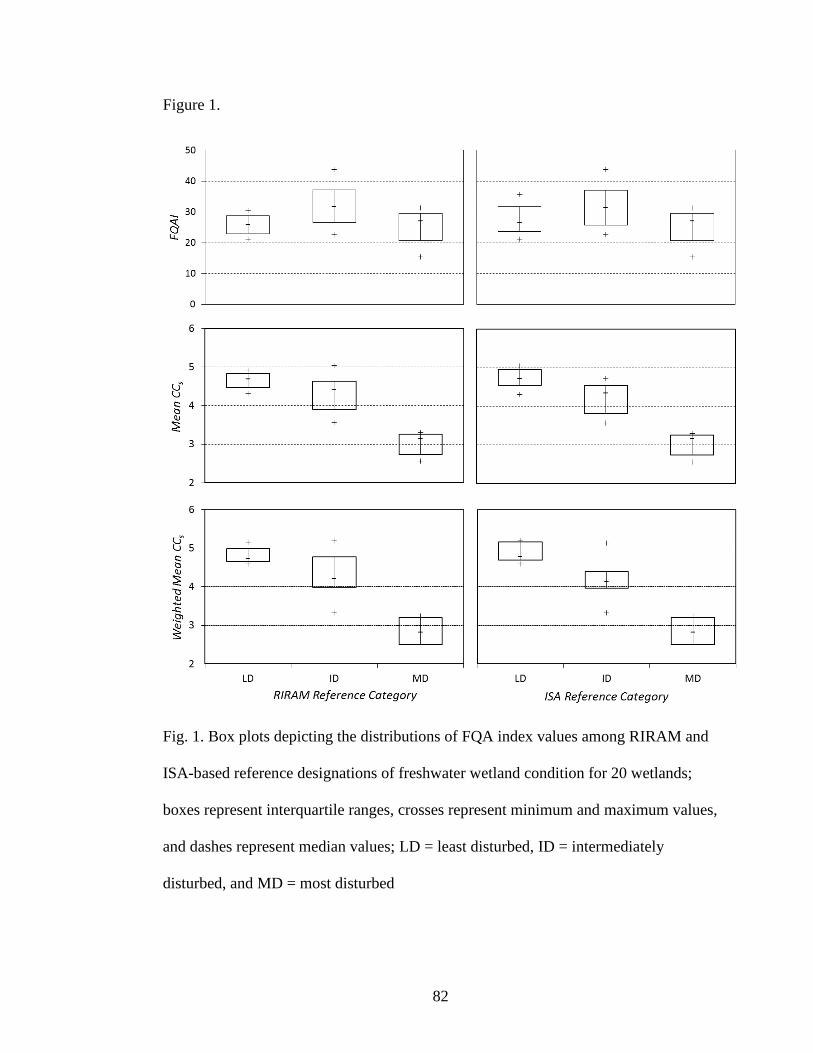
82
Figure 1.
Fig. 1. Box plots depicting the distributions of FQA index values among RIRAM and
ISA-based reference designations of freshwater wetland condition for 20 wetlands;
boxes represent interquartile ranges, crosses represent minimum and maximum values,
and dashes represent median values; LD = least disturbed, ID = intermediately
disturbed, and MD = most disturbed

83
APPENDIX 1
Rhode Island Rapid Assessment Method Field Datasheet
A. Wetland Characteristics; apply to the current state of the wetland. Not Scored. 1) Assessment Unit Area; select one:
<0.25 acres 0.25 to <1.0 acres 1.0 to <3.0 acres 3.0 to <10 acres
2) Hydrologic Characteristics Source of water; select main source:
Precipitation Groundwater Surface water
Maximum water depth, today; select one: Dry 1 to 3 feet Saturated >3 feet <1 foot
3) Habitat Characteristics Habitat stratum diversity; estimate total cover of all habitat strata within unit using classes at right: ___ Trees
___ Shrubs ___ Emergent ___ Aquatic bed ___ Sphagnum ___ Surface water, today ___ Unvegetated substrate, today
Microhabitat diversity; rate each present using the scale at right: ___ Vegetated hummocks or tussocks
___ Coarse woody debris ___ Standing dead trees ___ Amphibian breeding habitat
4) Wetland Classification Hydrogeomorphic Class; select main one:
Isolated Depression Connected Depression Floodplain (riverine) Fringe Slope Flat
RINHP natural community types; select all present within unit: Freshwater tidal marsh* Interdunal swale* Intermittent stream Eutrophic Pond Coastal plain pondshore* Coastal plain quagmire*
5) Wetland values; select all known or observed: Within 100 year flood plain Between stream or lake and human use Part of a habitat complex or corridor Falls in aquifer recharge zone
_____________________ *Identified by DEM as habitat of Greatest Conservation Need
10 to <25 acres 25 to 50 acres >50 acres
NWI Classes; select all comprising unit and indicate Dominance Type: Forested ________________________________________ Scrub-shrub ________________________________________ Emergent ________________________________________ Aquatic Bed ________________________________________ Unconsolidated Bottom or Shore Rock Bottom or Shore
Water Regime; select one or two dominant regimes: Permanently flooded Semi-permanently flooded Seasonally flooded Temporarily flooded Permanently saturated Seasonally saturated Regularly flooded (tidal) Irregularly flooded (tidal)
Cover Classes: 0…..< 1% 1…..1-5% 2…..6-25% 3…..26-50% 4…..51-75% 5…..>75% Ecological Significance Scale: 0…..None Noted 1…..Minor Feature 2…..Significant Feature 3…..Dominant Feature
Contains known T/E species Significant avian habitat Contains GCN* habitat type Educational or historic significance
Deep emergent marsh Shallow emergent marsh Emergent fen* Dwarf shrub bog / fen* Dwarf tree bog* Scrub-shrub wetland
Floodplain Forest* Red Maple Swamp Vernal pool* Hemlock-hardwood swamp Atlantic white cedar swamp* Black Spruce Bog* Other Type: __________________________
84
B. Landscape Stresses. Sum metrics 1 and 2 1) Degradation of Buffers
Estimate % cultural cover within 100-foot buffer. Select one.
<5% (10)
6 to 25% (7)
26-50% (4)
51-75% (1)
>75% (0)
2) Intensity of Surrounding Land Use Land Use Intensity weighted average within 500-foot buffer. Estimate proportion of each class to the nearest tenth and multiply. Proportion Score Weighted Value
Very Low _____ × 10 = ______
Low _____ × 7 = ______
Moderately High _____ × 4 = ______
High _____ × 1 = ______
Sum weighted values for score = ______
Sum of Metrics 1 and 2 = B. Landscape Stress Score C. Wetland Stresses. Sum metrics 3 to 9 and subtract from 70.
3) Impoundment. Sum a and b (Max = 10) a. Increase in depth or hydroperiod. Select one and multiply by the proportion of the unit affected to the nearest tenth. = ________
None (0)
Wetland was created by impoundment (1)
Change in velocity only (2)
Change of less than one water regime (4)
Change of one water regime (6)
Change of two or more water regimes (8)
Change to deepwater (10)
b. Artificial barrier to movement of resources through water. Select all that apply and sum. = ________
None (0)
Barrier to upstream movement at low water (1)
Barrier to downstream movement at low water (1)
Barrier to upstream or downstream movement above low water (1)
Water Regimes (Upland)…………………………………..Temporarily Flooded………………..Irregularly Flooded Seasonally Saturated ………………Seasonally Flooded……………………Regularly Flooded Permanently Saturated …………..Semi-permanently Flooded Permanently Flooded
Proportion of unit affected (circle one) 0 .1 .2 .3 .4 .5 .6 .7 .8 .9 1.0
Evidence: check all that apply
Physical barrier across flow downstream of wetland
Abrupt and unnatural edge downstream of wetland
Dam or restricting culvert downstream of wetland
Deepening of wetland upstream of barrier
Widening of wetland upstream of barrier
Change in vegetation across barrier
Dead or dying vegetation
Primary Associated Stressor; check one:
Road
Railway
Weir / Dam
Raised Trail
Development Fill
Other
Associated Stressors: Check all that apply
Commercial or industrial development
Unsewered Residential development
Sewered Residential development
New construction
Landfill or waste disposal
Channelized streams or ditches
Raised road beds
Foot paths / trails
Row crops, turf, or nursery plants
Poultry or livestock operations
Orchards, hay fields, or pasture
Piers, docks, or boat ramps
Golf courses / recreational development
Sand and gravel operations
Other ____________________________
Very Low…….Natural areas, open water Low…………….Recovering natural lands, passive recreation, low trails/dirt roads Mod High……Residential, pasture/hay, mowed areas, raised roads to 2-lane High…………….Urban, impervious land cover, new construction, row crops, turf crops,
mining operations, paved roads > 2-lane
Primary Source of Stress; indicate as current (C) or historic (H): __ Private / Residential __ Commercial __ Agricultural __ Public transportation __ Public utilities __ Public recreation __ Undetermined

85
4) Draining or diversion of water from wetland. Decrease in depth or hydroperiod. Select one and multiply by the proportion of the unit affected to the nearest tenth.
None (0)
Change in velocity only (3)
Change of less than one water regime (5)
Change of one water regime (7)
Change of two or more water regimes or to upland (10)
5) Anthropogenic fluvial inputs. Rank the evidence of impact for each and sum (Max = 10).
____ a. Nutrients
____ b. Sediments / Solids
____ c. Toxins / Salts
____ d. Increased flashiness
6) Filling and dumping within wetland. Select one and multiply by the proportion of the unit affected to the nearest tenth (Max = 10).
Intensity of filling
None (0)
Affects aesthetics only (2)
Affects water regime, vegetation, or soil quality (6)
Changes area to upland (10)
Fill is above surrounding upland grade (12)
Proportion of unit (or perimeter) affected (circle one) 0 .1 .2 .3 .4 .5 .6 .7 .8 .9 1.0
Proportion of unit affected (circle one) 0 .1 .2 .3 .4 .5 .6 .7 .8 .9 1.0
Evidence: check all that apply
Drainage ditches or tiles evident
Evident impoundment upstream of wetland
Severe root exposure
Moderate root exposure
Soil fissures
Uncharacteristically dry groundcover
Dead or dying vegetation
Change in vegetation across barrier
Primary Associated Stressor; Check one:
Road
Railway
Dike
Fill
Drainage ditch / tile
Major well withdrawals
Surface water pumps
Other
Evidence: check all that apply Runoff sources evident Point sources evident Excessive algae or floating vegetation Excessive rooted submerged or emergent vegetation Uncharacteristic sediments Obvious plumes or suspended solids Chemical smell Strangely tinted water Dead, dying, or patchy vegetation Dead fauna or stark lack of life Root exposure or bank erosion due to scouring
Evidence: check all that apply
Unnaturally abrupt change in ground level
Abrupt change in soil texture or content
Unnaturally straight or abrupt wetland edge
Unnatural items on or within the sediments
Primary Associated Stressor; Check one:
Road
Raised Trail
Railway
Trash
Fill
Organic / yard waste
Dam
Dike
Other
Water Regimes (Upland)…………………………………Temporarily Flooded…………… Irregularly Flooded Seasonally Saturated …………….Seasonally Flooded………………..Regularly Flooded Permanently Saturated …………Semi-Permanently Flooded Permanently Flooded
Evidence-of-Impact Ranks 0…..No evidence 1…..Sources evident, only 3…..Slight impact evident 5…..Moderate to strong impact evident
Primary Associated Stressor; Check one:
Point runoff
Sheet runoff
Effluent discharge
Organic / yard waste
Other point ________________
Riverine (up-stream)
Multiple / non-point
Channelization
Primary Source of Stress; indicate as current (C) or historic (H): __ Private / Residential __ Commercial __ Agricultural __ Public transportation __ Public utilities __ Public recreation __ Undetermined
Primary Source of Stress; indicate as current (C) or historic (H): __ Private / Residential __ Commercial __ Agricultural __ Public transportation __ Public utilities __ Public recreation __ Multiple / non-point __ Undetermined
Primary Source of Stress; indicate as current (C) or historic (H): __ Private / Residential __ Commercial __ Agricultural __ Public transportation __ Public utilities __ Public recreation __ Undetermined

86
7) Excavation and other substrate disturbances within wetland. Select one and multiply by the proportion of the unit affected to the nearest tenth. Intensity of disturbance
None (0)
Wetland unit was created by excavation (1)
Soil quality or vegetation disturbed (4)
Changes water regime (7)
Excavated to deep water (10)
8) Vegetation and detritus removal within wetland. Rank extent and multiply by the estimated proportion affected for each layer; then sum (Max = 10). Layers affected Extent Proportion
Aquatic Bed ______×________=_______
Detritus ______×________=_______
Emergent ______×________=_______
Shrub ______×________=_______
Canopy ______×________=_______ Sum =_______
9) Invasive species within wetland. 9a. Select one class for total coverage.
None noted (0)
Nearly absent <5% cover (2)…….…..Cover Class 1
Low 6-25% cover (4)…….…………..…..Cover Class 2
Moderate 26-50% cover (6).………….Cover Class 3
High 51-75% cover (8)…………………...Cover Class 4
Extensive >75% cover (10)……………..Cover Class 5
9b. List and select a cover class for each invasive plant species noted. Cover Class Species
_____ __________________________________________ _____ __________________________________________ _____ __________________________________________ _____ __________________________________________ _____ __________________________________________
Sum of C3 to C9 Scores = 70 Minus Sum = C. Wetland Stress Score
Proportion of unit (or perimeter) affected (circle one) 0 .1 .2 .3 .4 .5 .6 .7 .8 .9 1.0
Evidence: check all that apply
Unnaturally abrupt lowering in ground level
Loss of vegetation
Unnaturally straight and abrupt wetland edge
Direct evidence of disturbance
Primary Associated Stressor; Check one:
Vehicle disturbance
Plowing / cultivation
Excavation / Grading
Channelization / Dredging
Ditching
Footpaths
Trampling
Other
Proportion of unit affected 0 .1 .2 .3 .4 .5 .6 .7 .8 .9 1.0
Evidence: check all that apply
Cut stems or stumps
Immature vegetation strata
Missing vegetation strata
Mowed areas
Browsing or grazing
Primary Associated Stressor; Check one:
Power lines
Grazing
Cultivation
Timber Harvest
Development clearing
Trails / non-raised roads
Excavation / ditching
Other
Extent of removal 0…..None 2…..Partial or recovering 3…..Complete
Primary Abutting Stressor; Check one:
Road
Railway
Raised Trail
Footpath
Dam / Dike
Organic / yard waste
Other Fill
Drainage ditch / tile
Stormwater input
Clearing
Multiple
Other
Primary Source of Stress; indicate as current (C) or historic (H): __ Private / Residential __ Public transportation __ Commercial __ Public utilities __ Agricultural __ Public recreation __ Undetermined
Primary Source of Stress; indicate as current (C) or historic (H): __ Private / Residential __ Commercial __ Agricultural __ Public transportation __ Public utilities __ Public recreation __ Undetermined
Primary Source of Stress; indicate as current (C) or historic (H): __ Private / Residential __ Commercial __ Agricultural __ Public transportation __ Public utilities __ Public recreation __ Undetermined
87
D. Observed State of Wetland Characteristics. Circle one score for each characteristic and sum. Refer to Sections A through C to inform scores. Consider current wetland types. Characteristics Characteristic* Degraded Destroyed
Hydrologic Integrity……….…………………………….. Water and Soil Quality………………………………….. Vegetation/microhabitat Structure………......... Vegetation Composition……….………………………. Habitat Connectivity……………………………………...
SUM = D. Observed State Score
B. Landscape Stress Score (max 20) __________ + C. Wetland Stress Score (max 70) __________ =
B+C. Total Stress Score (max 90) + D. Observed State Score (max 10) __________ =
RIRAM V. 2.10 Condition Index
* Characteristic of wetland type in an unstressed setting
2 1.5 1 0.5 0 2 1.5 1 0.5 0 2 1.5 1 0.5 0 2 1.5 1 0.5 0 2 1.5 1 0.5 0
Related Documents