University of Montana University of Montana ScholarWorks at University of Montana ScholarWorks at University of Montana Graduate Student Theses, Dissertations, & Professional Papers Graduate School 2013 Biological effects of trogocytosis on CD4+ T lymphocytes Biological effects of trogocytosis on CD4+ T lymphocytes Douglas Grant Osborne The University of Montana Follow this and additional works at: https://scholarworks.umt.edu/etd Let us know how access to this document benefits you. Recommended Citation Recommended Citation Osborne, Douglas Grant, "Biological effects of trogocytosis on CD4+ T lymphocytes" (2013). Graduate Student Theses, Dissertations, & Professional Papers. 100. https://scholarworks.umt.edu/etd/100 This Dissertation is brought to you for free and open access by the Graduate School at ScholarWorks at University of Montana. It has been accepted for inclusion in Graduate Student Theses, Dissertations, & Professional Papers by an authorized administrator of ScholarWorks at University of Montana. For more information, please contact [email protected].

Welcome message from author
This document is posted to help you gain knowledge. Please leave a comment to let me know what you think about it! Share it to your friends and learn new things together.
Transcript
University of Montana University of Montana
ScholarWorks at University of Montana ScholarWorks at University of Montana
Graduate Student Theses, Dissertations, & Professional Papers Graduate School
2013
Biological effects of trogocytosis on CD4+ T lymphocytes Biological effects of trogocytosis on CD4+ T lymphocytes
Douglas Grant Osborne The University of Montana
Follow this and additional works at: https://scholarworks.umt.edu/etd
Let us know how access to this document benefits you.
Recommended Citation Recommended Citation Osborne, Douglas Grant, "Biological effects of trogocytosis on CD4+ T lymphocytes" (2013). Graduate Student Theses, Dissertations, & Professional Papers. 100. https://scholarworks.umt.edu/etd/100
This Dissertation is brought to you for free and open access by the Graduate School at ScholarWorks at University of Montana. It has been accepted for inclusion in Graduate Student Theses, Dissertations, & Professional Papers by an authorized administrator of ScholarWorks at University of Montana. For more information, please contact [email protected].
BIOLOGICAL EFFECTS OF TROGOCYTOSIS ON CD4+ T LYMPHOCYTES
By
DOUGLAS GRANT OSBORNE
BS, University of Washington, Seattle, Washington, 2005
Dissertation/Thesis
presented in partial fulfillment of the requirements for the degree of
Doctor of Philosophy
Microbiology, Integrated Microbiology and Biochemistry
The University of Montana Missoula, MT
January 2013
Approved by:
Sandy Ross, Associate Dean of The Graduate School
Graduate School
Dr. Bill Granath, Chair Integrated Microbiology and Biochemistry
Dr. Scott Wetzel, Thesis advisor
Integrated Microbiology and Biochemistry
Dr. Jesse Hay Integrated Microbiology and Biochemistry
Dr. Kevin Roberts
Center for Environmental Health and Safety
Dr. Dave Shepherd Center for Environmental Health and Safety
Dr. Mike Minnick
Integrated Microbiology and Biochemistry

ii
© COPYRIGHT
by
Douglas Grant Osborne
2013
All Rights Reserved
iii
Osborne, Douglas, Ph.D., Fall 2012 Microbiology BIOLOGICAL EFFECTS OF TROGOCYTOSIS ON CD4+ T LYMPHOCYTES
Chairperson: Dr. Bill Granath
Abstract
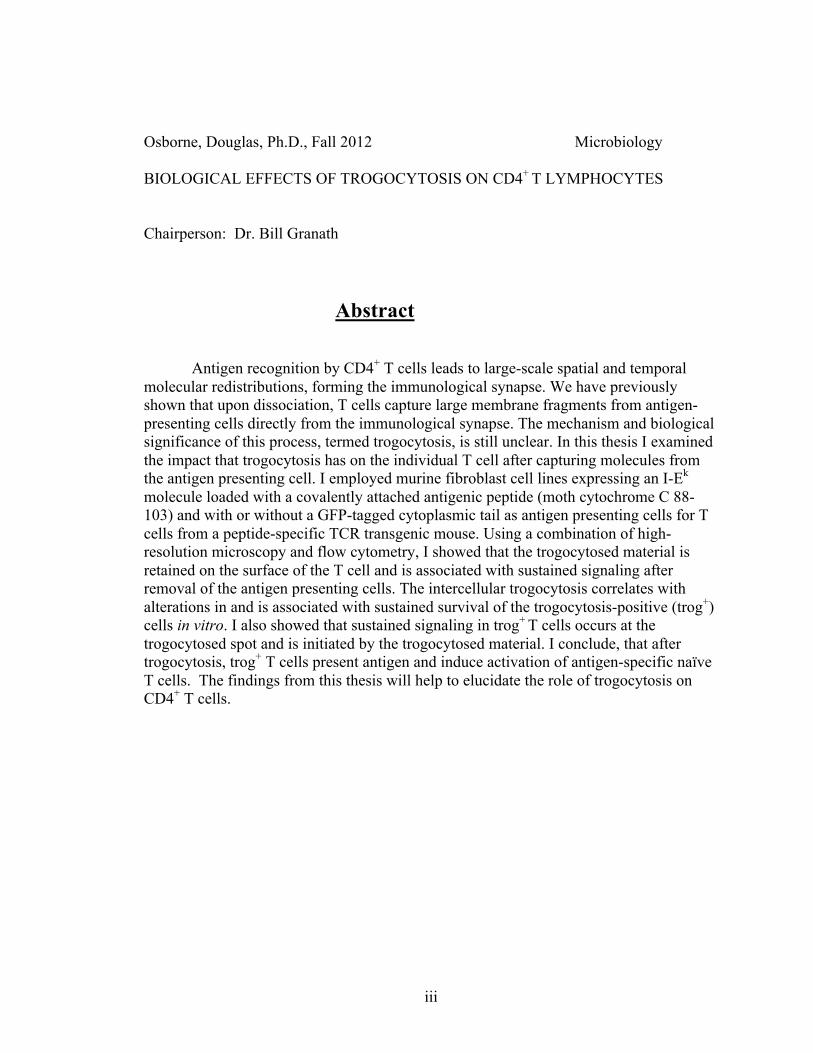
Antigen recognition by CD4+ T cells leads to large-scale spatial and temporal molecular redistributions, forming the immunological synapse. We have previously shown that upon dissociation, T cells capture large membrane fragments from antigen-presenting cells directly from the immunological synapse. The mechanism and biological significance of this process, termed trogocytosis, is still unclear. In this thesis I examined the impact that trogocytosis has on the individual T cell after capturing molecules from the antigen presenting cell. I employed murine fibroblast cell lines expressing an I-Ek
molecule loaded with a covalently attached antigenic peptide (moth cytochrome C 88-103) and with or without a GFP-tagged cytoplasmic tail as antigen presenting cells for T cells from a peptide-specific TCR transgenic mouse. Using a combination of high-resolution microscopy and flow cytometry, I showed that the trogocytosed material is retained on the surface of the T cell and is associated with sustained signaling after removal of the antigen presenting cells. The intercellular trogocytosis correlates with alterations in and is associated with sustained survival of the trogocytosis-positive (trog+) cells in vitro. I also showed that sustained signaling in trog+ T cells occurs at the trogocytosed spot and is initiated by the trogocytosed material. I conclude, that after trogocytosis, trog+ T cells present antigen and induce activation of antigen-specific naïve T cells. The findings from this thesis will help to elucidate the role of trogocytosis on CD4+ T cells.
iv
Table of Contents Abstract iii
Table of contents iv
Acknowledgements x
Chapter 1: Introduction 1 T Cell Activation 1
TCR signaling 4
Costimulation and cytokines 8
Immunological Synapse 9
Immunological synapse morphology 10
Immunological synapse function 13
Trogocytosis 16
Molecules trogocytosed and requirements for T cell trogocytosis 18
Trogocytosis mechanism 22
Integration of trogocytosed molecules into the T cell plasma 23
membrane
The function of trogocytosis 26
Trog+ T cells as APCs 26
Trogocytosis intrinsic function 27
Rationale 30
Chapter 2: Materials and Methods 33 Animals 33
Antibodies and Staining Reagents 33
Antigen presenting cells 34
In vitro T cell priming 35
Standard in vitro trogocytosis assay 36
In vitro naïve T cell trogocytosis assay 37
v
Flow cytometry 38
Examination of trogocytosis associated intracellular signaling 39 by flow cytometry
Immune synapse microscopy 40
Microscopic analysis of trogocytosis 41
Image analysis 41
TCR signaling inhibition 42
T-T presentation 43
Peptide affinity 44
qRT-PCR 45
Statistical analysis and graphing 46
Chapter 3: Results 47 Measuring Trogocytosis 47
Naïve T cell Trogocytosis 50
Trogocytosis correlates with naïve T cell proliferation 53
Trogocytosis negative cells recognize antigen and are activated similar 55 to trogocytosis positive cells
Sustained CD69 expression in trog+ T cells 57
Selective survival of trogocytosis+ CD4+ T cells in vitro after removal of 60 APC
Sustained TCR-proximal intracellular signaling in trogocytosis+ T cells 61
Trogocytosed MHC:peptide molecules co-localize with TCR-proximal 66 signaling molecules in trog+ T cells
Sustained TCR-proximal signaling in trog+ T cells 71
Sustained TCR-distal signaling in trog+ T cells 72
Trogocytosed molecules induce sustained signaling in trog+ T cells 76
T-T Ag presentation 85
Chapter 4: Discussion 88 Kinetics, activation, proliferation, and selective survival of trog+ T cells 90
Sustained signaling by the trogocytosed material 94
vi
Trogocytosis signaling and spots 98
T-T Ag presentation 98
Chapter 5: Future Directions 100 Peptide affinity 100
Gene expression of trog+ T cells 102
T cell subsets and trogocytosis 103
T-T Ag presentation 104
References 106
vii
Figures: Fig. 1 – Proximal signaling complex. 6
Fig. 2 – Overview of TCR signaling pathways. 7
Fig. 3 – Immune synapse: supramolecular activation complex organization 11 and content. Fig. 4 – Immune synapse formation. 13
Fig. 5 – TCR signaling at the c-SMAC. 15
Fig. 6 – CD4+ T cell trogocytosis via the immunological synapse. 18
Fig. 7 – Measuring trogocytosis using flow cytometry. 20
Fig. 8 – Proposed mechanism for trogocytosis. 24
Fig. 9 – Trogocytosed molecules are integrated into the T cell membrane. 25
Fig. 10 – Measuring trogocytosis using different APC-labeling methods. 49
Fig. 11 – Primary vs. secondary stimulation of naïve T cell shows 52 increased trogocytosis during the secondary stimulation with APCs.
Fig. 12 - In vitro trogocytosis is associated with more rapid proliferation 55 of naïve T cells.
Fig. 13 - Trog+ and trog- T cells have an activated phenotype. 57
Fig. 14 - Sustained CD69 expression in trog+ CD4+ T cells. 59
Fig. 15 - Selective survival of trog+ T cells. 61
Fig. 16 – Testing phosflow. 63
Fig. 17 - TCR-proximal signaling is sustained in trogocytosis+ CD4+ 65 T cells using phosflow.
Fig. 18 - TCR signaling-associated molecules are associated with 68 trogocytosed molecules on the T cell surface in conjugate with APC.
Fig. 19 - Measuring the thickness of TCR signaling-associated molecules 69
viii
across the distal T cell surface and T-APC interface.
Fig. 20 - Measuring pLck staining intensity across the distal T cell surface 70 and the T-APC interface.
Fig. 21 - Proximal TCR signaling-associated molecules are associated 72
with trogocytosed molecules on the recovered T cell surface.
Fig. 22 - Distal TCR signaling-associated molecules are associated 73 with trogocytosed molecules on the recovered T cell surface.
Fig. 23 - Correlation between the size of trogocytosed MHC:peptide 75
and TCR/pERK staining.
Fig. 24 - TCR-proximal signaling is sustained by trogocytosed 78 molecules in trog+ cells.
Fig. 25 - pZAP-70 rebounds and localizes with trogocytosed GFP-MHC 79 in trog+ T cells following the removal of PP2.
Fig. 26 - TCR-distal signaling is sustained by trogocytosed molecules 81
in trog+ CD4+ T cells using phosflow. Fig. 27 - TCR-distal signaling is sustained by trogocytosed 83
molecules in trog+ CD4+ T cells. Fig. 28 - pERK1/2 rebounds and localized with trogocytosed GFP-MHC 84
in trog+ T cells following the removal of PP2. Fig. 29 – T-T presentation. 87 Fig. 30 – Autopresentation: proposed autopresentation hypothesis 97
for how trogocytosis leads to sustained intracellular signaling.
Fig. 31 – Peptide affinity and trogocytosis. 101 Fig. 32 – qRT-PCR of trog+ T cells. 103
ix
Tables: Table 1 - qRT-PCR primer sets 45
x
Acknowledgements: Scott A. Wetzel – For giving me the opportunity to pursue openly my research and introducing me the greatest immune cell: T lymphocytes. I owe a large part of my laboratory skills to him. Lindsay Thuesen – For helping me maintain mice and cell lines, and being a great friend. Thesis Committee Members (Kevin Roberts, Bill Granath, Mike Minnick, Dave Shepherd, and Jesse Hay) for mentoring me and their encouragement through my graduate work. Pam Shaw – For training and assisting me with flow cytometry, and specifically helping me with clogs and compensation. Current and Former Members of the Wetzel lab: for taking care of my responsibilities when I was MIA, for trusting me to assist them in their research, and maintaining an open environment to discuss idea and troubles. My wife Jessa: For her incredible patience through the process and her kind nature.
1
Chapter 1:
Introduction
T cell activation
During an adaptive immune response, T lymphocytes play a central role in the
recognition and clearance of pathogens. The two general types of αβ T cells are CD8+
and CD4+, named for the coreceptor that the cells express. CD8+ T cells, or cytotoxic T
lymphocytes (CTL), are essential in cellular immune responses. CD8+ T cells lyse target
cells by releasing cytolytic granules containing perforin, a protein that forms pores in the
cell membrane, and granzymes; proteases that induce apoptosis. The second type of T
cell, the CD4+ T cells, or helper T cells, will be the main focus of this thesis. Upon
activation, naïve CD4+ T cells can differentiate into various helper T cell (TH) effector
subsets, among these are the TH1, TH2, TH17, TFH, and Treg subsets. TH1 cells play a role
in cellular immune responses, by expressing IL-2 and proinflammatory cytokines such as
IFNγ along with helping in the activation of CD8+ T cells, all leading to the clearance of
intracellular pathogens (1-3). TH2 cells play a role in humoral immune responses, by
expressing cytokines such as IL-4, IL-5, IL-10, and IL-13, which help boost Ig
production and lead to the production of immunoglobulin E antibodies, which are
responsible for the clearance of extracellular parasites (1-3). TH17 cells are involved in
the production of IL-17 and in autoimmunity (4). TFH cells (follicular B helper T cells)
regulate the development of antigen-specific B cell immunity (5). Treg cells (regulatory T
cells) are involved in the suppression of an immune response (6). To become activated
2
and to differentiate into the effector CD4+ T cell subsets, T cells require presentation of
antigen (Ag) by a professional antigen-presenting cell (APC).
Ag presentation involves the expression of polymorphic MHC molecules loaded
with specific antigenic peptide fragments on the APC membrane. The recognition of the
specific MHC:peptide complex by the TCR induces a series of signaling cascades in the
T cell leading to activation, differentiation, generation of effector function, and
proliferation. TCR:pMHC engagement (called signal 1) is but 1 of 3 signals that are
required for full CD4+ T cell activation and differentiation. The second signal,
costimulation, is induced by APCs recognizing Pathogen Associated Molecular Patterns
(PAMPs). This “danger” signal (7, 8) leads to increases in the expression of
costimulatory molecules, such as CD80 and CD86, which engage costimulatory
receptors, such as CD28, on the surface of the T cell (8-10). The costimulatory signal
augments TCR signaling (9), helping to increase activation, cytokine production, and
proliferation. The final signal for full T cell activation and differentiation (signal 3)
comes from the binding of cytokines to their receptors on the CD4+ T cell. This induces
signaling that drives proliferation and differentiation of naïve cells into one of the
effector subsets.
The interacting molecules at the T-APC interface (including TCR:pMHC,
costimulatory molecules, and adhesion molecules) along with intracellular signaling
molecules and the T cell cytoskeleton, are spatially and temporally segregated in a
structure termed the immunological synapse. The signaling through the synapse can lead
to alterations in T cell function, activation of naïve and effector T cells (11), thymic
selection (12), and/or cell death (13), and inactivation, also known as anergy (14).
3
When naïve T cells in the lymph nodes first encounter Ag, there is increased
expression of CD69 (5) and downmodulation of the TCR (15-17). Increased CD69
expression, originally termed the “very early activation marker”, is a sign of early
activation and has been found to help in T cell proliferation, signal transduction, and is
responsible for retention in the lymph nodes during T cell activation (18, 19). TCR
downmodulation occurs during activation (16, 17) via proposed phagocytic mechanisms
(20-22). TCR downmodulation is hypothesized to allow for serial TCR triggering (23,
24), where continuous TCR interactions with the pMHC can occur and desensitization of
the activated T cell (16, 25). Increases in CD69 and downmodulation of the TCR
precedes increased expression of CD25 (26), and the loss of CD62L (11) expression. The
increase in CD25 (IL-2 receptor α) expression allows the cell to bind IL-2 with
significantly higher affinity, which helps to increase T cell proliferation (26-28). The
decrease in the adhesion marker CD62L, also known as L-selectin, prevents the cell from
recirculating through 2° lymphoid organs, like the lymph nodes, after Ag recognition and
activation (29, 30). T cell activation also leads to increased expression of CD4 and CD44
(31). CD4 binds to non-polymorphic regions of the MHC and brings the Src family
kinase p56Lck (Lck) into close proximity to tyrosine containing substrates (16). CD4 can
also help stabilize the interactions of the TCR with the MHC (32). CD44 is an adhesion
marker commonly found on activated effector/memory cells that helps in lymph node
retention by binding hyaluronan on the surface of the surrounding extracellular matrix
(31, 33).
4
TCR signaling
The primary signal for T cell activation occurs through the engagement of the
αβ TCR heterodimer by a specific MHC:peptide molecule present on the surface of an
APC. TCR engagement initiates multiple signaling pathways that lead to the activation of
three primary transcription factors: nuclear factor of activated T cells (NFAT) (30, 45,
46), activator protein 1 (AP-1) (45, 46), and nuclear factor kappa-light-chain-enhancer of
activated B cells (NFκB) (48). Their activation results in T cell activation, proliferation,
and development of effector functions. TCR:pMHC engagement leads to both TCR
conformational changes (34) and aggregation (35, 36), which contribute to the initiation
of signaling by recruiting cytoplasmic and membrane-bound kinases. These
phosphorylate the immunoreceptor tyrosine-based activation motifs (ITAM) on the CD3
γ, ε, δ chains, and ζ dimer associated with the αβ TCR (37).
The kinase responsible for the initial ITAM phosphorylation is p56Lck (Lck) (34,
37). A recent report suggests that the main function of CD4 is the delivery of non-
covalently associated Lck to the engaged receptor, rather than the previously
hypothesized stabilization of the TCR:pMHC interaction (38). Lck knockout mice
display a loss of active T cells in the periphery and the thymus of mice (39). The initial
phosphorylation by Lck triggers the recruitment of a Syk-family kinase, zeta associated
protein 70 kDa (ZAP-70) (37). ZAP-70 contains two SH2 (Src Homology 2) domains
that bind the phosphorylated ITAMs. Upon ITAM binding, ZAP-70 is itself subsequently
phosphorylated by Lck and activated (37).
5
The activation of ZAP-70 initiates several downstream signaling pathways.
Phosphorylated ZAP-70 targets two important adapter proteins for phosphorylation: the
Linker of Activated T cells (LAT) and SH2 domain containing leukocyte protein of 76
kDa (SLP-76) (40, 41). The loss of either LAT or SLP-76 results in the loss of nearly all
signaling downstream of the TCR (42, 43). The phosphorylation of LAT at the plasma
membrane recruits SLP-76 (which is also phosphorylated by ZAP-70) and GRB2-related
adapter downstream of Shc (GADS). SLP-76 forms a stable interaction with LAT
through GADS, forming a multimolecular signaling complex called the proximal
signaling complex (40, 41). Even though these adaptor proteins lack enzymatic activity,
they are responsible for the correct orientation and assembling of the proximal signaling
complex to allow for the activation of multiple signaling pathways (44-46). The adapter
molecules, LAT, SLP-76, and GADS, along with adapter protein, Nck, the guanine
nucleotide exchange factor (GEF) Vav1, and the IL-2-induced tyrosine kinase (Itk), join
together to recruit other secondary messengers that are critical in producing T cell
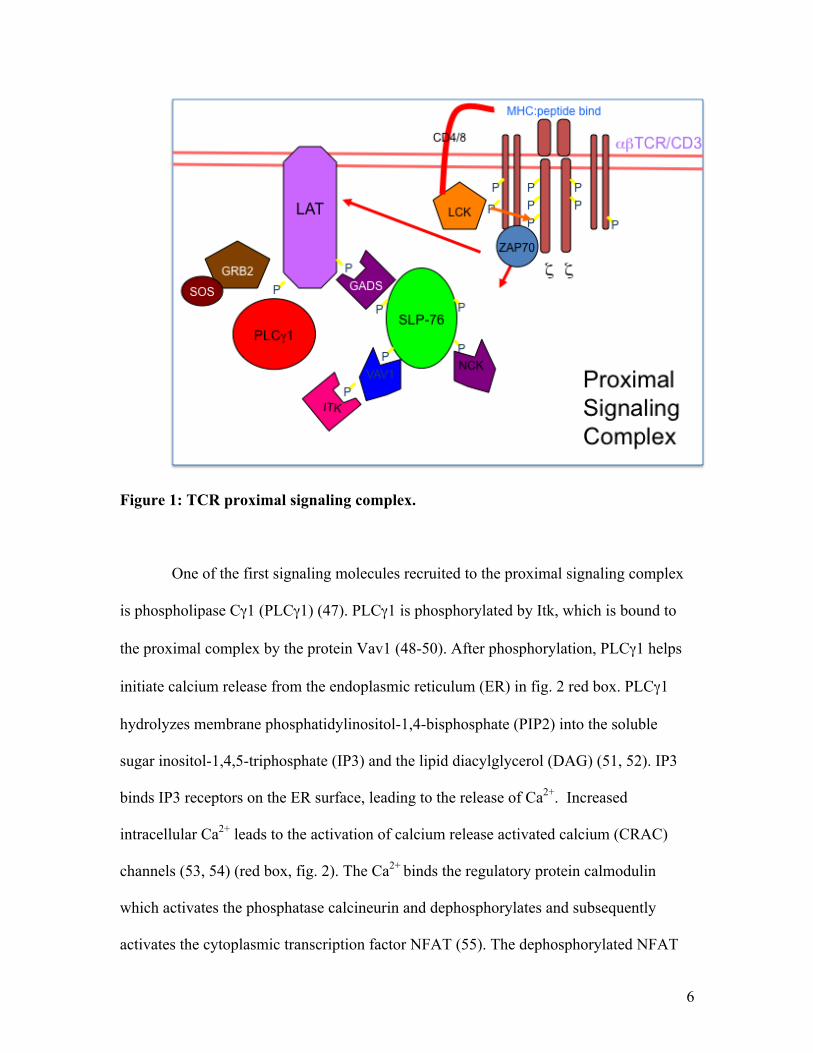
effector function (fig. 1; purple box, fig. 2) (45).
6
Figure 1: TCR proximal signaling complex.
One of the first signaling molecules recruited to the proximal signaling complex
is phospholipase Cγ1 (PLCγ1) (47). PLCγ1 is phosphorylated by Itk, which is bound to
the proximal complex by the protein Vav1 (48-50). After phosphorylation, PLCγ1 helps
initiate calcium release from the endoplasmic reticulum (ER) in fig. 2 red box. PLCγ1
hydrolyzes membrane phosphatidylinositol-1,4-bisphosphate (PIP2) into the soluble
sugar inositol-1,4,5-triphosphate (IP3) and the lipid diacylglycerol (DAG) (51, 52). IP3
binds IP3 receptors on the ER surface, leading to the release of Ca2+. Increased
intracellular Ca2+ leads to the activation of calcium release activated calcium (CRAC)
channels (53, 54) (red box, fig. 2). The Ca2+ binds the regulatory protein calmodulin
which activates the phosphatase calcineurin and dephosphorylates and subsequently
activates the cytoplasmic transcription factor NFAT (55). The dephosphorylated NFAT
7
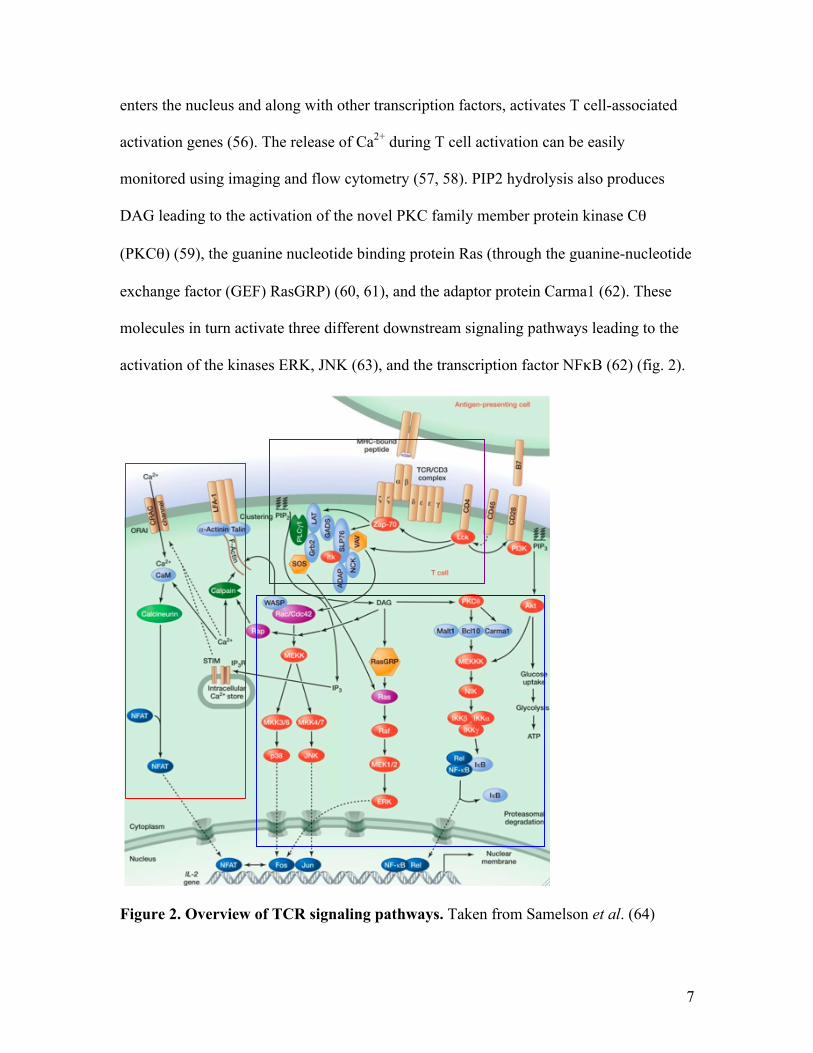
enters the nucleus and along with other transcription factors, activates T cell-associated
activation genes (56). The release of Ca2+ during T cell activation can be easily
monitored using imaging and flow cytometry (57, 58). PIP2 hydrolysis also produces
DAG leading to the activation of the novel PKC family member protein kinase Cθ
(PKCθ) (59), the guanine nucleotide binding protein Ras (through the guanine-nucleotide
exchange factor (GEF) RasGRP) (60, 61), and the adaptor protein Carma1 (62). These
molecules in turn activate three different downstream signaling pathways leading to the
activation of the kinases ERK, JNK (63), and the transcription factor NFκB (62) (fig. 2).
Figure 2. Overview of TCR signaling pathways. Taken from Samelson et al. (64)
8
Carma1 phosphorylation by PKCθ leads to the phosphorylation of mitogen-
associated kinase kinase kinase (MEKKK), which releases the transcription factor NFκB
from inhibitor of kappa B (IκB) by phosphorylating IκB for degradation. This allows
NFκB to enter the nucleus (65). The phosphorylation of MEK1/2 by the kinase Raf and
MEKK by the kinase Rac leads to the phosphorylation of kinases ERK, p38, and JNK.
These, in turn, help dimerize the two transcription factors Fos and Jun into the AP-1
transcription factor (66) (blue box, fig. 2). Singular activation and translocation of NFAT
without AP-1 leads to a hyporesponsive state in T cells, known as anergy (67). In
addition, SLP-76 and Vav1 help to activate the kinase Rac which recruits Rho family
GTPase Cdc42 and the Wiskott-Aldrich syndrome protein (WASP) to the signaling
complex to initiate cytoskeletal rearrangements in the cell, allowing for continued
proximal signaling and longer T-APC interaction (68, 69).
Costimulation and cytokines
In addition to signal 1, TCR engagement of the MHC:peptide complex, Ag
presentation that leads to T cell activation also requires a second signal that is acquired
through costimulation. TCR signaling in the absence of a costimulatory signal leads to
anergy (8). Cytokines, as the third signal, leads to increased activation, proliferation,
differentiation, and cell homing (70).
The prototypical costimulatory interaction involves the CD28 costimulatory
receptor on the surface of the T cell engaging B7 family molecules CD80 (B7-1) and
CD86 (B7-2) found on the surface of APC (71). According to the danger hypothesis,
9
microbial products or responses to cell damage induce the APC to upregulate expression
of CD80 and CD86 (8-10). As shown in fig. 2, engagement of CD28 by CD80/CD86 at
the immune synapse leads to the activation of PI3K (72), which augments the TCR-
mediated activation of MEKKK via the kinase Akt (73), which contributes to the
subsequent activation and translocation of NFκB (74).
The combination of TCR and costimulatory signaling leads to the induction of
gene expression within the T cell associated with the production of cytokines and,
ultimately, effector functions. One of the main cytokines produced during T cell
activation is IL-2 (75, 76). IL-2 binds the high affinity CD25-containing IL-2 receptor on
the surface of the T cell activating similar pathways involved in TCR and costimulation
(27), and ultimately leading to proliferation and differentiation.
Immunological synapse
Ag recognition by T cells, and the subsequent signaling, leads to spatial and
temporal molecular rearrangement at the T-APC interface to form a structure termed the
immunological synapse. These molecular rearrangements involve the clustering and
spatial segregation of molecules at the T-APC interface, including TCR:pMHC,
costimulatory, and adhesion molecules, along with intracellular signaling molecules and
the T cell cytoskeleton. This structure was first described by Kupfer et al. in 1987 (77),
who showed when murine T cells were being presented Ag by a B cell, the TCR was
concentrated at the cell-cell contact area. Kupfer et al. also found that T cells reorganized
microtubules and membrane-bound cytoskeleton to the cell-cell contact area (77). In a
10
follow up paper in 1998, Monks et al. showed that surface receptors, like the TCR,
segregated into specific areas on the T cells that were in contact with the APC, called
supramolecular activation complexes (SMACs) (78). The initial studies of immune
synapse formation found that the formation of an immune synapse coincided with T cell
activation (78, 79).
Immunological synapse morphology
After the initial T-APC contact and subsequent Ag recognition occurs, the
adhesion molecule leukocyte function-associated antigen 1 (LFA-1) on the T cell binds to
intercellular adhesion molecule 1 (ICAM-1) on the APC, leading to the formation of
microclusters containing both TCR:pMHC and LFA-1/ICAM-1(80). As shown in fig.3,
these TCR/MHC microclusters are translocated to the center of the T-APC contact patch
in an endosomal sorting protein, TSG101, dependent mechanism (81, 82). The area
where TCR microclusters translocate to has been termed the central supramolecular
activation complex (c-SMAC) (78). From fig. 3, it can best be seen that the c-SMAC
contains not only TCR/MHC:peptide, but also costimulatory molecule interactions
CD28/B7-1, adhesion molecule CD2, and the coreceptor CD4 (78, 83). The segregation
of intracellular signaling molecules PKCθ, Lck, and Fyn also occurs at the c-SMAC (78,
83). Surrounding the interactions of the TCR with MHC at the c-SMAC is a peripheral
ring of integrin adhesion molecules LFA-1/ICAM-1 (78, 83). This peripheral ring has
been termed the peripheral SMAC, or p-SMAC. The p-SMAC has been shown as the
location for accumulation of f-actin (84) and talin, which links integrins, like LFA-1, to
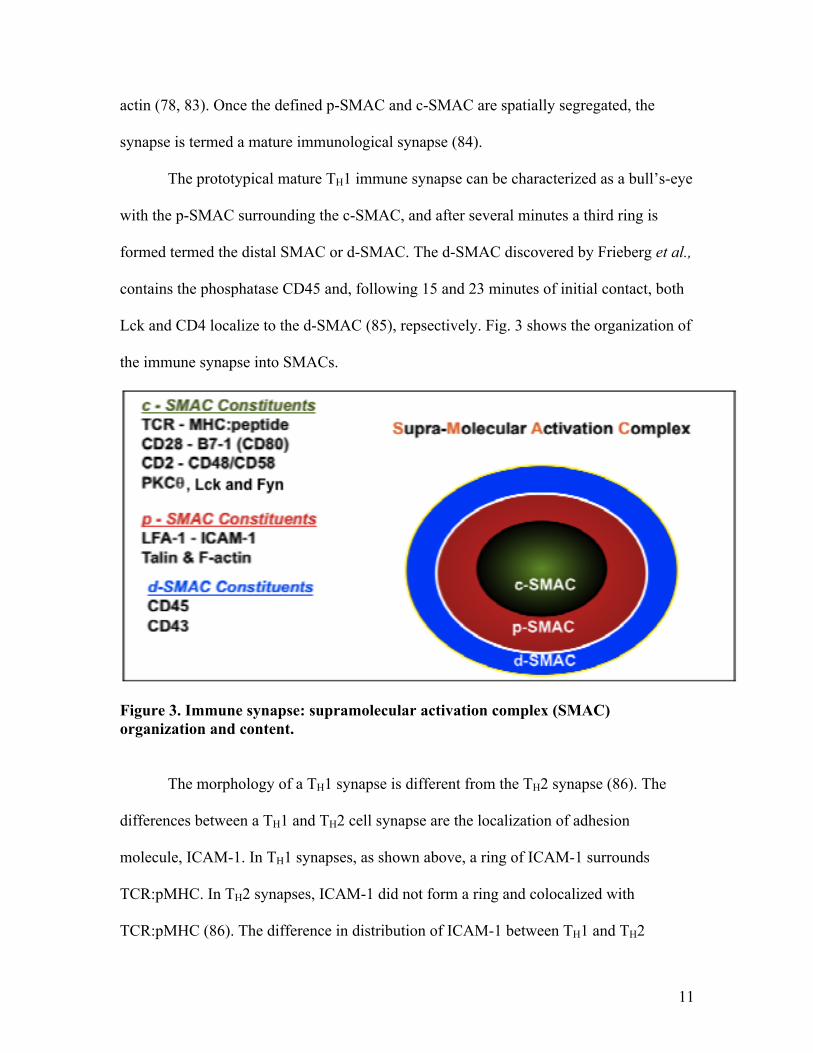
11
actin (78, 83). Once the defined p-SMAC and c-SMAC are spatially segregated, the
synapse is termed a mature immunological synapse (84).
The prototypical mature TH1 immune synapse can be characterized as a bull’s-eye
with the p-SMAC surrounding the c-SMAC, and after several minutes a third ring is
formed termed the distal SMAC or d-SMAC. The d-SMAC discovered by Frieberg et al.,
contains the phosphatase CD45 and, following 15 and 23 minutes of initial contact, both
Lck and CD4 localize to the d-SMAC (85), repsectively. Fig. 3 shows the organization of
the immune synapse into SMACs.
Figure 3. Immune synapse: supramolecular activation complex (SMAC) organization and content. The morphology of a TH1 synapse is different from the TH2 synapse (86). The
differences between a TH1 and TH2 cell synapse are the localization of adhesion
molecule, ICAM-1. In TH1 synapses, as shown above, a ring of ICAM-1 surrounds
TCR:pMHC. In TH2 synapses, ICAM-1 did not form a ring and colocalized with
TCR:pMHC (86). The difference in distribution of ICAM-1 between TH1 and TH2
12
synapses suggest differences in the function of the synapse between these cells. TH1
synapses could be used for cytotoxic functions (87), where the ring of ICAM-1 helps
concentrate cytotoxic granules towards the target cell and prevent damage to bystander
cells (88). TH2 cells are not known to have cytotoxic functions (87, 89), so there may be
less need for a ring of ICAM-1.
The organization of the c-SMAC and p-SMAC in TH1 cells can be visualized
using fluorescent microscopy, as shown in fig. 4. Using live-cell imaging and
fluorescently labeled MHC:peptide and ICAM-1 attached to a planar lipid membrane,
Grakoui et al. observed that when T cells interact with these molecules, large-scale
molecular rearrangements occur leading to the formation of the immune synapse (79).
Using time-lapse imaging, they showed that during the interaction of the T cell with
molecules in the membrane, the surface molecules can be seen reordering into specific
areas during a 60 minute time period, characterizing the c-SMAC and p-SMAC shown in
fig. 4A (79). In fig.4B Dustin’s group shows the localization of the TCR (red and green)
to the c-SMAC surrounded by ICAM-1 (blue) in the p-SMAC (90).
13
Figure 4. Immune synapse formation. (A) 60 minute time-lapse imaging showing the change in distribution of MHC (green) and ICAM-1 (red) receptors embedded in planar lipid bilayers when in contact with the T cell. From Grakoui et al. (79) (B) Fixed cell images showing the distribution of the T cell’s TCR ζ (green) and β (red) chains corresponding to the c-SMAC and surrounded by ICAM-1 (blue) at the p-SMAC. From Roberts. J. (90)
Immunological synapse function
The formation and organization of the immune synapse has been well studied (78,
79, 84, 85, 91, 92), but the functions of the immune synapse remain unclear. The
consensus from the last decade is that LFA-1/ICAM-1 interactions slow down rapidly
migrating T cells, allowing for long sustained contacts with APCs (93, 94) which may
lead to immune synapse formation and T cell activation. As the synapse is formed, the
SMACs stabilize the T-APC contact and lead to the segregation of signaling molecules
within the contact area. This allows for concentrated and continual TCR signaling (95)
14
leading to T activation (11). What remains unclear is the location of TCR signaling
within the immune synapse.
Over the last decade controversy has arisen over whether TCR signaling localizes
to the p-SMAC or c-SMAC, in a mature synapse. Recent results suggested that TCR
signaling starts in the p-SMAC and ceases in the c-SMAC (81, 96, 97). Lee et al. showed
as the TCR microclusters migrate from the p-SMAC to the c-SMAC, signaling associated
with these microclusters decreased (97). During synapse formation signaling can initially
be seen near the c-SMAC, but after one hour the signaling is gone (97). This can be seen
in the images in fig. 5A showing that peripheral phosphotyrosine (green) is lost in the c-
SMAC in an immune synapse after 60 min. Following entry into the c-SMAC the
microclusters are hypothesized to be degraded due to the increase of lysobisphophatidic
acid, a late endosomal marker in endosomes that are targeted for degradation (81). To
sustain the signaling necessary for full T cell activation, continuous formation of
signaling microclusters in the p-SMAC is required. These microclusters and the
associated signaling appear to be degraded in the c-SMAC (81). This raises the
possibility that the function of the c-SMAC may actually be to terminate TCR signaling.
However, the role of the c-SMAC in signal termination is controversial because it has
also been shown that signaling still occurs at the c-SMAC (78, 79, 98). In fig. 5B
phosphotyrosine is localized to the c-SMAC after 60 min of T-APC conjugate formation
(98). The images in fig. 5B are conflicting with the data shown by Lee et al. (97) in fig.
5A. These results are consistent with previous results showing signaling localized to c-
SMAC (86).
15
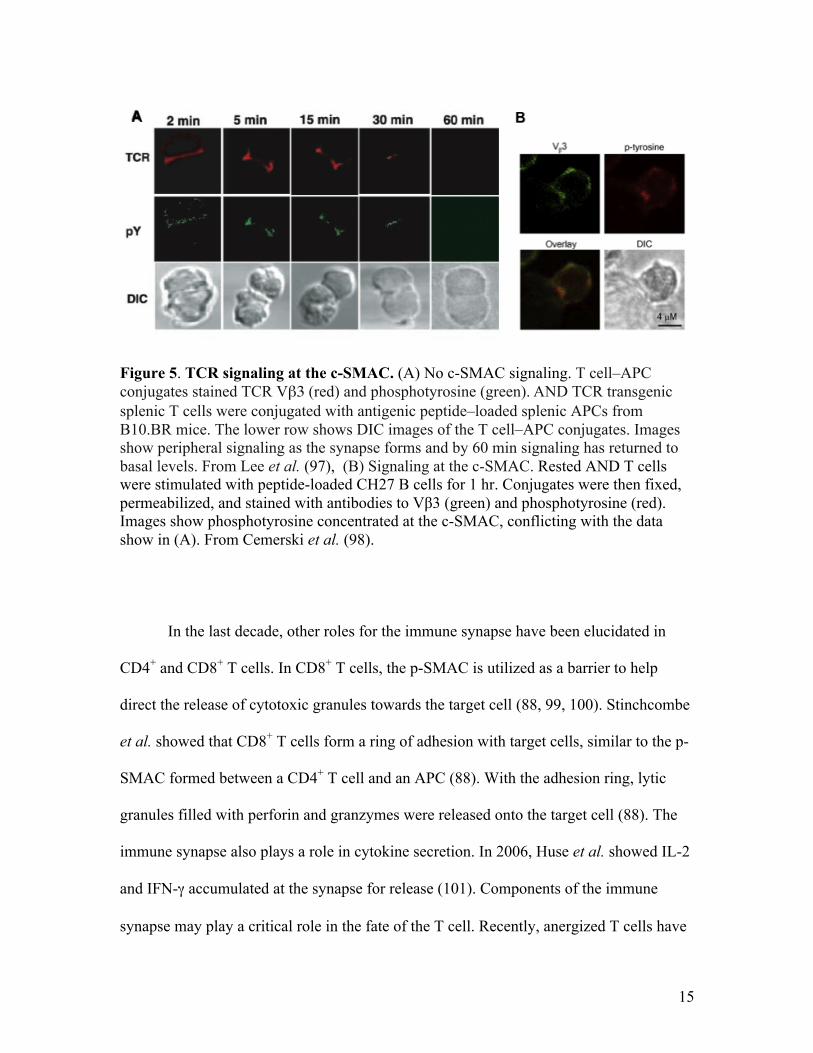
Figure 5. TCR signaling at the c-SMAC. (A) No c-SMAC signaling. T cell–APC conjugates stained TCR Vβ3 (red) and phosphotyrosine (green). AND TCR transgenic splenic T cells were conjugated with antigenic peptide–loaded splenic APCs from B10.BR mice. The lower row shows DIC images of the T cell–APC conjugates. Images show peripheral signaling as the synapse forms and by 60 min signaling has returned to basal levels. From Lee et al. (97), (B) Signaling at the c-SMAC. Rested AND T cells were stimulated with peptide-loaded CH27 B cells for 1 hr. Conjugates were then fixed, permeabilized, and stained with antibodies to Vβ3 (green) and phosphotyrosine (red). Images show phosphotyrosine concentrated at the c-SMAC, conflicting with the data show in (A). From Cemerski et al. (98).
In the last decade, other roles for the immune synapse have been elucidated in
CD4+ and CD8+ T cells. In CD8+ T cells, the p-SMAC is utilized as a barrier to help
direct the release of cytotoxic granules towards the target cell (88, 99, 100). Stinchcombe
et al. showed that CD8+ T cells form a ring of adhesion with target cells, similar to the p-
SMAC formed between a CD4+ T cell and an APC (88). With the adhesion ring, lytic
granules filled with perforin and granzymes were released onto the target cell (88). The
immune synapse also plays a role in cytokine secretion. In 2006, Huse et al. showed IL-2
and IFN-γ accumulated at the synapse for release (101). Components of the immune
synapse may play a critical role in the fate of the T cell. Recently, anergized T cells have
16
been shown to form an immune synapse with accumulated anergy-associated molecule,
the E3 ubiquitin-protein ligase, Cbl-B (102). Anergized CD4+ T cells formed distinct p-
and c-SMACs, and both SMACs showed enhanced levels of c-Cbl and Cbl-B (102).
Finally, and most relevant here, the immune synapse has been shown to be the site of
intercellular membrane and membrane-associated molecule transfer from APC to T cell
(88, 103-107).
Trogocytosis
Ag recognition by CD4+ T cells and the formation of a mature immune synapse
can lead to the acquisition of APC membrane lipids and membrane-bound proteins,
including cognate MHC:peptide complexes (103, 107). This phenomenon of intercellular
molecule transfer has been termed trogocytosis (108). Initially, the term was used to
describe the injuring of mouse embryo cells by pathogenic amoeba, wherein the amoeba
would acquire membrane from the mouse cells (109, 110). In 2003, Hudrisier and
colleagues applied the term trogocytosis to define the swapping of membrane and
membrane-associated molecules between immune cells (108, 111).
The discovery of immune cell trogocytosis came in the 1970’s when Playfair’s
group discovered the presence of B cell-derived Ig molecules on the surface of T cells
(112). Although there were several important publications in the 1980’s (113-115),
interest in trogocytosis and its potential immunomodulatory role was reignited in the late
1990s by the work of Mannie and colleagues (104, 116-121), Sprent et al. (105, 106,
122), and Hudrisier and Joly (107, 108, 111, 123-128). The general consensus of these,
17
and other studies, is that Ag recognition by T lymphocytes can lead to the trogocytosis of
molecules from the surface of an APC. Trogocytosis requires TCR recognition of
MHC:peptide ligands (103, 111, 129) and involves immune synapse formation (103)
along with subsequent TCR signaling. In addition, costimulation and actin cytoskeletal
rearrangements are required for efficient T cell trogocytosis (107, 108, 111, 123-128,
130).
While most studies have on focused on T cells; several other immune cells have
been shown to perform trogocytosis. B cells (111, 129, 131, 132), dendritic cells (DC)
(133, 134), and natural killer (NK) cells (135-138) have been shown to perform
trogocytosis. B cells acquire tethered antigen from target cells via trogocytosis (132). In
vivo studies have shown that DCs can capture MHC class I and II from other DCs (133,
134), and NK cells can acquire MHC class I in vitro and in vivo (135, 136, 138), along
with membrane (137) from target cells. The requirements for trogocytosis by these cells
appear to be less stringent than it is for T cells. B cells can perform trogocytosis without
BCR signaling and can acquire molecules from dead or lysed cells (111, 129). Similarly
DC have been shown to acquire MHC class I from apoptotic or necrotic tumor cells (139,
140), whereas T cells trogocytosis requires an intact APC (129). Unlike T cells,
trogocytosis by NK, B, and DCs can does not require Ag recognition (111, 129, 139,
141).
The acquisition of APC-derived molecules via the immune synapse can be
monitored using fluorescent microscopy, using fluorescently conjugated antibodies and
tagged surface molecules. In fig. 6, live-cell microscopy images show the formation of
several immune synapses, which can be seen as the accumulation of GFP-tagged
18
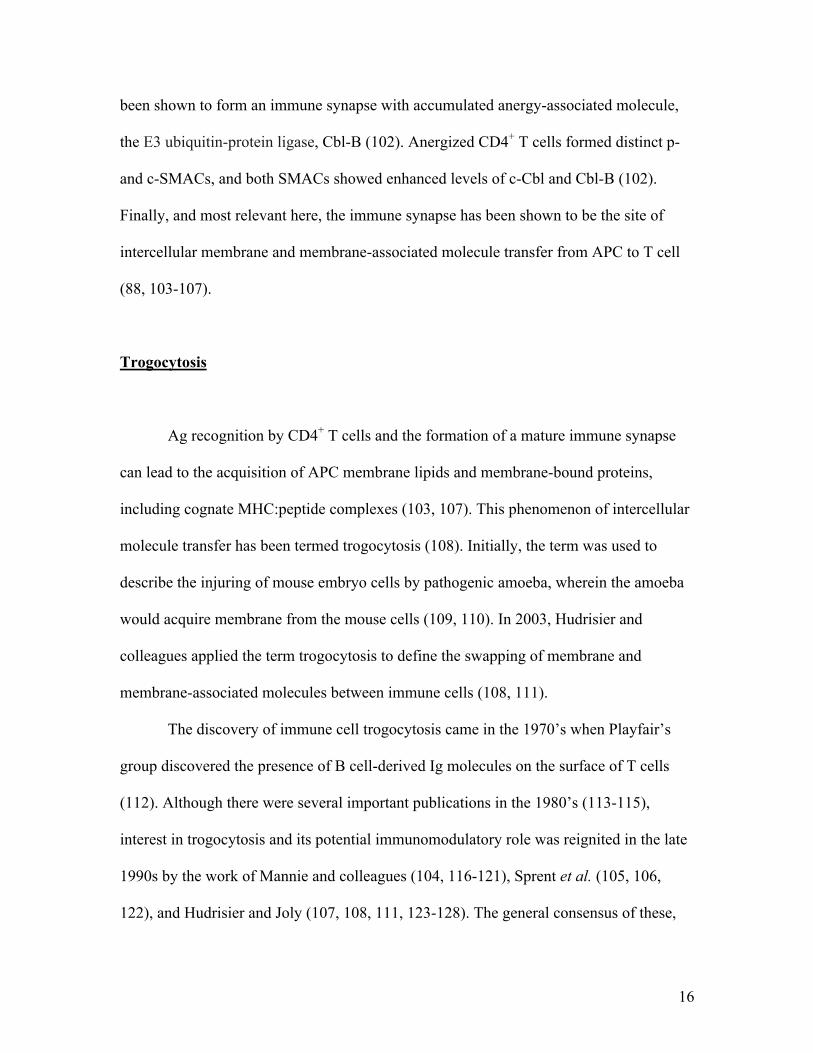
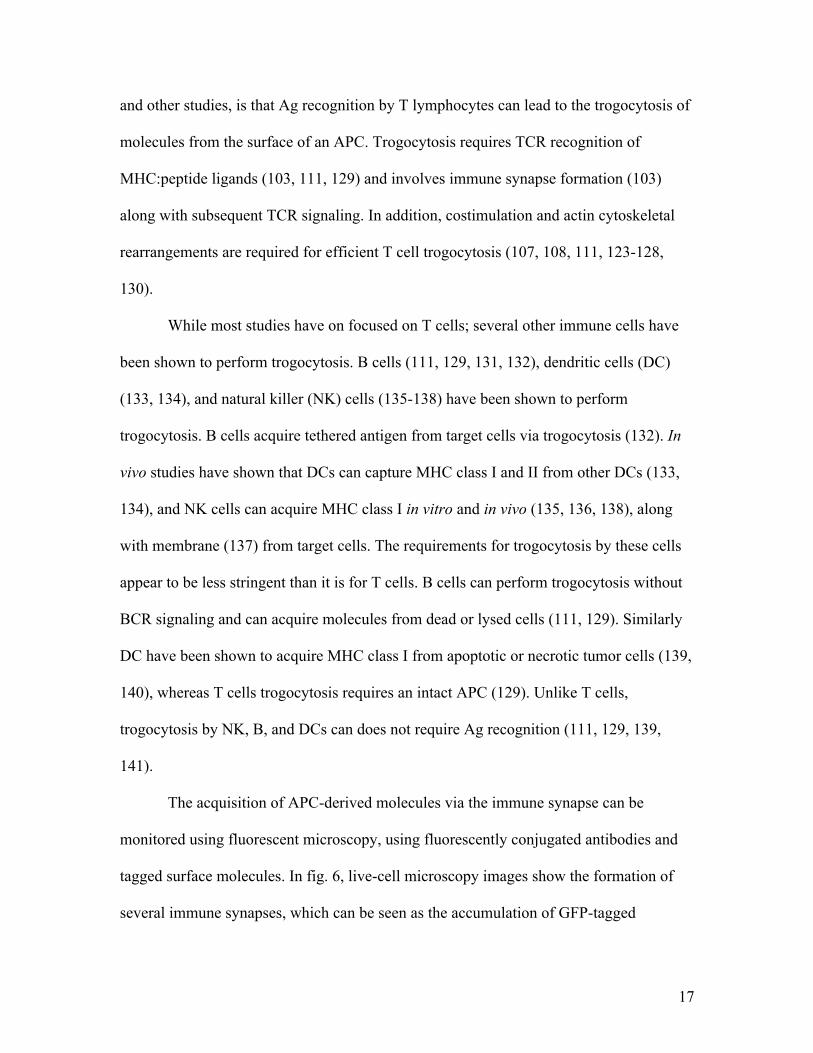
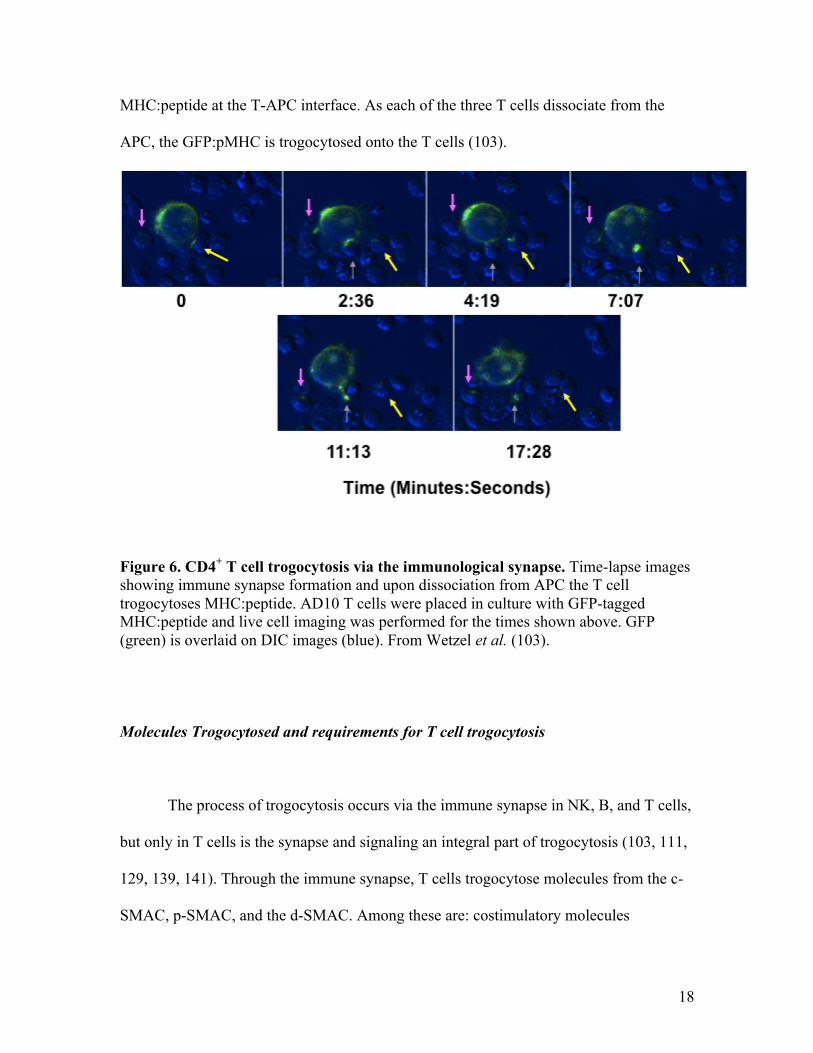
MHC:peptide at the T-APC interface. As each of the three T cells dissociate from the
APC, the GFP:pMHC is trogocytosed onto the T cells (103).
Figure 6. CD4+ T cell trogocytosis via the immunological synapse. Time-lapse images showing immune synapse formation and upon dissociation from APC the T cell trogocytoses MHC:peptide. AD10 T cells were placed in culture with GFP-tagged MHC:peptide and live cell imaging was performed for the times shown above. GFP (green) is overlaid on DIC images (blue). From Wetzel et al. (103).
Molecules Trogocytosed and requirements for T cell trogocytosis
The process of trogocytosis occurs via the immune synapse in NK, B, and T cells,
but only in T cells is the synapse and signaling an integral part of trogocytosis (103, 111,
129, 139, 141). Through the immune synapse, T cells trogocytose molecules from the c-
SMAC, p-SMAC, and the d-SMAC. Among these are: costimulatory molecules
19
[including CD80 (103, 130, 142), CD86 (106), OX40 ligand (143), and programmed
death ligand 1 (144)], adhesion molecules [including ICAM-1 (111)], and MHC:peptide
complexes (103, 105-107, 119, 145-147). Also, T cells can acquire membrane lipids from
the APC via the immune synapse (88, 107, 148).
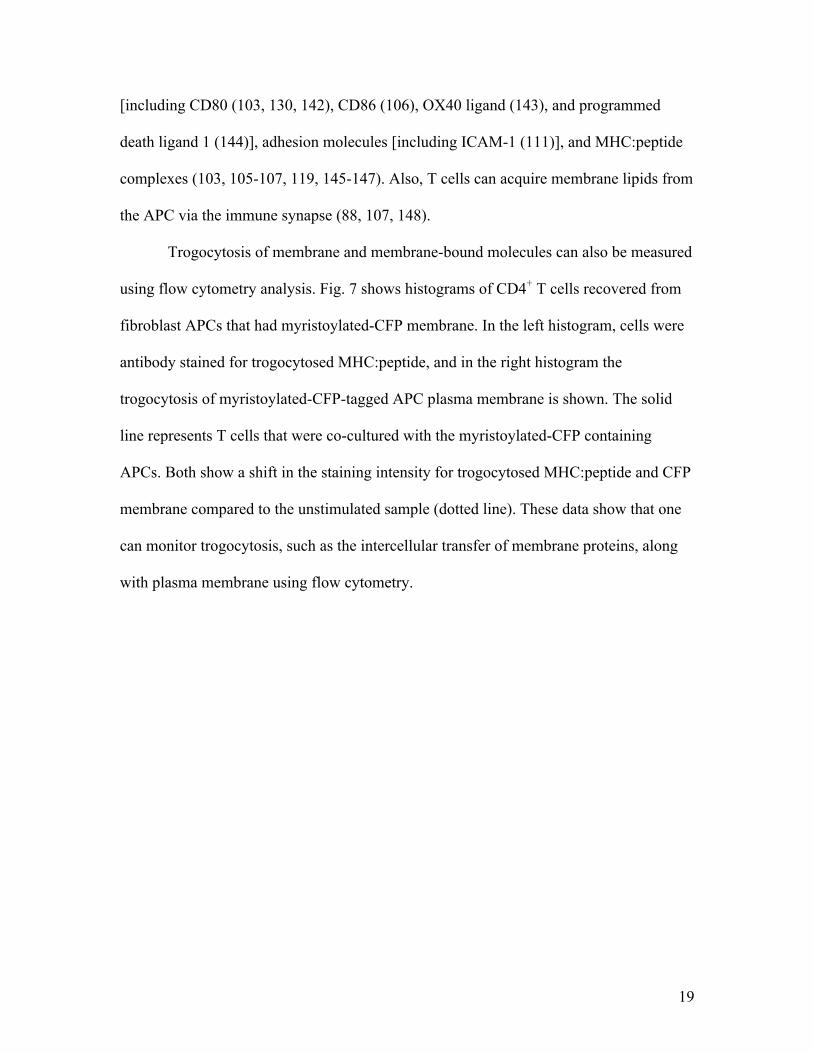
Trogocytosis of membrane and membrane-bound molecules can also be measured
using flow cytometry analysis. Fig. 7 shows histograms of CD4+ T cells recovered from
fibroblast APCs that had myristoylated-CFP membrane. In the left histogram, cells were
antibody stained for trogocytosed MHC:peptide, and in the right histogram the
trogocytosis of myristoylated-CFP-tagged APC plasma membrane is shown. The solid
line represents T cells that were co-cultured with the myristoylated-CFP containing
APCs. Both show a shift in the staining intensity for trogocytosed MHC:peptide and CFP
membrane compared to the unstimulated sample (dotted line). These data show that one
can monitor trogocytosis, such as the intercellular transfer of membrane proteins, along
with plasma membrane using flow cytometry.
20
Figure 7. Measuring trogocytosis using flow cytometry. Flow cytometry can be used to measure receptor and membrane trogocytosis onto T cells. (left histogram) CD4+ T cells recovered from myristoylated-CFP APC show increased staining for MHC:peptide on their surface (black line), compared to unstimulated T cells (dotted line), and non-specific antibody controls (shaded curve). (right histogram) Using the same CD4+ T cells used in the left histogram, CFP fluorescence is measured showing higher levels of trogocytosed CFP membrane on the surface of T cells recovered from myristoylated-CFP APC (black line), compared to unstimulated cells (dotted line), and non-specific antibody controls. (Unpublished data by Dr. Scott Wetzel)
As mentioned above, an integral component of T cell trogocytosis is the
engagement of the TCR by MHC:peptide (103, 111, 129). In the absence of TCR
engagement, trogocytosis is significantly reduced or halted (103, 106, 122). Hudrisier et
al. found that by blocking the initiation of TCR signaling using the Src kinase inhibitor,
PP2, also blocked trogocytosis (107); as TCR signaling increased, trogocytosis also
increased (107, 123), and that latruculin B, an inhibitor of actin polymerization, inhibits
trogocytosis by T cells (107).
Our lab and others have shown that the amount and the specificity of the Ag being
presented effects trogocytosis efficiency (103, 105-107, 119, 130, 142, 146, 149).
21
Trogocytosis efficiency is significantly lower in the absence of peptide (105-107) and is
dose dependent (103, 105, 107, 130, 142). Wetzel et al. also found that CD4+ T cell
trogocytosis is peptide specific (103). Several other papers have confirmed that peptide
specificity plays a role in trogocytosis (105, 107, 146).
Costimulatory molecules also play an important role in T cell trogocytosis. Using
blocking antibodies or CD28-/- T cells, Hwang et al. found that T cells require interactions
with costimulatory molecules, like CD80, on the APC for TCR mediated trogocytosis to
occur (106). Their data give support to the hypothesis that the immune synapse is
essential for trogocytosis, as it has been shown that CD80 is required for mature immune
synapse formation (78, 150, 151).
The activation state of the T cell plays an important role in trogocytosis. One of
the earliest T cell trogocytosis papers discovered that activated T cells performed
trogocytosis better than naïve T cells (152). Since then, many others have found that
resting or naïve T cells have reduced trogocytosis capabilities compared to activated T
cells (104, 106, 124, 130, 142, 153). Hwang et al. and others have hypothesized that the
increased expression of CD28 by activated T cells leads to increased adhesion that could
result in this difference (106, 122, 130). Consistent with this hypothesis, activated T cells
increase expression of their adhesion molecules, such as CD44 (31, 33), which could also
lead to increased trogocytosis.
22
Trogocytosis mechanism
The mechanism of trogocytosis from APC to T cell remains unclear. Early data
established that trogocytosis occurred via transsynaptic capture or directly from the
immune synapse (120, 123). Using electron microscopy, Patel et al. observed that APC
derived exosomes, which subsequently fused with the T cell, localized to the space
between the T cell and the APC (120). Another method of transsynaptic capture was
discovered by Stinchcombe et al., where they showed that upon dissociation of a
cytotoxic T lymphocyte (CTL) from its’ target cell, small “membrane bridges” had
formed between the cells (88). Resolution of the bridges lead to the transfer of MHC
class I and YFP-tagged membrane onto the T cell from the APC (88).
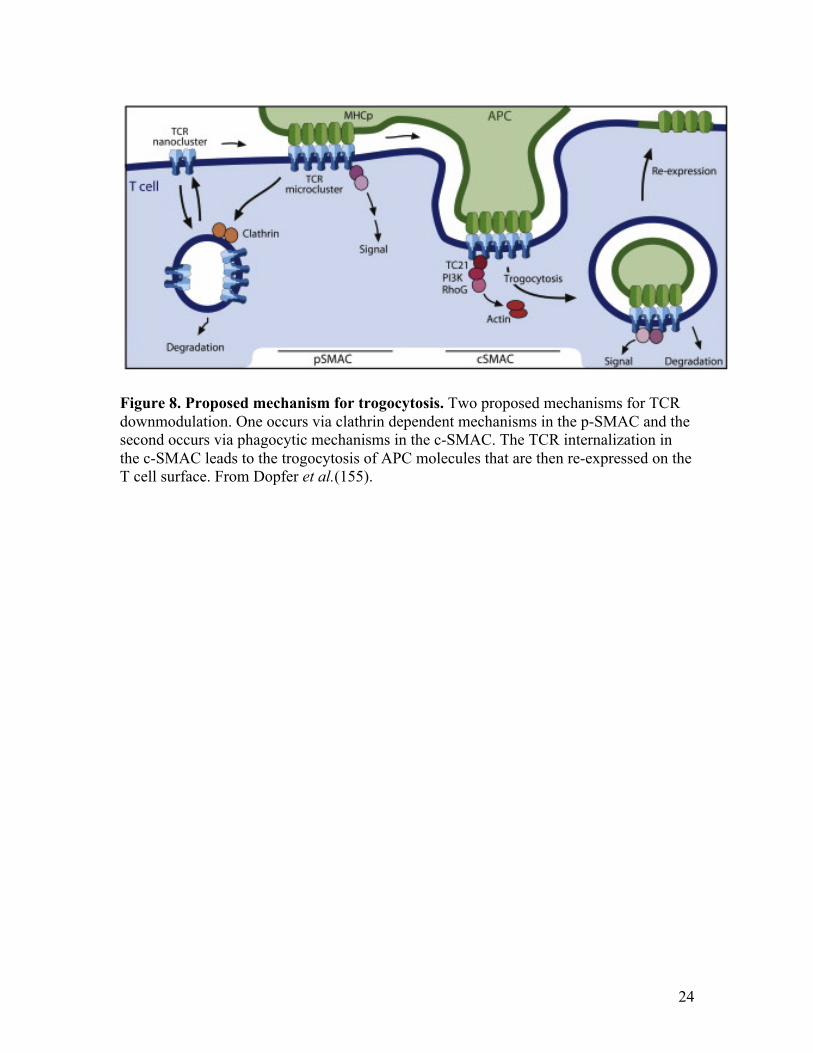
More recently, TCR downmodulation and coincidental phagocytosis has been
proposed as a mechanism for T cell trogocytosis. In 2011, Martin-Martin et al. found that
phagocytic mechanisms, specifically involving the activity of the small GTPases TC21
and RhoG, drive TCR downmodulation at the c-SMAC (20). This is consistent with
earlier data from Lee et al. and Cemerski et al., showing the TCR is downmodulated at
the c-SMAC (98, 154) and with the finding of Huang et al., who showed that CD8+ T
cells also perform trogocytosis by TCR downmodulation (105). These phagocytosed
APC membrane fragments are delivered to endosomes (105) and it has been hypothesized
that they fuse with the endosome membrane and upon recycling to the plasma membrane,
the APC molecules are integrated into the T cell membrane in their native topology (20,
155). This model is depicted in fig. 8 (155).
23
Integration of trogocytosed molecules into the T cell plasma membrane
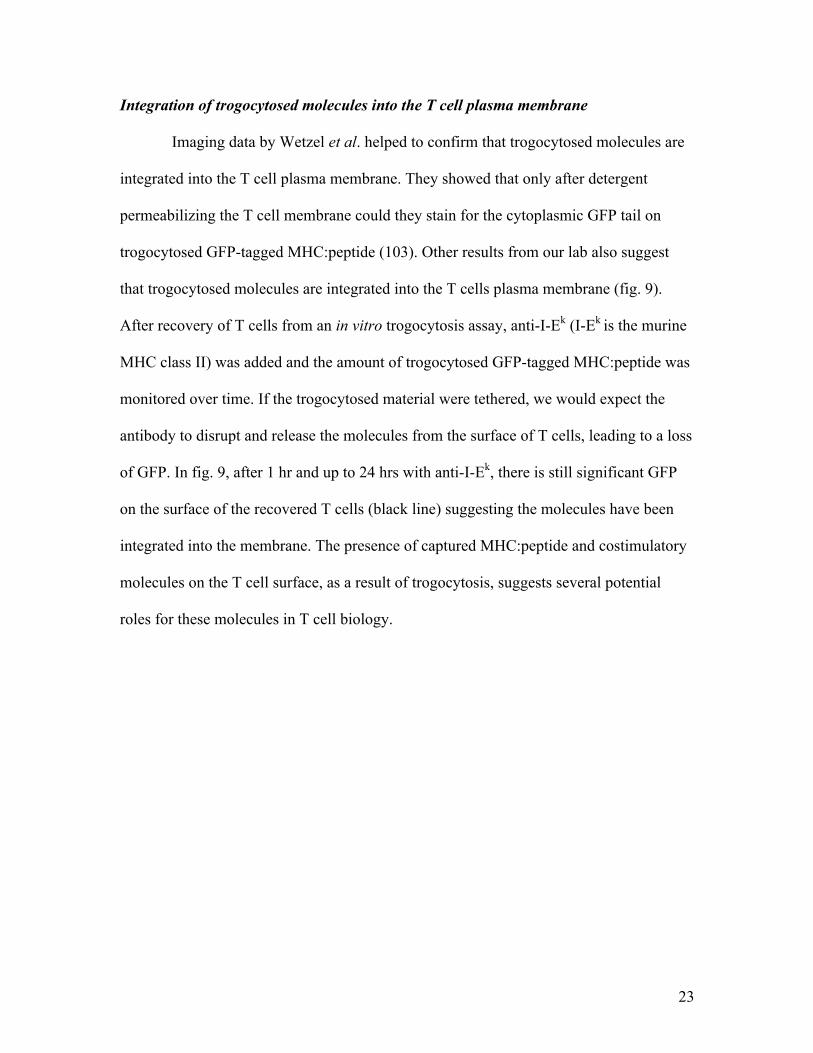
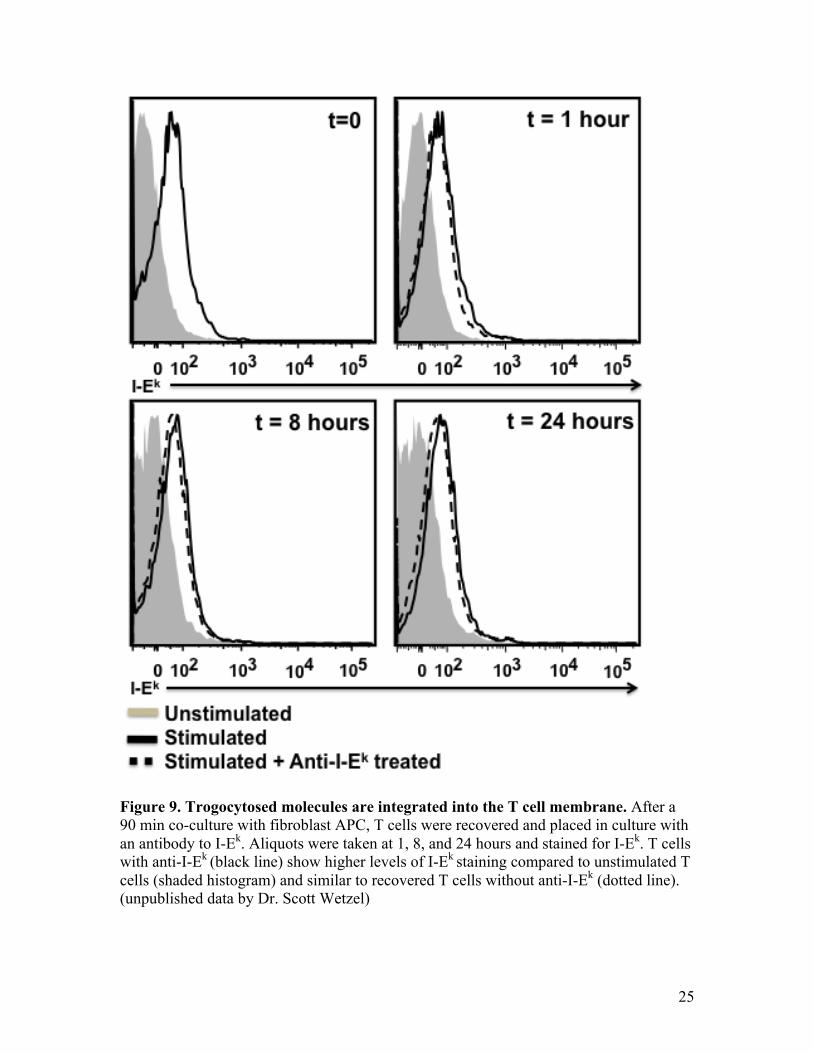
Imaging data by Wetzel et al. helped to confirm that trogocytosed molecules are
integrated into the T cell plasma membrane. They showed that only after detergent
permeabilizing the T cell membrane could they stain for the cytoplasmic GFP tail on
trogocytosed GFP-tagged MHC:peptide (103). Other results from our lab also suggest
that trogocytosed molecules are integrated into the T cells plasma membrane (fig. 9).
After recovery of T cells from an in vitro trogocytosis assay, anti-I-Ek (I-Ek is the murine
MHC class II) was added and the amount of trogocytosed GFP-tagged MHC:peptide was
monitored over time. If the trogocytosed material were tethered, we would expect the
antibody to disrupt and release the molecules from the surface of T cells, leading to a loss
of GFP. In fig. 9, after 1 hr and up to 24 hrs with anti-I-Ek, there is still significant GFP
on the surface of the recovered T cells (black line) suggesting the molecules have been
integrated into the membrane. The presence of captured MHC:peptide and costimulatory
molecules on the T cell surface, as a result of trogocytosis, suggests several potential
roles for these molecules in T cell biology.
24
Figure 8. Proposed mechanism for trogocytosis. Two proposed mechanisms for TCR downmodulation. One occurs via clathrin dependent mechanisms in the p-SMAC and the second occurs via phagocytic mechanisms in the c-SMAC. The TCR internalization in the c-SMAC leads to the trogocytosis of APC molecules that are then re-expressed on the T cell surface. From Dopfer et al.(155).
25
Figure 9. Trogocytosed molecules are integrated into the T cell membrane. After a 90 min co-culture with fibroblast APC, T cells were recovered and placed in culture with an antibody to I-Ek. Aliquots were taken at 1, 8, and 24 hours and stained for I-Ek. T cells with anti-I-Ek (black line) show higher levels of I-Ek staining compared to unstimulated T cells (shaded histogram) and similar to recovered T cells without anti-I-Ek (dotted line). (unpublished data by Dr. Scott Wetzel)
26
The function of trogocytosis
The biological significance of trogocytosis on CD4+ T cells remains unclear. The
potential role of trogocytosis in modulating immune responses falls into two broad
categories: cell extrinsic and cell intrinsic. Extrinsic function relates to how the
trogocytosis+ (trog+) T cell interacts with surrounding immune cells. The fact that
trogocytosed molecules, including MHC:peptide and costimulatory molecules, are
integrated into the T cell membrane in the correct orientation suggests that the trog+ T
cell may be able to present Ag (103, 107). As detailed below, several studies have
observed that Ag presentation by trog+ T cells can modulate the activation of responding
T cells (146, 147, 156-160) (T-T Ag presentation). The intrinsic cellular function of
trogocytosis relates to how trogocytosed material directly affects the individual trog+ T
cell biology. The few studies that have been done have shown that the trogocytosed
material may continue to interact with surface receptors on the trog+ T cell leading to
continued activation and signaling in the absence of APC, a process called
autopresentation (103, 161).
Trog+ T cells as APCs
The presence of trogocytosed MHC:peptide and CD80 on the T cells has been
shown in many studies to be involved in T cell to T cell Ag presentation (105, 107, 120,
130, 146, 150, 158, 159, 162-164) Analysis of T-T presentation first started in the 1970’s
with human T cells that endogenously express MHC class II, could be used to present Ag
to other human T cells (165-174). The vast majority of these studies found that Ag
27
presentation by human or rat CD4+ T cells (which also endogenously express MHC class
II) leads to the induction of anergy in the responder T cells (165-167, 169-174). The
induction of anergy in these responder T cells is likely due to a lack of costimulation on
the surface of the presenting T cells. Of these studies, only two looked at T cell
presentation of trogocytosed molecules (166, 168). One of the studies showed that CD4+
T cells could pick up antigens of gp120, an HIV receptor, during Ag presentation with an
infected T cell and use the antigens to help in the spread of HIV (168).
To study potential T-T Ag presentation as a result of trogocytosis, murine CD4+ T
cells are typically used because they don’t endogenously express MHC class II (175).
Several papers have examined the presentation of trogocytosed molecules by CD4+ T
cells (158, 159, 176). The initial studies of CD4+ T cell trogocytosis and subsequent T-T
presentation showed CD4+ T cells presenting trogocytosed bystander MHC class I
molecules and costimulatory molecules to CD8+ T cells (147, 177, 178). Xiang et al.
showed that CD4+ trog+ T cells can acquire bystander p:MHC class I with p:MHC class II
at the synapse and act like TH1 cells and activate CD8+ T cells (147). The CD4-CD8
interaction leads to the clonal expansion and generation of effector functions in the CD8+
T cells (147, 156, 177, 178). However, in the majority of trogocytosis-related studies,
CD4-CD8 and CD4-CD4 Ag presentation have found that T-T presentation is a
regulatory mechanism for inducing apoptosis, CTL killing (146, 178) or anergy (146,
158, 159, 179) in the responder T cells. Helft et al. found T-T presentation regulated
responder T cells by inhibiting effector/memory cell activation, but allowed for naïve T
cell survival (158). Most recently, Zhou et al. found that by adoptively transferring trog+
TH into TCR transgenic mice, the trog+ TH cells presented Ag to naïve T cells (159); this
28
increased CD25 expression in the responder. In contrast, when trog+ Treg cells were added
with the effector cells, CD25 expression went down (159). These studies suggest that T
cell Ag presentation has different effects on effector/memory cells and naïve T cells.
Trogocytosis intrinsic function
The presence of trogocytosed molecules may also have an effect on the biology of
the individual trog+ T cell. The presence of captured MHC:peptide and costimulatory
molecules on T cells suggests the possibility of autopresentation, wherein the
trogocytosed molecules on the surface of the T cell continue to engage receptors leading
to signaling in the absence of APCs. Zhou et al. first studied the effects of
autopresentation of CD4+ T cells, by looking at the effects of antigen-presentasomes
(APS), small exosomes derived from an APC tethered to the surface of T cells (161).
They found that T cells with APC derived vesicles or APS attached to their surface, had
increased levels of transcription factors NFκB and AP-1 which lead to proliferation and
activation of the T cells in the absence of APC (161). However this study did not
determine if the APS were responsible for signaling or if they just marked the cells that
were signaling. In addition, this study did not involve actual “trogocytosis” because
trogocytosis leads to the integration of trogocytosed molecules (103, 104, 152) and is not
APC derived vesicles or APS tethered to the T cell surface (103, 155). Their experimental
setup also strongly favored T-T presentation (161), casting further doubt on their results.
The study done by Wetzel et al. in 2005 was the first to examine signaling from
trogocytosed molecules (103). Using fluorescent microscopy, they found that several
TCR-associated signaling molecules, including phosphorylated tyrosine (pTYR) and Lck,
29
colocalized with the trogocytosed molecules on the surface of T cells recovered from
APC (103). Their data suggest that there is sustained signaling occurring in the T cell due
to autopresentation or continued engagement of the TCR with the trogocytosed molecules
(103). Wetzel et al. and Zhou et al. studies were the only studies prior to the work
detailed in this thesis analyzing intracellular signaling in trog+ CD4+ T cells.
Autopresentation of trogocytosed molecules may play a role in signal “summing” (180)
[i.e. repeated short-duration encounters that have been observed in T cell activation (181,
182)]. By continually engaging the TCR with trogocytosed MHC:peptide molecules may
sustain intracellular signaling leading to continual activation, proliferation, and survival.
An unresolved question regarding this potential autopresentation is whether trog+ T cells
sustain signaling over time without the presence of APC and whether the sustained
signaling is induced by the trogocytosed material, examining this question is the main
focus of this thesis.
30
Rationale
The impact of trogocytosis on the biological function of T cells is unclear. In this
thesis, I have examined the effects of trogocytosis on the individual trog+ CD4+ T cell.
The goal of these experiments was to determine the role trogocytosis plays in CD4+ T
cell activation, sustained signaling, proliferation, and selective survival in the trog+ T
cells. A murine fibroblast cell line expressing an I-Ek molecule loaded with a covalently
attached antigenic peptide (moth cytochrome C88-103) and containing a GFP-tagged
cytoplasmic tail was used as surrogate APCs and for T cells a peptide-specific TCR
transgenic mouse was used. The GFP-tagged MHC:peptide on the APCs allows for the
monitoring of trogocytosis by the presence of GFP on the surface of the T cells.
Trogocytosis can also be monitored by antibody (Ab) staining, because murine T cells do
not express MHC class II. Using a combination of high-resolution microscopy and flow
cytometry, it was observed that the trogocytosed material is retained on the surface of the
T cell.
The first aim was to determine what is required for the initial trogocytosis of
molecules by T cells. Multiple studies have found that naïve T cells perform trogocytosis
at reduced levels compared with activated T cells (104, 106, 124, 130, 142, 153), but
none have looked at whether the initial interaction of the naïve T cell with APC leads to
trogocytosis. Naïve T cells from AND x Rag-1-/- mice (mice with APCs that lack I-Ek)
were use to determine if the initial Ag presentation was sufficient enough to induce
significant trogocytosis. The data shows whether trogocytosis leads to the activation,
proliferation, and selective survival of trog+ CD4+ T cells. Flow cytometry data will show
31
whether trog+ T cells have an activated phenotype, proliferate, and survive longer in
culture following recovery from APCs compared to trog- T cells.
The second aim was to assess whether trogocytosis leads to sustained signaling.
Both Zhou et al. and Wetzel et al. have shown that signaling occurs in trog+ T cells (103,
161), but neither has determined if the signaling persists over time in the absence of APC.
Using wide-field microscopy, colocalization of several TCR associated-signaling
molecules with the trogocytosed material was analyzed. Using flow cytometry, sustained
signaling in trog+ T cells, over several days, in the absence of APC to see if sustained
signaling remained in trog+ T cells and not in trog- T cells.
The final aim of this thesis was to determine whether sustained signaling observed
in trog+ T cells, is driven by the trogocytosed molecules. Zhou et al. showed that having
tethered trogocytosed molecules on the T cell surface correlated with signaling in the
trog+ T cells (161), but they did not address if the trogocytosed molecules were
responsible for the signaling. Using an inhibitor to TCR signaling, PP2, the role of
trogocytosis in sustained signaling was examined. Using cultures of recovered T cells,
PP2 was added for 10 min, duration long enough for TCR signaling inhibition, then
washing out the inhibitor and incubate for 20 min to allow signal reinitiation. If TCR
signaling rebounds it suggest there is continual engagement of the TCR by the
trogocytosed material. Both flow cytometry and fluorescent microscopy data will
determine if there is rebound in TCR signaling following removal of PP2 in recovered
trog+ T cells.
I conclude by showing preliminary T-T presentation data. Experiments were set
up, using FACS sorted trog+ AD10 T cells placed in culture with naïve AND x B10.BR T
32
cells, to determine if trog+ T cells present Ag to the naïve T cells. Ag presentation was
confirmed by the activation of the naïve T cells by staining for activation markers (i.e.
CD69 and CD25) using flow cytometry.
The findings from this dissertation will further help to elucidate the biological
role of trogocytosis on CD4+ T cells by showing that trogocytosis leads to sustained
signaling, proliferation, and selective survival of trog+ T cells. The data in this thesis
suggest a possible role for trogocytosis in an immune response.
33
Chapter 2:
Materials and Methods
Animals
Heterozygous AD10 TCR transgenic mice (Vβ3+ ), specific for pigeon
cytochrome c fragment 88–104 (183) and reactive against moth cytochrome c (MCC)
fragment 88–103 on a B10.BR (H-2k) background, were kindly provided by S. Hedrick
(University of California, San Diego, CA) by way of David Parker (OHSU, Portland,
OR). This strain was maintained as heterozygotes by breeding to B10.BR mice, and
transgenic mice were identified by PCR. Homozygous AND x Rag-1-/- TCR transgenic
mice were purchased from Jackson Laboratory (Bar Harbor, Maine). AND x Rag-1-/-
mice were maintained as homozygoytes. Heterozygous AND x B10.BR TCR transgenic
mice were bred in the University of Montana Laboratory Animal Resources facilities
Only F1 animals resulting from breeding homozygous AND x Rag-1-/- mice with B10.BR
mice were used in experiments. Mice were housed in the University of Montana
Laboratory Animal Resources facilities and were allowed food and water ad libitum. All
procedures were supervised and in accordance with the University of Montana IACUC.
Antibodies and staining reagents
The following conjugated or unconjugated Abs were purchased from BD
Pharmingen (San Jose, CA): anti-TCR Vβ3 (clone KJ25), anti-ZAP70 PO4 (Y319 ; clone
17 A/P-ZAP-70), anti-ERK PO4 (MAPK p44/42 T202/Y204; clone 20a). CFSE, chicken
anti-rabbit IgG AlexaFluor 647, AlexaFluor 647-conjugated streptavidin, Pacific Blue-
34
conjugated streptavidin, AlexaFluor 488-conjugated streptavidin, and Vybrant CM-DiI
cell solution were purchased from Life Technologies (Eugene, OR). Biotin conjugated
anti-phosphotyrosine (4G10) was purchased from Upstate Biotechnology (Lake Placid,
NY). Rabbit polyclonal antibodies specific for phosphorylated Lck (Y505; #2751) and
phosphroylated ZAP-70 (Y319 Syk PO4 Y352; #2701) along with a mouse IgG1
monoclonal anti-phosphroylated ERK 1/2 (MAPK p44/42 T202/Y204; #E10) were
purchased from Cell Signaling Technology (Beverly, MA). Secondary staining reagents,
including Aminomethylcoumarin Acetate (AMCA)-conjugated streptavidin, Cy5-
conjugated polyclonal goat anti-armenian hamster IgG H+L, Texas Red-conjugated
polyclonal goat anti-armenian hamster IgG H+L, Texas Red-conjugated polyclonal
donkey anti-rabbit IgG H+L, and Texas Red-conjugated anti-mouse IgG H+L were
purchased from Jackson ImmunoResearch Laboratories (West Grove, PA). Purified anti-
CD3 (145.2C11), along with fluorescently conjugated anti-CD69 (H1.2F3), anti-CD4
(RM4-5), anti-C25 (PC61), anti-CD11c (N418), anti-F4/80 (BM8), and CD80 (16-10A1)
were purchased from BioLegend (San Diego, CA). PE-conjugated anti-CD45R (B220)
(RA3-6B2) was purchased from eBioscience (San Diego, CA). Anti-I-Ek (17-3-3) was
purchased from Southern Biotechnology (Birmingham, AL). EZ-link Sulfo-NHS-biotin
(sulfosuccinimidobiotin) to label the cell surface was purchased from Pierce (Rockford,
IL).
Antigen presenting cells
MCC:GFP fibroblasts expressing enhanced GFP-tagged I-Ek β-chain with
covalently attached antigenic MCC88-103 were described previously (184). A second
35
transfected fibroblast line, MCC:FKBP, has the MCC:I-Ek β-chain fused to three repeats
of the FK506-binding protein (FKBP) (Ariad Pharmaceuticals, Cambridge, MA) in place
of the GFP tag (103). The MCC:GFP and MCC:FKBP express nearly identical levels of
CD80, ICAM-1 and surface MCC:I-Ek. A third transfected fibroblast cell line, P13.9H
expresses CD80 and ICAM-1 similar to the other fibroblast cell lines, but it expresses I-
Ek without antigenic peptide attached. P13.9 cells were provided by Dr. Ron Germain
(NIAID, National Institutes of Health). Cells were maintained in “complete DMEM”
containing high glucose DMEM (Life Technologies, Carlsbad, CA) supplemented with
10% FBS (Atlanta Biologicals, Atlanta, GA), 1 mM L-glutamine, 100 mg/ml sodium
pyruvate, 50 µM 2-ME, essential and nonessential amino acids (Life Technologies,
Carlsbad, CA), 100 U/ml penicillin G, 100 U/ml streptomycin, and 50 µg/ml gentamicin
(Sigma, St. Louis, MO.).
In vitro T cell priming
Single cell suspensions of splenocytes from 6- to 12-wk-old AD10 transgenic
mice or AND x B10.BR F1 mice were depleted of erythrocytes by hypotonic lysis in
Gey’s solution and resuspended in “complete RPMI” containing RPMI (Life
Technologies) supplemented with 10% FBS (Atlanta Biologicals, Atlanta, GA), 1 mM L-
glutamine, 100 mg/ml sodium pyruvate, 50 µM 2-ME, essential and nonessential amino
acids (Life Technologies), 100 U/ml penicillin G, 100 U/ml streptomycin, and 50 µg/ml
gentamicin (Sigma, St. Louis, MO.). Cells were used directly ex vivo or were activated in
vitro for 6 days by addition of 2.5 µM MCC88-103 peptide to splenic cell suspensions at ~4
x 106 cells/ml . Lymphocytes were isolated from priming cultures by density
36
centrifugation using Lympholyte M (Cedarlane Laboratories, Burlington, NC). T cells
were resuspended at 5 x 10⁶/ml in phenol red-free complete RPMI and kept at 4°C until
used.
Standard in vitro trogocytosis assay
To assess trogocytosis by the CD4+ AD10 T cells, we used our previously
described standard in vitro trogocytosis assay (103). Briefly, 1 x 10⁶ MCC:GFP or
MCC:FKBP cells were plated into individual wells of a six-well tissue culture plate
(Greiner, Monroe, NC) and incubated overnight at 37°C. For cell surface labeling and to
measure trogocytosis, either 2.5 x 10⁷ MCC:GFP or MCC:FKBP cells/ml were placed in
PBS (pH 8.0) and stained using 10 mM solution of EZ-link Sulfo-NHS-biotin at room
temperature for 30 min. These cells were washed three times in PBS with 100 mM
glycine, resuspended in DMEM, and then plated at 106/well. In some experiments, 5 µM
Vybrant CM-DiI cell solution was also used to stain the cell surface of MCC:GFP or
MCC:FKBP. For this staining, 5 µl/ml of CM-DiI was added to 106 MCC:GFP or
MCC:FKBP cells/ml in Hank’s Balanced Salt Solution (HBSS, Life Technologies) for 20
min at 37°C, washed in complete DMEM, and then the cells were incubated overnight
37°C. A total of 2.5 x 10⁶ in vitro primed T cells were added to each well and the plates
were centrifuged briefly (30 seconds at 200 x g) to promote T-APC interaction. The cells
were then incubated for 90-minutes at 37°C. After the 90-minute incubation, T cells were
recovered from the cultures by rinsing with PBS. No additional dissociating reagents
were added (e.g., EDTA or trypsin) to aid in T cell recovery. In this way, only cells that
had spontaneously dissociated from the APC were collected. After two PBS washes,
37
recovered T cells (containing both trogocytosis+(trog+) and trogocytosis- (trog-)) were
used immediately in microscopy or flow cytometry experiments, or were resuspended in
complete RPMI at very low density (104/ml) and cultured for additional times up to 6
days. At the end of the incubation period, cells were resuspended at 106/ml before
staining and fixation for flow cytometry experiments or addition to poly-L-lysine-coated
LabTek II chambered coverslips for imaging, as described below.
In vitro naïve T cell trogocytosis assay
To assess trogocytosis by naïve T cells, AND x Rag-1-/- mice were used. In these
experiments, 1 x 10⁶ biotin labeled MCC:FKBP cells were plated into individual wells of
a six-well tissue culture plate (Greiner, Monroe, NC) and incubated overnight at 37°C. A
total of 2.5 x 10⁶ AND x Rag-1-/- T cells were added to each well and the plates were
centrifuged briefly (30 seconds at 200 x g) to promote T-APC interaction. The cells were
then incubated for 6-24 hours at 37°C. After the 6-24 hour incubation, T cells were
recovered from the cultures by rinsing with PBS, as described for the standard
trogocytosis assay. Similar to the standard trogocytosis assay, after two PBS washes,
recovered T cells (containing both trog+ and trog-) were used immediately in microscopy
or flow cytometry experiments or were resuspended in complete RPMI at very low
density (104/ml) and incubated for additional times up to 6 days. In some experiments,
after 2 days T cells were restimulated using fresh biotin-labeled MCC:FKBP cells using
the standard in vitro trogocytosis assay described above. To differentiate between
trogocytosis that occurred in the primary stimulation compared to the restimulation, two
different secondary staining reagents were used: AF488-conjugated and AF647-
38
conjugated streptavidin. Prior to the restimulation, T cells were stained with AF488-
conjugated streptavidin to identify biotin that had been trogocytosed from the primary
stimulation. Following the restimulation, the T cells were stained with AF647-conjugated
streptavidin to identify biotin trogocytosis from the restimulation culture.
Flow cytometry
Cells were recovered from the cultures and resuspended at 106/ml in FACS buffer
(PBS, pH 7.4 containing 2% BSA Fraction V (Sigma) and 0.1% NaN3). The T cells were
stained with the indicated reagents for 30-minutes at 4°C in FACS buffer. When
necessary, after three washes, cells were stained for 20-minutes with secondary reagents
in FACS buffer. To measure activation, cells were stained for the activation marker
CD69 and CD25, along with the TCR (Vβ3) and CD4. Following a final set of three
washes in FACS buffer, cell were resuspended in 500µl of FACS buffer and stored on ice
protected from light until analyzed using a FACSAria II (BD Biosciences) in the UM
Fluorescence Cytometry Core. Alternatively, after the final wash cells were fixed by
addition of ice-cold fixative (4% paraformaldehyde and 0.5% glutaraldehyde) followed
by a 45-minute incubation at room temperature. Following an additional set of FACS
buffer washes, cells were resuspended in 500µl FACS buffer and were stored at 4°C in
the dark for up to 3 days until analysis. To examine proliferation, cells were labeled with
5 mM CFSE in PBS prior to establishment of the in vitro priming cultures.
39
Examination of trogocytosis associated intracellular signaling by flow cytometry
To assess the activation state of TCR proximal (ZAP-70) and distal (ERK)
intracellular signaling molecules, we modified the phosphorylation (phosflow) protocol
of Chow et al. (185). After staining surface molecules on live cells, as described above,
cells were fixed for 10-minutes in ice-cold fixative (4% paraformaldehyde and 0.5%
glutaraldehyde in PBS). After two washes in PBS plus 5% FBS, cells were
permeabilized/fixed for between 10-30 minutes with ice-cold 50% methanol in PBS and
washed twice in PBS prior to staining. Cells were then stained with primary staining
reagents for 30 min at 4°C in FACS buffer at a 1:100 dilution (2 µg/ml). After three
washes, cells were stained for 20-minutes with secondary reagents in FACS buffer at a
1:200 dilution (2 µg/ml). After a final set of washes, cells were analyzed immediately or
were stored at 4°C for up to 3 days before analysis on a FACSAria II. Data were
analyzed with FlowJo 8.8.7 software (Tree Star, Ashland, OR) on a Macintosh iMac
(Apple, Inc). As a positive control, AD10 T cells were activated using phorbol 12-
myristate 13-acetate (PMA) (Sigma, St. Louis, MO.) or anti-CD3 (145-2C11). For PMA
stimulation, following a 6 day in vitro T cell priming, 40 nM PMA was added to the cells
for 10 min at 37°C, and then washed out immediately before the cells were stained. For
anti-CD3 stimulation, following a 6 day in vitro T cell priming, 5 µg/ml anti-CD3 was
added to the cells in solution for 30 min at 4°C. Following a wash with PBS, 10 µg/ml
Texas Red-conjugated polyclonal goat anti-armenian hamster IgG H+L was added for 15
min at 4°C to cross-link the anti-CD3, unbound Ab washed out before the cells were
stained.
40
Immune synapse microscopy
To examine the immune synapse, one day prior to imaging 2.5 × 10⁴ MCC:GFP
cells were added per well in #1.5 LabTek II eight-chambered coverslips (Nunc,
Rochester, NY) and incubated overnight at 37°C. The next day 105 T cells were added to
each well and the dishes were spun at 200xg for 30 sec to initiate contact between T cells
and APCs. After a 30-minute incubation at 37°C, cells were fixed by addition of ice-cold
fixative (4% paraformaldehyde and 0.5% glutaraldehyde in PBS) and incubated for 45-
minutes at room temperature in the dark followed by permeabilization with 0.2% Triton
X-100 in PBS for 10-minutes. Cultures were stained with primary Abs at concentrations
of 10 µg/ml in imaging buffer (PBS plus 2% BSA Fraction V) for 2 h at room
temperature in a humidified chamber. After three 5-min PBS washes, cells were
incubated with secondary Abs (1:200 dilution in imaging buffer) for 2 h at room
temperature. After three additional PBS washes, SlowFade Gold antifade reagent (Life
Technologies) was added to the wells. Samples were stored at 4°C and protected from
light until imaged.
T cell–APC conjugates to be imaged were chosen based upon their characteristic
morphology in differential interference contrast (DIC) of T cells in tight contact with and
flattened against an APC. A stack of 50–90 fluorescent images spaced 0.2 µm apart in the
z-axis was obtained with a 60X, 1.4 NA, oil immersion lens on the Applied Precision
(API) DeltaVisionRT image restoration microscopy system (Issaquah, WA).
41
Microscopic analysis of trogocytosis
To examine trogocytosis by microscopy, T cells were recovered from the standard
in vitro trogocytosis assay after the 90-minute incubation by vigorous rinsing with PBS
cells were immediately stained or incubated for up to 72 hrs before staining. For imaging
of cells directly from the trogocytosis assay, 106 recovered T cells were placed in each
well of Poly-L-Lysine pre-coated #1.5 LabTek II eight-chambered coverslips for 10-
minutes at 37°C. For time course experiments, recovered T cells (containing both trog+
and trog-) were incubated at very low density (104/ml) for the indicated times before
being placed in the Poly-L-Lysine coated chambered coverslips. Cells were fixed by
addition of ice-cold fixative (4% paraformaldehyde and 0.5% glutaraldehyde in PBS) and
incubated for 45-minutes at room temperature in the dark followed by permeabilization
with 0.2% Triton X-100 in PBS for 10-minutes. Cells were antibody stained as described
above, then imaged using an Applied Precision DeltaVisionRT microscopy system
(Issaquah, WA). Cells were chosen for imaging in DIC by identifying isolated, individual
T cells in the field (and without regard to potential fluorescence). T cells were imaged in
the same manner as the T-APC conjugates, as described above.
Image analysis
Constrained, iterative deconvolution was performed using the API SoftWorx
software package. Using SoftWorx the integrated intensity of GFP, which is a measure of
the amount of fluorescently-labeled molecules accumulated, was obtained for areas ≥ 2-
fold above background fluorescence. Background fluorescence was measured using a
region of interest (ROI) that encompassed areas away from the cell. For the analysis of
42
phosphorylated signaling molecules, the integrated intensity and mean fluorescent
intensity was obtained for areas ≥6 fold above background, again using ROI to measure
background, unless otherwise noted. Maximum intensity projections (MIP) were used to
create three-dimensional (3D) reconstructions for image analysis using the API SoftWorx
software. Line profiles were used to measure pixel intensity and distances using the API
SoftWorx software. For both recovered T cells and T-APC conjugates, 20-25 cells or
conjugates were imaged for each treatment group in each of the six experiments.
Integrated intensity and mean fluorescence intensity (MFI) were measured using single
optical sections. Both MFI and integrated intensity were measured using ROIs that
encompassed the trogocytosed molecules or intracellular signaling molecule. Co-
localization between trogocytosed molecules and intracellular signaling molecules was
assessed by the Pearson’s correlation coefficient and overlap coefficients using the
JACOP plug-in (186) in ImageJ (187).
TCR signaling inhibition
To determine if sustained signaling was due to engagement of the TCR by
trogocytosed material, TCR signaling inhibition experiments were performed similar to
those of Faroudi et al. (188). Cells incubated at very low density (104/ml) were treated for
10 or 30 minutes with 20 µM PP2, a Src-family tyrosine kinase inhibitor (189) (Life
Technologies). Three treatment groups were set up for the TCR signaling inhibition
experiments. In the first group, cells were incubated for 30-minutes in media only to
serve as an untreated control. In the second group, cells were incubated with 20µM PP2
for 10-minutes followed by three washes to remove the PP2. Cells were incubated for 20
43
additional minutes in media. In the final positive-control group, cells were incubated for
30-minutes in the presence of 20µM PP2, to confirm that the PP2 treatment inhibited
both TCR proximal and distal signaling events. After incubation, cells were fixed and
stained for phosphorylated ZAP-70 (TCR proximal signaling) and phosphorylated ERK
1/2 (TCR distal signaling) for flow cytometry and imaging, as described above.
T-T presentation
To examine the potential of trog+ T cells to present Ag, trog+ T cells were FACS
sorted and incubated with naïve AND x B10.BR T cells as potential responders. To
generate the trog+ cells, AD10 T cells were incubated with surface biotinylated and CFSE
stained MCC:FKBP cells in the standard in vitro trogocytosis assay. The CFSE stain and
lineage markers were used to identify and remove fibroblast, other contaminating cells.
Biotin+ CFSE- (trog+) and biotin- CFSE- (trog-) T cells were sorted using the FACSAria II
in the UM Fluorescence Cytometry core. The cultures were also stained for the following
lineage markers, B220 (B cells), F4/80 (Mθ), CD11c (DC). For each of the four
experiments performed, ~107 trog+ and trog- T cells were collected. To assess sort purity,
106 trog+ and trog- T cells were stained with PerCP-conjugated anti-CD4 and analyzed by
flow cytometry. To assess the ability of the trog+ and trog- cells to present Ag, the sorted
trog+ or trog- T cells were placed in culture with CFSE-labeled naïve AND x B10.BR T
cells at a 1:1 ratio overnight at 37°C. The CFSE staining allowed for identification of the
naïve T cells. After the overnight coculture, T cells were recovered, stained, and analyzed
using flow cytometry. CFSE+ and CFSE- cell populations were compared using stains for
activation markers CD69 and CD25, and trogocytosed biotin.
44
Peptide affinity
To assess whether antigenic peptide affinity affects trogocytosis by either CD4+
AD10 or AND x B10.BR T cells, we used our previously described standard in vitro
trogocytosis assay (103). Briefly, P13.9H cells were plated at 106/well into individual
wells of a six-well tissue culture plate and incubated overnight at 37°C with peptides.
Three peptides with varying TCR affinity were loaded onto P13.9H cells: a high-affinity
agonist peptide MCC (ANERADLIAYLKQATK) (Sigma, Woodlands, TX),
intermediate-affinity peptide MCC-A (AAAAAAAIAYAKQATK) (New England
Peptide, Gardner, MA), or a very weak agonist altered peptide ligand MCC-K99A
(ANERADLIAYLAQATK) (Sigma, Woodlands, TX). During the initial plating of the
P13.9H cells, 2.5 µΜ of each peptide was added to the cell cultures. A total of 2.5 x 10⁶
in vitro primed T cells were added to each well and the plates were centrifuged briefly
(30 seconds at 200 x g) to promote T-APC interaction. The cells were then incubated for
90-minutes at 37°C. After the 90-minute incubation, T cells were recovered from the
cultures by rinsing with PBS. No additional dissociating reagents were added (e.g.,
EDTA or trypsin) to aid in T cell recovery. In this way, only cells that had spontaneously
dissociated from the APC were collected. After two PBS washes, recovered T cells
(containing both trogocytosis+(trog+) and trogocytosis- (trog-)) were used immediately in
flow cytometry experiments. Recovered T cells were resuspended at 106/ml before
staining and fixation for flow cytometry experiments, as described above.
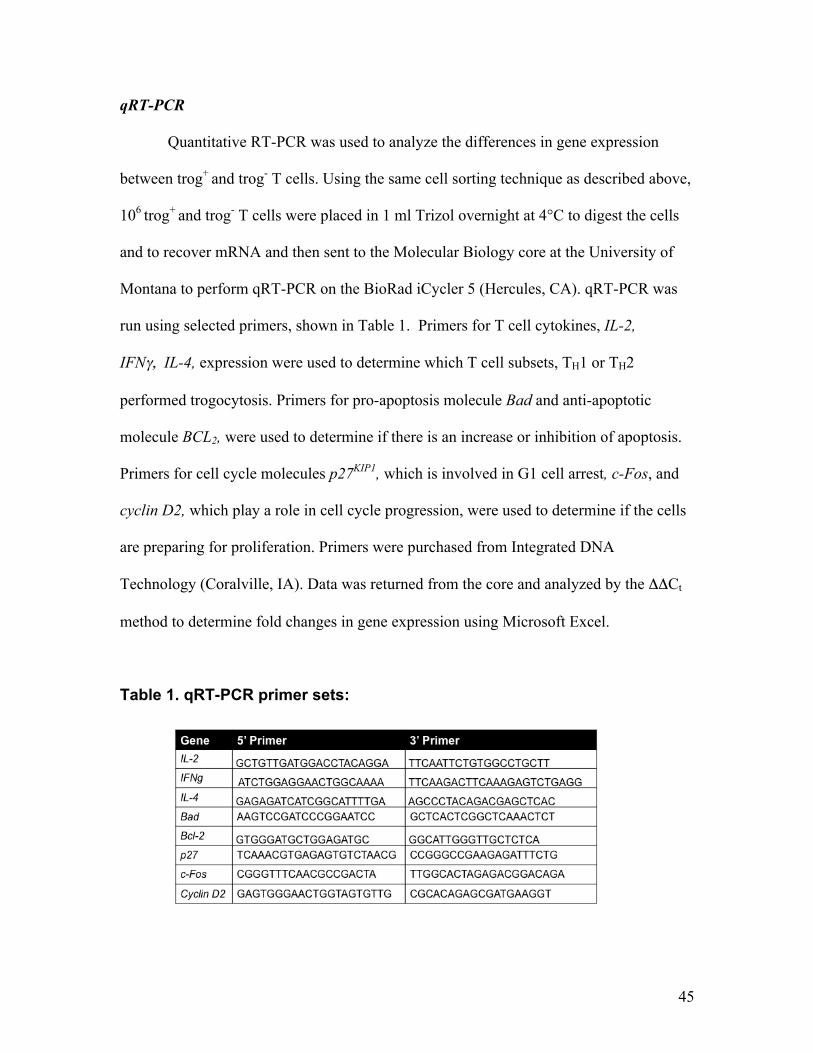
45
qRT-PCR
Quantitative RT-PCR was used to analyze the differences in gene expression
between trog+ and trog- T cells. Using the same cell sorting technique as described above,
106 trog+ and trog- T cells were placed in 1 ml Trizol overnight at 4°C to digest the cells
and to recover mRNA and then sent to the Molecular Biology core at the University of
Montana to perform qRT-PCR on the BioRad iCycler 5 (Hercules, CA). qRT-PCR was
run using selected primers, shown in Table 1. Primers for T cell cytokines, IL-2,
IFNγ, IL-4, expression were used to determine which T cell subsets, TH1 or TH2
performed trogocytosis. Primers for pro-apoptosis molecule Bad and anti-apoptotic
molecule BCL2, were used to determine if there is an increase or inhibition of apoptosis.
Primers for cell cycle molecules p27KIP1, which is involved in G1 cell arrest, c-Fos, and
cyclin D2, which play a role in cell cycle progression, were used to determine if the cells
are preparing for proliferation. Primers were purchased from Integrated DNA
Technology (Coralville, IA). Data was returned from the core and analyzed by the ΔΔCt
method to determine fold changes in gene expression using Microsoft Excel.
Table 1. qRT-PCR primer sets:
46
Statistical analysis and graphing
Statistical analysis (student’s t test) and graphing were performed using Prism 4
(GraphPad Software, La Jolla, CA). Significance was defined as p ≤ 0.05.
47
Chapter 3:
Results
The presence of APC-derived molecules on the surface of T cells, as a
consequence of trogocytosis, raises the possibility that these molecules play a role in
immune modulation. It has previously been shown that trogocytosis may allow T cells to
act as antigen presenting cells (146, 147, 156, 158, 190), but the biological effect of
trogocytosis on the individual T cell remains unclear. In support of a potentially
biologically significant role of trogocytosis on individual cells, our lab previously
reported that the acquired MHC:peptide molecules co-localized with elevated
phosphorylated tyrosine (pTyr) and the TCR-proximal kinase p56Lck (Lck) (103). This
suggests that the trogocytosed molecules are associated with sustained intracellular
signaling after dissociation from APC. In this thesis, I examine the biological effects of
trogocytosis on individual CD4+ T cells, specifically looking at sustained signaling,
proliferation, and cell survival.
Measuring Trogocytosis
To identify trog+ T cells, several different cell-labeling methods were used. Our
previous studies relied upon the detection of GFP-tagged MHC:peptide molecules
trogocytosed from APC. In addition, we have observed APC plasma membrane transfer
onto the T cells by monitoring the trogocytosis of myristoylated-CFP (fig. 7). To
compare trogocytosis efficiency of different markers, T cells were incubated with
fibroblast APCs and stained using several different staining protocols. Histograms for
48
several trogocytosed markers are shown in fig. 10. Trogcytosis was measured using GFP-
tagged MHC:peptide (fig. 10A) and fluorescently conjugated antibodies (Ab) to I-Ek (fig.
10B). Murine T cells do not express MHC class II, so the presence of MHC signifies that
trogocytosis has occurred. In fig. 10A, GFP mean fluorescence intensity (MFI) is
measured on the surface of the T cell using flow cytometry. AD10 T cells recovered from
fibroblast APC expressing GFP-tagged MHC (blue line) have a ~30 fold higher MFI than
T cells placed in culture without APC (red line). Using Abs specific for trogocytosed
MHC (fig. 10B) there is significant transfer of MHC detected (~6 fold higher MFI), but
the Ab staining is not as sensitive a measure of trogocytosis compared to the GFP-tagged
MHC:peptide (fig. 10A). In fig. 10C, lipophilic dye CM-DiI is used to stain the surface of
APC prior to co-culture with T cells. To measure membrane trogocytosis, T cells were
recovered from CM-DiI stained fibroblast APCs. The histogram in fig. 10C shows that T
cells recovered from CM-DiI stained APC (dotted line) have a 31 fold higher MFI than
the unstimulated T cell control (black line). The final method tested was to biotinylate the
surface of the APCs prior to incubation with T cells. T cells were stained with
streptavidin (SA) conjugated to fluorophore Pacific Blue (PB) to detect biotin
trogocytosis. The results in fig.10D show that biotinylated APC membrane proteins are
trogocytosed by the T cells and are easily detected by flow cytometry. Biotin trogocytosis
was not as significant as CM-DiI trogocytosis, showing only a 24 fold increase in MFI
for the recovered T cells compared to the unstimulated control.
As with the I-Ek data in figures 10A and 10B, there is significant transfer of biotin
from APC to T cells. This verifies that this method is able to efficiently detect
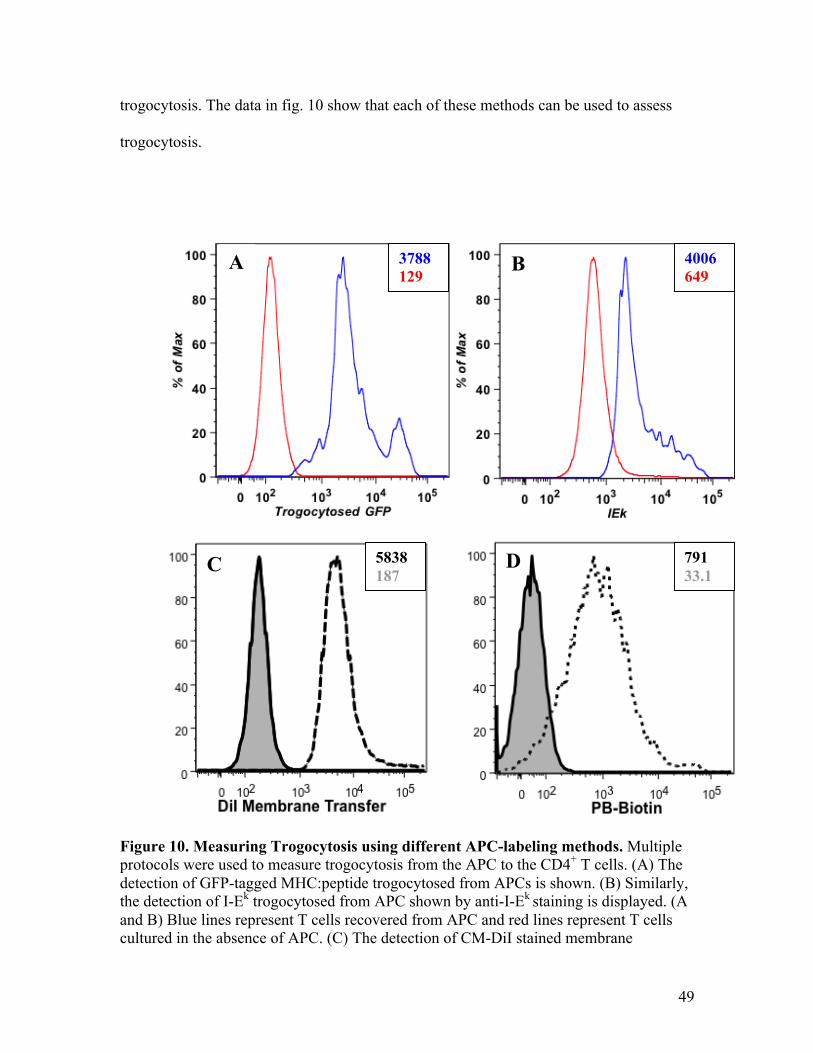
49
trogocytosis. The data in fig. 10 show that each of these methods can be used to assess
trogocytosis.
Figure 10. Measuring Trogocytosis using different APC-labeling methods. Multiple protocols were used to measure trogocytosis from the APC to the CD4+ T cells. (A) The detection of GFP-tagged MHC:peptide trogocytosed from APCs is shown. (B) Similarly, the detection of I-Ek trogocytosed from APC shown by anti-I-Ek staining is displayed. (A and B) Blue lines represent T cells recovered from APC and red lines represent T cells cultured in the absence of APC. (C) The detection of CM-DiI stained membrane
3788 129
4006 649
5838 187
791 33.1
A B
D C
50
trogocytosed from APC. (D) The detection of biotin trogocytosed from APC. To measure biotin trogocytosis, a secondary antibody specific for biotin, streptavidin-Pacific Blue, was used to stain (D). (C and D) Dashed lines represent T cells recovered from APC and the solid filled-in curve represents T cells cultured in the absence of APC. Black number represents recovered T cells and the gray letter represents the T cells minus APC. Data are representative of twelve separate experiments. Naïve T cell Trogocytosis The experiments shown in fig.10 used T cells that had been primed in vitro with
peptide and before use in the in vitro trogocytosis assay. It is unclear how efficient naïve
T cells can carry out trogocytosis. To address the question of whether T cells require
previous Ag recognition to efficiently perform trogocytosis, naïve CD4+ T cells from an
AND x Rag-1-/- mouse were used. The cells were placed in culture with biotinylated
fibroblast APC for 6-24 hours (primary stimulation), which has been shown to induce
naive T cell activation (11). The AND x Rag-1-/- mice were used because the T cells were
naïve due to the fact that their APCs do not express I-Ek. To determine the extent of naïve
T cell trogocytosis, following recovery from APCs the T cells were either stained
immediately and analyzed using flow cytometry or were placed in culture and aliquots
were taken and stained daily for up to 6 days. After a 6 hour co-culture, naïve T cells
were CD69lo, suggesting they were not activated (fig. 11A). In a parallel set of
experiments, the naïve T cells recovered from an initial in vitro trogocytosis assay were
restimulated 2-3 days following recovery from the primary stimulation. To differentiate
between the trogocytosis that occurred during the primary stimulation with the
trogocytosis that occurred in the secondary stimulation, T cells were stained for
trogocytosed biotin from the primary stimulation using SA-AlexaFluor 488 (AF488)
before restimulation, while trogocytosis occurring in the secondary culture was detected
using SA-AlexaFluor 647 (AF647). Trogocytosis was compared between the primary
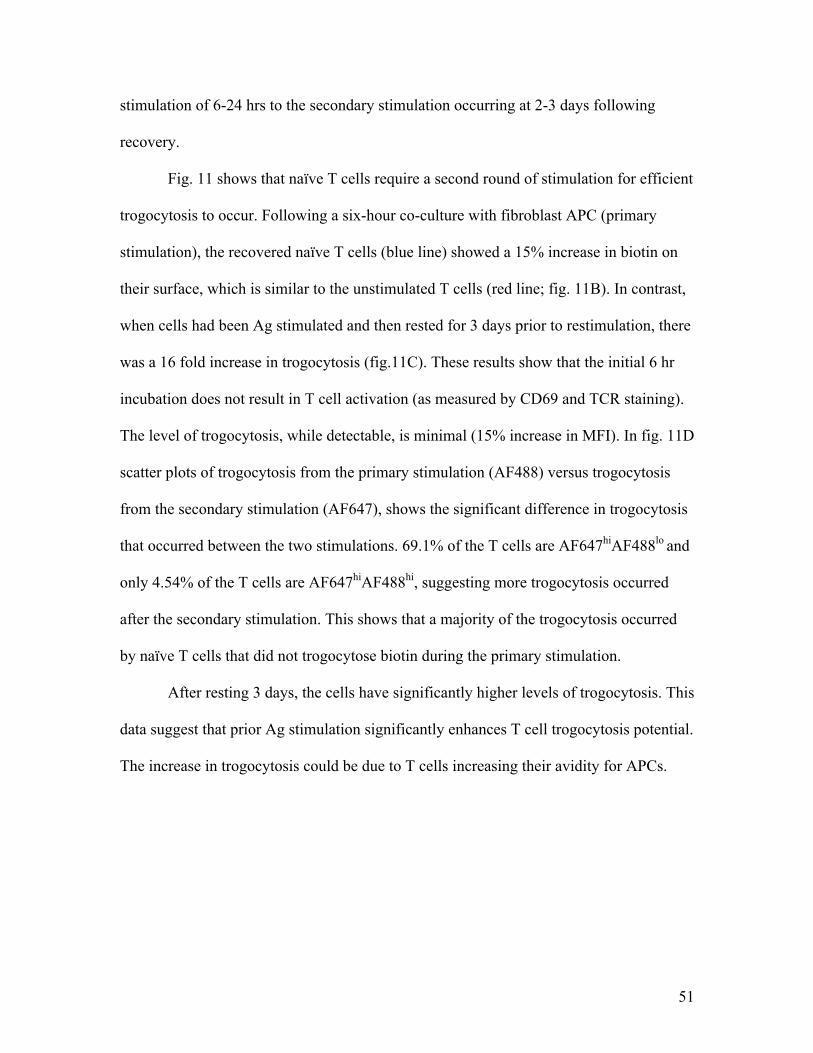
51
stimulation of 6-24 hrs to the secondary stimulation occurring at 2-3 days following
recovery.
Fig. 11 shows that naïve T cells require a second round of stimulation for efficient
trogocytosis to occur. Following a six-hour co-culture with fibroblast APC (primary
stimulation), the recovered naïve T cells (blue line) showed a 15% increase in biotin on
their surface, which is similar to the unstimulated T cells (red line; fig. 11B). In contrast,
when cells had been Ag stimulated and then rested for 3 days prior to restimulation, there
was a 16 fold increase in trogocytosis (fig.11C). These results show that the initial 6 hr
incubation does not result in T cell activation (as measured by CD69 and TCR staining).
The level of trogocytosis, while detectable, is minimal (15% increase in MFI). In fig. 11D
scatter plots of trogocytosis from the primary stimulation (AF488) versus trogocytosis
from the secondary stimulation (AF647), shows the significant difference in trogocytosis
that occurred between the two stimulations. 69.1% of the T cells are AF647hiAF488lo and
only 4.54% of the T cells are AF647hiAF488hi, suggesting more trogocytosis occurred
after the secondary stimulation. This shows that a majority of the trogocytosis occurred
by naïve T cells that did not trogocytose biotin during the primary stimulation.
After resting 3 days, the cells have significantly higher levels of trogocytosis. This
data suggest that prior Ag stimulation significantly enhances T cell trogocytosis potential.
The increase in trogocytosis could be due to T cells increasing their avidity for APCs.
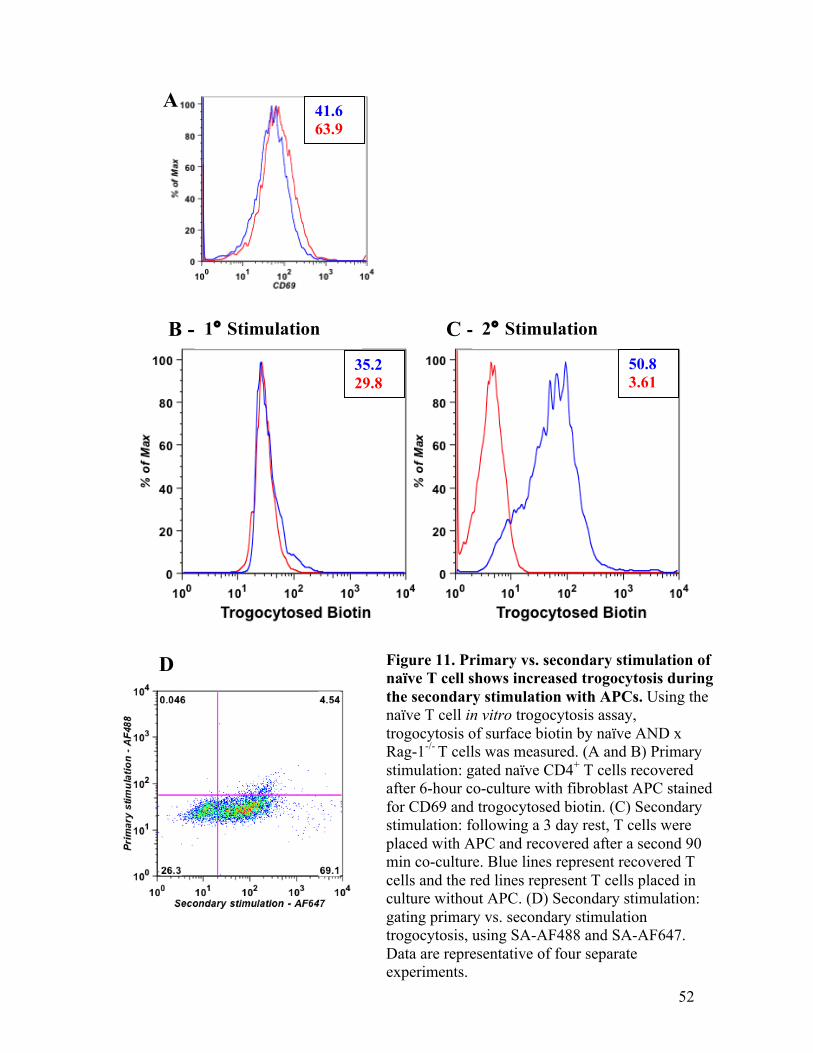
52
35.2 29.8
50.8 3.61
B - C -
41.6 63.9
D
A
Figure 11. Primary vs. secondary stimulation of naïve T cell shows increased trogocytosis during the secondary stimulation with APCs. Using the naïve T cell in vitro trogocytosis assay, trogocytosis of surface biotin by naïve AND x Rag-1-/- T cells was measured. (A and B) Primary stimulation: gated naïve CD4+ T cells recovered after 6-hour co-culture with fibroblast APC stained for CD69 and trogocytosed biotin. (C) Secondary stimulation: following a 3 day rest, T cells were placed with APC and recovered after a second 90 min co-culture. Blue lines represent recovered T cells and the red lines represent T cells placed in culture without APC. (D) Secondary stimulation: gating primary vs. secondary stimulation trogocytosis, using SA-AF488 and SA-AF647. Data are representative of four separate experiments.
1° Stimulation 2° Stimulation
53
Trogocytosis correlates with naïve T cell proliferation
The difference in trogocytosis between the primary stimulation and secondary
stimulation of naïve CD4+ T cells can be seen in fig. 11. The limited amount of
trogocytosis in the 6 hr primary stimulation of the naïve T cells, seen in fig. 11B may be
due to the length of the primary stimulation. To determine whether extended stimulation
of naïve T cells could result in enhanced trogocytosis, naïve T cells were Ag stimulated
for 24 to 96 hours. This time interval has previously been shown to allow enough time for
the naïve T cells to initiate proliferation (11). To induce activation of primary naïve
AD10 T cells in vitro, MCC88-103 peptide was added to an AD10 whole spleen suspension
culture. The physiologic APC in the spleen cell suspension serves as an APC in this
experiment. Proliferation of the CD4+ T cells was monitored by CFSE dilution over four
days and daily proliferation vs. trogocytosis results for CD4+ Vβ3+ T cells are shown in
fig. 12. Before the cultures were established (day zero) the naïve T cells were bimodal
with respect to trogocytosed I-Ek, with approximately 25% of the cells being I-Ek+
directly ex vivo. While the frequency number of trog+ cells varies between the 20 separate
experiments, the frequency of MHC+ TCR transgenic cells directly ex vivo ranges
between 10 and 25%. This has also been observed in 4 other TCR transgenic and non-
transgenic strains our lab has tested (OT-II, 3.L2, AND x B10.BR, B10.BR). The nature
of this in vivo trogocytosis by naïve cells is unknown, but it is potentially the result of
positive selection events (121) or tonic stimulation in vivo by selecting ligands in the
periphery (191). By day one, the frequency of trog+ T cells almost doubled to 46.5%. Of
note, only the trog+ population had begun to divide, with 57.8% of the trog+ cells dividing
54
on day one. Thus, the earliest cell division correlates with cells being trog+, although it is
unclear whether this proliferation is driven by trogocytosis.
The results on day two showed that both the trog+ cells and the trog- population
were proliferating, but the frequency of dividing cells was still significantly higher for the
trog+ population. By day three, both trog+ and trog- populations were clearly dividing.
The trog- population was bimodal with 91% of the cells dividing up to 4 times, while
9.0% remained undivided. The proliferation of the trog- cells surpassed that of the trog+
cells by day three; however, the frequency of trog+ cells had decreased between days two
and three. The remaining trog+ cells had 4.77-fold higher surface I-Ek than the trog-. The
reduction in the trog+ cells on day three was likely not due to activation induced cell
death, as measured by staining cells with Annexin V and 7-AAD (data not shown). This
raises the possibility that an alternative, such as dilution by proliferation by distribution
onto daughter cells, was responsible for the decrease in the trog+ cells. By day four, more
than 92% of the CD4+ cells had divided and few trog+ cells remain. Of the proliferating
cells, more than 82% were trog-. Taken together, the data in fig. 12 suggest that it is the
trog+ cells that initially divide upon Ag stimulation, followed by the proliferation of trog-
cells. Additionally, fig. 12 raises the possibility that as the trog+ cells divide, the
trogocytosed I-Ek may be diluted among daughter cells, reducing the apparent frequency
of trog+ cells and significantly increasing the apparent number of dividing trog- cells.
Thus, by day four the dividing cells appear to be overwhelmingly trog-. The data in fig.12
shows that initially naïve T cells do have trogocytosed I-Ek on their surface (day zero),
which differs from the data shown in fig. 11. This difference is likely due to differences
in the experimental systems. For fig. 11, naïve T cells are from I-Ek negative TCR Tg
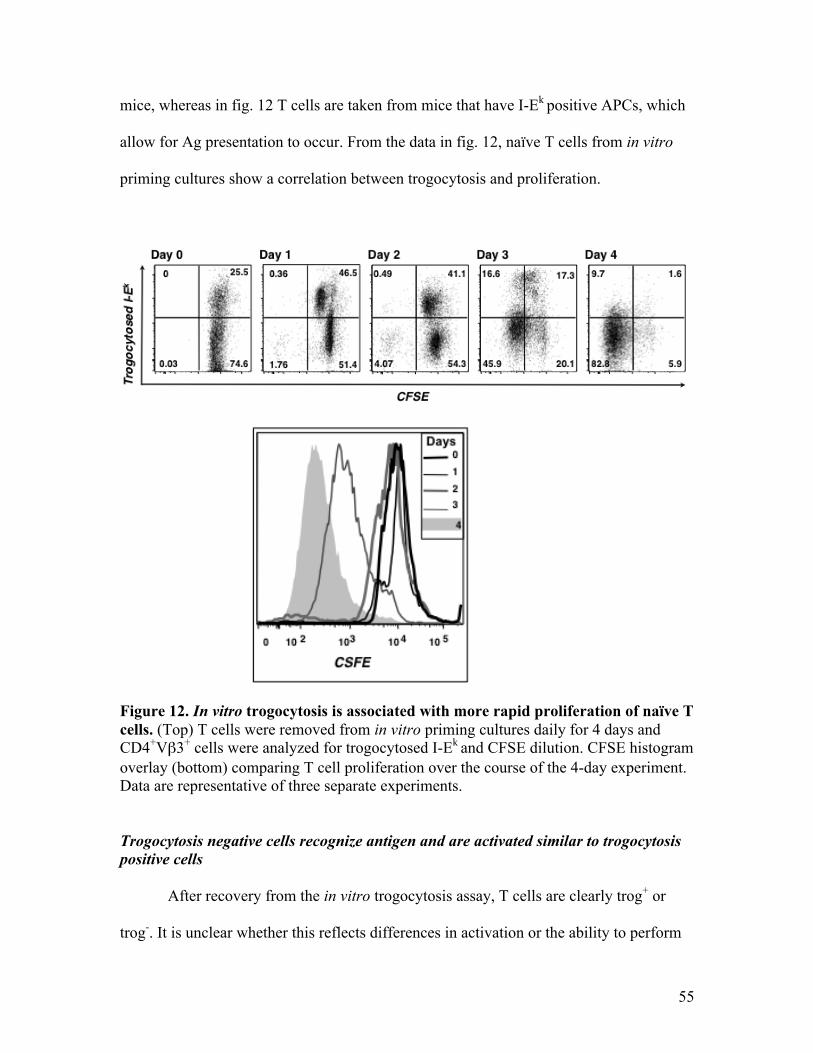
55
mice, whereas in fig. 12 T cells are taken from mice that have I-Ek positive APCs, which
allow for Ag presentation to occur. From the data in fig. 12, naïve T cells from in vitro
priming cultures show a correlation between trogocytosis and proliferation.
Figure 12. In vitro trogocytosis is associated with more rapid proliferation of naïve T cells. (Top) T cells were removed from in vitro priming cultures daily for 4 days and CD4+Vβ3+ cells were analyzed for trogocytosed I-Ek and CFSE dilution. CFSE histogram overlay (bottom) comparing T cell proliferation over the course of the 4-day experiment. Data are representative of three separate experiments. Trogocytosis negative cells recognize antigen and are activated similar to trogocytosis positive cells
After recovery from the in vitro trogocytosis assay, T cells are clearly trog+ or
trog-. It is unclear whether this reflects differences in activation or the ability to perform
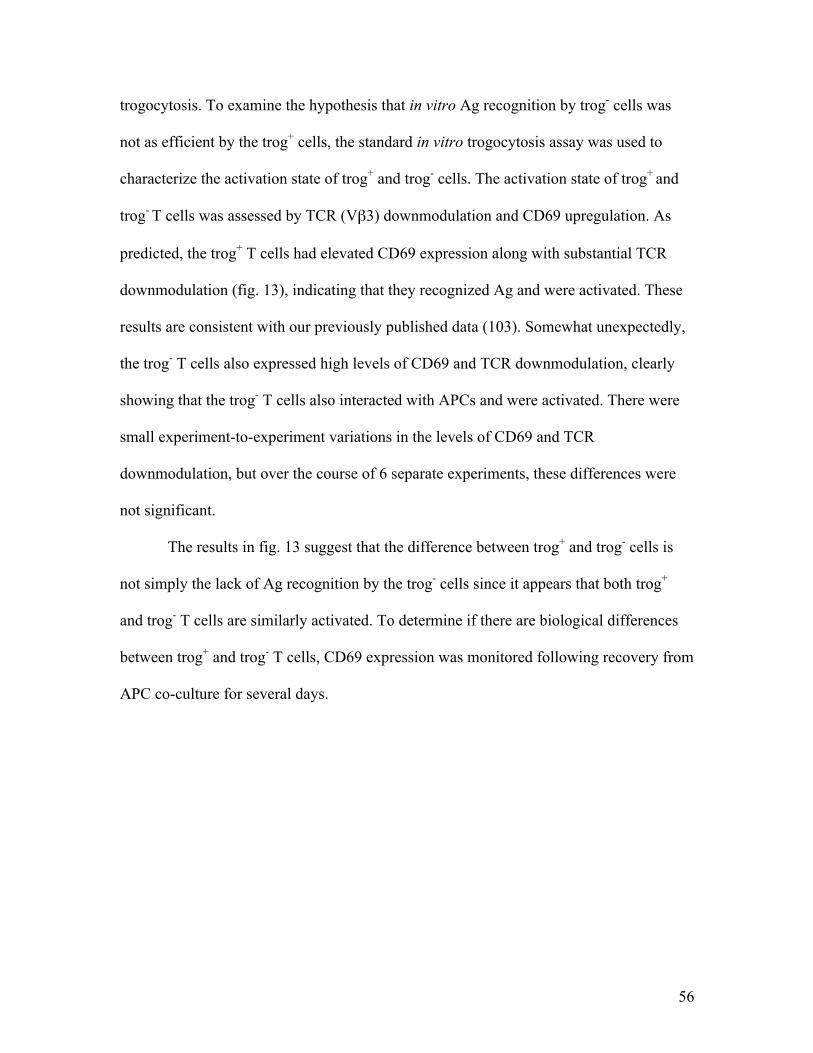
56
trogocytosis. To examine the hypothesis that in vitro Ag recognition by trog- cells was
not as efficient by the trog+ cells, the standard in vitro trogocytosis assay was used to
characterize the activation state of trog+ and trog- cells. The activation state of trog+ and
trog- T cells was assessed by TCR (Vβ3) downmodulation and CD69 upregulation. As
predicted, the trog+ T cells had elevated CD69 expression along with substantial TCR
downmodulation (fig. 13), indicating that they recognized Ag and were activated. These
results are consistent with our previously published data (103). Somewhat unexpectedly,
the trog- T cells also expressed high levels of CD69 and TCR downmodulation, clearly
showing that the trog- T cells also interacted with APCs and were activated. There were
small experiment-to-experiment variations in the levels of CD69 and TCR
downmodulation, but over the course of 6 separate experiments, these differences were
not significant.
The results in fig. 13 suggest that the difference between trog+ and trog- cells is
not simply the lack of Ag recognition by the trog- cells since it appears that both trog+
and trog- T cells are similarly activated. To determine if there are biological differences
between trog+ and trog- T cells, CD69 expression was monitored following recovery from
APC co-culture for several days.
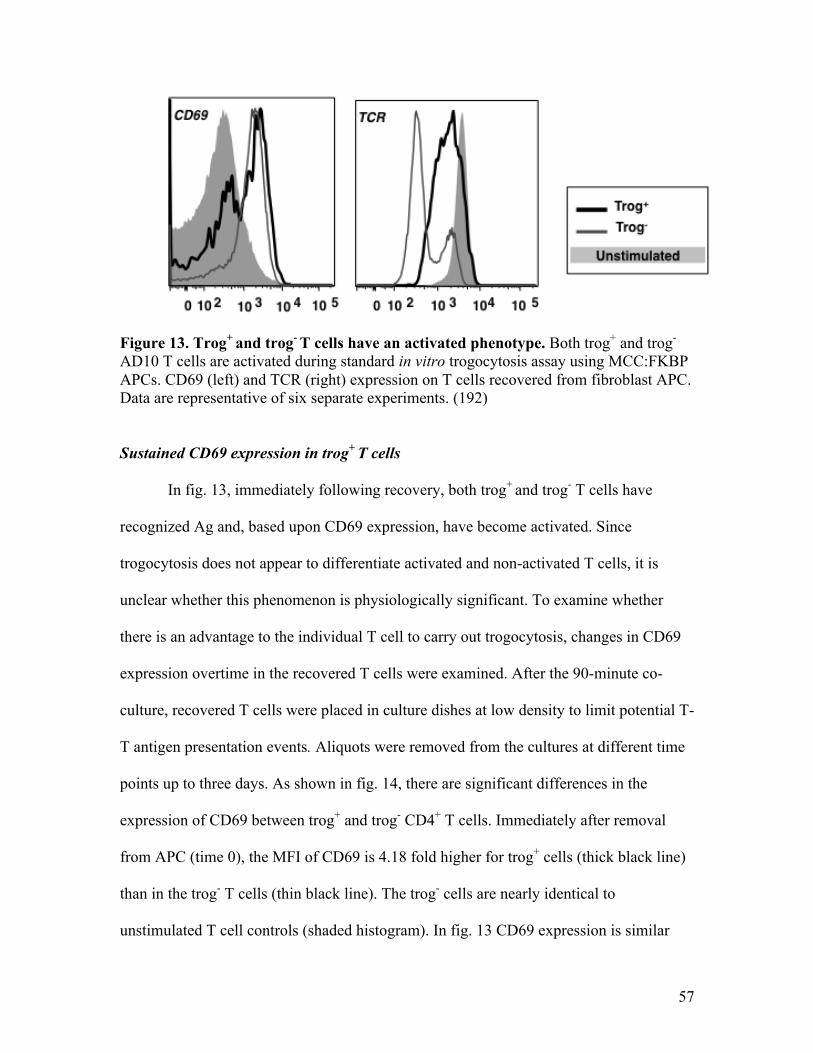
57
Figure 13. Trog+ and trog- T cells have an activated phenotype. Both trog+ and trog- AD10 T cells are activated during standard in vitro trogocytosis assay using MCC:FKBP APCs. CD69 (left) and TCR (right) expression on T cells recovered from fibroblast APC. Data are representative of six separate experiments. (192)
Sustained CD69 expression in trog+ T cells
In fig. 13, immediately following recovery, both trog+ and trog- T cells have
recognized Ag and, based upon CD69 expression, have become activated. Since
trogocytosis does not appear to differentiate activated and non-activated T cells, it is
unclear whether this phenomenon is physiologically significant. To examine whether
there is an advantage to the individual T cell to carry out trogocytosis, changes in CD69
expression overtime in the recovered T cells were examined. After the 90-minute co-
culture, recovered T cells were placed in culture dishes at low density to limit potential T-
T antigen presentation events. Aliquots were removed from the cultures at different time
points up to three days. As shown in fig. 14, there are significant differences in the
expression of CD69 between trog+ and trog- CD4+ T cells. Immediately after removal
from APC (time 0), the MFI of CD69 is 4.18 fold higher for trog+ cells (thick black line)
than in the trog- T cells (thin black line). The trog- cells are nearly identical to
unstimulated T cell controls (shaded histogram). In fig. 13 CD69 expression is similar
58
between trog+ and trog- T cells. The reason for the difference seen at t=0 in fig. 14 could
be due to experiment-experiment variations. By 30 min, the CD69 MFI of the trog+ T
cells is 4.9 fold higher than the trog- T cells and is similar to the anti-CD3-stimulated
positive control (thick gray line). Over the next two hours, CD69 MFI for trog+ cells
remains nearly the same with CD69 levels staying at 3-4 fold higher than trog- cells.
After 3 hours, the level of CD69 steadily decreases in the trog+ cells, but remains 5.5 fold
higher than trog- cells. The level of CD69 in the trog+ cells remains very similar to the
anti-CD3 positive control during this time frame. From twenty-four to seventy-two hours,
the trog+ T cells still have significantly higher CD69 levels, 2-4 fold higher MFI,
compared to the trog- T cells, which remain similar to the unstimulated control cells.
Thus, there is sustained CD69 expression only in trog+ T cells.
The CD69 results in fig. 14 suggest that there are differences between trog+ and
trog- cells following T cell recovery from APC. The higher CD69 levels in trog+ T cells
over time suggests sustained activation in these cells. Since CD69 requires continued
signaling for its expression (193), the sustained CD69 on the trog+ T cells could be due to
sustained signaling by the continued engagement of T cell receptors by the trogocytosed
molecules. In the remainder of this thesis I will assess whether there are other potential
biological advantages for the individual T cells that perform trogocytosis.
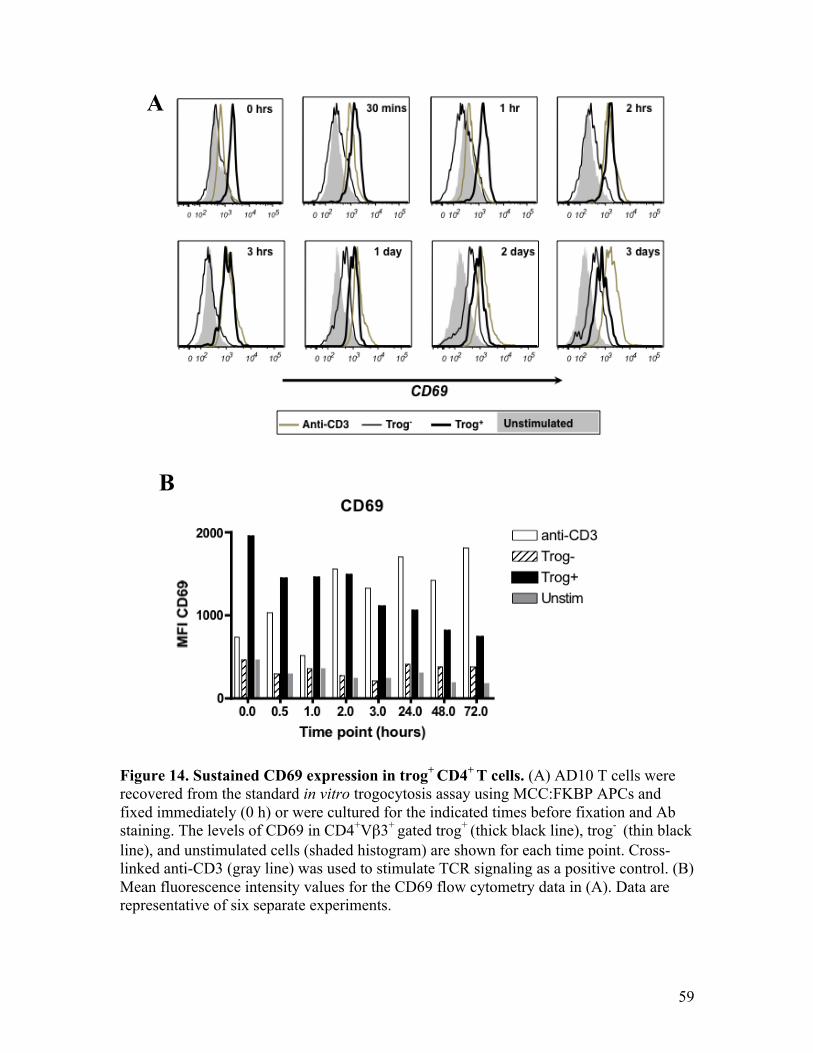
59
Figure 14. Sustained CD69 expression in trog+ CD4+ T cells. (A) AD10 T cells were recovered from the standard in vitro trogocytosis assay using MCC:FKBP APCs and fixed immediately (0 h) or were cultured for the indicated times before fixation and Ab staining. The levels of CD69 in CD4+Vβ3+ gated trog+ (thick black line), trog- (thin black line), and unstimulated cells (shaded histogram) are shown for each time point. Cross-linked anti-CD3 (gray line) was used to stimulate TCR signaling as a positive control. (B) Mean fluorescence intensity values for the CD69 flow cytometry data in (A). Data are representative of six separate experiments.
B
A
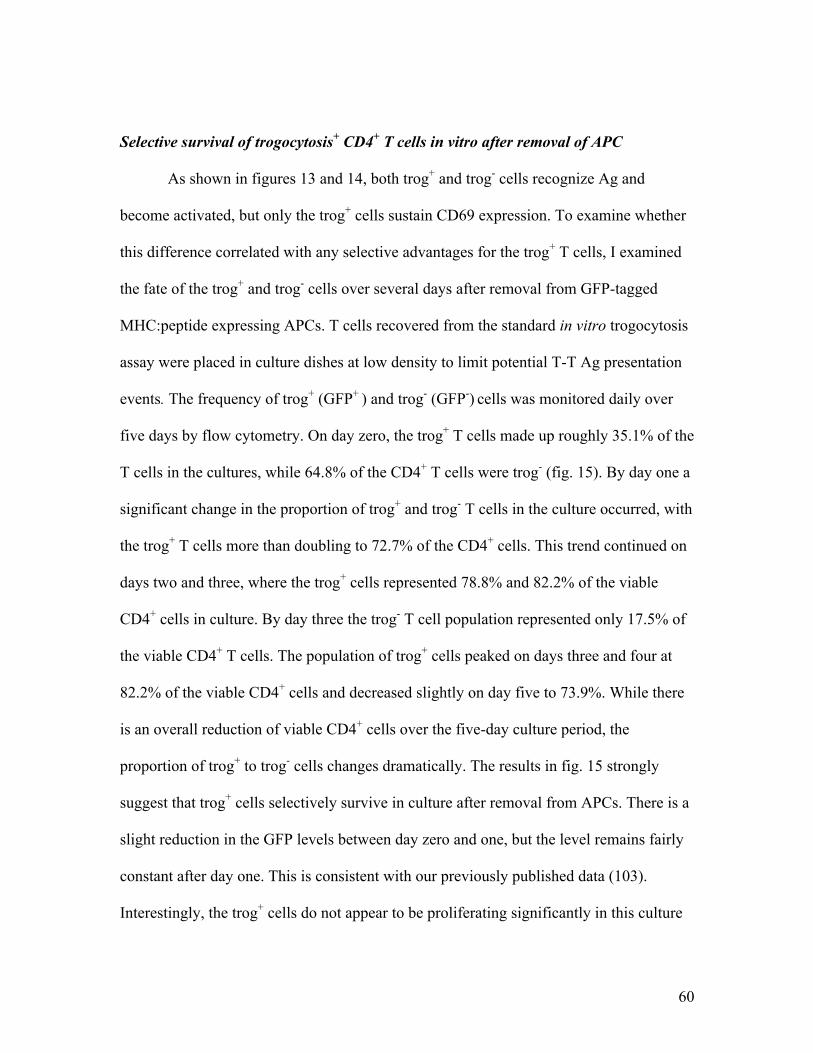
60
Selective survival of trogocytosis+ CD4+ T cells in vitro after removal of APC
As shown in figures 13 and 14, both trog+ and trog- cells recognize Ag and
become activated, but only the trog+ cells sustain CD69 expression. To examine whether
this difference correlated with any selective advantages for the trog+ T cells, I examined
the fate of the trog+ and trog- cells over several days after removal from GFP-tagged
MHC:peptide expressing APCs. T cells recovered from the standard in vitro trogocytosis
assay were placed in culture dishes at low density to limit potential T-T Ag presentation
events. The frequency of trog+ (GFP+ ) and trog- (GFP-) cells was monitored daily over
five days by flow cytometry. On day zero, the trog+ T cells made up roughly 35.1% of the
T cells in the cultures, while 64.8% of the CD4+ T cells were trog- (fig. 15). By day one a
significant change in the proportion of trog+ and trog- T cells in the culture occurred, with
the trog+ T cells more than doubling to 72.7% of the CD4+ cells. This trend continued on
days two and three, where the trog+ cells represented 78.8% and 82.2% of the viable
CD4+ cells in culture. By day three the trog- T cell population represented only 17.5% of
the viable CD4+ T cells. The population of trog+ cells peaked on days three and four at
82.2% of the viable CD4+ cells and decreased slightly on day five to 73.9%. While there
is an overall reduction of viable CD4+ cells over the five-day culture period, the
proportion of trog+ to trog- cells changes dramatically. The results in fig. 15 strongly
suggest that trog+ cells selectively survive in culture after removal from APCs. There is a
slight reduction in the GFP levels between day zero and one, but the level remains fairly
constant after day one. This is consistent with our previously published data (103).
Interestingly, the trog+ cells do not appear to be proliferating significantly in this culture
61
because the level of GFP on the trog+ cells is not significantly reduced on days four and
five, as would be expected if the GFP was equally distributed among daughter cells as a
result of proliferation. Taken together, the results in figures 12-15 suggest that the trog+
cells are activated, proliferate, sustain activation, and selectively survive after removal
from APCs.
Figure 15. Selective survival of trog+ T cells. AD10 trog+ T cells preferentially survive after removal from GFP-tagged MHC:MCC expressing APCs. T cells were recovered from standard in vitro trogocytosis assay and cultured at low density (104/ml). At indicated time points, the presence of trogocytosed GFP-tagged MHC:peptide on CD4+Vβ3+ gated cells was determined by flow cytometry. The levels of trogocytosed MHC:peptide on day 0 unstimulated (gray shaded) and on recovered T cells at the indicated time point (black line) are shown. Horizontal region markers indicate the frequency of trog+ cells in the cultures. Data are representative of four separate experiments. (192) Sustained TCR-proximal intracellular signaling in trogocytosis+ T cells
The results in figures 12-15 suggest that trog+ cells have sustained activation and
selective survival after removal from APCs compared to trog- cells. It is unclear whether
trogocytosed molecules drive this T cell activation and survival or simply mark
differentially activated cells that survive. One potential explanation consistent with a
62
direct role for the trogocytosed molecules in the selective survival of trog+ cells is that
these molecules are engaging the TCR and costimulatory receptors on the T cell surface
and sustaining intracellular signaling. Consistent with this possibility, we have previously
shown that pTyr and the Src kinase Lck accumulate with trogocytosed molecules on T
cells after removal of APC (103). To examine the hypothesis that the trogocytosed
molecules sustain intracellular signaling leading to T cell activation and survival, TCR
signaling in T cells recovered from APC was assessed by flow cytometry and imaging.
As a measure of TCR signaling events, the phosphorylation and activation state of
the TCR-proximal Syk family kinase, ZAP-70 and the TCR-distal MAP kinase, ERK
were examined. To measure the phosphorylation of molecules in T cells recovered from
the standard in vitro trogocytosis assay, phospho-specific Abs and phosflow (185, 194)
were used. This technique is as sensitive as traditional biochemical methods (194) and
requires significantly fewer cells. To establish the method for analysis of pERK and
pZAP-70 levels, AD10 T cells were pharmacologically stimulated. For pERK, T cells
were treated with 5 nM phorbol myristate acetate (PMA), which has a structure
analogous to diacylglycerol (DAG), to activate PKC and induce the activation of the
ERK. To increase intracellular pZAP-70, T cells were treated with 5 µg/ml anti-CD3 in
solution, followed by a secondary Ab, to crosslink CD3, leading to ZAP-70
phosphorylation. In fig. 16, T cells show elevated pERK (dotted line) and pZAP-70
(black line) staining following activation with PMA and anti-CD3 compared to the
untreated cells (shaded histogram). T cells stimulated with PMA showed a 2.2 fold
increase in pERK MFI compared to unstimulated cells, while anti-CD3 stimulated cells
showed a 3.1 fold increase in pZAP-70 MFI compared to the unstimulated sample. These
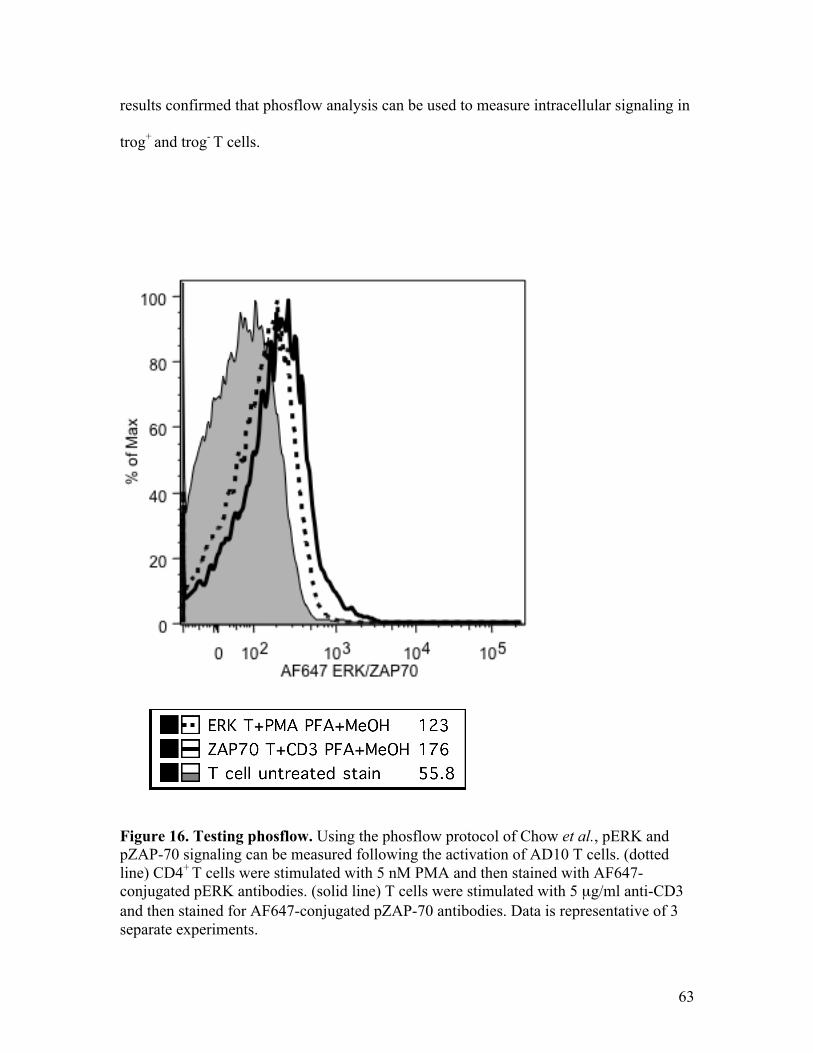
63
results confirmed that phosflow analysis can be used to measure intracellular signaling in
trog+ and trog- T cells.
Figure 16. Testing phosflow. Using the phosflow protocol of Chow et al., pERK and pZAP-70 signaling can be measured following the activation of AD10 T cells. (dotted line) CD4+ T cells were stimulated with 5 nM PMA and then stained with AF647-conjugated pERK antibodies. (solid line) T cells were stimulated with 5 µg/ml anti-CD3 and then stained for AF647-conjugated pZAP-70 antibodies. Data is representative of 3 separate experiments.
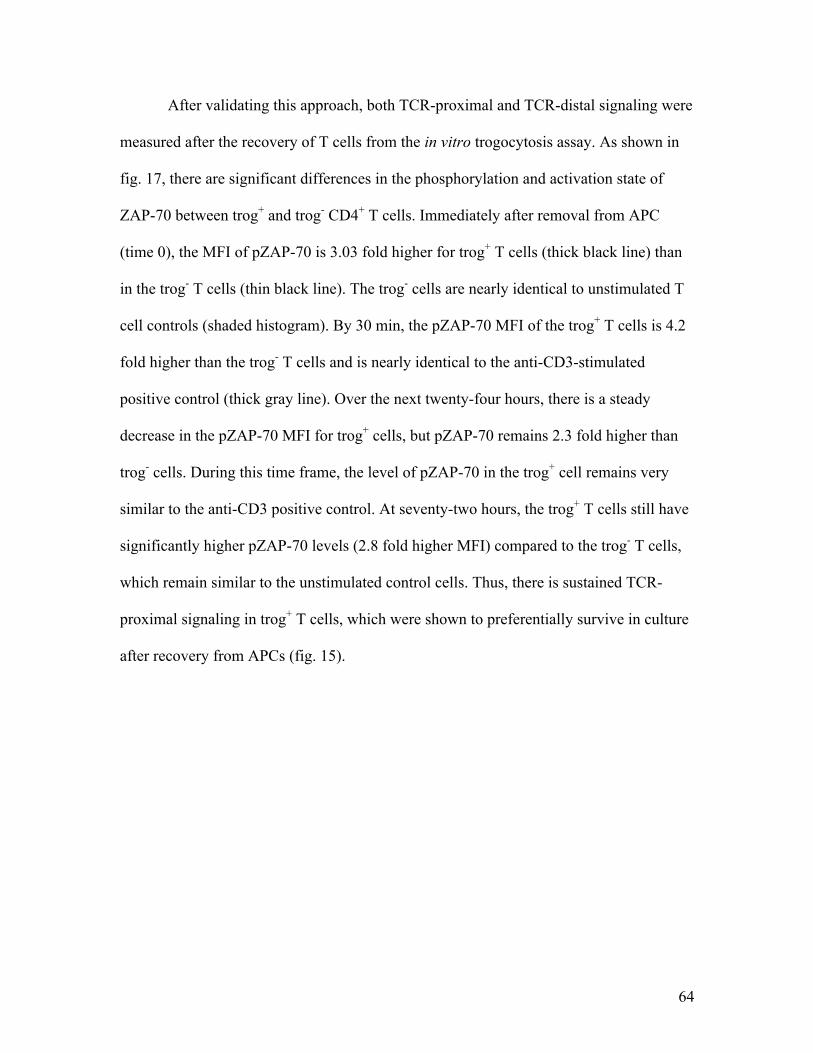
64
After validating this approach, both TCR-proximal and TCR-distal signaling were
measured after the recovery of T cells from the in vitro trogocytosis assay. As shown in
fig. 17, there are significant differences in the phosphorylation and activation state of
ZAP-70 between trog+ and trog- CD4+ T cells. Immediately after removal from APC
(time 0), the MFI of pZAP-70 is 3.03 fold higher for trog+ T cells (thick black line) than
in the trog- T cells (thin black line). The trog- cells are nearly identical to unstimulated T
cell controls (shaded histogram). By 30 min, the pZAP-70 MFI of the trog+ T cells is 4.2
fold higher than the trog- T cells and is nearly identical to the anti-CD3-stimulated
positive control (thick gray line). Over the next twenty-four hours, there is a steady
decrease in the pZAP-70 MFI for trog+ cells, but pZAP-70 remains 2.3 fold higher than
trog- cells. During this time frame, the level of pZAP-70 in the trog+ cell remains very
similar to the anti-CD3 positive control. At seventy-two hours, the trog+ T cells still have
significantly higher pZAP-70 levels (2.8 fold higher MFI) compared to the trog- T cells,
which remain similar to the unstimulated control cells. Thus, there is sustained TCR-
proximal signaling in trog+ T cells, which were shown to preferentially survive in culture
after recovery from APCs (fig. 15).
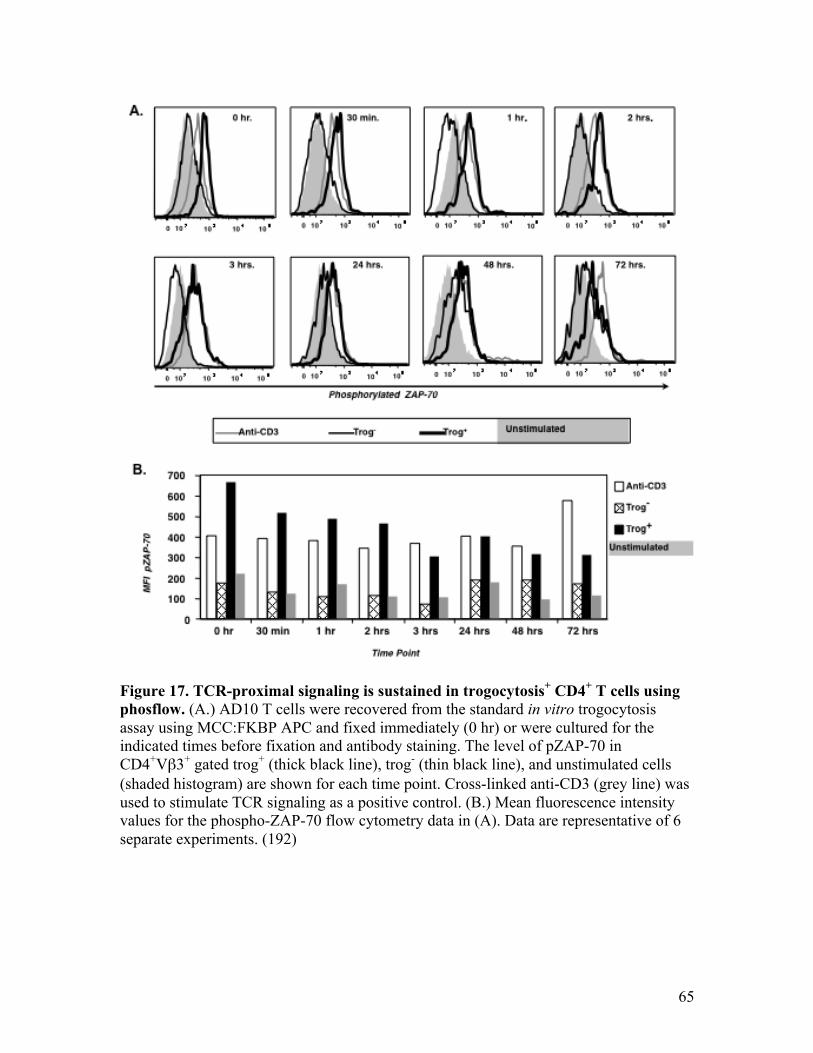
65
Figure 17. TCR-proximal signaling is sustained in trogocytosis+ CD4+ T cells using phosflow. (A.) AD10 T cells were recovered from the standard in vitro trogocytosis assay using MCC:FKBP APC and fixed immediately (0 hr) or were cultured for the indicated times before fixation and antibody staining. The level of pZAP-70 in CD4+Vβ3+ gated trog+ (thick black line), trog- (thin black line), and unstimulated cells (shaded histogram) are shown for each time point. Cross-linked anti-CD3 (grey line) was used to stimulate TCR signaling as a positive control. (B.) Mean fluorescence intensity values for the phospho-ZAP-70 flow cytometry data in (A). Data are representative of 6 separate experiments. (192)
66
Trogocytosed MHC:peptide molecules co-localize with TCR-proximal signaling molecules in trog+ T cells
The flow cytometry data show that TCR-proximal signaling is maintained in the
trog+ cells after removal of APC (fig. 17). To determine whether the elevated pZAP-70
was associated with the trogocytosed molecules on the surface of the T cells, high-
resolution microscopy was used to determine the spatial distribution and potential co-
localization of TCR-proximal signaling molecules with trogocytosed, GFP-tagged
MHC:peptide. To begin, the spatial distribution of the TCR, pZAP-70, total
phosphotyrosine (pTyr) and GFP-tagged MHC:peptide molecules were characterized at
the immune synapse formed between AD10 T cells and MCC:GFP fibroblast APC. At
the T-APC interface, cognate MHC:peptide (green) and the T cell antigen receptor (top-
row, blue) are accumulated and colocalized (fig.18), indicating the presence of a mature
immune synapse (IS) (184). At the T-APC interface, there is also significant enrichment
of pZAP-70 (red) and total phosphotyrosine (blue, bottom). These images are consistent
with previous reports characterizing signaling at the IS (97, 102, 154, 184, 195, 196).
Interestingly, there is a small spot of trogocytosed MHC:peptide on the distal pole of the
T cell (opposite the IS). The presence of trogocytosed MHC:peptide complexes (≥2x
background) was observed in 24% of the T-APC conjugates imaged. These trogocytosed
molecules accumulated at the distal pole on more than 82% of the trog+ T cells in T-APC
conjugates. Images of T-APC conjugates displaying accumulation of trogocytosed
MHC:peptide complexes at the distal pole of the T cell, showed that these molecules
colocalized with the TCR (blue) and were associated with elevated pZAP-70 (red) and
total pTyr (blue) more than 99% of the time.
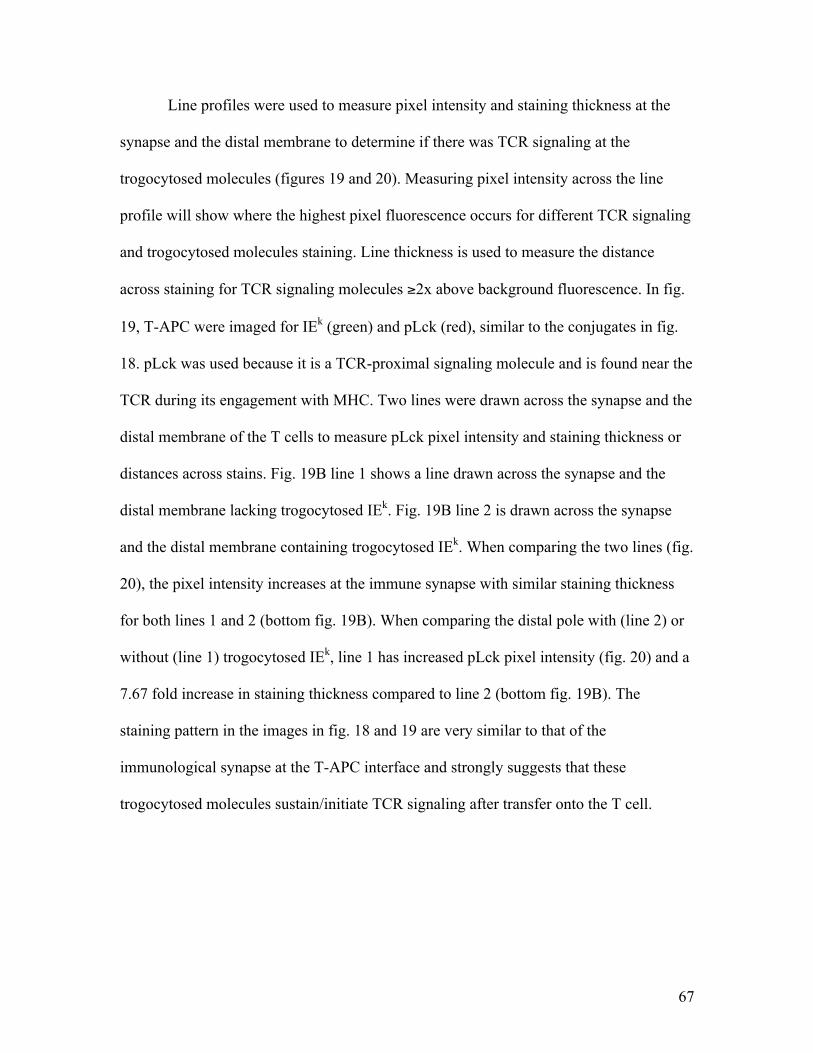
67
Line profiles were used to measure pixel intensity and staining thickness at the
synapse and the distal membrane to determine if there was TCR signaling at the
trogocytosed molecules (figures 19 and 20). Measuring pixel intensity across the line
profile will show where the highest pixel fluorescence occurs for different TCR signaling
and trogocytosed molecules staining. Line thickness is used to measure the distance
across staining for TCR signaling molecules ≥2x above background fluorescence. In fig.
19, T-APC were imaged for IEk (green) and pLck (red), similar to the conjugates in fig.
18. pLck was used because it is a TCR-proximal signaling molecule and is found near the
TCR during its engagement with MHC. Two lines were drawn across the synapse and the
distal membrane of the T cells to measure pLck pixel intensity and staining thickness or
distances across stains. Fig. 19B line 1 shows a line drawn across the synapse and the
distal membrane lacking trogocytosed IEk. Fig. 19B line 2 is drawn across the synapse
and the distal membrane containing trogocytosed IEk. When comparing the two lines (fig.
20), the pixel intensity increases at the immune synapse with similar staining thickness
for both lines 1 and 2 (bottom fig. 19B). When comparing the distal pole with (line 2) or
without (line 1) trogocytosed IEk, line 1 has increased pLck pixel intensity (fig. 20) and a
7.67 fold increase in staining thickness compared to line 2 (bottom fig. 19B). The
staining pattern in the images in fig. 18 and 19 are very similar to that of the
immunological synapse at the T-APC interface and strongly suggests that these
trogocytosed molecules sustain/initiate TCR signaling after transfer onto the T cell.
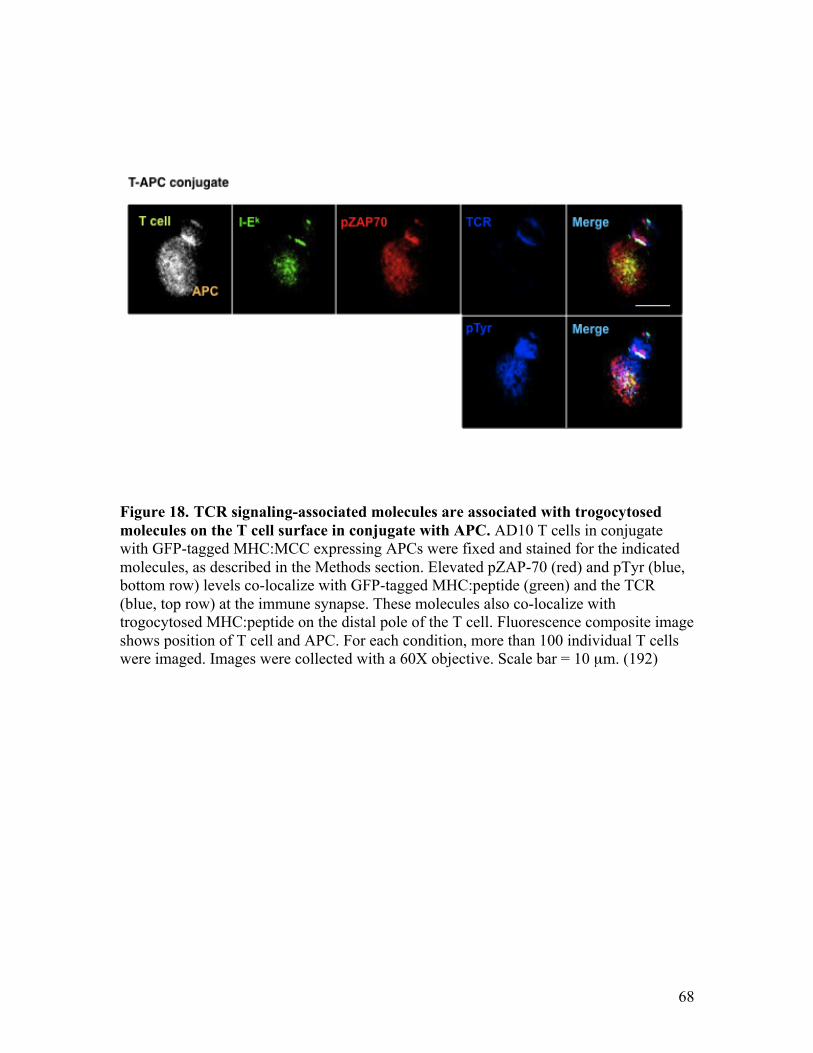
68
Figure 18. TCR signaling-associated molecules are associated with trogocytosed molecules on the T cell surface in conjugate with APC. AD10 T cells in conjugate with GFP-tagged MHC:MCC expressing APCs were fixed and stained for the indicated molecules, as described in the Methods section. Elevated pZAP-70 (red) and pTyr (blue, bottom row) levels co-localize with GFP-tagged MHC:peptide (green) and the TCR (blue, top row) at the immune synapse. These molecules also co-localize with trogocytosed MHC:peptide on the distal pole of the T cell. Fluorescence composite image shows position of T cell and APC. For each condition, more than 100 individual T cells were imaged. Images were collected with a 60X objective. Scale bar = 10 µm. (192)
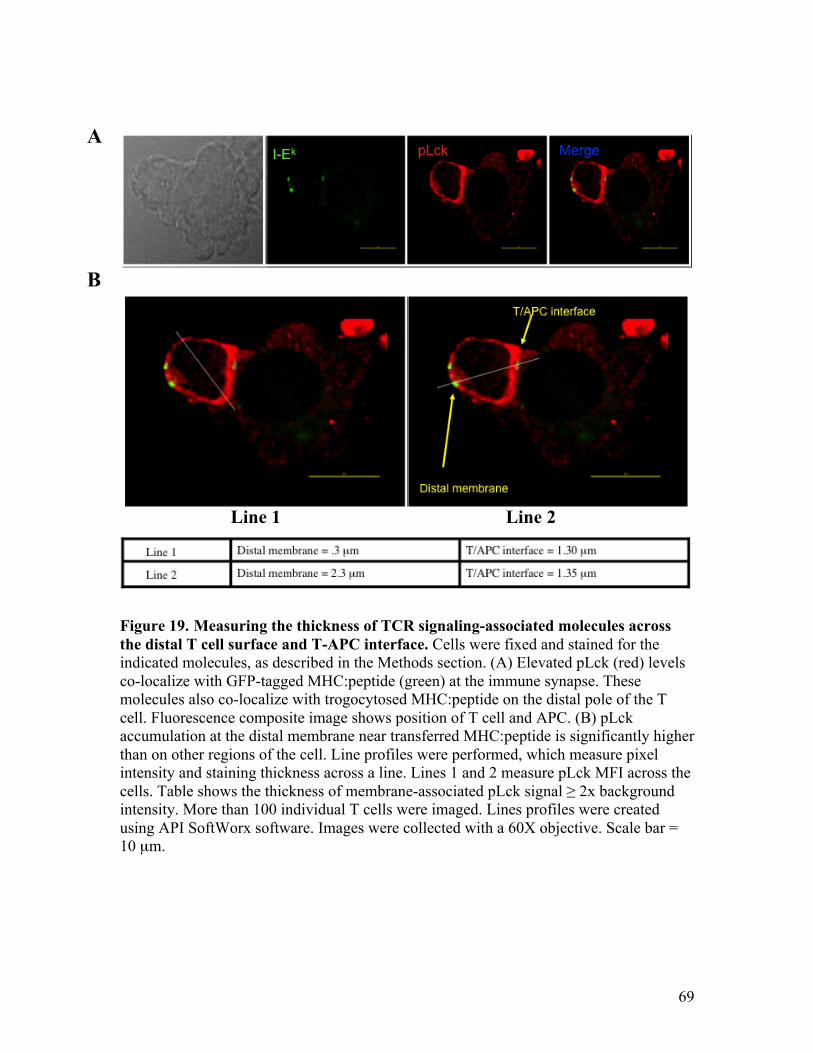
69
Figure 19. Measuring the thickness of TCR signaling-associated molecules across the distal T cell surface and T-APC interface. Cells were fixed and stained for the indicated molecules, as described in the Methods section. (A) Elevated pLck (red) levels co-localize with GFP-tagged MHC:peptide (green) at the immune synapse. These molecules also co-localize with trogocytosed MHC:peptide on the distal pole of the T cell. Fluorescence composite image shows position of T cell and APC. (B) pLck accumulation at the distal membrane near transferred MHC:peptide is significantly higher than on other regions of the cell. Line profiles were performed, which measure pixel intensity and staining thickness across a line. Lines 1 and 2 measure pLck MFI across the cells. Table shows the thickness of membrane-associated pLck signal ≥ 2x background intensity. More than 100 individual T cells were imaged. Lines profiles were created using API SoftWorx software. Images were collected with a 60X objective. Scale bar = 10 µm.
Line 1 Line 2
B
A
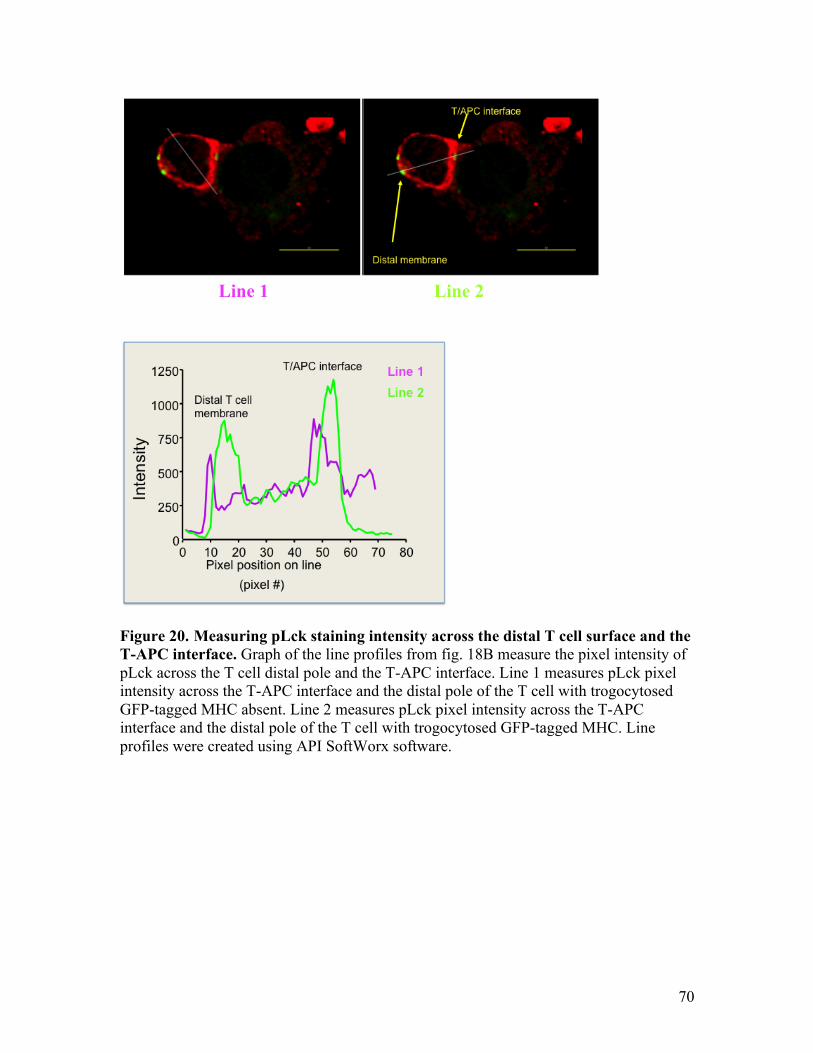
70
Figure 20. Measuring pLck staining intensity across the distal T cell surface and the T-APC interface. Graph of the line profiles from fig. 18B measure the pixel intensity of pLck across the T cell distal pole and the T-APC interface. Line 1 measures pLck pixel intensity across the T-APC interface and the distal pole of the T cell with trogocytosed GFP-tagged MHC absent. Line 2 measures pLck pixel intensity across the T-APC interface and the distal pole of the T cell with trogocytosed GFP-tagged MHC. Line profiles were created using API SoftWorx software.
Line 1 Line 2
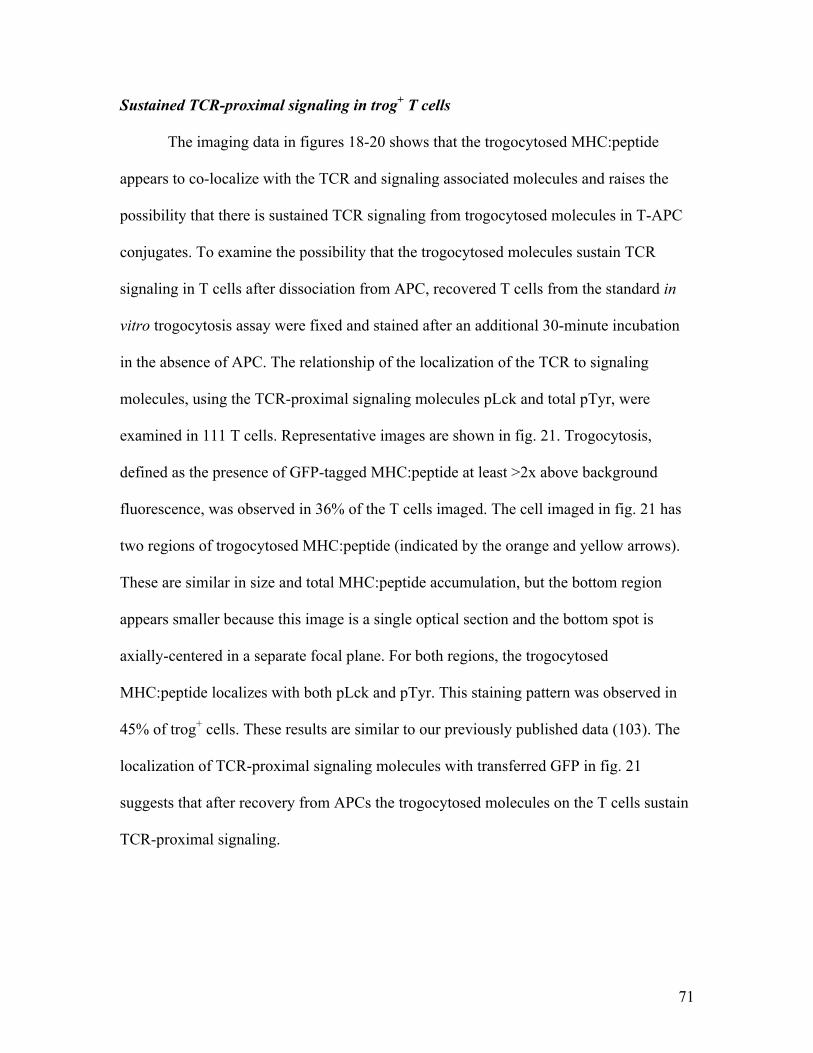
71
Sustained TCR-proximal signaling in trog+ T cells
The imaging data in figures 18-20 shows that the trogocytosed MHC:peptide
appears to co-localize with the TCR and signaling associated molecules and raises the
possibility that there is sustained TCR signaling from trogocytosed molecules in T-APC
conjugates. To examine the possibility that the trogocytosed molecules sustain TCR
signaling in T cells after dissociation from APC, recovered T cells from the standard in
vitro trogocytosis assay were fixed and stained after an additional 30-minute incubation
in the absence of APC. The relationship of the localization of the TCR to signaling
molecules, using the TCR-proximal signaling molecules pLck and total pTyr, were
examined in 111 T cells. Representative images are shown in fig. 21. Trogocytosis,
defined as the presence of GFP-tagged MHC:peptide at least >2x above background
fluorescence, was observed in 36% of the T cells imaged. The cell imaged in fig. 21 has
two regions of trogocytosed MHC:peptide (indicated by the orange and yellow arrows).
These are similar in size and total MHC:peptide accumulation, but the bottom region
appears smaller because this image is a single optical section and the bottom spot is
axially-centered in a separate focal plane. For both regions, the trogocytosed
MHC:peptide localizes with both pLck and pTyr. This staining pattern was observed in
45% of trog+ cells. These results are similar to our previously published data (103). The
localization of TCR-proximal signaling molecules with transferred GFP in fig. 21
suggests that after recovery from APCs the trogocytosed molecules on the T cells sustain
TCR-proximal signaling.
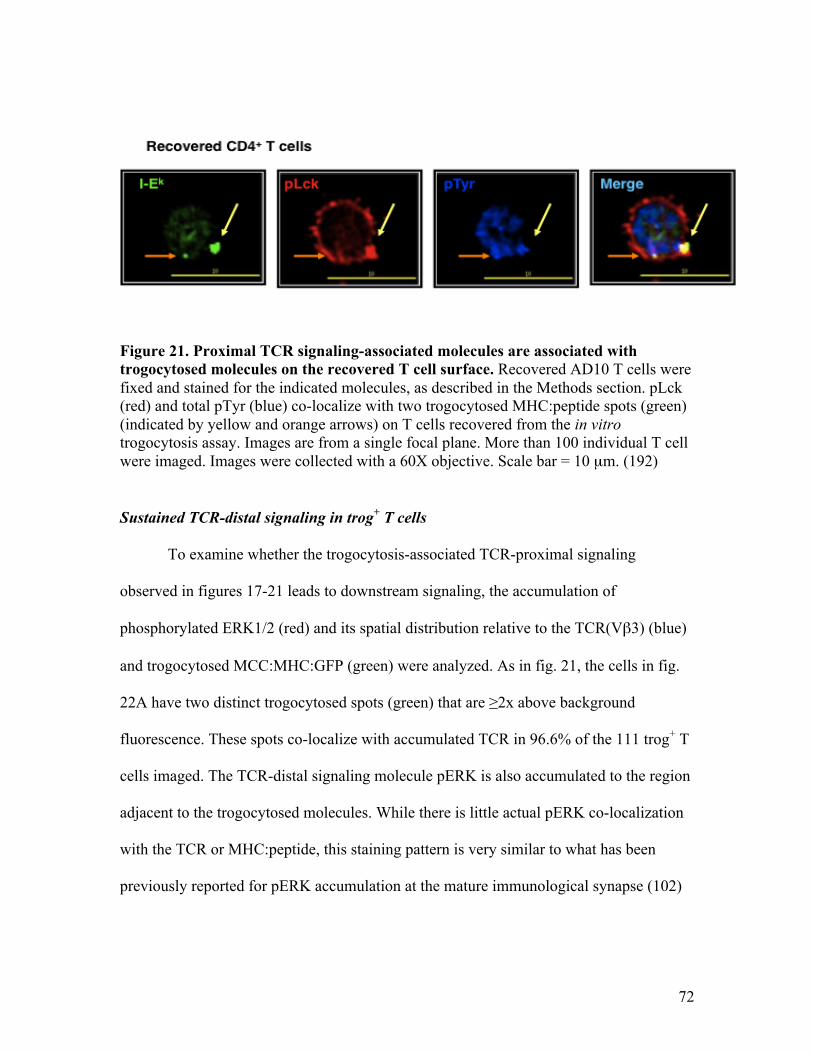
72
Figure 21. Proximal TCR signaling-associated molecules are associated with trogocytosed molecules on the recovered T cell surface. Recovered AD10 T cells were fixed and stained for the indicated molecules, as described in the Methods section. pLck (red) and total pTyr (blue) co-localize with two trogocytosed MHC:peptide spots (green) (indicated by yellow and orange arrows) on T cells recovered from the in vitro trogocytosis assay. Images are from a single focal plane. More than 100 individual T cell were imaged. Images were collected with a 60X objective. Scale bar = 10 µm. (192)
Sustained TCR-distal signaling in trog+ T cells
To examine whether the trogocytosis-associated TCR-proximal signaling
observed in figures 17-21 leads to downstream signaling, the accumulation of
phosphorylated ERK1/2 (red) and its spatial distribution relative to the TCR(Vβ3) (blue)
and trogocytosed MCC:MHC:GFP (green) were analyzed. As in fig. 21, the cells in fig.
22A have two distinct trogocytosed spots (green) that are ≥2x above background
fluorescence. These spots co-localize with accumulated TCR in 96.6% of the 111 trog+ T
cells imaged. The TCR-distal signaling molecule pERK is also accumulated to the region
adjacent to the trogocytosed molecules. While there is little actual pERK co-localization
with the TCR or MHC:peptide, this staining pattern is very similar to what has been
previously reported for pERK accumulation at the mature immunological synapse (102)
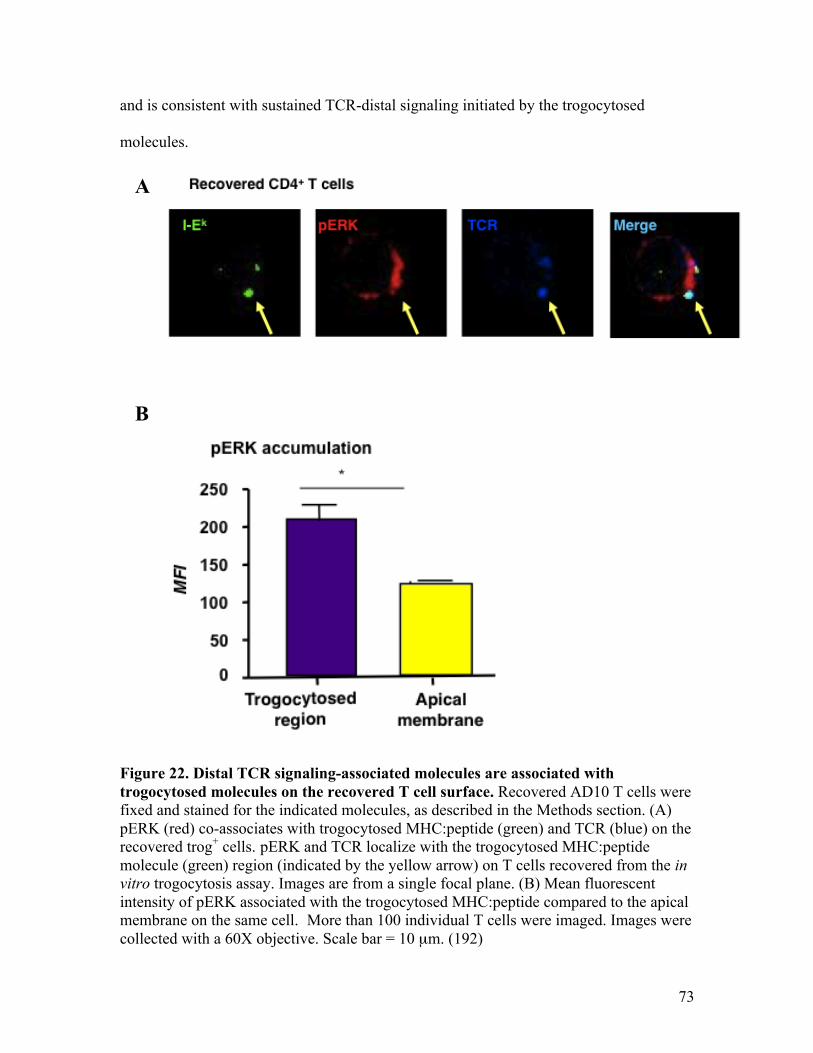
73
and is consistent with sustained TCR-distal signaling initiated by the trogocytosed
molecules.
Figure 22. Distal TCR signaling-associated molecules are associated with trogocytosed molecules on the recovered T cell surface. Recovered AD10 T cells were fixed and stained for the indicated molecules, as described in the Methods section. (A) pERK (red) co-associates with trogocytosed MHC:peptide (green) and TCR (blue) on the recovered trog+ cells. pERK and TCR localize with the trogocytosed MHC:peptide molecule (green) region (indicated by the yellow arrow) on T cells recovered from the in vitro trogocytosis assay. Images are from a single focal plane. (B) Mean fluorescent intensity of pERK associated with the trogocytosed MHC:peptide compared to the apical membrane on the same cell. More than 100 individual T cells were imaged. Images were collected with a 60X objective. Scale bar = 10 µm. (192)
B
A
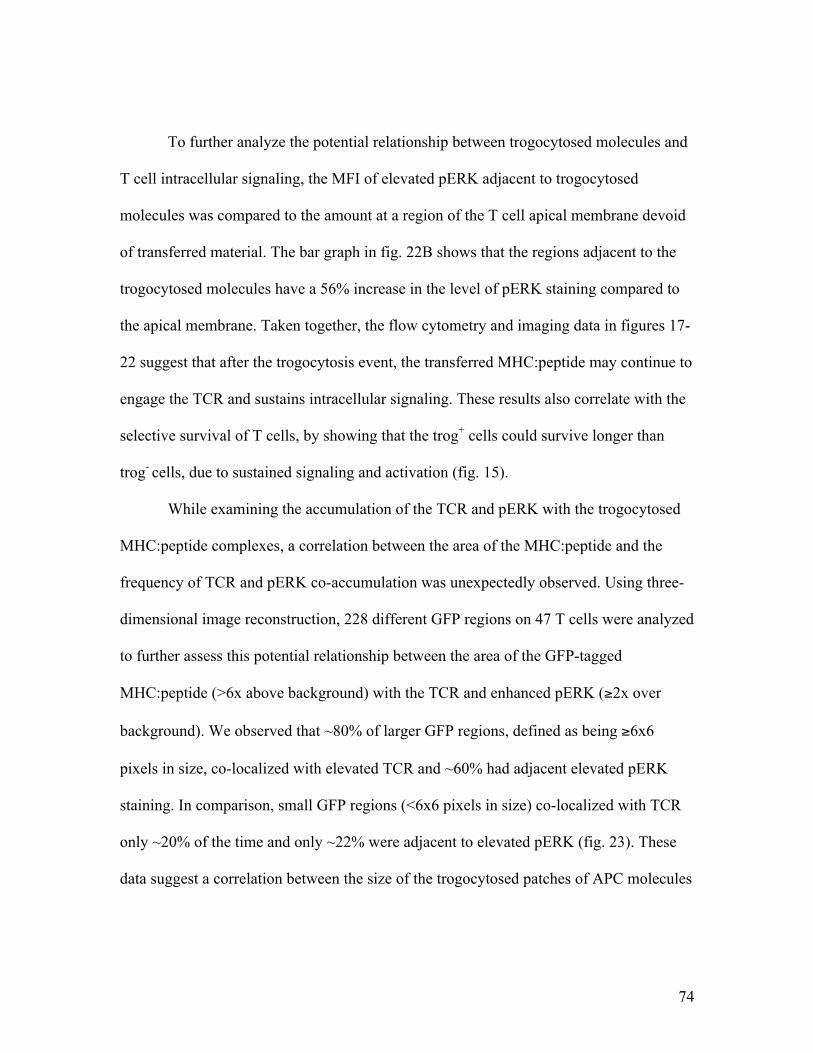
74
To further analyze the potential relationship between trogocytosed molecules and
T cell intracellular signaling, the MFI of elevated pERK adjacent to trogocytosed
molecules was compared to the amount at a region of the T cell apical membrane devoid
of transferred material. The bar graph in fig. 22B shows that the regions adjacent to the
trogocytosed molecules have a 56% increase in the level of pERK staining compared to
the apical membrane. Taken together, the flow cytometry and imaging data in figures 17-
22 suggest that after the trogocytosis event, the transferred MHC:peptide may continue to
engage the TCR and sustains intracellular signaling. These results also correlate with the
selective survival of T cells, by showing that the trog+ cells could survive longer than
trog- cells, due to sustained signaling and activation (fig. 15).
While examining the accumulation of the TCR and pERK with the trogocytosed
MHC:peptide complexes, a correlation between the area of the MHC:peptide and the
frequency of TCR and pERK co-accumulation was unexpectedly observed. Using three-
dimensional image reconstruction, 228 different GFP regions on 47 T cells were analyzed
to further assess this potential relationship between the area of the GFP-tagged
MHC:peptide (>6x above background) with the TCR and enhanced pERK (≥2x over
background). We observed that ~80% of larger GFP regions, defined as being ≥6x6
pixels in size, co-localized with elevated TCR and ~60% had adjacent elevated pERK
staining. In comparison, small GFP regions (<6x6 pixels in size) co-localized with TCR
only ~20% of the time and only ~22% were adjacent to elevated pERK (fig. 23). These
data suggest a correlation between the size of the trogocytosed patches of APC molecules
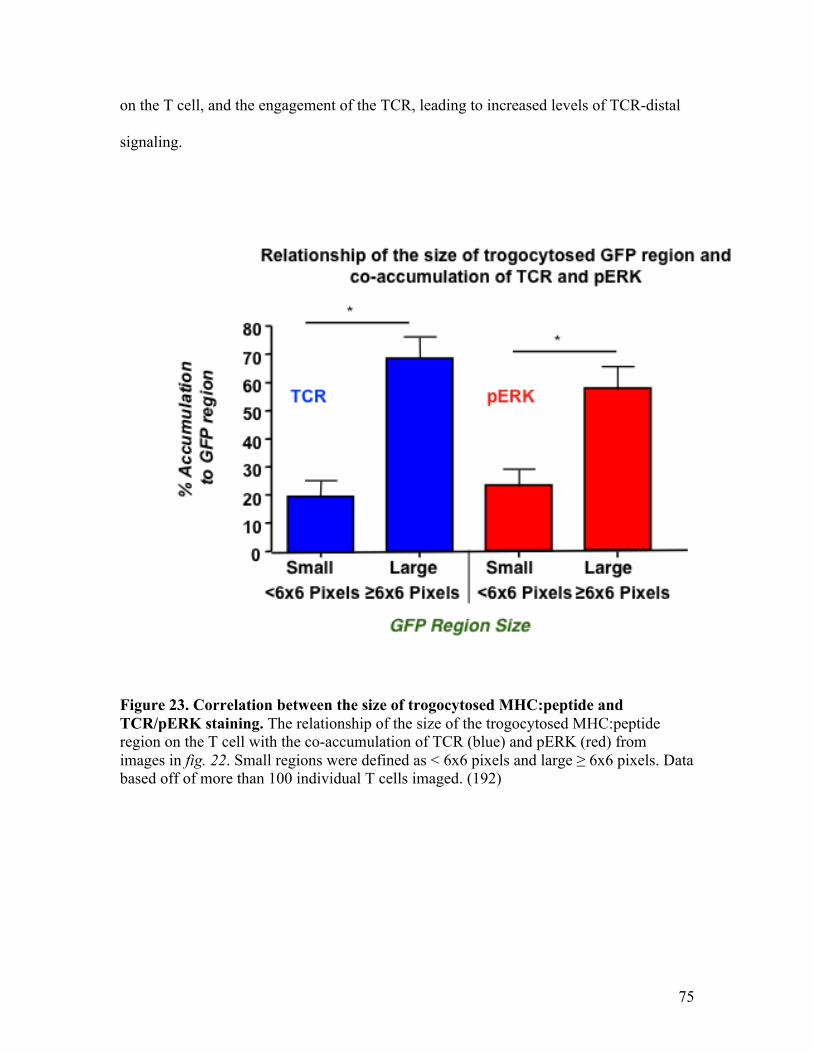
75
on the T cell, and the engagement of the TCR, leading to increased levels of TCR-distal
signaling.
Figure 23. Correlation between the size of trogocytosed MHC:peptide and TCR/pERK staining. The relationship of the size of the trogocytosed MHC:peptide region on the T cell with the co-accumulation of TCR (blue) and pERK (red) from images in fig. 22. Small regions were defined as < 6x6 pixels and large ≥ 6x6 pixels. Data based off of more than 100 individual T cells imaged. (192)
76
Trogocytosed molecules induce sustained signaling in trog+ T cells
The results in figures 17-23 suggest that trogocytosed molecules sustain TCR
signaling in T cells after the removal of APCs. However, these results could also be
attributed to residual signaling initiated at the immune synapse when T cells initially
interacted with APCs. To determine whether the trogocytosed molecules were initiating
TCR signaling, the PP2 interruption technique of Faroudi et al (188) was modified. PP2
is a reversible Src family kinase inhibitor that prevents the phosphorylation and activation
of Lck during TCR engagement and terminates TCR signaling (188, 189). If the signaling
detected by flow cytometry and imaging resulted from residual signaling from the
immune synapse, it would be extinguished by PP2 and would not resume after the
removal of this inhibitor. However, if the trogocytosed molecules were engaging their
receptors on the T cell and sustaining/initiating intracellular signaling, this signaling
would be expected to resume upon removal of PP2. To test this hypothesis, T cells were
recovered from the standard 90-minute trogocytosis assay and incubated for an additional
30-minutes followed by flow cytometry and imaging analysis of potential TCR-proximal
and TCR-distal signaling. Control cultures were treated with 20µM PP2 or were left
untreated for the entire 30-minute culture period. In parallel cultures, cells were incubated
with 20µM PP2 for 10-minutes at 37°C before the PP2 was washed out. These cells were
incubated for an additional 20-minutes in the absence of PP2 before analysis. The results
of these experiments are shown in figures 24-28.
In the first set of experiments, TCR-proximal signaling was examined by
assessing the level and localization of phosphorylated ZAP-70 in more than a 100 PP2
treated cells by imaging. In addition to representative images seen in fig. 24, quantitative
77
data analysis of the imaging is shown in the bar graphs in fig. 25. The images in the top
row of fig. 24, contained the untreated cells that were incubated in media alone for 30-
minutes after removal from APC. There are three distinct GFP-tagged MHC:peptide
spots (green) on this particular T cell. These spots co-localized with the TCR Vβ3 (blue)
and phosphorylated ZAP-70 (red). In contrast, when cells were cultured in 20µM PP2 for
the 30-minute incubation period (bottom row), the MHC:peptide and TCR co-localized
normally, but there was minimal pZAP-70 staining and essentially none was associated
with either the trogocytosed MHC:peptide or the accumulated TCR. This shows that PP2
treatment extinguishes TCR-proximal signaling, but does not alter TCR-MHC:peptide
interactions. Cells treated with PP2 for 10-minutes showed a reduction of total pZAP-70
and no pZAP-70 co-localization with either MHC:peptide or TCR, which was similar to
the 30-minute PP2 treatment group (data not shown). The cells treated with PP2 for 10-
minutes followed by an additional 20-minute incubation after PP2 removal, displayed a
single distinct GFP spot on the cell that was co-localized with both the TCR and elevated
pZAP-70.
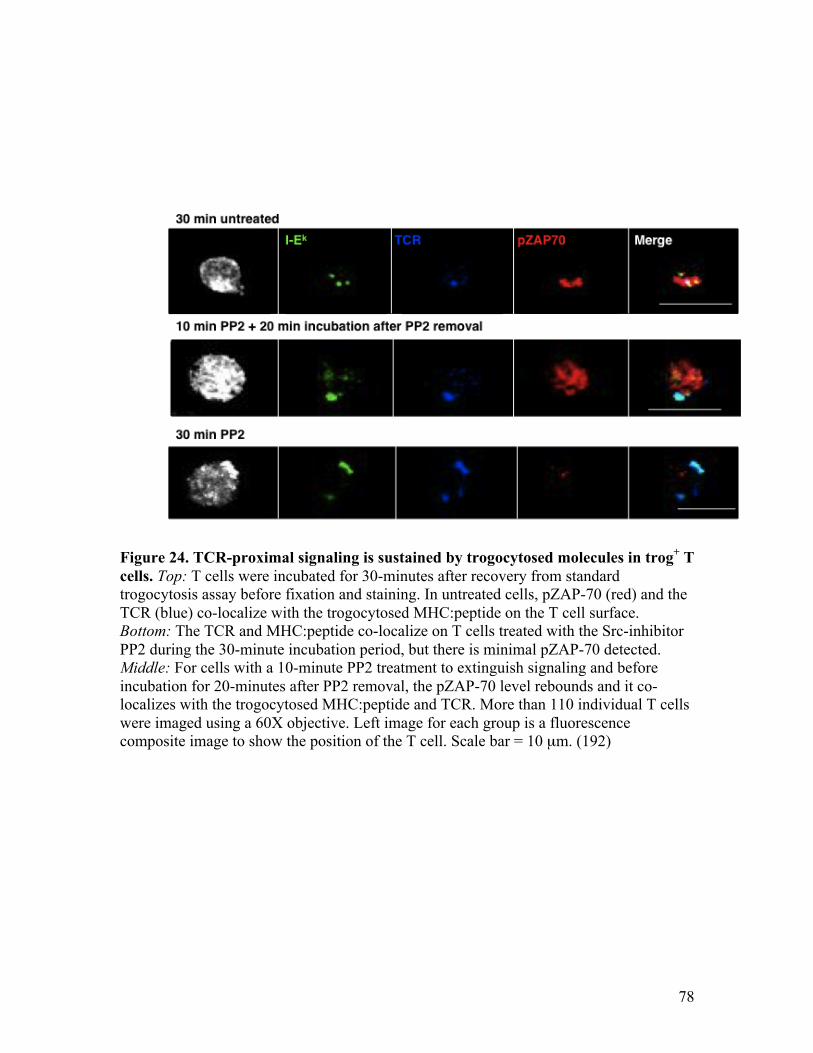
78
Figure 24. TCR-proximal signaling is sustained by trogocytosed molecules in trog+ T cells. Top: T cells were incubated for 30-minutes after recovery from standard trogocytosis assay before fixation and staining. In untreated cells, pZAP-70 (red) and the TCR (blue) co-localize with the trogocytosed MHC:peptide on the T cell surface. Bottom: The TCR and MHC:peptide co-localize on T cells treated with the Src-inhibitor PP2 during the 30-minute incubation period, but there is minimal pZAP-70 detected. Middle: For cells with a 10-minute PP2 treatment to extinguish signaling and before incubation for 20-minutes after PP2 removal, the pZAP-70 level rebounds and it co-localizes with the trogocytosed MHC:peptide and TCR. More than 110 individual T cells were imaged using a 60X objective. Left image for each group is a fluorescence composite image to show the position of the T cell. Scale bar = 10 µm. (192)
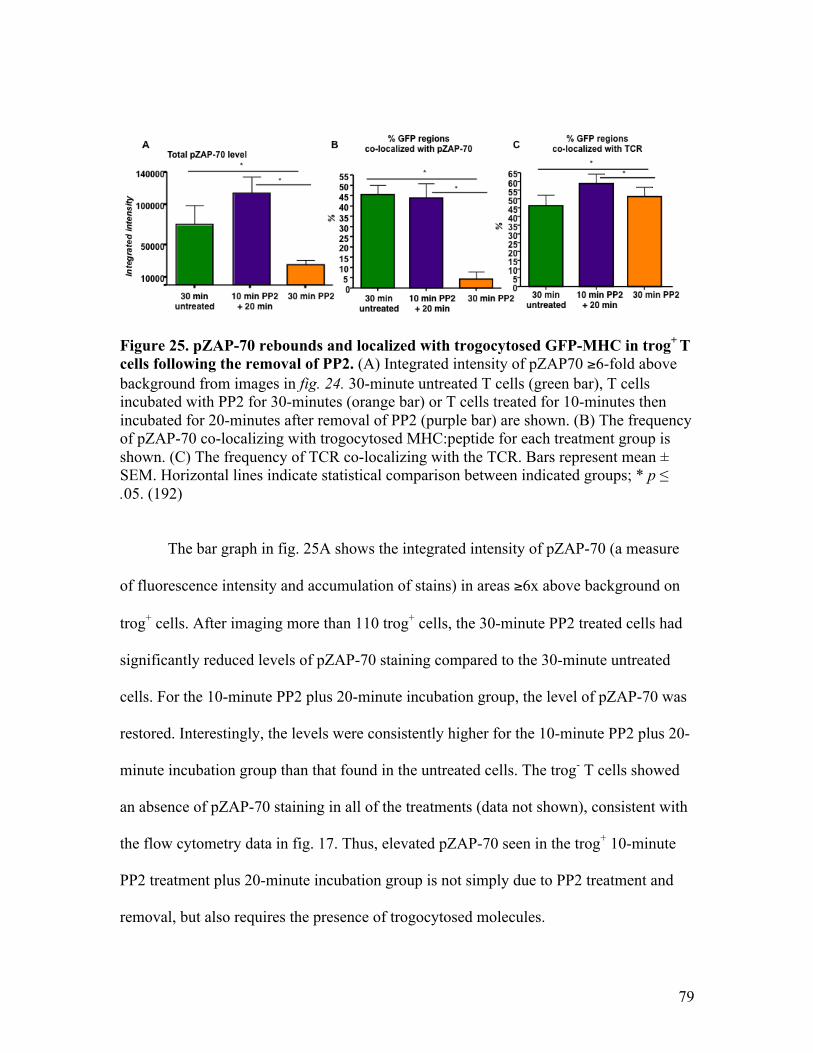
79
Figure 25. pZAP-70 rebounds and localized with trogocytosed GFP-MHC in trog+ T cells following the removal of PP2. (A) Integrated intensity of pZAP70 ≥6-fold above background from images in fig. 24. 30-minute untreated T cells (green bar), T cells incubated with PP2 for 30-minutes (orange bar) or T cells treated for 10-minutes then incubated for 20-minutes after removal of PP2 (purple bar) are shown. (B) The frequency of pZAP-70 co-localizing with trogocytosed MHC:peptide for each treatment group is shown. (C) The frequency of TCR co-localizing with the TCR. Bars represent mean ± SEM. Horizontal lines indicate statistical comparison between indicated groups; * p ≤ .05. (192)
The bar graph in fig. 25A shows the integrated intensity of pZAP-70 (a measure
of fluorescence intensity and accumulation of stains) in areas ≥6x above background on
trog+ cells. After imaging more than 110 trog+ cells, the 30-minute PP2 treated cells had
significantly reduced levels of pZAP-70 staining compared to the 30-minute untreated
cells. For the 10-minute PP2 plus 20-minute incubation group, the level of pZAP-70 was
restored. Interestingly, the levels were consistently higher for the 10-minute PP2 plus 20-
minute incubation group than that found in the untreated cells. The trog- T cells showed
an absence of pZAP-70 staining in all of the treatments (data not shown), consistent with
the flow cytometry data in fig. 17. Thus, elevated pZAP-70 seen in the trog+ 10-minute
PP2 treatment plus 20-minute incubation group is not simply due to PP2 treatment and
removal, but also requires the presence of trogocytosed molecules.
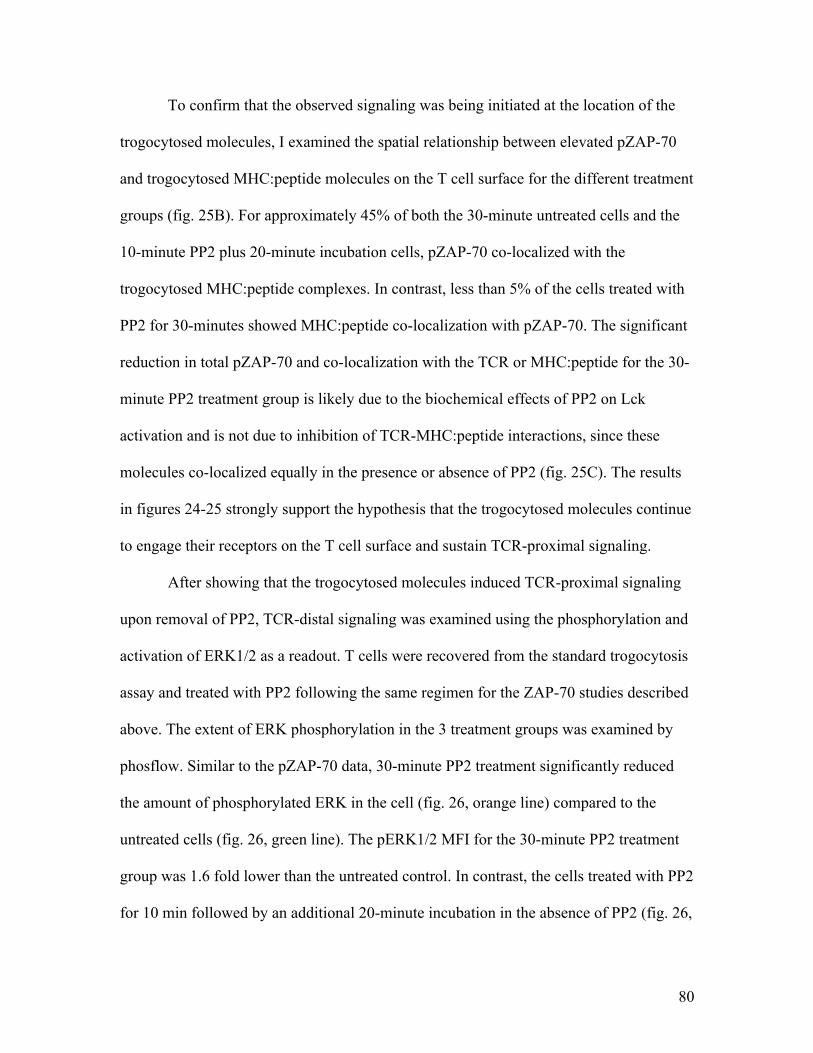
80
To confirm that the observed signaling was being initiated at the location of the
trogocytosed molecules, I examined the spatial relationship between elevated pZAP-70
and trogocytosed MHC:peptide molecules on the T cell surface for the different treatment
groups (fig. 25B). For approximately 45% of both the 30-minute untreated cells and the
10-minute PP2 plus 20-minute incubation cells, pZAP-70 co-localized with the
trogocytosed MHC:peptide complexes. In contrast, less than 5% of the cells treated with
PP2 for 30-minutes showed MHC:peptide co-localization with pZAP-70. The significant
reduction in total pZAP-70 and co-localization with the TCR or MHC:peptide for the 30-
minute PP2 treatment group is likely due to the biochemical effects of PP2 on Lck
activation and is not due to inhibition of TCR-MHC:peptide interactions, since these
molecules co-localized equally in the presence or absence of PP2 (fig. 25C). The results
in figures 24-25 strongly support the hypothesis that the trogocytosed molecules continue
to engage their receptors on the T cell surface and sustain TCR-proximal signaling.
After showing that the trogocytosed molecules induced TCR-proximal signaling
upon removal of PP2, TCR-distal signaling was examined using the phosphorylation and
activation of ERK1/2 as a readout. T cells were recovered from the standard trogocytosis
assay and treated with PP2 following the same regimen for the ZAP-70 studies described
above. The extent of ERK phosphorylation in the 3 treatment groups was examined by
phosflow. Similar to the pZAP-70 data, 30-minute PP2 treatment significantly reduced
the amount of phosphorylated ERK in the cell (fig. 26, orange line) compared to the
untreated cells (fig. 26, green line). The pERK1/2 MFI for the 30-minute PP2 treatment
group was 1.6 fold lower than the untreated control. In contrast, the cells treated with PP2
for 10 min followed by an additional 20-minute incubation in the absence of PP2 (fig. 26,
81
purple line) showed a restoration of pERK1/2 staining. Reminiscent of the pZAP-70
imaging data, the MFI for the 10-minute PP2 plus 20-minute incubation group was 30%
higher than the untreated controls and was 1.9 fold higher than the 30-minute PP2
treatment group. It was also 2.4 fold higher than the unstimulated T cell controls. These
results are consistent with the TCR-proximal signaling seen in fig. 24 and show that after
PP2 inhibition of TCR signaling is removed, TCR-distal signaling is re-initiated within
the trog+ T cells.
Figure 26. TCR-distal signaling is sustained by trogocytosed molecules in trog+ CD4+ T cells using phosflow. Phosflow data showing the level of pERK1/2 in untreated cells (green line), cells treated with PP2 for 30-minutes (orange line), and cells treated with PP2 followed by a 20-minute incubation after PP2 removal (purple line). Unstimulated cells (shaded histogram) are shown as a control. Data are representative of six separate experiments. (192)
82
To confirm that the recovery of TCR-distal signaling after PP2 removal is
associated with the trogocytosed molecules, imaging experiments were performed. In
each row of images in fig. 27, the trogocytosed GFP-MHC:peptide (green), TCR Vβ3
(blue), and pERK1/2 (red) are seen; the right column shows merged images of all three.
The untreated group in the top row has several distinct MHC:peptide spots on the
recovered T cell. Each of these spots co-localize with the regions of elevated TCR (blue).
Adjacent to these TCR-MHC:peptide regions, there is accumulation of elevated pERK.
Similar to fig. 22, the pERK does not co-localize with either the MHC:peptide or TCR,
but rather is adjacent to these molecules on the T cell. The spatial distribution of the
pERK in these trog+ cells is very similar to our previous report regarding pERK
accumulation at the immunological synapse (102). When PP2 was present for the entire
30-minute incubation period, the trogocytosed MHC:peptide co-localized with the TCR.
Similar to the pZAP-70 data, there was minimal pERK1/2 staining in the 30-minute PP2
group. In the cells incubated for 10-minutes with PP2 followed by an additional 20-
minute incubation in the absence of PP2, there were several regions of trogocytosed
MHC:peptide complexes that co-localized with the TCR. This is similar to the untreated
control (fig. 27, top row). There was also accumulation of pERK1/2 adjacent to the
trogocytosed molecules. This complements the flow data (fig. 26) by showing that
removal of PP2 allows resumption of TCR-dependent distal signaling from the
trogocytosed molecules.
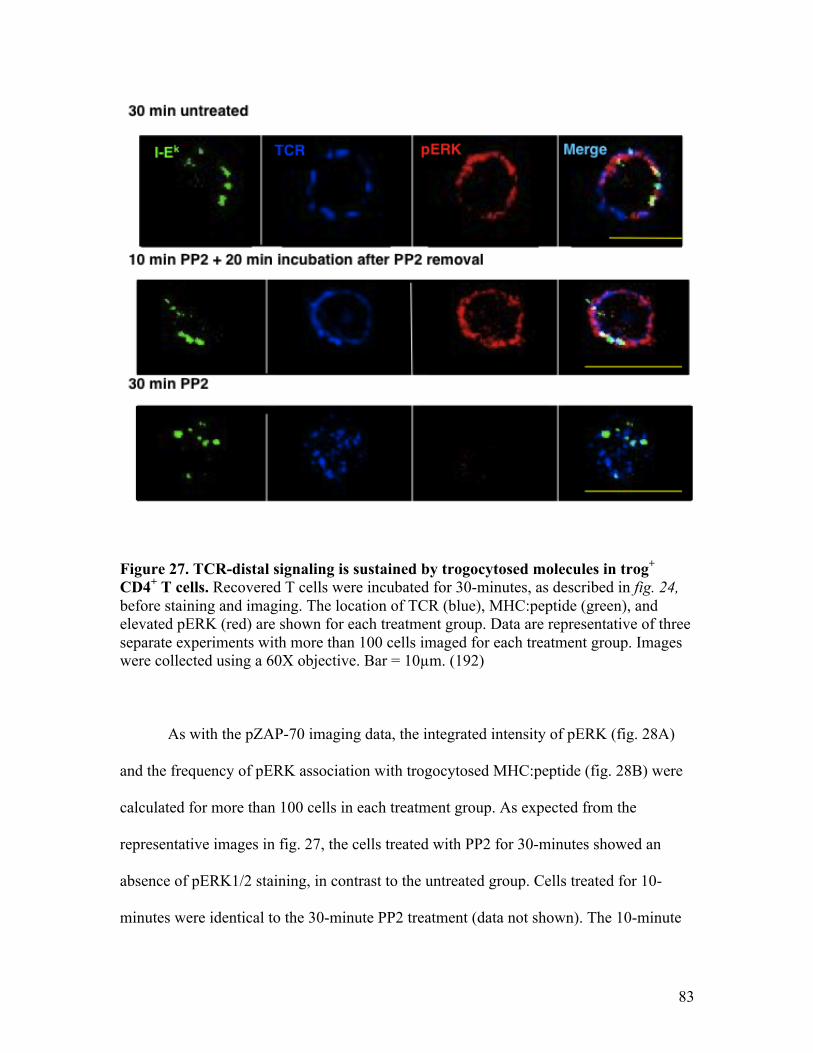
83
Figure 27. TCR-distal signaling is sustained by trogocytosed molecules in trog+ CD4+ T cells. Recovered T cells were incubated for 30-minutes, as described in fig. 24, before staining and imaging. The location of TCR (blue), MHC:peptide (green), and elevated pERK (red) are shown for each treatment group. Data are representative of three separate experiments with more than 100 cells imaged for each treatment group. Images were collected using a 60X objective. Bar = 10µm. (192)
As with the pZAP-70 imaging data, the integrated intensity of pERK (fig. 28A)
and the frequency of pERK association with trogocytosed MHC:peptide (fig. 28B) were
calculated for more than 100 cells in each treatment group. As expected from the
representative images in fig. 27, the cells treated with PP2 for 30-minutes showed an
absence of pERK1/2 staining, in contrast to the untreated group. Cells treated for 10-
minutes were identical to the 30-minute PP2 treatment (data not shown). The 10-minute
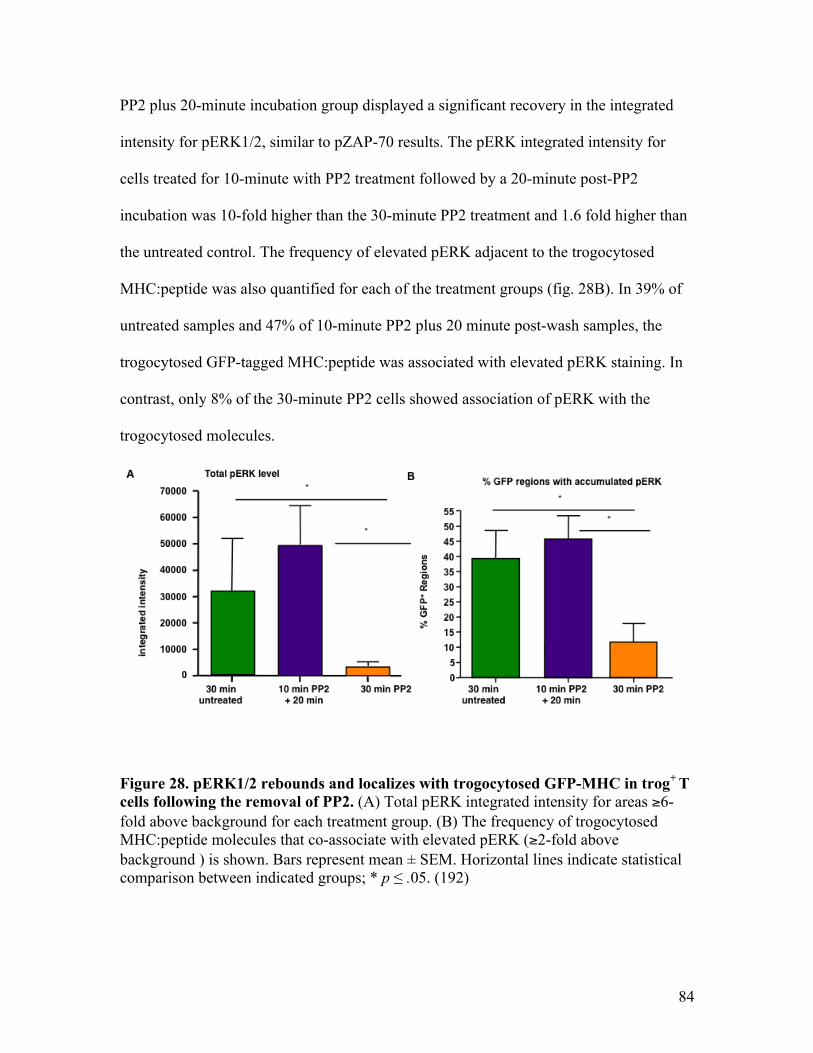
84
PP2 plus 20-minute incubation group displayed a significant recovery in the integrated
intensity for pERK1/2, similar to pZAP-70 results. The pERK integrated intensity for
cells treated for 10-minute with PP2 treatment followed by a 20-minute post-PP2
incubation was 10-fold higher than the 30-minute PP2 treatment and 1.6 fold higher than
the untreated control. The frequency of elevated pERK adjacent to the trogocytosed
MHC:peptide was also quantified for each of the treatment groups (fig. 28B). In 39% of
untreated samples and 47% of 10-minute PP2 plus 20 minute post-wash samples, the
trogocytosed GFP-tagged MHC:peptide was associated with elevated pERK staining. In
contrast, only 8% of the 30-minute PP2 cells showed association of pERK with the
trogocytosed molecules.
Figure 28. pERK1/2 rebounds and localizes with trogocytosed GFP-MHC in trog+ T cells following the removal of PP2. (A) Total pERK integrated intensity for areas ≥6-fold above background for each treatment group. (B) The frequency of trogocytosed MHC:peptide molecules that co-associate with elevated pERK (≥2-fold above background ) is shown. Bars represent mean ± SEM. Horizontal lines indicate statistical comparison between indicated groups; * p ≤ .05. (192)
85
Taken together, the results in figures 24-28 show that a 30-minute treatment with
PP2 significantly reduces both pERK1/2 and pZAP-70 levels in the trog+ cells. After a
10-minute PP2 treatment, both TCR-proximal (pZAP-70) and TCR-distal (pERK1/2)
signaling is re-initiated upon PP2 removal. This re-initiated signaling is dependent upon
the trogocytosed molecules. These results strongly suggest that these trogocytosed
molecules are engaging their receptors on the T cell surface and are sustaining
intracellular signaling after dissociation from the APC. Beyond the TCR:pMHC
interactions, the participation of other trogocytosed molecules (i.e., costimulatory and
adhesion) is currently unknown.
T-T Ag presentation To examine the cell extrinsic effects of trogocytosis, the potential of trog+ T cells
to present Ag was examined. The work of Zhou et al. showed that CD4+ T cells could
present trogocytosed Ag to naïve T cells, inducing CD25 expression and proliferation of
the responder naïve T cells (159). They also showed that when trog+ regulatory T cells
were present, immune suppression of the T cells occurred (159). To examine potential T-
T Ag presentation following trogocytosis, experiments were set up to analyze the
phenotype of the responder naive T cells. Fig. 29 shows the results of T-T presentation to
naïve T cells. Following the T-T presentation assay, trog+ and trog- FACS sorted AD10 T
cells were used as APCs. Responder CFSE-labeled naïve AND x B10.BR T cells become
activated and also performed trogocytosis when incubated with the trog+ T cells, but not
with the trog- cells. In fig. 29A and B, naïve T cells with trog+ T cells (thick black line)
had a 1.5 fold increase in CD69 expression and a 2.7 fold increase in CD25 expression
compared to naïve T cells with trog- T cells (thin black line). Naïve T cells with trog+ T
86
cells also showed a 20 fold decrease in the expression of the TCR compared to the naïve
T cells with trog- T cells (fig. 29C), showing they had downmodulated their TCR. In
contrast, the naïve T cells placed with trog- and unstimulated T cells (shaded histogram)
showed similar expression of CD69, CD25, and TCR. Interestingly, naïve T cells with
trog+ T cells showed a 2.2 fold increase in biotin expression compared to naïve T cells
with trog- T cells, suggesting these cells had performed trogocytosis. These results show
that T-T presentation may play a role in stimulating naïve T cells during an immune
response.
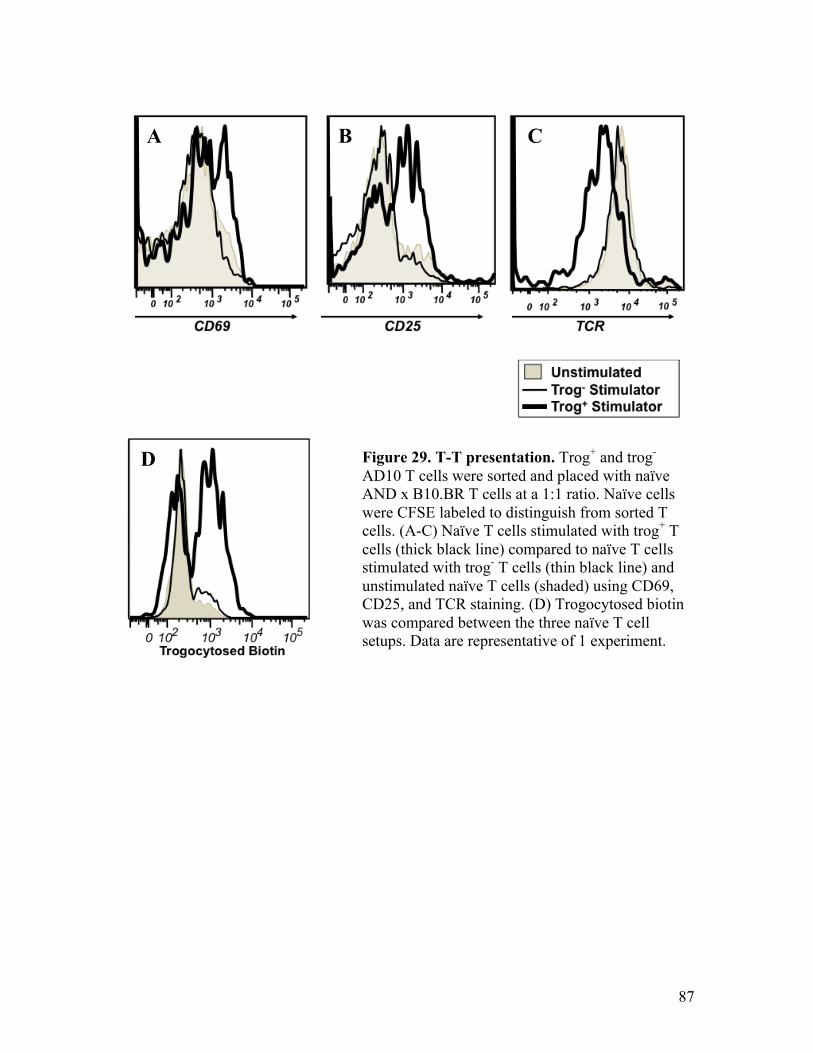
87
Figure 29. T-T presentation. Trog+ and trog- AD10 T cells were sorted and placed with naïve AND x B10.BR T cells at a 1:1 ratio. Naïve cells were CFSE labeled to distinguish from sorted T cells. (A-C) Naïve T cells stimulated with trog+ T cells (thick black line) compared to naïve T cells stimulated with trog- T cells (thin black line) and unstimulated naïve T cells (shaded) using CD69, CD25, and TCR staining. (D) Trogocytosed biotin was compared between the three naïve T cell setups. Data are representative of 1 experiment.
A B
D
C
88
Chapter 4:
Discussion
During antigen (Ag) recognition by CD4+ T cells, three signals are required for
the T cells to become activated. The first signal involves the engagement of the T cell
receptor (TCR) by cognate MHC:peptide. The TCR binds and recognizes MHC class II
and antigenic peptide bound to the MHC. TCR recognition of specific peptide residues
and the MHC leads to TCR crosslinking with CD3 and activation of the kinases Lck and
ZAP-70. The activation of these molecules leads to a series of signaling cascades that
ultimately leads to activation of several transcription factors. The transcription factors
activate genes that produce IL-2 and induce activation and proliferation. The second
signal involves the engagement of costimulatory molecules, like CD28 on the surface of
the T cell. Costimulatory engagement activates kinases leading to a cascade of signaling
molecule activation, similar to TCR engagement. In combination with TCR signaling,
costimulation leads to increased IL-2 production, activation, and proliferation. The final
signal comes from cytokines binding to their specific receptors on the surface of the T
cell leading to signaling and gene activation similar to TCR and costimulation
engagement.
During Ag recognition by CD4+ T cells, spatial and temporal rearrangements of
the TCR, costimulatory, and adhesion molecules results in the formation of an
immunological synapse between the APC and the T cell. The molecules accumulate at
the immune synapse and are arranged into distinct supramolecular activation complexes
(SMACs) (78). The prototypical TH1 immune synapse is characterized as a bull’s-eye
with TCR-MHC:peptide, TCR signaling associated molecules, and CD28/CD80 localized
89
to the center (the cSMAC). Adhesion molecules, such as ICAM-1/LFA-1, are found in a
surrounding peripheral ring (the pSMAC) (78, 79, 86). The overall function of the
immunological synapse is unclear; past results have shown that the immune synapse is
the site of cytokine secretion (101, 197), cytolytic granule secretion (88), and TCR down-
modulation and signaling (154). Our lab has shown that the immune synapse is also the
site of APC to CD4+ T cell trogocytosis (103). As T cells dissociate from APCs,
MHC:peptide complexes (103, 107), costimulatory molecules (106, 130, 142), plasma
membrane lipids (111, 148), and other membrane-bound molecules found on APCs are
trogocytosed by the T cells via the immunological synapse (103, 108, 124).
Over the past decade, there have been numerous studies that have examined the
mechanism of trogocytosis and the complement of molecules that are transferred, but
relatively little is known about the potential biological significance of the capturing of
these molecules by the trog+ T cell. The presence of APC-derived molecules on the T cell
raises the potential that they could engage receptors on the T cell and sustain intracellular
signaling. Sprent’s group has published several papers looking at the ability of APC-
derived exosomes to stimulate T cells (198-201), but attachment of exosomes to the
surface of the cell is fundamentally different from the integration of these molecules into
the plasma membrane via trogocytosis. Using fluorescent microscopy, Wetzel et al.
showed that staining for the cytosolic tail of the trogocytosed MHC class II required
permeabilization of the T cell membrane (103), suggesting the trogocytosed MHC was
integrated into the T cell plasma membrane in its topologically native form. These results
are consistent with the results in fig. 9. This finding also correlates with the hypothesis by
Martinez-Martin et al. (20) and Dopfer et al. (155), that endosomes containing
90
trogocytosed APC membrane and membrane molecules fuse with the T cell plasma
membrane resulting in the integration of these molecules in the correct orientation. This
raises the possibility that sustained signaling via trogocytosis results from trogocytosed
molecules engaging their receptors on the T cell surface.
A few studies have looked at the correlation between trogocytosis and sustained T
cell signaling, but the correlation remains unclear. In 2005 Zhou et al. showed that
CD80+ T cells had sustained NFκB activation and production of selected cytokines (161).
However, their results were most likely the result of T-T antigen presentation, not cell
autonomous signaling (161). Other reports have looked at the constitutively activated
receptor tyrosine kinases (202) and the Ig-like Transcript 2 (ILT2) signaling after
trogocytosis (203) in CD8+ T cells, but none have actually addressed sustained signaling
in T cells from trogocytosed APC-derived molecules. In this thesis, I have examined the
hypothesis that trogocytosed MHC:peptide complexes sustain intracellular signaling
within CD4+ T cells after dissociation from APC, leading to sustained T cell activation,
proliferation, and survival.
Kinetics, activation, proliferation, and selective survival of trog+ T cells
Since murine CD4+ T cells cannot express MHC class II endogenously (175),
the presence of these molecules on T cells is due to trogocytosis. I initially examined
trogocytosis by testing different cell labeling protocols to determine which was the most
efficient at measuring trogocytosis (fig. 10). GFP-tagged MHC class II and the use of
anti-I-Ek have been previously shown to be a good measure of trogocytosis (103). These
were compared with membrane (CM-DiI) and total protein (surface biotinylation)
91
trogocytosis to determine which has the best dynamic range when measured by flow
cytometry. Both CM-DiI and biotin were more sensitive measures of trogocytosis
compared to staining for just MHC. These results are consistent with past results showing
significant lipid trogocytosis from APCs onto the T cell (88, 107). The transfer of APC
membrane lipids may be the result of membrane fusion between the T-APC, as suggested
by Stinchcombe et al. (88). Hudrisier et al. proposed that T cells pull off membrane to
use in proliferation and metabolism and, in return, the T cell provides protection for the
target cell (108), but there are currently no published data to support this hypothesis.
To further examine trogocytosis, I addressed whether T cells require previous Ag
recognition to efficiently perform trogocytosis. Past results have shown that trogocytosis
is antigen dose-dependent (105, 107), peptide-specific (105, 107), and requires the
immune synapse (103, 108, 124), but very little research has looked at the length of
stimulation required for naïve T cell trogocytosis. Using AND x Rag-1-/- naïve T cells, it
was observed that two rounds of stimulation with APCs lead to T cells that are efficient at
naïve T cell trogocytosis. During the primary stimulation with APCs for 6-24 hr, little to
no trogocytosis occurred (fig. 11B). Following T cell recovery from the primary culture
and two additional days in culture, the naïve T cells showed significant trogocytosis after
a secondary 90 min stimulation with APC (fig. 11C). Previous studies have reported that
naïve T cells have a reduced ability to perform trogocytosis (104, 106, 130, 142, 153), but
none has restimulated these cells to examine their trogocytosis capacity upon the
secondary challenge. Our results suggest that following the primary stimulation, the T
cells increase avidity for the APC, by increased expression of adhesion molecules and
integrin activation, allowing for more stable T-APC interactions and, thus, increased
92
trogocytosis. CD28 expression is also increased in activated T cells and has been linked
to increases in transfer (106, 122, 130).
Using in vitro primed naïve T cell cultures, I found that trog+ T cells do
proliferate. Approximately 25% of naïve CD4+ T cells from AD10 TCR transgenic mice
were MHC class II positive directly ex vivo (fig. 12). Since murine CD4+ T cells cannot
express MHC class II endogenously (175), the presence of these molecules was due to a
trogocytosis event in vivo. The nature of this in vivo trogocytosis by naïve cells is
unclear; it could be the result of tonic stimulation by positively selecting ligands in the
periphery (191) and/or thymic positive selection events (121). When the AD10 splenic
suspensions were stimulated by addition of exogenous MCC88-103 antigenic peptide, the
frequency of MHC+ (trog+) T cells doubled by day 1 (fig. 12). The trog+ cells were also
the first CD4+ cells to proliferate. This raises the intriguing possibility that trogocytosis
may lower the threshold for activation and proliferation of naïve T cells upon antigen
stimulation. The lack of proliferation and activation from the primary stimulation of the
naïve T cell could be due to the cells not performing trogocytosis (fig. 11). Several
possibilities could explain this observation, including alterations in intracellular signaling
and/or increased avidity of the T cells, which could be due to signaling from the
trogocytosed molecules.
When trogocytosis by in vitro primed AD10 T was examined, the trog+ T cells
were found to have increased TCR-downmodulation and higher levels of CD69 (fig. 13).
This suggests that the cells were activated and is consistent with our previously published
results (103). It is interesting to note that both trog+ and trog- T cells have a similar
activation phenotype suggesting that both cell populations recognize Ag and are
93
activated. It is unclear why the trog- cells did not perform trogocytosis when even anergic
T cells efficiently trogocytosed molecules from APC (102). It is not likely due to
differences in activation because both populations are similarly activated upon antigen
recognition. It is possible that it reflects differences in the avidity of the T cells, their
adhesion molecule concentrations, activation states, and/or additional uncharacterized
attributes of the two populations of cells.
The significance of trogocytosis becomes clearer once the cells are recovered and
placed in culture away from APC. Analyzing sustained expression of CD69 in recovered
AD10 T cells over time, the trog+ T cells continue to express CD69, while trog- T cells do
not. In fig. 14, trog+ T cells (thick black line) have high levels of CD69 similar to the anti-
CD3 positive control (gray line) for up to one day following recovery. Continual CD69
expression on the surface of the T cell requires TCR:pMHC engagement (19) and TCR
signaling (193). I hypothesize that the continued expression of CD69 on the surface the T
cells is due to the trogocytosed material engaging receptors on the surface of the T cell
after recovery from APC.
This hypothesis is supported by fig. 15, which shows that trog+ T cells survive
longer in culture following recovery. When cells were recovered from the standard in
vitro trogocytosis assay and incubated at low density, a significant change in the
frequency of trog+ and trog- cells was observed over several days. Immediately after
recovery from the APC, the trog- T cells represented almost two-thirds of the CD4+ cells.
Over the course of several days, the frequency of trog+ and trog- cells had reversed so that
by day three, the trog+ cells made up more than 82% of the viable CD4+ T cells and the
trog- represented less than 18% of the viable CD4+ cells. The level of GFP-tagged MHC
94
remained fairly constant on the trog+ cells over 5 days, which suggests that the cells
weren’t dividing, because proliferation would result in the dilution of trogocytosed
molecules onto daughter cells. These results suggest that the trog+ cells were selectively
surviving in the cultures, while the trog- cells were dying.
Sustained signaling by the trogocytosed material
One explanation for the preferential survival of the trog+ cells is that the
trogocytosed molecules were sustaining intracellular signaling. It would be expected that
TCR signaling would cease in recovered cells unless there is continued TCR-
MHC:peptide engagement. By flow cytometry it was observed that after the acquisition
of cognate MHC:peptide complexes and other APC membrane molecules, there was
elevated phosphorylation and activation of both TCR-proximal (pZAP-70) and TCR-
distal signaling molecules (pERK1/2) over several days. Using high-resolution light
microscopy, it was observed that these TCR-associated signaling molecules accumulated
with the TCR and trogocytosed molecules. pERK1/2 was found to co-associate with the
trogocytosed material, meaning that pERK1/2 was near the trogocytosed molecules but
did not colocalize. This is consistent with Adams et al. and our previous results showing
ERK was sequestered and localized near the plasma membrane where the TCR is in
activated T cells (102, 204). These data support the hypothesis that the trogocytosed
molecules continued to engage their receptors on the T cell and that this
“autopresentation” sustained intracellular signaling.
While the detection of phosphorylated and activated signaling molecules in trog+
cells and the co-localization of these molecules with both the TCR and trogocytosed
95
MHC:peptide supports this model, it does not prove that the trogocytosed molecules are
driving the observed signaling. It is possible that the sustained signaling is actually due to
residual signaling carried over from the immune synapse between the APC and T cell. To
show that this signaling was due to sustained signaling from the trogocytosed molecules,
the approach of Faroudi et al. (188) was used. Following the addition of the Src-family of
tyrosine kinase inhibitor, PP2, TCR-mediated signaling, both proximal (pZAP-70) and
downstream (pERK1/2), ceased. Upon removal of the PP2 and a subsequent 20-minute
incubation, both pZAP-70 and pERK1/2 were detected and localized with the TCR and
trogocytosed MHC:peptide molecules. This signaling was observed only in the trog+
cells, not in the trog- cells. Since the trog- cells were capable of recognizing antigen and
responding (fig. 13), the lack of detectable signaling within these cells leads me to the
conclusion that the signaling in the trog+ cells was cell autonomous and driven by the
trogocytosed molecules. If this signaling had been the result of T-T presentation events,
there would have been detectable signaling within the trog- cells, as well, since the trog-
cells make up the majority of the population and are more likely to encounter the trog+
cells in T-T conjugates. The role of specific trogocytosed molecules (i.e. MHC:peptide,
costimulatory molecules, etc.) in the sustained signaling is currently unclear.
These results show that the trogocytosed molecules are responsible for initiating
and sustaining signaling by engaging the TCR, suggesting that this leads to the activation
and selective survival of trog+ T cells. The result of trogocytosis could, therefore, play a
role in immune modulation. This sustained signaling might lead to clonal exhaustion or
activation-induced cell death, helping to turn off an ongoing immune response.
Alternatively, this sustained signaling could result in selective survival and to
96
alterations/increases in T cell effector functions. Further analysis of effector function and
cytokine production by trog+ T cells will help clarify the potential role of trogocytosis in
immune control.
The imaging experiments shown in fig. 18 demonstrate that in T-APC conjugates
a significant accumulation of the TCR and signaling-associated molecules with
trogocytosed molecules. Interestingly, the trogocytosed molecules move to a region of
the T cell directly opposite the immune synapse more than 82% of the time. This area has
been termed the distal pole complex (205, 206). The trogocytosed patches of APC
membrane are usually arranged in a circular pattern at the distal pole forming a
“trogocytosis crown”. The reason for this segregation of the trogocytosed molecules
when conjugated to APC is unclear, but it raises the intriguing possibility that the
trogocytosed molecules could play a role in asymmetric T cell division. Asymmetric T
cell division involves the segregation of proteins and signaling molecules in a bipolar
manner resulting in the differential cell fate (effector versus memory) of daughter cells
(207). It is possible that the T cells integrate differential signaling from the immune
synapse and from trogocytosed molecules, which may play a role in setting up the
observed asymmetric T cell division and differential development of T cell fate.
Sustained signaling after trogocytosis could also resolve an apparent paradox
between the duration of Ag stimulation necessary to fully activate CD4+ T cells. Iezzi et
al. found that T cell activation required sustained Ag stimulation for up to 6 hours (11).
However, intravital microscopy has shown that the duration of initial T-DC interactions
are on the order of minutes inside an intact lymph node (208). A pair of previous in vitro
studies has shown that T cells form multiple short lived interactions with APC, and that
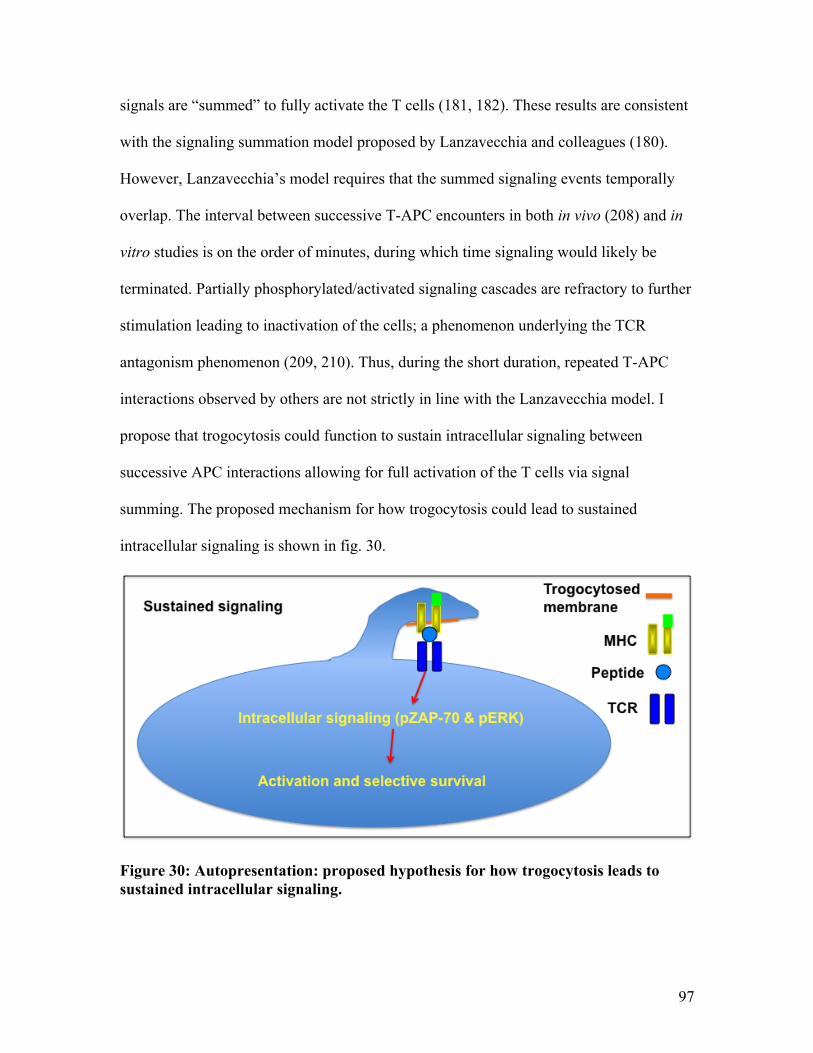
97
signals are “summed” to fully activate the T cells (181, 182). These results are consistent
with the signaling summation model proposed by Lanzavecchia and colleagues (180).
However, Lanzavecchia’s model requires that the summed signaling events temporally
overlap. The interval between successive T-APC encounters in both in vivo (208) and in
vitro studies is on the order of minutes, during which time signaling would likely be
terminated. Partially phosphorylated/activated signaling cascades are refractory to further
stimulation leading to inactivation of the cells; a phenomenon underlying the TCR
antagonism phenomenon (209, 210). Thus, during the short duration, repeated T-APC
interactions observed by others are not strictly in line with the Lanzavecchia model. I
propose that trogocytosis could function to sustain intracellular signaling between
successive APC interactions allowing for full activation of the T cells via signal
summing. The proposed mechanism for how trogocytosis could lead to sustained
intracellular signaling is shown in fig. 30.
Figure 30: Autopresentation: proposed hypothesis for how trogocytosis leads to sustained intracellular signaling.
98
Trogocytosis signaling and spots
Imaging done in this thesis and by many others have shown that trogocytosed
molecules are usually found in punctate spots on the surface of the T cell (20, 103, 105,
106, 120, 122). In T-APC conjugate images (figures 18-19), trogocytosed GFP:MHC can
be seen as one to two spots at the distal pole, as discussed above. It is unclear why
trogocytosis leads to punctate spots. The accumulation of trogocytosed molecules into
distinct spots suggest that the T cell is concentrating the molecules to accumulate
signaling in the area, which is consistent with the sustained signaling imaging data. When
the TCR becomes engaged with MHC:peptide, the TCR forms aggregates (35, 36), this
could explain why distinct spots form if there is continual engagement of the TCR by
trogocytosed MHC:peptide. Wetzel et al. showed in recovered cells that the trogocytosed
spots are surrounded by actin cytoskeleton (103), which could help maintain the spots.
Fig. 23 is the first data to look at how spot size could correlate to intracellular signaling
levels. Spots trogocytosed GFP ≥6x6 pixels showed higher staining for TCR and pERK
compared to spots <6x6 pixels. These data suggest that increasing the size of the
trogocytosed spot could lead to increased accumulation of intracellular signaling and
cytoskeleton keeping the punctate spot together.
T-T presentation The work of Zhou et al. showed that CD4+ T cells could present trogocytosed
antigen to naïve T cells, showing increases in CD25 and proliferation in the responder
naïve T cells (159). They also showed that when trog+ regulatory T cells were present,
99
immune suppression of the T cells occurred (159). To further Zhou et al. work,
experiments looking at the phenotype of the responder T cells and the effect of T-T
presentation on different responder T cells would help determine a role T-T presentation
in an immune response. Using trog+ and trog- sorted T cells as potential APCs, it was
observed that naïve T cells incubated with trog+ and not trog- T cells became activated.
Naïve T cells cultured with trog+ T cells showed increases in CD69, CD25, and
downmodulation of the TCR compared to naïve T cell placed in culture with trog- T cells.
Interestingly, naïve T cells trogocytosed biotin from the trog+ T cells, as shown in fig.
29D. Trogocytosis by responder naïve T cells during T-T Ag presentation may play a role
in sustained activation and signaling in these cells. Further experiments are needed to
determine this and whether an immune synapse forms at the interface. Understanding the
role of T-T presentation to naïve T cells (fig. 29) and effector T cells is important in
determining the overall role that trogocytosis may play in an immune response.
In conclusion, for the first time, the data presented here demonstrate that
trogocytosed molecules continue to engage their receptors on the surface of trog+ T cells
to cause sustained intracellular signaling. The selective survival of the trog+ T cells after
recovery from the APC co-culture suggests this is most likely due to sustained signaling
associated with trogocytosed molecules and provides strong evidence that trogocytosis
provides a selective advantage for trog+ T cells.
100
Chapter 5: Future Directions: Peptide affinity For this thesis, trogocytosis has been monitored during Ag presentation using a
strong agonist peptide, MCC, to the TCR. Results by Wetzel et al. have shown that using
non-specific peptide-loaded APCs does not lead to T cell trogocytosis (103). What has
not been analyzed is the effects on trogocytosis efficiency using varying Ag affinity for
the TCR. If trogocytosis occurs with specific Ag recognition, is trogocytosis dependent
upon the strength of the TCR-MHC:peptide interaction? Very preliminary peptide
affinity experiments have been performed using the fibroblast cell line P13.9H, loaded
with an high-affinity agonist peptide (MCC), intermediate-affinity peptide (MCC-A) or a
very weak agonist altered peptide ligand (MCC-K99A) (fig. 31A). Using this system we
can examine trogocytosis efficiency and can also assess for differences in intracellular
signaling and cell survival.
Early lab peptide affinity results are mixed. In several experiments, decreasing
TCR affinity decreased trogocytosis efficiency (fig. 31B), except in two experiments
where all peptides had similar trogocytosis efficiencies (fig. 31C). In fig. 31B, the bar
graph (left) shows a ~32% and ~66% decrease in trogocytosed CD80 MFI compared to
the strong agonist (MCC, yellow) to the intermediate agonist (MCC-A, blue) and the
weak agonist (MCC-K99A, red), respectively. P-values from bar graphs in fig. 31C (left)
showed no significant differences in the average MFI of trogocytosed CD80 (p > 0.05)
between the different peptides. Discrepancies in the data may be due to differences in
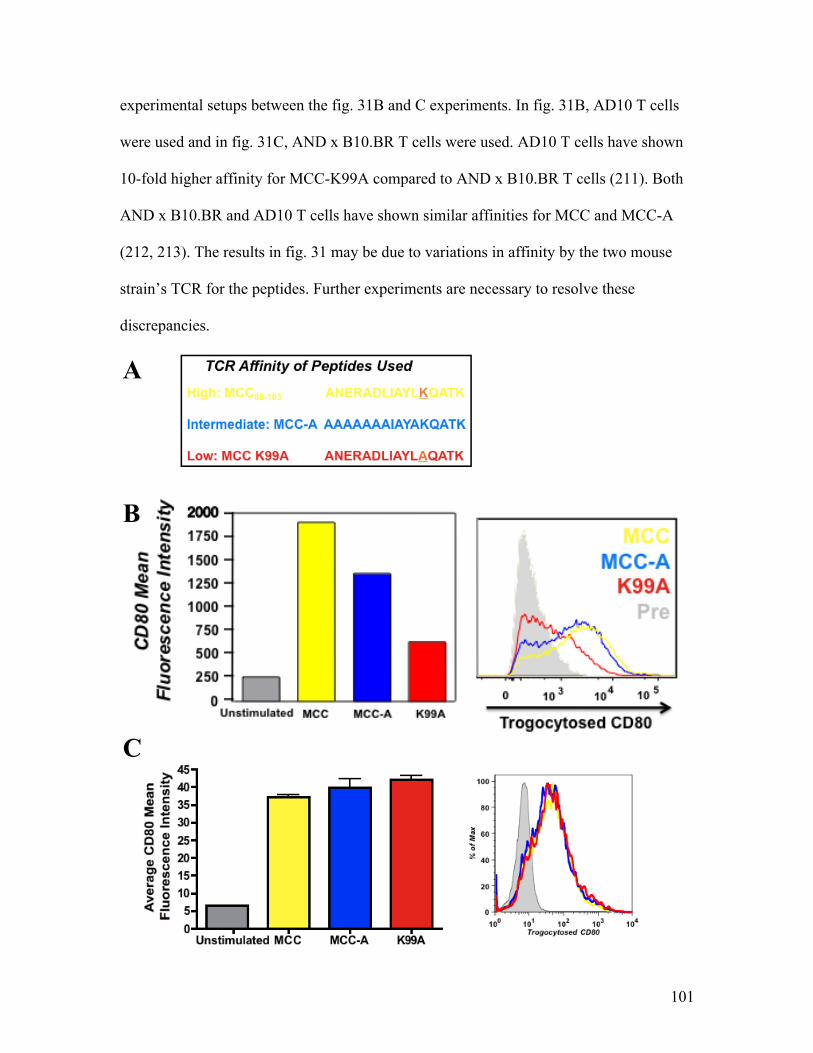
101
experimental setups between the fig. 31B and C experiments. In fig. 31B, AD10 T cells
were used and in fig. 31C, AND x B10.BR T cells were used. AD10 T cells have shown
10-fold higher affinity for MCC-K99A compared to AND x B10.BR T cells (211). Both
AND x B10.BR and AD10 T cells have shown similar affinities for MCC and MCC-A
(212, 213). The results in fig. 31 may be due to variations in affinity by the two mouse
strain’s TCR for the peptides. Further experiments are necessary to resolve these
discrepancies.
A
C
B
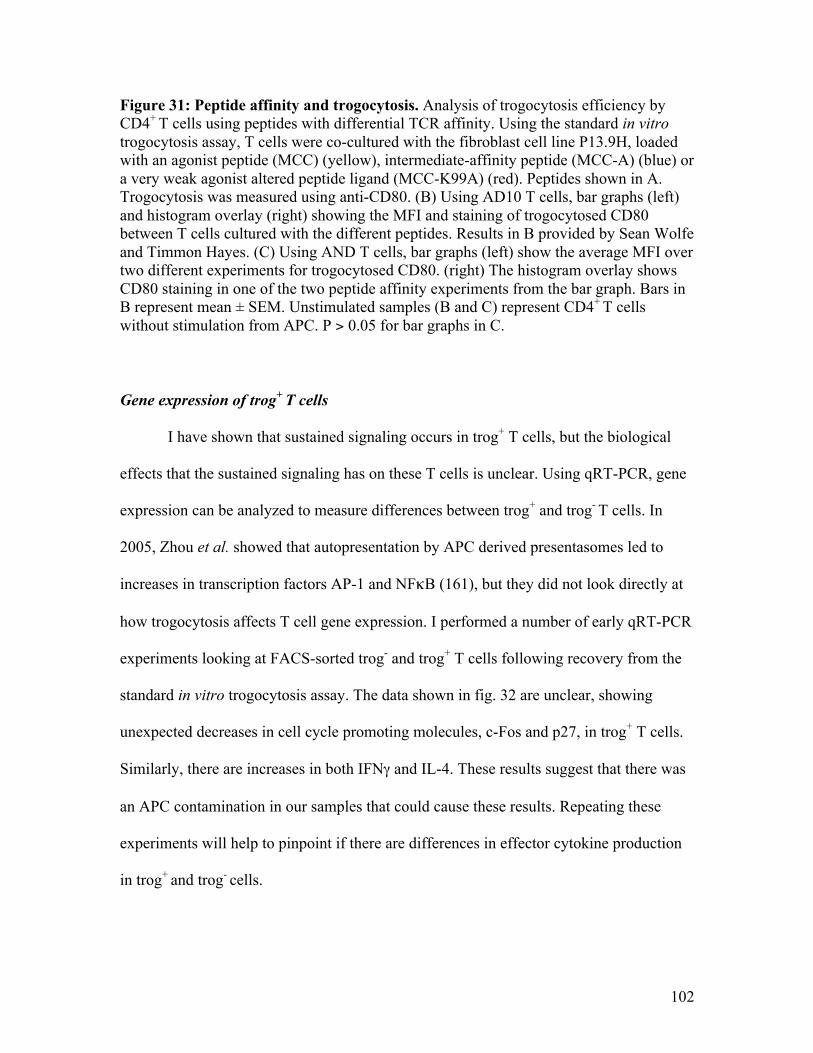
102
Figure 31: Peptide affinity and trogocytosis. Analysis of trogocytosis efficiency by CD4+ T cells using peptides with differential TCR affinity. Using the standard in vitro trogocytosis assay, T cells were co-cultured with the fibroblast cell line P13.9H, loaded with an agonist peptide (MCC) (yellow), intermediate-affinity peptide (MCC-A) (blue) or a very weak agonist altered peptide ligand (MCC-K99A) (red). Peptides shown in A. Trogocytosis was measured using anti-CD80. (B) Using AD10 T cells, bar graphs (left) and histogram overlay (right) showing the MFI and staining of trogocytosed CD80 between T cells cultured with the different peptides. Results in B provided by Sean Wolfe and Timmon Hayes. (C) Using AND T cells, bar graphs (left) show the average MFI over two different experiments for trogocytosed CD80. (right) The histogram overlay shows CD80 staining in one of the two peptide affinity experiments from the bar graph. Bars in B represent mean ± SEM. Unstimulated samples (B and C) represent CD4+ T cells without stimulation from APC. P > 0.05 for bar graphs in C.
Gene expression of trog+ T cells I have shown that sustained signaling occurs in trog+ T cells, but the biological
effects that the sustained signaling has on these T cells is unclear. Using qRT-PCR, gene
expression can be analyzed to measure differences between trog+ and trog- T cells. In
2005, Zhou et al. showed that autopresentation by APC derived presentasomes led to
increases in transcription factors AP-1 and NFκB (161), but they did not look directly at
how trogocytosis affects T cell gene expression. I performed a number of early qRT-PCR
experiments looking at FACS-sorted trog- and trog+ T cells following recovery from the
standard in vitro trogocytosis assay. The data shown in fig. 32 are unclear, showing
unexpected decreases in cell cycle promoting molecules, c-Fos and p27, in trog+ T cells.
Similarly, there are increases in both IFNγ and IL-4. These results suggest that there was
an APC contamination in our samples that could cause these results. Repeating these
experiments will help to pinpoint if there are differences in effector cytokine production
in trog+ and trog- cells.
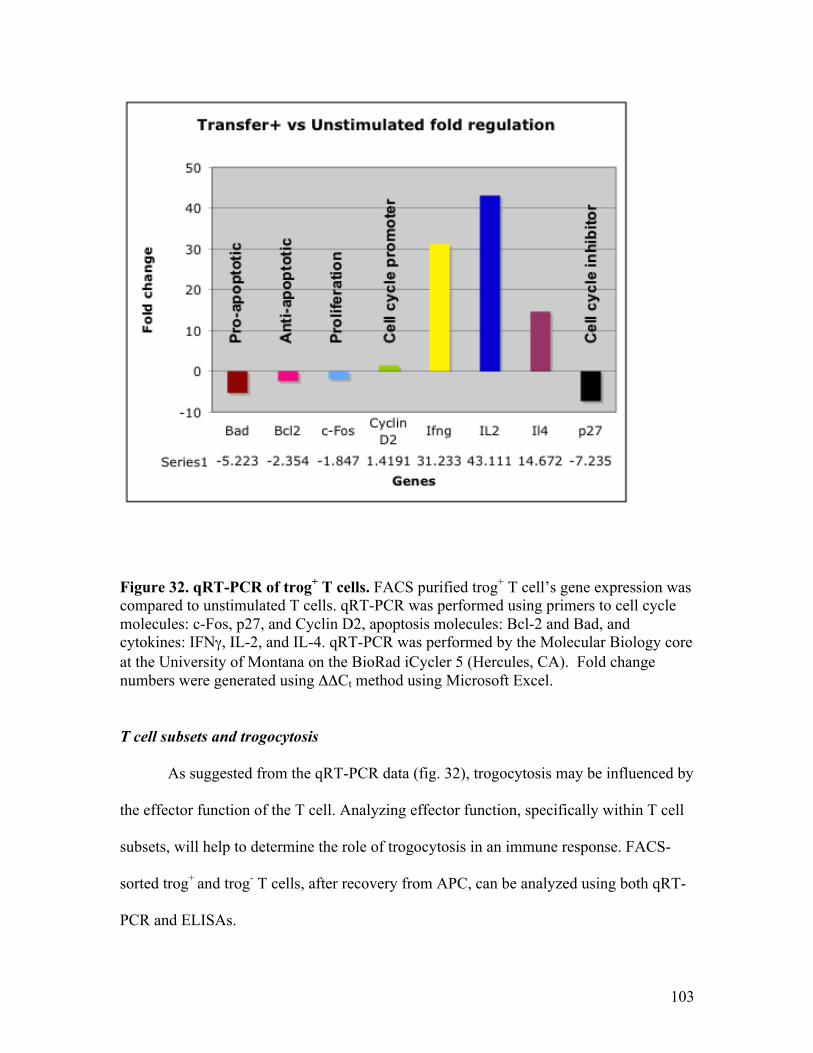
103
Figure 32. qRT-PCR of trog+ T cells. FACS purified trog+ T cell’s gene expression was compared to unstimulated T cells. qRT-PCR was performed using primers to cell cycle molecules: c-Fos, p27, and Cyclin D2, apoptosis molecules: Bcl-2 and Bad, and cytokines: IFNγ, ΙL-2, and IL-4. qRT-PCR was performed by the Molecular Biology core at the University of Montana on the BioRad iCycler 5 (Hercules, CA). Fold change numbers were generated using ΔΔCt method using Microsoft Excel. T cell subsets and trogocytosis As suggested from the qRT-PCR data (fig. 32), trogocytosis may be influenced by
the effector function of the T cell. Analyzing effector function, specifically within T cell
subsets, will help to determine the role of trogocytosis in an immune response. FACS-
sorted trog+ and trog- T cells, after recovery from APC, can be analyzed using both qRT-
PCR and ELISAs.
104
Promoting the differentiation of T cells into TH1 or TH2 cells can help us
determine which subset performs trogocytosis more efficiently. Prior to adding the
primed AD10 T cells to the standard in vitro trogocytosis assay, we can supplement the
primed cultures with cytokines to induce differentiation. By adding IL-4 or IFNγ to the
cultures we can induce the cells to become TH2 cells or TH1 cells, respectively.
Preliminary results by Lindsay Thuesen suggest that TH2 cells perform trogocytosis more
efficiently (data not shown). This experiment, combined with the qRT-PCR and ELISA
data, could determine if there is a specific T cell subset that performs trogocytosis more
efficiently.
T-T Ag presentation Further studies on T-T presentation could expand on the role of trogocytosis in T
cell function. Zhou et al. showed that CD4+ T cells could present trogocytosed Ag to
naïve T cells, causing increases in CD25 and proliferation of the naïve T cells (159). In
contrast, Helft et al. showed that T-T presentation led to inhibition of effector/memory T
cells (158). Experiments comparing T-T presentation on different responder T cells could
help define the potential role of T-T presentation in modulating immune responses.
Understanding the interactions between responder T cells and trog+ T cells should
be characterized. Is an immune synapse formed? What is the efficiency? And what is
required for T-T Ag presentation? Trog+ and trog- FACS-sorted T cells, following
recovery from the standard in vitro trogocytosis assay, could be placed in culture with
naïve T cells for varying durations of time and ratios of sorted versus naïve cells to
determine the length of time and cell dilution needed for efficient Ag presentation. We
105
could measure the expression of activation markers (like CD69 and CD25) to determine
T-T presentation.
Understanding the requirements for T-T Ag presentation, as described above, will
help us develop a standard assay for T-T presentation. Once an assay is created, imaging
could be done to determine if an immune synapse is formed between the T-APC and the
naïve responding cell. Imaging the interface between the two cells for prototypical
immune synapse markers (like TCR, MHC, costimulatory molecules (CD80), signaling
molecules (PKCθ), and adhesion molecules (ICAM-1)) will allow us to determine if there
is segregation of molecules into distinct SMACs, like those found in mature immune
synapses.
106
References
1. Romagnani, S. 2000. T-cell subsets (Th1 versus Th2). Ann Allergy Asthma
Immunol 85:9-18. 2. Jankovic, D., Z. Liu, and W. C. Gause. 2001. Th1- and Th2-cell commitment
during infectious disease: asymmetry in divergent pathways. Trends Immunol 22:450-457.
3. Street, N. E., and T. R. Mosmann. 1991. Functional diversity of T lymphocytes
due to secretion of different cytokine patterns. FASEB J 5:171-177. 4. Harrington, L. E., R. D. Hatton, P. R. Mangan, H. Turner, T. L. Murphy, K. M.
Murphy, and C. T. Weaver. 2005. Interleukin 17-producing CD4+ effector T cells develop via a lineage distinct from the T helper type 1 and 2 lineages. Nat Immunol 6:1123-1132.
5. Schaerli, P., K. Willimann, A. B. Lang, M. Lipp, P. Loetscher, and B. Moser.
2000. CXC chemokine receptor 5 expression defines follicular homing T cells with B cell helper function. J Exp Med 192:1553-1562.
6. Gershon, R. K., and K. Kondo. 1970. Cell interactions in the induction of
tolerance: the role of thymic lymphocytes. Immunology 18:723-737. 7. Matzinger, P. 1994. Tolerance, danger, and the extended family. Annu Rev
Immunol 12:991-1045. 8. Schwartz, R. H. 1992. Costimulation of T lymphocytes: the role of CD28, CTLA-
4, and B7/BB1 in interleukin-2 production and immunotherapy. Cell 71:1065-1068.
9. Schwartz, R. H. 1990. A cell culture model for T lymphocyte clonal anergy.
Science 248:1349-1356. 10. Quezada, S. A., L. Z. Jarvinen, E. F. Lind, and R. J. Noelle. 2004. CD40/CD154
interactions at the interface of tolerance and immunity. Annu Rev Immunol 22:307-328.
11. Iezzi, G., K. Karjalainen, and A. Lanzavecchia. 1998. The duration of antigenic
stimulation determines the fate of naive and effector T cells. Immunity 8:89-95. 12. Richie, L. I., P. J. Ebert, L. C. Wu, M. F. Krummel, J. J. Owen, and M. M. Davis.
2002. Imaging synapse formation during thymocyte selection: inability of
107
CD3zeta to form a stable central accumulation during negative selection. Immunity 16:595-606.
13. Mercep, M., A. M. Weissman, S. J. Frank, R. D. Klausner, and J. D. Ashwell.
1989. Activation-driven programmed cell death and T cell receptor zeta eta expression. Science 246:1162-1165.
14. Schwartz, R. H. 2003. T cell anergy. Annu Rev Immunol 21:305-334. 15. Schonrich, G., U. Kalinke, F. Momburg, M. Malissen, A. M. Schmitt-Verhulst, B.
Malissen, G. J. Hammerling, and B. Arnold. 1991. Down-regulation of T cell receptors on self-reactive T cells as a novel mechanism for extrathymic tolerance induction. Cell 65:293-304.
16. Zanders, E. D., J. R. Lamb, M. Feldmann, N. Green, and P. C. Beverley. 1983.
Tolerance of T-cell clones is associated with membrane antigen changes. Nature 303:625-627.
17. Reinherz, E. L., O. Acuto, M. Fabbi, A. Bensussan, C. Milanese, H. D. Royer, S.
C. Meuer, and S. F. Schlossman. 1984. Clonotypic surface structure on human T lymphocytes: functional and biochemical analysis of the antigen receptor complex. Immunol Rev 81:95-129.
18. Bankovich, A. J., L. R. Shiow, and J. G. Cyster. 2010. CD69 suppresses
sphingosine 1-phosophate receptor-1 (S1P1) function through interaction with membrane helix 4. J Biol Chem 285:22328-22337.
19. Yamashita, I., T. Nagata, T. Tada, and T. Nakayama. 1993. CD69 cell surface
expression identifies developing thymocytes which audition for T cell antigen receptor-mediated positive selection. Int Immunol 5:1139-1150.
20. Martinez-Martin, N., E. Fernandez-Arenas, S. Cemerski, P. Delgado, M. Turner,
J. Heuser, D. J. Irvine, B. Huang, X. R. Bustelo, A. Shaw, and B. Alarcon. 2011. T Cell Receptor Internalization from the Immunological Synapse Is Mediated by TC21 and RhoG GTPase-Dependent Phagocytosis. Immunity 35:208-222.
21. Dietrich, J., X. Hou, A. M. Wegener, and C. Geisler. 1994. CD3 gamma contains
a phosphoserine-dependent di-leucine motif involved in down-regulation of the T cell receptor. Embo J 13:2156-2166.
22. Monjas, A., A. Alcover, and B. Alarcon. 2004. Engaged and bystander T cell
receptors are down-modulated by different endocytotic pathways. J Biol Chem 279:55376-55384.
108
23. Valitutti, S., S. Muller, M. Cella, E. Padovan, and A. Lanzavecchia. 1995. Serial triggering of many T-cell receptors by a few peptide-MHC complexes. Nature 375:148-151.
24. Itoh, Y., B. Hemmer, R. Martin, and R. N. Germain. 1999. Serial TCR
engagement and down-modulation by peptide:MHC molecule ligands: relationship to the quality of individual TCR signaling events. J Immunol 162:2073-2080.
25. Valitutti, S., S. Muller, M. Dessing, and A. Lanzavecchia. 1996. Signal extinction
and T cell repolarization in T helper cell-antigen-presenting cell conjugates. Eur J Immunol 26:2012-2016.
26. Schuh, K., T. Twardzik, B. Kneitz, J. Heyer, A. Schimpl, and E. Serfling. 1998.
The interleukin 2 receptor alpha chain/CD25 promoter is a target for nuclear factor of activated T cells. J Exp Med 188:1369-1373.
27. Cantrell, D. A., and K. A. Smith. 1984. The interleukin-2 T-cell system: a new
cell growth model. Science 224:1312-1316. 28. Robb, R. J., A. Munck, and K. A. Smith. 1981. T cell growth factor receptors.
Quantitation, specificity, and biological relevance. J Exp Med 154:1455-1474. 29. Bradley, L. M., G. G. Atkins, and S. L. Swain. 1992. Long-term CD4+ memory T
cells from the spleen lack MEL-14, the lymph node homing receptor. J Immunol 148:324-331.
30. Hengel, R. L., V. Thaker, M. V. Pavlick, J. A. Metcalf, G. Dennis, Jr., J. Yang, R.
A. Lempicki, I. Sereti, and H. C. Lane. 2003. Cutting edge: L-selectin (CD62L) expression distinguishes small resting memory CD4+ T cells that preferentially respond to recall antigen. J Immunol 170:28-32.
31. Haynes, B. F., M. J. Telen, L. P. Hale, and S. M. Denning. 1989. CD44--a
molecule involved in leukocyte adherence and T-cell activation. Immunol Today 10:423-428.
32. Doyle, C., and J. L. Strominger. 1987. Interaction between CD4 and class II MHC
molecules mediates cell adhesion. Nature 330:256-259. 33. Huet, S., H. Groux, B. Caillou, H. Valentin, A. M. Prieur, and A. Bernard. 1989.
CD44 contributes to T cell activation. J Immunol 143:798-801. 34. Krogsgaard, M., Q. J. Li, C. Sumen, J. B. Huppa, M. Huse, and M. M. Davis.
2005. Agonist/endogenous peptide-MHC heterodimers drive T cell activation and sensitivity. Nature 434:238-243.
109
35. Williams, A. F., and A. D. Beyers. 1992. T-cell receptors. At grips with interactions. Nature 356:746-747.
36. Davis, S. J., and P. A. van der Merwe. 2006. The kinetic-segregation model: TCR
triggering and beyond. Nat Immunol 7:803-809. 37. Bu, J. Y., A. S. Shaw, and A. C. Chan. 1995. Analysis of the interaction of ZAP-
70 and syk protein-tyrosine kinases with the T-cell antigen receptor by plasmon resonance. Proc Natl Acad Sci U S A 92:5106-5110.
38. Artyomov, M. N., M. Lis, S. Devadas, M. M. Davis, and A. K. Chakraborty.
2010. CD4 and CD8 binding to MHC molecules primarily acts to enhance Lck delivery. Proc Natl Acad Sci U S A 107:16916-16921.
39. Lovatt, M., A. Filby, V. Parravicini, G. Werlen, E. Palmer, and R. Zamoyska.
2006. Lck regulates the threshold of activation in primary T cells, while both Lck and Fyn contribute to the magnitude of the extracellular signal-related kinase response. Mol Cell Biol 26:8655-8665.
40. Zhang, W., J. Sloan-Lancaster, J. Kitchen, R. P. Trible, and L. E. Samelson. 1998.
LAT: the ZAP-70 tyrosine kinase substrate that links T cell receptor to cellular activation. Cell 92:83-92.
41. Bubeck Wardenburg, J., C. Fu, J. K. Jackman, H. Flotow, S. E. Wilkinson, D. H.
Williams, R. Johnson, G. Kong, A. C. Chan, and P. R. Findell. 1996. Phosphorylation of SLP-76 by the ZAP-70 protein-tyrosine kinase is required for T-cell receptor function. J Biol Chem 271:19641-19644.
42. Yablonski, D., M. R. Kuhne, T. Kadlecek, and A. Weiss. 1998. Uncoupling of
nonreceptor tyrosine kinases from PLC-gamma1 in an SLP-76-deficient T cell. Science 281:413-416.
43. Sommers, C. L., L. E. Samelson, and P. E. Love. 2004. LAT: a T lymphocyte
adapter protein that couples the antigen receptor to downstream signaling pathways. Bioessays 26:61-67.
44. Dombroski, D., R. A. Houghtling, C. M. Labno, P. Precht, A. Takesono, N. J.
Caplen, D. D. Billadeau, R. L. Wange, J. K. Burkhardt, and P. L. Schwartzberg. 2005. Kinase-independent functions for Itk in TCR-induced regulation of Vav and the actin cytoskeleton. J Immunol 174:1385-1392.
45. Samelson, L. E. 2002. Signal transduction mediated by the T cell antigen
receptor: the role of adapter proteins. Annu Rev Immunol 20:371-394. 46. Wu, J. N., and G. A. Koretzky. 2004. The SLP-76 family of adapter proteins.
Semin Immunol 16:379-393.
110
47. Desai, D. M., M. E. Newton, T. Kadlecek, and A. Weiss. 1990. Stimulation of the
phosphatidylinositol pathway can induce T-cell activation. Nature 348:66-69. 48. Reynolds, L. F., C. de Bettignies, T. Norton, A. Beeser, J. Chernoff, and V. L.
Tybulewicz. 2004. Vav1 transduces T cell receptor signals to the activation of the Ras/ERK pathway via LAT, Sos, and RasGRP1. J Biol Chem 279:18239-18246.
49. Liu, K. Q., S. C. Bunnell, C. B. Gurniak, and L. J. Berg. 1998. T cell receptor-
initiated calcium release is uncoupled from capacitative calcium entry in Itk-deficient T cells. J Exp Med 187:1721-1727.
50. Berg, L. J., L. D. Finkelstein, J. A. Lucas, and P. L. Schwartzberg. 2005. Tec
family kinases in T lymphocyte development and function. Annu Rev Immunol 23:549-600.
51. Majerus, P. W., T. S. Ross, T. W. Cunningham, K. K. Caldwell, A. B. Jefferson,
and V. S. Bansal. 1990. Recent insights in phosphatidylinositol signaling. Cell 63:459-465.
52. Williams, R. L. 1999. Mammalian phosphoinositide-specific phospholipase C.
Biochim Biophys Acta 1441:255-267. 53. Feske, S., Y. Gwack, M. Prakriya, S. Srikanth, S. H. Puppel, B. Tanasa, P. G.
Hogan, R. S. Lewis, M. Daly, and A. Rao. 2006. A mutation in Orai1 causes immune deficiency by abrogating CRAC channel function. Nature 441:179-185.
54. Cahalan, M. D. 2009. STIMulating store-operated Ca(2+) entry. Nat Cell Biol
11:669-677. 55. Hogan, P. G., L. Chen, J. Nardone, and A. Rao. 2003. Transcriptional regulation
by calcium, calcineurin, and NFAT. Genes Dev 17:2205-2232. 56. Rao, A. 1994. NF-ATp: a transcription factor required for the co-ordinate
induction of several cytokine genes. Immunol Today 15:274-281. 57. Vandenberghe, P. A., and J. L. Ceuppens. 1990. Flow cytometric measurement of
cytoplasmic free calcium in human peripheral blood T lymphocytes with fluo-3, a new fluorescent calcium indicator. J Immunol Methods 127:197-205.
58. Delon, J., N. Bercovici, R. Liblau, and A. Trautmann. 1998. Imaging antigen
recognition by naive CD4+ T cells: compulsory cytoskeletal alterations for the triggering of an intracellular calcium response. Eur J Immunol 28:716-729.
59. Isakov, N., and A. Altman. 2002. Protein kinase C(theta) in T cell activation.
Annu Rev Immunol 20:761-794.
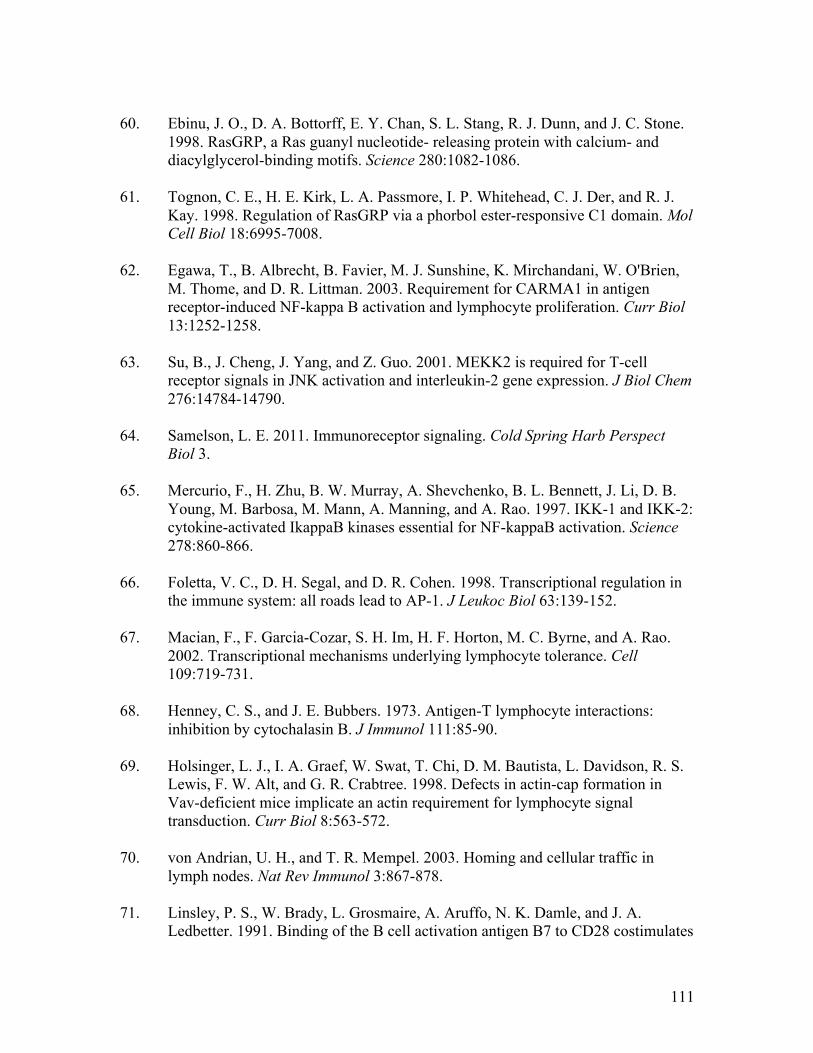
111
60. Ebinu, J. O., D. A. Bottorff, E. Y. Chan, S. L. Stang, R. J. Dunn, and J. C. Stone.
1998. RasGRP, a Ras guanyl nucleotide- releasing protein with calcium- and diacylglycerol-binding motifs. Science 280:1082-1086.
61. Tognon, C. E., H. E. Kirk, L. A. Passmore, I. P. Whitehead, C. J. Der, and R. J.
Kay. 1998. Regulation of RasGRP via a phorbol ester-responsive C1 domain. Mol Cell Biol 18:6995-7008.
62. Egawa, T., B. Albrecht, B. Favier, M. J. Sunshine, K. Mirchandani, W. O'Brien,
M. Thome, and D. R. Littman. 2003. Requirement for CARMA1 in antigen receptor-induced NF-kappa B activation and lymphocyte proliferation. Curr Biol 13:1252-1258.
63. Su, B., J. Cheng, J. Yang, and Z. Guo. 2001. MEKK2 is required for T-cell
receptor signals in JNK activation and interleukin-2 gene expression. J Biol Chem 276:14784-14790.
64. Samelson, L. E. 2011. Immunoreceptor signaling. Cold Spring Harb Perspect
Biol 3. 65. Mercurio, F., H. Zhu, B. W. Murray, A. Shevchenko, B. L. Bennett, J. Li, D. B.
Young, M. Barbosa, M. Mann, A. Manning, and A. Rao. 1997. IKK-1 and IKK-2: cytokine-activated IkappaB kinases essential for NF-kappaB activation. Science 278:860-866.
66. Foletta, V. C., D. H. Segal, and D. R. Cohen. 1998. Transcriptional regulation in
the immune system: all roads lead to AP-1. J Leukoc Biol 63:139-152. 67. Macian, F., F. Garcia-Cozar, S. H. Im, H. F. Horton, M. C. Byrne, and A. Rao.
2002. Transcriptional mechanisms underlying lymphocyte tolerance. Cell 109:719-731.
68. Henney, C. S., and J. E. Bubbers. 1973. Antigen-T lymphocyte interactions:
inhibition by cytochalasin B. J Immunol 111:85-90. 69. Holsinger, L. J., I. A. Graef, W. Swat, T. Chi, D. M. Bautista, L. Davidson, R. S.
Lewis, F. W. Alt, and G. R. Crabtree. 1998. Defects in actin-cap formation in Vav-deficient mice implicate an actin requirement for lymphocyte signal transduction. Curr Biol 8:563-572.
70. von Andrian, U. H., and T. R. Mempel. 2003. Homing and cellular traffic in
lymph nodes. Nat Rev Immunol 3:867-878. 71. Linsley, P. S., W. Brady, L. Grosmaire, A. Aruffo, N. K. Damle, and J. A.
Ledbetter. 1991. Binding of the B cell activation antigen B7 to CD28 costimulates
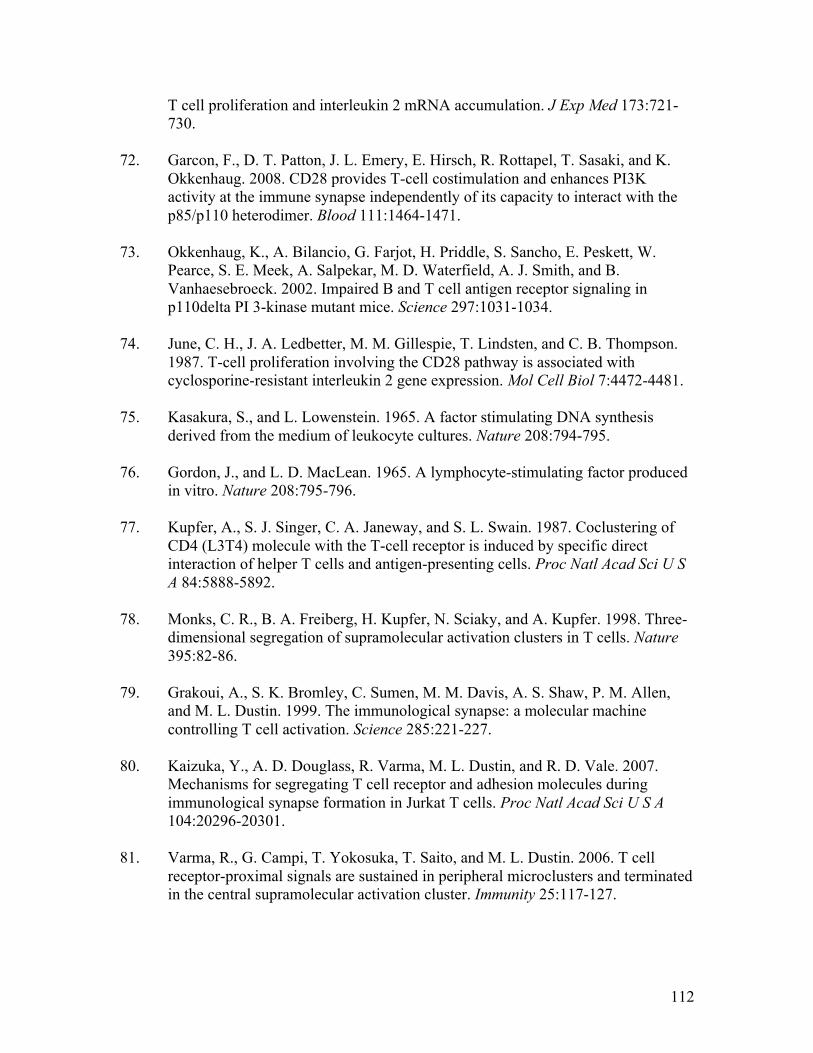
112
T cell proliferation and interleukin 2 mRNA accumulation. J Exp Med 173:721-730.
72. Garcon, F., D. T. Patton, J. L. Emery, E. Hirsch, R. Rottapel, T. Sasaki, and K.
Okkenhaug. 2008. CD28 provides T-cell costimulation and enhances PI3K activity at the immune synapse independently of its capacity to interact with the p85/p110 heterodimer. Blood 111:1464-1471.
73. Okkenhaug, K., A. Bilancio, G. Farjot, H. Priddle, S. Sancho, E. Peskett, W.
Pearce, S. E. Meek, A. Salpekar, M. D. Waterfield, A. J. Smith, and B. Vanhaesebroeck. 2002. Impaired B and T cell antigen receptor signaling in p110delta PI 3-kinase mutant mice. Science 297:1031-1034.
74. June, C. H., J. A. Ledbetter, M. M. Gillespie, T. Lindsten, and C. B. Thompson.
1987. T-cell proliferation involving the CD28 pathway is associated with cyclosporine-resistant interleukin 2 gene expression. Mol Cell Biol 7:4472-4481.
75. Kasakura, S., and L. Lowenstein. 1965. A factor stimulating DNA synthesis
derived from the medium of leukocyte cultures. Nature 208:794-795. 76. Gordon, J., and L. D. MacLean. 1965. A lymphocyte-stimulating factor produced
in vitro. Nature 208:795-796. 77. Kupfer, A., S. J. Singer, C. A. Janeway, and S. L. Swain. 1987. Coclustering of
CD4 (L3T4) molecule with the T-cell receptor is induced by specific direct interaction of helper T cells and antigen-presenting cells. Proc Natl Acad Sci U S A 84:5888-5892.
78. Monks, C. R., B. A. Freiberg, H. Kupfer, N. Sciaky, and A. Kupfer. 1998. Three-
dimensional segregation of supramolecular activation clusters in T cells. Nature 395:82-86.
79. Grakoui, A., S. K. Bromley, C. Sumen, M. M. Davis, A. S. Shaw, P. M. Allen,
and M. L. Dustin. 1999. The immunological synapse: a molecular machine controlling T cell activation. Science 285:221-227.
80. Kaizuka, Y., A. D. Douglass, R. Varma, M. L. Dustin, and R. D. Vale. 2007.
Mechanisms for segregating T cell receptor and adhesion molecules during immunological synapse formation in Jurkat T cells. Proc Natl Acad Sci U S A 104:20296-20301.
81. Varma, R., G. Campi, T. Yokosuka, T. Saito, and M. L. Dustin. 2006. T cell
receptor-proximal signals are sustained in peripheral microclusters and terminated in the central supramolecular activation cluster. Immunity 25:117-127.
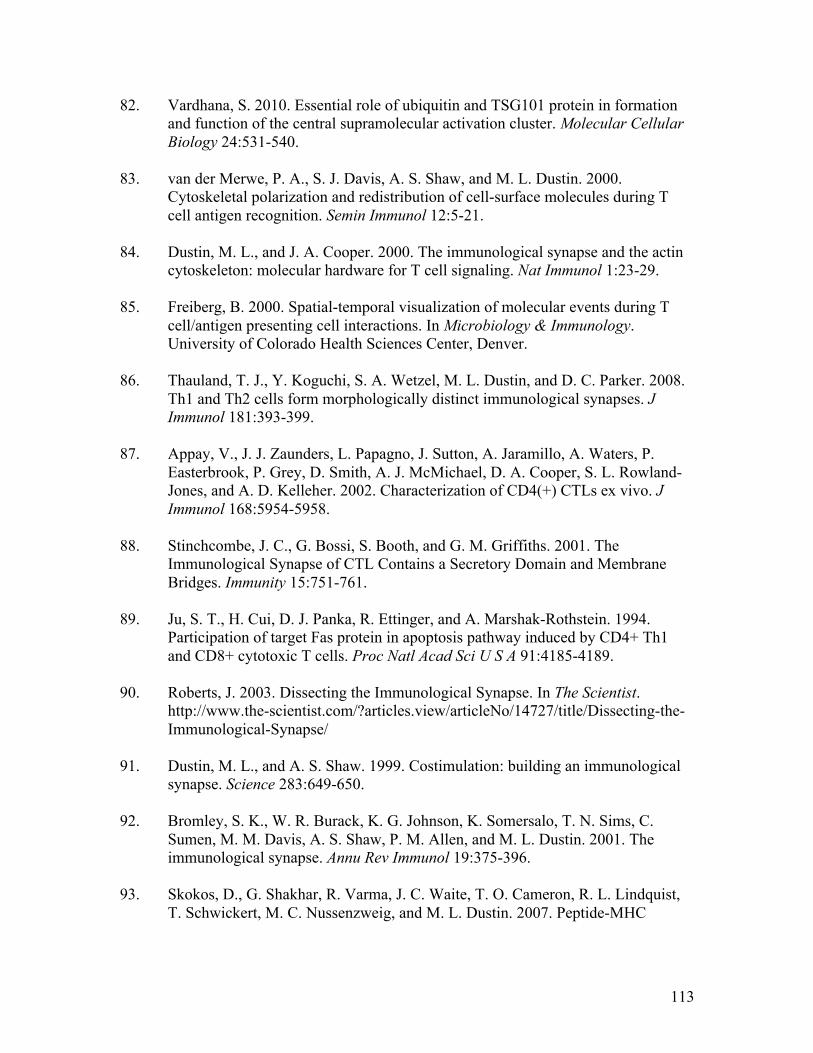
113
82. Vardhana, S. 2010. Essential role of ubiquitin and TSG101 protein in formation and function of the central supramolecular activation cluster. Molecular Cellular Biology 24:531-540.
83. van der Merwe, P. A., S. J. Davis, A. S. Shaw, and M. L. Dustin. 2000.
Cytoskeletal polarization and redistribution of cell-surface molecules during T cell antigen recognition. Semin Immunol 12:5-21.
84. Dustin, M. L., and J. A. Cooper. 2000. The immunological synapse and the actin
cytoskeleton: molecular hardware for T cell signaling. Nat Immunol 1:23-29. 85. Freiberg, B. 2000. Spatial-temporal visualization of molecular events during T
cell/antigen presenting cell interactions. In Microbiology & Immunology. University of Colorado Health Sciences Center, Denver.
86. Thauland, T. J., Y. Koguchi, S. A. Wetzel, M. L. Dustin, and D. C. Parker. 2008.
Th1 and Th2 cells form morphologically distinct immunological synapses. J Immunol 181:393-399.
87. Appay, V., J. J. Zaunders, L. Papagno, J. Sutton, A. Jaramillo, A. Waters, P.
Easterbrook, P. Grey, D. Smith, A. J. McMichael, D. A. Cooper, S. L. Rowland-Jones, and A. D. Kelleher. 2002. Characterization of CD4(+) CTLs ex vivo. J Immunol 168:5954-5958.
88. Stinchcombe, J. C., G. Bossi, S. Booth, and G. M. Griffiths. 2001. The
Immunological Synapse of CTL Contains a Secretory Domain and Membrane Bridges. Immunity 15:751-761.
89. Ju, S. T., H. Cui, D. J. Panka, R. Ettinger, and A. Marshak-Rothstein. 1994.
Participation of target Fas protein in apoptosis pathway induced by CD4+ Th1 and CD8+ cytotoxic T cells. Proc Natl Acad Sci U S A 91:4185-4189.
90. Roberts, J. 2003. Dissecting the Immunological Synapse. In The Scientist.
http://www.the-scientist.com/?articles.view/articleNo/14727/title/Dissecting-the-Immunological-Synapse/
91. Dustin, M. L., and A. S. Shaw. 1999. Costimulation: building an immunological
synapse. Science 283:649-650. 92. Bromley, S. K., W. R. Burack, K. G. Johnson, K. Somersalo, T. N. Sims, C.
Sumen, M. M. Davis, A. S. Shaw, P. M. Allen, and M. L. Dustin. 2001. The immunological synapse. Annu Rev Immunol 19:375-396.
93. Skokos, D., G. Shakhar, R. Varma, J. C. Waite, T. O. Cameron, R. L. Lindquist,
T. Schwickert, M. C. Nussenzweig, and M. L. Dustin. 2007. Peptide-MHC
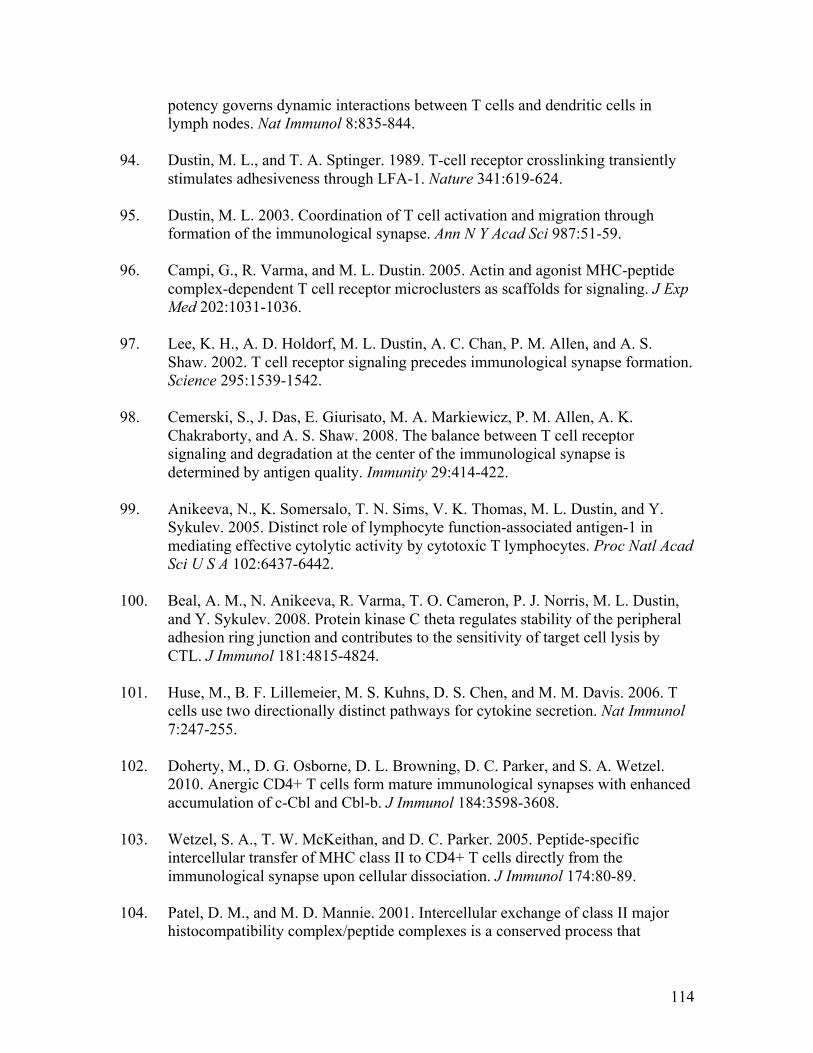
114
potency governs dynamic interactions between T cells and dendritic cells in lymph nodes. Nat Immunol 8:835-844.
94. Dustin, M. L., and T. A. Sptinger. 1989. T-cell receptor crosslinking transiently
stimulates adhesiveness through LFA-1. Nature 341:619-624. 95. Dustin, M. L. 2003. Coordination of T cell activation and migration through
formation of the immunological synapse. Ann N Y Acad Sci 987:51-59. 96. Campi, G., R. Varma, and M. L. Dustin. 2005. Actin and agonist MHC-peptide
complex-dependent T cell receptor microclusters as scaffolds for signaling. J Exp Med 202:1031-1036.
97. Lee, K. H., A. D. Holdorf, M. L. Dustin, A. C. Chan, P. M. Allen, and A. S.
Shaw. 2002. T cell receptor signaling precedes immunological synapse formation. Science 295:1539-1542.
98. Cemerski, S., J. Das, E. Giurisato, M. A. Markiewicz, P. M. Allen, A. K.
Chakraborty, and A. S. Shaw. 2008. The balance between T cell receptor signaling and degradation at the center of the immunological synapse is determined by antigen quality. Immunity 29:414-422.
99. Anikeeva, N., K. Somersalo, T. N. Sims, V. K. Thomas, M. L. Dustin, and Y.
Sykulev. 2005. Distinct role of lymphocyte function-associated antigen-1 in mediating effective cytolytic activity by cytotoxic T lymphocytes. Proc Natl Acad Sci U S A 102:6437-6442.
100. Beal, A. M., N. Anikeeva, R. Varma, T. O. Cameron, P. J. Norris, M. L. Dustin,
and Y. Sykulev. 2008. Protein kinase C theta regulates stability of the peripheral adhesion ring junction and contributes to the sensitivity of target cell lysis by CTL. J Immunol 181:4815-4824.
101. Huse, M., B. F. Lillemeier, M. S. Kuhns, D. S. Chen, and M. M. Davis. 2006. T
cells use two directionally distinct pathways for cytokine secretion. Nat Immunol 7:247-255.
102. Doherty, M., D. G. Osborne, D. L. Browning, D. C. Parker, and S. A. Wetzel.
2010. Anergic CD4+ T cells form mature immunological synapses with enhanced accumulation of c-Cbl and Cbl-b. J Immunol 184:3598-3608.
103. Wetzel, S. A., T. W. McKeithan, and D. C. Parker. 2005. Peptide-specific
intercellular transfer of MHC class II to CD4+ T cells directly from the immunological synapse upon cellular dissociation. J Immunol 174:80-89.
104. Patel, D. M., and M. D. Mannie. 2001. Intercellular exchange of class II major
histocompatibility complex/peptide complexes is a conserved process that
115
requires activation of T cells but is constitutive in other types of antigen presenting cell. Cell Immunol 214:165-172.
105. Huang, J. F., Y. Yang, H. Sepulveda, W. Shi, I. Hwang, P. A. Peterson, M. R.
Jackson, J. Sprent, and Z. Cai. 1999. TCR-Mediated internalization of peptide-MHC complexes acquired by T cells. Science 286:952-954.
106. Hwang, I., J. F. Huang, H. Kishimoto, A. Brunmark, P. A. Peterson, M. R.
Jackson, C. D. Surh, Z. Cai, and J. Sprent. 2000. T cells can use either T cell receptor or CD28 receptors to absorb and internalize cell surface molecules derived from antigen-presenting cells. J Exp Med 191:1137-1148.
107. Hudrisier, D., J. Riond, H. Mazarguil, J. E. Gairin, and E. Joly. 2001. CTLs
rapidly capture membrane fragments from target cells in a TCR signaling-dependent manner. J Immunol 166:3645-3649.
108. Joly, E., and D. Hudrisier. 2003. What is trogocytosis and what is its purpose? Nat
Immunol 4:815. 109. Marciano-Cabral, F., K. L. Zoghby, and S. G. Bradley. 1990. Cytopathic action of
Naegleria fowleri amoebae on rat neuroblastoma target cells. J Protozool 37:138-144.
110. Brown, T. 1979. Observations by immunofluorescence microscopy and electron
microscopy on the cytopathogenicity of Naegleria fowleri in mouse embryo-cell cultures. J Med Microbiol 12:363-371.
111. Daubeuf, S., A. Aucher, C. Bordier, A. Salles, L. Serre, G. Gaibelet, J. C. Faye,
G. Favre, E. Joly, and D. Hudrisier. 2010. Preferential transfer of certain plasma membrane proteins onto T and B cells by trogocytosis. PLoS One 5:e8716.
112. Hudson, L., J. Sprent, J. F. Miller, and J. H. Playfair. 1974. B cell-derived
immunoglobulin on activated mouse T lymphocytes. Nature 251:60-62. 113. Lorber, M. I., M. R. Loken, A. M. Stall, and F. W. Fitch. 1982. I-A antigens on
cloned alloreactive murine T lymphocytes are acquired passively. J Immunol 128:2798-2803.
114. Nepom, J. T., B. Benacerraf, and R. N. Germain. 1981. Acquisition of syngeneic
I-A determinants by T cells proliferating in response to poly (Gly60Ala30, Tyr10). J Immunol 127:888-892.
115. Sharrow, S. O., B. J. Mathieson, and A. Singer. 1981. Cell surface appearance of
unexpected host MHC determinants on thymocytes from radiation bone marrow chimeras. J Immunol 126:1327-1335.
116
116. Mannie, M. D., S. K. Rendall, P. Y. Arnold, J. P. Nardella, and G. A. White. 1996. Anergy-associated T cell antigen presentation. A mechanism of infectious tolerance in experimental autoimmune encephalomyelitis. J Immunol 157:1062-1070.
117. Arnold, P. Y., D. K. Davidian, and M. D. Mannie. 1997. Antigen Presentation by
T cells: T cell receptor ligation promotes antigen acquisition from professional antigen-presenting cells. European Journal of Immunology 27:3198-3205.
118. Arnold, P. Y., and M. D. Mannie. 1999. Vesicles bearing MHC class II molecules
mediate transfer of antigen from antigen-presenting cells to CD4+ T cells. Eur J Immunol 29:1363-1373.
119. Patel, D. M., P. Y. Arnold, G. A. White, J. P. Nardella, and M. D. Mannie. 1999.
Class II MHC/peptide complexes are released from APC and are acquired by T cell responders during specific antigen recognition. J Immunol 163:5201-5210.
120. Patel, D. M., R. W. Dudek, and M. D. Mannie. 2001. Intercellular exchange of
class II MHC complexes: ultrastructural localization and functional presentation of adsorbed I-A/peptide complexes. Cell Immunol 214:21-34.
121. Walker, M. R., and M. D. Mannie. 2002. Acquisition of functional MHC class
II/peptide complexes by T cells during thymic development and CNS-directed pathogenesis. Cell Immunol 218:13-25.
122. Hwang, I., and J. Sprent. 2001. Role of actin cytoskeleton in T cell absorption and
internalization of ligands from APC. J Immunol 166:5099-5107. 123. Espinosa, E., J. Tabiasco, D. Hudrisier, and J. J. Fournie. 2002. Synaptic transfer
by human gamma delta T cells stimulated with soluble or cellular antigens. J Immunol 168:6336-6343.
124. Hudrisier, D., and P. Bongrand. 2002. Intercellular transfer of antigen-presenting
cell determinants onto T cells: molecular mechanisms and biological significance. Faseb J 16:477-486.
125. Hudrisier, D., J. Riond, L. Garidou, C. Duthoit, and E. Joly. 2005. T cell
activation correlates with an increased proportion of antigen among the materials acquired from target cells. Eur J Immunol 35:2284-2294.
126. Hudrisier, D., A. Aucher, A. L. Puaux, C. Bordier, and E. Joly. 2007. Capture of
target cell membrane components via trogocytosis is triggered by a selected set of surface molecules on T or B cells. J Immunol 178:3637-3647.
117
127. Riond, J., J. Elhmouzi, D. Hudrisier, and J. E. Gairin. 2007. Capture of membrane components via trogocytosis occurs in vivo during both dendritic cells and target cells encounter by CD8(+) T cells. Scand J Immunol 66:441-450.
128. Daubeuf, S., M. A. Lindorfer, R. P. Taylor, E. Joly, and D. Hudrisier. 2010. The
direction of plasma membrane exchange between lymphocytes and accessory cells by trogocytosis is influenced by the nature of the accessory cell. J Immunol 184:1897-1908.
129. Aucher, A., E. Magdeleine, E. Joly, and D. Hudrisier. 2008. Capture of plasma
membrane fragments from target cells by trogocytosis requires signaling in T cells but not in B cells. Blood.
130. Sabzevari, H., J. Kantor, A. Jaigirdar, Y. Tagaya, M. Naramura, J. Hodge, J.
Bernon, and J. Schlom. 2001. Acquisition of CD80 (B7-1) by T cells. J Immunol 166:2505-2513.
131. Batista, F. D., and M. S. Neuberger. 2000. B cells extract and present
immobilized antigen: implications for affinity discrimination. Embo J 19:513-520. 132. Batista, F. D., D. Iber, and M. S. Neuberger. 2001. B cells acquire antigen from
target cells after synapse formation. Nature 411:489 - 494. 133. Herrera, O. B., D. Golshayan, R. Tibbott, F. Salcido Ochoa, M. J. James, F. M.
Marelli-Berg, and R. I. Lechler. 2004. A novel pathway of alloantigen presentation by dendritic cells. J Immunol 173:4828-4837.
134. Russo, V., D. Zhou, C. Sartirana, P. Rovere, A. Villa, S. Rossini, C. Traversari,
and C. Bordignon. 2000. Acquisition of intact allogeneic human leukocyte antigen molecules by human dendritic cells. Blood 95:3473-3477.
135. Carlin, L. M., K. Eleme, F. E. McCann, and D. M. Davis. 2001. Intercellular
transfer and supramolecular organization of human leukocyte antigen C at inhibitory natural killer cell immune synapses. J Exp Med 194:1507-1517.
136. Sjöström, A., M. Eriksson, C. Cerboni, M. H. Johansson, C. L. Sentman, K.
Karre, and P. Hoglund. 2001. Acquisition of external major histocompatibility complex class I molecules by natural killer cells expressing inhibitory Ly49 receptors. J Exp Med 194:1519-1530.
137. Tabiasco, J., E. Espinosa, D. Hudrisier, E. Joly, J. J. Fournie, and A. Vercellone.
2002. Active trans-synaptic capture of membrane fragments by natural killer cells. Eur J Immunol 32:1502-1508.
118
138. Zimmer, J., V. Ioannidis, and W. Held. 2001. H-2D Ligand Expression by Ly49A+ Natural Killer (NK) Cells Precludes Ligand Uptake from Environmental Cells: Implications for NK Cell Function. J Exp Med 194:1531-1539.
139. Harshyne, L. A., S. C. Watkins, A. Gambotto, and S. M. Barratt-Boyes. 2001.
Dendritic cells acquire antigens from live cells for cross-presentation to CTL. J Immunol 166:3717-3723.
140. Zhang, Q. J., X. L. Li, D. Wang, X. C. Huang, J. M. Mathis, W. M. Duan, D.
Knight, R. Shi, J. Glass, D. Q. Zhang, L. Eisenbach, and W. A. Jefferies. 2008. Trogocytosis of MHC-I/peptide complexes derived from tumors and infected cells enhances dendritic cell cross-priming and promotes adaptive T cell responses. PLoS One 3:e3097.
141. Roda-Navarro, P., and H. T. Reyburn. 2007. Intercellular protein transfer at the
NK cell immune synapse: mechanisms and physiological significance. FASEB J 21:1636-1646.
142. Tatari-Calderone, Z., R. T. Semnani, T. B. Nutman, J. Schlom, and H. Sabzevari.
2002. Acquisition of CD80 by human T cells at early stages of activation: functional involvement of CD80 acquisition in T cell to T cell interaction. J Immunol 169:6162-6169.
143. Baba, E., Y. Takahashi, J. Lichtenfeld, R. Tanaka, A. Yoshida, K. Sugamura, N.
Yamamoto, and Y. Tanaka. 2001. Functional CD4 T cells after intercellular molecular transfer of 0X40 ligand. J Immunol 167:875-883.
144. Gary, R., S. Voelkl, R. Palmisano, E. Ullrich, J. J. Bosch, and A. Mackensen.
2012. Antigen-specific transfer of functional programmed death ligand 1 from human APCs onto CD8+ T cells via trogocytosis. J Immunol 188:744-752.
145. Game, D. S., N. J. Rogers, and R. I. Lechler. 2005. Acquisition of HLA-DR and
costimulatory molecules by T cells from allogeneic antigen presenting cells. Am J Transplant 5:1614-1625.
146. Tsang, J. Y. S., J. C. Chai, and R. Lechler. 2003. Antigen Presentation by mouse
CD4+ T cells involving acquired MHC class II:peptide complexes: another mechanism to limit clonal expansion. Blood 101:2704-2710.
147. Xiang, J., H. Huang, and Y. Liu. 2005. A new dynamic model of CD8+ T effector
cell responses via CD4+ T helper-antigen-presenting cells. J Immunol 174:7497-7505.
148. Daubeuf, S., M. A. Lindorfer, R. P. Taylor, E. Joly, and D. Hudrisier. 2010. The
Direction of Plasma Membrane Exchange between Lymphocytes and Accessory
119
Cells by Trogocytosis Is Influenced by the Nature of the Accessory Cell. J Immunol 184:1897-1908.
149. Kedl, R. M., B. C. Schaefer, J. W. Kappler, and P. Marrack. 2002. T cells down-
modulate peptide-MHC complexes on APCs in vivo. Nat Immunol 3:27-32. 150. Wülfing, C., C. Sumen, M. D. Sjaastad, L. C. Wu, M. L. Dustin, and M. M.
Davis. 2002. Costimulation and endogenous MHC ligands contribute to T cell recognition. Nat Immunol 3:42-47.
151. Krummel, M. F., M. D. Sjaastad, C. Wülfing, and M. M. Davis. 2000. Differential
clustering of CD4 and CD3ζ during T cell recognition. Science 289:1349-1352. 152. Nagy, Z., B. E. Elliott, M. Nabholtz, P. H. Krammer, and B. Pernis. 1976.
Specific binding of alloantigens to T cells activated in the mixed lymphocyte reaction. Journal of Experimental Medicine 143:648-658.
153. Hayball, J. D., B. W. Robinson, and R. A. Lake. 2004. CD4+ T cells cross-
compete for MHC class II-restricted peptide antigen complexes on the surface of antigen presenting cells. Immunol Cell Biol 82:103-111.
154. Lee, K. H., A. R. Dinner, C. Tu, G. Campi, S. Raychaudhuri, R. Varma, T. N.
Sims, W. R. Burack, H. Wu, J. Wang, O. Kanagawa, M. Markiewicz, P. M. Allen, M. L. Dustin, A. K. Chakraborty, and A. S. Shaw. 2003. The immunological synapse balances T cell receptor signaling and degradation. Science 302:1218-1222.
155. Dopfer, E. P., S. Minguet, and W. W. Schamel. 2011. A new vampire saga: the
molecular mechanism of T cell trogocytosis. Immunity 35:151-153. 156. Shi, M., S. Hao, T. Chan, and J. Xiang. 2006. CD4(+) T cells stimulate memory
CD8(+) T cell expansion via acquired pMHC I complexes and costimulatory molecules, and IL-2 secretion. J Leukoc Biol 80:1354-1363.
157. Umeshappa, C. S., H. Huang, Y. Xie, Y. Wei, S. J. Mulligan, Y. Deng, and J.
Xiang. 2009. CD4+ Th-APC with acquired peptide/MHC class I and II complexes stimulate type 1 helper CD4+ and central memory CD8+ T cell responses. J Immunol 182:193-206.
158. Helft, J., A. Jacquet, N. T. Joncker, I. Grandjean, G. Dorothee, A. Kissenpfennig,
B. Malissen, P. Matzinger, and O. Lantz. 2008. Antigen-specific T-T interactions regulate CD4 T-cell expansion. Blood 112:1249-1258.
159. Zhou, G., Z. C. Ding, J. Fu, and H. I. Levitsky. 2011. Presentation of acquired
peptide-MHC class II ligands by CD4+ regulatory T cells or helper cells
120
differentially regulates antigen-specific CD4+ T cell response. J Immunol 186:2148-2155.
160. Choi, E. Y., K. C. Jung, H. J. Park, D. H. Chung, J. S. Song, S. D. Yang, E.
Simpson, and S. H. Park. 2005. Thymocyte-thymocyte interaction for efficient positive selection and maturation of CD4 T cells. Immunity 23:387-396.
161. Zhou, J., Y. Tagaya, R. Tolouei-Semnani, J. Schlom, and H. Sabzevari. 2005.
Physiological relevance of antigen presentasome (APS), an acquired MHC/costimulatory complex, in the sustained activation of CD4+ T cells in the absence of APCs. Blood 105:3238-3246.
162. Su, M. W., P. R. Walden, D. B. Golan, and H. N. Eisen. 1993. Cognate peptide-
induced destruction of CD8+ cytotoxic T lymphocytes is due to fratricide. J Immunol 151:658-667.
163. Mannie, M. D., and M. S. Norris. 2001. MHC class-II-restricted antigen
presentation by myelin basic protein-specific CD4+ T cells causes prolonged desensitization and outgrowth of CD4- responders. Cell Immunol 212:51-62.
164. Chai, J. G., I. Bartok, D. Scott, J. Dyson, and R. Lechler. 1998. T:T antigen
presentation by activated murine CD8+ T cells induces anergy and apoptosis. J Immunol 160:3655-3665.
165. Pichler, W. J., and T. Wyss-Coray. 1994. T cells as antigen-presenting cells.
Immunol Today 15:312-315. 166. Lanzavecchia, A., E. Roosnek, T. Gregory, P. Berman, and S. Abrignani. 1988. T
cells can present antigens such as HIV gp120 targeted to their own surface molecules. Nature 334:530-532.
167. Hewitt, C. R., and M. Feldmann. 1989. Human T cell clones present antigen. J
Immunol 143:762-769. 168. Siliciano, R. F., T. Lawton, C. Knall, R. W. Karr, P. Berman, T. Gregory, and E.
L. Reinherz. 1988. Analysis of host-virus interactions in AIDS with anti-gp120 T cell clones: effect of HIV sequence variation and a mechanism for CD4+ cell depletion. Cell 54:561-575.
169. Wyss-Coray, T., C. Brander, K. Frutig, and W. J. Pichler. 1992. Discrimination of
human CD4 T cell clones based on their reactivity with antigen-presenting T cells. Eur J Immunol 22:2295-2302.
170. Wyss-Coray, T., C. Brander, F. Bettens, D. Mijic, and W. J. Pichler. 1992. Use of
antibody/peptide constructs of direct antigenic peptides to T cells: evidence for T cell processing and presentation. Cell Immunol 139:268-273.
121
171. LaSalle, J. M., P. J. Tolentino, G. J. Freeman, L. M. Nadler, and D. A. Hafler.
1992. Early signaling defects in human T cells anergized by T cell presentation of autoantigen. J Exp Med 176:177-186.
172. Barnaba, V., C. Watts, M. de Boer, P. Lane, and A. Lanzavecchia. 1994.
Professional presentation of antigen by activated human T cells. Eur J Immunol 24:71-75.
173. Nakada, M., K. Nishizaki, T. Yoshino, M. Okano, T. Yamamoto, Y. Masuda, N.
Ohta, and T. Akagi. 1999. CD80 (B7-1) and CD86 (B7-2) antigens on house dust mite-specific T cells in atopic disease function through T-T cell interactions. J Allergy Clin Immunol 104:222-227.
174. Sidhu, S., S. Deacock, V. Bal, J. R. Batchelor, G. Lombardi, and R. I. Lechler.
1992. Human T cells cannot act as autonomous antigen-presenting cells, but induce tolerance in antigen-specific and alloreactive responder cells. J Exp Med 176:875-880.
175. Benoist, C., and D. Mathis. 1990. Regulation of major histocompatibility complex
class-II genes: X, Y and other letters of the alphabet. Annu Rev Immunol 8:681-715.
176. Mostbock, S., M. Catalfamo, Y. Tagaya, J. Schlom, and H. Sabzevari. 2007.
Acquisition of antigen presentasome (APS), an MHC/costimulatory complex, is a checkpoint of memory T-cell homeostasis. Blood 109:2488-2495.
177. Kennedy, R., A. H. Undale, W. C. Kieper, M. S. Block, L. R. Pease, and E. Celis.
2005. Direct Cross-Priming by Th Lymphocytes Generates Memory Cytotoxic Responses. Journal of Immunology 174:3967-3977.
178. Cox, J. H., A. J. McMichael, G. R. Screaton, and X. N. Xu. 2007. CTLs target Th
cells that acquire bystander MHC class I-peptide complex from APCs. J Immunol 179:830-836.
179. Lombardi, G., R. Hargreaves, S. Sidhu, N. Imami, L. Lightstone, S. Fuller-Espie,
M. Ritter, P. Robinson, A. Tarnok, and R. Lechler. 1996. Antigen presentation by T cells inhibits IL-2 production and induces IL-4 release due to altered cognate signals. J Immunol 156:2769-2775.
180. Rachmilewitz, J., and A. Lanzavecchia. 2002. A temporal and spatial summation
model for T-cell activation: signal integration and antigen decoding. Trends Immunol 23:592-595.
181. Gunzer, M., A. Schafer, S. Borgmann, S. Grabbe, K. S. Zanker, E. B. Brocker, E.
Kampgen, and P. Friedl. 2000. Antigen presentation in extracellular matrix:
122
interactions of T cells with dendritic cells are dynamic, short lived, and sequential. Immunity 13:323-332.
182. Underhill, D. M., M. Bassetti, A. Rudensky, and A. Aderem. 1999. Dynamic
interactions of macrophages with T cells during antigen presentation. J Exp Med 190:1909-1914.
183. Kaye, J., N. J. Vasquez, and S. M. Hedrick. 1992. Involvement of the same region
of the T cell antigen receptor in thymic selection and foreign peptide recognition. J Immunol 148:3342-3353.
184. Wetzel, S. A., T. W. McKeithan, and D. C. Parker. 2002. Live-cell dynamics and
the role of costimulation in immunological synapse formation. J Immunol 169:6092-6101.
185. Chow, S., D. Hedley, P. Grom, R. Magari, J. W. Jacobberger, and T. V. Shankey.
2005. Whole blood fixation and permeabilization protocol with red blood cell lysis for flow cytometry of intracellular phosphorylated epitopes in leukocyte subpopulations. Cytometry A 67:4-17.
186. Bolte, S., and F. P. Cordeliéres. 2006. A guided tour into subcellular
colocalization analysis in light microscopy. J Microsc 224:213-224. 187. Rasband, W. S. 1997-2009. ImageJ. National Institues of
Health:http://rsb.info.nih.gov/ij/. 188. Faroudi, M., R. Zaru, P. Paulet, S. Muller, and S. Valitutti. 2003. Cutting edge: T
lymphocyte activation by repeated immunological synapse formation and intermittent signaling. J Immunol 171:1128-1132.
189. Hanke, J. H., J. P. Gardner, R. L. Dow, P. S. Changelian, W. H. Brissette, E. J.
Weringer, B. A. Pollok, and P. A. Connelly. 1996. Discovery of a novel, potent, and Src family-selective tyrosine kinase inhibitor. Study of Lck- and FynT-dependent T cell activation. J Biol Chem 271:695-701.
190. Umeshappa, C. S., and J. Xiang. 2010. Tumor-derived HLA-G1 acquisition by
monocytes through trogocytosis: possible functional consequences. Cell Mol Life Sci 67:4107-4108.
191. Lo, W. L., N. J. Felix, J. J. Walters, H. Rohrs, M. L. Gross, and P. M. Allen.
2009. An endogenous peptide positively selects and augments the activation and survival of peripheral CD4+ T cells. Nat Immunol 10:1155-1161.
192. Osborne, D. G., and S. A. Wetzel. 2012. Trogocytosis Results in Sustained
Intracellular Signaling in CD4+ T Cells. J Immunol 189:4728-4739.
123
193. van Oers, N. S., N. Killeen, and A. Weiss. 1996. Lck regulates the tyrosine phosphorylation of the T cell receptor subunits and ZAP-70 in murine thymocytes. J Exp Med 183:1053-1062.
194. Perez, O. D., and G. P. Nolan. 2006. Phospho-proteomic immune analysis by flow
cytrometry: from mechanism to translational medicine at the single-cell level. Immunological Reviews 210:208-228.
195. Huppa, J. B., and M. M. Davis. 2003. T-cell-antigen recognition and the
immunological synapse. Nat Rev Immunol 3:973-983. 196. Huppa, J. B., M. Gleimer, C. Sumen, and M. M. Davis. 2003. Continuous T cell
receptor signaling required for synapse maintenance and full effector potential. Nat Immunol 4:749-755.
197. Kupfer, A., and S. J. Singer. 1989. Cell biology of cytotoxic and helper T cell
functions: immunofluorescence microscopic studies of single cells and cell couples. Annu Rev Immunol 7:309-337.
198. Hwang, I., X. Shen, and J. Sprent. 2003. Direct stimulation of naive T cells by
membrane vesicles from antigen-presenting cells: distinct roles for CD54 and B7 molecules. Proc Natl Acad Sci U S A 100:6670-6675.
199. Sprent, J., and C. D. Surh. 2003. Cytokines and T cell homeostasis. Immunol Lett
85:145-149. 200. Sprent, J. 2005. Direct stimulation of naive T cells by antigen-presenting cell
vesicles. Blood Cells Mol Dis 35:17-20. 201. Kovar, M., O. Boyman, X. Shen, I. Hwang, R. Kohler, and J. Sprent. 2006. Direct
stimulation of T cells by membrane vesicles from antigen-presenting cells. Proc Natl Acad Sci U S A 103:11671-11676.
202. Rechavi, O., I. Goldstein, H. Vernitsky, B. Rotblat, and Y. Kloog. 2007.
Intercellular transfer of oncogenic H-Ras at the immunological synapse. PLoS One 2:e1204.
203. HoWangYin, K. Y., J. Caumartin, B. Favier, M. Daouya, L. Yaghi, E. D.
Carosella, and J. LeMaoult. 2011. Proper regrafting of Ig-like transcript 2 after trogocytosis allows a functional cell-cell transfer of sensitivity. J Immunol 186:2210-2218.
204. Adams, C. L., A. M. Grierson, A. M. Mowat, M. M. Harnett, and P. Garside.
2004. Differences in the kinetics, amplitude, and localization of ERK activation in anergy and priming revealed at the level of individual primary T cells by laser scanning cytometry. J Immunol 173:1579-1586.
124
205. Cullinan, P., A. I. Sperling, and J. K. Burkhardt. 2002. The distal pole complex: a
novel membrane domain distal to the immunological synapse. Immunol Rev 189:111-122.
206. Allenspach, E. J., P. Cullinan, J. Tong, Q. Tang, A. G. Tesciuba, J. L. Cannon, S.
M. Takahashi, R. Morgan, J. K. Burkhardt, and A. I. Sperling. 2001. ERM-dependent movement of CD43 defines a novel protein complex distal to the immunological synapse. Immunity 15:739-750.
207. Chang, J. T., V. R. Palanivel, I. Kinjyo, F. Schambach, A. M. Intlekofer, A.
Banerjee, S. A. Longworth, K. E. Vinup, P. Mrass, J. Oliaro, N. Killeen, J. S. Orange, S. M. Russell, W. Weninger, and S. L. Reiner. 2007. Asymmetric T lymphocyte division in the initiation of adaptive immune responses. Science 315:1687-1691.
208. Mempel, T. R., S. E. Henrickson, and U. H. von Adrian. 2004. T-cell priming by
dendritic cells in lymph nodes occurs in three distinct phases. Nature 427:154-159.
209. Madrenas, J., R. L. Wange, J. L. Wang, N. Isakov, L. E. Samelson, and R. N.
Germain. 1995. Zeta phosphorylation without ZAP-70 activation induced by TCR antagonists or partial agonists. Science 267:515-518.
210. Kersh, B. E., G. J. Kersh, and P. M. Allen. 1999. Partially phosphorylated T cell
receptor zeta molecules can inhibit T cell activation. J Exp Med 190:1627-1636. 211. Page, D. M., J. Alexander, K. Snoke, E. Appella, A. Sette, S. M. Hedrick, and H.
M. Grey. 1994. Negative selection of CD4+ CD8+ thymocytes by T-cell receptor peptide antagonists. Proceedings of the National Academy of Sciences of the United States of America 91:4057-4061.
212. Sorger, S. B., Y. Paterson, P. J. Fink, and S. M. Hedrick. 1990. T cell receptor
junctional regions and the MHC molecule affect the recognition of antigenic peptides by T cell clones. J Immunol 144:1127-1135.
213. Wang, R., Y. Wang-Zhu, C. R. Gabaglia, K. Kimachi, and H. M. Grey. 1999. The
stimulation of low-affinity, nontolerized clones by heteroclitic antigen analogues causes the breaking of tolerance established to an immunodominant T cell epitope. J Exp Med 190:983-994.

125
Related Documents