
Welcome message from author
This document is posted to help you gain knowledge. Please leave a comment to let me know what you think about it! Share it to your friends and learn new things together.
Transcript


biological and medical physics,biomedical engineering

biological and medical physics,biomedical engineeringThe fields of biological and medical physics and biomedical engineering are broad, multidisciplinary anddynamic. They lie at the crossroads of frontier research in physics, biology, chemistry, and medicine. TheBiological and Medical Physics, Biomedical Engineering Series is intended to be comprehensive, covering abroad range of topics important to the study of the physical, chemical and biological sciences. Its goal is toprovide scientists and engineers with textbooks, monographs, and reference works to address the growingneed for information.
Books in the series emphasize established and emergent areas of science including molecular, membrane,and mathematical biophysics; photosynthetic energy harvesting and conversion; information processing;physical principles of genetics; sensory communications; automata networks, neural networks, and cellularautomata. Equally important will be coverage of applied aspects of biological and medical physics andbiomedical engineering such as molecular electronic components and devices, biosensors, medicine, imaging,physical principles of renewable energy production, advanced prostheses, and environmental control andengineering.
Editor-in-Chief:Elias Greenbaum, Oak Ridge National Laboratory,Oak Ridge, Tennessee, USA
Editorial Board:Masuo Aizawa, Department of Bioengineering,Tokyo Institute of Technology, Yokohama, Japan
Olaf S. Andersen, Department of Physiology,Biophysics & Molecular Medicine,Cornell University, New York, USA
Robert H. Austin, Department of Physics,Princeton University, Princeton, New Jersey, USA
James Barber, Department of Biochemistry,Imperial College of Science, Technologyand Medicine, London, England
Howard C. Berg, Department of Molecularand Cellular Biology, Harvard University,Cambridge, Massachusetts, USA
Victor Bloomfield, Department of Biochemistry,University of Minnesota, St. Paul, Minnesota, USA
Robert Callender, Department of Biochemistry,Albert Einstein College of Medicine,Bronx, New York, USA
Britton Chance, Department of Biochemistry/Biophysics, University of Pennsylvania,Philadelphia, Pennsylvania, USA
Steven Chu, Department of Physics,Stanford University, Stanford, California, USA
Louis J. DeFelice, Department of Pharmacology,Vanderbilt University, Nashville, Tennessee, USA
Johann Deisenhofer, Howard Hughes MedicalInstitute, The University of Texas, Dallas,Texas, USA
George Feher, Department of Physics,University of California, San Diego, La Jolla,California, USA
Hans Frauenfelder, CNLS, MS B258,Los Alamos National Laboratory, Los Alamos,New Mexico, USA
Ivar Giaever, Rensselaer Polytechnic Institute,Troy, New York, USA
Sol M. Gruner, Department of Physics,Princeton University, Princeton, New Jersey, USA
Judith Herzfeld, Department of Chemistry,Brandeis University, Waltham, Massachusetts, USA
Pierre Joliot, Institute de BiologiePhysico-Chimique, Fondation Edmondde Rothschild, Paris, France
Lajos Keszthelyi, Institute of Biophysics, HungarianAcademy of Sciences, Szeged, Hungary
Robert S. Knox, Department of Physicsand Astronomy, University of Rochester, Rochester,New York, USA
Aaron Lewis, Department of Applied Physics,Hebrew University, Jerusalem, Israel
Stuart M. Lindsay, Department of Physicsand Astronomy, Arizona State University,Tempe, Arizona, USA
David Mauzerall, Rockefeller University,New York, New York, USA
Eugenie V. Mielczarek, Department of Physicsand Astronomy, George Mason University, Fairfax,Virginia, USA
Markolf Niemz, Klinikum Mannheim,Mannheim, Germany
V. Adrian Parsegian, Physical Science Laboratory,National Institutes of Health, Bethesda,Maryland, USA
Linda S. Powers, NCDMF: Electrical Engineering,Utah State University, Logan, Utah, USA
Earl W. Prohofsky, Department of Physics,Purdue University, West Lafayette, Indiana, USA
Andrew Rubin, Department of Biophysics, MoscowState University, Moscow, Russia
Michael Seibert, National Renewable EnergyLaboratory, Golden, Colorado, USA
David Thomas, Department of Biochemistry,University of Minnesota Medical School,Minneapolis, Minnesota, USA
Samuel J. Williamson, Department of Physics,New York University, New York, New York, USA

U.R. Muller D.V. Nicolau (Eds.)
Microarray Technologyand Its Applications
With 123 FiguresIncluding 16 Color Plates
123

Uwe R. Muller, Ph.D.V.P., Applied ScienceNanosphere, Inc.4088 Commercial AvenueNorthbrook, IL 60062USAe-mail: [email protected]
Prof. Dan V. NicolauSwinburne University of Technology533-545 Burwood Rd.Hawthorn, Victoria 3122Australiae-mail: [email protected]
Library of Congress Cataloging in Publication Data: 2004113284
ISSN 1618-7210
ISBN 3-540-22931-0 Springer Berlin Heidelberg New York
This work is subject to copyright. All rights are reserved, whether the whole orpart of thematerial is concerned,specifically the rights of translation, reprinting, reuse of illustrations, recitation, broadcasting, reproductionon microfilm or in any other way, and storage in data banks. Duplication of this publication or parts thereof ispermitted only under the provisions of the German Copyright Law of September 9, 1965, in its current version,and permission for use must always be obtained from Springer. Violations are liable to prosecution under theGerman Copyright Law.
Springer is a part of Springer Science+Business Media
springeronline.com
© Springer-Verlag Berlin Heidelberg 2005Printed in Germany
The use of general descriptive names, registered names, trademarks, etc. in this publication does not imply,even in the absence of a specific statement, that such names are exempt from the relevant protective laws andregulations and therefore free for general use.
Cover concept by eStudio Calamar Steinen
Typesetting by the authors using a Springer LATEX-macro packageCover production: design & production GmbH, HeidelbergProduction: LE-TEX Jelonek, Schmidt & Vöckler GbR, Leipzig
Printed on acid-free paper SPIN 10884448 57/3141/YL - 5 4 3 2 1 0
Preface
It has been stated that our knowledge doubles every 20 years, but that may bean understatement when considering the Life Sciences. A series of discoveriesand inventions have propelled our knowledge from the recognition that DNAis the genetic material to a basic molecular understanding of ourselves and theliving world around us in less than 50 years. Crucial to this rapid progress wasthe discovery of the double-helical structure of DNA, which laid the foundationfor all hybridization based technologies. The discoveries of restriction enzymes,ligases, polymerases, combined with key innovations in DNA synthesis andsequencing ushered in the era of biotechnology as a new science with profoundsociological and economic implications that are likely to have a dominatinginfluence on the development of our society during this century. Given theprocess by which science builds on prior knowledge, it is perhaps unfair tosingle out a few inventions and credit them with having contributed most tothis avalanche of knowledge. Yet, there are surely some that will be recognizedas having had a more profound impact than others, not just in the furtheringof our scientific knowledge, but by leveraging commercial applications thatprovide a tangible return to our society.
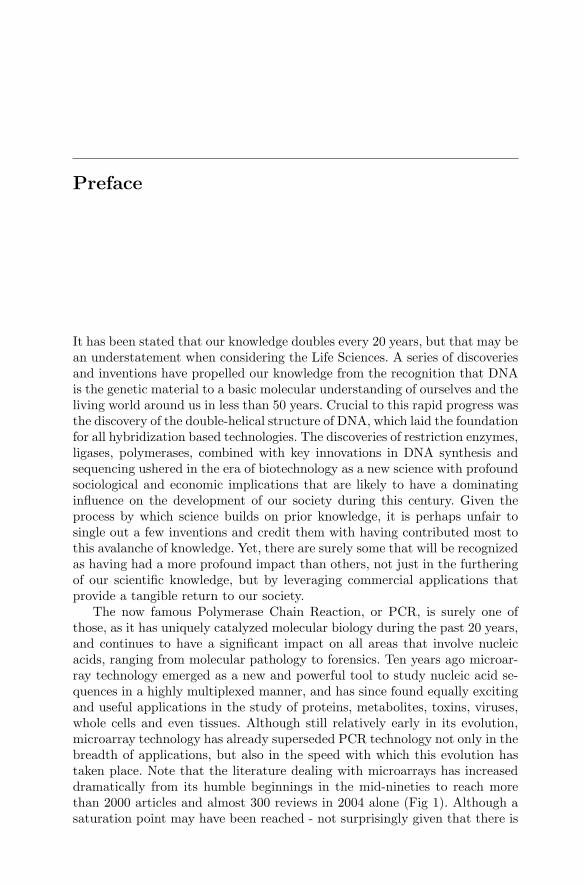
The now famous Polymerase Chain Reaction, or PCR, is surely one ofthose, as it has uniquely catalyzed molecular biology during the past 20 years,and continues to have a significant impact on all areas that involve nucleicacids, ranging from molecular pathology to forensics. Ten years ago microar-ray technology emerged as a new and powerful tool to study nucleic acid se-quences in a highly multiplexed manner, and has since found equally excitingand useful applications in the study of proteins, metabolites, toxins, viruses,whole cells and even tissues. Although still relatively early in its evolution,microarray technology has already superseded PCR technology not only in thebreadth of applications, but also in the speed with which this evolution hastaken place. Note that the literature dealing with microarrays has increaseddramatically from its humble beginnings in the mid-nineties to reach morethan 2000 articles and almost 300 reviews in 2004 alone (Fig 1). Although asaturation point may have been reached - not surprisingly given that there is
VI Preface
still a limit to the number of laboratories that have access to this technology-its impact is truly remarkable, especially when compared, for example, to theemerging and much touted field of Nanotechnology.
Num
ber
of A
rtic
les
Num
ber of Review
s
Fig. 1. Comparative evolution of publications regarding microarrays andnanobiotechnology
Amidst the pace of such rapid knowledge expansion, there is a challengein trying to compose a book that does not face obsolescence by the timeof its first publication. Alas, the breadth of this field is driving the growingknowledge base into many new directions, generating the need for differentbooks at different levels and each with a different and unique focus.
As early participants in the development of microarray technology the edi-tors have learned to appreciate the need for contributions from many differentareas in the basic sciences and engineering that were crucial to its birth andcontinued healthy growth. In turn we have observed how the involvement inthis particular scientific endeavour has affected many careers, turning physi-cist into oncologists, physicians into bioinformaticians, and chemists and biol-ogists into optical engineers. Provided the diverse nature of backgrounds thatare required to further propel this field, we thought it appropriate to aggre-gate this book around three aspects of microarray technology: fundamentals,designed to provide a scientific base; fabrication, which describes the currentstate of the art and compares ‘old’ and new ways of building microarrays; andapplications, that are aimed to highlight only the amazing variety and optionsprovided by these techniques. As an aid to the practitioner we have also askedthe authors to provide a detailed method section wherever appropriate.
Part 1, General Microarray Technologies, opens with an overview on mi-croarray formats. Chapters 2 and 3 cover the fundamentals of the physico-chemical aspects of immobilizing biomolecules on different substrates, while
Preface VII
Chaps. 4 and 5 describe the principal techniques used for array manufac-ture. Chapter 6 explores the limits of miniaturization with nanoarrays, andChap. 7 illuminates various aspects of microfluidics for automation. Finally,Chaps. 8 and 9 deal with the principles of labelling and detection method-ologies. The next parts are concerned with application of these fundamentaltechniques toward the development and use of specific types of microarrays.Part 2 describes DNA based microarrays in 4 chapters, covering SNP detec-tion, high sensitivity expression profiling, comparative genomic hybridization,and the analysis of regulatory circuits. Part 3 contains 3 chapters that dealwith microarrays for protein and small molecule detection, describing arraytechnology for antibodies, aptamers, and lipid bound proteins, respectively.The final part comprises 4 chapters that introduce the most esoteric arrays,those that contain high information content in each feature (whole cells ortissues), and the capability of performing biological reactions, such as trans-fections. How the combination of these types of arrays generates new insightsinto the molecular basis of normal and malignant cell function is summarizedin the last chapter.
It appears that given the dynamics of microarray technology any bookwould be a ‘work in progress’. Rather than fighting this, the editors and theauthors of this book embrace this concept: chances are that this book willgrow in time in line with the new developments in microarray technology.
June, 2004 Uwe MullerDan Nicolau
Acknowledgements
The initial idea for this book emerged during a serendipitous meeting betweenthe Editors and a representative from Springer Verlag during a Conference onMicroarrays, Fundamentals, Fabrication and Applications that was chairedand organized by the Editors as part of the International Society for OpticalEngineering (SPIE) Meeting in January 2001 in San Jose, CA. In fact, sev-eral Chaps. of this book were authored by people present at that Conference.The Editors wish to thank the organizers of SPIE, and in particular Mar-ilyn Gorsuch and Annie Gerstl, who helped with the organisation of theseConferences in the last four years. Thanks also to the Conference co-Chairs,Ramesh Raghavachari and David Dunn. The Editors also wish to thank Pe-ter Livingston and Gerardin Solana for the tedious work of converting themanuscripts into a camera-ready format.
Many contributors have specific acknowledgements.The authors of Chap. 1 are grateful to Stephen Felder, Ph.D. and Richard
Kris, Ph.D. of NeoGen, LLC. (Tucson, AZ), the inventors of the multiplexednuclease protection assay, for proof-of-principle work on the mRNA assay andfor the software for reagent design, image analysis and data interpretation.
The authors of Chap. 4 would like to thank Innovadyne Technologies foruse of Fig. 4.5 and Peter Hoyt for helpful discussions. The research pre-sented here was sponsored by the Laboratory Directed Research and Devel-opment Program of Oak Ridge National Laboratory (ORNL), managed byUT-Battelle, LLC for the U. S. Department of Energy under Contract No.DE-AC05-00OR22725 and by NIH Grant R01 HL62681-02. The manuscripthas been authored by a contractor of the U.S.Government under contractDE-AC05-00OR22725. Accordingly, the U.S. Government retains a nonexclu-sive, royalty-free license to publish or reproduce the published form of thiscontribution, or allow others to do so, for U.S. Government purposes.
One of the authors of Chap. 6 (DVN) wishes to thank Dan V. Nicolau Jr.for discussions regarding the computational applications of nanoarrays.
The authors of Chap. 7 would like to thank Joe Bonanno and Dale Ganser(formerly Motorola Labs) for help in device fabrication, and Gary Olsen and

X Acknowledgements
Pankaj Singhal (Motorola Life Sciences) for useful discussions on hybridiza-tion kinetics. This work has been sponsored in part by NIST ATP contract#1999011104A and DARPA contract #MDA972-01-3-0001.
Some of the authors of Chap. 8, i.e. JJS and SSM, acknowledge the NIH forsupport. CAM acknowledges the AFOSR, DARPA, and the NSF for supportof this work.
The authors of Chap. 9 are very grateful to Gabriele Gunther for excellenttechnical assistance, to Dr. K. Bohm, Jena, for kindly providing us with mi-crotubules and kinesin samples, and to Dr. Wolf, PicoRapid GmbH Bremen,for help in spotting protein samples by an automatic arrayer.
The authors of Chap. 13 thank Dr. Tae Hoon Kim and Miss Sara VanCalcar for critical reading of the manuscript. We are also grateful to Drs.Hieu Cam, Yasuhiko Takahashi, Brian Dynlacht, Richard Young, and Mr. TomVolkert for their help during the development of the technology described inthis chapter. B.R. is supported by the Ludwig Institute for Cancer Researchand a Sidney Kimmel Foundation for Cancer Research Scholar Award.
The authors of Chap. 14 wish to acknowledge the great support by Dr.Ronald Frank.
Finally, the authors of Chap. 20 thank Juha Kononen, Guido Sauter, Hol-ger Moch, Lukas Bubendorf, Galen Hostetter, Ghadi Salem, John Kakarekaand Tom Pohida for their contribution to the tissue microarray development,and Robert Cornelison, Don Weaver, Abdel Elkhahloon, and Natalie Gold-berger and for their contributions to the cell microarrays.
Contents
Part I General Microarray Technologies
1 Array FormatsRalph R. Martel, Matthew P. Rounseville, Ihab W. Botros,Bruce E. Seligmann . . . . . . . . . . . . . . . . . . . . . . . . . . . . . . . . . . . . . . . . . . . . . . 3
1.1 Introduction . . . . . . . . . . . . . . . . . . . . . . . . . . . . . . . . . . . . . . . . . . . . 31.2 Reasons to Use Arrays . . . . . . . . . . . . . . . . . . . . . . . . . . . . . . . . . . . 41.3 Arrays for Nucleic Acid Analysis . . . . . . . . . . . . . . . . . . . . . . . . . . 61.4 Protein Arrays . . . . . . . . . . . . . . . . . . . . . . . . . . . . . . . . . . . . . . . . . 81.5 The ArrayPlateTM . . . . . . . . . . . . . . . . . . . . . . . . . . . . . . . . . . . . . . 91.6 Conclusion . . . . . . . . . . . . . . . . . . . . . . . . . . . . . . . . . . . . . . . . . . . . . 19References . . . . . . . . . . . . . . . . . . . . . . . . . . . . . . . . . . . . . . . . . . . . . . . . . . . 20
2 Biomolecules and Cells on Surfaces –Fundamental ConceptsKristi L. Hanson, Luisa Filipponi, Dan V. Nicolau . . . . . . . . . . . . . . . . . . . 23
2.1 Introduction . . . . . . . . . . . . . . . . . . . . . . . . . . . . . . . . . . . . . . . . . . . . 232.2 Types of Immobilization . . . . . . . . . . . . . . . . . . . . . . . . . . . . . . . . . 232.3 DNA Immobilization on Surfaces . . . . . . . . . . . . . . . . . . . . . . . . . . 282.4 Protein Immobilization on Surfaces . . . . . . . . . . . . . . . . . . . . . . . . 322.5 Carbohydrate Immobilization . . . . . . . . . . . . . . . . . . . . . . . . . . . . . 362.6 Immobilization of Cells on Surfaces . . . . . . . . . . . . . . . . . . . . . . . . 382.7 Conclusions . . . . . . . . . . . . . . . . . . . . . . . . . . . . . . . . . . . . . . . . . . . . 41References . . . . . . . . . . . . . . . . . . . . . . . . . . . . . . . . . . . . . . . . . . . . . . . . . . . 42
3 Surfaces and SubstratesAlvaro Carrillo, Kunal V. Gujraty, Ravi S. Kane . . . . . . . . . . . . . . . . . . . . . 45
3.1 Introduction . . . . . . . . . . . . . . . . . . . . . . . . . . . . . . . . . . . . . . . . . . . . 453.2 DNA Microarrays . . . . . . . . . . . . . . . . . . . . . . . . . . . . . . . . . . . . . . . 463.3 Protein Microarrays . . . . . . . . . . . . . . . . . . . . . . . . . . . . . . . . . . . . . 50
XII Contents
3.4 Conclusion . . . . . . . . . . . . . . . . . . . . . . . . . . . . . . . . . . . . . . . . . . . . . 55References . . . . . . . . . . . . . . . . . . . . . . . . . . . . . . . . . . . . . . . . . . . . . . . . . . . 56
4 Reagent Jetting Based Deposition Technologiesfor Array ConstructionMitchel J. Doktycz . . . . . . . . . . . . . . . . . . . . . . . . . . . . . . . . . . . . . . . . . . . . . . . 63
4.1 Introduction . . . . . . . . . . . . . . . . . . . . . . . . . . . . . . . . . . . . . . . . . . . . 634.2 Reagent Jetting – Technology Overview . . . . . . . . . . . . . . . . . . . . 634.3 Thermal Jet Based Dispensing . . . . . . . . . . . . . . . . . . . . . . . . . . . . 654.4 Piezo Jet Based Dispensing . . . . . . . . . . . . . . . . . . . . . . . . . . . . . . 674.5 Solenoid Jet Based Dispensing . . . . . . . . . . . . . . . . . . . . . . . . . . . . 68References . . . . . . . . . . . . . . . . . . . . . . . . . . . . . . . . . . . . . . . . . . . . . . . . . . . 71
5 Manufacturing of 2-D Arrays by Pin-printing TechnologiesUwe R. Muller, Roeland Papen . . . . . . . . . . . . . . . . . . . . . . . . . . . . . . . . . . . . 73
5.1 Introduction . . . . . . . . . . . . . . . . . . . . . . . . . . . . . . . . . . . . . . . . . . . . 735.2 Definition of ‘Contact’ Pin–Printing . . . . . . . . . . . . . . . . . . . . . . . 735.3 Overview of Different Pin Technologies . . . . . . . . . . . . . . . . . . . . 745.4 Other System Components and Environmental Factors . . . . . . 795.5 Pin Printing Process . . . . . . . . . . . . . . . . . . . . . . . . . . . . . . . . . . . . 815.6 Example of a High Throughput Pin–Printing System for
Manufacturing of 2D Arrays – the Corning GENII System . . . 845.7 Conclusion . . . . . . . . . . . . . . . . . . . . . . . . . . . . . . . . . . . . . . . . . . . . . 86References . . . . . . . . . . . . . . . . . . . . . . . . . . . . . . . . . . . . . . . . . . . . . . . . . . . 87
6 NanoarraysDan V. Nicolau, Linnette Demers, David S. Ginger . . . . . . . . . . . . . . . . . . . 89
6.1 Introduction . . . . . . . . . . . . . . . . . . . . . . . . . . . . . . . . . . . . . . . . . . . . 896.2 Passive Nano–scale Arrays . . . . . . . . . . . . . . . . . . . . . . . . . . . . . . . 916.3 Computational Nanoarrays . . . . . . . . . . . . . . . . . . . . . . . . . . . . . . . 1056.4 Dynamic Nanoarrays . . . . . . . . . . . . . . . . . . . . . . . . . . . . . . . . . . . . 1096.5 Conclusion . . . . . . . . . . . . . . . . . . . . . . . . . . . . . . . . . . . . . . . . . . . . . 115References . . . . . . . . . . . . . . . . . . . . . . . . . . . . . . . . . . . . . . . . . . . . . . . . . . . 115
7 The Use of Microfluidic Techniquesin Microarray ApplicationsPiotr Grodzinski, Robin H. Liu, Ralf Lenigk, Yingjie Liu . . . . . . . . . . . . . . 119
7.1 Introduction . . . . . . . . . . . . . . . . . . . . . . . . . . . . . . . . . . . . . . . . . . . . 1197.2 Biochannel Hybridization Arrays . . . . . . . . . . . . . . . . . . . . . . . . . . 1207.3 Chips with Cavitation Microstreaming Mixers –
Kinetics Studies . . . . . . . . . . . . . . . . . . . . . . . . . . . . . . . . . . . . . . . . 1287.4 Integrated Microfluidic Reactors
for DNA Amplification and Hybridization . . . . . . . . . . . . . . . . . . 1357.5 Summary and Conclusions . . . . . . . . . . . . . . . . . . . . . . . . . . . . . . . 142

Contents XIII
References . . . . . . . . . . . . . . . . . . . . . . . . . . . . . . . . . . . . . . . . . . . . . . . . . . . 142
8 Labels and Detection MethodsJames J. Storhoff, Sudhakar S. Marla, Viswanadham Garimella,Chad A. Mirkin . . . . . . . . . . . . . . . . . . . . . . . . . . . . . . . . . . . . . . . . . . . . . . . . . . 147
8.1 Introduction . . . . . . . . . . . . . . . . . . . . . . . . . . . . . . . . . . . . . . . . . . . . 1478.2 Fluorophore Labelling and Detection Methods . . . . . . . . . . . . . . 1488.3 Enhanced Fluorescence-Based Assays . . . . . . . . . . . . . . . . . . . . . . 1518.4 Phosphor Reporters . . . . . . . . . . . . . . . . . . . . . . . . . . . . . . . . . . . . . 1548.5 Electrochemical Detection . . . . . . . . . . . . . . . . . . . . . . . . . . . . . . . . 1568.6 Metal Nanoparticle Labels and Metal Thin Films
for Microarrays . . . . . . . . . . . . . . . . . . . . . . . . . . . . . . . . . . . . . . . . . 1598.7 Conclusions . . . . . . . . . . . . . . . . . . . . . . . . . . . . . . . . . . . . . . . . . . . . 172References . . . . . . . . . . . . . . . . . . . . . . . . . . . . . . . . . . . . . . . . . . . . . . . . . . . 174
9 Marker-free Detection on MicroarraysMatthias Vaupel, Andreas Eing, Karl-Otto Greulich, Jan Roegener,Peter Schellenberg, Hans Martin. Striebel, Heinrich F. Arlinghaus . . . . . . 181
9.1 Introduction . . . . . . . . . . . . . . . . . . . . . . . . . . . . . . . . . . . . . . . . . . . . 1819.2 Imaging Ellipsometry
and Imaging Surface Plasmon Resonance on Biochips . . . . . . . . 1819.3 Intrinsic UV Fluorescence for Chip Analysis
of Rare Proteins . . . . . . . . . . . . . . . . . . . . . . . . . . . . . . . . . . . . . . . . 1909.4 Genetic Diagnostics with Unlabelled DNA . . . . . . . . . . . . . . . . . 197References . . . . . . . . . . . . . . . . . . . . . . . . . . . . . . . . . . . . . . . . . . . . . . . . . . . 204
Part II DNA Microarrays
10 Analysis of DNA Sequence Variationin the Microarray FormatUlrika Liljedahl, Mona Fredriksson, Ann-Christine Syvanen . . . . . . . . . . . 211
10.1 Introduction . . . . . . . . . . . . . . . . . . . . . . . . . . . . . . . . . . . . . . . . . . . . 21110.2 Principles of Genotyping . . . . . . . . . . . . . . . . . . . . . . . . . . . . . . . . . 21310.3 Performing the Assays in Practice . . . . . . . . . . . . . . . . . . . . . . . . . 21710.4 Conclusion . . . . . . . . . . . . . . . . . . . . . . . . . . . . . . . . . . . . . . . . . . . . . 222References . . . . . . . . . . . . . . . . . . . . . . . . . . . . . . . . . . . . . . . . . . . . . . . . . . . 223
11 High Sensitivity Expression ProfilingRamesh Ramakrishnan, Paul Bao, Uwe R. Muller . . . . . . . . . . . . . . . . . . . . 229
11.1 Introduction . . . . . . . . . . . . . . . . . . . . . . . . . . . . . . . . . . . . . . . . . . . . 22911.2 Oligonucleotide Expression Arrays . . . . . . . . . . . . . . . . . . . . . . . . 23011.3 cDNA-based Expression Arrays . . . . . . . . . . . . . . . . . . . . . . . . . . . 23911.4 Appendix . . . . . . . . . . . . . . . . . . . . . . . . . . . . . . . . . . . . . . . . . . . . . . 244

XIV Contents
References . . . . . . . . . . . . . . . . . . . . . . . . . . . . . . . . . . . . . . . . . . . . . . . . . . . 245
12 Applications of Matrix-CGH (Array-CGH)for Genomic Research and Clinical DiagnosticsCarsten Schwaenena, Michelle Nesslinga, Bernhard Radlwimmera,Swen Wessendorf, Peter Lichtera . . . . . . . . . . . . . . . . . . . . . . . . . . . . . . . . . . . 251
12.1 Introduction . . . . . . . . . . . . . . . . . . . . . . . . . . . . . . . . . . . . . . . . . . . . 25112.2 Technical Aspects . . . . . . . . . . . . . . . . . . . . . . . . . . . . . . . . . . . . . . . 25312.3 Applications . . . . . . . . . . . . . . . . . . . . . . . . . . . . . . . . . . . . . . . . . . . . 256References . . . . . . . . . . . . . . . . . . . . . . . . . . . . . . . . . . . . . . . . . . . . . . . . . . . 260
13 Analysis of Gene Regulatory CircuitsZirong Li . . . . . . . . . . . . . . . . . . . . . . . . . . . . . . . . . . . . . . . . . . . . . . . . . . . . . . . 265
13.1 Introduction . . . . . . . . . . . . . . . . . . . . . . . . . . . . . . . . . . . . . . . . . . . . 26513.2 An Experimental Protocol
for Genome Wide Location Analysis . . . . . . . . . . . . . . . . . . . . . . . 26813.3 Example: Identifying the Target Genes of Human E2F4 . . . . . . 27313.4 Summary . . . . . . . . . . . . . . . . . . . . . . . . . . . . . . . . . . . . . . . . . . . . . . 275References . . . . . . . . . . . . . . . . . . . . . . . . . . . . . . . . . . . . . . . . . . . . . . . . . . . 275
Part III Protein Microarrays
14 Protein, Antibody and Small Molecule MicroarraysHendrik Weiner, Jorn Glokler, Claus Hultschig, Konrad Bussow,Gerald Walter . . . . . . . . . . . . . . . . . . . . . . . . . . . . . . . . . . . . . . . . . . . . . . . . . . . 279
14.1 Introduction . . . . . . . . . . . . . . . . . . . . . . . . . . . . . . . . . . . . . . . . . . . . 27914.2 Protein Microarrays . . . . . . . . . . . . . . . . . . . . . . . . . . . . . . . . . . . . . 28014.3 Antibody Microarrays . . . . . . . . . . . . . . . . . . . . . . . . . . . . . . . . . . . 28314.4 Peptide and Other Synthetic Arrays . . . . . . . . . . . . . . . . . . . . . . . 287References . . . . . . . . . . . . . . . . . . . . . . . . . . . . . . . . . . . . . . . . . . . . . . . . . . . 290
15 Photoaptamer Arrays for Proteomics ApplicationsDrew Smith, Chad Greef . . . . . . . . . . . . . . . . . . . . . . . . . . . . . . . . . . . . . . . . . . 297
15.1 Introduction . . . . . . . . . . . . . . . . . . . . . . . . . . . . . . . . . . . . . . . . . . . . 29715.2 Overview of Photoaptamer Discovery
and High Throughput Production . . . . . . . . . . . . . . . . . . . . . . . . . 29815.3 Using Photoaptamer Microarrays . . . . . . . . . . . . . . . . . . . . . . . . . 30115.4 Discussion . . . . . . . . . . . . . . . . . . . . . . . . . . . . . . . . . . . . . . . . . . . . . 303References . . . . . . . . . . . . . . . . . . . . . . . . . . . . . . . . . . . . . . . . . . . . . . . . . . . 305
16 Biological Membrane MicroarraysYe Fang, Anthony G. Frutos, Yulong Hong, Joydeep Lahiri . . . . . . . . . . . . 309
16.1 Introduction . . . . . . . . . . . . . . . . . . . . . . . . . . . . . . . . . . . . . . . . . . . . 309
Contents XV
16.2 Biospecific Binding Studies Using Membrane Microarrays . . . . 31316.3 Conclusions . . . . . . . . . . . . . . . . . . . . . . . . . . . . . . . . . . . . . . . . . . . . 318References . . . . . . . . . . . . . . . . . . . . . . . . . . . . . . . . . . . . . . . . . . . . . . . . . . . 319
Part IV Cell & Tissue Microarrays
17 Use of Reporter Systemsfor Reverse Transfection Cell ArraysBrian L. Webb . . . . . . . . . . . . . . . . . . . . . . . . . . . . . . . . . . . . . . . . . . . . . . . . . . 323
17.1 Introduction . . . . . . . . . . . . . . . . . . . . . . . . . . . . . . . . . . . . . . . . . . . . 32317.2 Reporter Systems for Reverse Transfection . . . . . . . . . . . . . . . . . 32517.3 Reagents and Protocols . . . . . . . . . . . . . . . . . . . . . . . . . . . . . . . . . . 332References . . . . . . . . . . . . . . . . . . . . . . . . . . . . . . . . . . . . . . . . . . . . . . . . . . . 333
18 Whole Cell MicroarraysRavi Kapur . . . . . . . . . . . . . . . . . . . . . . . . . . . . . . . . . . . . . . . . . . . . . . . . . . . . . 335
18.1 Introduction . . . . . . . . . . . . . . . . . . . . . . . . . . . . . . . . . . . . . . . . . . . . 33518.2 The Need . . . . . . . . . . . . . . . . . . . . . . . . . . . . . . . . . . . . . . . . . . . . . . 33618.3 The Solution . . . . . . . . . . . . . . . . . . . . . . . . . . . . . . . . . . . . . . . . . . . 33618.4 Challenges and Opportunities for Cellular Micrroarrays . . . . . . 341References . . . . . . . . . . . . . . . . . . . . . . . . . . . . . . . . . . . . . . . . . . . . . . . . . . . 343
19 Tissue Microarrays for Miniaturized High-ThroughputMolecular Profiling of TumorsRonald Simon, Martina Mirlacher, Guido Sauter . . . . . . . . . . . . . . . . . . . . . 345
19.1 Introduction . . . . . . . . . . . . . . . . . . . . . . . . . . . . . . . . . . . . . . . . . . . . 34519.2 The TMA Technology . . . . . . . . . . . . . . . . . . . . . . . . . . . . . . . . . . . 34619.3 The Representativity Issue . . . . . . . . . . . . . . . . . . . . . . . . . . . . . . . 34619.4 TMA Applications . . . . . . . . . . . . . . . . . . . . . . . . . . . . . . . . . . . . . . 34919.5 Future Directions . . . . . . . . . . . . . . . . . . . . . . . . . . . . . . . . . . . . . . . 35119.6 Protocol . . . . . . . . . . . . . . . . . . . . . . . . . . . . . . . . . . . . . . . . . . . . . . . 352References . . . . . . . . . . . . . . . . . . . . . . . . . . . . . . . . . . . . . . . . . . . . . . . . . . . 354
20 Application of Microarray Technologiesfor Translational GenomicsSpyro Mousses, Natasha Caplen, Mark Basik, Anne Kallioniemi,Olli Kallioniemi . . . . . . . . . . . . . . . . . . . . . . . . . . . . . . . . . . . . . . . . . . . . . . . . . . 361
20.1 Introduction . . . . . . . . . . . . . . . . . . . . . . . . . . . . . . . . . . . . . . . . . . . . 36120.2 High Throughput Clinical Target Validation Using Tissue
Microarrays . . . . . . . . . . . . . . . . . . . . . . . . . . . . . . . . . . . . . . . . . . . . 36320.3 Examples of Studies Integrating DNA and Tissue Microarray
Technologies for the Rapid Clinical Translationof Genomic Discoveries . . . . . . . . . . . . . . . . . . . . . . . . . . . . . . . . . . 365

XVI Contents
20.4 High Throughput Characterizationof Gene Function Using Live Cell Microarrays . . . . . . . . . . . . . . 368
20.5 Conclusions . . . . . . . . . . . . . . . . . . . . . . . . . . . . . . . . . . . . . . . . . . . . 370References . . . . . . . . . . . . . . . . . . . . . . . . . . . . . . . . . . . . . . . . . . . . . . . . . . . 372
Index . . . . . . . . . . . . . . . . . . . . . . . . . . . . . . . . . . . . . . . . . . . . . . . . . . . . . . . . . . 375

List of Contributors
Heinrich F. ArlinghausPhysikalisches Institut derUniversitat Munster Wilhelm-Klemm-Str. 10 D-48149Munster, [email protected]
Paul BaoNanosphere, Inc.4088 Commercial AvenueNorthbrook, IL 60062, [email protected]
Mark BasikTranslational Genomics ResearchInstitute (TGen)20 First Field RoadGaithesburg, MA 20878, [email protected]
Ihab W. BotrosHigh Throughput Genomics, Inc.6296 East Grant RoadTucson, AZ 85712, [email protected]
Konrad BussowMax Planck Institute of MolecularGeneticsIhnestrasse 73D-14195 Berlin, [email protected]
Natasha CaplenMedical Genetics BranchNational Human Genome ResearchInstituteNational Institutes of HealthBuilding 10, Room 10C10310 Center DriveBethesda, MD 20892 [email protected]
Alvaro CarrilloRensselaer Polytechnic InstituteHoward P. Isermann Department ofChemical EngineeringRicketts Building, 110 8th StreetTroy, NY 12180, [email protected]
Linnette DemersNanoInk, Inc.1335 W. Randolph StreetChicago, IL 60607, [email protected]
Mitchel J. DoktyczLife Sciences Division and CondensedMatter Sciences DivisionOak Ridge National LaboratoryP.O. Box 2008Oak Ridge, TN 37831-6123, [email protected]

XVIII List of Contributors
Andreas EingNanofilm TechnologieAnna-Vadenhoeck-Ring 5D-37081 Gottingen, [email protected]
Ye FangCorning, Inc.Biochemical Sciences, Science andTechnology DivisionCorning, NY 14870, [email protected]
Luisa FilipponiSwinburne University of TechnologyIndustrial Research InstituteSwinburne533-545 Burwood RoadHawthorn, VIC 3122, [email protected]
Anthony G. FrutosCorning, Inc.Biochemical Sciences, Science andTechnology DivisionCorning, NY 14870, [email protected]
Mona FredrikssonUppsala University HospitalDept Medical SciencesS-751 85 Uppsala, [email protected]
Viswanadham GarimellaNanosphere, Inc.4088 Commercial AvenueNorthbrook, IL 60062, [email protected]
Kunal V. GujratyRensselaer Polytechnic InstituteHoward P. Isermann Department ofChemical EngineeringRicketts Building, 110 8th StreetTroy, NY 12180, [email protected]
David S. GingerDepartment of ChemistryUniversity of WashingtonBox 351700Seattle, WA 98195-1700, [email protected]
Jorn GloklerMax Planck Institute of MolecularGeneticsIhnestrasse 73D-14195 Berlin, [email protected]
Chad GreefSomaLogic, Inc.1745 38th StreetBoulder, CO 80301, [email protected]
Karl-Otto GreulichInstitute for Molecular BiotechnologyDepartment of Single Cell and SingleMolecule TechniquesBeutenbergstrasse 11D-07745 Jena, [email protected]
Piotr GrodzinskiMicrofluidics Laboratory, PSRL,Motorola Labs7700 S. River ParkwayTempe, AZ 85284, USACurrent address:Bioscience Division, MS J586Los Alamos National LaboratoryLos Alamos, NM 87545, [email protected]
Kristi L. HansonSwinburne University of TechnologyIndustrial Research InstituteSwinburne533-545 Burwood Road Hawthorn,VIC 3122, [email protected]
List of Contributors XIX
Yulong HongCorning, Inc.Biochemical Sciences, Science andTechnology DivisionCorning, NY 14870, [email protected]
Claus HultschigMax Planck Institute of MolecularGeneticsIhnestrasse 73D-14195 Berlin, [email protected]
Anne KallioniemiUniversity of TampereLaboratory of Cancer GeneticsInstitute of Medical TechnologyP.O. Box 607FIN-33014 University of Tampere,[email protected]
Olli KallioniemiMedical Biotechnology GroupVTT Technical Research Centre ofFinlandUniversity of TurkuP.O. Box 106, 20521 Turku, [email protected]
Ravi S. KaneRensselaer Polytechnic InstituteHoward P. Isermann Department ofChemical EngineeringRicketts Building, 110 8th StreetTroy, NY 12180, [email protected]
Ravi KapurAnudeza Group292 Morton StreetStoughton, MA 02072, [email protected]
Joydeep LahiriCorning, Inc.Biochemical Sciences, Science andTechnology DivisionCorning, NY 14870, [email protected]
Ralf LenigkMicrofluidics Laboratory, PSRL,Motorola Labs7700 S. River ParkwayTempe, AZ 85284, USACurrent address:Applied NanoBioscience CenterP.O. Box 874004Arizona State UniversityTempe, AZ 85287, [email protected]
Zirong LiLudwig Institute for Cancer ResearchUCSD La Jolla Medical SchoolCampus9500 Gilman DriveLa Jolla, CA 92093-0653, [email protected]
Peter LichterMolekulare GenetikDeutsches KrebsforschungszentrumD-69120 Heidelberg, [email protected]
Ulrika LiljedahlUppsala University HospitalDept Medical SciencesS-751 85 Uppsala, [email protected]
Robin H. LiuMicrofluidics Laboratory, PSRL,Motorola Labs7700 S. River ParkwayTempe, AZ 85284, USACurrent address:

XX List of Contributors
Applied NanoBioscience CenterP.O. Box 874004Arizona State UniversityTempe, AZ 85287, [email protected]
Yingjie LiuMicrofluidics Laboratory, PSRL,Motorola Labs7700 S. River ParkwayTempe, AZ 85284, USACurrent address: Applied NanoBio-science Center P.O. Box 874004Arizona State University Tempe, AZ85287, USAJason [email protected]
Sudhakar S. MarlaNanosphere, Inc.4088 Commercial AvenueNorthbrook, IL 60062, [email protected]
Ralph R. MartelHigh Throughput Genomics, Inc.6296 East Grant RoadTucson, AZ 85712, [email protected]
Mirlacher MartinaUniversity of BaselInstitute of PathologySchoenbeinstrasse 404031 Basel, [email protected]
Chad A. MirkinNorthwestern UniversityInstitute for Nanotechnology2145 Sheridan RoadEvanston, IL 60208, [email protected]
Spyro MoussesTranslational Genomics ResearchInstitute (TGen)20 First Field RoadGaithesburg, MA 20878, [email protected]
Uwe R. MullerNanosphere, Inc.4088 Commercial AvenueNorthbrook, IL 60062, [email protected]
Michelle NesslingMolekulare GenetikDeutsches KrebsforschungszentrumD-69120 Heidelberg, [email protected]
Dan V. NicolauSwinburne University of TechnologyIndustrial Research InstituteSwinburne533-545 Burwood RoadHawthorn, VIC 3122, [email protected]
Roeland PapenPicoliter inc.231 S Whisman Road,Mountain View CA [email protected]
Bernhard RadlwimmerMolekulare GenetikDeutsches KrebsforschungszentrumD-69120 Heidelberg, [email protected]
Ramesh RamakrishnanNanosphere, Inc.4088 Commercial AvenueNorthbrook, IL 60062, [email protected]

List of Contributors XXI
Bing RenUniversity of California, San DiegoDepartment of Cellular and Molecu-lar Medicine, School of Medicine9500 Gilman Drive, La Jolla, CA92093-0653, [email protected]
Jan RoegenerUniversity of BielefeldDepartment of Applied Laser PhysicsUniversitaetsstrasse 25 D3D-33615 Bielefeld, [email protected]
Simon RonaldUniversity of BaselInstitute of PathologySchoenbeinstrasse 404031 Basel, [email protected]
Matthew P. RounsevilleHigh Throughput Genomics, Inc.6296 East Grant RoadTucson, AZ 85712, [email protected]
Guido SauterUniversity of Basel Institute ofPathology Schoenbeinstrasse 40 4031Basel, [email protected]
Peter SchellenbergInstitute for Molecular BiotechnologyDepartment of Single Cell and SingleMolecule TechniquesBeutenbergstrasse 11D-07745 Jena, [email protected]
Carsten SchwaenenMedizinische Klinik der UniversitatUlm
Innere Medizin III D-89081 Ulm,[email protected]
Bruce E. SeligmannHigh Throughput Genomics, Inc.6296 East Grant RoadTucson, AZ 85712, [email protected]
Drew SmithSomaLogic, Inc.1745 38th StreetBoulder, CO 80301, [email protected]
James J. StorhoffNanosphere, Inc.1818 Skokie BoulevardNorthbrook, IL 60062, [email protected]
Hans Martin. StriebelInstitute for Molecular Biotechnol-ogy,Department of Single Cell and SingleMolecule TechniquesBeutenbergstrasse 11 D-07745 Jena,[email protected]
Ann-Christine SyvanenUppsala University HospitalDept Medical SciencesS-751 85 Uppsala, [email protected]
Matthias VaupelNanofilm TechnologieAnna-Vadenhoeck-Ring 5 D-37081Gottingen, [email protected]

XXII List of Contributors
Gerald WalterBiorchard ASNedre Skogvei 14N-0281 Oslo, [email protected]
Brian L. WebbCorning, Inc.Biochemical Sciences, Science andTechnology DivisionCorning, NY 14870, [email protected]
Hendrik Weiner
Max Planck Institute of MolecularGeneticsIhnestrasse 73D-14195 Berlin, [email protected]
Swen WessendorfMedizinische Klinik der UniversitatUlmInnere Medizin IIID-89081 Ulm, [email protected]

Part I
General Microarray Technologies
1
Array Formats
Ralph R. Martel, Matthew P. Rounseville, and Ihab W. Botros,and Bruce E. Seligmann
1.1 Introduction
Arrays have become an increasingly diverse set of tools for biological studies;their use continues to expand rapidly. Likewise, the underlying array tech-nologies, formats and protocols continue to evolve. Investigators can choosefrom a growing range of options when selecting an array technology that isappropriate for reaching their research objectives. Traditionally, arrays haveconsisted of collections of distinct capture molecules – typically cDNAs oroligonucleotides – attached to a substrate – usually a glass slide – at pre-defined locations within a grid pattern [1, 2]. However, today’s formats aremore diverse and can be grouped into several categories. Like any catego-rization effort, there will be exceptions, crossover technologies and tangentialrelations. The intent here is only to lay out some general trends.
The classes of capture molecules used in arrays include not only DNA,but also proteins [3], carbohydrates [4], drug-like molecules [5], cells [6], tis-sues [7] and the like. Array formats vary in their architecture. For closedarchitecture arrays, the analytes that can be measured are preselected andlocked-in during the manufacturing process. In contrast open architecture ar-ray technologies allow the set of measured analytes to be modified or allownew analytes to be discovered. Regardless of the architecture, various manu-facturing technologies and various substrate materials and coatings are avail-able as are numerous means of attaching capture molecules to substrates. Abroad variety of commercially prepared arrays can be purchased. In some in-stances, the pre-defined grid has been eliminated and replaced with ‘virtual ar-rays’ of optically encoded beads [8] or of analyte-specific detection labels (e.g.e-Tags; www.aclara.com). Coupled with the diversity of arrayed molecules andarray formats is the diversity of detection schemes that include fluorescence,luminescence, electrochemical detection, mass spectrometry, surface plasmonresonance and others.
In spite of the diversity of formats, all arrays share a common feature:Arrays allow multiplexed analyses, that is, arrays allow multiple tests to be
4 Ralph R. Martel et al.
performed simultaneously. This is the case both when many analytes are mea-sured simultaneously in an individual sample and also when many samples aretested at one time for an individual analyte. For instance, DNA arrays canbe used to determine the expression levels of thousands of genes in an indi-vidual biological specimen, while tissue arrays can be used to determine thepresence of a specific antigen in hundreds of specimens in a single experiment.Various ‘array–of–arrays’ technologies combine the measurement of numerousanalytes across numerous samples.
The impact of array technologies on the life sciences has been important. Inconjunction with bioinformatic tools to process and analyze the large amountsof data they generate, arrays have spawned new approaches to systems biol-ogy often described with the ‘omics’ suffix: genomics, transcriptomics andproteomics, to name a few.
This chapter will provide the rationales for using arrays to address variousscientific questions and will outline some of the array technologies developed tofill specific needs. This is a series of examples to illustrate the range of availableoptions and how one technology may be better suited than another to reach aspecific research objective, not a comprehensive survey of available tools. Thelatter part of the chapter will discuss the ArrayPlateTM technology developedby High Throughput Genomics (HTG, Tucson, AZ) to bring the benefitsof arrays to the high throughput screening phase of the drug discovery anddevelopment process. The procedure for a multiplexed ArrayPlateTM mRNAassay will be described and the results of an mRNA assay and a companionmultiplexed ELISA will be presented.
1.2 Reasons to Use Arrays
There are three principle justifications for using array technologies. Arraysserve to discover unique patterns (of gene expression, protein synthesis orpost-translational modification, etc.) associated with a particular physiolog-ical state. We use the term ‘survey array’ to describe the technologies thatare employed for this purpose. ‘Scan array’ or ‘focused array’ refers to thearray tools that measure a predefined pattern, previously established withsurvey arrays. Finally, ‘efficiency array’ refers to the techniques that do notrequire multiplexing per se, but that take advantage of the parallel process-ing common to arrays to provide savings of effort, time and materials or toimprove data quality by incorporating internal controls that are measured ineach sample. Most array technologies have been developed to achieve one ofthese three goals and may be inefficient for reaching the other two.
1.2.1 Arrays to Identify Patterns
The best-known array technology, the GeneChip R© developed by Affymetrix(Santa Clara, California) is an excellent example of a ‘survey array’. According
1 Array Formats 5
to the company (www.affymetrix.com), the two arrays in the Human GenomeU133 Set contain over one million distinct oligonucleotide features to monitorthe expression of 39,000 transcript variants of 33,000 different human genes ina single sample. GeneChips R© and their cDNA and oligonucleotide array coun-terparts are widely used to identify genes that are differentially expressed indiseased tissues or during development or upon treatment with a drug. Inmost instances, results obtained with DNA arrays show that the vast major-ity of genes are either not expressed or not affected by disease. Typically, adisease-specific pattern of gene expression or ‘signature’ is characterized thatinvolves fewer than 50 genes [9–12]. Although well suited to initially definepatterns based on the examination of a relatively small number of samples,survey arrays are generally too labor- and material-intensive and too costlyto be used routinely thereafter in diagnostics or in drug discovery.
1.2.2 Arrays to Measure Patterns
‘Scan arrays’ that measure specific patterns are appropriate for clinical diag-nostics and for drug discovery. While these techniques measure fewer analytesthan do survey arrays, the analytes have been carefully selected and validated.Other attributes such as ease of use and throughput make various scan arraytechnologies well-suited for particular niches.
Inexpensive readout equipment is a requirement for array-based diagnos-tic tests as such tests are performed at many different sites such as referencelaboratories, hospital laboratories and physicians’ offices but relatively infre-quently at any given site. Cost per test however is less important since theresults provide information that is of high value. Furthermore, most diagnos-tic testing is reimbursed by insurers. Hands-on manipulations must be simpleas testing is frequently performed by inexperienced personnel. To gain ap-proval from regulatory agencies, diagnostics tests must yield results that arerobust and interpretable. For these reasons, various hand-held electronic arraydevices appear to be in the best position to make inroads in this arena.
In drug discovery, once targets are validated, throughput becomes an im-portant criterion, that is, how rapidly collections of hundreds of thousands ofchemical compounds can be tested to identify those compounds that elicit adesired effect. Efficiency in the high throughput screening laboratory is ob-tained with miniaturization (96–, 384– and 1536–well microplates) and withextensive automation and plate handling robotics. Besides performance cri-teria such as sensitivity and reproducibility, the success of a technology inthis setting depends upon the development of automation-friendly protocols.While substantial expenditures on capital equipment are commonplace, costper sample is an issue because of the large testing volumes. The ArrayPlateTM
described later in this chapter was designed specifically for high throughputscreening.
6 Ralph R. Martel et al.
1.2.3 Arrays for Parallel Processing
Examples where the array format has been adopted for the efficiencies derivedfrom parallel processing can be found in the combinatorial chemistry litera-ture [13]. The synthesis of chemical compound libraries has been performedin an array format [14]. Indeed, the photolithographic process utilized byAffymetrix to manufacture its DNA chips had its origins in combinatorialchemistry [15]. Arrays of compounds have also been used in drug discoveryscreening [16]. Microtiter plate wells that contained individual compoundshave been miniaturized to the point of vanishing with the compounds be-coming elements of an array rather than contents of a well. Generally, usingarrays leverages sample preparation efforts. In cell-based assays for instance,the effort of culturing cells and screening compounds is the same regardlessof whether a single or multiple measurements are made.
1.3 Arrays for Nucleic Acid Analysis
Several review articles covering advances and applications of DNA microar-ray technology have recently been published [17,18] hence, the same materialwill not be repeated here. Oligonucleotide and cDNA arrays have differentstrengths and weaknesses. There is more control over the design of oligonu-cleotide microarrays than there is for cDNA arrays. Consequently, oligonu-cleotide arrays tend to have more uniform physicochemical characteristics andfewer issues pertaining to cross–hybridization. For cDNA arrays, the captureprobes are typically PCR amplicons of clones derived from the organism orthe organ of interest. One advantage is that cDNA probes can be incorpo-rated into arrays without further characterization of the underlying gene. Forboth types of microarrays however, the architecture is closed, albeit at timesunknown for cDNA arrays. For illustrative purposes, several less conventionalarray technologies are described.
1.3.1 Arrays on Beads
The attachment of array moieties to small particles allows multiplexed assaysto be performed in three–dimensions rather than on a flat surface. Luminex(Austin, TX) has developed fluorochrome-coded microspheres that can becoated with various classes of ligands. During an assay, a sample is incubatedwith the beads in solution, allowing the analytes of interest to be capturedby their corresponding bead-bound ligands. A fluorescently tagged ‘reportermolecule’ then labels the analyte species. For readout, beads are passed, singlefile, through a flow cytometry device where the fluorescent tags are illuminatedby laser excitation. The resulting fluorescence of both the bead and the re-porter molecule are quantified and decoded to yield the identity and quantity
1 Array Formats 7
of the captured molecule. The application of this method to RNA expressionanalysis has been described recently [8].
Illumina (San Diego, CA) has developed an alternative readout system forbead-based arrays. A manifold of 96 fiber optic bundles, each consisting ofabout 50,000 individual fibers, is manufactured to fit the standard microplateformat. A dimple etched at the end of each fiber can accommodate one of thecompany’s 3 µm beads. This enables fluorochrome excitation and emissionof the beads and of fluorescently-labelled analytes through the fiber. Thecompany claims that combinations of fluorescent dyes uniquely identify upto 1,500 beads that can be sampled with 30–fold redundancy to provide astatistical average readout. Presently, the method appears to be used mainlyin single nucleotide polymorphism (SNP) genotyping of multiple samples, asreviewed by Oliphant [19].
1.3.2 Electronic Arrays
Array technologies have used electronics to program open architecture sys-tems, to accelerate hybridization kinetics and control stringency, and to de-tect captured analytes. The NanoChip R© (Nanogen, San Diego, CA) incor-porates 100 electrode test sites that are coated with a hydrogel containingstreptavidin. This system has an open architecture. Programming is with bi-otinylated target–binding probes that migrate to specific electrodes when apositive charge is applied and that remain bound to the streptavidin after-wards. An electric field is also used to concentrate target molecules at theelectrodes to accelerate their hybridization and subsequently, to drive awaynon-specifically bound materials. Final detection of target is by fluorescence.The eSensorTM DNA detection system (Motorola, Pasadena, CA) uses a self-assembled monolayer (SAM) array of target-specific 22–mer oligonucleotidescovalently bound to the gold electrodes of a circuit board [20]. Target nucleicacids hybridized to the array are detected with ferrocene-labelled signalingprobes that hybridize with their target next to the capture probe. An appliedpotential causes the transfer of electrons from the ferrocene to the gold elec-trode with the measured current quantifying the ferrocene label. SNPs canbe detected as perfect hybrids that generate signals at least twofold greaterthan do single–base mismatches. Both of these technologies have targeteddiagnostic applications.
1.3.3 SAGE
Serial analysis of gene expression (SAGE) allows the simultaneous detectionand quantification of multiple mRNA species [21, 22] although it is not anarray technology per se. SAGE relies on the isolation of unique sequencetags from individual mRNA molecules via a process that includes mRNAisolation, reverse transcription, restriction enzyme digestion, ligation and PCRamplification. The tags are subsequently ligated to form concatamers that
8 Ralph R. Martel et al.
are sequenced to reveal both the identity and abundance of expressed genes.Unlike conventional arrays, SAGE can identify novel transcripts.
1.4 Protein Arrays
The development of protein arrays has lagged behind that of DNA arrays pri-marily because of the greater complexity of proteins. While DNA microarrayshave become the tools of choice for characterizing patterns of gene expres-sion, two–dimensional gel electrophoresis remains the standard method forgenerating ‘protein fingerprints’.
Multiplexed immunoassays are the most developed application for proteinarrays. Three strategies have emerged. One is the miniaturization and mul-tiplexing of the standard enzyme linked immunosorbent assay (ELISA), inwhich capture antibodies are arrayed onto slides or microtiter plates. A varia-tion on this method that requires only a single antibody for each antigen, is tolabel the proteins in a sample with one fluorochrome and the proteins in a ref-erence sample with a second fluorochrome. The differentially labelled samplesare mixed and incubated with an antibody microarray which is scanned. Theratio of the two fluorescent dyes at each spot in the array corresponds to therelative concentration of each protein in the two samples [23]. Improvementsin sensitivity and signal–to–noise ratio will be required for this methodologyto become useful for measuring protein changes in biologically relevant sam-ples. A third strategy, which may be particularly useful for diagnostic assays,is to prepare arrays of antigens. Such arrays allow samples to be tested forthe presence and the titer of antibodies to particular antigens. This approachlends itself to develop broad–spectrum tests for certain autoimmune diseasesand for exposure to infectious agents. As for nucleic acids, bead arrays alsolend themselves to proteomic applications.
The technological challenges that remain are the development of specific,high affinity ligands that can be produced on a large scale and in a relativelyshort time. Distinguishing between various post-translational modifications,such as phosphorylation and amidation, are also technical features that needto be addressed. It is likely that different types of protein arrays will berequired for cataloging the proteome, detecting differences in expression, andfor screening compounds. For a more extensive review on the developmentof protein-detecting microarrays and related devices see Kodadek [24] andSchweitzer [3].
The development of arrays of functionally active proteins such as enzymesand receptors is progressing rapidly and the significant advances in this areaare the topic of Chaps. 14–16 in this book.
1 Array Formats 9
1.5 The ArrayPlateTM
HTG developed the ArrayPlateTM as a platform technology with an open ar-chitecture to conduct a variety of multiplexed assays in microtiter plates. Thegoal was to extend the capabilities and information content of conventionaldrug discovery and development assays for two purposes. The first was toprovide a technology to allow genomic and transcriptomic efforts to progressfrom target discovery to drug discovery, that is, from the description of disease-specific signature patterns of gene expression to the identification of signature-modulating compounds. How the multiplexed ArrayPlateTM mRNA assayachieves this is discussed. The second purpose was to provide screening labo-ratories with another means to increase their efficiency as multiplexing is syn-ergistic with both automation and miniaturization to enhance productivity.The multiplexed ELISA serves as an example for this. ArrayPlateTM assaysrely on a single hybridization to transition from an open to a closed architec-ture. The benefits of this hybridization step, termed “reagent programming”,that modifies the binding specificity of each element in a universal array, willbe outlined. For the mRNA assay, a multiplexed nuclease protection assayis combined with the capture of processed nuclease protection probes on thearray. Enzyme-mediated chemiluminescent detection subsequently quantifiesprobes in the mRNA assay and antigens in the multiplexed ELISA.
1.5.1 Materials and Methods
ArrayPlateTM Manufacture
The 96–well ArrayPlatesTM contained at the bottom of each well of flat-bottom poly-styrene microtiter plate (FalconTM) modified with N–oxysuccini-mide ester, a four–by–four array of 16 distinct oligonucleotide elements 100 µmin diameter and spaced 800 µm on center. Each of the 16 anchor oligonu-cleotides incorporated a unique 25–mer sequence and was 3′-modified withheptylamine. Arrays were printed with a PixSys 3000 microarrayer equippedwith 85 µm inner diameter ceramic dispensing tips (Cartesian Technologies,Irvine, CA) in an environmental chamber (26C and 80% relative humidity).
Oligonucleotides and Antibodies
The 16 target human mRNA species each required three oligonucleotides:A nuclease protection probe, a programming linker and a detection linker.These oligonucleotides were designed using ArrayPlateTM Oligo v.3.0 soft-ware (HTG, Tucson, AZ) and synthesized (Epoch Biosciences, San Diego, CAand Sigma–Genosys, The Woodlands, TX) as detailed elsewhere [25]. The 16genes examined were glyceraldehyde 3–phosphate dehydrogenase (GAPDH),interleukin–1β (IL–1β), tumor necrosis factor–α (TNF–α), tubulin, cathep-sin G (catG), cyclooxygenase–2 (cox–2), granulocyte colony stimulating fac-tor (G–CSF), granulocyte macrophage colony stimulating factor (GM–CSF),
10 Ralph R. Martel et al.
glutathione S–transferase Pi–1 (GST Pi–1), high mobility group 17 (HMG–17), cyclophilin (cyclo), β–thromboglobulin (bTG), lactate dehydrogenase(LDH), tissue inhibitor metalloprotease 1 (TIMP–1), matrix metaloproteinase9 (MMP–9) and β–actin.
Briefly, each programming linker was a 50–mer comprising a 5′ 25–mercomplementary to one of the 16 anchor oligonucleotides and a 3′ 25–mer com-plementary to one of the 16 target-specific nuclease protection probes. Eachnuclease protection probe was a 65–mer composed of a 50–base sequence with48% to 52% GC content, complementary to the target mRNA. Each protec-tion probe also incorporated a target-independent 15–mer control sequence.Each detection linker oligonucleotide was a 50–mer designed with a common3′ 25–mer sequence and a unique 5′ 25–mer complementary to the 5′–terminal25–mer of the corresponding nuclease protection probe. Finally, a detectionconjugate of horseradish peroxidase labelled with the 25–mer sequence com-plementary to the common 3′-end of all detection linkers was used to generatea luminescent signal.
All oligonucleotides were tested before use in an assay by means of a designof experiments protocol that ensured that each oligonucleotide hybridized asintended without showing unintended and interfering binding. The behaviorof individual oligonucleotide species was deduced from the observed behaviorof predefined oligonucleotide mixtures.
For the antibody assays, ELISA-ready antibody sets, recombinant anti-gen standards and streptavidin–peroxidase were obtained from R&D Systems(Minneapolis, MN).
Cell Culture and Treatments
The human THP–1 acute monocytic leukemia cell line (ATCC, Manassas,VA) was grown in either T–175 culture flasks or in 96–well V–bottom cellculture plates (Falcon) at 37C with 4% (v/v) CO2 and 80% relative hu-midity in RPMI 1640 medium supplemented with 10% (v/v) fetal bovineserum, 100 U/ml penicillin and 100 µg/ml streptomycin (Hyclone, Logan,UT). Phorbol merystil acetate (PMA) treatment (0.1 µg/ml in RPMI for 48hours) caused the cells to differentiate to adherent monocytes.
Cells activation was induced with four hours of treatment with 1 µg/mlbacterial lipopolysaccharide (LPS) (Sigma, St. Louis, MO) in culture medium.Dexamethasone (Sigma, St. Louis, MO) treatments were with compound dis-solved at various concentrations in culture medium. Cells growing in suspen-sion in microtiter plates were harvested by centrifugation at 180× g for 5 min-utes (GS15, Beckman Coulter, Fullerton, CA). Removal of culture mediumfrom cell pellets and from adherent cells in wells was by aspiration.
Multiplexed Nuclease Protection Assay
All reagent additions were performed with a 96–channel Biomek FX auto-mated pipettor (Beckman Coulter, Fullerton, CA). Media-free THP–1 cells
1 Array Formats 11
in 96–well culture plates received in rapid succession 30 µl/well lysis solution(HTG, Tucson, AZ) that contained each of the 16 nuclease protection probesat 30 pM and 60 µl/well mineral oil (Sigma, St. Louis, MO). The plates wereincubated for 10 minutes at 95C, for 6 hours at 70C and were allowed tocool to room temperature for 10 minutes. The plates received 20 µl/well S1nuclease solution (50 S1 units in 1.4 M sodium chloride, 22.5 mM zinc sulfate,250 mM sodium acetate, pH 4.5) (Promega, Madison, WI) and were incu-bated for 30 minutes at 50C. The plates received 10 µl/well 1.6 M sodiumhydroxide, 135 mM EDTA and were heated for 15 minutes at 95C. Aftercooling at room temperature for 15 minutes, the plates received 10 µl/wellNeutralizing Solution (1 M HEPES, pH 7.5, 1.6 M HCl, 6× SSC). For eachwell, 60 µl of the 70 µl aqueous subphase was transferred from the cell cultureplate to a programmed (i.e. programming linker-modified) ArrayPlateTM, fol-lowed immediately by the additional transfer of 60 µl of aqueous subphaseand overlayering oil.
Reagent Modification of Universal Arrays
The washing of ArrayPlatesTM was completed in 60 seconds with a 96–channelplate washer (ELx405 Auto Plate Washer, Bio–Tek Instruments, Minooski,VT) and consisted of six dispenses and aspirations of 300 µl/well 1× SSC(150 mM sodium chloride, 15 mM sodium citrate, pH 7) with 0.1% (v/v)Tween–20 (Sigma, St. Louis, MO).
Following a wash cycle, the ArrayPlatesTM received 50 µl/well program-ming linker solution that consisted of each of the 16 programming linkeroligonucleotides at 5 nM in SSCS (1× SSC, 0.1% (w/v) SDS). After a one-hour hybridization at 50C, the ArrayPlatesTM were washed again. Thesewere programmed (i.e. programming linker-modified) ArrayPlatesTM.
Capture and Detection of Protection Probes on the ArrayPlateTM
Programmed ArrayPlatesTM containing nuclease protection-processed celllysates were incubated overnight at 50C and washed. The ArrayPlatesTM re-ceived 50 µl/well detection linker solution that contained each of the 16 detec-tion linker oligonucleotides 5 nM in SSCS. The plates were incubated for onehour at 50C and washed. Next, the ArrayPlatesTM received 50 µl/well detec-tion enzyme conjugate solution and were incubated for 30 minutes at 37C fol-lowed by a wash. Detection enzyme conjugate solution contained 10 nM detec-tion enzyme conjugate in SSCS. The ArrayPlatesTM received 50 µl/well chemi-luminescent peroxidase substrate (Atto–PSTM Lumigen, Southfield, MI) andwere imaged from the bottom with an Omix CCD imager (HTG, Tucson, AZ)for 30 seconds to 6 minutes, depending on signal intensity, within 30 minutesof substrate addition.
12 Ralph R. Martel et al.
Image Analysis
Digital images of ArrayPlatesTM were analyzed with software (ArrayPlateTM
Fit v.3.31a, HTG, Tucson, AZ) that extracted luminescence intensity datafor each array element in a plate. The resulting data were exported ascomma-separated value (CSV) files that were processed further with soft-ware (ArrayPlateTM Crunch, HTG, Tucson, AZ) that allowed manipulationof the intensity data, for instance, to normalize signals within arrays to anycombination of array elements. Intensity data CSV files were also importedinto Excel spreadsheets (Microsoft, Redmond, WA) for further analysis.
1.5.2 Results and Discussion
Reagent Programming of Universal Arrays
The 96–well ArrayPlatesTM contain the same universal array of 16 distinct el-ements printed at the bottom of each well. Each element consists of a position-specific, covalently bound ‘anchor’ species that incorporates an oligonucleotide25–mer recognition feature. Since identical arrays are printed across all wellsof all plates, the manufacture of ArrayPlatesTM is standardized and subjectto rigorous quality control procedures.
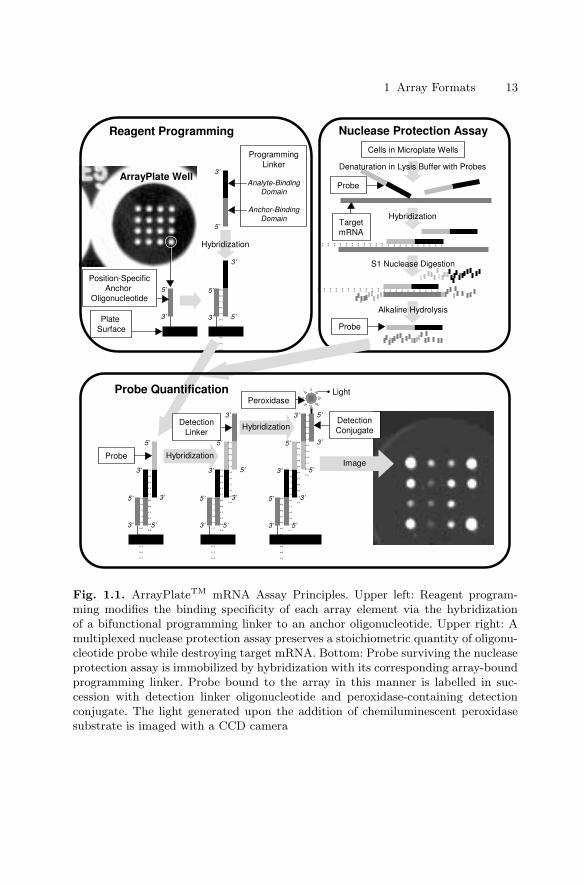
In spite of this standardized production, ArrayPlatesTM provide an openarchitecture to allow customized assays: A ‘reagent programming’ hybridiza-tion immobilizes specific capture reagents at preselected positions in the uni-versal array. This is achieved using a cocktail that contains 16 bifunctional‘programming linker’ species. Each programming linker contains both anoligonucleotide complementary to a specific anchor and an analyte-specific re-gion. Thus, the hybridization of linkers to anchors immobilizes analyte-specificreagents at predetermined positions within the array (Fig. 1.1, top left panel).
Reagent programming provides versatility. The analyte-specific region of aprogramming linker can be an oligonucleotide, a peptide, a protein or a chem-ical compound, depending upon the type of assay that is to be performed:Programming linkers that consist of antibody conjugated to anchor-bindingoligonucleotide are suited for multiplexed ELISAs or for setting up arrays ofantigens. Programming linkers that have two oligonucleotide regions serve tocapture target RNA, DNA or oligonucleotides. Conjugates of anchor-bindingoligonucleotide and substrate peptides can be used for instance, for multi-plexed kinase and phosphatase assays. With reagent programming, differentcombinations of assay capacity versus content become possible. For example,the user can program all the wells in a plate identically to measure 16 targetsper sample across 96 samples. Alternatively, by programming arrays in pairsand splitting samples across two wells, 32 targets (16×2) can be measured in48 samples (96÷2).
1 Array Formats 13
ArrayPlate Well
5’
3’Plate
Surface
Position-Specific
Anchor
Oligonucleotide
Reagent Programming
5’
3’
Programming
Linker
Analyte-Binding
Domain
Anchor-Binding
Domain
5’
3’
I I I I I I I I I I I
5’
3’
Hybridization I I I I I I I I I I I I I I I I I I I I I
Cells in Microplate Wells
Hybridization
S1 Nuclease Digestion
Alkaline Hydrolysis
I I I I I I I I I I I I I I I I I I I I I
Probe
Denaturation in Lysis Buffer with Probes
Probe
Target
mRNA
Nuclease Protection Assay
I I I I I I I I I I I
I I I I I I I I I I I
5’
3’
5’
5’
3’
3’
Hybridization
I I I I I I I I I I I
I I I I I I I I I I I
I I I I I I I I I I I
I I I I I I I I I I I
5’
3’
5’
5’
5’
5’
3’
3’
3’
3’
Light
I I I I I I I I I I I
I I I I I I I I I I I
I I I I I I I I I I I
5’
3’ 5’
5’3’
3’
3’
5’
ImageProbe
Detection
LinkerHybridization
Detection
Conjugate
Peroxidase
Probe Quantification
Fig. 1.1. ArrayPlateTM mRNA Assay Principles. Upper left: Reagent program-ming modifies the binding specificity of each array element via the hybridizationof a bifunctional programming linker to an anchor oligonucleotide. Upper right: Amultiplexed nuclease protection assay preserves a stoichiometric quantity of oligonu-cleotide probe while destroying target mRNA. Bottom: Probe surviving the nucleaseprotection assay is immobilized by hybridization with its corresponding array-boundprogramming linker. Probe bound to the array in this manner is labelled in suc-cession with detection linker oligonucleotide and peroxidase-containing detectionconjugate. The light generated upon the addition of chemiluminescent peroxidasesubstrate is imaged with a CCD camera
14 Ralph R. Martel et al.
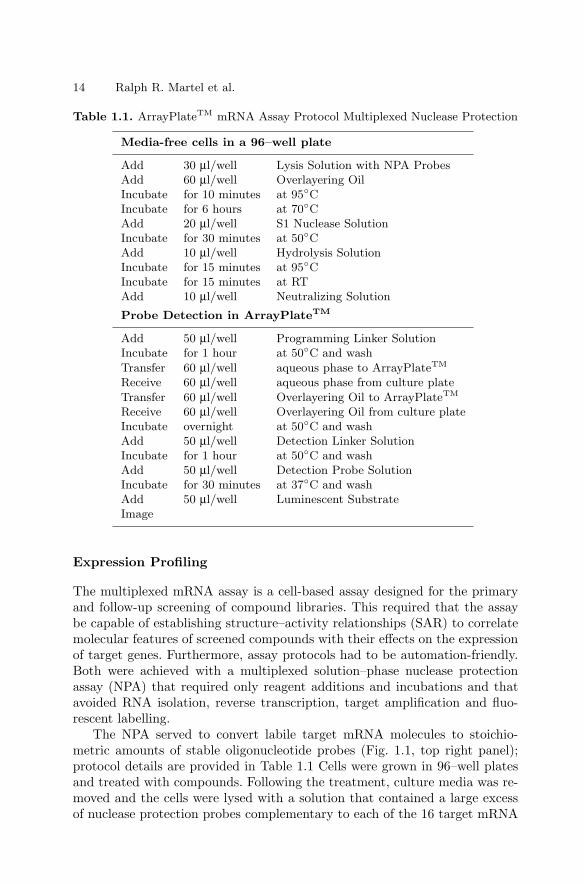
Table 1.1. ArrayPlateTM mRNA Assay Protocol Multiplexed Nuclease Protection
Media-free cells in a 96–well plate
Add 30 µl/well Lysis Solution with NPA ProbesAdd 60 µl/well Overlayering OilIncubate for 10 minutes at 95CIncubate for 6 hours at 70CAdd 20 µl/well S1 Nuclease SolutionIncubate for 30 minutes at 50CAdd 10 µl/well Hydrolysis SolutionIncubate for 15 minutes at 95CIncubate for 15 minutes at RTAdd 10 µl/well Neutralizing Solution
Probe Detection in ArrayPlateTM
Add 50 µl/well Programming Linker SolutionIncubate for 1 hour at 50C and washTransfer 60 µl/well aqueous phase to ArrayPlateTM
Receive 60 µl/well aqueous phase from culture plateTransfer 60 µl/well Overlayering Oil to ArrayPlateTM
Receive 60 µl/well Overlayering Oil from culture plateIncubate overnight at 50C and washAdd 50 µl/well Detection Linker SolutionIncubate for 1 hour at 50C and washAdd 50 µl/well Detection Probe SolutionIncubate for 30 minutes at 37C and washAdd 50 µl/well Luminescent SubstrateImage
Expression Profiling
The multiplexed mRNA assay is a cell-based assay designed for the primaryand follow-up screening of compound libraries. This required that the assaybe capable of establishing structure–activity relationships (SAR) to correlatemolecular features of screened compounds with their effects on the expressionof target genes. Furthermore, assay protocols had to be automation-friendly.Both were achieved with a multiplexed solution–phase nuclease protectionassay (NPA) that required only reagent additions and incubations and thatavoided RNA isolation, reverse transcription, target amplification and fluo-rescent labelling.
The NPA served to convert labile target mRNA molecules to stoichio-metric amounts of stable oligonucleotide probes (Fig. 1.1, top right panel);protocol details are provided in Table 1.1 Cells were grown in 96–well platesand treated with compounds. Following the treatment, culture media was re-moved and the cells were lysed with a solution that contained a large excessof nuclease protection probes complementary to each of the 16 target mRNA
1 Array Formats 15
species. A heat denaturation step served to inactivate endogenous nucleasesand to remove secondary structure in the target mRNA species. During a sub-sequent incubation, probe hybridized to mRNA. S1 nuclease, an enzyme thatspecifically cleaves single-stranded nucleic acids [26–28], was added to digestexcess probes and unhybridized mRNA, leaving only duplexes of probe andmRNA intact. An alkaline hydrolysis simultaneously inactivated the S1 nucle-ase and destroyed the RNA component of the mRNA:probe duplexes. Uponneutralization of the samples, nuclease protection probes remained in amountsproportional to the concentration of the complementary target mRNA speciesthat had been present in the original cell sample. These probes were subse-quently quantified with an ArrayPlateTM. Since all nuclease protection probeswere designed to have similar lengths and GC content regardless of their targetgenes, various probes showed similar behaviors in the assay and consequently,a standardized NPA protocol could be used.
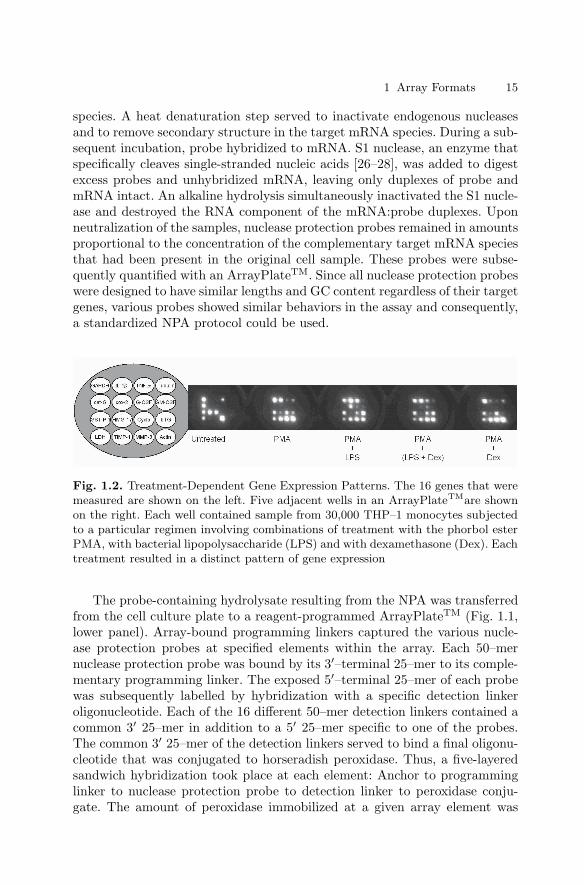
Fig. 1.2. Treatment-Dependent Gene Expression Patterns. The 16 genes that weremeasured are shown on the left. Five adjacent wells in an ArrayPlateTMare shownon the right. Each well contained sample from 30,000 THP–1 monocytes subjectedto a particular regimen involving combinations of treatment with the phorbol esterPMA, with bacterial lipopolysaccharide (LPS) and with dexamethasone (Dex). Eachtreatment resulted in a distinct pattern of gene expression
The probe-containing hydrolysate resulting from the NPA was transferredfrom the cell culture plate to a reagent-programmed ArrayPlateTM (Fig. 1.1,lower panel). Array-bound programming linkers captured the various nucle-ase protection probes at specified elements within the array. Each 50–mernuclease protection probe was bound by its 3′–terminal 25–mer to its comple-mentary programming linker. The exposed 5′–terminal 25–mer of each probewas subsequently labelled by hybridization with a specific detection linkeroligonucleotide. Each of the 16 different 50–mer detection linkers contained acommon 3′ 25–mer in addition to a 5′ 25–mer specific to one of the probes.The common 3′ 25–mer of the detection linkers served to bind a final oligonu-cleotide that was conjugated to horseradish peroxidase. Thus, a five-layeredsandwich hybridization took place at each element: Anchor to programminglinker to nuclease protection probe to detection linker to peroxidase conju-gate. The amount of peroxidase immobilized at a given array element was
16 Ralph R. Martel et al.
determined by the amount of nuclease protection probe bound there as thisprobe was the limiting reagent.
Upon the addition of chemiluminescent peroxidase substrate, light wasgenerated at each array element in proportion to the amount of peroxi-dase immobilized there. Within 30 minutes of substrate addition, the entireArrayPlateTM was imaged for 30 seconds to 6 minutes with a high resolutionCCD imager. The digital images of ArrayPlatesTM were analyzed with imageanalysis software that reported the signal intensity for each element in a plateafter correcting the intensity for local background and, when applicable, forthe contribution of adjacent elements.
Changes in the patterns of expression of 16 genes in THP–1 monocytessubjected to various treatment regimens are shown in Fig. 1.2. Various treat-ments were useful to establish performance characteristics for the assay.
Performance Characteristics
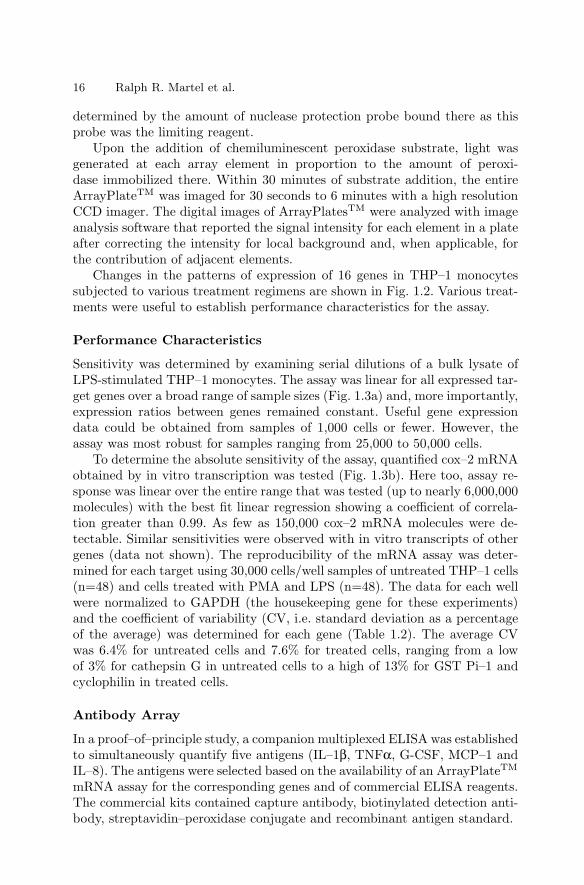
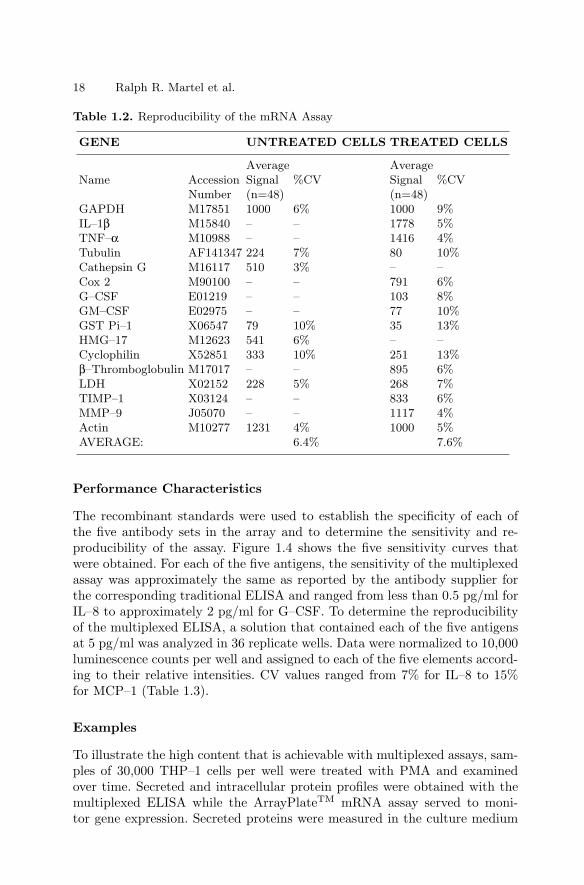
Sensitivity was determined by examining serial dilutions of a bulk lysate ofLPS-stimulated THP–1 monocytes. The assay was linear for all expressed tar-get genes over a broad range of sample sizes (Fig. 1.3a) and, more importantly,expression ratios between genes remained constant. Useful gene expressiondata could be obtained from samples of 1,000 cells or fewer. However, theassay was most robust for samples ranging from 25,000 to 50,000 cells.
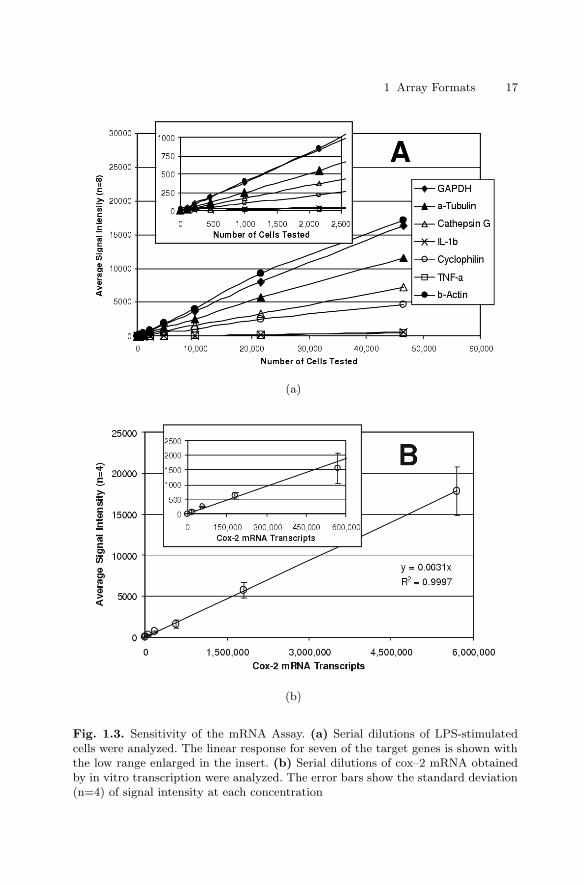
To determine the absolute sensitivity of the assay, quantified cox–2 mRNAobtained by in vitro transcription was tested (Fig. 1.3b). Here too, assay re-sponse was linear over the entire range that was tested (up to nearly 6,000,000molecules) with the best fit linear regression showing a coefficient of correla-tion greater than 0.99. As few as 150,000 cox–2 mRNA molecules were de-tectable. Similar sensitivities were observed with in vitro transcripts of othergenes (data not shown). The reproducibility of the mRNA assay was deter-mined for each target using 30,000 cells/well samples of untreated THP–1 cells(n=48) and cells treated with PMA and LPS (n=48). The data for each wellwere normalized to GAPDH (the housekeeping gene for these experiments)and the coefficient of variability (CV, i.e. standard deviation as a percentageof the average) was determined for each gene (Table 1.2). The average CVwas 6.4% for untreated cells and 7.6% for treated cells, ranging from a lowof 3% for cathepsin G in untreated cells to a high of 13% for GST Pi–1 andcyclophilin in treated cells.
Antibody Array
In a proof–of–principle study, a companion multiplexed ELISA was establishedto simultaneously quantify five antigens (IL–1β, TNFα, G-CSF, MCP–1 andIL–8). The antigens were selected based on the availability of an ArrayPlateTM
mRNA assay for the corresponding genes and of commercial ELISA reagents.The commercial kits contained capture antibody, biotinylated detection anti-body, streptavidin–peroxidase conjugate and recombinant antigen standard.
1 Array Formats 17
(a)
(b)
Fig. 1.3. Sensitivity of the mRNA Assay. (a) Serial dilutions of LPS-stimulatedcells were analyzed. The linear response for seven of the target genes is shown withthe low range enlarged in the insert. (b) Serial dilutions of cox–2 mRNA obtainedby in vitro transcription were analyzed. The error bars show the standard deviation(n=4) of signal intensity at each concentration
18 Ralph R. Martel et al.
Table 1.2. Reproducibility of the mRNA Assay
GENE UNTREATED CELLS TREATED CELLS
Average AverageName Accession Signal %CV Signal %CV
Number (n=48) (n=48)GAPDH M17851 1000 6% 1000 9%IL–1β M15840 – – 1778 5%TNF–α M10988 – – 1416 4%Tubulin AF141347 224 7% 80 10%Cathepsin G M16117 510 3% – –Cox 2 M90100 – – 791 6%G–CSF E01219 – – 103 8%GM–CSF E02975 – – 77 10%GST Pi–1 X06547 79 10% 35 13%HMG–17 M12623 541 6% – –Cyclophilin X52851 333 10% 251 13%β–Thromboglobulin M17017 – – 895 6%LDH X02152 228 5% 268 7%TIMP–1 X03124 – – 833 6%MMP–9 J05070 – – 1117 4%Actin M10277 1231 4% 1000 5%AVERAGE: 6.4% 7.6%
Performance Characteristics
The recombinant standards were used to establish the specificity of each ofthe five antibody sets in the array and to determine the sensitivity and re-producibility of the assay. Figure 1.4 shows the five sensitivity curves thatwere obtained. For each of the five antigens, the sensitivity of the multiplexedassay was approximately the same as reported by the antibody supplier forthe corresponding traditional ELISA and ranged from less than 0.5 pg/ml forIL–8 to approximately 2 pg/ml for G–CSF. To determine the reproducibilityof the multiplexed ELISA, a solution that contained each of the five antigensat 5 pg/ml was analyzed in 36 replicate wells. Data were normalized to 10,000luminescence counts per well and assigned to each of the five elements accord-ing to their relative intensities. CV values ranged from 7% for IL–8 to 15%for MCP–1 (Table 1.3).
Examples
To illustrate the high content that is achievable with multiplexed assays, sam-ples of 30,000 THP–1 cells per well were treated with PMA and examinedover time. Secreted and intracellular protein profiles were obtained with themultiplexed ELISA while the ArrayPlateTM mRNA assay served to moni-tor gene expression. Secreted proteins were measured in the culture medium
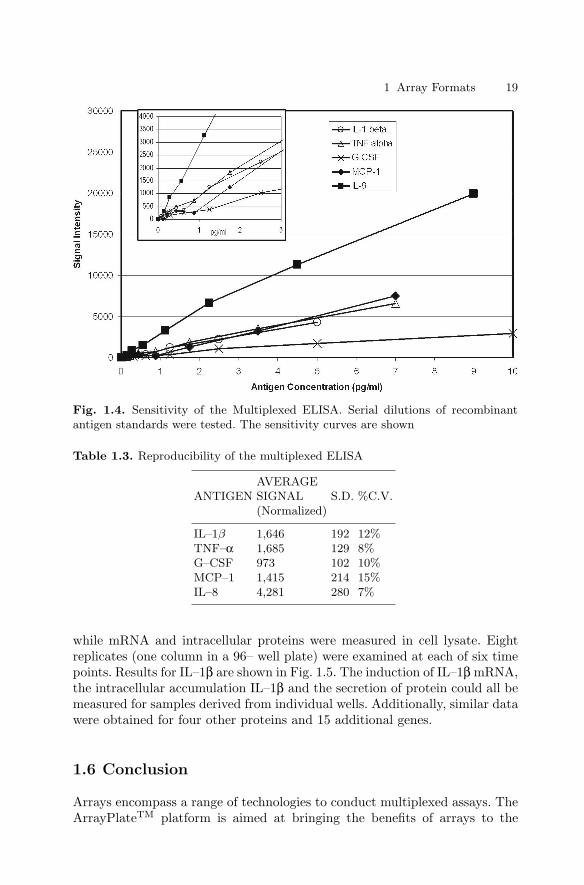
1 Array Formats 19
Fig. 1.4. Sensitivity of the Multiplexed ELISA. Serial dilutions of recombinantantigen standards were tested. The sensitivity curves are shown
Table 1.3. Reproducibility of the multiplexed ELISA
AVERAGEANTIGEN SIGNAL S.D. %C.V.
(Normalized)
IL–1β 1,646 192 12%TNF–α 1,685 129 8%G–CSF 973 102 10%MCP–1 1,415 214 15%IL–8 4,281 280 7%
while mRNA and intracellular proteins were measured in cell lysate. Eightreplicates (one column in a 96– well plate) were examined at each of six timepoints. Results for IL–1β are shown in Fig. 1.5. The induction of IL–1β mRNA,the intracellular accumulation IL–1β and the secretion of protein could all bemeasured for samples derived from individual wells. Additionally, similar datawere obtained for four other proteins and 15 additional genes.
1.6 Conclusion
Arrays encompass a range of technologies to conduct multiplexed assays. TheArrayPlateTM platform is aimed at bringing the benefits of arrays to the
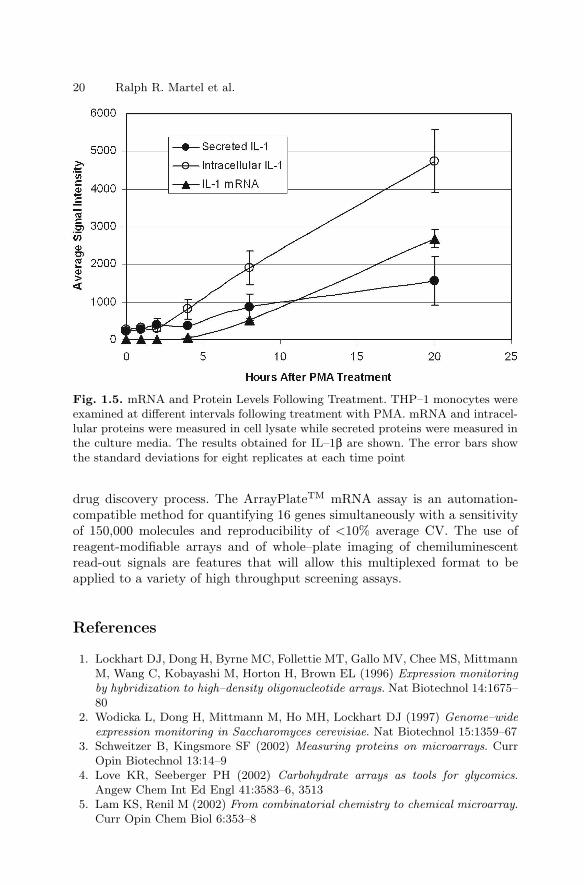
20 Ralph R. Martel et al.
Fig. 1.5. mRNA and Protein Levels Following Treatment. THP–1 monocytes wereexamined at different intervals following treatment with PMA. mRNA and intracel-lular proteins were measured in cell lysate while secreted proteins were measured inthe culture media. The results obtained for IL–1β are shown. The error bars showthe standard deviations for eight replicates at each time point
drug discovery process. The ArrayPlateTM mRNA assay is an automation-compatible method for quantifying 16 genes simultaneously with a sensitivityof 150,000 molecules and reproducibility of <10% average CV. The use ofreagent-modifiable arrays and of whole–plate imaging of chemiluminescentread-out signals are features that will allow this multiplexed format to beapplied to a variety of high throughput screening assays.
References
1. Lockhart DJ, Dong H, Byrne MC, Follettie MT, Gallo MV, Chee MS, MittmannM, Wang C, Kobayashi M, Horton H, Brown EL (1996) Expression monitoringby hybridization to high–density oligonucleotide arrays. Nat Biotechnol 14:1675–80
2. Wodicka L, Dong H, Mittmann M, Ho MH, Lockhart DJ (1997) Genome–wideexpression monitoring in Saccharomyces cerevisiae. Nat Biotechnol 15:1359–67
3. Schweitzer B, Kingsmore SF (2002) Measuring proteins on microarrays. CurrOpin Biotechnol 13:14–9
4. Love KR, Seeberger PH (2002) Carbohydrate arrays as tools for glycomics.Angew Chem Int Ed Engl 41:3583–6, 3513
5. Lam KS, Renil M (2002) From combinatorial chemistry to chemical microarray.Curr Opin Chem Biol 6:353–8
1 Array Formats 21
6. Wu RZ, Bailey SN, Sabatini DM (2002) Cell–biological applications oftransfected–cell microarrays. Trends Cell Biol 12:485–8
7. Fejzo MS, Slamon DJ (2001) Frozen tumor tissue microarray technology foranalysis of tumor RNA, DNA, and proteins. Am J Pathol 159:1645–50
8. Yang L, Tran DK, Wang X (2001) BADGE, Beads Array for the Detection ofGene Expression, a high–throughput diagnostic bioassay. Genome Res 11:1888–98
9. Tung WS, Lee JK, Thompson RW (2001) Simultaneous analysis of 1176 geneproducts in normal human aorta and abdominal aortic aneurysms using amembrane–based complementary DNA expression array. J Vasc Surg 34:143–50
10. Golub TR, Slonim DK, Tamayo P, Huard C, Gaasenbeek M, Mesirov JP, CollerH, Loh ML, Downing JR, Caligiuri MA, Bloomfield CD, Lander ES (1999)Molecular classification of cancer: class discovery and class prediction by geneexpression monitoring. Science 286:531–7
11. Hedenfalk I, Duggan D, Chen Y, Radmacher M, Bittner M, Simon R, MeltzerP, Gusterson B, Esteller M, Kallioniemi OP, Wilfond B, Borg A, Trent J (2001)Gene–expression profiles in hereditary breast cancer. N Engl J Med 344:539–48
12. Heller RA, Schena M , Chai A, Shalon D, Bedilion T, Gilmore J, Woolley DE,Davis RW (1997) Discovery and analysis of inflammatory disease–related genesusing cDNA microarrays. Proc Natl Acad Sci USA 94:2150–5
13. Blackwell HE, Perez L, Stavenger RA, Tallarico JA, Cope Eatough E, FoleyMA, Schreiber SL (2001) A one–bead, one–stock solution approach to chemicalgenetics: part 1. Chem Biol 8:1167–82
14. LeProust E, Pellois JP, Yu P, Zhang H, Gao X, Srivannavit O, Gulari E, Zhou X(2000) Digital light–directed synthesis. A microarray platform that permits rapidreaction optimization on a combinatorial basis. J Comb Chem 2:349–54
15. Fodor SP, Read JL, Pirrung MC, Stryer L, Lu AT, Solas D (1991) Light–directed,spatially addressable parallel chemical synthesis. Science 251:767–773
16. David CA, Middleton T, Montgomery D, Lim HB, Kati W, Molla A, XueiX, Warrior U, Kofron JL, Burns DJ (2002) Microarray compound screening(microARCS) to identify inhibitors of HIV integrase. J Biomol Screen 7:259–66
17. Heller JH (2002) DNA microarray technology: devices, systems, and applications.Annu Rev Biomed Eng 4:129–53
18. Shoemaker DD, Linsley PS (2002) Recent developments in DNA microarrays.Curr Opin Microbiol 5:334–337
19. Oliphant A, Barker DL, Stuelpnagel JR, Chee MS (2002) BeadArray technol-ogy: enabling an accurate, cost–effective approach to high–throughput genotyping.Biotechniques Suppl 32:56–61
20. Umek RM, Lin SW, Vielmetter J, Terbrueggen RH, Irvine B, Yu CJ, KayyemJF, Yowanto H, Blackburn GF, Farkas DH, Chen YP (2001) Electronic detectionof nucleic acids: a versatile platform for molecular diagnostics. J Mol Diagn3:74–84
21. Velculescu VE, Zhang L, Vogelstein B, Kinzler KW (1995) Serial Analysis ofGene Expression. Science 270: 484–487
22. Bertelson AH, Velculescu VE (1998) High–throughput Gene Expression AnalysisUsing SAGE. Drug Discovery Today 3:152–159
23. Haab BB, Dunham MJ, Brown PO (2001) Protein microarrays for highly par-allel detection and quantitation of specific proteins and antibodies in complexsolutions. Genome Biol 2:research0004.1–0004.13

22 Ralph R. Martel et al.
24. Kodadek T (2002) Development of protein–detecting microarrays and relateddevices. Trends Biochem Sci 27:295–300
25. Martel RR, Botros IW, Rounseville MP, Hinton JP, Staples RR, Morales DA,Farmer JB, Seligmann BE (2002) Multiplexed screening assay for mRNA com-bining nuclease protection with luminescent array detection. Assay Drug DevTech 1:61–71
26. Berk AJ, Sharp PA (1977) Sizing and mapping of early adenovirus mRNAs bygel electrophoresis of S1 endonuclease–digested hybrids. Cell 12:721–32
27. Maxwell IH, Van Ness J, Hahn WE (1978) Assay of DNA–RNA hybrids by S1nuclease digestion and adsorption to DEAE–cellulose filters. Nucleic Acids Res5:2033–8
28. Wittelsberger SC, Hansen JN (1977) The specificity of S1 nuclease toward RNA–DNA hybrids as studied using isotopes of phosphorus–32 and phosphorus–33.Nucleic Acids Res 4:1829–35
2
Biomolecules and Cells on Surfaces –Fundamental Concepts
Kristi L. Hanson, Luisa Filipponi, and Dan V. Nicolau
2.1 Introduction
In microarray technology, surfaces must be designed and prepared to opti-mize the immobilization of probe biomolecules and/or cells, but also to resistnon-specific binding of target species. Further, the surface and type of im-mobilization technique selected will affect the concentration, bioactivity andtarget–binding ability of bound species. For any given probe molecule, thereis likely to be an optimal surface and/or technique which will allow for attach-ment at the highest possible concentration and with preservation of requiredactivity. However, for multi–probe array formats requiring a variety of probemolecules to be bound to the same type of surface, difficulties are encoun-tered selecting a surface and immobilization method able to generate sufficientprobe concentration, resolution and bioactivity for all probes. The resultingvariability in probe concentration and activity within the array also leads tosignal variability, causing difficulty in data interpretation. Thus, appropriateattachment methods are critical to the success of any array technology.
The aim of this chapter is to summarize the general knowledge and fun-damental concepts underlying DNA, protein, small biomolecule and cell at-tachment to surfaces, and to highlight issues arising in the field of microarrayfabrication. The section will provide background knowledge for the readernot familiar with general biomolecule immobilization techniques, while morespecific protocols used in microarray technology will be discussed further inChap. 3.
2.2 Types of Immobilization
Biomolecule attachment is dependent on the properties of the biomolecularsurface, the solid surface, and the liquid medium. In most cases, the biomolec-ular surface will display a higher level of complexity than the attachmentsurface or the liquid medium, as biomolecules and cells exhibit not only an
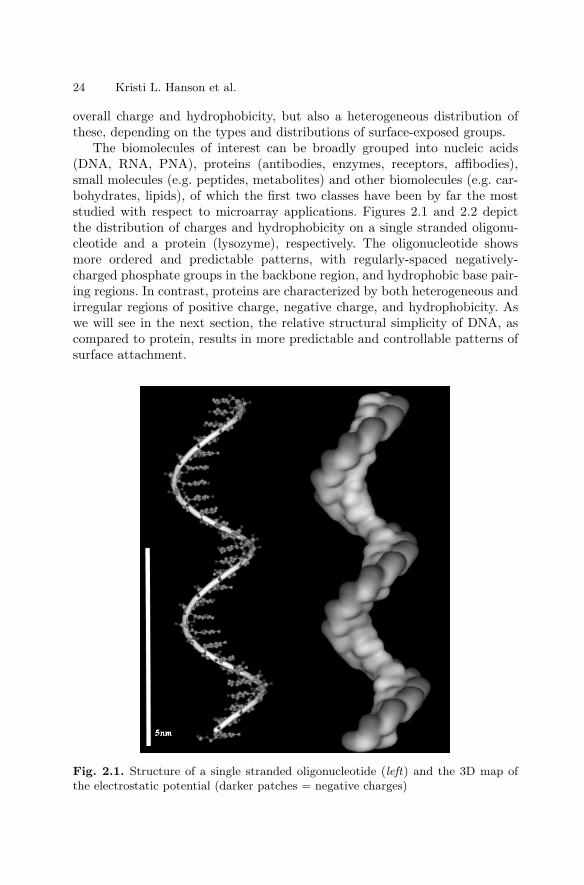
24 Kristi L. Hanson et al.
overall charge and hydrophobicity, but also a heterogeneous distribution ofthese, depending on the types and distributions of surface-exposed groups.
The biomolecules of interest can be broadly grouped into nucleic acids(DNA, RNA, PNA), proteins (antibodies, enzymes, receptors, affibodies),small molecules (e.g. peptides, metabolites) and other biomolecules (e.g. car-bohydrates, lipids), of which the first two classes have been by far the moststudied with respect to microarray applications. Figures 2.1 and 2.2 depictthe distribution of charges and hydrophobicity on a single stranded oligonu-cleotide and a protein (lysozyme), respectively. The oligonucleotide showsmore ordered and predictable patterns, with regularly-spaced negatively-charged phosphate groups in the backbone region, and hydrophobic base pair-ing regions. In contrast, proteins are characterized by both heterogeneous andirregular regions of positive charge, negative charge, and hydrophobicity. Aswe will see in the next section, the relative structural simplicity of DNA, ascompared to protein, results in more predictable and controllable patterns ofsurface attachment.
Fig. 2.1. Structure of a single stranded oligonucleotide (left) and the 3D map ofthe electrostatic potential (darker patches = negative charges)
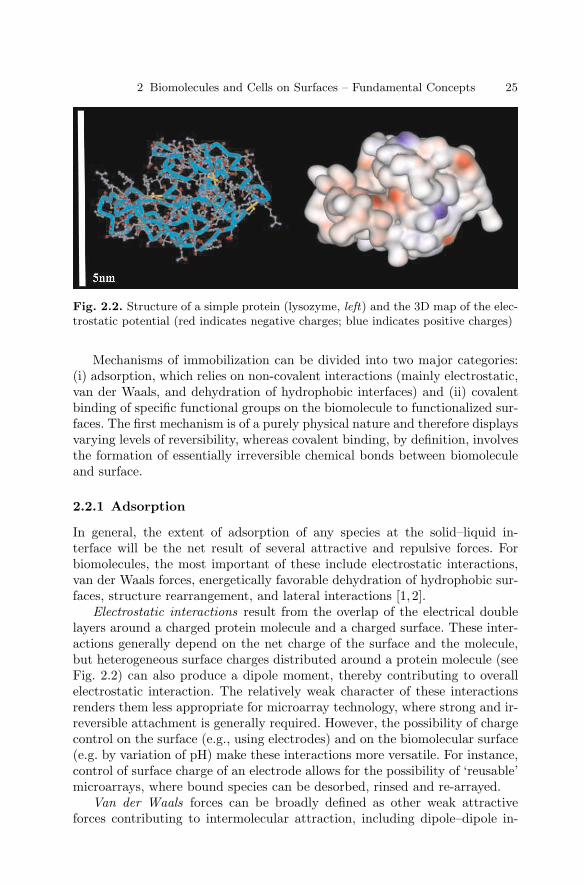
2 Biomolecules and Cells on Surfaces – Fundamental Concepts 25
Fig. 2.2. Structure of a simple protein (lysozyme, left) and the 3D map of the elec-trostatic potential (red indicates negative charges; blue indicates positive charges)
Mechanisms of immobilization can be divided into two major categories:(i) adsorption, which relies on non-covalent interactions (mainly electrostatic,van der Waals, and dehydration of hydrophobic interfaces) and (ii) covalentbinding of specific functional groups on the biomolecule to functionalized sur-faces. The first mechanism is of a purely physical nature and therefore displaysvarying levels of reversibility, whereas covalent binding, by definition, involvesthe formation of essentially irreversible chemical bonds between biomoleculeand surface.
2.2.1 Adsorption
In general, the extent of adsorption of any species at the solid–liquid in-terface will be the net result of several attractive and repulsive forces. Forbiomolecules, the most important of these include electrostatic interactions,van der Waals forces, energetically favorable dehydration of hydrophobic sur-faces, structure rearrangement, and lateral interactions [1, 2].
Electrostatic interactions result from the overlap of the electrical doublelayers around a charged protein molecule and a charged surface. These inter-actions generally depend on the net charge of the surface and the molecule,but heterogeneous surface charges distributed around a protein molecule (seeFig. 2.2) can also produce a dipole moment, thereby contributing to overallelectrostatic interaction. The relatively weak character of these interactionsrenders them less appropriate for microarray technology, where strong and ir-reversible attachment is generally required. However, the possibility of chargecontrol on the surface (e.g., using electrodes) and on the biomolecular surface(e.g. by variation of pH) make these interactions more versatile. For instance,control of surface charge of an electrode allows for the possibility of ‘reusable’microarrays, where bound species can be desorbed, rinsed and re-arrayed.
Van der Waals forces can be broadly defined as other weak attractiveforces contributing to intermolecular attraction, including dipole–dipole in-
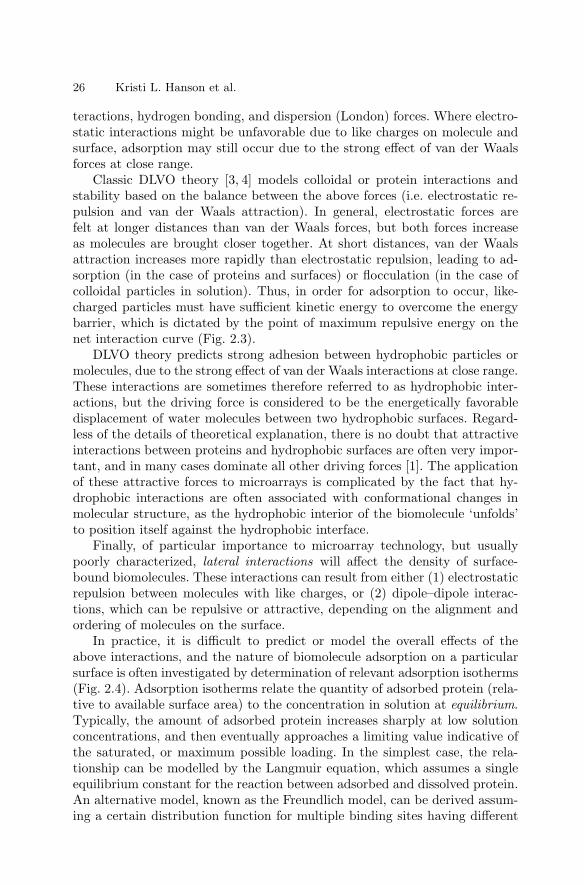
26 Kristi L. Hanson et al.
teractions, hydrogen bonding, and dispersion (London) forces. Where electro-static interactions might be unfavorable due to like charges on molecule andsurface, adsorption may still occur due to the strong effect of van der Waalsforces at close range.
Classic DLVO theory [3, 4] models colloidal or protein interactions andstability based on the balance between the above forces (i.e. electrostatic re-pulsion and van der Waals attraction). In general, electrostatic forces arefelt at longer distances than van der Waals forces, but both forces increaseas molecules are brought closer together. At short distances, van der Waalsattraction increases more rapidly than electrostatic repulsion, leading to ad-sorption (in the case of proteins and surfaces) or flocculation (in the case ofcolloidal particles in solution). Thus, in order for adsorption to occur, like-charged particles must have sufficient kinetic energy to overcome the energybarrier, which is dictated by the point of maximum repulsive energy on thenet interaction curve (Fig. 2.3).
DLVO theory predicts strong adhesion between hydrophobic particles ormolecules, due to the strong effect of van der Waals interactions at close range.These interactions are sometimes therefore referred to as hydrophobic inter-actions, but the driving force is considered to be the energetically favorabledisplacement of water molecules between two hydrophobic surfaces. Regard-less of the details of theoretical explanation, there is no doubt that attractiveinteractions between proteins and hydrophobic surfaces are often very impor-tant, and in many cases dominate all other driving forces [1]. The applicationof these attractive forces to microarrays is complicated by the fact that hy-drophobic interactions are often associated with conformational changes inmolecular structure, as the hydrophobic interior of the biomolecule ‘unfolds’to position itself against the hydrophobic interface.
Finally, of particular importance to microarray technology, but usuallypoorly characterized, lateral interactions will affect the density of surface-bound biomolecules. These interactions can result from either (1) electrostaticrepulsion between molecules with like charges, or (2) dipole–dipole interac-tions, which can be repulsive or attractive, depending on the alignment andordering of molecules on the surface.
In practice, it is difficult to predict or model the overall effects of theabove interactions, and the nature of biomolecule adsorption on a particularsurface is often investigated by determination of relevant adsorption isotherms(Fig. 2.4). Adsorption isotherms relate the quantity of adsorbed protein (rela-tive to available surface area) to the concentration in solution at equilibrium.Typically, the amount of adsorbed protein increases sharply at low solutionconcentrations, and then eventually approaches a limiting value indicative ofthe saturated, or maximum possible loading. In the simplest case, the rela-tionship can be modelled by the Langmuir equation, which assumes a singleequilibrium constant for the reaction between adsorbed and dissolved protein.An alternative model, known as the Freundlich model, can be derived assum-ing a certain distribution function for multiple binding sites having different
2 Biomolecules and Cells on Surfaces – Fundamental Concepts 27
Fig. 2.3. Net interaction curve formed by subtracting the attraction curve (dueto van der Waals forces) from the repulsion curve (due to electrostatic repulsion oflike-charged particles)
equilibrium constants. In most cases, one or both of these models can be fitto protein adsorption data.
Evaluation of such isotherms is particularly useful when comparing dif-ferent adsorption strategies, and can provide insight into maximum possibleprotein loading concentration, binding geometries and lateral interactions. Forexample, if the dimensions of the biomolecule are known, the maximum sur-face coverage achieved can be compared to theoretical monolayer coveragein all possible binding geometries, thereby allowing inference of attachmentdensity and/or attachment orientation.
2.2.2 Covalent Attachment
The covalent binding of biomolecules allows for very strong attachment andin certain instances a positional linking at one end of a biomolecule. A variety
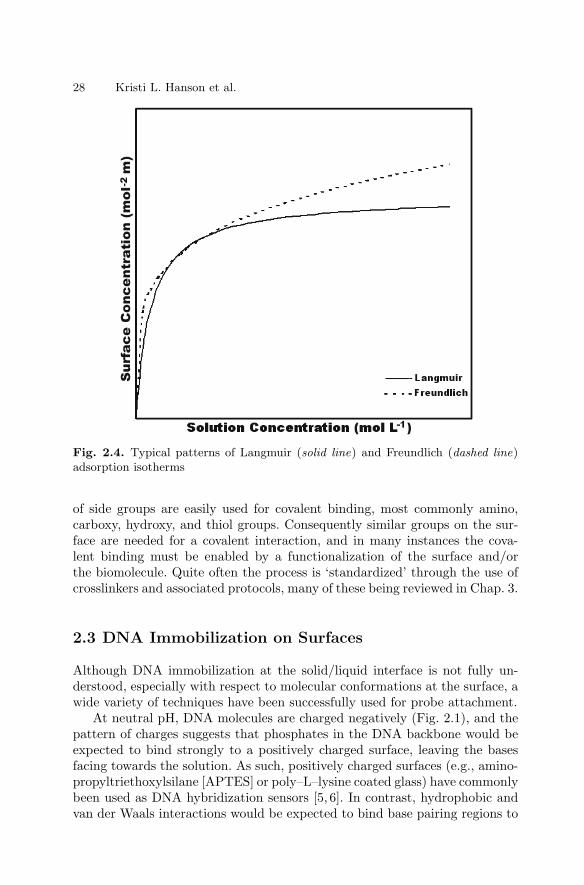
28 Kristi L. Hanson et al.
Fig. 2.4. Typical patterns of Langmuir (solid line) and Freundlich (dashed line)adsorption isotherms
of side groups are easily used for covalent binding, most commonly amino,carboxy, hydroxy, and thiol groups. Consequently similar groups on the sur-face are needed for a covalent interaction, and in many instances the cova-lent binding must be enabled by a functionalization of the surface and/orthe biomolecule. Quite often the process is ‘standardized’ through the use ofcrosslinkers and associated protocols, many of these being reviewed in Chap. 3.
2.3 DNA Immobilization on Surfaces
Although DNA immobilization at the solid/liquid interface is not fully un-derstood, especially with respect to molecular conformations at the surface, awide variety of techniques have been successfully used for probe attachment.
At neutral pH, DNA molecules are charged negatively (Fig. 2.1), and thepattern of charges suggests that phosphates in the DNA backbone would beexpected to bind strongly to a positively charged surface, leaving the basesfacing towards the solution. As such, positively charged surfaces (e.g., amino-propyltriethoxylsilane [APTES] or poly–L–lysine coated glass) have commonlybeen used as DNA hybridization sensors [5, 6]. In contrast, hydrophobic andvan der Waals interactions would be expected to bind base pairing regions to
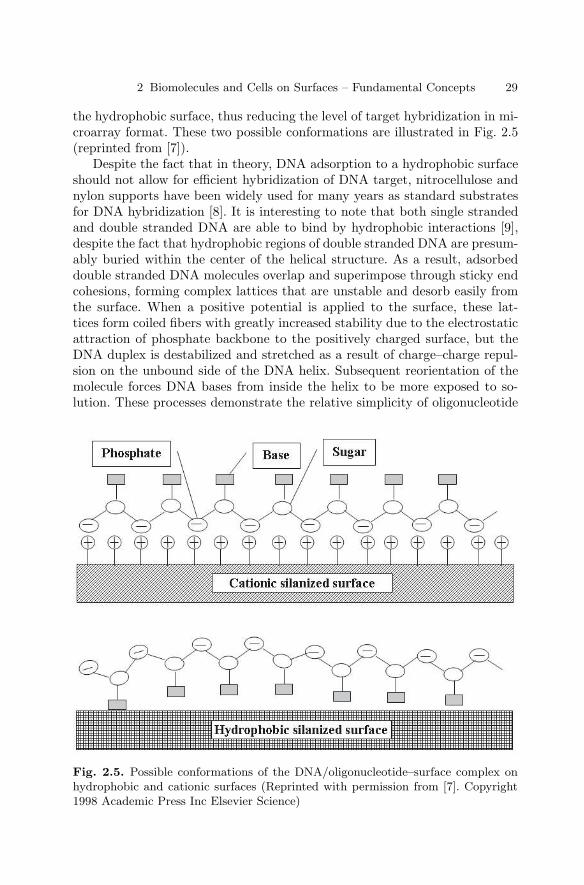
2 Biomolecules and Cells on Surfaces – Fundamental Concepts 29
the hydrophobic surface, thus reducing the level of target hybridization in mi-croarray format. These two possible conformations are illustrated in Fig. 2.5(reprinted from [7]).
Despite the fact that in theory, DNA adsorption to a hydrophobic surfaceshould not allow for efficient hybridization of DNA target, nitrocellulose andnylon supports have been widely used for many years as standard substratesfor DNA hybridization [8]. It is interesting to note that both single strandedand double stranded DNA are able to bind by hydrophobic interactions [9],despite the fact that hydrophobic regions of double stranded DNA are presum-ably buried within the center of the helical structure. As a result, adsorbeddouble stranded DNA molecules overlap and superimpose through sticky endcohesions, forming complex lattices that are unstable and desorb easily fromthe surface. When a positive potential is applied to the surface, these lat-tices form coiled fibers with greatly increased stability due to the electrostaticattraction of phosphate backbone to the positively charged surface, but theDNA duplex is destabilized and stretched as a result of charge–charge repul-sion on the unbound side of the DNA helix. Subsequent reorientation of themolecule forces DNA bases from inside the helix to be more exposed to so-lution. These processes demonstrate the relative simplicity of oligonucleotide
Fig. 2.5. Possible conformations of the DNA/oligonucleotide–surface complex onhydrophobic and cationic surfaces (Reprinted with permission from [7]. Copyright1998 Academic Press Inc Elsevier Science)
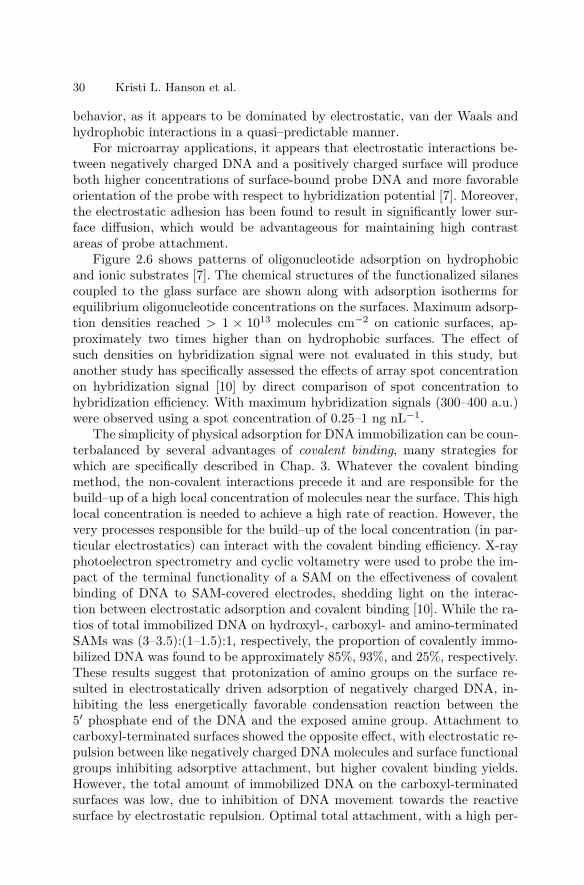
30 Kristi L. Hanson et al.
behavior, as it appears to be dominated by electrostatic, van der Waals andhydrophobic interactions in a quasi–predictable manner.
For microarray applications, it appears that electrostatic interactions be-tween negatively charged DNA and a positively charged surface will produceboth higher concentrations of surface-bound probe DNA and more favorableorientation of the probe with respect to hybridization potential [7]. Moreover,the electrostatic adhesion has been found to result in significantly lower sur-face diffusion, which would be advantageous for maintaining high contrastareas of probe attachment.
Figure 2.6 shows patterns of oligonucleotide adsorption on hydrophobicand ionic substrates [7]. The chemical structures of the functionalized silanescoupled to the glass surface are shown along with adsorption isotherms forequilibrium oligonucleotide concentrations on the surfaces. Maximum adsorp-tion densities reached > 1 × 10¹³ molecules cm−2 on cationic surfaces, ap-proximately two times higher than on hydrophobic surfaces. The effect ofsuch densities on hybridization signal were not evaluated in this study, butanother study has specifically assessed the effects of array spot concentrationon hybridization signal [10] by direct comparison of spot concentration tohybridization efficiency. With maximum hybridization signals (300–400 a.u.)were observed using a spot concentration of 0.25–1 ng nL−1.
The simplicity of physical adsorption for DNA immobilization can be coun-terbalanced by several advantages of covalent binding, many strategies forwhich are specifically described in Chap. 3. Whatever the covalent bindingmethod, the non-covalent interactions precede it and are responsible for thebuild–up of a high local concentration of molecules near the surface. This highlocal concentration is needed to achieve a high rate of reaction. However, thevery processes responsible for the build–up of the local concentration (in par-ticular electrostatics) can interact with the covalent binding efficiency. X-rayphotoelectron spectrometry and cyclic voltametry were used to probe the im-pact of the terminal functionality of a SAM on the effectiveness of covalentbinding of DNA to SAM-covered electrodes, shedding light on the interac-tion between electrostatic adsorption and covalent binding [10]. While the ra-tios of total immobilized DNA on hydroxyl-, carboxyl- and amino-terminatedSAMs was (3–3.5):(1–1.5):1, respectively, the proportion of covalently immo-bilized DNA was found to be approximately 85%, 93%, and 25%, respectively.These results suggest that protonization of amino groups on the surface re-sulted in electrostatically driven adsorption of negatively charged DNA, in-hibiting the less energetically favorable condensation reaction between the5′ phosphate end of the DNA and the exposed amine group. Attachment tocarboxyl-terminated surfaces showed the opposite effect, with electrostatic re-pulsion between like negatively charged DNA molecules and surface functionalgroups inhibiting adsorptive attachment, but higher covalent binding yields.However, the total amount of immobilized DNA on the carboxyl-terminatedsurfaces was low, due to inhibition of DNA movement towards the reactivesurface by electrostatic repulsion. Optimal total attachment, with a high per-
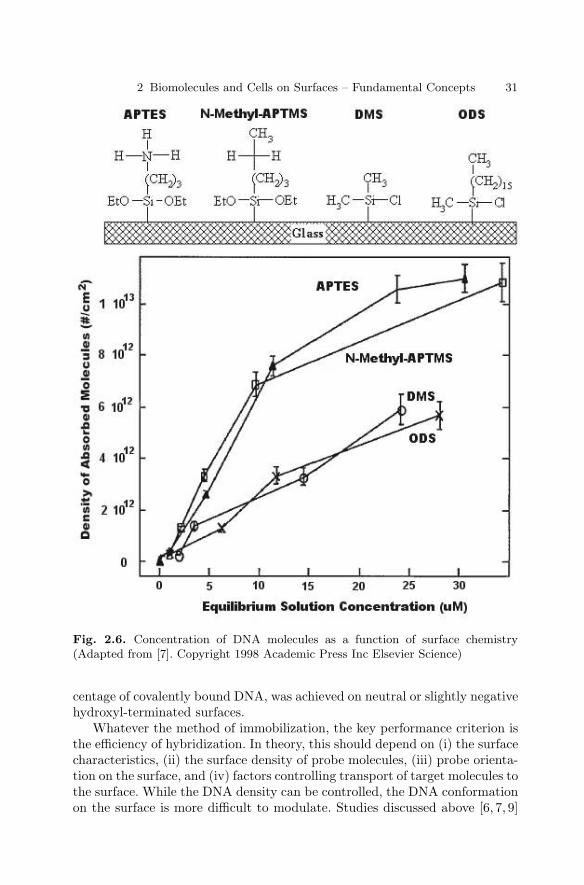
2 Biomolecules and Cells on Surfaces – Fundamental Concepts 31
Fig. 2.6. Concentration of DNA molecules as a function of surface chemistry(Adapted from [7]. Copyright 1998 Academic Press Inc Elsevier Science)
centage of covalently bound DNA, was achieved on neutral or slightly negativehydroxyl-terminated surfaces.
Whatever the method of immobilization, the key performance criterion isthe efficiency of hybridization. In theory, this should depend on (i) the surfacecharacteristics, (ii) the surface density of probe molecules, (iii) probe orienta-tion on the surface, and (iv) factors controlling transport of target molecules tothe surface. While the DNA density can be controlled, the DNA conformationon the surface is more difficult to modulate. Studies discussed above [6, 7, 9]
32 Kristi L. Hanson et al.
suggest that electrostatically driven DNA adsorption results in orientation ofthe molecule’s backbone parallel to, rather than perpendicular to, the sur-face, but with base pairing sites exposed to the liquid medium. While thisorientation is conducive to target hybridization, it does not allow for denseprobe coverage on the surface, and will therefore limit both the sensitivityand spatial resolution of associated microarrays. That said, simple adsorp-tive attachment of DNA has been found to be sufficient for many microarrayapplications.
Where higher sensitivity and resolution are required, covalent binding cannot only produce higher densities and tighter immobilization of DNA, but alsocontrol the orientation of molecular immobilization at either the 3′–hydroxylor 5′–phosphate end of the DNA chain. However, increased probe densitywill also affect intra–strand interactions, surface interactions and charge den-sity at the surface, which can in turn result in substantially different ionicstrength, pH, and dielectric constant at the surface than in bulk electrolytesolution. It is likely that these differences will also impinge on the availabilityof immobilized strands for hybridization. For instance, the standard enthalpychange for the thermal denaturation of target bound DNA was found to be2–3 times lower for immobilized DNA than for DNA in the bulk solution,and the melting temperature (Tm) was decreased by 6–10C [11]. The lowermelting temperature suggests that interstrand bonding is weaker on a sur-face than in solution, depending on bound strand density. Thus, dependingon the ability to control immobilization density, there may be variations insensitivity from case to case. Another study [12] suggests that this effect islikely to be more pronounced for shorter strands, which were shown to pro-duce lower hybridization signals when spotted at the same concentration aslonger molecules. Hybridization signals for shorter strands could, however, beimproved by addition of a poly(A)tail. This would be expected if smaller tar-get molecules are held more tightly and closer to the surface, thus being moreaffected by surface interactions. In contrast, longer molecules are likely to con-tain more free loops and ends available for hybridization further away fromthe surface. This effect has been observed elsewhere [13], where hybridizationwas found to be directly dependent on the length of immobilized strands.
2.4 Protein Immobilization on Surfaces
The fundamentals of protein attachment on surfaces have been widely re-viewed (e.g., [14–16]), but the extreme diversity and complexity of proteinsstill make any prediction regarding attachment difficult. Technologies usedfor DNA microarray application have, to some degree, been adapted to pro-tein microarrays, but the broader use of protein microarray technology is stilllimited, primarily due to the fact that surfaces and technology allowing uni-form and global attachment of a wide variety of proteins are not currentlyavailable. This lag in technology stems from the fundamental structural dif-
2 Biomolecules and Cells on Surfaces – Fundamental Concepts 33
ference between proteins and DNA. DNA is (i) uniformly structured with anordered hydrophilic backbone, (ii) stable, (iii) does not lose binding activityeasily, and (iv) has only one interaction site and geometry with target DNA.In contrast, proteins have (i) many different structures, (ii) contain hetero-geneous hydrophobic and charged domains, (iii) are extremely fragile withactivity dependent on retention of three–dimensional structure, and (iv) canhave multiple interaction sites.
Additional complications arise with respect to microarray technology,where functional conservation and sufficient concentration of bound proteinare critical to the success of the technology. Correct orientation of the boundprotein is required to increase the exposure of functional domains to sol-vent/target, but protein adsorption mechanisms often result in random (orwidely distributed) orientations on a surface.
In theory, random attachment is not likely to result in a high percentageof protein functional sites in the proper orientation for binding, but successfulattachment and target detection have been achieved with random adsorptiveattachment techniques (e.g., [17]). Further, a recent study indicates that theremay be minimal effect on functionality between proteins immobilized by di-rected or random attachment [18]. In contrast, oriented attachment has alsobeen found to increase array sensitivity up to 10–fold [19].
Overall, the need for directed orientation and choice of technique will de-pend on the specific proteins being used, and no single method is likely to workin all situations. It is clear, however, that as protein arrays become more com-prehensive and as the number of proteins in a single array increases, the needfor a technology that can accomplish immobilization across a wide range ofproteins, or even an entire proteome, will become more desirable. Strategiesused thus far can be broadly classified based on adsorptive or covalent bindingmechanisms, and then further subdivided into methods resulting in randomvs. directed orientation of the molecule.
2.4.1 Random Adsorptive Attachment
As proteins are charged biomolecules, it would be expected that electrostaticinteractions could be used for efficient and controllable immobilization. How-ever, electrostatic adsorption is often of a non-permanent nature and can bestrongly affected by changes to solution pH and ionic activity, thereby al-lowing for the possibility that subsequent array processing might desorb theprotein. Additionally, despite the simplicity of electrostatic interaction, whichshould make adsorption more predictable, such interactions are usually moredifficult to predict than hydrophobic or covalent ones [20]. This is most likelydue to the uneven spatial charge distribution on protein surfaces, which alsovaries with pH and ionic strength of the solution. Many chemical or physico–chemical schemes have been used to create charged surfaces that can adsorbproteins, for example polyelectrolyte multilayers [21] and sulfonated polymer
34 Kristi L. Hanson et al.
surfaces [22,23]. However, because of the complexity of the electrostatic poten-tial map as well as interference from other interactions (e.g. hydrophobicity),a generic ‘magic’ surface that can promote the electrostatically-driven adsorp-tion of proteins has not been found.
Hydrophobic interactions are often stronger and less reversible than elec-trostatic attractions, but can result in loss of functional activity due to partialdenaturation as the protein unfolds to expose hydrophobic interior portionsto the hydrophobic surface [15].
Due to the complexity of proteins, a reasonable approach would be toexplore combinatorially the level of adsorption versus descriptors of surface,solution, and protein characteristics. In an attempt to map the adsorption ofvirtually any protein on virtually any surface, Nicolau and co-workers havecompiled a protein adsorption database [24]. The database contains about 500cases of protein adsorption for approximately 30 proteins and approximately100 surfaces in various solution conditions.
Molecular surface property algorithms developed to describe the proteins[25, 26], have been used to describe protein adsorption. A purely empiricalapproach using a linearly piecewise model with breakpoint was found to becapable of accounting for over 90% of the variance in the data [27]. Funda-mentally, the model assumes that the protein concentration on the surfacefollows a piecewise linear regression conforming to a Langmuir relationship.The experimental data present in the database have been used to derive anempirical relationship that describes the correlation between protein adsorp-tion (dependent variable) and process (independent) variables (i.e. proteinconcentration in solution; surface tension of the surface; ionic strength of thesolution; and absolute value of the difference between pH and the isoelectricpoint of the protein), as follows:
Γ = f1(γ, ion str, abs(pH − pI), C) · (1 − g(Γ))
+f2(γ, ion str, abs(pH − pI), C) · g(Γ),
f1 = a11γ + a12 · ion str + a13 · abs(pH − pI) + a14 · C,
f2 = a21γ + a22 · ion str + a23 · abs(pH − pI) + a24 · C,
Γ ≤ Γbreakpoint ⇒ g(Γ) = 0,
Γ > Γbreakpoint ⇒ g(Γ) = 1. (2.1)
The parameters of the equations are: Γ – protein surface concentration(mg/m2); C, protein concentration in solution (mg/ml); γ - surface tensionof the polymer (dyne/cm); ion str – ionic strength (M); pI – isoelectric pointof the protein; Γbreakpoint – protein concentration at which the slope of thelinear function Γ = f(C) changes; and the rest of the parameters are constants(Table 2.1).
The level of fit using such a model is quite remarkable, especially consider-ing that the adsorption data span over three orders of magnitude. This work
2 Biomolecules and Cells on Surfaces – Fundamental Concepts 35
Table 2.1. Coefficients for the protein adsorption (Eq. 6)
ProteinSurface Ionic concentrationtension strength in solution Free(dyne/cm) (M) Abs(pH-pI) (mg/ml) term
Coefficientsin f 1 a11 = 0.076 a12=-3.297 a13=0.085 1.052 b1=4.441
Coefficientsin f 2 a21=-0.014 a22=3.701 a23=-0.395 0.438 b2=4.840
Mean 44.82892 0.07505 1.39033 0.49182
Standarddeviation 6.942584 0.071997 0.914402 0.760767
Break point for the protein surface concentration (mg/m2) 3
suggests that prediction of appropriate surface types for maximum proteinadsorption may, in fact, be possible based on analysis of protein surface char-acteristics. Validation of the model with additional sets of data will assist infurther applications to microarray technology.
Overall, it appears that random adsorptive attachment can be very effec-tive for microarray purposes, and it is possible to make some general predic-tions about adsorption levels for a variety of proteins if the molecular surfacecharacteristics are known or can be predicted. As mentioned above, the effectsof non-oriented binding on array performance can be an issue with this typeof attachment, but in many cases still result in acceptable levels of targetbinding.
2.4.2 Random Covalent Attachment
Covalent binding is quite commonly used in biochip fabrication. Proteinspresent a variety of functional groups, including amino–, carboxyl–, hydroxyl–and thiol–, which can readily be used for covalent binding to surfaces withcomplementary chemical groups. However, due to the relative lability of pro-teins as compared to DNA, more care is required to avoid chemically-inducedprotein denaturation during the attachment process. There are many strate-gies for crosslinking of available functional groups, most of which make use ofspecialized crosslinkers designed for both attachment and physical separationof protein from surface, thereby allowing for more of the protein functionaldomain to be exposed to the solvent [28].
Covalent binding generally produces a higher concentration of protein thandoes adsorption. For instance, a study [29] compared the effect of physi-cal adsorption of a protein on Poly(tert–butyl–methacrylate), a highly hy-drophobic surface, to the covalent binding of the same protein to a carboxylic-functionalized surface (derived from the former via e-beam photolysis). Cova-

36 Kristi L. Hanson et al.
lent attachment resulted in significantly higher surface protein concentrationsthan adsorption, despite the fact that carboxylic functional groups result ina hydrophilic surface which tends to repel protein (Fig. 2.7).
2.4.3 Oriented Attachment
A variety of oriented immobilization techniques have been attempted, andhave recently been summarized [30]. These techniques can be adsorptive, co-valent or a combination of both. Some of the more common methods include:
1. use of antibody binding proteins to bind the Fc portion of antibodiesleaving the binding sites exposed to solution [31,32];
2. terminal biotinylation of genetically engineered proteins with subsequentend-specific attachment to a streptavidin coated surface [33];
3. terminal His–tag addition and subsequent attachment to a nitrilotriaceticacid-coated surface [34];
4. use of carbohydrate binding molecules to bind the carbohydrate moietiesof antibodies [35]; and
5. cystine thiol production on the C–terminal (non-antigen binding) end ofcleaved Fab regions, with subsequent attachment using the cystine thiol‘handle’ [32, 33].
A recent study [19] explored the effect of some of the above methods ofantibody attachment on analyte binding capacity, and found that orientationincreases analyte binding capacity up to 10–fold. When Fab’ fragments werespecifically oriented in a dense monolayer, 90% of the adsorbed moleculeswere active, while randomly attached Fab fragments were packed at muchlower density, and showed a much lower specific activity. Thus for applicationsrequiring high sensitivity and low detection limits, such techniques are likelyto greatly improve performance.
While the above discussion has outlined that there are, in fact, a variety ofmethods which are useful for the immobilisation of proteins and detection oftarget analytes in array format, this methodological variation also has a po-tential downside. Heterogeneous information from different laboratories mayultimately result in non-standardized datasets, difficult to compare and in-terpret, thus hindering the overall goal of a more complete understanding ofproteomes.
2.5 Carbohydrate Immobilization
Carboydrate-based microarrays, which have appeared only recently, have re-cently been reviewed [36]. Applications of these arrays have enormous po-tential in microarray technology due to the structural diversity, specificity,and differential expression of carbohydrates [37]. Further, these molecules are
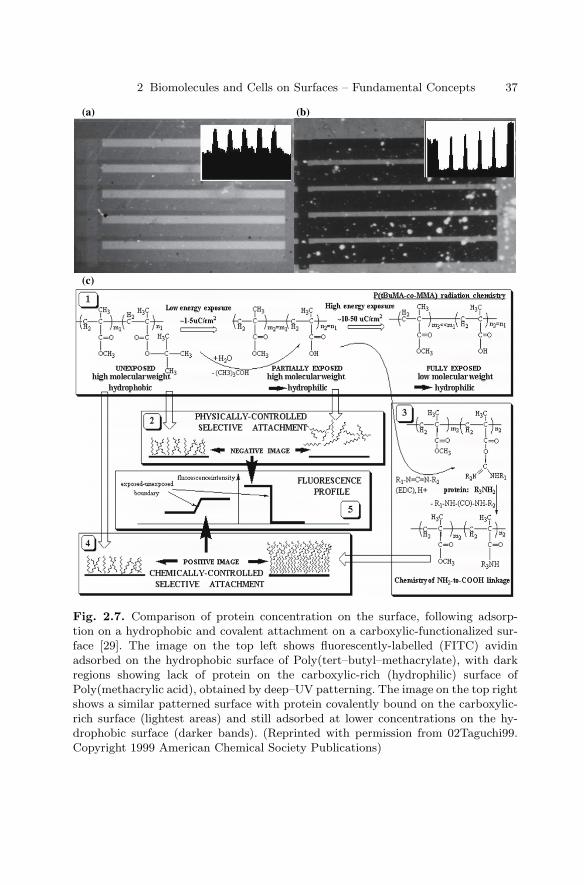
2 Biomolecules and Cells on Surfaces – Fundamental Concepts 37
(a) (b)
(c)
Fig. 2.7. Comparison of protein concentration on the surface, following adsorp-tion on a hydrophobic and covalent attachment on a carboxylic-functionalized sur-face [29]. The image on the top left shows fluorescently-labelled (FITC) avidinadsorbed on the hydrophobic surface of Poly(tert–butyl–methacrylate), with darkregions showing lack of protein on the carboxylic-rich (hydrophilic) surface ofPoly(methacrylic acid), obtained by deep–UV patterning. The image on the top rightshows a similar patterned surface with protein covalently bound on the carboxylic-rich surface (lightest areas) and still adsorbed at lower concentrations on the hy-drophobic surface (darker bands). (Reprinted with permission from 02Taguchi99.Copyright 1999 American Chemical Society Publications)
38 Kristi L. Hanson et al.
associated with a number of cell characteristics, including adhesion, carcino-genesis and immunity [38]. The ability to rapidly determine the presence andtype of carboydrate molecules in a sample would therefore greatly increaseour understanding of their in vivo functions.
Carbohydrates, like proteins, are structurally heterogeneous and requirepreservation of molecular conformation, 3–D structure, and topological con-figuration on a chip in order for molecular recognition to occur. As such, theexisting array surfaces commonly used for DNA are generally not amenableto carbohydrate immobilization.
From an immobilization perspective, perhaps the most common theme toemerge from recent studies is that larger carbohydrate molecules are easilyretained on relatively hydrophobic (e.g., nitrocellulose or treated polystyrene)surfaces [39,40], but smaller carbohydrates show much lower binding efficien-cies [39]. To overcome this problem, synthetic glycoconjugates have been used,allowing linkage of the carbohydrate to a protein, lipid or polyacrylamide chainwhich can then be easily immobilized on a nitrocellulose surface.
In general, this relatively simple means of attaching carbohydrates is as-sociated with retention of the immunological properties of a variety of car-bohydrates with distinct structural configurations and diverse sugar chaincontents [39]. The authors note, however, that individual preparations muststill be tested on such a substrate, given the wide structural diversity of car-bohydrate antigens.
2.6 Immobilization of Cells on Surfaces
Cell-based microarrays are being developed for a number of applications, suchas medical screening (where the capability of cells to selectively respond todifferent agents can be assessed) and the study of fundamental cell behaviors(such as cell–cell communication and cell spreading). The starting point forthese techniques is the ability to pattern arrays of single–cells that can beperturbed and monitored individually. As a consequence, the impact of cellconfinement on microsized areas (i.e. areas that have dimensions comparableto that of a single cell – a technology generally referred as ‘cell patterning’ [41])is of extreme importance in the context of microarray technology.
On a molecular level, the immobilization of cells is far more complex thanthe immobilization of single biomolecules, and may therefore require situation-specific studies to determine proper surfaces for a particular application. Thedifficulty of cell immobilization arises in the first instance from the complexityof the cell membrane, containing many types of molecules (membrane pro-teins, glycoproteins; lipid bilayer supramolecular structures; small molecules,etc.). These biomolecules could attach to a given surface based on the con-cepts described in the previous sections. Though each such interaction couldbe analyzed independently, it is likely that these interactions are cooperativeor at least not fully independent. Furthermore, the cell is also very flexible,
2 Biomolecules and Cells on Surfaces – Fundamental Concepts 39
which makes the attachment of the respective molecular patches, indepen-dently and collectively, dynamic. Finally, and most importantly, the cell is aliving entity that responds to the stimuli presented by the surface. One mech-anism of response, and in fact the simplest from a panoply of responses, is tosecrete chemical species that will extend the ‘controlled’ environment of thecell beyond its cell wall.
Simplistically speaking, cell attachment should follow the same rules thatgovern the non-covalent biomolecular immobilization. For instance, electro-static interactions can be used for cell immobilization, if the surface of thecell is charged, as is the case for neuronal cells (negatively charged) or somebacteria (most negatively, but some positively charged). Because cells are nor-mally surrounded by a sheath of proteins which presents the hydrophilic facetowards the exterior, hydrophobicity-driven immobilization is generally lesseffective. The most powerful means of cell immobilization is by biomolecularrecognition. Cells present proteins on the exterior of their walls that can beunique to a particular cell type or species and that can be recognized by com-plementary biomolecules (receptors). Alternatively, cells may present proteinswith specific functions (including surface attachment) that can be suppliedto immobilize cells. While the former mechanism has the propensity to becell-specific, the latter is more general.
At the first instance, surfaces covered with cell specific proteins wouldbe the natural technological path for cell immobilization. However, in theprevious section we saw that the general behavior of proteins on surfaces isdifficult to predict. The problems related to protein adsorption in the contextof cell immobilization have been concisely described by Mrksich [42]. Briefly,it is difficult to know the density of ligands that are effectively available forbinding to cellular receptors, due to the distribution in conformation and ori-entation of adsorbed protein. Many studies aimed at investigating the roleof ligand density in cell adhesion and migration have improperly assumed alinear correlation between the density of adsorbed protein and the concentra-tion of protein used to coat the substrates [43]. Also, as expected, the activityof protein-coated substrates can show a dramatic dependence on the choiceof substrate. For instance, culturing of myoblasts on two different types ofpolystyrene resulted in completely different outcomes, namely proliferation ordifferentiation, even though both were coated with comparable densities offibronectin (a cell adhesion protein) [44].
Because of the diversity of the response of different cells to surfaces, it isgenerally necessary to systematically and specifically test cell adhesion andpreservation of bioactivity on substrates intended for microarray devices. Forinstance, one set of experiments [45,46] examined the attachment of neuronalcells on photosensitive polymers. The photoresists, when exposed to UV light,generate carboxylic-rich surfaces (with concentration modulated by exposureenergy) that can be further functionalized with neuropeptides. Thermal pro-cessing was also used to manipulate the surface properties, either via polymercrosslinking and decarboxylation, or via diffusion of silicon-rich species. It was
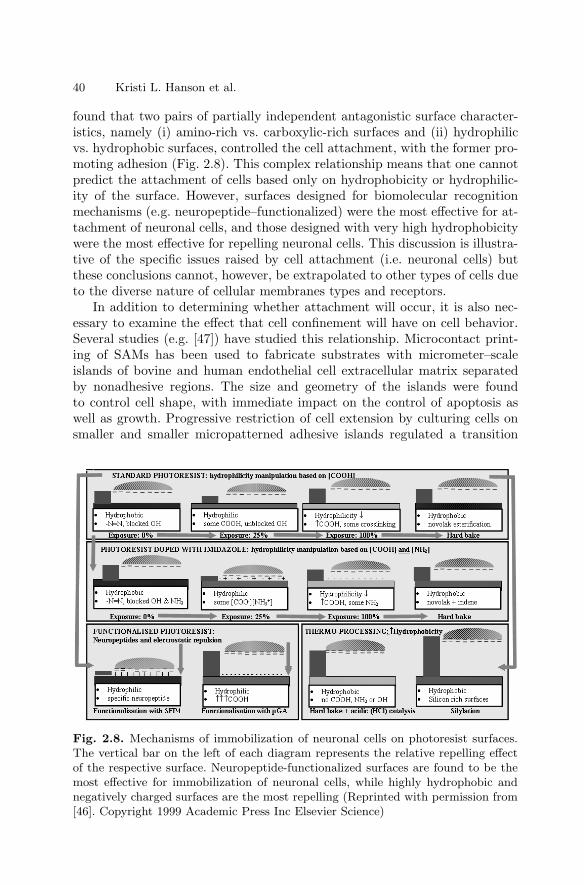
40 Kristi L. Hanson et al.
found that two pairs of partially independent antagonistic surface character-istics, namely (i) amino-rich vs. carboxylic-rich surfaces and (ii) hydrophilicvs. hydrophobic surfaces, controlled the cell attachment, with the former pro-moting adhesion (Fig. 2.8). This complex relationship means that one cannotpredict the attachment of cells based only on hydrophobicity or hydrophilic-ity of the surface. However, surfaces designed for biomolecular recognitionmechanisms (e.g. neuropeptide–functionalized) were the most effective for at-tachment of neuronal cells, and those designed with very high hydrophobicitywere the most effective for repelling neuronal cells. This discussion is illustra-tive of the specific issues raised by cell attachment (i.e. neuronal cells) butthese conclusions cannot, however, be extrapolated to other types of cells dueto the diverse nature of cellular membranes types and receptors.
In addition to determining whether attachment will occur, it is also nec-essary to examine the effect that cell confinement will have on cell behavior.Several studies (e.g. [47]) have studied this relationship. Microcontact print-ing of SAMs has been used to fabricate substrates with micrometer–scaleislands of bovine and human endothelial cell extracellular matrix separatedby nonadhesive regions. The size and geometry of the islands were foundto control cell shape, with immediate impact on the control of apoptosis aswell as growth. Progressive restriction of cell extension by culturing cells onsmaller and smaller micropatterned adhesive islands regulated a transition
Fig. 2.8. Mechanisms of immobilization of neuronal cells on photoresist surfaces.The vertical bar on the left of each diagram represents the relative repelling effectof the respective surface. Neuropeptide-functionalized surfaces are found to be themost effective for immobilization of neuronal cells, while highly hydrophobic andnegatively charged surfaces are the most repelling (Reprinted with permission from[46]. Copyright 1999 Academic Press Inc Elsevier Science)
2 Biomolecules and Cells on Surfaces – Fundamental Concepts 41
from growth to apoptosis on a single continuum of cell spreading. This workshowed that the size and geometry of the microarray pattern can have pro-found effects on cellular behavior, which in turn can influence the performanceof a cell-based microarray.
In addition to surface chemistry, size and geometry, topography also in-fluences cell physiology [48]. Substratum topography was found to influencea number of cell behaviors, such as spreading, secretion, attachment, shape,growth, polarity and differentiated functions [49]. The ability to effectivelyimmobilize cells for the development of microarrays thus relies on the abil-ity to accurately design and control the microarray surface properties at themicro– and nano– scale level.
Another fundamental problem is the intrinsic limitation of culturing cellsin an environment that lacks cells’ natural three–dimensional organization.The question of whether a cell patterned on a flat surface will behave thesame way as when in a three–dimensional matrix (e.g. a gel) is still a matterof investigation, but evidence points to important differences in cell behaviorwhen grown in 2D versus 3D cultures [50–52]. This could mean that unpre-dictable and different behaviors might be obtained when cells are patternedover a 2D environment, such as a microarray. Moreover, cell behavior in vivois modulated by interaction with the surrounding cells and by the environ-ment, a heterogeneous medium which comprises gradients of nutrients andsecreted factors. As a result, use of isolated cell populations in vitro maytrigger different behavior from the ‘natural’ state. These issues are currentlyunder extensive research and should be taken in great consideration whendesigning a cell-based microarray and evaluating its performance.
2.7 Conclusions
The immobilization of biomolecules and cells for microarray technology hasthree ‘dimensions’: (i) a biomolecule or cell to be immobilized on a surface, ofwhich we have limited information and which generally cannot, and/or shouldnot, be altered; (ii) an immobilization surface which can be partially tuned,and of which we have quasi-complete information, and (iii) a liquid environ-ment which is fully controllable and of which we have complete information.This chapter addressed the fundamental concepts dictating the likely responseof biomolecules and cells immobilized on surfaces, and their resulting bioac-tivity. Our approach was to present the general interrelationships between theinput and output technological parameters, and then to qualify these generalrules on several specific situations. The only certainty that we hope we trans-mitted to the reader, in a field littered with more exceptions than rules, isthat, although general rules are relevant in all situations, nothing can replaceexperience and innovation.
42 Kristi L. Hanson et al.
References
1. Norde, W. 2003. Colloids and interfaces in life sciences. Marcel Dekker, Monti-cello, NY
2. Haynes, C. A. and W. Norde. 1994. Globular proteins at solid/liquid interfaces.Colloids and surfaces B: Biointerfaces 2:517–566
3. Derjaguin, B. V. and D. L. Landau. 1941. A theory of the stability of stronglycharged lyophobic sols and the coalescence of strongly charged particles in elec-trolytic solution. Acta Physicochimica USSR 14:633–662
4. Verwey, E. J. W. and J. Th. G. Overbeek. 1948. Theory of stability of lyophobiccolloids. Elsevier, Amsterdam
5. Schena, M., D. Shalon, R. W. Davis, and P. O. Brown. 1995. Quantitative mon-itoring of gene expression patterns with a complementary DNA microarray. Sci-ence 270:467–470
6. Chan, V., D. J. Graves, P. Fortina, and S. E. McKenzie. 1997. Adsorption andsurface diffusion of DNA oligonucleotides at liquid/solid interfaces. Langmuir13:320–329
7. Chan, V., S. E. McKenzie, S. Surrey, P. Fortina, and D. J. Graves. 1998. Effectof Hydrophobicity and Electrostatics on Adsorption and Surface Diffusion ofDNA Oligonucleotides at Liquid/Solid Interfaces. Journal of Colloid & InterfaceScience 203:197–207
8. Ausubel, F. M., R. Brent, R. E. Kingston, D. D. Moore, J. G. Seidman, J. A.Smith, and K. Struhl. 1997. Current protocols in molecular biology. John Wileyand Sons, New York
9. Brett, A. M. O. and A.-M. Chiorcea. 2003. Atomic Force Microscopy of DNAImmobilized onto a Highly Oriented Pyrolytic Graphite Electrode Surface. Lang-muir 19:3830–3839
10. Zhao, Y.-D., D.-W. Pang, S. Hu, Z.-L. Wang, J.-K. Cheng, and H.-P. Dai.1999. DNA–modified electrodes; part 4: optimization of covalent immobilizationof DNA on self–assembled monolayers. Talanta 49:751–756
11. Watterson, J. H., P. A. E. Piunno, C. C. Wust, and U. J. Krull. 2000. Effectsof Oligonucleotide Immobilization Density on Selectivity of Quantitative Trans-duction of Hybridization of Immobilized DNA. Langmuir 16:4984–4992
12. Franssen-van Hal, N. L. W., O. Vorst, E. Kramer, R. D. Hall, and J. Keijera.2002. Factors in sequencing cDNA microarray hybridization on silylated glassslides. Analytical Biochemistry 308:5–17
13. Stillman, B. A. and J. L. Tonkinson. 2001. Expression microarray hybridiza-tion kinetics depend on length of the immobilized DNA but are independent ofimmobilization substrate. Analytical Biochemistry 295:149–157
14. Norde, W. 1986. Adsorption of Proteins from Solution at the Solid–Liquid In-terface. Advances in Colloid and Interface Science 25:267–340
15. Brash, J. L. and T. A. Horbett. 1987. Protein at interfaces: physicochemical andbiochemical studies. American Chemical Society, Washington, D.C.
16. Horbett, T. A. and J. L. Brash. 1995. Protein at interfaces II: fundamentals andapplications. American Chemical Society, Washington, D.C.
17. Angenendt, P., J. Glokler, D. Murphy, H. Lehrach, and D. J. Cahill. 2002. To-ward optimized antibody microarrays: a comparison of current microarray sup-port materials. Analytical Biochemistry 309:253–260
18. Wilchek, M. and T. Miron. 2003. Oriented versus random protein immobiliza-tion. Journal of Biochemical and Biophysical Methods 55:67–70
2 Biomolecules and Cells on Surfaces – Fundamental Concepts 43
19. Peluso, P., D. S. Wilson, D. Do, H. Tran, M. Venkatasubbaiah, D. Quincy,B. Heidecker, K. Poindexter, N. Tolani, M. Phelan, K. Witte, L. S. Jung, P.Wagner, and S. Nock. 2003. Optimizing antibody immobilization strategies forthe construction of protein microarrays. Analytical Biochemistry 312:113–124
20. Asthagiri, D. and A. M. Lenhoff. 1997. Influence of Structural Details in Mod-eling Electrostatically Driven Protein Adsorption. Langmuir 13:6761–6768
21. Ladam, G., P. Schaaf, F. J. G. Cuisinier, G. Decher, and J.-C. Voegel. 2001.Protein adsorption onto auto–assembled polyelectrolyte films. Langmuir 17:878–882
22. Lestelius, M., B. Liedberg, and P. Tengvall. 1997. In Vitro Plasma Protein Ad-sorption on –Functionalized Alkanethiolate Self–Assembled Monolayers. Lang-muir 13:5900–5908
23. Sundaram, S., F. Lim, S. L. Cooper, and R. W. Colman. 1996. Role of leucocytesin coagulation induced by artificial surfaces: investigation of expression of Mac–1, granulocyte elastase release and leucocyte adhesion on modified polyurethanes.Biomaterials 17
24. Nicolau, D. V. Biomolecular adsorption database. www.bionanoeng.com/BAD/25. Nicolau, D. V. Jr. and D. V. Nicolau. 2002. A database comprising biomolec-
ular descriptors relevant to protein adsorption on microarray surfaces. SPIEProceedings 3:109–116
26. Nicolau, D. V. Jr. and D. V. Nicolau. 2002. A model of protein adsorptionto solid surfaces from solution. In Biomedical Nanotechnology Architecturesand Applications, Darryl J. Bornhop; David A. Dunn; Raymond P. Mariella;Catherine J. Murphy; Dan V. Nicolau; Shuming Nie; Michelle Palmer; RameshRaghavachari; Eds, Proc. SPIE Vol. 4626, 1–8, 2002
27. Nicolau, D. V. Jr., Fulga, F. and Nicolau, D. V. 2003 Impact of Protein Adsorp-tion on the Geometry of Microfluidics Devices. Biomedical Microdevices 5:3,227–233
28. Wong, S. H. 1991. Chemistry of protein conjugation and cross–linking. CRCPress, Boca Raton, FL
29. Nicolau, D. V., T. Taguchi, H. Taniguchi, and S. Yoshikawa. 1999. Positiveand negative tone protein patterning using conventional deep–UV/e-beam resists.Langmuir 15:3845–3851
30. Seong, S. and C. Choi. 2003. Current status of protein chip development in termsof fabrication and application. Proteomics 3:2176–2189
31. Vijayendran, R. A. and D. E. Leckband. 2001. A Quantitative Assessment ofHeterogeneity for Surface–Immobilized Proteins. Analytical Chemistry 73:471–480
32. Nakanishi, K., H. Muguruma, and I. Karube. 1996. A novel method of immo-bilizing antibodies on a quartz crystal microbalance using plasma–polymerizedfilms for immunosensors. Analytical Chemistry 68:1695–1700
33. Rowe, C. A., S. B. Scruggs, M. J. Feldstein, J. P. Golden, and F. S. Ligler.1999. An Array Immunosensor for Simultaneous Detection of Clinical Analytes.Analytical Chemistry 71:433–439
34. Lu, Y. J., F. Zhang, and S. F. Sui. 2002. Specific binding of integrin to RGDpeptide immobilized on a nitrilotriacetic acid chip: a surface plasmon resonancestudy. Biochemistry (Moscow) 67:1122–1129
35. Hoffman, W. L. and D. J. O’Shannessy. 1988. Site-specific immobilization ofantibodies by their oligosaccharide moieties to new hydrazide derivatized solidsupports. Journal of Immunological Methods 112:113–120
44 Kristi L. Hanson et al.
36. Wang, D. 2003. Carbohydrate microarrays. Proteomics 3:2167–217537. Wang, D. and E. A. Kabat . 1996. Carbohydrate Antigens (Polysaccharides), p.
247–276. In M. H. V. Van Regenmortal (ed.), Structure of Antigens, VolumeThree. CRC Press, Boca Raton, New York, London, Tokyo
38. Hirabayashi, J., Y. Arata, and K. Kasai. 2001. Glycome project: Concept, strat-egy and preliminary application to Caenorhabditis elegans. Proteomics 1:295–303
39. Wang, D., S. Liu, B. J. Trummer, C. Deng, and A. Wang. 2002. Carbohydratemicroarrays for the recognition of cross–reactive molecular markers of microbesand host cells. Nature biotechnology 20:275–281
40. Willats, W. G. T., S. E. Rasmussen, T. Kristensen, J. D. Mikkelsen, and J.P. Knox. 2002. Sugar–coated microarrays: A novel slide surface for the high–throughput analysis of glycans. Proteomics 2:1666–1671
41. Folch, A. and M. Toner. 2000. Microengineering of cellular interactions. Annualreview of biomedical engineering 2:227-256
42. Mrksich, M. 2000. A surface chemistry approach to studying cell adhesion.Chemical Society Reviews 29
43. Palecek, S. P., J. C. Loftus, M. H. Ginsberg, D. A. Lauffenburger, and A. F.Horwitz. 1997. Integrin–ligand binding properties govern cell migration speedthrough cell–substratum adhesiveness. Nature 385:537–540
44. Garcia, A. J., M. D. Vega, and D. Boettiger. 1999. Modulation of cell prolif-eration and differentiation through substrate–dependent changes in fibronectin.Molecular biology of the cell 10:785–798
45. Nicolau, D. V., T. Taguchi, H. Tanigawa, and S. Yoshikawa. 1996. Control ofthe neuronal cell attachment by functionality manipulation of diazo–naphtho–quinone/novolak photoresist surface. Biosensors and Bioelectronics 11:1237–1252
46. Nicolau, D. V., T. Taguchi, H. Taniguchi, H. Tanigawa, and S. Yoshikawa. 1999.Patterning neuronal and glia cells on light–assisted functionalized photoresists.Biosensors & Bioelectronics 14:317–325
47. Chen, C. S., M. Mrksich, S. Huang, G. M. Whitesides, and D. E. Ingber. 1998.Micropatterned surfaces for control of cell shape, position, and function. Biotech-nology Progress 14
48. Flemming, R. G., C. J. Murphy, G. A. Abrams, S. L. Goodman, and P. F.Nealey. 1999. Effects of synthetic micro– and nano–structured surfaces on cellbehavior. Biomaterials 20:573–588
49. Singhvi, R., G. Stephanopoulos, and D. I. C. Wang. 1994. Review: Effects ofsubstratum morphology on cell physiology. Biotechnology and Bioengineering43:764–771
50. Abbott, A. 2003. Biology’s new dimension. Nature 424:870–87251. Weaver, V. M., O. W. Petersen, F. Wang, C. A. Larabell, P. Briand, C. Damsky,
and M. J. Bissell. 1997. Reversion of the malignant phenotype of human breastcells in three–dimensional culture and in vivo by integrin blocking antibodies.The Journal of Cell Biology 137:231–245
52. Wang, F., V. M. Weaver, O. W. Petersen, C. A. Larabell, S. Dedhar, P. Briand,R. Lupu, and M. J. Bissell. 1998. Reciprocal interactions between 1–integrinand epidermal growth factor receptor in three–dimensional basement membranebreast cultures: A different perspective in epithelial biology. Proceedings of theNational Academy of Science 95:14821–14826
3
Surfaces and Substrates
Alvaro Carrillo, Kunal V. Gujraty, and Ravi S. Kane
3.1 Introduction
This chapter describes several approaches that have been used to fabricateDNA and protein microarrays . These microarrays may be used to performhighly miniaturized assays, in parallel, for numerous research, clinical, anddiagnostic applications.
The composition and morphology of the substrate and the choice of surfacechemistry influence several critical requirements for the successful implemen-tation of microarray technology. These requirements include the controlledand reproducible spatial deposition of microliter or nanoliter amounts of sam-ple on a surface, the stable attachment of biomolecules to the surface withoutdenaturation, the immobilization of biomolecules at high density and at a highand consistent surface concentration, and detection methods that will providea quantitative measure of the interaction. The ability to reuse the microarraysurface is also desirable.
The surface modification technique should be easy, fast, reliable and formstable surfaces; surface chemistry is a major determinant of the stability ofattachment of biomolecules. The surface must allow biomolecule attachmentwithout denaturation or deactivation. In order to guarantee that only relevantinteractions are measured, it is also necessary for the surface to be resistant tothe non-specific adsorption of biomolecules and other analytes present in solu-tion. The substrate must be compatible with the measurement method, thatis, depending on the case, it must offer low fluorescence [1,2] or chemilumines-cence background, or should be compatible with surface plasmon resonance ormass spectrometry. Minimum interference from the substrate in the detectionstage is critical for generating microarrays with high sensitivity.
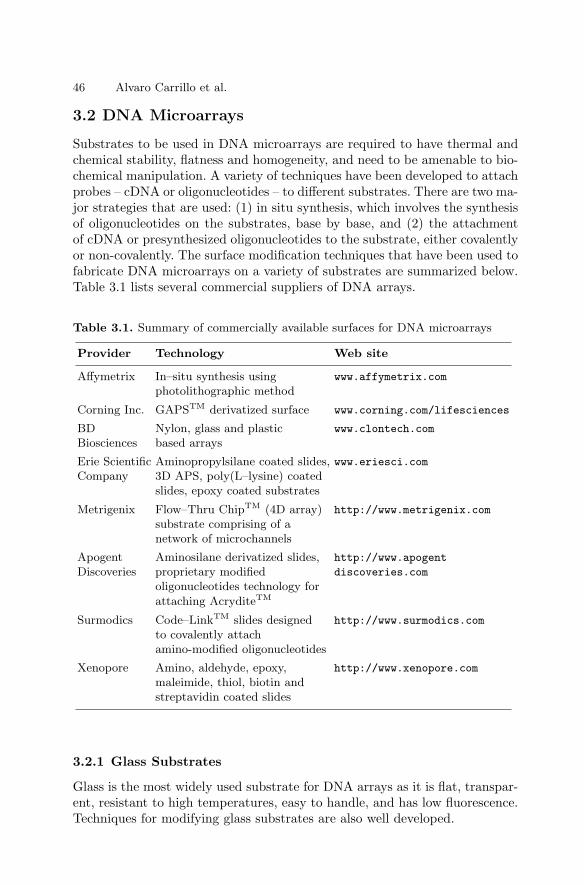
46 Alvaro Carrillo et al.
3.2 DNA Microarrays
Substrates to be used in DNA microarrays are required to have thermal andchemical stability, flatness and homogeneity, and need to be amenable to bio-chemical manipulation. A variety of techniques have been developed to attachprobes – cDNA or oligonucleotides – to different substrates. There are two ma-jor strategies that are used: (1) in situ synthesis, which involves the synthesisof oligonucleotides on the substrates, base by base, and (2) the attachmentof cDNA or presynthesized oligonucleotides to the substrate, either covalentlyor non-covalently. The surface modification techniques that have been used tofabricate DNA microarrays on a variety of substrates are summarized below.Table 3.1 lists several commercial suppliers of DNA arrays.
Table 3.1. Summary of commercially available surfaces for DNA microarrays
Provider Technology Web site
Affymetrix In–situ synthesis using www.affymetrix.com
photolithographic method
Corning Inc. GAPSTM derivatized surface www.corning.com/lifesciences
BD Nylon, glass and plastic www.clontech.com
Biosciences based arrays
Erie Scientific Aminopropylsilane coated slides, www.eriesci.comCompany 3D APS, poly(L–lysine) coated
slides, epoxy coated substrates
Metrigenix Flow–Thru ChipTM (4D array) http://www.metrigenix.com
substrate comprising of anetwork of microchannels
Apogent Aminosilane derivatized slides, http://www.apogent
Discoveries proprietary modified discoveries.com
oligonucleotides technology forattaching AcryditeTM
Surmodics Code–LinkTM slides designed http://www.surmodics.com
to covalently attachamino-modified oligonucleotides
Xenopore Amino, aldehyde, epoxy, http://www.xenopore.com
maleimide, thiol, biotin andstreptavidin coated slides
3.2.1 Glass Substrates
Glass is the most widely used substrate for DNA arrays as it is flat, transpar-ent, resistant to high temperatures, easy to handle, and has low fluorescence.Techniques for modifying glass substrates are also well developed.
3 Surfaces and Substrates 47
In Situ Synthesis
The Affymetrix method [3–5] uses solid–phase chemistry, photolabile protect-ing groups, and photolithography to synthesize oligonucleotides base–by–base.The surface is reacted with a linker having a photolabile group at its free end.Light is then directed to specific regions of the substrate by using a pho-tolithographic mask, resulting in the removal of the photolabile groups andthe activation of the linkers in these regions. The ‘activated’ ends react withnucleotides forming a covalent bond, and the process is repeated to build updifferent sequences at different sites on the substrate. The photolithographicfabrication method allows the construction of dense arrays containing manydifferent probes in a small area. More than 400,000 different square probe re-gions can be packed into an area of about 1 cm2 [6]. The major disadvantageof this method stems from the fact that the yield per cycle (i.e. per nucleotideattachment step) is ∼ 95% [5], which limits the probe length that can be syn-thesized with high fidelity. An alternate method for the in situ synthesis ofoligonucleotide arrays using photogenerated acids (PGAs) has been reportedby Gao et al. [7].
Covalent Attachment of Probes to Substrates Functionalizedwith Amino Groups
This method is among the most widely used techniques for immobiliz-ing probes onto glass substrates. Glass slides can be silanized by immers-ing them in a 2% solution of 3–aminopropyl–triethoxysilane (APTES) inacetone for 40 minutes at room temperature followed by three acetonewashes [8]. The silanization may also be carried out using p–aminophenyl–trimethoxysilane [8]. Aminosilane-coated slides may also be purchased com-mercially [9]. Presynthesized oligonucleotides having amino–modifiers canbe attached to the aminosilane coated slides using bi-functional linkers [6];alternatively, the amino-modified oligonucleotides can be succinylated andthen covalently attached to the slides by amide bond formation using 1–(3–dimethylamino–propyl)–3–ethylcarbodiimide hydrochloride (EDC). Freeamine groups on the substrate may be blocked chemically, in order to min-imize the non-specific adsorption of the negatively charged oligonucleotidesduring the hybridization step [9]. Non-specific binding may also be minimizedby prehybridization in a solution containing 1% bovine serum albumin [9].
Attachment of Probes to Poly(L–lysine)-coated Glass Substrates
This technique makes use of the adsorption of the polyanionic probes onto thepolycation-coated glass substrate via electrostatic interactions [6]. Poly(L–lysine)-coated glass slides are obtained by immersing cleaned glass slides inan aqueous buffered solution of poly(L–lysine) [10]. The slides are dried, andthen stored at room temperature for a month, to allow the surface to become
48 Alvaro Carrillo et al.
sufficiently hydrophobic [10]. The hydrophobicity of the surface is critical forobtaining printed DNA spots of small size, and hence for generating high den-sity arrays. An arraying robot is used to deposit the probes onto the slidesfrom solutions in aqueous buffer. This step is followed by four post-processingsteps: rehydration and drying, crosslinking of the DNA to the slide by UVirradiation, blocking of the free amine groups by acylation with succinic an-hydride, and denaturation [10].
Other Techniques
There are several other methods for immobilizing DNA onto glass substrates.Silanized DNA can be attached to unmodified glass surfaces covalently [11].Chrisey et al. have described methods for the formation of patterned single ormultiple DNA species on glass microscope slides using photolithographic tech-nique [12]. The covalent attachment of disulfide-modified oligonucleotides tomercaptosilane-modified glass [13], amine-modified oligonucleotides to aldehy-de-modified surfaces [14] or epoxy-modified surfaces [15], aldehyde-modifiedoligonucleotides to semicarbazide-coated surfaces, and oligonucleotides to di-azotized surfaces [16] are other approaches that may be used for fabricatingmicroarrays.
3.2.2 Silicon Substrates
Oxidized silicon substrates can be modified by silanization, and by the ad-sorption of polycations such as poly(L–lysine). Consequently, the techniquesused to attach probes to glass substrates may also be used to attach probesto oxidized silicon substrates [12,15,17,18].
Unoxidized crystalline silicon offers several advantages as a substrate forDNA microarrays including high purity, a highly organized and defined crys-talline structure, robustness, and thermal and chemical stability [19]. Strotheret al. [19] developed a technique for attaching oligonucleotides to unoxidizedsilicon substrates. Hydrogen terminated silicon wafers are generated by expos-ing wafers to a 2% solution of HF in water. The wafers are then covered withtertbutyloxycarbonyl (t–BOC)-protected 10–aminodec–1–ene and exposed toUV light for 2 hours. The surfaces are then treated with 25% trifluoroaceticacid in dichloromethane and rinsed with 10% ammonium hydroxide to re-move the t–BOC protecting group and form surfaces terminated with pri-mary amines. Thiol-modified probes can then be covalently attached to theamine-functionalized surfaces using the heterobifunctional crosslinker sulfo–succinimidyl 4–(N–maleimidomethyl) cyclohexane–1–carboxylate (SSMCC).The DNA-modified surfaces are rinsed with distilled water and stored at37C for 1 hour in a buffer containing sodium dodecyl sulfate to remove non-specifically bound strands.
3 Surfaces and Substrates 49
3.2.3 Gold Substrates
Gold-coated substrates have been used for immobilizing oligonucleotides toform an array. The primary advantage of gold-coated substrates is that theycan be functionalized by forming self-assembled monolayers (SAMs) of alka-nethiolates. The use of ω-functionalized alkanethiolates allows the chemistryof the interface to be controlled at the molecular level. Patterned SAMs maybe generated by using photolithographic, soft lithographic, and other tech-niques [20–22]. Gold-coated substrates are also compatible with surface plas-mon resonance (SPR) imaging techniques. SPR can be used to investigate thethermodynamics and the kinetics of binding interactions between unlabelledbiomolecules in real time.
Gilmor et al. [21] have developed a technique for attaching probes ontopatterned gold substrates. Substrates are prepared by evaporating chromium(an adhesion layer) followed by gold onto glass slides or silicon wafers. Thegold coated slides are dipped into a solution of 11–mercaptoundecanoic acid(1 mM in ethanol) for ∼ 18 hours to form a SAM. Poly(L–lysine) is ad-sorbed onto the SAM from an aqueous solution (1 mg/ml, pH 8). The surfaceis then exposed to UV light through a quartz mask, resulting in the oxida-tion of the gold–sulfur bond in the exposed regions; rinsing the surface withethanol completely removes the alkanethiol in these regions. Immersion of thesubstrate into a solution of octadecanethiol generates a substrate having apattern of hydrophobic (methyl-terminated) and hydrophilic (poly(L–lysine)-terminated) domains. Thiol-modified oligonucleotides can be covalently at-tached to poly(L–lysine)-terminated regions of the array by using the heter-obifunctional linker SSMCC. Corn et al. [23] have also developed a multistepchemical modification procedure to create DNA arrays on gold surfaces. Theyused SPR imaging to measure the adsorption of single stranded DNA–bindingprotein onto the oligonucleotide array.
3.2.4 Gels
Probes have been immobilized in gels on substrates like glass. ‘Three–dimensio-nal’ gels can provide more than 100 times greater capacities for immobilizationthan two–dimensional substrates, and can provide higher sensitivities [24–26].Gels provide a stable support with low fluorescence background and a highshelf life.
Mirzabekov and co-workers have developed procedures for immobilizingoligonucleotide probes in polyacrylamide gels [24–26]. The gel micromatrices,prepared by the photopolymerization of acrylamide, are activated by treat-ment with 100% hydrazine hydrate at 18 ± 2C for 40 minutes, resulting inthe incorporation of hydrazide groups into the gel. The space between gelelements on the glass slide is made hydrophobic by treatment with Repel–Silane. Activated oligonucleotides are immobilized by coupling with the hy-drazide groups of the gel. Alternatively, amine-modified oligonucleotides can
50 Alvaro Carrillo et al.
be immobilized onto micromatrix gel pads containing aldehyde groups [25,27].Oligonucleotides have also been immobilized on glass slides coated with an ac-tivated agarose film [28]; the outcome of hybridizations with longer labelledfragments was less reliable on these slides than on conventional aldehyde-functionalized glass slides.
3.2.5 Fiber Optic Arrays
This technique utilizes probes that are immobilized onto microspheres us-ing well established procedures [29–32]. Probe-functionalized microspheresare coupled to high density fiber optic arrays; the optical fiber substrate al-lows simultaneous and repetitive monitoring of the microsphere array [30,33].Amine-modified oligonucleotides are activated by treatment with cyanuricchloride, and then reacted with polyethyleneimine (PEI)-coated microspheres.The beads are then rinsed with a sodium borate buffer, and the unreactedamine groups on the beads are capped using succinic anhydride to preventnon-specific binding of DNA.
3.2.6 Polymers
Polymers like nylon and polypropylene have been used for arraying oligonu-cleotides. Oligonucleotides have been immobilized onto nylon supports us-ing UV crosslinkers [34–36]. High density arrays have been constructed onaminated polypropylene supports using phosphoramidite chemistry [37–39].Oligonucleotides have been immobilized onto polypropylene supports co-valently, using bifunctional crosslinkers or EDC-mediated amide bond for-mation between amine-terminated oligonucleotide and carboxylate-modifiedpolypropylene plates [40, 41], and non covalently [42]. Non-covalently im-mobilized oligonucleotides are, however, susceptible to removal under highsalt/high temperature conditions.
3.3 Protein Microarrays
The commercial development of protein microarrays has been difficult in greatpart due to the increased complexity that comes with dealing with proteins(compared to oligonucleotides or cDNA). Proteins tend to denature on sur-faces [43, 44]; this denaturation can result in a loss of their activity. Proteinsalso tend to adsorb non-specifically on a wide variety of surfaces [45]; this non-specific adsorption can lead to the misinterpretation of the results of microar-ray experiments. On account of these challenges, surface functionalization andprotein immobilization procedures are very important for the successful im-plementation of protein microarrays. A wide variety of substrates and surfacechemistries have been used in academic research and some have been devel-oped commercially. Some of these methods are described below; Table 3.2 listsseveral surfaces available commercially.
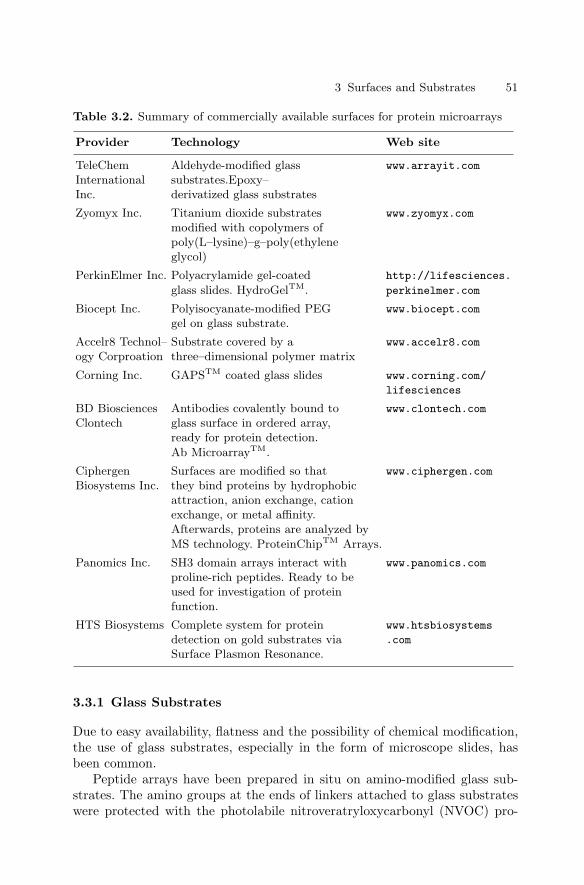
3 Surfaces and Substrates 51
Table 3.2. Summary of commercially available surfaces for protein microarrays
Provider Technology Web site
TeleChem Aldehyde-modified glass www.arrayit.com
International substrates.Epoxy–Inc. derivatized glass substrates
Zyomyx Inc. Titanium dioxide substrates www.zyomyx.com
modified with copolymers ofpoly(L–lysine)–g–poly(ethyleneglycol)
PerkinElmer Inc. Polyacrylamide gel-coated http://lifesciences.
glass slides. HydroGelTM. perkinelmer.com
Biocept Inc. Polyisocyanate-modified PEG www.biocept.com
gel on glass substrate.
Accelr8 Technol– Substrate covered by a www.accelr8.com
ogy Corproation three–dimensional polymer matrix
Corning Inc. GAPSTM coated glass slides www.corning.com/
lifesciences
BD Biosciences Antibodies covalently bound to www.clontech.com
Clontech glass surface in ordered array,ready for protein detection.Ab MicroarrayTM.
Ciphergen Surfaces are modified so that www.ciphergen.com
Biosystems Inc. they bind proteins by hydrophobicattraction, anion exchange, cationexchange, or metal affinity.Afterwards, proteins are analyzed byMS technology. ProteinChipTM Arrays.
Panomics Inc. SH3 domain arrays interact with www.panomics.com
proline-rich peptides. Ready to beused for investigation of proteinfunction.
HTS Biosystems Complete system for protein www.htsbiosystems
detection on gold substrates via .com
Surface Plasmon Resonance.
3.3.1 Glass Substrates
Due to easy availability, flatness and the possibility of chemical modification,the use of glass substrates, especially in the form of microscope slides, hasbeen common.
Peptide arrays have been prepared in situ on amino-modified glass sub-strates. The amino groups at the ends of linkers attached to glass substrateswere protected with the photolabile nitroveratryloxycarbonyl (NVOC) pro-
52 Alvaro Carrillo et al.
tecting group. Illumination of the substrate through a patterned mask resultedin the removal of the protecting groups in selected regions of the substrate;the free amino groups were reacted with an NVOC-protected amino acid. Thisprocess was repeated several times to generate different peptide sequences atdifferent locations on the substrate [3].
MacBeath and Schreiber described a procedure for fabricating proteinmicroarrays on glass slides modified with an aldehyde–containing silanereagent [46,47]. This approach was used to screen protein–protein interactions,identify substrates of protein kinases, and identify protein targets of smallmolecules. A high precision robot was used to print proteins in phosphate-buffered saline containing 40% glycerol. The aldehydes react with primaryamines on the protein to form a Schiff’s base linkage. The slides were thenimmersed in a buffer containing bovine serum albumin (BSA) to quench unre-acted aldehydes and prevent the non-specific binding of proteins in subsequentsteps. The aldehyde-modified substrates used in this study were obtained com-mercially from TeleChem International under the trade name SuperAldehydeSubstrates [48]. This vendor also offers epoxy-derivatized glass surfaces un-der the trade name SuperEpoxy Substrates; the reaction of the epoxy groupswith primary amines of the protein can also be used to attach proteins tosurfaces covalently. Protein microarrays fabricated using the aldehyde-basedprotein immobilization strategy have been used to study protein–protein in-teractions in the yeast proteome [49], and to study protein expression in cancercells [50, 51].
Amino-derivatized surfaces have been used to covalently immobilize pro-teins in a microarray [52–54]. Optically flat, 96–well glass plates were func-tionalized with amine groups by immersing them in a solution of aminopropy-ltrimethoxysilane (APTMS). Reaction of the amino groups with bis–sulfo–succinimidyl suberate generated an N–hydroxysuccinimide (NHS)-activatedsurface. Proteins were printed onto the activated substrates robotically, result-ing in their covalent attachment to the surface. After washing excess unboundprotein, the substrates were incubated with a solution of casein in phosphatebuffered saline (PBS) to minimize the non-specific adsorption of proteins insubsequent steps [53,54].
Peptide arrays have also been fabricated by the site-specific ligationof glyoxylyl peptides onto glass surfaces functionalized with semicarbazidegroups [55]. Cleaned glass slides were silanized with APTMS. The amino-functionalized surfaces were treated with triphosgen/diisopropylethylamineand 9–Fluorenylmethyl-protected hydrazine (Fmoc–NHNH2); the semicar-bazide groups were obtained on removal of the Fmoc groups. These arraysallowed the highly sensitive and specific detection of antibodies in very smallblood samples from infected individuals [55].
Poly(L–lysine)-derivatized glass slides have been used to create proteinmicroarrays [51,56]. Proteins were immobilized onto the slides non-covalently,by spotting solutions of the proteins in PBS [56]. The arrays were rinsed toremove unbound protein, and were then incubated overnight at 4C in a block-
3 Surfaces and Substrates 53
ing solution containing non-fat milk to minimize the non-specific adsorptionof proteins. A further reduction in the extent of non-specific adsorption wasdeemed to be necessary in order to detect specific target proteins at concen-trations below 1 ng/ml [56]. Other protein immobilization techniques havealso been reported; for instance, the binding of histidine-tagged proteins tonickel coated slides was used to form a yeast proteome microarray [49].
The analysis of membrane proteins is important, since these proteins repre-sent the most important class of drug targets; approximately 50% of currentmolecular targets are membrane-bound [57]. The application of microarraytechnology to membrane proteins has been complicated by the need to immo-bilize the accompanying lipid membranes in addition to the proteins them-selves in order to maintain bioactivity [58, 59]. Fang et al. [57, 60] fabricatedmicroarrays of G protein-coupled receptors (GPCR). Membrane preparationswere printed onto ultraflat glass slides modified with γ–aminopropylsilane(GAPSTM). Assays for the screening of ligands on membrane protein mi-croarrays were also described [57].
The techniques described above allow the formation of microarrays of pro-teins; the immobilization of small molecules in microarrays is also useful forthe identification of small molecule ligands for proteins [61, 62]. Macbeathet al. reacted aminosilane-functionalized glass slides with N–succinimidyl 3–maleimido propionate to obtain a surface presenting maleimide groups athigh density [62]. Thiol–containing small molecules are covalently attachedto the surface on printing, presumably due to the formation of a thioetherlinkage [62, 63]. No non-specific protein binding was observed in aqueousbuffer [62]. Kuruvilla et al. fabricated small molecule microarrays by cova-lently attaching alcohol–containing small molecules to chlorinated glass sur-faces [64]. They used these microarrays to identify compounds that bind theyeast protein Ure2p; one of these compounds was found to specifically activatea glucose-sensitive transcriptional pathway downstream of Ure2p [64].
3.3.2 Silicon Substrates
The techniques described above for immobilizing proteins on silanized orpolycation-derivatized glass substrates may also be used for immobiliza-tion on oxidized silicon substrates. Mooney et al. have described anothertechnique for immobilizing proteins non-covalently on glass or oxidized sil-icon substrates [65]. Substrates were functionalized with a monolayer of n–octadecyltrimethoxysilane (OTMS). UV photolithography was used to removethe monolayer in selected regions of the substrate creating a pattern, and bi-otinylated BSA was then allowed to adsorb onto the substrate. Significantlygreater amounts of biotinylated BSA adsorbed in the OTMS-coated regionson the substrate. Streptavidin could be captured on the biotinylated regions;an additional layer of biotinylated protein could then be deposited in theseregions [65].
54 Alvaro Carrillo et al.
3.3.3 Gold Substrates
Several studies have described the immobilization of proteins on SAMs ofalkanethiolates on gold [66–68]. SAMs allow the investigation of biospecificinteractions while minimizing background due to the non-specific adsorp-tion of proteins. In a recent study, dip–pen nanolithographyTM (DPNTM)was used to generate protein nanoarrays [68]. DPNTM was used to pattern16–mercaptohexadecanoic acid (MHA) on gold-coated substrates in the formof dots or grids having features ranging from 100 to 350 nanometers. Thesurrounding areas were passivated with a SAM of a protein-resistant tri-ethylene glycol-terminated alkanethiol. Proteins such as lysozyme and IgGadsorbed selectively on the MHA-coated regions of the substrate. Proteinsalso retained their biological activity after adsorption [68]. Yang et al. havealso described a technique, which they call light-activated micropatterning ofproteins (LAMP), for the spatially resolved micropatterning of proteins onSAM-coated substrates [69].
Hodneland et al. described a method for the selective and covalent im-mobilization of proteins on gold substrates with control over the density andorientation of the protein [66]. The method is based on the active–site di-rected covalent immobilization of fusion proteins to mixed SAMspresentingphosphonate ligands in a background of protein-resistant triethylene glycolgroups. The fusion proteins are comprised of the capture protein (cutinase)and the protein of interest; cutinase forms an active site-specific covalentadduct with phosphonate ligands. SPR spectroscopy showed that cutinasebinds irreversibly to the mixed SAM and that the triethylene glycol groupsprevent the non-specific adsorption of proteins [66].
Bieri et al. reported a study dealing with G protein-coupled receptors(GPCR) in which biotinylated membranes containing the protein rhodopsinin a specific orientation were immobilized in micrometer-sized patterns ontogold-coated substrates, and SPR was used to follow the process of ligandbinding, G protein activation and receptor deactivation [70].
3.3.4 Titanium Dioxide Substrates
Titanium dioxide substrates can be functionalized by the adsorption ofpolycations such as poly(L–lysine) (PLL). Copolymers of poly(L–lysine)–g–poly(ethylene gly–col) (PLL–g–PEG) also spontaneously adsorb on these sub-strates and generate a comb-like structure in which the PEG side chains ex-tend into the solution [71,72]. The PEG chains resist the non-specific adsorp-tion of proteins on the underlying substrate [73, 74]. By modifying the PEGside chains with biotin, it is possible to adsorb streptavidin specifically; thestreptavidin layer can be used to capture biotinylated proteins in a microarrayformat [75]. This technology is being commercialized by Zyomyx Inc. [76].
3 Surfaces and Substrates 55
3.3.5 Gels and Membranes: 3D Immobilization
An alternative to printing proteins on flat surfaces is to immobilize proteins inthree–dimensional gels. Gels greatly increase the capacity for the immobiliza-tion of proteins [77]. Polyacrylamide gels have been produced by persulfate–[78] and photo-induced [24, 78] polymerization; proteins are bound to the geleither by the reaction of amine groups on proteins with the glutaraldehyde-activated gel [24], by copolymerization of acrylamide and bisacrylamide withacryloyl-modified proteins [78], or by the reaction of antibodies that containaldehyde groups after periodate oxidation with polyacrylamide gels previouslyactivated by partial substitution of amide groups by hydrazide groups [79].Gel formulations can be tuned to accommodate proteins having a molecularweight as high as 400 kDa [79]. Commercial offerings of gel technology includepolyacrylamide [80] and polyisocyanate-modified PEG gels [81].
Proteins also adsorb to hydrophobic nitrocellulose membranes. The bind-ing capacity per unit area is higher than that for flat surfaces, resulting in agreater sensitivity than that achieved on amine- and aldehyde-modified glasssurfaces [50]. Nitrocellulose membrane microarrays have been used to studyprotein–protein, protein–DNA [82], and antibody–antigen interactions [83],and also to monitor the phosphorylation of proteins during cancer progres-sion [84]. Polyvinylidene difluoride filter membranes reportedly offer supe-rior protein binding capacity and mechanical resistance than nitrocellulosemembranes, and have also been used to generate protein microarrays using arobotic arrayer. BSA was used as a blocking agent to minimize the non-specificadsorption of proteins [85].
3.3.6 Polymers
Poly(dimethylsiloxane) (PDMS) has been used as a substrate to immobi-lize proteins both covalently and non-covalently. Yeast kinases were immo-bilized covalently in arrays of PDMS microwells, by using the crosslinker3–glycidoxypropyltrimethoxysilane (GPTS) [86]. Microfluidic networks havealso been used to form patterns of proteins, adsorbed non-covalently, ontohydrophobic PDMS substrates [87].
Electrospray deposition has been used to fabricate protein microarrays onaluminized plastic substrates. The proteins were administered in a mixturewith sucrose, and were attached to the surfaces either non-covalently or cova-lently by the reaction of amine groups of the proteins with aldehyde-modifiedsubstrates [88,89].
3.4 Conclusion
The choice of substrate and surface chemistry has a major impact on the per-formance of DNA and protein microarrays. A wide variety of approaches have
56 Alvaro Carrillo et al.
been used to fabricate these arrays, involving the covalent and non-covalentattachment of probes (oligonucleotides, cDNA, oligopeptides, proteins, andsmall molecules) to glass, silicon and gold substrates, gels and membranes.Future challenges include the fabrication of microarrays with increased den-sity, lower background, higher immobilization yield, and higher sensitivity.
References
1. Che DP, Bao YJ, Muller UR (2001) Novel surface and multicolor charge cou-pled device-based fluorescent imaging system for DNA microarrays. Journal ofBiomedical Optics 6: 450–456
2. Raghavachari N, Bao YP, Li G, Xie X, Muller UR (2003) Reduction of aut-ofluorescence on DNA microarrays and slide surfaces by treatment with sodiumborohydride. Anal Biochem 312: 101–105
3. Fodor SPA, Read JL, Pirrung MC, Stryer L, Lu AT, Solas D (1991) Light–directed, spatially addressable parallel chemical synthesis. Science 251: 767–773
4. Lipshutz R, Fodor SPA, Gingeras TR, Lockhart DJ (1999) High Density syn-thetic oligonucleotide arrays. Nature 21: 20–24
5. McGall GH, Barone AD, Duggelmann M, Fodor SPA, Gentalen E, Ngo N (1997)The Efficiency of light directed synthesis of DNA arrays on glass substrates. JAm Chem Soc 119: 5081–5090
6. Graves DJ (1999) Powerful tools for genetic analysis come of age. Trends inBiotechnology 17: 127–134
7. Gao X, LeProust E, Zhang H, Srivannavit O, Gulari E, Yu P, Nishiguchi C,Xiang Q, Zhou X (2001) A flexible light–directed DNA chip synthesis gated bydeprotection using solution photogenerated acids. Nucleic Acids Research 29:4744–4750
8. Joos B, Kuster H, Cone R (1997) Covalent attachment of hybridizable oligonu-cleotides to glass supports. Anal Biochem 247: 96–101
9. Hegde P, Qi R, Abernathy K, Gay C, Dharap S, Gaspard R, Hughes JE, SnesrudE, Lee N, Quakenbush J (2000) A concise guide to cDNA microarray analysis.BioTechniques 29: 548–562
10. Eisen MB, Browm PO (1999) DNA arrays for analysis of gene expression. Meth-ods in Enzymology 303: 179–205
11. Kumar A, Larsson O, Parodi D, Liang Z (2000) Silanized nucleic acids: a generalplatform for DNA immobilization. Nucleic Acids Research 28: e71
12. Chrisey LA, O’Ferrall CE, Spargo BJ, Dulcey CS, Calvert JM (1996) Fabricationof patterned DNA surfaces. Nucleic Acids Research 24: 3040–3047
13. Rogers Y-H, Jiang-Baucom P, Huang Z-J, Bogdanov V, Anderson S, Boyce-Janico MT (1999) Immobilization of oligonucleotides onto a glass support viadisulfide bonds: a method for preparation of DNA arrays. Anal Biochem 266:23–30
14. Zammatteo N, Jeanmart L, Hamels S, Courtois S, Louette P, Hevesi L, RemacleJ (2000) Comparison between different strategies of covalent attachment of DNAto glass surfaces to build DNA microarrays. Anal Biochem 280: 143–150
15. Lamture JB, Beattie KL, Burke BE, Eggero HD, Ehrlich DJ, Fowler R, HollisMA, Kosicki BB, Reich RK, Smith SR, Varma RS, Hogan ME (1994) Direct
3 Surfaces and Substrates 57
detection of nucleic acid hybridization on the surface of a charge coupled device.Nucleic Acids Research 22: 2121–2125
16. Dolan P, Wu Y, Ista LK, Metzenberg RL, Nelson MA, Lopez GP (2001) Ro-bust and efficient synthetic method for forming DNA microarrays. Nucleic AcidsResearch 29: e107
17. Blanchard AP, Kaiser RJ, Hood LE (1996) High density oligonucleotide arrays.Bio-sensors and Bioelectronics 11: 687–690
18. Gray DE, Case-Green SC, Fell TS, Dobson PJ, Southern EM (1997) Ellipso-metric and interferometric characterization of DNA probes immobilized on acombinatorial array. Langmuir 12: 2833–2842
19. Strother T, Cai W, Zhao X, Hamers RJ, Smith LM (2000) Synthesis and charac-erization of DNA–modified silicon (111) surfaces. J Am Chem Soc 122: 1205–1209
20. Demers LM, Ginger DS, Park SJ, Li Z, Chung SW, Mirkin CA (2002) Di-rect patterning of modified oligonucleotides on metals and insulators by dip–pennanolithography. Science 296: 1836–1841
21. Gilmor SD, Thiel AJ, Strother TC, Smith LM, Lagally MG (2000) Hy-drophilic/hydrophobic patterned surfaces as templates for DNA arrays. Lang-muir 16: 7223–7228
22. Zhang H, Li Z, Mirkin CA (2002) Dip–pen nanolithography–based methodologyfor preparing arrays of nanostructures functionalized with oligonucleotides. Ad-vanced Materials 14: 1472–1474
23. Brockman JM, Frutos AG, Corn RM (1999) A multistep chemical modificationprocedure to create DNA arrays on gold surfaces for the study of protein–DNAinteractions with surface plasmon resonance imaging. J Am Chem Soc 121:8044–8051
24. Guschin D, Yershov G, Zaslavsky A, Gemmell A, Shick V, Proudnikov D,Arenkov P, Mirzabekov A (1997) Manual manufacturing of oligonucleotide,DNA, and protein microchips. Anal Biochem 250: 203–211
25. Proudnikov D, Timofeev E, Mirzabekov A (1998) Immobilization of DNA inpolyacrylamide gel for the manufacture of DNA and DNA–oligonucleotide mi-crochips. Anal Biochem 259: 34–41
26. Timofeev EN, Kochtkova SV, Mirzabekov AD, Florentiev VL (1996) Regioselec-tive immobilization of short oligonucleotides to acrylic copolymer gels. NucleicAcids Research 24: 3142–3148
27. Dubiley S, Kirillov E, Lysov Y, Mirzabekov A (1997) Fractionation, phospho-rylation and ligating on oligonucleotide microchips to enhance sequencing byhybridization. Nucleic Acids Research 25: 2259
28. Afanassiev V, Hanemann V, Wolfl S (2000) Preparation of DNA and proteinmicroarrays on glass slides coated with an agarose film. Nucleic Acids Research28: e66
29. Egner BJ, Rana S, Smith H, Bouloc N, Frey JG, Brocklesby WS, Bradley M(1997) Tagging in combinatorial chemistry: the use of coloured and fluorescentbeads. Chemical Communications 8: 735–736
30. Ferguson JA, Steemers FJ, Walt DR (2000) High density fiber optic DNA ran-dom microsphere array. Anal Chem 72: 5618–5624
31. Needels MC, Jones DG, Tate EH, Heinkel GL, Kochersperger LM, Dower WJ,Barrett RW, Gallop MA (1993) Generation and screening of an oligonucleotide–encoded synthetic peptide library. Proc Natl Acad Sci USA 90: 10700–10704
58 Alvaro Carrillo et al.
32. Ness JV, Kalbfleish S, Petrie CR, Reed MW, Tabone JC, Vermeulen NMJ (1991)A versatile solid support system for oligodeoxynucleotide probe–based hybridiza-tion assays. Nucleic Acids Research 19: 3345–3350
33. Walt DR (2000) Molecular biology – bead-based fiber–optic arrays. Science 287:451–452
34. Church GM, Gilbert W (1984) Genomic sequencing. Proc Natl Acad Sci USA81: 1991–1995
35. Saiki RK, Walsh PS, Levenson CH, Erlich HA (1989) Genetic analysis of ampli-fied DNA with immobilized sequence–specific oligonucleotide probes. Proc NatlAcad Sci USA 86: 6230–6234
36. Zhao N, Hashida H, Takahashi N, Misumi Y, Sakaki Y (1995) High–densitycDNA filter analysis: a novel approach for large scale quantitative analysis ofgene expression. Gene 156: 207–213
37. Matson RS, Rampal J, Pentoney SL, Anderson PD, Coassin P (1995) Biopoly-mer synthesis on polypropylene supports: oligonucleotide arrays. Anal Biochem224: 110–116
38. Shchepinov MS, Case-Green SC, Southern EM (1997) Steric factors influencinghybridization of nucleic acids to oligonucleotide arrays. Nucleic Acids Research25: 1155–1161
39. Weiler J, Hoheisel JD (1996) Combining the preparation of oligonucleotide arraysand synthesis of high–quality primers. Anal Biochem 243: 218–227
40. Kohsaka H, Taniguchi A, Richman DD, Carson DA (1993) Microtiter formatgene quantification by covalent capture of competitive PCR products–applicationto HIV1 detection. Nucleic Acids Research 21: 3469–3472
41. Running JA, Urdea MS (1990) A procedure for productive coupling of syn-thetic oligonucleotides to polystyrene microtiter wells for hybridization capture.BioTechniques 8: 276–277
42. Nikiforov TT, Rogers Y-H (1995) The use of 96–well polystyrene plates for DNAhybridization–based assays : An evaluation of different approaches to oligonu-cleotide immobilization. Anal Biochem 227: 201–209
43. Butler JE, Ni L, Nessler R, Joshi DS, Suter M, Rosenberg B, Chang J, BrownWR, Cantarero LA (1992) The physical and functional behavior of capture an-tibodies adsorbed on polystyrene. J Immunol Meth 150: 77–90
44. Butler JE, Ni L, Brown WR, Joshi KS, Chang J, Rosenberg B, Voss EW (1993)The immunochemistry of sandwich ELISAs – VI. Greater than 90% of mono-clonal and 75% of polyclonal anti-fluorescyl capture antibodies (CAbs) are de-natured by passive adsorption. Molecular Immunology 30: 1165–1175
45. Chapman RG, Ostuni E, Liang MN, Meluleni G, Kim E, Yan L, Pier G, WarrenHS, Whitesides GM (2001) Polymeric thin films that resist the adsorption ofproteins and the adhesion of bacteria. Langmuir 17: 1225–1233
46. www.cgr.harvard.edu/macbeath/research/protein microarrays/protein microar-rays.html
47. MacBeath G, Schreiber SL (2000) Printing proteins as microarrays for high–throughput function determination. Science 289: 1760–1763
48. http://arrayit.com/products/substrates/substrates.html49. Zhu H, Bilgin M, Bangham R, Hall D, Casamayor A, Bertone P, Lan N, Jansen
R, Bidlingmaier S, Houfek T, Mitchell T, Miller P, Dean R, Gerstein M, SnyderM (2001) Global analysis of protein activities using proteome chips. Science 293:2101–2105

3 Surfaces and Substrates 59
50. Madoz-Gurpide J, Wang H, Misek DE, Brichory F, Hanash SM (2001) Proteinbased microarrays: a tool for probing the proteome of cancer cells and tissues.Proteomics 1: 1279–1287
51. Sreekumar A, Nyati MK, Varambally S, Barrette TR, Ghosh D, Lawrence TS,Chinnaiyan AM (2001) Profiling of cancer cells using protein microarrays: dis-covery of novel radiation–regulated proteins. Can Res 61: 7585–7593
52. Benters R, Niemeyer CM, Wohrle D (2001) Dendrimer–activated solid supportsfor nucleic acid and protein microarrays. Chembiochem 2: 686–694
53. Mendoza LG, McQuary P, Mongan A, Gangadharan R, Brignac S, Eggers M(1999) High–throughput microarray–based enzyme–linked immunosorbent assay(ELISA). BioTechniques 27: 778–788
54. Wiese R, Belosludtsev Y, Powdrill T, Thompson P, Hogan M (2001) Simulta-neous multianalyte ELISA performed on a microarray platform. Clin Chem 47:1451–1457
55. Melnyk O, Duburcq X, Olivier C, Urbes F, Auriault C, Gras-Masse H (2002)Peptide arrays for highly sensitive and specific antibody–binding fluorescenceassays. Bioconjugate Chem 13: 713–720
56. Haab BB, Dunham MJ, Brown PO (2001) Protein microarrays for highly par-allel detection and quantitation of specific proteins and antibodies in complexsolutions. Genome Biology 2: research0004.1–0004.13
57. Fang Y, Frutos AG, Lahiri J (2002) Membrane protein microarrays. J Am ChemSoc 124: 2394–2395
58. Cremer PS, Boxer SG (1999) Formation and spreading of lipid bilayers on planarglass supports. J Phys Chem B 103: 2554–2559
59. Lahiri J, Kalai P, Frutos A, Jonas SJ, Schaeffler R (2000) Method for fabricatingsupported bilayer lipid membranes on gold. Langmuir 16: 7805–7810
60. Fang Y, Frutos AG, Lahiri J (2002) G–protein–coupled receptor microarrays.Chem–biochem 3: 987–991
61. Hergenrother PJ, Depew KM, Schreiber SL (2000) Small–molecule microar-rays: covalent attachment and screening of alcohol–containing small moleculeson glass slides. J Am Chem Soc 122: 7849–7850
62. MacBeath G, Koehler AN, Schreiber SL (1999) Printing small molecules asmicroarrays and detecting protein–ligand interactions en masse. J Am ChemSoc 121: 7967–7968
63. http://www.schreiber.chem.harvard.edu/home/protocols/SMP.html64. Kuruvilla FG, Shamji AF, Sternson SM, Hergenrother PJ, Schreiber SL (2002)
Dissecting glucose signalling with diversity–oriented sysnthesis and small–molecule microarrays. Nature 416: 653–657
65. Mooney JF, Hunt AJ, McIntosh JR, Liberko CA, Walba DM, Rogers CT (1996)Patterning of functional antibodies and other proteins by photolithography ofsilane monolayers. Proc Natl Acad Sci USA 93: 12287–12291
66. Hodneland CD, Lee Y, Min D, Mrksich M (2002) Selective immobilization ofproteins to self–assembled monolayers presenting active site–directed capture lig-ands. Proc Natl Acad Sci USA 99: 5048–5052
67. Lahiri J, Isaacs L, Tien J, Whitesides GM (1999) A strategy for the generationof surfaces presenting ligands for studies of binding based on an active ester as acommon reactive intermediate: a surface plasmon resonance study. Anal Chem71: 777–790
68. Lee K, Park S, Mirkin C, Smith J, Mrksich M (2002) Protein nanoarrays gen-erated by dip–pen nanolithography. Science 295: 1702–1705
60 Alvaro Carrillo et al.
69. Yang Z, Frey W, Oliver T, Chilkoti A (2000) Light–activated affinity micropat-terning of proteins on self–assembled monolayers on gold. Langmuir 16: 1751–1758
70. Bieri C, Heyse OP, Hofmann KP, Vogel H (1999) Micropatterned immobilizationof a G protein–coupled receptor and direct detection of G protein activation. NatBiotechnol 17: 1105–1108
71. Kenausis GL, Voros J, Elbert DL, Huang N, Hofer R, Ruiz-Taylor L, Textor M,Hubbell JA, Spencer ND (2000) Poly(L–lysine)–g–Poly(ethylene glycol) layerson metal oxide surfaces: attachment mechanism and effects of polymer architec-ture on resistance to protein adsorption. J Phys Chem B 104: 3298–3309
72. Ruiz-Taylor LA, Martin TL, Wagner P (2001) X-ray photoelectron spec-troscopy and radiometry studies of biotin–derivatized poly(L–lysine)–grafted–poly(ethylene glycol) monolayers on metal oxides. Langmuir 17: 7313–7322
73. Harris JM, Zalipsky S (1997) Poly(ethylene glycol): chemistry and biologicalapplications. American Chemical Society, Washington D.C.
74. Jenney CR, Anderson JM (1999) Effects of surface–coupled polyethylene oxideon human macrophage adhesion and foreign body giant cell formation in vitro.J Biomed Mater Res 44: 206–216
75. Ruiz-Taylor LA, Martin TL, Zaugg FG, Witte K, Indermule P, Nock S, WagnerP (2001) Monolayers of derivatized poly(L–lysine)–grafted–poly(ethylene glycol)on metal oxides as a class of biomolecular interfaces. Proc Natl Acad Sci USA98: 852–857
76. Frederickson RM (2002) Zyomyx, protein chips: protein chemistry comes to thesurface. Chem Biol 9: 763–765
77. Angenendt P, Glokler J, Murphy D, Lehrach H, Cahill DJ (2002) Toward opti-mized antibody microarrays: a comparison of current microarray support mate-rials. Anal Biochem 309: 253–260
78. Vasiliskov AV, Timofeev EN, Surzhikov SA, Drobyshev AL, Shick VV, Mirz-abekov AD (1999) Fabrication of microarray of gel–immobilized compounds ona chip by co-polymerisation. BioTechniques 27: 592–605
79. Arenkov P, Kukhtin A, Gemmell A, Voloshchuk S, Chupeeva V, Mirzabekov A(2000) Protein microchips: use for immunoassay and enzymatic reactions. AnalBiochem 278: 123–131
80. http://lifesciences.perkinelmer.com/areas/proteomics/chem.asp HydroGelTM.81. http://www.biocept.com/technology.html82. Ge H (2000) UPA, a universal protein array system for quantitative detection
of protein–protein, protein–DNA, protein–RNA and protein–ligand interactions.Nucleic Acids Research 28: e3, i–vii
83. de Wildt RMT, Mundy CR, Gorick BD, Tomlinson IM (2000) Antibody arraysfor high–throughput screening of antibody–fantigen interactions. Nature Biotech-nology 18: 989–994
84. Paweletz CP, Charboneau L, Bichsel VE, Simone NL, Chen T, Gillespie JW,Emmert-Buck MR, Roth MJ, Petricoin EF, Liotta LA (2001) Reverse phaseprotein microarrays which capture disease progression show activation of pro-survival pathways at the cancer invasion front. Oncogene 20: 1981–1989
85. Lueking A, Horn M, Eickhoff H, Bussow K, Lehrach H, Walter G (1999) Proteinmicroarrays for gene expression and antibody screening. Anal Biochem 270: 103–111

3 Surfaces and Substrates 61
86. Zhu H, Klemic JF, Chang S, Bertone P, Casamayor A, Klemic KG, Smith D,Gerstein M, Reed MA, Snyder M (2000) Analysis of yeast protein kinases usingprotein chips. Nature Genetics 26: 283–289
87. Bernard A, Michel B, Delamarche E (2001) Micromosaic immunoassays. AnalChem 73: 8–12
88. Avseenko N, Morozova TY, Atauliakhanov F, Morozov VN (2001) Immobi-lization of proteins in immunochemical microarrays fabricated by elecrospraydeposition. Anal Chem 73: 6047–6052
89. Morozocv VN, Morozova TY (1999) Electrospray deposition as a method formass fabrication of mono– and multicomponent microarrays of biological andbiologically active substances. Anal Chem 71: 3110–3117
4
Reagent Jetting Based Deposition Technologiesfor Array Construction
Mitchel J. Doktycz
4.1 Introduction
Technologies utilizing arrayed biological reagents are revolutionizing bioan-alytical measurements. In genomics, initial successes in gene microarray ex-periments for analysis of gene transcription have led to applications involv-ing microarrays of proteins [1, 2], whole cells [3], membranes [4] and smallmolecules [5]. High throughput screening applications, which exploit smallvolume reaction mixtures, are also leveraging off of microarray technology. De-position technologies have developed to meet the challenges inherent to thesevarious applications and materials. Deposition technologies must be compat-ible with the assay requirements (e.g. reagent conservation, volume metering,array density) and bridge ‘macro–scale’ sample containers to microscale assaydevices.
Two robust technologies are becoming conventional. Currently, most mi-croarraying of prepared reagents is carried out using pin based, touch–off de-position techniques, which is the subject of the following chapter in this book.This technique is inherently simple and numerous variants of pin spottingare in practice or development. Another approach with gaining popularity isbased on reagent jetting. Similar to ink jetting technology that is commonlyused in desktop printers, reagent jetting does not require contact between thedispensing tip and surface and allows for metering of extremely small vol-umes of reagent. This latter technique will be overviewed herein, highlightingvariants and their specific strengths.
4.2 Reagent Jetting – Technology Overview
Various approaches to reagent jetting are currently in use. These techniquesborrow features and technology developed for commonly used ink jet baseddesktop printers [6]. These printers are typically drop–on–demand devices that
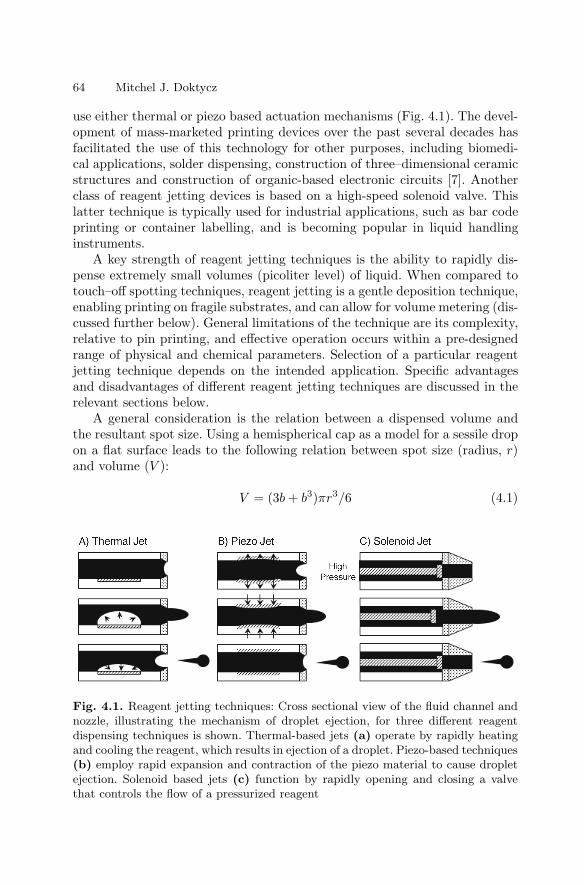
64 Mitchel J. Doktycz
use either thermal or piezo based actuation mechanisms (Fig. 4.1). The devel-opment of mass-marketed printing devices over the past several decades hasfacilitated the use of this technology for other purposes, including biomedi-cal applications, solder dispensing, construction of three–dimensional ceramicstructures and construction of organic-based electronic circuits [7]. Anotherclass of reagent jetting devices is based on a high-speed solenoid valve. Thislatter technique is typically used for industrial applications, such as bar codeprinting or container labelling, and is becoming popular in liquid handlinginstruments.
A key strength of reagent jetting techniques is the ability to rapidly dis-pense extremely small volumes (picoliter level) of liquid. When compared totouch–off spotting techniques, reagent jetting is a gentle deposition technique,enabling printing on fragile substrates, and can allow for volume metering (dis-cussed further below). General limitations of the technique are its complexity,relative to pin printing, and effective operation occurs within a pre-designedrange of physical and chemical parameters. Selection of a particular reagentjetting technique depends on the intended application. Specific advantagesand disadvantages of different reagent jetting techniques are discussed in therelevant sections below.
A general consideration is the relation between a dispensed volume andthe resultant spot size. Using a hemispherical cap as a model for a sessile dropon a flat surface leads to the following relation between spot size (radius, r)and volume (V ):
V = (3b + b3)πr3/6 (4.1)
Fig. 4.1. Reagent jetting techniques: Cross sectional view of the fluid channel andnozzle, illustrating the mechanism of droplet ejection, for three different reagentdispensing techniques is shown. Thermal-based jets (a) operate by rapidly heatingand cooling the reagent, which results in ejection of a droplet. Piezo-based techniques(b) employ rapid expansion and contraction of the piezo material to cause dropletejection. Solenoid based jets (c) function by rapidly opening and closing a valvethat controls the flow of a pressurized reagent
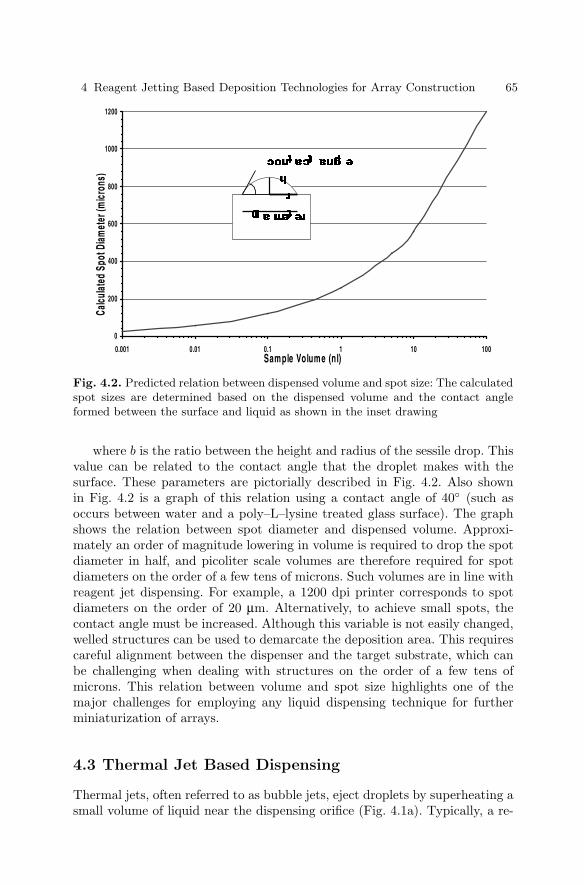
4 Reagent Jetting Based Deposition Technologies for Array Construction 65
0
200
400
600
800
1000
1200
0.001 0.01 0.1 1 10 100Sample Volume (nl)
Calcu
lated
Spot
Diam
eter
(micr
ons)
Fig. 4.2. Predicted relation between dispensed volume and spot size: The calculatedspot sizes are determined based on the dispensed volume and the contact angleformed between the surface and liquid as shown in the inset drawing
where b is the ratio between the height and radius of the sessile drop. Thisvalue can be related to the contact angle that the droplet makes with thesurface. These parameters are pictorially described in Fig. 4.2. Also shownin Fig. 4.2 is a graph of this relation using a contact angle of 40 (such asoccurs between water and a poly–L–lysine treated glass surface). The graphshows the relation between spot diameter and dispensed volume. Approxi-mately an order of magnitude lowering in volume is required to drop the spotdiameter in half, and picoliter scale volumes are therefore required for spotdiameters on the order of a few tens of microns. Such volumes are in line withreagent jet dispensing. For example, a 1200 dpi printer corresponds to spotdiameters on the order of 20 µm. Alternatively, to achieve small spots, thecontact angle must be increased. Although this variable is not easily changed,welled structures can be used to demarcate the deposition area. This requirescareful alignment between the dispenser and the target substrate, which canbe challenging when dealing with structures on the order of a few tens ofmicrons. This relation between volume and spot size highlights one of themajor challenges for employing any liquid dispensing technique for furtherminiaturization of arrays.
4.3 Thermal Jet Based Dispensing
Thermal jets, often referred to as bubble jets, eject droplets by superheating asmall volume of liquid near the dispensing orifice (Fig. 4.1a). Typically, a re-
66 Mitchel J. Doktycz
sistive heating element is controlled such that the application of current causesrapid heating of the ink. This generates a vapor bubble, forcing liquid from thenozzle (middle panel, Fig. 4.1a). Upon cooling, the bubble collapses, pinchingthe liquid stream and allowing for the channel to refill (lower panel, Fig. 4.1a).Heating and cooling can occur very quickly, with repetition rates greater than10,000 Hz being typical. Considering the simplicity of the required structure,which consists of a liquid channel, nozzle and heating element, thermal jetscan be fabricated at high density using techniques developed in the semi-conductor industry. The simple manufacturing process coupled with the highdemand for desktop printers have led to low cost, disposable print heads.
A significant difference between desktop printers and those needed for highthroughput screening applications is the number of ‘inks’ required. The fewink cartridges needed for color printing pales in comparison to the thousandsof reagents used to create a cDNA microarray. This necessitates cleaning andrefilling of the ink cartridges. A further complication is the ink formulation.Commercial printers are optimized for specific ink compositions and print-ing densities. Factors such as surface tension and viscosity must be carefullycontrolled. Further, these inks are often matched with the properties of theprint media for optimal performance. Similar considerations are necessary foradopting thermal jet based printing for biomedical applications. To date, cus-tom thermal jet print heads, specifically designed for microarray printing, havenot been described. Nevertheless, several examples on the use of commercialprinters, adapted to printing biomaterials, have been published [8–10].
To adapt a commercial printer for dispensing DNA or protein solutions, theink cartridge must be carefully rinsed out and replaced with the biochemicalin a solution of similar viscosity and surface tension as the original ink. Thiscan be done by the addition of various reagents such as ethanol [8], glycerol [9]or a detergent such as sodium dodecyl sulfate [10]. The printed spots can beextremely small, on the order of a few tens of microns, which is consistentwith the dispensed volume of a few tens of picoliters. The rapid heating,which can reach temperatures of 200–300C, could presumably cause proteindegradation which would lead to low protein activity as well as clogging ofthe nozzle. However, while extensive evaluation of different proteins has notbeen performed, the problem of protein denaturation does not appear to besignificant. This is likely due to the highly localized heating which expands theliquid behind the ejected droplet. When spotting nucleic acids, the potentialfor denaturation may be advantageous because single stranded probes aredesired.
While the use of a commercial printer for printing biomolecules takes ad-vantage of low instrumentation costs and exploits various computer softwareprograms for defining the printed regions, there are no simple means for chang-ing reagents and complete recovery of unused material is not possible. There-fore, such an approach is only useful for applications where one, or a fewreagents, need to be patterned.
4 Reagent Jetting Based Deposition Technologies for Array Construction 67
4.4 Piezo Jet Based Dispensing
This technology operates by mechanically inducing a pressure wave into theliquid. Rapid dimensional changes of a piezoelectric material can induce thispressure pulse to eject a single droplet (Fig. 4.1b). A number of differentdesigns are employed in desktop printers, with the piezoelectric material op-erating in either a push, pull, shear or squeeze tube mode [6]. The charac-teristics of the droplet are dependent on a number of factors including thephysical and chemical characteristics of the liquid, the nozzle structure andthe dimensions of the preceding fluidic chamber. Commercial desktop printersemploy dozens to hundreds of individually controlled dispensers. In contrastto thermal jet printers, single channel piezo-based dispensers are commer-cially available for applications other than desktop printing. Instruments orcomponents from manufacturers such as MicroFab Technologies [11], Micro-drop GmbH [12], and Perkin Elmer Life Sciences [13] are commonly usedfor biomedical applications. Perkin Elmer’s Packard BioChip ArrayerTM andSpotArrayTM Enterprise are specifically designed for microarray construction.
The majority of dispensers for research applications are based on thesqueeze tube design. Typically, a glass capillary is mounted inside a cylindri-cal piezo material. A specific voltage pulse is applied to the piezo material tocreate the pressure pulse. The optimal duration and amplitude of the voltagedepends on the design of the device. Typically, the diameter of the dispenseddroplet matches closely the diameter of the orifice. Volumes of a few picolitersare reproducibly dispensed at rates of a few thousand per second. Figure 4.3adisplays an ∼ 10 pl drop being dispensed from a 20 µm orifice. The image inFig. 4.3a is actually a composite of 15 dispenses captured with a synchronizedXenon strobe lamp and illustrates the reproducibility of the technique. Thespots that are formed from a single dispense are on the order of 50 µm indiameter (Fig. 4.3b). The Packard BioChip ArrayerTM uses a 75 µm nozzleand dispenses drops on the order of 300 pl. This leads to spots on the orderof 200–300 µm when dispensing onto a glass slide [13]. These volumes andresultant spot sizes are consistent with the estimates displayed in Fig. 4.2.
The sub–nanoliter volumes that can be dispensed and the commercialavailability of the technology are clear strengths of the piezo jetting tech-nique. However, a complication is that the dispense nozzle must be filled withthe desired reagent and a specific fluid pressure must be maintained for dis-pensing. Appropriate pressure in the fluid tube is necessary for preventingthe reagent from dripping out the nozzle and for optimal performance of thedevice. One method, aspirating sample through the nozzle, requires sufficienttime to stabilize the system pressure and can reduce fluid handling through-put. Further, small nozzle diameters can lead to clogging and slow aspirationrates. Alternatively, the dispenser can be dedicated to delivering a particularreagent by filling from a reservoir behind the nozzle, much like in a conven-tional desktop printer cartridge.
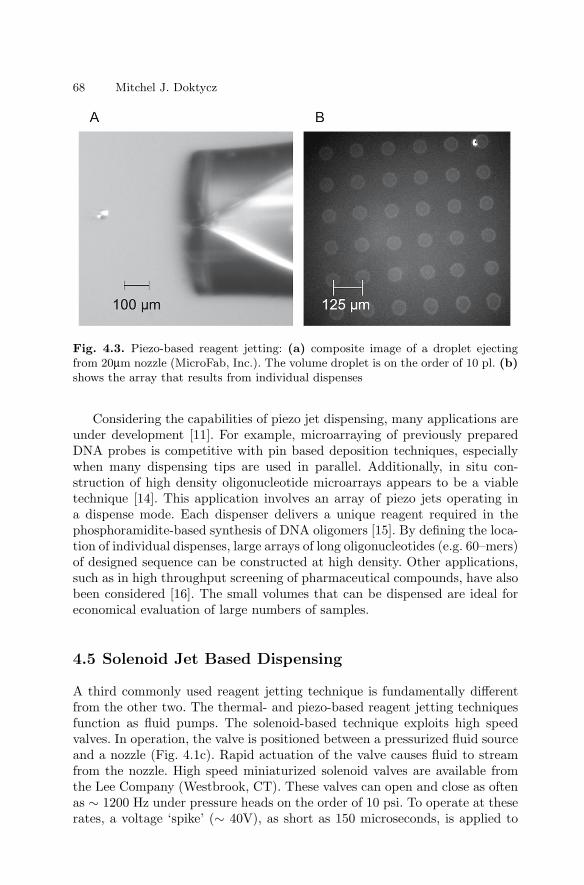
68 Mitchel J. Doktycz
Fig. 4.3. Piezo-based reagent jetting: (a) composite image of a droplet ejectingfrom 20µm nozzle (MicroFab, Inc.). The volume droplet is on the order of 10 pl. (b)shows the array that results from individual dispenses
Considering the capabilities of piezo jet dispensing, many applications areunder development [11]. For example, microarraying of previously preparedDNA probes is competitive with pin based deposition techniques, especiallywhen many dispensing tips are used in parallel. Additionally, in situ con-struction of high density oligonucleotide microarrays appears to be a viabletechnique [14]. This application involves an array of piezo jets operating ina dispense mode. Each dispenser delivers a unique reagent required in thephosphoramidite-based synthesis of DNA oligomers [15]. By defining the loca-tion of individual dispenses, large arrays of long oligonucleotides (e.g. 60–mers)of designed sequence can be constructed at high density. Other applications,such as in high throughput screening of pharmaceutical compounds, have alsobeen considered [16]. The small volumes that can be dispensed are ideal foreconomical evaluation of large numbers of samples.
4.5 Solenoid Jet Based Dispensing
A third commonly used reagent jetting technique is fundamentally differentfrom the other two. The thermal- and piezo-based reagent jetting techniquesfunction as fluid pumps. The solenoid-based technique exploits high speedvalves. In operation, the valve is positioned between a pressurized fluid sourceand a nozzle (Fig. 4.1c). Rapid actuation of the valve causes fluid to streamfrom the nozzle. High speed miniaturized solenoid valves are available fromthe Lee Company (Westbrook, CT). These valves can open and close as oftenas ∼ 1200 Hz under pressure heads on the order of 10 psi. To operate at theserates, a voltage ‘spike’ (∼ 40V), as short as 150 microseconds, is applied to
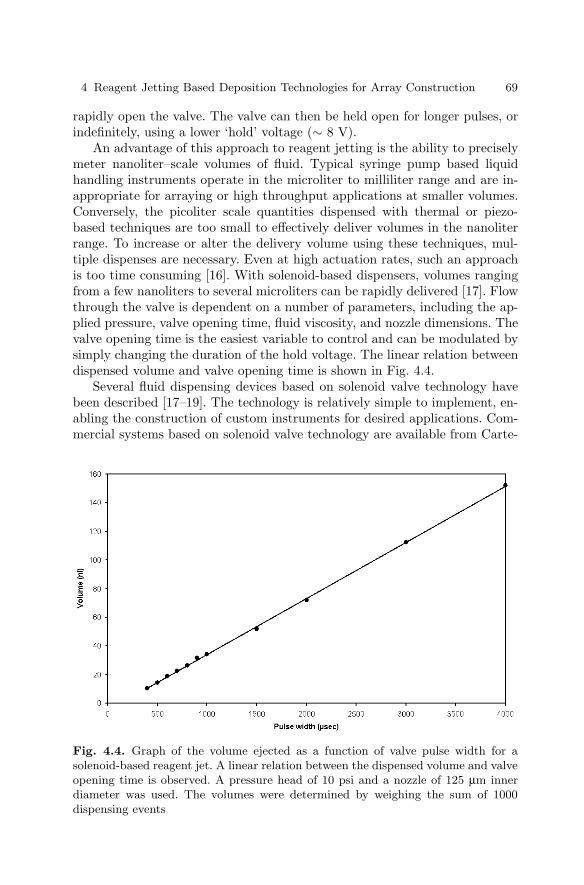
4 Reagent Jetting Based Deposition Technologies for Array Construction 69
rapidly open the valve. The valve can then be held open for longer pulses, orindefinitely, using a lower ‘hold’ voltage (∼ 8 V).
An advantage of this approach to reagent jetting is the ability to preciselymeter nanoliter–scale volumes of fluid. Typical syringe pump based liquidhandling instruments operate in the microliter to milliliter range and are in-appropriate for arraying or high throughput applications at smaller volumes.Conversely, the picoliter scale quantities dispensed with thermal or piezo-based techniques are too small to effectively deliver volumes in the nanoliterrange. To increase or alter the delivery volume using these techniques, mul-tiple dispenses are necessary. Even at high actuation rates, such an approachis too time consuming [16]. With solenoid-based dispensers, volumes rangingfrom a few nanoliters to several microliters can be rapidly delivered [17]. Flowthrough the valve is dependent on a number of parameters, including the ap-plied pressure, valve opening time, fluid viscosity, and nozzle dimensions. Thevalve opening time is the easiest variable to control and can be modulated bysimply changing the duration of the hold voltage. The linear relation betweendispensed volume and valve opening time is shown in Fig. 4.4.
Several fluid dispensing devices based on solenoid valve technology havebeen described [17–19]. The technology is relatively simple to implement, en-abling the construction of custom instruments for desired applications. Com-mercial systems based on solenoid valve technology are available from Carte-
Fig. 4.4. Graph of the volume ejected as a function of valve pulse width for asolenoid-based reagent jet. A linear relation between the dispensed volume and valveopening time is observed. A pressure head of 10 psi and a nozzle of 125 µm innerdiameter was used. The volumes were determined by weighing the sum of 1000dispensing events
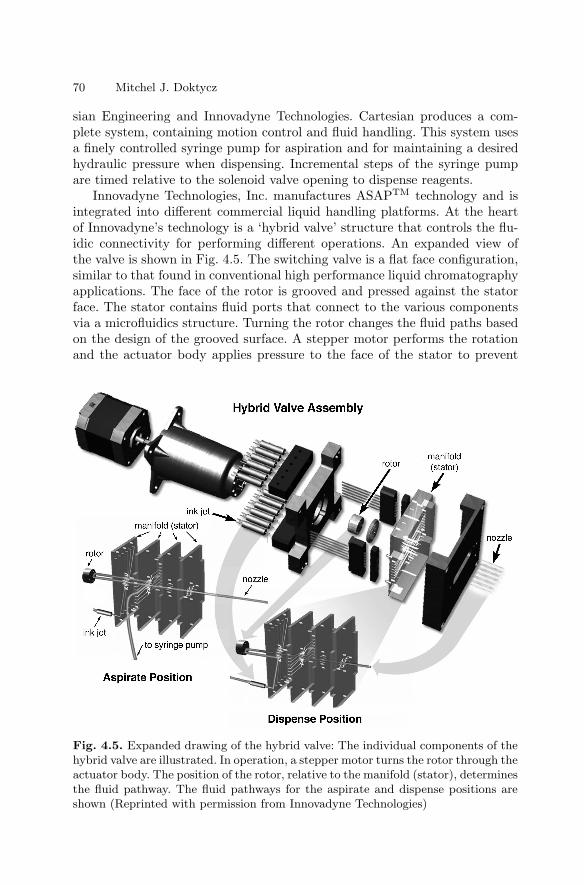
70 Mitchel J. Doktycz
sian Engineering and Innovadyne Technologies. Cartesian produces a com-plete system, containing motion control and fluid handling. This system usesa finely controlled syringe pump for aspiration and for maintaining a desiredhydraulic pressure when dispensing. Incremental steps of the syringe pumpare timed relative to the solenoid valve opening to dispense reagents.
Innovadyne Technologies, Inc. manufactures ASAPTM technology and isintegrated into different commercial liquid handling platforms. At the heartof Innovadyne’s technology is a ‘hybrid valve’ structure that controls the flu-idic connectivity for performing different operations. An expanded view ofthe valve is shown in Fig. 4.5. The switching valve is a flat face configuration,similar to that found in conventional high performance liquid chromatographyapplications. The face of the rotor is grooved and pressed against the statorface. The stator contains fluid ports that connect to the various componentsvia a microfluidics structure. Turning the rotor changes the fluid paths basedon the design of the grooved surface. A stepper motor performs the rotationand the actuator body applies pressure to the face of the stator to prevent
Fig. 4.5. Expanded drawing of the hybrid valve: The individual components of thehybrid valve are illustrated. In operation, a stepper motor turns the rotor through theactuator body. The position of the rotor, relative to the manifold (stator), determinesthe fluid pathway. The fluid pathways for the aspirate and dispense positions areshown (Reprinted with permission from Innovadyne Technologies)
4 Reagent Jetting Based Deposition Technologies for Array Construction 71
leakage. With this set up, multiple fluid streams can be switched simultane-ously and rapidly. Further, multiple functionalities can be integrated withoutinterfering in the sample path. This prevents contamination of the solenoidvalve that can reduce its operational lifetime. Additionally, different compo-nents such as syringe pumps, washing and purging sources, or reagent sourcescan be integrated depending on the application. The hybrid valve can delivergreater than 200 individual dispenses per minute and deliver volumes rangingfrom 50 nl to 10 µl with less than 5% coefficient of variation.
Several applications based on solenoid-based reagent jetting have been de-veloped. Although the system can be used for microarraying, the typical lowerlimit on droplet volume (∼ 1 nl) is too large to produce high density microar-rays. Other applications exploit the technique’s ability to rapidly dispensea desired volume. These applications include high throughput screening ofpharmaceutical candidates or synthesis of combinatorial libraries [18]. Whenused as a reagent dispenser, care must be taken not to expose the valve toharsh solvents as this can lead to degradation of the valve seals. The use ofsolenoid-based reagent dispensing has also been described for the automatedscreening of protein crystallization parameters [19]. The ability to dispense onthe nanoliter scale, afforded by solenoid-based reagent jets, allows significantminiaturization and higher throughput leading to significant cost savings.
References
1. Le HP 1998. Progress and Trends in Ink–jet Printing Technology. J of ImagingScience and Technology 42(1):49–62
2. Bateman TA, Ayers RA and Greenway RB (1999) An Engineering Evaluation ofFour Fluid Transfer Devices for Automated 384–Well High Throughput Screen-ing. Lab Robotics and Automation 11:250–259
3. Mueller U, Nyarsik L, Horn M, Rauth H, Przewieslik T, Saenger W, LehrachH, Eickhoff H (2001) Development of a technology for automation and minia-turization of protein crystallization. Journal of Biotechnology 85, 7–14
4. Okamoto T, Suzuki T and Yamamoto M (2000) Microarray Fabrication with Co-valent Attachment of DNA Using Bubble Jet Technology. Nature Biotechnology18:438–441
5. Schober A, Gunther R, Schwienhorst A, Doring M, and Lindmann BF (1993) Ac-curate High–Speed Liquid Handling of Very Small Biological Samples. BioTech-niques 15(2):324–329
6. Roda A, Guardigli M, Russo C, Pasini P and Baraldini M (2000) Protein Mi-crodeposition Using A Conventional Ink–Jet Printer. BioTechniques 28(3):492–496
7. Lahiri J, Jonas SJ, Frutos AG, Kalal P and Fang Y (2001) Lipid Microarrays.Biomedical Microdevices 3(2):157–164
8. de Wildt RM, Mundy CR, Gorick BD and Tomlinson IM (2000) Antibody arraysfor high–throughput screening of antibody–antigen interactions. Nature Biotech-nology 18:989–994
72 Mitchel J. Doktycz
9. Hughes TR, M Mao M, AR Jones AR, J Burchard J, MJ Marton MJ, KWShannon KW, SM Lefkowitz SM, M Ziman M, JM Schelter JM, Meyer MR,Kobayashi S, Davis C, Dai H, He YD, Stephaniants SB, Cavet G, Walker WL,West A, Coffey E, Shoemaker DD, Stoughton R, Blanchard AP, Friend SH,and Linsley PS (2001) Expression profiling using microarrays fabricated by anink–jet oligonucleotide synthesizer. Nature Biotechnology 19:342–347
10. Hicks JS, Harker BW, Beattie KL, and Doktycz M J (2001) Modification ofan automated liquid handling system for reagent–jet, nanoliter–level dispensing.Biotechniques, 30 (4), 878–885
11. MacBeath G and Schreiber SL (2000) Printing Proteins as Microarrays forHigh–Throughput Function Determination. Science 289:1760–1763
12. Lemmo AV, Fisher JT, Geysen HM, and Rose DJ (1997) Characterization ofan Inkjet Chemical Microdispenser for Combinatorial Library Synthesis. Anal.Chem. 69:543–551
13. Blanchard AP, Kaiser RJ, and Hood LE (1996) High–Density OligonucleotideArrays. Biosensors & Bioelectronics 11(6/7):687–690
14. Allain LR, Askari M, Stokes DL, Vo-Dinh T (2001) Microarray sampling–platform fabrication using bubble–jet technology for a biochip system. FreseniusJ Anal Chem 371:146–150
15. Uetz P, Giot L, Cagney G, Mansfield TA, Judson RS, Knight JR, LockshonD, Narayan V, Srinivasan M, Pochart P, Qureshi-Emili A, Li Y, Godwin B,Conover D, Kalbfleisch T, Vijayadamodar G, Yang M, Johnston M, Fields S,Rothberg JM (2000) A comprehensive analysis of protein–protein interactionsin Saccharomyces cerevisiae. Nature 403:623–627
16. Qureshi-Emili A and Cagney G (2000) Large–scale functional analysis usingpeptide or protein arrays. Nature Biotechnology 18:393–397
17. Calvert P (2001) Inkjet Printing for Materials and Devices. Chem. Mater.13:3299–3305
18. Cooley P, Wallace D, Antohe B (2001) Proceedings, SPIE Conference on Mi-crofludics and BioMEMS. Vol. 4560, p. 177–188, Microfluidics and BioMEMS,Carlos H Mastrangelo; Holger Becker; Ed
19. Papen R, Croker K, and Kolb A (1998) Nanoliter Dispensing Technology. Ge-netic Engineering News, 18(4)
5
Manufacturing of 2-D Arraysby Pin-printing Technologies
Uwe R. Muller and Roeland Papen
5.1 Introduction
Seldom has a simple concept had such an impact on the Life Sciences as theapplication of ‘pin–printing’ to the arraying of biological materials, creating anentirely new movement in biotechnology. While Affymetrix developed a costlyhigh tech precision photolithography process to produce high density arraysof oligos, Schena, Davis, Brown and Shalon, then at Stanford University, useda single split pin, mounted on a home-made X–Y–Z robot, to transfer smallaliquots of cDNA from a 96–well microplate onto surface modified micro-scope slides, thereby providing the research world for the first time access tohigh density microarrays [1]. What followed was a popularization of pin toolprinting technology, aided by the emergence of several new companies thatfocused on delivering robotic instrumentation to deliver nano– and picolitervolumes of biological materials to a substrate at ever increasing density. Whiletransferring liquids with pins, hollow needles or capillaries appears low-tech,the small amount of liquid that is being transferred and especially the needto print many different fluids without sample mixing provides a significanttechnical challenge. Different approaches and solutions have been developedto meet these challenges. While non-contact jetting technologies have beendiscussed in the previous chapter, the focus here is on a variety of pin-basedtechniques and procedures, as well as key elements in the printing step thatare crucial for obtaining high quality arrays.
5.2 Definition of ‘Contact’ Pin–Printing
Contact pin–printing derives its definition from the fact that at the criticalpoint in the process a continuity exists between the transfer device (pin), thefluid (liquid) and the receiving surface (substrate). Several important physicaland chemical properties of these three elements affect their interaction and, incombination with other environmental conditions (e.g. humidity), determine
74 Uwe R. Muller et al.
the volume of the transferred liquid and the geometry of the resulting spot.Among these properties are viscosity and surface tension of the liquid, thegeometry of the pin, the force of deposition and speed of retraction, and thewetting characteristics (hydrophobicity) of both the substrate and the transferdevice. Contact between all surfaces with a multiplicity of different fluids alsoindicates the need for washing the pins between different transfers, anotherimportant parameter contributing to the reliability and quality of printing.
In difference to contact printing, ink jet-based technologies such as solenoidand piezo–electric dispensing are considered non-contact technologies, as thereis never continuity between dispensing element, liquid and receiving surface.Transfer volume and spot formation are therefore determined by fewer inter-acting parameters, which results in somewhat better quantification and moreuniform spot morphologies than achievable with contact printing, howevertypically at the cost of higher instrument complexity and therefore higherprice. For a comparison of robotic arraying instruments, see [2, 3].
In reality, even ink jet printing may be considered a contact printing tech-nology since the drop–formation is determined by interaction of the fluid witha physical orifice [4]. The only true non-contact printing technology is there-fore based on focused acoustics, where sound energy is coupled into the bottomof a container and a droplet ejected upwards by focusing acoustic energy atthe meniscus. The formation of the ejected drop depends solely on the fre-quency, energy and duration of the tone burst and eliminates variability andlimitations due to solid–liquid interactions [5].
5.3 Overview of Different Pin Technologies
While Pat Brown and others initially used only a single pin for printing anarray, the need to transfer to more destinations, faster, smaller and moreprecisely led to many different embodiments of the transfer pin and supportingrobotics. The basic pin types are reviewed below:
Solid Pins: Solid pins have excellent reproducibility for both transfer volumeand spot size as long as they are adequately washed between liquid transfers.Typically only one spot can be printed and the pin needs to be re-loaded withnew material after every deposition, whereby the amount of liquid loaded isproportional to the diameter of the pin. Solid pins have the lowest samplewastage (< 15%) of all the pin types, have an excellent CV (coefficient ofvariance) for transfer volume (as low as 2%) and spot–size, and are morerobust with regard to impact. The disadvantage is low throughput, and ifmore than one solid pin is used in a system to make up for this deficiency,the variability in spot–size and volume transferred increases proportionally asa function of pin quality (e.g. uniformity of pin diameter, surface treatment,etc). Pin performance is a function of dimensions and coating, and there areseveral manufacturers offering different choices [6, 7].
5 Manufacturing of 2-D Arrays by Pin-printing Technologies 75
Ring and Pin: Only one commercial arraying system (the AffymetrixGMS417; formerly Genetic Microsystems) is based on the ring and pin tech-nique. This process involves capturing a film of sample liquid inside a smallring by dipping it into the sample solution. For sample deposition a solid pinis pushed through this ring, whereby some of the sample is carried by the flatend of the pin to the substrate surface. The continuity of the sample film istypically not disrupted by this pin movement. Thus, the ring acts as a samplereservoir allowing multiple depositions without having to return to the samplesource. A CV for spot–size of < 10% (across 4 pins) has been reported [8]. Thedisadvantage is a higher susceptibility to environmental conditions, especiallyhumidity, that affects both the concentration of the sample in the film as wellas the stability of the film itself. This technique is also very wasteful of samplesince a large dead volume is required in the source well (to cover the ring),and not all the material in the film can be transferred. For example, a typicalload volume on a GMS427 ring is 1.5 µl, of which typically only 6.7 nl (4replicates/slide × 42 slides × 40 pl/spot), or less is used, meaning that 99.5%of the sample is wasted.
Micro–Fabricated Pin Array: An extreme example of parallelization isthe print plate from Corning, an etched silicon surface containing more thanone thousand 100 µm posts in an array layout and matching perfectly to afunnel reservoir containing the samples to be transferred. The print plate isinserted into the mated funnel and removes a few picoliters out of each channelupon retraction, which is then deposited onto a substrate. Positionality isexcellent as the spot to spot distance is not affected by robotic motion butis a feature of the print plate. The throughput and reloading is improved bymoving the substrates (microscope slides) in between the reservoir (funnel)and the pinplate, keeping travel distances small and allowing quick reloadingbetween prints. The CV’s for transfer volume and spot–size are on the orderof 9% (over a thousand pins), and there is little sample wastage on the pin(< 15%). Disadvantages include the high set–up cost of this very specializedmanufacturing equipment. This new and unique process is described in detailfurther in this chapter.
Dip–Pen NanolithographyTM: This technology represents the smallest‘solid pin’ to date and is based on atomic force microscopy. The AFM tipserves as the pen that is coated with organic molecules which are transferredvia a water meniscus to the substrate surface [9–11]. This allows extrememiniaturization with spots of less than 0.5 µm in diameter. This new technol-ogy is described in more detail in Chap. 6 of this book.
Split or Quill Pin: These types of pins represent the biochemist’s versionof the old quill pen, basically a goose feather with a slit at the end that wasused to draw up ink. For microarraying these pins are now machined withhigh precision to contain slits of 15–50 µm. After loading 0.1–0.5 µl they can
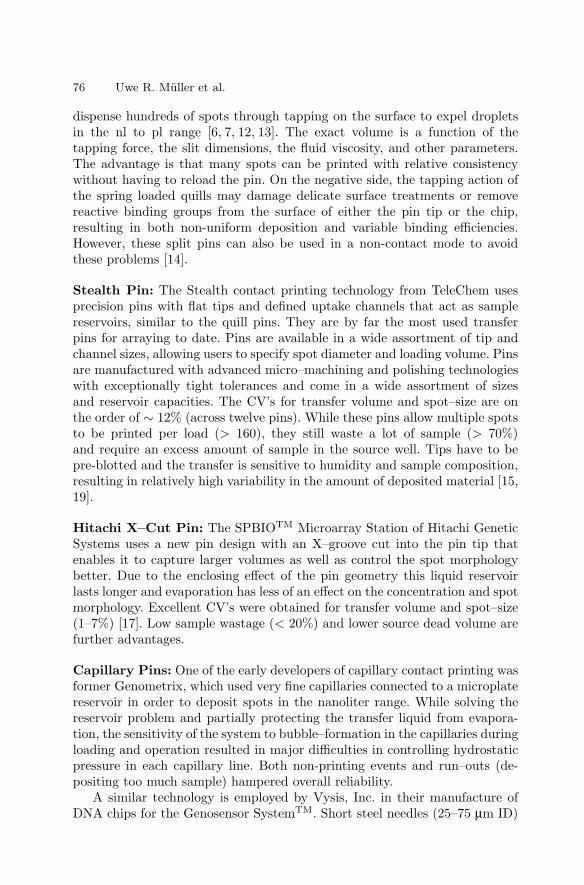
76 Uwe R. Muller et al.
dispense hundreds of spots through tapping on the surface to expel dropletsin the nl to pl range [6, 7, 12, 13]. The exact volume is a function of thetapping force, the slit dimensions, the fluid viscosity, and other parameters.The advantage is that many spots can be printed with relative consistencywithout having to reload the pin. On the negative side, the tapping action ofthe spring loaded quills may damage delicate surface treatments or removereactive binding groups from the surface of either the pin tip or the chip,resulting in both non-uniform deposition and variable binding efficiencies.However, these split pins can also be used in a non-contact mode to avoidthese problems [14].
Stealth Pin: The Stealth contact printing technology from TeleChem usesprecision pins with flat tips and defined uptake channels that act as samplereservoirs, similar to the quill pins. They are by far the most used transferpins for arraying to date. Pins are available in a wide assortment of tip andchannel sizes, allowing users to specify spot diameter and loading volume. Pinsare manufactured with advanced micro–machining and polishing technologieswith exceptionally tight tolerances and come in a wide assortment of sizesand reservoir capacities. The CV’s for transfer volume and spot–size are onthe order of ∼ 12% (across twelve pins). While these pins allow multiple spotsto be printed per load (> 160), they still waste a lot of sample (> 70%)and require an excess amount of sample in the source well. Tips have to bepre-blotted and the transfer is sensitive to humidity and sample composition,resulting in relatively high variability in the amount of deposited material [15,19].
Hitachi X–Cut Pin: The SPBIOTM Microarray Station of Hitachi GeneticSystems uses a new pin design with an X–groove cut into the pin tip thatenables it to capture larger volumes as well as control the spot morphologybetter. Due to the enclosing effect of the pin geometry this liquid reservoirlasts longer and evaporation has less of an effect on the concentration and spotmorphology. Excellent CV’s were obtained for transfer volume and spot–size(1–7%) [17]. Low sample wastage (< 20%) and lower source dead volume arefurther advantages.
Capillary Pins: One of the early developers of capillary contact printing wasformer Genometrix, which used very fine capillaries connected to a microplatereservoir in order to deposit spots in the nanoliter range. While solving thereservoir problem and partially protecting the transfer liquid from evapora-tion, the sensitivity of the system to bubble–formation in the capillaries duringloading and operation resulted in major difficulties in controlling hydrostaticpressure in each capillary line. Both non-printing events and run–outs (de-positing too much sample) hampered overall reliability.
A similar technology is employed by Vysis, Inc. in their manufacture ofDNA chips for the Genosensor SystemTM. Short steel needles (25–75 µm ID)
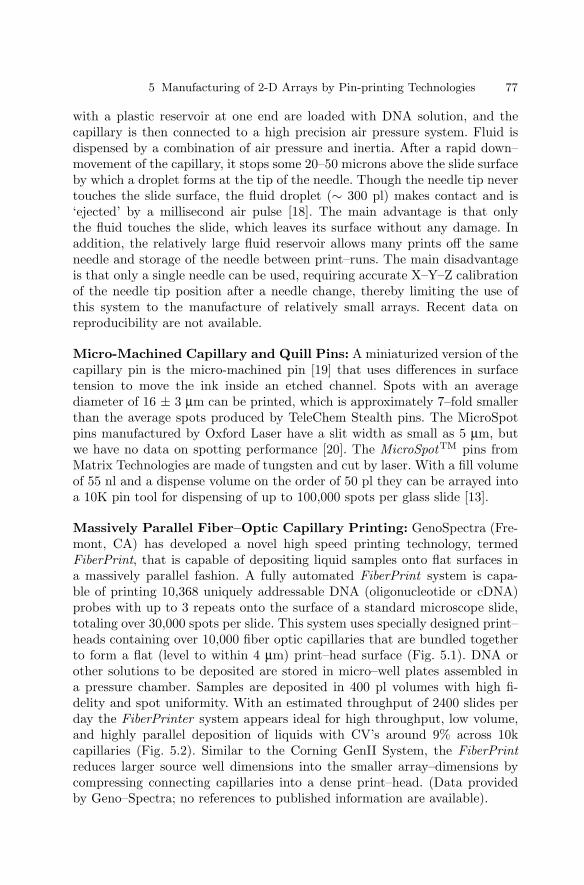
5 Manufacturing of 2-D Arrays by Pin-printing Technologies 77
with a plastic reservoir at one end are loaded with DNA solution, and thecapillary is then connected to a high precision air pressure system. Fluid isdispensed by a combination of air pressure and inertia. After a rapid down–movement of the capillary, it stops some 20–50 microns above the slide surfaceby which a droplet forms at the tip of the needle. Though the needle tip nevertouches the slide surface, the fluid droplet (∼ 300 pl) makes contact and is‘ejected’ by a millisecond air pulse [18]. The main advantage is that onlythe fluid touches the slide, which leaves its surface without any damage. Inaddition, the relatively large fluid reservoir allows many prints off the sameneedle and storage of the needle between print–runs. The main disadvantageis that only a single needle can be used, requiring accurate X–Y–Z calibrationof the needle tip position after a needle change, thereby limiting the use ofthis system to the manufacture of relatively small arrays. Recent data onreproducibility are not available.
Micro-Machined Capillary and Quill Pins: A miniaturized version of thecapillary pin is the micro-machined pin [19] that uses differences in surfacetension to move the ink inside an etched channel. Spots with an averagediameter of 16 ± 3 µm can be printed, which is approximately 7–fold smallerthan the average spots produced by TeleChem Stealth pins. The MicroSpotpins manufactured by Oxford Laser have a slit width as small as 5 µm, butwe have no data on spotting performance [20]. The MicroSpotTM pins fromMatrix Technologies are made of tungsten and cut by laser. With a fill volumeof 55 nl and a dispense volume on the order of 50 pl they can be arrayed intoa 10K pin tool for dispensing of up to 100,000 spots per glass slide [13].
Massively Parallel Fiber–Optic Capillary Printing: GenoSpectra (Fre-mont, CA) has developed a novel high speed printing technology, termedFiberPrint, that is capable of depositing liquid samples onto flat surfaces ina massively parallel fashion. A fully automated FiberPrint system is capa-ble of printing 10,368 uniquely addressable DNA (oligonucleotide or cDNA)probes with up to 3 repeats onto the surface of a standard microscope slide,totaling over 30,000 spots per slide. This system uses specially designed print–heads containing over 10,000 fiber optic capillaries that are bundled togetherto form a flat (level to within 4 µm) print–head surface (Fig. 5.1). DNA orother solutions to be deposited are stored in micro–well plates assembled ina pressure chamber. Samples are deposited in 400 pl volumes with high fi-delity and spot uniformity. With an estimated throughput of 2400 slides perday the FiberPrinter system appears ideal for high throughput, low volume,and highly parallel deposition of liquids with CV’s around 9% across 10kcapillaries (Fig. 5.2). Similar to the Corning GenII System, the FiberPrintreduces larger source well dimensions into the smaller array–dimensions bycompressing connecting capillaries into a dense print–head. (Data providedby Geno–Spectra; no references to published information are available).
78 Uwe R. Muller et al.
Fig. 5.1. Schematic of the FiberPrint system (courtesy of GenoSpectra)
Fig. 5.2. Image and measured quality of a labelled oligo array deposited by a 10kFiberPrint printhead (courtesy of GenoSpectra)
5 Manufacturing of 2-D Arrays by Pin-printing Technologies 79
Disposable Pins: VP–Scientific has recently introduced disposable one–time–use pre-molded pin–arrays. The pin–array is made out of polypropy-lene and has 96, 384 or 1536 pins that transfer between 120–135 nl per pinwith a CV of 8–12% [7]. Adapters are available for integration of the dispos-able print head with various robotic platforms, which allows transfer of wholeplates’ worth of DNA samples at a time. This avoids the need for washingand therefore eliminates cross–contamination, further enhancing the integrityof the array. The adaptability to existing robotics greatly increases their use-fulness for arraying.
In addition to the pins discussed above, a variety of other materials andpin designs have been explored by different groups and industrial manufac-turers [19,21].
5.4 Other System Componentsand Environmental Factors
While the pin is the core of a contact printing system, other system compo-nents and environmental factors influence its reliability and reproducibility.Proper monitoring, maintenance, calibration and minor adjustments of thesecan make the difference between optimal performance and bad arraying. Keyfactors include:
Pin Holders: Pins are typically held ‘floating’ in a pin holder, meaning thatthey are held in position in guiding sleeves by gravity and prevented fromfalling through due to a mechanical stop; yet they are free to move upwardsas the pin hits the substrate. This avoids excessive wear of the delicate pin tipand minimizes damage to the substrate surface. Critical in this arrangementof the guiding sleeves are tight tolerances to minimize angular deflections ofthe pins, but enough space to prevent bonding between the tip and the holder,which can result in tips no longer reaching the substrate. Telechem Stealth pinsalso feature a pin ‘collar’ that prevents rotation, providing near frictionlessprinting. Material choices are also important here to prevent static build–upon the tips and print head, which can dramatically lower print quality.
Multiple Pins: Machine tooling of pins is a delicate procedure, and giventhe small dimensions of the pin tip, it is often necessary to match pins in thesame grid to minimize performance variations from pin to pin. Maintainingnear perfect parallelism between the print head and the plane of the substratebecomes increasingly difficult with increasing number of pins and increasingsize of the print head. Adjusting this planarity by mechanical means in addi-tion to pin selection is essential to good printing and affects the longevity ofthe pins. Typical configurations for print heads are 4 pins in a 2 × 2 or 2 × 6format with 9 mm center to center spacing for 96–well source plates, and a
80 Uwe R. Muller et al.
4 × 4, 4 × 8 or 4 × 12 format with 4.5 mm center to center spacing for 384–well plates. These dimensions are mostly dictated by the fact that the usablesurface area on a glass microscope slide is limited to approximately 22×60 mm(excluding label and edges to fix a hyb–chamber). With a single transfer pinit is possible to maintain the relative position of the samples after printingon the array the same as in the source plates. For multiple pin configurationsthis is not possible due to the fixed format of the pins and the dimensionaldifference between source plate and array, requiring sample tracking softwarefor dealing with large numbers of samples.
Environmental Control: As soon as the pin, tip or capillary is loaded withsample, a race against time starts since evaporation at the liquid interfacewill change both the volume on the pin tip and the concentration of the bio-molecules in that volume. Solid pins are most vulnerable to evaporation, buteven for quill pins the amount of liquid available for deposition will eventuallybe reduced by evaporation, acting as a counter force in the substrate–liquid–pin interaction, and slowly reducing the volume deposited in each spot. Ap-plication notes by MiraiBio [17] clearly show the effect of evaporation on theX–cut solid pins. But even capillary pins, while protecting the transfer liquidbetter, are subject to evaporation. Typically a 70 micron orifice capillary willconcentrate an analyte at the bottom of the tip by about 10% per secondfor the bottom half nanoliter. This often results in what is called “the firstdrop effect”, whereby the first spot may result in a higher signal intensitythan subsequent spots. Evaporation control is also important for the sourceplates, as lengthy exposure to typical laboratory environments may concen-trate the DNA solutions in the microplates and create variability betweendifferent samples. Furthermore, the rate at which the deposited fluid dries onthe substrate surface affects spot morphology. Therefore, most manufacturingquality arraying robots are equipped with some type of enclosure to maintaina consistent humidity level, ideally between 55–70%. For high density arrays itis also advisable to keep the source plates cooled to minimize evaporation overthe term of the printing run. Additional cooling or heating of the substratemay be required for printing of protein arrays to either minimize the risk ofprotein denaturation or to enhance surface reactivity.
Due to the micron dimensions in which spot sizes are measured, it is clearthat dust particles, lint and other airborne debris can have a detrimental effecton the array quality either by clogging up the capillary channels in quill orcapillary pins or by ‘smudge’ deposition, thereby disrupting surface tensionand affecting spot morphology. In addition, any dust particles that stick tothe slide surface and are not removed by the hybridization or washing processwill typically affect the imaging, since such particles scatter light and tend toalso fluoresce across the visible spectrum. Deionization of the air as well asselection of anti-static materials in the system can be very helpful in avoidingthat slides become dust traps.
5 Manufacturing of 2-D Arrays by Pin-printing Technologies 81
Positional Robotic Control: The limitation on array density is primarilydetermined by spot diameter and secondarily by the positional reproducibil-ity and accuracy of the robotic XYZ stage. Typical spot sizes for pin basedprinters are between 100 and 200 µm in diameter, though significantly smallerspots can be made with Nanoplotters (see Chap. 6). While even relatively lowcost stages provide positional accuracy and reproducibility in the range of tensof microns, manufacture of high density arrays and prolonged production runsmay require more precise stages with single digit micrometer precision and ac-curacy as well as positional feedback to compensate for system errors. Precisecontrol of speed, acceleration and positional accuracy in the Z–axis are alsocritical to contact arraying, as described below in the printing process section.
Washing System: Essential for consistent print performance and low carry–over is a good washing system. While some commercial arraying systems relyon a simple water rinse to clean the tips between different samples, othersystems use additional ultrasonic cleaning or pressurized–jet streams of waterthat are directed at the tips for a more efficient rinse. A combination of bothapproaches as well as procedures that use specific cleansing and soaking fluidshave been reported [15,22].
5.5 Pin Printing Process
5.5.1 Dynamics of Spot Formation
As mentioned above the elements interacting in spot formation and spot mor-phology are the geometry and surface properties of the pin and the substrate,as well as the viscosity, composition and resulting surface tension of the sam-ple. Some of these issues have already been addressed in Chaps. 2 and 3 ofthis book, and for the more intricate physics involved we refer the reader tothe literature [23–26]. Our focus here is on the key issues in the mechanics ofthe process.
In the first step the pin is dipped into the ink reservoir, whereby the pene-tration depth and time of the pin in the fluid is important. Over–immersion ofthe pin will result in loading too much sample, causing the deposition of toolarge a drop for single transfer solid pins, and even for the first depositions ofquill pins. It can also lead to unwanted carry–over in subsequent cycles. Obvi-ously, immersion times have to be sufficiently long to fill up the capillaries inthe case of quill style pins. Before starting the print, it is advisable to blot theloaded pins for a specific number of ‘pre-print’ spots on a sacrificial substrateto condition the pins and eliminate ‘first spot effects’.
In the second step the pin is contacted with the substrate surface for de-livery of the ink. Several parameters influence the amount of liquid that isdeposited and the resulting spot size. First, the force (speed) with which thetip impacts the substrate is particularly critical for capillary and quill type
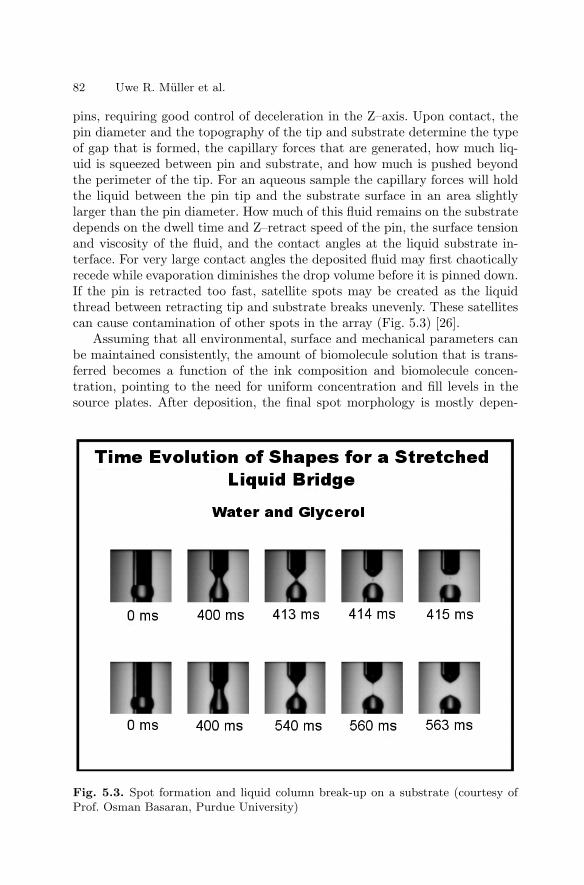
82 Uwe R. Muller et al.
pins, requiring good control of deceleration in the Z–axis. Upon contact, thepin diameter and the topography of the tip and substrate determine the typeof gap that is formed, the capillary forces that are generated, how much liq-uid is squeezed between pin and substrate, and how much is pushed beyondthe perimeter of the tip. For an aqueous sample the capillary forces will holdthe liquid between the pin tip and the substrate surface in an area slightlylarger than the pin diameter. How much of this fluid remains on the substratedepends on the dwell time and Z–retract speed of the pin, the surface tensionand viscosity of the fluid, and the contact angles at the liquid substrate in-terface. For very large contact angles the deposited fluid may first chaoticallyrecede while evaporation diminishes the drop volume before it is pinned down.If the pin is retracted too fast, satellite spots may be created as the liquidthread between retracting tip and substrate breaks unevenly. These satellitescan cause contamination of other spots in the array (Fig. 5.3) [26].
Assuming that all environmental, surface and mechanical parameters canbe maintained consistently, the amount of biomolecule solution that is trans-ferred becomes a function of the ink composition and biomolecule concen-tration, pointing to the need for uniform concentration and fill levels in thesource plates. After deposition, the final spot morphology is mostly depen-
Fig. 5.3. Spot formation and liquid column break-up on a substrate (courtesy ofProf. Osman Basaran, Purdue University)
5 Manufacturing of 2-D Arrays by Pin-printing Technologies 83
dant on the rate of evaporation, contact wetting angles and composition ofthe fluid [24,25].
5.5.2 Importance of the Substrate and its Surface
From a pin–printing perspective the ideal substrate surface is flat and itscoating is uniform. The most prevalent substrate for spotting DNA is still themicroscope slide coated with either an amino–silane or aldehyde group. Theprocess of attaching organosilanes with various functional groups to glass hasbeen known for over 30 years and can be easily duplicated in any lab. Pro-ducing such surfaces in high volume and with reproducible and stable contactangles, however, remains an art, a fact that is reflected in the high ‘value add’that the surface coating brings to a basic glass slide. Other than the contactangle, the most relevant surface characteristic for the fluid deposition processis the thickness and pore–size of its coating. In fact, recent developments haveincreased the amount of material that can be transferred to the surface byintroducing a 3–dimensional nature, providing more surface area and evengiving the surface the wicking effect of a membrane [27–29]. This in itself mayhave a significant effect on the variability in spot size and drop volume, butis especially critical for contact deposition, since the impact of the pin maydamage or alter the surface and its wicking characteristics.
The detailed physico–chemical properties of the substrate surface and howthat impacts the amount and the mechanism by which the biological materialis bound in the arraying process has been the subject of two of the precedingchapters and will not be further discussed here. Also note that the opticalcharacteristics of the glass and its coating are equally important for the de-tection process, since most current assay formats rely on optical read-out (seeChaps. 8 and 11).
5.5.3 Software and Data–Tracking
Software control is a critical component of contact printing systems. Theyprovide the user with an interface to manage the operation and to fine–tunecritical variables and system parameters such as array spacing, number ofpre-print spots, Z–motion control, dwell time, wash and dry sequences. Moreexpanded configurations also include sample tracking software that allows thesource well coordinates to be related to its spot location within the printedarray on the destination substrate. Integration of sample tracking softwarewith a data management system enables a scientist to rapidly design arrayexperiments as well as de-convolute and link experimental results back tothe printing process for optimization. A large number of software packages,either system specific or generic, are available from different vendors, and haveintegrated quality control features that can monitor the printing process andalert the user to deviations from operational specifications.
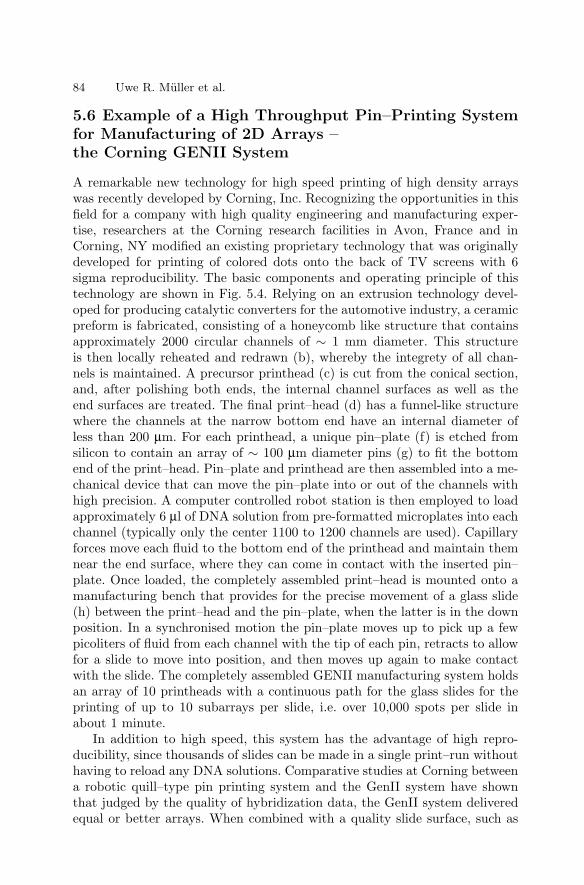
84 Uwe R. Muller et al.
5.6 Example of a High Throughput Pin–Printing Systemfor Manufacturing of 2D Arrays –the Corning GENII System
A remarkable new technology for high speed printing of high density arrayswas recently developed by Corning, Inc. Recognizing the opportunities in thisfield for a company with high quality engineering and manufacturing exper-tise, researchers at the Corning research facilities in Avon, France and inCorning, NY modified an existing proprietary technology that was originallydeveloped for printing of colored dots onto the back of TV screens with 6sigma reproducibility. The basic components and operating principle of thistechnology are shown in Fig. 5.4. Relying on an extrusion technology devel-oped for producing catalytic converters for the automotive industry, a ceramicpreform is fabricated, consisting of a honeycomb like structure that containsapproximately 2000 circular channels of ∼ 1 mm diameter. This structureis then locally reheated and redrawn (b), whereby the integrety of all chan-nels is maintained. A precursor printhead (c) is cut from the conical section,and, after polishing both ends, the internal channel surfaces as well as theend surfaces are treated. The final print–head (d) has a funnel-like structurewhere the channels at the narrow bottom end have an internal diameter ofless than 200 µm. For each printhead, a unique pin–plate (f) is etched fromsilicon to contain an array of ∼ 100 µm diameter pins (g) to fit the bottomend of the print–head. Pin–plate and printhead are then assembled into a me-chanical device that can move the pin–plate into or out of the channels withhigh precision. A computer controlled robot station is then employed to loadapproximately 6 µl of DNA solution from pre-formatted microplates into eachchannel (typically only the center 1100 to 1200 channels are used). Capillaryforces move each fluid to the bottom end of the printhead and maintain themnear the end surface, where they can come in contact with the inserted pin–plate. Once loaded, the completely assembled print–head is mounted onto amanufacturing bench that provides for the precise movement of a glass slide(h) between the print–head and the pin–plate, when the latter is in the downposition. In a synchronised motion the pin–plate moves up to pick up a fewpicoliters of fluid from each channel with the tip of each pin, retracts to allowfor a slide to move into position, and then moves up again to make contactwith the slide. The completely assembled GENII manufacturing system holdsan array of 10 printheads with a continuous path for the glass slides for theprinting of up to 10 subarrays per slide, i.e. over 10,000 spots per slide inabout 1 minute.
In addition to high speed, this system has the advantage of high repro-ducibility, since thousands of slides can be made in a single print–run withouthaving to reload any DNA solutions. Comparative studies at Corning betweena robotic quill–type pin printing system and the GenII system have shownthat judged by the quality of hybridization data, the GenII system deliveredequal or better arrays. When combined with a quality slide surface, such as
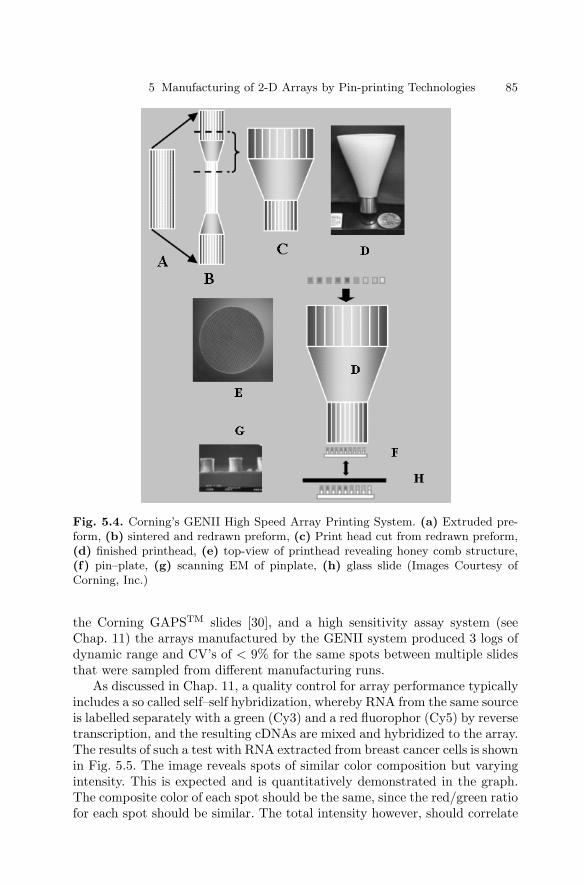
5 Manufacturing of 2-D Arrays by Pin-printing Technologies 85
Fig. 5.4. Corning’s GENII High Speed Array Printing System. (a) Extruded pre-form, (b) sintered and redrawn preform, (c) Print head cut from redrawn preform,(d) finished printhead, (e) top-view of printhead revealing honey comb structure,(f) pin–plate, (g) scanning EM of pinplate, (h) glass slide (Images Courtesy ofCorning, Inc.)
the Corning GAPSTM slides [30], and a high sensitivity assay system (seeChap. 11) the arrays manufactured by the GENII system produced 3 logs ofdynamic range and CV’s of < 9% for the same spots between multiple slidesthat were sampled from different manufacturing runs.
As discussed in Chap. 11, a quality control for array performance typicallyincludes a so called self–self hybridization, whereby RNA from the same sourceis labelled separately with a green (Cy3) and a red fluorophor (Cy5) by reversetranscription, and the resulting cDNAs are mixed and hybridized to the array.The results of such a test with RNA extracted from breast cancer cells is shownin Fig. 5.5. The image reveals spots of similar color composition but varyingintensity. This is expected and is quantitatively demonstrated in the graph.The composite color of each spot should be the same, since the red/green ratiofor each spot should be similar. The total intensity however, should correlate
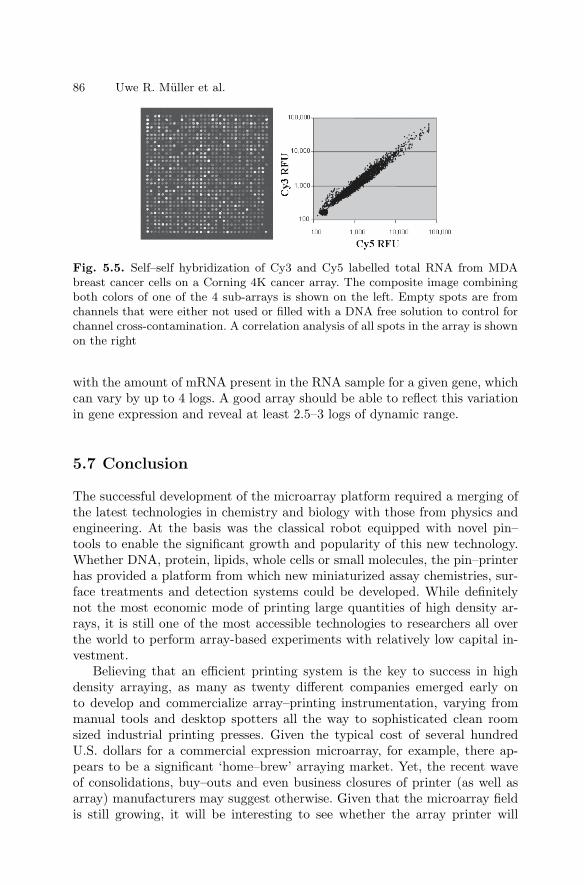
86 Uwe R. Muller et al.
Fig. 5.5. Self–self hybridization of Cy3 and Cy5 labelled total RNA from MDAbreast cancer cells on a Corning 4K cancer array. The composite image combiningboth colors of one of the 4 sub-arrays is shown on the left. Empty spots are fromchannels that were either not used or filled with a DNA free solution to control forchannel cross-contamination. A correlation analysis of all spots in the array is shownon the right
with the amount of mRNA present in the RNA sample for a given gene, whichcan vary by up to 4 logs. A good array should be able to reflect this variationin gene expression and reveal at least 2.5–3 logs of dynamic range.
5.7 Conclusion
The successful development of the microarray platform required a merging ofthe latest technologies in chemistry and biology with those from physics andengineering. At the basis was the classical robot equipped with novel pin–tools to enable the significant growth and popularity of this new technology.Whether DNA, protein, lipids, whole cells or small molecules, the pin–printerhas provided a platform from which new miniaturized assay chemistries, sur-face treatments and detection systems could be developed. While definitelynot the most economic mode of printing large quantities of high density ar-rays, it is still one of the most accessible technologies to researchers all overthe world to perform array-based experiments with relatively low capital in-vestment.
Believing that an efficient printing system is the key to success in highdensity arraying, as many as twenty different companies emerged early onto develop and commercialize array–printing instrumentation, varying frommanual tools and desktop spotters all the way to sophisticated clean roomsized industrial printing presses. Given the typical cost of several hundredU.S. dollars for a commercial expression microarray, for example, there ap-pears to be a significant ‘home–brew’ arraying market. Yet, the recent waveof consolidations, buy–outs and even business closures of printer (as well asarray) manufacturers may suggest otherwise. Given that the microarray fieldis still growing, it will be interesting to see whether the array printer will
5 Manufacturing of 2-D Arrays by Pin-printing Technologies 87
follow the path of the thermocycler with a place in every molecular biologylab, or that of the DNA synthesizer, a tool that has largely disappeared fromthe average biochemistry lab, since home–brew oligo synthesis is no longercost-effective.
References
1. Schena M, Shalon D, Davis RW, Brown PO. Quantitative monitoring of geneexpression patterns with a complementary DNA microarray. Science 1995;270:467–70
2. Bowtell DD, Sambrook JFE. DNA Microarrays:A Molecular Cloning Manual,New York: Cold Spring Harbor Laboratory Press, 2002; http://www.nature.-com/ng/journal/v32/n4s/extref/ng1030–S4.pdf
3. Leung YF, Pang CP, Browne K. Guide to microarray hardware – a researcherperspective. 2001; http://www.images.technologynetworks.net/resources/-comptab.asp
4. Rose D, Lemmo T. Challenges in implementing high–density formats for highthroughput screening. Laboratory Automation News. 1997; 2:12–19
5. Ellson R. Transfer of Low Nanoliter Volumes between Microwell Plates UsingFocused Acoustics–Automation Considerations. JALA 2003; 8:34–39
6. Genetix. http://www.genetix.com/productpages/consumables/slides/aQuPins.-htm
7. V&P Scientific I. 2003; http://www.vp–scientific.com/index.htm8. Genetic MicroSystems. GMS 417 Arrayer User Guide. 1999;A–19. Demers LM, Ginger DS, Park SJ, Li Z, Chung SW, Mirkin CA. Direct patterning
of modified oligonucleotides on metals and insulators by dip–pen nanolithogra-phy. Science 2002; 296:1836–8
10. Hong S, Mirkin CA. A nanoplotter with both parallel and serial writing capabil-itites. Science 2000; 288:1808–11
11. Lee KB, Park SJ, Mirkin CA, Smith JC, Mrksich M. Protein nanoarrays gen-erated by dip–pen nanolithography. Science 2002; 295:1702–5
12. Majer Precision Engineering. DNA Array Pins. http://www.majerprecision.-com/pins.htm
13. Matrix. http://www.matrixtechcorp.com/tech/AT–pdf/MicroSpot Tech.html14. Zeng J, Deshpande M, Kan H–C, Gilbert JR. A dynamic spotting method for
split–pin based microarrays. Technical Proceedings of Micro Total Analysis Sys-tems, Micro–TAS 2001, Monterey, CA 2001
15. Rose D. Microfluidic Technologies and Instrumentation for Printing DNA Mi-croarrays. Microarray Biochip Technology. Eaton Publishing, 2000:35
16. TeleChem International I. Stealth Micro Spotting Pins and Printheads. 2003;http://arrayit.com/Products/Printing/Stealth/stealth.html
17. MiraiBio. Spotting Pin Evaporation 1, Application Sheet 3. 2003;http://www.miraibio.com/pdf/tech/appnotes/AppSht3 Evaporation1 pub.pdf
18. Muller UR, Daywalt M, Che D, VanBriesen A. Dispensing system for DNAmicroarrays. The American Journal of Human Genetics 63, A237: 88
19. Tsai J, Kim CJ. A silicon micromachined pin for contact droplet printing. Pro-ceedings of the Second Joint EMBS/BMES Conference, Houston, TX, USA.2002
88 Uwe R. Muller et al.
20. Oxford Lasers. High Precision CVL Micro–Cutting. http://www.oxfordlasers.-com/Industrial/uchi/CSE4BiomedicalPin.htm
21. George RA, Woolley JP, Spellman PT. Ceramic capillaries for use in microarrayfabrication. Genome Res 2001; 11:1780–3
22. Holloway AJ, van Laar RK, Tothill RW, Bowtell DD. Options available – fromstart to finish – for obtaining data from DNA microarrays II. Nat Genet 2002;32 Suppl:481–9
23. Chen AU, Notz PK, Basaran OA. Computational and experimental analysis ofpinch–off and scaling. Phys Rev Lett 2002; 88:174501
24. Deegan RD. Pattern formation in drying drops. Phys Rev E Stat Phys PlasmasFluids Relat Interdiscip Topics 2000; 61:475–85
25. Deegan RD, Bakajin O, Dupont TF, Huber G, Nagel SR, Witten TA. Contactline deposits in an evaporating drop. Phys Rev E Stat Phys Plasmas Fluids RelatInterdiscip Topics 2000; 62:756–65
26. Zhang X, Padgett R, Basaran OA. Nonlinear deformation and breakup ofstretching liquid bridges. J. Fluid Mech. 1996; 329:207–245
27. Beattie KL, Beattie WG, Meng L, Turner SL, Coral-Vazquez R, Smith DD etal. Advances in genosensor research. Clin Chem 1995; 41:700–6
28. Lee PH, Sawan SP, Modrusan Z, Arnold LJ Jr, Reynolds MA. An efficientbinding chemistry for glass polynucleotide microarrays. Bioconjug Chem 2002;13:97–103
29. Mirzabekov A, Kolchinsky A. Emerging array–based technologies in proteomics.Curr Opin Chem Biol 2002; 6:70–5
30. Corning I. GAPS Coated Slides. 2003; http://catalog.corning.com/Lifesciences
6
Nanoarrays
Dan V. Nicolau, Linnette Demers, and David S. Ginger
6.1 Introduction
The field of microarray technology progressed, in the most general terms, alongthree directions: increase of the number of tests (biomolecules or cells) on thesame chip; increase of the number of tested biomolecules on the same unit area(i.e. density); and increase in the sophistication of the biochips, with manyalternative designs being proposed. The first two trends walk in the steps of theevolution of microchips proper, i.e. larger chips and higher density on the chip,but the last similarity (i.e. ‘smarter’ design) should be analyzed in more detail.While semiconductor technology imposed very early in its history a ‘champion’device, i.e. bipolar and later CMOS transistor, microarray technology does nothave yet a ‘champion’. It follows that microarray technology is still to reachits maturity, with all the benefits (e.g. effervescent innovation) and drawbacks(e.g. difficult standardization) that arise from this still-emergent stage.
However, seen from another angle, microarray technology is much closer toa ‘technology crisis’. It has been argued for decades, and proven wrong everytime, that semiconductor technology will come to a halt due to the inabilityof lithography to print smaller features at the pace asked by the unforgivingMoore’s Law [1], i.e. halving of the printed critical size on the chip every 18months. Apart from the apparently endless capacity of microlithography topush the resolution limits, fundamentally the crisis has been always far away.Microelectronics and – nowadays – nanoelectronics ‘operate’ with electrons(which are much smaller than 1 nm), while the most advanced lithography isasked to print features of many tens of nanometers. Even if we consider thequantum effects, the present lithography can print features that are at leastten times larger than the critical technological barrier. On the other hand,individual DNAs and proteins, the smallest ‘building elements’ of microar-rays, are several to several tens of nanometers in size. Consequently advancedlithography is already capable of printing features that are on the same orderof magnitude, if not smaller than, the ‘modules’ to be printed! Furthermore,for cell and tissue arrays, patterning resolution is a non-issue.
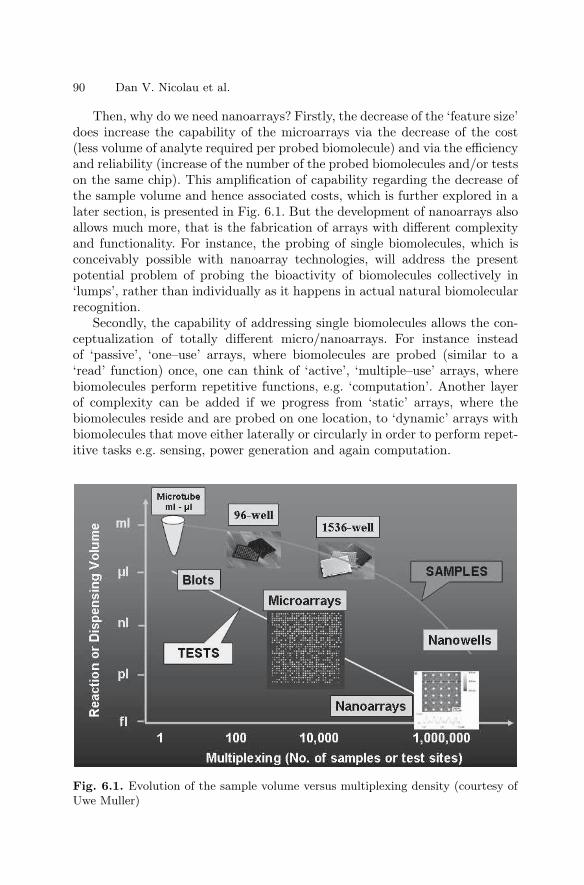
90 Dan V. Nicolau et al.
Then, why do we need nanoarrays? Firstly, the decrease of the ‘feature size’does increase the capability of the microarrays via the decrease of the cost(less volume of analyte required per probed biomolecule) and via the efficiencyand reliability (increase of the number of the probed biomolecules and/or testson the same chip). This amplification of capability regarding the decrease ofthe sample volume and hence associated costs, which is further explored in alater section, is presented in Fig. 6.1. But the development of nanoarrays alsoallows much more, that is the fabrication of arrays with different complexityand functionality. For instance, the probing of single biomolecules, which isconceivably possible with nanoarray technologies, will address the presentpotential problem of probing the bioactivity of biomolecules collectively in‘lumps’, rather than individually as it happens in actual natural biomolecularrecognition.
Secondly, the capability of addressing single biomolecules allows the con-ceptualization of totally different micro/nanoarrays. For instance insteadof ‘passive’, ‘one–use’ arrays, where biomolecules are probed (similar to a‘read’ function) once, one can think of ‘active’, ‘multiple–use’ arrays, wherebiomolecules perform repetitive functions, e.g. ‘computation’. Another layerof complexity can be added if we progress from ‘static’ arrays, where thebiomolecules reside and are probed on one location, to ‘dynamic’ arrays withbiomolecules that move either laterally or circularly in order to perform repet-itive tasks e.g. sensing, power generation and again computation.
Fig. 6.1. Evolution of the sample volume versus multiplexing density (courtesy ofUwe Muller)
6 Nanoarrays 91
6.2 Passive Nano–scale Arrays
Typically, robotically-spotted microarrays contain spots of 100 microns, withup to 10,000 different cDNA sites on a chip. In situ synthesis, using 20 µm2
spots is currently capable of producing up to 400,000 distinct oligonucleotideson a chip [2]. A reduction in feature size from 20–200 µm to microns or sub–microns would vastly increase the amount of genetic information that couldbe screened simultaneously under certain conditions on one chip. This typeof scaling, with appropriate readout system, could enable SNP analysis viatiling arrays of the entire human genome on a single 2 × 2 cm array [3]. Ingeneral, achieving such high resolution with directly patterned oligonucleotideprobes would enable the study of binding and detection in arrays that are upto 10,000 times more complex, in the same area, than is presently possible.A decrease in feature size will also lead to assays wherein a fixed numberof targets are screened with correspondingly smaller requirements of samplevolume. Importantly, patterning at this scale will not only require, but greatlyfacilitate the development of high throughput, high resolution screening tools.
In principle, there are two major strategies for the fabrication of nanoar-rays, which are common to the micro/nanolithography for both microchipsand microarrays. First, one can alter the properties of an area e.g. with light,creating different chemical functionalities or hydrophobicities locally. Subse-quently, this ‘island’ is used for further fabrication, e.g. immobilization of thetarget biomolecule. It has been shown (discussion in Chap. 3) that this fabri-cation strategy has certain fundamental limitations in terms of the achievableresolution. Second, one can deposit locally the chemical species (e.g. targetbiomolecules in solution) by mechanical means directly on the surface with e.g.a nano–sized ‘pencil’ – a strategy similar to several ‘new generation lithogra-phies’ [4]. The deposition by mechanical means can also be performed in anon-contact manner using technologies developed on the back of ink jet printertechnology.
Current methods for preparing microarrays vary with the specific appli-cation, and include contact and non-contact methods of spotting oligonu-cleotides or cDNA, or a combination of photolithography and in situ syn-thesis for oligonucleotides. However, without major investment in high endprojections systems, conventional lithography techniques cannot fabricate fea-tures in the 150–200 nm range, due to the diffraction of light. Extreme UVlithography and other next–generation photolithography strategies may offerthe required resolution, but at ever increasing mask and fabrication facilitycosts, and operating under increasingly harsh conditions that may not becompatible with biological materials. Specifically, it will eventually becomeeconomically prohibitive to scale down microarray spots with conventionalphotolithography. As a comparison, the estimated cost of conventional mi-croelectronics fabrication facilities will reach 200 billion dollars by 2015 [5].Thus, there has been a significant effort on the behalf of the research andindustrial communities to develop strategies to replace conventional robotic
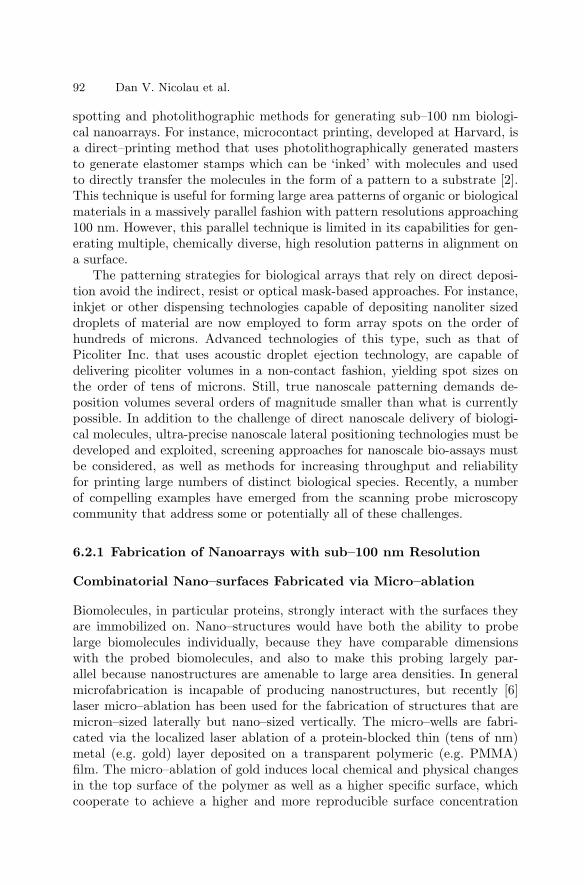
92 Dan V. Nicolau et al.
spotting and photolithographic methods for generating sub–100 nm biologi-cal nanoarrays. For instance, microcontact printing, developed at Harvard, isa direct–printing method that uses photolithographically generated mastersto generate elastomer stamps which can be ‘inked’ with molecules and usedto directly transfer the molecules in the form of a pattern to a substrate [2].This technique is useful for forming large area patterns of organic or biologicalmaterials in a massively parallel fashion with pattern resolutions approaching100 nm. However, this parallel technique is limited in its capabilities for gen-erating multiple, chemically diverse, high resolution patterns in alignment ona surface.
The patterning strategies for biological arrays that rely on direct deposi-tion avoid the indirect, resist or optical mask-based approaches. For instance,inkjet or other dispensing technologies capable of depositing nanoliter sizeddroplets of material are now employed to form array spots on the order ofhundreds of microns. Advanced technologies of this type, such as that ofPicoliter Inc. that uses acoustic droplet ejection technology, are capable ofdelivering picoliter volumes in a non-contact fashion, yielding spot sizes onthe order of tens of microns. Still, true nanoscale patterning demands de-position volumes several orders of magnitude smaller than what is currentlypossible. In addition to the challenge of direct nanoscale delivery of biologi-cal molecules, ultra-precise nanoscale lateral positioning technologies must bedeveloped and exploited, screening approaches for nanoscale bio-assays mustbe considered, as well as methods for increasing throughput and reliabilityfor printing large numbers of distinct biological species. Recently, a numberof compelling examples have emerged from the scanning probe microscopycommunity that address some or potentially all of these challenges.
6.2.1 Fabrication of Nanoarrays with sub–100 nm Resolution
Combinatorial Nano–surfaces Fabricated via Micro–ablation
Biomolecules, in particular proteins, strongly interact with the surfaces theyare immobilized on. Nano–structures would have both the ability to probelarge biomolecules individually, because they have comparable dimensionswith the probed biomolecules, and also to make this probing largely par-allel because nanostructures are amenable to large area densities. In generalmicrofabrication is incapable of producing nanostructures, but recently [6]laser micro–ablation has been used for the fabrication of structures that aremicron–sized laterally but nano–sized vertically. The micro–wells are fabri-cated via the localized laser ablation of a protein-blocked thin (tens of nm)metal (e.g. gold) layer deposited on a transparent polymeric (e.g. PMMA)film. The micro–ablation of gold induces local chemical and physical changesin the top surface of the polymer as well as a higher specific surface, whichcooperate to achieve a higher and more reproducible surface concentration
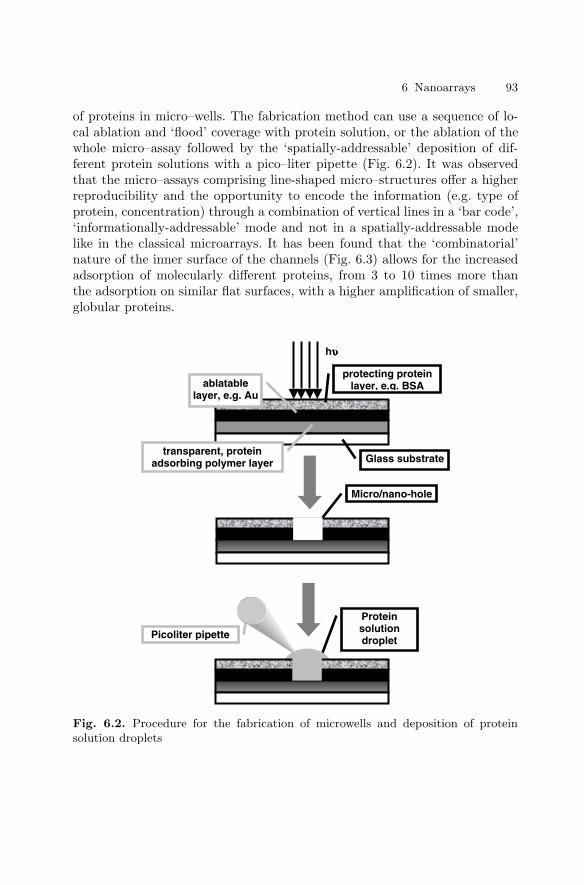
6 Nanoarrays 93
of proteins in micro–wells. The fabrication method can use a sequence of lo-cal ablation and ‘flood’ coverage with protein solution, or the ablation of thewhole micro–assay followed by the ‘spatially-addressable’ deposition of dif-ferent protein solutions with a pico–liter pipette (Fig. 6.2). It was observedthat the micro–assays comprising line-shaped micro–structures offer a higherreproducibility and the opportunity to encode the information (e.g. type ofprotein, concentration) through a combination of vertical lines in a ‘bar code’,‘informationally-addressable’ mode and not in a spatially-addressable modelike in the classical microarrays. It has been found that the ‘combinatorial’nature of the inner surface of the channels (Fig. 6.3) allows for the increasedadsorption of molecularly different proteins, from 3 to 10 times more thanthe adsorption on similar flat surfaces, with a higher amplification of smaller,globular proteins.
hυυυυ
Glass substrate
ablatablelayer, e.g. Au
transparent, protein adsorbing polymer layer
protecting protein layer, e.g. BSA
ProteinsolutiondropletPicoliter pipette
Micro/nano-hole
Fig. 6.2. Procedure for the fabrication of microwells and deposition of proteinsolution droplets
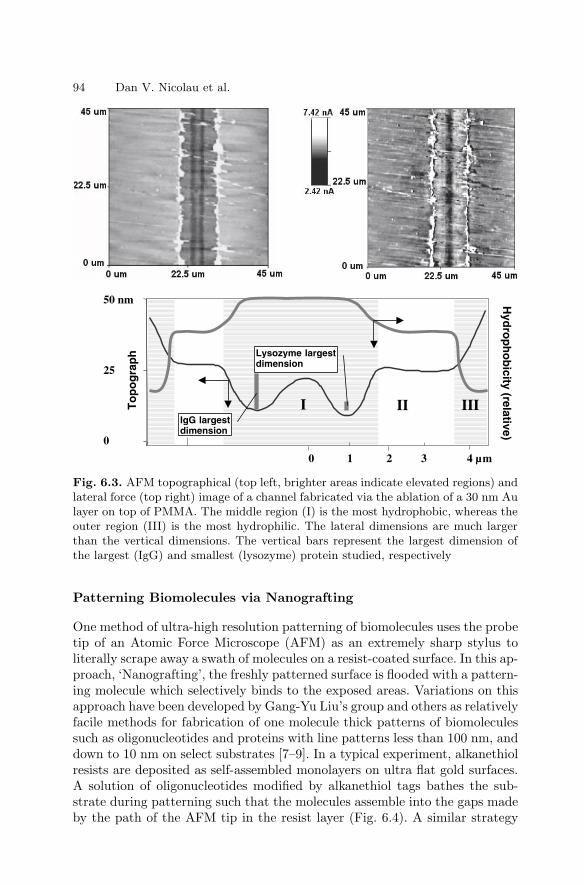
94 Dan V. Nicolau et al.
0
25
50 nm
I II
0 1 2 3 4 µm
Hyd
rop
ho
bicity (relative)
To
po
gra
ph
IgG largestdimension
Lysozyme largestdimension
III
Fig. 6.3. AFM topographical (top left, brighter areas indicate elevated regions) andlateral force (top right) image of a channel fabricated via the ablation of a 30 nm Aulayer on top of PMMA. The middle region (I) is the most hydrophobic, whereas theouter region (III) is the most hydrophilic. The lateral dimensions are much largerthan the vertical dimensions. The vertical bars represent the largest dimension ofthe largest (IgG) and smallest (lysozyme) protein studied, respectively
Patterning Biomolecules via Nanografting
One method of ultra-high resolution patterning of biomolecules uses the probetip of an Atomic Force Microscope (AFM) as an extremely sharp stylus toliterally scrape away a swath of molecules on a resist-coated surface. In this ap-proach, ‘Nanografting’, the freshly patterned surface is flooded with a pattern-ing molecule which selectively binds to the exposed areas. Variations on thisapproach have been developed by Gang-Yu Liu’s group and others as relativelyfacile methods for fabrication of one molecule thick patterns of biomoleculessuch as oligonucleotides and proteins with line patterns less than 100 nm, anddown to 10 nm on select substrates [7–9]. In a typical experiment, alkanethiolresists are deposited as self-assembled monolayers on ultra flat gold surfaces.A solution of oligonucleotides modified by alkanethiol tags bathes the sub-strate during patterning such that the molecules assemble into the gaps madeby the path of the AFM tip in the resist layer (Fig. 6.4). A similar strategy
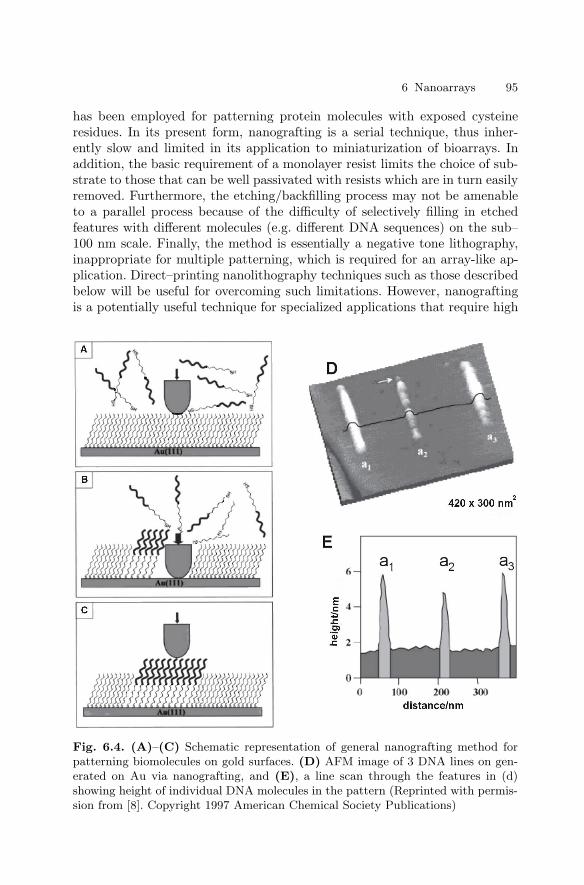
6 Nanoarrays 95
has been employed for patterning protein molecules with exposed cysteineresidues. In its present form, nanografting is a serial technique, thus inher-ently slow and limited in its application to miniaturization of bioarrays. Inaddition, the basic requirement of a monolayer resist limits the choice of sub-strate to those that can be well passivated with resists which are in turn easilyremoved. Furthermore, the etching/backfilling process may not be amenableto a parallel process because of the difficulty of selectively filling in etchedfeatures with different molecules (e.g. different DNA sequences) on the sub–100 nm scale. Finally, the method is essentially a negative tone lithography,inappropriate for multiple patterning, which is required for an array-like ap-plication. Direct–printing nanolithography techniques such as those describedbelow will be useful for overcoming such limitations. However, nanograftingis a potentially useful technique for specialized applications that require high
Fig. 6.4. (A)–(C) Schematic representation of general nanografting method forpatterning biomolecules on gold surfaces. (D) AFM image of 3 DNA lines on gen-erated on Au via nanografting, and (E), a line scan through the features in (d)showing height of individual DNA molecules in the pattern (Reprinted with permis-sion from [8]. Copyright 1997 American Chemical Society Publications)
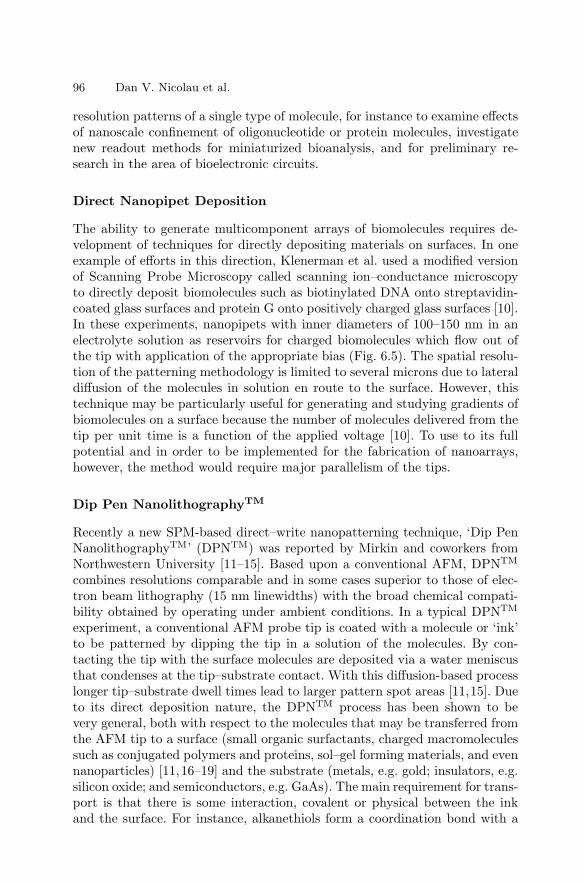
96 Dan V. Nicolau et al.
resolution patterns of a single type of molecule, for instance to examine effectsof nanoscale confinement of oligonucleotide or protein molecules, investigatenew readout methods for miniaturized bioanalysis, and for preliminary re-search in the area of bioelectronic circuits.
Direct Nanopipet Deposition
The ability to generate multicomponent arrays of biomolecules requires de-velopment of techniques for directly depositing materials on surfaces. In oneexample of efforts in this direction, Klenerman et al. used a modified versionof Scanning Probe Microscopy called scanning ion–conductance microscopyto directly deposit biomolecules such as biotinylated DNA onto streptavidin-coated glass surfaces and protein G onto positively charged glass surfaces [10].In these experiments, nanopipets with inner diameters of 100–150 nm in anelectrolyte solution as reservoirs for charged biomolecules which flow out ofthe tip with application of the appropriate bias (Fig. 6.5). The spatial resolu-tion of the patterning methodology is limited to several microns due to lateraldiffusion of the molecules in solution en route to the surface. However, thistechnique may be particularly useful for generating and studying gradients ofbiomolecules on a surface because the number of molecules delivered from thetip per unit time is a function of the applied voltage [10]. To use to its fullpotential and in order to be implemented for the fabrication of nanoarrays,however, the method would require major parallelism of the tips.
Dip Pen NanolithographyTM
Recently a new SPM-based direct–write nanopatterning technique, ‘Dip PenNanolithographyTM’ (DPNTM) was reported by Mirkin and coworkers fromNorthwestern University [11–15]. Based upon a conventional AFM, DPNTM
combines resolutions comparable and in some cases superior to those of elec-tron beam lithography (15 nm linewidths) with the broad chemical compati-bility obtained by operating under ambient conditions. In a typical DPNTM
experiment, a conventional AFM probe tip is coated with a molecule or ‘ink’to be patterned by dipping the tip in a solution of the molecules. By con-tacting the tip with the surface molecules are deposited via a water meniscusthat condenses at the tip–substrate contact. With this diffusion-based processlonger tip–substrate dwell times lead to larger pattern spot areas [11,15]. Dueto its direct deposition nature, the DPNTM process has been shown to bevery general, both with respect to the molecules that may be transferred fromthe AFM tip to a surface (small organic surfactants, charged macromoleculessuch as conjugated polymers and proteins, sol–gel forming materials, and evennanoparticles) [11,16–19] and the substrate (metals, e.g. gold; insulators, e.g.silicon oxide; and semiconductors, e.g. GaAs). The main requirement for trans-port is that there is some interaction, covalent or physical between the inkand the surface. For instance, alkanethiols form a coordination bond with a
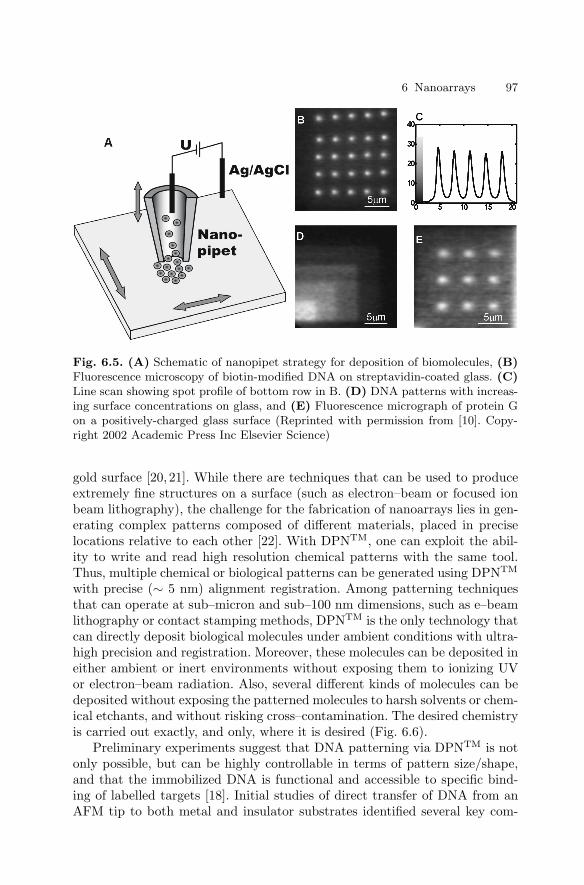
6 Nanoarrays 97
Fig. 6.5. (A) Schematic of nanopipet strategy for deposition of biomolecules, (B)Fluorescence microscopy of biotin-modified DNA on streptavidin-coated glass. (C)Line scan showing spot profile of bottom row in B. (D) DNA patterns with increas-ing surface concentrations on glass, and (E) Fluorescence micrograph of protein Gon a positively-charged glass surface (Reprinted with permission from [10]. Copy-right 2002 Academic Press Inc Elsevier Science)
gold surface [20, 21]. While there are techniques that can be used to produceextremely fine structures on a surface (such as electron–beam or focused ionbeam lithography), the challenge for the fabrication of nanoarrays lies in gen-erating complex patterns composed of different materials, placed in preciselocations relative to each other [22]. With DPNTM, one can exploit the abil-ity to write and read high resolution chemical patterns with the same tool.Thus, multiple chemical or biological patterns can be generated using DPNTM
with precise (∼ 5 nm) alignment registration. Among patterning techniquesthat can operate at sub–micron and sub–100 nm dimensions, such as e–beamlithography or contact stamping methods, DPNTM is the only technology thatcan directly deposit biological molecules under ambient conditions with ultra-high precision and registration. Moreover, these molecules can be deposited ineither ambient or inert environments without exposing them to ionizing UVor electron–beam radiation. Also, several different kinds of molecules can bedeposited without exposing the patterned molecules to harsh solvents or chem-ical etchants, and without risking cross–contamination. The desired chemistryis carried out exactly, and only, where it is desired (Fig. 6.6).
Preliminary experiments suggest that DNA patterning via DPNTM is notonly possible, but can be highly controllable in terms of pattern size/shape,and that the immobilized DNA is functional and accessible to specific bind-ing of labelled targets [18]. Initial studies of direct transfer of DNA from anAFM tip to both metal and insulator substrates identified several key com-
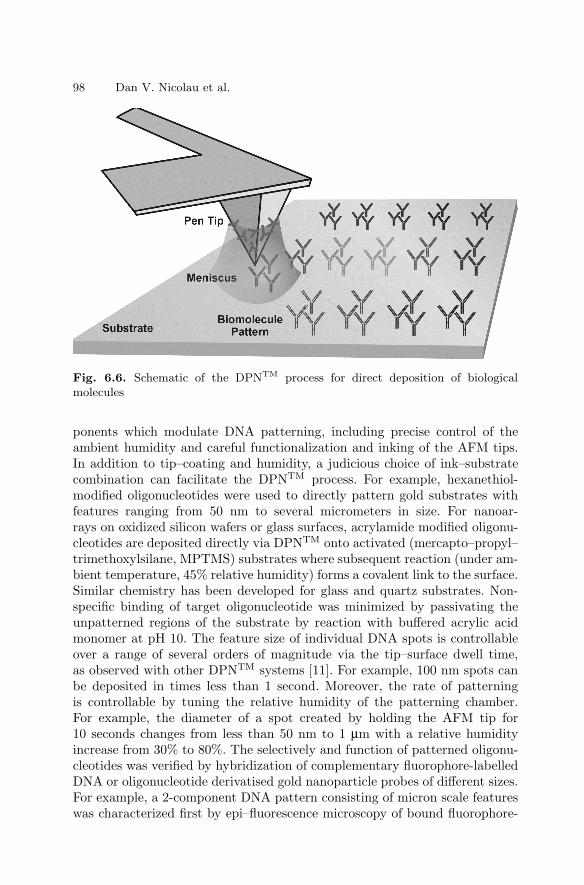
98 Dan V. Nicolau et al.
Fig. 6.6. Schematic of the DPNTM process for direct deposition of biologicalmolecules
ponents which modulate DNA patterning, including precise control of theambient humidity and careful functionalization and inking of the AFM tips.In addition to tip–coating and humidity, a judicious choice of ink–substratecombination can facilitate the DPNTM process. For example, hexanethiol-modified oligonucleotides were used to directly pattern gold substrates withfeatures ranging from 50 nm to several micrometers in size. For nanoar-rays on oxidized silicon wafers or glass surfaces, acrylamide modified oligonu-cleotides are deposited directly via DPNTM onto activated (mercapto–propyl–trimethoxylsilane, MPTMS) substrates where subsequent reaction (under am-bient temperature, 45% relative humidity) forms a covalent link to the surface.Similar chemistry has been developed for glass and quartz substrates. Non-specific binding of target oligonucleotide was minimized by passivating theunpatterned regions of the substrate by reaction with buffered acrylic acidmonomer at pH 10. The feature size of individual DNA spots is controllableover a range of several orders of magnitude via the tip–surface dwell time,as observed with other DPNTM systems [11]. For example, 100 nm spots canbe deposited in times less than 1 second. Moreover, the rate of patterningis controllable by tuning the relative humidity of the patterning chamber.For example, the diameter of a spot created by holding the AFM tip for10 seconds changes from less than 50 nm to 1 µm with a relative humidityincrease from 30% to 80%. The selectively and function of patterned oligonu-cleotides was verified by hybridization of complementary fluorophore-labelledDNA or oligonucleotide derivatised gold nanoparticle probes of different sizes.For example, a 2-component DNA pattern consisting of micron scale featureswas characterized first by epi–fluorescence microscopy of bound fluorophore-
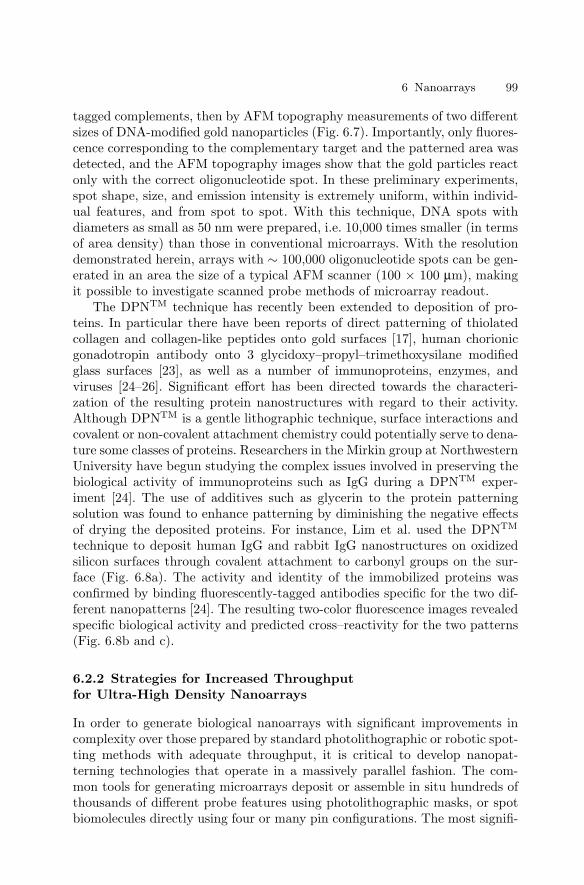
6 Nanoarrays 99
tagged complements, then by AFM topography measurements of two differentsizes of DNA-modified gold nanoparticles (Fig. 6.7). Importantly, only fluores-cence corresponding to the complementary target and the patterned area wasdetected, and the AFM topography images show that the gold particles reactonly with the correct oligonucleotide spot. In these preliminary experiments,spot shape, size, and emission intensity is extremely uniform, within individ-ual features, and from spot to spot. With this technique, DNA spots withdiameters as small as 50 nm were prepared, i.e. 10,000 times smaller (in termsof area density) than those in conventional microarrays. With the resolutiondemonstrated herein, arrays with ∼ 100,000 oligonucleotide spots can be gen-erated in an area the size of a typical AFM scanner (100 × 100 µm), makingit possible to investigate scanned probe methods of microarray readout.
The DPNTM technique has recently been extended to deposition of pro-teins. In particular there have been reports of direct patterning of thiolatedcollagen and collagen-like peptides onto gold surfaces [17], human chorionicgonadotropin antibody onto 3 glycidoxy–propyl–trimethoxysilane modifiedglass surfaces [23], as well as a number of immunoproteins, enzymes, andviruses [24–26]. Significant effort has been directed towards the characteri-zation of the resulting protein nanostructures with regard to their activity.Although DPNTM is a gentle lithographic technique, surface interactions andcovalent or non-covalent attachment chemistry could potentially serve to dena-ture some classes of proteins. Researchers in the Mirkin group at NorthwesternUniversity have begun studying the complex issues involved in preserving thebiological activity of immunoproteins such as IgG during a DPNTM exper-iment [24]. The use of additives such as glycerin to the protein patterningsolution was found to enhance patterning by diminishing the negative effectsof drying the deposited proteins. For instance, Lim et al. used the DPNTM
technique to deposit human IgG and rabbit IgG nanostructures on oxidizedsilicon surfaces through covalent attachment to carbonyl groups on the sur-face (Fig. 6.8a). The activity and identity of the immobilized proteins wasconfirmed by binding fluorescently-tagged antibodies specific for the two dif-ferent nanopatterns [24]. The resulting two-color fluorescence images revealedspecific biological activity and predicted cross–reactivity for the two patterns(Fig. 6.8b and c).
6.2.2 Strategies for Increased Throughputfor Ultra-High Density Nanoarrays
In order to generate biological nanoarrays with significant improvements incomplexity over those prepared by standard photolithographic or robotic spot-ting methods with adequate throughput, it is critical to develop nanopat-terning technologies that operate in a massively parallel fashion. The com-mon tools for generating microarrays deposit or assemble in situ hundreds ofthousands of different probe features using photolithographic masks, or spotbiomolecules directly using four or many pin configurations. The most signifi-
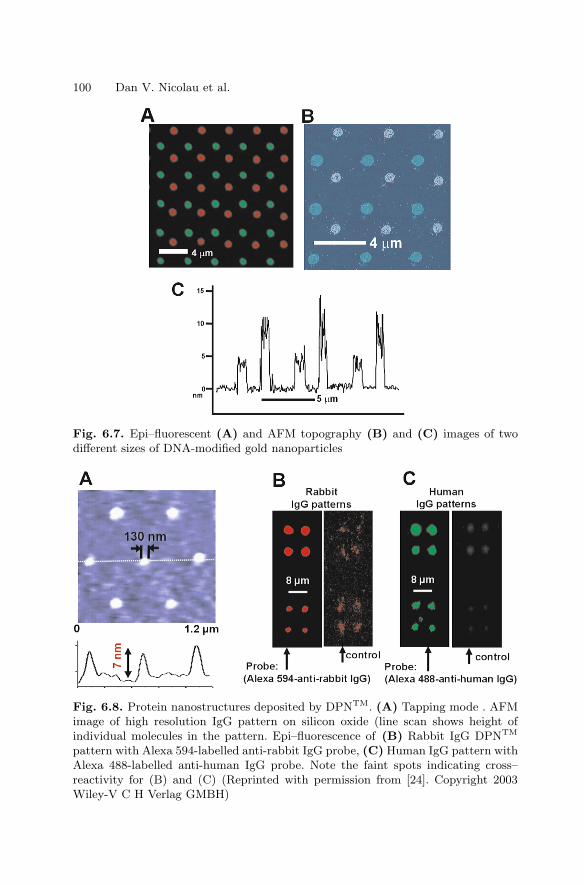
100 Dan V. Nicolau et al.
Fig. 6.7. Epi–fluorescent (A) and AFM topography (B) and (C) images of twodifferent sizes of DNA-modified gold nanoparticles
Fig. 6.8. Protein nanostructures deposited by DPNTM. (A) Tapping mode . AFMimage of high resolution IgG pattern on silicon oxide (line scan shows height ofindividual molecules in the pattern. Epi–fluorescence of (B) Rabbit IgG DPNTM
pattern with Alexa 594-labelled anti-rabbit IgG probe, (C) Human IgG pattern withAlexa 488-labelled anti-human IgG probe. Note the faint spots indicating cross–reactivity for (B) and (C) (Reprinted with permission from [24]. Copyright 2003Wiley-V C H Verlag GMBH)
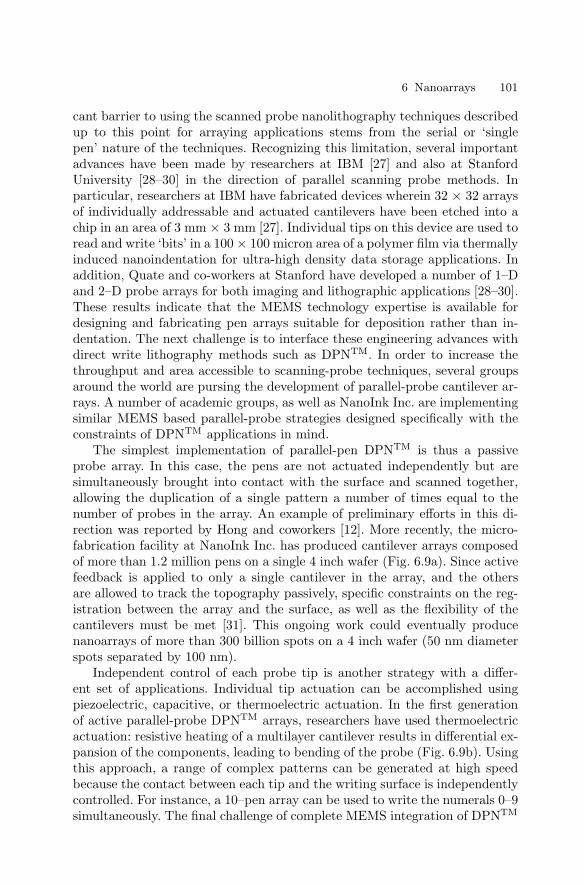
6 Nanoarrays 101
cant barrier to using the scanned probe nanolithography techniques describedup to this point for arraying applications stems from the serial or ‘singlepen’ nature of the techniques. Recognizing this limitation, several importantadvances have been made by researchers at IBM [27] and also at StanfordUniversity [28–30] in the direction of parallel scanning probe methods. Inparticular, researchers at IBM have fabricated devices wherein 32 × 32 arraysof individually addressable and actuated cantilevers have been etched into achip in an area of 3 mm × 3 mm [27]. Individual tips on this device are used toread and write ‘bits’ in a 100 × 100 micron area of a polymer film via thermallyinduced nanoindentation for ultra-high density data storage applications. Inaddition, Quate and co-workers at Stanford have developed a number of 1–Dand 2–D probe arrays for both imaging and lithographic applications [28–30].These results indicate that the MEMS technology expertise is available fordesigning and fabricating pen arrays suitable for deposition rather than in-dentation. The next challenge is to interface these engineering advances withdirect write lithography methods such as DPNTM. In order to increase thethroughput and area accessible to scanning-probe techniques, several groupsaround the world are pursing the development of parallel-probe cantilever ar-rays. A number of academic groups, as well as NanoInk Inc. are implementingsimilar MEMS based parallel-probe strategies designed specifically with theconstraints of DPNTM applications in mind.
The simplest implementation of parallel-pen DPNTM is thus a passiveprobe array. In this case, the pens are not actuated independently but aresimultaneously brought into contact with the surface and scanned together,allowing the duplication of a single pattern a number of times equal to thenumber of probes in the array. An example of preliminary efforts in this di-rection was reported by Hong and coworkers [12]. More recently, the micro-fabrication facility at NanoInk Inc. has produced cantilever arrays composedof more than 1.2 million pens on a single 4 inch wafer (Fig. 6.9a). Since activefeedback is applied to only a single cantilever in the array, and the othersare allowed to track the topography passively, specific constraints on the reg-istration between the array and the surface, as well as the flexibility of thecantilevers must be met [31]. This ongoing work could eventually producenanoarrays of more than 300 billion spots on a 4 inch wafer (50 nm diameterspots separated by 100 nm).
Independent control of each probe tip is another strategy with a differ-ent set of applications. Individual tip actuation can be accomplished usingpiezoelectric, capacitive, or thermoelectric actuation. In the first generationof active parallel-probe DPNTM arrays, researchers have used thermoelectricactuation: resistive heating of a multilayer cantilever results in differential ex-pansion of the components, leading to bending of the probe (Fig. 6.9b). Usingthis approach, a range of complex patterns can be generated at high speedbecause the contact between each tip and the writing surface is independentlycontrolled. For instance, a 10–pen array can be used to write the numerals 0–9simultaneously. The final challenge of complete MEMS integration of DPNTM
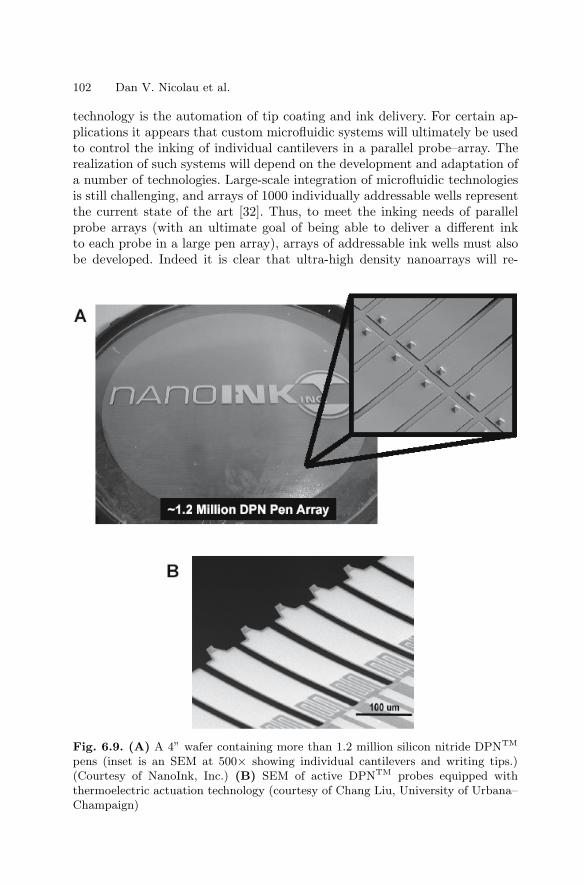
102 Dan V. Nicolau et al.
technology is the automation of tip coating and ink delivery. For certain ap-plications it appears that custom microfluidic systems will ultimately be usedto control the inking of individual cantilevers in a parallel probe–array. Therealization of such systems will depend on the development and adaptation ofa number of technologies. Large-scale integration of microfluidic technologiesis still challenging, and arrays of 1000 individually addressable wells representthe current state of the art [32]. Thus, to meet the inking needs of parallelprobe arrays (with an ultimate goal of being able to deliver a different inkto each probe in a large pen array), arrays of addressable ink wells must alsobe developed. Indeed it is clear that ultra-high density nanoarrays will re-
Fig. 6.9. (A) A 4” wafer containing more than 1.2 million silicon nitride DPNTM
pens (inset is an SEM at 500× showing individual cantilevers and writing tips.)(Courtesy of NanoInk, Inc.) (B) SEM of active DPNTM probes equipped withthermoelectric actuation technology (courtesy of Chang Liu, University of Urbana–Champaign)
6 Nanoarrays 103
quire incredibly complex sample handling. The synthesis and purification oflarge numbers of oligonucleotides for instance is daunting and may becomeprohibitive as the number of distinct probe features increases. An alternativestrategy for fabrication of such high density nanoarrays may eventually exploitan in situ synthesis approach, whereby monomers are delivered sequentiallyby probe tips, building the probe molecules at each feature from the chip upin a strategy similar to that currently used by Affymetrix.
6.2.3 Strategies for Nanoarray Detection and Analysis
New technologies for generating nanoarrays with sub–100 nm sized features of-fer an opportunity for investigation and development of new detection method-ologies that can operate below the diffraction limit of light.
While present-day detection methods may be inadequate for screeningsuch high density arrays, miniaturization on the scale accessible with DPNTM
will allow the development of screening methods that are suitable for suchnanoscale structures. There are many scientific opportunities in this regard:when a feature composed of receptors is miniaturized to the scale of the bi-ological analytes or their attached labels, almost every mechanical, electricaland chemical property of the receptor feature is changed upon reaction withthe analyte. These properties, including size, shape, electrical conductivity,and hydrophilicity, can all be monitored in situ with an AFM or with on-chipelectronic circuitry. In the long term, it may even be possible to direct theattachment of proteins and virus particles in specific orientations to studyreactivity as a function of structural configuration. One promising strategyfor detecting analyte binding to nanoarrays is the use of labelled nanoparticleprobes. Nanoparticles can be prepared from a host of different materials indifferent sizes and shapes and can be functionalized with biological recognitionmolecules such as antibodies or oligonucleotides [33–37]. Some of the parti-cles have been shown to bind specifically to surface-immobilized receptors orcomplementary nucleic acids where they are detected using optical or elec-trical readout. This strategy is proving to be a particularly useful method ofidentifying and possibly quantifying binding in microarray assays due to thestriking properties of the nanoparticles [18, 25]. For example, in addition toheight change measurements after particle binding, there are already examplesof electrical detection of DNA targets using DNA-modified gold nanoparticlesbetween microelectrodes [36], as well as reports of detection strategies thatmake use of the strong resonant scattering [38, 39], optical absorbance [40],or fluorescent properties of certain metal or inorganic nanoparticles [41]. Ingeneral such strategies are amenable to spatially-resolved characterization ofnanoarrays on surfaces through the wide variety of tools accessed by scanningprobe microscopy, from topography, to friction, magnetic force, and even nearfield scanning optical configurations. This approach has been recently used inconjunction with topographical AFM to detect the selective binding of dif-
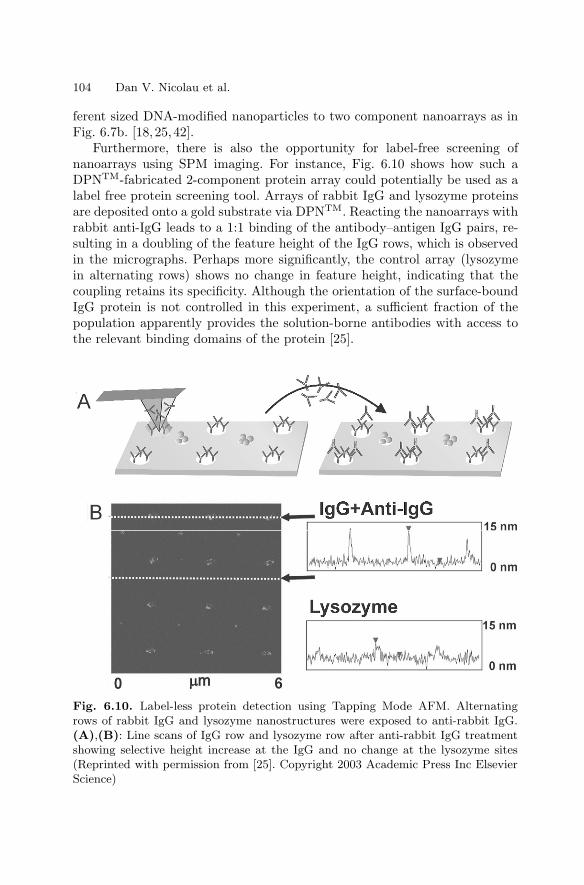
104 Dan V. Nicolau et al.
ferent sized DNA-modified nanoparticles to two component nanoarrays as inFig. 6.7b. [18,25,42].
Furthermore, there is also the opportunity for label-free screening ofnanoarrays using SPM imaging. For instance, Fig. 6.10 shows how such aDPNTM-fabricated 2-component protein array could potentially be used as alabel free protein screening tool. Arrays of rabbit IgG and lysozyme proteinsare deposited onto a gold substrate via DPNTM. Reacting the nanoarrays withrabbit anti-IgG leads to a 1:1 binding of the antibody–antigen IgG pairs, re-sulting in a doubling of the feature height of the IgG rows, which is observedin the micrographs. Perhaps more significantly, the control array (lysozymein alternating rows) shows no change in feature height, indicating that thecoupling retains its specificity. Although the orientation of the surface-boundIgG protein is not controlled in this experiment, a sufficient fraction of thepopulation apparently provides the solution-borne antibodies with access tothe relevant binding domains of the protein [25].
Fig. 6.10. Label-less protein detection using Tapping Mode AFM. Alternatingrows of rabbit IgG and lysozyme nanostructures were exposed to anti-rabbit IgG.(A),(B): Line scans of IgG row and lysozyme row after anti-rabbit IgG treatmentshowing selective height increase at the IgG and no change at the lysozyme sites(Reprinted with permission from [25]. Copyright 2003 Academic Press Inc ElsevierScience)
6 Nanoarrays 105
Clearly, the practicality of screening nanoarrays using scanned probe tech-nology is currently limited by the slow imaging speed. A single 10 × 10 micronAFM image can take up to 20 minutes to acquire and conventional AFM atits fastest only acquires several frames a minute. However, SPM technology isadvancing to address this particular issue. For example, Infinitesima’s noveltechnology combines a resonant scanned probe system with near-field opticaldetection to produce images in ten milliseconds or less, nearly video rate. Withall the other advantages of conventional SPM it is ideally suited to followingdynamic processes in situ and in almost any environmental conditions.
The path towards miniaturization will not proceed without requiring ob-stacles to be overcome along the way. However, it is widely thought that thepotential rewards clearly justify the effort. One potential difficulty comes fromcross–reactivity and non-specific binding of analyte or other species to the ar-ray spots. Although non-specific binding is a problem for any surface-basedassay, it is likely to become more problematic as screening goes nanoscale:on a nanoscale receptor spot it would be possible for a few non-specifically-bound particles to completely overwhelm the intended signal. Fortunately,going nanoscale offers new possibilities to alleviate the non specific binding.On one hand, for a small sacrifice in information density, redundancy and‘error checking’ could be built into any array. On the other hand, control-ling (and screening) the chemical environment with nanoscale precision couldoffer the opportunity both to reduce the frequency of non-specific bindingevents, and to more readily identify them when they do occur. Finally, withdirect techniques such as DPNTM, cross–contamination of the patterned arrayfeatures is entirely eliminated.
6.3 Computational Nanoarrays
The function of ‘classical’ bio–arrays, be they micro– or nano–, is to provideinformation regarding the biomolecular recognition through the docking ofprobe biomolecules on target biomolecules (or cells) spatially encoded on thesurface of the array. But molecular recognition may be just the first of aconcatenation of stages that represent a process of computation, in which casethe last configuration of the microarray represents the ‘solution’. Althoughthese functional arrays are not nanoarrays in the sense of lateral or verticalresolution as described in the previous section, they perform their functiontruly at the nano–level.
DNA computing is a new method of physical computing which is basedon the molecular recognition of complementary biomolecules (DNA) and themassive parallelism that can be achieved through cycles of DNA synthesis,PCR, ligation, electrophoresis and use of restricting enzymes. This new com-puting method appears to be particularly suited to problems that cannot besolved by even the most advance traditional electronic computers that operatesequentially. Traditionally these are called NP problems, referring to the ex-
106 Dan V. Nicolau et al.
ponential (i.e. Nondeterministic Polynomial) time required to reach a solutionfor a linear increase of the size of the problem.
Adleman [43] was the first to describe a DNA-based method which solvesthe Hamilton path problem (e.g. finding an airline path that passes severalcities optimally visiting each just once) in polynomial–time. The trade–off inAdleman’s experiment was to use a large number of ‘computers’ (i.e. DNAmolecules) which perform operations in a massively parallel manner againsttime (number and type of physical procedural steps). The nodes and thepair between nodes were encoded in DNA strands, which self–assemble inall possible arrangements following Watson–Crick complementarity. Some ofthese dsDNA may contain possible solutions, which can be selected, amplifiedand detected using classical molecular biology techniques.
After the initial proof of concept carried out by Adleman [43], DNA com-puting received a lot of attention due to its potential for problem-solvingefficiency, data storage capacity, energy efficient computation and new math-ematical outlook on computation. Essentially, the basic operations of the DNAcomputing are: Amplify; Merge; Detect; Sequence-separate; Length-separate;and Position-separate. Using this basic mathematical apparatus, many algo-rithms have been proposed to solve specific problems using DNA computing,among others, the satisfiability problem [44], the maximal clique problem [45],the graph coloring problem [46], with many other (e.g. breaking the Data En-cryption Scheme, Travelling Salesman Problem, decide graph connectivity,‘knapsack’ problem) being possible.
The critical factor on which the success of DNA computing in solution–phase depends is the capacity to achieve very small error rates for variousbiochemical operations. Because the grand idea behind DNA computing is toperform massively parallel operations, it follows that an efficient computationrelies on an as complete as possible search of the possible solutions space (DNAstrands). Classically, this can be achieved by a high ratio of DNA strandsavailable per number of candidate solutions. As the complexity of the prob-lem (expressed in terms of the dimensions of the input) increases, this ratiodecreases for a given initial amount of DNA, i.e. the average number of strandsencoding one candidate solution becomes smaller. This places demands on themaximum acceptable error rate or, equivalently, on the minimum amount ofDNA needed. Thus, DNA computing as defined suffers from a ‘scalability’problem. This has prompted the search for means to better control the errorrates in DNA computing operations (e.g. PCR, hybridization). One avenuefor improving experimental control during DNA computing experiments is toimmobilize the DNA strands on a surface before manipulation.
Microarray technology helped move the concept of manipulation of DNAmolecules for DNA computing from solution-based to surface-based processes.For instance, Smith et al. [47] proposed a new surface-based DNA computa-tion (Fig. 6.11). Firstly, ssDNA molecules that correspond to ‘all’ possiblesolutions to a problem (‘make’ function) are synthesized and covalently im-mobilized (‘attach’ function) on a surface. Then, subsets of the surface-bound
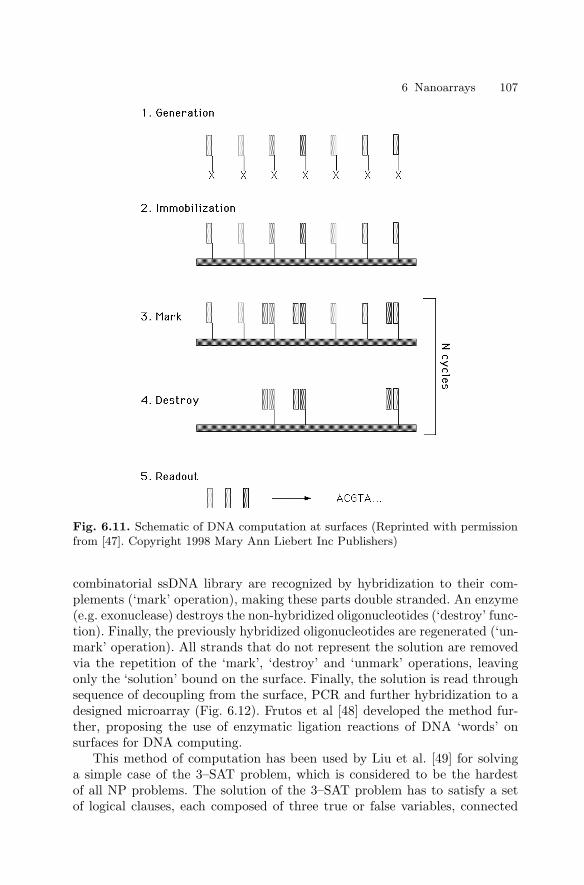
6 Nanoarrays 107
Fig. 6.11. Schematic of DNA computation at surfaces (Reprinted with permissionfrom [47]. Copyright 1998 Mary Ann Liebert Inc Publishers)
combinatorial ssDNA library are recognized by hybridization to their com-plements (‘mark’ operation), making these parts double stranded. An enzyme(e.g. exonuclease) destroys the non-hybridized oligonucleotides (‘destroy’ func-tion). Finally, the previously hybridized oligonucleotides are regenerated (‘un-mark’ operation). All strands that do not represent the solution are removedvia the repetition of the ‘mark’, ‘destroy’ and ‘unmark’ operations, leavingonly the ‘solution’ bound on the surface. Finally, the solution is read throughsequence of decoupling from the surface, PCR and further hybridization to adesigned microarray (Fig. 6.12). Frutos et al [48] developed the method fur-ther, proposing the use of enzymatic ligation reactions of DNA ‘words’ onsurfaces for DNA computing.
This method of computation has been used by Liu et al. [49] for solvinga simple case of the 3–SAT problem, which is considered to be the hardestof all NP problems. The solution of the 3–SAT problem has to satisfy a setof logical clauses, each composed of three true or false variables, connected
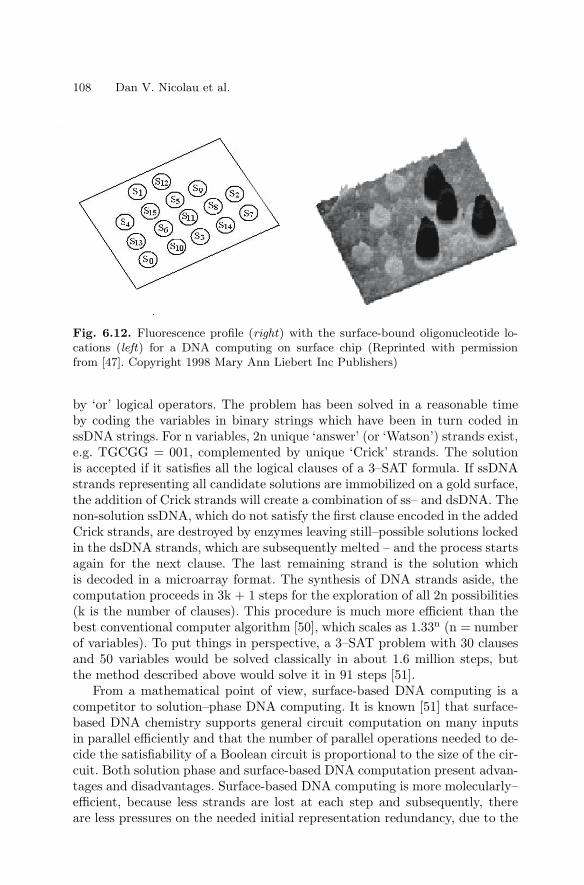
108 Dan V. Nicolau et al.
Fig. 6.12. Fluorescence profile (right) with the surface-bound oligonucleotide lo-cations (left) for a DNA computing on surface chip (Reprinted with permissionfrom [47]. Copyright 1998 Mary Ann Liebert Inc Publishers)
by ‘or’ logical operators. The problem has been solved in a reasonable timeby coding the variables in binary strings which have been in turn coded inssDNA strings. For n variables, 2n unique ‘answer’ (or ‘Watson’) strands exist,e.g. TGCGG = 001, complemented by unique ‘Crick’ strands. The solutionis accepted if it satisfies all the logical clauses of a 3–SAT formula. If ssDNAstrands representing all candidate solutions are immobilized on a gold surface,the addition of Crick strands will create a combination of ss– and dsDNA. Thenon-solution ssDNA, which do not satisfy the first clause encoded in the addedCrick strands, are destroyed by enzymes leaving still–possible solutions lockedin the dsDNA strands, which are subsequently melted – and the process startsagain for the next clause. The last remaining strand is the solution whichis decoded in a microarray format. The synthesis of DNA strands aside, thecomputation proceeds in 3k + 1 steps for the exploration of all 2n possibilities(k is the number of clauses). This procedure is much more efficient than thebest conventional computer algorithm [50], which scales as 1.33n (n = numberof variables). To put things in perspective, a 3–SAT problem with 30 clausesand 50 variables would be solved classically in about 1.6 million steps, butthe method described above would solve it in 91 steps [51].
From a mathematical point of view, surface-based DNA computing is acompetitor to solution–phase DNA computing. It is known [51] that surface-based DNA chemistry supports general circuit computation on many inputsin parallel efficiently and that the number of parallel operations needed to de-cide the satisfiability of a Boolean circuit is proportional to the size of the cir-cuit. Both solution phase and surface-based DNA computation present advan-tages and disadvantages. Surface-based DNA computing is more molecularly–efficient, because less strands are lost at each step and subsequently, thereare less pressures on the needed initial representation redundancy, due to the
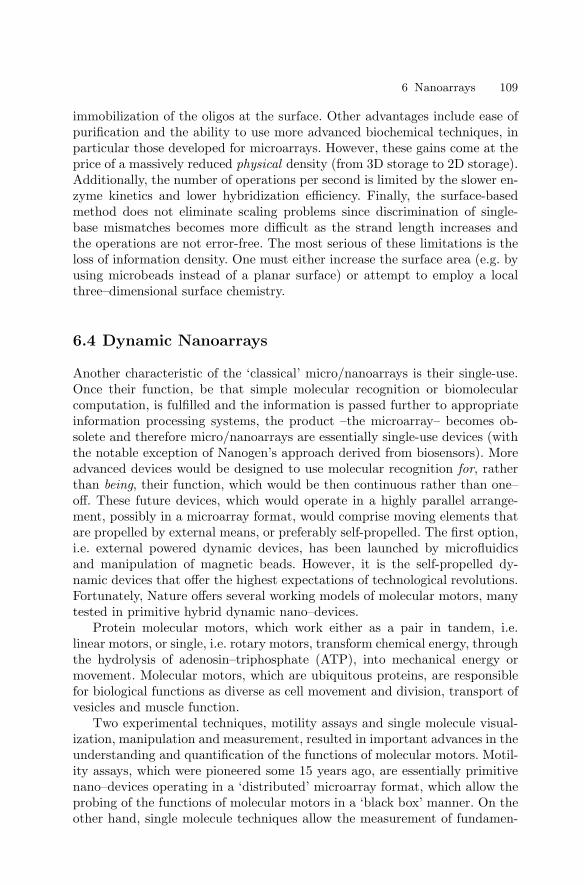
6 Nanoarrays 109
immobilization of the oligos at the surface. Other advantages include ease ofpurification and the ability to use more advanced biochemical techniques, inparticular those developed for microarrays. However, these gains come at theprice of a massively reduced physical density (from 3D storage to 2D storage).Additionally, the number of operations per second is limited by the slower en-zyme kinetics and lower hybridization efficiency. Finally, the surface-basedmethod does not eliminate scaling problems since discrimination of single-base mismatches becomes more difficult as the strand length increases andthe operations are not error-free. The most serious of these limitations is theloss of information density. One must either increase the surface area (e.g. byusing microbeads instead of a planar surface) or attempt to employ a localthree–dimensional surface chemistry.
6.4 Dynamic Nanoarrays
Another characteristic of the ‘classical’ micro/nanoarrays is their single-use.Once their function, be that simple molecular recognition or biomolecularcomputation, is fulfilled and the information is passed further to appropriateinformation processing systems, the product –the microarray– becomes ob-solete and therefore micro/nanoarrays are essentially single-use devices (withthe notable exception of Nanogen’s approach derived from biosensors). Moreadvanced devices would be designed to use molecular recognition for, ratherthan being, their function, which would be then continuous rather than one–off. These future devices, which would operate in a highly parallel arrange-ment, possibly in a microarray format, would comprise moving elements thatare propelled by external means, or preferably self-propelled. The first option,i.e. external powered dynamic devices, has been launched by microfluidicsand manipulation of magnetic beads. However, it is the self-propelled dy-namic devices that offer the highest expectations of technological revolutions.Fortunately, Nature offers several working models of molecular motors, manytested in primitive hybrid dynamic nano–devices.
Protein molecular motors, which work either as a pair in tandem, i.e.linear motors, or single, i.e. rotary motors, transform chemical energy, throughthe hydrolysis of adenosin–triphosphate (ATP), into mechanical energy ormovement. Molecular motors, which are ubiquitous proteins, are responsiblefor biological functions as diverse as cell movement and division, transport ofvesicles and muscle function.
Two experimental techniques, motility assays and single molecule visual-ization, manipulation and measurement, resulted in important advances in theunderstanding and quantification of the functions of molecular motors. Motil-ity assays, which were pioneered some 15 years ago, are essentially primitivenano–devices operating in a ‘distributed’ microarray format, which allow theprobing of the functions of molecular motors in a ‘black box’ manner. On theother hand, single molecule techniques allow the measurement of fundamen-
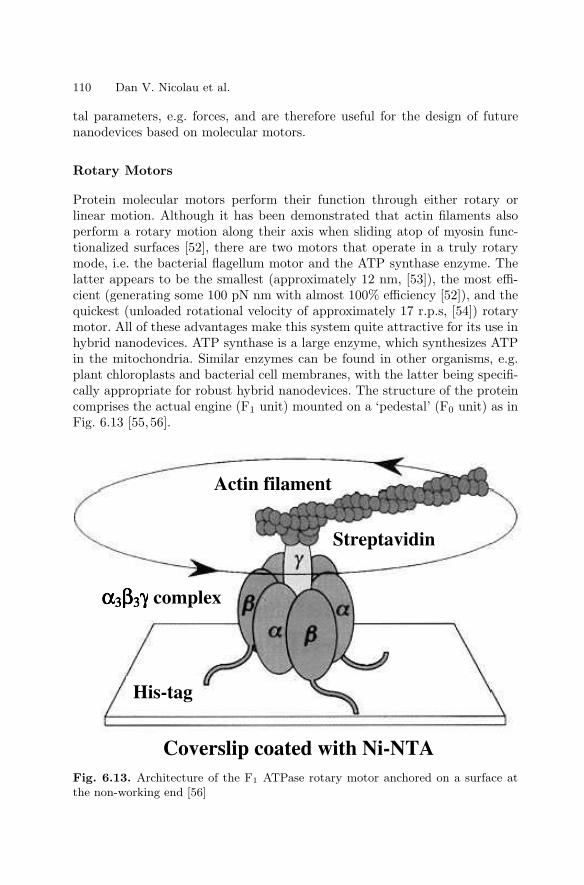
110 Dan V. Nicolau et al.
tal parameters, e.g. forces, and are therefore useful for the design of futurenanodevices based on molecular motors.
Rotary Motors
Protein molecular motors perform their function through either rotary orlinear motion. Although it has been demonstrated that actin filaments alsoperform a rotary motion along their axis when sliding atop of myosin func-tionalized surfaces [52], there are two motors that operate in a truly rotarymode, i.e. the bacterial flagellum motor and the ATP synthase enzyme. Thelatter appears to be the smallest (approximately 12 nm, [53]), the most effi-cient (generating some 100 pN nm with almost 100% efficiency [52]), and thequickest (unloaded rotational velocity of approximately 17 r.p.s, [54]) rotarymotor. All of these advantages make this system quite attractive for its use inhybrid nanodevices. ATP synthase is a large enzyme, which synthesizes ATPin the mitochondria. Similar enzymes can be found in other organisms, e.g.plant chloroplasts and bacterial cell membranes, with the latter being specifi-cally appropriate for robust hybrid nanodevices. The structure of the proteincomprises the actual engine (F1 unit) mounted on a ‘pedestal’ (F0 unit) as inFig. 6.13 [55,56].
Actin filament
Streptavidin
His-tag
αααα3333ββββ3333γγγγ complex
Coverslip coated with Ni-NTA Fig. 6.13. Architecture of the F1 ATPase rotary motor anchored on a surface atthe non-working end [56]
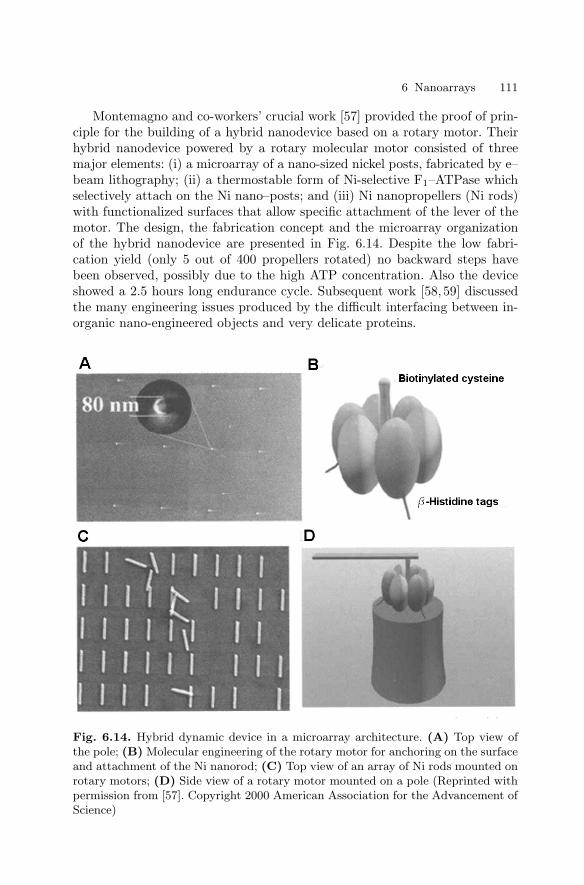
6 Nanoarrays 111
Montemagno and co-workers’ crucial work [57] provided the proof of prin-ciple for the building of a hybrid nanodevice based on a rotary motor. Theirhybrid nanodevice powered by a rotary molecular motor consisted of threemajor elements: (i) a microarray of a nano-sized nickel posts, fabricated by e–beam lithography; (ii) a thermostable form of Ni-selective F1–ATPase whichselectively attach on the Ni nano–posts; and (iii) Ni nanopropellers (Ni rods)with functionalized surfaces that allow specific attachment of the lever of themotor. The design, the fabrication concept and the microarray organizationof the hybrid nanodevice are presented in Fig. 6.14. Despite the low fabri-cation yield (only 5 out of 400 propellers rotated) no backward steps havebeen observed, possibly due to the high ATP concentration. Also the deviceshowed a 2.5 hours long endurance cycle. Subsequent work [58, 59] discussedthe many engineering issues produced by the difficult interfacing between in-organic nano-engineered objects and very delicate proteins.
Fig. 6.14. Hybrid dynamic device in a microarray architecture. (A) Top view ofthe pole; (B) Molecular engineering of the rotary motor for anchoring on the surfaceand attachment of the Ni nanorod; (C) Top view of an array of Ni rods mounted onrotary motors; (D) Side view of a rotary motor mounted on a pole (Reprinted withpermission from [57]. Copyright 2000 American Association for the Advancement ofScience)
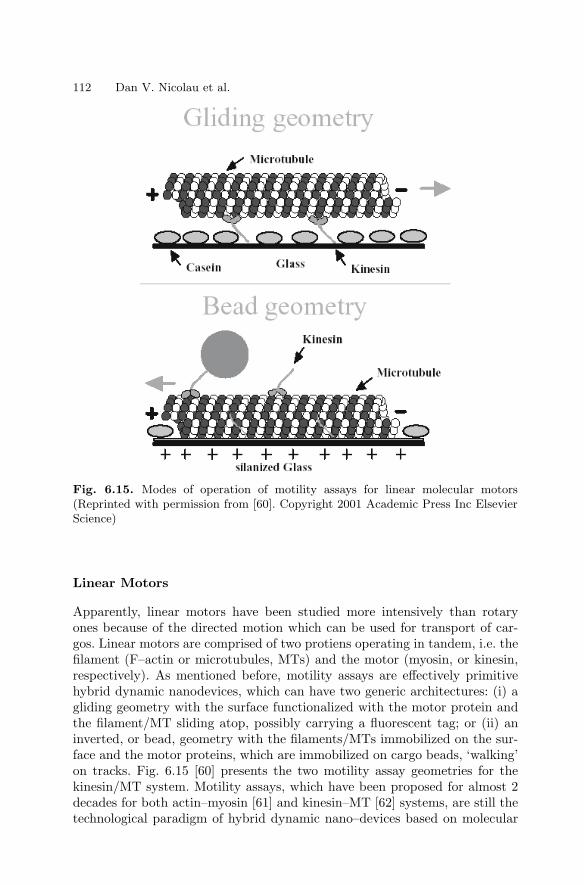
112 Dan V. Nicolau et al.
Fig. 6.15. Modes of operation of motility assays for linear molecular motors(Reprinted with permission from [60]. Copyright 2001 Academic Press Inc ElsevierScience)
Linear Motors
Apparently, linear motors have been studied more intensively than rotaryones because of the directed motion which can be used for transport of car-gos. Linear motors are comprised of two protiens operating in tandem, i.e. thefilament (F–actin or microtubules, MTs) and the motor (myosin, or kinesin,respectively). As mentioned before, motility assays are effectively primitivehybrid dynamic nanodevices, which can have two generic architectures: (i) agliding geometry with the surface functionalized with the motor protein andthe filament/MT sliding atop, possibly carrying a fluorescent tag; or (ii) aninverted, or bead, geometry with the filaments/MTs immobilized on the sur-face and the motor proteins, which are immobilized on cargo beads, ‘walking’on tracks. Fig. 6.15 [60] presents the two motility assay geometries for thekinesin/MT system. Motility assays, which have been proposed for almost 2decades for both actin–myosin [61] and kinesin–MT [62] systems, are still thetechnological paradigm of hybrid dynamic nano–devices based on molecular
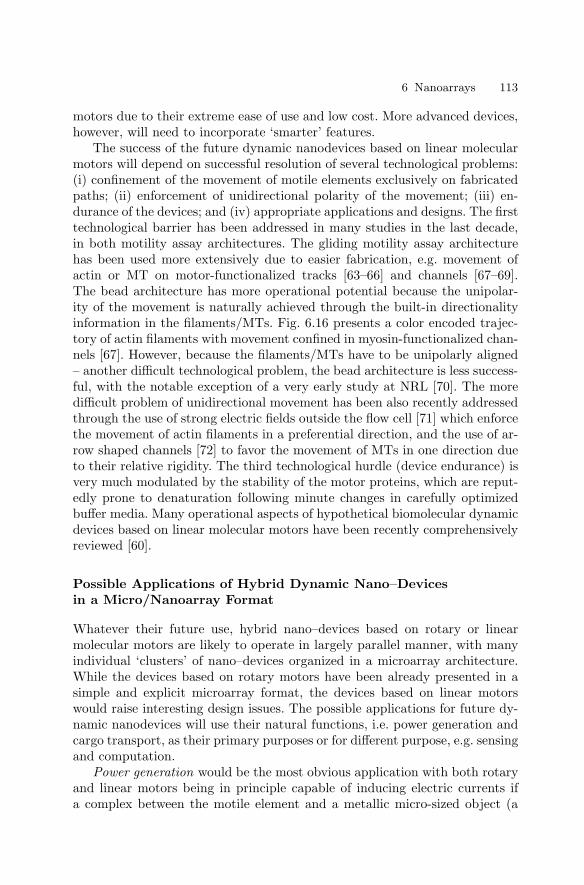
6 Nanoarrays 113
motors due to their extreme ease of use and low cost. More advanced devices,however, will need to incorporate ‘smarter’ features.
The success of the future dynamic nanodevices based on linear molecularmotors will depend on successful resolution of several technological problems:(i) confinement of the movement of motile elements exclusively on fabricatedpaths; (ii) enforcement of unidirectional polarity of the movement; (iii) en-durance of the devices; and (iv) appropriate applications and designs. The firsttechnological barrier has been addressed in many studies in the last decade,in both motility assay architectures. The gliding motility assay architecturehas been used more extensively due to easier fabrication, e.g. movement ofactin or MT on motor-functionalized tracks [63–66] and channels [67–69].The bead architecture has more operational potential because the unipolar-ity of the movement is naturally achieved through the built-in directionalityinformation in the filaments/MTs. Fig. 6.16 presents a color encoded trajec-tory of actin filaments with movement confined in myosin-functionalized chan-nels [67]. However, because the filaments/MTs have to be unipolarly aligned– another difficult technological problem, the bead architecture is less success-ful, with the notable exception of a very early study at NRL [70]. The moredifficult problem of unidirectional movement has been also recently addressedthrough the use of strong electric fields outside the flow cell [71] which enforcethe movement of actin filaments in a preferential direction, and the use of ar-row shaped channels [72] to favor the movement of MTs in one direction dueto their relative rigidity. The third technological hurdle (device endurance) isvery much modulated by the stability of the motor proteins, which are reput-edly prone to denaturation following minute changes in carefully optimizedbuffer media. Many operational aspects of hypothetical biomolecular dynamicdevices based on linear molecular motors have been recently comprehensivelyreviewed [60].
Possible Applications of Hybrid Dynamic Nano–Devicesin a Micro/Nanoarray Format
Whatever their future use, hybrid nano–devices based on rotary or linearmolecular motors are likely to operate in largely parallel manner, with manyindividual ‘clusters’ of nano–devices organized in a microarray architecture.While the devices based on rotary motors have been already presented in asimple and explicit microarray format, the devices based on linear motorswould raise interesting design issues. The possible applications for future dy-namic nanodevices will use their natural functions, i.e. power generation andcargo transport, as their primary purposes or for different purpose, e.g. sensingand computation.
Power generation would be the most obvious application with both rotaryand linear motors being in principle capable of inducing electric currents ifa complex between the motile element and a metallic micro-sized object (a
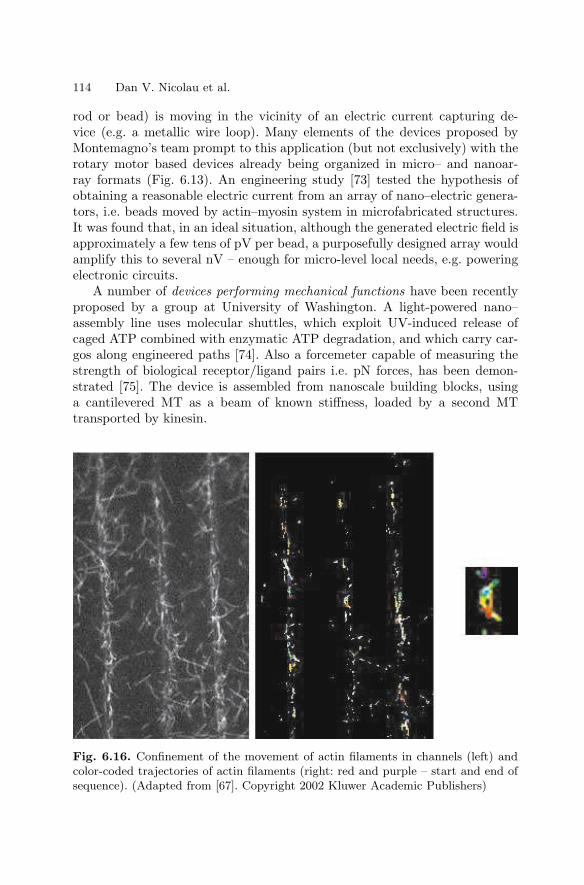
114 Dan V. Nicolau et al.
rod or bead) is moving in the vicinity of an electric current capturing de-vice (e.g. a metallic wire loop). Many elements of the devices proposed byMontemagno’s team prompt to this application (but not exclusively) with therotary motor based devices already being organized in micro– and nanoar-ray formats (Fig. 6.13). An engineering study [73] tested the hypothesis ofobtaining a reasonable electric current from an array of nano–electric genera-tors, i.e. beads moved by actin–myosin system in microfabricated structures.It was found that, in an ideal situation, although the generated electric field isapproximately a few tens of pV per bead, a purposefully designed array wouldamplify this to several nV – enough for micro-level local needs, e.g. poweringelectronic circuits.
A number of devices performing mechanical functions have been recentlyproposed by a group at University of Washington. A light-powered nano–assembly line uses molecular shuttles, which exploit UV-induced release ofcaged ATP combined with enzymatic ATP degradation, and which carry car-gos along engineered paths [74]. Also a forcemeter capable of measuring thestrength of biological receptor/ligand pairs i.e. pN forces, has been demon-strated [75]. The device is assembled from nanoscale building blocks, usinga cantilevered MT as a beam of known stiffness, loaded by a second MTtransported by kinesin.
Fig. 6.16. Confinement of the movement of actin filaments in channels (left) andcolor-coded trajectories of actin filaments (right: red and purple – start and end ofsequence). (Adapted from [67]. Copyright 2002 Kluwer Academic Publishers)
6 Nanoarrays 115
Imaging devices are another possible application. Vogel’s group proposedan imaging device based on the kinesin–MT system [76]. Information aboutsurface properties such as topography is obtained by repeated acquisition ofan optical signal from a large number of microscopic, self-propelled probesmoving on random paths across a surface. Nicolau et al. [65] observed thatthe fluorescence of rhodamine-labelled actin filaments decreases when the fila-ments pass across hydrophilic (myosin-poor) surfaces. This system can be thenused for the readout of encoded surface properties with nanometer precision.
Molecular motors based devices can be also used, in principle, for biosens-ing applications. If biomolecular recognition can induce a dramatic changein the movement characteristics of motile elements, e.g. motor functionalizedbeads, or antibody decorated filaments, then a very sensitive biosensing deviceis available. The detection of the movement characteristics can be detectedby a giant magneto resistance (GMR) detector and integrated on a chip ifthe beads are magnetic. The sensitivity of such a device is also its draw-back, especially in the context of the sensitivity of protein molecular motorsto minute changes in environmental conditions. However, the major benefitof such biosensing molecular motors-based devices lies in the motility of the‘molecular sensor’ which allows for improved process kinetics by adding amoving component to the otherwise diffusion-limited tangent–probe bindingprocess. This is especially important for detection of sensors aimed at highlytoxic or pathogenic agents, where speed of detection is critical.
Finally, molecular motors based devices can be used for computation, ina similar, algorithmically–speaking, fashion as DNA computing. It has beenrecently proposed [77] that motile elements can explore in a highly paral-lel manner graphs that encode a mathematical problem. The most intuitiveexample would be to solve the travelling salesman problem in a maze thatrepresents at a small scale the air paths in Adleman’s experiment.
6.5 Conclusion
We hope we have shown in this chapter that nanoarray technology opensmany new fields for microarray industry in many ways. In the immediate toshort term, static nanoarrays open the possibility of probing biomolecularrecognition on an enormous scale and also at the single molecule level. DNAcomputation microarrays are possibly the best technological avenue for DNAcomputing, which in itself is a tremendous development. New possibilities,unforeseen at the moment, would be opened by the development of dynamicnanodevices working in a microarray architecture.
References
1. Dammel, R. Diazonaphthoquinone–based Resists; SPIE Tutorial Texts; SPIE:Bellingham, WA, 1993; Vol. 11, Chapter 1
2. Pirrung, M. C. Angew. Chem. Int. Ed. 2002, 41, 1276–1289

116 Dan V. Nicolau et al.
3. Lander, E. S. Nature Genet. 1999, 21, 3–44. Xia, Y.; Rogers, J. A.; Paul, K. E.; Whitesides, G. M. Chem. Rev. 1999, 99,
1823–18485. Geppert, L. IEEE Spectrum 1996, 33–386. Ivanova, E., Wright, J.P., Pham, D.K., Filipponi, L., Viezolli, A., Nicolau, D.V.
Langmuir, 18, 9539–9546, 20027. Liu, G.-Y.; Xu, S.; Qian, Y. Acc. Chem. Res. 2000, 33, 457–4668. Xu, S.; Liu, G. Langmuir 1997, 13, 127–1299. Shoer, J. K.; Crooks, R. M. Langmuir 1997, 13
10. Bruckbauer, A.; Ying, L.; Rothery, A. M.; Zhou, D.; Shevchuk, A. I.; Abell, C.;Korchev, Y. E.; Klenerman, D. J. Am. Chem. Soc. 2002, 124, 8810–8811
11. Piner, R. D.; Zhu, J.; Xu, F.; Hong, S.; Mirkin, C. A. Science 1999, 283, 661–66312. Hong, S. H.; Mirkin, C. A. Science 2000, 288, 1808–181113. Hong, S. H.; Zhu, J.; Mirkin, C. A. Langmuir 1999, 15, 7897–790014. Hong, S. H.; Zhu, J.; Mirkin, C. A. Science 1999, 286, 523–52515. Piner, R. P.; Hong, S.; Mirkin, C. A. Langmuir 1999, 15, 5457–546016. Ivanisevic, A.; Mirkin, C. A. J. Am. Chem. Soc. 2001, 123, 7887–788917. Wilson, D. L.; Martin, R.; Hong, S.; Cronin-Golomb, M.; Mirkin, C. A.; Kaplan,
D. L. Proc. Natl. Acad. Sci. USA 2002, 98, 13660–1366418. Demers, L. M.; Ginger, D. S.; Park, S.-J.; Li, Z.; Chung, S.-W.; Mirkin, C. A.
Science 2002, 298, 1836–183819. Su, M.; Liu, X.; Li, S.-Y.; Dravid, V. P.; Mirkin, C. A. J. Am. Chem. Soc. 2002,
124, 1560–156120. Troughton, E. B.; Bain, C. D.; Whitesides, G. M.; Nuzzo, R. G.; Allara, D. L.;
Porter, M. D. Langmuir 1988, 4, 365–38521. Bain, C. D.; Whitesides, G. M. J. Am. Chem. Soc. 1989, 111, 7164–717522. Pique, A.; Chrisey, D. B., Eds. Direct–write technologies for rapid prototyping
applications: sensors, electronics, and integrated power sources ; Academic Press:San Diego, CA, 2002
23. Noy, A.; Miller, A. E.; Klare, J. E.; Weeks, B. L.; Woods, B. W.; DeYoreo, J. J.Nano Letters 2002, 2, 109–112
24. Lim, J. H.; Ginger, D. S.; Lee, K. B.; Heo, J.; Nam, J. M.; Mirkin, C. A. Angew.Chem. Int. Ed. Engl. 2003, 42, 2309–2312
25. Lee, K. B.; Lim, J. H.; Mirkin, C. A. J. Am. Chem. Soc. 2003, 125, 5588–558926. Lee, K.-B.; Park, S. J.; Mirkin, C. A. Science 2002, 295, 1702–170527. Vettiger, P.; Cross, G.; Despont, M.; Drechsler, U.; Durig, U.; Gotsmann, B.;
Haberle, W.; Lantz, M. A.; Rothuizen, H. E.; Stutz, R.; Binnig, G. K. IEEETransactions on Nanotechnology 2002, 1, 39–55
28. Chow, E. M.; Yaralioglu, G. G.; Quate, C. F.; Kenny, T. W. Appl. Phys. Lett.2002, 80, 664–666
29. Sulchek, T.; Grow, R. J.; Yaralioglu, G. G.; Minne, S. C.; Quate, C. F.; Manalis,S. R.; Kiraz, A.; Aydine, A.; Atalar, A. Appl. Phys. Lett. 2001, 78, 1787–1789
30. Degertekin, F. L.; Hadimioglu, B.; Sulchek, T.; Quate, C. F. Appl. Phys. Lett.2001, 78, 1628–1630
31. Zhang, M.; Bullen, D.; Chung, S.-W.; Hong, S.; Ryu, K. S.; Fan, Z.; Mirkin, C.A.; Liu, C. Nanotechnology 2002, 13, 212–217
32. Thorsen, T.; Maerkl, S. J.; Quake, S. R. Science 2002, 298, 580–58433. Storhoff, J. J.; Mucic, R. C.; Mirkin, C. A. J. Cluster Sci. 1997, 8, 179–21634. Storhoff, J. J.; Elghanian, R.; Mucic, R. C.; Mirkin, C. A.; Letsinger, R. L. J.
Am. Chem. Soc. 1998, 120, 1959–1964

6 Nanoarrays 117
35. Niemeyer, C. M.; Burger, W.; Peplies, J. Angew. Chem. Int. Ed. 1998, 37, 2265–2268
36. Niemeyer, C. M. Angew. Chem. Int. Ed. Engl. 2001, 40, 4128–415837. Park, S. J.; Taton, T. A.; Mirkin, C. A. Science 2002, 295, 1503–150638. Haes, A. J.; Van Duyne, R. P. J. Am. Chem. Soc. 2002, 124, 10596–1060439. Taton, T. A.; Lu, G.; Mirkin, C. A. J. Am. Chem. Soc. 2001, 123, 5164–516540. Taton, T. A.; Mirkin, C. A.; Letsinger, R. L. Science 2000, 289, 175741. Parak, W. J.; Boudreau, R.; Le Gros, M.; Gerion, D.; Zanchet, D.; Micheel,
C. M.; Williams, S. C.; Alivisatos, A. P.; Larabell, C. Adv. Mater. 2002, 14,882–885
42. Demers, L. M.; Park, S. J.; Taton, T. A.; Li, Z.; Mirkin, C. A. Angew. Chem.Int. Ed. Engl. 2001, 40, 3071–3073
43. Adleman, L. M. Molecular computation of solutions to combinatorial problems.Science 1994, 266, 11 November
44. Lipton, R. J. DNA solution of hard computational problem. 1995, Science 268,28 April
45. Ouyang, Q.; Kaplan, P. D.; Liu, S.; Libchaber, A. DNA solution of the maximalclique problem. Science 1997, 278, 17 October
46. Liu, Y., Xu, J. Pan, L., Wang, S. DNA Solution of a graph coloring problem. J.Chem. Inf. Comput. Sci. 2002, 42, 524–528
47. Smith L. M, Corn R. M, Condon A. E, Lagally M. G, Frutos A. G, Liu Q,Thiel A. J. A surface–based approach to DNA computation. J Comput Biol.1998 Summer, 5(2):255–67
48. Frutos, A. G., Smith, L. M., and Corn, R. M. (1998) Enzymatic ligation reactionsof DNA “words” on surfaces for DNA computing. J. Am. Chem. Soc. 120, 10277–10282. York, Vol. 1
49. Liu, Q, Wang, L., Frutos, A. G., Condon, A.E. Corn, R. M. Smith, L. M. DNAcomputing on surfaces. Nature, Vol. 403, 13 Jan 2000 175–178
50. Schoning, U. in Proc. 40th Ann. IEEE Conf. Found. Comp. Sci. (FOCS) 410–414(IEEE Comp. Sci., Los Alamitos, California, 1999)
51. Ogihara M. Ray, A. DNA computing on a chip. Nature Vol 403, 143–144, 200052. Kinosita Jr, K., Yashida, R., Noji, H., Ishiwata, S., Yoshida, M. Cell 93, 21
(1998)53. Noji, H., Yasuda, R., Yoshida, M., Kinosita Jr, K., Direct observation of the
rotation of F1ATPase. Nature, 386, 299–302, 199754. Bachand, G.D. Montemagno, C. D. Constructing Organic/Inorganic NEMS De-
vices Powered by Biomolecular Motors. Biomedical Microdevices 2:3, 179–184,2000
55. Yoshida M, Muneyuki E, Hisabori T. ATP synthase–a marvelous rotary engineof the cell. Nat Rev Mol Cell Biol. 2001 Sep;2(9):669–77
56. Noji H, Yasuda R, Yoshida M, Kinosita K Jr. Direct observation of the rotationof F1-ATPase. Nature, 1997, 386 :299–302.
57. Soong, R.K., Bachand, G.D., Neves, H.P., Olkhovets, A.G., Craighead, H.G.,Montemagno, C.D. Powering a nanodevice with a biomolecular motor. Science,290, 1555–, 2000
58. Bachand, G.D. Montemagno, C. D. Constructing Organic/Inorganic NEMS De-vices Powered by Biomolecular Motors. Biomedical Microdevices 2:3, 179–184,2000
59. Soong, R.K., Neves, H.P., Schmidt, J.J., Bachand, G.D., Montemagno, C.D.Engineering Issues in the fabrication of a hybrid nano–propeller system poweredby F1–ATPase, Biomedical Microdevices, 3:1, 71–73, 2001
118 Dan V. Nicolau et al.
60. Hess H, Vogel V. Molecular shuttles based on motor proteins: active transportin synthetic environments. J Biotechnol. 2001 Nov; 82(1):67–85
61. Yanagida, T., Nakase, M., Nishiyama, K. & Oosawa, F. (1984). Direct obser-vation of motion of single F–actin filaments in the presence of myosin. Nature307, 58–60
62. Spudich, J. A., Kron, S. J. & Sheetz, M. P. (1985) Nature, 315, 584–58663. Suzuki, H., Oiwa, K., Yamada, A., Sakakibara, H., H. Nakayama and Mashiko
S. 1995. Linear arrangement of motor protein on a mechanically deposited flu-oropolymer thin film. Jpn. J. Appl. Phys. 34:3937–3941
64. Suzuki, H., Yamada, A., Oiwa K., H. Nakayama and S. Mashiko. 1997. Control ofactin moving trajectory by patterned poly(methylmethacrylate) tracks. Biophys.J. 72:1997–2001
65. Nicolau, D.V., Suzuki, H., Mashiko, S., Taguchi, T., Yoshikawa, S. Movement ofactin filaments on microlithographically–functionalized myosin tracks. Biophys-ical Journal, 77 (2), 99044–99065, 1999
66. Dennis, J. R., Howard, J. & Vogel, V. (1999). Molecular shuttles: directing themotion of microtubules on nanoscale kinesin tracks. Nanotechnology 10, 232–236
67. Mahanivong, C., Wright, J. P., Kekic, M., Pham, D. K., dos Remedios, C.,Nicolau, D.V. Manipulation of the Motility of Protein Molecular Motors onMicrofabricated Substrates. Biomedical Microdevices 4(2): 111–116; 2002
68. Clemmens, J.; Hess, H.; Howard, J.; Vogel, V. Analysis of Microtubule Guid-ance in Open Microfabricated Channels Coated with the Motor Protein Kinesin.Langmuir; 2003; 19(5); 1738–1744
69. Bunk, R., Klinth , J., Rosengren , J., Nicholls, I., Tagerud, S., Omling, P.,Mansson, A., Montelius, L. Towards a ‘nano–traffic’ system powered by molec-ular motors. Microelectronic Engineering 67–68 (2003) 899–904
70. Turner, D. C., Chang, C., Fang K., S. L. Brandow and D. B. Murphy. 1995. Se-lective adhesion of functional microtubules to patterned silane surfaces. Biophys.J. 69:2782–2789
71. Riveline, D., Ott, A., Julicher, F., Winkelmann, D. A., Cardoso, O., Lacapere,J. J., Magnusdottir, S., Viovy, J. L., Gorre-Talini, L. & Prost, J. (1998). Actingon actin: the electric motility assay. Eur Biophys J 27, 403–8
72. Hiratsuka, Y., Tada, T., Oiwa, K., Kanayama, T., Uyeda, T.Q. P. Controlling theDirection of Kinesin–Driven Microtubule Movements along MicrolithographicTracks. Biophysical Journal, 81 2001 1555–1561
73. Fulga, F., Myhra, S., Nicolau, Jr. D. V., D.V. Nicolau, Interrogation of the dy-namics of magnetic microbeads on the meso–scale via electromagnetic detection.Smart Materials & Structures, 11 (5) 722–727, 2002
74. Hess, H., Clemmens, J., Qin, D., Howard, J. & Vogel, V. (2001). Light–ControlledMolecular Shuttles Made from Motor Proteins Carrying Cargo on EngineeredSurfaces. Nano Letters 1, 235–239
75. Hess, H.; Howard, J.; Vogel, V. A Piconewton Forcemeter Assembled from Mi-crotubules and Kinesins. Nano Lett. 2002; 2(10); 1113–1115
76. Hess, H.; Clemmens, J.; Howard, J.; Vogel, V. Surface Imaging by Self–PropelledNanoscale Probes. Nano Lett. 2002; 2(2); 113–116
77. Nicolau, D. V., Jr.; Nicolau, D. V. Computing with the Actin–Myosin molecu-lar motor system. In Biomedical Applications of Micro– and Nanoengineering.Nicolau, Dan V. (Ed.) SPIE Proc. 4937, 219–225, 2002
7
The Use of Microfluidic Techniquesin Microarray Applications
Piotr Grodzinski, Robin H. Liu, Ralf Lenigk, and Yingjie Liu
7.1 Introduction
The area of hybridization arrays enjoyed unprecedented growth in the lastdecade [1,2]. These arrays, allowing for a highly parallel analysis of a multitudeof single-stranded DNA fragments, found use in many different areas, rangingfrom microscale sequencing and cDNA expression microarrays for analysisof gene expression [3, 4] to drug discovery and development [5] and singlenucleotide polymorphism (SNP) analysis [6].
Conventional DNA microarray chips are still hampered, however, by nu-merous imperfections. They usually use sizable sample volumes of ∼ 200 µl,which prohibits evolution towards further chip miniaturization. Current on-chip hybridization assays take several hours to be completed, since the ma-jority of them rely solely on diffusion to control the reaction kinetics. Finally,most of the available array chips are not equipped with on-chip sample prepa-ration provision, therefore requiring elaborate robot-based sample prepara-tion using traditional bench techniques. Slow reaction kinetics and lack ofintegrated sample preparation prohibits further penetration of the microarraytechnology into diagnostic applications.
The recent, rapid developments in chip micro-fabrication technologies andmicrofluidics provide potential for elevating many of current deficiencies ofmicroarray techniques. Microfluidic chips (also called “lab chips”) contain in-terconnected fluidic microchannel networks, reaction chambers, mixers, andvalves, and can carry out conventional biochemical measurements with in-creased speed and reliability [7]. They have the capacity to improve reactionkinetics with the use of target stirring or mixing techniques, thereby allow-ing expansion to high throughput analysis. Also, with the incorporation ofmicro–Total Analysis Systems (µTAS) on the chip, they have the potential tointegrate front-end sample preparation with back-end hybridization detectionstages.
In this chapter, we will discuss chip technologies developed at MotorolaLabs and address the use of microfluidics in conjunction with microarray
120 P. Grodzinski et al.
hybridization detection techniques. We will cover three general areas pertinentto 1) multi-sample analysis in ‘biochannel’ devices, 2) improvement of reactionkinetics using acoustic microstreaming target mixing and target oscillationin the biochannel, and 3) integration of on-chip PCR amplification to bringsample preparation and hybridization detection into a single chip.
7.2 Biochannel Hybridization Arrays
Conventional DNA hybridization assays rely solely on the diffusion of tar-get to surface-bound probes. This diffusion limitation of the reaction leadsto hybridization times on the order of 3 to 12 hours, depending on the sizeand concentration of the target and on the hybridization conditions. Whileamplification of genetic material has become faster with the development ofrapid micro-system PCR cycling methods [8–10], detection is still hamperedby the slow process of DNA hybridization. It has been recognized that mix-ing is important to achieve maximum rates of hybridization [11] and variousmethods have been devised to accelerate this process. They include electronicenhancement of DNA hybridization [12, 13], dynamic DNA hybridization us-ing paramagnetic beads [14,15], rotation of the whole device [16], and the useof a micro porous three–dimensional biochip with the hybridization solutionbeing pumped continuously through it [17].
While ultra-high density arrays are powerful tools for expression analysisstudies, highly parallel low or medium density arrays will be useful in manyother applications such as clinical diagnostics and pharmacogenomic applica-tions based on genotyping and SNP scoring. Therefore, the ability to performmassively parallel assays with only a few micro–liters of sample/reagent perassay would provide substantial time and cost savings, and hence is highlydesirable. The ‘biochannel’ approach presented here addresses these points: itenables the simultaneous analysis of a multitude of samples at a time, requiresonly small sample volumes, improves hybridization kinetics, and provides easeof integration with other micro-fluidic device components. Fig. 7.1 depicts the‘working space’ for biochannel devices, plotted as number of samples versusnumber of targets analyzed within one chip. Biochannel structures offer dis-tinct advantages for analysis of a large number of different samples in thearray environment, with a low to medium density of detection probes.
Two different sets of chips have been prepared: 1) plastic, multi-channelarrays for multi-sample analysis with optical detection schemes [18–20] and2) hybrid arrays for single sample analysis used for studies of reaction kineticswith electrochemical detection schemes [20].
7.2.1 Biochannel Devices with Optical Detection
The first generation of multi-channel arrays was built using microfabricatedPDMS networks containing channels which were ∼ 200 µm wide, ∼ 50 µm
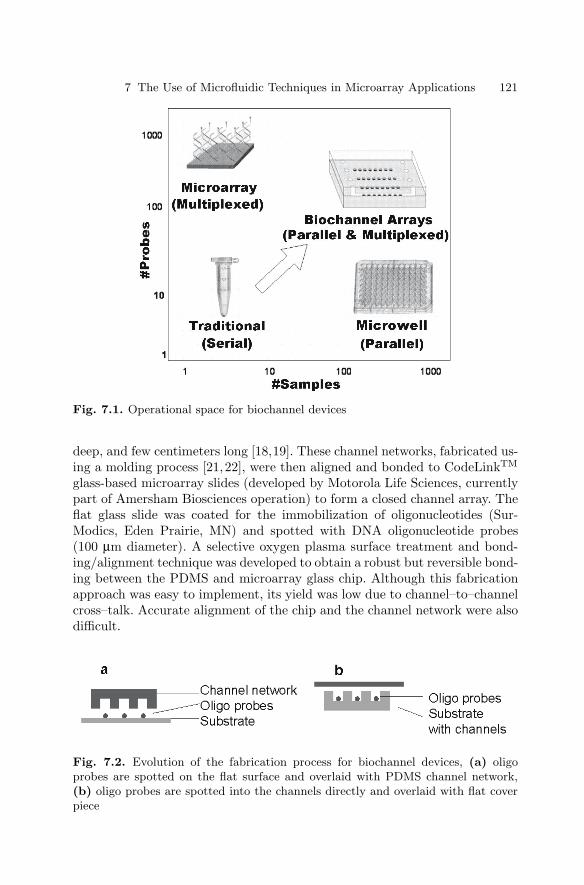
7 The Use of Microfluidic Techniques in Microarray Applications 121
Fig. 7.1. Operational space for biochannel devices
deep, and few centimeters long [18,19]. These channel networks, fabricated us-ing a molding process [21,22], were then aligned and bonded to CodeLinkTM
glass-based microarray slides (developed by Motorola Life Sciences, currentlypart of Amersham Biosciences operation) to form a closed channel array. Theflat glass slide was coated for the immobilization of oligonucleotides (Sur-Modics, Eden Prairie, MN) and spotted with DNA oligonucleotide probes(100 µm diameter). A selective oxygen plasma surface treatment and bond-ing/alignment technique was developed to obtain a robust but reversible bond-ing between the PDMS and microarray glass chip. Although this fabricationapproach was easy to implement, its yield was low due to channel–to–channelcross–talk. Accurate alignment of the chip and the channel network were alsodifficult.
Fig. 7.2. Evolution of the fabrication process for biochannel devices, (a) oligoprobes are spotted on the flat surface and overlaid with PDMS channel network,(b) oligo probes are spotted into the channels directly and overlaid with flat coverpiece
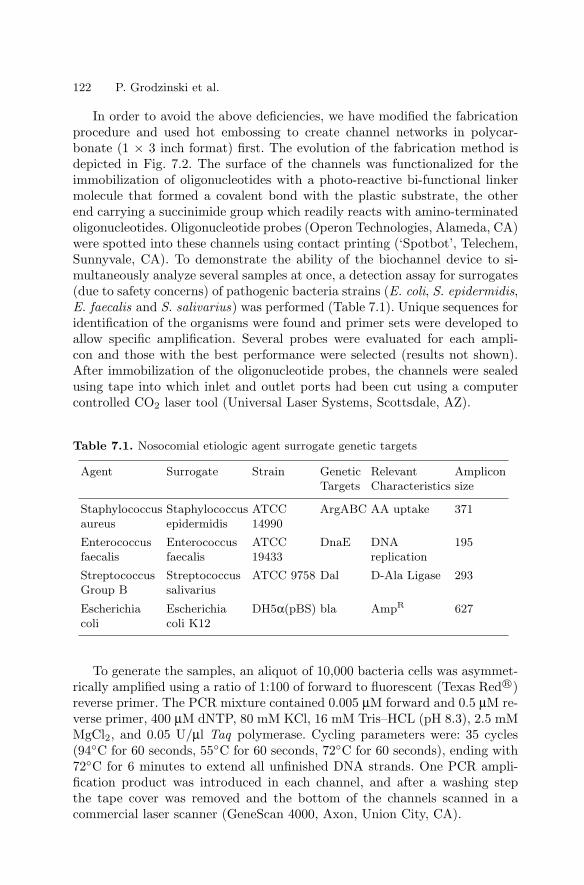
122 P. Grodzinski et al.
In order to avoid the above deficiencies, we have modified the fabricationprocedure and used hot embossing to create channel networks in polycar-bonate (1 × 3 inch format) first. The evolution of the fabrication method isdepicted in Fig. 7.2. The surface of the channels was functionalized for theimmobilization of oligonucleotides with a photo-reactive bi-functional linkermolecule that formed a covalent bond with the plastic substrate, the otherend carrying a succinimide group which readily reacts with amino-terminatedoligonucleotides. Oligonucleotide probes (Operon Technologies, Alameda, CA)were spotted into these channels using contact printing (‘Spotbot’, Telechem,Sunnyvale, CA). To demonstrate the ability of the biochannel device to si-multaneously analyze several samples at once, a detection assay for surrogates(due to safety concerns) of pathogenic bacteria strains (E. coli, S. epidermidis,E. faecalis and S. salivarius) was performed (Table 7.1). Unique sequences foridentification of the organisms were found and primer sets were developed toallow specific amplification. Several probes were evaluated for each ampli-con and those with the best performance were selected (results not shown).After immobilization of the oligonucleotide probes, the channels were sealedusing tape into which inlet and outlet ports had been cut using a computercontrolled CO2 laser tool (Universal Laser Systems, Scottsdale, AZ).
Table 7.1. Nosocomial etiologic agent surrogate genetic targets
Agent Surrogate Strain Genetic Relevant AmpliconTargets Characteristics size
Staphylococcus Staphylococcus ATCC ArgABC AA uptake 371aureus epidermidis 14990
Enterococcus Enterococcus ATCC DnaE DNA 195faecalis faecalis 19433 replication
Streptococcus Streptococcus ATCC 9758 Dal D-Ala Ligase 293Group B salivarius
Escherichia Escherichia DH5α(pBS) bla AmpR 627coli coli K12
To generate the samples, an aliquot of 10,000 bacteria cells was asymmet-rically amplified using a ratio of 1:100 of forward to fluorescent (Texas Red R©)reverse primer. The PCR mixture contained 0.005 µM forward and 0.5 µM re-verse primer, 400 µM dNTP, 80 mM KCl, 16 mM Tris–HCL (pH 8.3), 2.5 mMMgCl2, and 0.05 U/µl Taq polymerase. Cycling parameters were: 35 cycles(94C for 60 seconds, 55C for 60 seconds, 72C for 60 seconds), ending with72C for 6 minutes to extend all unfinished DNA strands. One PCR ampli-fication product was introduced in each channel, and after a washing stepthe tape cover was removed and the bottom of the channels scanned in acommercial laser scanner (GeneScan 4000, Axon, Union City, CA).
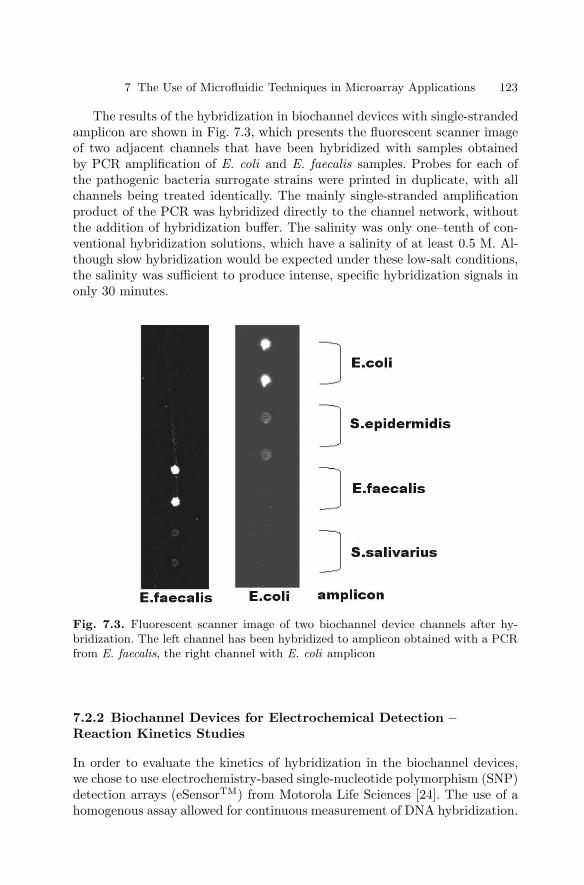
7 The Use of Microfluidic Techniques in Microarray Applications 123
The results of the hybridization in biochannel devices with single-strandedamplicon are shown in Fig. 7.3, which presents the fluorescent scanner imageof two adjacent channels that have been hybridized with samples obtainedby PCR amplification of E. coli and E. faecalis samples. Probes for each ofthe pathogenic bacteria surrogate strains were printed in duplicate, with allchannels being treated identically. The mainly single-stranded amplificationproduct of the PCR was hybridized directly to the channel network, withoutthe addition of hybridization buffer. The salinity was only one–tenth of con-ventional hybridization solutions, which have a salinity of at least 0.5 M. Al-though slow hybridization would be expected under these low-salt conditions,the salinity was sufficient to produce intense, specific hybridization signals inonly 30 minutes.
Fig. 7.3. Fluorescent scanner image of two biochannel device channels after hy-bridization. The left channel has been hybridized to amplicon obtained with a PCRfrom E. faecalis, the right channel with E. coli amplicon
7.2.2 Biochannel Devices for Electrochemical Detection –Reaction Kinetics Studies
In order to evaluate the kinetics of hybridization in the biochannel devices,we chose to use electrochemistry-based single-nucleotide polymorphism (SNP)detection arrays (eSensorTM) from Motorola Life Sciences [24]. The use of ahomogenous assay allowed for continuous measurement of DNA hybridization.
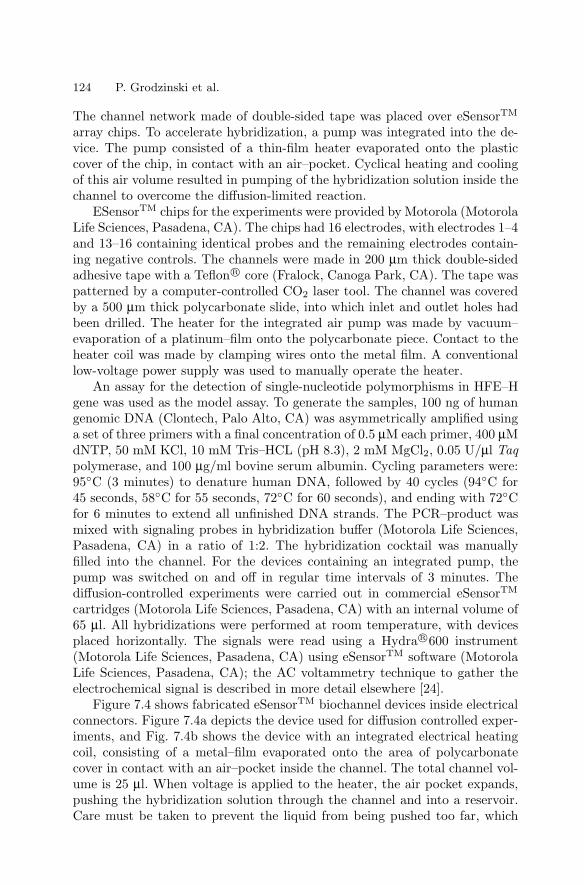
124 P. Grodzinski et al.
The channel network made of double-sided tape was placed over eSensorTM
array chips. To accelerate hybridization, a pump was integrated into the de-vice. The pump consisted of a thin-film heater evaporated onto the plasticcover of the chip, in contact with an air–pocket. Cyclical heating and coolingof this air volume resulted in pumping of the hybridization solution inside thechannel to overcome the diffusion-limited reaction.
ESensorTM chips for the experiments were provided by Motorola (MotorolaLife Sciences, Pasadena, CA). The chips had 16 electrodes, with electrodes 1–4and 13–16 containing identical probes and the remaining electrodes contain-ing negative controls. The channels were made in 200 µm thick double-sidedadhesive tape with a Teflon R© core (Fralock, Canoga Park, CA). The tape waspatterned by a computer-controlled CO2 laser tool. The channel was coveredby a 500 µm thick polycarbonate slide, into which inlet and outlet holes hadbeen drilled. The heater for the integrated air pump was made by vacuum–evaporation of a platinum–film onto the polycarbonate piece. Contact to theheater coil was made by clamping wires onto the metal film. A conventionallow-voltage power supply was used to manually operate the heater.
An assay for the detection of single-nucleotide polymorphisms in HFE–Hgene was used as the model assay. To generate the samples, 100 ng of humangenomic DNA (Clontech, Palo Alto, CA) was asymmetrically amplified usinga set of three primers with a final concentration of 0.5 µM each primer, 400 µMdNTP, 50 mM KCl, 10 mM Tris–HCL (pH 8.3), 2 mM MgCl2, 0.05 U/µl Taqpolymerase, and 100 µg/ml bovine serum albumin. Cycling parameters were:95C (3 minutes) to denature human DNA, followed by 40 cycles (94C for45 seconds, 58C for 55 seconds, 72C for 60 seconds), and ending with 72Cfor 6 minutes to extend all unfinished DNA strands. The PCR–product wasmixed with signaling probes in hybridization buffer (Motorola Life Sciences,Pasadena, CA) in a ratio of 1:2. The hybridization cocktail was manuallyfilled into the channel. For the devices containing an integrated pump, thepump was switched on and off in regular time intervals of 3 minutes. Thediffusion-controlled experiments were carried out in commercial eSensorTM
cartridges (Motorola Life Sciences, Pasadena, CA) with an internal volume of65 µl. All hybridizations were performed at room temperature, with devicesplaced horizontally. The signals were read using a Hydra R©600 instrument(Motorola Life Sciences, Pasadena, CA) using eSensorTM software (MotorolaLife Sciences, Pasadena, CA); the AC voltammetry technique to gather theelectrochemical signal is described in more detail elsewhere [24].
Figure 7.4 shows fabricated eSensorTM biochannel devices inside electricalconnectors. Figure 7.4a depicts the device used for diffusion controlled exper-iments, and Fig. 7.4b shows the device with an integrated electrical heatingcoil, consisting of a metal–film evaporated onto the area of polycarbonatecover in contact with an air–pocket inside the channel. The total channel vol-ume is 25 µl. When voltage is applied to the heater, the air pocket expands,pushing the hybridization solution through the channel and into a reservoir.Care must be taken to prevent the liquid from being pushed too far, which
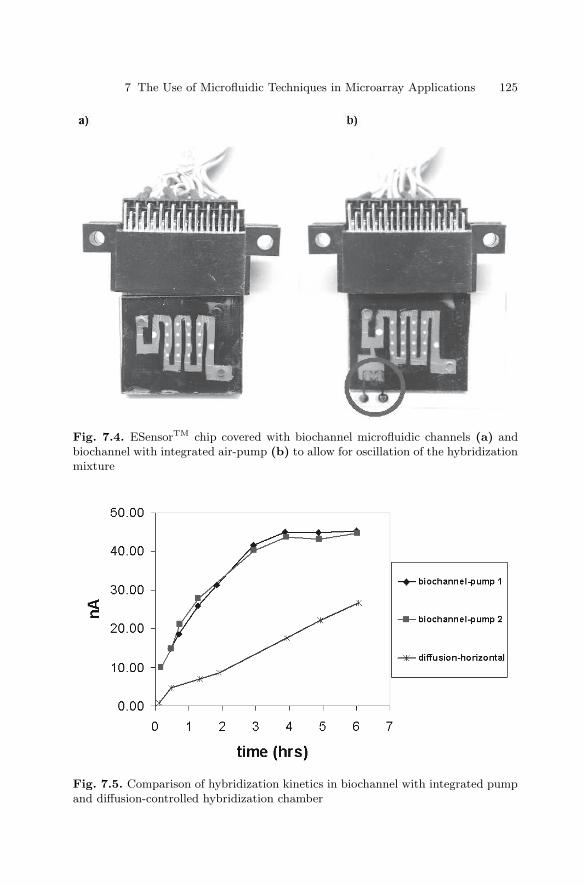
7 The Use of Microfluidic Techniques in Microarray Applications 125
Fig. 7.4. ESensorTM chip covered with biochannel microfluidic channels (a) andbiochannel with integrated air-pump (b) to allow for oscillation of the hybridizationmixture
Fig. 7.5. Comparison of hybridization kinetics in biochannel with integrated pumpand diffusion-controlled hybridization chamber
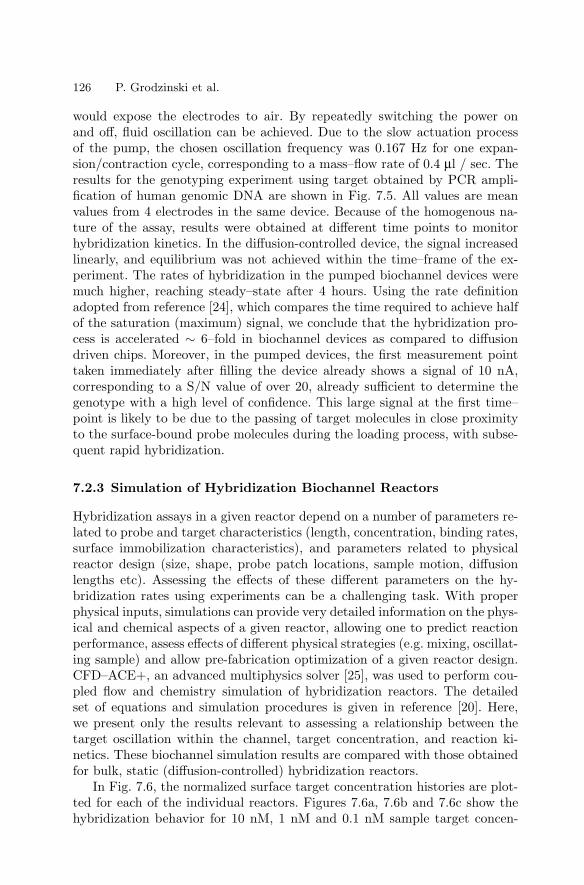
126 P. Grodzinski et al.
would expose the electrodes to air. By repeatedly switching the power onand off, fluid oscillation can be achieved. Due to the slow actuation processof the pump, the chosen oscillation frequency was 0.167 Hz for one expan-sion/contraction cycle, corresponding to a mass–flow rate of 0.4 µl / sec. Theresults for the genotyping experiment using target obtained by PCR ampli-fication of human genomic DNA are shown in Fig. 7.5. All values are meanvalues from 4 electrodes in the same device. Because of the homogenous na-ture of the assay, results were obtained at different time points to monitorhybridization kinetics. In the diffusion-controlled device, the signal increasedlinearly, and equilibrium was not achieved within the time–frame of the ex-periment. The rates of hybridization in the pumped biochannel devices weremuch higher, reaching steady–state after 4 hours. Using the rate definitionadopted from reference [24], which compares the time required to achieve halfof the saturation (maximum) signal, we conclude that the hybridization pro-cess is accelerated ∼ 6–fold in biochannel devices as compared to diffusiondriven chips. Moreover, in the pumped devices, the first measurement pointtaken immediately after filling the device already shows a signal of 10 nA,corresponding to a S/N value of over 20, already sufficient to determine thegenotype with a high level of confidence. This large signal at the first time–point is likely to be due to the passing of target molecules in close proximityto the surface-bound probe molecules during the loading process, with subse-quent rapid hybridization.
7.2.3 Simulation of Hybridization Biochannel Reactors
Hybridization assays in a given reactor depend on a number of parameters re-lated to probe and target characteristics (length, concentration, binding rates,surface immobilization characteristics), and parameters related to physicalreactor design (size, shape, probe patch locations, sample motion, diffusionlengths etc). Assessing the effects of these different parameters on the hy-bridization rates using experiments can be a challenging task. With properphysical inputs, simulations can provide very detailed information on the phys-ical and chemical aspects of a given reactor, allowing one to predict reactionperformance, assess effects of different physical strategies (e.g. mixing, oscillat-ing sample) and allow pre-fabrication optimization of a given reactor design.CFD–ACE+, an advanced multiphysics solver [25], was used to perform cou-pled flow and chemistry simulation of hybridization reactors. The detailedset of equations and simulation procedures is given in reference [20]. Here,we present only the results relevant to assessing a relationship between thetarget oscillation within the channel, target concentration, and reaction ki-netics. These biochannel simulation results are compared with those obtainedfor bulk, static (diffusion-controlled) hybridization reactors.
In Fig. 7.6, the normalized surface target concentration histories are plot-ted for each of the individual reactors. Figures 7.6a, 7.6b and 7.6c show thehybridization behavior for 10 nM, 1 nM and 0.1 nM sample target concen-
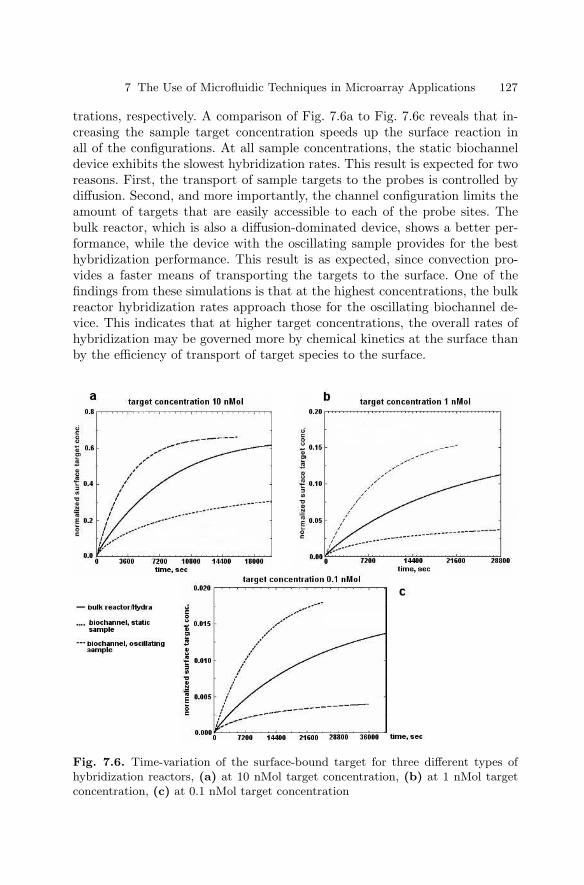
7 The Use of Microfluidic Techniques in Microarray Applications 127
trations, respectively. A comparison of Fig. 7.6a to Fig. 7.6c reveals that in-creasing the sample target concentration speeds up the surface reaction inall of the configurations. At all sample concentrations, the static biochanneldevice exhibits the slowest hybridization rates. This result is expected for tworeasons. First, the transport of sample targets to the probes is controlled bydiffusion. Second, and more importantly, the channel configuration limits theamount of targets that are easily accessible to each of the probe sites. Thebulk reactor, which is also a diffusion-dominated device, shows a better per-formance, while the device with the oscillating sample provides for the besthybridization performance. This result is as expected, since convection pro-vides a faster means of transporting the targets to the surface. One of thefindings from these simulations is that at the highest concentrations, the bulkreactor hybridization rates approach those for the oscillating biochannel de-vice. This indicates that at higher target concentrations, the overall rates ofhybridization may be governed more by chemical kinetics at the surface thanby the efficiency of transport of target species to the surface.
Fig. 7.6. Time-variation of the surface-bound target for three different types ofhybridization reactors, (a) at 10 nMol target concentration, (b) at 1 nMol targetconcentration, (c) at 0.1 nMol target concentration
128 P. Grodzinski et al.
7.3 Chips with Cavitation Microstreaming Mixers –Kinetics Studies
The biochannel oscillation technique discussed in the previous section wassuccessfully applied to the improvement of hybridization kinetics. This tech-nique is limited, however, to low- and medium-density 1–dimensional arrays.We have also developed a more general mixing technique which can be usedon 2–dimensional arrays of any size. This technique relies on the principle ofcavitation microstreaming [26] and has many advantages over most existingtechniques used for hybridization enhancement, including simple apparatus,ease of implementation, low power consumption (∼ 2 mW), and low cost.
The mixing enhancement was tested using dye experiments, and the tech-nique was subsequently used to enhance DNA hybridization in both op-tical detection-based and electrochemical detection-based DNA microarraychips [27,28].
7.3.1 Theory of Cavitation Microstreaming
An air bubble in a liquid medium can act as an actuator (i.e., the bubble sur-face behaves like a vibrating membrane) when it is energized by an acousticfield. The behavior of a bubble in a sound field is determined largely by its res-onance characteristics. For frequencies in the range considered here (∼ kHz),the radius of a bubble at resonant frequency f is given by:
2πaf =√
3γP0/ρ (7.1)
where a is the bubble radius, γ is the ratio of specific heats for the gas, P0
is the hydrostatic pressure and ρ is the density of the liquid.When a bubble undergoes vibration within a sound field, the frictional
forces generated at the air/liquid interface induce a bulk fluid flow around theair bubble, called cavitation microstreaming or acoustic microstreaming [26].It was found that cavitation microstreaming is orderly at low driving ampli-tudes when the insonation frequency drives the bubbles at their resonancefrequency for pulsation and when the bubbles are situated on solid bound-aries. Bubble-induced streaming is strongly dependent on frequency for agiven bubble radius, and on bubble radius for a given frequency. Acousticmicrostreaming arising around a single bubble excited close to its resonancefrequency produces strong liquid circulation flow in the liquid chamber. Thisliquid circulation flow can be used to effectively enhance mixing beyond thediffusion-limited process.
Although cavitation microstreaming has been studied since the 1950s [29,30], we have not found any report on the use of this phenomenon to enhancemicromixing. One challenge here is to precisely control the size of the airbubbles. In this work, we have developed an air bubble trapping design usingmicromachined air pockets for mixing enhancement.
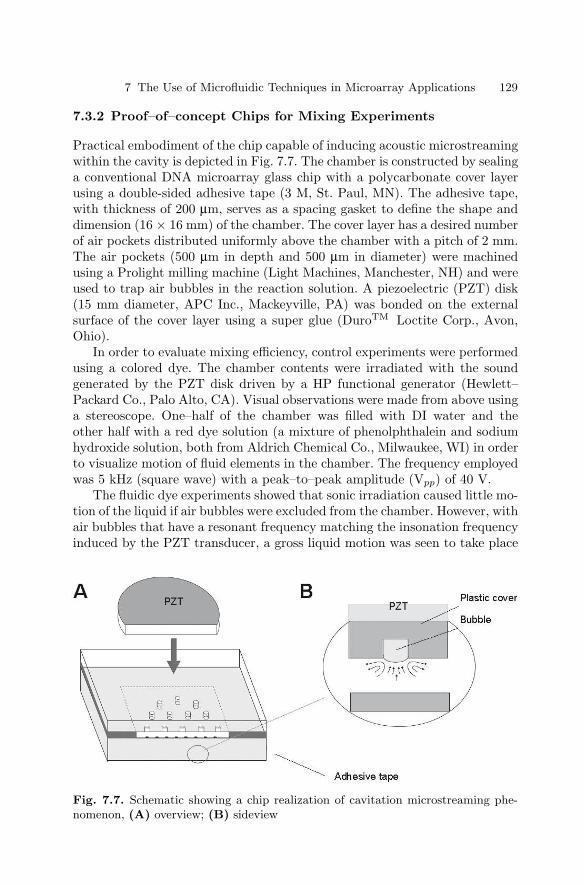
7 The Use of Microfluidic Techniques in Microarray Applications 129
7.3.2 Proof–of–concept Chips for Mixing Experiments
Practical embodiment of the chip capable of inducing acoustic microstreamingwithin the cavity is depicted in Fig. 7.7. The chamber is constructed by sealinga conventional DNA microarray glass chip with a polycarbonate cover layerusing a double-sided adhesive tape (3 M, St. Paul, MN). The adhesive tape,with thickness of 200 µm, serves as a spacing gasket to define the shape anddimension (16 × 16 mm) of the chamber. The cover layer has a desired numberof air pockets distributed uniformly above the chamber with a pitch of 2 mm.The air pockets (500 µm in depth and 500 µm in diameter) were machinedusing a Prolight milling machine (Light Machines, Manchester, NH) and wereused to trap air bubbles in the reaction solution. A piezoelectric (PZT) disk(15 mm diameter, APC Inc., Mackeyville, PA) was bonded on the externalsurface of the cover layer using a super glue (DuroTM Loctite Corp., Avon,Ohio).
In order to evaluate mixing efficiency, control experiments were performedusing a colored dye. The chamber contents were irradiated with the soundgenerated by the PZT disk driven by a HP functional generator (Hewlett–Packard Co., Palo Alto, CA). Visual observations were made from above usinga stereoscope. One–half of the chamber was filled with DI water and theother half with a red dye solution (a mixture of phenolphthalein and sodiumhydroxide solution, both from Aldrich Chemical Co., Milwaukee, WI) in orderto visualize motion of fluid elements in the chamber. The frequency employedwas 5 kHz (square wave) with a peak–to–peak amplitude (Vpp) of 40 V.
The fluidic dye experiments showed that sonic irradiation caused little mo-tion of the liquid if air bubbles were excluded from the chamber. However, withair bubbles that have a resonant frequency matching the insonation frequencyinduced by the PZT transducer, a gross liquid motion was seen to take place
Fig. 7.7. Schematic showing a chip realization of cavitation microstreaming phe-nomenon, (A) overview; (B) sideview
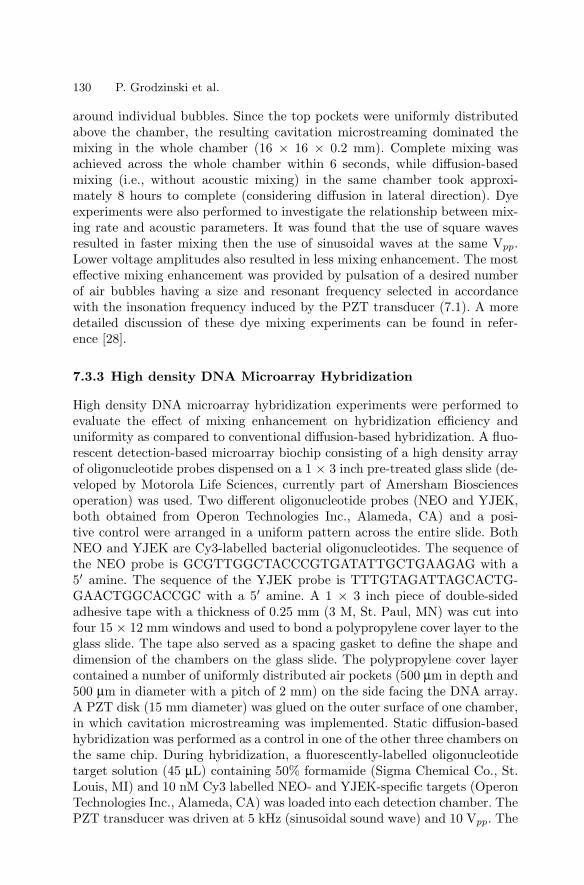
130 P. Grodzinski et al.
around individual bubbles. Since the top pockets were uniformly distributedabove the chamber, the resulting cavitation microstreaming dominated themixing in the whole chamber (16 × 16 × 0.2 mm). Complete mixing wasachieved across the whole chamber within 6 seconds, while diffusion-basedmixing (i.e., without acoustic mixing) in the same chamber took approxi-mately 8 hours to complete (considering diffusion in lateral direction). Dyeexperiments were also performed to investigate the relationship between mix-ing rate and acoustic parameters. It was found that the use of square wavesresulted in faster mixing then the use of sinusoidal waves at the same Vpp.Lower voltage amplitudes also resulted in less mixing enhancement. The mosteffective mixing enhancement was provided by pulsation of a desired numberof air bubbles having a size and resonant frequency selected in accordancewith the insonation frequency induced by the PZT transducer (7.1). A moredetailed discussion of these dye mixing experiments can be found in refer-ence [28].
7.3.3 High density DNA Microarray Hybridization
High density DNA microarray hybridization experiments were performed toevaluate the effect of mixing enhancement on hybridization efficiency anduniformity as compared to conventional diffusion-based hybridization. A fluo-rescent detection-based microarray biochip consisting of a high density arrayof oligonucleotide probes dispensed on a 1 × 3 inch pre-treated glass slide (de-veloped by Motorola Life Sciences, currently part of Amersham Biosciencesoperation) was used. Two different oligonucleotide probes (NEO and YJEK,both obtained from Operon Technologies Inc., Alameda, CA) and a posi-tive control were arranged in a uniform pattern across the entire slide. BothNEO and YJEK are Cy3-labelled bacterial oligonucleotides. The sequence ofthe NEO probe is GCGTTGGCTACCCGTGATATTGCTGAAGAG with a5′ amine. The sequence of the YJEK probe is TTTGTAGATTAGCACTG-GAACTGGCACCGC with a 5′ amine. A 1 × 3 inch piece of double-sidedadhesive tape with a thickness of 0.25 mm (3 M, St. Paul, MN) was cut intofour 15 × 12 mm windows and used to bond a polypropylene cover layer to theglass slide. The tape also served as a spacing gasket to define the shape anddimension of the chambers on the glass slide. The polypropylene cover layercontained a number of uniformly distributed air pockets (500 µm in depth and500 µm in diameter with a pitch of 2 mm) on the side facing the DNA array.A PZT disk (15 mm diameter) was glued on the outer surface of one chamber,in which cavitation microstreaming was implemented. Static diffusion-basedhybridization was performed as a control in one of the other three chambers onthe same chip. During hybridization, a fluorescently-labelled oligonucleotidetarget solution (45 µL) containing 50% formamide (Sigma Chemical Co., St.Louis, MI) and 10 nM Cy3 labelled NEO- and YJEK-specific targets (OperonTechnologies Inc., Alameda, CA) was loaded into each detection chamber. ThePZT transducer was driven at 5 kHz (sinusoidal sound wave) and 10 Vpp. The
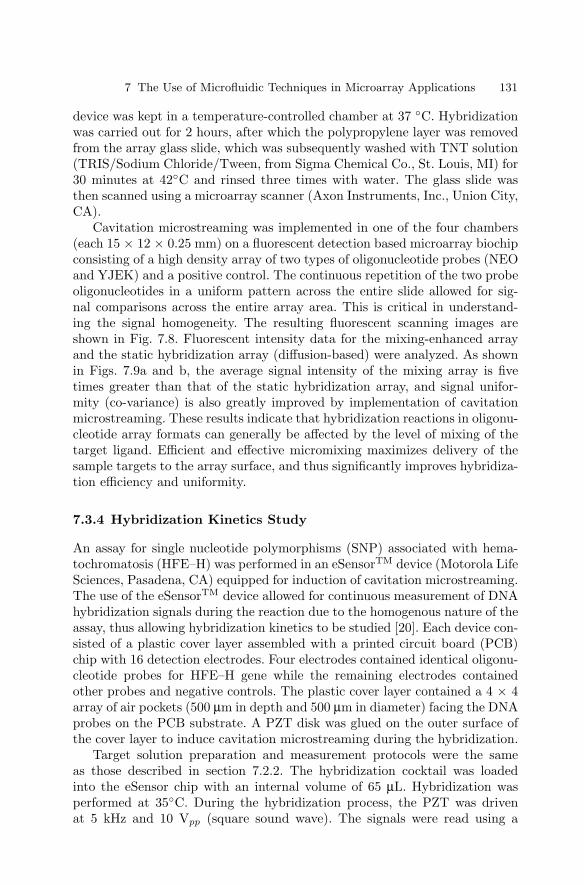
7 The Use of Microfluidic Techniques in Microarray Applications 131
device was kept in a temperature-controlled chamber at 37 C. Hybridizationwas carried out for 2 hours, after which the polypropylene layer was removedfrom the array glass slide, which was subsequently washed with TNT solution(TRIS/Sodium Chloride/Tween, from Sigma Chemical Co., St. Louis, MI) for30 minutes at 42C and rinsed three times with water. The glass slide wasthen scanned using a microarray scanner (Axon Instruments, Inc., Union City,CA).
Cavitation microstreaming was implemented in one of the four chambers(each 15 × 12 × 0.25 mm) on a fluorescent detection based microarray biochipconsisting of a high density array of two types of oligonucleotide probes (NEOand YJEK) and a positive control. The continuous repetition of the two probeoligonucleotides in a uniform pattern across the entire slide allowed for sig-nal comparisons across the entire array area. This is critical in understand-ing the signal homogeneity. The resulting fluorescent scanning images areshown in Fig. 7.8. Fluorescent intensity data for the mixing-enhanced arrayand the static hybridization array (diffusion-based) were analyzed. As shownin Figs. 7.9a and b, the average signal intensity of the mixing array is fivetimes greater than that of the static hybridization array, and signal unifor-mity (co-variance) is also greatly improved by implementation of cavitationmicrostreaming. These results indicate that hybridization reactions in oligonu-cleotide array formats can generally be affected by the level of mixing of thetarget ligand. Efficient and effective micromixing maximizes delivery of thesample targets to the array surface, and thus significantly improves hybridiza-tion efficiency and uniformity.
7.3.4 Hybridization Kinetics Study
An assay for single nucleotide polymorphisms (SNP) associated with hema-tochromatosis (HFE–H) was performed in an eSensorTM device (Motorola LifeSciences, Pasadena, CA) equipped for induction of cavitation microstreaming.The use of the eSensorTM device allowed for continuous measurement of DNAhybridization signals during the reaction due to the homogenous nature of theassay, thus allowing hybridization kinetics to be studied [20]. Each device con-sisted of a plastic cover layer assembled with a printed circuit board (PCB)chip with 16 detection electrodes. Four electrodes contained identical oligonu-cleotide probes for HFE–H gene while the remaining electrodes containedother probes and negative controls. The plastic cover layer contained a 4 × 4array of air pockets (500 µm in depth and 500 µm in diameter) facing the DNAprobes on the PCB substrate. A PZT disk was glued on the outer surface ofthe cover layer to induce cavitation microstreaming during the hybridization.
Target solution preparation and measurement protocols were the sameas those described in section 7.2.2. The hybridization cocktail was loadedinto the eSensor chip with an internal volume of 65 µL. Hybridization wasperformed at 35C. During the hybridization process, the PZT was drivenat 5 kHz and 10 Vpp (square sound wave). The signals were read using a
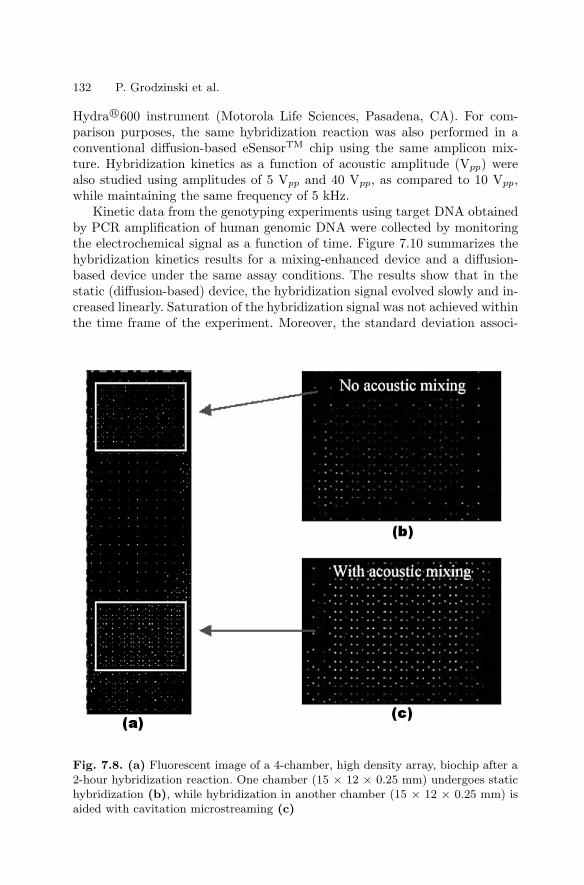
132 P. Grodzinski et al.
Hydra R©600 instrument (Motorola Life Sciences, Pasadena, CA). For com-parison purposes, the same hybridization reaction was also performed in aconventional diffusion-based eSensorTM chip using the same amplicon mix-ture. Hybridization kinetics as a function of acoustic amplitude (Vpp) werealso studied using amplitudes of 5 Vpp and 40 Vpp, as compared to 10 Vpp,while maintaining the same frequency of 5 kHz.
Kinetic data from the genotyping experiments using target DNA obtainedby PCR amplification of human genomic DNA were collected by monitoringthe electrochemical signal as a function of time. Figure 7.10 summarizes thehybridization kinetics results for a mixing-enhanced device and a diffusion-based device under the same assay conditions. The results show that in thestatic (diffusion-based) device, the hybridization signal evolved slowly and in-creased linearly. Saturation of the hybridization signal was not achieved withinthe time frame of the experiment. Moreover, the standard deviation associ-
Fig. 7.8. (a) Fluorescent image of a 4-chamber, high density array, biochip after a2-hour hybridization reaction. One chamber (15 × 12 × 0.25 mm) undergoes statichybridization (b), while hybridization in another chamber (15 × 12 × 0.25 mm) isaided with cavitation microstreaming (c)
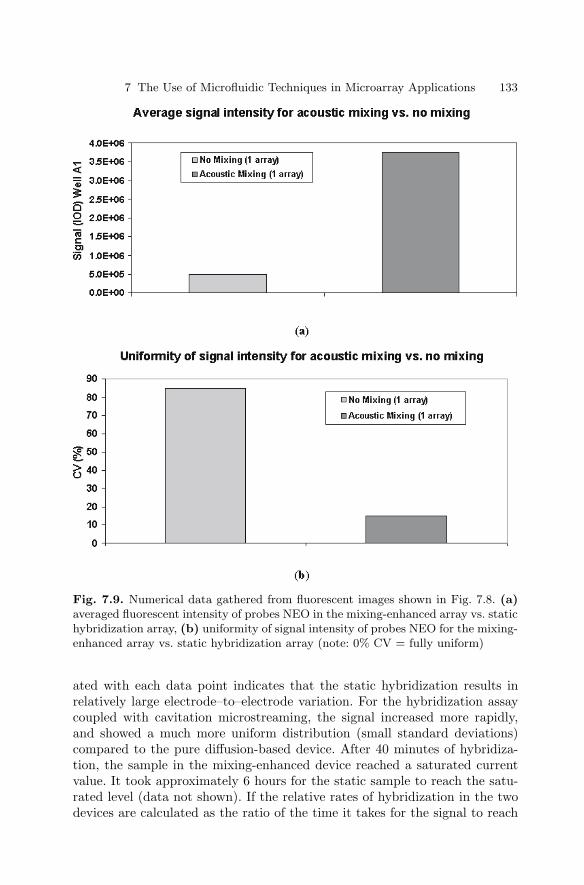
7 The Use of Microfluidic Techniques in Microarray Applications 133
Fig. 7.9. Numerical data gathered from fluorescent images shown in Fig. 7.8. (a)averaged fluorescent intensity of probes NEO in the mixing-enhanced array vs. statichybridization array, (b) uniformity of signal intensity of probes NEO for the mixing-enhanced array vs. static hybridization array (note: 0% CV = fully uniform)
ated with each data point indicates that the static hybridization results inrelatively large electrode–to–electrode variation. For the hybridization assaycoupled with cavitation microstreaming, the signal increased more rapidly,and showed a much more uniform distribution (small standard deviations)compared to the pure diffusion-based device. After 40 minutes of hybridiza-tion, the sample in the mixing-enhanced device reached a saturated currentvalue. It took approximately 6 hours for the static sample to reach the satu-rated level (data not shown). If the relative rates of hybridization in the twodevices are calculated as the ratio of the time it takes for the signal to reach
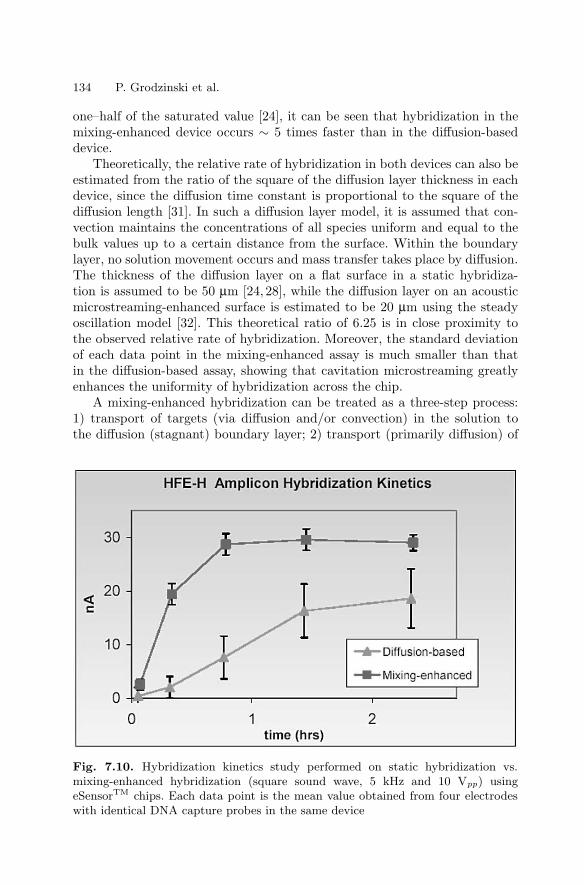
134 P. Grodzinski et al.
one–half of the saturated value [24], it can be seen that hybridization in themixing-enhanced device occurs ∼ 5 times faster than in the diffusion-baseddevice.
Theoretically, the relative rate of hybridization in both devices can also beestimated from the ratio of the square of the diffusion layer thickness in eachdevice, since the diffusion time constant is proportional to the square of thediffusion length [31]. In such a diffusion layer model, it is assumed that con-vection maintains the concentrations of all species uniform and equal to thebulk values up to a certain distance from the surface. Within the boundarylayer, no solution movement occurs and mass transfer takes place by diffusion.The thickness of the diffusion layer on a flat surface in a static hybridiza-tion is assumed to be 50 µm [24, 28], while the diffusion layer on an acousticmicrostreaming-enhanced surface is estimated to be 20 µm using the steadyoscillation model [32]. This theoretical ratio of 6.25 is in close proximity tothe observed relative rate of hybridization. Moreover, the standard deviationof each data point in the mixing-enhanced assay is much smaller than thatin the diffusion-based assay, showing that cavitation microstreaming greatlyenhances the uniformity of hybridization across the chip.
A mixing-enhanced hybridization can be treated as a three-step process:1) transport of targets (via diffusion and/or convection) in the solution tothe diffusion (stagnant) boundary layer; 2) transport (primarily diffusion) of
Fig. 7.10. Hybridization kinetics study performed on static hybridization vs.mixing-enhanced hybridization (square sound wave, 5 kHz and 10 Vpp) usingeSensorTM chips. Each data point is the mean value obtained from four electrodeswith identical DNA capture probes in the same device
7 The Use of Microfluidic Techniques in Microarray Applications 135
target within the diffusion boundary layer to the probes on the chip surface;and 3) reaction of target with probes on the surface. Since the last step isa chemical process of association and dissociation at the surface on whichextended research has been reported [33,34], we have focused on the first twosteps. Both fluidic and hybridization experiments have demonstrated thatcavitation microstreaming not only provides rapid lateral mass transport offluidic elements, but also enhances the vertical mass transport of target DNAin the solution. The combination of rapid lateral and vertical fluid movementsresults in rapid transport of targets in solution to the diffusion boundary layerand thus allows for continuous replenishment of fresh DNA targets aroundprobes that have been depleted of complementary targets. As a result, thehybridization rate is increased. Moreover, the rapid fluid movement associatedwith cavitation microstreaming in a shallow hybridization chamber reducesthe thickness of the diffusion boundary layer by 2.5–fold. Targets are thereforein closer proximity to the immobilized probes on the chip surface, resultingin faster hybridization due to shorter diffusion lengths.
The rapid lateral fluidic movement, as observed in the fluidic dye experi-ments, also ensures a homogenous mixture of targets and sufficient fluid ex-change across the large surface area of the chip, thus allowing for uniformhybridization signals to be achieved. Uniformity of the hybridization signal iscritical, especially for high density microarrays and/or for detection of low-abundance targets. Lack of lateral convection can lead to non-homogeneousarray performance and hybridization differences that are independent of dif-ferences in target concentration. Although the enhancement of hybridizationrates using acoustic microstreaming is not as significant as that in the biochan-nel [20], flow–through [17], and electronic DNA [12, 13] devices, cavitationmicrostreaming has distinct advantages over the above methods, due to therapid lateral mass transport that can be achieved, resulting in significantlyenhanced uniformity of hybridization. Moreover, cavitation microstreamingrequires a very simple mixing apparatus, and thus can easily be incorporatedinto most existing biochip devices.
7.4 Integrated Microfluidic Reactorsfor DNA Amplification and Hybridization
The use of microfabrication technologies has created the potential to integratebiological sample preparation with DNA analysis in a single Lab–on–a–Chipdevice [35, 36]. The prospective goal is to fully integrate sample collectionand pretreatment with the DNA extraction, amplification, and detection intoa single microfluidic platform. The ability to perform all of the steps of thebiological assay, in a single self-contained microchip, promises significant ad-vantages in terms of speed, cost, sample/reagent consumption, contaminationreduction, efficiency and automation [37,38].
136 P. Grodzinski et al.
In recent years, developments in Lab–on–a–Chip technologies have beensubstantial. Previously, integrated micro devices with reagent mixing, enzy-matic reactions, and DNA sizing by electrophoresis were demonstrated [39].The integration of micro PCR with microchip capillary electrophoresis (CE)has also been developed [40, 41]. The devices reported by Burns et al. [42]were capable of metering aqueous reagents, mixing, amplification, enzymaticdigestion, electrophoretic separation, and detection with no external lenses,heaters, or mechanical pumps. Other integrated devices, demonstrated by Sos-nowski et al. [43], utilized electrical forces to accomplish such functions as cellseparation, sample transport, hybridization acceleration, and denaturation. Inanother report [35], integrated monolithic genetic assay devices have been fab-ricated in polycarbonate to carry out serial and parallel multistep molecularoperations, including nucleic acid hybridization. Recently, Taylor et al. [44]reported on devices capable of carrying out automated sample preparationfollowed by real time PCR detection of pathogens. Similarly, Wilding, Krickaand Fortina [45] have developed a prototype of an integrated semi-disposablemicrochip analyzer. The system, which is currently under further testing, iscapable of cell separation and isolation, PCR amplification, and amplicatedetection.
The overall performance of an integrated device does not depend only onthat of its individual functional units, but also on that of the functional in-tegration. As a result, microvalves have become critical components for thefurther development of Lab–on–a–Chip technology. Some very ingenious mi-crovalves have been designed and built as alternatives to silicon based mi-crovalves [46,47]. Electrokinetic valves have been successfully used for sampleinjection in microchip CE, on-chip fluid mixing, and dilution [36, 48]. Hy-drophobic passive valves have been implemented in microfabricated centrifu-gal microfluidic systems [49]. Systems containing on–off valves and switchingvalves have been built in elastomeric materials by soft lithography [50]. Poly-mer monoliths containing grafted thermally responsive polymers have beenthermally controlled to block or allow flow in micrometer size structures [51].Various designs of hydrogel valves, which operate on the principle of hydro-gel volume change with external stimuli, have enabled the fabrication of anorganic microfluidic system [52]. Because of the unique valving requirements(high pressure, biocompatibility, and device complexity) for the integrationof PCR and hybridization functionality, none of these valves could be imple-mented into our monolithic integrated devices.
7.4.1 Integrated Chip Design and Fabrication
Here [53], we discuss plastic, disposable devices capable of carrying out PCRamplification, hybridization, and hybridization wash assays. These microfludicdevices were fabricated into polycarbonate plastic using CO2 laser machin-ing. Reagent transport through the device was provided by syringe pumps,which were docked onto the device. Peltier thermal electrical devices powered
7 The Use of Microfluidic Techniques in Microarray Applications 137
the heating and cooling functionality of the device. Oligonucleotide probeswere deposited inside plastic hybridization channels using surface attachmentchemistry and spotting techniques previously discussed in section 7.2.1. NovelPluronics phase change valves accomplished the integration of such functionalunits as PCR amplification, hybridization and hybridization wash on the samedevice. An air permeable hydrophobic membrane valve was implemented intothe device to allow for the flow of solution into the sealed hybridization cham-ber. All of the reagents needed for the assay were loaded into the device beforethe assay. Genomic DNA from the bacteria Escherichia coli K–12 (E. coli)and Enterococcus faecalis (E. faecalis) were used to amplify the E. coli K–12MG1655 gene (221 bp) and the E. faecalis DNAE gene (195 bp) by singleor multiplex asymmetrical PCR (A–PCR) reactions. The single strand ampli-cons were hybridized to the detection probes inside the hybridization channel.The performance of each individual functional unit and that of the integratedsystem were tested.
7.4.2 Pluronics Phase Change Valves
Microvalves are critical to the successful integration of PCR amplificationwith DNA hybridization assays. Suitable microvalves have to meet a number ofrequirements. First, the valves must be able to withhold the pressure generatedduring the PCR reaction, caused by degassing and air expansion at elevatedtemperature. If the valve fails, the PCR sample will be pushed out of the PCRchamber, resulting in failed PCR reaction. The amount of pressure requiredto prevent degassing has been estimated by Chiou et. al. [54] to be about3.1 psi. The evaluation was performed using solubility data for air in waterand Henry’s law. The presence of an air gap between the PCR chamber and thevalves will cause additional internal pressure build–up. Heating of this air gapwill generate an additional 3.7 psi pressure at 94C (using the ideal gas law),therefore the valve must be able to withhold at least 6.8 psi total pressure toensure the successful confinement of the PCR sample during thermal cycling.Second, because valves will be in direct contact with PCR solution, the valvematerial must not inhibit the PCR reaction. Third, the valve needs to beeasily opened after the PCR reaction to allow PCR solution to flow into thehybridization channel.
Pluronics F127, a commercially available surfactant, is composed of un-charged (EO)106(PO)70(EO)106 triblock copolymers. Solutions of Pluronicswithin a concentration range of 18–30% are low viscosity liquids (< 2 poise)at low temperature (0–5C), but form self-supporting cubic liquid crystallinegels at room temperature [53]. Therefore, Pluronics solutions at the properconcentration can be used as one-shot, phase change valves. These one shotvalves are initially closed and become permanently opened once activated bya lowering of the valve temperature below the Pluronics gel transition tem-perature. We have found that the presence of Pluronics molecules does notinhibit PCR reactions, and a 9 mm × 0.25 mm × 0.25 mm valve made of 30%
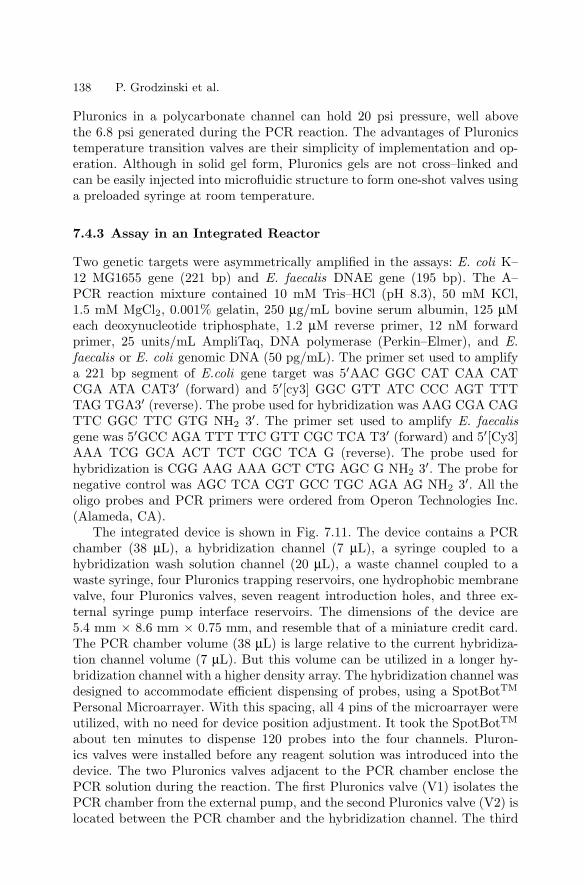
138 P. Grodzinski et al.
Pluronics in a polycarbonate channel can hold 20 psi pressure, well abovethe 6.8 psi generated during the PCR reaction. The advantages of Pluronicstemperature transition valves are their simplicity of implementation and op-eration. Although in solid gel form, Pluronics gels are not cross–linked andcan be easily injected into microfluidic structure to form one-shot valves usinga preloaded syringe at room temperature.
7.4.3 Assay in an Integrated Reactor
Two genetic targets were asymmetrically amplified in the assays: E. coli K–12 MG1655 gene (221 bp) and E. faecalis DNAE gene (195 bp). The A–PCR reaction mixture contained 10 mM Tris–HCl (pH 8.3), 50 mM KCl,1.5 mM MgCl2, 0.001% gelatin, 250 µg/mL bovine serum albumin, 125 µMeach deoxynucleotide triphosphate, 1.2 µM reverse primer, 12 nM forwardprimer, 25 units/mL AmpliTaq, DNA polymerase (Perkin–Elmer), and E.faecalis or E. coli genomic DNA (50 pg/mL). The primer set used to amplifya 221 bp segment of E.coli gene target was 5′AAC GGC CAT CAA CATCGA ATA CAT3′ (forward) and 5′[cy3] GGC GTT ATC CCC AGT TTTTAG TGA3′ (reverse). The probe used for hybridization was AAG CGA CAGTTC GGC TTC GTG NH2 3′. The primer set used to amplify E. faecalisgene was 5′GCC AGA TTT TTC GTT CGC TCA T3′ (forward) and 5′[Cy3]AAA TCG GCA ACT TCT CGC TCA G (reverse). The probe used forhybridization is CGG AAG AAA GCT CTG AGC G NH2 3′. The probe fornegative control was AGC TCA CGT GCC TGC AGA AG NH2 3′. All theoligo probes and PCR primers were ordered from Operon Technologies Inc.(Alameda, CA).
The integrated device is shown in Fig. 7.11. The device contains a PCRchamber (38 µL), a hybridization channel (7 µL), a syringe coupled to ahybridization wash solution channel (20 µL), a waste channel coupled to awaste syringe, four Pluronics trapping reservoirs, one hydrophobic membranevalve, four Pluronics valves, seven reagent introduction holes, and three ex-ternal syringe pump interface reservoirs. The dimensions of the device are5.4 mm × 8.6 mm × 0.75 mm, and resemble that of a miniature credit card.The PCR chamber volume (38 µL) is large relative to the current hybridiza-tion channel volume (7 µL). But this volume can be utilized in a longer hy-bridization channel with a higher density array. The hybridization channel wasdesigned to accommodate efficient dispensing of probes, using a SpotBotTM
Personal Microarrayer. With this spacing, all 4 pins of the microarrayer wereutilized, with no need for device position adjustment. It took the SpotBotTM
about ten minutes to dispense 120 probes into the four channels. Pluron-ics valves were installed before any reagent solution was introduced into thedevice. The two Pluronics valves adjacent to the PCR chamber enclose thePCR solution during the reaction. The first Pluronics valve (V1) isolates thePCR chamber from the external pump, and the second Pluronics valve (V2) islocated between the PCR chamber and the hybridization channel. The third
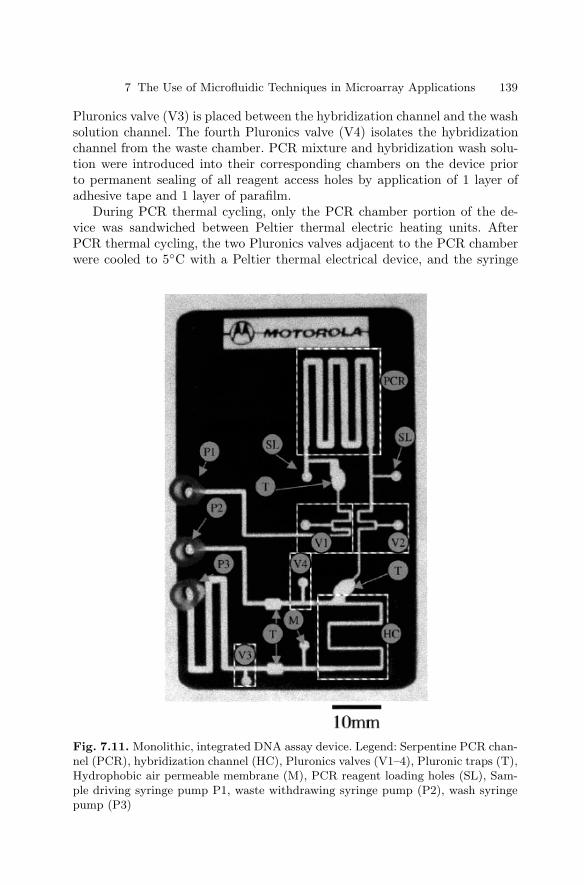
7 The Use of Microfluidic Techniques in Microarray Applications 139
Pluronics valve (V3) is placed between the hybridization channel and the washsolution channel. The fourth Pluronics valve (V4) isolates the hybridizationchannel from the waste chamber. PCR mixture and hybridization wash solu-tion were introduced into their corresponding chambers on the device priorto permanent sealing of all reagent access holes by application of 1 layer ofadhesive tape and 1 layer of parafilm.
During PCR thermal cycling, only the PCR chamber portion of the de-vice was sandwiched between Peltier thermal electric heating units. AfterPCR thermal cycling, the two Pluronics valves adjacent to the PCR chamberwere cooled to 5C with a Peltier thermal electrical device, and the syringe
Fig. 7.11. Monolithic, integrated DNA assay device. Legend: Serpentine PCR chan-nel (PCR), hybridization channel (HC), Pluronics valves (V1–4), Pluronic traps (T),Hydrophobic air permeable membrane (M), PCR reagent loading holes (SL), Sam-ple driving syringe pump P1, waste withdrawing syringe pump (P2), wash syringepump (P3)
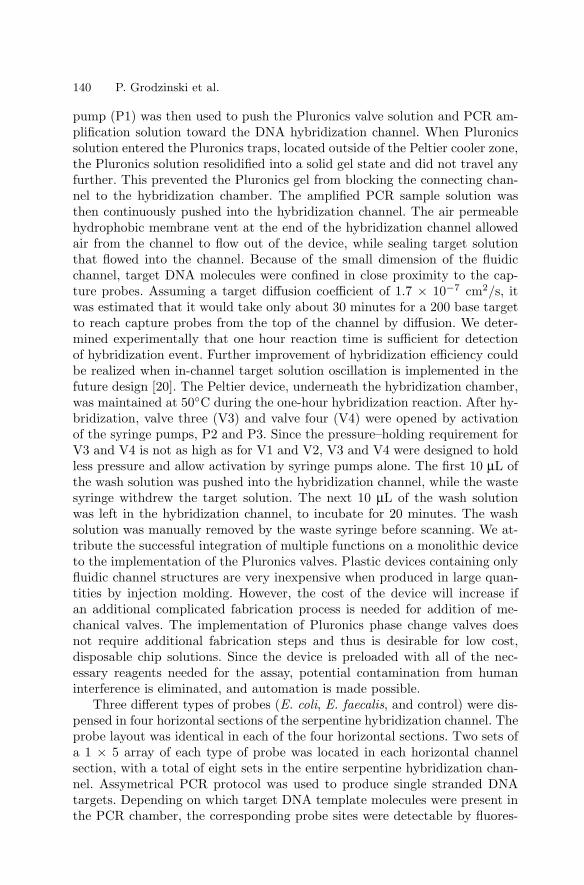
140 P. Grodzinski et al.
pump (P1) was then used to push the Pluronics valve solution and PCR am-plification solution toward the DNA hybridization channel. When Pluronicssolution entered the Pluronics traps, located outside of the Peltier cooler zone,the Pluronics solution resolidified into a solid gel state and did not travel anyfurther. This prevented the Pluronics gel from blocking the connecting chan-nel to the hybridization chamber. The amplified PCR sample solution wasthen continuously pushed into the hybridization channel. The air permeablehydrophobic membrane vent at the end of the hybridization channel allowedair from the channel to flow out of the device, while sealing target solutionthat flowed into the channel. Because of the small dimension of the fluidicchannel, target DNA molecules were confined in close proximity to the cap-ture probes. Assuming a target diffusion coefficient of 1.7 × 10⁻⁷ cm2/s, itwas estimated that it would take only about 30 minutes for a 200 base targetto reach capture probes from the top of the channel by diffusion. We deter-mined experimentally that one hour reaction time is sufficient for detectionof hybridization event. Further improvement of hybridization efficiency couldbe realized when in-channel target solution oscillation is implemented in thefuture design [20]. The Peltier device, underneath the hybridization chamber,was maintained at 50C during the one-hour hybridization reaction. After hy-bridization, valve three (V3) and valve four (V4) were opened by activationof the syringe pumps, P2 and P3. Since the pressure–holding requirement forV3 and V4 is not as high as for V1 and V2, V3 and V4 were designed to holdless pressure and allow activation by syringe pumps alone. The first 10 µL ofthe wash solution was pushed into the hybridization channel, while the wastesyringe withdrew the target solution. The next 10 µL of the wash solutionwas left in the hybridization channel, to incubate for 20 minutes. The washsolution was manually removed by the waste syringe before scanning. We at-tribute the successful integration of multiple functions on a monolithic deviceto the implementation of the Pluronics valves. Plastic devices containing onlyfluidic channel structures are very inexpensive when produced in large quan-tities by injection molding. However, the cost of the device will increase ifan additional complicated fabrication process is needed for addition of me-chanical valves. The implementation of Pluronics phase change valves doesnot require additional fabrication steps and thus is desirable for low cost,disposable chip solutions. Since the device is preloaded with all of the nec-essary reagents needed for the assay, potential contamination from humaninterference is eliminated, and automation is made possible.
Three different types of probes (E. coli, E. faecalis, and control) were dis-pensed in four horizontal sections of the serpentine hybridization channel. Theprobe layout was identical in each of the four horizontal sections. Two sets ofa 1 × 5 array of each type of probe was located in each horizontal channelsection, with a total of eight sets in the entire serpentine hybridization chan-nel. Assymetrical PCR protocol was used to produce single stranded DNAtargets. Depending on which target DNA template molecules were present inthe PCR chamber, the corresponding probe sites were detectable by fluores-
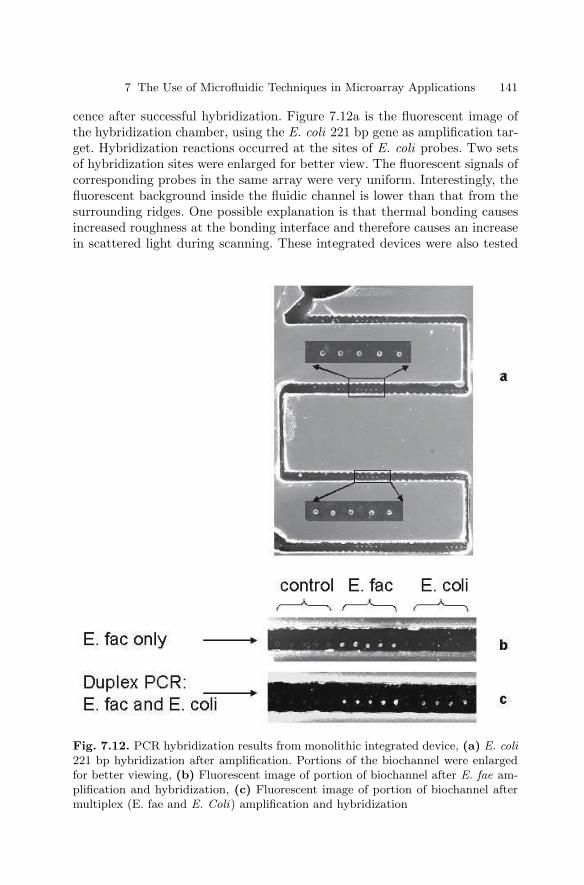
7 The Use of Microfluidic Techniques in Microarray Applications 141
cence after successful hybridization. Figure 7.12a is the fluorescent image ofthe hybridization chamber, using the E. coli 221 bp gene as amplification tar-get. Hybridization reactions occurred at the sites of E. coli probes. Two setsof hybridization sites were enlarged for better view. The fluorescent signals ofcorresponding probes in the same array were very uniform. Interestingly, thefluorescent background inside the fluidic channel is lower than that from thesurrounding ridges. One possible explanation is that thermal bonding causesincreased roughness at the bonding interface and therefore causes an increasein scattered light during scanning. These integrated devices were also tested
Fig. 7.12. PCR hybridization results from monolithic integrated device, (a) E. coli221 bp hybridization after amplification. Portions of the biochannel were enlargedfor better viewing, (b) Fluorescent image of portion of biochannel after E. fae am-plification and hybridization, (c) Fluorescent image of portion of biochannel aftermultiplex (E. fae and E. Coli) amplification and hybridization
142 P. Grodzinski et al.
for E. faecalis gene (195 bp) amplification and detection, and for multiplexPCR (E. coli and E. faecalis) amplification and detection. All amplificationand hybridization reactions were successful, as shown in Fig. 7.12(b,c).
7.5 Summary and Conclusions
Microarray hybridization technologies have become indispensable tools inthe studies of gene mapping, gene expression, and single nucleotide poly-morphisms. The microarray field has enjoyed tremendous progress in thelast decade, resulting in successful commercialization of several chip ap-proaches [1,2,12,13,17,24]. However there is still significant room for improve-ments, particularly in the areas of assay kinetics, on-chip sample preparationand further functional integration. These improvements will not only increaseanalysis throughput and reduce analysis cost, but will enable broadening ofthe practical applications to such areas as doctor’s office diagnostics, fieldenvironmental monitoring, and rapid biothreat recognition. A clever combi-nation of existing microarray techniques and newly developing microfluidicchips promise powerful analytical solutions where high parallelism of sens-ing is complimented with high throughput, rapid assay kinetics and compact,portable instrumentation.
References
1. Fodor, S. P., Read, J. L., Pirrung, M. C., Stryer, L., Lu, A. T., Solas, D.(1991) Light–directed, spatially addressable parallel chemical synthesis. Science251, 767–773
2. Schena, M. Microarray BiochipTechnology. Eaton Publishing: Natick, MA, 20003. Duggan, D. J., Bittner, M., Chen, Y., Meltzer, P., and Trent, J. M. (1999)
Expression profiling using cDNA microarrays. Nature Genetics 21, 10–144. Brown, P. O., and Botstein, D. (1999) Exploring the new world of the genome
with DNA microarrays. Nature Genetics 21, 33–375. Debouck, C., and Goodfellow, P. N. (1999) DNA microarrays in drug discovery
and development. Nature Genetics 21, 48–506. Hacia, J. G. (1999) Resequencing and mutational analysis using oligonucleotide
microarrays. Nature Genetics 21, 42–477. Liu, R. H., Grodzinski, P. In Microfluidic and BioMEMS Applications ; Tay, F.
E. H., Ed.; Kluwer Academic Publishers: Boston, 2002, pp 143–1848. Wittwer, C. T., Fillmore, G.C., Garling, D.J. (1990) Minimizing the time re-
quired for DNA amplification by efficient heat transfer to small samples. AnalBiochem 186, 328–331
9. Belgrader, P., Benett, W., Hadley, D., Richards, J., Stratton, P., Mariella Jr. ,R., Milanovich, F., (1999) PCR detection of bacteria in seven minutes. Science,284, 449–450
10. Huhmer, A. F. R. (2000) Noncontact infrared–mediated thermocycling for ef-fective polymerase chain reaction amplification of DNA in nanoliter volumes.Analytical Chemistry 72, 5507–5512
7 The Use of Microfluidic Techniques in Microarray Applications 143
11. Southern, E., Mir, K., and Shchepinov, M. (1999) Molecular interactions onmicroarrays. [Review] [37 refs]. Nature Genetics 21, 5–9
12. Edman, C. F., Raymond, D. E., Wu, D. J., Tu, E., Sosnowski, R. G., Butler, W.F., Nerenberg, M., and Heller, M. J. (1997) Electric field directed nucleic acidhybridization on microchips. Nucleic Acids Res 25, 4907–14
13. Radtkey, R., Feng, L., Muralhidar, M., Duhon, M., Canter, D., DiPierro, D.,Fallon, S., Tu, E., McElfresh, K., Nerenberg, M., and Sosnowski, R. (2000)Rapid, high fidelity analysis of simple sequence repeats on an electronically activeDNA microchip. Nucleic Acids Res 28, E17
14. Fan ZH, M. S., Granzow R, Heaney P, Ho W, Dong Q, Kumar R. (1999) Dy-namic DNA hybridization on a chip using paramagnetic beads. Anal Chem 71,4851–4859
15. Fan, Z. H., Kumar, R. (2001) In Biochip Technology, Cheng, J., Kricka, L., Ed.,Harwood Academic Publishers, Philadelphia, PA, pp. 291 – 307
16. Chee, M., Yang, R., Hubbell, E., Berno, A., Huang, X. C., Stern, D., Winkler,J., Lockhart, D. J., Morris, M. S., and Fodor, S. P. (1996) Accessing geneticinformation with high–density DNA arrays. Science 274, 610–4
17. Cheek, B.J., Steel, A.B., Torres, M.P., Yu, Y-Y., Yang, H. (2001) Chemilumi-nescence Detection for Hybridization Assays on the Flow–Thru Chip, a Three–Dimensional Microchannel Biochip. Anal Chem 73, 5777–5783
18. Liu, R. H., Chen, H., Luehrsen, K. R., Ganser, D., Weston, D., Blackwell, J.,Grodzinski, P., In Technical Digest of International MEMS Conf., Interlaken,Switzerland, Jan. 21–25 2001; 439–442
19. Liu, R., Lenigk, R., Luehrsen, K. R., Yu, H., Chen, H., Ganser, D., Bonanno,J., Grodzinski, P., In Micro Total Analysis Systems 2001 ; Ramsey, J. M., Vanden Berg, A., Eds.; Kluwer Academic Publishers: Monterey, CA, 2001, 465–467
20. Lenigk, R., Liu, R., Athavale, M., Chen, Z., Ganser, D., Yang, J., Rauch, C.,Liu, Y., Chan, B., Yu, H., Ray, M., Marrero, R., Grodzinski, P. (2002) Plasticbiochannel hybridization devices: A new concept for microfluidic DNA arrays.Analytical Biochemistry 311, 40–49
21. Jackman, R. J., Brittain, S. T., Adams, A., Prentiss, M. G., Whitesides, G.(1998) Design and Fabrication of Topologically Complex, Three–DimensionalMicrostructures. Science 280, 2089–2091
22. Jo, B. H., Lerberghe, L. M. V., Motsegood, K. M., Beebe, D. J. (2000) Three–dimensional micro–channel fabrication in Polydimethylsiloxane(PDMS) elas-tomer. Journal of Micro–electro–mechanical Systems 9, 76–81
23. Umek RM, L. S., Vielmetter J, Terbrueggen RH, Irvine B, Yu CJ, Kayyem JF,Yowanto H, Blackburn GF, Farkas DH, Chen YP. (2001) Electronic detectionof nucleic acids: a versatile platform for molecular diagnostics J Mol Diagn 3,74–84
24. Steel, A., Torres, M., Hartwell, J., Yu, Y.-Y., Ting, N., Hoke, G., Yang, H. InMicroarray Biochip Technology ; Schena, M., Ed.; Eaton Publishing, 2000, pp87–117
25. Corporation, C. R. (2001) CFD–ACE+ User’s Manual, CFD Research Corpo-ration, Huntsville, AL
26. Elder, S. A. (1959) Cavitation Microstreaming. J. Acoust. Soc. Am. 31, 54–6227. Liu, R.H., Lenigk, R., Ganser, D., Bonanno, J., Sanchez, B., Singal, P., Grodzin-
ski, P., Improvement of DNA Microarray Biochips using Microfluidic MixingTechnique, presented at Solid–State Sensor and Actuator Workshop, HiltonHead Island, SC, June, 2002

144 P. Grodzinski et al.
28. Liu, R. H., Lenigk, R., Yang, J., Druyor-Sanchez, R., Singal, P., Grodzinski, P.(2003) Hybridization Enhancement by Bubble–induced Acoustic Microstreaming.Analytical Chemistry, 75 1911-1917
29. Nyborg, W. L. (1958) Acoustic streaming near a boundary. J. Acoust. Soc. Am.30, 329–339
30. Kolb, J., Nyborg, W. L. (1956) Small–Scale Acoustic Streaming in Liquids. J.Acoust. Soc. Am. 28, 1237–1242
31. Bard, A. J., Faulkner, L. R. Electrochemical Methods; Wiley: New York, 198032. White, F. M. Viscous Fluid Flow ; McGraw-Hill: New York, 197433. Jonsson, U. L., al., e. (1991) Real–time biospecific interaction analysis using
surface plasmon resonance and a sensor chip technology. BioTechniques 11, 620–627
34. Garland, P. B. (1996) Optical evanescent wave methods for the study of biomolec-ular interactions. Q. Rev. Biophys. 29, 91–117
35. Anderson, R. C., Su, X., Bogdan, G. J., Fenton, J. (2000) A miniature integrateddevice for automated multistep genetic assays. Nucleic Acids Res 28, E60
36. Harrison, D. J., Fluri, K., Seiler, K., Fan, Z., Effenhauser, C. S., Manz, A. (1993)Micromachining a Miniaturized Capillary Electrophoresis–based Chemical Anal-ysis System on a Chip. Science 261, 895–897
37. Wang, J. (2000) From DNA biosensors to gene chips. Nucleic Acids Res 28,3011–3016
38. Ramsey, J. M., Jacobson, S. C., Knapp, M. R. (1995) Microfabricated ChemicalMeasurement Systems. Nature Medicine 1, 1093–1096
39. Jacobson, S. C., Hergenroder, R., Moore Jr., A. W., Ramsey, J. M. (1994)Precolumn Reactions with Electrophoretic Analysis Integrated on a Microchip.Anal. Chem. 66, 4127–4132
40. Woolley, A. T., Hadley, D., Landre, P., deMello, A. J., Mathies, R. A., Northrup,M. A. (1996) Functional Integration of PCR Amplification and Capillary Elec-trophoresis in a Microfabricated DNA Analysis Device. Anal. Chem. 68, 4081–4086
41. Waters, L. C., Jacobson, S. C., Kroutchinina, N., Khandurina, J., Foote, R. S.,Ramsey, J. M. (1998) Microchip Device for Cell Lysis, Multiplex PCR Amplifi-cation, and Electrophoretic Sizing. Anal. Chem. 70, 158–162
42. Burns, M. A., Johnson, B. N., Brahmasandra, S. N., Handique, K., Webster,J. R., Krishnan, M., Sammarco, T. S., Man, P. M., Jones, D., Heldsinger, D.,Mastrangelo, C. H., Burke, D. T. (1998) An integrated nanoliter DNA analysisdevice. Science 282, 484–487
43. Sosnowski, R. G., Tu, E., Butler, W. F., O’Connell, J. P., Heller, M. J. (1997)Rapid determination of single base mismatch mutations in DNA hybrids by directelectric field control. Proc Natl Acad Sci U S A 94, 1119–1123
44. Taylor, M. T., Belgrader, P., Joshi, R., Kintz, G. A., Northrup, M. A. In MicroTotal Analysis Systems 2001 ; Ramsey, J. M., Van den Berg, A., Eds.; KluwerAcademic Publishers: Monterey, CA, 2001, pp 670–672
45. Yuen, P., Kricka, L., Fortina, P., Panaro, N., Sakazume, T., Wilding, P. (2001)Microchip Module for Blood Sample Preparation and Nucleic Acid AmplificationReactions. Genome Research 11, 405–412
46. Smith, L., Hok, B., In Transducers ’91, San Francisco, CA 1991; 1049–105147. Barth, P. W. In Transducers’95 : Stockholm, Sweden, 1995, pp 276–277
7 The Use of Microfluidic Techniques in Microarray Applications 145
48. Jacobson, S. C., McKnight, T. E., Ramsey , J. M. (1999) Microfluidic Devicesfor Electrokinetically Driven Parallel and Serial Mixing. Analytical Chemistry71, 4455–4459
49. Duffy, D. C., Gillis, H. L., Lin, J., Sheppard, N. F., Kellogg, G. L. (1999) Mi-crofabricated Centrifugal Microfluidic Systems: Characterization and MultipleEnzymatic Assays. Analytical Chemistry 71, 4669–4678
50. Unger, M. A., Chou, H. P., Thorsen, T., Scherer, A., Quake, S. R. (2000) Mono-lithic microfabricated valves and pumps by multilayer soft lithography. Science288, 113–116
51. Peters, E. C., Svec, F., Frechet, J. M. J. (1999) Rigid Macroporous PolymerMonoliths. Advanced Materials 11, 1169–1181
52. Beebe, D. J., Moore, J. S., Bauer, J. M., Yu, Q., Liu, R. H., Devadoss, C., Jo,B. H. (2000) Functional hydrogel structures for autonomous flow control insidemicrofluidic channels. Nature 404, 588–590
53. Liu, Y., Rauch, C., Stevens, R., Lenigk, R., Yang, J., Rhine, D., Grodzinski,P. (2002) DNA Amplification and Hybridization Assays in Integrated PlasticMonolithic Devices. Analytical Chemistry 74, 3063–3070
54. Chiou, J., Matsudaira, P., Sonin, A., Ehrlich, D. (2001) A closed–cycle capillarypolymerase chain reaction machine. Anal Chem 73, 2018–2021
8
Labels and Detection Methods
James J. Storhoff, Sudhakar S. Marla, Viswanadham Garimella, andChad A. Mirkin
8.1 Introduction
The sequencing of the human genome [1,2] along with other organisms is fu-elling the development of new tools for the highly parallel analysis of genomicinformation. Microarray technology has emerged as a robust methodology forquantitatively analyzing a large number of nucleic acid sequences in parallel,as shown in Fig. 8.1 [3,4]. High density oligonucleotide [5] or cDNA microar-rays have been utilized for measuring the abundance of mRNA transcripts,which is typically referred to as gene expression analysis [6, 7]. Differentialgene expression analysis is used to determine which genes are up-regulatedor down-regulated during specific cellular processes or in response to environ-mental stimuli [8]. Cellular responses triggered during specific disease states,or by exposure to drugs, toxins, or other molecules of interest have been stud-ied [9, 10]. Such arrays are currently being developed for diagnosis of specificdiseases such as cancer [11] as well as for identifying novel mechanisms of drugaction [10]. In addition, microarrays have found applications in identifyingsingle nucleotide polymorphisms (SNPs) or other genetic variations [7,12–15].The detection of SNPs associated with genetic disorders has led to the devel-opment of diagnostic microarrays for diseases such as cystic fibrosis [16]. Forpharmacogenomic applications, SNP arrays are used to identify key mutationsin genes that encode for enzymes responsible for drug metabolism [17].
The major factors that have limited the utility of microarrays in the re-search and diagnostic applications described above are the amount of targetneeded, detection specificity, as well as cost and reliability of detection equip-ment and assays. A critical determinant of these parameters is the labellingand detection methodology. While the current gold standard is fluorescencetechnology, the emphasis on higher sensitivity, specificity, and cost-effectivedetection instrumentation has spurred the development of a number of new la-belling and detection methodologies. Recent reports have demonstrated thatfluorophore-labelled dendrimers, up-converting phosphor reporters, electro-chemical detection techniques and semiconductor or metal nanoparticle labels
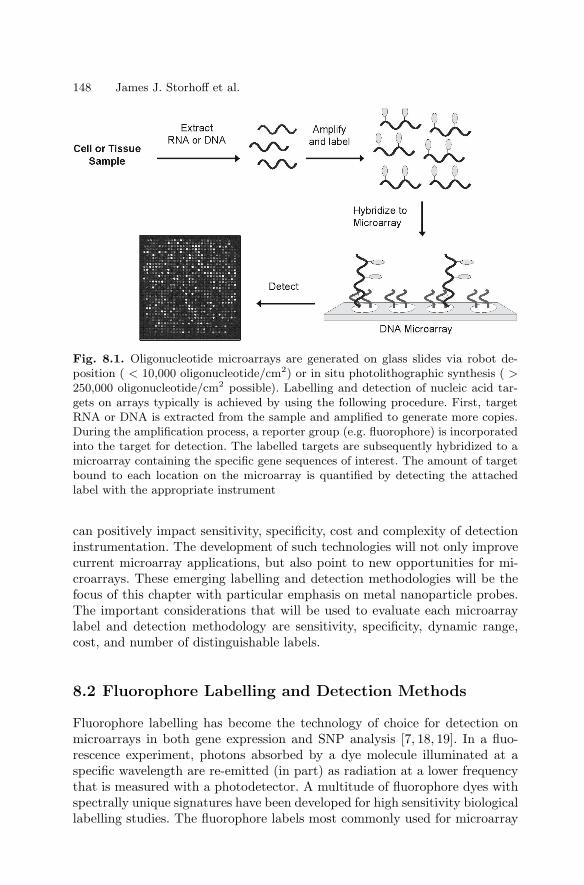
148 James J. Storhoff et al.
Fig. 8.1. Oligonucleotide microarrays are generated on glass slides via robot de-position ( < 10,000 oligonucleotide/cm2) or in situ photolithographic synthesis ( >250,000 oligonucleotide/cm2 possible). Labelling and detection of nucleic acid tar-gets on arrays typically is achieved by using the following procedure. First, targetRNA or DNA is extracted from the sample and amplified to generate more copies.During the amplification process, a reporter group (e.g. fluorophore) is incorporatedinto the target for detection. The labelled targets are subsequently hybridized to amicroarray containing the specific gene sequences of interest. The amount of targetbound to each location on the microarray is quantified by detecting the attachedlabel with the appropriate instrument
can positively impact sensitivity, specificity, cost and complexity of detectioninstrumentation. The development of such technologies will not only improvecurrent microarray applications, but also point to new opportunities for mi-croarrays. These emerging labelling and detection methodologies will be thefocus of this chapter with particular emphasis on metal nanoparticle probes.The important considerations that will be used to evaluate each microarraylabel and detection methodology are sensitivity, specificity, dynamic range,cost, and number of distinguishable labels.
8.2 Fluorophore Labelling and Detection Methods
Fluorophore labelling has become the technology of choice for detection onmicroarrays in both gene expression and SNP analysis [7, 18, 19]. In a fluo-rescence experiment, photons absorbed by a dye molecule illuminated at aspecific wavelength are re-emitted (in part) as radiation at a lower frequencythat is measured with a photodetector. A multitude of fluorophore dyes withspectrally unique signatures have been developed for high sensitivity biologicallabelling studies. The fluorophore labels most commonly used for microarray
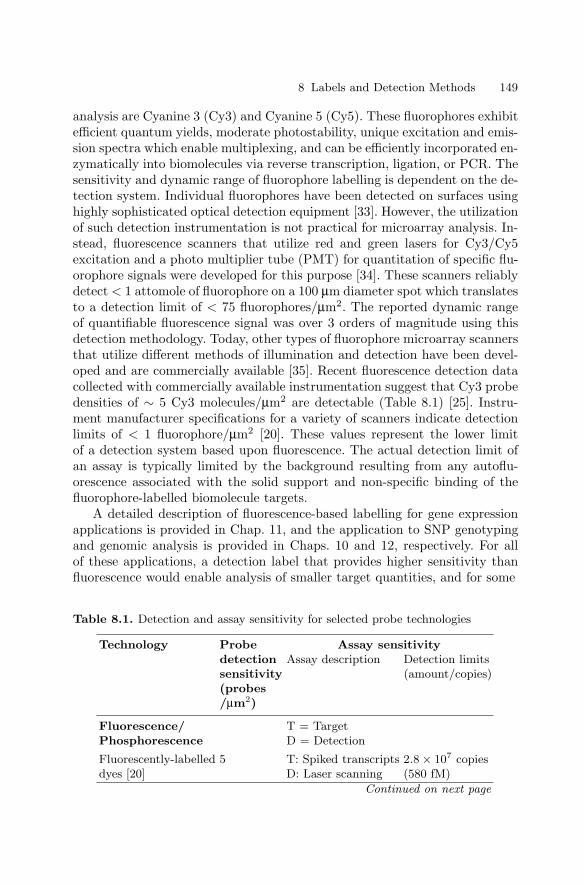
8 Labels and Detection Methods 149
analysis are Cyanine 3 (Cy3) and Cyanine 5 (Cy5). These fluorophores exhibitefficient quantum yields, moderate photostability, unique excitation and emis-sion spectra which enable multiplexing, and can be efficiently incorporated en-zymatically into biomolecules via reverse transcription, ligation, or PCR. Thesensitivity and dynamic range of fluorophore labelling is dependent on the de-tection system. Individual fluorophores have been detected on surfaces usinghighly sophisticated optical detection equipment [33]. However, the utilizationof such detection instrumentation is not practical for microarray analysis. In-stead, fluorescence scanners that utilize red and green lasers for Cy3/Cy5excitation and a photo multiplier tube (PMT) for quantitation of specific flu-orophore signals were developed for this purpose [34]. These scanners reliablydetect < 1 attomole of fluorophore on a 100 µm diameter spot which translatesto a detection limit of < 75 fluorophores/µm2. The reported dynamic rangeof quantifiable fluorescence signal was over 3 orders of magnitude using thisdetection methodology. Today, other types of fluorophore microarray scannersthat utilize different methods of illumination and detection have been devel-oped and are commercially available [35]. Recent fluorescence detection datacollected with commercially available instrumentation suggest that Cy3 probedensities of ∼ 5 Cy3 molecules/µm2 are detectable (Table 8.1) [25]. Instru-ment manufacturer specifications for a variety of scanners indicate detectionlimits of < 1 fluorophore/µm2 [20]. These values represent the lower limitof a detection system based upon fluorescence. The actual detection limit ofan assay is typically limited by the background resulting from any autoflu-orescence associated with the solid support and non-specific binding of thefluorophore-labelled biomolecule targets.
A detailed description of fluorescence-based labelling for gene expressionapplications is provided in Chap. 11, and the application to SNP genotypingand genomic analysis is provided in Chaps. 10 and 12, respectively. For allof these applications, a detection label that provides higher sensitivity thanfluorescence would enable analysis of smaller target quantities, and for some
Table 8.1. Detection and assay sensitivity for selected probe technologies
Technology Probe Assay sensitivitydetection Assay description Detection limitssensitivity (amount/copies)(probes/µm2)
Fluorescence/ T = TargetPhosphorescence D = Detection
Fluorescently-labelled 5 T: Spiked transcripts 2.8 × 10⁷ copiesdyes [20] D: Laser scanning (580 fM)
Continued on next page
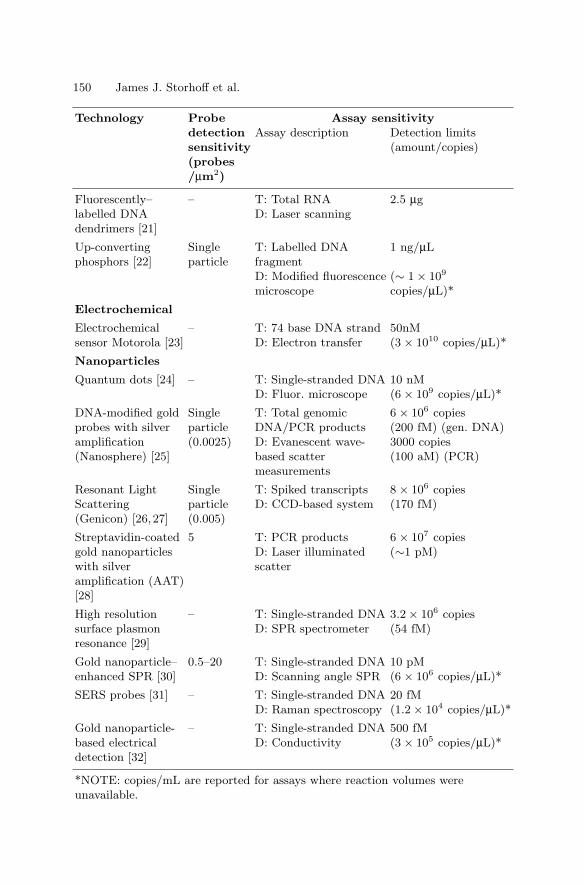
150 James J. Storhoff et al.
Technology Probe Assay sensitivitydetection Assay description Detection limitssensitivity (amount/copies)(probes/µm2)
Fluorescently– – T: Total RNA 2.5 µglabelled DNA D: Laser scanningdendrimers [21]
Up-converting Single T: Labelled DNA 1 ng/µLphosphors [22] particle fragment
D: Modified fluorescence (∼ 1 × 10⁹
microscope copies/µL)*
Electrochemical
Electrochemical – T: 74 base DNA strand 50nMsensor Motorola [23] D: Electron transfer (3 × 10¹⁰ copies/µL)*
Nanoparticles
Quantum dots [24] – T: Single-stranded DNA 10 nMD: Fluor. microscope (6 × 10⁹ copies/µL)*
DNA-modified gold Single T: Total genomic 6 × 10⁶ copiesprobes with silver particle DNA/PCR products (200 fM) (gen. DNA)amplification (0.0025) D: Evanescent wave- 3000 copies(Nanosphere) [25] based scatter (100 aM) (PCR)
measurements
Resonant Light Single T: Spiked transcripts 8 × 10⁶ copiesScattering particle D: CCD-based system (170 fM)(Genicon) [26,27] (0.005)
Streptavidin-coated 5 T: PCR products 6 × 10⁷ copiesgold nanoparticles D: Laser illuminated (∼1 pM)with silver scatteramplification (AAT)[28]
High resolution – T: Single-stranded DNA 3.2 × 10⁶ copiessurface plasmon D: SPR spectrometer (54 fM)resonance [29]
Gold nanoparticle– 0.5–20 T: Single-stranded DNA 10 pMenhanced SPR [30] D: Scanning angle SPR (6 × 10⁶ copies/µL)*
SERS probes [31] – T: Single-stranded DNA 20 fMD: Raman spectroscopy (1.2 × 10⁴ copies/µL)*
Gold nanoparticle- – T: Single-stranded DNA 500 fMbased electrical D: Conductivity (3 × 10⁵ copies/µL)*detection [32]
*NOTE: copies/mL are reported for assays where reaction volumes wereunavailable.
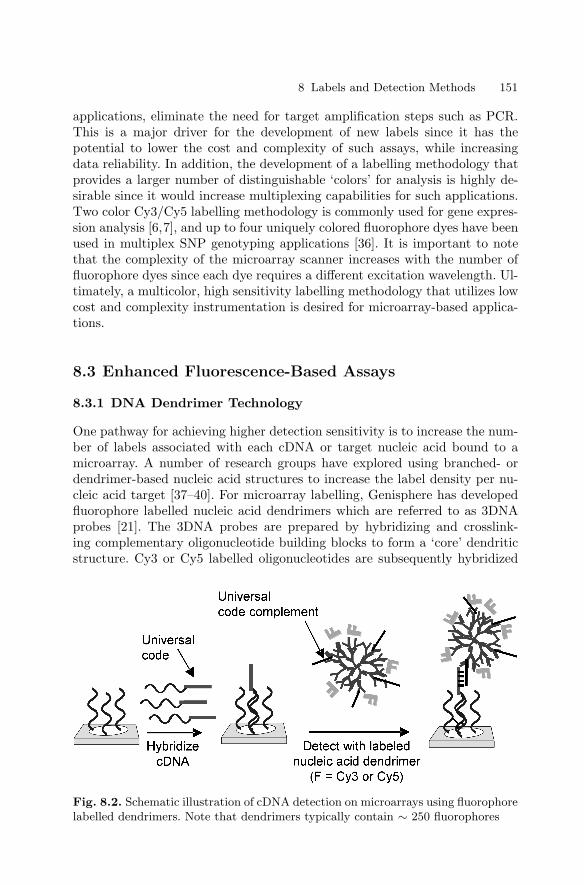
8 Labels and Detection Methods 151
applications, eliminate the need for target amplification steps such as PCR.This is a major driver for the development of new labels since it has thepotential to lower the cost and complexity of such assays, while increasingdata reliability. In addition, the development of a labelling methodology thatprovides a larger number of distinguishable ‘colors’ for analysis is highly de-sirable since it would increase multiplexing capabilities for such applications.Two color Cy3/Cy5 labelling methodology is commonly used for gene expres-sion analysis [6,7], and up to four uniquely colored fluorophore dyes have beenused in multiplex SNP genotyping applications [36]. It is important to notethat the complexity of the microarray scanner increases with the number offluorophore dyes since each dye requires a different excitation wavelength. Ul-timately, a multicolor, high sensitivity labelling methodology that utilizes lowcost and complexity instrumentation is desired for microarray-based applica-tions.
8.3 Enhanced Fluorescence-Based Assays
8.3.1 DNA Dendrimer Technology
One pathway for achieving higher detection sensitivity is to increase the num-ber of labels associated with each cDNA or target nucleic acid bound to amicroarray. A number of research groups have explored using branched- ordendrimer-based nucleic acid structures to increase the label density per nu-cleic acid target [37–40]. For microarray labelling, Genisphere has developedfluorophore labelled nucleic acid dendrimers which are referred to as 3DNAprobes [21]. The 3DNA probes are prepared by hybridizing and crosslink-ing complementary oligonucleotide building blocks to form a ‘core’ dendriticstructure. Cy3 or Cy5 labelled oligonucleotides are subsequently hybridized
Fig. 8.2. Schematic illustration of cDNA detection on microarrays using fluorophorelabelled dendrimers. Note that dendrimers typically contain ∼ 250 fluorophores
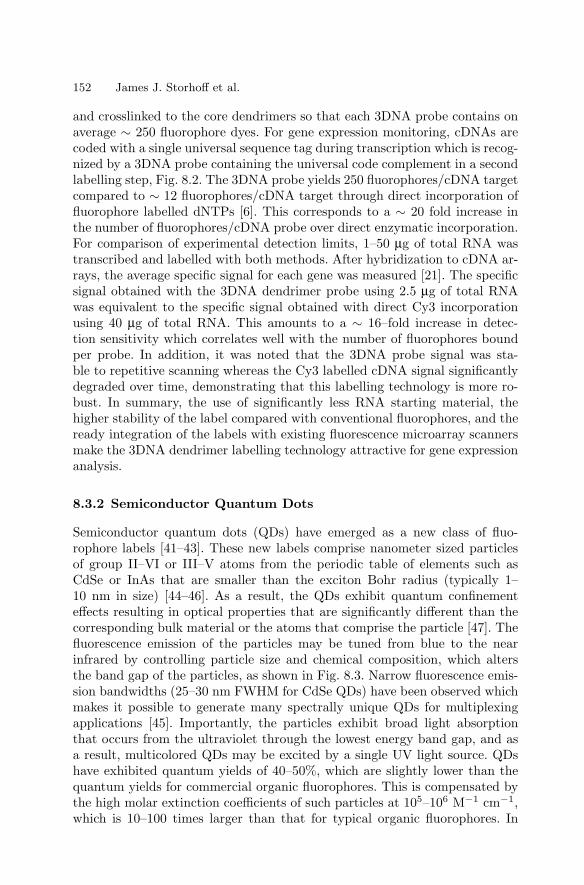
152 James J. Storhoff et al.
and crosslinked to the core dendrimers so that each 3DNA probe contains onaverage ∼ 250 fluorophore dyes. For gene expression monitoring, cDNAs arecoded with a single universal sequence tag during transcription which is recog-nized by a 3DNA probe containing the universal code complement in a secondlabelling step, Fig. 8.2. The 3DNA probe yields 250 fluorophores/cDNA targetcompared to ∼ 12 fluorophores/cDNA target through direct incorporation offluorophore labelled dNTPs [6]. This corresponds to a ∼ 20 fold increase inthe number of fluorophores/cDNA probe over direct enzymatic incorporation.For comparison of experimental detection limits, 1–50 µg of total RNA wastranscribed and labelled with both methods. After hybridization to cDNA ar-rays, the average specific signal for each gene was measured [21]. The specificsignal obtained with the 3DNA dendrimer probe using 2.5 µg of total RNAwas equivalent to the specific signal obtained with direct Cy3 incorporationusing 40 µg of total RNA. This amounts to a ∼ 16–fold increase in detec-tion sensitivity which correlates well with the number of fluorophores boundper probe. In addition, it was noted that the 3DNA probe signal was sta-ble to repetitive scanning whereas the Cy3 labelled cDNA signal significantlydegraded over time, demonstrating that this labelling technology is more ro-bust. In summary, the use of significantly less RNA starting material, thehigher stability of the label compared with conventional fluorophores, and theready integration of the labels with existing fluorescence microarray scannersmake the 3DNA dendrimer labelling technology attractive for gene expressionanalysis.
8.3.2 Semiconductor Quantum Dots
Semiconductor quantum dots (QDs) have emerged as a new class of fluo-rophore labels [41–43]. These new labels comprise nanometer sized particlesof group II–VI or III–V atoms from the periodic table of elements such asCdSe or InAs that are smaller than the exciton Bohr radius (typically 1–10 nm in size) [44–46]. As a result, the QDs exhibit quantum confinementeffects resulting in optical properties that are significantly different than thecorresponding bulk material or the atoms that comprise the particle [47]. Thefluorescence emission of the particles may be tuned from blue to the nearinfrared by controlling particle size and chemical composition, which altersthe band gap of the particles, as shown in Fig. 8.3. Narrow fluorescence emis-sion bandwidths (25–30 nm FWHM for CdSe QDs) have been observed whichmakes it possible to generate many spectrally unique QDs for multiplexingapplications [45]. Importantly, the particles exhibit broad light absorptionthat occurs from the ultraviolet through the lowest energy band gap, and asa result, multicolored QDs may be excited by a single UV light source. QDshave exhibited quantum yields of 40–50%, which are slightly lower than thequantum yields for commercial organic fluorophores. This is compensated bythe high molar extinction coefficients of such particles at 105–106 M−1 cm−1,which is 10–100 times larger than that for typical organic fluorophores. In
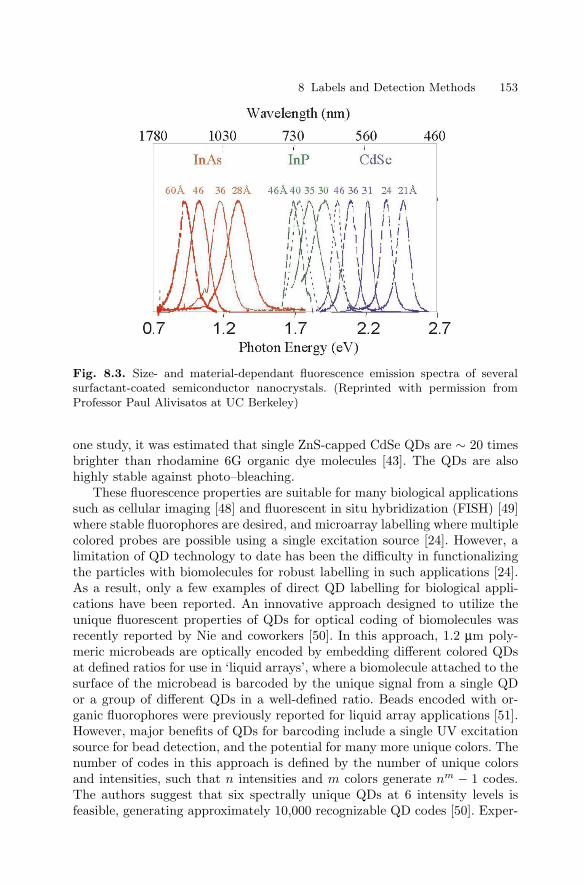
8 Labels and Detection Methods 153
Fig. 8.3. Size- and material-dependant fluorescence emission spectra of severalsurfactant-coated semiconductor nanocrystals. (Reprinted with permission fromProfessor Paul Alivisatos at UC Berkeley)
one study, it was estimated that single ZnS-capped CdSe QDs are ∼ 20 timesbrighter than rhodamine 6G organic dye molecules [43]. The QDs are alsohighly stable against photo–bleaching.
These fluorescence properties are suitable for many biological applicationssuch as cellular imaging [48] and fluorescent in situ hybridization (FISH) [49]where stable fluorophores are desired, and microarray labelling where multiplecolored probes are possible using a single excitation source [24]. However, alimitation of QD technology to date has been the difficulty in functionalizingthe particles with biomolecules for robust labelling in such applications [24].As a result, only a few examples of direct QD labelling for biological appli-cations have been reported. An innovative approach designed to utilize theunique fluorescent properties of QDs for optical coding of biomolecules wasrecently reported by Nie and coworkers [50]. In this approach, 1.2 µm poly-meric microbeads are optically encoded by embedding different colored QDsat defined ratios for use in ‘liquid arrays’, where a biomolecule attached to thesurface of the microbead is barcoded by the unique signal from a single QDor a group of different QDs in a well-defined ratio. Beads encoded with or-ganic fluorophores were previously reported for liquid array applications [51].However, major benefits of QDs for barcoding include a single UV excitationsource for bead detection, and the potential for many more unique colors. Thenumber of codes in this approach is defined by the number of unique colorsand intensities, such that n intensities and m colors generate nm − 1 codes.The authors suggest that six spectrally unique QDs at 6 intensity levels isfeasible, generating approximately 10,000 recognizable QD codes [50]. Exper-
154 James J. Storhoff et al.
imentally, polymeric beads were loaded with differing amounts of a single colorQD, and the fluorescence intensity was quantified from individual beads us-ing wavelength resolved fluorescence spectroscopy. Using a single color bead,the fluorescence intensity scales linearly with the number of QDs/bead fromloadings of 640 to ∼ 50,000 QDs/bead, with 10 distinct intensity levels at3 standard deviations. In a model system, three DNA labelled beads withunique QD barcodes were used to detect complementary DNA sequences in amultiplex detection assay. The fluorescence intensities from each bead and thefluorophore labelled target were measured using single bead spectroscopy. Ina more recent report, 5 SNPs were simultaneously genotyped from a single so-lution using QD encoded microbeads in conjunction with flow cytometry [52].
Alivisatos and coworkers have demonstrated that direct QD labelling forconventional microarray based applications is feasible [24]. Four separate goldsubstrates were derivatized with four unique DNA sequences for study, alongwith four spectrally unique QDs, each derivatized with the complement of oneof the surface bound targets. In these studies, an argon ion laser was used forexcitation, and the fluorescence emission was captured with a CCD camerathrough a 60× objective. Sequence specific hybridization of each color QD wasdemonstrated by exposing each substrate to a mixture of the four QDs, whichpredominantly resulted in hybridization of only the perfectly complementaryQD. The surface density required for detectable signal was not reported, but10–100 nM concentrations of the QDs are needed to produce detectable sig-nal. The low sensitivity probably stems from poor functionalization or unop-timized assays given that the high quantum yields of QDs should yield signalintensities that are at least comparable to organic dye labels. Therefore, fur-ther work in labelling will likely significantly improve detection capabilities ofQDs for microarray applications. An additional focus area is the preparationof QDs made of more environmentally benign materials than CdSe which istoxic. The benefits of more robust and reliable multicolor detection with sim-plified instrumentation are attractive if this can be achieved. Quantum DotCorporation and others are currently marketing semiconductor quantum dotprobes for a variety of biological labelling applications.
8.4 Phosphor Reporters
Autofluorescence background on microarray substrates negatively impacts thesensitivity of fluorophore labelling. A novel approach devised to eliminate aut-ofluorescence utilizes up-converting phosphor labels that absorb two photonsof lower frequency light in the infrared region and emit a single photon at ahigher frequency in the visible region [22,53–55]. Up-converting phosphor (UP)labels typically comprise submicron-sized yttriumYoxysulfide particles (0.2–0.4 µm diameter) that are doped with lanthanide ions such as Ytterbium andErbium for excitation and emission [55]. Phosphorescence from the lanthanideions persists for > 10−8 seconds after excitation while organic fluorophores
8 Labels and Detection Methods 155
emit light for < 10−9 seconds after illumination; thus, phosphorescence isdistinguishable from autofluorescence using time resolved fluorescence spec-troscopy [56,57]. Up-converting phosphor labels with different emission colorsare generated by using the same absorber ion with different lanthanide ions foremission. For example, the Ytterbium/Erbium excitation/emission pair emitsgreen light while the Ytterbium/Thulium pair emits blue light. UP materialsalso are characterized by narrow emission bandwidths (25–50 nm), which hasenabled the development of over six spectrally unique emission colors [22].Additionally, infrared excitation is advantageous for microarrays since otherassay components (e.g. substrates) do not absorb infrared light resulting inlower overall background. A detection limit of ∼ 12 UP particles in a 30–40 mm2 well was achieved using infrared laser excitation and detection witha photomultiplier tube [22]. Therefore, the theoretical detection limit of a fewUP labels per microarray spot is orders of magnitude better than molecularCy3 fluorophores with detection limits of ∼ 1–5 fluors/µm2 (Table 8.1).
In an actual microarray labelling experiment, the specific and non-specificbinding properties of the UP particles to the array surface and kinetics ofbinding play a role in determining assay sensitivity. In a recent study con-ducted by Tanke and coworkers, arrays containing a serial dilution of humanelongation factor (HEF) probes (∼ 1000 base–pair) were hybridized to a bi-otin labelled (HEF) target, followed by staining with Cy5-labelled avidin, andsubsequent labelling with an UP particle for comparison [22] (Fig. 8.4). Thelimit of detection (LOD) for Cy5 was ∼ 4 ng/µL using a laser-based microar-ray scanner, while the LOD of the UP labels was ∼ 1 ng/µL recorded with afluorescence microscope modified for infrared excitation. Therefore, the assaysensitivity was increased 4–fold when compared to conventional fluorescencedetection. The phosphor luminescence was found to correlate linearly withprobe and target concentration over a concentration range of ∼ 3 orders ofmagnitude, which was comparable to Cy5 labelling.
Phosphor technology offers a greater number of ‘colors’ for labelling (cur-rently 6) than fluorescence with single source infrared excitation [22]. Formicroarrays, this translates to a greater potential for multiplexing with sim-plified and lower cost detection instrumentation. Despite the sensitive UPprobe detection capabilities, the assay sensitivity is currently in the samerange as molecular fluorophore probes. This is likely due to the large parti-cle size, which results in poor diffusion, steric hindrance, and large van derWaals forces between surface and substrate. The use of smaller particles andimproved conjugation methods offers a potential route to higher sensitivitydetection. More recently, glass microbarcodes with lanthanide ion emitterswere reported for multiplexed DNA detection assays [58]. The combinationof single source excitation and multiple colors is also extremely attractive forbarcoding applications.
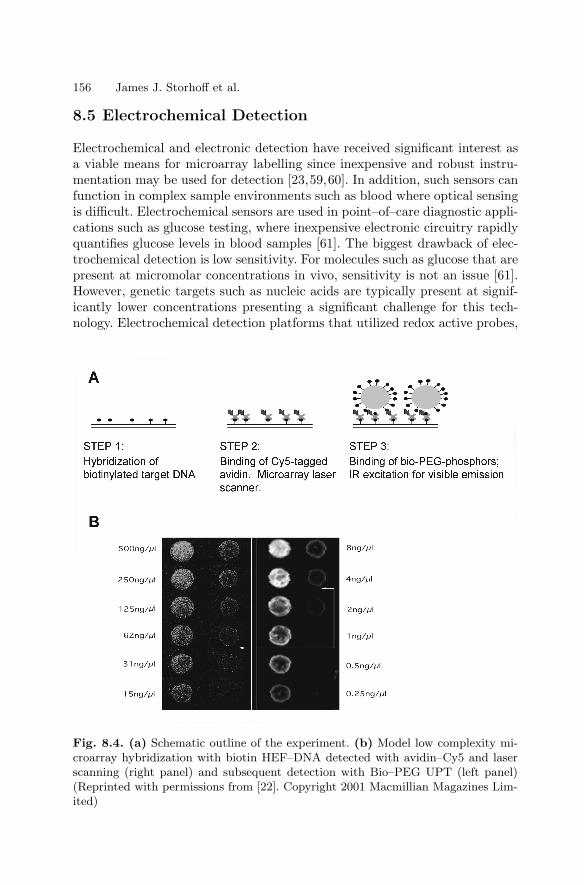
156 James J. Storhoff et al.
8.5 Electrochemical Detection
Electrochemical and electronic detection have received significant interest asa viable means for microarray labelling since inexpensive and robust instru-mentation may be used for detection [23,59,60]. In addition, such sensors canfunction in complex sample environments such as blood where optical sensingis difficult. Electrochemical sensors are used in point–of–care diagnostic appli-cations such as glucose testing, where inexpensive electronic circuitry rapidlyquantifies glucose levels in blood samples [61]. The biggest drawback of elec-trochemical detection is low sensitivity. For molecules such as glucose that arepresent at micromolar concentrations in vivo, sensitivity is not an issue [61].However, genetic targets such as nucleic acids are typically present at signif-icantly lower concentrations presenting a significant challenge for this tech-nology. Electrochemical detection platforms that utilized redox active probes,
Fig. 8.4. (a) Schematic outline of the experiment. (b) Model low complexity mi-croarray hybridization with biotin HEF–DNA detected with avidin–Cy5 and laserscanning (right panel) and subsequent detection with Bio–PEG UPT (left panel)(Reprinted with permissions from [22]. Copyright 2001 Macmillian Magazines Lim-ited)
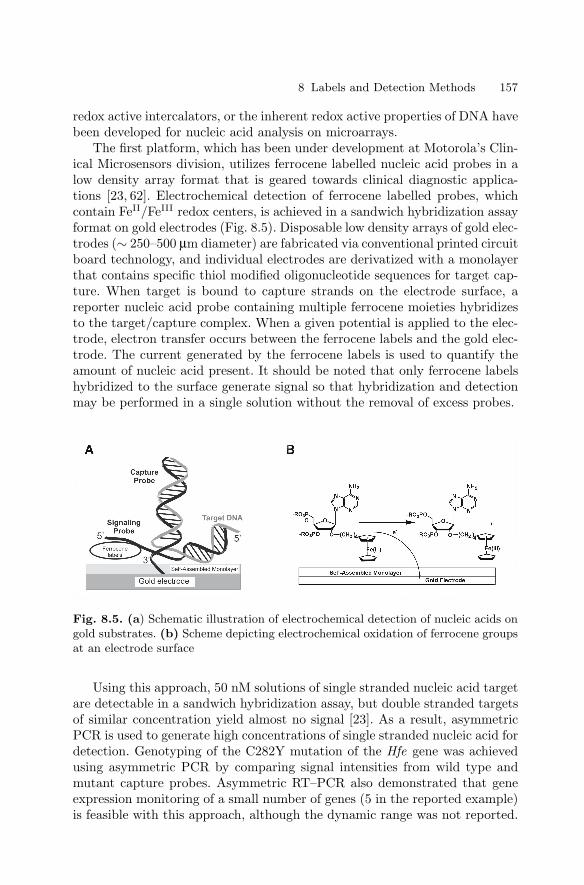
8 Labels and Detection Methods 157
redox active intercalators, or the inherent redox active properties of DNA havebeen developed for nucleic acid analysis on microarrays.
The first platform, which has been under development at Motorola’s Clin-ical Microsensors division, utilizes ferrocene labelled nucleic acid probes in alow density array format that is geared towards clinical diagnostic applica-tions [23, 62]. Electrochemical detection of ferrocene labelled probes, whichcontain FeII/FeIII redox centers, is achieved in a sandwich hybridization assayformat on gold electrodes (Fig. 8.5). Disposable low density arrays of gold elec-trodes (∼ 250–500 µm diameter) are fabricated via conventional printed circuitboard technology, and individual electrodes are derivatized with a monolayerthat contains specific thiol modified oligonucleotide sequences for target cap-ture. When target is bound to capture strands on the electrode surface, areporter nucleic acid probe containing multiple ferrocene moieties hybridizesto the target/capture complex. When a given potential is applied to the elec-trode, electron transfer occurs between the ferrocene labels and the gold elec-trode. The current generated by the ferrocene labels is used to quantify theamount of nucleic acid present. It should be noted that only ferrocene labelshybridized to the surface generate signal so that hybridization and detectionmay be performed in a single solution without the removal of excess probes.
Fig. 8.5. (a) Schematic illustration of electrochemical detection of nucleic acids ongold substrates. (b) Scheme depicting electrochemical oxidation of ferrocene groupsat an electrode surface
Using this approach, 50 nM solutions of single stranded nucleic acid targetare detectable in a sandwich hybridization assay, but double stranded targetsof similar concentration yield almost no signal [23]. As a result, asymmetricPCR is used to generate high concentrations of single stranded nucleic acid fordetection. Genotyping of the C282Y mutation of the Hfe gene was achievedusing asymmetric PCR by comparing signal intensities from wild type andmutant capture probes. Asymmetric RT–PCR also demonstrated that geneexpression monitoring of a small number of genes (5 in the reported example)is feasible with this approach, although the dynamic range was not reported.
158 James J. Storhoff et al.
The most important attributes of this detection approach are the simpleand in-expensive electronic detection system and electrode chips, and theintegration of hybridization and detection into a single step. Additionally,multiple reporter groups have been developed by tuning the redox potentialof the ferrocene moiety. A disadvantage of this approach is the relativelylow sensitivity compared to fluorescence detection and the inability to detectdouble stranded DNA targets (Table 8.1).
The second electrochemical detection platform utilizes the electron trans-fer properties of nucleic acids for detection, eliminating the need for nucleicacid probes labelled with redox active groups [59, 60]. Thorp and coworkersdeveloped a label free electrochemical detection strategy that utilizes me-diated electron transfer from guanine in target nucleic acids bound to anelectrode [60]. The amount of peak current correlates with the number ofguanine residues in the target. Detection limits of ∼ 26 molecules/µm2 werereported for a 1497 bp PCR amplicon deposited directly onto an IndiumTin Oxide (ITO) electrode [63]. In a proof–of–concept study for gene expres-sion, RT–PCR amplified RAK gene products from six breast tissue sampleswere quantified via fluorescence and then measured via electrochemical detec-tion [64]. Overexpression in the breast cancer samples was correctly identifiedby measuring the peak current associated with each PCR amplicon on indi-vidual ITO electrodes. ITO microelectrode arrays with gene specific capturesequences have been applied to low density gene expression applications [65].The benefits are label-free detection in addition to the inexpensive detectionhardware, but low detection sensitivity is still a disadvantage when comparedto fluorophore labelling.
Alternatively, Barton and coworkers have utilized redox active interca-lators to signal the presence of specific nucleic acid sequences [59, 66]. Theapproach uses an electrocatalytic signal amplification strategy involving theintercalators coupled to [Fe(CN)6]3−. This technique has been used success-fully in SNP discrimination by measuring the electrochemical signal at theelectrodes containing matched and mismatched probes. The electrochemicalresponse from the mismatched hybrids is diminished owing to the disruptedelectron transfer between the electrode and the intercalator, allowing the iden-tification of the perfectly matched hybrid. In addition, electrocatalytic signalamplification strategies offer the potential to improve detection sensitivity bygenerating more electrochemical signal per target. GeneOhm Sciences, Inc. iscurrently developing this technology for SNP analysis.
8 Labels and Detection Methods 159
8.6 Metal Nanoparticle Labels and Metal Thin Filmsfor Microarrays
8.6.1 Introduction to Metal NanoparticleBased Detection Methodologies
Gold nanoparticles have been utilized as labels for cellular imaging [67] aswell as detection of proteins [68, 69] and nucleic acids [70], but it was notuntil recently that nanoparticle labelling was applied to biomolecule detec-tion on microarrays [71]. Recent interest in metal nanoparticles as labels hasbeen fuelled by the development of reliable preparation methods [72] and ro-bust functionalization techniques with nucleic acids or proteins [69,73]. Metalnanoparticles exhibit unique optical, catalytic, and electronic properties owingto their size, and therefore, can be used in a variety of detection schemes basedon different modes of signal transduction. An explosion of research in this areahas led to a number of different approaches that may be utilized for detect-ing such particles in both optical and electrical detection formats. Reporteddetection formats include colorimetric changes [73,74], silver enhanced imag-ing [28, 71], surface plasmon resonance imaging [30, 75], light scatter [76, 77],surface enhanced Raman spectroscopy [31], photo–thermal imaging [78], elec-trical detection [32], and scanning electrochemical microscopy [79].
The preparation and properties of colloidal gold particles were studied inthe early 1800s by Faraday [80]. Reproducible methods have now been de-veloped for preparing highly monodisperse 1–100 nm diameter gold particleswhich are available through commercial sources. Although gold is the easiestmetal to prepare in nanoparticle form, the synthesis of other metal particlessuch as silver have now been realized. The method used for functionalizingthe nanoparticles with biomolecules for detection is critical, as it dictates thebinding properties of the resulting label, as well as the application of thelabels for detection. Both direct and indirect nanoparticle labelling strate-gies have been developed for nucleic acid detection on microarrays (Fig. 8.6).For indirect nucleic acid labelling, metal nanoparticles are functionalized withantibodies such as antibiotin or streptavidin which passively adsorb to the sur-face (Fig. 8.6a). For detection, haptens are incorporated into the nucleic acidtarget and bound to the microarray, followed by labelling with the complemen-tary antibody-labelled gold nanoparticle in a separate step. The advantage ofthis method is that a single particle may be used for detection of all nucleicacid sequences. Disadvantages include compromised sensitivity due to passiveadsorption, and the requirement of incorporating a label into the target se-quence of interest. Direct nanoparticle probe labelling was pioneered by Mirkinand coworkers [73]. In this approach, oligonucleotides are covalently anchoredto the nanoparticle surface using thiol linkers (Fig. 8.6b). For detection, theDNA-modified gold nanoparticle probes are hybridized to nucleic acid targetsin a sandwich assay format. The probes exhibit high stability toward thermalfluctuations as well as elevated concentrations of salt [73] and are typically
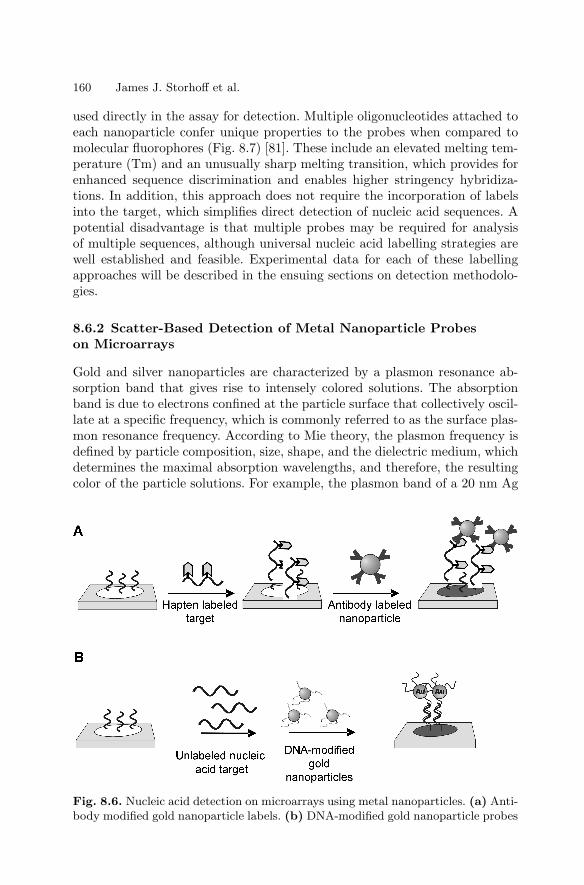
160 James J. Storhoff et al.
used directly in the assay for detection. Multiple oligonucleotides attached toeach nanoparticle confer unique properties to the probes when compared tomolecular fluorophores (Fig. 8.7) [81]. These include an elevated melting tem-perature (Tm) and an unusually sharp melting transition, which provides forenhanced sequence discrimination and enables higher stringency hybridiza-tions. In addition, this approach does not require the incorporation of labelsinto the target, which simplifies direct detection of nucleic acid sequences. Apotential disadvantage is that multiple probes may be required for analysisof multiple sequences, although universal nucleic acid labelling strategies arewell established and feasible. Experimental data for each of these labellingapproaches will be described in the ensuing sections on detection methodolo-gies.
8.6.2 Scatter-Based Detection of Metal Nanoparticle Probeson Microarrays
Gold and silver nanoparticles are characterized by a plasmon resonance ab-sorption band that gives rise to intensely colored solutions. The absorptionband is due to electrons confined at the particle surface that collectively oscil-late at a specific frequency, which is commonly referred to as the surface plas-mon resonance frequency. According to Mie theory, the plasmon frequency isdefined by particle composition, size, shape, and the dielectric medium, whichdetermines the maximal absorption wavelengths, and therefore, the resultingcolor of the particle solutions. For example, the plasmon band of a 20 nm Ag
Fig. 8.6. Nucleic acid detection on microarrays using metal nanoparticles. (a) Anti-body modified gold nanoparticle labels. (b) DNA-modified gold nanoparticle probes
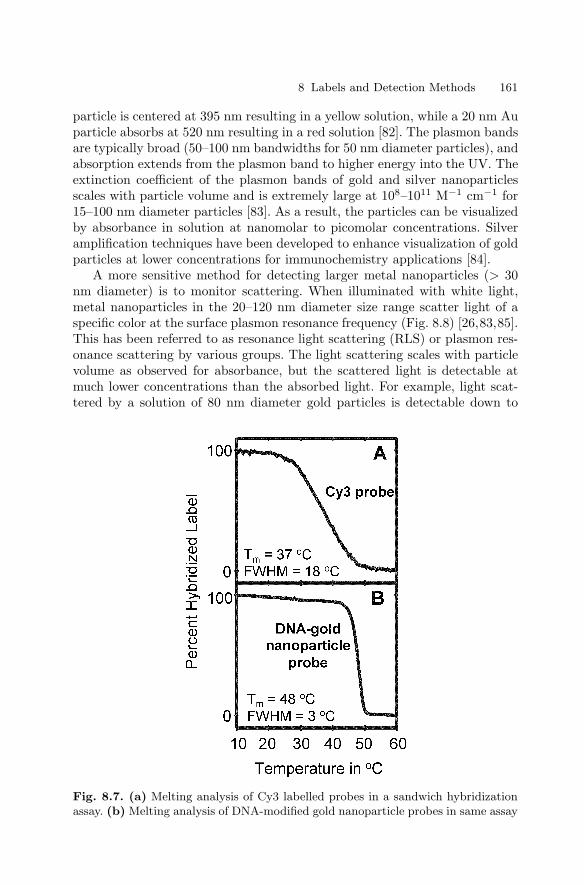
8 Labels and Detection Methods 161
particle is centered at 395 nm resulting in a yellow solution, while a 20 nm Auparticle absorbs at 520 nm resulting in a red solution [82]. The plasmon bandsare typically broad (50–100 nm bandwidths for 50 nm diameter particles), andabsorption extends from the plasmon band to higher energy into the UV. Theextinction coefficient of the plasmon bands of gold and silver nanoparticlesscales with particle volume and is extremely large at 108–1011 M−1 cm−1 for15–100 nm diameter particles [83]. As a result, the particles can be visualizedby absorbance in solution at nanomolar to picomolar concentrations. Silveramplification techniques have been developed to enhance visualization of goldparticles at lower concentrations for immunochemistry applications [84].
A more sensitive method for detecting larger metal nanoparticles (> 30nm diameter) is to monitor scattering. When illuminated with white light,metal nanoparticles in the 20–120 nm diameter size range scatter light of aspecific color at the surface plasmon resonance frequency (Fig. 8.8) [26,83,85].This has been referred to as resonance light scattering (RLS) or plasmon res-onance scattering by various groups. The light scattering scales with particlevolume as observed for absorbance, but the scattered light is detectable atmuch lower concentrations than the absorbed light. For example, light scat-tered by a solution of 80 nm diameter gold particles is detectable down to
Fig. 8.7. (a) Melting analysis of Cy3 labelled probes in a sandwich hybridizationassay. (b) Melting analysis of DNA-modified gold nanoparticle probes in same assay
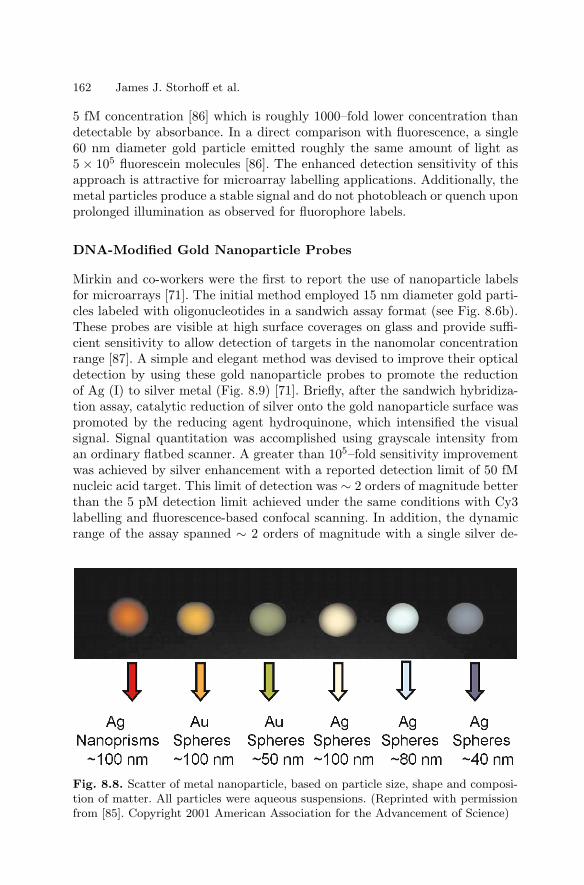
162 James J. Storhoff et al.
5 fM concentration [86] which is roughly 1000–fold lower concentration thandetectable by absorbance. In a direct comparison with fluorescence, a single60 nm diameter gold particle emitted roughly the same amount of light as5 × 105 fluorescein molecules [86]. The enhanced detection sensitivity of thisapproach is attractive for microarray labelling applications. Additionally, themetal particles produce a stable signal and do not photobleach or quench uponprolonged illumination as observed for fluorophore labels.
DNA-Modified Gold Nanoparticle Probes
Mirkin and co-workers were the first to report the use of nanoparticle labelsfor microarrays [71]. The initial method employed 15 nm diameter gold parti-cles labeled with oligonucleotides in a sandwich assay format (see Fig. 8.6b).These probes are visible at high surface coverages on glass and provide suffi-cient sensitivity to allow detection of targets in the nanomolar concentrationrange [87]. A simple and elegant method was devised to improve their opticaldetection by using these gold nanoparticle probes to promote the reductionof Ag (I) to silver metal (Fig. 8.9) [71]. Briefly, after the sandwich hybridiza-tion assay, catalytic reduction of silver onto the gold nanoparticle surface waspromoted by the reducing agent hydroquinone, which intensified the visualsignal. Signal quantitation was accomplished using grayscale intensity froman ordinary flatbed scanner. A greater than 105–fold sensitivity improvementwas achieved by silver enhancement with a reported detection limit of 50 fMnucleic acid target. This limit of detection was ∼ 2 orders of magnitude betterthan the 5 pM detection limit achieved under the same conditions with Cy3labelling and fluorescence-based confocal scanning. In addition, the dynamicrange of the assay spanned ∼ 2 orders of magnitude with a single silver de-
Fig. 8.8. Scatter of metal nanoparticle, based on particle size, shape and composi-tion of matter. All particles were aqueous suspensions. (Reprinted with permissionfrom [85]. Copyright 2001 American Association for the Advancement of Science)
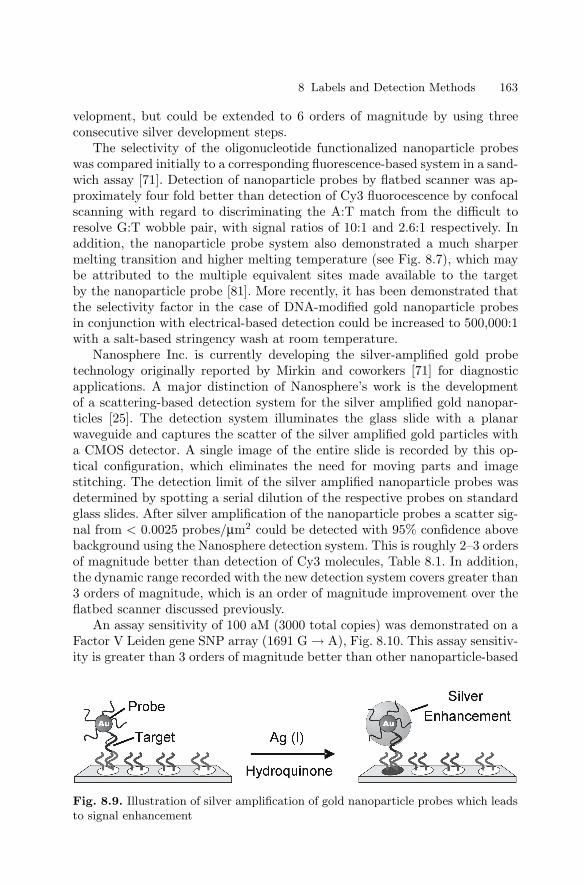
8 Labels and Detection Methods 163
velopment, but could be extended to 6 orders of magnitude by using threeconsecutive silver development steps.
The selectivity of the oligonucleotide functionalized nanoparticle probeswas compared initially to a corresponding fluorescence-based system in a sand-wich assay [71]. Detection of nanoparticle probes by flatbed scanner was ap-proximately four fold better than detection of Cy3 fluorocescence by confocalscanning with regard to discriminating the A:T match from the difficult toresolve G:T wobble pair, with signal ratios of 10:1 and 2.6:1 respectively. Inaddition, the nanoparticle probe system also demonstrated a much sharpermelting transition and higher melting temperature (see Fig. 8.7), which maybe attributed to the multiple equivalent sites made available to the targetby the nanoparticle probe [81]. More recently, it has been demonstrated thatthe selectivity factor in the case of DNA-modified gold nanoparticle probesin conjunction with electrical-based detection could be increased to 500,000:1with a salt-based stringency wash at room temperature.
Nanosphere Inc. is currently developing the silver-amplified gold probetechnology originally reported by Mirkin and coworkers [71] for diagnosticapplications. A major distinction of Nanosphere’s work is the developmentof a scattering-based detection system for the silver amplified gold nanopar-ticles [25]. The detection system illuminates the glass slide with a planarwaveguide and captures the scatter of the silver amplified gold particles witha CMOS detector. A single image of the entire slide is recorded by this op-tical configuration, which eliminates the need for moving parts and imagestitching. The detection limit of the silver amplified nanoparticle probes wasdetermined by spotting a serial dilution of the respective probes on standardglass slides. After silver amplification of the nanoparticle probes a scatter sig-nal from < 0.0025 probes/µm2 could be detected with 95% confidence abovebackground using the Nanosphere detection system. This is roughly 2–3 ordersof magnitude better than detection of Cy3 molecules, Table 8.1. In addition,the dynamic range recorded with the new detection system covers greater than3 orders of magnitude, which is an order of magnitude improvement over theflatbed scanner discussed previously.
An assay sensitivity of 100 aM (3000 total copies) was demonstrated on aFactor V Leiden gene SNP array (1691 G → A), Fig. 8.10. This assay sensitiv-ity is greater than 3 orders of magnitude better than other nanoparticle-based
Fig. 8.9. Illustration of silver amplification of gold nanoparticle probes which leadsto signal enhancement
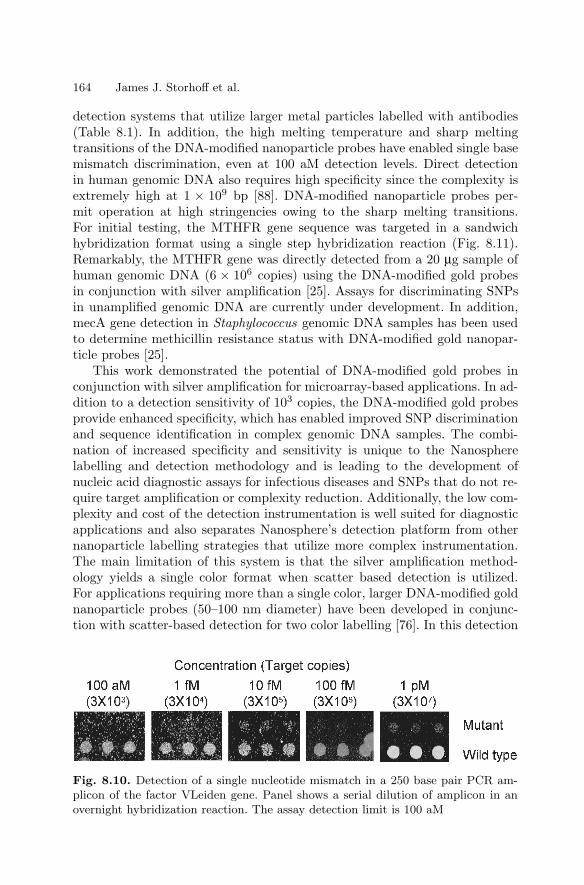
164 James J. Storhoff et al.
detection systems that utilize larger metal particles labelled with antibodies(Table 8.1). In addition, the high melting temperature and sharp meltingtransitions of the DNA-modified nanoparticle probes have enabled single basemismatch discrimination, even at 100 aM detection levels. Direct detectionin human genomic DNA also requires high specificity since the complexity isextremely high at 1 × 10⁹ bp [88]. DNA-modified nanoparticle probes per-mit operation at high stringencies owing to the sharp melting transitions.For initial testing, the MTHFR gene sequence was targeted in a sandwichhybridization format using a single step hybridization reaction (Fig. 8.11).Remarkably, the MTHFR gene was directly detected from a 20 µg sample ofhuman genomic DNA (6 × 10⁶ copies) using the DNA-modified gold probesin conjunction with silver amplification [25]. Assays for discriminating SNPsin unamplified genomic DNA are currently under development. In addition,mecA gene detection in Staphylococcus genomic DNA samples has been usedto determine methicillin resistance status with DNA-modified gold nanopar-ticle probes [25].
This work demonstrated the potential of DNA-modified gold probes inconjunction with silver amplification for microarray-based applications. In ad-dition to a detection sensitivity of 103 copies, the DNA-modified gold probesprovide enhanced specificity, which has enabled improved SNP discriminationand sequence identification in complex genomic DNA samples. The combi-nation of increased specificity and sensitivity is unique to the Nanospherelabelling and detection methodology and is leading to the development ofnucleic acid diagnostic assays for infectious diseases and SNPs that do not re-quire target amplification or complexity reduction. Additionally, the low com-plexity and cost of the detection instrumentation is well suited for diagnosticapplications and also separates Nanosphere’s detection platform from othernanoparticle labelling strategies that utilize more complex instrumentation.The main limitation of this system is that the silver amplification method-ology yields a single color format when scatter based detection is utilized.For applications requiring more than a single color, larger DNA-modified goldnanoparticle probes (50–100 nm diameter) have been developed in conjunc-tion with scatter-based detection for two color labelling [76]. In this detection
Fig. 8.10. Detection of a single nucleotide mismatch in a 250 base pair PCR am-plicon of the factor VLeiden gene. Panel shows a serial dilution of amplicon in anovernight hybridization reaction. The assay detection limit is 100 aM
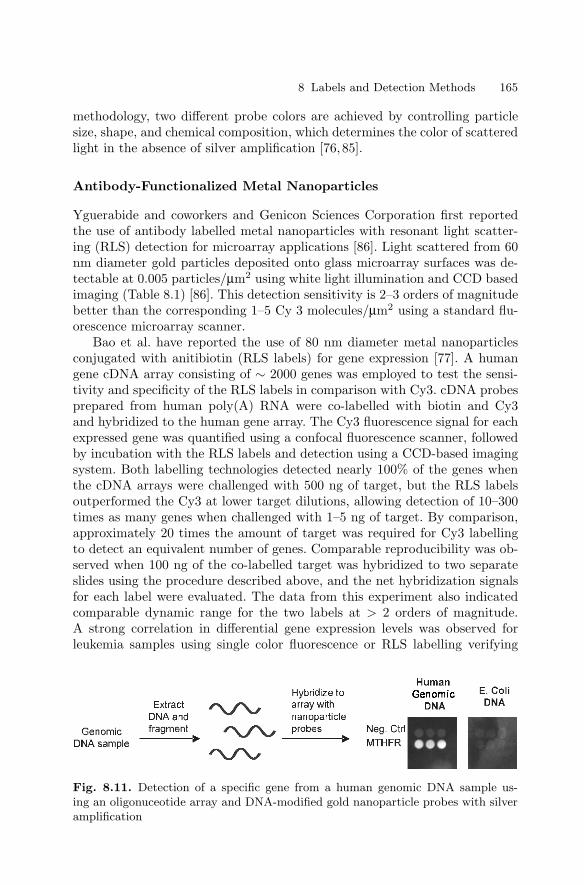
8 Labels and Detection Methods 165
methodology, two different probe colors are achieved by controlling particlesize, shape, and chemical composition, which determines the color of scatteredlight in the absence of silver amplification [76,85].
Antibody-Functionalized Metal Nanoparticles
Yguerabide and coworkers and Genicon Sciences Corporation first reportedthe use of antibody labelled metal nanoparticles with resonant light scatter-ing (RLS) detection for microarray applications [86]. Light scattered from 60nm diameter gold particles deposited onto glass microarray surfaces was de-tectable at 0.005 particles/µm2 using white light illumination and CCD basedimaging (Table 8.1) [86]. This detection sensitivity is 2–3 orders of magnitudebetter than the corresponding 1–5 Cy 3 molecules/µm2 using a standard flu-orescence microarray scanner.
Bao et al. have reported the use of 80 nm diameter metal nanoparticlesconjugated with anitibiotin (RLS labels) for gene expression [77]. A humangene cDNA array consisting of ∼ 2000 genes was employed to test the sensi-tivity and specificity of the RLS labels in comparison with Cy3. cDNA probesprepared from human poly(A) RNA were co-labelled with biotin and Cy3and hybridized to the human gene array. The Cy3 fluorescence signal for eachexpressed gene was quantified using a confocal fluorescence scanner, followedby incubation with the RLS labels and detection using a CCD-based imagingsystem. Both labelling technologies detected nearly 100% of the genes whenthe cDNA arrays were challenged with 500 ng of target, but the RLS labelsoutperformed the Cy3 at lower target dilutions, allowing detection of 10–300times as many genes when challenged with 1–5 ng of target. By comparison,approximately 20 times the amount of target was required for Cy3 labellingto detect an equivalent number of genes. Comparable reproducibility was ob-served when 100 ng of the co-labelled target was hybridized to two separateslides using the procedure described above, and the net hybridization signalsfor each label were evaluated. The data from this experiment also indicatedcomparable dynamic range for the two labels at > 2 orders of magnitude.A strong correlation in differential gene expression levels was observed forleukemia samples using single color fluorescence or RLS labelling verifying
Fig. 8.11. Detection of a specific gene from a human genomic DNA sample us-ing an oligonuceotide array and DNA-modified gold nanoparticle probes with silveramplification
166 James J. Storhoff et al.
the signal specificity. A more recent report by Genicon Sciences assessed thedynamic range and limit of detection in gene expression studies using knownamounts of specific cDNA transcripts that were spiked into complex cDNAsamples [107]. The reported lower limit of detection (LLOD) was 8.2 × 10⁶
copies (∼ 170 fM, 80 uL) with a 3.3 log dynamic range. By comparison, aCy3 label had an LLOD of 2.8 × 10⁷ copies (∼ 580 fM, 80 uL) with a 3.2 logdynamic range. It should be noted that although a single color was reportedin this study, two color nanoparticle labelling is now available using silver andgold particles [27].
In an approach similar to Genicon, Schultz and coworkers have utilizedlarge silver nanoparticles referred to as plasmon resonant particles (PRPs)and resonant scatter based detection for microarray labelling [89]. The 40–100 nm diameter silver particles are prepared by solution-based reduction ofsilver onto small gold particle seeds (∼ 5 nm diameter). The PRPs scatterlight based on the position of the surface plasmon band as observed for goldparticles [90]. In this study, 55 ± 17 nm diameter particles which exhibit max-imum scatter at ∼ 430 nm were utilized. The particles were derivatized withmouse anti-biotin antibodies for detection of biotin labelled targets, Fig. 8.6a.For detection, the slide is illuminated in dark field using a halogen lamp, anda high resolution image of each microarray spot is captured using a CCD cam-era through a 10× or 100× dark-field/bright-field objective lens on an opticalmicroscope [89]. Individual plasmon resonant particles provide a scatteringsignal that is distinguishable from other sources of scatter, thereby enablingparticle counting to be used for measuring the amount of total signal from eachmicroarray spot. This unique detection methodology was applied on a smallmodel array containing positive and negative control capture sequences. A bi-otin labelled 30–mer target was hybridized to the array overnight followed byovernight incubation with the antibiotin labelled silver particles. A detectionlimit of 1×10⁶ target copies (830 fM, 2 uL) was achieved, which was ∼ 10–foldbetter than obtained by measuring average scatter intensity (1 × 10⁷ copies)using this illuminaton/detection technique. The improvement in sensitivity isattributed to the elimination of background pixels that decrease the averagescattering signal on microarray spots that are not completely coated with par-ticles. This labelling technology is under development at Seashell Corporationfor microarray applications [89].
The above cited literature clearly demonstrates that RLS labels holdpromise as high sensitivity labelling systems for gene expression. However,the 3–4 fold increase in assay sensitivity observed with spiked transcriptswas significantly less than the expected 2–3 orders of magnitude improve-ment predicted based on the theoretical RLS detection limit of 0.005 RLSparticles/µm2. This significant disparity is likely attributed to the large sizeof the gold particles required, which presents steric and kinetic limits to thenumber of particles bound to each cDNA probe. In addition, the passive ad-sorption of the antibiotin antibodies to the nanoparticle surface may be proneto desorption [77]. Particle counting may be used to increase sensitivity in
8 Labels and Detection Methods 167
such detection systems, but this strategy requires the use of slower and morecomplex instrumentation [89]. While the use of smaller metal nanoparticlesfor labelling can enhance hybridization kinetics and relieve steric issues, thisapproach will result in lower scattering intensity. Alexandre et al. in collab-oration with Advanced Array Technology (AAT) have employed streptavidincoated ∼ 10 nm gold nanoparticles in conjunction with silver amplification fornucleic acid analysis on microarrays [28, 91]. In a direct comparison, this ap-proach yielded detection limits (0.1 fmol, ∼ 6×10⁷ copies) equivalent to a Cy3labelled target. These detection limits in comparison to the DNA-modifiednanoparticle probes (Table 8.1) indicate that in addition to the smaller sizeof the nanoparticles, the functionalization strategy, antibody or DNA, mustplay an important role in determining assay sensitivity.
In summary, scatter-based nanoparticle detection enables single particledetection capabilities. Therefore, the major determinant of assay sensitivity inthese detection strategies is background, target binding affinity, particle bind-ing kinetics and sterics. A detection limit of ∼ 100 aM (3000 target copies) hasbeen achieved using Nanosphere’s oligonucleotide-modified gold nanoparticle(15 nm diameter)–silver amplification technology in conjunction with simpleoptical detection instrumentation for nucleic acid detection. Antibody-labelledgold or silver particles (> 60 nm diameter) without silver amplification haveachieved fM to pM detection limits (∼ 106–107 target copies) in nucleic aciddetection assays. The higher sensitivity achieved with the Nanosphere strat-egy is likely a combination of the small particle size which increases bindingkinetics and limits sterics, the use of covalent DNA particle modification whichenhances target binding affinity, and the use of silver amplification which re-sults in a higher signal per nanoparticle probe due to increased particle size.More importantly, the assay sensitivity achieved with the Nanosphere tech-nology is roughly 3 orders magnitude more sensitive than a comparable assaywith fluorescently-labelled dyes (Table 8.1) which has enabled direct detectionof genomic DNA samples.
8.6.3 Surface Plasmon Resonance Detection
Surface plasmon resonance (SPR) spectroscopy is a detection methodologythat enables measurement of changes in thickness and/or index of refraction oforganic or biomolecular thin films at noble metal surfaces (Au, Ag, or Cu) [75].This technology has been reviewed extensively [75,92,93], therefore discussionwill be limited to recent advancements in using SPR with microarrays. Sur-face plasmons are generated by conduction electrons at the metal surface thatcollectively oscillate at a specific frequency. The surface plasmon resonancefrequency is sensitive to the metal/dielectric medium interface such that theadsorption of biomolecules at the surface interface results in changes in theSPR which can be measured by scanning angle SPR, SPR wavelength shift, orSPR imaging [75]. The scanning angle SPR technique is the most commonlyemployed method, and instruments are commercially available through Bia-
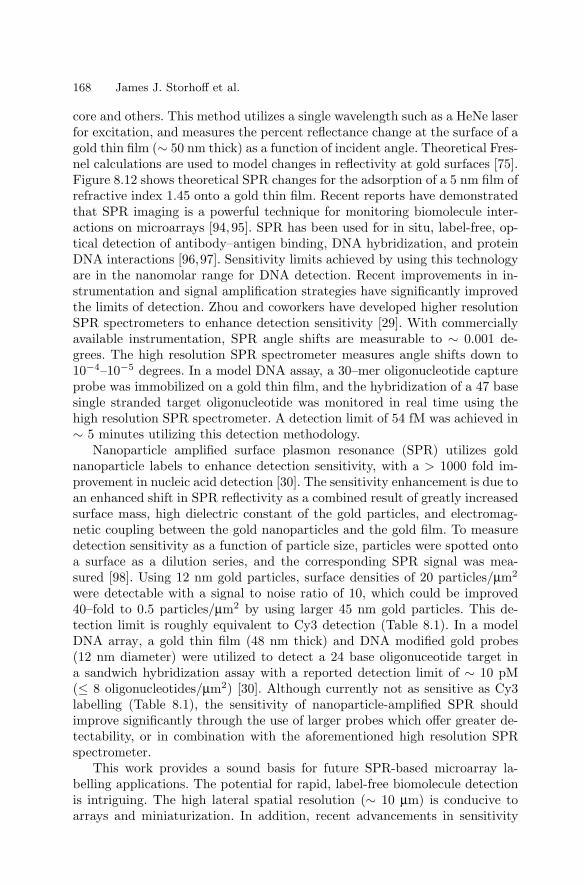
168 James J. Storhoff et al.
core and others. This method utilizes a single wavelength such as a HeNe laserfor excitation, and measures the percent reflectance change at the surface of agold thin film (∼ 50 nm thick) as a function of incident angle. Theoretical Fres-nel calculations are used to model changes in reflectivity at gold surfaces [75].Figure 8.12 shows theoretical SPR changes for the adsorption of a 5 nm film ofrefractive index 1.45 onto a gold thin film. Recent reports have demonstratedthat SPR imaging is a powerful technique for monitoring biomolecule inter-actions on microarrays [94, 95]. SPR has been used for in situ, label-free, op-tical detection of antibody–antigen binding, DNA hybridization, and proteinDNA interactions [96,97]. Sensitivity limits achieved by using this technologyare in the nanomolar range for DNA detection. Recent improvements in in-strumentation and signal amplification strategies have significantly improvedthe limits of detection. Zhou and coworkers have developed higher resolutionSPR spectrometers to enhance detection sensitivity [29]. With commerciallyavailable instrumentation, SPR angle shifts are measurable to ∼ 0.001 de-grees. The high resolution SPR spectrometer measures angle shifts down to10−4–10−5 degrees. In a model DNA assay, a 30–mer oligonucleotide captureprobe was immobilized on a gold thin film, and the hybridization of a 47 basesingle stranded target oligonucleotide was monitored in real time using thehigh resolution SPR spectrometer. A detection limit of 54 fM was achieved in∼ 5 minutes utilizing this detection methodology.
Nanoparticle amplified surface plasmon resonance (SPR) utilizes goldnanoparticle labels to enhance detection sensitivity, with a > 1000 fold im-provement in nucleic acid detection [30]. The sensitivity enhancement is due toan enhanced shift in SPR reflectivity as a combined result of greatly increasedsurface mass, high dielectric constant of the gold particles, and electromag-netic coupling between the gold nanoparticles and the gold film. To measuredetection sensitivity as a function of particle size, particles were spotted ontoa surface as a dilution series, and the corresponding SPR signal was mea-sured [98]. Using 12 nm gold particles, surface densities of 20 particles/µm2
were detectable with a signal to noise ratio of 10, which could be improved40–fold to 0.5 particles/µm2 by using larger 45 nm gold particles. This de-tection limit is roughly equivalent to Cy3 detection (Table 8.1). In a modelDNA array, a gold thin film (48 nm thick) and DNA modified gold probes(12 nm diameter) were utilized to detect a 24 base oligonuceotide target ina sandwich hybridization assay with a reported detection limit of ∼ 10 pM(≤ 8 oligonucleotides/µm2) [30]. Although currently not as sensitive as Cy3labelling (Table 8.1), the sensitivity of nanoparticle-amplified SPR shouldimprove significantly through the use of larger probes which offer greater de-tectability, or in combination with the aforementioned high resolution SPRspectrometer.
This work provides a sound basis for future SPR-based microarray la-belling applications. The potential for rapid, label-free biomolecule detectionis intriguing. The high lateral spatial resolution (∼ 10 µm) is conducive toarrays and miniaturization. In addition, recent advancements in sensitivity
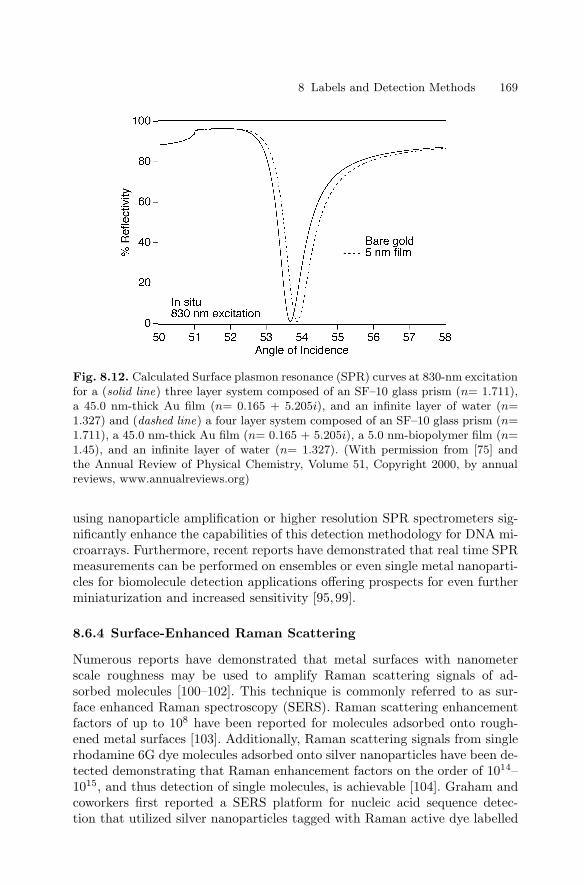
8 Labels and Detection Methods 169
Fig. 8.12. Calculated Surface plasmon resonance (SPR) curves at 830-nm excitationfor a (solid line) three layer system composed of an SF–10 glass prism (n= 1.711),a 45.0 nm-thick Au film (n= 0.165 + 5.205i), and an infinite layer of water (n=1.327) and (dashed line) a four layer system composed of an SF–10 glass prism (n=1.711), a 45.0 nm-thick Au film (n= 0.165 + 5.205i), a 5.0 nm-biopolymer film (n=1.45), and an infinite layer of water (n= 1.327). (With permission from [75] andthe Annual Review of Physical Chemistry, Volume 51, Copyright 2000, by annualreviews, www.annualreviews.org)
using nanoparticle amplification or higher resolution SPR spectrometers sig-nificantly enhance the capabilities of this detection methodology for DNA mi-croarrays. Furthermore, recent reports have demonstrated that real time SPRmeasurements can be performed on ensembles or even single metal nanoparti-cles for biomolecule detection applications offering prospects for even furtherminiaturization and increased sensitivity [95,99].
8.6.4 Surface-Enhanced Raman Scattering
Numerous reports have demonstrated that metal surfaces with nanometerscale roughness may be used to amplify Raman scattering signals of ad-sorbed molecules [100–102]. This technique is commonly referred to as sur-face enhanced Raman spectroscopy (SERS). Raman scattering enhancementfactors of up to 108 have been reported for molecules adsorbed onto rough-ened metal surfaces [103]. Additionally, Raman scattering signals from singlerhodamine 6G dye molecules adsorbed onto silver nanoparticles have been de-tected demonstrating that Raman enhancement factors on the order of 1014–1015, and thus detection of single molecules, is achievable [104]. Graham andcoworkers first reported a SERS platform for nucleic acid sequence detec-tion that utilized silver nanoparticles tagged with Raman active dye labelled
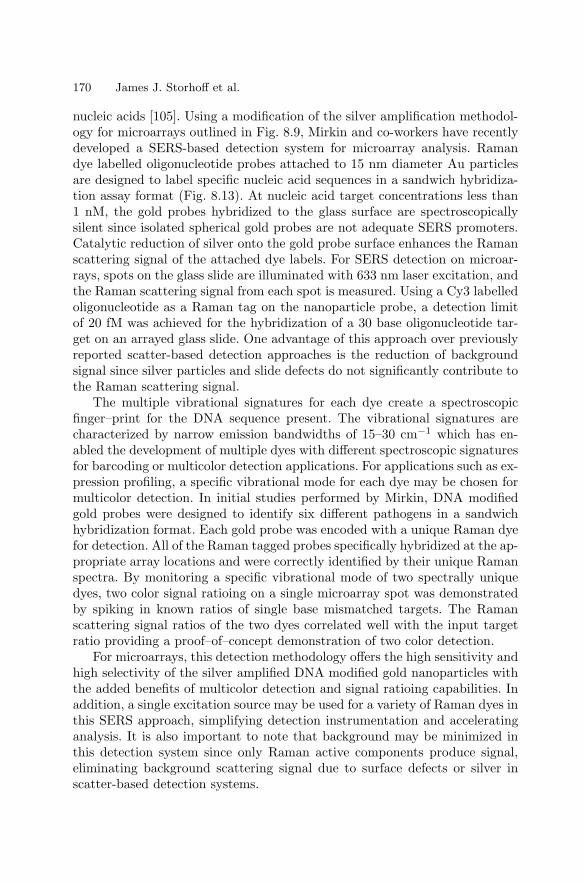
170 James J. Storhoff et al.
nucleic acids [105]. Using a modification of the silver amplification methodol-ogy for microarrays outlined in Fig. 8.9, Mirkin and co-workers have recentlydeveloped a SERS-based detection system for microarray analysis. Ramandye labelled oligonucleotide probes attached to 15 nm diameter Au particlesare designed to label specific nucleic acid sequences in a sandwich hybridiza-tion assay format (Fig. 8.13). At nucleic acid target concentrations less than1 nM, the gold probes hybridized to the glass surface are spectroscopicallysilent since isolated spherical gold probes are not adequate SERS promoters.Catalytic reduction of silver onto the gold probe surface enhances the Ramanscattering signal of the attached dye labels. For SERS detection on microar-rays, spots on the glass slide are illuminated with 633 nm laser excitation, andthe Raman scattering signal from each spot is measured. Using a Cy3 labelledoligonucleotide as a Raman tag on the nanoparticle probe, a detection limitof 20 fM was achieved for the hybridization of a 30 base oligonucleotide tar-get on an arrayed glass slide. One advantage of this approach over previouslyreported scatter-based detection approaches is the reduction of backgroundsignal since silver particles and slide defects do not significantly contribute tothe Raman scattering signal.
The multiple vibrational signatures for each dye create a spectroscopicfinger–print for the DNA sequence present. The vibrational signatures arecharacterized by narrow emission bandwidths of 15–30 cm−1 which has en-abled the development of multiple dyes with different spectroscopic signaturesfor barcoding or multicolor detection applications. For applications such as ex-pression profiling, a specific vibrational mode for each dye may be chosen formulticolor detection. In initial studies performed by Mirkin, DNA modifiedgold probes were designed to identify six different pathogens in a sandwichhybridization format. Each gold probe was encoded with a unique Raman dyefor detection. All of the Raman tagged probes specifically hybridized at the ap-propriate array locations and were correctly identified by their unique Ramanspectra. By monitoring a specific vibrational mode of two spectrally uniquedyes, two color signal ratioing on a single microarray spot was demonstratedby spiking in known ratios of single base mismatched targets. The Ramanscattering signal ratios of the two dyes correlated well with the input targetratio providing a proof–of–concept demonstration of two color detection.
For microarrays, this detection methodology offers the high sensitivity andhigh selectivity of the silver amplified DNA modified gold nanoparticles withthe added benefits of multicolor detection and signal ratioing capabilities. Inaddition, a single excitation source may be used for a variety of Raman dyes inthis SERS approach, simplifying detection instrumentation and acceleratinganalysis. It is also important to note that background may be minimized inthis detection system since only Raman active components produce signal,eliminating background scattering signal due to surface defects or silver inscatter-based detection systems.
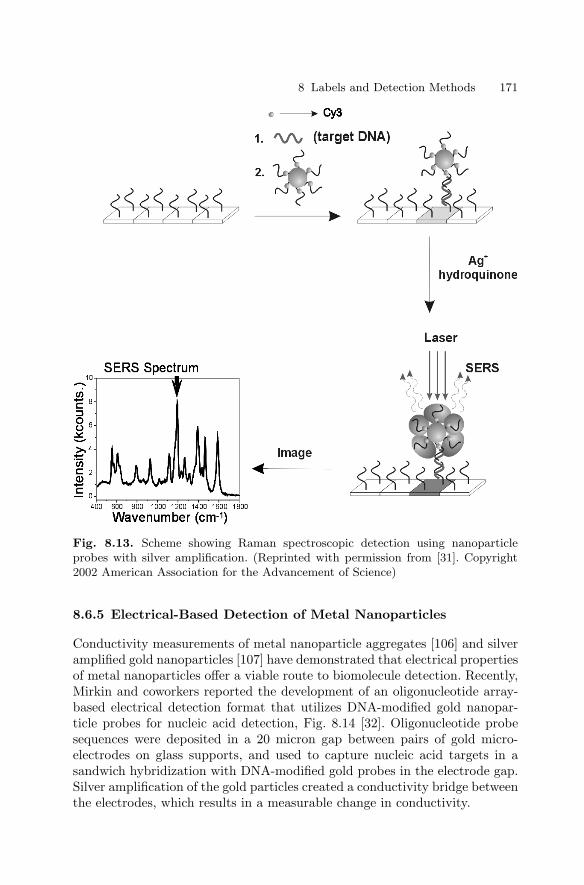
8 Labels and Detection Methods 171
Fig. 8.13. Scheme showing Raman spectroscopic detection using nanoparticleprobes with silver amplification. (Reprinted with permission from [31]. Copyright2002 American Association for the Advancement of Science)
8.6.5 Electrical-Based Detection of Metal Nanoparticles
Conductivity measurements of metal nanoparticle aggregates [106] and silveramplified gold nanoparticles [107] have demonstrated that electrical propertiesof metal nanoparticles offer a viable route to biomolecule detection. Recently,Mirkin and coworkers reported the development of an oligonucleotide array-based electrical detection format that utilizes DNA-modified gold nanopar-ticle probes for nucleic acid detection, Fig. 8.14 [32]. Oligonucleotide probesequences were deposited in a 20 micron gap between pairs of gold micro-electrodes on glass supports, and used to capture nucleic acid targets in asandwich hybridization with DNA-modified gold probes in the electrode gap.Silver amplification of the gold particles created a conductivity bridge betweenthe electrodes, which results in a measurable change in conductivity.
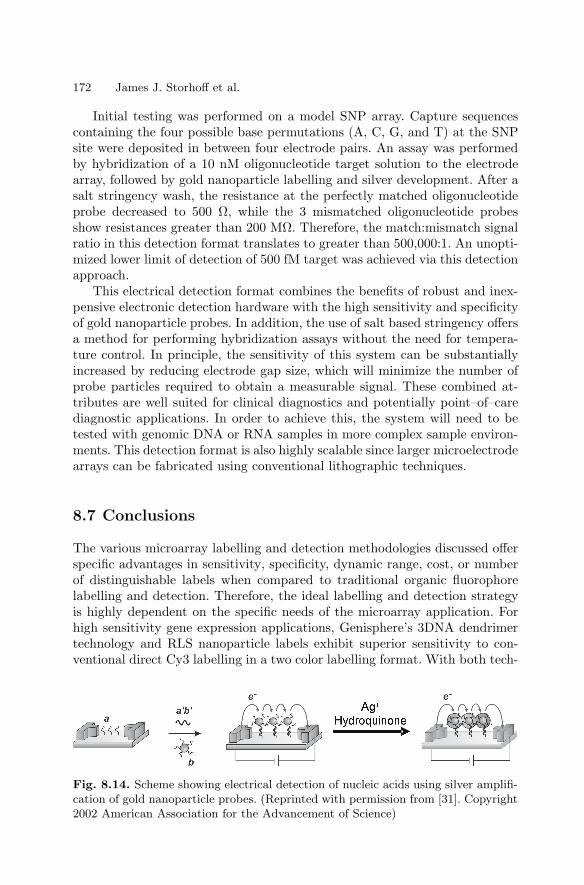
172 James J. Storhoff et al.
Initial testing was performed on a model SNP array. Capture sequencescontaining the four possible base permutations (A, C, G, and T) at the SNPsite were deposited in between four electrode pairs. An assay was performedby hybridization of a 10 nM oligonucleotide target solution to the electrodearray, followed by gold nanoparticle labelling and silver development. After asalt stringency wash, the resistance at the perfectly matched oligonucleotideprobe decreased to 500 Ω, while the 3 mismatched oligonucleotide probesshow resistances greater than 200 MΩ. Therefore, the match:mismatch signalratio in this detection format translates to greater than 500,000:1. An unopti-mized lower limit of detection of 500 fM target was achieved via this detectionapproach.
This electrical detection format combines the benefits of robust and inex-pensive electronic detection hardware with the high sensitivity and specificityof gold nanoparticle probes. In addition, the use of salt based stringency offersa method for performing hybridization assays without the need for tempera-ture control. In principle, the sensitivity of this system can be substantiallyincreased by reducing electrode gap size, which will minimize the number ofprobe particles required to obtain a measurable signal. These combined at-tributes are well suited for clinical diagnostics and potentially point–of–carediagnostic applications. In order to achieve this, the system will need to betested with genomic DNA or RNA samples in more complex sample environ-ments. This detection format is also highly scalable since larger microelectrodearrays can be fabricated using conventional lithographic techniques.
8.7 Conclusions
The various microarray labelling and detection methodologies discussed offerspecific advantages in sensitivity, specificity, dynamic range, cost, or numberof distinguishable labels when compared to traditional organic fluorophorelabelling and detection. Therefore, the ideal labelling and detection strategyis highly dependent on the specific needs of the microarray application. Forhigh sensitivity gene expression applications, Genisphere’s 3DNA dendrimertechnology and RLS nanoparticle labels exhibit superior sensitivity to con-ventional direct Cy3 labelling in a two color labelling format. With both tech-
Fig. 8.14. Scheme showing electrical detection of nucleic acids using silver amplifi-cation of gold nanoparticle probes. (Reprinted with permission from [31]. Copyright2002 American Association for the Advancement of Science)
8 Labels and Detection Methods 173
nologies, it has been demonstrated that up to 10–fold less RNA is required fordetection [21,77]. Up-converting phosphor labels demonstrate marginally bet-ter sensitivity than Cy3 labelling in gene expression applications to date [22].Even greater detection sensitivity is attainable through further optimizationof these nascent labelling and detection strategies.
Certain nanoparticle and phosphor-based labelling methodologies offer alarger number of distinguishable colors than conventional organic dyes, com-bined with simplified and lower cost instrumentation (e.g. single source exci-tation). The potential for enhanced multiplexing capability is especially im-portant for liquid-based array and barcoding applications. Quantum dots (i.e.semiconductor nanoparticles) offer at least 6 distinguishable colors with a sin-gle excitation source, using particles of different size and composition [42],providing the potential for thousands of unique codes through combination ofvarious colors and intensities, all with higher photostability [50]. One draw-back of this labelling methodology is the toxicity of CdSe particles, whichrequires careful handling and disposal. Phosphor technology also offers the po-tential for more colors (six spectrally unique colors reported) with the addedbenefits of single source infrared excitation and longer decay times, which min-imizes background fluorescence [55]. Finally, nanoparticle probe-based SERSlabels offer the greatest potential for multiplexing combined with high sensi-tivity [31].
The electrochemical detection platform [23, 59, 60] offers one of the mostrobust and lowest cost detection strategies, yet, sensitivity limitations in cur-rent assays necessitates the use of target amplification, thereby increasingassay complexity and cost. For applications in clinical diagnostics such asSNP detection and infectious disease identification, the elimination of targetamplification represents a holy grail, since it would increase assay reliability,significantly reduce cost and assay complexity, and save time. Assuming that adrop of blood is a reasonable target source, sensitivities of < 106 target copiesare required for detection of single copy targets in total human genomic DNAin microarray type applications without target amplification. Detection limitsof ∼ 100 aM (3000 target copies) have been achieved using Nanosphere’s DNA-modified gold nanoparticle (15 nm diameter) technology in conjunction withsimple optical detection instrumentation for nucleic acid detection. However,for hybridization based detection of SNPs or mutational sequence changes ofjust a few bp, specificity is even more critical than sensitivity in the absenceof complexity reduction [88]. Here too the higher specificity of DNA-modifiedgold probes conferred by the sharp melting transitions has enabled detectionof gene sequences within unamplified human genomic DNA samples usingoligonucleotide microarrays [25]. It is envisioned that strategies such as thiswill result in broad-based genetic disease diagnostics, with equal potential forinfectious disease identification. However, in the latter case a single life cellcan be detected by conventional microbiological procedures (‘gold standard’),making the necessity of a short culture period likely for some bacterial diag-nostic applications where < 103 copies of the organism are present. Finally,
174 James J. Storhoff et al.
point–of–care diagnostic applications will require not only high sensitivity andspecificity, but also simple, rapid, and robust detection assays. Gold nanopar-ticle probe-based electrical detection systems that lend themselves to assayminiaturization and planar device integration have demonstrated that thesegoals may be achievable in the not too distant future.
References
1. Venter JC, Adams MD, Myers EW et al., 2001. The sequence of the humangenome. Science 291, 1304–
2. Lander ES, Linton LM, Birren B et al., 2001. Initial sequencing and analysisof the human genome. Nature 409, 860–921
3. Chee M, Yang R, Hubbell E et al., 1996. Accessing genetic information withhigh–density DNA arrays. Science 274, 610–614
4. Lockhart DJ, Winzeler EA, 2000. Genomics, gene expression, and DNA arrays.Nature 405, 827–836
5. Fodor SPA, Read JL, Pirrung MC et al., 1991. Light–Directed, Spatially Ad-dressable Parallel Chemical Synthesis. Science 251, 767–773
6. Duggan DJ, Bittner M, Chen Y et al., 1999. Expression profiling using cDNAmicroarrays. Nature genetics supplement 21, 10–14
7. Lipshutz RJ, Fodor SPA, Gingeras TR et al., 1999. High density syntheticoligonucleotide arrays. Nature genetics supplement 21, 20–24
8. Spellman PT, Sherlock G, Zhang MQ et al., 1998. Comprehensive identifi-cation of cell cycle–regulated genes of the yeast Saccharomyces cerevisiae bymicroarray hybridization. Mol. Biol. Cell 9, 3273–3297
9. Clarke PA, Poele RT, Wooster R et al., 2001. Gene expression microarrayanalysis in cancer biology, pharmacology, and drug development: progress andpotential. Biochem. Pharmacol. 62, 1311–1336
10. Debouck C, Goodfellow PN, 1999. DNA microarrays in drug discovery anddevelopment. Nature Genetics 21, 48–50
11. Golub TR, Slonim DK, Tamayo P et al., 1999. Molecular classification of can-cer: Class discovery and class prediction by gene expression monitoring. Science286, 531–537
12. Chakravarti A, 1999. Population genetics–making sense out of sequence. Naturegenetics supplement 21, 56–60
13. Wang DG, Fan JB, Siao CJ et al., 1998. Large–scale identification, mapping,and genotyping of single– nucleotide polymorphisms in the human genome.Science 280, 1077–1082
14. Hacia JG, 1999. Resequencing and mutational analysis using oligonucleotidemicroarrays. Nature Genetics 21, 42–47
15. Hacia JG, Fan JB, Ryder O et al., 1999. Determination of ancestral allelesfor human single–nucleotide polymorphisms using high–density oligonucleotidearrays. Nature Genetics 22, 164–167
16. Cronin MT, Fucini RV, Kim SM et al., 1996. Cystic fibrosis mutation detectionby hybridization to light– generated DNA probe arrays. Hum. Mutat. 7, 244–255
17. Longenbach-Huber S, Safgren S, Raich T et al., 2001. Cytochrome P450(CYP450) genotyping on the CodeLink (TM) bioarray. Clin. Chem. 47, 37
8 Labels and Detection Methods 175
18. Guo Z, Guilfoyle RA, Thiel AJ et al., 1994. Direct Fluorescence Analysis ofGenetic Polymorphisms by Hybridization with Oligonucleotide Arrays on GlassSupports. Nucleic Acids Res. 22, 5456–5465
19. Hacia JG, Brody LC, Chee MS, et al. (1996) Detection of heterozygous mu-tations in BRCA1 using high density oligonucleotide arrays and two–colourfluorescence analysis. Nature Genetics 14:441–447
20. Bowtell DD, Sambrook JF (Eds.) (2002) DNA Microarrays: A MolecularCloning Manual. Cold Spring Harbor Laboratory Press, New York
21. Stears RL, Getts RC, Gullans SR (2000) A novel, sensitive detection system forhigh–density microarrays using dendrimer technology. Physiological Genomics3:93–99
22. van de Rijke F, Zijlmans H, Li S, et al. (2001) Up–converting phosphor reportersfor nucleic acid microarrays. Nature Biotechnology 19:273–276
23. Umek RM, Lin SW, Vielmetter J, et al. (2001) Electronic detection of nucleicacids – A versatile platform for molecular diagnostics. Journal of MolecularDiagnostics 3:74–84
24. Gerion D, Parak WJ, Williams SC, et al. (2002) Sorting fluorescent nano–crystals with DNA. Journal of the American Chemical Society 124:7070–7074
25. Storhoff JJ, Marla SM, Bao P, et al. (2004) Gold nanoparticle–based detectionof genomic DNA targets on microarrays using a novel optical detection system.Biosensors and Bioelectronics 19:875–883
26. Yguerabide J, Yguerabide EE (1998) Light–scattering submicroscopic particlesas highly fluorescent analogs and their use as tracer labels in clinical and biolog-ical applications – II. Experimental characterization. Analytical Biochemistry262:157–176
27. See white papers at www.geniconsciences.com28. Alexandre I, Hamels S, Dufour S, et al. (2001) Colorimetric silver detection of
DNA microarrays. Analytical Biochemistry 295:1–829. Song F, Zhou F, Wang J, et al. (2002) Detection of oligonucleotide hybridiza-
tion at femtomolar level and sequence–specific gene analysis of the arabidopsisthaliana leaf extract with an ultrasensitive surface plasmon resonance spectrom-eter. Nucleic Acids Research 30:e72
30. He L, Musick MD, Nicewarner SR, et al. (2000) Colloidal Au–enhanced surfaceplasmon resonance for ultrasensitive detection of DNA hybridization. Journalof the American Chemical Society 122:9071–9077
31. Cao YWC, Jin RC, Mirkin CA (2002) Nanoparticles with Raman spectroscopicfingerprints for DNA and RNA detection. Science 297:1536–1540
32. Park SJ, Taton TA, Mirkin CA (2002) Array–Based Electrical Detection ofDNA with Nanoparticle Probes. Science 295:1503–1506
33. Nie SM, Zare RN (1997) Optical detection of single molecules. Annual Reviewof Biophysics and Biomolecular Structure 26:567–596
34. Cheung VG, Morley M, Aguilar F, et al. (1999) Making and reading microar-rays. Nature genetics supplement 21:15–19
35. Brown CS, Goodwin PC, Sorger PK (2001) Image metrics in the statisticalanalysis of DNA microarray data. Proceedings of the National Academy ofSciences of the United States of America 98:8944–8949
36. Lindroos K, Sigurdsson S, Johansson K, et al. (2002) Multiplex SNP genotyp-ing in pooled DNA samples by a four–color microarray system. Nucleic AcidsResearch 30:e70

176 James J. Storhoff et al.
37. Collins ML, Irvine B, Tyner D, et al. (1997) A branched DNA signal amplifi-cation assay for quantification of nucleic acid targets below 100 molecules/ml.Nucleic Acids Research 25:2979–2984
38. Shchepinov MS, Udalova IA, Bridgman AJ, et al. (1997) Oligonucleotide den-drimers: synthesis and use as polylabelled DNA probes. Nucleic Acids Research25:4447–4454
39. Nilsen TW, Grayzel J, Prensky W (1997) Dendritic Nucleic Acid Structures.Journal of Theoretical Biology 187:273–284
40. Wang J, Jiang M, Nilsen TW, et al. (1998) Dendritic Nucleic Acid Probes forDNA Biosensors. Journal of the American Chemical Society 120:8281–8282
41. Alivisatos AP (2001) Less is more in medicine – Sophisticated forms of nan-otechnology will find some of their first real–world applications in biomedicalresearch, disease diagnosis and, possibly, therapy. Scientific American 285:66–73
42. Bruchez M, Moronne M, Gin P, et al. (1998) Semiconductor nanocrystals asfluorescent biological labels. Science 281:2013–2016
43. Chan WCW, Nie SM (1998) Quantum dot bioconjugates for ultrasensitive non-isotopic detection. Science 281:2016–2018
44. Weller H (1993) Colloidal Semiconductor Q–Particles – Chemistry in theTransition Region between Solid–State and Molecules. Angewandte Chemie–International Edition in English 32:41–53
45. Chan WCW, Maxwell DJ, Gao XH, et al. (2002) Luminescent quantum dots formultiplexed biological detection and imaging. Current Opinion in Biotechnology13:40–46
46. Murray CB, Norris DJ, Bawendi MG (1993) Synthesis and Characterizationof Nearly Monodisperse Cde (E = S, Se, Te) Semiconductor Nanocrystallites.Journal of the American Chemical Society 115:8706–8715
47. Alivisatos AP (1996) Semiconductor clusters, nanocrystals, and quantum dots.Science 271:933–937
48. Wu XY, Liu HJ, Liu JQ, et al. (2003) Immunofluorescent labeling of cancermarker Her2 and other cellular targets with semiconductor quantum dots. Na-ture Biotechnology 21:41–46
49. Pathak S, Choi SK, Arnheim N, et al. (2001) Hydroxylated quantum dots asluminescent probes for in situ hybridization. Journal of the American ChemicalSociety 123:4103–4104
50. Han MY, Gao XH, Su JZ, et al. (2001) Quantum–dot–tagged microbeads formultiplexed optical coding of biomolecules. Nature Biotechnology 19:631–635
51. Ferguson JA, Steemers FJ, Walt DR (2000) High–density fiber–optic DNArandom microsphere array. Analytical Chemistry 72:5618–5624
52. Xu HX, Sha MY, Wong EY, et al. (2003) Multiplexed SNP genotyping using theQbead (TM) system: a quantum dot–encoded microsphere–based assay. NucleicAcids Research 31:e43
53. Ostermay.Fw (1971) Preparation and Properties of Infrared–to–Visible Con-version Phosphors. Metallurgical Transactions 2:747
54. Hampl J, Hall M, Mufti NA, et al. (2001) Upconverting phosphor reporters inimmunochromatographic assays. Analytical Biochemistry 288:176–187
55. Zijlmans H, Bonnet J, Burton J, et al. (1999) Detection of cell and tissuesurface antigens using up– converting phosphors: A new reporter technology.Analytical Biochemistry 267:30–36
8 Labels and Detection Methods 177
56. Verwoerd NP, Hennink EJ, Bonnet J, et al. (1994) Use of FerroelectricLiquid–Crystal Shutters for Time–Resolved Fluorescence Microscopy. Cytome-try 16:113–117
57. Beverloo HB, Vanschadewijk A, Zijlmans H, et al. (1992) ImmunochemicalDetection of Proteins and Nucleic–Acids on Filters Using Small LuminescentInorganic Crystals as Markers. Analytical Biochemistry 203:326–334
58. Dejneka MJ, Streltsov A, Pal S, et al. (2003) Rare earth–doped glass micro–barcodes. Proceedings of the National Academy of Sciences of the United Statesof America 100:389–393
59. Boon EM, Ceres DM, Drummond TG, et al. (2000) Mutation detection by elec-trocatalysis at DNA–modified electrodes. Nature Biotechnology 18:1096–1100
60. Napier ME, Loomis CR, Sistare MF, et al. (1997) Probing biomolecule recog-nition with electron transfer: Electrochemical sensors for DNA hybridization.Bioconjugate Chemistry 8:906–913
61. Wang J (2001) Glucose biosensors: 40 years of advances and challenges. Elec-troanalysis 13:983–988
62. Yu CJ, Wan YJ, Yowanto H, et al. (2001) Electronic detection of single–basemismatches in DNA with ferrocene–modified probes. Journal of the AmericanChemical Society 123:11155–11161
63. Armistead PM, Thorp HH (2000) Modification of indium tin oxide electrodeswith nucleic acids: Detection of attomole quantities of immobilized DNA byelectrocatalysis. Analytical Chemistry 72:3764–3770
64. Armistead PM, Thorp HH (2002) Electrochemical detection of gene expressionin tumor samples: Overexpression of Rak nuclear tyrosine kinase. BioconjugateChemistry 13:172–176
65. Popovich ND (2001) Mediated electrochemical detection of nucleic acids fordrug discovery and clinical diagnostics. IVD Technology April
66. Boon EM, Kisko JL, Barton JK (2002) In Redox Cell Biology and Genetics,Pt B, Vol. 353, pp. 506–522
67. Handley DA (1991) In Colloidal Gold; Principles, Methods, and Applications,Vol. 1 (Ed, Hayat, M. A.) Academic Press, San Diego, pp. 1–12
68. Rohringer R (1991) In Colloidal Gold: Principles, Methods, and Applications,Vol. 2 (Ed, Hayat, M. A.) Academic Press, San Diego, pp. 398–411
69. Niemeyer CM (2001) Nanoparticles, Proteins, and Nucleic Acids: Biotech-nology Meets Materials Science. Angewandte Chemie–International Edition40:4128–4158
70. Storhoff JJ, Mirkin CA (1999) Programmed Materials Synthesis with DNA.Chemical Reviews 99:1849–1862
71. Taton TA, Mirkin CA, Letsinger RL (2000) Scanometric DNA array detectionwith nanoparticle probes. Science 289:1757–1760
72. Handley DA (1991) In Colloidal Gold; Principles, Methods, and Applications,Vol. 1 (Ed, Hayat, M. A.) Academic Press, San Diego, pp. 13–32
73. Mirkin CA, Letsinger RL, Mucic RC, et al. (1996) A DNA–based method for ra-tionally assembling nanoparticles into macroscopic materials. Nature 382:607–609
74. Elghanian R, Storhoff JJ, Mucic RC, et al. (1997) Selective colorimetric de-tection of polynucleotides based on the distance–dependent optical properties ofgold nanoparticles. Science 277:1078–1081
178 James J. Storhoff et al.
75. Brockmann JM, Nelson BP, Corn RM (2000) Surface Plasmon ResonanceImaging Measurements of Ultrathin Organic Films. Annual Reviews of PhysicalChemistry 51:41–63
76. Taton TA, Lu G, Mirkin CA (2001) Two–color labeling of oligonucleotide arraysvia size–selective scattering of nanoparticle probes. Journal of the AmericanChemical Society 123:5164–5165
77. Bao P, Frutos AG, Greef C, et al. (2002) High–Sensitivity Detection of DNAHybridization on Microarrays Using Resonance Light Scattering. AnalyticalChemistry 74:1792–1797
78. Boyer D, Tamarat P, Maali A, et al. (2002) Photothermal imaging ofnanometer–sized metal particles among scatterers. Science 297:1160–1163
79. Wang J, Song FY, Zhou FM (2002) Silver–enhanced imaging of DNA hybridiza-tion at DNA microarrays with scanning electrochemical microscopy. Langmuir18:6653–6658
80. Faraday M (1857) Experimental relations of gold (and other metals) to light.Philos Trans R Soc London 147:145
81. Jin RC, Wu GS, Li Z, et al. (2003) What controls the melting properties ofDNA–linked gold nanoparticle assemblies? Journal of the American ChemicalSociety 125:1643–1654
82. Link S, Wang ZL, El–Sayed MA (1999) Alloy formation of gold–silver nanopar-ticles and the dependence of the plasmon absorption on their composition. Jour-nal of Physical Chemistry B 103:3529–3533
83. Yguerabide J, Yguerabide EE (1998) Light–scattering submicroscopic parti-cles as highly fluorescent analogs and their use as tracer labels in clinical andbiological applications – I. Theory. Analytical Biochemistry 262:137–156
84. Scopsi L (1991) In Colloidal Gold: Principles, Methods, and Applications, Vol.1 (Ed, Hayat, M. A.) Academic Press, San Diego, pp. 251–295
85. Jin RC, Cao YW, Mirkin CA, et al. (2001) Photoinduced conversion of silvernanospheres to nanoprisms. Science 294:1901–1903
86. Yguerabide J, Yguerabide EE (2001) Resonance Light Scattering Particles asUltrasensitive Labels for Detection of Analytes in a Wide Range of Applica-tions. Journal of Cellular Biochemistry Supplement 37:71–81
87. Taton TA, Mucic RC, Mirkin CA, et al. (2000) The DNA–mediated formationof supramolecular mono– and multilayered nanoparticle structures. Journal ofthe American Chemical Society 122:6305–6306
88. Lander ES (1999) Array of hope. Nature genetics supplement 21:3–489. Oldenburg SJ, Genick CC, Clark KA, et al. (2002) Base pair mismatch recogni-
tion using plasmon resonant particle labels. Analytical Biochemistry 309:109–116
90. Schultz S, Smith DR, Mock JJ, et al. (2000) Single–target molecule detectionwith nonbleaching multicolor optical immunolabels. Proceedings of the NationalAcademy of Sciences of the United States of America 97:996–1001
91. Alexandre I, Houbion Y, Collet J, et al. (2002) Compact disc with both numericand genomic information as DNA microarray platform. Biotechniques 33:435
92. Liedberg B, Nylander C, Lundstrom I (1995) Biosensing with surface plasmonresonance – how it all started. Biosensors and Bioelectronics 10:i–ix
93. Homola J, Yee SS, Gauglitz G (1999) Surface plasmon resonance sensors: re-view. Sensors and Actuators B 54:3–15

8 Labels and Detection Methods 179
94. Peterlinz KA, Georgiadis RM (1997) Observation of hybridization and de-hybridization of thiol– tethered DNA using two–color surface plasmon reso-nance spectroscopy. Journal of the American Chemical Society 119:3401–3402
95. Haes AJ, Van Duyne RP (2002) A nanoscale optical biosensor: Sensitivity andselectivity of an approach based on the localized surface plasmon resonance spec-troscopy of triangular silver nanoparticles. Journal of the American ChemicalSociety 124:10596–10604
96. Jordan CE, Frutos AG, Thiel AJ, et al. (1997) Surface plasmon reso-nance imaging measurements of DNA hybridization adsorption and strepta–vidin/DNA multilayer formation at chemically modified gold surfaces. Analyt-ical Chemistry 69:4939–4947
97. Thiel AJ, Frutos AG, Jordan CE, et al. (1997) In situ surface plasmon res-onance imaging detection of DNA hybridization to oligonucleotide arrays ongold surfaces. Analytical Chemistry 69:4948–4956
98. Goodrich GP, Nicewarner SR, He L, et al. (2001) Nanoparticle–amplified sur-face plasmon resonance for detection of DNA hybridization. Proceedings ofSPIE 2:80–85
99. Raschke G, Kowarik S, Franzl T, et al. (2003) Biomolecular Recognition Basedon Single Gold Nanoparticle Light Scattering. Nano Letters 3:935–938
100. Freeman RG, Grabar KC, Allison KJ, et al. (1995) Self–Assembled Metal Col-loid Monolayers – an Approach to Sers Substrates. Science 267:1629–1632
101. Mulvaney SP, Keating CD (2000) Raman spectroscopy. Analytical Chemistry72:145R–157R
102. Isola NR, Stokes DL, Vo-Dinh T (1998) Surface–Enhanced Raman Gene Probefor HIV Detection. Analytical Chemistry 70:1352–1356
103. Haynes CL, Van Duyne RP (2003) Plasmon–Sampled Surface–Enhanced Ra-man Excitation Spectroscopy. Journal of Physical Chemistry B 107:7426–7433
104. Nie SM, Emery SR (1997) Probing single molecules and single nanoparticlesby surface– enhanced Raman scattering. Science 275:1102–1106
105. Graham D, Mallinder BJ, Whitcombe D, et al. (2002) Simple multiplex geno-typing by surface–enhanced resonance Raman scattering. Analytical Chemistry74:1069
106. Brust M, Bethell D, Schiffrin DJ, et al. (1995) Novel Gold–Dithiol Nano–Networks with Nonmetallic Electronic– Properties. Advanced Materials 7:795–
107. Velev OD, Kaler EW (1999) In situ assembly of colloidal particles into minia-turized biosensors. Langmuir 15:3693–3698
9
Marker-free Detection on Microarrays
Matthias Vaupel, Andreas Eing, Karl-Otto Greulich, Jan Roegener,Peter Schellenberg, Hans Martin. Striebel, and Heinrich F. Arlinghaus
9.1 Introduction
The binding of oligomers or DNA are usually detected by fluorescence. Tothis end at least one binding partner is labelled with a fluorescence marker.This detection method cannot be used for protein reactions since biologicaland chemical properties of proteins are often changed by a bound marker.Marker-free observation of a protein reaction is favorable. We discuss imagingellipsometry, as well as imaging surface plasmon resonance (SPR) and com-pare the results of both methods with scanning probe microscopy (SPM) anddetection using fluorescence markers.
Intrinsic ultraviolet (UV) fluorescence is presented as an alternative methodto classical two dimensional gel electrophoresis.
Time–of–flight secondary ion mass spectrometry (TOF–SIMS) is investi-gated in comparison to ultraviolet matrix-assisted laser desorption / ionizationmass spectrometry (MALDI–MS) for read-out of peptide nucleic acid (PNA)microarray chips. All presented marker-free detection methods are intendedfor the development of a marker-free microarray reader for cancer detectingprotein biochips [1].
9.2 Imaging Ellipsometryand Imaging Surface Plasmon Resonance on Biochips
9.2.1 Imaging Null Ellipsometry
Ellipsometry is a non-destructive, label-free optical method for determiningthickness and optical properties of thin films [2]. It measures the change inpolarization of the light reflected by the surface of the film. Fast ellipsometrymethods, single or multi-wavelength, have been adopted for monitoring filmgrowth in situ, allowing the precise control of film deposition processes [3].Commercial imaging ellipsometers, e.g. I–Elli2000 and EP3 from Nanofilm
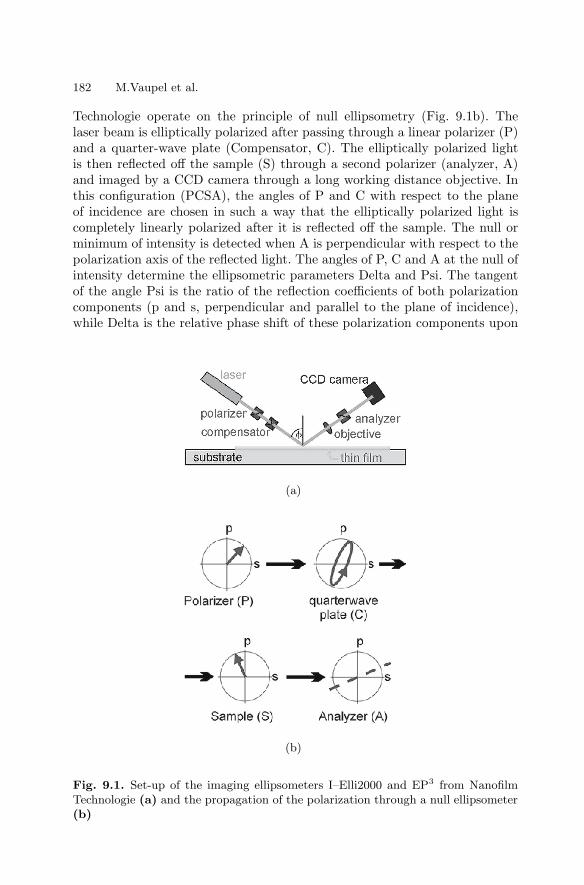
182 M.Vaupel et al.
Technologie operate on the principle of null ellipsometry (Fig. 9.1b). Thelaser beam is elliptically polarized after passing through a linear polarizer (P)and a quarter-wave plate (Compensator, C). The elliptically polarized lightis then reflected off the sample (S) through a second polarizer (analyzer, A)and imaged by a CCD camera through a long working distance objective. Inthis configuration (PCSA), the angles of P and C with respect to the planeof incidence are chosen in such a way that the elliptically polarized light iscompletely linearly polarized after it is reflected off the sample. The null orminimum of intensity is detected when A is perpendicular with respect to thepolarization axis of the reflected light. The angles of P, C and A at the null ofintensity determine the ellipsometric parameters Delta and Psi. The tangentof the angle Psi is the ratio of the reflection coefficients of both polarizationcomponents (p and s, perpendicular and parallel to the plane of incidence),while Delta is the relative phase shift of these polarization components upon
(a)
(b)
Fig. 9.1. Set-up of the imaging ellipsometers I–Elli2000 and EP3 from NanofilmTechnologie (a) and the propagation of the polarization through a null ellipsometer(b)
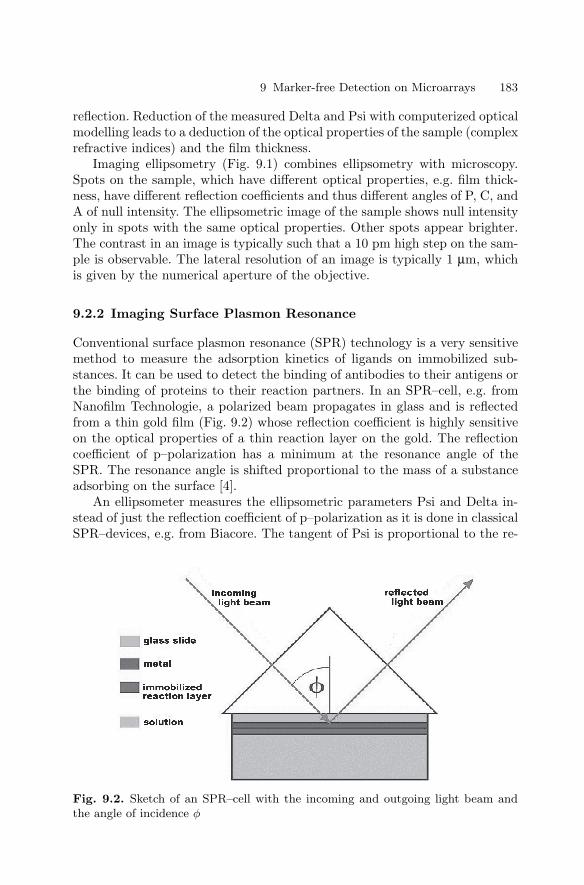
9 Marker-free Detection on Microarrays 183
reflection. Reduction of the measured Delta and Psi with computerized opticalmodelling leads to a deduction of the optical properties of the sample (complexrefractive indices) and the film thickness.
Imaging ellipsometry (Fig. 9.1) combines ellipsometry with microscopy.Spots on the sample, which have different optical properties, e.g. film thick-ness, have different reflection coefficients and thus different angles of P, C, andA of null intensity. The ellipsometric image of the sample shows null intensityonly in spots with the same optical properties. Other spots appear brighter.The contrast in an image is typically such that a 10 pm high step on the sam-ple is observable. The lateral resolution of an image is typically 1 µm, whichis given by the numerical aperture of the objective.
9.2.2 Imaging Surface Plasmon Resonance
Conventional surface plasmon resonance (SPR) technology is a very sensitivemethod to measure the adsorption kinetics of ligands on immobilized sub-stances. It can be used to detect the binding of antibodies to their antigens orthe binding of proteins to their reaction partners. In an SPR–cell, e.g. fromNanofilm Technologie, a polarized beam propagates in glass and is reflectedfrom a thin gold film (Fig. 9.2) whose reflection coefficient is highly sensitiveon the optical properties of a thin reaction layer on the gold. The reflectioncoefficient of p–polarization has a minimum at the resonance angle of theSPR. The resonance angle is shifted proportional to the mass of a substanceadsorbing on the surface [4].
An ellipsometer measures the ellipsometric parameters Psi and Delta in-stead of just the reflection coefficient of p–polarization as it is done in classicalSPR–devices, e.g. from Biacore. The tangent of Psi is proportional to the re-
Fig. 9.2. Sketch of an SPR–cell with the incoming and outgoing light beam andthe angle of incidence φ
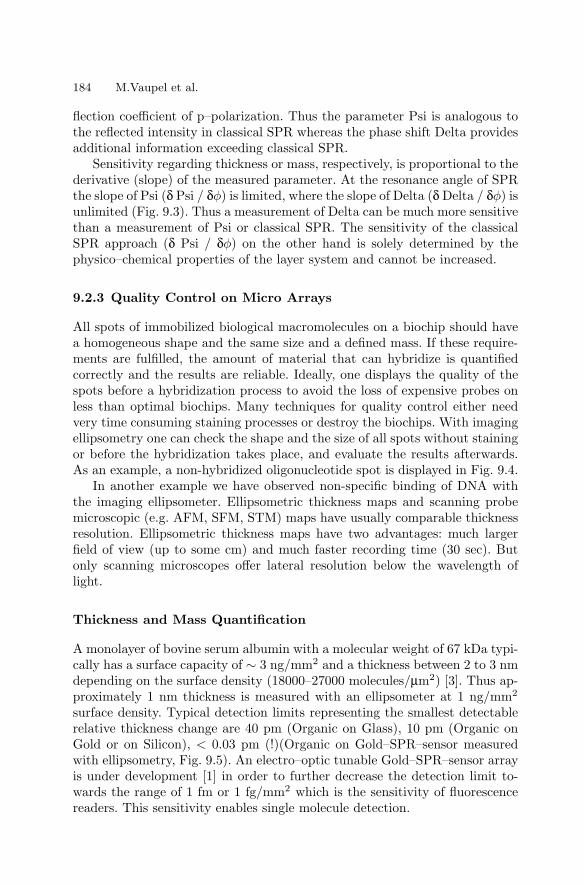
184 M.Vaupel et al.
flection coefficient of p–polarization. Thus the parameter Psi is analogous tothe reflected intensity in classical SPR whereas the phase shift Delta providesadditional information exceeding classical SPR.
Sensitivity regarding thickness or mass, respectively, is proportional to thederivative (slope) of the measured parameter. At the resonance angle of SPRthe slope of Psi (δ Psi / δφ) is limited, where the slope of Delta (δ Delta / δφ) isunlimited (Fig. 9.3). Thus a measurement of Delta can be much more sensitivethan a measurement of Psi or classical SPR. The sensitivity of the classicalSPR approach (δ Psi / δφ) on the other hand is solely determined by thephysico–chemical properties of the layer system and cannot be increased.
9.2.3 Quality Control on Micro Arrays
All spots of immobilized biological macromolecules on a biochip should havea homogeneous shape and the same size and a defined mass. If these require-ments are fulfilled, the amount of material that can hybridize is quantifiedcorrectly and the results are reliable. Ideally, one displays the quality of thespots before a hybridization process to avoid the loss of expensive probes onless than optimal biochips. Many techniques for quality control either needvery time consuming staining processes or destroy the biochips. With imagingellipsometry one can check the shape and the size of all spots without stainingor before the hybridization takes place, and evaluate the results afterwards.As an example, a non-hybridized oligonucleotide spot is displayed in Fig. 9.4.
In another example we have observed non-specific binding of DNA withthe imaging ellipsometer. Ellipsometric thickness maps and scanning probemicroscopic (e.g. AFM, SFM, STM) maps have usually comparable thicknessresolution. Ellipsometric thickness maps have two advantages: much largerfield of view (up to some cm) and much faster recording time (30 sec). Butonly scanning microscopes offer lateral resolution below the wavelength oflight.
Thickness and Mass Quantification
A monolayer of bovine serum albumin with a molecular weight of 67 kDa typi-cally has a surface capacity of ∼ 3 ng/mm2 and a thickness between 2 to 3 nmdepending on the surface density (18000–27000 molecules/µm2) [3]. Thus ap-proximately 1 nm thickness is measured with an ellipsometer at 1 ng/mm2
surface density. Typical detection limits representing the smallest detectablerelative thickness change are 40 pm (Organic on Glass), 10 pm (Organic onGold or on Silicon), < 0.03 pm (!)(Organic on Gold–SPR–sensor measuredwith ellipsometry, Fig. 9.5). An electro–optic tunable Gold–SPR–sensor arrayis under development [1] in order to further decrease the detection limit to-wards the range of 1 fm or 1 fg/mm2 which is the sensitivity of fluorescencereaders. This sensitivity enables single molecule detection.
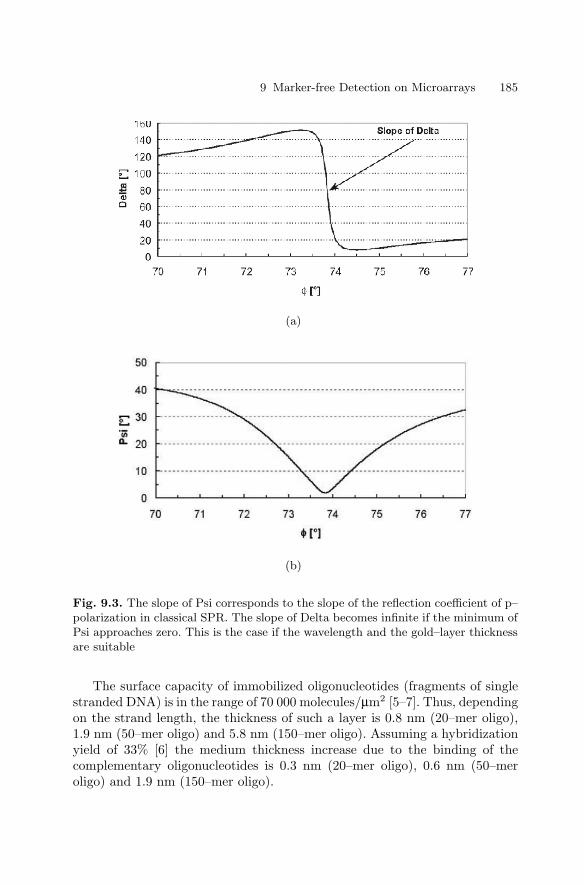
9 Marker-free Detection on Microarrays 185
(a)
(b)
Fig. 9.3. The slope of Psi corresponds to the slope of the reflection coefficient of p–polarization in classical SPR. The slope of Delta becomes infinite if the minimum ofPsi approaches zero. This is the case if the wavelength and the gold–layer thicknessare suitable
The surface capacity of immobilized oligonucleotides (fragments of singlestranded DNA) is in the range of 70 000 molecules/µm2 [5–7]. Thus, dependingon the strand length, the thickness of such a layer is 0.8 nm (20–mer oligo),1.9 nm (50–mer oligo) and 5.8 nm (150–mer oligo). Assuming a hybridizationyield of 33% [6] the medium thickness increase due to the binding of thecomplementary oligonucleotides is 0.3 nm (20–mer oligo), 0.6 nm (50–meroligo) and 1.9 nm (150–mer oligo).
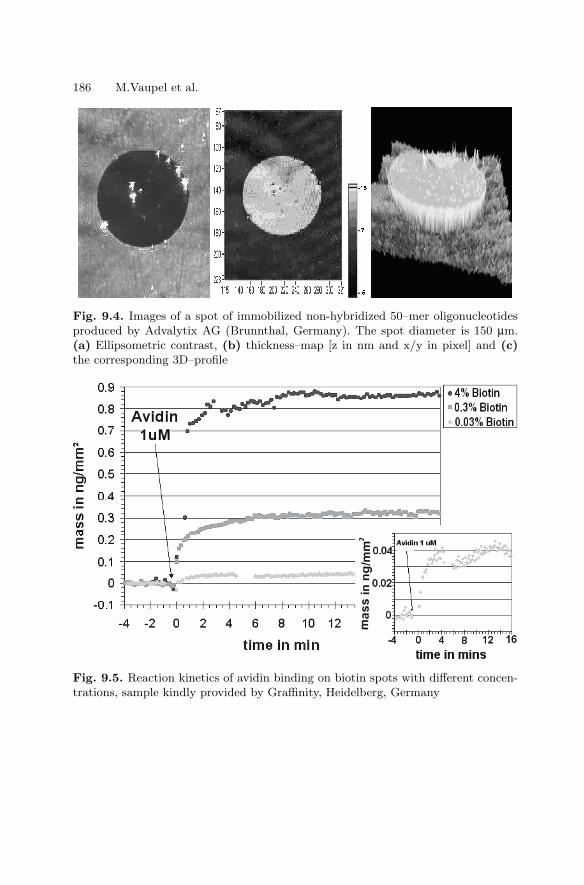
186 M.Vaupel et al.
Fig. 9.4. Images of a spot of immobilized non-hybridized 50–mer oligonucleotidesproduced by Advalytix AG (Brunnthal, Germany). The spot diameter is 150 µm.(a) Ellipsometric contrast, (b) thickness–map [z in nm and x/y in pixel] and (c)the corresponding 3D–profile
Fig. 9.5. Reaction kinetics of avidin binding on biotin spots with different concen-trations, sample kindly provided by Graffinity, Heidelberg, Germany
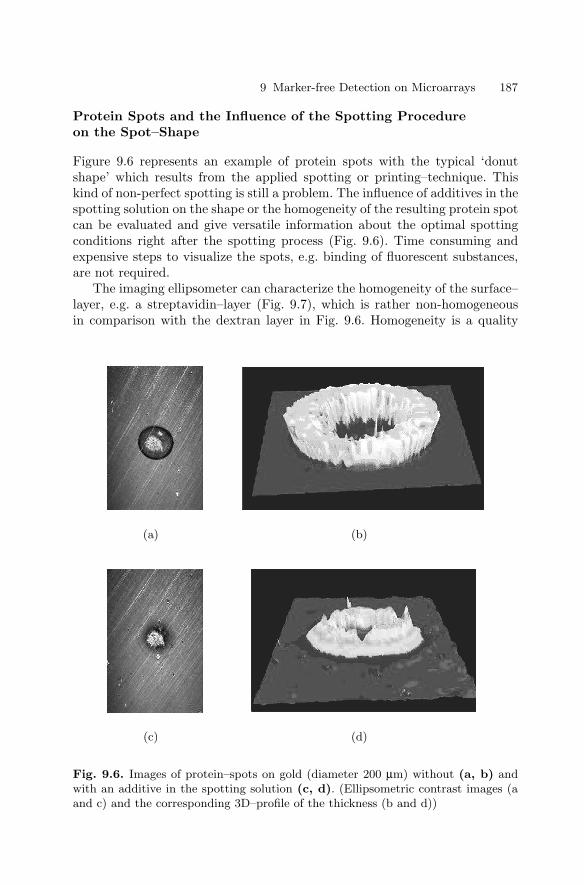
9 Marker-free Detection on Microarrays 187
Protein Spots and the Influence of the Spotting Procedureon the Spot–Shape
Figure 9.6 represents an example of protein spots with the typical ‘donutshape’ which results from the applied spotting or printing–technique. Thiskind of non-perfect spotting is still a problem. The influence of additives in thespotting solution on the shape or the homogeneity of the resulting protein spotcan be evaluated and give versatile information about the optimal spottingconditions right after the spotting process (Fig. 9.6). Time consuming andexpensive steps to visualize the spots, e.g. binding of fluorescent substances,are not required.
The imaging ellipsometer can characterize the homogeneity of the surface–layer, e.g. a streptavidin–layer (Fig. 9.7), which is rather non-homogeneousin comparison with the dextran layer in Fig. 9.6. Homogeneity is a quality
(a) (b)
(c) (d)
Fig. 9.6. Images of protein–spots on gold (diameter 200 µm) without (a, b) andwith an additive in the spotting solution (c, d). (Ellipsometric contrast images (aand c) and the corresponding 3D–profile of the thickness (b and d))
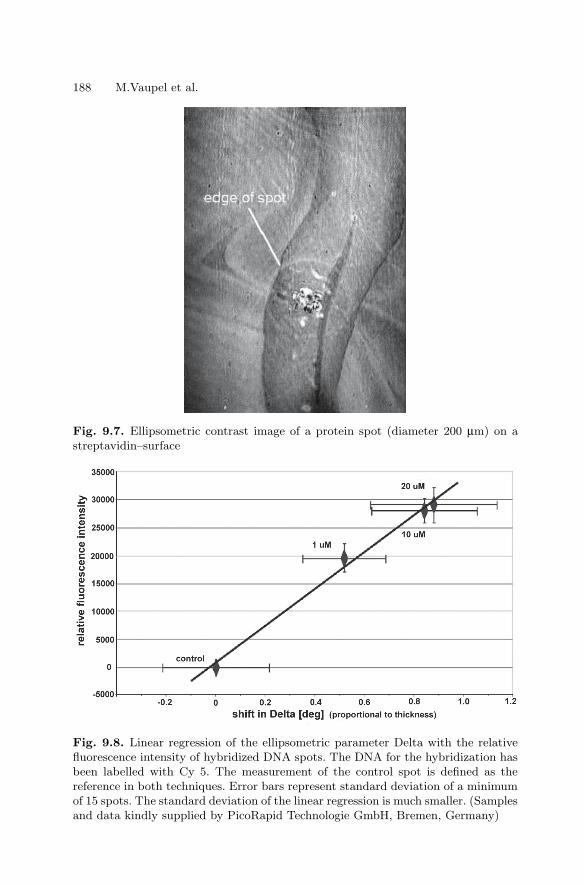
188 M.Vaupel et al.
Fig. 9.7. Ellipsometric contrast image of a protein spot (diameter 200 µm) on astreptavidin–surface
Fig. 9.8. Linear regression of the ellipsometric parameter Delta with the relativefluorescence intensity of hybridized DNA spots. The DNA for the hybridization hasbeen labelled with Cy 5. The measurement of the control spot is defined as thereference in both techniques. Error bars represent standard deviation of a minimumof 15 spots. The standard deviation of the linear regression is much smaller. (Samplesand data kindly supplied by PicoRapid Technologie GmbH, Bremen, Germany)
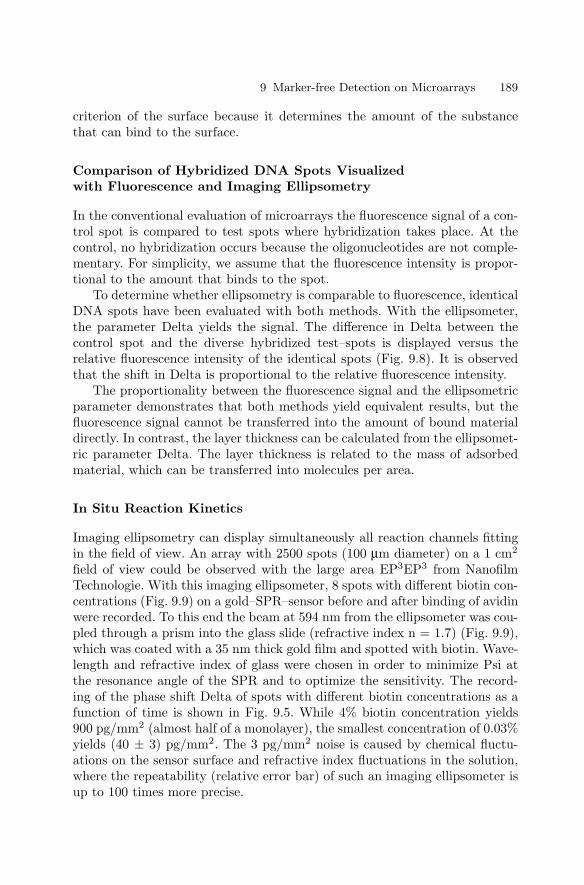
9 Marker-free Detection on Microarrays 189
criterion of the surface because it determines the amount of the substancethat can bind to the surface.
Comparison of Hybridized DNA Spots Visualizedwith Fluorescence and Imaging Ellipsometry
In the conventional evaluation of microarrays the fluorescence signal of a con-trol spot is compared to test spots where hybridization takes place. At thecontrol, no hybridization occurs because the oligonucleotides are not comple-mentary. For simplicity, we assume that the fluorescence intensity is propor-tional to the amount that binds to the spot.
To determine whether ellipsometry is comparable to fluorescence, identicalDNA spots have been evaluated with both methods. With the ellipsometer,the parameter Delta yields the signal. The difference in Delta between thecontrol spot and the diverse hybridized test–spots is displayed versus therelative fluorescence intensity of the identical spots (Fig. 9.8). It is observedthat the shift in Delta is proportional to the relative fluorescence intensity.
The proportionality between the fluorescence signal and the ellipsometricparameter demonstrates that both methods yield equivalent results, but thefluorescence signal cannot be transferred into the amount of bound materialdirectly. In contrast, the layer thickness can be calculated from the ellipsomet-ric parameter Delta. The layer thickness is related to the mass of adsorbedmaterial, which can be transferred into molecules per area.
In Situ Reaction Kinetics
Imaging ellipsometry can display simultaneously all reaction channels fittingin the field of view. An array with 2500 spots (100 µm diameter) on a 1 cm2
field of view could be observed with the large area EP3EP3 from NanofilmTechnologie. With this imaging ellipsometer, 8 spots with different biotin con-centrations (Fig. 9.9) on a gold–SPR–sensor before and after binding of avidinwere recorded. To this end the beam at 594 nm from the ellipsometer was cou-pled through a prism into the glass slide (refractive index n = 1.7) (Fig. 9.9),which was coated with a 35 nm thick gold film and spotted with biotin. Wave-length and refractive index of glass were chosen in order to minimize Psi atthe resonance angle of the SPR and to optimize the sensitivity. The record-ing of the phase shift Delta of spots with different biotin concentrations as afunction of time is shown in Fig. 9.5. While 4% biotin concentration yields900 pg/mm2 (almost half of a monolayer), the smallest concentration of 0.03%yields (40 ± 3) pg/mm2. The 3 pg/mm2 noise is caused by chemical fluctu-ations on the sensor surface and refractive index fluctuations in the solution,where the repeatability (relative error bar) of such an imaging ellipsometer isup to 100 times more precise.
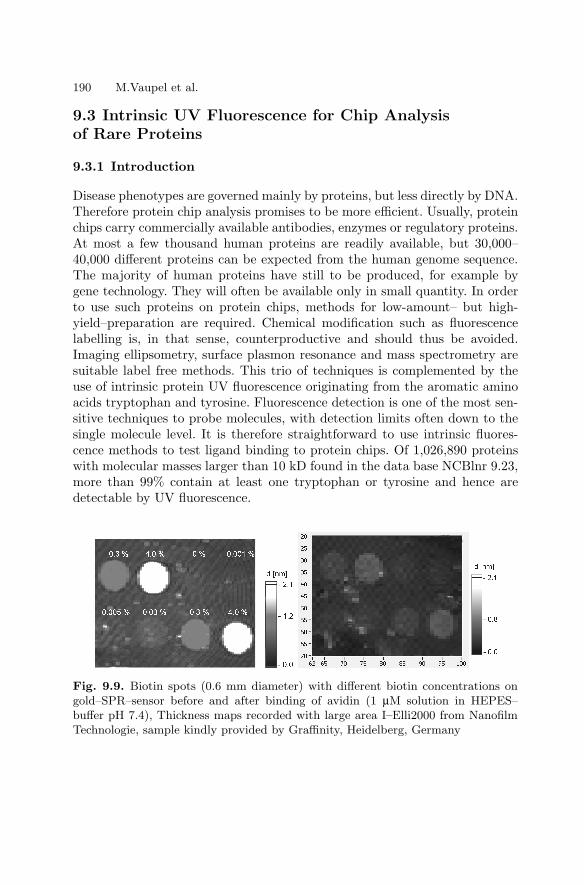
190 M.Vaupel et al.
9.3 Intrinsic UV Fluorescence for Chip Analysisof Rare Proteins
9.3.1 Introduction
Disease phenotypes are governed mainly by proteins, but less directly by DNA.Therefore protein chip analysis promises to be more efficient. Usually, proteinchips carry commercially available antibodies, enzymes or regulatory proteins.At most a few thousand human proteins are readily available, but 30,000–40,000 different proteins can be expected from the human genome sequence.The majority of human proteins have still to be produced, for example bygene technology. They will often be available only in small quantity. In orderto use such proteins on protein chips, methods for low-amount– but high-yield–preparation are required. Chemical modification such as fluorescencelabelling is, in that sense, counterproductive and should thus be avoided.Imaging ellipsometry, surface plasmon resonance and mass spectrometry aresuitable label free methods. This trio of techniques is complemented by theuse of intrinsic protein UV fluorescence originating from the aromatic aminoacids tryptophan and tyrosine. Fluorescence detection is one of the most sen-sitive techniques to probe molecules, with detection limits often down to thesingle molecule level. It is therefore straightforward to use intrinsic fluores-cence methods to test ligand binding to protein chips. Of 1,026,890 proteinswith molecular masses larger than 10 kD found in the data base NCBlnr 9.23,more than 99% contain at least one tryptophan or tyrosine and hence aredetectable by UV fluorescence.
Fig. 9.9. Biotin spots (0.6 mm diameter) with different biotin concentrations ongold–SPR–sensor before and after binding of avidin (1 µM solution in HEPES–buffer pH 7.4), Thickness maps recorded with large area I–Elli2000 from NanofilmTechnologie, sample kindly provided by Graffinity, Heidelberg, Germany
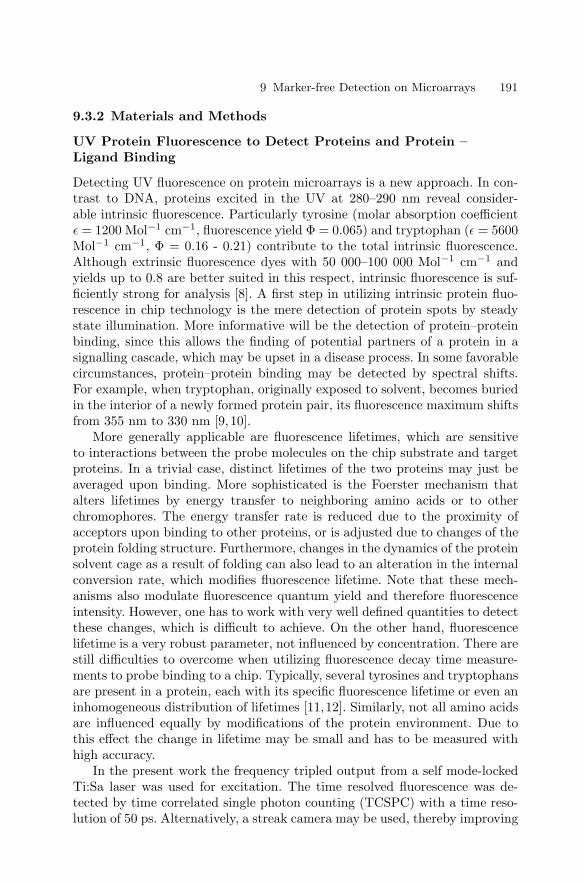
9 Marker-free Detection on Microarrays 191
9.3.2 Materials and Methods
UV Protein Fluorescence to Detect Proteins and Protein –Ligand Binding
Detecting UV fluorescence on protein microarrays is a new approach. In con-trast to DNA, proteins excited in the UV at 280–290 nm reveal consider-able intrinsic fluorescence. Particularly tyrosine (molar absorption coefficientε = 1200 Mol−1 cm−1, fluorescence yield Φ = 0.065) and tryptophan (ε = 5600Mol−1 cm−1, Φ = 0.16 - 0.21) contribute to the total intrinsic fluorescence.Although extrinsic fluorescence dyes with 50 000–100 000 Mol−1 cm−1 andyields up to 0.8 are better suited in this respect, intrinsic fluorescence is suf-ficiently strong for analysis [8]. A first step in utilizing intrinsic protein fluo-rescence in chip technology is the mere detection of protein spots by steadystate illumination. More informative will be the detection of protein–proteinbinding, since this allows the finding of potential partners of a protein in asignalling cascade, which may be upset in a disease process. In some favorablecircumstances, protein–protein binding may be detected by spectral shifts.For example, when tryptophan, originally exposed to solvent, becomes buriedin the interior of a newly formed protein pair, its fluorescence maximum shiftsfrom 355 nm to 330 nm [9,10].
More generally applicable are fluorescence lifetimes, which are sensitiveto interactions between the probe molecules on the chip substrate and targetproteins. In a trivial case, distinct lifetimes of the two proteins may just beaveraged upon binding. More sophisticated is the Foerster mechanism thatalters lifetimes by energy transfer to neighboring amino acids or to otherchromophores. The energy transfer rate is reduced due to the proximity ofacceptors upon binding to other proteins, or is adjusted due to changes of theprotein folding structure. Furthermore, changes in the dynamics of the proteinsolvent cage as a result of folding can also lead to an alteration in the internalconversion rate, which modifies fluorescence lifetime. Note that these mech-anisms also modulate fluorescence quantum yield and therefore fluorescenceintensity. However, one has to work with very well defined quantities to detectthese changes, which is difficult to achieve. On the other hand, fluorescencelifetime is a very robust parameter, not influenced by concentration. There arestill difficulties to overcome when utilizing fluorescence decay time measure-ments to probe binding to a chip. Typically, several tyrosines and tryptophansare present in a protein, each with its specific fluorescence lifetime or even aninhomogeneous distribution of lifetimes [11,12]. Similarly, not all amino acidsare influenced equally by modifications of the protein environment. Due tothis effect the change in lifetime may be small and has to be measured withhigh accuracy.
In the present work the frequency tripled output from a self mode-lockedTi:Sa laser was used for excitation. The time resolved fluorescence was de-tected by time correlated single photon counting (TCSPC) with a time reso-lution of 50 ps. Alternatively, a streak camera may be used, thereby improving
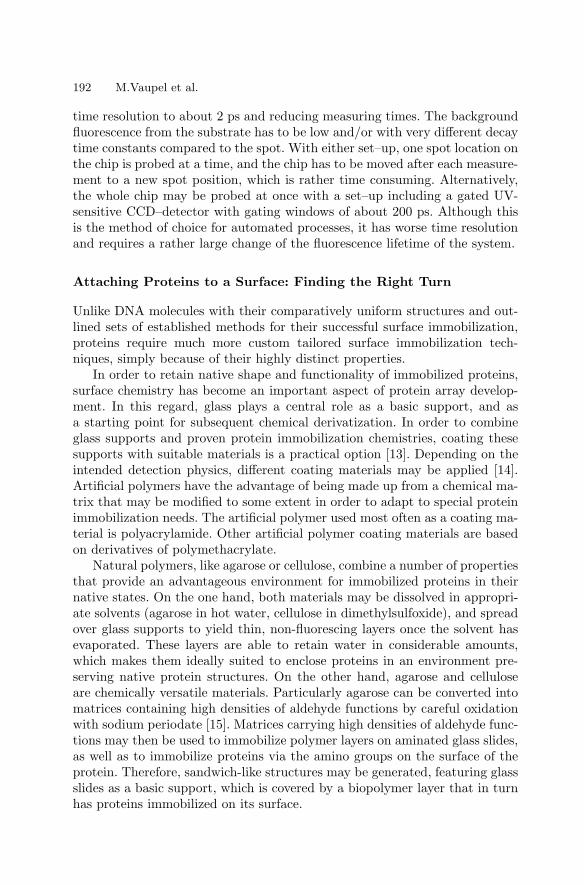
192 M.Vaupel et al.
time resolution to about 2 ps and reducing measuring times. The backgroundfluorescence from the substrate has to be low and/or with very different decaytime constants compared to the spot. With either set–up, one spot location onthe chip is probed at a time, and the chip has to be moved after each measure-ment to a new spot position, which is rather time consuming. Alternatively,the whole chip may be probed at once with a set–up including a gated UV-sensitive CCD–detector with gating windows of about 200 ps. Although thisis the method of choice for automated processes, it has worse time resolutionand requires a rather large change of the fluorescence lifetime of the system.
Attaching Proteins to a Surface: Finding the Right Turn
Unlike DNA molecules with their comparatively uniform structures and out-lined sets of established methods for their successful surface immobilization,proteins require much more custom tailored surface immobilization tech-niques, simply because of their highly distinct properties.
In order to retain native shape and functionality of immobilized proteins,surface chemistry has become an important aspect of protein array develop-ment. In this regard, glass plays a central role as a basic support, and asa starting point for subsequent chemical derivatization. In order to combineglass supports and proven protein immobilization chemistries, coating thesesupports with suitable materials is a practical option [13]. Depending on theintended detection physics, different coating materials may be applied [14].Artificial polymers have the advantage of being made up from a chemical ma-trix that may be modified to some extent in order to adapt to special proteinimmobilization needs. The artificial polymer used most often as a coating ma-terial is polyacrylamide. Other artificial polymer coating materials are basedon derivatives of polymethacrylate.
Natural polymers, like agarose or cellulose, combine a number of propertiesthat provide an advantageous environment for immobilized proteins in theirnative states. On the one hand, both materials may be dissolved in appropri-ate solvents (agarose in hot water, cellulose in dimethylsulfoxide), and spreadover glass supports to yield thin, non-fluorescing layers once the solvent hasevaporated. These layers are able to retain water in considerable amounts,which makes them ideally suited to enclose proteins in an environment pre-serving native protein structures. On the other hand, agarose and celluloseare chemically versatile materials. Particularly agarose can be converted intomatrices containing high densities of aldehyde functions by careful oxidationwith sodium periodate [15]. Matrices carrying high densities of aldehyde func-tions may then be used to immobilize polymer layers on aminated glass slides,as well as to immobilize proteins via the amino groups on the surface of theprotein. Therefore, sandwich-like structures may be generated, featuring glassslides as a basic support, which is covered by a biopolymer layer that in turnhas proteins immobilized on its surface.
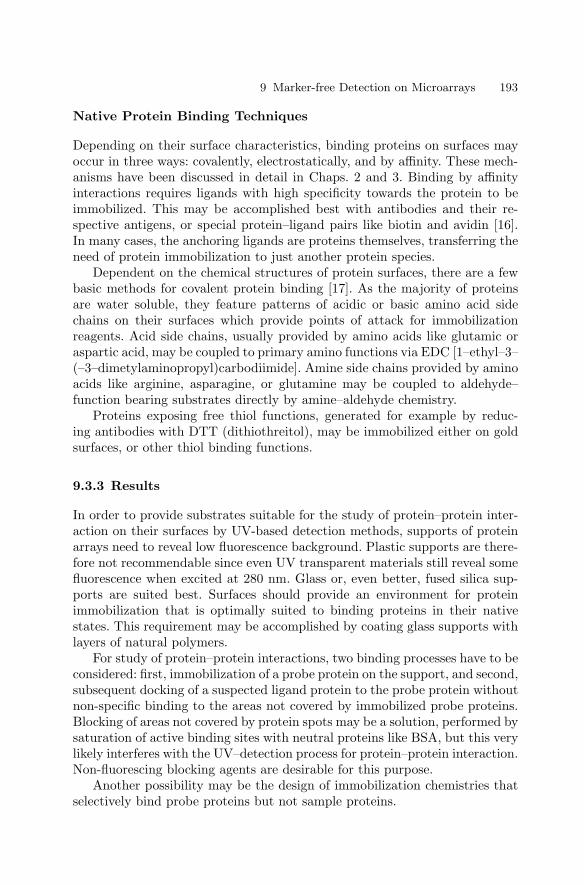
9 Marker-free Detection on Microarrays 193
Native Protein Binding Techniques
Depending on their surface characteristics, binding proteins on surfaces mayoccur in three ways: covalently, electrostatically, and by affinity. These mech-anisms have been discussed in detail in Chaps. 2 and 3. Binding by affinityinteractions requires ligands with high specificity towards the protein to beimmobilized. This may be accomplished best with antibodies and their re-spective antigens, or special protein–ligand pairs like biotin and avidin [16].In many cases, the anchoring ligands are proteins themselves, transferring theneed of protein immobilization to just another protein species.
Dependent on the chemical structures of protein surfaces, there are a fewbasic methods for covalent protein binding [17]. As the majority of proteinsare water soluble, they feature patterns of acidic or basic amino acid sidechains on their surfaces which provide points of attack for immobilizationreagents. Acid side chains, usually provided by amino acids like glutamic oraspartic acid, may be coupled to primary amino functions via EDC [1–ethyl–3–(–3–dimetylaminopropyl)carbodiimide]. Amine side chains provided by aminoacids like arginine, asparagine, or glutamine may be coupled to aldehyde–function bearing substrates directly by amine–aldehyde chemistry.
Proteins exposing free thiol functions, generated for example by reduc-ing antibodies with DTT (dithiothreitol), may be immobilized either on goldsurfaces, or other thiol binding functions.
9.3.3 Results
In order to provide substrates suitable for the study of protein–protein inter-action on their surfaces by UV-based detection methods, supports of proteinarrays need to reveal low fluorescence background. Plastic supports are there-fore not recommendable since even UV transparent materials still reveal somefluorescence when excited at 280 nm. Glass or, even better, fused silica sup-ports are suited best. Surfaces should provide an environment for proteinimmobilization that is optimally suited to binding proteins in their nativestates. This requirement may be accomplished by coating glass supports withlayers of natural polymers.
For study of protein–protein interactions, two binding processes have to beconsidered: first, immobilization of a probe protein on the support, and second,subsequent docking of a suspected ligand protein to the probe protein withoutnon-specific binding to the areas not covered by immobilized probe proteins.Blocking of areas not covered by protein spots may be a solution, performed bysaturation of active binding sites with neutral proteins like BSA, but this verylikely interferes with the UV–detection process for protein–protein interaction.Non-fluorescing blocking agents are desirable for this purpose.
Another possibility may be the design of immobilization chemistries thatselectively bind probe proteins but not sample proteins.
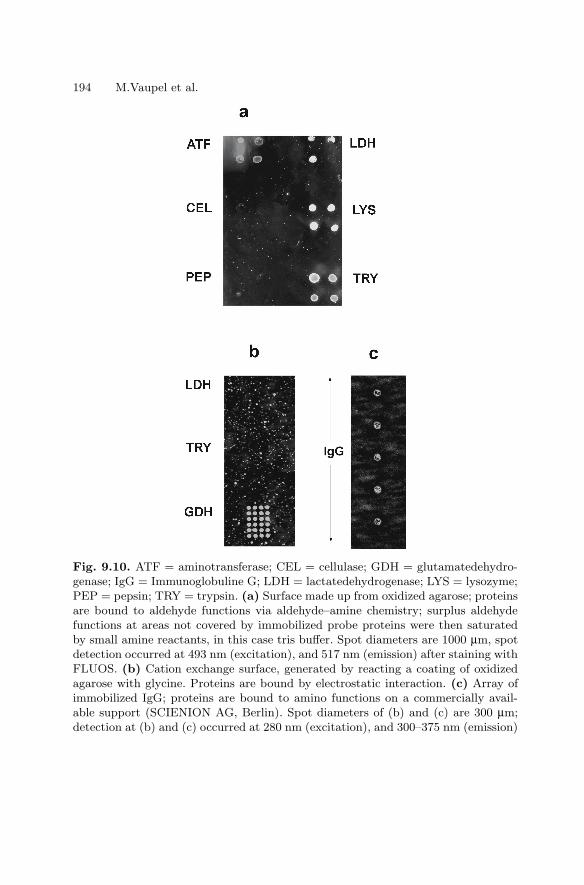
194 M.Vaupel et al.
Fig. 9.10. ATF = aminotransferase; CEL = cellulase; GDH = glutamatedehydro-genase; IgG = Immunoglobuline G; LDH = lactatedehydrogenase; LYS = lysozyme;PEP = pepsin; TRY = trypsin. (a) Surface made up from oxidized agarose; proteinsare bound to aldehyde functions via aldehyde–amine chemistry; surplus aldehydefunctions at areas not covered by immobilized probe proteins were then saturatedby small amine reactants, in this case tris buffer. Spot diameters are 1000 µm, spotdetection occurred at 493 nm (excitation), and 517 nm (emission) after staining withFLUOS. (b) Cation exchange surface, generated by reacting a coating of oxidizedagarose with glycine. Proteins are bound by electrostatic interaction. (c) Array ofimmobilized IgG; proteins are bound to amino functions on a commercially avail-able support (SCIENION AG, Berlin). Spot diameters of (b) and (c) are 300 µm;detection at (b) and (c) occurred at 280 nm (excitation), and 300–375 nm (emission)
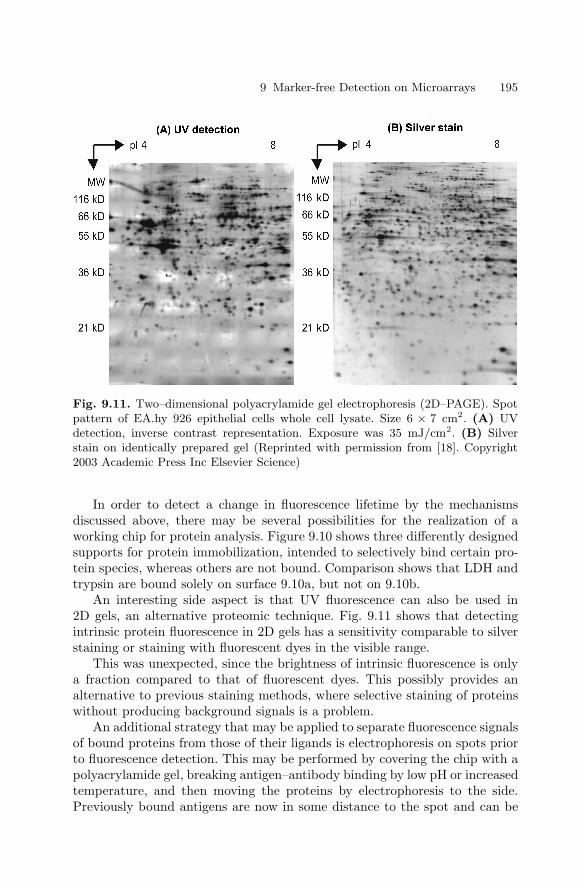
9 Marker-free Detection on Microarrays 195
Fig. 9.11. Two–dimensional polyacrylamide gel electrophoresis (2D–PAGE). Spotpattern of EA.hy 926 epithelial cells whole cell lysate. Size 6 × 7 cm2. (A) UVdetection, inverse contrast representation. Exposure was 35 mJ/cm2. (B) Silverstain on identically prepared gel (Reprinted with permission from [18]. Copyright2003 Academic Press Inc Elsevier Science)
In order to detect a change in fluorescence lifetime by the mechanismsdiscussed above, there may be several possibilities for the realization of aworking chip for protein analysis. Figure 9.10 shows three differently designedsupports for protein immobilization, intended to selectively bind certain pro-tein species, whereas others are not bound. Comparison shows that LDH andtrypsin are bound solely on surface 9.10a, but not on 9.10b.
An interesting side aspect is that UV fluorescence can also be used in2D gels, an alternative proteomic technique. Fig. 9.11 shows that detectingintrinsic protein fluorescence in 2D gels has a sensitivity comparable to silverstaining or staining with fluorescent dyes in the visible range.
This was unexpected, since the brightness of intrinsic fluorescence is onlya fraction compared to that of fluorescent dyes. This possibly provides analternative to previous staining methods, where selective staining of proteinswithout producing background signals is a problem.
An additional strategy that may be applied to separate fluorescence signalsof bound proteins from those of their ligands is electrophoresis on spots priorto fluorescence detection. This may be performed by covering the chip with apolyacrylamide gel, breaking antigen–antibody binding by low pH or increasedtemperature, and then moving the proteins by electrophoresis to the side.Previously bound antigens are now in some distance to the spot and can be
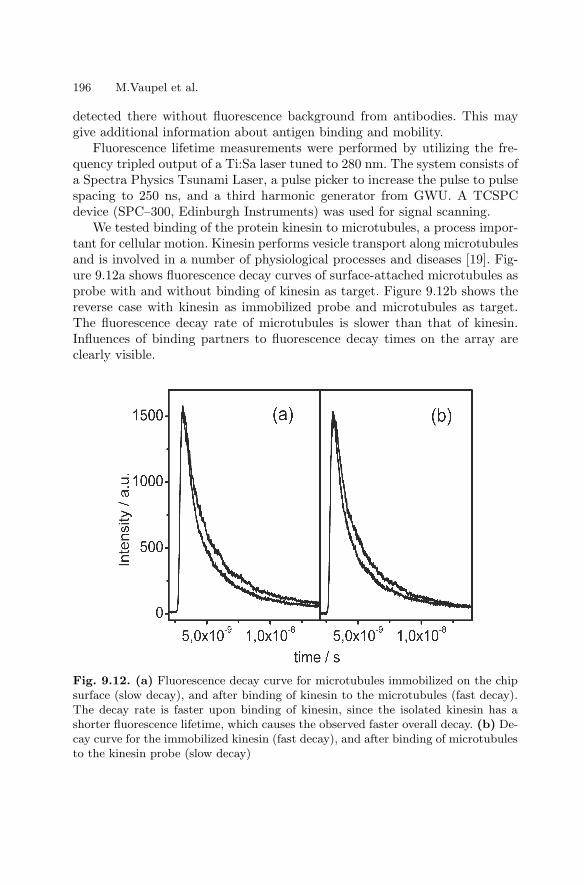
196 M.Vaupel et al.
detected there without fluorescence background from antibodies. This maygive additional information about antigen binding and mobility.
Fluorescence lifetime measurements were performed by utilizing the fre-quency tripled output of a Ti:Sa laser tuned to 280 nm. The system consists ofa Spectra Physics Tsunami Laser, a pulse picker to increase the pulse to pulsespacing to 250 ns, and a third harmonic generator from GWU. A TCSPCdevice (SPC–300, Edinburgh Instruments) was used for signal scanning.
We tested binding of the protein kinesin to microtubules, a process impor-tant for cellular motion. Kinesin performs vesicle transport along microtubulesand is involved in a number of physiological processes and diseases [19]. Fig-ure 9.12a shows fluorescence decay curves of surface-attached microtubules asprobe with and without binding of kinesin as target. Figure 9.12b shows thereverse case with kinesin as immobilized probe and microtubules as target.The fluorescence decay rate of microtubules is slower than that of kinesin.Influences of binding partners to fluorescence decay times on the array areclearly visible.
Fig. 9.12. (a) Fluorescence decay curve for microtubules immobilized on the chipsurface (slow decay), and after binding of kinesin to the microtubules (fast decay).The decay rate is faster upon binding of kinesin, since the isolated kinesin has ashorter fluorescence lifetime, which causes the observed faster overall decay. (b) De-cay curve for the immobilized kinesin (fast decay), and after binding of microtubulesto the kinesin probe (slow decay)
9 Marker-free Detection on Microarrays 197
9.3.4 Discussion
The fabrication of protein microarrays is challenging, because due to the gen-erally high variations between proteins and their binding needs, every singleprotein has to be checked for its own optimal immobilization conditions. Thiswill be a time and resource consuming task, particularly if protein arrays withmany proteins in their native states are under consideration.
Additional difficulties have to be overcome if non-modifying protein de-tection methods are to be applied. A new non-modifying detection method isintrinsic UV–detection.
Apparently this saves material and costs. Furthermore, omitting of stain-ing speeds up the whole procedure, an important aspect with regard to phar-maceutical screening purposes. Also, working with unaltered proteins reduceserrors caused by the staining process. This includes malfunctions due to dyesand tags or false quantification due to variations in staining yield. Detectionof intrinsic fluorescence is faster and cheaper than mass spectrometry. Samplehandling and reproducibility is comparative to standard fluorescence detec-tion procedures. Its great advantages derive from economic material use, shortanalysis times, and handling of samples in native, non-modified states.
9.4 Genetic Diagnostics with Unlabelled DNA
In recent years, nucleic acid chip technology has been a subject of growinginterest for clinical diagnostics as well as for sequencing DNA and cDNAs, forpartial sequencing of clones, for single nucleotide polymorphism (SNPs) stud-ies, and for identification of expressed genes. Nucleic acid chips are based onthe method of sequencing by hybridization, where unknown DNA fragmentsare hybridized to complementary nucleic acid sequences, which are immobi-lized on a solid surface in an array format. The main variables in this processare the attachment of the nucleic acid sequences to a solid surface, the condi-tions for hybridization, and the detection of the hybridized DNA sequences.
Currently, various techniques are used to detect hybridized DNAs/RNAs,many described in other chapters of this book. Most of them use PCR foramplification, and labelling procedures such as fluorescent, colorimetric or ra-dioactive tags for detection. Also, a number of approaches have been made us-ing stable isotope as tags [20,21]. Indirect methods such as ultraviolet matrix-assisted laser desorption / ionization mass spectrometry (MALDI–MS) [22–26]limit the size of the DNA samples examined to around 50 to 80 bases.
These disadvantages can be avoided by using peptide nucleic acid (PNA)microarray chips [27–36]. With this microarray chip, label-free and PCR-freeDNA diagnostics should become possible [3, 37–42]. PNA is a synthesizedDNA analog in which both the phosphate and the deoxyribose of the DNAbackbone are replaced by polypeptides (see Fig. 9.13). These DNA analogspossess the ability to hybridize with complementary DNA or RNA sequences.
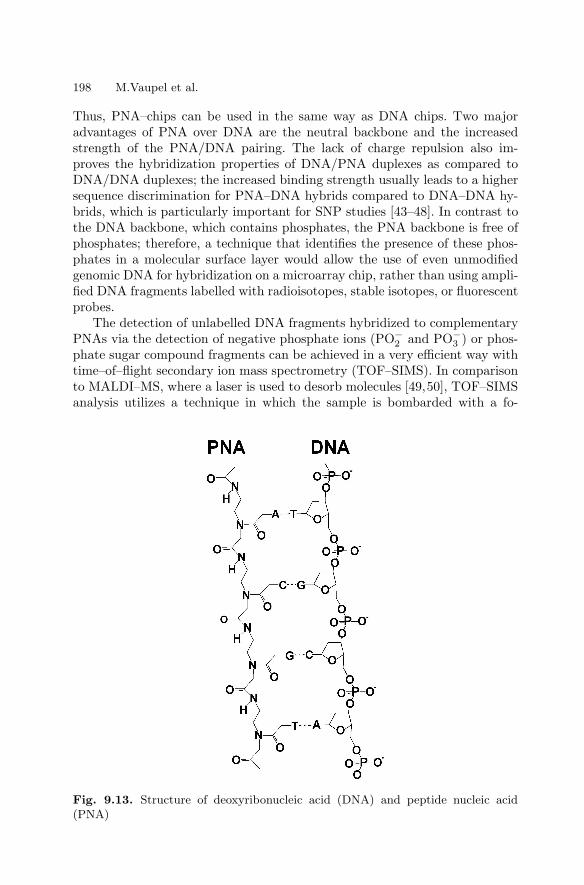
198 M.Vaupel et al.
Thus, PNA–chips can be used in the same way as DNA chips. Two majoradvantages of PNA over DNA are the neutral backbone and the increasedstrength of the PNA/DNA pairing. The lack of charge repulsion also im-proves the hybridization properties of DNA/PNA duplexes as compared toDNA/DNA duplexes; the increased binding strength usually leads to a highersequence discrimination for PNA–DNA hybrids compared to DNA–DNA hy-brids, which is particularly important for SNP studies [43–48]. In contrast tothe DNA backbone, which contains phosphates, the PNA backbone is free ofphosphates; therefore, a technique that identifies the presence of these phos-phates in a molecular surface layer would allow the use of even unmodifiedgenomic DNA for hybridization on a microarray chip, rather than using ampli-fied DNA fragments labelled with radioisotopes, stable isotopes, or fluorescentprobes.
The detection of unlabelled DNA fragments hybridized to complementaryPNAs via the detection of negative phosphate ions (PO−
2 and PO−3 ) or phos-
phate sugar compound fragments can be achieved in a very efficient way withtime–of–flight secondary ion mass spectrometry (TOF–SIMS). In comparisonto MALDI–MS, where a laser is used to desorb molecules [49,50], TOF–SIMSanalysis utilizes a technique in which the sample is bombarded with a fo-
Fig. 9.13. Structure of deoxyribonucleic acid (DNA) and peptide nucleic acid(PNA)

9 Marker-free Detection on Microarrays 199
cused, energetic ion beam that sputters atoms, clusters or large molecules (upto 10,000 amu) off the surface [51–54]. Most of these originate from the topmonolayer. The ionized sputtered secondary particles can be directly detectedwith a time–of–flight mass spectrometer (TOF–MS).
Two types of ion source are particularly suited for TOF–SIMS. The firstone produces positive noble gas ions (usually argon or xenon) either by elec-tron impact (EI) or in a plasma created by a discharge. The ions are then ex-tracted from the source region, accelerated to the chosen energy and focusedin an electrostatic ion optical column. More recently it has been shown thatthe use of primary polyatomic ions such as SF+
5 , created in EI sources, couldenhance the molecular secondary ion yield by several magnitudes [38,55].
The second type of ion gun produces positive ions from a liquid metal(gallium, indium or gold) [56]. Because the ion production occurs in a verysmall volume, gallium liquid metal ion sources have a very high brightness.As a result, the ion beam may be focused to a fine spot, resulting in a spotsize of 0.2 µm at 8–10 keV or about 20 nm at 30 keV, while being pulsed atfrequencies of up to 50 kHz and rastered at the same time.
All ion gun optical columns provide deflection plates for scanning the ionbeam over areas adjustable from many square millimeters to a few squaremicrometers. They have been adapted for pulsing by the introduction of de-flection plates, which rapidly sweep the beam across an aperture. Applyingan ion beam bunching technique, ion pulses of less than 1 ns width can beproduced.
In a TOF mass analyzer (Fig. 9.14), all sputtered ions are acceleratedwith an extraction voltage of U0 to a given potential, so that all ions possessthe same kinetic energy. The ions are then allowed to drift through a field-free drift path of a given length L before striking the detector. According tothe equation (mL2)/(2t2) = qU0, light ions travel the fixed distance throughthe flight tube more rapidly than identically charged heavy ions. Thus, themeasurement of the time, t, of ions with mass–to–charge ratio, m/q, provides asimple means of mass analysis with t2 = (mL2)/(2qU0) ∝ m/q. Because a verywell defined start time is required for the flight time measurement, the primaryion gun has to be operated in a pulsed mode in order to be able to deliverdiscrete primary–ion packages [57]. Electric fields (e.g., ion mirrors [58,59] orelectrical sectors [60, 61]) are used in the drift path in order to compensatefor different incident energies and angular distributions of the secondary ions.For good mass resolution, the flight path must be sufficiently long (1–1.5 m),and very sophisticated high frequency pulsing and counting systems mustbe employed to time the flight of the ion to within a sub–nanosecond. Onegreat advantage of TOF–MS is its ability to provide simultaneous detectionof all masses of the same polarity. Charge compensation for insulator analysisis possible using pulsed low-energy electrons, which are introduced duringthe time interval between ion pulses. With such a TOF–SIMS instrument,the useful mass range is extended beyond 10,000 amu; the mass resolution,
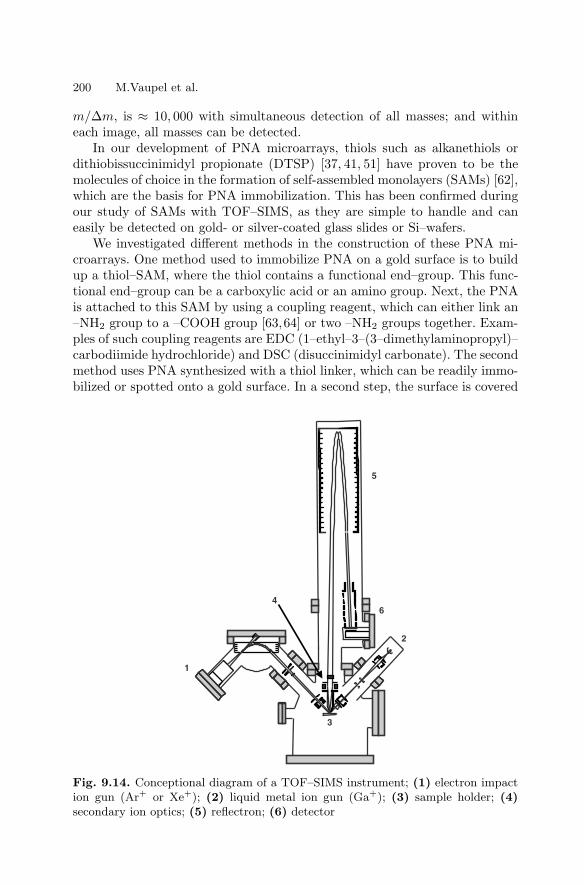
200 M.Vaupel et al.
m/∆m, is ≈ 10, 000 with simultaneous detection of all masses; and withineach image, all masses can be detected.
In our development of PNA microarrays, thiols such as alkanethiols ordithiobissuccinimidyl propionate (DTSP) [37, 41, 51] have proven to be themolecules of choice in the formation of self-assembled monolayers (SAMs) [62],which are the basis for PNA immobilization. This has been confirmed duringour study of SAMs with TOF–SIMS, as they are simple to handle and caneasily be detected on gold- or silver-coated glass slides or Si–wafers.
We investigated different methods in the construction of these PNA mi-croarrays. One method used to immobilize PNA on a gold surface is to buildup a thiol–SAM, where the thiol contains a functional end–group. This func-tional end–group can be a carboxylic acid or an amino group. Next, the PNAis attached to this SAM by using a coupling reagent, which can either link an–NH2 group to a –COOH group [63,64] or two –NH2 groups together. Exam-ples of such coupling reagents are EDC (1–ethyl–3–(3–dimethylaminopropyl)–carbodiimide hydrochloride) and DSC (disuccinimidyl carbonate). The secondmethod uses PNA synthesized with a thiol linker, which can be readily immo-bilized or spotted onto a gold surface. In a second step, the surface is covered
1
2
3
4
5
6
Fig. 9.14. Conceptional diagram of a TOF–SIMS instrument; (1) electron impaction gun (Ar+ or Xe+); (2) liquid metal ion gun (Ga+); (3) sample holder; (4)secondary ion optics; (5) reflectron; (6) detector
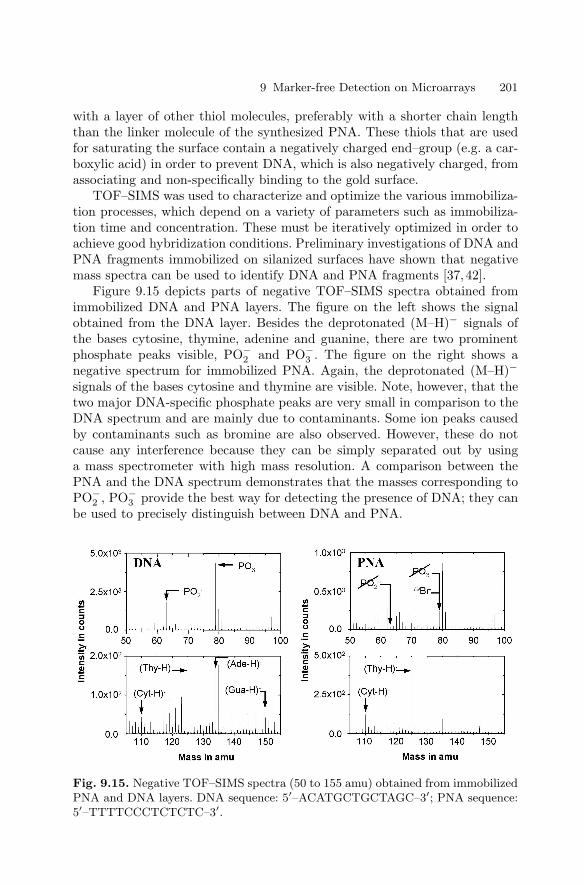
9 Marker-free Detection on Microarrays 201
with a layer of other thiol molecules, preferably with a shorter chain lengththan the linker molecule of the synthesized PNA. These thiols that are usedfor saturating the surface contain a negatively charged end–group (e.g. a car-boxylic acid) in order to prevent DNA, which is also negatively charged, fromassociating and non-specifically binding to the gold surface.
TOF–SIMS was used to characterize and optimize the various immobiliza-tion processes, which depend on a variety of parameters such as immobiliza-tion time and concentration. These must be iteratively optimized in order toachieve good hybridization conditions. Preliminary investigations of DNA andPNA fragments immobilized on silanized surfaces have shown that negativemass spectra can be used to identify DNA and PNA fragments [37,42].
Figure 9.15 depicts parts of negative TOF–SIMS spectra obtained fromimmobilized DNA and PNA layers. The figure on the left shows the signalobtained from the DNA layer. Besides the deprotonated (M–H)− signals ofthe bases cytosine, thymine, adenine and guanine, there are two prominentphosphate peaks visible, PO−
2 and PO−3 . The figure on the right shows a
negative spectrum for immobilized PNA. Again, the deprotonated (M–H)−
signals of the bases cytosine and thymine are visible. Note, however, that thetwo major DNA-specific phosphate peaks are very small in comparison to theDNA spectrum and are mainly due to contaminants. Some ion peaks causedby contaminants such as bromine are also observed. However, these do notcause any interference because they can be simply separated out by usinga mass spectrometer with high mass resolution. A comparison between thePNA and the DNA spectrum demonstrates that the masses corresponding toPO−
2 , PO−3 provide the best way for detecting the presence of DNA; they can
be used to precisely distinguish between DNA and PNA.
Fig. 9.15. Negative TOF–SIMS spectra (50 to 155 amu) obtained from immobilizedPNA and DNA layers. DNA sequence: 5′–ACATGCTGCTAGC–3′; PNA sequence:5′–TTTTCCCTCTCTC–3′.
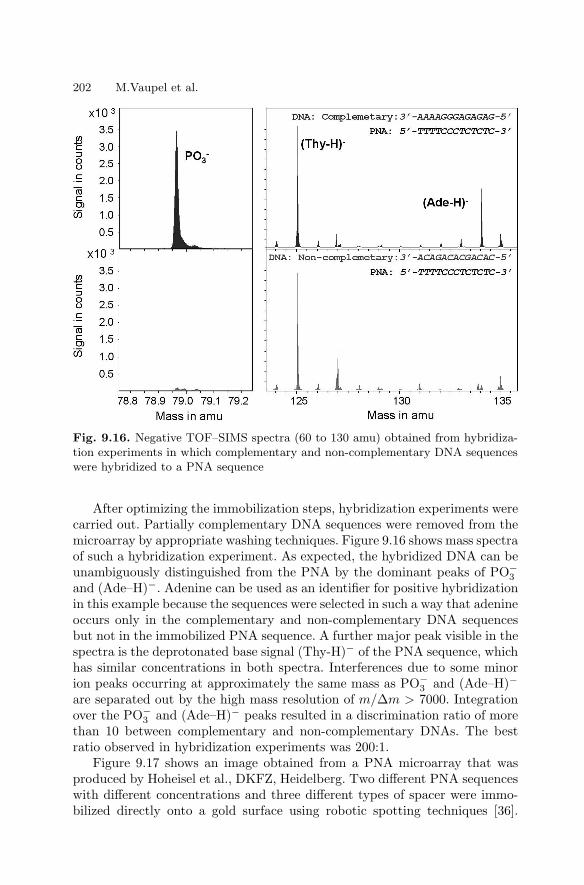
202 M.Vaupel et al.
Fig. 9.16. Negative TOF–SIMS spectra (60 to 130 amu) obtained from hybridiza-tion experiments in which complementary and non-complementary DNA sequenceswere hybridized to a PNA sequence
After optimizing the immobilization steps, hybridization experiments werecarried out. Partially complementary DNA sequences were removed from themicroarray by appropriate washing techniques. Figure 9.16 shows mass spectraof such a hybridization experiment. As expected, the hybridized DNA can beunambiguously distinguished from the PNA by the dominant peaks of PO−
3
and (Ade–H)−. Adenine can be used as an identifier for positive hybridizationin this example because the sequences were selected in such a way that adenineoccurs only in the complementary and non-complementary DNA sequencesbut not in the immobilized PNA sequence. A further major peak visible in thespectra is the deprotonated base signal (Thy-H)− of the PNA sequence, whichhas similar concentrations in both spectra. Interferences due to some minorion peaks occurring at approximately the same mass as PO−
3 and (Ade–H)−
are separated out by the high mass resolution of m/∆m > 7000. Integrationover the PO−
3 and (Ade–H)− peaks resulted in a discrimination ratio of morethan 10 between complementary and non-complementary DNAs. The bestratio observed in hybridization experiments was 200:1.
Figure 9.17 shows an image obtained from a PNA microarray that wasproduced by Hoheisel et al., DKFZ, Heidelberg. Two different PNA sequenceswith different concentrations and three different types of spacer were immo-bilized directly onto a gold surface using robotic spotting techniques [36].
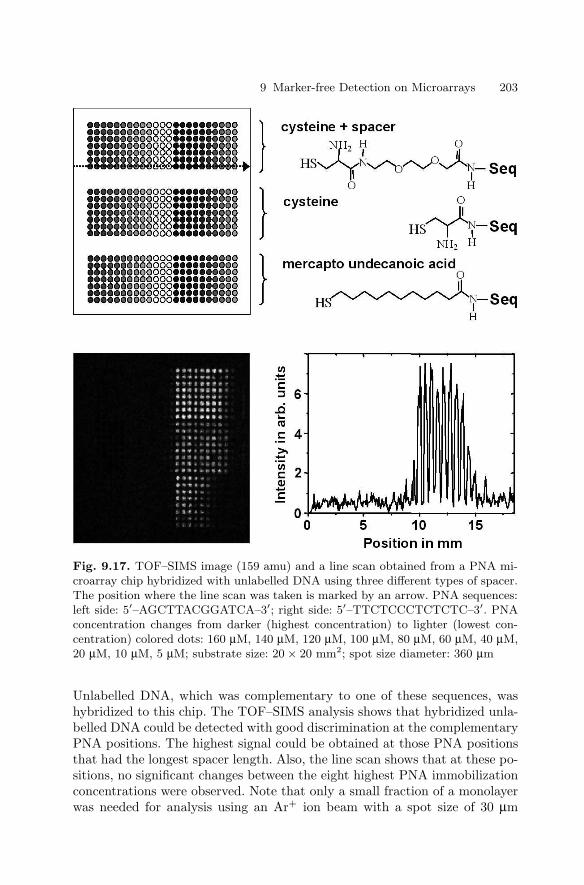
9 Marker-free Detection on Microarrays 203
Fig. 9.17. TOF–SIMS image (159 amu) and a line scan obtained from a PNA mi-croarray chip hybridized with unlabelled DNA using three different types of spacer.The position where the line scan was taken is marked by an arrow. PNA sequences:left side: 5′–AGCTTACGGATCA–3′; right side: 5′–TTCTCCCTCTCTC–3′. PNAconcentration changes from darker (highest concentration) to lighter (lowest con-centration) colored dots: 160 µM, 140 µM, 120 µM, 100 µM, 80 µM, 60 µM, 40 µM,20 µM, 10 µM, 5 µM; substrate size: 20 × 20 mm2; spot size diameter: 360 µm
Unlabelled DNA, which was complementary to one of these sequences, washybridized to this chip. The TOF–SIMS analysis shows that hybridized unla-belled DNA could be detected with good discrimination at the complementaryPNA positions. The highest signal could be obtained at those PNA positionsthat had the longest spacer length. Also, the line scan shows that at these po-sitions, no significant changes between the eight highest PNA immobilizationconcentrations were observed. Note that only a small fraction of a monolayerwas needed for analysis using an Ar+ ion beam with a spot size of 30 µm
204 M.Vaupel et al.
in diameter. Additional experiments showed that it is even possible to detectDNA in an area of less than 100 nm in diameter using a focussed Ga+ ionbeam, corresponding to attomole sensitivity.
The data clearly show that TOF–SIMS is a powerful technique for identi-fying unambiguously hybridized unlabelled DNA on PNA microarray chips bydetecting the phosphate or phosphate-containing compounds present in DNA.It is also very suitable for studying the complexity of the immobilization andhybridization process. Employing unlabelled DNA has several advantages overusing fluorescent and radioactive labelling procedures, such as higher signal–to–noise ratio, higher sensitivity, absence of a labelling or amplification pro-cedure, and direct analysis of hybridized genomic DNA. Particularly, the in-crease in the number of phosphates with increasing sequence length will beadvantageous for sequencing genomic DNA. In future experiments, the spotsize will be reduced to smaller than 10 × 10 µm2, the repetition rate will beincreased up to 200 kHz, and the sensitivity will be further improved by usingpolyatomic primary ions such as SF+
5 or gold cluster ions [38]. With theseexperimental improvements, analysis time of only a few minutes for 10,000immobilized PNA spots should become possible for genetic diagnostics.
References
1. Project “SCREEN” for foundations of laser based (marker–free) screening meth-ods, for which all authors of this chapter acknowledge funding by the GermanMinistry of Research
2. Azzam RMA and Bashara NM, Ellipsometry and Polarized Light. North HollandPhysics, 1987
3. Arwin H in: “Physical Chemistry of Biological Interfaces”, Baszkin A., NordeW. (ed.), 2000, 577–607, Marcel Dekker Inc, New York
4. Silin V, Plant A, Trends in Biotech, 1997 15: 353–3595. Sojka B, Piunno P, Wust C., Krull U., Appl. Biochem. Biotechnol. 2000 Oct,
89(1): 85–1036. Chrisey L, Lee G, O’Ferrall E, Nucleic Acids Research, 1996 24(15): 3030–30397. Strother T, Cai W, Zhao X, Hamers R, Lloyd M, J. Am. Chem. Soc., 2000
122(6): 1205–12098. Greulich KO, 1998. Intrinsic fluorescence techniques for studies on protein–
protein and protein–RNA interaction in RNP Particles. In: Schenkel J (ed), LabManual: RNP Particles, splicing and autoimmune diseases. Springer, Heidelberg,48–71
9. Lakowicz JR, 1983. Protein Fluorescence, Principles of Fluorescence Spec-troscopy. Plenum Publishing Coorporation, New York, 354–357
10. Schwarzwald R, Greulich KO, 1988. Tyrosine fluorescence energy transfer as aprobe for protein–DNA interactions. Ber Bunsenges Phys Chem 92: 447
11. Alcala JR, Gratton E, and Prendergast FG, 1987. Fluorescence lifetime distri-butions in proteins. Biophys J 51: 597–604
12. Petrich JW, Chang MC, McDonald DB, and Fleming GR, 1983. On the originof nonexponential fluorescence decay in tryptophan and its derivatives. J AmChem Soc 105: 3815–3832
9 Marker-free Detection on Microarrays 205
13. Raghavachari N, Bao YP, Li G, Xie X, and Muller UR, 2003. Reduction of aut-ofluorescence on DNA microarrays and slide surfaces by treatment with sodiumborohydride. Anal Biochem 312: 101–105
14. Hermanson GT, 1996. Bioconjugate Techniques. Academic Press Inc, San Diego,CA
15. Afanassiev V, Hanemann V, Wolfl S, 2000. Preparation of DNA and proteinmicro arrays on glass slides coated with an agarose film. Nucleic Acids Res 28:e66
16. Peluso P, Wilson DS, Do D, Tran H, Venkatasubbaiah M, Quincy D, HeideckerB, Pointdexter K, Tolani N, Phelan M, Witte K, Jung LS, Wagner P, and NockS, 2003. Optimizing antibody immobilization strategies for the construction ofprotein microarrays. Anal Biochem 312: 113–124
17. Hermanson GT, Mallia AK, and Smith PK, 1992. Immobilized Affinity LigandTechniques. Academic Press Inc., San Diego, CA
18. Roegener J, Lutter P, Reinhardt R, Bluggel M, Meyer HE, and AnselmettiD, 2003. Ultrasensitive Detection of Unstained Proteins in Acrylamide Gels byNative UV Fluorescence. Anal Chem 75: 157–159
19. Bohm KJ, Stracke R, Muhlig P, and Unger E, 2001. Motor protein–driven unidi-rectional transport of micrometer–sized cargoes across isopolar microtubule ar-rays. Nanotechnology 12: 238–244
20. Arlinghaus HF, Kwoka MP, Guo XQ, Jacobson KB, 1997. Multiplexed DNA Se-quencing and Diagnostics by Hybridization with Enriched Stable Isotope Labels,Anal. Chem. 69, 1510–1517
21. Jacobson KB, Arlinghaus HF, 1992. Development of Resonance Ionization Spec-troscopy for DNA Sequencing and Genome Mapping, Anal. Chem. 64, 315A–328A
22. Jurinke C, van den Boom D, Cantor RC, Koster H, 2002. The use of MassAR-RAY technology for high throughput genotyping, Adv. Biochem. Eng. Biotechnol.77, 57–74
23. Kirpekar F, Berkenkamp S, Hillenkamp F, 1999. Detection of double–strandedDNA by IR– and UV–MALDI mass spectrometry, Anal. Chem. 71, 2334–2339
24. Kirpekar F, Nordhoff E, Larsen LK, Kristiansen K, Roepstorff P, HillenkampF, 1998. DNA sequence analysis by MALDI mass spectrometry, Nucleic AcidResearch 26(11), 2554–2559
25. Little DP, Cornish TJ, O’Donnell MJ, Braun A, Cotter RJ, Koster H, 1997.MALDI on a Chip: Analysis of Arrays of Low–Femtomole to SubfemtomoleQuantities of Synthetic Oligonucleotides and DNA Diagnostic Products Dis-pensed by a Piezoelectric Pipet., Anal. Chem. 69, 4540–4546
26. O’Donnell MJ, Tang K, Koster H, Smith CL, Cantor CR, 1997. High–Density,Covalent Attachment of DNA to Silicon Wafers for Analysis by MALDI–TOFMass Spectrometry, Anal. Chem. 69, 2438–2443
27. Chakrabarti MC, Schwarz FP, 1999. Thermal stability of PNA/DNA andDNA/DNA dupexes by differential scanning calorimetry, Nucleic Acids Research27(24), 4801–4806
28. Hoheisel JD, 1997. Oligomer–chip technology, TIBTECH 15, 465–46929. Matysiak S, Reuthner F, Hoheisel JD, 2001. Automating parallel peptide syn-
thesis for the production of PNA library arrays, BioTechniques 31, 896–90430. Nielsen PE, 1999. Applications of peptide nucleic acids, Current Opinion in
Biotechnology 10, 71–75
206 M.Vaupel et al.
31. Nielsen PE, 1997. Peptide nucleic acid (PNA) from DNA recognition to anti-sense and DNA structure, Biophysical Chemistry 68, 103–108
32. Ratilainen T, Holmen A, Tuite E, Nielsen PE, Norden B, 2000. Thermodynamicsof sequence–specific binding of PNA to DNA. Biochemistry, 39, 7781–7791
33. Ratilainen T, Holmen A, Tuite E, Haaima G, Christensen L, Nielsen PE, NordenB, 1998. Hybridization of peptide nucleic acid, Biochemistry 37, 12331–12342
34. Ray A, Norden B, 2000. Peptide nucleic acid (PNA): medical and biotechnicalapplications and promise for the future, The FASEB Journal 14, 1041–1060
35. see articles in: Peptide Nucleic Acids: Protocols and Applications, 1999, NielsonPE, Egholm M, eds., Horizon Scientific Press, Wymondham, UK
36. Weiler J, Gausepohl H, Hauser N, Jensen ON, Hoheisel JD, 1997. Hybridizationbased DNA screening on peptide nucleic acid (PNA) oligomer arrays, NucleicAcids Research 25(14), 2792–2799
37. Arlinghaus HF, Ostrop M, Friedrichs O, Feldner J, Gunst U, Lipinsky D, 2002.DNA sequencing with ToF–SIMS, Surf. Interf. Anal. 33, 35–39
38. Arlinghaus HF, Hoppener C, Drexler J, 2000. TOF–SIMS Characterization ofDNA and PNA Biosensor Chips, in: Secondary Ion Mass Spectrometry SIMSXII, Benninghoven, A., Bertrand, P., Migeon, H.–N., Werner, H.W., eds., Else-vier, Amsterdam, 951–954
39. Arlinghaus HF, Kwoka MN, Jacobson KB, 1997. Analysis of Biosensor Chipsfor Identification of Nucleic Acids, Anal. Chem. 69, 3747–3753
40. Arlinghaus HF, Ostrop M, Friedrichs O, Feldner J, 2003. Genome Diagnosticwith TOF–SIMS, Appl. Surf. Sci., 203–204, 689–692
41. Feldner JC, Ostrop M, Friedrichs O, Sohn S, Lipinsky D, Gunst U, Sohn S,Arlinghaus HF, 2003. TOF–SIMS Investigation of the Immobilization Processof Peptide Nucleic Acids, Appl. Surf. Sci., 203–204, 722–725
42. Hoppener C, Drexler J, Ostrop M, Arlinghaus HF, 2000. Investigation of theImmobilization Process of Nucleic Acid, in: Secondary Ion Mass SpectrometrySIMS XII, Benninghoven, A., Bertrand, P., Migeon, H.–N., Werner, H.W., eds.,Elsevier, Amsterdam, 915–918
43. Griffin TJ, Smith LM, 2000. Single–nucleotide polymorphism analysis byMALDI–TOF mass spectrometry, TIBTECH, 18, 77–84
44. Ross PL, Lee K, Belgrader P, 1997. Discrimination of single–nucleotide polymor-phisms in human DNA using peptide nucleic acid probes detected by MALDI–TOF mass spectrometry, Anal. Chem. 69, 4197–4202
45. Storm N, Darnhofer B, van den Boom D, Rodi CP, 2003. MALDI–TOF massspectrometry–based SNP genotyping, Methods in Mol. Biol. 212, 241–62
46. Syvanen A, 2001. Accessing genetic variation: Genotyping single nucleotide poly-morphisms, Nature Reviews 2, 930–942
47. Wang J, Rivas G, Cai X, Chicharro M, Parrado C, Dontha N, Begleiter A,Mowat M, Palecek E, Nielsen PE, 1997. Detection of point mutation in p53gene using a peptide nucleic acid biosensor, Analytica Chimica Acta 344, 111–118
48. Wittung–Stafshede P, Rodahl M, Kasemo B, Nielsen P, Norden B, 2000. Detec-tion of point mutations in DNA by PNA–based quarz–crystal biosensor, Colloidsand Surfaces A: Physicochem. Eng. Aspects 174, 269–273
49. Berkenkamp S, Kirpekar F, Hillenkamp F, 1998. Infrared MALDI mass spec-trometry of large nucleic acids, Science 281, 260–262
50. Karas M, Bachman D, Bahr U, Hillenkamp F, 1987. Int. J. Mass Spectrom. IonProcesses, 78, 53–68
9 Marker-free Detection on Microarrays 207
51. Arlinghaus HF, 2002, Static Secondary Ion Mass Spectrometry (SSIMS ) in: Sur-face and Thin Film Analysis. Principles, Instrumentation, Applications, BubertH, Jenett H, eds., Wiley–VCH, 86–106
52. Benninghoven A, Rudennauer FG, Werner HW, 1987. Secondary Ion Mass Spec-trometry, Wiley, New York
53. see articles in the Proceeding of Secondary Ion Mass Spectrometry SIMS II –SIMS XIII
54. Vickerman JC, Briggs D, 2001. TOF–SIMS, Surface Analysis by Mass Spec-trometry, IM Publication, Charlton, UK
55. Stapel D, Brox O, Benninghoven A, 1999. Appl. Surf. Sci. 140, 156–6756. Prewett PD, Jefferies DK, 1980. J. Phys. D 13, 1747–175557. Niehuis E, Heller T, Feld H, Benninghoven A, 1987. J. Vac. Sci. Technol. A 5,
124358. Karataev VI, Mamyrin BA, Shmikk DV, 1972. Sov. Phys. Techn. Phys. 16, 117759. Schueler BW, 1992. Microsc. Microanal. Microstruct. 3, 11960. Iltgen K, Bendel C, Niehuis E, Benninghoven A, 1997. J. Vac. Sci. Technol. A
15, 46061. Sakurai T, Matsuo T, Matsuda H, 1985. Int. J. Mass. Spectrom. Ion Phys. 63,
27362. Schreiber F, 2000. Structure and growth of self–assembling monolayers, Progress
in Surface Science 65, 151–25663. Huang E, Zhou F, Deng L, 2000. Studies of surface coverage and orientation of
DNA molecules immobilized onto preformed alkanethiol self–assemled monolay-ers, Langmuir 16, 3272–3280
64. Kroger, K., Jung, A., Barzen, C., Gaulitz, G., 2002, Versatile biosensor surfacebased on peptide nucleic acid with label free and total internal reflection fluores-cence detection for quantification of endocrine disruptors, Analytical ChimicaActa, 469(1), 37–48

Part II
DNA Microarrays
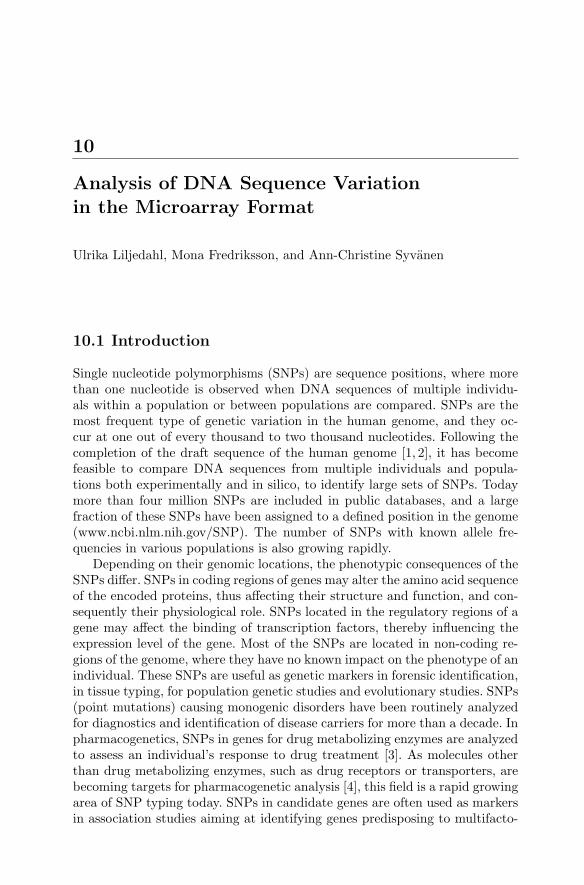
10
Analysis of DNA Sequence Variationin the Microarray Format
Ulrika Liljedahl, Mona Fredriksson, and Ann-Christine Syvanen
10.1 Introduction
Single nucleotide polymorphisms (SNPs) are sequence positions, where morethan one nucleotide is observed when DNA sequences of multiple individu-als within a population or between populations are compared. SNPs are themost frequent type of genetic variation in the human genome, and they oc-cur at one out of every thousand to two thousand nucleotides. Following thecompletion of the draft sequence of the human genome [1, 2], it has becomefeasible to compare DNA sequences from multiple individuals and popula-tions both experimentally and in silico, to identify large sets of SNPs. Todaymore than four million SNPs are included in public databases, and a largefraction of these SNPs have been assigned to a defined position in the genome(www.ncbi.nlm.nih.gov/SNP). The number of SNPs with known allele fre-quencies in various populations is also growing rapidly.
Depending on their genomic locations, the phenotypic consequences of theSNPs differ. SNPs in coding regions of genes may alter the amino acid sequenceof the encoded proteins, thus affecting their structure and function, and con-sequently their physiological role. SNPs located in the regulatory regions of agene may affect the binding of transcription factors, thereby influencing theexpression level of the gene. Most of the SNPs are located in non-coding re-gions of the genome, where they have no known impact on the phenotype of anindividual. These SNPs are useful as genetic markers in forensic identification,in tissue typing, for population genetic studies and evolutionary studies. SNPs(point mutations) causing monogenic disorders have been routinely analyzedfor diagnostics and identification of disease carriers for more than a decade. Inpharmacogenetics, SNPs in genes for drug metabolizing enzymes are analyzedto assess an individual’s response to drug treatment [3]. As molecules otherthan drug metabolizing enzymes, such as drug receptors or transporters, arebecoming targets for pharmacogenetic analysis [4], this field is a rapid growingarea of SNP typing today. SNPs in candidate genes are often used as markersin association studies aiming at identifying genes predisposing to multifacto-
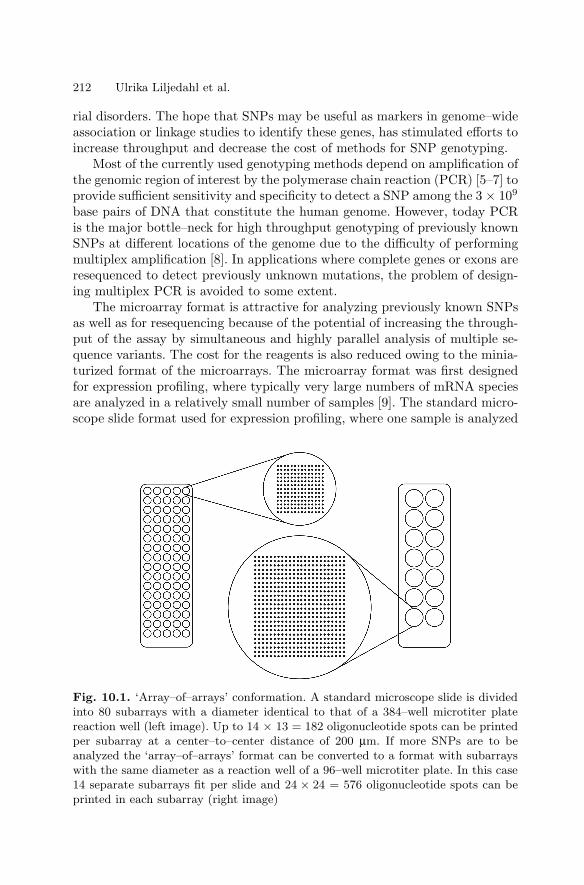
212 Ulrika Liljedahl et al.
rial disorders. The hope that SNPs may be useful as markers in genome–wideassociation or linkage studies to identify these genes, has stimulated efforts toincrease throughput and decrease the cost of methods for SNP genotyping.
Most of the currently used genotyping methods depend on amplification ofthe genomic region of interest by the polymerase chain reaction (PCR) [5–7] toprovide sufficient sensitivity and specificity to detect a SNP among the 3 × 10⁹
base pairs of DNA that constitute the human genome. However, today PCRis the major bottle–neck for high throughput genotyping of previously knownSNPs at different locations of the genome due to the difficulty of performingmultiplex amplification [8]. In applications where complete genes or exons areresequenced to detect previously unknown mutations, the problem of design-ing multiplex PCR is avoided to some extent.
The microarray format is attractive for analyzing previously known SNPsas well as for resequencing because of the potential of increasing the through-put of the assay by simultaneous and highly parallel analysis of multiple se-quence variants. The cost for the reagents is also reduced owing to the minia-turized format of the microarrays. The microarray format was first designedfor expression profiling, where typically very large numbers of mRNA speciesare analyzed in a relatively small number of samples [9]. The standard micro-scope slide format used for expression profiling, where one sample is analyzed
Fig. 10.1. ‘Array–of–arrays’ conformation. A standard microscope slide is dividedinto 80 subarrays with a diameter identical to that of a 384–well microtiter platereaction well (left image). Up to 14 × 13 = 182 oligonucleotide spots can be printedper subarray at a center–to–center distance of 200 µm. If more SNPs are to beanalyzed the ‘array–of–arrays’ format can be converted to a format with subarrayswith the same diameter as a reaction well of a 96–well microtiter plate. In this case14 separate subarrays fit per slide and 24 × 24 = 576 oligonucleotide spots can beprinted in each subarray (right image)
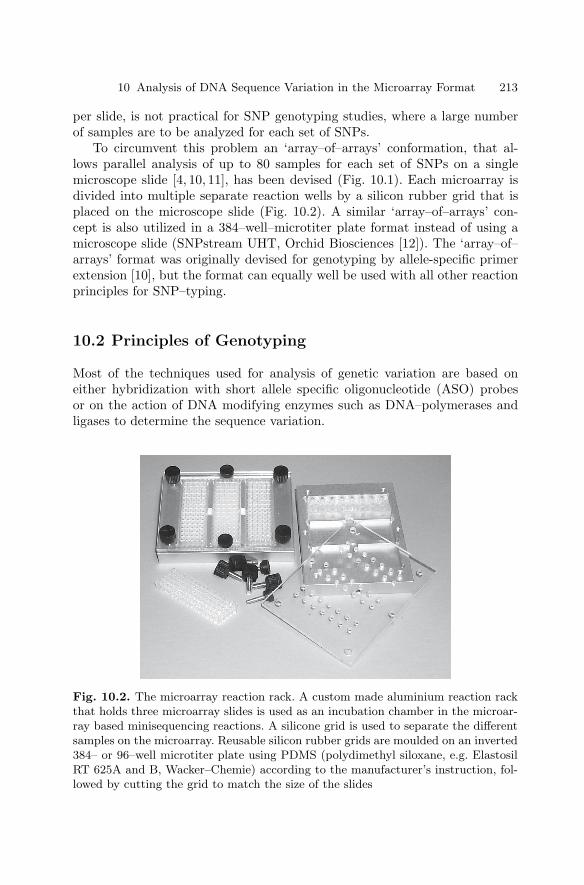
10 Analysis of DNA Sequence Variation in the Microarray Format 213
per slide, is not practical for SNP genotyping studies, where a large numberof samples are to be analyzed for each set of SNPs.
To circumvent this problem an ‘array–of–arrays’ conformation, that al-lows parallel analysis of up to 80 samples for each set of SNPs on a singlemicroscope slide [4, 10, 11], has been devised (Fig. 10.1). Each microarray isdivided into multiple separate reaction wells by a silicon rubber grid that isplaced on the microscope slide (Fig. 10.2). A similar ‘array–of–arrays’ con-cept is also utilized in a 384–well–microtiter plate format instead of using amicroscope slide (SNPstream UHT, Orchid Biosciences [12]). The ‘array–of–arrays’ format was originally devised for genotyping by allele-specific primerextension [10], but the format can equally well be used with all other reactionprinciples for SNP–typing.
10.2 Principles of Genotyping
Most of the techniques used for analysis of genetic variation are based oneither hybridization with short allele specific oligonucleotide (ASO) probesor on the action of DNA modifying enzymes such as DNA–polymerases andligases to determine the sequence variation.
Fig. 10.2. The microarray reaction rack. A custom made aluminium reaction rackthat holds three microarray slides is used as an incubation chamber in the microar-ray based minisequencing reactions. A silicone grid is used to separate the differentsamples on the microarray. Reusable silicon rubber grids are moulded on an inverted384– or 96–well microtiter plate using PDMS (polydimethyl siloxane, e.g. ElastosilRT 625A and B, Wacker–Chemie) according to the manufacturer’s instruction, fol-lowed by cutting the grid to match the size of the slides
214 Ulrika Liljedahl et al.
10.2.1 Hybridization
In hybridization with ASO–probes, the destabilising effect of a single nu-cleotide mismatch between an oligonucleotide probe and its target sequenceis utilized to distinguish between sequence variants (Fig. 10.3a). The reactionconditions are optimized with respect to ionic strength and temperature toprovide maximal discrimination between the two sequence variants. However,the stability of the oligonucleotide–target hybrid is also affected by the se-quence flanking the SNP–position, as well as by the secondary structure ofthe template. Therefore there is no single set of reaction conditions that wouldprovide optimal specificity for all SNPs in multiplexed hybridization assays.
Multiplex analysis using ASOs on microarrays is used in the AffymetrixGeneChip R© assay, where the difficulty in assay design is circumvented by usingarrays with tens of different allele-specific oligonucleotides for each SNP to beanalyzed [13] and by accepting a reduced success rate [14]. Other attempts tocircumvent the specificity problem of multiplexed ASO–assays is to employtemperature gradients [15] or electric field gradients (e.g. Nanogen) [16] tothe microarrays. In these methods optimal discrimination between match andmismatch is achieved at a specific point of the gradient.
Peptide nucleic acids (PNA) or locked nucleic acids (LNA) can also be usedto increase the power of ASO hybridization. Due to their chemical structure,PNA and LNA have strong affinities for complementary DNA, which allowsfor the use of shorter probes than the natural ASO–probes to improve thediscrimination between the SNP alleles [17,18].
10.2.2 Oligonucleotide Ligation
In the oligonucleotide ligation assay (OLA) [19], the ability of a DNA ligaseto discriminate between a match and a mismatch hybridization at the ligationpoint is utilized. An allele-specific probe and a ligation probe are hybridizedto a target sequence, and in the case of a perfect match between the allele-specific probe and the target, the junction between the two probes is closedby ligation which facilitates the detection (Fig. 10.3b). OLA has been adoptedto the microarray format with one of the ligation probes immobilized [20] orwith immobilized single stem loop probes [21]. It is also possible to performthe ligation reaction in solution followed by capturing of the products onmicroarrays [22] or microparticles [23] by hybridization to generic tag or zip–code oligonucleotides.
Padlock probes are circularisable oligonucleotide ligation probes with spe-cific target recognition sequences in their 5′ and 3′ ends and a connectingsequence between the target specific regions [24]. When hybridized to its tar-get sequence the two ends of the probe are brought adjacent to each other,and the junction is ligated when there is a perfect match. Proof of principleof highly multiplex padlock probe ligation using ‘molecular inversion probes’in solution has recently been shown [25]. In this assay the circularized probes
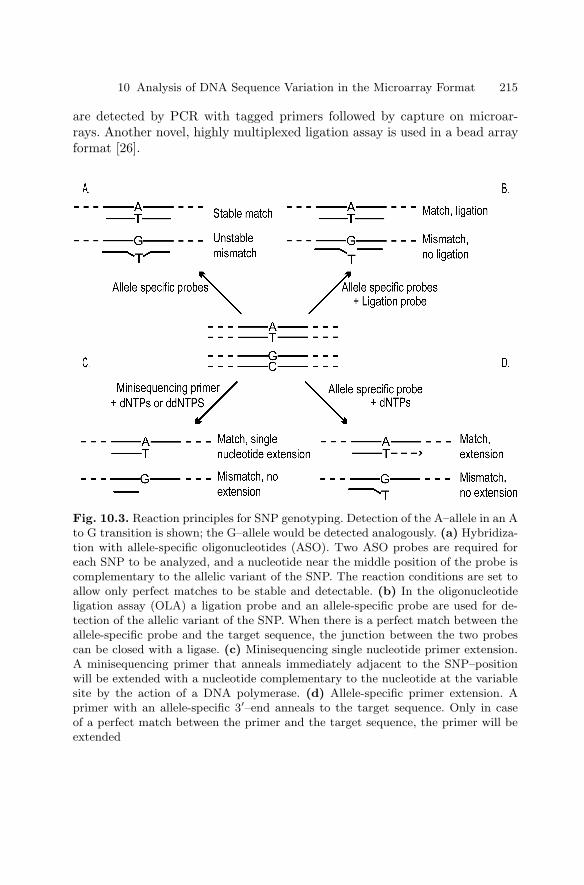
10 Analysis of DNA Sequence Variation in the Microarray Format 215
are detected by PCR with tagged primers followed by capture on microar-rays. Another novel, highly multiplexed ligation assay is used in a bead arrayformat [26].
Fig. 10.3. Reaction principles for SNP genotyping. Detection of the A–allele in an Ato G transition is shown; the G–allele would be detected analogously. (a) Hybridiza-tion with allele-specific oligonucleotides (ASO). Two ASO probes are required foreach SNP to be analyzed, and a nucleotide near the middle position of the probe iscomplementary to the allelic variant of the SNP. The reaction conditions are set toallow only perfect matches to be stable and detectable. (b) In the oligonucleotideligation assay (OLA) a ligation probe and an allele-specific probe are used for de-tection of the allelic variant of the SNP. When there is a perfect match between theallele-specific probe and the target sequence, the junction between the two probescan be closed with a ligase. (c) Minisequencing single nucleotide primer extension.A minisequencing primer that anneals immediately adjacent to the SNP–positionwill be extended with a nucleotide complementary to the nucleotide at the variablesite by the action of a DNA polymerase. (d) Allele-specific primer extension. Aprimer with an allele-specific 3′–end anneals to the target sequence. Only in caseof a perfect match between the primer and the target sequence, the primer will beextended
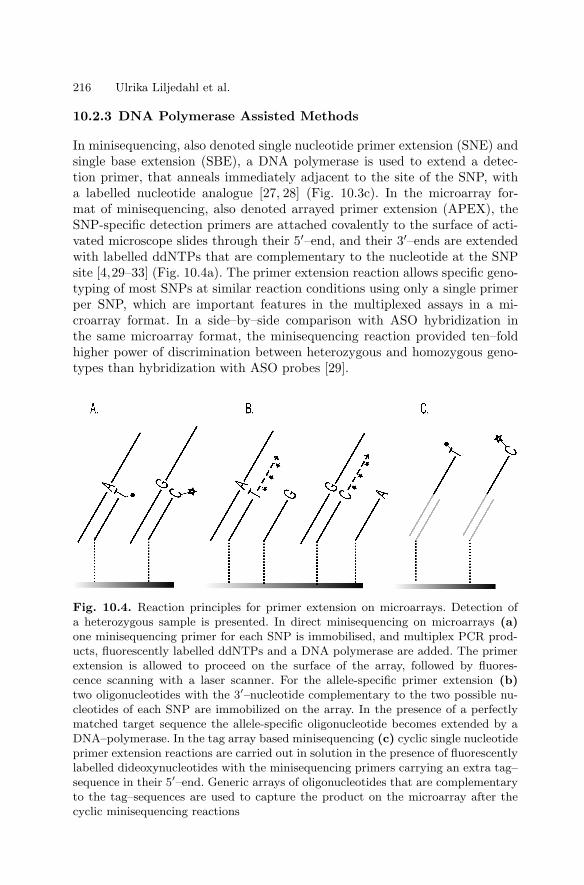
216 Ulrika Liljedahl et al.
10.2.3 DNA Polymerase Assisted Methods
In minisequencing, also denoted single nucleotide primer extension (SNE) andsingle base extension (SBE), a DNA polymerase is used to extend a detec-tion primer, that anneals immediately adjacent to the site of the SNP, witha labelled nucleotide analogue [27, 28] (Fig. 10.3c). In the microarray for-mat of minisequencing, also denoted arrayed primer extension (APEX), theSNP-specific detection primers are attached covalently to the surface of acti-vated microscope slides through their 5′–end, and their 3′–ends are extendedwith labelled ddNTPs that are complementary to the nucleotide at the SNPsite [4,29–33] (Fig. 10.4a). The primer extension reaction allows specific geno-typing of most SNPs at similar reaction conditions using only a single primerper SNP, which are important features in the multiplexed assays in a mi-croarray format. In a side–by–side comparison with ASO hybridization inthe same microarray format, the minisequencing reaction provided ten–foldhigher power of discrimination between heterozygous and homozygous geno-types than hybridization with ASO probes [29].
Fig. 10.4. Reaction principles for primer extension on microarrays. Detection ofa heterozygous sample is presented. In direct minisequencing on microarrays (a)one minisequencing primer for each SNP is immobilised, and multiplex PCR prod-ucts, fluorescently labelled ddNTPs and a DNA polymerase are added. The primerextension is allowed to proceed on the surface of the array, followed by fluores-cence scanning with a laser scanner. For the allele-specific primer extension (b)two oligonucleotides with the 3′–nucleotide complementary to the two possible nu-cleotides of each SNP are immobilized on the array. In the presence of a perfectlymatched target sequence the allele-specific oligonucleotide becomes extended by aDNA–polymerase. In the tag array based minisequencing (c) cyclic single nucleotideprimer extension reactions are carried out in solution in the presence of fluorescentlylabelled dideoxynucleotides with the minisequencing primers carrying an extra tag–sequence in their 5′–end. Generic arrays of oligonucleotides that are complementaryto the tag–sequences are used to capture the product on the microarray after thecyclic minisequencing reactions
10 Analysis of DNA Sequence Variation in the Microarray Format 217
DNA polymerases may also be utilized for SNP genotyping by allele-specific primer extension in the microarray format (Fig. 10.3d). In this casetwo immobilized primers with 3′–ends complementary to either of the nu-cleotides of the SNP are used [10] (Fig. 10.4b). In this approach, primer ex-tension will only occur when there is a perfect match in the 3′–end of theprimer. The allele-specific primer extension reaction is more dependent onthe reaction conditions than minisequencing, but its specificity has been in-creased by analyzing RNA templates in conjunction with reverse transcriptasereactions in the presence of trehalose [10] which has allowed accurate genotyp-ing in a large study where 140,000 genotypes where produced [34]. Anotherapproach for increasing the specificity of allele-specific primer extension is toinclude apyrase in the reaction to prevent the slower mismatched extensionreaction [35].
In an alternative format of the minisequencing system, multiplex cyclicprimer extension reactions are performed in solution with primers tailed with5′–tag sequences. The products of the minisequencing reaction are then cap-tured to complementary tag sequences immobilized on the microarray by hy-bridization (Fig. 10.4c). This flexible genotyping strategy that was first de-scribed for microspheres [36,37], has been used in conjunction with both low-density [38] and high density [39] microarrays. In the latter application, thehigh density GeneChip R© platform was combined with genotyping by singlenucleotide primer extension.
The tag–array assays are more flexible to design compared to the minise-quencing approach with immobilized extension primers, since the array isgeneric and thus can be used for many different sets of SNPs. The ‘array–of–arrays’ format is particularly well suited for genotyping by the flexible tag–array approach [11]. Additionally, the cyclic extension reaction also serves toincrease the signal strength. The accuracy of the primer extension reactionsin solution allows multiplex quantification of variant alleles present as a smallminority (2–5%) of a sample [11].
In the following section two important features of the microarray basedassays, namely production of microarrays and labelling strategies will be dis-cussed in more detail.
10.3 Performing the Assays in Practice
10.3.1 Production of Microarrays
The manufacturing of microarrays can be performed through in situ synthesisof oligonucleotides on the surface of the microarray, or by chemical immobi-lization of presynthesised oligonucleotides. The material used for microarraysmust have low autofluorescence and high binding capacity of oligonucleotides.Glass meets these criteria, and in addition it is non-porous, which allow theuse of small reaction volumes, and it is durable to both heat and chemicals.
218 Ulrika Liljedahl et al.
In situ synthesis of oligonucleotides at high density on a glass surface usinglight directed photolithography has been developed by Affymetrix [40]. TheseGeneChip R© arrays are used for expression analysis and for genotyping usingASO–probes. The photolithographic synthesis proceeds in the 3′–5′ direction,which makes the GeneChip R© arrays impossible to use in direct primer exten-sion assays, where a free 3′–end is needed for the polymerase to extend. Aproposed strategy for avoiding this limitation is to perform the in situ syn-thesis in 3′–5′–direction with a subsequent inversion of the oligonucleotide onthe surface [41]. Direct in situ synthesis on glass surfaces in the 5′–3′– di-rection using 5′–phosphoramidites has also been proposed [42]. However, themost frequently used method for producing microarrays for primer extensionis to attach presynthesised oligonucleotides on the glass surface. Covalent at-tachment is preferred over passive adsorption since it can be better controlledthan in situ synthesis. Covalent attachment also allows for better accessibil-ity for the oligonucleotide in the proceeding genotyping reaction, and allowsthe use of more stringent washing protocols than arrays prepared by adsorp-tion [43–45].
We have previously compared six chemical reactions for immobilization ofoligonucleotides on a surface for application in the microarray based minise-quencing method [32]. Both commercially and in–house coated slides wereevaluated to identify the slide with the best binding capacity and most fa-vorable performance in the minisequencing reaction with respect to back-ground fluorescence prior to and after the reaction, as well as signal inten-sities and power of genotype discrimination. We found the CodeLinkTM Ac-tivated Slides from Amersham Biosciences (previously denoted CodeLinkTM
Activated Slides, Motorola and 3DLinkTM Activated Slides, SurModics) tohave the highest binding capacity of oligonucleotides relative to the in–housecoated isothiocyanate slides that served as reference. Although the mercap-tosilane slides (Orchid Biosciences [46]) binding disulfide-modified oligonu-cleotides have lower binding capacity than the CodeLinkTM slides, the slidesperformed equally well in the minisequencing reaction because of their lowerbackground fluorescence.
10.3.2 Labelling Strategies
In principle any detection strategy, such as radioactivity, colorimetry and flu-orescence may be used in the microarray format, but fluorescence is the farmost frequently used principle today. The Affymetrix GeneChip R© system em-ploys an indirect fluorescence detection strategy, in which the target sequenceis first labelled using a biotin–conjugated nucleotide, which is visualized ina subsequent staining reaction with a fluorescent streptavidin–phycoerythrinconjugate [13,47]. Many different fluorophores are available for direct labelling,followed by detection using fluorescence microscopes, CCD cameras or fluores-cence scanners with photomultiplier tubes. In OLA two allele-specific fluores-cently labelled oligonucleotides are required for each SNP [22]. An advantage
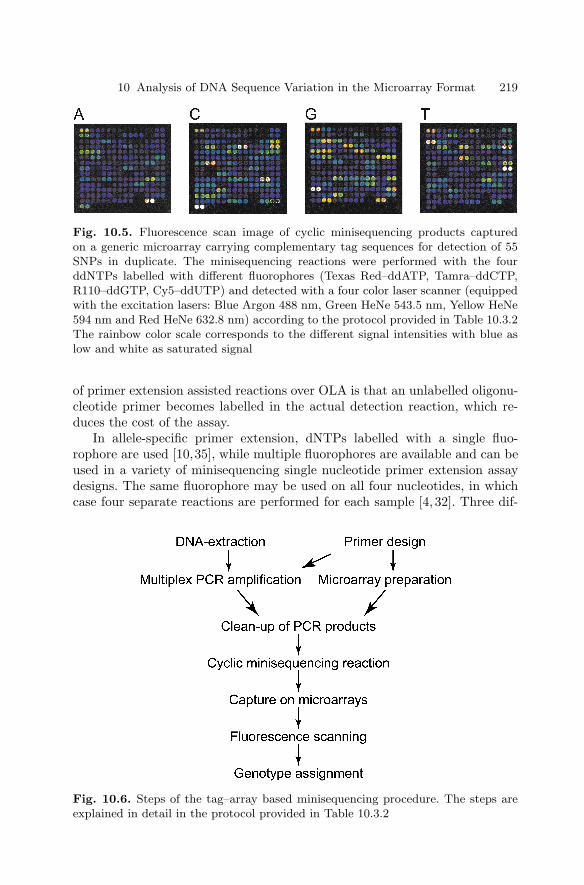
10 Analysis of DNA Sequence Variation in the Microarray Format 219
Fig. 10.5. Fluorescence scan image of cyclic minisequencing products capturedon a generic microarray carrying complementary tag sequences for detection of 55SNPs in duplicate. The minisequencing reactions were performed with the fourddNTPs labelled with different fluorophores (Texas Red–ddATP, Tamra–ddCTP,R110–ddGTP, Cy5–ddUTP) and detected with a four color laser scanner (equippedwith the excitation lasers: Blue Argon 488 nm, Green HeNe 543.5 nm, Yellow HeNe594 nm and Red HeNe 632.8 nm) according to the protocol provided in Table 10.3.2The rainbow color scale corresponds to the different signal intensities with blue aslow and white as saturated signal
of primer extension assisted reactions over OLA is that an unlabelled oligonu-cleotide primer becomes labelled in the actual detection reaction, which re-duces the cost of the assay.
In allele-specific primer extension, dNTPs labelled with a single fluo-rophore are used [10,35], while multiple fluorophores are available and can beused in a variety of minisequencing single nucleotide primer extension assaydesigns. The same fluorophore may be used on all four nucleotides, in whichcase four separate reactions are performed for each sample [4, 32]. Three dif-
Fig. 10.6. Steps of the tag–array based minisequencing procedure. The steps areexplained in detail in the protocol provided in Table 10.3.2
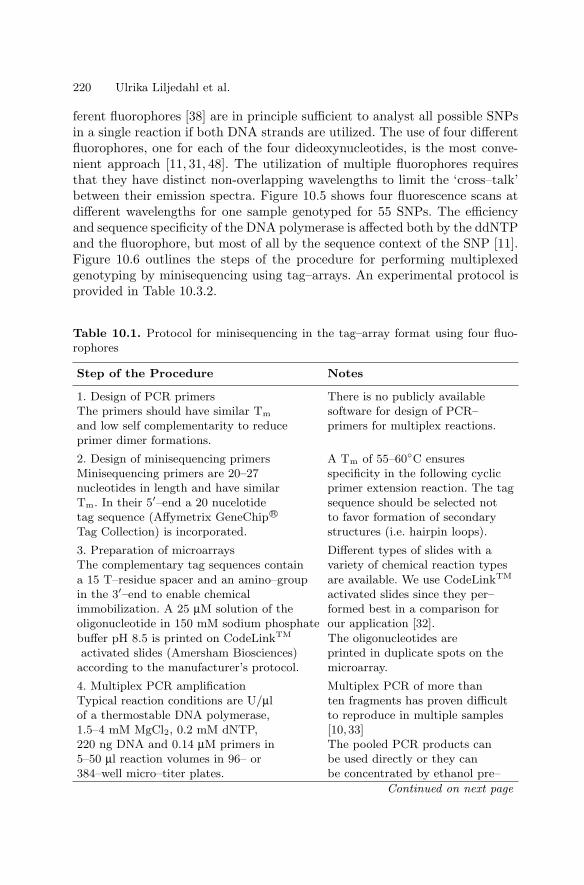
220 Ulrika Liljedahl et al.
ferent fluorophores [38] are in principle sufficient to analyst all possible SNPsin a single reaction if both DNA strands are utilized. The use of four differentfluorophores, one for each of the four dideoxynucleotides, is the most conve-nient approach [11, 31, 48]. The utilization of multiple fluorophores requiresthat they have distinct non-overlapping wavelengths to limit the ‘cross–talk’between their emission spectra. Figure 10.5 shows four fluorescence scans atdifferent wavelengths for one sample genotyped for 55 SNPs. The efficiencyand sequence specificity of the DNA polymerase is affected both by the ddNTPand the fluorophore, but most of all by the sequence context of the SNP [11].Figure 10.6 outlines the steps of the procedure for performing multiplexedgenotyping by minisequencing using tag–arrays. An experimental protocol isprovided in Table 10.3.2.
Table 10.1. Protocol for minisequencing in the tag–array format using four fluo-rophores
Step of the Procedure Notes
1. Design of PCR primers There is no publicly availableThe primers should have similar Tm software for design of PCR–and low self complementarity to reduce primers for multiplex reactions.primer dimer formations.
2. Design of minisequencing primers A Tm of 55–60C ensuresMinisequencing primers are 20–27 specificity in the following cyclicnucleotides in length and have similar primer extension reaction. The tagTm. In their 5′–end a 20 nucelotide sequence should be selected nottag sequence (Affymetrix GeneChipR© to favor formation of secondaryTag Collection) is incorporated. structures (i.e. hairpin loops).
3. Preparation of microarrays Different types of slides with aThe complementary tag sequences contain variety of chemical reaction typesa 15 T–residue spacer and an amino–group are available. We use CodeLinkTM
in the 3′–end to enable chemical activated slides since they per–immobilization. A 25 µM solution of the formed best in a comparison foroligonucleotide in 150 mM sodium phosphate our application [32].buffer pH 8.5 is printed on CodeLinkTM The oligonucleotides areactivated slides (Amersham Biosciences) printed in duplicate spots on the
according to the manufacturer’s protocol. microarray.
4. Multiplex PCR amplification Multiplex PCR of more thanTypical reaction conditions are U/µl ten fragments has proven difficultof a thermostable DNA polymerase, to reproduce in multiple samples1.5–4 mM MgCl2, 0.2 mM dNTP, [10,33]220 ng DNA and 0.14 µM primers in The pooled PCR products can5–50 µl reaction volumes in 96– or be used directly or they can384–well micro–titer plates. be concentrated by ethanol pre–
Continued on next page
10 Analysis of DNA Sequence Variation in the Microarray Format 221
Step of the Procedure Notes
PCR program: 94C for 10 minutes, cipitation or by spin dialysis withthen 94C for 0.5–1 minute, 55–68C CentriconR© devices (Millipore(depending on the Tm of the primers) Corporation) to increase thefor 0.5–1 minute, 72C for 1.5 minutes amount of amplicons.for 35 cycles and a final extension at72C for 7 minutes The multiplex PCRproducts from each sample are pooled.
5. Clean–up of PCR products Exonuclease I degrades the ex–Seven µl of pooled PCR product is cess of PCR primers and shrimptreated with 0.5 U/µl Exonuclease I and alkaline phosphatase inactivates0.1 U/µl shrimp alkaline phosphatase the dNTPs. The MgCl2 concentra–(USB Corporation) in 4–8 mM MgCl2, tion has to be optimized and ad–50 mM Tris–HCl, pH 9.5, in a 10.5 µl justed according to the amountvolume at 37C for 30–60 minutes The added with the PCR product.enzymes are inactivated at 99C for 15minutes
6. Cyclic minisequencing reaction Avoid exposing the fluoropho–The reaction mixture contains 10.5 µl of res to light to prevent bleaching.enzyme-treated PCR product, 5.0 mM The fluorophores should have dis–of each tagged minisequencing primers, tinct and non-overlapping emis–0.09–0.27 µM of fluorescent ddNTPs sion spectras. It may be advanta–(TexasRed–ddATP, TAMRA–ddCTP, geous to use Cy5–ddUTP at aR110–ddGTP, Cy5–ddUTP (Perkin higher concentration than theElmer Life Sciences)), 0.017% Triton– other ddNTPs. The control tem–X–100, 50 mM Tris–HCl pH 9.5, 0.07 plates are four synthetic oligonu–U/µl of ThermoSequenaseTMDNA cleotides mimicking a four allelicPolymerase (Amersham Biosciences) SNP for which the primer will beand 1 nM of control templates in a 15 extended with A, C, G or Tµl volume. The reaction is repeated for respectively. Up to 99 cycles can33 cycles of 95C and 55C for 20 be performed.seconds each.
7. Capture on microarrays To avoid drying of the reac–The slides are preheated to 42C in a tion wells, which can lead tocustom–made aluminium reaction rack high background fluorescence, a(Fig. 10.2). Fifteen µl of minisequencing wet tissue paper is placed on thereaction product, 0.4 nM of TAMRA- plexiglass lid and covered withlabelled control oligonucleotide in 22µl saran–wrap and aluminium foil.of 6× SSC, are added to each reaction The control oligonucleotide is awell on the microscope slide. After fluorescently labelled, synthetichybridization for 2–3 hours at 42C, sequence that hybridize to itsthe slides are briefly rinsed with 4× complementary sequence on theSSC at room temperature and washed slide. 1 × SSC: 150 mM sodiumtwice for 5 minutes with 2× SSC, chloride, 15 mM sodium0.1% SDS at 42C and twice for 1 citrate pH 7.0.minute with 0.2× SSC at room temp.The slides are dried by centrifugationfor 5 minutes at 500 rpm.
Continued on next page
222 Ulrika Liljedahl et al.
Step of the Procedure Notes
8. Fluorescence scanning Figure 10.5 shows fluorescenceFluorescence signals on the slides are detected images of a microarray scannedusing a four color laser scanner (e.g. at four different wavelengthsScanArrayR© 5000, Perkin Elmer LifeSciences). after hybridization of aThe signal intensities are measured with the cyclic minisequencing product.analysis software of the scanner (QuantArrayR©).
9. Genotype assignment A software for genotype as–The mean value of the signals from the duplicate signment for SNPs is thespots is corrected for the average background SNPsnapper software, availablein the reaction well. Genotypes are assigned at:by calculating the ratio between the signal http://www.bioinfo.helsinki.fi/intensity from one of the alleles divided by SNPSnapper/the sum of the signals from both allelesusing a Microsoft ExcelTMmacro.
10.4 Conclusion
During the past few years much effort has been targeted at developingtechnology for analyzing DNA sequence variation in the microarray format.Microarray-based methods have also been applied in a number of clinical, ge-nomic and evolutionary studies. Table 10.2 provides some examples of theseapplications. So far the studies have been of modest size, but with the possi-bility of a high level of multiplexing to bring down the costs of the microarray-based assays, we can foresee studies on a much larger scale that will increaseour understanding of the role of DNA sequence variation in health and disease.
Table 10.2. Examples of applications of microarray-based analysis of DNA sequencevariants
Application Reaction Comment Ref.principle
Comparative sequencing ASO–hybridization Introduction of [49]microarray concept
Cystic fibrosis Affymetrix First use of GeneChip R© [50]mutations GeneChipR© for genotyping
Recessive disease muta– Minisequencing Proof of principle for [29]tions in Finland primer extension primer extension on arrays
Mutation detection in ASO–hybridization Strategy for multiplex [13]the ATM gene GeneChipR© PCR design
Risk factors for myocar– Minisequencing 33P–detection [51]dial infarction primer extension
Continued on next page
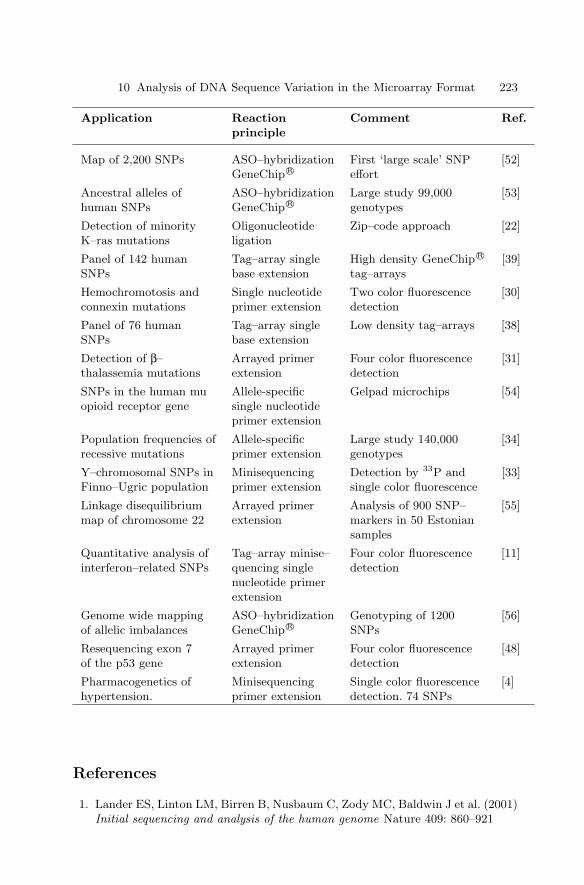
10 Analysis of DNA Sequence Variation in the Microarray Format 223
Application Reaction Comment Ref.principle
Map of 2,200 SNPs ASO–hybridization First ‘large scale’ SNP [52]GeneChipR© effort
Ancestral alleles of ASO–hybridization Large study 99,000 [53]human SNPs GeneChipR© genotypes
Detection of minority Oligonucleotide Zip–code approach [22]K–ras mutations ligation
Panel of 142 human Tag–array single High density GeneChip R© [39]SNPs base extension tag–arrays
Hemochromotosis and Single nucleotide Two color fluorescence [30]connexin mutations primer extension detection
Panel of 76 human Tag–array single Low density tag–arrays [38]SNPs base extension
Detection of β– Arrayed primer Four color fluorescence [31]thalassemia mutations extension detection
SNPs in the human mu Allele-specific Gelpad microchips [54]opioid receptor gene single nucleotide
primer extension
Population frequencies of Allele-specific Large study 140,000 [34]recessive mutations primer extension genotypes
Y–chromosomal SNPs in Minisequencing Detection by 33P and [33]Finno–Ugric population primer extension single color fluorescence
Linkage disequilibrium Arrayed primer Analysis of 900 SNP– [55]map of chromosome 22 extension markers in 50 Estonian
samples
Quantitative analysis of Tag–array minise– Four color fluorescence [11]interferon–related SNPs quencing single detection
nucleotide primerextension
Genome wide mapping ASO–hybridization Genotyping of 1200 [56]of allelic imbalances GeneChip R© SNPs
Resequencing exon 7 Arrayed primer Four color fluorescence [48]of the p53 gene extension detection
Pharmacogenetics of Minisequencing Single color fluorescence [4]hypertension. primer extension detection. 74 SNPs
References
1. Lander ES, Linton LM, Birren B, Nusbaum C, Zody MC, Baldwin J et al. (2001)Initial sequencing and analysis of the human genome Nature 409: 860–921
224 Ulrika Liljedahl et al.
2. Venter JC, Adams MD, Myers EW, Li PW, Mural RJ, Sutton GG et al. (2001)The sequence of the human genome Science 291: 1304–1351
3. Evans WE and Relling MV (1999) Pharmacogenomics: translating functionalgenomics into rational therapeutics Science 286: 487–491
4. Liljedahl U, Karlsson J, Melhus H, Kurland L, Lindersson M, Kahan T et al.(2003) A microarray minisequencing system for pharmacogenetic profiling ofantihypertensive drug response Pharmacogenetics 13: 7–17
5. Saiki RK, Bugawan TL, Horn GT, Mullis KB and Erlich HA (1986) Analysis ofenzymatically amplified beta-globin and HLA-DQ alpha DNA with allele-specificoligonucleotide probes Nature 324: 163–166
6. Mullis KB and Faloona FA (1987) Specific synthesis of DNA in vitro via apolymerase-catalyzed chain reaction Methods Enzymol 155: 335–350
7. Saiki RK, Gelfand DH, Stoffel S, Scharf SJ, Higuchi R, Horn GT et al. (1988)Primer-directed enzymatic amplification of DNA with a thermostable DNA poly-merase Science 239: 487–491
8. Shuber AP, Grondin VJ and Klinger KW (1995) A simplified procedure fordeveloping multiplex PCRs Genome Res 5: 488–493
9. Schena M, Shalon D, Davis RW and Brown PO (1995) Quantitative monitoringof gene expression patterns with a complementary DNA microarray Science 270:467–470
10. Pastinen T, Raitio M, Lindroos K, Tainola P, Peltonen L and Syvanen AC(2000) A system for specific, high-throughput genotyping by allele-specific primerextension on microarrays Genome Res 10: 1031–1042
11. Lindroos K, Sigurdsson S, Johansson K, Ronnblom L and Syvanen AC (2002)Multiplex SNP genotyping in pooled DNA samples by a four-colour microarraysystem Nucleic Acids Res 30: e70
12. Bell PA, Chaturvedi S, Gelfand CA, Huang CY, Kochersperger M, Kopla R etal. (2002) SNPstream UHT: ultra-high throughput SNP genotyping for pharma-cogenomics and drug discovery Biotechniques 30: S70–77
13. Hacia JG, Sun B, Hunt N, Edgemon K, Mosbrook D, Robbins C et al. (1998)Strategies for mutational analysis of the large multiexon ATM gene using high-density oligonucleotide arrays Genome Res 8: 1245–1258
14. Cho RJ, Mindrinos M, Richards DR, Sapolsky RJ, Anderson M, Drenkard E etal. (1999) Genome-wide mapping with biallelic markers in Arabidopsis thalianaNat Genet 23: 203–207
15. Fotin AV, Drobyshev AL, Proudnikov DY, Perov AN and Mirzabekov AD(1998) Parallel thermodynamic analysis of duplexes on oligodeoxyribonucleotidemicrochips Nucleic Acids Res 26: 1515–1521
16. Radtkey R, Feng L, Muralhidar M, Duhon M, Canter D, DiPierro D et al. (2000)Rapid, high fidelity analysis of simple sequence repeats on an electronically activeDNA microchip Nucleic Acids Res 28: E17
17. Ross PL, Lee K and Belgrader P (1997) Discrimination of single-nucleotidepolymorphisms in human DNA using peptide nucleic acid probes detected byMALDI-TOF mass spectrometry Anal Chem 69: 4197–4202
18. Orum H, Jakobsen MH, Koch T, Vuust J and Borre MB (1999) Detection of thefactor V Leiden mutation by direct allele-specific hybridization of PCR ampliconsto photoimmobilized locked nucleic acids Clin Chem 45: 1898–1905
19. Landegren U, Kaiser R, Sanders J and Hood L (1988) A ligase-mediated genedetection technique Science 241: 1077–1080
10 Analysis of DNA Sequence Variation in the Microarray Format 225
20. Lizardi PM, Huang X, Zhu Z, Bray-Ward P, Thomas DC and Ward DC (1998)Mutation detection and single-molecule counting using isothermal rolling-circleamplification Nat Genet 19: 225–232
21. Broude NE, Woodward K, Cavallo R, Cantor CR and Englert D (2001) DNAmicroarrays with stem-loop DNA probes: preparation and applications NucleicAcids Res 29: E92
22. Gerry NP, Witowski NE, Day J, Hammer RP, Barany G and Barany F (1999)Universal DNA microarray method for multiplex detection of low abundancepoint mutations J Mol Biol 292: 251–262
23. Iannone MA, Taylor JD, Chen J, Li MS, Rivers P, Slentz-Kesler KA et al.(2000) Multiplexed single nucleotide polymorphism genotyping by oligonucleotideligation and flow cytometry Cytometry 39: 131–140
24. Nilsson M, Malmgren H, Samiotaki M, Kwiatkowski M, Chowdhary BP andLandegren U (1994) Padlock probes: circularizing oligonucleotides for localizedDNA detection Science 265: 2085–2088
25. Hardenbol P, Baner J, Jain M, Nilsson M, Namsaraev EA, Karlin-Neumann GAet al. (2003) Multiplexed genotyping with sequence-tagged molecular inversionprobes Nat Biotechnol 21: 673–678
26. Oliphant A, Barker DL, Stuelpnagel JR and Chee MS (2002) BeadArray technol-ogy: enabling an accurate, cost-effective approach to high-throughput genotypingBiotechniques Suppl: 56–58, 60–51
27. Syvanen AC, Aalto-Setala K, Harju L, Kontula K and Soderlund H (1990) Aprimer-guided nucleotide incorporation assay in the genotyping of apolipoproteinE Genomics 8: 684–692
28. Syvanen AC (1999) From gels to chips:”minisequencing”; primer extension foranalysis of point mutations and single nucleotide polymorphisms Hum Mutat13: 1–10
29. Pastinen T, Kurg A, Metspalu A, Peltonen L and Syvanen AC (1997) Minise-quencing: a specific tool for DNA analysis and diagnostics on oligonucleotidearrays Genome Res 7: 606–614
30. Fortina P, Delgrosso K, Sakazume T, Santacroce R, Moutereau S, Su HJ et al.(2000) Simple two-color array-based approach for mutation detection Eur J HumGenet 8: 884–894
31. Kurg A, Tonisson N, Georgiou I, Shumaker J, Tollett J and Metspalu A (2000)Arrayed primer extension: solid-phase four-color DNA resequencing and muta-tion detection technology Genet Test 4: 1–7
32. Lindroos K, Liljedahl U, Raitio M and Syvanen AC (2001) Minisequencing onoligonucleotide microarrays: comparison of immobilisation chemistries NucleicAcids Res 29: e69
33. Raitio M, Lindroos K, Laukkanen M, Pastinen T, Sistonen P, Sajantila A et al.(2001) Y-chromosomal SNPs in Finno-Ugric-speaking populations analyzed byminisequencing on microarrays Genome Res 11: 471–482
34. Pastinen T, Perola M, Ignatius J, Sabatti C, Tainola P, Levander M et al. (2001)Dissecting a population genome for targeted screening of disease mutations HumMol Genet 10: 2961–2972
35. O’Meara D, Ahmadian A, Odeberg J and Lundeberg J (2002) SNP typing byapyrasemediated allele-specific primer extension on DNA microarrays NucleicAcids Res 30: e75
226 Ulrika Liljedahl et al.
36. Cai H, White PS, Torney D, Deshpande A, Wang Z, Marrone B et al. (2000)Flow cytometry-based minisequencing: a new platform for high-throughputsingle-nucleotide polymorphism scoring Genomics 66: 135–143
37. Chen J, Iannone MA, Li MS, Taylor JD, Rivers P, Nelsen AJ et al. (2000) Amicrosphere-based assay for multiplexed single nucleotide polymorphism analysisusing single base chain extension Genome Res 10: 549–557
38. Hirschhorn JN, Sklar P, Lindblad-Toh K, Lim YM, Ruiz-Gutierrez M, Bolk Set al. (2000) SBE-TAGS: an array-based method for efficient single-nucleotidepolymorphism genotyping Proc Natl Acad Sci U S A 97: 12164–12169
39. Fan JB, Chen X, Halushka MK, Berno A, Huang X, Ryder T et al. (2000)Parallel genotyping of human SNPs using generic high-density oligonucleotidetag arrays Genome Res 10: 853–860
40. Pease AC, Solas D, Sullivan EJ, Cronin MT, Holmes CP and Fodor SP (1994)Light-generated oligonucleotide arrays for rapid DNA sequence analysis ProcNatl Acad Sci U S A 91: 5022–5026
41. Kwiatkowski M, Fredriksson S, Isaksson A, Nilsson M and Landegren U (1999)Inversion of in situ synthesized oligonucleotides: improved reagents for hybridiza-tion and primer extension in DNA microarrays Nucleic Acids Res 27: 4710–4714
42. Beier M and Hoheisel JD (2002) Analysis of DNA-microarrays produced by in-verse in situ oligonucleotide synthesis J Biotechnol 94: 15–22
43. Guo Z, Guilfoyle RA, Thiel AJ, Wang R and Smith LM (1994) Direct fluores-cence analysis of genetic polymorphisms by hybridization with oligonucleotidearrays on glass supports Nucleic Acids Res 22: 5456–5465
44. Beier M and Hoheisel JD (1999) Versatile derivatisation of solid support mediafor covalent bonding on DNA-microchips Nucleic Acids Res 27: 1970–1977
45. Dolan PL, Wu Y, Ista LK, Metzenberg RL, Nelson MA and Lopez GP (2001)Robust and efficient synthetic method for forming DNA microarrays NucleicAcids Res 29: E107–107
46. Rogers YH, Jiang-Baucom P, Huang ZJ, Bogdanov V, Anderson S and Boyce-Jacino MT (1999) Immobilization of oligonucleotides onto a glass support viadisulfide bonds: A method for preparation of DNA microarrays Anal Biochem266: 23–30
47. Chee M, Yang R, Hubbell E, Berno A, Huang XC, Stern D et al. (1996) Accessinggenetic information with high-density DNA arrays Science 274: 610–614
48. Tonisson N, Zernant J, Kurg A, Pavel H, Slavin G, Roomere H et al. (2002)Evaluating the arrayed primer extension resequencing assay of TP53 tumor sup-pressor gene Proc Natl Acad Sci U S A 99: 5503–5508
49. Southern EM, Maskos U and Elder JK (1992) Analyzing and comparing nucleicacid sequences by hybridization to arrays of oligonucleotides: evaluation usingexperimental models Genomics 13: 1008–1017
50. Cronin MT, Fucini RV, Kim SM, Masino RS, Wespi RM and Miyada CG (1996)Cystic fibrosis mutation detection by hybridization to light-generated DNA probearrays Hum Mutat 7: 244–255
51. Pastinen T, Perola M, Niini P, Terwilliger J, Salomaa V, Vartiainen E et al.(1998) Array-based multiplex analysis of candidate genes reveals two indepen-dent and additive genetic risk factors for myocardial infarction in the Finnishpopulation Hum Mol Genet 7: 1453–1462
52. Wang DG, Fan JB, Siao CJ, Berno A, Young P, Sapolsky R et al. (1998) Large-scale identification, mapping, and genotyping of single-nucleotide polymorphismsin the human genome Science 280: 1077–1082

10 Analysis of DNA Sequence Variation in the Microarray Format 227
53. Hacia JG, Fan JB, Ryder O, Jin L, Edgemon K, Ghandour G et al. (1999)Determination of ancestral alleles for human single-nucleotide polymorphismsusing high-density oligonucleotide arrays Nat Genet 22: 164–167
54. LaForge KS, Shick V, Spangler R, Proudnikov D, Yuferov V, Lysov Y et al.(2000) Detection of single nucleotide polymorphisms of the human mu opioidreceptor gene by hybridization or single nucleotide extension on custom oligonu-cleotide gelpad microchips: potential in studies of addiction Am J Med Genet96: 604–615
55. Dawson E, Abecasis GR, Bumpstead S, Chen Y, Hunt S, Beare DM et al. (2002)A first-generation linkage disequilibrium map of human chromosome 22 Nature418: 544–548
56. Primdahl H, Wikman FP, von der Maase H, Zhou XG, Wolf H and OrntoftTF (2002) Allelic imbalances in human bladder cancer: genome-wide detectionwith high-density single-nucleotide polymorphism arrays J Natl Cancer Inst 94:216–223
11
High Sensitivity Expression Profiling
Ramesh Ramakrishnan, Paul Bao, and Uwe R. Muller
11.1 Introduction
DNA microarrays were originally conceived to provide a new means for rapidsequence analysis [1–3] but it was soon recognized that they presented apowerful new tool to determine the relative transcript abundance of multi-ple genes [4, 5]. Expression microarrays have been shown to provide valuableinsights in the areas of target discovery [6], mechanism of drug action [7–9],genes and pathways involved in various cellular responses and pathophysiolo-gies [10–12], exon mapping [13], chemosensitivity [14, 15] and tumor classi-fication [16, 17]. Clinically, expression microarrays have been used in studiesutilizing gene expression signatures to distinguish primary breast cancers frommultifocal disease [18] and to predict disease outcome, surpassing currentlyused clinical and histopathological methods [19–22].
The probes used for expression array fabrication can be made from clonesof genes, PCR amplicons, or oligonucleotides [6, 23–26], and various methodsfor their attachment and linkage to the array surface have emerged (Chaps. 2and 3). While cDNA probes and PCR amplicons are typically arrayed in abuffer that contains both strands, oligonucleotide probes are single-strandedand complementary to the mRNA or cDNA target sequences, respectively.
The primary target for expression analysis is mRNA, but it is typicallyconverted to cDNA prior to use for two reasons: first, DNA is much morestable and therefore more easily handled and stored; second cDNA synthesisprovides a convenient method to produce labelled targets by incorporationof fluorescent or hapten labelled nucleotides during the reverse transcriptionreaction. When the target material is limiting, various methods can be em-ployed to either enhance the signal, or to amplify the mRNA (see below).As reviewed in Chap. 8, the standard labelling system consists in direct in-corporation of fluorescent nucleotides using a two color labelling scheme, butindirect labelling via incorporation of haptens provides for alternate and po-tentially higher sensitivity detection schemes (Chap. 8 and below). The typeof labels used and the exact conditions for labelling and hybridization are crit-
230 Ramesh Ramakrishnan et al.
ically important and have a profound impact on the sensitivity of the system.For most slide based arrays, hybridization is carried out under a coverslip in ahumidity chamber, followed by washing and staining, if indirect labelling sys-tems are used. However, for enhanced hybridization rates and more consistentperformance, automated hybridization chambers and complete hybridizationsystems have been developed.
Although all array based expression systems are based on a determinationof relative transcript abundance by comparing the copy number in a specificsample to that in a reference, there are two different approaches involvingeither labelling both samples with the same ‘color’ and hybridizing to separatearrays, or labelling both samples with different ‘colors’, and hybridizing themcompetitively to the same array. The latter was first pioneered by Kallioniemiet al. by comparing genomic DNA from different sources [27]. The advantage isthat differences between the two arrays that can affect either the hybridization(e.g. spot morphologies, probe amounts) or the detection (e.g. shading) areeliminated, typically resulting in improved CVs (coefficients of variation) forcolor ratios as compared to the CVs of raw hybridization signals [24]. However,the two color approach also has disadvantages including varying incorporationrates of different fluorophors, the need for more reference sample in multipleexperiments, spectral overlap between dyes, more expensive imaging systems,and, in case of multiple haptens, more complex signal amplification protocols.
Many methods for improvements and optimizations have emerged duringthe past decade, most, of course, to improve manufacturability, specificityand/or sensitivity. This is where some significant differences in the type ofprobe used for manufacturing the array have appeared. In fact, while mostdata suggest that equivalent results are obtained between oligo and cDNAarrays [24,25,28], some data suggest otherwise [29,30].
Because oligo and cDNA arrays each have a set of advantages and disad-vantages, we have combined our experiences to describe in this chapter highsensitivity expression systems achieved with either format, using as examplesthe Motorola CodeLinkTM (now Amersham CodeLinkTM) oligonucleotide ar-ray and the Corning CMTTM cDNA-based expression arrays (no longer com-mercially available, but see Chap. 5).
11.2 Oligonucleotide Expression Arrays
11.2.1 Array Design
The use of oligonucleotides instead of clones or PCR amplified DNA sequencesas probes for expression arrays has significant advantages since they can bedesigned to hybridize specifically to any gene in the sample, provided sequenceinformation is available. The ease with which oligonucleotides can be synthe-sized reduces complexity in the manufacturing and quality control areas, sinceit eliminates the need for clone tracking and handling, PCR amplification and
11 High Sensitivity Expression Profiling 231
sequence verification. Further, the specificity associated with oligonucleotidearrays enables the study and analysis of splice variants [31] and the ability todifferentiate closely related members of gene families.
Typical arrays fabricated with oligo probes of 20–30 nucleotides in lengthhave sensitivity limitations, but this limitation can be minimized by extendingthe length to 50 bases or more [25]. However, depending on the method ofarray fabrication, this may result in other disadvantages. For example, for insitu synthesis [32–34] the lower coupling efficiencies on the array can limit pu-rity with significant impact on specificity and sensitivity. This typically limitsthe probe length to about 25 bases. In addition, in situ synthesis does notallow an independent confirmation of the fidelity of synthesis. On the otherhand, synthesis of oligonucleotides prior to deposition on the array incurs asignificant cost not just in synthesis, but also in purification and sequenceconfirmation, which increases proportionally with oligo size. In addition, thisapproach requires covalent attachment of the oligos to the array surface. How-ever, several innovative solutions in chemistry and systems engineering havebeen proposed to address these obstacles [35,36].
Covalent attachment of prefabricated oligonucleotides circumvents some ofthe constraints imposed by earlier in situ synthesis methods and allows newelements to be added without redesigning the entire microarray. The emphasishere shifts to the ability to reproducibly attach probes. One approach includesfabrication of arrays by photochemical as well as chemical attachment [37].Incorporation of specific functional moieties at the 5′ end of oligonucleotidescan serve as a pseudo–purification step. Since only full-length oligonucleotideswill receive the attachment group and attach to the matrix efficiently, non-specific adsorption of the oligonucleotide can be virtually eliminated.
Longer oligonucleotides (60–mer to 70–mer) exhibit chemical characteris-tics similar to cDNAs in that they can be attached directly (non-covalently)to slide surfaces without the need for any specialized attachment chemistry.However, for maximum attachment, a UV–crosslinking step is advisable andimproves sensitivity (personal observations), though probes retained on a glasssurface in this manner may not exhibit the same degree of conformationalflexibility or accessibility as do those retained via end attachment [38]. Al-ternatively, oligonucleotides can be modified by incorporation of biotin orhaptens at either end, and they can then be anchored efficiently on surfacescoated with streptavidin or anti-hapten antibodes, respectively. The disad-vantage of such an attachment scheme is that the biological interaction mustremain intact throughout the assay, imposing constraints upon subsequenthybridization and array processing.
For applications in expression analysis, the oligonucleotide probes are gen-erally designed towards the 3′ end of a RNA transcript, primarily to reduce theeffects of transcript degradation [26]. Probe design is also guided by primingand amplification schemes (random hexamer versus oligo–dT), which impactthe regions of the transcript represented in the cDNA or cRNA sample. Al-though a set of heuristics has been proposed for probe design [39], there is
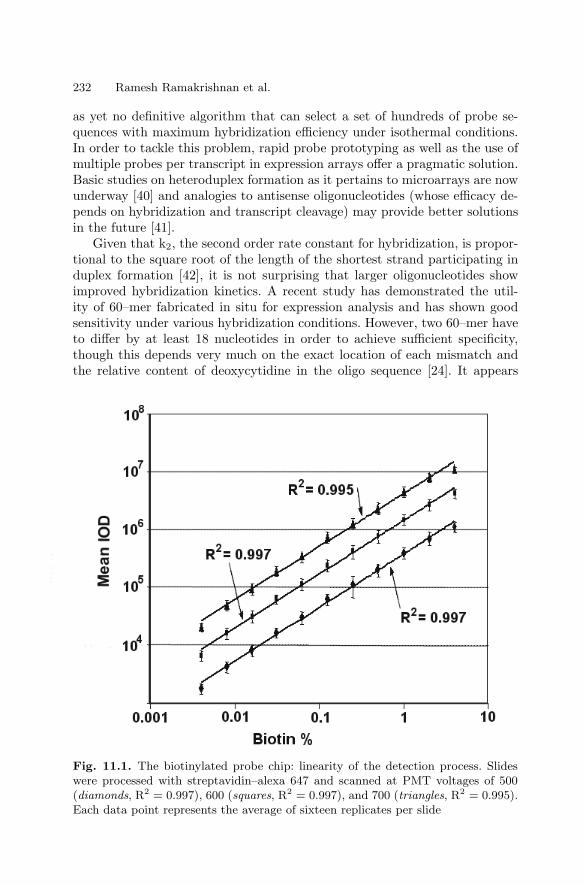
232 Ramesh Ramakrishnan et al.
as yet no definitive algorithm that can select a set of hundreds of probe se-quences with maximum hybridization efficiency under isothermal conditions.In order to tackle this problem, rapid probe prototyping as well as the use ofmultiple probes per transcript in expression arrays offer a pragmatic solution.Basic studies on heteroduplex formation as it pertains to microarrays are nowunderway [40] and analogies to antisense oligonucleotides (whose efficacy de-pends on hybridization and transcript cleavage) may provide better solutionsin the future [41].
Given that k2, the second order rate constant for hybridization, is propor-tional to the square root of the length of the shortest strand participating induplex formation [42], it is not surprising that larger oligonucleotides showimproved hybridization kinetics. A recent study has demonstrated the util-ity of 60–mer fabricated in situ for expression analysis and has shown goodsensitivity under various hybridization conditions. However, two 60–mer haveto differ by at least 18 nucleotides in order to achieve sufficient specificity,though this depends very much on the exact location of each mismatch andthe relative content of deoxycytidine in the oligo sequence [24]. It appears
Fig. 11.1. The biotinylated probe chip: linearity of the detection process. Slideswere processed with streptavidin–alexa 647 and scanned at PMT voltages of 500(diamonds, R2 = 0.997), 600 (squares, R2 = 0.997), and 700 (triangles, R2 = 0.995).Each data point represents the average of sixteen replicates per slide
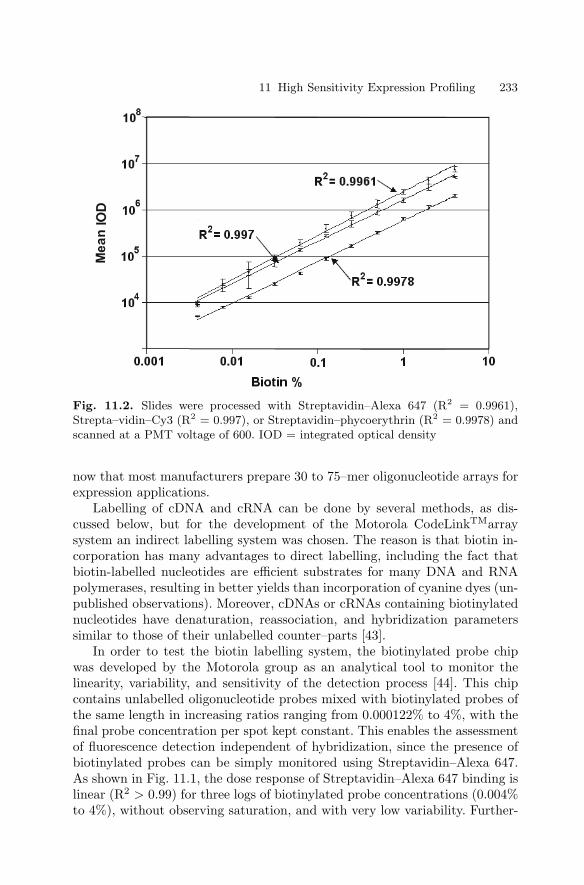
11 High Sensitivity Expression Profiling 233
Fig. 11.2. Slides were processed with Streptavidin–Alexa 647 (R2 = 0.9961),Strepta–vidin–Cy3 (R2 = 0.997), or Streptavidin–phycoerythrin (R2 = 0.9978) andscanned at a PMT voltage of 600. IOD = integrated optical density
now that most manufacturers prepare 30 to 75–mer oligonucleotide arrays forexpression applications.
Labelling of cDNA and cRNA can be done by several methods, as dis-cussed below, but for the development of the Motorola CodeLinkTMarraysystem an indirect labelling system was chosen. The reason is that biotin in-corporation has many advantages to direct labelling, including the fact thatbiotin-labelled nucleotides are efficient substrates for many DNA and RNApolymerases, resulting in better yields than incorporation of cyanine dyes (un-published observations). Moreover, cDNAs or cRNAs containing biotinylatednucleotides have denaturation, reassociation, and hybridization parameterssimilar to those of their unlabelled counter–parts [43].
In order to test the biotin labelling system, the biotinylated probe chipwas developed by the Motorola group as an analytical tool to monitor thelinearity, variability, and sensitivity of the detection process [44]. This chipcontains unlabelled oligonucleotide probes mixed with biotinylated probes ofthe same length in increasing ratios ranging from 0.000122% to 4%, with thefinal probe concentration per spot kept constant. This enables the assessmentof fluorescence detection independent of hybridization, since the presence ofbiotinylated probes can be simply monitored using Streptavidin–Alexa 647.As shown in Fig. 11.1, the dose response of Streptavidin–Alexa 647 binding islinear (R2 > 0.99) for three logs of biotinylated probe concentrations (0.004%to 4%), without observing saturation, and with very low variability. Further-
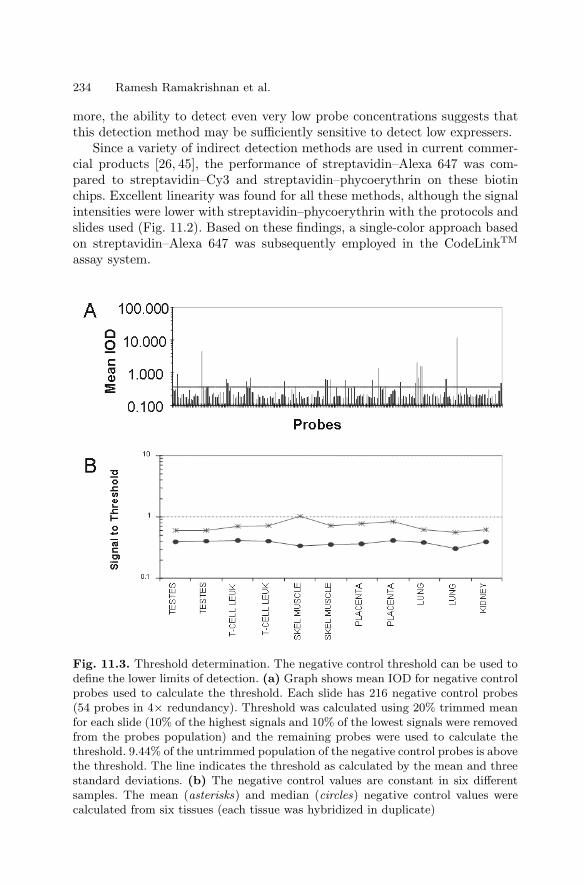
234 Ramesh Ramakrishnan et al.
more, the ability to detect even very low probe concentrations suggests thatthis detection method may be sufficiently sensitive to detect low expressers.
Since a variety of indirect detection methods are used in current commer-cial products [26, 45], the performance of streptavidin–Alexa 647 was com-pared to streptavidin–Cy3 and streptavidin–phycoerythrin on these biotinchips. Excellent linearity was found for all these methods, although the signalintensities were lower with streptavidin–phycoerythrin with the protocols andslides used (Fig. 11.2). Based on these findings, a single-color approach basedon streptavidin–Alexa 647 was subsequently employed in the CodeLinkTM
assay system.
Fig. 11.3. Threshold determination. The negative control threshold can be used todefine the lower limits of detection. (a) Graph shows mean IOD for negative controlprobes used to calculate the threshold. Each slide has 216 negative control probes(54 probes in 4× redundancy). Threshold was calculated using 20% trimmed meanfor each slide (10% of the highest signals and 10% of the lowest signals were removedfrom the probes population) and the remaining probes were used to calculate thethreshold. 9.44% of the untrimmed population of the negative control probes is abovethe threshold. The line indicates the threshold as calculated by the mean and threestandard deviations. (b) The negative control values are constant in six differentsamples. The mean (asterisks) and median (circles) negative control values werecalculated from six tissues (each tissue was hybridized in duplicate)
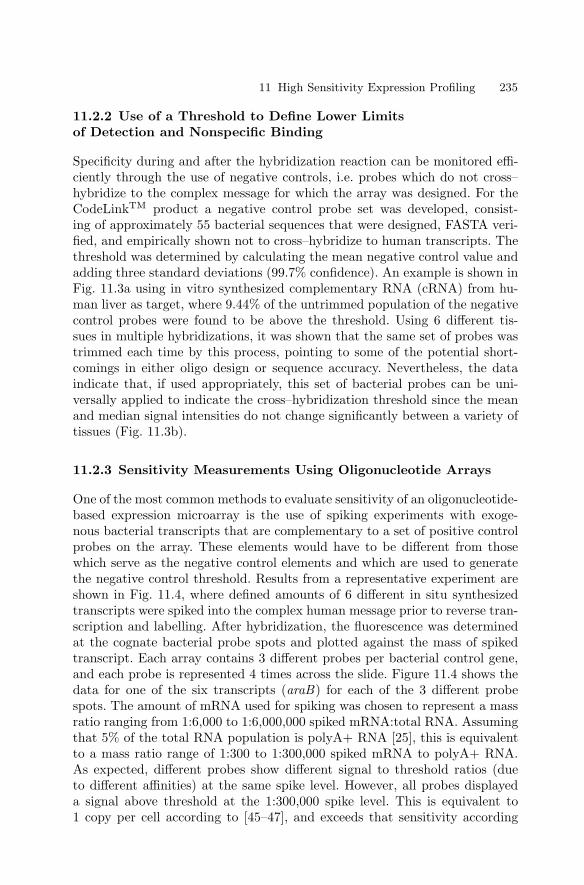
11 High Sensitivity Expression Profiling 235
11.2.2 Use of a Threshold to Define Lower Limitsof Detection and Nonspecific Binding
Specificity during and after the hybridization reaction can be monitored effi-ciently through the use of negative controls, i.e. probes which do not cross–hybridize to the complex message for which the array was designed. For theCodeLinkTM product a negative control probe set was developed, consist-ing of approximately 55 bacterial sequences that were designed, FASTA veri-fied, and empirically shown not to cross–hybridize to human transcripts. Thethreshold was determined by calculating the mean negative control value andadding three standard deviations (99.7% confidence). An example is shown inFig. 11.3a using in vitro synthesized complementary RNA (cRNA) from hu-man liver as target, where 9.44% of the untrimmed population of the negativecontrol probes were found to be above the threshold. Using 6 different tis-sues in multiple hybridizations, it was shown that the same set of probes wastrimmed each time by this process, pointing to some of the potential short-comings in either oligo design or sequence accuracy. Nevertheless, the dataindicate that, if used appropriately, this set of bacterial probes can be uni-versally applied to indicate the cross–hybridization threshold since the meanand median signal intensities do not change significantly between a variety oftissues (Fig. 11.3b).
11.2.3 Sensitivity Measurements Using Oligonucleotide Arrays
One of the most common methods to evaluate sensitivity of an oligonucleotide-based expression microarray is the use of spiking experiments with exoge-nous bacterial transcripts that are complementary to a set of positive controlprobes on the array. These elements would have to be different from thosewhich serve as the negative control elements and which are used to generatethe negative control threshold. Results from a representative experiment areshown in Fig. 11.4, where defined amounts of 6 different in situ synthesizedtranscripts were spiked into the complex human message prior to reverse tran-scription and labelling. After hybridization, the fluorescence was determinedat the cognate bacterial probe spots and plotted against the mass of spikedtranscript. Each array contains 3 different probes per bacterial control gene,and each probe is represented 4 times across the slide. Figure 11.4 shows thedata for one of the six transcripts (araB) for each of the 3 different probespots. The amount of mRNA used for spiking was chosen to represent a massratio ranging from 1:6,000 to 1:6,000,000 spiked mRNA:total RNA. Assumingthat 5% of the total RNA population is polyA+ RNA [25], this is equivalentto a mass ratio range of 1:300 to 1:300,000 spiked mRNA to polyA+ RNA.As expected, different probes show different signal to threshold ratios (dueto different affinities) at the same spike level. However, all probes displayeda signal above threshold at the 1:300,000 spike level. This is equivalent to1 copy per cell according to [45–47], and exceeds that sensitivity according
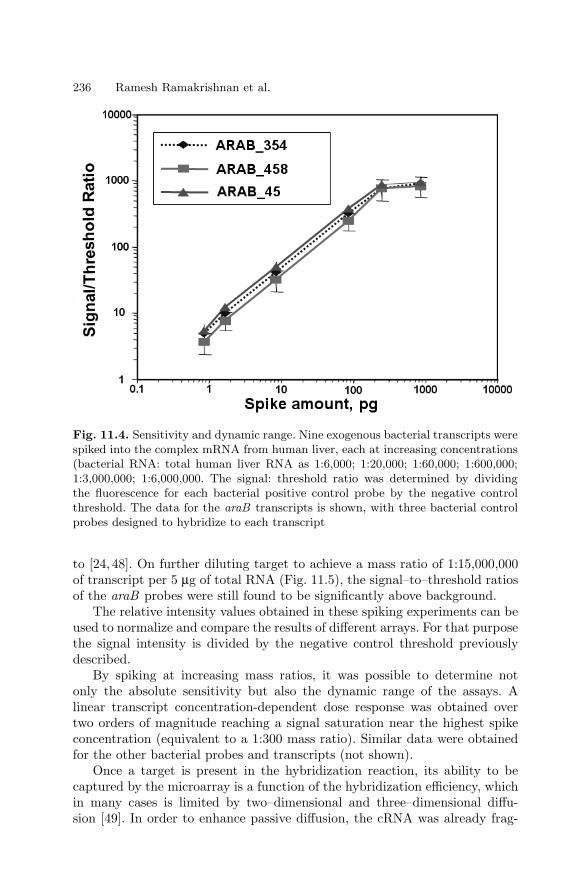
236 Ramesh Ramakrishnan et al.
Fig. 11.4. Sensitivity and dynamic range. Nine exogenous bacterial transcripts werespiked into the complex mRNA from human liver, each at increasing concentrations(bacterial RNA: total human liver RNA as 1:6,000; 1:20,000; 1:60,000; 1:600,000;1:3,000,000; 1:6,000,000. The signal: threshold ratio was determined by dividingthe fluorescence for each bacterial positive control probe by the negative controlthreshold. The data for the araB transcripts is shown, with three bacterial controlprobes designed to hybridize to each transcript
to [24, 48]. On further diluting target to achieve a mass ratio of 1:15,000,000of transcript per 5 µg of total RNA (Fig. 11.5), the signal–to–threshold ratiosof the araB probes were still found to be significantly above background.
The relative intensity values obtained in these spiking experiments can beused to normalize and compare the results of different arrays. For that purposethe signal intensity is divided by the negative control threshold previouslydescribed.
By spiking at increasing mass ratios, it was possible to determine notonly the absolute sensitivity but also the dynamic range of the assays. Alinear transcript concentration-dependent dose response was obtained overtwo orders of magnitude reaching a signal saturation near the highest spikeconcentration (equivalent to a 1:300 mass ratio). Similar data were obtainedfor the other bacterial probes and transcripts (not shown).
Once a target is present in the hybridization reaction, its ability to becaptured by the microarray is a function of the hybridization efficiency, whichin many cases is limited by two–dimensional and three–dimensional diffu-sion [49]. In order to enhance passive diffusion, the cRNA was already frag-
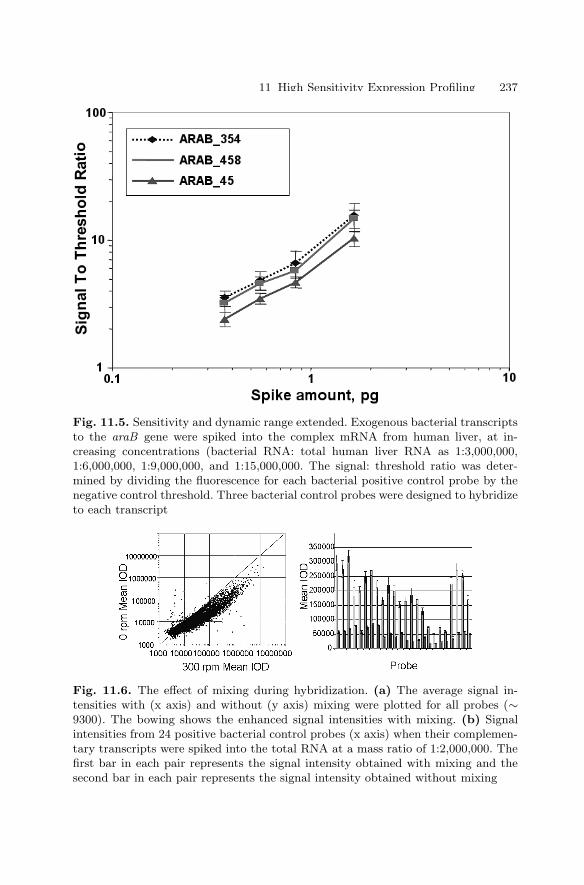
11 High Sensitivity Expression Profiling 237
Fig. 11.5. Sensitivity and dynamic range extended. Exogenous bacterial transcriptsto the araB gene were spiked into the complex mRNA from human liver, at in-creasing concentrations (bacterial RNA: total human liver RNA as 1:3,000,000,1:6,000,000, 1:9,000,000, and 1:15,000,000. The signal: threshold ratio was deter-mined by dividing the fluorescence for each bacterial positive control probe by thenegative control threshold. Three bacterial control probes were designed to hybridizeto each transcript
Fig. 11.6. The effect of mixing during hybridization. (a) The average signal in-tensities with (x axis) and without (y axis) mixing were plotted for all probes (∼9300). The bowing shows the enhanced signal intensities with mixing. (b) Signalintensities from 24 positive bacterial control probes (x axis) when their complemen-tary transcripts were spiked into the total RNA at a mass ratio of 1:2,000,000. Thefirst bar in each pair represents the signal intensity obtained with mixing and thesecond bar in each pair represents the signal intensity obtained without mixing
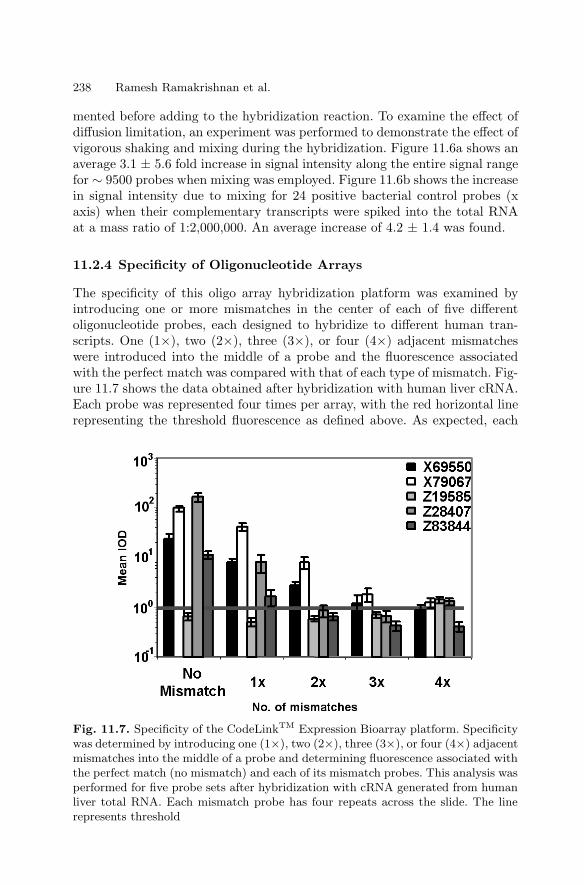
238 Ramesh Ramakrishnan et al.
mented before adding to the hybridization reaction. To examine the effect ofdiffusion limitation, an experiment was performed to demonstrate the effect ofvigorous shaking and mixing during the hybridization. Figure 11.6a shows anaverage 3.1 ± 5.6 fold increase in signal intensity along the entire signal rangefor ∼ 9500 probes when mixing was employed. Figure 11.6b shows the increasein signal intensity due to mixing for 24 positive bacterial control probes (xaxis) when their complementary transcripts were spiked into the total RNAat a mass ratio of 1:2,000,000. An average increase of 4.2 ± 1.4 was found.
11.2.4 Specificity of Oligonucleotide Arrays
The specificity of this oligo array hybridization platform was examined byintroducing one or more mismatches in the center of each of five differentoligonucleotide probes, each designed to hybridize to different human tran-scripts. One (1×), two (2×), three (3×), or four (4×) adjacent mismatcheswere introduced into the middle of a probe and the fluorescence associatedwith the perfect match was compared with that of each type of mismatch. Fig-ure 11.7 shows the data obtained after hybridization with human liver cRNA.Each probe was represented four times per array, with the red horizontal linerepresenting the threshold fluorescence as defined above. As expected, each
Fig. 11.7. Specificity of the CodeLinkTM Expression Bioarray platform. Specificitywas determined by introducing one (1×), two (2×), three (3×), or four (4×) adjacentmismatches into the middle of a probe and determining fluorescence associated withthe perfect match (no mismatch) and each of its mismatch probes. This analysis wasperformed for five probe sets after hybridization with cRNA generated from humanliver total RNA. Each mismatch probe has four repeats across the slide. The linerepresents threshold
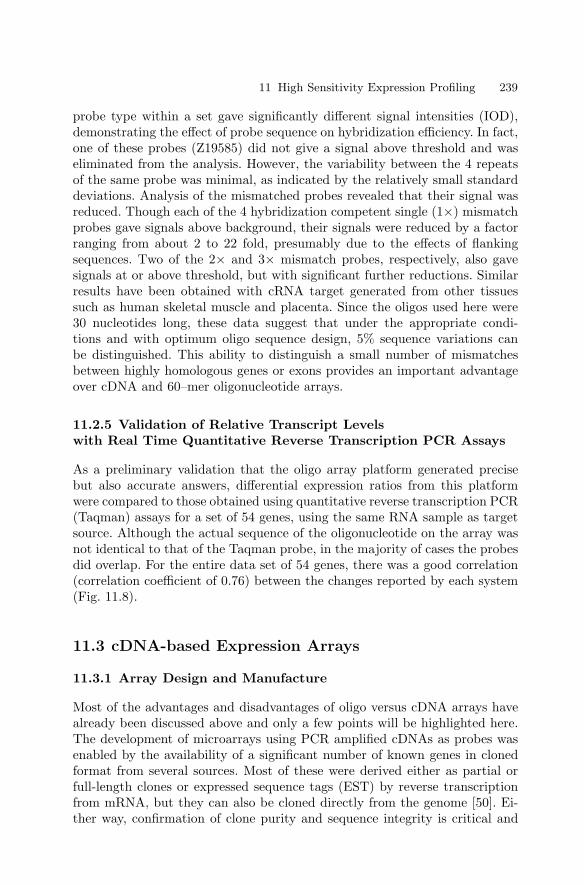
11 High Sensitivity Expression Profiling 239
probe type within a set gave significantly different signal intensities (IOD),demonstrating the effect of probe sequence on hybridization efficiency. In fact,one of these probes (Z19585) did not give a signal above threshold and waseliminated from the analysis. However, the variability between the 4 repeatsof the same probe was minimal, as indicated by the relatively small standarddeviations. Analysis of the mismatched probes revealed that their signal wasreduced. Though each of the 4 hybridization competent single (1×) mismatchprobes gave signals above background, their signals were reduced by a factorranging from about 2 to 22 fold, presumably due to the effects of flankingsequences. Two of the 2× and 3× mismatch probes, respectively, also gavesignals at or above threshold, but with significant further reductions. Similarresults have been obtained with cRNA target generated from other tissuessuch as human skeletal muscle and placenta. Since the oligos used here were30 nucleotides long, these data suggest that under the appropriate condi-tions and with optimum oligo sequence design, 5% sequence variations canbe distinguished. This ability to distinguish a small number of mismatchesbetween highly homologous genes or exons provides an important advantageover cDNA and 60–mer oligonucleotide arrays.
11.2.5 Validation of Relative Transcript Levelswith Real Time Quantitative Reverse Transcription PCR Assays
As a preliminary validation that the oligo array platform generated precisebut also accurate answers, differential expression ratios from this platformwere compared to those obtained using quantitative reverse transcription PCR(Taqman) assays for a set of 54 genes, using the same RNA sample as targetsource. Although the actual sequence of the oligonucleotide on the array wasnot identical to that of the Taqman probe, in the majority of cases the probesdid overlap. For the entire data set of 54 genes, there was a good correlation(correlation coefficient of 0.76) between the changes reported by each system(Fig. 11.8).
11.3 cDNA-based Expression Arrays
11.3.1 Array Design and Manufacture
Most of the advantages and disadvantages of oligo versus cDNA arrays havealready been discussed above and only a few points will be highlighted here.The development of microarrays using PCR amplified cDNAs as probes wasenabled by the availability of a significant number of known genes in clonedformat from several sources. Most of these were derived either as partial orfull-length clones or expressed sequence tags (EST) by reverse transcriptionfrom mRNA, but they can also be cloned directly from the genome [50]. Ei-ther way, confirmation of clone purity and sequence integrity is critical and
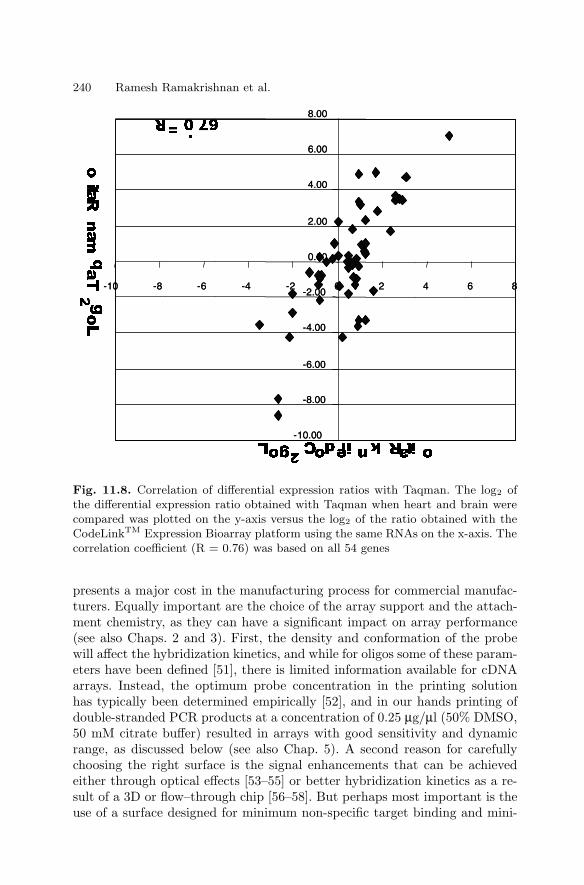
240 Ramesh Ramakrishnan et al.
-10.00
-8.00
-6.00
-4.00
-2.00
0.00
2.00
4.00
6.00
8.00
-10 -8 -6 -4 -2 0 2 4 6 8
-10.00
-8.00
-6.00
-4.00
-2.00
0.00
2.00
4.00
6.00
8.00
-10 -8 -6 -4 -2 0 2 4 6 8
Fig. 11.8. Correlation of differential expression ratios with Taqman. The log2 ofthe differential expression ratio obtained with Taqman when heart and brain werecompared was plotted on the y-axis versus the log2 of the ratio obtained with theCodeLinkTM Expression Bioarray platform using the same RNAs on the x-axis. Thecorrelation coefficient (R = 0.76) was based on all 54 genes
presents a major cost in the manufacturing process for commercial manufac-turers. Equally important are the choice of the array support and the attach-ment chemistry, as they can have a significant impact on array performance(see also Chaps. 2 and 3). First, the density and conformation of the probewill affect the hybridization kinetics, and while for oligos some of these param-eters have been defined [51], there is limited information available for cDNAarrays. Instead, the optimum probe concentration in the printing solutionhas typically been determined empirically [52], and in our hands printing ofdouble-stranded PCR products at a concentration of 0.25 µg/µl (50% DMSO,50 mM citrate buffer) resulted in arrays with good sensitivity and dynamicrange, as discussed below (see also Chap. 5). A second reason for carefullychoosing the right surface is the signal enhancements that can be achievedeither through optical effects [53–55] or better hybridization kinetics as a re-sult of a 3D or flow–through chip [56–58]. But perhaps most important is theuse of a surface designed for minimum non-specific target binding and mini-
11 High Sensitivity Expression Profiling 241
mum autofluorescence (if fluorescently labelled target is used). It was shownby Shena et al. that reducing slide background through modification of the at-tachment chemistry can improve the sensitivity by a factor of 10 [5]. However,we have noticed that adsorption of organic molecules from the environmentupon storage of arrays can dramatically increase autofluorescence and renderthem useless. In many cases treatment of the array with sodium borohydridebefore hybridization can offer an easy remedy [59]. This process will do littleto improve the autofluorescence of the glass itself, unless the glass has beentreated to adsorb or reflect any unwanted photons from within or the un-derside of the slide [53]. In order to insure that the array has a minimum ofbackground autofluorescence, we recommend using a high quality glass sub-strate (e.g. GAPSTMslides, Corning) and scanning all arrays at a high voltagesetting prior to use. Assuming that a quality array (for a description of qualityparameters see [52]) has been fabricated, the tasks turn to target preparationand labelling.
11.3.2 Target Preparation and Labelling
Many studies have focused on the preparation and labelling of cDNA fromeither total RNA or isolated poly(A)+ mRNA, since the effect of target con-centration, label type and density on sensitivity is obvious. However, there arevarious definitions and descriptions of sensitivity. Given the variety of arrays,labels and detection modes, the reported amounts of non-amplified target re-quired per hybridization varies up to 100–fold between different publications,ranging from a few to more than 100 µg total RNA [60,61] or 200 ng to a fewµg of purified poly (A)+ mRNA [52,62]. A better way to express sensitivity isto define the minimum amount of a specific target needed per hybridizationto give a detectable signal over noise, as originally described by Schena etal. [4]. This can be accomplished by spiking specific amounts of one or moretypes of a synthetic mRNA into the target RNA before reverse transcrip-tion as described above for oligo arrays. By these criteria, arrays with longerprobes (cDNA or > 50–mer oligos) have been shown to be more sensitive thanshort oligo arrays (25–mer) [63], which is not unexpected. Without any targetor signal amplification, the sensitivities for cDNA arrays have been reportedto be around 2 pg (0.006 fmol) of a unique Cy3 or Cy5 labelled mRNA perspot and per hybridization [52] compared to 20 pg (∼ 0.06 fmol) for 60–meroligos [24, 63], and ≥ 0.3 fmol for 30–mer oligo arrays [63]. However, Cy5 istypically somewhat less sensitive [63,64].
Assuming approximately 10 pg total RNA [60,65] and 100,000 transcriptsper eukaryotic cell [24], mRNA represents approximately 0.5% of the totalRNA. Thus, based on the above cited sensitivity limits detection of 1 copy ofa given transcript per cell would require on the order of 40 µg of total RNAor 200 ng purified mRNA. Since for many applications, such as fine-needleaspirates, this much material can not be obtained, signal or target amplifi-cation procedures may offer a suitable solution. Incorporation of biotinylated
242 Ramesh Ramakrishnan et al.
nucleotides during the RT step, followed by fluorescently labelled streptavidinis commonly used, as described above. Efficient incorporation of aminatedrandom primers and/or aminoallyl nucleotides during cDNA synthesis, andsubsequent chemical conversion of the primary amine groups to fluorescentmoieties has provided > 10 fold improvements in signal strength [66] andreduced the required amount of material to as little as 1 µg total RNA [67].
Better amplification can be achieved by incorporating a T7 primer dur-ing the cDNA synthesis, followed by transcription using the cDNA as tem-plate [68,69]. The resulting amplification is linear, reaching amplification levelsof several orders of magnitude without significant distortion of transcript ra-tios [68,70,71]. Our own data suggest a 5800 fold amplification, starting withthe total RNA from as few as 10,000 HepG2 cells (∼ 11 pg/cell) and resultingin 312 pg/cell of aRNA (assuming 0.5% of total RNA is mRNA) [72]. An evenmore powerful target amplification can be achieved by combining reverse tran-scription with PCR allowing expression analysis of single cells [73]. However,the non-linear PCR step may distort the transcript ratios [74].
11.3.3 Hybridization and Detection
Clearly, any target or signal amplification procedures add some complexityto the assay process, and a high sensitivity 2-color assay format with a sim-ple reverse transcription reaction and direct incorporation of label is verydesirable. We have developed a protocol that allows detection of single copymRNAs starting with 2–5 µg of total RNA (i.e. ∼ 500,000 human cells) with-out the need for any signal or target amplification. This was only possiblebecause of the combination of quality slides and cDNA arrays, reduction ofautofluorescence by treatment with sodium borohydride [59], and the opti-mized labelling and hybridization protocol shown in the Appendix. In fact,prior to discovering the benefits of the sodium borohydride treatment morethan 10 times that amount of target was needed to get similar results withthe same arrays [75].
When using this protocol to test various tissues on Corning CMTTM4KCancer arrays (containing ∼ 2000 cancer related genes in duplicate) we typ-ically found that virtually all genes represented on the array were expressedin the tissues analyzed. As shown in Fig. 11.9, more than 95% of the probespots have a net Signal/Noise (S/N) ratio for Cy5 of 5 or larger (slide A),whereby this ratio for the negative control probes (bacterial genes) rangedbetween 1.4 and 1.8 (not shown). The Cy3 net S/N ratio is somewhat lowerand 4% less genes are detectable. This is because of the differences in theaverage background for these two fluorophore, which was on the order of 176RFU for Cy5 and 383 RFU for Cy3 in our experimental set–up.
Of course, the amount of target hybridizing to the probe is not only a func-tion of the target concentration, but also of solution stringency. By loweringthe salt concentration from 2.25× SSC to 1.25× SSC (slide B), up to 20% fewergenes become detectable, depending on the net S/N ratio that one chooses
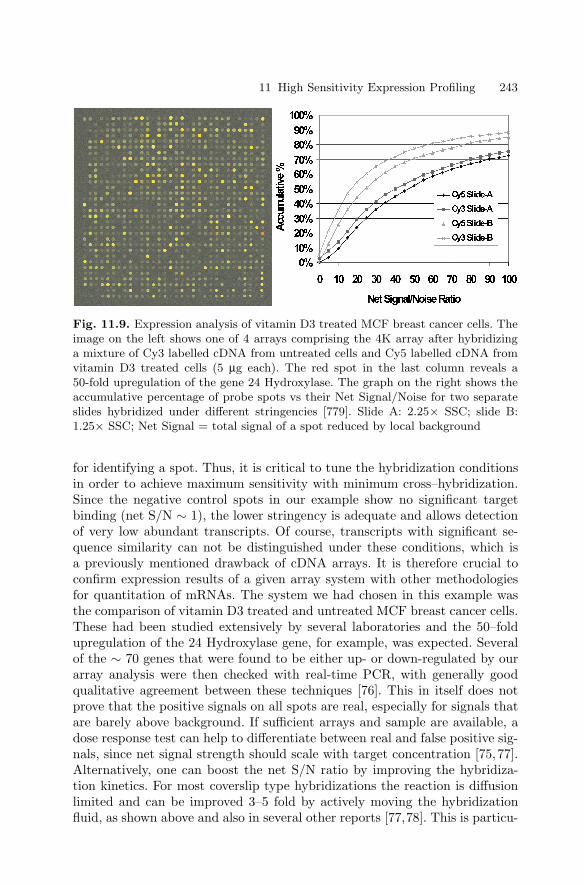
11 High Sensitivity Expression Profiling 243
Fig. 11.9. Expression analysis of vitamin D3 treated MCF breast cancer cells. Theimage on the left shows one of 4 arrays comprising the 4K array after hybridizinga mixture of Cy3 labelled cDNA from untreated cells and Cy5 labelled cDNA fromvitamin D3 treated cells (5 µg each). The red spot in the last column reveals a50-fold upregulation of the gene 24 Hydroxylase. The graph on the right shows theaccumulative percentage of probe spots vs their Net Signal/Noise for two separateslides hybridized under different stringencies [779]. Slide A: 2.25× SSC; slide B:1.25× SSC; Net Signal = total signal of a spot reduced by local background
for identifying a spot. Thus, it is critical to tune the hybridization conditionsin order to achieve maximum sensitivity with minimum cross–hybridization.Since the negative control spots in our example show no significant targetbinding (net S/N ∼ 1), the lower stringency is adequate and allows detectionof very low abundant transcripts. Of course, transcripts with significant se-quence similarity can not be distinguished under these conditions, which isa previously mentioned drawback of cDNA arrays. It is therefore crucial toconfirm expression results of a given array system with other methodologiesfor quantitation of mRNAs. The system we had chosen in this example wasthe comparison of vitamin D3 treated and untreated MCF breast cancer cells.These had been studied extensively by several laboratories and the 50–foldupregulation of the 24 Hydroxylase gene, for example, was expected. Severalof the ∼ 70 genes that were found to be either up- or down-regulated by ourarray analysis were then checked with real-time PCR, with generally goodqualitative agreement between these techniques [76]. This in itself does notprove that the positive signals on all spots are real, especially for signals thatare barely above background. If sufficient arrays and sample are available, adose response test can help to differentiate between real and false positive sig-nals, since net signal strength should scale with target concentration [75,77].Alternatively, one can boost the net S/N ratio by improving the hybridiza-tion kinetics. For most coverslip type hybridizations the reaction is diffusionlimited and can be improved 3–5 fold by actively moving the hybridizationfluid, as shown above and also in several other reports [77,78]. This is particu-
244 Ramesh Ramakrishnan et al.
larly important if volume displacers are used, such as polydextrans [79], whichincrease the effective target concentration but also the fluid viscosity [77].
Since at least 50% of the genes present in a genome are expected to beexpressed at less than 1 copy per cell and most of the others are presentin fewer than 10 copies, sensitivity will remain the key issue for this typeof analysis. With a push toward smaller sample sizes and ideally single cellanalysis, stochasticity in gene expression will become the ultimate limit [80],requiring multiplexing of samples and arrays to overcome these statisticalhurdles. Finally, miniaturization and automation will provide some additionalsolutions, as discussed in Chaps. 6 and 7.
11.4 Appendix
Assay Protocol for Expression Microarrays The following protocol is basedon methods worked out by the Biochemistry research group at Corning, Inc.[50,59,75–77] and includes recent improvements.
1. Reagents• 5× FSS buffer: 250 mM Tris–HCl, 375 mM KCl, 15 mM MgCl2• dNTP mix: 10 mM each of dGTP, dATP, and dTTP, 1 mM of dCTP• RevT solution: 8 µl 5× FSS buffer, 4 µl 0.1 M DTT, 2 µl dNTP mix
and 1 µl of 1 mM dCTP–Cy3 or 1 mM dCTP–Cy5, and 2 µl of reversetranscriptase
• Universal Hybridization Kit (Cat. No. 40026, Corning Incorporated),consisting in: Universal Wash Reagent A, Universal Wash Reagent B,Universal Pre-Soak Solution, Sodium Borohydride Pre-Soak Tablets,Universal Pre-Hybridization Solution, and Universal HybridizationBufferWash Soln 1: 50 ml Wash Reagent A, 447.5 ml water, 2.5 ml WashReagent BWash Soln 2: 75 ml Wash Reagent A, 1425 ml waterWash Soln 3: 300 ml Wash Soln 2, 1200 ml water
2. Labelling of total human RNA• mix 1–5 µg of purified total human RNA, 3 µg of random hexamers
(1 ug/ul) and nuclease free water; final volume 23 µl• incubate for 5 minutes at 70C, quick chill on ice and spin down• add 17 µl of RevT solution, mix well and incubate for 2 hours, 42C• add 1 µl (2 U/µl) RNase H and 0.25 µl RNase A (30 µg/µl); incubate
15 minutes, 37C• purify cDNAs with Qiagen’s PCR purification kit and reduce the vol-
ume by evaporation to about 5–8 µl3. Autofluorescence reduction and prewash:
• incubate slides in Universal Pre-Soak Solution with 1 tablet of NaBH4
at 42C, 20–30 minutes, then transfer successively to Wash Solution 2

11 High Sensitivity Expression Profiling 245
(RT, 10 sec), Universal Pre-Hybridization Solution (42C, 15 minutes),Wash Solution 2 (RT, 1 minute), Wash Solution 3 (RT, 30 sec)
• dry slides by low speed spin (1000 rpm) at RT, 1 minute4. Hybridization
• dissolve labelled cDNA in 60 µl Universal Hybridization buffer• denature the target mixture at 95C for 3 minutes, then spin for 20 sec
at RT• place onto the array, cover with 24 × 60 mm cover–slip (avoid bubbles!)• incubate in a high humidity hybridization chamber at 42C, 14–20
hours5. Post hybridization processing
• immerse slides in Wash Solution 1 (2 minutes), remove coverslip, thenincubate for 5 minutes, all at 42C
• transfer slides successively to Wash Solution 1 (5 minutes, 42C), WashSolution 2 (10 minutes, RT), wash solution 3 (2 minutes, RT), washsolution 3 (2 minutes, RT)
• dry slides by low speed spin (1000 rpm) for 1 minute at RT; store inthe dark
References
1. Drmanac R, Drmanac S, Chui G, Diaz R, Hou A, Jin H, Jin P, Kwon S, Lacy S,Moeur B, Shafto J, Swanson D, Ukrainczyk T, Xu C, Little D. 2002. Sequenc-ing by hybridization (SBH): advantages, achievements, and opportunities. AdvBiochem Eng Biotechnol 77:75–101
2. Khrapko KR, Lysov YuP, Khorlyn AA, Shick VV, Florentiev VL, MirzabekovAD. 1989. An oligonucleotide hybridization approach to DNA sequencing. FEBSLett 256:118–22
3. Lysov IuP, Florent’ev VL, Khorlin AA, Khrapko KR, Shik VV. 1988. Determina-tion of the nucleotide sequence of DNA using hybridization with oligonucleotides.A new method. Dokl Akad Nauk SSSR 303:1508–11
4. Schena M, Shalon D, Davis RW, Brown PO. 1995. Quantitative monitoringof gene expression patterns with a complementary DNA microarray. Science270:467–70
5. Schena M, Shalon D, Heller R, Chai A, Brown PO, Davis RW. 1996. Parallelhuman genome analysis: microarray–based expression monitoring of 1000 genes.Proc Natl Acad Sci USA 93:10614–9
6. Heller RA, Schena M, Chai A, Shalon D, Bedilion T, Gilmore J, Woolley DE,Davis RW. 1997. Discovery and analysis of inflammatory disease–related genesusing cDNA microarrays. Proc Natl Acad Sci USA 94:2150–5
7. Huang P, Feng L, Oldham EA, Keating MJ, Plunkett W. 2000. Superoxidedismutase as a target for the selective killing of cancer cells. Nature 407:390–5
8. Lam LT, Pickeral OK, Peng AC, Rosenwald A, Hurt EM, Giltnane JM, AverettLM, Zhao H, Davis RE, Sathyamoorthy M, Wahl LM, Harris ED, Mikovits JA,Monks AP, Hollingshead MG, Sausville EA, Staudt LM. 2001. Genomic–scalemeasurement of mRNA turnover and the mechanisms of action of the anticancerdrug flavopiridol. Genome Biol 2:RESEARCH0041
246 Ramesh Ramakrishnan et al.
9. Marton MJ, DeRisi JL, Bennett HA, Iyer VR, Meyer MR, Roberts CJ,Stoughton R, Burchard J, Slade D, Dai H, Bassett DE Jr, Hartwell LH, BrownPO, Friend SH. 1998. Drug target validation and identification of secondary drugtarget effects using DNA microarrays. Nat Med 4:1293–301
10. Bittner M, Meltzer P, Chen Y, Jiang Y, Seftor E, Hendrix M, Radmacher M,Simon R, Yakhini Z, Ben-Dor A, Sampas N, Dougherty E, Wang E, MarincolaF, Gooden C, Lueders J, Glatfelter A, Pollock P, Carpten J, Gillanders E, LejaD, Dietrich K, Beaudry C, Berens M, Alberts D, Sondak V. 2000. Molecularclassification of cutaneous malignant melanoma by gene expression profiling.Nature 406:536–40
11. Iyer VR, Eisen MB, Ross DT, Schuler G, Moore T, Lee JC, Trent JM, StaudtLM, Hudson J Jr, Boguski MS, Lashkari D, Shalon D, Botstein D, Brown PO.1999. The transcriptional program in the response of human fibroblasts to serum.Science 283:83–7
12. Perou CM, Sorlie T, Eisen MB, van de Rijn M, Jeffrey SS, Rees CA, Pollack JR,Ross DT, Johnsen H, Akslen LA, Fluge O, Pergamenschikov A, Williams C, ZhuSX, Lonning PE, Borresen-Dale AL, Brown PO, Botstein D. 2000. Molecularportraits of human breast tumours. Nature 406:747–52
13. Shoemaker DD, Schadt EE, Armour CD, He YD, Garrett-Engele P, McDonaghPD, Loerch PM, Leonardson A, Lum PY, Cavet G, Wu LF, Altschuler SJ,Edwards S, King J, Tsang JS, Schimmack G, Schelter JM, Koch J, ZimanM, Marton MJ, Li B, Cundiff P, Ward T, Castle J, Krolewski M, Meyer MR,Mao M, Burchard J, Kidd MJ, Dai H, Phillips JW, Linsley PS, Stoughton R,Scherer S, Boguski MS. 2001. Experimental annotation of the human genomeusing microarray technology. Nature 409:922–7
14. Scherf U, Ross DT, Waltham M, Smith LH, Lee JK, Tanabe L, Kohn KW,Reinhold WC, Myers TG, Andrews DT, Scudiero DA, Eisen MB, Sausville EA,Pommier Y, Botstein D, Brown PO, Weinstein JN. 2000. A gene expressiondatabase for the molecular pharmacology of cancer. Nat Genet 24:236–44
15. Staunton JE, Slonim DK, Coller HA, Tamayo P, Angelo MJ, Park J, ScherfU, Lee JK, Reinhold WO, Weinstein JN, Mesirov JP, Lander ES, Golub TR.2001. Chemosensitivity prediction by transcriptional profiling. Proc Natl AcadSci USA 98:10787–92
16. Alizadeh AA, Eisen MB, Davis RE, Ma C, Lossos IS, Rosenwald A, Boldrick JC,Sabet H, Tran T, Yu X, Powell JI, Yang L, Marti GE, Moore T, Hudson J Jr, LuL, Lewis DB, Tibshirani R, Sherlock G, Chan WC, Greiner TC, WeisenburgerDD, Armitage JO, Warnke R, Staudt LM, et al. 2000. Distinct types of diffuselarge B–cell lymphoma identified by gene expression profiling. Nature 403:503–11
17. Golub TR, Slonim DK, Tamayo P, Huard C, Gaasenbeek M, Mesirov JP, CollerH, Loh ML, Downing JR, Caligiuri MA, Bloomfield CD, Lander ES. 1999. Molec-ular classification of cancer: class discovery and class prediction by gene expres-sion monitoring. Science 286:531–7
18. Unger MA, Rishi M, Clemmer VB, Hartman JL, Keiper EA, Greshock JD,Chodosh LA, Liebman MN, Weber BL. 2001. Characterization of adjacent breasttumors using oligonucleotide microarrays. Breast Cancer Res 3:336–41
19. Bhattacharjee A, Richards WG, Staunton J, Li C, Monti S, Vasa P, Ladd C,Beheshti J, Bueno R, Gillette M, Loda M, Weber G, Mark EJ, Lander ES,Wong W, Johnson BE, Golub TR, Sugarbaker DJ, Meyerson M. 2001. Classifi-cation of human lung carcinomas by mRNA expression profiling reveals distinctadenocarcinoma subclasses. Proc Natl Acad Sci USA 98:13790–5
11 High Sensitivity Expression Profiling 247
20. Garber ME, Troyanskaya OG, Schluens K, Petersen S, Thaesler Z, Pacyna-Gengelbach M, van de Rijn M, Rosen GD, Perou CM, Whyte RI, Altman RB,Brown PO, Botstein D, Petersen I. 2001. Diversity of gene expression in ade-nocarcinoma of the lung. Proc Natl Acad Sci USA 98:13784–9
21. Pomeroy SL, Tamayo P, Gaasenbeek M, Sturla LM, Angelo M, McLaughlin ME,Kim JY, Goumnerova LC, Black PM, Lau C, Allen JC, Zagzag D, Olson JM,Curran T, Wetmore C, Biegel JA, Poggio T, Mukherjee S, Rifkin R, Califano A,Stolovitzky G, Louis DN, Mesirov JP, Lander ES, Golub TR. 2002. Predictionof central nervous system embryonal tumour outcome based on gene expression.Nature 415:436–42
22. van ’t Veer LJ, Dai H, van de Vijver MJ, He YD, Hart AA, Mao M, PeterseHL, van der Kooy K, Marton MJ, Witteveen AT, Schreiber GJ, Kerkhoven RM,Roberts C, Linsley PS, Bernards R, Friend SH. 2002. Gene expression profilingpredicts clinical outcome of breast cancer. Nature 415:530–6
23. Brown PO, Botstein D. 1999. Exploring the new world of the genome with DNAmicroarrays. Nat Genet 21:33–7
24. Hughes TR, Mao M, Jones AR, Burchard J, Marton MJ, Shannon KW,Lefkowitz SM, Ziman M, Schelter JM, Meyer MR, Kobayashi S, Davis C, Dai H,He YD, Stephaniants SB, Cavet G, Walker WL, West A, Coffey E, ShoemakerDD, Stoughton R, Blanchard AP, Friend SH, Linsley PS. 2001. Expression pro-filing using microarrays fabricated by an ink–jet oligonucleotide synthesizer. NatBiotechnol 19:342–7
25. Kane MD, Jatkoe TA, Stumpf CR, Lu J, Thomas JD, Madore SJ. 2000. Assess-ment of the sensitivity and specificity of oligonucleotide (50mer) microarrays.Nucleic Acids Res 28:4552–7
26. Lipshutz RJ, Fodor SP, Gingeras TR, Lockhart DJ. 1999. High density syntheticoligonucleotide arrays. Nat Genet 21:20–4
27. Kallioniemi A, Kallioniemi OP, Sudar D, Rutovitz D, Gray JW, Waldman F,Pinkel D. 1992. Comparative genomic hybridization for molecular cytogeneticanalysis of solid tumors. Science 258:818–21
28. Yuen T, Wurmbach E, Pfeffer RL, Ebersole BJ, Sealfon SC. 2002. Accuracyand calibration of commercial oligonucleotide and custom cDNA microarrays.Nucleic Acids Res 30:e48
29. Kuo WP, Jenssen TK, Butte AJ, Ohno-Machado L, Kohane IS. 2002. Analysisof matched mRNA measurements from two different microarray technologies.Bioinformatics 18:405–12
30. Li J, Pankratz M, Johnson JA. 2002. Differential gene expression patterns re-vealed by oligonucleotide versus long cDNA arrays. Toxicol Sci 69:383–90
31. Hu GK, Madore SJ, Moldover B, Jatkoe T, Balaban D, Thomas J, Wang Y.2001. Predicting splice variant from DNA chip expression data. Genome Res11:1237–45
32. Fodor SP, Read JL, Pirrung MC, Stryer L, Lu AT, Solas D. 1991. Light–directed,spatially addressable parallel chemical synthesis. Science 251:767–73
33. Maskos U, Southern EM. 1992. Oligonucleotide hybridizations on glass sup-ports: a novel linker for oligonucleotide synthesis and hybridization properties ofoligonucleotides synthesised in situ. Nucleic Acids Res 20:1679–84
34. Nanthakumar A, Pon RT, Mazumder A, Yu S, Watson A. 2000. Solid–phaseoligonucleotide synthesis and flow cytometric analysis with microspheres encodedwith covalently attached fluorophores. Bioconjug Chem 11:282–8
248 Ramesh Ramakrishnan et al.
35. Graves DJ. 1999. Powerful tools for genetic analysis come of age. TrendsBiotechnol 17:127–34
36. Marshall WS, Boymel JL. 1999. Drug Discovery Today. 2:34–4237. Elghanian R, Xu Y, McGowen J, Siethoff M, Liu CG, Winick J, Fuller N, Ra-
makrishnan R, Beuhler A, Johnson T, Mazumder A, Brush C. 2001. Nucleosides,Nucleotides and Nucleic Acids. 20:1371–1375
38. Lemeshko SV, Powdrill T, Belosludtsev YY, Hogan M. 2001. Oligonucleotidesform a duplex with non-helical properties on a positively charged surface. NucleicAcids Res 29:3051–8
39. Lockhart DJ, Dong H, Byrne MC, Follettie MT, Gallo MV, Chee MS, MittmannM, Wang C, Kobayashi M, Horton H, Brown EL. 1996. Expression monitoring byhybridization to high–density oligonucleotide arrays. Nat Biotechnol 14:1675–80
40. Mir KU, Southern EM. 1999. Determining the influence of structure on hy-bridization using oligonucleotide arrays. Nat Biotechnol 17:788–92
41. Matveeva OV, Tsodikov AD, Giddings M, Freier SM, Wyatt JR, SpiridonovAN, Shabalina SA, Gesteland RF, Atkins JF. 2000. Identification of sequencemotifs in oligonucleotides whose presence is correlated with antisense activity.Nucleic Acids Res 28:2862–5
42. Wetmur JG. 1991. DNA probes: applications of the principles of nucleic acidhybridization. Crit Rev Biochem Mol Biol 26:227–59
43. Langer PR, Waldrop AA, Ward DC. 1981. Enzymatic synthesis of biotin–labeledpolynucleotides: novel nucleic acid affinity probes. Proc Natl Acad Sci USA78:6633–7
44. Ramakrishnan R, Dorris D, Lublinsky A, Nguyen A, Domanus M, ProkhorovaA, Gieser L, Touma E, Lockner R, Tata M, Zhu X, Patterson M, Shippy R,Sendera TJ, Mazumder A. 2002. An assessment of Motorola CodeLink microar-ray performance for gene expression profiling applications. Nucleic Acids Res30:e30
45. Lockhart DJ, Winzeler EA. 2000. Genomics, gene expression and DNA arrays.Nature 405:827–36
46. Wang X, Ghosh S, Guo SW. 2001. Quantitative quality control in microarrayimage processing and data acquisition. Nucleic Acids Res 29:E75–5
47. Wodicka L, Dong H, Mittmann M, Ho MH, Lockhart DJ. 1997. Genome–wideexpression monitoring in Saccharomyces cerevisiae. Nat Biotechnol 15:1359–67
48. Hastie ND, Bishop JO. 1976. The expression of three abundance classes of mes-senger RNA in mouse tissues. Cell 9:761–74
49. Chan V, Graves DJ, McKenzie SE. 1995. The biophysics of DNA hybridizationwith immobilized oligonucleotide probes. Biophys J 69:2243–55
50. Hong Y, Muller UR, Lai F. 2003. Toxicology in Vitro 17:85–9251. Riccelli PV, Merante F, Leung KT, Bortolin S, Zastawny RL, Janeczko R,
Benight AS. 2001. Hybridization of single–stranded DNA targets to immobilizedcomplementary DNA probes: comparison of hairpin versus linear capture probes.Nucleic Acids Res 29:996–1004
52. Yue H, Eastman PS, Wang BB, Minor J, Doctolero MH, Nuttall RL, Stack R,Becker JW, Montgomery JR, Vainer M, Johnston R. 2001. An evaluation ofthe performance of cDNA microarrays for detecting changes in global mRNAexpression. Nucleic Acids Res 29:E41–1
53. Che D, Bao Y, Muller UR. 2001. Novel surface and multicolor charge coupleddevice–based fluorescent imaging system for DNA microarrays. J Biomed Opt6:450–6
11 High Sensitivity Expression Profiling 249
54. Neuschaefer D, Budach W, Wanke C. 2002. SPIE’s BIOS 2002. ProceedingAbstract 4626–115:189
55. Stimpson DI, Hoijer JV, Hsieh WT, Jou C, Gordon J, Theriault T, Gamble R,Baldeschwieler JD. 1995. Real–time detection of DNA hybridization and meltingon oligonucleotide arrays by using optical wave guides. Proc Natl Acad Sci USA92:6379–83
56. Broude NE, Woodward K, Cavallo R, Cantor CR, Englert D. 2001. DNA mi-croarrays with stem–loop DNA probes: preparation and applications. NucleicAcids Res 29:E92
57. Cheek BJ, Steel AB, Torres MP, Yu YY, Yang H. 2001. Chemiluminescencedetection for hybridization assays on the flow–thru chip, a three–dimensionalmicrochannel bio–chip. Anal Chem 73:5777–83
58. Fredrickson HL, Perkins EJ, Bridges TS, Tonucci RJ, Fleming JK, Nagel A,Diedrich K, Mendez-Tenorio A, Doktycz MJ, Beattie KL. 2001. Towards envi-ronmental toxicogenomics – development of a flow–through, high–density DNAhybridization array and its application to ecotoxicity assessment. Sci Total En-viron 274:137–49
59. Raghavachari N, Bao Y, Li G, Xie X, Muller UR. 2003. Reduction of autofluo-rescence on DNA microarrays and slide surfaces by treatment with sodium boro-hydride. Anal Biochem 312:102–5
60. Duggan DJ, Bittner M, Chen Y, Meltzer P, Trent JM. 1999. Expression profilingusing cDNA microarrays. Nat Genet 21:10–4
61. Mayanil CS, George D, Freilich L, Miljan EJ, Mania-Farnell B, McLone DG,Bremer EG. 2001. Microarray analysis detects novel Pax3 downstream targetgenes. J Biol Chem 276:49299–309
62. DeRisi J, Penland L, Brown PO, Bittner ML, Meltzer PS, Ray M, Chen Y,Su YA, Trent JM. 1996. Use of a cDNA microarray to analyse gene expressionpatterns in human cancer. Nat Genet 14:457–60
63. Relogio A, Schwager C, Richter A, Ansorge W, Valcarcel J. 2002. Optimizationof oligonucleotide–based DNA microarrays. Nucleic Acids Res 30:e51
64. Storhoff JJ, Marla SS, Hagenow S, Mehta H, Lucas A, Garimella V, Patno TJ,Buckingham W, Cork WH, Muller UR. 2002. SPIE Proceedings. SPIE Proceed-ings 4937:1–7
65. Sussman H. 2002. The Scientist. 16(13):37–3866. Schroeder BG, Peterson LM, Fleischmann RD. 2002. Improved quantitation and
reproducibility in Mycobacterium tuberculosis DNA microarrays. J Mol MicrobiolBiotechnol 4:123–6
67. Xiang CC, Kozhich OA, Chen M, Inman JM, Phan QN, Chen Y, BrownsteinMJ. 2002. Amine–modified random primers to label probes for DNA microarrays.Nat Biotechnol 20:738–42
68. Pabon C, Modrusan Z, Ruvolo MV, Coleman IM, Daniel S, Yue H, Arnold LJ Jr.2001. Optimized T7 amplification system for microarray analysis. Biotechniques31:874–9
69. Van Gelder RN, von Zastrow ME, Yool A, Dement WC, Barchas JD, EberwineJH. 1990. Amplified RNA synthesized from limited quantities of heterogeneouscDNA. Proc Natl Acad Sci USA 87:1663–7
70. Vernon SD, Unger ER, Rajeevan M, Dimulescu IM, Nisenbaum R, CampbellCE. 2000. Reproducibility of alternative probe synthesis approaches for gene ex-pression profiling with arrays. J Mol Diagn 2:124–7

250 Ramesh Ramakrishnan et al.
71. Wang E, Miller LD, Ohnmacht GA, Liu ET, Marincola FM. 2000. High–fidelitymRNA amplification for gene profiling. Nat Biotechnol 18:457–9
72. Raghavachari et al. Ambion TechNotes. 9((3)): http://www.ambion.com-/techlib/tn/93–9313.html
73. Theilgaard-Monch K, Cowland J, Borregaard N. 2001. Profiling of gene expres-sion in individual hematopoietic cells by global mRNA amplification and slot blotanalysis. J Immunol Methods 252:175–89
74. Brail LH, Jang A, Billia F, Iscove NN, Klamut HJ, Hill RP. 1999. Gene ex-pression in individual cells: analysis using global single cell reverse transcriptionpolymerase chain reaction (GSC RT–PCR). Mutat Res 406:45–54
75. Bao P, Frutos AG, Greef C, Lahiri J, Muller U, Peterson TC, Warden L, XieX. 2002. High–sensitivity detection of DNA hybridization on microarrays usingresonance light scattering. Anal Chem 74:1792–7
76. Srilatha S, Raghavachari N, Bao YP, Muller UR, Feldman D. 2003. Breast Can-cer Research and Treatment. in press
77. Yuen PK, Li G, Bao P, Muller UR. 2003. Lab on a Chip. 3:46–5078. Adey NB, Lei M, Howard MT, Jensen JD, Mayo DA, Butel DL, Coffin SC,
Moyer TC, Slade DE, Spute MK, Hancock AM, Eisenhoffer GT, Dalley BK,McNeely MR. 2002. Gains in sensitivity with a device that mixes microarrayhybridization solution in a 25–microm–thick chamber. Anal Chem 74:6413–7
79. Wahl GM, Stern M, Stark GR. 1979. Efficient transfer of large DNA fragmentsfrom agarose gels to diazobenzyloxymethyl–paper and rapid hybridization by us-ing dextran sulfate. Proc Natl Acad Sci USA 76:3683–7
80. Elowitz MB, Levine AJ, Siggia ED, Swain PS. 2002. Stochastic gene expressionin a single cell. Science 297:1183–6
12
Applications of Matrix-CGH (Array-CGH)for Genomic Research and Clinical Diagnostics
Carsten Schwaenena, Michelle Nesslinga, Bernhard Radlwimmera,Swen Wessendorf, and Peter Lichtera
12.1 Introduction
One of the major scientific achievements of the past decade was the rapiddevelopment of genomic research, resulting in the comprehensive sequenceinformation of the human genome. This information has provided the basisfor the identification of a vast number of novel genomic aberrations in tumorsand hereditary diseases.
Cancer etiology and development is associated with hereditary or acquiredgenomic alterations. Among these, genomic imbalances play a prominent rolewith deletions indicating the localization of tumor suppressor genes (e.g.NF2, P53 or ATM) or amplifications frequently affecting protooncogenes (e.g.MYC). Such aberrations may lead to an inactivation or, by a so–called “dosageeffect”, activation of genes relevant to the initiation and progression of tumorcells. Genomic imbalances also play an important role in the field of clinicalgenetics. Many human mental retardation syndromes, congenital malforma-tions and miscarriages are caused by defined copy number gains or losses ofvarious chromosomal regions, whole chromosomes, or by small subtelomericchromosome rearrangements [1–5]. Besides the most frequent aneuploidies ofhuman chromosomes, such as Patau syndrome (trisomy of chromosome 13),Edward syndrome (trisomy of chromosome 18) or Down syndrome (trisomy ofchromosome 21), a number of congenital diseases are associated with smallerimbalances, mostly microdeletions: e.g. Prader–Willi syndrome (15q12), An-gelman syndrome (15q12), Williams syndrome (7q11.2), or DiGeorge syn-drome (22q11.21). Identification of chromosomal imbalances has significantlycontributed to the detection of genes playing a pathogenic role and the elucida-tion of molecular mechanisms responsible for defined phenotypes in malignantor congenital diseases.
Our current understanding of chromosomal alterations is mainly based onchromosome banding analysis, visualization of targeted genomic regions byfluorescence in situ hybridization (FISH) to metaphase chromosomes or inter-phase cell nuclei, or traditional comparative genomic hybridization (CGH).
252 Carsten Schwaenena et al.
In the last decade, CGH was extensively applied to the investigation of re-current imbalances in hematological malignancies and solid tumors. CGHto metaphase chromosomes is a molecular cytogenetic technique that allowsgenome–wide screening for imbalanced chromosomal regions independent ofthe need to prepare metaphase chromosomes from the specimen to be inves-tigated. This is of particular importance in the analysis of tumor cells, as inmany instances dividing cells are difficult or even impossible to obtain. Thus,CGH circumvents the limitations of conventional karyotype analysis includ-ing mandatory short-term culturing of the tumor cells which might induceadditional chromosomal aberrations. In principle, equal amounts of differen-tially labelled genomic test (e.g. tumor) and control DNA are used as probesfor fluorescence in situ hybridization (FISH) onto chromosomes of normalmetaphase cells immobilized on glass slides. The comparison of the obtainedhybridization–signal intensities of both DNA probes represents an average ofall imbalances present in the sample genome [6–10].
CGH allows genome–wide localization of chromosomal imbalances with-out prior knowledge of specific regions of interest, and has been used to studya large variety of solid tumors and hematological malignancies [11–16]. Suchstudies have revealed a wealth of novel genomic aberrations, contributed to theidentification of novel genes, and provided the basis for improved cancer clas-sification schemes. Conventional CGH, however, has not become a diagnostictool in clinical settings, since the method is technically demanding, difficultto automate and has limited spatial resolution. Due to the degree of DNAcondensation of metaphase chromosomes, resolution of CGH is restricted toapproximately 3–10 Mb for low copy number gains and losses [17–19] and2 Mb (a product of the degree of repetition and the size of the amplicon) forhigh level amplifications [8, 20].
To circumvent these problems, it was mandatory to replace the metaphasechromosomes as targets for comparative in situ hybridization. A chip-basedtechnique, termed “matrix–CGH” or “array–CGH”, was developed [21] allow-ing analyses at a much higher resolution and providing a basis for extensiveautomation. For this approach, the chromosome targets are substituted bywell-defined genomic DNA fragments (e.g. specific for chromosomal regionsor genes) cloned in various types of vectors (e.g. BACs, PACs, cosmids, plas-mids). These fragments are immobilized on glass surfaces in order to generatea microarray where each clone is represented on a distinct position of thematrix. When the technique was first reported [21] most of the steps of theprocedure were performed manually. This approach has been extended andmodified with regard to automation and array size [22–24]. Rapid and repro-ducible positioning of large numbers of DNA fragments is achieved using inkjet, split pin or capillary-based robotic printing systems. This allows high res-olution genomic screening of thousands of defined DNA targets immobilizedon glass slides in a single experiment. The spatial resolution of matrix–CGHis highly superior to that of chromosomal CGH. Resolution is limited mainlyby the size of the spotted DNA fragments, and by the fact that hybridization
12 Applications of Matrix-CGH (Array-CGH) 253
signal strength decreases with decreasing fragment size and complexity. UsingBAC or PAC clones as targets, single–copy number changes can be detectedwith a resolution similar to that of interphase FISH in a single hybridizationexperiment. Analysis of multiple genomic regions by inter-phase FISH, in con-trast, would require either multiple hybridization experiments or a complexmulticolor FISH approach applied to a series of cell nuclei. High level ampli-fications down to a size of several kb can be detected by using cDNA arraysas hybridization targets [25,26].
Matrix–CGH analysis is based on a co-hybridization of differentiallyfluorescent-labelled genomic test and control DNA. Following hybridization,the signal intensities of both fluorochromes are measured for each target se-quence and the respective normalized signal ratios are calculated. The ob-tained genomic profile indicates gains or losses of chromosomal regions likelow copy number losses, such as deletions, low copy number gains, such astrisomies, or high level amplifications. A representative example is shown inFigs. 12.1 and 12.2. One should keep in mind that comparative genomic hy-bridization does not allow the identification of balanced chromosome aberra-tions such as balanced translocations or inversions. While matrix–CGH is ded-icated to the detection of net genomic imbalances, genomic DNA arrays couldalso contribute to the fine mapping of breakpoints in rearranged chromosomes.Provided a marker chromosome is prepared by flow sorting or micromanipu-lation techniques and the chromosome-derived labelled DNA is hybridized toa comprehensive genomic array, breakpoints could be pinpointed to a singlefragment immobilized on the chip depending on the chip design [27].
12.2 Technical Aspects
Different DNA targets have been tested for use in matrix–CGH. The mostcommon are genomic DNA fragments cloned in different vector types (BAC,PAC, cosmid) [21, 22, 24]. These spanning DNA inserts (up to 300 kbp) areprepared from bacterial cultures and sheared by sonification to a fragmentlength of 500–5000 kbp [22, 24], or generated by applying PCR-based ampli-fication procedures [23, 28]. One disadvantage of the preparation from largebacterial cultures is that it is laborious and expensive and has to be repeatedwhenever the DNA supply has been exhausted. To overcome these problems,methods of whole–genome amplification, such as degenerate–oligonucleotide–primed–PCR (DOP–PCR, [29]) PCR and single-cell comparative genomic hy-bridization (SCOMP); [30]), have been applied to PCR–amplify BAC andPAC clone DNA [23, 27]. For these methods, DNA is prepared on a smallscale, and the PCR products, once obtained, can be repeatedly re-amplifiedproducing a large supply of target DNA. Furthermore, use of PCR-amplifiedBAC and PAC sequence pools has the advantage of allowing the simultane-ous preparation of thousands of DNA fragments ready to be immobilized on a
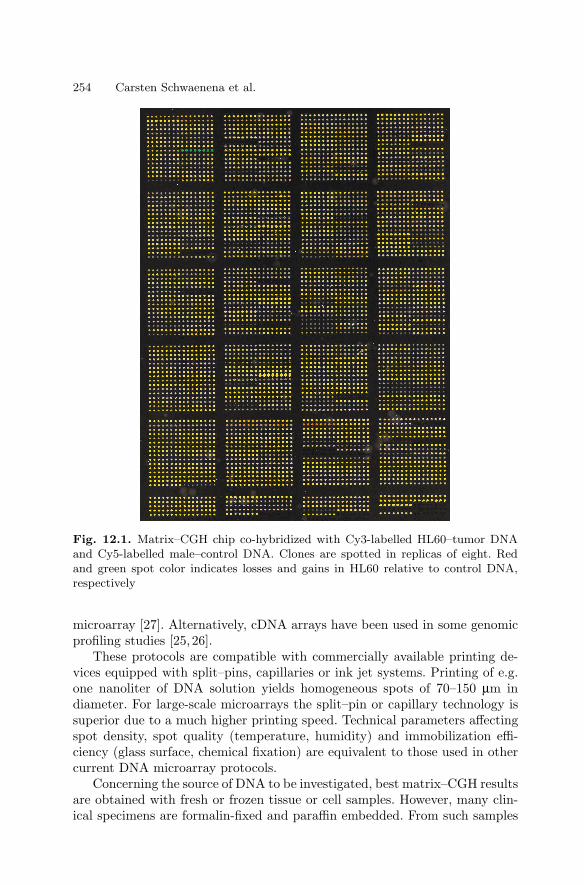
254 Carsten Schwaenena et al.
Fig. 12.1. Matrix–CGH chip co-hybridized with Cy3-labelled HL60–tumor DNAand Cy5-labelled male–control DNA. Clones are spotted in replicas of eight. Redand green spot color indicates losses and gains in HL60 relative to control DNA,respectively
microarray [27]. Alternatively, cDNA arrays have been used in some genomicprofiling studies [25,26].
These protocols are compatible with commercially available printing de-vices equipped with split–pins, capillaries or ink jet systems. Printing of e.g.one nanoliter of DNA solution yields homogeneous spots of 70–150 µm indiameter. For large-scale microarrays the split–pin or capillary technology issuperior due to a much higher printing speed. Technical parameters affectingspot density, spot quality (temperature, humidity) and immobilization effi-ciency (glass surface, chemical fixation) are equivalent to those used in othercurrent DNA microarray protocols.
Concerning the source of DNA to be investigated, best matrix–CGH resultsare obtained with fresh or frozen tissue or cell samples. However, many clin-ical specimens are formalin-fixed and paraffin embedded. From such samples
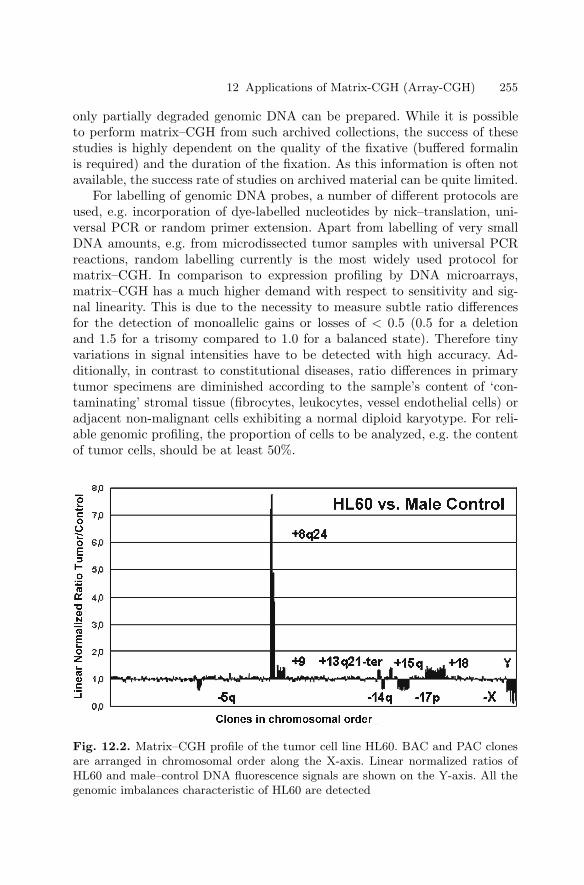
12 Applications of Matrix-CGH (Array-CGH) 255
only partially degraded genomic DNA can be prepared. While it is possibleto perform matrix–CGH from such archived collections, the success of thesestudies is highly dependent on the quality of the fixative (buffered formalinis required) and the duration of the fixation. As this information is often notavailable, the success rate of studies on archived material can be quite limited.
For labelling of genomic DNA probes, a number of different protocols areused, e.g. incorporation of dye-labelled nucleotides by nick–translation, uni-versal PCR or random primer extension. Apart from labelling of very smallDNA amounts, e.g. from microdissected tumor samples with universal PCRreactions, random labelling currently is the most widely used protocol formatrix–CGH. In comparison to expression profiling by DNA microarrays,matrix–CGH has a much higher demand with respect to sensitivity and sig-nal linearity. This is due to the necessity to measure subtle ratio differencesfor the detection of monoallelic gains or losses of < 0.5 (0.5 for a deletionand 1.5 for a trisomy compared to 1.0 for a balanced state). Therefore tinyvariations in signal intensities have to be detected with high accuracy. Ad-ditionally, in contrast to constitutional diseases, ratio differences in primarytumor specimens are diminished according to the sample’s content of ‘con-taminating’ stromal tissue (fibrocytes, leukocytes, vessel endothelial cells) oradjacent non-malignant cells exhibiting a normal diploid karyotype. For reli-able genomic profiling, the proportion of cells to be analyzed, e.g. the contentof tumor cells, should be at least 50%.
Fig. 12.2. Matrix–CGH profile of the tumor cell line HL60. BAC and PAC clonesare arranged in chromosomal order along the X-axis. Linear normalized ratios ofHL60 and male–control DNA fluorescence signals are shown on the Y-axis. All thegenomic imbalances characteristic of HL60 are detected
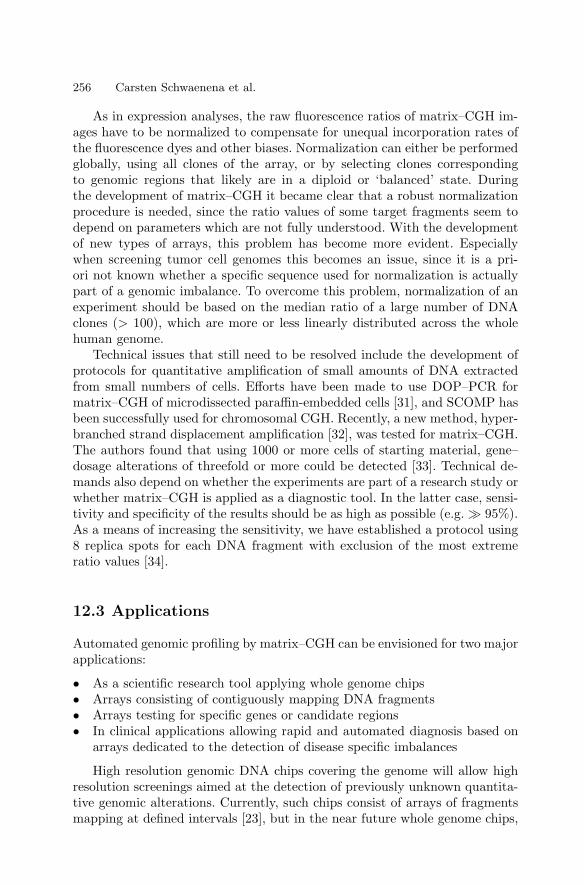
256 Carsten Schwaenena et al.
As in expression analyses, the raw fluorescence ratios of matrix–CGH im-ages have to be normalized to compensate for unequal incorporation rates ofthe fluorescence dyes and other biases. Normalization can either be performedglobally, using all clones of the array, or by selecting clones correspondingto genomic regions that likely are in a diploid or ‘balanced’ state. Duringthe development of matrix–CGH it became clear that a robust normalizationprocedure is needed, since the ratio values of some target fragments seem todepend on parameters which are not fully understood. With the developmentof new types of arrays, this problem has become more evident. Especiallywhen screening tumor cell genomes this becomes an issue, since it is a pri-ori not known whether a specific sequence used for normalization is actuallypart of a genomic imbalance. To overcome this problem, normalization of anexperiment should be based on the median ratio of a large number of DNAclones (> 100), which are more or less linearly distributed across the wholehuman genome.
Technical issues that still need to be resolved include the development ofprotocols for quantitative amplification of small amounts of DNA extractedfrom small numbers of cells. Efforts have been made to use DOP–PCR formatrix–CGH of microdissected paraffin-embedded cells [31], and SCOMP hasbeen successfully used for chromosomal CGH. Recently, a new method, hyper-branched strand displacement amplification [32], was tested for matrix–CGH.The authors found that using 1000 or more cells of starting material, gene–dosage alterations of threefold or more could be detected [33]. Technical de-mands also depend on whether the experiments are part of a research study orwhether matrix–CGH is applied as a diagnostic tool. In the latter case, sensi-tivity and specificity of the results should be as high as possible (e.g. 95%).As a means of increasing the sensitivity, we have established a protocol using8 replica spots for each DNA fragment with exclusion of the most extremeratio values [34].
12.3 Applications
Automated genomic profiling by matrix–CGH can be envisioned for two majorapplications:
• As a scientific research tool applying whole genome chips• Arrays consisting of contiguously mapping DNA fragments• Arrays testing for specific genes or candidate regions• In clinical applications allowing rapid and automated diagnosis based on
arrays dedicated to the detection of disease specific imbalances
High resolution genomic DNA chips covering the genome will allow highresolution screenings aimed at the detection of previously unknown quantita-tive genomic alterations. Currently, such chips consist of arrays of fragmentsmapping at defined intervals [23], but in the near future whole genome chips,
12 Applications of Matrix-CGH (Array-CGH) 257
carrying, e.g., a complete tiling path of fragments of the human genome, willbecome available. The identified aberrations will allow the identification ofcritical chromosomal regions or might even pinpoint critical genes, e.g. tumorsuppressor genes or oncogenes. Aberrant chromosomal regions can be furthernarrowed to microdeletions or single imbalanced DNA fragments by subse-quent molecular analysis with specialized arrays consisting of contiguouslymapping genomic DNA fragments (‘contigs’). Depending on the size of theimbalanced chromosomal region and the desired physical resolution, BACs,PACs, cosmids or sets of cDNAs of adjacent genes are used. Whenever disease-relevant chromosomal regions have been identified by any method, contig chipsare a suitable starting point for studies aiming at the identification of diseasegenes. The feasibility of this approach has been recently demonstrated in 116patients with hereditary neurofibromatosis type 2. In this study, the chro-mosomal region 22q12 was analyzed with defined contigs uncovering smalldeletions as small as 40 kbp in size [35]. Thus, matrix–CGH allows bridgingof the gap between imbalances approximately 10 Mbp in size, assessed, e.g.by cytogenetic methods, and smaller imbalances only some 100 kbp in length.
A further approach utilizes various designs of so-called onco chips, whichtest for the copy number of genes, selected on the basis of their function (e.g.carcino–genesis) or location (e.g. in tumor-associated imbalanced regions). Ina recent study, such a chip was used to identify previously undetected, hid-den chromosomal amplifications in high grade non-Hodgkin lymphoma thatcorrelate with the mRNA expression level of candidate genes located in therespective amplicons [36]. Based on this and other studies [37, 38], and inanalogy to the novel findings that had been detected with traditional CGH, it
Fig. 12.3. Comparison of matrix–CGH and chromosomal CGH values. Adaptedfrom Wessendorf et al. 2002. Examples are shown for tumor cell lines COLO320–HSR(continuous amplification of 8q24, grey bars) and HL60 (discontinuous amplificationof 8q24, black bars). Although the scoring of the ratio values of the two methods ishighly concordant, the absolute ratio values of the amplified regions are distributedover a much higher range for array signals, indicating the superior dynamics ofmatrix–CGH
258 Carsten Schwaenena et al.
can be assumed that matrix–CGH will help to uncover numerous ampliconstoo small to be seen when using conventional methods. Furthermore, due tothe method’s high resolution, detection of discontinuous amplifications willeven become possible (Fig. 12.3). Once the number of candidate genes hasbeen limited by fine–mapping of amplicons, subsequent molecular analyseswill lead to the identification of new disease-related genes, in particular oncogenes. The significance of the identified amplicon can easily be verified byFISH to tissue microarrays [39], which are a convenient tool to rapidly as-sess the frequency of the respective amplification in a large series of tumors.Pathogenically significant gene amplifications can also provide interferencepoints for new therapeutic targets. The Her2/neu amplification in breast car-cinomas and other tumors serves as a paradigmatic example. Amplification ofthis gene, which codes for a membrane-bound receptor, is associated with tu-mor progression. Patients carrying this amplification benefit from treatmentwith a modified antibody (Herceptin) directed against the receptor. Effortsneeded to prove the pathogenic role of a candidate gene, however, should notbe underestimated. Even with today’s advanced technologies, comprehensivefunctional characterization, including analysis of DNA sequence, RNA andprotein expression levels, posttranslational modifications, molecular interac-tions in biological pathways, and more, remains a formidable challenge.
Another interesting application of matrix–CGH is the detailed compari-son of related tumor samples from an individual patient. This approach is ofparticular interest to the monitoring of tumor development and progressionat different time points including comparison between primary tumors andderived metastases, transformation of tumors towards higher malignancies oranalysis of relapse. Information about when and where chromosomal imbal-ances occur or recur in one individual will potentially aid the discovery ofgenes relevant to tumor initiation, aggressiveness, metastatic potential, andtreatment resistance (e.g. [40, 41]).
In the recent past, the accumulation of complex molecular data has greatlycontributed to improvements in tumor classification schemes. Assessment ofgenomic imbalances at an unprecedented resolution will likely also contributeto further refinements in tumor classification. In this context, two recentmatrix–CGH studies are of particular interest. It could be shown that profilingof genomic imbalances allows reliable diagnosis of renal cell carcinoma [42].A study comparing the genomic profile of dedifferentiated and pleomorphicliposarcomas uncovered a highly distinct pattern of both tumor entities [43].Interestingly, this distinction was unequivocal using the genomic profile, butwas less apparent from the expression profiles obtained from the same tumorseries. Thus, depending on the diagnostic question and the tumor type, ex-pression studies are not always superior in their diagnostic potential. Thisis an important consideration for practical reasons as well, since DNA typ-ically is much more stable than RNA and therefore much better suited forapplication in routine diagnostics.
12 Applications of Matrix-CGH (Array-CGH) 259
While matrix–CGH is now broadly accepted as a research tool, it is of-ten debated to what degree it will really become part of routine diagnostics.Matrix–CGH could be used for the diagnosis of well-characterized recurrentchromosomal aberrations, which predict a homogeneous clinical course. Insuch a setting, the diagnosis could support treatment decisions and contributeto a further individualization of anticancer therapies. The identification ofdistinct clinical subgroups with different prognostic outcome is certainly mostadvanced in hematological malignancies. For example, cytogenetic methods,such as chromosome banding and FISH, are used to define subgroups in pa-tients with chronic lymphocytic or acute leukemias according to their survivalprobabilities. The impact of such diagnostic data is evident in acute myeloidleukemias, where patients are already treated with either risk-adapted con-ventional chemotherapy or myeloablative peripheral stem cell transplantationaccording to their cytogenetic risk profile. Thus, genomic profiles provide im-portant information for a tailored treatment, i.e. each patient receiving thebest therapy available when comparing treatment tolerance and individualgenetic risk.
Finally, it will be important to reliably diagnose the pattern of genomicalterations with prognostic impact. Disease specific matrix–CGH chips willsimplify the identification of relevant chromosomal aberrations, since theyallow an automated diagnostic procedure. We have developed such a chipoptimized to detect alterations in chronic lymphocytic leukemia of B–celltype. This disease is characterized by a highly variable clinical course. Re-current chromosomal imbalances were shown to provide strongly significantprognostic markers with deletions including chromosome arms 17p or 11q be-ing associated with rapid disease progression and shorter overall survival ofpatients [44]. As therapy decisions based on these biological findings appear tobecome an option that is being tested in clinical trials, we developed a DNAmicroarray dedicated to meet the clinical needs. Testing of this chip revealedan unprecedented diagnostic specificity and sensitivity [34].
Besides oncological applications, CGH to microarrays will also becomean important tool in clinical genetics. In families with unexplained mentalretardation or dysmorphic features, as yet unknown microdeletions or crypticrearrangements associated with small imbalances of genomic material seem toplay a major role. Thus, prenatal and postnatal diagnostics in these familieswould greatly benefit from a method screening for such alterations at a highresolution, such as matrix–CGH with a genome–wide chip design. In caseof mental retardation with negative cytogenetic results, a specialized chipcovering all telomeric regions could be of particular importance [45], sincemore than 5% of cases with mental retardation seem to be associated withcryptic telomeric translocations including small genomic imbalances [46].
In addition to the many applications that are currently pursued, genomicmicroarrays will likely find new uses in other areas as well. For example,it can be envisioned that genomic DNA chips will be applied to study theextent of genomic duplications and deletions that have occurred during evo-
260 Carsten Schwaenena et al.
lution and that seem to exist as polymorphisms within populations [47]. More-over, new technical developments are likely to further increase the potentialof genomic DNA arrays. For instance, a combination of immunoprecipitationand hybridization to genomic microarrays could facilitate the assignment ofDNA/protein binding sites [48]. Certainly, CGH to microarrays is still in itsearly phase and the spectrum of applications will likely increase further in thefuture.
References
1. Knight SJ, Flint J. Perfect endings: a review of subtelomeric probes and theiruse in clinical diagnosis. J Med Genet. 2000 Jun;37(6):401–9
2. Battaglia A, Carey JC. Diagnostic evaluation of developmental delay/mentalretardation: An overview. Am J Med Genet. 2003 Feb 15;117C(1):3–14
3. Cassidy SB, Dykens E, Williams CA. Prader-Willi and Angelman syndromes:sister imprinted disorders. Am J Med Genet. 2000 ;97(2):136–46
4. Donnai D, Karmiloff-Smith A. Williams syndrome: from genotype through tothe cognitive phenotype. Am J Med Genet. 2000;97(2):164–71
5. Scambler PJ. The 22q11 deletion syndromes. Hum Mol Genet. 2000 Oct;9(16):2421–6
6. Kallioniemi A, Kallioniemi OP, Sudar D, Rutovitz D, Gray JW, Waldman F,Pinkel D. Comparative genomic hybridization for molecular cytogenetic analysisof solid tumors. Science. 1992 Oct 30;258(5083):818–21
7. Du Manoir S, Speicher MR, Joos S, Schrock E, Popp S, Dohner H, KovacsG, Robert-Nicoud M, Lichter P, Cremer T. Detection of complete and partialchromosome gains and losses by comparative genomic in situ hybridization. HumGenet. 1993 Feb;90(6):590–610
8. Joos S, Scherthan H, Speicher MR, Schlegel J, Cremer T, Lichter P. Detection ofamplified DNA sequences by reverse chromosome painting using genomic tumorDNA as probe. Hum Genet. 1993 Feb;90(6):584–9
9. Kallioniemi OP, Kallioniemi A, Sudar D, Rutovitz D, Gray JW, WaldmanF, Pinkel D. Comparative genomic hybridization: a rapid new method for de-tecting and mapping DNA amplification in tumors. Semin Cancer Biol. 1993Feb;4(1):41–6
10. Speicher MR, du Manoir S, Schrock E, Holtgreve-Grez H, Schoell B, LengauerC, Cremer T, Ried T. Molecular cytogenetic analysis of formalin–fixed, paraffin–embedded solid tumors by comparative genomic hybridization after universalDNA–amplification. Hum Mol Genet. 1993 Nov;2(11):1907–14
11. Forozan F, Karhu R, Kononen J, Kallioniemi A, Kallioniemi OP.Genome screening by comparative genomic hybridization. Trends Genet. 1997Oct;13(10):405–9
12. Zitzelsberger H, Lehmann L, Werner M, Bauchinger M. Comparative genomichybridisation for the analysis of chromosomal imbalances in solid tumours andhaematological malignancies. Histochem Cell Biol. 1997 Oct–Nov;108(4–5):403–17
13. Knuutila S, Armengol G, Bjorkqvist AM, el-Rifai W, Larramendy ML, Monni O,Szymanska J. Comparative genomic hybridization study on pooled DNAs from
12 Applications of Matrix-CGH (Array-CGH) 261
tumors of one clinical–pathological entity. Cancer Genet Cytogenet. 1998 Jan1;100(1):25–30
14. Bentz M, Werner CA, Dohner H, Joos S, Barth TF, Siebert R, Schroder M,Stilgenbauer S, Fischer K, Moller P, Lichter P. High incidence of chromosomalimbalances and gene amplifications in the classical follicular variant of folliclecenter lymphoma. Blood. 1996 Aug 15;88(4):1437–44
15. Bentz M, Plesch A, Bullinger L, Stilgenbauer S, Ott G, Muller-HermelinkHK, Baudis M, Barth TF, Moller P, Lichter P, Dohner H. t(11;14)–positivemantle cell lymphomas exhibit complex karyotypes and share similaritieswith B–cell chronic lymphocytic leukemia. Genes Chromosomes Cancer. 2000Mar;27(3):285–94
16. Knuutila S, Aalto Y, Autio K, Bjorkqvist AM, El-Rifai W, Hemmer S, HuhtaT, Kettunen E, Kiuru-Kuhlefelt S, Larramendy ML, Lushnikova T, Monni O,Pere H, Tapper J, Tarkkanen M, Varis A, Wasenius VM, Wolf M, Zhu Y. DNAcopy number losses in human neoplasms. Am J Pathol. 1999 Sep;155(3):683–94
17. Kallioniemi A, Kallioniemi OP, Piper J, Tanner M, Stokke T, Chen L, SmithHS, Pinkel D, Gray JW, Waldman FM. Detection and mapping of amplifiedDNA sequences in breast cancer by comparative genomic hybridization. ProcNatl Acad Sci USA. 1994 Mar 15;91(6):2156–60
18. Bentz M, Plesch A, Stilgenbauer S, Dohner H, Lichter P. Minimal sizes of dele-tions detected by comparative genomic hybridization. Genes Chromosomes Can-cer. 1998 Feb;21(2):172–5
19. Kirchhoff M, Gerdes T, Maahr J, Rose H, Bentz M, Dohner H, LundsteenC. Deletions below 10 megabasepairs are detected in comparative genomic hy-bridization by standard reference intervals. Genes Chromosomes Cancer. 1999Aug;25(4):410–3
20. Piper J, Rutovitz D, Sudar D, Kallioniemi A, Kallioniemi OP, Waldman FM,Gray JW, Pinkel D. Computer image analysis of comparative genomic hybridiza-tion. Cytometry. 1995 Jan 1;19(1):10–26
21. Solinas-Toldo S, Lampel S, Stilgenbauer S, Nickolenko J, Benner A, DohnerH, Cremer T, Lichter P. Matrix–based comparative genomic hybridization:biochips to screen for genomic imbalances. Genes Chromosomes Cancer. 1997Dec;20(4):399–407
22. Pinkel D, Segraves R, Sudar D, Clark S, Poole I, Kowbel D, Collins C, KuoWL, Chen C, Zhai Y, Dairkee SH, Ljung BM, Gray JW, Albertson DG. Highresolution analysis of DNA copy number variation using comparative genomichybridization to microarrays. Nat Genet. 1998 Oct;20(2):207–11
23. Snijders AM, Nowak N, Segraves R, Blackwood S, Brown N, Conroy J, Hamil-ton G, Hindle AK, Huey B, Kimura K, Law S, Myambo K, Palmer J, Ylstra B,Yue JP, Gray JW, Jain AN, Pinkel D, Albertson DG. Assembly of microar-rays for genome–wide measurement of DNA copy number. Nat Genet. 2001Nov;29(3):263–4
24. Wessendorf S, Fritz B, Wrobel G, Nessling M, Lampel S, Goettel D, KuepperM, Joos S, Hopman T, Kokocinski F, Dohner H, Bentz M, Schwaenen C, LichterP. Automated screening for genomic imbalances using matrix–based comparativegenomic hybridization. Lab Invest. 2002 Jan;82(1):47–60
25. Pollack JR, Perou CM, Alizadeh AA, Eisen MB, Pergamenschikov A, WilliamsCF, Jeffrey SS, Botstein D, Brown PO. Genome–wide analysis of DNA copy–number changes using cDNA microarrays. Nat Genet. 1999 Sep;23(1):41–6
262 Carsten Schwaenena et al.
26. Hyman E, Kauraniemi P, Hautaniemi S, Wolf M, Mousses S, Rozenblum E,Ringner M, Sauter G, Monni O, Elkahloun A, Kallioniemi OP, Kallioniemi A.Impact of DNA amplification on gene expression patterns in breast cancer. Can-cer Res. 2002 Nov 1;62(21):6240–5
27. Carter NP, Fiegler H, Piper J. Comparative analysis of comparative genomichybridization microarray technologies: report of a workshop sponsored by theWellcome Trust. Cytometry. 2002 Oct 1;49(2):43–8
28. Carter NP. Analysis of chromosome rearrengements and replication timing usingDNA microarrays. Abstract, Perigueux; 2003
29. Telenius H, Carter NP, Bebb CE, Nordenskjold M, Ponder BA, Tunnacliffe A.Degenerate oligonucleotide–primed PCR: general amplification of target DNA bya single degenerate primer. Genomics. 1992 Jul;13(3):718–25
30. Klein CA, Schmidt-Kittler O, Schardt JA, Pantel K, Speicher MR, RiethmullerG. Comparative genomic hybridization, loss of heterozygosity, and DNA se-quence analysis of single cells. Proc Natl Acad Sci USA. 1999 Apr 13;96(8):4494–9
31. Daigo Y, Chin SF, Gorringe KL, Bobrow LG, Ponder BA, Pharoah PD, Cal-das C. Degenerate oligonucleotide primed–polymerase chain reaction–based ar-ray comparative genomic hybridization for extensive amplicon profiling of breastcancers : a new approach for the molecular analysis of paraffin–embedded cancertissue. Am J Pathol. 2001 May;158(5):1623–31
32. Dean FB, Hosono S, Fang L, Wu X, Faruqi AF, Bray-Ward P, Sun Z, ZongQ, Du Y, Du J, Driscoll M, Song W, Kingsmore SF, Egholm M, Lasken RS.Comprehensive human genome amplification using multiple displacement ampli-fication. Proc Natl Acad Sci USA. 2002 Apr 16;99(8):5261–6
33. Lage JM, Leamon JH, Pejovic T, Hamann S, Lacey M, Dillon D, SegravesR, Vossbrinck B, Gonzalez A, Pinkel D, Albertson DG, Costa J, Lizardi PM.Whole Genome Analysis of Genetic Alterations in Small DNA Samples UsingHyperbranched Strand Displacement Amplification and Array–CGH. GenomeRes. 2003 Feb;13(2):294–307
34. Schwaenen C, Nessling M, Wessendorf S, et al. Automated array-based ge-nomic profiling in chronic lymphocytic leukemia: Development of a clinical tooland discovery of recurrent genomic alterations Proc Natl Acad Sci USA 2004Jan;101(4):1039-1044
35. Bruder CE, Hirvela C, Tapia-Paez I, Fransson I, Segraves R, Hamilton G, ZhangXX, Evans DG, Wallace AJ, Baser ME, Zucman-Rossi J, Hergersberg M, Bolt-shauser E, Papi L, Rouleau GA, Poptodorov G, Jordanova A, Rask-AndersenH, Kluwe L, Mautner V, Sainio M, Hung G, Mathiesen T, Moller C, Pulst SM,Harder H, Heiberg A, Honda M, Niimura M, Sahlen S, Blennow E, Albert-son DG, Pinkel D, Dumanski JP. High resolution deletion analysis of consti-tutional DNA from neurofibromatosis type 2 (NF2) patients using microarray–CGH. Hum Mol Genet. 2001 Feb 1;10(3):271–82
36. Wessendorf S, Schwaenen C, Kohlhammer H et al. Hidden gene amplificationsin aggressive B-cell non-Hodgkin lymphomas detected by microarray-based com-parative genomic hybridization Oncogene 2003 Mar;22(9):1425-1429
37. Ishizuka T, Tanabe C, Sakamoto H, Aoyagi K, Maekawa M, Matsukura N,Tokunaga A, Tajiri T, Yoshida T, Terada M, Sasaki H. Gene amplificationprofiling of esophageal squamous cell carcinomas by DNA array CGH. BiochemBiophys Res Commun. 2002 Aug 9;296(1):152–5
12 Applications of Matrix-CGH (Array-CGH) 263
38. Zhao J, Roth J, Bode-Lesniewska B, Pfaltz M, Heitz PU, Komminoth P. Com-bined comparative genomic hybridization and genomic microarray for detectionof gene amplifications in pulmonary artery intimal sarcomas and adrenocorticaltumors. Genes Chromosomes Cancer. 2002 May;34(1):48–57
39. Kononen J, Bubendorf L, Kallioniemi A, Barlund M, Schraml P, LeightonS, Torhorst J, Mihatsch MJ, Sauter G, Kallioniemi OP. Tissue microarraysfor high–throughput molecular profiling of tumor specimens. Nat Med. 1998Jul;4(7):844–7
40. Martinez-Climent JA, Alizadeh AA, Segraves R, Blesa D, Rubio-Moscardo F,Albertson DG, Garcia-Conde J, Dyer MJ, Levy R, Pinkel D, Lossos IS. Trans-formation of follicular lymphoma to diffuse large cell lymphoma is associatedwith a heterogeneous set of DNA copy number and gene expression alterations.Blood. 2002 Oct 24
41. Kraus J, Pantel K, Pinkel D, Albertson DG, Speicher MR. High–resolutiongenomic profiling of occult micrometastatic tumor cells. Genes ChromosomesCancer. 2003 Feb;36(2):159–66
42. Wilhelm M, Veltman JA, Olshen AB, Jain AN, Moore DH, Presti JC Jr, Ko-vacs G, Waldman FM. Array–based comparative genomic hybridization for thedifferential diagnosis of renal cell cancer. Cancer Res. 2002 Feb 15;62(4):957–60
43. Fritz B, Schubert F, Wrobel G, Schwaenen C, Wessendorf S, Nessling M, KorzC, Rieker RJ, Montgomery K, Kucherlapati R, Mechtersheimer G, Eils R, JoosS, Lichter P. Microarray–based copy number and expression profiling in dediffer-entiated and pleomorphic liposarcoma. Cancer Res. 2002 Jun 1;62(11):2993–8
44. Dohner H, Stilgenbauer S, Benner A, Leupolt E, Krober A, Bullinger L, DohnerK, Bentz M, Lichter P. Genomic aberrations and survival in chronic lymphocyticleukemia. N Engl J Med. 2000 Dec 28;343(26):1910–6
45. Veltman JA, Schoenmakers EF, Eussen BH, Janssen I, Merkx G, van Cleef B,van Raven-swaaij CM, Brunner HG, Smeets D, van Kessel AG. High–throughputanalysis of sub-telomeric chromosome rearrangements by use of array–basedcomparative genomic hybridization. Am J Hum Genet. 2002 May;70(5):1269–76
46. Flint J, Wilkie AO, Buckle VJ, Winter RM, Holland AJ, McDermid HE. Thedetection of subtelomeric chromosomal rearrangements in idiopathic mental re-tardation. Nat Genet. 1995 Feb;9(2):132–40
47. Lichter P, Joos S, Bentz M, Lampel S. Comparative genomic hybridization: usesand limitations. Semin Hematol. 2000 Oct;37(4):348–57
48. Lockhart DJ, Winzeler EA. Genomics, gene expression and DNA arrays. Na-ture. 2000 Jun 15;405(6788):827–36
49. Johansson B, Mertens F, Mitelman F. Cytogenetic evolution patterns in non-Hodgkin’s lymphoma. Blood. 1995 Nov 15;86(10):3905–14
13
Analysis of Gene Regulatory Circuits
Zirong Li
13.1 Introduction
The gene regulatory circuitry controls the gene expression programs and per-mits a cell to grow, differentiate, and maintain normal functions within thetissues and organs [1]. It consists of two components: the transcription factorsthat bind to DNA and regulate expression of neighboring genes, and the cis-regulatory elements that are bound by transcription factors. Typically, a genehas a promoter that can be recognized by multiple transcription factors, andspecific expression of the gene is determined by a combination of these factorsthat bind to the promoter [2, 3]. Simultaneous binding of multiple transcrip-tion factors to the promoter is usually required to turn the gene on or off.Once bound to the target genes, the transcription factors recruit chromatinmodification complexes or the transcription machinery to activate or repressgene expression [4].
Malfunction of the gene regulatory circuitry is a major cause of humandiseases. More than 50 transcription factors have now been linked to geneticlesions that occur in human cancers. In order to understand the molecularbasis of cancer, it is necessary to identify the set of genes directly controlledby these regulators. The analysis of the gene regulatory network is not only ofsubstantial medical importance, but also a central problem in biology. Identifi-cation of the complete set of target genes for a transcription factor is essentialto decode the gene expression programs that produce living cells.
With the availability of complete genome sequences for many organismsand advances in DNA microarray technologies, a method has recently beendeveloped to directly examine the interactions between transcription factorsand their target sites in the genome [5, 6]. This technique, known as genomewide location analysis, combines a conventional chromatin immunoprecipi-tation protocol with microarray technologies to determine the genomic re-gions that a DNA binding protein recognizes in vivo. It contains four steps:chromatin immunoprecipitation (ChIP), ligation-mediated PCR (LM–PCR),hybridization and microarray analysis (Fig. 13.1).
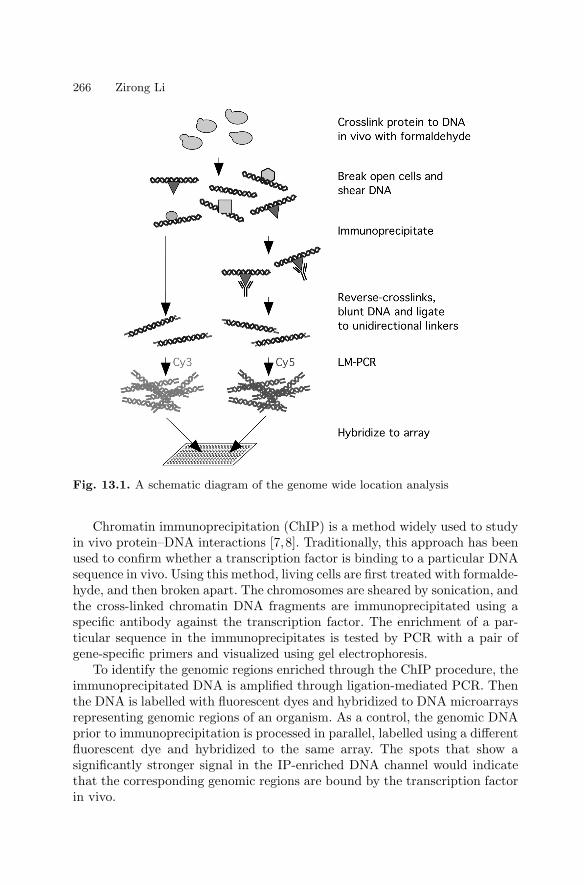
266 Zirong Li
Fig. 13.1. A schematic diagram of the genome wide location analysis
Chromatin immunoprecipitation (ChIP) is a method widely used to studyin vivo protein–DNA interactions [7,8]. Traditionally, this approach has beenused to confirm whether a transcription factor is binding to a particular DNAsequence in vivo. Using this method, living cells are first treated with formalde-hyde, and then broken apart. The chromosomes are sheared by sonication, andthe cross-linked chromatin DNA fragments are immunoprecipitated using aspecific antibody against the transcription factor. The enrichment of a par-ticular sequence in the immunoprecipitates is tested by PCR with a pair ofgene-specific primers and visualized using gel electrophoresis.
To identify the genomic regions enriched through the ChIP procedure, theimmunoprecipitated DNA is amplified through ligation-mediated PCR. Thenthe DNA is labelled with fluorescent dyes and hybridized to DNA microarraysrepresenting genomic regions of an organism. As a control, the genomic DNAprior to immunoprecipitation is processed in parallel, labelled using a differentfluorescent dye and hybridized to the same array. The spots that show asignificantly stronger signal in the IP-enriched DNA channel would indicatethat the corresponding genomic regions are bound by the transcription factorin vivo.
13 Analysis of Gene Regulatory Circuits 267
The genome wide location analysis is emerging as a powerful approach toanalyze the genetic regulatory network in cells. It has been successfully usedto identify target genes for a number of yeast and mammalian transcriptionfactors [5, 6, 9–11]. For example, the method was first used to characterizethe yeast Gal4 protein, a transcription regulator of the galactose metabolismpathway. All of the previously known Gal4 targets were identified, and threenovel targets were found and confirmed by independent methods [5]. In an-other study, Simon [10] used the genome wide location analysis to investigatenine transcription factors that play a role during the yeast cell cycle progres-sion. The results revealed a genetic regulatory network that appears to controlthe sequential activation of cyclins and other cell cycle regulators. Interest-ingly, each of these nine transcription factors was found to be a transcriptionaltarget for this network.
Most recently, more than 100 known yeast transcription regulators werecharacterized using the genome wide location analysis and their targets iden-tified [12]. The target genes for these regulators, which account for nearlyall the known yeast transcription factors, were experimentally mapped. Theinformation led to the discovery of six types of regulatory circuitry motifs,which appear to be the basic unit of genetic regulatory networks. This workrepresents the first comprehensive description of a genetic regulatory networkin an organism [12].
The genome wide location analysis has also proved useful to study mam-malian transcription factors [11, 13]. One of the main challenges in applyinggenome wide location analysis to mammalian cells is the availability of DNAmicroarrays that represent the whole genome. Because the human cells con-tain more than three billion base pairs per haploid genome, the cost to man-ufacture DNA microarrays to cover the entire genome is currently very high.Alternatives to the whole genome arrays have been developed. For example,Ren [11] developed DNA microarrays that represent human gene promoters,based on the assumption that these are the most important regulatory re-gions in the genome [11]. These arrays have been used to identify the targetgenes for E2F, regulators of mammalian DNA replication and cell cycle [11].Most known E2F targets were identified in this study. In another approach,genomic DNA libraries enriched for CpG islands were used to make DNAmicroarrays [13]. Since most human genes have CpG islands in their promot-ers, such arrays can also be used to identify potential target genes for humantranscription factors.
In this chapter, a genome wide location analysis protocol is described. Theapplication of this protocol to the human E2F factor is also demonstrated.
268 Zirong Li
13.2 An Experimental Protocolfor Genome Wide Location Analysis
This section describes a detailed protocol for genome wide location analysis.The protocol has been used to analyze the in vivo DNA binding sites forhuman transcription factors. With minor modifications, this protocol can alsobe used to study DNA binding proteins in other cell types or organisms.
13.2.1 Materials
• Distilled water (dH2O)• 5 × 10⁸ WI38 cells, of human lung fibroblast origin• DNA microarrays containing DNA fragments corresponding to human
gene promoters• Rabbit polyclonal antibodies against the transcription factor of interest• Sheep anti-rabbit IgG conjugated dynabeads (Dynal, Cat# 112.04)• Crosslinking solution (11% formaldehyde, 0.1 M NaCl, 1 mM Na–EDTA,
0.5 mM Na–EGTA, 50 mM Hepes, pH 8.0)• 2.5 M glycine solution• PBS (137 mM NaCl, 2.7 mM KCl, 10 mM Na2HPO4, 2 mM KH2PO4)• Lysis Buffer 1 (0.05 M Hepes–KOH, pH 7.5, 0.14 M NaCl, 1 µM EDTA,
10% glycerol, 0.5% NP–40, 0.25%, Triton X–100, protease inhibitor cock-tail (Roche Applied Science, CAT# 1836170) added prior to use)
• Lysis Buffer 2 (0.2 M NaCl, 1 µM EDTA, 0.5 µM EGTA, 10 µM Tris, pH 8,protease inhibitor cocktail (Roche Applied Science, CAT# 1836170) addedjust prior to use)
• Lysis Buffer 3 (1 µM EDTA, 0.5 µM EGTA, 10 µM Tris–HCl, pH 8, pro-tease inhibitor cocktail (Roche Applied Science, CAT# 1836170) addedjust prior to use)
• RIPA buffer (50 mM Hepes, pH 7.6, 1 mM EDTA, 0.7% DOC, 1% NP–40,0.5 M LiCl, protease inhibitor cocktail (Roche Applied Science, CAT#1836170) added prior to use)
• Elution buffer (50 mM Tris, pH 8, 10 mM EDTA, 1% SDS)• Proteinase K stock solution (20 mg/ml proteinase K (Sigma), 50 mM Tris–
HCl, pH 8.0, 1.5 mM Calcium Acetate)• TE (10 mM Tris–HCl, pH 8.0, 1 mM EDTA, pH 8.0)• Proteinase K solution (2% glycogen, 5% proteinase K stock solution, TE)• Linker oligo (oJW102: GCGGTGACCCGGGAGATCTGAATTC; oJW103:
GAATTCAGATC; these two oligos are dissolved in dH2O and annealedto make a 15 µM solution in 0.25 M Tris–HCl, pH 8.0)
• Hybridization buffer 1 (2.2 × SSC, 0.22% SDS)• Hybridization buffer 2 (70% formamide, 3 × SSC, 14.3% dextran sulfate)• Pre-hybridization buffer (2 × SSC, 0.05% SDS, 0.2% BSA)• Wash buffer 1 (2 × SSC, 0.1% SDS)• Wash buffer 2 (0.2 × SSC, 0.1%SDS)• Wash buffer 3 (0.2 × SSC)
13 Analysis of Gene Regulatory Circuits 269
13.2.2 Procedures
Chromatin Immunoprecipitation
Formaldehyde Cross–linking of Cells. The cells grown in plastic dishesare first re-suspended and transferred as 40 ml aliquots into 50 ml tubes. Thetubes are placed on ice for 10 minutes, then 1/10 volume, i.e. 4 ml, crosslinkingsolution is added directly to each tube. The cross–linking reaction is allowed tocontinue for 10 minutes before being stopped by the addition of 1/20 volume,i.e. 2.2 ml, of 2.5 M glycine solution to each tube. The fixed cells in eachtube are harvested by centrifugation at 2000 g for 10 minutes at 4C. Thecell pellets are re-suspended and pooled together with a total of 50 ml coldPBS. These cells are centrifuged again at 2000 g for 5 minutes at 4C, andthe supernatant is removed. After repeating the washing cycle once more, thefinal cell pellet is snap frozen in liquid nitrogen and stored at –80C.
Extraction and Fragmentation of Chromatin. The frozen cell pellet fromthe previous step is re-suspended in 30 ml of Lysis Buffer 1 and incubated for10 minutes at 4C on a rocking platform. The cell mixture is then centrifugedat 2000 g for 10 minutes at 4C. After removing the supernatant, the cell pelletis re-suspended in 24 ml Lysis Buffer 2 and mixed gently at room temperaturefor 10 minutes on a rocking platform. The cells are then centrifuged at 2000 gfor 10 minutes at 4C. The cell pellet is finally re-suspended in 10 ml of LysisBuffer 3.
To obtain small chromatin fragments from the above cell extracts, physicalshearing forces generated by a sonicator are used. The cell mixture from theprevious step is divided into 5 ml aliquots and placed in 15 ml tubes. Thesetubes are then placed on ice. Cells are continuously sonicated for 25 secondsusing a Branson Sonifier 450 with power setting at 5. The sonication is followedby at least 1 minute of incubation on ice to avoid accumulation of heat. Thecell mixture is sonicated and chilled for a total of eight cycles (Note that thenumber of sonication cycles varies with different cell types and cross–linkingconditions). Efficiency of sonication can be checked by taking 10 µl of cellextract out for gel analysis after each cycle, with the optimal chromatin DNAaround 500–1000 bp. After sonication, the chromatin samples are pooled to-gether, adjusted to 0.5% Sarkosyl (sodium lauryl sarcosine) and gently mixedfor 10 minutes at room temperature on a rocking platform. The chromatinsolution is then transferred to a centrifuge tube and spun for 10 minutes at10,000 g to remove cell debris. The supernatant is collected for chromatinimmunoprecipitation, or stored at –80C as 1 ml aliquots.
Immunoprecipitation of Chromatin. The chromatin immunoprecipita-tion is performed using anti-rabbit IgG-conjugated magnetic beads (Dynal)that are coupled to the polyclonal antibodies. To prepare this material, mag-netic beads (100 µl) are centrifuged at 2000 g for 3 minutes at 4C. After
270 Zirong Li
removing the supernatant, the beads are re-suspended in 5 ml cold PBS con-taining 5 mg/ml Bovin Serum Albumin (BSA, Sigma Cat# A–7906) madeimmediately before use. This washing cycle is repeated a total of 3 times, andthe magnetic beads are re-suspended in 5 ml of cold PBS with BSA. 10 µgrabbit polyclonal antibody is added to the beads mixture and mixed overnighton a rotating platform at 4C. The following day, the magnetic beads are col-lected by centrifugation at 2000 g for 5 minutes, washed 3 times with 5 ml coldPBS with 5 mg/ml BSA and re-suspended in 100 µl cold PBS with 5 mg/mlBSA.
The soluble chromatin solution from Step 2 is first adjusted to 0.1% TritonX–100, 0.1% sodium deoxycholate, and 1 mM PMSF. To 1 ml of this mixture,100 µl of magnetic beads pre-coupled with the antibody are then added. Themixture is incubated at 4C overnight in a rotating platform. The followingday, the magnetic beads are collected using a magnet MPC–E from Dynal, andthe supernatant removed by aspiration. The beads are re-suspended in 1 mlRIPA buffer. After incubation on a rotating platform at 4C for 3 minutes,the magnetic beads are collected with MPC–E again. This washing process isrepeated 5 times followed by a wash with 1 ml TE. The beads are collectedby centrifugation at 2000 g for 3 minutes and re-suspended in 50 µl elutionbuffer. To elute the precipitated chromatin, the beads are incubated at 65Cfor 10 minutes with constant agitation, then 40 µl of supernatant are collectedafter a 30 second centrifugation at 2000 g. The eluted chromatin is mixed with120 µl of TE (1% SDS) and incubated at 65C overnight to reverse the cross–links.
Purification of Immunoprecipitated DNA. To purify the immunoprecip-itated DNA, 120 µl Proteinase K solution is added to the chromatin solution.The mixture is incubated for 2 hours at 37C to allow digestion of proteinsin the precipitates. The sample is then extracted twice with phenol (Sigma,cat# P–4557), once with 24:1 chloroform/isoamyl alcohol (Sigma cat# C–0549). The sample is adjusted to 200 mM NaCl. 2 volumes of ethanol areadded to the mixture, which is then incubated for 15 minutes at –80C oron dry ice. The DNA is then precipitated by centrifugation at 14,000 rpm at4C in a micro–centrifuge. The DNA pellet is washed with 70% ethanol andre-suspended in 30 µl TE containing 10 µg DNase-free RNase A (Sigma, cat#6513) and incubated for 2 hours at 37C. After the incubation, the DNA ispurified with Qiagen PCR kit (Qiagen, cat# 28106) and re-suspended in 50 µlelution buffer included with the kit.
As a control, DNA from an aliquot of chromatin solution is reversecrosslinked and purified in a similar fashion. At this step, PCR reactions usingspecific primers to amplify certain known target regions can be performed tocheck whether the chromatin immunoprecipitation is successful. A detaileddescription of such tests can be found in other publications [8].

13 Analysis of Gene Regulatory Circuits 271
Ligation-mediated PCR
Blunting Reaction. The immunoprecipitated DNA obtained from the pre-vious steps usually needs to be amplified and labelled for DNA microarrayanalysis. To achieve this, a ligation-mediated PCR (LM–PCR) method is used.First, the DNA is treated with T4 DNA polymerase to form blunt ends. Thereaction is assembled as follows:
40 µl immunoprecipitated DNA (or 20 ng of control input DNA)11 µl (10×) T4 DNA pol buffer (NE Biolabs cat # 007–203)0.5 µl BSA (10 mg/ml) (NE Biolabs cat # 007–BSA)0.5 µl dNTP mix (20 mM each)0.2 µl T4 DNA pol (3 U/µl) (NE Biolabs cat # 203L)add dH2O to a total 112 µl.
The reaction is carried out for 20 minutes at 12C. Afterwards, the sam-ple is adjusted with 1/10 volume of 3 M sodium acetate (pH 5.2), 1 µg ofglycogen (Roche Applied Sciences, cat# 0901393) and is extracted with phe-nol:chloroform:isoamyl alcohol (25:24:1) (Sigma, cat# P–3803) once, followedby ethanol precipitation (see above). The final DNA pellet is dissolved in 25 µldH2O.
Ligation Reaction. Assemble the following reaction:
25 µl of DNA8 µl dH2010 µl 5× ligase buffer (Invitrogne, cat# 46300–018)6.7 µl annealed linkers (15 µM)0.5 µl T4 DNA ligase (New England Biolabs, cat# 202L)50.2 µl Total
The ligation reaction is allowed to continue for over night at 16C. On thenext day, the DNA is purified by ethanol precipitation and dissolved in 25 µldH2O.
PCR. The ligated DNA sample is used as template in the following poly-merase chain reaction:
25 µl DNA4 µl 10× ThermoPol reaction buffer (New England Biolabs, cat# B9004S)4.75 µl ddH2O5 µl 10× dNTP mix (2.5 mM each dATP, dTTP, dGTP, dCTP)1.25 µl oligo oJW102 (40 µM stock)add dH2O to final volume of 40 µl.
The sample is first incubated at 55C for 2 minutes, then 10 µl of anenzyme mix [8 µl dH2O, 1 µl Taq DNA polymerase (5 U/µl), 1 µl Ther-malPol reaction buffer, and 0.025 unit of Pfu polymerase (Stratagene, cat #
272 Zirong Li
600250–51)] is added to the sample. Subsequently, the following PCR cycle isperformed:
step 1: 72C for 5 minutes;step 2: 95C for 2 minutes;step 3: 95C for 1 minute;step 4: 60C for 1 minute;step 5: 72C for 1 minute;step 6: go to step 3 for 22 times;step 7: 72C for 5 minutes;step 8: 4C forever;
Afterwards, the DNA is purified using the Qiaquick PCR purification kit(Qiagen, cat# 28106) and eluted in 60 µl elution buffer provided with the kit.
DNA Microarray Hybridization
Labelling Immunoprecipitated DNA. To 200 ng of DNA from the pre-vious step, 20 µl of 2.5× random primer solution (from the BioPrime kit, In-vitrogen, Cat# 18094–011) and dH2O are added to a final volume of 42.5 µl.The mixture is boiled for 5 minutes and then immediately placed on ice. Toinitiate the labelling reaction, 5 µl of 10× low dCTP mixture (2.5 mM eachfor dATP, dTTP and dGTP, and 0.6 mM for dCTP), 1.5 µl of Cy5–dCTP(Amersham, Cat# PA55021) or Cy3–dCTP (Amersham, Cat# PA53021), 40unit of Klenow DNA polymerase are added to the mixture. The reaction iscarried out at 37C for 2 hours. Finally, the labelled DNA is purified usingthe Qiagen PCR kit (Qiagen, Cat# 28106).
DNA Microarray Hybridization. 2.5 µg of Cy5-labelled ChIP DNA,2.5 µg of Cy3-labelled genomic DNA and 36 µg human Cot–1 DNA (In-vitrogen, Cat# 15279–011) are mixed together and concentrated by ethanolprecipitation. The DNA pellet is dissolved in 22.4 µl of hybridization buffer 1.Then 20 µl of hybridization buffer 2 is added to the mixture, and the sample isincubated first at 95C for 5 minutes then 42C for 2 minutes. Subsequently,4 µl of yeast tRNA (Sigma, cat# R9001 at 10 µg/µl) and 3 µl of 2% BSA areused to adjust the hybridization reaction to 50 µl. This mixture is added toa DNA microarray slide that has been incubated with the pre-hybridizationsolution for 40 minutes at 42C. A 25 mm × 60 mm cover slip is then gen-tly placed on top of the sample, and the hybridization is carried out in ahybridization chamber (Corning, cat# 07–200–271) at 60C overnight in awater bath.
Washing Microarrays. After the hybridization, the microarray slide iswashed once with washing buffer 1 at 60C for 5 minutes, once with washingbuffer 2 for 10 minutes at room temperature, and three times with washingbuffer 3 at room temperature.
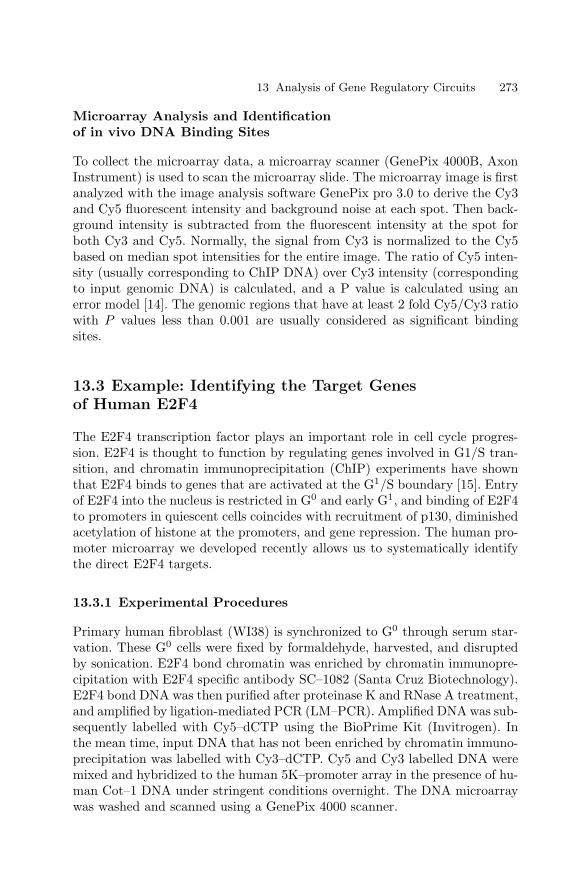
13 Analysis of Gene Regulatory Circuits 273
Microarray Analysis and Identificationof in vivo DNA Binding Sites
To collect the microarray data, a microarray scanner (GenePix 4000B, AxonInstrument) is used to scan the microarray slide. The microarray image is firstanalyzed with the image analysis software GenePix pro 3.0 to derive the Cy3and Cy5 fluorescent intensity and background noise at each spot. Then back-ground intensity is subtracted from the fluorescent intensity at the spot forboth Cy3 and Cy5. Normally, the signal from Cy3 is normalized to the Cy5based on median spot intensities for the entire image. The ratio of Cy5 inten-sity (usually corresponding to ChIP DNA) over Cy3 intensity (correspondingto input genomic DNA) is calculated, and a P value is calculated using anerror model [14]. The genomic regions that have at least 2 fold Cy5/Cy3 ratiowith P values less than 0.001 are usually considered as significant bindingsites.
13.3 Example: Identifying the Target Genesof Human E2F4
The E2F4 transcription factor plays an important role in cell cycle progres-sion. E2F4 is thought to function by regulating genes involved in G1/S tran-sition, and chromatin immunoprecipitation (ChIP) experiments have shownthat E2F4 binds to genes that are activated at the G1/S boundary [15]. Entryof E2F4 into the nucleus is restricted in G0 and early G1, and binding of E2F4to promoters in quiescent cells coincides with recruitment of p130, diminishedacetylation of histone at the promoters, and gene repression. The human pro-moter microarray we developed recently allows us to systematically identifythe direct E2F4 targets.
13.3.1 Experimental Procedures
Primary human fibroblast (WI38) is synchronized to G0 through serum star-vation. These G0 cells were fixed by formaldehyde, harvested, and disruptedby sonication. E2F4 bond chromatin was enriched by chromatin immunopre-cipitation with E2F4 specific antibody SC–1082 (Santa Cruz Biotechnology).E2F4 bond DNA was then purified after proteinase K and RNase A treatment,and amplified by ligation-mediated PCR (LM–PCR). Amplified DNA was sub-sequently labelled with Cy5–dCTP using the BioPrime Kit (Invitrogen). Inthe mean time, input DNA that has not been enriched by chromatin immuno-precipitation was labelled with Cy3–dCTP. Cy5 and Cy3 labelled DNA weremixed and hybridized to the human 5K–promoter array in the presence of hu-man Cot–1 DNA under stringent conditions overnight. The DNA microarraywas washed and scanned using a GenePix 4000 scanner.
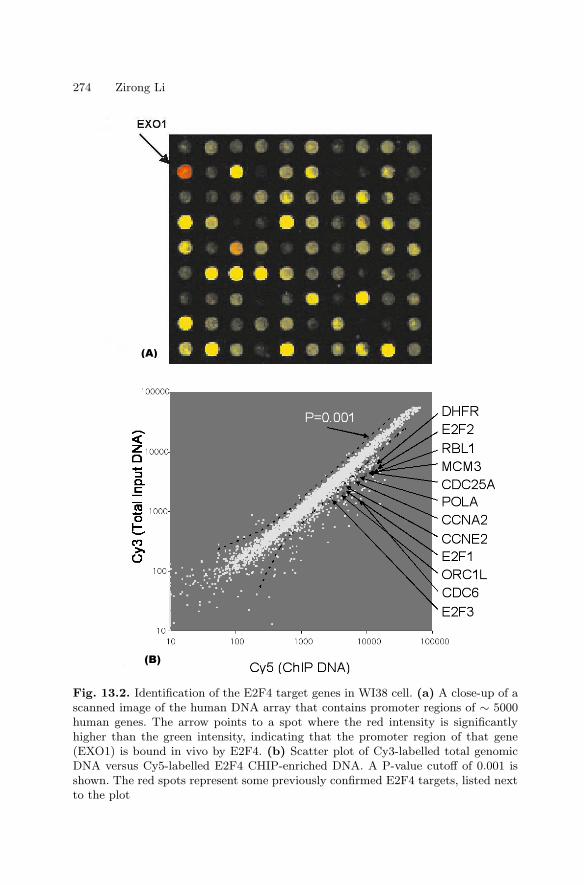
274 Zirong Li
(A)
(B)
Fig. 13.2. Identification of the E2F4 target genes in WI38 cell. (a) A close-up of ascanned image of the human DNA array that contains promoter regions of ∼ 5000human genes. The arrow points to a spot where the red intensity is significantlyhigher than the green intensity, indicating that the promoter region of that gene(EXO1) is bound in vivo by E2F4. (b) Scatter plot of Cy3-labelled total genomicDNA versus Cy5-labelled E2F4 CHIP-enriched DNA. A P-value cutoff of 0.001 isshown. The red spots represent some previously confirmed E2F4 targets, listed nextto the plot
13 Analysis of Gene Regulatory Circuits 275
13.3.2 Results and Discussion
The result of the E2F4 location analysis experiment is shown in Fig. 13.2. Ourresults suggest that the genome wide location analysis procedure is a powerfulmethod to identify in vivo targets of transcription factors. When using thecriteria: P–value ≤ 0.001, channel intensity ≥ 200 and ratio ≥ 2, we found143 genes whose promoters were occupied by E2F4 in physiological condi-tion, indicating that they are putative E2F4 targets. Most of these 143 geneswere confirmed earlier by either chromatin immunopreciptation or AffymetrixcDNA expression arrays [11, 16]. We also identified some novel E2F4 targetsthat fall into several function groups related to cell cycle regulation, DNAreplication, DNA repair, G2/M checkpoints and mitotic regulation.
13.4 Summary
Genome wide location analysis is a general method to identify the in vivobinding sites for transcription regulators. The recent use of this method tomap the genetic regulatory network in yeast demonstrated that this methodis an essential tool for us to understand the mechanisms of gene regulationin cells [12]. Applying this approach to mammalian transcription factors isexpected to yield important information about the mechanisms of animaldevelopment and pathology of human diseases.
References
1. Davidson, E. H. (2001). Genomic Regulatory Systems:development and evolution(San Diego, Academic Press)
2. Tjian, R., and Maniatis, T. (1994). Transcriptional activation: a complex puzzlewith few easy pieces, Cell 77, 5–8
3. Ptashne, M., and Gann, A. (1997). Transcriptional activation by recruitment,Nature 386, 569–77
4. Orphanides, G., and Reinberg, D. (2002). A Unified Theory of Gene Expression,Cell 108, 439–451
5. Ren, B., Robert, F., Wyrick, J. J., Aparicio, O., Jennings, E. G., Simon, I.,Zeitlinger, J., Schreiber, J., Hannett, N., Kanin, E., et al. (2000). Genome–widelocation and function of DNA binding proteins, Science 290, 2306–9
6. Iyer, V. R., Horak, C. E., Scafe, C. S., Botstein, D., Snyder, M., and Brown,P. O. (2001). Genomic binding sites of the yeast cell–cycle transcription factorsSBF and MBF, Nature 409, 533–8
7. Solomon, M. J., Larsen, P. L., and Varshavsky, A. (1988). Mapping protein–DNAinteractions in vivo with formaldehyde: evidence that histone H4 is retained ona highly transcribed gene, Cell 53, 937–47
8. Orlando, V. (2000). Mapping chromosomal proteins in vivo by formaldehyde–crosslinked–chromatin immunoprecipitation, Trends Biochem Sci 25, 99–104

276 Zirong Li
9. Lieb, J. D., Liu, X., Botstein, D., and Brown, P. O. (2001). Promoter–specificbinding of Rap1 revealed by genome–wide maps of protein–DNA association, NatGenet 28, 327–34
10. Simon, I., Barnett, J., Hannett, N., Harbison, C. T., Rinaldi, N. J., Volkert, T.L., Wyrick, J. J., Zeitlinger, J., Gifford, D. K., Jaakkola, T. S., and Young, R.A. (2001). Serial regulation of transcriptional regulators in the yeast cell cycle,Cell 106, 697–708
11. Ren, B., Cam, H., Takahashi, Y., Volkert, T., Terragni, J., Young, R. A., andDynlacht, B. D. (2002). E2F integrates cell cycle progression with DNA repair,replication, and G(2)/M checkpoints, Genes Dev 16, 245–56
12. Lee, T. I., Rinaldi, N. J., Robert, F., Odom, D. T., Bar-Joseph, Z., Gerber, G.K., Hannett, N. M., Harbison, C. T., Thompson, C. M., Simon, I., et al. (2002).Transcriptional regulatory networks in Saccharomyces cerevisiae, Science 298,799–804
13. Weinmann, A. S., Yan, P. S., Oberley, M. J., Huang, T. H., and Farnham, P.J. (2002). Isolating human transcription factor targets by coupling chromatinimmunoprecipitation and CpG island microarray analysis, Genes Dev 16, 235–44
14. Roberts, C. J., Nelson, B., Marton, M. J., Stoughton, R., Meyer, M. R., Bennett,H. A., He, Y. D., Dai, H., Walker, W. L., Hughes, T. R., et al. (2000). Signalingand circuitry of multiple MAPK pathways revealed by a matrix of global geneexpression profiles, Science 287, 873–80
15. Takahashi, Y., Rayman, J. B., and Dynlacht, B. D. (2000). Analysis of promoterbinding by the E2F and pRB families in vivo: distinct E2F proteins mediateactivation and repression, Genes Dev 14, 804–16
16. Iyer, V. R., Eisen, M. B., Ross, D. T., Schuler, G., Moore, T., Lee, J. C., Trent,J. M., Staudt, L. M., Hudson, J., Jr., Boguski, M. S., et al. (1999). The tran-scriptional program in the response of human fibroblasts to serum, Science 283,83–7

Part III
Protein Microarrays
14
Protein, Antibody and Small MoleculeMicroarrays
Hendrik Weiner, Jorn Glokler, Claus Hultschig, Konrad Bussow, andGerald Walter
14.1 Introduction
New and rapidly spreading infectious and lifestyle diseases, together withknown killers like cancer and heart disease, particularly threaten older popu-lations and put enormous pressure on our medical capabilities. Today’s drugarsenal attacks about 400 targets, while the human genome sequence revealedat least 30,000 genes. The expression of these genes creates a complex puzzleof millions of products and points of interaction between them. Every one ofthese products is a potential drug or target, provided that the correspondingdrug can be shown to be specific and safe in a patient’s organism. And as indi-vidual patients are different, tests need to be extended to whole populations.Clearly, this can only be handled using high throughput approaches, lookingat large numbers of genes and their products simultaneously.
The array format enables miniaturized and parallel analysis of large num-bers of diagnostic markers in complex samples [1,2]. The concept of the arrayedlibrary [3] allows gene expression analysis and protein interaction screening ona whole–genome scale. Using automated colony picking and gridding, cDNAor antibody libraries can be expressed and screened as clone arrays [4, 5]. Asdiscussed in this chapter, protein microarrays are constructed from recombi-nantly expressed and purified proteins, using a range of expression systems.Gene product action can be studied directly if the proteins’ structure andfunctionality is maintained. This requires novel systems for high throughputprotein expression that produce sufficient amounts of properly modified andfolded molecules. Large numbers of proteins must be arrayed at high density,keeping them intact and biologically active. That is most easily achieved ifmolecules of the same general structure (e.g. antibodies) are arrayed. Anti-body arrays are now becoming an important screening tool for a wide rangeof molecules in complex mixtures and a robust format for expression profilingof whole genomes. Alternative systems such as nucleotide aptamers should beable to mimic certain protein functions, and as nano- and microfluidic arrays,can make very robust array formats in the future. Differential protein profiles
280 Hendrik Weiner et al.
have been used as molecular diagnostics for cancer [6] and might soon be ap-plied to screen high risk populations for tumor markers. In the format of highthroughput arrays, differential protein profiles may eventually arrive at thedoctor’s office and as over–the–counter devices.
14.2 Protein Microarrays
14.2.1 Introduction
A protein microarray is a highly ordered pattern of proteins immobilizedon a pre-treated surface of a small and planar metal, plastic, or glass sup-port [7–9]. Microarrays, like microprocessors, use parallelism, miniaturizationand automation as three conceptual cornerstones [10]. However, unlike mi-croprocessors, microarrays are not designed to take input signals and, usingpreprogrammed instructions, convert them into meaningful output. Proteinmicroarray technology enables high throughput analysis of protein functions,such as interactions between proteins, catalysis, binding to drugs and otherbiochemical reactions [11]. The speed, precision, affordability and efficiencyof microarray analysis offer a tremendous experimental advantage over tradi-tional, rather cumbersome, analytical tools using columns, gels, filters and mi-croplates. Microarrays lend themselves to a plethora of applications in biomed-ical research, clinical diagnostics and in the pharmaceutical industry. Thiscan be inferred from more than 100 protein array-oriented scientific publica-tions in the past two years [12,13]. Ultimately, a single microarray containingthe complete set (not taking into account covalently modified isoforms) of20,000–40,000 proteins expressed in human cells would allow comprehensiveassessment of a given protein function. However, as outlined below, such aproteome–wide microarray is not yet on the horizon.
14.2.2 Protein Production, Purity and Printing
Putting diverse protein repertoires on a microarray requires the simultaneousand quality-assured production of many recombinant proteins of high purity.This is a non-trivial exercise that requires an appropriate infrastructure plusexpertise, both of which often do not exist in regular and otherwise well-equipped molecular laboratories. Usually, recombinant proteins are producedin a soluble form in Escherichia coli, yeast, mammalian or insect cells. Invitro translation is an alternative option since most microarray-based appli-cations require less than 100 µg protein. Current practice in our laboratoryinvolves a long list of quality control steps for the production and isolation ofrecombinant proteins to assure their purity and fidelity. This list includes thePCR product, vector design, entry clone, expression clone, DNA sequencingof cloned insert and, eventually, the solubility, size and electrophoretic ho-mogeneity of the purified protein product. Such attention to quality is most
14 Protein, Antibody and Small Molecule Microarrays 281
often very critical for interpretable results from microarray-based binding ex-periments. Even if induction can significantly increase the abundance of arecombinant protein over background, binding to impurities in the proteinpreparation, when placed onto an array, can heavily contaminate a true sig-nal.
After being standardized with respect to homogeneity, purity and con-centration, the recombinant proteins are ready to be immobilized onto anarray support, most often a standard microscope format. Different supportdesigns and surface chemistries have been described in preceding Chaps. 1–3.Established spotting technologies, including needle printing, piezo or solenoiddispensing have been discussed in Chaps. 4 and 5. Contact printing robotsallow for up to 50,000 different elements on a slide. Nanotechnology and non-contact printing techniques can further increase the number of elements on anarray (Chap. 6). If robotic spotting is unavailable or if only a small subset ofproteins are to be analyzed, manual spotting can be an appropriate alterna-tive, e.g. with the apparatus from Schleicher & Schuell or Greiner. The formerallows for almost 800 elements on the slide and is originally designed for thecompany’s proprietary slides containing a thin nitrocellulose layer. However,after minor adjustments, this apparatus is also applicable for printing non-layered microscope slides. Whenever an isolated protein is being immobilizedit might alter its binding properties with respect to in-solution conditions.This can be minimized through the use of random immobilization as opposedto site-specific immobilization that leaves only a certain part of the moleculesaccessible for binders. Alternatively, one can immobilize the proteins on a slidethat carries a highly hydrophilic layer of nitrocellulose (‘Fast Slides’, Schle-icher & Schuell Bioscience) or polyacrylamide (‘Hydrogel’, Perkin Elmer LifeSciences). The latter are thought to nicely emulate solution like properties.
In summary, the virtues of functional assays with well constructed pro-tein microarrays include ensured purity, standardized protein amounts andaccessibility, on array replicates, ranking of signals possible and an inclusionof both positive and negative controls.
14.2.3 Detection of Small or Large Ligands
Numerous detection strategies have evolved over the years to detect and am-plify signals associated with intermolecular binding events. These will notbe reviewed here. The advent of fluorescent detection in combination withperfectly flat supports has greatly contributed to the popularity of DNA mi-croarrays. Because of the almost ubiquitous nature of fluorescent detectionsystems, and because many molecular laboratories are already equipped withthe infrastructure for the detection of fluorescent dyes on DNA microarrays,one might choose to concentrate on labelling proteins with the same or similardyes to those employed for differential analysis on DNA microarrays, namelyCy3/Cy5 dyes (Amersham Biosciences) or Alexa 488/530 dyes (MolecularProbes). Fluorophore labels on proteins can be detected with a sensitivity
282 Hendrik Weiner et al.
superior to many other labels. In addition, fluorophore labelled proteins caneasily be quantified, e.g. one can easily detect as low as 1 attomol of a flu-orophore labelled antigenic protein bound on an antibody immobilized on amicroarray (H. Weiner and K. Bussow, unpubl.). However, fluorophore la-belling of peptides or small molecules is often not practical due to steric hin-drance by labels as large or bigger than the molecule being analyzed. Smallmolecule binding usually becomes accessible through radiolabels, that cannow be detected with suitable microarray-based readers, e.g. from Fuji orZinsser. Steric hindrance in the microenvironment around a binding site canalso be problematic for protein–protein interactions. As a solution, proteinscan be radio-labelled metabolically [14, 15], ex vivo [16] or at a single siteafter purification [17]. Such radiolabelling usually prevents the problems asso-ciated with multisite–labelling (biotinylation, fluorophorylation) or secondarydetection (antibodies). To radiolabel a protein site–specifically, the proteinprobe can be constructed as a gluthatione–S–transferase (GST) fusion in thata phosphorylation site for protein kinase A (PKA) is inserted between theGST and the protein part of interest. Vectors for the expression of affinity-tagged fusion proteins that contain a PKA–site are commercially available(Novagen, Amersham Biosciences). The fusion protein has to be phosphory-lated by PKA [17] and can then be used as a probe to decorate the microarray.Label-free approaches including mass spectrometry [18, 19] or surface plas-mon resonance [20, 21] should be attractive alternatives to detect small orlarge molecule binding events, as discussed in Chap. 9. Unfortunately, none ofthese approaches are currently applicable to the detection of binding eventson microarrays containing a large set of different proteins.
14.2.4 Caveats
The main challenge for all recombinant techniques is to synthesise properlyfolded and conformationally correct recombinant proteins, i.e. to emulate thestructural integrity of the native protein [22]. This can often not be fullywarranted, even if one tries to incorporate co- and post-translational modifi-cations during the production of the protein, e.g., through its expression ininsect or mammalian cells. Another problematic aspect is surface denaturationupon spotting, immobilization, storage and assay [18]. Surface denaturation,at least to some extent, always occurs and is often difficult to control, in par-ticular if a variety of proteins is to be treated in parallel and under identicalconditions, while each protein requires a particular environment to be fullyactive; for details see Chaps. 2 and 3. As a result, a given protein functiondetected on a microarray may be a false positive and not physiologically rele-vant. Any such result should therefore be confirmed using an in-solution assay,preferably in vivo in an appropriate cellular system.
14 Protein, Antibody and Small Molecule Microarrays 283
14.2.5 Conclusions
Almost every cellular process depends on protein activities that are probablycontrolled by highly specific interactions between proteins and between pro-teins and other molecules [23,24]. It is therefore not surprising that proteomicsis currently being hailed as the next phase of genomic activity [25] and thattherapeutic molecules most often are directed to proteins [26]. Appropriatelydesigned protein microarrays are likely to find immediate applications in an-alytical protein biochemistry and can complement or even replace traditionaltechnologies employed in protein characterization. One of the most promisingfeatures of protein microarrays is their potential to serve as a reliable ‘earlycatch’ format to fish out a given protein function that can then be charac-terized more deeply using classical non-array-based protein techniques. Thisfeature is reminiscent to the recently developed high density protein arraysthat are constructed from cDNA expression libraries and that are printedon large membranes [27]. Although very useful for certain functional stud-ies [28], such protein arrays are often not acceptable because they carry aredundant set of only unpurified and at least partially denatured recombinantproteins produced in E. coli. Clearly, the construction of properly designedprotein microarrays often requires hundreds or thousands of different recom-binant proteins, non-denatured, of sufficient purity and in workable amounts.As outlined above, the cloning, expression and isolation of such proteins rep-resents the biggest obstacle in the production of a protein microarray, even ifonly a small set of recombinant proteins is to be arrayed.
14.3 Antibody Microarrays
14.3.1 Introduction
What Are Antibody Microarrays?
Antibody arrays constitute a subset of protein arrays, displaying a certain typeof protein in terms of structure and function. Antibodies are here defined asimmunoglobulins or their different fragments, such as Fab’s, or (reduced totheir antigen binding domains) single-chain (sc)Fv’s. It is essential that theimmobilized antibodies retain their native structure in order to bind theircognate antigen specifically.
Applications
DNA–arrays and PCR have been widely applied to study the transcriptionallevel of gene expression and correlate patterns to certain phenotypes. Howevermany features of gene function can only be assessed after translation, includingmodification and intracellular localization of proteins. Even the level of trans-lation may differ from the transcription level of a gene [29]. If we take a look at
284 Hendrik Weiner et al.
the diversity of human gene transcripts of currently more than 37,000 [30], thenumber of possible post-translational modifications on the resulting proteinsmay increase this complexity beyond a million [31]. Functionally, phosphory-lation states can indicate the status of a protein in the signal transductionpathway. Glycosylation of extracellular proteins is decreased or altered incertain types of cancer [32]. Antibodies can detect the three–dimensional con-formation of a protein, which is most important for the screening of prions inTSEs (transmissible spongiform diseases) [33]. Antibodies can assess a mul-titude of other post-translational modifications, emphasizing the demand forantibody arrays to analyze complex protein samples in an efficient mannersimilar to DNA microarrays.
14.3.2 Current Technology
Originally, antibody arrays have been developed in 96 well–microtitre plates,based on the classical ELISA format. Miniaturization has increased the num-ber of simultaneously detectable antigens, while still using wells to provide forseparate incubation chambers. To further integrate the complexity of ELISAexperiments, a multiplicity of different antibodies was immobilized in definedspots on the bottom of these wells, hence creating a micro–ELISA format [34].In order to apply greater amounts of different antibodies to a surface, mem-brane filters were used as support for recombinant scFv’s [5] or antibodies todetect cytokines in patient sera [35].
Microarrays
Early approaches to generate antibody arrays for high throughput screeningused either expensive new materials such as specialized ELISA plates andmachinery adapted to this format, or a relatively high amount of antibodiesand analyte consumed by filter assays. As a consequence, a new format wasintroduced for microarrays based upon the already well-established micro-scope glass slide as a basis. Such slides have been extensively used for cDNAmicroarrays, but then adapted to protein microarrays by Mirzabekov, usinggel–pads for the immobilization of protein samples [36]. The robotic equipmentdeveloped for cDNA microarray technology was adapted to the production ofprotein arrays, using glass surfaces to covalently anchor proteins. This enabledthe spotting of proteins at a density of 10,000 different samples [11]. Earlyantibody microarrays were created using poly–L–lysine surfaces as adoptedfrom DNA array technology [37]. However, it became apparent that of the115 antibody–antigen pairs in these experiments, only half of the immobilizedantigens and 20% of the immobilized antibodies remained active.
As antibodies constitute the active part in an immunoassay, special caremust be taken to keep these in a native state on the microarrays. Several stud-ies have been focused on finding optimal storage conditions and appropriatesurfaces [38, 39]. Of the materials tested, those which covalently immobilism
14 Protein, Antibody and Small Molecule Microarrays 285
antibodies via epoxy–groups in combination with a surface gave the best re-sults with respect to detection limits and signal to noise ratio. Before suchantibody microarrays are created, it is advisable to check the functionalityof each antibody individually [38]. Indirect immobilization by biotinylationand streptavidin may improve the performance of antibody arrays up to 10–fold [40]. However to introduce this modification to all antibodies individuallywould make this approach more costly and time–consuming.
Labelling and Detection
Starting from classical radioactive and enzymatic labelling techniques, cova-lent fluorescent labels have become standard for the detection of analytes inmicroarray technology, but see Chaps. 8 and 9 for a detailed review of thisand other labelling or label-free techniques. Isothermal rolling–circle ampli-fication has been developed to further increase the sensitivity of fluorescentdetection [41]. Preferably, N–succinimide-activated esters of fluorophores suchas Cy3 and Cy5 are used in combination, allowing for easy comparison by in-ternal control. For antibody microarrays, either the analyte or a secondaryantibody (sandwich assays) must be labelled. However, complex analyte sam-ples are difficult to label homogeneously, preserving epitopes recognized by theimmobilized antibodies. Even properties like solubility of the modified pro-teins might be affected. Alternatively, the application of secondary antibodiesmatching the primary antibodies on the chip is limited to a small number ofdifferent molecules to be screened before the background exceeds the signal.Therefore, sandwich assays could not so far be applied to complexities beyond38 different sets of antibodies [42].
High sensitivity of detection and minute amounts of sample required aremain advantages of microarrays as compared to the classical ELISA. Nanoliteramounts of sample can be applied and immobilized on the support. Puttinga cover slide on top of the chip surface during incubation can reduce theamount of analyte. The absolute detection level is dependent on the bindingproperties of the applied antibody and the complexity of the analyzed sample,but may well reach down to 1 pg/mL using the rolling circle amplificationdetection [42].
Microwells and Microfluidic Chips
While conventional microarrays only allow the simultaneous screening of twosamples at a time, efforts have been made to introduce true multiplexing (asin microtitre ELISA) to the microarray technology. This was achieved partlyas described above, by printing small arrays in microtitre wells. However, atrue multiplexing is only achieved if all samples are kept in separate compart-ments, which can be achieved by the synthesis of microchip surfaces bearingmicrowells, or microfluidic chips that have channels etched on the surface bywhich all points on the chip can be addressed individually [43].
286 Hendrik Weiner et al.
14.3.3 Current Deficiencies
Source of Antibodies
A major problem of antibody microarrays is the standardized production ofmany different antibodies. As commercially available monoclonal and poly-clonal antibodies can make an array exceedingly expensive, attempts havebeen made to isolate recombinant antibodies by phage display [44], ribosomaldisplay [45] or even aptamers from nucleic acid libraries [46].
Antibody Performance on Microarrays
Previous studies have demonstrated that there is a widely varying performanceof antibodies on microarrays. Many do not show any activity, decreased speci-ficity or a lowered affinity [37,38]. Optimizing the surface and applying indirectimmobilization can increase performance. However it would be advantageousto determine and include additional information regarding the suitability ofa commercially available antibody in a similar manner as currently availablefor the application in immunoblotting, indirect ELISA or dot blot. As for an-tibody fragments in single–chain format derived from phage display libraries,we have found that stability is often impaired by immobilization. While Fabfragments are often found to be more stable than scFv’s [47], it remains to bedemonstrated that these are better suited for the microarray format.
Surfaces and Hardware
Although a large portion of the hardware equipment was adopted from cDNAmicroarray technology, such as the microscope slide format, fluorescent detec-tion, microspotting devices and scanners, many of these will have to be opti-mized to meet the requirements of antibody arrays. Keeping the immobilizedantibodies hydrated and reducing the denaturing contact with the surfaceseems to be necessary to retain these in an active state. Introducing microw-ells to reduce evaporation may be helpful, but also requires alignment of thehandling robots with the surface grid. The same holds true for the microfluidicchips that need a greater extent of additional hardware and protocols to beapplied.
14.3.4 Conclusions
Despite the technology of antibody microarrays still being in its infancy, rapidprogress has been made. Depending on the application, the diversity anddimension of such microarrays will be ranging from 100 to 10,000 differentbinders. It will be interesting to see whether the recombinant molecules de-rived from combinatorial libraries are going to replace the currently favored
14 Protein, Antibody and Small Molecule Microarrays 287
antibodies in the future. New detection techniques may obviate the need to la-bel the analyte or secondary antibody. Direct in vitro synthesis of the bindingmolecules on the chip may solve storage and activity problems faced today [48].In summary, the impact antibody microarrays will have on diagnostics anddrug discovery is yet to be conceived.
14.4 Peptide and Other Synthetic Arrays
14.4.1 Combinatorial Peptide and Non-Peptide Libraries
Structure determination is a powerful approach to molecular interaction anal-ysis. Techniques such as X–ray crystallography and nuclear magnetic reso-nance (NMR) offer insights into the spatial arrangement of macromoleculesand their complexes. However, since structure determination of biologicalmacromolecules is time consuming and cumbersome, empirical combinatorialmethods were developed in parallel to the structure determination methodsto address the important topic of structure/activity relationship [49]. Thesemethods mimic natural selection, the driving force behind evolution. They relyon the creation of many different variants of one molecule of interest and theselection of those variants by certain functional criteria. Both combinatorialchemistry and combinatorial biology provide suitable strategies for the cre-ation of and selection from large libraries of diverse but comparable molecules.In these approaches, a library consisting of many different molecules is cre-ated and those members with an anticipated property are selected. A varietyof different methods for the creation of and the selection from combinatoriallibraries have been reviewed exhaustively [50–52].
In combinatorial chemistry, combining different building blocks with suit-able chemical reactions creates large numbers of variants. The resulting in-dividual compounds are used to study structure activity relationships of onetarget molecule systematically. However, the number of compounds that canbe individually synthesized is limited. Progress in solid phase synthesis, orig-inally introduced by Merrifield [53–55], gave fast and automated access toindividual oligomeric compounds. For the creation of large numbers of indi-vidual sequences of monomeric building blocks, various techniques of chemicalsynthesis have been developed. These fall into two groups, multiple synthesisand parallel synthesis. A good overview of the different building blocks usedfor combinatorial chemistry has been provided by Hogan [56]. In multiple syn-thesis, mobile support elements are employed. After each reaction cycle, thesegments are separated and regrouped for the next coupling. Examples arethe Tea Bag method [57], the use of segmented cellulose filters [58, 59] andthe one–bead–one–compound approach [60], combined with the mix–and–splitapproach [61]. Parallel synthesis uses arrays of fixed reactors. Today, severalthousand syntheses can be run in parallel due to miniaturization and rapidreagent application. The pin method [62] demonstrated the success of this
288 Hendrik Weiner et al.
approach in a convincing way. Geyen et al. performed their reactions on areplicating gadget that was dipped into a microtitre plate filled with reagentsfor peptide synthesis according to the anticipated sequence. Parallel synthesison flat supports is another elegant and fast strategy of generating microar-rays of biological macromolecules. Its most prominent examples [62] are themacroscopic DNA arrays on glass support, first described by Maskos & South-ern [63], the photolithographic Affymax (later Affymetrix) technique [64], andthe SPOT method [65–67].
The resulting libraries of natural or artificial building blocks can bescreened for active compounds in hybridization or western blotting experi-ments, while still bound to the solid support used for their synthesis. Theirrespective position of synthesis is used for the identification of each bindingpartner. Alternatively, library members are transferred into solution, followedby testing them individually or as pools.
The techniques described above can either be used for synthesis of individ-ual compounds or pools, by using mixtures of building blocks for the couplingreactions. This results in libraries of potential ligands in one reactor. An ex-ample for such a pooling strategy is the ‘mimotope’ approach [68] in whichhexameric peptide sequences binding to a certain target structure are deter-mined ab initio. This approach involves iterative testing of pools of peptidesat randomized positions and leads to a hexameric peptide sequence with max-imal binding strength to the target protein. Frank et al. [69] have proposeda modified version of the ‘mimotope’ approach that circumvents the iterativescreening but allows for direct access to the optimal peptide sequence.
14.4.2 Peptide Libraries to Study Protein–Protein Interactions
Protein–protein interactions are generally believed to be conformationally de-fined. The contact area between proteins in a complex is often only smalland comprises only a short sequence motif. Typical examples include SH3,WW, EBVH1, PDZ and armadillo repeat domains of signalling and struc-tural proteins [70–72]. All these domains bind to short sequence motivs ofcertain target proteins. Such binding can be mimicked with short syntheticpeptides that, however, have a much larger conformational freedom than therespective sequence motive of the target protein.
14.4.3 SPOT Method for the Creation of Peptide Arrays
Among the positionally addressable solid phase synthesis methods, the SPOTsynthesis, developed by Ronald Frank [63], is an easy and flexible methodfor simultaneous, parallel chemical synthesis on membrane supports [66, 67].SPOT synthesis is used for synthesis of different peptides or peptide mix-tures at clearly defined positions on a modified cellulose membrane. Thesepeptide arrays were used to study protein–protein and protein–peptide inter-actions [73]. In a western blot-like manner, the analyte is incubated with the
14 Protein, Antibody and Small Molecule Microarrays 289
array on which potential binding partners were synthesized. The positions ofbinding of the analyte are detected with methods adapted from western blots,and signals can be directly translated into the sequence of the respective pep-tides.
Epitope mapping of antibodies [63,74–76] was the first application of thistechnique. In addition, three different proline-rich repeats of Acta (actin as-sembly inducing protein A) were identified to be the ligands of VASP (va-sodilator stimulated phosphoprotein) and other cellular proteins by Niebuhret al. [77]. Furthermore, this technique was used to determine the peptide bind-ing motifs of streptavidin [78], which eventually led to the development of theStrepTag [79,80]. Protein–DNA [81] and protein–metal interactions [82] werestudied using peptide arrays prepared by the SPOT method. An investigationof the CaM-regulated activity of the STOP protein in tubulin stabilization hasbeen described recently [83]. A comprehensive review of applications of theSPOT method was published by Frank and Schneider-Mergener [84].
For manufacturing peptide arrays using the SPOT method, N–terminallyand side chain-protected amino acids are dissolved in a solvent of low volatil-ity. This solution is distributed by pipetting to defined positions on a modifiedcellulose membrane. Arrays of ninety–six spots of the size of a standard mi-croplate can be generated manually. For the generation of arrays with morespots, up to 2,000 on a membrane of 20×20 cm, automated SPOT synthesiz-ers have been developed in cooperation between Ronald Frank and AbimedGmbH Langenfeld, Germany. This robot is currently distributed by Intavis(http://www.intavis.com). In the original approach, the entire cellulose mem-brane was modified by coupling β–alanine (Fmoc–β–alanine) and removingthe Fmoc protection group after completion of the coupling reaction. Today,more robust supports suitable for SPOT–synthesis are commercially avail-able (e.g., AIMS Scientific, http://www.aims-scientific-products.de). A kit forthe SPOT synthesis is available from Sigma Genosys (http://www.sigma-genosys.com/spot.asp). Technical details of the SPOT synthesis have beenreviewed elsewhere [63,85–87].
14.4.4 Alternative Peptide Array Technology
The throughput of the SPOT synthesis was increased with the introductionof the BioDisk Synthesizer [88]. In this approach, a rotating disk, made of anon-porous polymer, is used as support for the synthesis. Inkjet technologyis employed for the delivery of activated protected amino acids and the de-protection reagents. Centrifugal force is used for the removal of the differentreagents.
Photolithographic synthesis of peptide arrays was first described by Fodoret al. [64]. The application of this technology to the deprotection of oligonu-cleotide monomers bound to a suitable solid support resulted in the well-established Affymetrix oligonucleotide arrays. For the synthesis of such ar-rays, defined photomasks are used, limiting the flexibility of the approach.
290 Hendrik Weiner et al.
Pellois et al. [89] described recently the synthesis of peptide arrays relyingon the highly flexible digital micromirror array [90] and conventional peptidechemistry with in-solution removal of acid–labile protecting groups using pho-togenerated reagents [91–94]. These arrays were used for mapping an antibodywith natural and non-natural amino–acids.
Alternative arraying technologies are currently developed aiming at anincreased spotting density and production rate of ligands. Various nanodis-pensing devices for microarrays have been developed recently (e.g., [95]). Laserprinter technology has been used as an alternative approach to prepare pep-tide arrays on paper [96, 97]. Twenty toners are being developed containingFmoc protected amino acids in a solvent that is solid at room temperature.During standard laser printing, the particles are heated on the paper and theamino acids are coupled to the paper support. The paper is washed to removeuncoupled monomers and subsequently N–terminal protection groups. Thenext amino acids are coupled to free amino groups of the first immobilizedamino acids in the next printing cycle. Laser printing relies on the inductionof positive charge by laser or LCD light. Negatively charged toner particlesare attracted onto the paper by the positive charges underneath it. Therefore,it should be possible to replace the paper with a computer chip, while chargedspots on such chips can be electronically ‘switched’.
References
1. Walter G, Bussow K, Cahill D, Lueking A, Lehrach H (2000) Protein arraysfor gene expression and molecular interaction screening. Current Opinion inMicrobiology 3(3): 298–302
2. Walter G, Bussow K, Lueking A, Glokler J (2002) High–throughput proteinarrays: prospects for molecular diagnostics. Trends in Molecular Medicine 8(6):250–253
3. Lennon GG, Lehrach H (1991) Hybridization analyses of arrayed cDNA libraries.Trends Genet 7(10): 314–317
4. Bussow K, Cahill D, Nietfeld W, Bancroft D, Scherzinger E, Lehrach H, WalterG (1998) A method for global protein expression and antibody screening on high–density filters of an arrayed cDNA library. Nucleic Acids Res 26(21): 5007–5008
5. de Wildt RM, Mundy CR, Gorick BD, Tomlinson IM (2000) Antibody arraysfor high–throughput screening of antibody–antigen interactions. Nat Biotechnol18(9): 989–994
6. Petricoin EF, et al. (2002) Use of proteomic patterns in serum to identify ovariancancer. Lancet 359(9306): 572–577
7. Jenkins RE, Pennington SR (2001) Arrays for protein expression profiling: to-wards a viable alternative to two–dimensional gel electrophoresis? Proteomics1(1): 13–29
8. Templin MF, Stoll D, Schrenk M, Traub PC, Vohringer CF, Joos TO (2002)Protein microarray technology. Trends Biotechnol 20(4): 160–166
9. Zhu H, Snyder M (2001) Protein arrays and microarrays. Curr Opin Chem Biol5(1): 40–45

14 Protein, Antibody and Small Molecule Microarrays 291
10. Schena M, Shalon D, Davis RW, Brown PO (1995) Quantitative monitoringof gene–expression patterns with a complementary–DNA microarray. Science270(N5235): 467–470
11. MacBeath G, Schreiber SL (2000) Printing proteins as microarrays for high–throughput function determination. Science 289(5485): 1760–1763
12. BioChipNet [http://www.biochipnet.de/]13. Microarray Electronic Library [http://www.arrayit.com/e–library/]14. Conrads TP, Issaq HJ, Veenstra TD (2002) New tools for quantitative phospho-
proteome analysis. Biochem Biophys Res Comm 290(3): 885–89015. Ong SE, Blagoev B, Kratchmarova I, Kristensen DB, Steen H, Pandey A, Mann
M (2002) Stable isotope labeling by amino acids in cell culture, SILAC, as asimple and accurate approach to expression proteomics. Mol Cell Proteomics1(5): 376–386
16. Glover JF, Wilson TM (1982) Efficient translation of the coat protein cistron oftobacco mosaic virus in a cell–free system from Escherichia coli. Eur J Biochem122(3): 485–492
17. Blanar MA, Rutter WJ (1992) Interaction cloning: identification of a helix–loop–helix zipper protein that interacts with c–Fos. Science 256(5059): 1014–1018
18. Aebersold R, Mann M (2003) Mass spectrometry–based proteomics. Nature422(6928): 198–207
19. Borrebaeck CA, Ekstrom S, Hager AC, Nilsson J, Laurell T, Marko-Varga G(2001) Protein chips based on recombinant antibody fragments: a highly sensi-tive approach as detected by mass spectrometry. Biotechniques 30(5): 1126–1130,1132
20. Karlsson R, Kullman-Magnusson M, Hamalainen MD, Remaeus A, AnderssonK, Borg P, Gyzander E, Deinum J (2000) Biosensor analysis of drug–target in-teractions: direct and competitive binding assays for investigation of interactionsbetween thrombin and thrombin inhibitors. Anal Biochem 278(1): 1–13
21. Myszka D, Rich R (2000) Implementing surface plasmon resonance biosensorsin drug discovery. Pharm Sci Technol Today 3: 310–317
22. Sali A, Glaeser R, Earnest T, Baumeister W (2003) From words to literature instructural proteomics. Nature 422(6928): 216–225
23. Gavin AC, et al. (2002) Functional organization of the yeast proteome by sys-tematic analysis of protein complexes. Nature 415(6868): 141–147
24. Ho Y, et al. (2002) Systematic identification of protein complexes in Saccha-romyces cerevisiae by mass spectrometry. Nature 415(6868): 180–183
25. Tyers M, Mann M (2003) From genomics to proteomics. Nature 422(6928): 193–197
26. Mitchell P (2002) A perspective on protein microarrays. Nat Biotechnol 20(3):225–229
27. Bussow K, Nordhoff E, Lubbert C, Lehrach H, Walter G (2000) A human cDNAlibrary for high–throughput protein expression screening. Genomics 65(1): 1–8
28. Weiner H, Faupel T, Bussow K (2004) Protein arrays for cDNA expressionlibraries. In: Protein Arrays. Humana Press Inc
29. Anderson L, Seilhamer J (1997) A comparison of selected mRNA and proteinabundances in human liver. Electrophoresis 18(3–4): 533–537
30. Ensembl Database [http://www.ensembl.org/Homo sapiens]31. Cahill DJ (2001) Protein and antibody arrays and their medical applications. J
Immunol Methods 250(1–2): 81–91
292 Hendrik Weiner et al.
32. Burchell JM, Mungul A, Taylor-Papadimitriou J (2001) O–linked glycosylationin the mammary gland: changes that occur during malignancy. J MammaryGland Biol Neoplasia 6(3): 355–364
33. Safar JG, et al. (2002) Measuring prions causing bovine spongiform encephalopa-thy or chronic wasting disease by immunoassays and transgenic mice. NatBiotechnol 20(11): 1147–1150
34. Mendoza LG, McQuary P, Mongan A, Gangadharan R, Brignac S, Eggers M(1999) High–throughput microarray–based enzyme–linked immunosorbent assay(ELISA). Biotechniques 27(4): 778–780, 782–776, 788
35. Huang RP, Huang R, Fan Y, Lin Y (2001) Simultaneous detection of multiplecytokines from conditioned media and patient’s sera by an antibody–based proteinarray system. Anal Biochem 294(1): 55–62
36. Arenkov P, Kukhtin A, Gemmell A, Voloshchuk S, Chupeeva V, Mirzabekov A(2000) Protein microchips: use for immunoassay and enzymatic reactions. AnalBiochem 278(2): 123–131
37. Haab BB, Dunham MJ, Brown PO (2001) Protein microarrays for highly par-allel detection and quantitation of specific proteins and antibodies in complexsolutions. Genome Biology 2(2): RESEARCH0004
38. Angenendt P, Glokler J (2003) submitted39. Angenendt P, Glokler J, Murphy D, Lehrach H, Cahill DJ (2002) Toward opti-
mized antibody microarrays: a comparison of current microarray support mate-rials. Anal Biochem 309(2): 253–260
40. Peluso P, et al. (2003) Optimizing antibody immobilization strategies for theconstruction of protein microarrays. Anal Biochem 312(2): 113–124
41. Schweitzer B, Wiltshire S, Lambert J, O’Malley S, Kukanskis K, Zhu Z,Kingsmore SF, Lizardi PM, Ward DC (2000) Inaugural article: immunoassayswith rolling circle DNA amplification: a versatile platform for ultrasensitive anti-gen detection. Proc Natl Acad Sci USA 97(18): 10113–10119
42. Schweitzer B, Kingsmore SF (2002) Measuring proteins on microarrays. CurrOpin Biotechnol 13(1): 14–19
43. Bernard A, Michel B, Delamarche E (2001) Micromosaic immunoassays. AnalChem 73(1): 8–12
44. Hallborn J, Carlsson R (2002) Automated screening procedure for high–throughput generation of antibody fragments. Biotechniques Suppl: 30–37
45. Hanes J, Schaffitzel C, Knappik A, Pluckthun A (2000) Picomolar affinity an-tibodies from a fully synthetic naive library selected and evolved by ribosomedisplay. Nat Biotechnol 18(12): 1287–1292
46. Smith D, Collins BD, Heil J, Koch TH (2003) Sensitivity and specificity ofphotoaptamer probes. Mol Cell Proteomics 2(1): 11–18
47. Kramer K, Fiedler M, Skerra A, Hock B (2002) A generic strategy for subcloningantibody variable regions from the scFv phage display vector pCANTAB 5 Einto pASK85 permits the economical production of F(ab) fragments and leadsto improved recombinant immunoglobulin stability. Biosens Bioelectron 17(4):305–313
48. He M, Taussig M (2001) Single step generation of protein arrays from DNA bycell–free expression and in situ immobilisation (PISA method). Nucleic AcidsRes 29(15): e73
49. Petsko GA (1996) For medicinal purposes. Nature 384(6604 Suppl): 7–950. Abelson JN, ed (1996) Combinatorial Chemistry. Methods in Enzymology. Vol.
267, Academic Press: San Diego
14 Protein, Antibody and Small Molecule Microarrays 293
51. Cortese R, ed (1996) Combinatorial Libraries; Synthesis, Screening and Appli-cation Potential. , Walter de Gruyter & Co: Berlin
52. Famulok M, Winnaker E-L, Wong C-H, eds (1999) Combinatorial Chemistry inBiology. , Springer Verlag: Berlin
53. Merrifield B (1986) Solid phase synthesis. Science 232(4748): 341–34754. Merrifield RB (1963) Solid phase peptide synthesis. I. The synthesis of a
tetrapeptide. J Am Chem Soc 85: 2149–215455. Merrifield RB (1965) Automated synthesis of peptides. Science 150(693): 178–18556. Hogan JC, Jr. (1996) Directed combinatorial chemistry. Nature 384(6604 Suppl):
17–1957. Houghten RA, Pinilla C, Blondelle SE, Appel JR, Dooley CT, Cuervo JH (1991)
Generation and use of synthetic peptide combinatorial libraries for basic researchand drug discovery. Nature 354(6348): 84–86
58. Frank R, Dohring R (1988) Simultaneous multiple synthesis under controlledflow conditions on cellulose paper disks as segmental solid supports. Tetrahedron44(19): 6031–6040
59. Frank R, Heikens W, Heisterberg-Moutsis G, Blocker H (1983) A new generalapproach for the simultaneous chemical synthesis of large numbers of oligonu-cleotides: segmental solid supports. Nucleic Acids Res 11(13): 4365–4377
60. Lam KS, Salmon SE, Hersh EM, Hruby VJ, Kazmierski WM, Knapp RJ (1991)A new type of synthetic peptide library for identifying ligand–binding activity.Nature 354(6348): 82–84
61. Furka A, Sebestyen F, Asgedom M, Dibo G (1991) General method for rapidsynthesis of multicomponent peptide mixtures. Int J Pept Protein Res 37(6):487–493
62. Geysen HM, Meloen RH, Barteling SJ (1984) Use of peptide synthesis to probeviral antigens for epitopes to a resolution of a single amino acid. Proc Natl AcadSci USA 81(13): 3998–4002
63. Maskos U, Southern EM (1992) Oligonucleotide hybridizations on glass sup-ports: a novel linker for oligonucleotide synthesis and hybridization properties ofoligonucleotides synthesised in situ. Nucleic Acids Res 20(7): 1679–1684
64. Fodor SP, Read JL, Pirrung MC, Stryer L, Lu AT, Solas D (1991) Light–directed,spatially addressable parallel chemical synthesis. Science 251(4995): 767–773
65. Frank R (1992) Spot synthesis: an easy techique for the positionally addressableparallel chemical synthesis on a membrane support. Tetrahedron 48: 9217–9232
66. Frank R (2002) High–density synthetic Peptide microarrays: emerging tools forfunctional genomics and proteomics. Comb Chem High Throughput Screen 5(6):429–440
67. Frank R (2002) The SPOT–synthesis technique. Synthetic peptide arrays onmembrane supports–principles and applications. J Immunol Methods 267(1):13–26
68. Geysen HM, Rodda SJ, Mason TJ (1986) A priori delineation of a peptide whichmimics a discontinuous antigenic determinant. Mol Immunol 23(7): 709–715
69. Frank R (1995) Simultaneous and combinatorial chemical synthesis techniquesfor the generation and screening of molecular diversity. J Biotechnol 41(2–3):259–272
70. Cantley LC, Songyang Z (1994) Specificity in recognition of phosphopeptides bysrchomology 2 domains. J Cell Sci 18: 121–126
294 Hendrik Weiner et al.
71. Macias M, Hyvonen M, Baraldi E, Schultz J, Sudol M, Saraste M, Oschkinat M(1996) Structure of the WW domain of a kinase–associated protein complexedwith a proline–rich peptide. Nature 382: 646–649
72. Spink KE, Fridman SG, Weis WI (2001) Molecular mechanisms of beta–cateninrecognition by adenomatous polyposis coli revealed by the structure of an APC–beta–catenin complex. EMBO J 20(22): 6203–6212
73. Reineke U, Kramer A, Schneider-Mergener J (1999) Antigen sequence– andlibrary–based mapping of linear and discontinuous protein–protein–interactionsites by spot synthesis. Comb Chem Biol 243: 23–36
74. Darji A, Niebuhr K, Hense M, Wehland J, Chakraborty T, Weiss S (1996)Neutralizing monoclonal antibodies against listeriolysin: mapping of epitopes in-volved in pore formation. Infect Immun 64(6): 2356–2358
75. Hohne WE, et al. (1993) Structural base of the interaction of a monoclonalantibody against p24 of HIV–1 with its peptide epitope. Mol Immunol 30(13):1213–1221
76. Martens W, Greiser-Wilke I, Harder TC, Dittmar K, Frank R, Orvell C, Moen-nig V, Liess B (1995) Spot synthesis of overlapping peptides on paper membranesupports enables the identification of linear monoclonal antibody binding deter-minants on morbillivirus phosphoproteins. Vet Microbiol 44(2–4): 289–298
77. Niebuhr K, Ebel F, Frank R, Reinhard M, Domann E, Carl UD, Walter U,Gertler FB, Wehland J, Chakraborty T (1997) A novel proline–rich motifpresent in ActA of Listeria monocytogenes and cytoskeletal proteins is the lig-and for the EVH1 domain, a protein module present in the Ena/VASP family.Embo J 16(17): 5433–5444
78. Schmidt TGM, Koepke J, Frank R, Skerra A (1996) Molecular interaction be-tween the Strep–tag affinity peptide and its cognate target, streptavidin. J MolBiol 255(5): 753–766
79. Schmidt TG, Koepke J, Frank R, Skerra A (1996) Molecular interaction betweenthe Strep–tag affinity peptide and its cognate target, streptavidin. J Mol Biol255(5): 753–766
80. Voss S, Skerra A (1997) Mutagenesis of a flexible loop in streptavidin leads tohigher affinity for the Strep–tag II peptide and improved performance in recom-binant protein purification. Protein Eng 10(8): 975–982
81. Kramer A, Volkmer-Engert R, Malin R, Reineke U, Schneider-Mergener J (1993)Simultaneous synthesis of peptide libraries on single resin and continuous cel-lulose membrane supports: examples for the identification of protein, metal andDNA binding peptide mixtures. Pept Res 6(6): 314–319
82. Malin R, Steinbrecher A, Semmler W, Noll B, Johannson B, Frommel C,Schneider-Mergener J (1995) Identification of technetium–99m binding peptidesusing cellulose–bound combinatorial peptide libraries. J Am Chem Soc 117:11821–11822
83. Bosc C, Frank R, Denarier E, Ronjat M, Schweitzer A, Wehland J, Job D(2001) Identification of novel bifunctional calmodulin–binding and microtubule–stabilizing motifs in STOP proteins. J Biol Chem 276(33): 30904–30913
84. Frank R, Schneider-Mergener J (2002) SPOT–synthesis – scope and applica-tions. In: Kocj J, Mahler M (eds) Peptide arrays on membrane supports: alaboratory manual. Springer Verlag, Heidelberg
85. Frank R, Hoffmann S, Kieb M, Lahmann H, Tegge W, Behm C, Gausepohl H(1996) Combinatorial synthesis on membrane supports by the SPOT technique:
14 Protein, Antibody and Small Molecule Microarrays 295
imaging peptide sequence space. In: Jung G (ed) Combinatorial peptide andnon-peptide libraries – a handbook. Verlag Chemie. pp 363–386
86. Frank R, Overwin H (1996) SPOT synthesis. Epitope analysis with arrays ofsynthetic peptides prepared on cellulose membranes. Methods Mol Biol 66: 149–169
87. Kramer A, Schneider-Mergener J (1998) Synthesis and screening of peptide li-braries on continuous cellulose membrane supports. Methods Mol Biol 87: 25–39
88. Adler F, Turk G, Frank R, Zander N, Wu W, Volkmer-Engert R, Schneider-Mergener J, Gausepohl H (1999) A new array format for the automated parallelcombinatorial synthesis by the SPOT–technique. In: Epton R (ed) Proc. Inter-national Symp. on ‘Innovation and Perspectives in Solid Phase Synthesis 2000 ’.Mayflower Worldwide, Kingswinford, York. pp 221
89. Pellois JP, Zhou X, Srivannavit O, Zhou T, Gulari E, Gao X (2002) Individuallyaddressable parallel peptide synthesis on microchips. Nat Biotechnol 20(9): 922–926
90. Singh-Gasson S, Green RD, Yue Y, Nelson C, Blattner F, Sussman MR, CerrinaF (1999) Maskless fabrication of light–directed oligonucleotide microarrays usinga digital micromirror array. Nat Biotechnol 17(10): 974–978
91. Gao X, LeProust E, Zhang H, Srivannavit O, Gulari E, Yu P, Nishiguchi C,Xiang Q, Zhou X (2001) A flexible light–directed DNA chip synthesis gatedby deprotection using solution photogenerated acids. Nucleic Acids Res 29(22):4744–4750
92. Gao X, Yu P, LeProust E, Sonigo L, Pellois JP, Zhang H (1998) OligonucleotideSynthesis Using Solution Photogenerated Acids. J Am Chem Soc 120(48): 12698–12699
93. LeProust E, Pellois JP, Yu P, Zhang H, Gao X, Srivannavit O, Gulari E, Zhou X(2000) Digital Light–Directed Synthesis. A Microarray Platform That PermitsRapid Reaction Optimization on a Combinatorial Basis. J Comb Chem 2(4):349–354
94. Pellois JP, Wang W, Gao X (2000) Peptide Synthesis Based on t–Boc Chemistryand Solution Photogenerated Acids. J Comb Chem 2(4): 355–360
95. Hughes TR, et al. (2001) Expression profiling using microarrays fabricated byan ink–jet oligonucleotide synthesizer. Nat Biotechnol 19(4): 342–347
96. Bischoff FR, Stadler V, Breitling F (2003) Hochkomplexe Peptidarrays – Tech-niken, Anwendungen und Perspektiven. BioSpektrum 8:654-657
97. Breitling F, Breitling F, Felgenhauer T, Fernandez S, Leibe K, Beyer M, StadlerV, Bischoff FR, Poustka A (2003) Hochkomplexe Peptidarrays auf Computer-chips. : in press
98. Hultschig C, Two Dimensional Screening: Towards Establishing a NovelTechnique to Study Biomolecular Interactions, in Gemeinsame naturwis-senschaftliche Faklutat. 2000, Technische Universitat Carolo-Wilhelminazu Braunschweig; Germany; available under: http://www.biblio.tu–bs.de/ediss/data/20000207a/20000207a.html
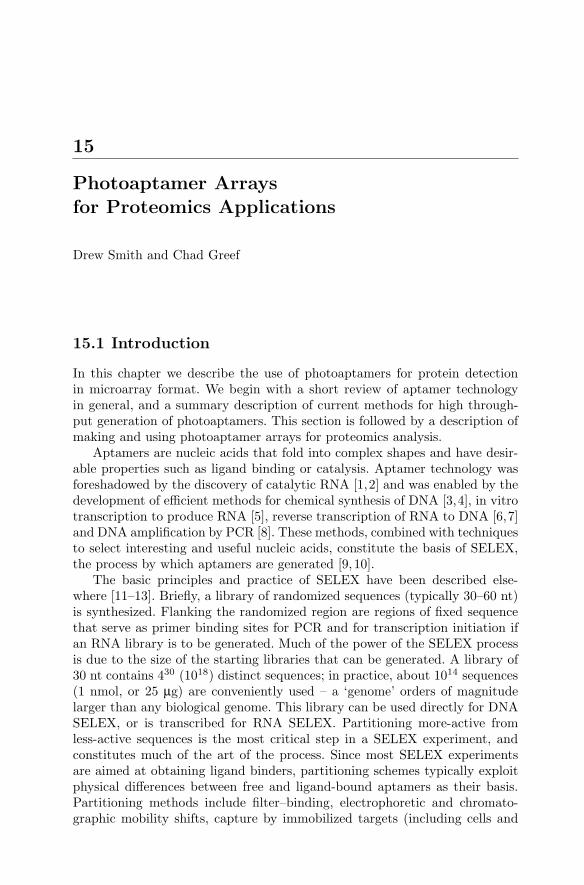
15
Photoaptamer Arraysfor Proteomics Applications
Drew Smith and Chad Greef
15.1 Introduction
In this chapter we describe the use of photoaptamers for protein detectionin microarray format. We begin with a short review of aptamer technologyin general, and a summary description of current methods for high through-put generation of photoaptamers. This section is followed by a description ofmaking and using photoaptamer arrays for proteomics analysis.
Aptamers are nucleic acids that fold into complex shapes and have desir-able properties such as ligand binding or catalysis. Aptamer technology wasforeshadowed by the discovery of catalytic RNA [1,2] and was enabled by thedevelopment of efficient methods for chemical synthesis of DNA [3,4], in vitrotranscription to produce RNA [5], reverse transcription of RNA to DNA [6,7]and DNA amplification by PCR [8]. These methods, combined with techniquesto select interesting and useful nucleic acids, constitute the basis of SELEX,the process by which aptamers are generated [9, 10].
The basic principles and practice of SELEX have been described else-where [11–13]. Briefly, a library of randomized sequences (typically 30–60 nt)is synthesized. Flanking the randomized region are regions of fixed sequencethat serve as primer binding sites for PCR and for transcription initiation ifan RNA library is to be generated. Much of the power of the SELEX processis due to the size of the starting libraries that can be generated. A library of30 nt contains 430 (1018) distinct sequences; in practice, about 1014 sequences(1 nmol, or 25 µg) are conveniently used – a ‘genome’ orders of magnitudelarger than any biological genome. This library can be used directly for DNASELEX, or is transcribed for RNA SELEX. Partitioning more-active fromless-active sequences is the most critical step in a SELEX experiment, andconstitutes much of the art of the process. Since most SELEX experimentsare aimed at obtaining ligand binders, partitioning schemes typically exploitphysical differences between free and ligand-bound aptamers as their basis.Partitioning methods include filter–binding, electrophoretic and chromato-graphic mobility shifts, capture by immobilized targets (including cells and
298 Drew Smith et al.
tissues) and variations of these techniques. Once separated, the enriched poolsare recovered, reverse-transcribed (if RNA) and amplified by PCR to beginanother cycle. SELEX experiments typically require 6–12 cycles to convergeupon a few tens of active sequences.
Aptamers have been developed for use as therapeutic agents [14], as invivo imaging agents [15, 16], as intra- and extra-cellular inhibitors of proteinfunction in vivo and in tissue culture [17–22], as cell–surface labels [23,24], asprobes for target validation and drug design [25–27], as affinity purificationreagents [28], and as diagnostic reagents in microwell [29–33] and microarrayformat [34].
The use of aptamers in the latter format is the subject of this chapter.The use of aptamers in microarray format for protein detection is a natu-ral extension of both aptamer and microarray technologies. Like antibodies,aptamers have been discovered for a broad range of target proteins (see theAptamer Database http://aptamer.icmb.utexas.edu/index.html), have affini-ties that are typically nanomolar or better, and show excellent discriminationbetween their targets and closely related proteins [35–40]. However, the natureof aptamers lends itself to microarray applications: nucleic acids, especiallyDNA, are chemically stable and resistant to degradation (except by nucleases);DNA molecules are readily synthesized by automated methods; the incorpora-tion of modifications for array attachment is simple; and the SELEX processitself can be automated for high throughput discovery [41–43].
Our approach to microarray detection employs photoaptamers as captureagents. Photoaptamers are photoactivated crosslinking aptamers [44,45]. Thecovalent complex that is generated between aptamer capture agent and targetprotein simplifies processing and analysis of the microarray: unbound proteincan be washed away using denaturing conditions, and the captured proteincan be labelled in situ for detection [46,47]. The photocrosslinking reaction isquite specific and aids in the rejection of non-specific binding, particularly byproteins with high affinity for DNA [48]. Photocrosslinking activity is impartedby incorporating BrdU into SELEX libraries. Irradiation at 300 nm or longerwavelengths generates the 5–uridinyl radical which will react with proximalelectron-rich amino acids, causing covalent complex formation [49–51].
15.2 Overview of Photoaptamer Discoveryand High Throughput Production
The first photoSELEX experiments exploited electrophoretic mobility shifts topartition crosslinked from free DNA or RNA [44,45]. Although effective, thismethod is time–consuming and is difficult to scale. Microbead partitioning canbe adapted to a 96–well format, because suspensions of beads can be easilymixed and transferred by standard liquid handling equipment. Bead suspen-sions can then be converted from liquid to solid phase by filtration or magnetic
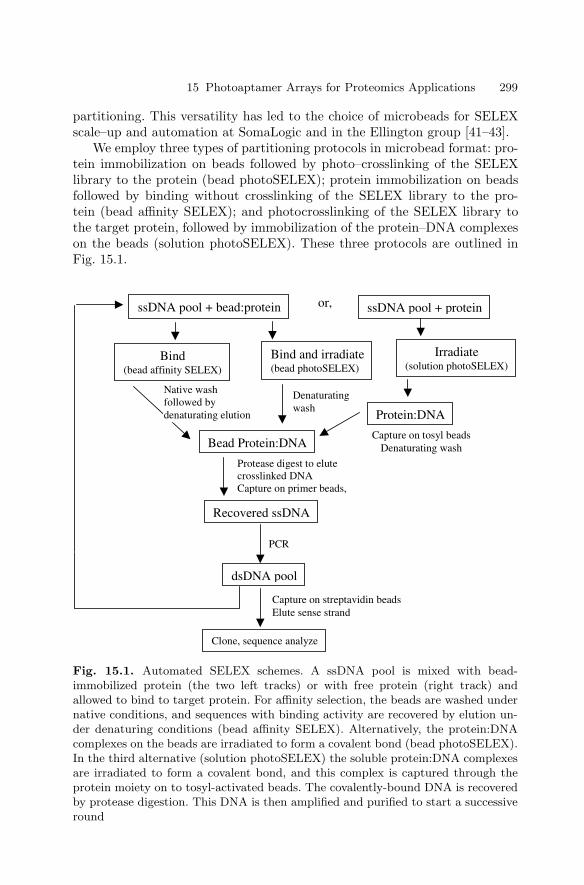
15 Photoaptamer Arrays for Proteomics Applications 299
partitioning. This versatility has led to the choice of microbeads for SELEXscale–up and automation at SomaLogic and in the Ellington group [41–43].
We employ three types of partitioning protocols in microbead format: pro-tein immobilization on beads followed by photo–crosslinking of the SELEXlibrary to the protein (bead photoSELEX); protein immobilization on beadsfollowed by binding without crosslinking of the SELEX library to the pro-tein (bead affinity SELEX); and photocrosslinking of the SELEX library tothe target protein, followed by immobilization of the protein–DNA complexeson the beads (solution photoSELEX). These three protocols are outlined inFig. 15.1.
ssDNA pool + bead:protein ssDNA pool + proteinor,
Irradiate (solution photoSELEX)
Bind and irradiate(bead photoSELEX)
Bind (bead affinity SELEX)
Protein:DNA
Denaturating wash
Capture on tosyl beadsDenaturating wash
Protease digest to elute crosslinked DNA Capture on primer beads,
PCR
Recovered ssDNA
dsDNA pool
Capture on streptavidin beadsElute sense strand
Clone, sequence analyze
Bead Protein:DNA
Native wash followed by denaturating elution
Fig. 15.1. Automated SELEX schemes. A ssDNA pool is mixed with bead-immobilized protein (the two left tracks) or with free protein (right track) andallowed to bind to target protein. For affinity selection, the beads are washed undernative conditions, and sequences with binding activity are recovered by elution un-der denaturing conditions (bead affinity SELEX). Alternatively, the protein:DNAcomplexes on the beads are irradiated to form a covalent bond (bead photoSELEX).In the third alternative (solution photoSELEX) the soluble protein:DNA complexesare irradiated to form a covalent bond, and this complex is captured through theprotein moiety on to tosyl-activated beads. The covalently-bound DNA is recoveredby protease digestion. This DNA is then amplified and purified to start a successiveround
300 Drew Smith et al.
These protocols share many common steps, and differ principally by cova-lent vs non-covalent binding of DNA to the target protein, and by the respec-tive order of protein:DNA crosslinking vs protein:bead immobilization in theprocess. All of these processes are fully automated in 96–well format with theexception of moving plates to and from the PCR thermal cycler. The photoSE-LEX protocols are performed on a Cavro pipetting station modified to handlea fiber optic tool for the irradiation step. The affinity SELEX protocol can beperformed on the Cavro or, more readily, on a TomTech 96–channel pipettingrobot. A round of photoSELEX using these procedures requires 10–14 hoursfor a full 96–well plate. Affinity SELEX requires 6–8 hours per round.
Successful SELEX experiments are typically completed in 6–9 cycles; ad-ditional cycles rarely improve aptamer pool activity. Because so many SELEXexperiments can be performed in parallel, the task of identifying and synthe-sizing active sequences generally requires much more time and effort than theselection process itself. We start by winnowing out those pools that have notconverged from the ∼ 1014 sequences in the starting library to a few tens ofsequences. This convergence is conveniently monitored by assessing the rateof reannealing of the double-stranded DNA products of the PCR step – a C0tassay [52]. The PCR sample is denatured by heating to 98 in the presenceof the dye SYBR Green I, which fluoresces when bound to double-strandedDNA. The DNA is cooled to a temperature that allows reannealing of fullycomplementary sequences (∼ 87), and the gain in fluoresecence over time ismonitored with a CCD camera. Converged pools typically regain full fluores-cence in < 10 minutes. These pools are carried forward for activity analysis.
Photoaptamer pools can be screened for activity in solution or in microar-ray format. Because photoaptamers require a stable protein:DNA complex forphotocrosslinking [49], active pools can be identified on the basis of their affin-ity for their target proteins. This is conveniently done by the nitrocellulosefilter–binding assay, where radiolabelled DNA and excess protein are mixedand filtered, and the fraction of DNA bound is determined by scintillationcounting or phosphorimaging of the filters [11].
The filter–binding assay yields a quantitative determination of protein–binding activity, typically expressed as a dissociation constant. A more qual-itative assessment of activity can be determined in microarray format, asdescribed below. With few exceptions, there is good agreement between theresults of the two assays. The microarray assay is somewhat more stringent –pools and aptamers that have strong affinity for their target protein (< 10nM)show the best activity on microarrays, whereas lower affinity pools often (butnot always) show little or no microarray activity. SELEX pools can be pre-pared for arraying by PCR with a 5′amino linker primer.
15 Photoaptamer Arrays for Proteomics Applications 301
15.3 Using Photoaptamer Microarrays
Once pools from a SELEX experiment have been determined to have bindingaffinity and crosslinking activity to cognate protein they are cloned through aplasmid vector and individual sequences are determined. Alignment protocolsidentify sequence motifs among the different populations, as well as potentialcontaminants and spurious outliers. The sequences that are determined tohave the greatest likelihood of representing the binding motif from the SELEXare chemically synthesized for activity screening by microarray and solutionphase assays.
Chemical synthesis of photoaptamers is performed by standard phospho-ramidite methods, with procedural modifications that have been optimizedto maximize deprotection and recovery of full-length product. Aptamers aresynthesized with appropriate attachment chemistries added as modified phos-phoramidites. Product quality is confirmed with extensive HPLC, CGE, andICR mass spec analysis. Since DNA synthesis is highly controllable the pro-duction of aptamers can be considered a very robust, manufacturable process,amenable to scale–up and quality control.
Synthetic photoaptamers are arrayed by standard contact printing meth-ods with modifications that optimize loading, spot morphology, and aptameractivity. An important consideration is that the substrate must be chosen tominimize non-specific adsorption of DNA, as this will disrupt aptamer ter-tiary structure, limiting activity. We have found that commercially availablemicroarray slides that present chemically functionalized polymer coatings al-low high aptamer loading and activity. After printing, slides are processed bymethods designed to render the remaining functional groups and the polymercoating inert to interaction with proteins and UPS (see below). Printed slidescan be stored dry for extended periods with no loss of activity.
Photoaptamers arrays are used as discovery tools to screen pools for bind-ing activity and individual cloned sequences for relative activity and cross–reactivity, but the ultimate goal is to evaluate protein levels in multiplexfashion from complex mixtures. In all cases the procedure to run a photoap-tamer array assay is the same; protein samples are incubated over the arrayallowing affinity binding to occur, unbound protein is washed away, boundprotein is photo–crosslinked to cognate aptamer, crosslinked protein is chemi-cally labelled with a Universal Protein Stain (UPS), and the label is detected.Individual steps are detailed below:
Protein Binding
Protein samples are prepared in Protein Incubation Buffer (PIB) that matchesas closely as possible the composition of the SELEX discovery buffer, in termsof buffer composition, salt content, and ionic strength. Carrier DNA is added,but has not been shown to be absolutely necessary. The photoaptamer arraysare prepared by equilibration in PIB for 15 minutes prior to introduction of
302 Drew Smith et al.
the protein mixture. Note that conventional, protein based blocking mixturesare not necessary. Once the protein mixture is applied to the array the mix-ture is allowed to incubate at 30C for at least 2 hours. For high sensitivitymeasurements longer incubation times may improve results. The protein in-cubation can be performed in either a static mode, in which the solution isallowed to interact with the array without dynamic movement, or in a flowmode, where solution is circulated over the array in either a continuous loopor a reciprocating fashion. For the static mode, simple reaction vessels arefashioned over the arrays by application of adhesive-backed wells or othersimilar devices, while for circulation mode more technically evolved solutionsare required. Both methods yield equivalent results; the advantage of mixingis a reduction in the incubation time needed to reach maximal binding levels.
Pre-Crosslink Wash, Crosslinking, and Post-Crosslink Wash
At the end of the incubation period the protein solution is replaced with PIB,allowing removal of unbound protein while retaining cognate protein bindingto aptamers through affinity interaction. The arrays are then exposed to UVirradiation, causing covalent crosslink formation between BrdU residues onthe aptamers and proximal electron-rich amino acids of the cognate proteins.Optimal wavelength for the crosslink is 308 nm, which can be introduced byexcimer laser excitation or broad spectrum UV which is filtered to eliminatesub–300 nm wavelengths. Optimal energy levels have been calibrated on thelaser and empirically determined to be 3 J/cm2, which gives the highest levelsof specific crosslinking.
The specificity imparted to the microarray assay in the crosslinking stepis a key feature of photoaptamer technology. The photoSELEX process se-lects those aptamers that efficiently crosslink their target protein. Because thephotoactivated complex is short-lived, efficient crosslinking requires close andstable contacts between BrdU and the target amino–acid, a requirement forπ–bond orbital overlap has been proposed [50]. Although polyanion–bindingproteins may bind to aptamer DNA, the probability that this binding willresult in productive geometry for photocrosslinking is low. We have shownthat the photocrosslinking step can improve aptamer specificity by an orderof magnitude or more over the specificity due to affinity interactions alone [48].Although these measurements were made in solution, they are consistent withresults obtained on microarrays, both with simple protein mixtures and withtarget proteins spiked in to serum [48].
Since the crosslinked aptamer–protein complex is covalently linked to thesubstrate it is possible to use extremely rigorous denaturing conditions tofully remove any remaining proteins from the substrate or non-cognate arrayfeatures. Examples of denaturing components of washing solutions include0.02 M NaOH, 0.1 M AcOH, 1% SDS, 2% TritonX–100, 0.5 M NaCl, 0.02 MDTT, 8 M Urea, 4 M GuHCl, 50C, and sonication. However, since the bind-ing interaction of aptamers to cognate proteins is extremely specific there is
15 Photoaptamer Arrays for Proteomics Applications 303
generally little to be gained from stringent washes at this point, but elimi-nating non-specifically adsorbed protein from the substrate minimizes generalbackground signal.
Signal Generation with Universal Protein Stain (UPS)
Because the only protein molecules present on the array at this point are thosethat are covalently crosslinked to their cognate aptamer, a global labelling stepthat targets protein-specific chemical moieties is employed. Generally, directfluorescence detection provides adequate signal/noise, but alternative meth-ods and/or signal amplification can boost response for high sensitivity applica-tions. A number of methods to introduce fluorescent detection molecules havebeen used, including lysine-specific activated ester modified dyes, thiol specificmaleimide modified dyes, nitrosylation of tyrosines followed by nitrotyrosinespecific Ab, and biotinylation followed by TSA detection.
Fluorescence signal from photoaptamer arrays is measured by standard mi-croarray scanning devices, providing raw data as 16–bit TIFF images. Dataprocessing involves fitting ROI grids to the image via standard image pro-cessing software methods, extracting mean signal intensity from features, sub-tracting background signal derived from no–protein controls, and evaluatingresultant values by comparing to standard curves generated through doseresponse control experiments. An internal database processes, collates, andstores data from experiments.
Figure 15.2 shows results from a model multiplex experiment in which aseries of protein mixtures were created such that each mixture contained 14proteins at different levels, each protein was represented at some level in eachmixture, and the overall protein concentration of each mixture was constant.The mixtures were each assayed on discrete arrays, and the resultant datawas deconvoluted to generate multiple standard curves from one assay series.The pseudo–color image shows boxed features corresponding to the endostatinstandard curve series, while the other quadruplicate groupings correspond toother proteins in the mixtures.
15.4 Discussion
Development of microarray assays capable of rapid multplexed determinationof absolute and relative levels of proteins in complex mixtures will enablemany new capabilities in the fields of research proteomics, drug discovery,and clinical diagnostics. Multiplexed protein analysis in the microarray formatwill allow researchers to explore causal relationships between relative proteinlevels in samples and diseased states being studied while consuming far smallervolumes of precious samples than are required for current methods.
As the number of proteins available for study increases, unique signaturepatterns of protein levels in diseased state samples could become apparent,
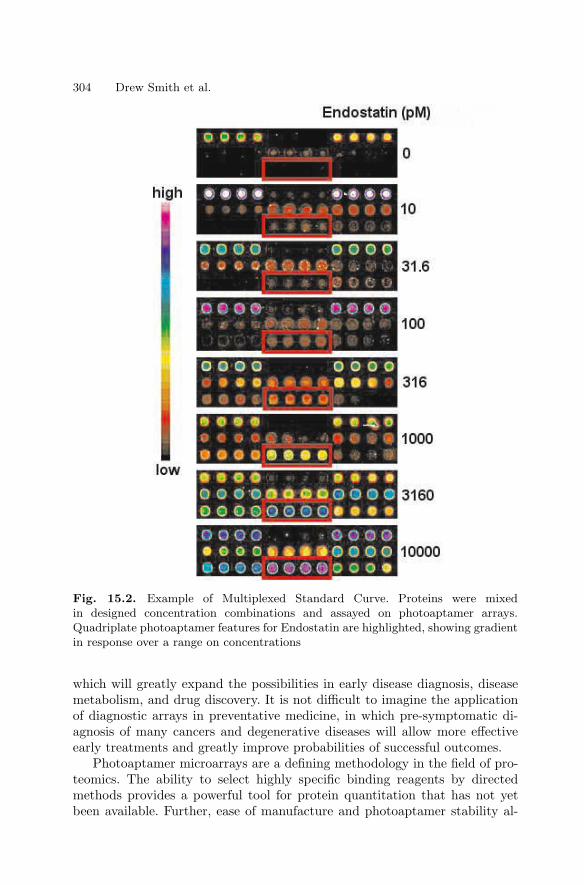
304 Drew Smith et al.
Fig. 15.2. Example of Multiplexed Standard Curve. Proteins were mixedin designed concentration combinations and assayed on photoaptamer arrays.Quadriplate photoaptamer features for Endostatin are highlighted, showing gradientin response over a range on concentrations
which will greatly expand the possibilities in early disease diagnosis, diseasemetabolism, and drug discovery. It is not difficult to imagine the applicationof diagnostic arrays in preventative medicine, in which pre-symptomatic di-agnosis of many cancers and degenerative diseases will allow more effectiveearly treatments and greatly improve probabilities of successful outcomes.
Photoaptamer microarrays are a defining methodology in the field of pro-teomics. The ability to select highly specific binding reagents by directedmethods provides a powerful tool for protein quantitation that has not yetbeen available. Further, ease of manufacture and photoaptamer stability al-
15 Photoaptamer Arrays for Proteomics Applications 305
lows a wide range of applications that is unlimited by many of the constraintstraditionally associated with biological reagents. The acquisition of photoap-tamers is limited only by the availability of individual proteins, and as thatrepertoire and inventory increases the possibilities for photoaptamers will fol-low closely behind.
The obvious ambition for protein microarray technology is to supplant thelaborious technologies now associated with proteomics: to make 2–D gel anal-ysis and single–analyte ELISAs as obsolete for the study of protein expressionas Northern blots have become for the study of mRNA expression. Microar-ray technology and its associated instrumentation are already cheaper, fasterand more–robust than the suite of technologies associated with 2–D gel/massspectrometry analysis. The acceptance of microarray technology for proteomicanalysis now awaits the introduction of assay platforms that are as sensitiveand comprehensive as the technologies we seek to replace.
The ideal microarray would combine the sensitivity of ELISA technol-ogy with the comprehensive proteome coverage of 2–D gel/MS technology.Antibody-based arrays have already shown impressive ELISA-like sensitivityin small multiplex arrays [53,54]. However, the need to identify and apply sec-ondary labelling antibodies will soon become an important constraint on thedegree of proteome coverage that can be achieved. Multiplexing with antibod-ies may fall well short of the coverage provided by 2–D gels. Photoaptamersstart from a narrower technology base than do antibodies, but dispense withthe need for a secondary reagent. As the degree of multiplexing becomes morecritical in the development of protein microarray technology, the advantagesof a format based on a single capture and detection reagent will become moreimportant.
References
1. Guerrier-Takada, C., Gardiner, K. J., Marsh, T. L., Pace, N. R., and Altman, S.(1983). The RNA Moiety Of RNase P Is The Catalytic Subunit Of The Enzyme.Cell 35, 849–857
2. Kruger, K., Grabowski, P. J., Zaug, A. J., Sands, J., Gottschling, D. E., andCech, T. R. (1982). Self-splicing RNA: autoexcision and autocyclization of theribosomal RNA in-tervening sequence of Tetrahymena. Cell 31, 147–157
3. Beaucage, S. L., and Caruthers, M. H. (1981). Studies on Nucleotide ChemistryV. Deoxynucleoside Phosphoramidites A New Class of Key Intermediates forDeoxypolynucleotide Synthesis. Tetrahedron Lett 22, 1859
4. Matteucci, M. D., and Caruthers, M. H. (1981). Studies on Nucleotide ChemistryIV. Synthesis of Deoxyoligonucleotides on a Polymer Support. J Am Chem Soc103, 3185
5. Studier, F. W., and Moffatt, B. A. (1986). Use of bacteriophage T7 RNA poly-merase to direct selective high–level expression of cloned genes. J Mol Biol 189,113–130
6. Baltimore, D. (1970). RNA–dependent DNA polymerase in virions of RNA tu-mour viruses. Nature 226, 1209–1211
306 Drew Smith et al.
7. Temin, H. M., and Mizutani, S. (1970). RNA–dependent DNA polymerase invirions of Rous sarcoma virus. Nature 226, 1211–1213
8. Saiki, R. K., Scharf, S., Faloona, F., Mullis, K. B., Horn, G. T., Erlich, H. A., andArnheim, N. (1985). Enzymatic amplification of beta–globin genomic sequencesand restriction site analysis for diagnosis of sickle cell anemia. Science 230,1350–1354
9. Ellington, A. D., and Szostak, J. W. (1990). In vitro selection of RNA moleculesthat bind specific ligands. Nature 346, 818–822
10. Tuerk, C., and Gold, L. (1990). Systematic evolution of ligands by exponentialenrichment: RNA ligands to bacteriophage T4 DNA polymerase. Science 249,505–510
11. Fitzwater, T., and Polisky, B. (1996). A SELEX primer. Methods Enzymol 267,275–301
12. Gold, L., Polisky, B., Uhlenbeck, O., and Yarus, M. (1995). Diversity of oligonu-cleotide functions. Annu Rev Biochem 64, 763–797
13. Tuerk, C. (1997). Using the SELEX combinatorial chemistry process to find highaffinity nucleic acid ligands to target molecules. Methods Mol Biol 67, 219–230
14. Eyetech Study Group. (2002). Preclinical and Phase 1a Clinical Evaluation ofan Anti-Vegf Pegylated Aptamer (Eye001) for the Treatment of Exudative Age–Related Macular Degeneration. Retina 22, 143–152
15. Charlton, J., Sennello, J., and Smith, D. (1997). In vivo imaging of inflammationusing an aptamer inhibitor of human neutrophil elastase. Chem Biol 4, 809–816
16. Hicke, B. J., Marion, C., Chang, Y. F., Gould, T., Lynott, C. K., Parma, D.,Schmidt, P. G., and Warren, S. (2001). Tenascin–C aptamers are generatedusing tumor cells and purified protein. J Biol Chem 276, 48644–48654
17. Bless, N. M., Smith, D., Charlton, J., Czermak, B. J., Schmal, H., Friedl, H. P.,and Ward, P. A. (1997). Protective effects of an aptamer inhibitor of neutrophilelastase in lung inflammatory injury. Curr Biol 7, 877–880
18. Blind, M., Kolanus, W., and Famulok, M. (1999). Cytoplasmic RNA modulatorsof an inside–out signal–transduction cascade. Proc Natl Acad Sci USA 96, 3606–3610
19. Hicke, B. J., Watson, S. R., Koenig, A., Lynott, C. K., Bargatze, R. F., Chang,Y. F., Ringquist, S., Moon-McDermott, L., Jennings, S., Fitzwater, T., et al.(1996). DNA aptamers block L–selectin function in vivo. Inhibition of humanlymphocyte trafficking in SCID mice. J Clin Invest 98, 2688–2692
20. Ostendorf, T., Kunter, U., Grone, H. J., Bahlmann, F., Kawachi, H., Shimizu,F., Koch, K. M., Janjic, N., and Floege, J. (2001). Specific Antagonism of PDGFPrevents Renal Scarring in Experimental Glomerulonephritis. J Am Soc Nephrol12, 909–918
21. Shi, H., Hoffman, B. E., and Lis, J. T. (1999). RNA aptamers as effective proteinantagonists in a multicellular organism. Proc Natl Acad Sci USA 96, 10033–10038
22. Vuyisich, M., and Beal, P. (2002). Controlling protein activity with ligand–regulated RNA aptamers. Chem Biol 9, 907
23. Davis, K. A., Lin, Y., Abrams, B., and Jayasena, S. D. (1998). Staining of cellsurface human CD4 with 2′–F–pyrimidine–containing RNA aptamers for flowcytometry. Nucleic Acids Res 26, 3915–3924
24. Homann, M., and Goringer, H. U. (1999). Combinatorial selection of high affinityRNA ligands to live African trypanosomes. Nucleic Acids Res 27, 2006–2014

15 Photoaptamer Arrays for Proteomics Applications 307
25. Bergan, R., Connell, Y., Fahmy, B., Kyle, E., and Neckers, L. (1994). Aptamericinhibition of p210bcr–abl tyrosine kinase autophosphorylation by oligodeoxynu-cleotides of defined sequence and backbone structure. Nucleic Acids Res 22, 2150–2154
26. Green, L. S., Bell, C., and Janjic, N. (2001). Aptamers as reagents for high–throughput screening. Biotechniques 30, 1094–1096, 1098, 1100 passim
27. Maurel, M. C., Biard, B., Moulinier, C., Braz, D., Nugier, J., Chaumas, I.,Reboud-Ravaux, M., and Decout, J. L. (2002). RNA–acting antibiotics: in-vitroselection of RNA aptamers for the design of new bioactive molecules less sus-ceptible to bacterial resistance. J Pharm Pharmacol 54, 1019–1031
28. Romig, T. S., Bell, C., and Drolet, D. W. (1999). Aptamer affinity chromatog-raphy: combinatorial chemistry applied to protein purification. J Chromatogr BBiomed Sci Appl 731, 275–284
29. Drolet, D. W., Moon-McDermott, L., and Romig, T. S. (1996). An enzyme–linked oligonucleotide assay. Nat Biotechnol 14, 1021–1025
30. Fredriksson, S., Gullberg, M., Jarvius, J., Olsson, C., Pietras, K., Gustafsdottir,S. M., Ostman, A., and Landegren, U. (2002). Protein detection using proximity–dependent DNA ligation assays. Nat Biotechnol 20, 473–477
31. Kato, T., Yano, K., Ikebukuro, K., and Karube, I. (2000). Bioassay of bile acidsusing an enzyme–linked DNA aptamer. Analyst 125, 1371–1373
32. Rye, P. D., and Nustad, K. (2001). Immunomagnetic DNA aptamer assay.Biotechniques 30, 290–292, 294–295
33. Stojanovic, M. N., and Landry, D. W. (2002). Aptamer-Based ColorimetricProbe for Cocaine. J Am Chem Soc 124, 9678-9679
34. Lee, M., and Walt, D. R. (2000). A Fiber–Optic Microarray Biosensor UsingAptamers as Receptors. Anal Biochem 282, 142–146
35. Bridonneau, P., Chang, Y. F., Buvoli, A. V., O’Connell, D., and Parma, D.(1999). Site–directed selection of oligonucleotide antagonists by competitive elu-tion. Antisense Nucleic Acid Drug Dev 9, 1–11
36. Daniels, D. A., Sohal, A. K., Rees, S., and Grisshammer, R. (2002). Generationof RNA aptamers to the G–protein–coupled receptor for neurotensin, NTS–1.Anal Biochem 305, 214–226
37. Kensch, O., Connolly, B. A., Steinhoff, H. J., McGregor, A., Goody, R. S.,and Restle, T. (2000). HIV–1 reverse transcriptase–pseudoknot RNA aptamerinteraction has a binding affinity in the low picomolar range coupled with highspecificity. J Biol Chem 275, 18271–18278
38. O’Connell, D., Koenig, A., Jennings, S., Hicke, B., Han, H. L., Fitzwater, T.,Chang, Y. F., Varki, N., Parma, D., and Varki, A. (1996). Calcium–dependentoligonucleotide antagonists specific for L– selectin. Proc Natl Acad Sci USA 93,5883–5887
39. Rehder, M. A., and McGown, L. B. (2001). Open–tubular capillary electrochro-matography of bovine beta–lactoglobulin variants A and B using an aptamerstationary phase. Electrophoresis 22, 3759–3764
40. Ruckman, J., Green, L. S., Beeson, J., Waugh, S., Gillette, W. L., Henninger,D. D., Claesson-Welsh, L., and Janjic, N. (1998). 2′–Fluoropyrimidine RNA–based aptamers to the 165–amino acid form of vascular endothelial growth factor(VEGF165). Inhibition of receptor binding and VEGF–induced vascular perme-ability through interactions requiring the exon 7–encoded domain. J Biol Chem273, 20556–20567

308 Drew Smith et al.
41. Cox, J. C., and Ellington, A. D. (2001). Automated selection of anti-proteinaptamers. Bioorg Med Chem 9, 2525–2531
42. Cox, J. C., Rajendran, M., Riedel, T., Davidson, E. A., Sooter, L. J., Bayer, T.S., Schmitz-Brown, M., and Ellington, A. D. (2002). Automated acquisition ofaptamer sequences. Comb Chem High Throughput Screen 5, 289–299
43. Gold, L., Zichi, D., Jenison, R., and Schneider, D. WO 00/43534, Method andApparatus for the Automated Generation of Nucleic Acid Ligands Golden, M.C., Collins, B. D., Willis, M. C., and Koch, T. H. (2000). Diagnostic potentialof PhotoSELEX–evolved ssDNA aptamers. J Biotechnol 81, 167–178
44. Golden, M. C., Collins, B. D., Willis, M. C., and Koch, T. H. (2000). Diagnosticpotential of PhotoSELEX-evolved ssDNA aptamers. J Biotechnol 81, 167–178
45. Jensen, K. B., Atkinson, B. L., Willis, M. C., Koch, T. H., and Gold, L. (1995).Using in vitro selection to direct the covalent attachment of human immunode-ficiency virus type 1 Rev protein to high–affinity RNA ligands. Proc Natl AcadSci USA 92, 12220–12224
46. Brody, E. N., and Gold, L. (2000). Aptamers as therapeutic and diagnosticagents. J Biotechnol 74, 5–13
47. Brody, E. N., Willis, M. C., Smith, J. D., Jayasena, S., Zichi, D., and Gold,L. (1999). The use of aptamers in large arrays for molecular diagnostics. MolDiagn 4, 381–388
48. Smith, D., Collins, B. D., Heil, J., and Koch, T. H. (2003). Sensitivity andspecificity of photoaptamer probes. Mol Cell Proteomics 2, 11–18
49. Koch, T., Smith, D., Tabacman, E., and Zichi, D. (2004). Kinetic Analysis ofSite–specific Photoaptamer–Protein Crosslinking. J Mol Biol 336: 1159–1173
50. Meisenheimer, K. M., and Koch, T. H. (1997). Photocrosslinking of nucleic acidsto associated proteins. Crit Rev Biochem Mol Biol 32, 101–140
51. Norris, C. L., Meisenheimer, K. M., and Koch, T. H. (1997). Mechanistic stud-ies relevant to bromouridine enhanced nucleoprotein photocrosslinking. Possibleinvolvement of an excited tyrosine residue of the protein. Photochem Photobiol65, 201–207
52. Charlton, J., and Smith, D. (1999). Estimation of SELEX Pool Size by Mea-surement of DNA Renaturation Rates. RNA 5, 1326–1332
53. Moreno-Bondi, M. C., Alarie, J. P., and Vo-Dinh, T. (2003). Multi–analyte anal-ysis system using an antibody–based biochip. Anal Bioanal Chem 375, 120–124
54. Schweitzer, B., Roberts, S., Grimwade, B., Shao, W., Wang, M., Fu, Q., Shu, Q.,Laroche, I., Zhou, Z., Tchernev, V. T., et al. (2002). Multiplexed protein profilingon microarrays by rolling–circle amplification. Nat Biotechnol 20, 359–365
16
Biological Membrane Microarrays
Ye Fang, Anthony G. Frutos, Yulong Hong, and Joydeep Lahiri
16.1 Introduction
16.1.1 Importance of Membrane Bound Molecules
The cell membrane, in addition to providing a semipermeable barrier, is hostto some of the most important molecules required for cellular function. Thesemolecules can be classified from a molecular perspective into proteins (e.g. Gprotein-coupled receptors (GPCRs), receptor tyrosine kinases, ion–channels)and small molecules (e.g. glycolipids such as gangliosides and phosphatidyli-nositol phosphate (PIP)) [1]. Membrane–bound molecules comprise approxi-mately 50% of all drug targets; methods to study these molecules in multi-plexed, miniaturized formats are of significant interest to the pharmaceuticalindustry [2].
Protein profiling using protein microarrays will presumably circumvent is-sues associated with estimating protein abundance from mRNA levels usingDNA microarrays [3–5]. There is an even more significant application for pro-tein microarrays. Proteins are the molecules against which most drugs aredesigned; therefore, protein microarrays are uniquely well suited for directlydetermining compound binding and selectivity. In traditional drug discovery,compound libraries are tested against an identified ‘target’ to generate ‘hits’;selectivity studies are carried out further downstream, during the progressionof a ‘hit’ to a ‘lead’. One of the primary outcomes of mRNA (or protein)profiling using DNA (or protein) microarrays will be more rapid identificationof putative targets relative to conventional strategies. Therefore, technolo-gies that enable target focused screening will become critical for keeping pacewith the increased rate of target identification. Streamlining the process ofdrug discovery by bridging primary and secondary screening will be essential– protein microarrays, which offer selectivity information naturally, are ideallysuited for meeting this challenge.
Protein arrays are difficult to fabricate because of issues related to main-taining the correctly folded conformations of proteins when immobilized.
310 Ye Fang et al.
The fabrication of membrane microarrays requires several unique consider-ations [6,7]. Unlike DNA or conventional protein arrays, fabricating microar-rays of membranes requires the immobilization of the target and the associ-ated lipids. Membranes on solid supports are unstable and highly susceptibleto degradation when drawn through water–air interfaces [8]. This instability isundesirable as microarray based assays require immersion in different block-ing and washing buffers to minimize non-specific binding. Since individualmolecules are free to diffuse inside biological membranes (‘the fluid mosaicmodel’) [1], covalent immobilization of the entire supported membrane (orthe embedded targets) is undesirable for the fabrication of ‘biomimetic’ mem-brane microarrays. Given these considerations, an ideal surface for membranemicroarrays should seek to maximize the stability of the supported membranewhile enabling lateral diffusion of individual molecules in the membrane. Highstability and lateral fluidity are contradictory in nature; therefore, surfacesthat balance these properties offer a practical compromise. Finally, membraneproteins contain extramembrane domains that must be correctly folded whenimmobilized at a surface; therefore, surfaces that offset the protein from thesurface or those that are porous or deformable must be used [9].
16.1.2 Key Components of the Microarray Assay
A high quality microarray assay depends on optimization of each of the compo-nents that comprise the assay – the substrate with appropriate surface chem-istry, high quality biological materials for printing, a reliable robotic printer,assay reagents, a high resolution fluorescence scanner, and finally, softwarefor image analysis and informatics. The widespread use of DNA microarrayshas resulted in the commercial availability of printers and fluorescence scan-ners. Due to their ready availability and ease of operation, we wanted to usethese instruments for fabricating and reading membrane microarrays. How-ever, previous work on supported membranes had emphasized the need tokeep the supported membrane immersed in buffer (to prevent desorption) [8],which precluded both conventional pin–printing and scanning of slides usingexisting microarray scanners. Previously, membrane arrays were fabricatedby immersion of patterned substrates containing lipid–binding and lipid–nonbinding regions in solutions of lipids. Although bioassays can be performedon such arrays by continuous flow methods, fabrication of arrays containingdifferent immobilized membranes at different locations would require com-plicated fluidics [10]. Given these considerations, our research efforts wereaimed at: (a) developing surface chemistries that resulted in supported mem-branes stable in air; (b) fabricating membrane microarrays by pin printing;(c) demonstrating the feasibility of printing membranes containing membraneproteins and ligands; and (d) developing assays for screening of compoundsagainst membrane microarrays containing proteins or ligands.
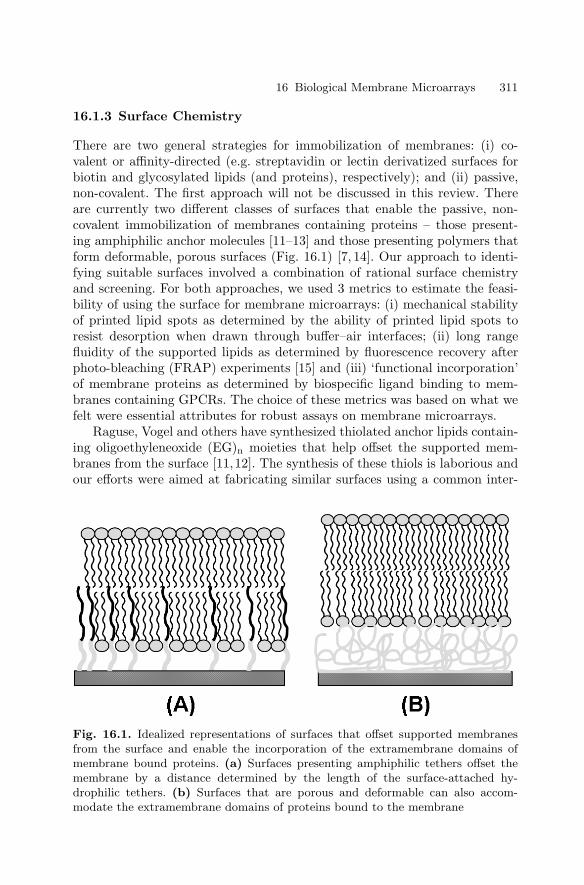
16 Biological Membrane Microarrays 311
16.1.3 Surface Chemistry
There are two general strategies for immobilization of membranes: (i) co-valent or affinity-directed (e.g. streptavidin or lectin derivatized surfaces forbiotin and glycosylated lipids (and proteins), respectively); and (ii) passive,non-covalent. The first approach will not be discussed in this review. Thereare currently two different classes of surfaces that enable the passive, non-covalent immobilization of membranes containing proteins – those present-ing amphiphilic anchor molecules [11–13] and those presenting polymers thatform deformable, porous surfaces (Fig. 16.1) [7, 14]. Our approach to identi-fying suitable surfaces involved a combination of rational surface chemistryand screening. For both approaches, we used 3 metrics to estimate the feasi-bility of using the surface for membrane microarrays: (i) mechanical stabilityof printed lipid spots as determined by the ability of printed lipid spots toresist desorption when drawn through buffer–air interfaces; (ii) long rangefluidity of the supported lipids as determined by fluorescence recovery afterphoto-bleaching (FRAP) experiments [15] and (iii) ‘functional incorporation’of membrane proteins as determined by biospecific ligand binding to mem-branes containing GPCRs. The choice of these metrics was based on what wefelt were essential attributes for robust assays on membrane microarrays.
Raguse, Vogel and others have synthesized thiolated anchor lipids contain-ing oligoethyleneoxide (EG)n moieties that help offset the supported mem-branes from the surface [11,12]. The synthesis of these thiols is laborious andour efforts were aimed at fabricating similar surfaces using a common inter-
Fig. 16.1. Idealized representations of surfaces that offset supported membranesfrom the surface and enable the incorporation of the extramembrane domains ofmembrane bound proteins. (a) Surfaces presenting amphiphilic tethers offset themembrane by a distance determined by the length of the surface-attached hy-drophilic tethers. (b) Surfaces that are porous and deformable can also accom-modate the extramembrane domains of proteins bound to the membrane
312 Ye Fang et al.
mediate approach [16]. We made self-assembled monolayers (SAMs) of hex-adecanoic acid that were activated to form interchain anhydride groups [17];this activated surface was treated with Brij–76–amine to form the desiredfunctionalized SAMs [13]. Arrays of supported lipids were obtained by im-mersion of chips containing patterns of Brij-derivatized SAMs in vesicular so-lutions of phosphatidycholine or by robotic pin printing of the lipids on an un-patterned Brij–presenting surface [18]. When immersed in buffer, the printedlipids stayed confined to the printed regions because of the self–limiting ex-pansion of the lipid microspots [19]. When the lipids used were mixtures ofdipalmitoylphosphatidylcholine (DPPC) and dimyristoylcholine (DMPC), thelipid microspots resisted desorption when withdrawn through air–water inter-faces. Lipid microspots comprising egg–phosphatidylcholine (egg–PC) were,however, not stable on the Brij-derivatized SAMs. DPPC/DMPC lipids arein the gel phase at room temperature while egg PC is in the fluid phase; weare currently uncertain whether the phase of the lipid or issues with insertionof cis-unsaturated lipids in egg–PC causes this decreased stability. The insta-bility of fluid phase lipid microspots on Brij was a concern and we decided toturn to a screening approach for evaluating lipid–binding surfaces.
We investigated the properties of lipids on several surfaces and found thatthose modified with γ–aminopropylsilane (GAPSTM) had the desired prop-erties [7, 9]. Specifically, microspots of both DPPC/DMPC and egg–PC re-mained stably associated with the surface even upon repeated withdrawalsthrough buffer–air interfaces. Second, FRAP experiments revealed that sup-ported lipids on GAPSTMexhibited significant long-range lateral fluidity (ap-proximately 50% was mobile, over the 30 minute course of the experiment).The GAPSTM surface therefore balances high mechanical stability and lateralfluidity. Finally, microarrays of GPCRs printed on GAPSTM slides showedbiospecific binding (see below) to ligands. The physical basis for the inter-action of lipids with GAPSTMis currently unclear – a combination of elec-trostatic, hydrophobic and surface hydration forces are presumably involved.Other amine–presenting surfaces, especially poly(ethyleneimine) (PEI), arealso well suited for the fabrication of microarrays The primary difference be-tween membrane microarrays on GAPSTM and those on PEI is the spot size– microspots on PEI are approximately 3 times bigger than on GAPSTM foridentical lipid compositions and printing conditions (unpublished results). Is-raelachvili and co-workers have also demonstrated the formation of supportedmembranes on PEI [14].
16.1.4 Pin Printing
Our first experiments for arraying membranes were carried out using a quillpin printer [13], and since the printing was successful, we have not investigatedalternative printing technologies. We hypothesize that the use of alternativeprinters should be feasible, although there may be issues with using thermal
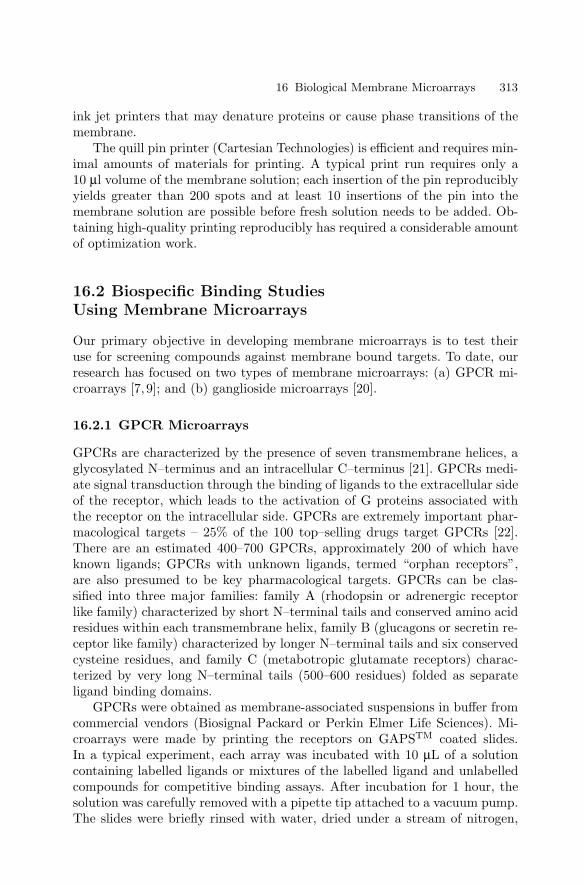
16 Biological Membrane Microarrays 313
ink jet printers that may denature proteins or cause phase transitions of themembrane.
The quill pin printer (Cartesian Technologies) is efficient and requires min-imal amounts of materials for printing. A typical print run requires only a10 µl volume of the membrane solution; each insertion of the pin reproduciblyyields greater than 200 spots and at least 10 insertions of the pin into themembrane solution are possible before fresh solution needs to be added. Ob-taining high-quality printing reproducibly has required a considerable amountof optimization work.
16.2 Biospecific Binding StudiesUsing Membrane Microarrays
Our primary objective in developing membrane microarrays is to test theiruse for screening compounds against membrane bound targets. To date, ourresearch has focused on two types of membrane microarrays: (a) GPCR mi-croarrays [7, 9]; and (b) ganglioside microarrays [20].
16.2.1 GPCR Microarrays
GPCRs are characterized by the presence of seven transmembrane helices, aglycosylated N–terminus and an intracellular C–terminus [21]. GPCRs medi-ate signal transduction through the binding of ligands to the extracellular sideof the receptor, which leads to the activation of G proteins associated withthe receptor on the intracellular side. GPCRs are extremely important phar-macological targets – 25% of the 100 top–selling drugs target GPCRs [22].There are an estimated 400–700 GPCRs, approximately 200 of which haveknown ligands; GPCRs with unknown ligands, termed “orphan receptors”,are also presumed to be key pharmacological targets. GPCRs can be clas-sified into three major families: family A (rhodopsin or adrenergic receptorlike family) characterized by short N–terminal tails and conserved amino acidresidues within each transmembrane helix, family B (glucagons or secretin re-ceptor like family) characterized by longer N–terminal tails and six conservedcysteine residues, and family C (metabotropic glutamate receptors) charac-terized by very long N–terminal tails (500–600 residues) folded as separateligand binding domains.
GPCRs were obtained as membrane-associated suspensions in buffer fromcommercial vendors (Biosignal Packard or Perkin Elmer Life Sciences). Mi-croarrays were made by printing the receptors on GAPSTM coated slides.In a typical experiment, each array was incubated with 10 µL of a solutioncontaining labelled ligands or mixtures of the labelled ligand and unlabelledcompounds for competitive binding assays. After incubation for 1 hour, thesolution was carefully removed with a pipette tip attached to a vacuum pump.The slides were briefly rinsed with water, dried under a stream of nitrogen,
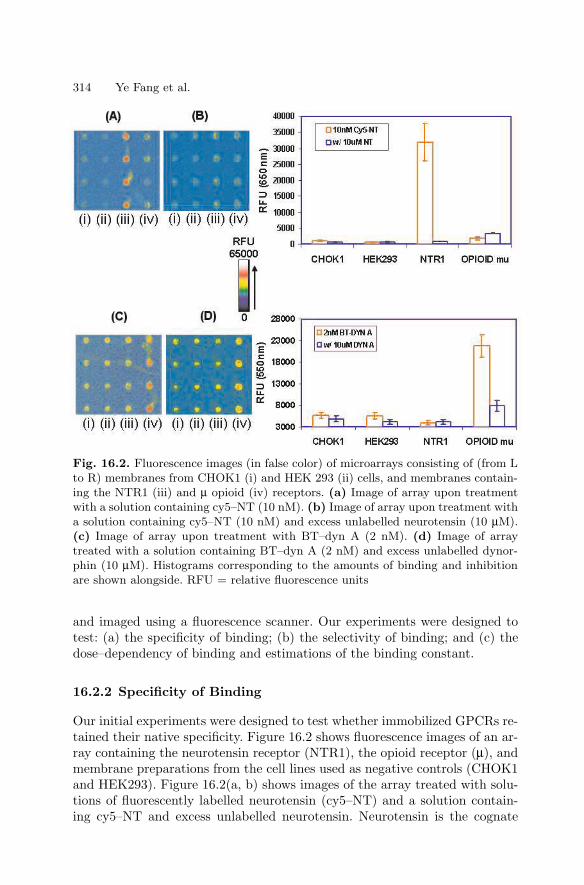
314 Ye Fang et al.
Fig. 16.2. Fluorescence images (in false color) of microarrays consisting of (from Lto R) membranes from CHOK1 (i) and HEK 293 (ii) cells, and membranes contain-ing the NTR1 (iii) and µ opioid (iv) receptors. (a) Image of array upon treatmentwith a solution containing cy5–NT (10 nM). (b) Image of array upon treatment witha solution containing cy5–NT (10 nM) and excess unlabelled neurotensin (10 µM).(c) Image of array upon treatment with BT–dyn A (2 nM). (d) Image of arraytreated with a solution containing BT–dyn A (2 nM) and excess unlabelled dynor-phin (10 µM). Histograms corresponding to the amounts of binding and inhibitionare shown alongside. RFU = relative fluorescence units
and imaged using a fluorescence scanner. Our experiments were designed totest: (a) the specificity of binding; (b) the selectivity of binding; and (c) thedose–dependency of binding and estimations of the binding constant.
16.2.2 Specificity of Binding
Our initial experiments were designed to test whether immobilized GPCRs re-tained their native specificity. Figure 16.2 shows fluorescence images of an ar-ray containing the neurotensin receptor (NTR1), the opioid receptor (µ), andmembrane preparations from the cell lines used as negative controls (CHOK1and HEK293). Figure 16.2(a, b) shows images of the array treated with solu-tions of fluorescently labelled neurotensin (cy5–NT) and a solution contain-ing cy5–NT and excess unlabelled neurotensin. Neurotensin is the cognate
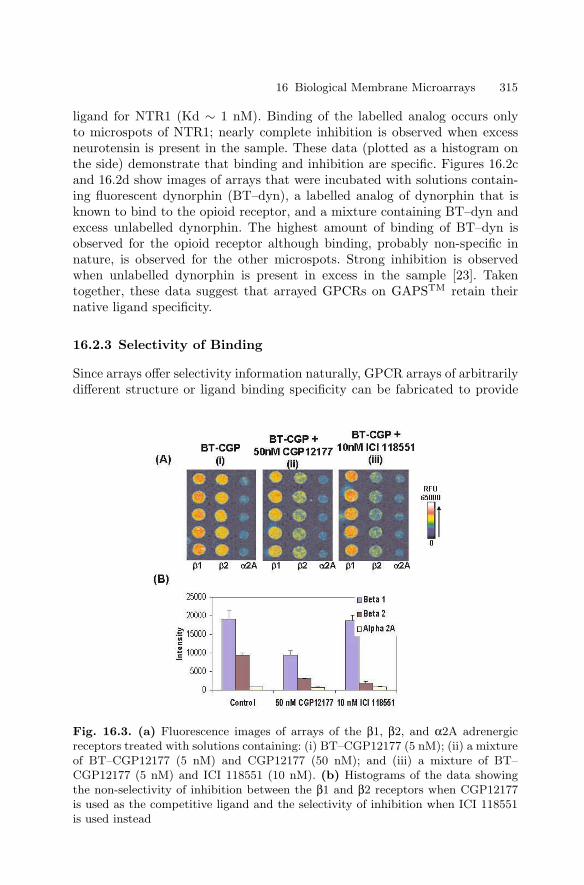
16 Biological Membrane Microarrays 315
ligand for NTR1 (Kd ∼ 1 nM). Binding of the labelled analog occurs onlyto microspots of NTR1; nearly complete inhibition is observed when excessneurotensin is present in the sample. These data (plotted as a histogram onthe side) demonstrate that binding and inhibition are specific. Figures 16.2cand 16.2d show images of arrays that were incubated with solutions contain-ing fluorescent dynorphin (BT–dyn), a labelled analog of dynorphin that isknown to bind to the opioid receptor, and a mixture containing BT–dyn andexcess unlabelled dynorphin. The highest amount of binding of BT–dyn isobserved for the opioid receptor although binding, probably non-specific innature, is observed for the other microspots. Strong inhibition is observedwhen unlabelled dynorphin is present in excess in the sample [23]. Takentogether, these data suggest that arrayed GPCRs on GAPSTM retain theirnative ligand specificity.
16.2.3 Selectivity of Binding
Since arrays offer selectivity information naturally, GPCR arrays of arbitrarilydifferent structure or ligand binding specificity can be fabricated to provide
Fig. 16.3. (a) Fluorescence images of arrays of the β1, β2, and α2A adrenergicreceptors treated with solutions containing: (i) BT–CGP12177 (5 nM); (ii) a mixtureof BT–CGP12177 (5 nM) and CGP12177 (50 nM); and (iii) a mixture of BT–CGP12177 (5 nM) and ICI 118551 (10 nM). (b) Histograms of the data showingthe non-selectivity of inhibition between the β1 and β2 receptors when CGP12177is used as the competitive ligand and the selectivity of inhibition when ICI 118551is used instead
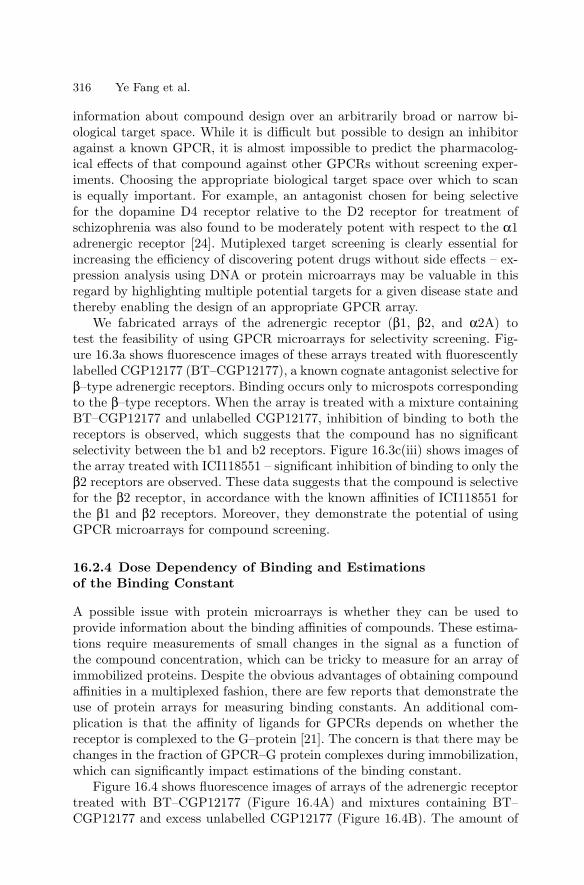
316 Ye Fang et al.
information about compound design over an arbitrarily broad or narrow bi-ological target space. While it is difficult but possible to design an inhibitoragainst a known GPCR, it is almost impossible to predict the pharmacolog-ical effects of that compound against other GPCRs without screening exper-iments. Choosing the appropriate biological target space over which to scanis equally important. For example, an antagonist chosen for being selectivefor the dopamine D4 receptor relative to the D2 receptor for treatment ofschizophrenia was also found to be moderately potent with respect to the α1adrenergic receptor [24]. Mutiplexed target screening is clearly essential forincreasing the efficiency of discovering potent drugs without side effects – ex-pression analysis using DNA or protein microarrays may be valuable in thisregard by highlighting multiple potential targets for a given disease state andthereby enabling the design of an appropriate GPCR array.
We fabricated arrays of the adrenergic receptor (β1, β2, and α2A) totest the feasibility of using GPCR microarrays for selectivity screening. Fig-ure 16.3a shows fluorescence images of these arrays treated with fluorescentlylabelled CGP12177 (BT–CGP12177), a known cognate antagonist selective forβ–type adrenergic receptors. Binding occurs only to microspots correspondingto the β–type receptors. When the array is treated with a mixture containingBT–CGP12177 and unlabelled CGP12177, inhibition of binding to both thereceptors is observed, which suggests that the compound has no significantselectivity between the b1 and b2 receptors. Figure 16.3c(iii) shows images ofthe array treated with ICI118551 – significant inhibition of binding to only theβ2 receptors are observed. These data suggests that the compound is selectivefor the β2 receptor, in accordance with the known affinities of ICI118551 forthe β1 and β2 receptors. Moreover, they demonstrate the potential of usingGPCR microarrays for compound screening.
16.2.4 Dose Dependency of Binding and Estimationsof the Binding Constant
A possible issue with protein microarrays is whether they can be used toprovide information about the binding affinities of compounds. These estima-tions require measurements of small changes in the signal as a function ofthe compound concentration, which can be tricky to measure for an array ofimmobilized proteins. Despite the obvious advantages of obtaining compoundaffinities in a multiplexed fashion, there are few reports that demonstrate theuse of protein arrays for measuring binding constants. An additional com-plication is that the affinity of ligands for GPCRs depends on whether thereceptor is complexed to the G–protein [21]. The concern is that there may bechanges in the fraction of GPCR–G protein complexes during immobilization,which can significantly impact estimations of the binding constant.
Figure 16.4 shows fluorescence images of arrays of the adrenergic receptortreated with BT–CGP12177 (Figure 16.4A) and mixtures containing BT–CGP12177 and excess unlabelled CGP12177 (Figure 16.4B). The amount of
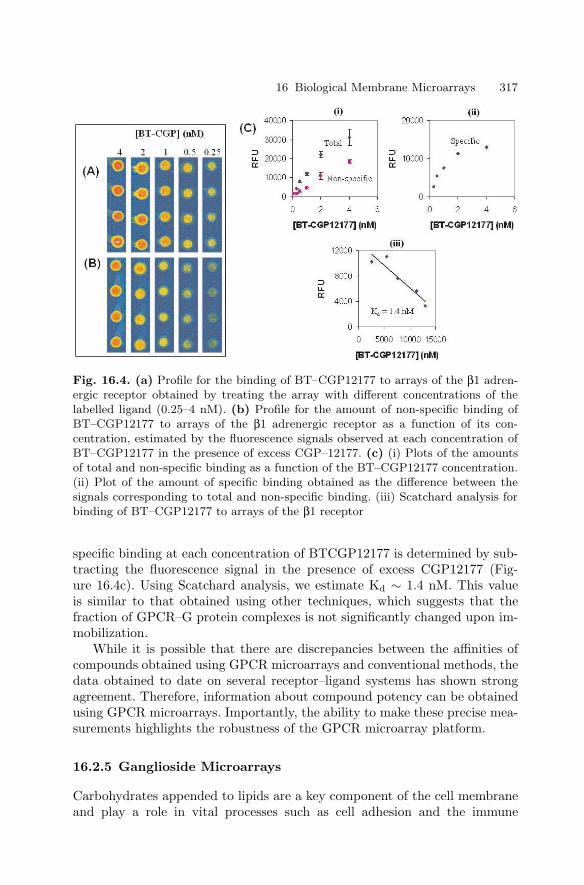
16 Biological Membrane Microarrays 317
Fig. 16.4. (a) Profile for the binding of BT–CGP12177 to arrays of the β1 adren-ergic receptor obtained by treating the array with different concentrations of thelabelled ligand (0.25–4 nM). (b) Profile for the amount of non-specific binding ofBT–CGP12177 to arrays of the β1 adrenergic receptor as a function of its con-centration, estimated by the fluorescence signals observed at each concentration ofBT–CGP12177 in the presence of excess CGP–12177. (c) (i) Plots of the amountsof total and non-specific binding as a function of the BT–CGP12177 concentration.(ii) Plot of the amount of specific binding obtained as the difference between thesignals corresponding to total and non-specific binding. (iii) Scatchard analysis forbinding of BT–CGP12177 to arrays of the β1 receptor
specific binding at each concentration of BTCGP12177 is determined by sub-tracting the fluorescence signal in the presence of excess CGP12177 (Fig-ure 16.4c). Using Scatchard analysis, we estimate Kd ∼ 1.4 nM. This valueis similar to that obtained using other techniques, which suggests that thefraction of GPCR–G protein complexes is not significantly changed upon im-mobilization.
While it is possible that there are discrepancies between the affinities ofcompounds obtained using GPCR microarrays and conventional methods, thedata obtained to date on several receptor–ligand systems has shown strongagreement. Therefore, information about compound potency can be obtainedusing GPCR microarrays. Importantly, the ability to make these precise mea-surements highlights the robustness of the GPCR microarray platform.
16.2.5 Ganglioside Microarrays
Carbohydrates appended to lipids are a key component of the cell membraneand play a role in vital processes such as cell adhesion and the immune
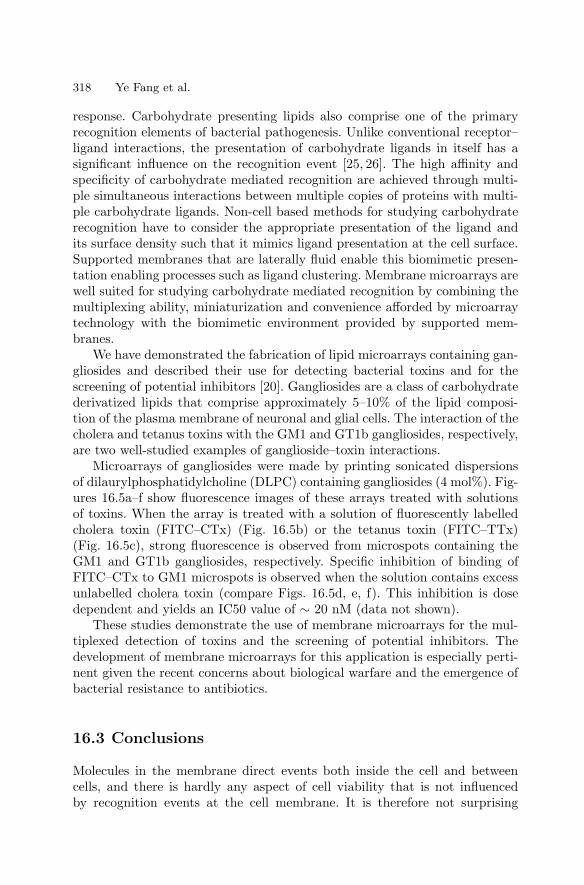
318 Ye Fang et al.
response. Carbohydrate presenting lipids also comprise one of the primaryrecognition elements of bacterial pathogenesis. Unlike conventional receptor–ligand interactions, the presentation of carbohydrate ligands in itself has asignificant influence on the recognition event [25, 26]. The high affinity andspecificity of carbohydrate mediated recognition are achieved through multi-ple simultaneous interactions between multiple copies of proteins with multi-ple carbohydrate ligands. Non-cell based methods for studying carbohydraterecognition have to consider the appropriate presentation of the ligand andits surface density such that it mimics ligand presentation at the cell surface.Supported membranes that are laterally fluid enable this biomimetic presen-tation enabling processes such as ligand clustering. Membrane microarrays arewell suited for studying carbohydrate mediated recognition by combining themultiplexing ability, miniaturization and convenience afforded by microarraytechnology with the biomimetic environment provided by supported mem-branes.
We have demonstrated the fabrication of lipid microarrays containing gan-gliosides and described their use for detecting bacterial toxins and for thescreening of potential inhibitors [20]. Gangliosides are a class of carbohydratederivatized lipids that comprise approximately 5–10% of the lipid composi-tion of the plasma membrane of neuronal and glial cells. The interaction of thecholera and tetanus toxins with the GM1 and GT1b gangliosides, respectively,are two well-studied examples of ganglioside–toxin interactions.
Microarrays of gangliosides were made by printing sonicated dispersionsof dilaurylphosphatidylcholine (DLPC) containing gangliosides (4 mol%). Fig-ures 16.5a–f show fluorescence images of these arrays treated with solutionsof toxins. When the array is treated with a solution of fluorescently labelledcholera toxin (FITC–CTx) (Fig. 16.5b) or the tetanus toxin (FITC–TTx)(Fig. 16.5c), strong fluorescence is observed from microspots containing theGM1 and GT1b gangliosides, respectively. Specific inhibition of binding ofFITC–CTx to GM1 microspots is observed when the solution contains excessunlabelled cholera toxin (compare Figs. 16.5d, e, f). This inhibition is dosedependent and yields an IC50 value of ∼ 20 nM (data not shown).
These studies demonstrate the use of membrane microarrays for the mul-tiplexed detection of toxins and the screening of potential inhibitors. Thedevelopment of membrane microarrays for this application is especially perti-nent given the recent concerns about biological warfare and the emergence ofbacterial resistance to antibiotics.
16.3 Conclusions
Molecules in the membrane direct events both inside the cell and betweencells, and there is hardly any aspect of cell viability that is not influencedby recognition events at the cell membrane. It is therefore not surprising
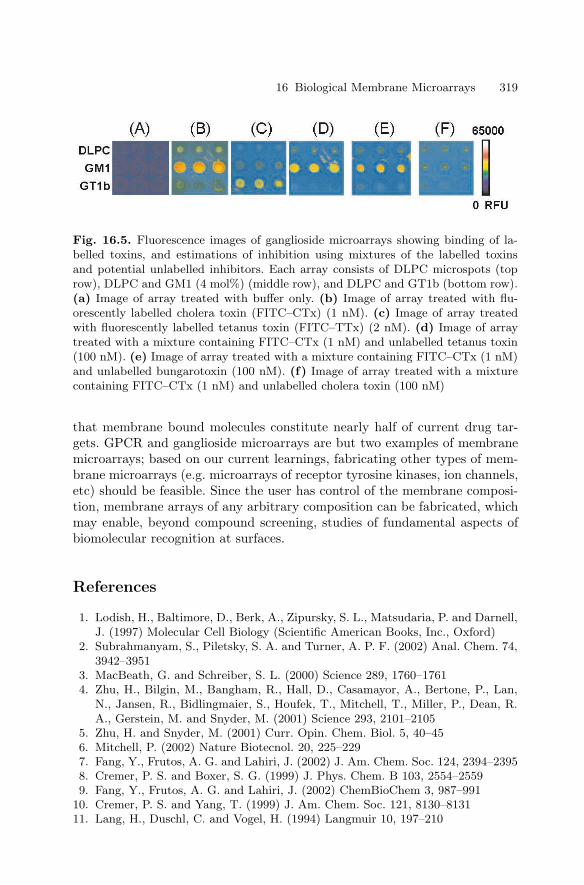
16 Biological Membrane Microarrays 319
Fig. 16.5. Fluorescence images of ganglioside microarrays showing binding of la-belled toxins, and estimations of inhibition using mixtures of the labelled toxinsand potential unlabelled inhibitors. Each array consists of DLPC microspots (toprow), DLPC and GM1 (4 mol%) (middle row), and DLPC and GT1b (bottom row).(a) Image of array treated with buffer only. (b) Image of array treated with flu-orescently labelled cholera toxin (FITC–CTx) (1 nM). (c) Image of array treatedwith fluorescently labelled tetanus toxin (FITC–TTx) (2 nM). (d) Image of arraytreated with a mixture containing FITC–CTx (1 nM) and unlabelled tetanus toxin(100 nM). (e) Image of array treated with a mixture containing FITC–CTx (1 nM)and unlabelled bungarotoxin (100 nM). (f) Image of array treated with a mixturecontaining FITC–CTx (1 nM) and unlabelled cholera toxin (100 nM)
that membrane bound molecules constitute nearly half of current drug tar-gets. GPCR and ganglioside microarrays are but two examples of membranemicroarrays; based on our current learnings, fabricating other types of mem-brane microarrays (e.g. microarrays of receptor tyrosine kinases, ion channels,etc) should be feasible. Since the user has control of the membrane composi-tion, membrane arrays of any arbitrary composition can be fabricated, whichmay enable, beyond compound screening, studies of fundamental aspects ofbiomolecular recognition at surfaces.
References
1. Lodish, H., Baltimore, D., Berk, A., Zipursky, S. L., Matsudaria, P. and Darnell,J. (1997) Molecular Cell Biology (Scientific American Books, Inc., Oxford)
2. Subrahmanyam, S., Piletsky, S. A. and Turner, A. P. F. (2002) Anal. Chem. 74,3942–3951
3. MacBeath, G. and Schreiber, S. L. (2000) Science 289, 1760–17614. Zhu, H., Bilgin, M., Bangham, R., Hall, D., Casamayor, A., Bertone, P., Lan,
N., Jansen, R., Bidlingmaier, S., Houfek, T., Mitchell, T., Miller, P., Dean, R.A., Gerstein, M. and Snyder, M. (2001) Science 293, 2101–2105
5. Zhu, H. and Snyder, M. (2001) Curr. Opin. Chem. Biol. 5, 40–456. Mitchell, P. (2002) Nature Biotecnol. 20, 225–2297. Fang, Y., Frutos, A. G. and Lahiri, J. (2002) J. Am. Chem. Soc. 124, 2394–23958. Cremer, P. S. and Boxer, S. G. (1999) J. Phys. Chem. B 103, 2554–25599. Fang, Y., Frutos, A. G. and Lahiri, J. (2002) ChemBioChem 3, 987–991
10. Cremer, P. S. and Yang, T. (1999) J. Am. Chem. Soc. 121, 8130–813111. Lang, H., Duschl, C. and Vogel, H. (1994) Langmuir 10, 197–210

320 Ye Fang et al.
12. Raguse, B., Braach–Maksvytis, V., Cornell, B. A., King, L. G., Osman, P. D.J., Pace, R. J. and Wieczorek, L. (1998) Langmuir 14, 648–659
13. Lahiri, J., Kalal, P., Frutos, A. G., Jonas, S. J. and Schaeffler, R. (2000) Lang-muir 16, 7805–7810
14. Majewski, J., Wong, J. Y., Park, C. K., Seitz, M., Israelachvili, J. and Smith,G. S. (1998) Biophys. J. 75, 2363–2367
15. Groves, J. T., Ulman, N. and Boxer, S. G. (1997) Science 275, 651–65316. Lahiri, J., Isaacs, L., Tien, J. and Whitesides, G. M. (1999) Anal. Chem. 71,
777–79017. Yan, L., Marzolin, C., Terfort, A. and Whitesides, G. M. (1997) Langmuir 13,
6704–671218. Lahiri, J., Jonas, S. J., Frutos, A. G., Kalal, P. and Fang, Y. (2001) Biomed.
Microdevices 3, 157–16419. Hovis, J. and Boxer, S. G. (2000) Langmuir 16, 894–89720. Fang, Y., Frutos, A. G. and Lahiri, J. Langmuir, (2003) Langmuir 19, 1500-150521. Haga, T. and Berstein, G. (1999) in CRC Methods in Signal Transduction Series
(CRC Press, Boca Raton, FL)22. Klabunde, T. and Hessler, G. (2002) ChemBioChem 3, 928–94423. Bell, K. M. and Traynor, J. R. (1998) Can. J. Physiol. Pharmacol. 76, 325–33324. Hendrix, J. A., Shimshock, S. J., Shutske, G. M., Tomer IV, J. D., Kapples,
K. J., Palermo, M. G., Corbett, T. J., Vargas, H. M., Kafka, S., Brooks, K.M., Laws-Ricker, L., Leee, D. K. H., Lannoy, I. d., Bordeleau, M., Rizkalla, G.,Owolabi, J. and Kamboj, R. K. (2002) ChemBioChem 3, 999–1009
25. Mammen, M., Seok-Ki, C. and Whitesides, G. M. (1998) Angew. Chem. Int.Ed. 37, 2755–2794
26. Liang, R., Loebach, J., Horan, N., Ge, M., Thompson, C., Yan, L. and Kahne,D. (1997) Proc. Natl. Acad. Sci. U. S. A. 94, 10554–10559

Part IV
Cell & Tissue Microarrays
17
Use of Reporter Systemsfor Reverse Transfection Cell Arrays
Brian L. Webb
17.1 Introduction
The ability to transfer exogenous recombinant genes into cultured mammaliancells has revolutionized the study of gene function and gene regulation [1].Originally, the ability of viruses to transmit their genetic material across theplasma membrane of target cells was exploited as the means to shuttle desiredgenes into cells. Due to the highly efficient nature of viral infection, highjack-ing the viral genome with a desired recombinant gene of interest results inexpression of the desired protein in nearly all target cells [2]. However, themulti–step process required to develop recombinant viruses as well as biosafetyissues led to the development of more convenient means of gene transfer. Avariety of DNA transfection methods were the result. One method involvesthe use of diethylaminoethyl (DEAE)–dextran, a positively charged dextranmolecule that interacts with the negatively charged phosphate backbone ofDNA. DNA–DEAE dextran complexes can adsorb onto the cell surface andcan be taken up by endocytosis, leading to the in vivo expression of the tar-get gene [3]. Another method involves mixing calcium chloride, DNA, andphosphate buffer to produce small, insoluble particles of calcium phosphatecontaining entrapped DNA [4–6]. These DNA–calcium phosphate complexessettle onto adherent cultured cells and are taken up by phagocytosis. Perhapsthe easiest and thus most popular transfection method to date involves usingcationic lipid reagents [7–9]. Cationic lipids, such as Lipofectamine, form unil-amellar vesicles in an aqueous environment [10]. Positively charged cationiclipid vesicles bind to negatively charged DNA, forming liposome–DNA com-plexes. These complexes can be taken up by mammalian cells by endocytosis.Thus, conventional transfections are performed by mixing DNA with a trans-fection reagent to form DNA complexes and then adding these complexes ontotarget cells attached to a growth support surface. Optimization of lipid com-positions have yielded lipid reagents with low toxicity and high transfectionefficiencies in a wide range of eukaryotic cells.
324 Brian L. Webb
Expression of exogenous genes using DNA transfection has enabled thestudy of gene function in vivo. For example, the function of unknown genescan be discovered by examining the effect of their overexpression in trans-fected cells using a variety of cell-based assays. This approach has led to theidentification of many novel drug targets. However, the incredible speed ofgene cloning and sequencing brought about by the genomic revolution hasoutpaced conventional gene discovery approaches in the pharmaceutical in-dustry. One potential answer to this challenge is reverse transfection, a highthroughput gene expression method for examining the function of hundredsto thousands of genes in parallel.
The notion of performing surface-mediated transfection was first describedby Paulson et al. [11]. As contact between DNA and the target cells is a re-quirement for successful transfection, Paulson and coworkers suggested im-mobilizing the DNA particles onto a cell growth surface prior to attachingthe target cells. Subsequent addition and attachment of target cells to theDNA-loaded surface can lead to higher probability of cell–DNA contact, po-tentially leading to higher transfection efficiencies. More recently, the appealof performing DNA transfections off a solid surface for gene therapy applica-tions has lead to numerous reports of surface-mediated transfection, on suchsurfaces as biodegradable polymers and modified silica nanoparticles [12, 13].Two groups recognized the potential of merging surface-mediated transfectiontechnology with DNA microarray technology. Genova Pharmaceuticals filed apatent application on a method of simultaneously screening large numbers ofgenes using surface-mediated transfection of arrayed libraries of cDNAs [14].Immobilization of individual cDNA clones in unique locations on a surface wasachieved using hybridization to arrayed oligo linkers. Simultaneous transfec-tion of the arrayed cDNA library would thus generate patches of transfectedcells which could be screened for any desired gene function using cell-basedor biochemical assays.
A more straightforward immobilization approach was described by Zhaudinand Sabatini, who coined the phrase “reverse transfection” to describe surface-mediated transfection of cDNAs spotted in an array format on a cell growthsurface by a conventional arrayer [15]. Following treatment with a transfectionreagent, the surface is overlayed with adherent cells, which become transfectedin patches with the various cDNAs. The term “reverse” was used because theorder of addition of the target cells and DNA to the surface is reversed com-pared to conventional transfection techniques. Although a uniform lawn ofmammalian cells is cultured on the array surface, only those cells that ad-here to the spots of arrayed DNA become transfected, producing localizedpatches of transfected cells each expressing a unique protein. As with theGenova method, the array of transfected cell clusters produced by reversetransfection can be used for high throughput analysis of gene function.
Transfection cell arrays can be viewed as specialized protein microarrays,with several key advantages. First, the proteins to be studied can be expressedand characterized in their native cellular environment as opposed to being
17 Use of Reporter Systems for Reverse Transfection Cell Arrays 325
isolated proteins immobilized on a surface. Second, proteins which may bedifficult to purify, such as membrane-associated proteins, can be studied usingtransfection arrays. And third, the shelf life of transfection arrays followingfabrication is very long, since they are essentially immobilized DNA spots untilsubsequent addition of mammalian cells, compared to the uncertain stabilityof immobilized purified proteins.
Zhiauddin and Sabatini have published a detailed protocol for producingtransfection arrays, which is available on the internet (http://staffa.wi.mit.edu/sabatini public/reverse transfection.htm). One limitation of this reverse trans-fection technology as described by Zhiauddin and Sabatini is the need forextensive post-transfection processing of the array to detect protein activity,including fixing and permeabilizing the cells and multiple antibody incuba-tion steps. At Corning we have investigated the use of reporter constructsco-transfected along with other genes of interest as a convenient means tomonitor and screen gene function on reverse transfection microarrays. Re-porter systems are commonly used for conventional transfections as a meansto monitor the activity of transfected proteins. We have demonstrated theusefulness of reporter systems for assessing the activity of putative signalingproteins produced by reverse transfection. Thus, the focus of this chapter willbe a description of how to use reporter constructs for reverse transfection mi-croarray assays. The reverse transfection protocol we use is essentially thatdescribed by Zhiauddin and Sabatini except that it was modified to includethe co-transfection of a reporter plasmid.
17.2 Reporter Systems for Reverse Transfection
Signal transduction is essential for cellular proliferation, differentiation, andregulation of key cellular activities inside the cell. It is the process by whichextracellular signals are transmitted through the membrane via receptors intothe nucleus to trigger transcriptional responses. Enhancer elements withinpromoters are the convergent points for the majority of signal transductionpathways. AP–1, CRE, SRE, NF–kB and SRF binding elements are exam-ples of enhancer elements contained within promoters that are responsive tovarious signaling pathways [16]. Incorporation of these elements into reportersystems represents a simple and rapid means for assessment of the in vivoactivation of these pathways. A host of reporters linked to enhancer elementshave been developed, including luciferase, secreted alkaline phosphatase, chlo-ramphenicol acetyltransferase (CAT), β–galactosidase, and green fluorescentprotein (GFP) [17]. Assays are performed by co-transfection of a reporter witha gene of interest into a target cell line. Activation of the reporter indicates in-volvement of the gene of interest in that particular signaling pathway. Thus,the activity of unknown genes can be screened conveniently using reporteractivation as a read-out.
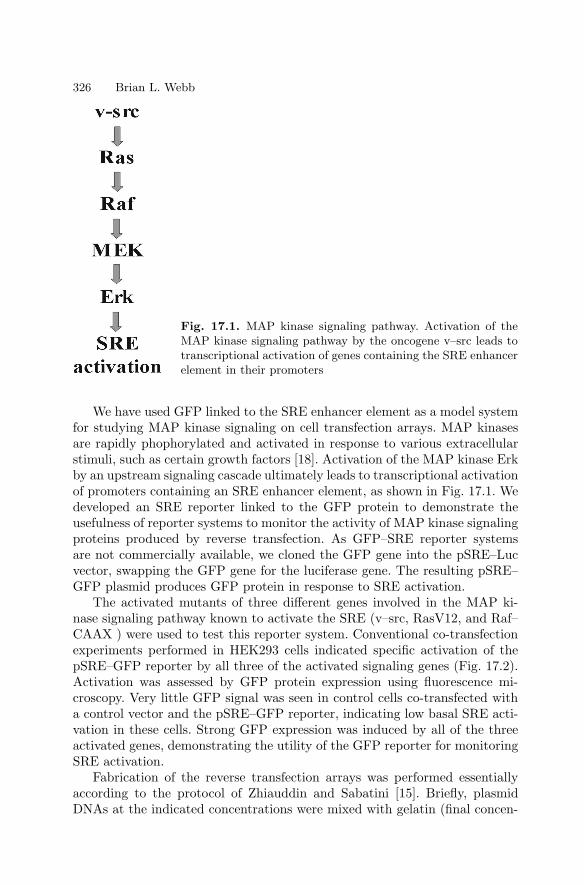
326 Brian L. Webb
Fig. 17.1. MAP kinase signaling pathway. Activation of theMAP kinase signaling pathway by the oncogene v–src leads totranscriptional activation of genes containing the SRE enhancerelement in their promoters
We have used GFP linked to the SRE enhancer element as a model systemfor studying MAP kinase signaling on cell transfection arrays. MAP kinasesare rapidly phophorylated and activated in response to various extracellularstimuli, such as certain growth factors [18]. Activation of the MAP kinase Erkby an upstream signaling cascade ultimately leads to transcriptional activationof promoters containing an SRE enhancer element, as shown in Fig. 17.1. Wedeveloped an SRE reporter linked to the GFP protein to demonstrate theusefulness of reporter systems to monitor the activity of MAP kinase signalingproteins produced by reverse transfection. As GFP–SRE reporter systemsare not commercially available, we cloned the GFP gene into the pSRE–Lucvector, swapping the GFP gene for the luciferase gene. The resulting pSRE–GFP plasmid produces GFP protein in response to SRE activation.
The activated mutants of three different genes involved in the MAP ki-nase signaling pathway known to activate the SRE (v–src, RasV12, and Raf–CAAX ) were used to test this reporter system. Conventional co-transfectionexperiments performed in HEK293 cells indicated specific activation of thepSRE–GFP reporter by all three of the activated signaling genes (Fig. 17.2).Activation was assessed by GFP protein expression using fluorescence mi-croscopy. Very little GFP signal was seen in control cells co-transfected witha control vector and the pSRE–GFP reporter, indicating low basal SRE acti-vation in these cells. Strong GFP expression was induced by all of the threeactivated genes, demonstrating the utility of the GFP reporter for monitoringSRE activation.
Fabrication of the reverse transfection arrays was performed essentiallyaccording to the protocol of Zhiauddin and Sabatini [15]. Briefly, plasmidDNAs at the indicated concentrations were mixed with gelatin (final concen-
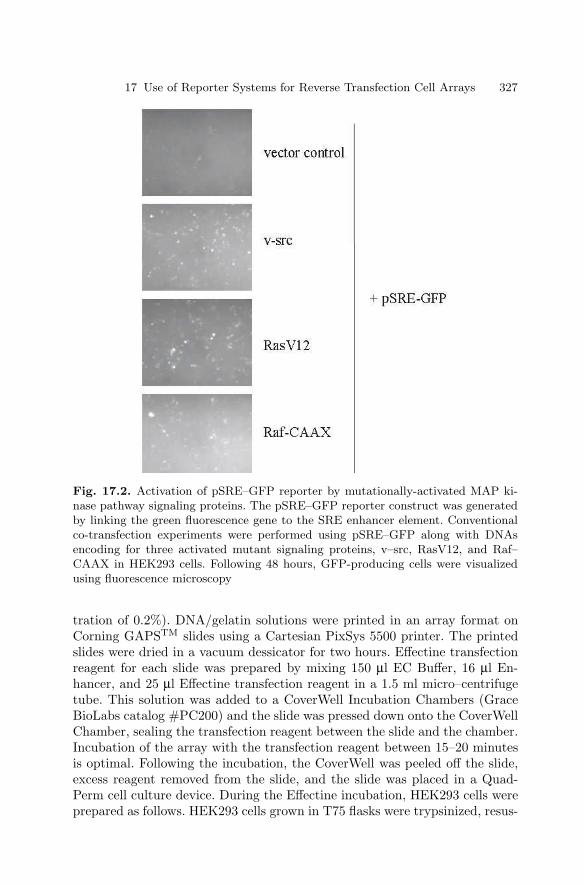
17 Use of Reporter Systems for Reverse Transfection Cell Arrays 327
Fig. 17.2. Activation of pSRE–GFP reporter by mutationally-activated MAP ki-nase pathway signaling proteins. The pSRE–GFP reporter construct was generatedby linking the green fluorescence gene to the SRE enhancer element. Conventionalco-transfection experiments were performed using pSRE–GFP along with DNAsencoding for three activated mutant signaling proteins, v–src, RasV12, and Raf–CAAX in HEK293 cells. Following 48 hours, GFP-producing cells were visualizedusing fluorescence microscopy
tration of 0.2%). DNA/gelatin solutions were printed in an array format onCorning GAPSTM slides using a Cartesian PixSys 5500 printer. The printedslides were dried in a vacuum dessicator for two hours. Effectine transfectionreagent for each slide was prepared by mixing 150 µl EC Buffer, 16 µl En-hancer, and 25 µl Effectine transfection reagent in a 1.5 ml micro–centrifugetube. This solution was added to a CoverWell Incubation Chambers (GraceBioLabs catalog #PC200) and the slide was pressed down onto the CoverWellChamber, sealing the transfection reagent between the slide and the chamber.Incubation of the array with the transfection reagent between 15–20 minutesis optimal. Following the incubation, the CoverWell was peeled off the slide,excess reagent removed from the slide, and the slide was placed in a Quad-Perm cell culture device. During the Effectine incubation, HEK293 cells wereprepared as follows. HEK293 cells grown in T75 flasks were trypsinized, resus-
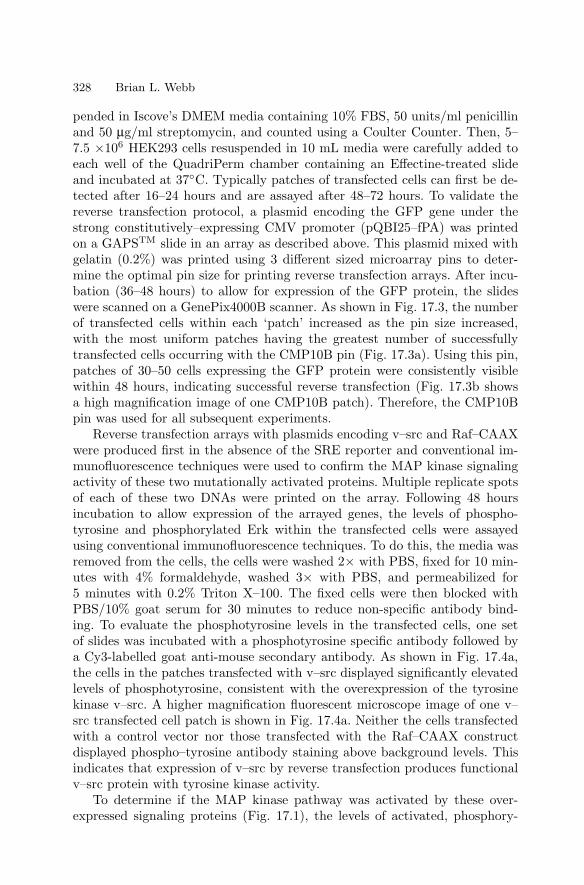
328 Brian L. Webb
pended in Iscove’s DMEM media containing 10% FBS, 50 units/ml penicillinand 50 µg/ml streptomycin, and counted using a Coulter Counter. Then, 5–7.5 ×10⁶ HEK293 cells resuspended in 10 mL media were carefully added toeach well of the QuadriPerm chamber containing an Effectine-treated slideand incubated at 37C. Typically patches of transfected cells can first be de-tected after 16–24 hours and are assayed after 48–72 hours. To validate thereverse transfection protocol, a plasmid encoding the GFP gene under thestrong constitutively–expressing CMV promoter (pQBI25–fPA) was printedon a GAPSTM slide in an array as described above. This plasmid mixed withgelatin (0.2%) was printed using 3 different sized microarray pins to deter-mine the optimal pin size for printing reverse transfection arrays. After incu-bation (36–48 hours) to allow for expression of the GFP protein, the slideswere scanned on a GenePix4000B scanner. As shown in Fig. 17.3, the numberof transfected cells within each ‘patch’ increased as the pin size increased,with the most uniform patches having the greatest number of successfullytransfected cells occurring with the CMP10B pin (Fig. 17.3a). Using this pin,patches of 30–50 cells expressing the GFP protein were consistently visiblewithin 48 hours, indicating successful reverse transfection (Fig. 17.3b showsa high magnification image of one CMP10B patch). Therefore, the CMP10Bpin was used for all subsequent experiments.
Reverse transfection arrays with plasmids encoding v–src and Raf–CAAXwere produced first in the absence of the SRE reporter and conventional im-munofluorescence techniques were used to confirm the MAP kinase signalingactivity of these two mutationally activated proteins. Multiple replicate spotsof each of these two DNAs were printed on the array. Following 48 hoursincubation to allow expression of the arrayed genes, the levels of phospho-tyrosine and phosphorylated Erk within the transfected cells were assayedusing conventional immunofluorescence techniques. To do this, the media wasremoved from the cells, the cells were washed 2× with PBS, fixed for 10 min-utes with 4% formaldehyde, washed 3× with PBS, and permeabilized for5 minutes with 0.2% Triton X–100. The fixed cells were then blocked withPBS/10% goat serum for 30 minutes to reduce non-specific antibody bind-ing. To evaluate the phosphotyrosine levels in the transfected cells, one setof slides was incubated with a phosphotyrosine specific antibody followed bya Cy3-labelled goat anti-mouse secondary antibody. As shown in Fig. 17.4a,the cells in the patches transfected with v–src displayed significantly elevatedlevels of phosphotyrosine, consistent with the overexpression of the tyrosinekinase v–src. A higher magnification fluorescent microscope image of one v–src transfected cell patch is shown in Fig. 17.4a. Neither the cells transfectedwith a control vector nor those transfected with the Raf–CAAX constructdisplayed phospho–tyrosine antibody staining above background levels. Thisindicates that expression of v–src by reverse transfection produces functionalv–src protein with tyrosine kinase activity.
To determine if the MAP kinase pathway was activated by these over-expressed signaling proteins (Fig. 17.1), the levels of activated, phosphory-
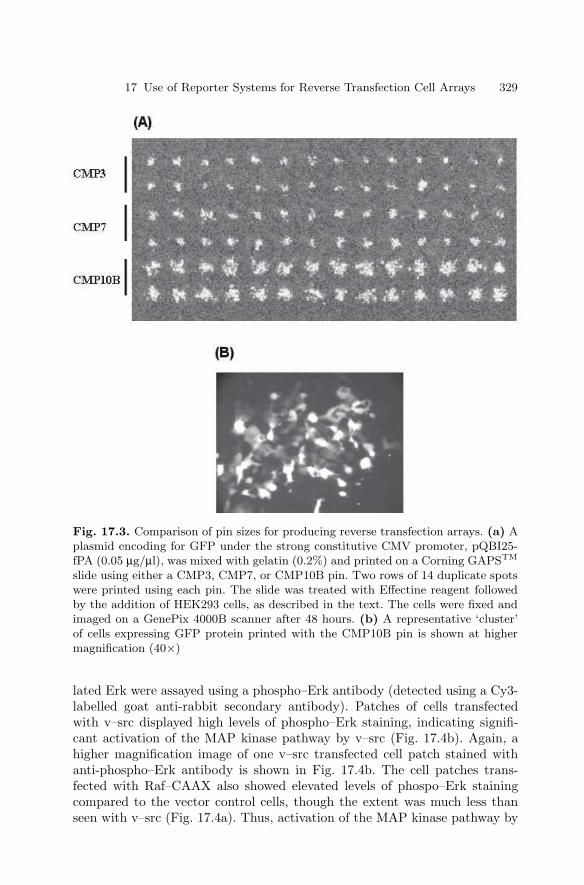
17 Use of Reporter Systems for Reverse Transfection Cell Arrays 329
Fig. 17.3. Comparison of pin sizes for producing reverse transfection arrays. (a) Aplasmid encoding for GFP under the strong constitutive CMV promoter, pQBI25-fPA (0.05 µg/µl), was mixed with gelatin (0.2%) and printed on a Corning GAPSTM
slide using either a CMP3, CMP7, or CMP10B pin. Two rows of 14 duplicate spotswere printed using each pin. The slide was treated with Effectine reagent followedby the addition of HEK293 cells, as described in the text. The cells were fixed andimaged on a GenePix 4000B scanner after 48 hours. (b) A representative ‘cluster’of cells expressing GFP protein printed with the CMP10B pin is shown at highermagnification (40×)
lated Erk were assayed using a phospho–Erk antibody (detected using a Cy3-labelled goat anti-rabbit secondary antibody). Patches of cells transfectedwith v–src displayed high levels of phospho–Erk staining, indicating signifi-cant activation of the MAP kinase pathway by v–src (Fig. 17.4b). Again, ahigher magnification image of one v–src transfected cell patch stained withanti-phospho–Erk antibody is shown in Fig. 17.4b. The cell patches trans-fected with Raf–CAAX also showed elevated levels of phospo–Erk stainingcompared to the vector control cells, though the extent was much less thanseen with v–src (Fig. 17.4a). Thus, activation of the MAP kinase pathway by
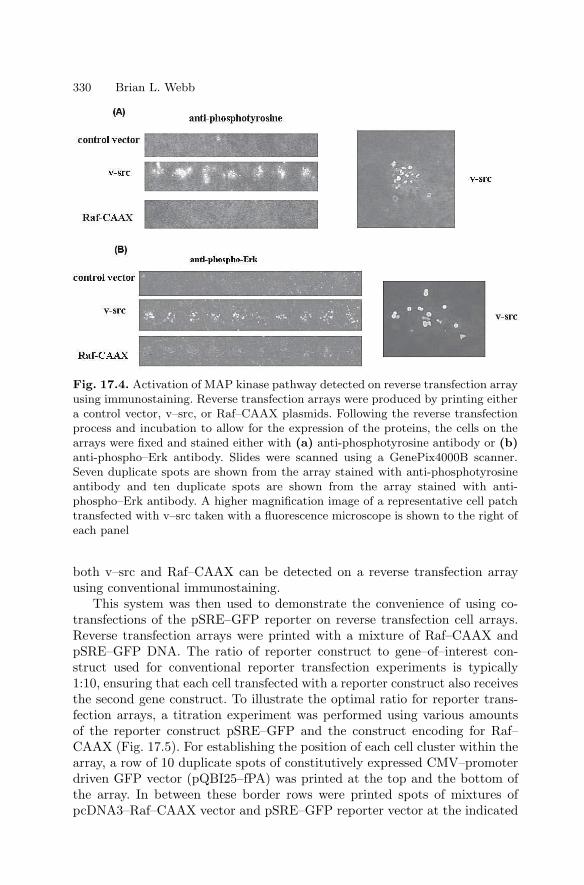
330 Brian L. Webb
Fig. 17.4. Activation of MAP kinase pathway detected on reverse transfection arrayusing immunostaining. Reverse transfection arrays were produced by printing eithera control vector, v–src, or Raf–CAAX plasmids. Following the reverse transfectionprocess and incubation to allow for the expression of the proteins, the cells on thearrays were fixed and stained either with (a) anti-phosphotyrosine antibody or (b)anti-phospho–Erk antibody. Slides were scanned using a GenePix4000B scanner.Seven duplicate spots are shown from the array stained with anti-phosphotyrosineantibody and ten duplicate spots are shown from the array stained with anti-phospho–Erk antibody. A higher magnification image of a representative cell patchtransfected with v–src taken with a fluorescence microscope is shown to the right ofeach panel
both v–src and Raf–CAAX can be detected on a reverse transfection arrayusing conventional immunostaining.
This system was then used to demonstrate the convenience of using co-transfections of the pSRE–GFP reporter on reverse transfection cell arrays.Reverse transfection arrays were printed with a mixture of Raf–CAAX andpSRE–GFP DNA. The ratio of reporter construct to gene–of–interest con-struct used for conventional reporter transfection experiments is typically1:10, ensuring that each cell transfected with a reporter construct also receivesthe second gene construct. To illustrate the optimal ratio for reporter trans-fection arrays, a titration experiment was performed using various amountsof the reporter construct pSRE–GFP and the construct encoding for Raf–CAAX (Fig. 17.5). For establishing the position of each cell cluster within thearray, a row of 10 duplicate spots of constitutively expressed CMV–promoterdriven GFP vector (pQBI25–fPA) was printed at the top and the bottom ofthe array. In between these border rows were printed spots of mixtures ofpcDNA3–Raf–CAAX vector and pSRE–GFP reporter vector at the indicated
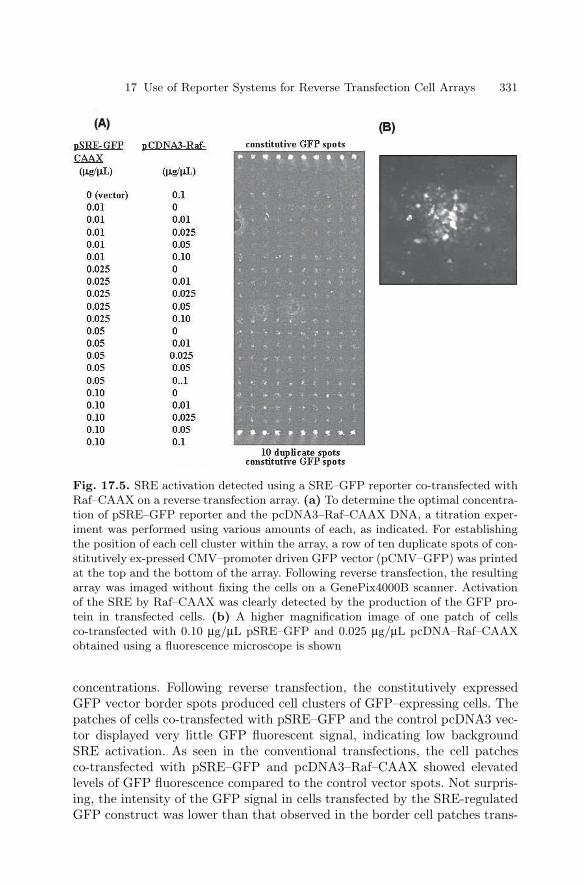
17 Use of Reporter Systems for Reverse Transfection Cell Arrays 331
Fig. 17.5. SRE activation detected using a SRE–GFP reporter co-transfected withRaf–CAAX on a reverse transfection array. (a) To determine the optimal concentra-tion of pSRE–GFP reporter and the pcDNA3–Raf–CAAX DNA, a titration exper-iment was performed using various amounts of each, as indicated. For establishingthe position of each cell cluster within the array, a row of ten duplicate spots of con-stitutively ex-pressed CMV–promoter driven GFP vector (pCMV–GFP) was printedat the top and the bottom of the array. Following reverse transfection, the resultingarray was imaged without fixing the cells on a GenePix4000B scanner. Activationof the SRE by Raf–CAAX was clearly detected by the production of the GFP pro-tein in transfected cells. (b) A higher magnification image of one patch of cellsco-transfected with 0.10 µg/µL pSRE–GFP and 0.025 µg/µL pcDNA–Raf–CAAXobtained using a fluorescence microscope is shown
concentrations. Following reverse transfection, the constitutively expressedGFP vector border spots produced cell clusters of GFP–expressing cells. Thepatches of cells co-transfected with pSRE–GFP and the control pcDNA3 vec-tor displayed very little GFP fluorescent signal, indicating low backgroundSRE activation. As seen in the conventional transfections, the cell patchesco-transfected with pSRE–GFP and pcDNA3–Raf–CAAX showed elevatedlevels of GFP fluorescence compared to the control vector spots. Not surpris-ing, the intensity of the GFP signal in cells transfected by the SRE-regulatedGFP construct was lower than that observed in the border cell patches trans-
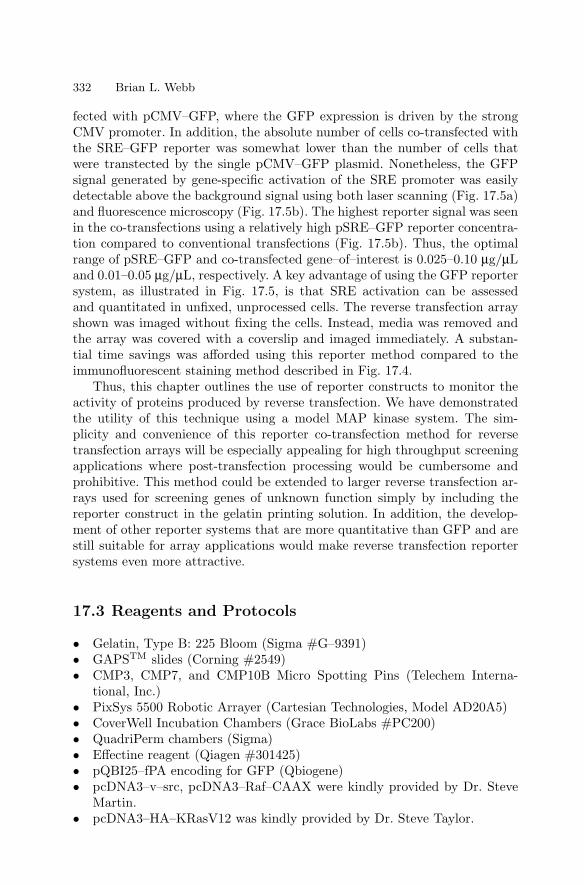
332 Brian L. Webb
fected with pCMV–GFP, where the GFP expression is driven by the strongCMV promoter. In addition, the absolute number of cells co-transfected withthe SRE–GFP reporter was somewhat lower than the number of cells thatwere transtected by the single pCMV–GFP plasmid. Nonetheless, the GFPsignal generated by gene-specific activation of the SRE promoter was easilydetectable above the background signal using both laser scanning (Fig. 17.5a)and fluorescence microscopy (Fig. 17.5b). The highest reporter signal was seenin the co-transfections using a relatively high pSRE–GFP reporter concentra-tion compared to conventional transfections (Fig. 17.5b). Thus, the optimalrange of pSRE–GFP and co-transfected gene–of–interest is 0.025–0.10 µg/µLand 0.01–0.05 µg/µL, respectively. A key advantage of using the GFP reportersystem, as illustrated in Fig. 17.5, is that SRE activation can be assessedand quantitated in unfixed, unprocessed cells. The reverse transfection arrayshown was imaged without fixing the cells. Instead, media was removed andthe array was covered with a coverslip and imaged immediately. A substan-tial time savings was afforded using this reporter method compared to theimmunofluorescent staining method described in Fig. 17.4.
Thus, this chapter outlines the use of reporter constructs to monitor theactivity of proteins produced by reverse transfection. We have demonstratedthe utility of this technique using a model MAP kinase system. The sim-plicity and convenience of this reporter co-transfection method for reversetransfection arrays will be especially appealing for high throughput screeningapplications where post-transfection processing would be cumbersome andprohibitive. This method could be extended to larger reverse transfection ar-rays used for screening genes of unknown function simply by including thereporter construct in the gelatin printing solution. In addition, the develop-ment of other reporter systems that are more quantitative than GFP and arestill suitable for array applications would make reverse transfection reportersystems even more attractive.
17.3 Reagents and Protocols
• Gelatin, Type B: 225 Bloom (Sigma #G–9391)• GAPSTM slides (Corning #2549)• CMP3, CMP7, and CMP10B Micro Spotting Pins (Telechem Interna-
tional, Inc.)• PixSys 5500 Robotic Arrayer (Cartesian Technologies, Model AD20A5)• CoverWell Incubation Chambers (Grace BioLabs #PC200)• QuadriPerm chambers (Sigma)• Effectine reagent (Qiagen #301425)• pQBI25–fPA encoding for GFP (Qbiogene)• pcDNA3–v–src, pcDNA3–Raf–CAAX were kindly provided by Dr. Steve
Martin.• pcDNA3–HA–KRasV12 was kindly provided by Dr. Steve Taylor.
17 Use of Reporter Systems for Reverse Transfection Cell Arrays 333
• pSRE–Luc (Stratagene)• Antibodies used for immunofluoresence (Phospho–Tyrosine Monoclonal
Antibody (P–Tyr–100) #9411 and Phospho–p44/42 MAP Kinase (Thr202/Tyr204) Antibody #9101 ) were from Cell Signaling.
Preparation of gelatin solutions and transfection array slides were per-formed according to the published protocol of Zhiauddin and Sabatini (http://staffa.wi.mit.edu/sabatini public/reverse transfection.htm).
We used a PixSys5500 Robotic Arrayer with Telechem’s ArrayIt CMP10Bpins to print the DNA/gelatin solutions. The size of the printed DNA spotsusing this pin was approximately 250 µm and the spots were printed 600 µmapart.
References
1. Ravid, K. and Freshney, R.I., ed. (1998) DNA Transfer to Cultured Cells, Wiley-Liss, New York
2. Ausubel, F.M. et al. eds. (1991) Current protocols in molecular biology, NewYork, Wiley Interscience
3. Vaheri, A. and Pagano, J.S. (1965). Virology 27, 4344. Graham, F.L., and Ven der Eb, A.J. (1973) Virology 52, 456–4675. Chen, C., and Okayama, H. (1987) Mol. Cell. Biol. 7, 27456. Wigler, M., Silverstein, S., Lee, L.S., Pellicer, A., Cheng, Y.C., and Axel, R.
(1977) Cell 11, 2237. Felgner, P.L. et al. (1987). Proc. Natl. Acad. Sci. USA 84, 74138. Lasic, D.D., ed.(1997) Lipsosomes in Gene Therapy, CRC Press, New York9. Felgner, P.L., Gadek, T.R., Holm, M., Roman, R., Chan H.W., Wenz, M.,
Northrop, J.P., Ringold, G.M., and Danielsen M. (1987) Proc Natl Acad SciUSA 84, 7413–7417
10. Hawley-Nelson, P., Ciccarone, V., Gebeyehu, G., Jessee, J., and Felgner, P.L.(1993) Focus 15, 73–78
11. Paulson, B. O., Clarke, M. F., anc Chuck, S.Y. United States Patent 5, 811, 27412. Zheng, J., Manuel, W. S., and Hornsby, P. J. Biotehnol. Prog. (2000) 16, 254–25713. Kneuer, C., Sameti, M., Haltner, E.G., Schiestel, T., Schirra, H., Schmidt, H.,
and Lehr, C. Int. J. Pharm. (2000) 196, 257–26114. Cen, H., and Sun, S., WO 99/5588615. Ziauddin, J. and Sabatini, D.M. Nature (2001) 411, 107–11016. Cochran B.H. (1993) NIDA Res Monogr 125, 3–2417. Alam, J., and Cook, J.L. (1990) Anal Biochem 188, 245–25418. Lange-Carter, C.A., Pleiman, C.M., Gardner, A.M., Blumer, K.J., and Johnson,
G.L. (1993) Science 260, 315–9
18
Whole Cell Microarrays
Ravi Kapur
18.1 Introduction
The post-genomic revolution is changing the face of drug discovery into a cellcentric focus. It is predicted that cell-based screening in biopharmaceuticalswill increase from 30% to 50% of all screening activities by 2005. The mappingof the genome has created a significant challenge of validating gene targetsfor specific disease states. Functional genomics within living cells is seen as asolution. Industrialization of cell biology will follow the path of industrializa-tion of molecular biology; development of tools and techniques to gather andmanage data with high throughput. The market drivers of gene sequencing,faster and cheaper, will also be drivers for extraction of the knowledge of thecellome. Additionally, the emerging marketplace for point–of–care diagnostics(POCD) presently focused on DNA and protein analysis will rapidly evolveinto cell-based point–of–care diagnostics. It is projected that the growth rateof cell-based POCD will eventually exceed the growth rate of adoption of cell-based screening in biopharmaceuticals. In the recent past, cell-based assayshave been assessed for utility as functional assays for detection, classificationand identification of chemical and biological agents considered to be environ-mental pollutants or toxicants. As detection elements, living cells may playa critical role in early detection of change in the cellular milieu affected bychemical or biological threat agents.
The use of whole cells to screen and diagnose drugs, target disorders, orenvironmental toxicants is presently rate-limited by the throughput, cost andmeaningful interpretation of the intracellular pathways modulated by suchagents. The tools and techniques responsible for revolutionizing the genomicera will similarly come into play for cell-based screening: hardware for highthroughput data generation, and software for data management, informationextraction and knowledge generation towards diagnosis.
336 Ravi Kapur
18.2 The Need
Functional cell-based assays serve as an early biological filter in various stagesof the drug discovery process. They can serve the role of assays to tease outthe validity of gene targets implicated in disease state in addition to test-ing the drug–responsiveness of said targets; in secondary screening to screenand rank–list the in-vitro safety and efficacy of lead compounds; for earlytoxicity profiling of lead compounds; and for early adsorption, distribution,metabolism and excretion (ADME) profiling across cells from multiple tissuetypes.
Similarly cells captured from patients with pathological states can beprobed for surface markers or intracellular chromosomal abnormalities todetect and diagnose the target disorder whether it be viral infection or fe-tal/maternal genetic disorders.
The use of a panel of cell types such as mucosal, endothelial, immune andneurological can be used to profile the cellular signature in response to knowntoxicants of chemical and biological origin for eventual use in detection andclassification of unknown chemical/biological samples.
The ultimate success of cell-based assays as functional tools for screening,detection, and diagnosis requires building of a knowledge base of cellular re-sponses across multiple cell types and multiple chemical/biological molecules.The ability to generate this cellular knowledge base to enable in the futureeither a priori prediction of cellular activity or minimization of empirical ex-periments requires generation of a massive quantity of cellular information;the shotgun approach to cell biology. The ability to generate, manage and ex-tract information from massive amounts of data in a cost-effective way fromlive whole cell-based experiments is the cornerstone of the knowledge base ofthe cellome. Tools to enable massively parallel number of experiments will berequired to decipher the cell much like the automation approach to decipherits predecessor, DNA.
18.3 The Solution
18.3.1 High Density Microplates
Automation of processes is the cornerstone of enabling high throughput yield,while miniaturization positively impacts both throughput and cost. The adop-tion of 96 well microplates, designed for enzyme linked immunosorbent assays,for culturing cells for use in screening was an attempt to increase through-put of data by parallelization of experiments. The continued drive for higherthroughput at lower cost is leading to the migration of cell-based assays onto384 well plates, and it is projected that 50% of cell-based assays will havemigrated to the 384 well plate format over the next 4 years.
18 Whole Cell Microarrays 337
Though there have been attempts to migrate cellular assays onto evenhigher density microplate formats, such as 1536 and 3456 well reaction plates,the success has been variable and constrained. The physical geometry of thehigh density micro wells impedes homogenous distribution of cells due to sur-face tension forces pulling the liquid to the edges and walls of the cylindricalor rectangular wells. Additionally, the low volume of each well, 1 µl–3 µl, ne-cessitates a very tight control on evaporation-mediated compromise in cellularviability. This limits the practical utility of these high density cellular assayplatforms to a few robust cell types for short incubation experiments.
In addition to the constraints of surface tension artifacts, higher densitymicroplate platforms are likely to have intrinsic engineering issues relatedto optical flatness resulting in sphericity and astigmatism. Additionally, theinterstitial material between wells can contribute to light piping between wells.This problem is compounded when scanning multiple wells in one scan andlimits the throughput of readout.
18.3.2 Microarrays
For ultra-high density cellular platforms to be successful, there will need tobe a departure from the large area footprint of traditional high density mi-croplates. New planar platforms such as glass slides or plastic substrates withsmall footprints engineered and optimized for cell adhesion and optical mi-croscopy, coupled to fluid delivery platforms will provide the solution for highthroughput and low cost cell screening. The microarrays of cells on said pla-nar substrates will reduce cost by reduction in consumption of cells, reagentsand compounds. Increased throughput of screening will result from increaseddensity of the cellular islands on a small macroscopic footprint permittingimaging of all cellular domains in one optical pass. The addressability pro-vided by distinct pre-defined geometric localization of the cells, will furtherenable rapid high resolution readout of cellular domains positive for targetactivity. The planar substrates engineered for optical microscopy (opticallyflat, thin, and with low autofluorescence) will further enhance the throughputand quality of collected data.
Two functional classes of cellular microarrays can be envisioned to meetthe needs of biopharma and biotech: 1) Single cell type high density arraysof one cell type for high throughput screening of multiple compounds, and 2)Multiple distinct cellular populations on a single chip screened across a singlecompound. The former serves the high throughput screening efforts, while thelatter supports assay development, target validation and ADME–Tox.
18.3.3 Single Cell Type High Density Microarrays
Arraying a single cell type in distinct domains on a planar substrate followedby addressing each cellular domain with a distinct compound can enable highthroughput screening of multiple compounds. The cell domain size can be
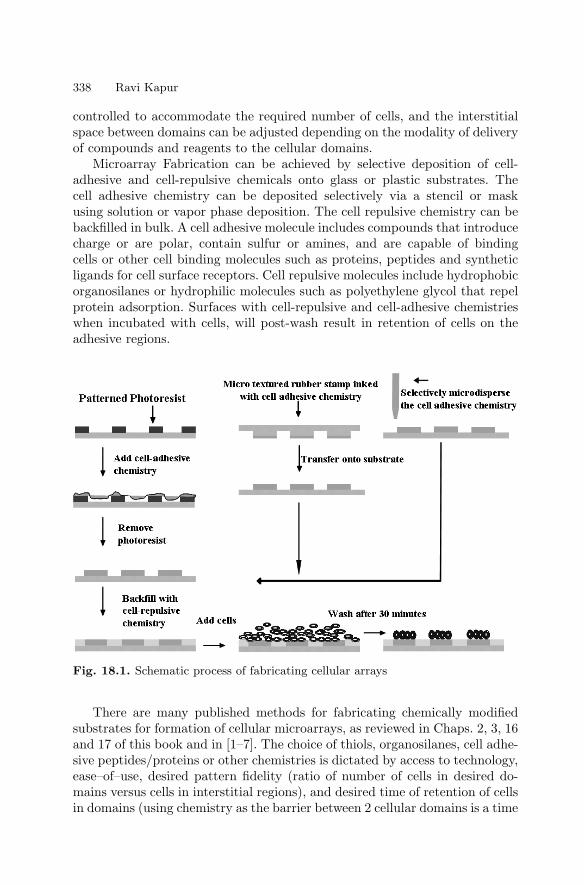
338 Ravi Kapur
controlled to accommodate the required number of cells, and the interstitialspace between domains can be adjusted depending on the modality of deliveryof compounds and reagents to the cellular domains.
Microarray Fabrication can be achieved by selective deposition of cell-adhesive and cell-repulsive chemicals onto glass or plastic substrates. Thecell adhesive chemistry can be deposited selectively via a stencil or maskusing solution or vapor phase deposition. The cell repulsive chemistry can bebackfilled in bulk. A cell adhesive molecule includes compounds that introducecharge or are polar, contain sulfur or amines, and are capable of bindingcells or other cell binding molecules such as proteins, peptides and syntheticligands for cell surface receptors. Cell repulsive molecules include hydrophobicorganosilanes or hydrophilic molecules such as polyethylene glycol that repelprotein adsorption. Surfaces with cell-repulsive and cell-adhesive chemistrieswhen incubated with cells, will post-wash result in retention of cells on theadhesive regions.
Fig. 18.1. Schematic process of fabricating cellular arrays
There are many published methods for fabricating chemically modifiedsubstrates for formation of cellular microarrays, as reviewed in Chaps. 2, 3, 16and 17 of this book and in [1–7]. The choice of thiols, organosilanes, cell adhe-sive peptides/proteins or other chemistries is dictated by access to technology,ease–of–use, desired pattern fidelity (ratio of number of cells in desired do-mains versus cells in interstitial regions), and desired time of retention of cellsin domains (using chemistry as the barrier between 2 cellular domains is a time
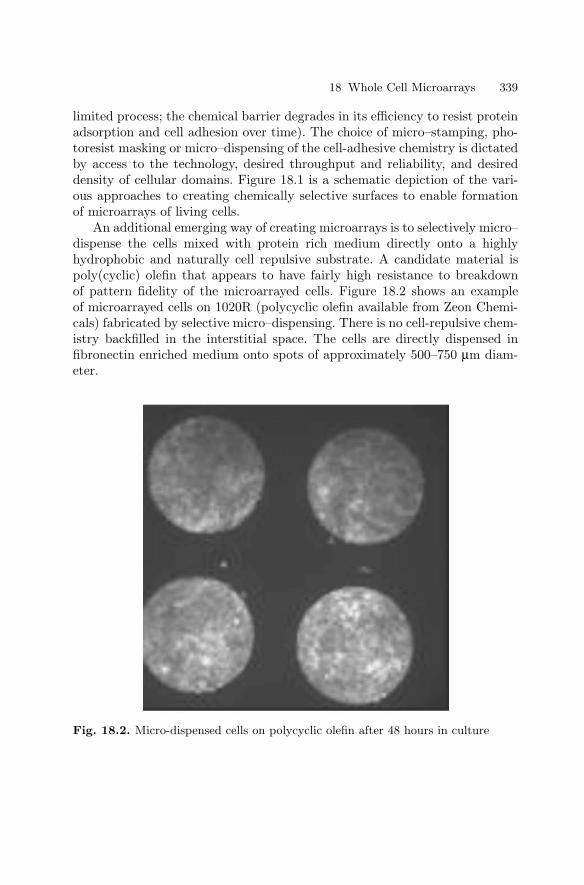
18 Whole Cell Microarrays 339
limited process; the chemical barrier degrades in its efficiency to resist proteinadsorption and cell adhesion over time). The choice of micro–stamping, pho-toresist masking or micro–dispensing of the cell-adhesive chemistry is dictatedby access to the technology, desired throughput and reliability, and desireddensity of cellular domains. Figure 18.1 is a schematic depiction of the vari-ous approaches to creating chemically selective surfaces to enable formationof microarrays of living cells.
An additional emerging way of creating microarrays is to selectively micro–dispense the cells mixed with protein rich medium directly onto a highlyhydrophobic and naturally cell repulsive substrate. A candidate material ispoly(cyclic) olefin that appears to have fairly high resistance to breakdownof pattern fidelity of the microarrayed cells. Figure 18.2 shows an exampleof microarrayed cells on 1020R (polycyclic olefin available from Zeon Chemi-cals) fabricated by selective micro–dispensing. There is no cell-repulsive chem-istry backfilled in the interstitial space. The cells are directly dispensed infibronectin enriched medium onto spots of approximately 500–750 µm diam-eter.
Fig. 18.2. Micro-dispensed cells on polycyclic olefin after 48 hours in culture
340 Ravi Kapur
18.3.4 Multiple Cellular Population Microarrays
For functional genomics, there is a need for high throughput analysis of genefunction within living cells. Ziauddin and co-workers [8], using microarrays offull-length cDNA in expression vectors, demonstrated a recent innovation inhigh throughput functional genomics. Plating of living cells onto the cDNAarrayed glass slides resulted in uptake and expression of specific proteins inspatially distinct groups of cells residing on a common substrate. These 200spatially distinct cell clusters, each expressing a unique intracellular or cellmembrane protein, can be used to screen for the effect of a single drug across200 protein targets in one experiment. Additionally, the effect of genes oncellular phenotype can be addressed with this model (see also Chap. 17).
Multiple tissue specific cell types can additionally be arrayed on a glass/plastic substrate to serve in applications such as ADME–Tox (adsorption, dis-tribution, metabolism, excretion and toxicology). The ability to measure theeffect of a single drug across multiple tissue specific cells enables an under-standing of its side–effects away from intended targets and generation of atoxicology profile across tissue types. Such arrays can be fabricated by mi-croarraying cell-specific mono-clonal antibodies (mAB) onto a glass/ plasticsubstrate followed by incubation of cell–types with antigens specific to thearrayed antibodies. Eurogentec in collaboration with GenomicDevices & Di-agnostics has developed a method of antibody based cell capture on chipswhich can be followed by a PCR or RT–PCR analysis [9]. The specificityof the antigen–antibody reaction will determine the efficiency of sorting ofthe cells and associated noise and cross–contamination within the array. Thistechnique works well for sorting blood cells and is aided by the commerciallyavailable high purity antibodies for blood cell specific antigens. Incubatingthe mAB arrayed substrate with one cell type, followed by a wash, and incu-bation with a second cell type decreases the non-specific adsorption mediatedcross–contamination as compared to incubating a mixture of all cell types onthe substrate. Commercially available mAB arrays from Beckton Dickensonor home-brewed arrays (with control on spot size, type of antibody and ar-ray density) can be used to generate microarrays of multiple cell types on acommon substrate.
A third approach to generating multi-cellular arrays with a wide band-width of cell types is the use of microarrays of cell differentiating factors to in-duce on-chip differentiation of totipotent/pluripotent cells into tissue specificcells [10]. In this approach, stem cell differentiating factors are microarrayedon a glass/plastic substrate using commercial off–the–shelf automated liquidhandling tools. The interstitial region between domains is chemically mod-ified to prevent cell–adhesion. Totipotent or pluripotent cells are incubatedwith the substrate and bind to the domains containing distinct cell differ-entiating factors. Interaction of the cells with the underlying differentiatingmolecules results in each domain having a cellular phenotype and genotypecorresponding to its differentiated state.
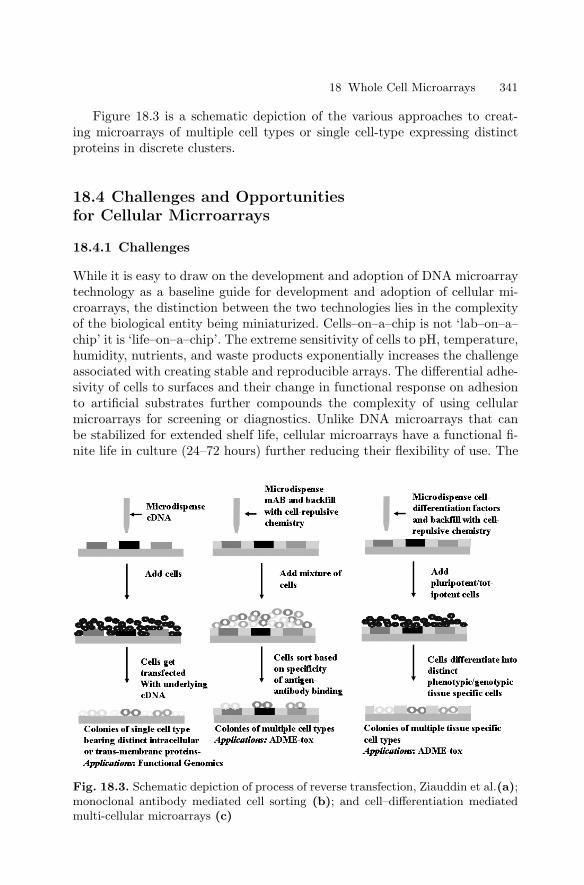
18 Whole Cell Microarrays 341
Figure 18.3 is a schematic depiction of the various approaches to creat-ing microarrays of multiple cell types or single cell-type expressing distinctproteins in discrete clusters.
18.4 Challenges and Opportunitiesfor Cellular Micrroarrays
18.4.1 Challenges
While it is easy to draw on the development and adoption of DNA microarraytechnology as a baseline guide for development and adoption of cellular mi-croarrays, the distinction between the two technologies lies in the complexityof the biological entity being miniaturized. Cells–on–a–chip is not ‘lab–on–a–chip’ it is ‘life–on–a–chip’. The extreme sensitivity of cells to pH, temperature,humidity, nutrients, and waste products exponentially increases the challengeassociated with creating stable and reproducible arrays. The differential adhe-sivity of cells to surfaces and their change in functional response on adhesionto artificial substrates further compounds the complexity of using cellularmicroarrays for screening or diagnostics. Unlike DNA microarrays that canbe stabilized for extended shelf life, cellular microarrays have a functional fi-nite life in culture (24–72 hours) further reducing their flexibility of use. The
Fig. 18.3. Schematic depiction of process of reverse transfection, Ziauddin et al.(a);monoclonal antibody mediated cell sorting (b); and cell–differentiation mediatedmulti-cellular microarrays (c)
342 Ravi Kapur
density of cellular microarrays will be limited by the large biological vari-ance in cell populations. The large baseline variance of functionality of cellsin culture, more profound in primary cells, places sharp statistical limits onthe minimum number of cells required to make an accurate determinationof change in functionality in response to a compound. Theoretically, use ofsingle cells for screening/diagnosis is feasible for highly controlled model cellsystems exhibiting very low variance in baseline response. Practically, for realworld cellular lines and primary cell types, a minimum of 100 cells is requiredto make a statistically relevant detection. This limits the absolute obtainabledensity for cellular microarrays. For open systems requiring exposure of theplanar cellular microarrays to a liquid dispensing device for spatially con-trolled treatment of the cellular domains with distinct compounds, sterilityand evaporation will require careful management. These requirements will addto the technical challenge and cost of developing the technology for adoptionby mainstream markets. Lastly, to bring cellular microarrays to practice asa tool for high throughput screening and point–of–care diagnostics will re-quire the development and standardization of hardware, software, biologicalreagents, cell lines, and processes.
18.4.2 Opportunities
The rapidly growing cell-based screening market (compound annual growthrate at 3%) in biopharma is the single most important determinant for thesuccessful adoption of cellular microarrays. The present screening platformsare centered on use of high density microplates compatible with the liquid han-dling tools residing in biopharma. Eventually, the drive for higher throughputat lower cost will drive the momentum towards adoption of integrated, andminiaturized whole platform solutions centered on cellular microarrays on pla-nar substrates. It is projected that 50% of all assays will migrate to cell-basedassays in biopharma by 2005. Most of this conversion will be driven in 96 and384 well microplates. The use of 1536 well microplates for cell-based assays isunsuitable, except for a few niche cell types and applications. As such, if themicroarray driven platform is positioned correctly, its adoption into the earlystage markets and eventually into the mainstream markets will be seamlesswith the needs of biopharma. This provides a 4–5 year window of opportunityfor development and validation of the technology beyond its present prototypestage.
In parallel to the development of the core technology and product offer-ing, the ongoing commercial development of technologies centered on liquidhandling, chemically modified surfaces and cell stabilization will positively im-pact the development and utility of the whole product offering. Commerciallyavailable liquid handling tools (such as from Cartesian, Packard, Picoliter) toarray cells on commercially available chemically microarrayed substrates [11]will hasten the development and standardization of tools and techniques toserve the core technology development. The ongoing development of technolo-
18 Whole Cell Microarrays 343
gies for cell preservation and stabilization by means as varied as cryopreser-vation, freeze–drying or room temperature drying will dramatically impactthe utility and flexibility of the whole product offering by enabling extendedshelf–life of the consumable microarrayed substrates.
The ultimate success of cellular microarrays will be driven by the ability ofthe technology to deliver on the promise of faster, cheaper, smaller and betterto enable industrialization of cell biology.
References
1. Singhvi, Engineering cell shape and function, Science, Vol. 264, pp 6962. Thomas, Surfaces designed to control the projected area and shape of individual
cells, Journal of Biomechanical Engineering, Vol. 121, pp 40, 19943. Bhatia, Controlling cell interactions by micropatterning in co-cultures: Hepato-
cytes and 3T3 fibroblasts, J. Biomed. Mater. Res., Vol. 34, pp 189, 19974. Kapur, Cellular and cytoskeleton morphology and strength of adhesion of cells
on self–assembled monolayers of organosilanes, Exp. Cell Res., Vol. 244, pp 275,1998
5. Matsuda, Development of micropatterning technology for cultured cells, ASAIOTrans, Vol. 36, pp 559, 1990
6. Matsuda, Development of surface photochemical modification method for mi-cropatterning of cultured cells, J. Biomed. Mater. Res., Vol. 29, pp 749, 1995
7. Mrksich, Using microcontact printing to pattern the attachment of mammaliancells to self–assembled monolayers of alkanethiolates on transparent films of goldand silver, Exp. Cell Res., Vol. 235, pp 305, 1997
8. Ziauddin, Microarrays of cells expressing defined cDNAs, Nature, Vol. 411, pp107, 2001
9. Eurogentec Inc., http://www.eurogentec.be10. Kapur, International Patent Publication Number WO 00/60356, October 12,
200011. Creative Scientific Methods– http://www.cre8ive–sci.com Erie Scientific Co.,
Schott Glass Co
19
Tissue Microarrays for MiniaturizedHigh-Throughput Molecular Profilingof Tumors
Ronald Simon, Martina Mirlacher, and Guido Sauter
19.1 Introduction
High throughput expression screening methods, like cDNA microarrays whichallow the simultaneous expression analysis of tens of thousands of genes in oneexperiment, have fundamentally changed the way potentially significant genesare discovered. More recently, modern proteomics tools have been employedto survey the expression of hundreds or thousands of genes at the proteinlevel [1]. Such methods are now extensively used in both academic and in-dustrial research. As a result, hundreds or thousands of ESTs, genes or geneproducts with a potential role in non-neoplastic or neoplastic diseases havebeen discovered.
Many of these findings may eventually lead to clinically useful applica-tions. For example, disease specific overexpression of a gene can be exploitedin a diagnostic test. In the best case, a gene being overexpressed or function-ally altered in a particular disease could serve as a therapeutic target. Tofurther investigate the potential utility of a newly detected gene alteration,it is important to collect profound information on the epidemiology of thecandidate gene expression in a multitude of diseased and non-diseased tis-sues. New technology is also facilitating high throughput analysis of multipledifferent tissues. For example, this can be achieved by multi–tissue North-ern blots, protein arrays, or high throughput real time PCR facilities [2–5].However, all these methods share the disadvantage that disintegrated tis-sues are used and that the cell types expressing a gene of interest cannot beidentified. This is problematic because candidate genes can be expressed inmultiple different tissue compartments. In-situ technologies such as immuno-histochemistry (IHC), RNA in-situ hybridization (RNA–ISH) or fluorescencein situ hybridization (FISH) are therefore optimal for molecular epidemiologystudies. However, such large-scale in-situ tissue analyses were cumbersomeand slow when traditional methods of molecular pathology were used. More-over, cutting of traditional tissue sections for in-situ analysis would rapidlyexhaust valuable tissue resources since not more than 200 sections can typi-
346 Ronald Simon et al.
cally be made from one tissue block. To overcome these shortcomings we haverecently developed a tissue microarray (TMA) technique [6]. In this methodup to 1,000 different tissue samples can be combined on one microscope glassslide and then be simultaneously analyzed by in-situ analysis methods.
19.2 The TMA Technology
The availability of a large collection of well-characterized tissues – optimallywith attached clinical data – is the most important prerequisite to benefitfrom the TMA technology. Accordingly, most of the work related to the man-ufacturing of TMAs is similar to classical molecular pathology studies andincludes collecting potentially relevant tissues, reviewing all the correspond-ing slides, and selecting blocks for subsequent arraying. Depending on thedegree of organization of a tissue archive and its related databases, the timeneeded for this part of the project varies greatly.
The tissue arraying process itself is simple. The key components of thecommercially available tissue microarraying devices are two needles with aslightly different diameter. With the smaller needle (outer diameter 0.6 mm),holes are punched into empty ‘recipient’ paraffin blocks. Subsequently, aslightly larger needle (inner diameter 0.6 mm) is utilized to transfer tissuecylinders from preexisting ‘donor’ paraffin blocks into these pre-made holesat specific coordinates. Regular microtomes can then be used to cut tissuemicroarray sections. An adhesive coated slide system (Instrumedics, Hacken-sack, New Jersey) facilitates the cutting. TMA sections can be used for alltypes of in situ analyses including immunohistochemistry (IHC), fluorescencein situ hybridization (FISH) or RNA in situ hybridization. Figure 19.1 showsan overview of an H&E stained TMA section as well as examples of IHC andISH results.
19.3 The Representativity Issue
The question of whether or not a small sample measuring 0.6 mm in diametercan be representative of an entire, potentially heterogeneous tumor has beena major concern in the early period of using TMAs [7–11]. At least 20 stud-ies have compared IHC findings on TMAs and their corresponding traditional‘large’ sections [7,9,10,12–28], with the vast majority of them revealing a highlevel of concordance of results [7,9,10,12,13,15,17,18,20,21,23–28]. In severalof these studies, multiple samples were taken from the donor blocks in order todetermine how many samples are needed to obtain results on TMAs that aresufficiently concordant to those observed in large section analyses. In general,these studies found that two or three samples provided more representativeinformation than a single sample [7, 9, 12, 13, 24] and that adding more than
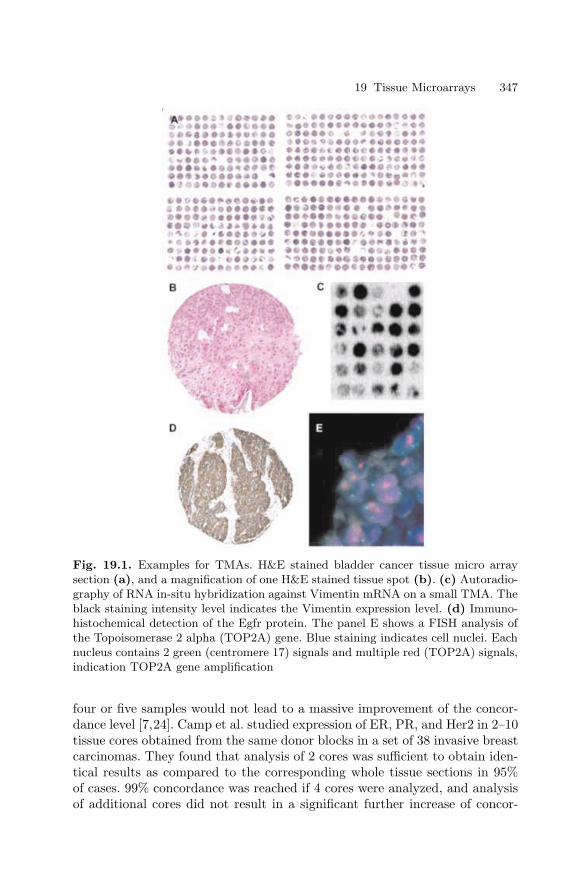
19 Tissue Microarrays 347
Fig. 19.1. Examples for TMAs. H&E stained bladder cancer tissue micro arraysection (a), and a magnification of one H&E stained tissue spot (b). (c) Autoradio-graphy of RNA in-situ hybridization against Vimentin mRNA on a small TMA. Theblack staining intensity level indicates the Vimentin expression level. (d) Immuno-histochemical detection of the Egfr protein. The panel E shows a FISH analysis ofthe Topoisomerase 2 alpha (TOP2A) gene. Blue staining indicates cell nuclei. Eachnucleus contains 2 green (centromere 17) signals and multiple red (TOP2A) signals,indication TOP2A gene amplification
four or five samples would not lead to a massive improvement of the concor-dance level [7,24]. Camp et al. studied expression of ER, PR, and Her2 in 2–10tissue cores obtained from the same donor blocks in a set of 38 invasive breastcarcinomas. They found that analysis of 2 cores was sufficient to obtain iden-tical results as compared to the corresponding whole tissue sections in 95%of cases. 99% concordance was reached if 4 cores were analyzed, and analysisof additional cores did not result in a significant further increase of concor-
348 Ronald Simon et al.
dance [7]. Similarly, Hoos et al. analyzed 1–3 tissue cores from 59 fibroblastictumors with heterogeneous Ki–67, p53, and pRB expression. Analysis of 3tissue cores yielded concordance rates of 91% (pRB), 96% (Ki–67), and 98%(p53) respectively, compared to whole tissue sections [9]. Recently, Rubin etal. determined the optimal sample number for immunohistochemical Ki–67measurement in 1–10 cores of 88 prostate cancers. In this study, 3 cores wererequired to optimally represent Ki–67 expression with respect to the standardtumor slide, whereas 3–4 cores gave the optimal predictive value for clinicaloutcomes. More than 4 cores did not add significant information [24].
However, all these studies were based on the assumption that classicallarge sections – the current gold standard for molecular tumor tissue analysis– is representative of an entire tumor. It is very possible that this notionis not always true. In the optimal case, a ‘large’ section will contain tumortissue measuring 3 × 2 cm in diameter. Given a section thickness of 3 µm theexamined tumor volume is about 0.0018 cm3. This volume represents only1/19,000 of a tumor with a diameter of 4 cm or 1/150,000 of a tumor with adiameter of 8 cm. A TMA sample measuring 0.6 mm in diameter represents atumor volume of 0.00000108 cm3 that is 1/1,600 of a 3 × 2 cm tumor area ona ‘large’ section. Considering these numbers, the representativity problem isabout 1,000 times greater between the entire tumor and a traditional ‘large’section than between a TMA sample and a ‘large’ section.
These calculations suggest that studies investigating the utility of molec-ular analysis methods should rather address the question of whether or notestablished associations between molecular features and tumor phenotype orclinical outcome can be found. In fact, all studies that we are aware of usingTMAs to reproduce firmly established associations between molecular featuresand tumor phenotype or prognosis revealed the expected significant results.For example, expected associations with clinical outcome were found in TMAstudies for the KI67 labelling index in urinary bladder cancer [10], soft tissuesarcoma [29], and in Hurthle cell carcinoma [30], for vimentin expression inkidney cancer [20], and for expression of estrogen and progesterone receptorproteins [26] or HER–2 alterations in breast cancer patients [31]. The asso-ciations with prognosis that were obtained in a TMA analysis are shown forHER2 overexpression and HER2 amplifications in a set of 553 breast cancersin Fig. 19.2. Another study confirmed the known frequencies of amplificationfor Cyclin–D1, c–myc and HER2 in various cancer types [32]. A multitude ofstudies found associations between gene amplification or protein overexpres-sion and tumor phenotype, e.g. cyclin E [33], FGFR1, RAF1 [34], MDM2 orCDK4 [35] amplification or MAGE–A4 expression [36] and stage and gradein bladder cancer, CK7 and CK20 expression and grade in colorectal car-cinoma [37], IGFBP2 expression and hormone–refractory state [38], EIF3S3amplification and stage [39], aneusomy and grade [40] or E–cadherin expres-sion and tumor size [41] in prostate cancer, aneusomy and tumor type in braintumors [42], particular expression profiles and histological subtypes in breastcancer [43] and synovial sarcoma [44], or SHP1 expression and tumor devel-
19 Tissue Microarrays 349
opment in lymphomas [45]. In addition, it has been demonstrated that TMAscan be utilized for comprehensive analyses of amplicon architecture [35, 46].Overall, these data clearly show that relevant data can be obtained in TMAstudies. This is especially true if the TMAs used are large enough to providesufficient power for statistical analyses.
19.4 TMA Applications
More than 100 publications reviewing or using the TMA approach had beenpublished at the end of 2002. Obviously there is a large variety of possibleTMA applications. Virtually all research involving in-situ tissue analysis canbe done in a TMA format. Most published studies have utilized TMAs incancer research. TMAs that were applied in these projects can be dividedinto 5 different categories: prevalence TMAs, normal tissue TMAs, progres-sion TMAs, prognostic TMAs, and TMAs composed of experimental tissues.Prevalence TMAs contain tumor samples without clinico–pathological dataattached. Despite this limitation, they are highly useful to determine theprevalence of a given alteration in tumor entities of interest. Remarkably,tumor entities that can be successfully analyzed on prevalence TMAs includeHodgkin’s lymphoma [14,17,27]. This could not necessarily be expected sincethese tumors predominantly consist of reactive inflammatory cells with onlyfew dispersed neoplastic Hodgkin or Reed Sternberg cells. Prevalence TMAscan contain tissue samples from various different tumor entities. The largest‘multitumor’ TMA manufactured in our laboratory contained 4,788 differentsamples from 130 different tumor types [47]. This TMA is currently utilized forthe analysis of multiple different markers on the DNA and protein level. In onestudy the frequency of 17q23 amplifications, which is linked to poor prognosisin breast cancer, was analyzed using FISH. The multitumor TMA analysisrevealed that 17q23 amplification can occur in 18 additional tumor categoriesbesides breast cancer, including tumors of the adrenal gland, lung, ovary, skin,soft tissue, stomach, thyroid gland, urinary bladder, and uterus [47].
Normal TMAs are especially important if candidate genes are evaluatedfor their potential utility as diagnostic reagents or therapeutic targets. Forsuch applications, it is important to see whether candidate genes are alsoexpressed in normal tissues. In case of potential therapeutic targets it wouldbe most important to know whether vital organs like brain, heart, kidney,liver or bone marrow cells expressed a candidate gene.
Progression TMAs contain samples of different stages of one particular tu-mor type [6, 48–50]. For example, an ideal prostate cancer progression TMAwould contain samples of either normal prostate, benign prostatic hyperpla-sia (BPH), prostatic intraepithelial neoplasia (PIN), incidental carcinomas(stage pT1), organ confined carcinomas (pT2), or carcinomas with extrapro-static growth (pT3–4), as well as metastases and recurrences after androgenwithdrawal treatment. TMAs are also suited to study progression within tu-
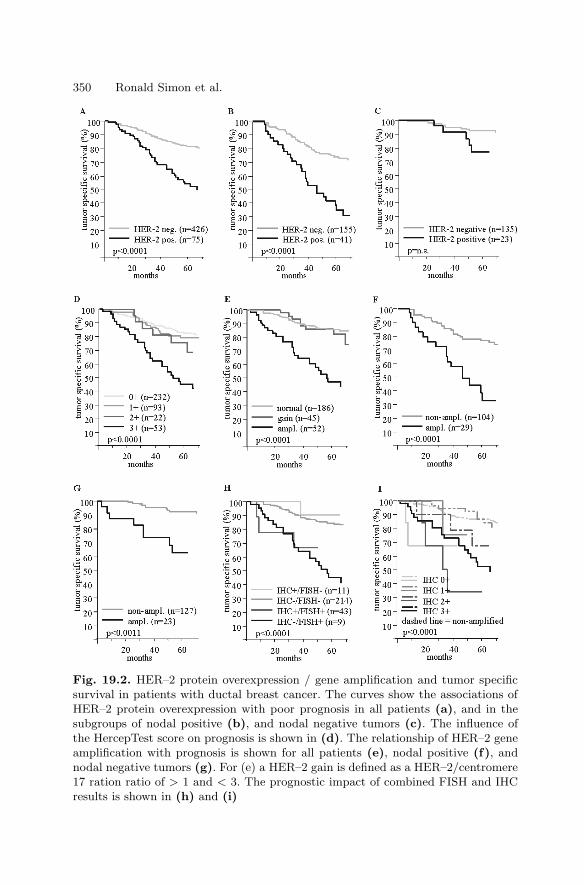
350 Ronald Simon et al.
Fig. 19.2. HER–2 protein overexpression / gene amplification and tumor specificsurvival in patients with ductal breast cancer. The curves show the associations ofHER–2 protein overexpression with poor prognosis in all patients (a), and in thesubgroups of nodal positive (b), and nodal negative tumors (c). The influence ofthe HercepTest score on prognosis is shown in (d). The relationship of HER–2 geneamplification with prognosis is shown for all patients (e), nodal positive (f), andnodal negative tumors (g). For (e) a HER–2 gain is defined as a HER–2/centromere17 ration ratio of > 1 and < 3. The prognostic impact of combined FISH and IHCresults is shown in (h) and (i)
19 Tissue Microarrays 351
mors. TMAs can easily include large numbers of pairs of primary tumors andtheir non-invasive precursor lesions, metastases, or recurrences after specifictreatment. In our laboratory we have constructed a TMA composed of tis-sues from 196 nodal positive breast carcinomas. From each tumor, one samplewas taken from the primary tumor and from each of three different metas-tases. Together with samples from 196 nodal negative breast carcinomas this‘breast cancer metastasis TMA’ contains almost 1000 tissue samples. In arecent study, we used this array to demonstrate a high concordance in theHER2 amplification/overexpression between primary tumors and their nodalmetastases [51].
Prognosis TMAs contain samples from tumors with available clinicalfollow–up data. Molecular features were analyzed for their prognostic sig-nificance in bladder [33, 35, 52], breast [15, 26, 31, 53–55], prostate [56–58],brain [25,59,60], liver [61], kidney [20], and colorectal tumors [62–64], Hodgkin’slymphoma [14], and malignant melanoma [65]. Although all recent progno-sis TMAs comprised tissues from retrospective studies from heterogeneouslytreated patients, these TMAs proved to be highly useful. For example, sig-nificant associations were found between 17q23 amplifications [31] or Cox2expression [55] and breast cancer prognosis, between Top2A expression andprognosis in glioblastoma [59], between MYC and AIB1 expression and prog-nosis in hepatocellular carcinoma [61], and between IGFBP2 and prostatecancer prognosis [38]. Future prognosis TMAs will increasingly contain homo-geneously treated tumors as clinical trial groups are implementing the makingof TMAs from patients included in clinical trials as part of their protocols.
TMAs can also be made from experimental tissues like cell lines [35,66] orxenografts. Cell line TMAs are especially useful for selections of optimal celllines for subsequent functional analyses. For example, it is possible to screenhundreds of arrayed cell lines for amplification of a gene of interest. Amplifiedcell lines can then be ordered and, for example, utilized for testing potentiallyinhibiting drug candidates.
Obviously the use of TMAs is not limited to cancer research. TMAs havealso been used in quality control. For example, TMAs can be used to comparethe results of IHC analysis between different laboratories [67, 68]. It has alsobeen suggested to place small TMAs containing a variety of normal tissues onslides that are used for diagnostic IHC thus providing optimal negative andpositive controls [69].
19.5 Future Directions
TMA technology has become a widely accepted standard technology. Severalattempts are under way to further improve and automate the technology. Pro-totype versions of automated tissue arrayers have now become commerciallyavailable. When they are operational, good quality TMAs can be produced.
352 Ronald Simon et al.
However, automated tissue arrayers will not noticeably improve the availabil-ity of TMAs since the assembling of a TMA is only a minor part of the entireTMA making process. Much more promising is the possibility of automatedTMA analysis. Since one technician can manually stain more than 200,000tissue samples per week, the reading of the TMA slides has become the majorbottleneck in the system. In principle, TMAs are optimally suited for auto-mated IHC analysis. The most critical step for automation of IHC analysisis the selection of the area to be analyzed. This selection has already takenplace in TMAs. It is expected, that systems will soon become available thatwill automatically scan TMA slides and measure the intensity of staining foreach individual TMA spot. In one of our studies we compared manual versusautomated analysis of p21 staining on a colon cancer TMA, and we were ableto identify a similar association with prognosis using our home made TMAanalysis software to that detected after manual analysis (Marcel Ramseier,Simon Hanggi, personal communication). In another study using a commer-cial system we found a 92.1% concordance in the interpretation of the Her2status between manual and automated scoring [53]. However, Her2 is an easyto measure protein. Her2 is hardly expressed in non-neoplastic tissues, overex-pression in tumors is usually at a high level, and excellent IHC staining kits areavailable. Automated measurement will be much more difficult for many othergene products, especially if expression occurs in multiple different cell typesor cellular compartments or in case of significant background staining. Onceautomated imaging with or without image analysis can be performed, it ispossible to link these data to other databases containing molecular, patholog-ical or clinical data. For example, Manley et al. constructed an Internet baseddatabase comprised of interrelated data from 336 prostate cancer patientstransferred into 19 TMA blocks with 5451 TMA biopsy cores. Automaticallyacquired digital images of the TMA spots were successfully analyzed over theInternet for several immunohistochemical biomarkers including E–cadherin,prostate-specific antigen, p27 (Kip1), and Ki–67 labelling index, and attachedclinico–pathological data were used for subsequent statistical analyses [70].This study shows nicely how TMA data with clinical and pathology informa-tion linked to an Internet database can assist collaborative multi–institutionalstudies.
19.6 Protocol
Manufacturing TMAs is a four–step process including sample collection,preparation of recipient blocks, construction of TMA blocks, and sectioning.The required materials and recommended laboratory procedures are brieflydescribed below.
19.6.1 Sample Collection
• Exactly define the TMA to be made. Include normal tissues.

19 Tissue Microarrays 353
• Collect all slides of these tissues from the archive.• One pathologist must review all sections from all candidate specimens to
select the optimal slide. Tissue areas suited for subsequent punching shouldbe marked.
• Collect the tissue blocks that correspond to the selected slides. Theseblocks and their corresponding marked slides must be matched and sortedin the order of appearance on the TMA.
19.6.2 Preparing Recipient Blocks
• Melt paraffin at 60C, filtrate and pour it into a stainless steel mold. Incontrast to normal paraffin blocks, tissue microarray blocks are cut at roomtemperature. Therefore, a special type of paraffin (‘Peel–A–Way’ paraffin;Polysciences Inc., PA, USA) is recommended with a melting temperaturebetween 53 and 55C.
• Place a slotted plastic embedding cassette (as used in every histology lab)on the top of the warm paraffin.
• Cool paraffin block down for 2 hours at room temperature and for 2 addi-tional hours at 4C. Large recipient blocks (for example 30× 45× 10 mm)are easier to handle than the smaller blocks.
19.6.3 TMA Block Constuction
Only if all this preparatory work has been done can a tissue–arraying devicebe employed. At least two different tissue–arraying systems are now commer-cially available. Several groups have introduced inexpensive modifications tothe existing commercially available manual non-automated arrayers, whichmarkedly improve performance and facilitate arraying of frozen tissue. TheTMA manufacturing process consists of five steps that are repeated for eachsample placed on the TMA:
• punching a hole into an empty (recipient) paraffin block• removing and discarding the wax cylinder from the needle used for recip-
ient block punching• removing a cylindrical sample from a donor paraffin block• placing the cylindrical tissue sample in the pre-made hole in the recipient
block• proceeding to the new coordinates for the next tissue sample
Exact positioning of the tip of the tissue cylinder at the level of the recip-ient block surface is crucial for the quality and the yield of the TMA block.Placing the tissue too deeply into the recipient block results in empty spots inthe first sections taken from the TMA block. Positioning the tissue cylindernot deep enough causes empty spots in the last sections taken from this TMA.As soon as all tissue elements are filled into the recipient block, the block isheated at 40C for 10 minutes. Protruding tissue cylinders are then gentlypressed deeper into the warmed TMA block using a glass slide.
354 Ronald Simon et al.
19.6.4 TMA Block Sectioning
Regular sections can be taken from TMA blocks using standard microtomes.However, the more samples a TMA block contains, the more difficult regularcutting becomes. As a consequence, the number of slides of inadequate qualityincreases with the size of the TMA. In turn, fewer sections from the TMA blockcan effectively be analyzed. Using a tape sectioning kit (Instrumedics Inc.,NY, USA) facilitates cutting and leads to highly regular non-distorted sec-tions (ideal for automated analysis). The use of the tape sectioning system isdescribed below:
• Place an adhesive tape on the TMA block in the microtome immediatelybefore cutting.
• Cut a section (usually 5 µm). The tissue slice is now adhering to the tape.• Place the tissue slice on a special ‘glued’ slide• Expose the slide (tissue on the bottom) to UV light for 35 seconds (This
leads to polymerization of the glue on the slide and on the tape).• Dip the slide into TPC solution (Instrumedics) at room temperature for
5–10 seconds.• Gently remove the tape from the glass slide leaving the tissue on the slide.• Air dry slides at room temperature.
References
1. Schweitzer, B. and Kingsmore, S. F. Measuring proteins on microarrays. CurrOpin Biotechnol, 13: 14–19, 2002
2. Belin, D. The use of RNA probes for the analysis of gene expression. Northernblot hybridization and ribonuclease protection assay. Methods Mol Biol, 86: 87–102, 1998
3. Bichsel, V. E., Liotta, L. A., and Petricoin, E. F., 3rd Cancer proteomics: frombiomarker discovery to signal pathway profiling. Cancer J, 7: 69–78, 2001
4. Kallioniemi, O. P. Biochip technologies in cancer research. Ann Med, 33: 142–147, 2001
5. Walker, N. J. Real–time and quantitative PCR: applications to mechanism–basedtoxicology. J Biochem Mol Toxicol, 15: 121–127, 2001
6. Kononen, J., Bubendorf, L., Kallioniemi, A., Barlund, M., Schraml, P., Leighton,S., Torhorst, J., Mihatsch, M., Sauter, G., and Kallioniemi, O. Tissue microar-rays for high–throughput molecular profiling of hundreds of specimens. Nat Med,4: 844–847, 1998
7. Camp, R. L., Charette, L. A., and Rimm, D. L. Validation of tissue microarraytechnology in breast carcinoma. Lab Invest, 80: 1943–1949, 2000
8. Gancberg, D., Di Leo, A., Rouas, G., Jarvinen, T., Verhest, A., Isola, J., Piccart,M. J., and Larsimont, D. Reliability of the tissue microarray based FISH forevaluation of the HER–2 oncogene in breast carcinoma. J Clin Pathol, 55: 315–317, 2002
19 Tissue Microarrays 355
9. Hoos, A., Urist, M. J., Stojadinovic, A., Mastorides, S., Dudas, M. E., Leung, D.H., Kuo, D., Brennan, M. F., Lewis, J. J., and Cordon-Cardo, C. Validation oftissue microarrays for immunohistochemical profiling of cancer specimens usingthe example of human fibroblastic tumors. Am J Pathol, 158: 1245–1251, 2001
10. Nocito, A., Bubendorf, L., Maria Tinner, E., Suess, K., Wagner, U., Forster, T.,Kononen, J., Fijan, A., Bruderer, J., Schmid, U., Ackermann, D., Maurer, R.,Alund, G., Knonagel, H., Rist, M., Anabitarte, M., Hering, F., Hardmeier, T.,Schoenenberger, A. J., Flury, R., Jager, P., Luc Fehr, J., Schraml, P., Moch, H.,Mihatsch, M. J., Gasser, T., and Sauter, G. Microarrays of bladder cancer tissueare highly representative of proliferation index and histological grade. J Pathol,194: 349–357, 2001
11. Rimm, D. L., Camp, R. L., Charette, L. A., Costa, J., Olsen, D. A., and Reiss,M. Tissue microarray: a new technology for amplification of tissue resources.Cancer J, 7: 24–31, 2001
12. Engellau, J., Akerman, M., Anderson, H., Domanski, H. A., Rambech, E., Alve-gard, T. A., and Nilbert, M. Tissue microarray technique in soft tissue sar-coma: immunohisto–chemical Ki–67 expression in malignant fibrous histiocy-toma. Appl Immunohistochem Mol Morphol, 9: 358–363, 2001
13. Fernebro, E., Dictor, M., Bendahl, P. O., Ferno, M., and Nilbert, M. Evaluationof the tissue microarray technique for immunohistochemical analysis in rectalcancer. Arch Pathol Lab Med, 126: 702–705, 2002
14. Garcia, J. F., Camacho, F. I., Morente, M., Fraga, M., Montalban, C., Alavaro,T., Bellas, C., Castano, A., Diez, A., Flores, T., Martin, C., Martinez, M. A.,Mazorra, F., Menarguez, J., Mestre, M. J., Mollejo, M., Saez, A. I., Sanchez,L., and Piris, M. A. Hodgkin’s and Reed–Sternberg cells harbor alterations inthe major tumor suppressor pathways and cell–cycle checkpoints: analyses usingtissue–microarrays. Blood, 12: 12, 2002
15. Ginestier, C., Charafe-Jauffret, E., Bertucci, F., Eisinger, F., Geneix, J., Bech-lian, D., Conte, N., Adelaide, J., Toiron, Y., Nguyen, C., Viens, P., Mozziconacci,M. J., Houlgatte, R., Birnbaum, D., and Jacquemier, J. Distinct and comple-mentary information provided by use of tissue and DNA microarrays in the studyof breast tumor markers. Am J Pathol, 161: 1223–1233, 2002
16. Gulmann, C., Butler, D., Kay, E., Grace, A., and Leader, M. Biopsy of abiopsy: validation of immunoprofiling in gastric cancer biopsy tissue microar-rays. Histopathology, 42: 70–76, 2003
17. Hedvat, C. V., Hegde, A., Chaganti, R. S., Chen, B., Qin, J., Filippa, D. A.,Nimer, S. D., and Teruya-Feldstein, J. Application of tissue microarray technol-ogy to the study of non-Hodgkin’s and Hodgkin’s lymphoma. Hum Pathol, 33:968–974, 2002
18. Hendriks, Y., Franken, P., Dierssen, J. W., De Leeuw, W., Wijnen, J., Dreef, E.,Tops, C., Breuning, M., Brocker-Vriends, A., Vasen, H., Fodde, R., and Morreau,H. Conventional and tissue microarray immunohistochemical expression analysisof mismatch repair in hereditary colorectal tumors. Am J Pathol, 162: 469–477,2003
19. Merseburger, A. S., Kuczyk, M. A., Serth, J., Bokemeyer, C., Young, D. Y., Sun,L., Connelly, R. R., McLeod, D. G., Mostofi, F. K., Srivastava, S. K., Stenzl,A., Moul, J. W., and Sesterhenn, I. A. Limitations of tissue microarrays in theevaluation of focal alterations of bcl–2 and p53 in whole mount derived prostatetissues. Oncol Rep, 10: 223–228, 2003

356 Ronald Simon et al.
20. Moch, H., Schraml, P., Bubendorf, L., Mirlacher, M., Kononen, J., Gasser, T.,Mihatsch, M. J., Kallioniemi, O. P., and Sauter, G. High–throughput tissue mi-croarray analysis to evaluate genes uncovered by cDNA microarray screening inrenal cell carcinoma. Am J Pathol, 154: 981–986, 1999
21. Mucci, N. R., Akdas, G., Manely, S., and Rubin, M. A. Neuroendocrine ex-pression in metastatic prostate cancer: evaluation of high throughput tissue mi-croarrays to detect heterogeneous protein expression. Hum Pathol, 31: 406–414,2000
22. Natkunam, Y., Warnke, R. A., Montgomery, K., Falini, B., and van De Rijn,M. Analysis of mum1/irf4 protein expression using tissue microarrays and im-munohistochemistry. Mod Pathol, 14: 686–694, 2001
23. Rassidakis, G. Z., Jones, D., Thomaides, A., Sen, F., Lai, R., Cabanillas, F.,McDonnell, T. J., and Medeiros, L. J. Apoptotic rate in peripheral T–cell lym-phomas. A study using a tissue microarray with validation on full tissue sections.Am J Clin Pathol, 118: 328–334, 2002
24. Rubin, M. A., Dunn, R., Strawderman, M., and Pienta, K. J. Tissue microarraysampling strategy for prostate cancer bio-marker analysis. Am J Surg Pathol,26: 312–319, 2002
25. Sallinen, S. L., Sallinen, P. K., Haapasalo, H. K., Helin, H. J., Helen, P. T.,Schraml, P., Kallioniemi, O. P., and Kononen, J. Identification of differentiallyexpressed genes in human gliomas by DNA microarray and tissue chip tech-niques. Cancer Res, 60: 6617–6622, 2000
26. Torhorst, J., Bucher, C., Kononen, J., Haas, P., Zuber, M., Kochli, O. R., Mross,F., Dieterich, H., Moch, H., Mihatsch, M., Kallioniemi, O. P., and Sauter, G.Tissue microarrays for rapid linking of molecular changes to clinical endpoints.Am J Pathol, 159: 2249–2256, 2001
27. Tzankov, A., Zimpfer, A., Lugli, A., Krugmann, J., Went, P., Schraml, P., Mau-rer, R., Ascani, S., Pileri, S., Geley, S., and Dirnhofer, S. High–throughput tissuemicroarray analysis of G1–cyclin alterations in classical Hodgkin’s lymphomaindicates overexpression of cyclin E1. J Pathol, 199: 201–207, 2003
28. Yosepovich, A. and Kopolovic, J. Tissue microarray technology–a new and pow-erful tool for the molecular profiling of tumors. Harefuah, 141: 1039–1041, 1090,2002
29. Hoos, A., Stojadinovic, A., Mastorides, S., Urist, M. J., Polsky, D., Di Como,C. J., Brennan, M. F., and Cordon-Cardo, C. High Ki–67 proliferative indexpredicts disease specific survival in patients with high–risk soft tissue sarcomas.Cancer, 92: 869–874, 2001
30. Hoos, A., Stojadinovic, A., Singh, B., Dudas, M. E., Leung, D. H., Shaha, A.R., Shah, J. P., Brennan, M. F., Cordon-Cardo, C., and Ghossein, R. Clinicalsignificance of molecular expression profiles of Hurthle cell tumors of the thyroidgland analyzed via tissue microarrays. Am J Pathol, 160: 175–183, 2002
31. Barlund, M., Forozan, F., Kononen, J., Bubendorf, L., Chen, Y., Bittner, M. L.,Torhorst, J., Haas, P., Bucher, C., Sauter, G., Kallioniemi, O. P., and Kallion-iemi, A. Detecting activation of ribosomal protein S6 kinase by complementaryDNA and tissue microarray analysis. J Natl Cancer Inst, 92: 1252–1259, 2000
32. Schraml, P., Kononen, J., Bubendorf, L., Moch, H., Bissig, H., Nocito, A., Mi-hatsch, M., Kallioniemi, O., and Sauter, G. Tissue microarrays for gene ampli-fication surveys in many different tumor types. Clin Cancer Res, 5: 1966–1975,1999

19 Tissue Microarrays 357
33. Richter, J., Wagner, U., Kononen, J., Fijan, A., Bruderer, J., Schmid, U., Ack-ermann, D., Maurer, R., Alund, G., Knonagel, H., Rist, M., Wilber, K., An-abitarte, M., Hering, F., Hardmeier, T., Schonenberger, A., Flury, R., Jager, P.,Fehr, J. L., Schraml, P., Moch, H., Mihatsch, M. J., Gasser, T., Kallioniemi, O.P., and Sauter, G. High–throughput tissue microarray analysis of cyclin E geneamplification and over–expression in urinary bladder cancer. Am J Pathol, 157:787–794, 2000
34. Simon, R., Richter, J., Wagner, U., Fijan, A., Bruderer, J., Schmid, U., Ack-ermann, D., Maurer, R., Alund, G., Knonagel, H., Rist, M., Wilber, K., An-abitarte, M., Hering, F., Hardmeier, T., Schonenberger, A., Flury, R., Jager, P.,Fehr, J. L., Schraml, P., Moch, H., Mihatsch, M. J., Gasser, T., and Sauter, G.High–throughput tissue microarray analysis of 3p25 (RAF1) and 8p12 (FGFR1)copy number alterations in urinary bladder cancer. Cancer Res, 61: 4514–4519,2001
35. Simon, R., Struckmann, K., Schraml, P., Wagner, U., Forster, T., Moch, H.,Fijan, A., Bruderer, J., Wilber, K., Mihatsch, M. J., Gasser, T., and Sauter,G. Amplification pattern of 12q13–q15 genes (MDM2, CDK4, GLI) in urinarybladder cancer. Oncogene, 21: 2476–2483, 2002
36. Kocher, T., Zheng, M., Bolli, M., Simon, R., Forster, T., Schultz-Thater, E.,Remmel, E., Noppen, C., Schmid, U., Ackermann, D., Mihatsch, M. J., Gasser,T., Heberer, M., Sauter, G., and Spagnoli, G. C. Prognostic relevance of MAGE–A4 tumor antigen expression in transitional cell carcinoma of the urinary blad-der: a tissue microarray study. Int J Cancer, 100: 702–705, 2002
37. Park, S. Y., Kim, H. S., Hong, E. K., and Kim, W. H. Expression of cytokeratins7 and 20 in primary carcinomas of the stomach and colorectum and their valuein the differential diagnosis of metastatic carcinomas to the ovary. Hum Pathol,33: 1078–1085, 2002
38. Bubendorf, L., Kolmer, M., Kononen, J., Koivisto, P., Mousses, S., Chen, Y.,Mahlamaki, E., Schraml, P., Moch, H., Willi, N., Elkahloun, A. G., Pretlow, T.G., Gasser, T. C., Mihatsch, M. J., Sauter, G., and Kallioniemi, O. P. Hormonetherapy failure in human prostate cancer: analysis by complementary DNA andtissue microarrays. J Natl Cancer Inst, 91: 1758–1764, 1999
39. Saramaki, O., Willi, N., Bratt, O., Gasser, T. C., Koivisto, P., Nupponen, N.N., Bubendorf, L., and Visakorpi, T. Amplification of EIF3S3 gene is associatedwith advanced stage in prostate cancer. Am J Pathol, 159: 2089–2094, 2001
40. Skacel, M., Ormsby, A. H., Pettay, J. D., Tsiftsakis, E. K., Liou, L. S., Klein,E. A., Levin, H. S., Zippe, C. D., and Tubbs, R. R. Aneusomy of chromosomes7, 8, and 17 and amplification of HER–2/neu and epidermal growth factor re-ceptor in Gleason score 7 prostate carcinoma: a differential fluorescent in situhybridization study of Gleason pattern 3 and 4 using tissue microarray. HumPathol, 32: 1392–1397, 2001
41. Rubin, M. A., Mucci, N. R., Figurski, J., Fecko, A., Pienta, K. J., and Day, M.L. E–cadherin expression in prostate cancer: a broad survey using high–densitytissue microarray technology. Hum Pathol, 32: 690–697, 2001
42. Fuller, C. E., Wang, H., Zhang, W., Fuller, G. N., and Perry, A. High–throughputmolecular profiling of high–grade astro–cytomas: the utility of fluorescence in situhybridization on tissue microarrays (TMA–FISH). J Neuropathol Exp Neurol,61: 1078–1084, 2002
43. Korsching, E., Packeisen, J., Agelopoulos, K., Eisenacher, M., Voss, R., Isola,J., van Diest, P. J., Brandt, B., Boecker, W., and Buerger, H. Cytogenetic al-
358 Ronald Simon et al.
terations and cytokeratin expression patterns in breast cancer: integrating a newmodel of breast differentiation into cytogenetic pathways of breast carcinogenesis.Lab Invest, 82: 1525–1533, 2002
44. Allander, S. V., Illei, P. B., Chen, Y., Antonescu, C. R., Bittner, M., Ladanyi, M.,and Meltzer, P. S. Expression profiling of synovial sarcoma by cDNA microar-rays: association of ERBB2, IGFBP2, and ELF3 with epithelial differentiation.Am J Pathol, 161: 1587–1595, 2002
45. Oka, T., Yoshino, T., Hayashi, K., Ohara, N., Nakanishi, T., Yamaai, Y., Hi-raki, A., Sogawa, C. A., Kondo, E., Teramoto, N., Takahashi, K., Tsuchiyama,J., and Akagi, T. Reduction of hematopoietic cell–specific tyrosine phosphataseSHP–1 gene expression in natural killer cell lymphoma and various types oflymphomas/leukemias : combination analysis with cDNA expression array andtissue microarray. Am J Pathol, 159: 1495–1505, 2001
46. Monni, O., Barlund, M., Mousses, S., Kononen, J., Sauter, G., Heiskanen, M.,Paavola, P., Avela, K., Chen, Y., Bittner, M. L., and Kallioniemi, A. Com-prehensive copy number and gene expression profiling of the 17q23 amplicon inhuman breast cancer. Proc Natl Acad Sci U S A, 98: 5711–5716, 2001
47. Andersen, C. L., Monni, O., Wagner, U., Kononen, J., Barlund, M., Bucher, C.,Haas, P., Nocito, A., Bissig, H., Sauter, G., and Kallioniemi, A. High–throughputcopy number analysis of 17q23 in 3520 tissue specimens by fluorescence in situhybridization to tissue microarrays. Am J Pathol, 161: 73–79, 2002
48. Bubendorf, L., Kolmer, M., Kononen, J., Koivisto, P., Mousses, S., Chen1, Y.,Mahlamaki, E., Schraml, P., Moch, H., Willi, N., Elkahlhoun, A., Pretlow, T.,Gasser, T., Mihatsch, M., Sauter, G., and Kallioniemi, O. Molecular mechanismsof hormone therapy failure in human prostate cancer analyzed by a combinationof cDNA and tissue microarrays. J Natl Cancer Inst, 91: 1758–1764, 1999
49. Bubendorf, L., Kononen, J., Koivisto, P., Schraml, P., Moch, H., Gasser, T.,Willi, N., Mihatsch, M., Sauter, G., and Kallioniemi, O. Survey of gene ampli-fications during prostate cancer progression by high–throughput fluorescence insitu hybridization on tissue microarrays. Cancer Res, 59: 803–806, 1999
50. Richter, J., Wagner, U., Kononen, J., Fijan, A., Bruderer, J., Schmid, U., Ack-ermann, D., Maurer, R., Alund, G., Knonagel, H., Rist, M., Wilber, K., An-abitarte, M., Hering, F., Hardmeier, T., Schonenberger, A., Flury, R., Jager, P.,Fehr, J. L., Schraml, P., Moch, H., Mihatsch, M. J., Gasser, T., Kallioniemi, O.P., and Sauter, G. High–throughput tissue microarray analysis of cyclin E geneamplification and over–expression in urinary bladder cancer. Am J Pathol, 157:787–794, 2000
51. Simon, R., Nocito, A., Hubscher, T., Bucher, C., Torhorst, J., Schraml, P.,Bubendorf, L., Mihatsch, M. M., Moch, H., Wilber, K., Schotzau, A., Kononen,J., and Sauter, G. Patterns of her–2/neu amplification and overexpression inprimary and metastatic breast cancer. J Natl Cancer Inst, 93: 1141–1146, 2001
52. Rao, J., Seligson, D., Visapaa, H., Horvath, S., Eeva, M., Michel, K., Pantuck,A., Belldegrun, A., and Palotie, A. Tissue microarray analysis of cytoskeletalactin–associated bio-markers gelsolin and E–cadherin in urothelial carcinoma.Cancer, 95: 1247–1257, 2002
53. Bucher, C., Torhorst, J., Kononen, J., Haas, P., Askaa, J., Godtfredsen, S. E.,Bauer, K. D., Seelig, S., Kallioniemi, O., and Sauter, G. Automated, High–Throughput Tissue Microarray Analysis for Assessing the Significance of HER–2 In-volvement in Breast Cancer. In: Proceedings of the ASCO annual meeting,Abstr. #2388, New Orleans, LA, 2000
19 Tissue Microarrays 359
54. Poremba, C., Heine, B., Diallo, R., Heinecke, A., Wai, D., Schaefer, K. L.,Braun, Y., Schuck, A., Lanvers, C., Bank-falvi, A., Kneif, S., Torhorst, J., Zu-ber, M., Kochli, O. R., Mross, F., Dieterich, H., Sauter, G., Stein, H., Fogt,F., and Boecker, W. Telomerase as a prognostic marker in breast cancer: high–throughput tissue microarray analysis of hTERT and hTR. J Pathol, 198: 181–189, 2002
55. Ristimaki, A., Sivula, A., Lundin, J., Lundin, M., Salminen, T., Haglund, C.,Joensuu, H., and Isola, J. Prognostic significance of elevated cyclooxygenase–2expression in breast cancer. Cancer Res, 62: 632–635, 2002
56. Bubendorf, L., Kononen, J., Koivisto, P., Schraml, P., Moch, H., Gasser, T. C.,Willi, N., Mihatsch, M. J., Sauter, G., and Kallioniemi, O. P. Survey of gene am-plifications during prostate cancer progression by high–throughout fluorescencein situ hybridization on tissue microarrays. Cancer Res, 59: 803–806, 1999
57. Dhanasekaran, S. M., Barrette, T. R., Ghosh, D., Shah, R., Varambally, S.,Kurachi, K., Pienta, K. J., Rubin, M. A., and Chinnaiyan, A. M. Delineation ofprognostic biomarkers in prostate cancer. Nature, 412: 822–826, 2001
58. Mousses, S., Bubendorf, L., Wagner, U., Hostetter, G., Kononen, J., Cornelison,R., Goldberger, N., Elkahloun, A. G., Willi, N., Koivisto, P., Ferhle, W., Raffeld,M., Sauter, G., and Kallioniemi, O. P. Clinical validation of candidate genesassociated with prostate cancer progression in the CWR22 model system usingtissue microarrays. Cancer Res, 62: 1256–1260, 2002
59. Miettinen, H. E., Jarvinen, T. A., Kellner, U., Kauraniemi, P., Parwaresch, R.,Rantala, I., Kalimo, H., Paljarvi, L., Isola, J., and Haapasalo, H. High topoiso-merase IIalpha expression associates with high proliferation rate and and poorprognosis in oligodendrogliomas. Neuropathol Appl Neurobiol, 26: 504–512, 2000
60. Miettinen, H. E., Paunu, N., Rantala, I., Kalimo, H., Paljarvi, L., Helin, H., andHaapasalo, H. Cell cycle regulators (p21, p53, pRb) in oligodendrocytic tumors:a study by novel tumor microarray technique. J Neurooncol, 55: 29–37, 2001
61. Wang, Y., Wu, M. C., Sham, J. S., Zhang, W., Wu, W. Q., and Guan, X.Y. Prognostic significance of c–myc and AIB1 amplification in hepatocellularcarcinoma. A broad survey using high–throughput tissue microarray. Cancer,95: 2346–2352, 2002
62. Chung, G. G., Provost, E., Kielhorn, E. P., Charette, L. A., Smith, B. L., andRimm, D. L. Tissue microarray analysis of beta–catenin in colorectal cancershows nuclear phospho–beta–catenin is associated with a better prognosis. ClinCancer Res, 7: 4013–4020, 2001
63. Hoos, A., Nissan, A., Stojadinovic, A., Shia, J., Hedvat, C. V., Leung, D. H.,Paty, P. B., Klimstra, D., Cordon-Cardo, C., and Wong, W. D. Tissue Microar-ray Molecular Profiling of Early, Node–negative Adenocarcinoma of the Rectum:A Comprehensive Analysis. Clin Cancer Res, 8: 3841–3849, 2002
64. Otsuka, M., Kato, M., Yoshikawa, T., Chen, H., Brown, E. J., Masuho, Y.,Omata, M., and Seki, N. Differential expression of the L–plastin gene in humancolorectal cancer progression and metastasis. Biochem Biophys Res Commun,289: 876–881, 2001
65. Kielhorn, E., Provost, E., Olsen, D., D’Aquila, T. G., Smith, B. L., Camp, R.L., and Rimm, D. L. Tissue microarray–based analysis shows phospho–beta–catenin expression in malignant melanoma is associated with poor outcome. IntJ Cancer, 103: 652–656, 2003
66. Hoos, A. and Cordon–Cardo, C. Tissue microarray profiling of cancer specimensand cell lines: opportunities and limitations. Lab Invest, 81: 1331–1338, 2001

360 Ronald Simon et al.
67. Mengel, M., von Wasielewski, R., Wiese, B., Rudiger, T., Muller-Hermelink, H.K., and Kreipe, H. Inter–laboratory and inter–observer reproducibility of im-munohistochemical assessment of the Ki–67 labelling index in a large multi–centre trial. J Pathol, 198: 292–299, 2002
68. von Wasielewski, R., Mengel, M., Wiese, B., Rudiger, T., Muller–Hermelink,H. K., and Kreipe, H. Tissue array technology for testing interlaboratory andinterobserver reproducibility of immunohistochemical estrogen receptor analysisin a large multicenter trial. Am J Clin Pathol, 118: 675–682, 2002
69. Packeisen, J., Buerger, H., Krech, R., and Boecker, W. Tissue microarrays: anew approach for quality control in immunohistochemistry. J Clin Pathol, 55:613–615, 2002
70. Manley, S., Mucci, N. R., De Marzo, A. M., and Rubin, M. A. Relational databasestructure to manage high–density tissue microarray data and images for pathol-ogy studies focusing on clinical outcome: the prostate specialized program of re-search excellence model. Am J Pathol, 159: 837–843, 2001

20
Application of Microarray Technologiesfor Translational Genomics
Spyro Mousses, Natasha Caplen, Mark Basik, Anne Kallioniemi, andOlli Kallioniemi
20.1 Introduction
There has been an exponential growth in the rate at which the human genomeis being decoded to decipher its genetic information. New enabling technolo-gies have been developed to accelerate throughput in both structural andfunctional genomics, rapidly expanding our capacity to extract data from thegenome. The human genome project reported the near completion of the firstdraft of the 3 billion base pair human genome and a catalogue of more than34 thousand human genes [1–5]. The promise of this milestone in scientificachievement is that it will lead to a better understanding of biological pro-cesses, and facilitate medical breakthroughs by the discovery of new disease-related genes.
Besides the new sequencing technologies that have led to the rapid com-pletion of the genome sequence, the need to apply these discoveries has givenbirth to innovative high throughput technologies, which have made it possibleto interrogate the expression and sequence variation of thousands of genes inparallel. The most popular and powerful example is the DNA microarray [6–9],which can be used to simultaneously quantify the expression of thousands ofgenes, thereby producing insight into the expressed ‘transcriptome’. Thou-sands of studies have used DNA microarrays for genome scale analysis ofgene expression or sequence variation and have generated long lists of can-didate genes associated with various disease states [10–13]. Based solely onthe microarray data however, the utility of these candidate genes in clinicaldiagnostics and therapeutics can only be hypothesized. Since traditional func-tional and clinical validation of candidate genes is carried out one gene at atime, it is becoming increasingly apparent that these studies are generatinghypotheses at a rate that far exceeds the rate for testing these hypotheses withcurrent approaches. Indeed, a major bottleneck is present in the translationof genomic information into medical advances. High throughput hypothesistesting platforms therefore need to be developed and applied before the fullpotential of the genomic revolution can truly be realized. In this chapter, two
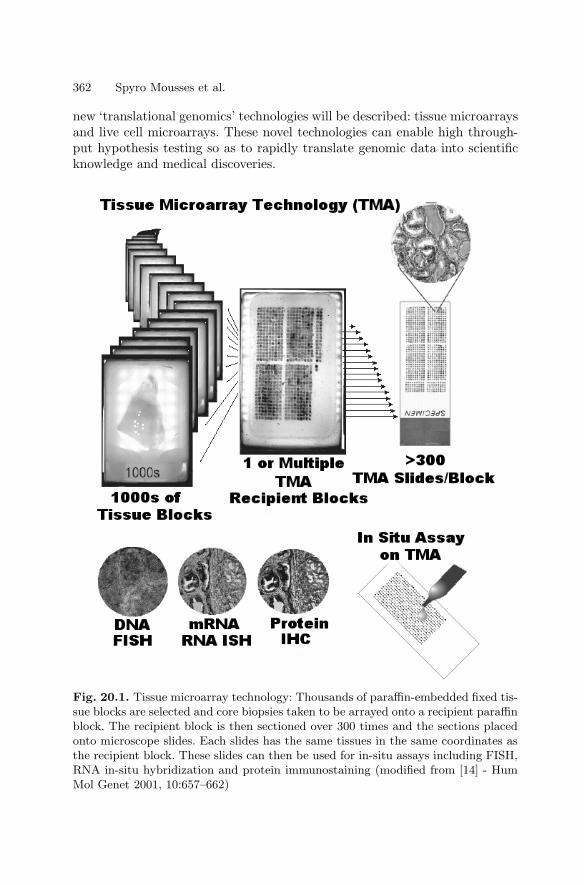
362 Spyro Mousses et al.
new ‘translational genomics’ technologies will be described: tissue microarraysand live cell microarrays. These novel technologies can enable high through-put hypothesis testing so as to rapidly translate genomic data into scientificknowledge and medical discoveries.
Fig. 20.1. Tissue microarray technology: Thousands of paraffin-embedded fixed tis-sue blocks are selected and core biopsies taken to be arrayed onto a recipient paraffinblock. The recipient block is then sectioned over 300 times and the sections placedonto microscope slides. Each slides has the same tissues in the same coordinates asthe recipient block. These slides can then be used for in-situ assays including FISH,RNA in-situ hybridization and protein immunostaining (modified from [14] - HumMol Genet 2001, 10:657–662)
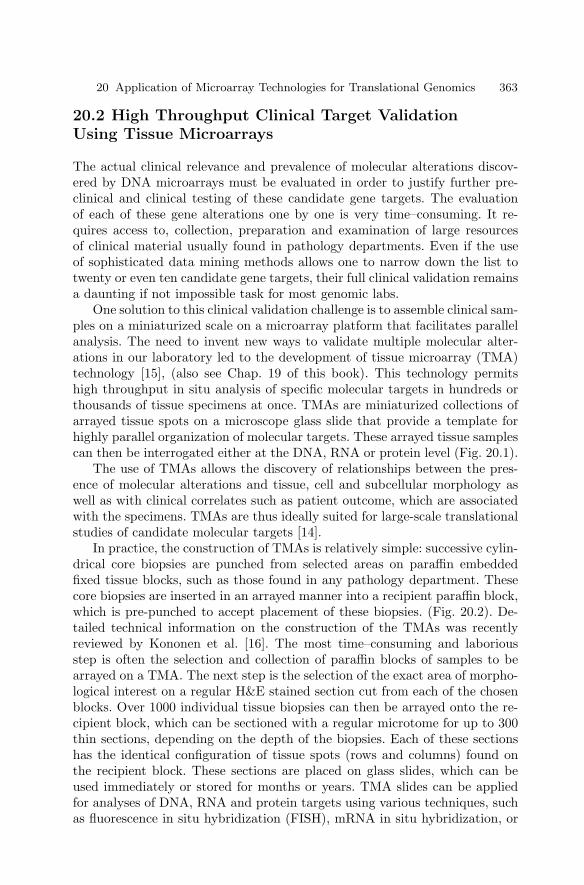
20 Application of Microarray Technologies for Translational Genomics 363
20.2 High Throughput Clinical Target ValidationUsing Tissue Microarrays
The actual clinical relevance and prevalence of molecular alterations discov-ered by DNA microarrays must be evaluated in order to justify further pre-clinical and clinical testing of these candidate gene targets. The evaluationof each of these gene alterations one by one is very time–consuming. It re-quires access to, collection, preparation and examination of large resourcesof clinical material usually found in pathology departments. Even if the useof sophisticated data mining methods allows one to narrow down the list totwenty or even ten candidate gene targets, their full clinical validation remainsa daunting if not impossible task for most genomic labs.
One solution to this clinical validation challenge is to assemble clinical sam-ples on a miniaturized scale on a microarray platform that facilitates parallelanalysis. The need to invent new ways to validate multiple molecular alter-ations in our laboratory led to the development of tissue microarray (TMA)technology [15], (also see Chap. 19 of this book). This technology permitshigh throughput in situ analysis of specific molecular targets in hundreds orthousands of tissue specimens at once. TMAs are miniaturized collections ofarrayed tissue spots on a microscope glass slide that provide a template forhighly parallel organization of molecular targets. These arrayed tissue samplescan then be interrogated either at the DNA, RNA or protein level (Fig. 20.1).
The use of TMAs allows the discovery of relationships between the pres-ence of molecular alterations and tissue, cell and subcellular morphology aswell as with clinical correlates such as patient outcome, which are associatedwith the specimens. TMAs are thus ideally suited for large-scale translationalstudies of candidate molecular targets [14].
In practice, the construction of TMAs is relatively simple: successive cylin-drical core biopsies are punched from selected areas on paraffin embeddedfixed tissue blocks, such as those found in any pathology department. Thesecore biopsies are inserted in an arrayed manner into a recipient paraffin block,which is pre-punched to accept placement of these biopsies. (Fig. 20.2). De-tailed technical information on the construction of the TMAs was recentlyreviewed by Kononen et al. [16]. The most time–consuming and laboriousstep is often the selection and collection of paraffin blocks of samples to bearrayed on a TMA. The next step is the selection of the exact area of morpho-logical interest on a regular H&E stained section cut from each of the chosenblocks. Over 1000 individual tissue biopsies can then be arrayed onto the re-cipient block, which can be sectioned with a regular microtome for up to 300thin sections, depending on the depth of the biopsies. Each of these sectionshas the identical configuration of tissue spots (rows and columns) found onthe recipient block. These sections are placed on glass slides, which can beused immediately or stored for months or years. TMA slides can be appliedfor analyses of DNA, RNA and protein targets using various techniques, suchas fluorescence in situ hybridization (FISH), mRNA in situ hybridization, or
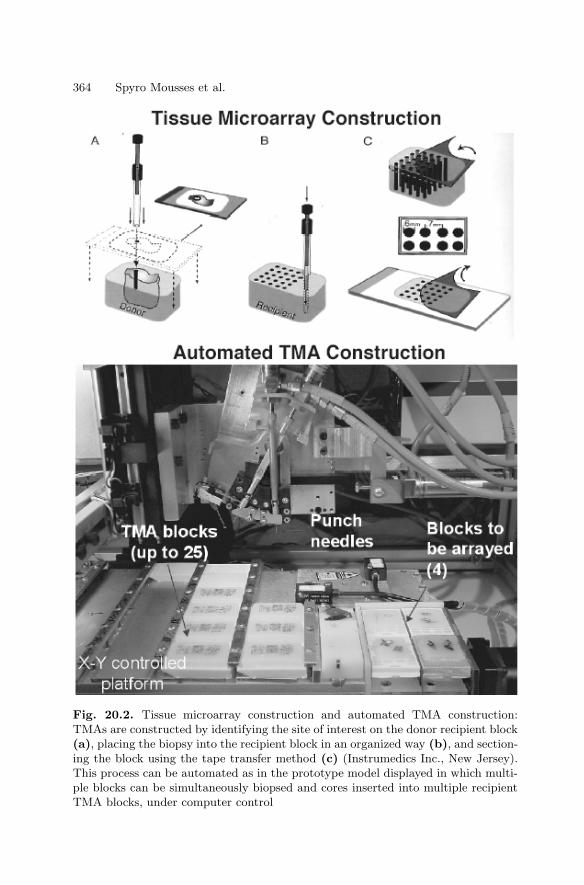
364 Spyro Mousses et al.
Fig. 20.2. Tissue microarray construction and automated TMA construction:TMAs are constructed by identifying the site of interest on the donor recipient block(a), placing the biopsy into the recipient block in an organized way (b), and section-ing the block using the tape transfer method (c) (Instrumedics Inc., New Jersey).This process can be automated as in the prototype model displayed in which multi-ple blocks can be simultaneously biopsed and cores inserted into multiple recipientTMA blocks, under computer control
20 Application of Microarray Technologies for Translational Genomics 365
immunohistochemistry (IHC). In fact, it is possible to interrogate with all 3methods a virtually identical cohort of tissue samples using a series of suc-cessively sectioned TMA slides. Moreover, by using small (0.6 mm) diameterbiopsies, TMA technology prevents the loss of precious archival material. Infact, because of this small size of the biopsies, it is feasible to take severalbiopsies from each donor paraffin block in order to construct replicate TMAblocks in one sitting without destroying the original block. For example, con-struction of 10 replicate TMA blocks from a starting material of 1000 tissueswould enable one to produce up to 3000 TMA slides. This would only re-move ten 0.6 mm cylindrical cores of each of the 1000 tissue blocks. These3000 TMA slides can each be used with a different probe or assay to analyzeup to 3000 different genes of interest, in 1000 specimens per assay. This pro-duces a total capacity of up to 3 million individual spot measurements fromprecious clinical tissue material. TMAs therefore make it possible to performlarge-scale clinical studies on a single microscope slide.
Since clinical epidemiology studies require large case numbers, TMAs areideal for the efficient use of the large tissue resources available in pathologylaboratory archives. If matching clinical data such as survival and treatmentresponse exists for these specimens, rapid extraction of clinicopathologicalcorrelates in over 1000 of these specimens can be performed in a single TMAexperiment. Since TMA slides are usually created as multiple sets containingthe same clinical specimens populations, data from multiple genes can beanalyzed across that population to determine patterns of involvement amongstrelated genes and gene products. For instance, all of the members of a signalingpathway can be studied on successive TMA slides. Another TMA exampleis that of creating a ‘progression TMA’ in which multiple tissue samples ofdifferent stages of a disease can be arrayed on one TMA, so as to permit rapiddetermination of the onset of a molecular event in relationship to the stagesof disease progression. It is thus clear that the throughput and uniformity ofTMAs can be used for a variety of creative applications to produce data of ascale, quality, and nature that is unique to this platform.
20.3 Examples of Studies Integrating DNA and TissueMicroarray Technologies for the Rapid ClinicalTranslation of Genomic Discoveries
Tissue microarrays can be used for the high throughput analysis of a varietyof specimens including different tissue and organ types from various diseaseand normal states. TMAs have also been constructed from cell lines and fromtissues from various model organisms. However, most studies reporting theuse of TMAs have focused on their application in the study of human disease,especially cancer. Given the current proliferation of lists of candidate genesgenerated by DNA microarrays, TMAs have already been used to validate
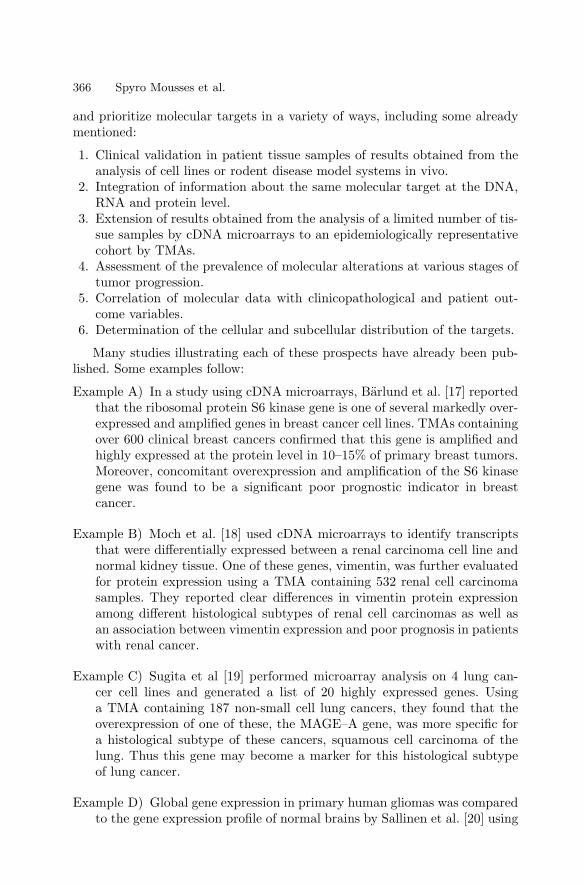
366 Spyro Mousses et al.
and prioritize molecular targets in a variety of ways, including some alreadymentioned:
1. Clinical validation in patient tissue samples of results obtained from theanalysis of cell lines or rodent disease model systems in vivo.
2. Integration of information about the same molecular target at the DNA,RNA and protein level.
3. Extension of results obtained from the analysis of a limited number of tis-sue samples by cDNA microarrays to an epidemiologically representativecohort by TMAs.
4. Assessment of the prevalence of molecular alterations at various stages oftumor progression.
5. Correlation of molecular data with clinicopathological and patient out-come variables.
6. Determination of the cellular and subcellular distribution of the targets.
Many studies illustrating each of these prospects have already been pub-lished. Some examples follow:
Example A) In a study using cDNA microarrays, Barlund et al. [17] reportedthat the ribosomal protein S6 kinase gene is one of several markedly over-expressed and amplified genes in breast cancer cell lines. TMAs containingover 600 clinical breast cancers confirmed that this gene is amplified andhighly expressed at the protein level in 10–15% of primary breast tumors.Moreover, concomitant overexpression and amplification of the S6 kinasegene was found to be a significant poor prognostic indicator in breastcancer.
Example B) Moch et al. [18] used cDNA microarrays to identify transcriptsthat were differentially expressed between a renal carcinoma cell line andnormal kidney tissue. One of these genes, vimentin, was further evaluatedfor protein expression using a TMA containing 532 renal cell carcinomasamples. They reported clear differences in vimentin protein expressionamong different histological subtypes of renal cell carcinomas as well asan association between vimentin expression and poor prognosis in patientswith renal cancer.
Example C) Sugita et al [19] performed microarray analysis on 4 lung can-cer cell lines and generated a list of 20 highly expressed genes. Usinga TMA containing 187 non-small cell lung cancers, they found that theoverexpression of one of these, the MAGE–A gene, was more specific fora histological subtype of these cancers, squamous cell carcinoma of thelung. Thus this gene may become a marker for this histological subtypeof lung cancer.
Example D) Global gene expression in primary human gliomas was comparedto the gene expression profile of normal brains by Sallinen et al. [20] using
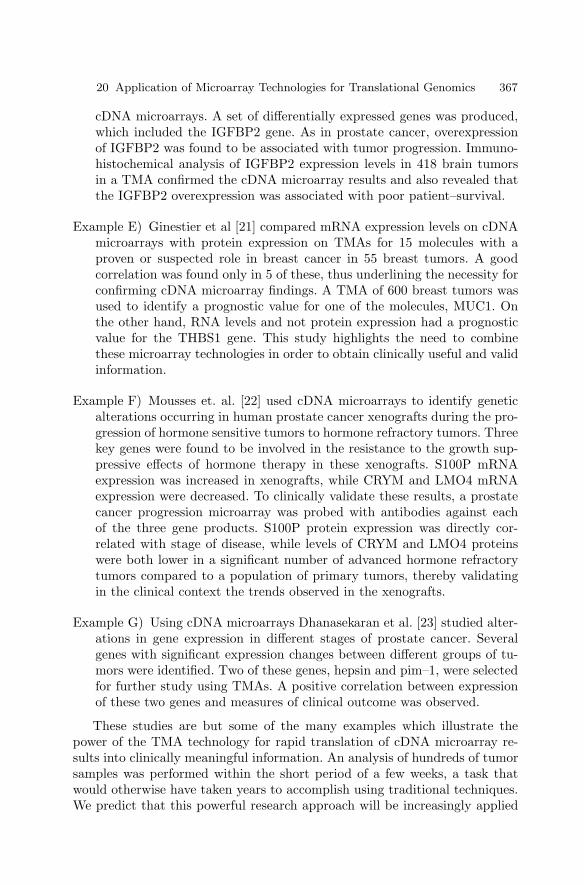
20 Application of Microarray Technologies for Translational Genomics 367
cDNA microarrays. A set of differentially expressed genes was produced,which included the IGFBP2 gene. As in prostate cancer, overexpressionof IGFBP2 was found to be associated with tumor progression. Immuno-histochemical analysis of IGFBP2 expression levels in 418 brain tumorsin a TMA confirmed the cDNA microarray results and also revealed thatthe IGFBP2 overexpression was associated with poor patient–survival.
Example E) Ginestier et al [21] compared mRNA expression levels on cDNAmicroarrays with protein expression on TMAs for 15 molecules with aproven or suspected role in breast cancer in 55 breast tumors. A goodcorrelation was found only in 5 of these, thus underlining the necessity forconfirming cDNA microarray findings. A TMA of 600 breast tumors wasused to identify a prognostic value for one of the molecules, MUC1. Onthe other hand, RNA levels and not protein expression had a prognosticvalue for the THBS1 gene. This study highlights the need to combinethese microarray technologies in order to obtain clinically useful and validinformation.
Example F) Mousses et. al. [22] used cDNA microarrays to identify geneticalterations occurring in human prostate cancer xenografts during the pro-gression of hormone sensitive tumors to hormone refractory tumors. Threekey genes were found to be involved in the resistance to the growth sup-pressive effects of hormone therapy in these xenografts. S100P mRNAexpression was increased in xenografts, while CRYM and LMO4 mRNAexpression were decreased. To clinically validate these results, a prostatecancer progression microarray was probed with antibodies against eachof the three gene products. S100P protein expression was directly cor-related with stage of disease, while levels of CRYM and LMO4 proteinswere both lower in a significant number of advanced hormone refractorytumors compared to a population of primary tumors, thereby validatingin the clinical context the trends observed in the xenografts.
Example G) Using cDNA microarrays Dhanasekaran et al. [23] studied alter-ations in gene expression in different stages of prostate cancer. Severalgenes with significant expression changes between different groups of tu-mors were identified. Two of these genes, hepsin and pim–1, were selectedfor further study using TMAs. A positive correlation between expressionof these two genes and measures of clinical outcome was observed.
These studies are but some of the many examples which illustrate thepower of the TMA technology for rapid translation of cDNA microarray re-sults into clinically meaningful information. An analysis of hundreds of tumorsamples was performed within the short period of a few weeks, a task thatwould otherwise have taken years to accomplish using traditional techniques.We predict that this powerful research approach will be increasingly applied
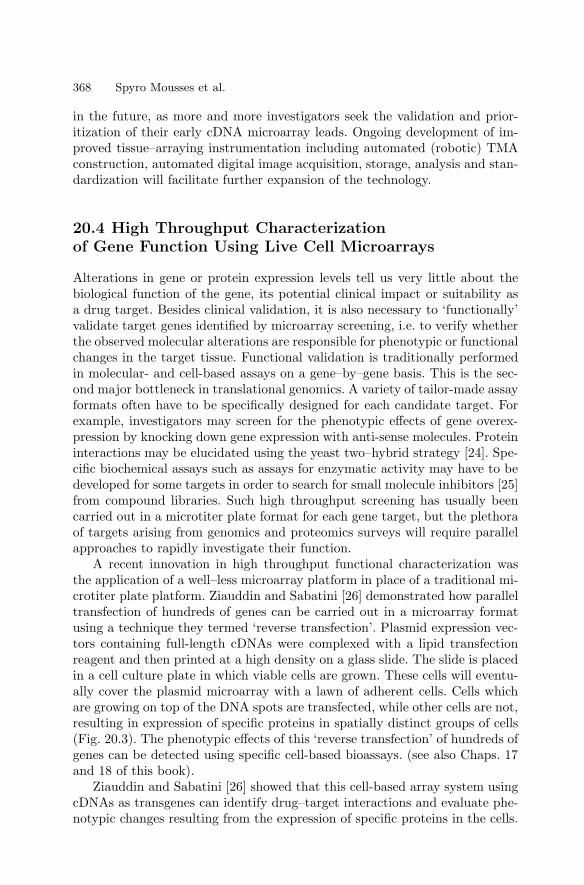
368 Spyro Mousses et al.
in the future, as more and more investigators seek the validation and prior-itization of their early cDNA microarray leads. Ongoing development of im-proved tissue–arraying instrumentation including automated (robotic) TMAconstruction, automated digital image acquisition, storage, analysis and stan-dardization will facilitate further expansion of the technology.
20.4 High Throughput Characterizationof Gene Function Using Live Cell Microarrays
Alterations in gene or protein expression levels tell us very little about thebiological function of the gene, its potential clinical impact or suitability asa drug target. Besides clinical validation, it is also necessary to ‘functionally’validate target genes identified by microarray screening, i.e. to verify whetherthe observed molecular alterations are responsible for phenotypic or functionalchanges in the target tissue. Functional validation is traditionally performedin molecular- and cell-based assays on a gene–by–gene basis. This is the sec-ond major bottleneck in translational genomics. A variety of tailor-made assayformats often have to be specifically designed for each candidate target. Forexample, investigators may screen for the phenotypic effects of gene overex-pression by knocking down gene expression with anti-sense molecules. Proteininteractions may be elucidated using the yeast two–hybrid strategy [24]. Spe-cific biochemical assays such as assays for enzymatic activity may have to bedeveloped for some targets in order to search for small molecule inhibitors [25]from compound libraries. Such high throughput screening has usually beencarried out in a microtiter plate format for each gene target, but the plethoraof targets arising from genomics and proteomics surveys will require parallelapproaches to rapidly investigate their function.
A recent innovation in high throughput functional characterization wasthe application of a well–less microarray platform in place of a traditional mi-crotiter plate platform. Ziauddin and Sabatini [26] demonstrated how paralleltransfection of hundreds of genes can be carried out in a microarray formatusing a technique they termed ‘reverse transfection’. Plasmid expression vec-tors containing full-length cDNAs were complexed with a lipid transfectionreagent and then printed at a high density on a glass slide. The slide is placedin a cell culture plate in which viable cells are grown. These cells will eventu-ally cover the plasmid microarray with a lawn of adherent cells. Cells whichare growing on top of the DNA spots are transfected, while other cells are not,resulting in expression of specific proteins in spatially distinct groups of cells(Fig. 20.3). The phenotypic effects of this ‘reverse transfection’ of hundreds ofgenes can be detected using specific cell-based bioassays. (see also Chaps. 17and 18 of this book).
Ziauddin and Sabatini [26] showed that this cell-based array system usingcDNAs as transgenes can identify drug–target interactions and evaluate phe-notypic changes resulting from the expression of specific proteins in the cells.
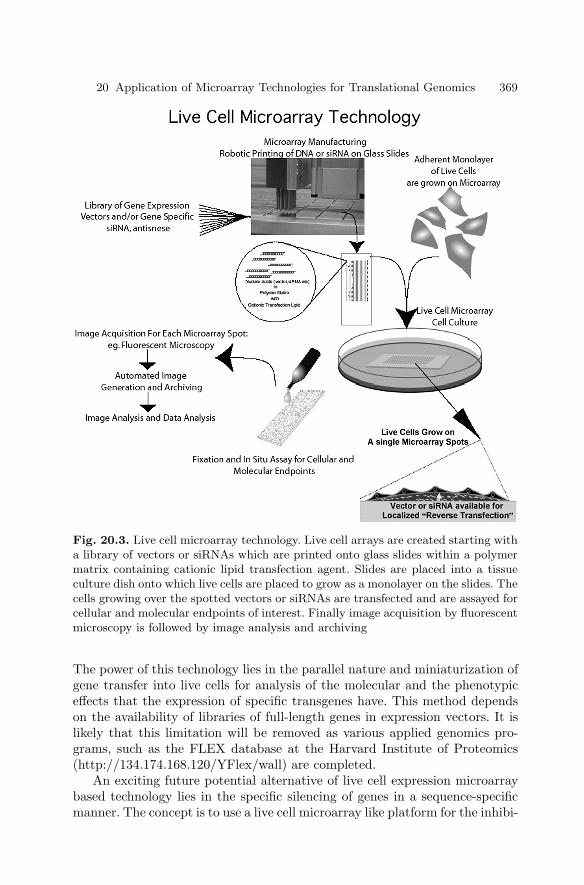
20 Application of Microarray Technologies for Translational Genomics 369
Fig. 20.3. Live cell microarray technology. Live cell arrays are created starting witha library of vectors or siRNAs which are printed onto glass slides within a polymermatrix containing cationic lipid transfection agent. Slides are placed into a tissueculture dish onto which live cells are placed to grow as a monolayer on the slides. Thecells growing over the spotted vectors or siRNAs are transfected and are assayed forcellular and molecular endpoints of interest. Finally image acquisition by fluorescentmicroscopy is followed by image analysis and archiving
The power of this technology lies in the parallel nature and miniaturization ofgene transfer into live cells for analysis of the molecular and the phenotypiceffects that the expression of specific transgenes have. This method dependson the availability of libraries of full-length genes in expression vectors. It islikely that this limitation will be removed as various applied genomics pro-grams, such as the FLEX database at the Harvard Institute of Proteomics(http://134.174.168.120/YFlex/wall) are completed.
An exciting future potential alternative of live cell expression microarraybased technology lies in the specific silencing of genes in a sequence-specificmanner. The concept is to use a live cell microarray like platform for the inhibi-
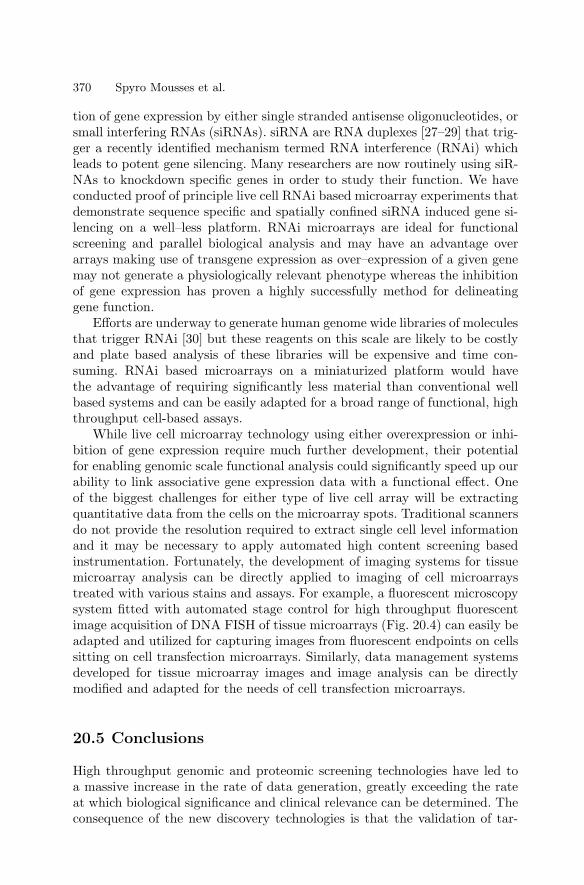
370 Spyro Mousses et al.
tion of gene expression by either single stranded antisense oligonucleotides, orsmall interfering RNAs (siRNAs). siRNA are RNA duplexes [27–29] that trig-ger a recently identified mechanism termed RNA interference (RNAi) whichleads to potent gene silencing. Many researchers are now routinely using siR-NAs to knockdown specific genes in order to study their function. We haveconducted proof of principle live cell RNAi based microarray experiments thatdemonstrate sequence specific and spatially confined siRNA induced gene si-lencing on a well–less platform. RNAi microarrays are ideal for functionalscreening and parallel biological analysis and may have an advantage overarrays making use of transgene expression as over–expression of a given genemay not generate a physiologically relevant phenotype whereas the inhibitionof gene expression has proven a highly successfully method for delineatinggene function.
Efforts are underway to generate human genome wide libraries of moleculesthat trigger RNAi [30] but these reagents on this scale are likely to be costlyand plate based analysis of these libraries will be expensive and time con-suming. RNAi based microarrays on a miniaturized platform would havethe advantage of requiring significantly less material than conventional wellbased systems and can be easily adapted for a broad range of functional, highthroughput cell-based assays.
While live cell microarray technology using either overexpression or inhi-bition of gene expression require much further development, their potentialfor enabling genomic scale functional analysis could significantly speed up ourability to link associative gene expression data with a functional effect. Oneof the biggest challenges for either type of live cell array will be extractingquantitative data from the cells on the microarray spots. Traditional scannersdo not provide the resolution required to extract single cell level informationand it may be necessary to apply automated high content screening basedinstrumentation. Fortunately, the development of imaging systems for tissuemicroarray analysis can be directly applied to imaging of cell microarraystreated with various stains and assays. For example, a fluorescent microscopysystem fitted with automated stage control for high throughput fluorescentimage acquisition of DNA FISH of tissue microarrays (Fig. 20.4) can easily beadapted and utilized for capturing images from fluorescent endpoints on cellssitting on cell transfection microarrays. Similarly, data management systemsdeveloped for tissue microarray images and image analysis can be directlymodified and adapted for the needs of cell transfection microarrays.
20.5 Conclusions
High throughput genomic and proteomic screening technologies have led toa massive increase in the rate of data generation, greatly exceeding the rateat which biological significance and clinical relevance can be determined. Theconsequence of the new discovery technologies is that the validation of tar-
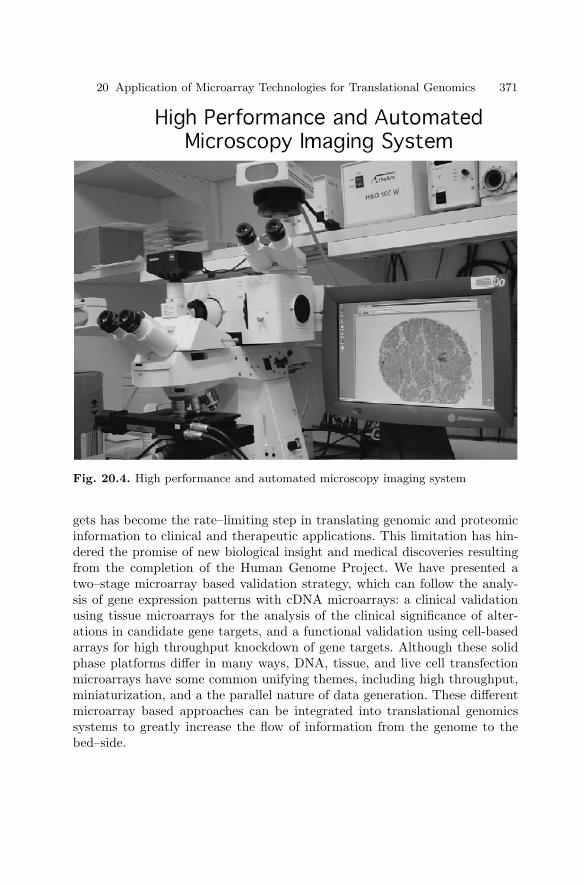
20 Application of Microarray Technologies for Translational Genomics 371
Fig. 20.4. High performance and automated microscopy imaging system
gets has become the rate–limiting step in translating genomic and proteomicinformation to clinical and therapeutic applications. This limitation has hin-dered the promise of new biological insight and medical discoveries resultingfrom the completion of the Human Genome Project. We have presented atwo–stage microarray based validation strategy, which can follow the analy-sis of gene expression patterns with cDNA microarrays: a clinical validationusing tissue microarrays for the analysis of the clinical significance of alter-ations in candidate gene targets, and a functional validation using cell-basedarrays for high throughput knockdown of gene targets. Although these solidphase platforms differ in many ways, DNA, tissue, and live cell transfectionmicroarrays have some common unifying themes, including high throughput,miniaturization, and a the parallel nature of data generation. These differentmicroarray based approaches can be integrated into translational genomicssystems to greatly increase the flow of information from the genome to thebed–side.
372 Spyro Mousses et al.
References
1. Birney E, Bateman A, Clamp ME, Hubbard TJ. Mining the draft humangenome. Nature 2001, 409:827–828
2. Collins FS, Patrinos A, Jordan E, Chakravarti A, Gesteland R, Walters L. Newgoals for the US Human Genome Project. 1998–2003. Science 1998, 282:682–689
3. Lander ES, Linton LM, Birren B, Nusbaum C, Zody MC, Baldwin J, Devon K,Dewar K, Doyle M, FitzHugh W et al.. Initial sequencing and analysis of thehuman genome. Nature 2001, 409:860–921
4. Venter JC, Adams MD, Myers EW, Li PW, Mural RJ, Sutton GG, Smith HO,Yandell M, Evans CA, Holt RA et al.. The sequence of the human genome.Science 2001, 291:1304–1351
5. Wolfsberg TG, McEntyre J, Schuler GD. Guide to the draft human genome.Nature 2001, 409:824–826
6. Lockhart DJ, Dong H, Byrne MC, Follettie MT, Gallo MV, Chee MS, Mitt-mann M, Wang C, Kobayashi M, Horton H, Brown EL. Expression monitoringby hybridization to high–density oligonucleotide arrays. Nat Biotechnol 1996,14:1675–1680
7. Schena M, Shalon D, Davis RW, Brown PO. Quantitative monitoring of geneexpression patterns with a complementary DNA microarray. Science 1995,270:467–470
8. Schena M, Shalon D, Heller R, Chai A, Brown PO, Davis RW. Parallel humangenome analysis: microarray–based expression monitoring of 1000 genes. ProcNatl Acad Sci USA 1996, 93:10614–10619
9. Shoemaker DD, Schadt EE, Armour CD, He YD, Garrett-Engele P, McDon-agh PD, Loerch PM, Leonardson A, Lum PY, Cavet G et al.. Experimentalannotation of the human genome using microarray technology. Nature 2001,409:922–927
10. Bittner M, Meltzer P, Chen Y, Jiang Y, Seftor E, Hendrix M, Radmacher M,Simon R, Yakhini Z, Ben-Dor A et al.. Molecular classification of cutaneousmalignant melanoma by gene expression profiling. Nature 2000, 406:536–540
11. DeRisi J, Penland L, Brown PO, Bittner ML, Meltzer PS, Ray M, Chen Y, SuYA, Trent JM. Use of a cDNA microarray to analyse gene expression patternsin human cancer. Nat Genet 1996, 14:457–460
12. Golub TR, Slonim DK, Tamayo P, Huard C, Gaasenbeek M, Mesirov JP, CollerH, Loh ML, Downing JR, Caligiuri MA et al.. Molecular classification of cancer:class discovery and class prediction by gene expression monitoring. Science 1999,286:531–537
13. Perou CM, Sorlie T, Eisen MB, van de Rijn M, Jeffrey SS, Rees CA, PollackJR, Ross DT, Johnsen H, Akslen LA et al.. Molecular portraits of human breasttumours. Nature 2000, 406:747–752
14. Kallioniemi OP, Wagner U, Kononen J, Sauter G. Tissue microarray technologyfor high–throughput molecular profiling of cancer. Hum Mol Genet 2001, 10:657–662
15. Kononen J, Bubendorf L, Kallioniemi A, Barlund M, Schraml P, Leighton S,Torhorst J, Mihatsch MJ, Sauter G, Kallioniemi OP. Tissue microarrays forhigh–throughput molecular profiling of tumor specimens. Nat Med 1998, 4:844–847
20 Application of Microarray Technologies for Translational Genomics 373
16. Kononen J, Hostetter G, Sauter G, Kallioniemi OP. Construction of tissue mi-croarrays. In A Companion to Molecular Cloning, vol 4, edn 3. Edited by BowtellD, Sambrook J. Cold Spring Harbor: Cold Spring Harbor Laboratory Press,2001: in press
17. Barlund M, Forozan F, Kononen J, Bubendorf L, Chen Y, Bittner ML, TorhorstJ, Haas P, Bucher C, Sauter G et al.. Detecting activation of ribosomal proteinS6 kinase by complementary DNA and tissue microarray analysis. J Natl CancerInst 2000, 92:1252–1259
18. Moch H, Schraml P, Bubendorf L, Mirlacher M, Kononen J, Gasser T, MihatschMJ, Kallioniemi OP, Sauter G. High–throughput tissue microarray analysis toevaluate genes uncovered by cDNA microarray screening in renal cell carcinoma.Am J Pathol 1999, 154:981–986
19. Sugita M, Geraci M, Gao B, Powell RL, Hirsch FR, Johnson G, Lapadat R,Gabrielson E, Bremnes R, Bunn PA and Franklin WA. Combined use of oligonu-cleotide and tissue microarrays identifies cancer/testis antigens as bio-markersin lung carcinoma. Cancer Res 2002;62(14): 3971–9
20. Sallinen SL, Sallinen PK, Haapasalo HK, Helin HJ, Helen PT, Schraml P,Kallioniemi OP, Kononen J. Identification of differentially expressed genes inhuman gliomas by DNA microarray and tissue chip techniques. Cancer Res 2000,60:6617–6622
21. Ginestier C, Charafe-Jauffret E, Bertucci F, Eisinger F, Geneix J, Bechlian D,Conte N, Adelaide J, Toiron Y, Nguyen C, Viens P, Mozziconacci MJ, Houl-gatte R, Birnbaum D, Jacquemier J. Distinct and complementary informationprovided by use of tissue and DNA microarrays in the study of breast tumormarkers. Am J Path 2002;161(4):1223–33
22. Mousses, S., Bubendorf, L., Wagner, U., Hostetter, G., Kononen, J., Corneli-son, R., Goldberger, N., Elkahloun, A.G., Willi, N., Koivisto, P., Ferhle, W.,Raffeld, M., Sauter, G., Kallioniemi, OP. Clinical validation of candidate genesassociated with prostate cancer progression in the CWR22 model system usingtissue microarrays. Cancer Research 2002; 62(5): 1256–60
23. Dhanasekaran SM, Barrette TR, Ghosh D, Shah R, Varambally S, Kurachi K,Pienta KJ, Rubin MA, Chinnaiyan AM. Delineation of prognostic bio-markersin prostate cancer. Nature 2001, 412:822–826
24. Toby GG, Golemis EA. Using the yeast interaction trap and other two–hybrid–based approaches to study protein–protein interactions. Methods 2001, 24:201–217
25. Vidal M, Endoh H. Prospects for drug screening using the reverse two–hybridsystem. Trends Biotechnol 1999, 17:374–381
26. Ziauddin J, Sabatini DM. Microarrays of cells expressing defined cDNAs. Nature2001, 411:107–110.1
27. Caplen NJ, Parrish S, Imani F, Fire A, Morgan RA. Specific inhibition of geneexpression by small double–stranded RNAs in invertebrate and vertebrate sys-tems. Proc Natl Acad Sci USA 2001, 98:9742–9747
28. Elbashir SM, Lendeckel W, Tuschl T. RNA interference is mediated by 21– and22–nucleotide RNAs. Genes Dev 2001, 15:188–200
29. Elbashir SM, Harborth J, Lendeckel W, Yalcin A, Weber K, Tuschl T. Duplexesof 21–nucleotide RNAs mediate RNA interference in cultured mammalian cells.Nature 2001, 411:494–498
30. Hannon GJ. RNA interference. Nature 2002;418:244–51

374 Spyro Mousses et al.
31. Khan J, Wei JS, Ringner M, Saal LH, Ladanyi M, Westermann F, BertholdF, Schwab M, Antonescu CR, Peterson C, Meltzer PS. Classification and diag-nostic prediction of cancers using gene expression profiling and artificial neuralnetworks. Nat Med 2001, 7:673–679
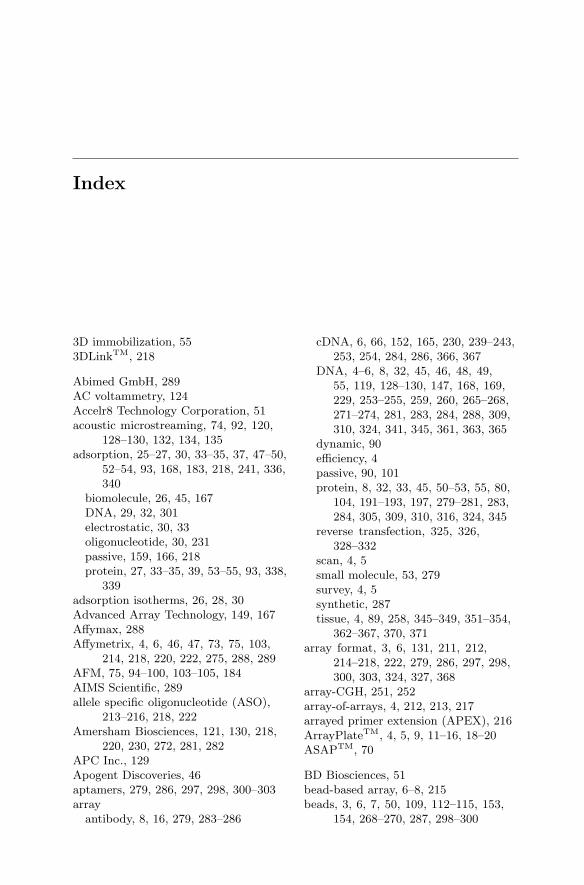
Index
3D immobilization, 553DLinkTM, 218
Abimed GmbH, 289AC voltammetry, 124Accelr8 Technology Corporation, 51acoustic microstreaming, 74, 92, 120,
128–130, 132, 134, 135adsorption, 25–27, 30, 33–35, 37, 47–50,
52–54, 93, 168, 183, 218, 241, 336,340
biomolecule, 26, 45, 167DNA, 29, 32, 301electrostatic, 30, 33oligonucleotide, 30, 231passive, 159, 166, 218protein, 27, 33–35, 39, 53–55, 93, 338,
339adsorption isotherms, 26, 28, 30Advanced Array Technology, 149, 167Affymax, 288Affymetrix, 4, 6, 46, 47, 73, 75, 103,
214, 218, 220, 222, 275, 288, 289AFM, 75, 94–100, 103–105, 184AIMS Scientific, 289allele specific oligonucleotide (ASO),
213–216, 218, 222Amersham Biosciences, 121, 130, 218,
220, 230, 272, 281, 282APC Inc., 129Apogent Discoveries, 46aptamers, 279, 286, 297, 298, 300–303array
antibody, 8, 16, 279, 283–286
cDNA, 6, 66, 152, 165, 230, 239–243,253, 254, 284, 286, 366, 367
DNA, 4–6, 8, 32, 45, 46, 48, 49,55, 119, 128–130, 147, 168, 169,229, 253–255, 259, 260, 265–268,271–274, 281, 283, 284, 288, 309,310, 324, 341, 345, 361, 363, 365
dynamic, 90efficiency, 4passive, 90, 101protein, 8, 32, 33, 45, 50–53, 55, 80,
104, 191–193, 197, 279–281, 283,284, 305, 309, 310, 316, 324, 345
reverse transfection, 325, 326,328–332
scan, 4, 5small molecule, 53, 279survey, 4, 5synthetic, 287tissue, 4, 89, 258, 345–349, 351–354,
362–367, 370, 371array format, 3, 6, 131, 211, 212,
214–218, 222, 279, 286, 297, 298,300, 303, 324, 327, 368
array-CGH, 251, 252array-of-arrays, 4, 212, 213, 217arrayed primer extension (APEX), 216ArrayPlateTM, 4, 5, 9, 11–16, 18–20ASAPTM, 70
BD Biosciences, 51bead-based array, 6–8, 215beads, 3, 6, 7, 50, 109, 112–115, 153,
154, 268–270, 287, 298–300
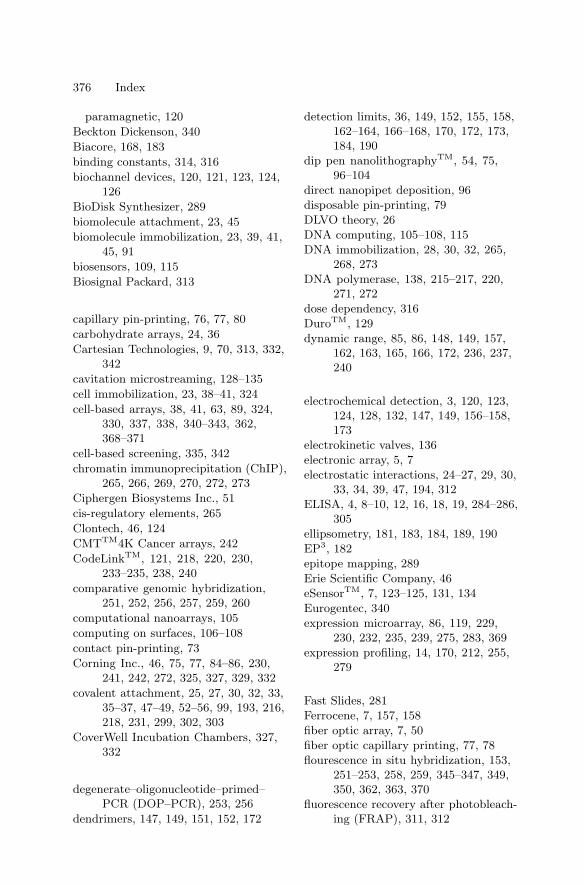
376 Index
paramagnetic, 120
Beckton Dickenson, 340
Biacore, 168, 183
binding constants, 314, 316
biochannel devices, 120, 121, 123, 124,126
BioDisk Synthesizer, 289
biomolecule attachment, 23, 45
biomolecule immobilization, 23, 39, 41,45, 91
biosensors, 109, 115
Biosignal Packard, 313
capillary pin-printing, 76, 77, 80
carbohydrate arrays, 24, 36
Cartesian Technologies, 9, 70, 313, 332,342
cavitation microstreaming, 128–135
cell immobilization, 23, 38–41, 324
cell-based arrays, 38, 41, 63, 89, 324,330, 337, 338, 340–343, 362,368–371
cell-based screening, 335, 342
chromatin immunoprecipitation (ChIP),265, 266, 269, 270, 272, 273
Ciphergen Biosystems Inc., 51
cis-regulatory elements, 265
Clontech, 46, 124
CMTTM4K Cancer arrays, 242
CodeLinkTM, 121, 218, 220, 230,233–235, 238, 240
comparative genomic hybridization,251, 252, 256, 257, 259, 260
computational nanoarrays, 105
computing on surfaces, 106–108
contact pin-printing, 73
Corning Inc., 46, 75, 77, 84–86, 230,241, 242, 272, 325, 327, 329, 332
covalent attachment, 25, 27, 30, 32, 33,35–37, 47–49, 52–56, 99, 193, 216,218, 231, 299, 302, 303
CoverWell Incubation Chambers, 327,332
degenerate–oligonucleotide–primed–PCR (DOP–PCR), 253, 256
dendrimers, 147, 149, 151, 152, 172
detection limits, 36, 149, 152, 155, 158,162–164, 166–168, 170, 172, 173,184, 190
dip pen nanolithographyTM, 54, 75,96–104
direct nanopipet deposition, 96
disposable pin-printing, 79DLVO theory, 26
DNA computing, 105–108, 115DNA immobilization, 28, 30, 32, 265,
268, 273
DNA polymerase, 138, 215–217, 220,271, 272
dose dependency, 316DuroTM, 129
dynamic range, 85, 86, 148, 149, 157,162, 163, 165, 166, 172, 236, 237,240
electrochemical detection, 3, 120, 123,124, 128, 132, 147, 149, 156–158,173
electrokinetic valves, 136electronic array, 5, 7
electrostatic interactions, 24–27, 29, 30,33, 34, 39, 47, 194, 312
ELISA, 4, 8–10, 12, 16, 18, 19, 284–286,305
ellipsometry, 181, 183, 184, 189, 190
EP3, 182epitope mapping, 289
Erie Scientific Company, 46eSensorTM, 7, 123–125, 131, 134
Eurogentec, 340expression microarray, 86, 119, 229,
230, 232, 235, 239, 275, 283, 369
expression profiling, 14, 170, 212, 255,279
Fast Slides, 281
Ferrocene, 7, 157, 158fiber optic array, 7, 50
fiber optic capillary printing, 77, 78flourescence in situ hybridization, 153,
251–253, 258, 259, 345–347, 349,350, 362, 363, 370
fluorescence recovery after photobleach-ing (FRAP), 311, 312
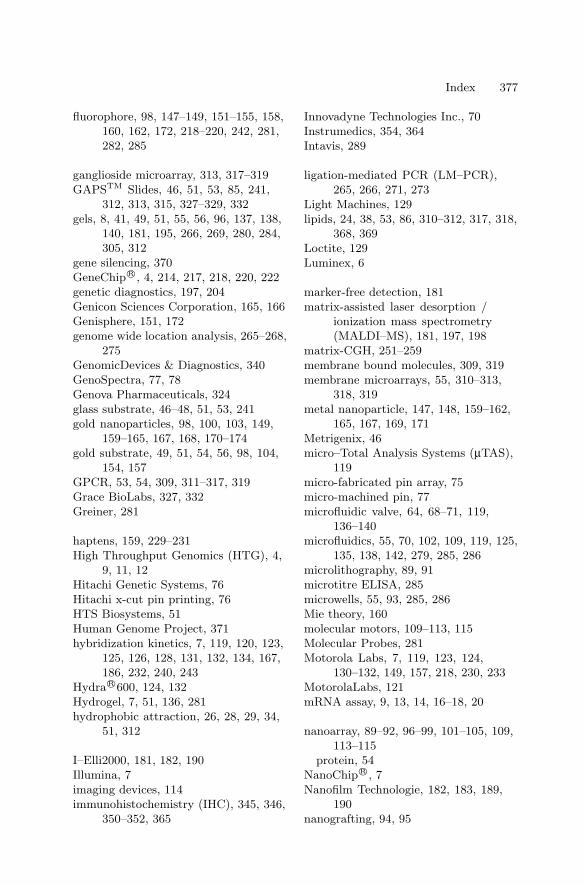
Index 377
fluorophore, 98, 147–149, 151–155, 158,160, 162, 172, 218–220, 242, 281,282, 285
ganglioside microarray, 313, 317–319GAPSTM Slides, 46, 51, 53, 85, 241,
312, 313, 315, 327–329, 332gels, 8, 41, 49, 51, 55, 56, 96, 137, 138,
140, 181, 195, 266, 269, 280, 284,305, 312
gene silencing, 370GeneChipR©, 4, 214, 217, 218, 220, 222genetic diagnostics, 197, 204Genicon Sciences Corporation, 165, 166Genisphere, 151, 172genome wide location analysis, 265–268,
275GenomicDevices & Diagnostics, 340GenoSpectra, 77, 78Genova Pharmaceuticals, 324glass substrate, 46–48, 51, 53, 241gold nanoparticles, 98, 100, 103, 149,
159–165, 167, 168, 170–174gold substrate, 49, 51, 54, 56, 98, 104,
154, 157GPCR, 53, 54, 309, 311–317, 319Grace BioLabs, 327, 332Greiner, 281
haptens, 159, 229–231High Throughput Genomics (HTG), 4,
9, 11, 12Hitachi Genetic Systems, 76Hitachi x-cut pin printing, 76HTS Biosystems, 51Human Genome Project, 371hybridization kinetics, 7, 119, 120, 123,
125, 126, 128, 131, 132, 134, 167,186, 232, 240, 243
HydraR©600, 124, 132Hydrogel, 7, 51, 136, 281hydrophobic attraction, 26, 28, 29, 34,
51, 312
I–Elli2000, 181, 182, 190Illumina, 7imaging devices, 114immunohistochemistry (IHC), 345, 346,
350–352, 365
Innovadyne Technologies Inc., 70Instrumedics, 354, 364Intavis, 289
ligation-mediated PCR (LM–PCR),265, 266, 271, 273
Light Machines, 129lipids, 24, 38, 53, 86, 310–312, 317, 318,
368, 369Loctite, 129Luminex, 6
marker-free detection, 181matrix-assisted laser desorption /
ionization mass spectrometry(MALDI–MS), 181, 197, 198
matrix-CGH, 251–259membrane bound molecules, 309, 319membrane microarrays, 55, 310–313,
318, 319metal nanoparticle, 147, 148, 159–162,
165, 167, 169, 171Metrigenix, 46micro–Total Analysis Systems (µTAS),
119micro-fabricated pin array, 75micro-machined pin, 77microfluidic valve, 64, 68–71, 119,
136–140microfluidics, 55, 70, 102, 109, 119, 125,
135, 138, 142, 279, 285, 286microlithography, 89, 91microtitre ELISA, 285microwells, 55, 93, 285, 286Mie theory, 160molecular motors, 109–113, 115Molecular Probes, 281Motorola Labs, 7, 119, 123, 124,
130–132, 149, 157, 218, 230, 233MotorolaLabs, 121mRNA assay, 9, 13, 14, 16–18, 20
nanoarray, 89–92, 96–99, 101–105, 109,113–115
protein, 54NanoChipR©, 7Nanofilm Technologie, 182, 183, 189,
190nanografting, 94, 95
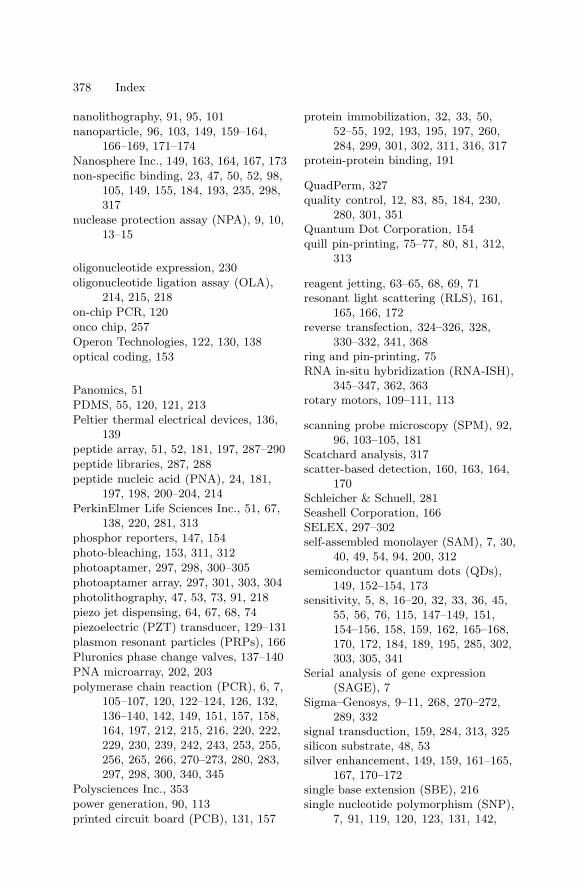
378 Index
nanolithography, 91, 95, 101nanoparticle, 96, 103, 149, 159–164,
166–169, 171–174Nanosphere Inc., 149, 163, 164, 167, 173non-specific binding, 23, 47, 50, 52, 98,
105, 149, 155, 184, 193, 235, 298,317
nuclease protection assay (NPA), 9, 10,13–15
oligonucleotide expression, 230oligonucleotide ligation assay (OLA),
214, 215, 218on-chip PCR, 120onco chip, 257Operon Technologies, 122, 130, 138optical coding, 153
Panomics, 51PDMS, 55, 120, 121, 213Peltier thermal electrical devices, 136,
139peptide array, 51, 52, 181, 197, 287–290peptide libraries, 287, 288peptide nucleic acid (PNA), 24, 181,
197, 198, 200–204, 214PerkinElmer Life Sciences Inc., 51, 67,
138, 220, 281, 313phosphor reporters, 147, 154photo-bleaching, 153, 311, 312photoaptamer, 297, 298, 300–305photoaptamer array, 297, 301, 303, 304photolithography, 47, 53, 73, 91, 218piezo jet dispensing, 64, 67, 68, 74piezoelectric (PZT) transducer, 129–131plasmon resonant particles (PRPs), 166Pluronics phase change valves, 137–140PNA microarray, 202, 203polymerase chain reaction (PCR), 6, 7,
105–107, 120, 122–124, 126, 132,136–140, 142, 149, 151, 157, 158,164, 197, 212, 215, 216, 220, 222,229, 230, 239, 242, 243, 253, 255,256, 265, 266, 270–273, 280, 283,297, 298, 300, 340, 345
Polysciences Inc., 353power generation, 90, 113printed circuit board (PCB), 131, 157
protein immobilization, 32, 33, 50,52–55, 192, 193, 195, 197, 260,284, 299, 301, 302, 311, 316, 317
protein-protein binding, 191
QuadPerm, 327quality control, 12, 83, 85, 184, 230,
280, 301, 351Quantum Dot Corporation, 154quill pin-printing, 75–77, 80, 81, 312,
313
reagent jetting, 63–65, 68, 69, 71resonant light scattering (RLS), 161,
165, 166, 172reverse transfection, 324–326, 328,
330–332, 341, 368ring and pin-printing, 75RNA in-situ hybridization (RNA-ISH),
345–347, 362, 363rotary motors, 109–111, 113
scanning probe microscopy (SPM), 92,96, 103–105, 181
Scatchard analysis, 317scatter-based detection, 160, 163, 164,
170Schleicher & Schuell, 281Seashell Corporation, 166SELEX, 297–302self-assembled monolayer (SAM), 7, 30,
40, 49, 54, 94, 200, 312semiconductor quantum dots (QDs),
149, 152–154, 173sensitivity, 5, 8, 16–20, 32, 33, 36, 45,
55, 56, 76, 115, 147–149, 151,154–156, 158, 159, 162, 165–168,170, 172, 184, 189, 195, 285, 302,303, 305, 341
Serial analysis of gene expression(SAGE), 7
Sigma–Genosys, 9–11, 268, 270–272,289, 332
signal transduction, 159, 284, 313, 325silicon substrate, 48, 53silver enhancement, 149, 159, 161–165,
167, 170–172single base extension (SBE), 216single nucleotide polymorphism (SNP),
7, 91, 119, 120, 123, 131, 142,
Index 379
147–149, 151, 154, 158, 163, 164,172, 173, 197, 198, 211–220, 222
single nucleotide primer extension(SNE), 215–217, 219
single-cell comparative genomichybridization (SCOMP), 253, 256
solenoid jet dispensing, 64, 68–71, 74solid pin-printing, 74, 75, 80, 81SomaLogic, 299SPBIOTM Microarray Station, 76SPOT, 288, 289SpotBotTM Personal Microarrayer, 122,
138stealth pin-printing, 76, 77, 79steric effects, 155, 166, 167, 282surface plasmon resonance (SPR), 3, 45,
49, 51, 54, 149, 159–161, 167–169,181, 183–185, 189, 190, 282
surface-enhanced Raman scattering(SERS), 149, 169, 170, 173
SurModics, 46, 121, 218
Taqman, 239, 240
TeleChem International Inc., 51, 52, 76,77, 79, 122, 332, 333
thermal jet dispensing, 64, 65time correlated single photon counting
(TCSPC), 191, 196time–of–flight secondary ion mass
spectrometry (TOF–SIMS), 181,198–204
titanium dioxide substrates, 51, 54transcription factors, 211, 265, 267, 268,
275translational genomics, 361, 362, 368,
371
Universal Protein Stain, 301, 303
van der Waals forces, 25–28, 30, 155virus, 99, 103, 323, 336VP–Scientific, 79
Xenopore, 46
Zyomyx Inc., 51, 54
Related Documents


