Biological and Environmental Engineering Soil & Water Research Group Re-conceptualizing SWAT for Variable Source Area Hydrology Zachary Easton 1* , Daniel Fuka 1 , Todd Walter 1 , Dillon Cowan 2 , Elliot Schneiderman 3 , Tammo Steenhuis 1 1 Dept. Biological and Environmental Engineering, Cornell University 2 School of Civil and Environmental * [email protected]

Welcome message from author
This document is posted to help you gain knowledge. Please leave a comment to let me know what you think about it! Share it to your friends and learn new things together.
Transcript

Biological and Environmental Engineering
Soil & Water Research Group
Re-conceptualizing SWAT for Variable Source Area Hydrology
Zachary Easton1*, Daniel Fuka1, Todd Walter1, Dillon Cowan2, Elliot Schneiderman3, Tammo Steenhuis1
1Dept. Biological and Environmental Engineering, Cornell University2School of Civil and Environmental Engineering, Cornell University
3New York City Dept. Environmental Protection, Kingston, NY*[email protected]

Biological and Environmental Engineering
Soil & Water Research Group
Re-conceptualizing SWAT
• Variable Source Area (VSA) Hydrology• Curve Number and VSA hydrology• Convincing SWAT it recognizes VSAs

Biological and Environmental Engineering
Soil & Water Research Group
Rain
Infiltration
“Runoff”
Common Perception of Runoff
Infiltration Excessa.k.a. Hortonian Flow (Horton 1933, 1940)

Biological and Environmental Engineering
Soil & Water Research Group
NewNew YorkYork
March
AprilM
ayJu
ne
July
August
September
October
November
1 10 100
20
0
30
50
40
70
60
80
100
90
10
Return Period (yr)
% o
f Are
a G
ener
ating
Hor
toni
an F
low
Is Hortonian Flow Common?
Walter et al. 2003. ASCE J. Hydrol. Eng. 8: 214-218
Biological and Environmental Engineering
Soil & Water Research Group
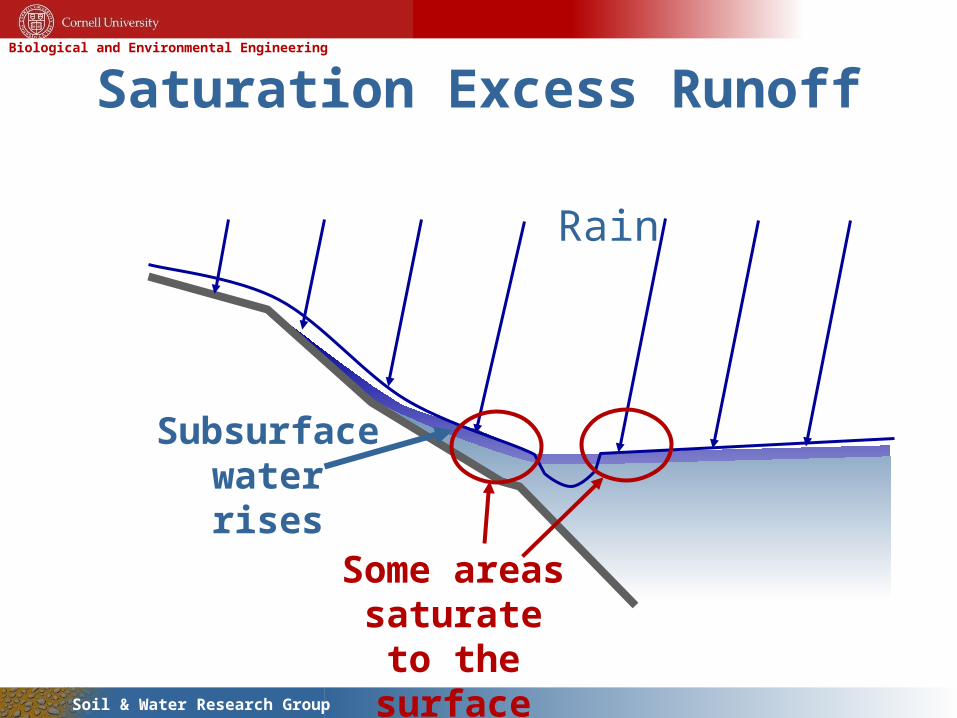
Rain
Subsurfacewaterrises
Some areas saturate to the surface
Saturation Excess Runoff

Biological and Environmental Engineering
Soil & Water Research Group
Rain
Rain on saturated areas becomes overland flow
Upland interflow may exfiltrate
Dunne and Black. 1970. Water Resour. Res. 6: 478-490Dunne and Black. 1970. Water Resour. Res. 6: 1296-1311
Saturation Excess Runoff

Biological and Environmental Engineering
Soil & Water Research Group
Variable Source Areas
Current Water Quality Models were not Intended to Capture this Complexity•General Watershed Loading Function (GWLF)•Soil Water Assessment Tool (SWAT)•Agricultural Nonpoint Source Pollution Model (AGNPS)
Flow Path
Biological and Environmental Engineering
Soil & Water Research Group
Re-conceptualizing SWAT
• Variable Source Area (VSA) Hydrology• Curve Number and VSA hydrology• Convincing SWAT it recognizes VSAs

Biological and Environmental Engineering
Soil & Water Research Group
USDA-NRCS Curve Number Model
“Runoff”=Pe2/(Pe+S)
S=25400/CN-254
Tables link CN to land use andsoil infiltration capacity

Biological and Environmental Engineering
Soil & Water Research Group
Curve Numbering VSA hydrologyQ = Pe
2/(Pe+S)Watershed
UnsaturatedSaturated
AfQ
P
Steenhuis et al. 1995. ASCE Div Drain. & Irr. 121:234-238
Q = AfPe
dQ/dPe = Af
Af = f(S,Pe)

Biological and Environmental Engineering
Soil & Water Research Group
We know how much area is contributing…
…but from where in the landscape?
Af = f(S,Pe)

Biological and Environmental Engineering
Soil & Water Research Group
High : 33.103500
Low : 3.520011
Soil Topographic Index
33.10
3.52
Soil Topographic IndexWetness Index Classes
10=f(S)
=f(S)
=f(S)=f(S)
=f(S)
=f(S)
=f(S) =f(S)
f(S)
=f(S)
Easton et al., 2008. J. Hydrol. 348: 279-291.Lyon et al. 2004. Hydrol. Proc. 18(15): 2757-2771.Schneiderman et al. 2007. Hydrol. Proc. 21: 3420-3430.
Wetness IndexClasses
ilocal storage

Biological and Environmental Engineering
Soil & Water Research Group
Re-conceptualizing SWAT
• Variable Source Area (VSA) Hydrology• Curve Number and VSA hydrology• Convincing SWAT it recognizes VSAs

Biological and Environmental Engineering
Soil & Water Research Group
Soils Landuse
HRUs
Revisit the HRU concept• Define HRUs as the
coincidence of soil type and landuse• Hydrological/chemical
properties are defined at the HRU
• So runoff/P loss is the same here (lowland pasture)
• As here (upland pasture)• Is this a good assumption?

Biological and Environmental Engineering
Soil & Water Research Group
LanduseSTI
HRUs
SSURGO
• VSA concept defines HRUs as the coincidence of soil topographic index and landuse
• So runoff/P loss is now not the same here (lowland pasture)
• As here (upland pasture)• Better Assumption?

Biological and Environmental Engineering
Soil & Water Research Group
Distributing CN-values
0102030405060708090
100
0 0.1 0.2 0.3 0.4 0.5 0.6 0.7 0.8 0.9
CN
or
Sto
rage
Fractional Contributing Area
Local Storage
CN
Wetness IndexClasses
• Average of Standard CNs = 73.1 distributed according to landuse/soils
• Average of VSA CNs = 73.1, distributed according to a wetness index

Biological and Environmental Engineering
Soil & Water Research Group
050
100150200250300350400
Jan-99 Mar-99 May-99 Jul-99 Sep-99 Nov-99
So
il W
ater
(mm
)• High runoff prone area = high moisture content (in general)• We relate local soil water storage, e,i, to AWC with the following:
ρb = soil bulk density (g cm-3) clay = soil clay content (cm3 cm-3).
Modify the Available Water Content
5.24
254
100
4.05.0
65.21
,ie
bb clayAWC
Wetness Class 10
Wetness Class 2
Wetness Class 9
Wetness Class 1

Biological and Environmental Engineering
Soil & Water Research Group
0
2
4
6
8
10
12
14
16
Oct-98 Mar-99 Aug-99 Jan-00 Jun-00 Nov-00 Apr-01 Sep-01 Feb-02 Jul-02 Dec-02 May-03 Oct-03 Mar-04 Aug-04
Str
ea
mfl
ow
(c
m)
Measured
SWAT-VSA
0
2
4
6
8
10
12
14
16
Oct-98 Mar-99 Aug-99 Jan-00 Jun-00 Nov-00 Apr-01 Sep-01 Feb-02 Jul-02 Dec-02 May-03 Oct-03 Mar-04 Aug-04
Str
ea
mfl
ow
(c
m)
Measured
SWAT
r2 = 0.76
E = 0.82
r2 = 0.74E = 0.83
0
15
0 15Measured
SW
AT
0
15
0 15Measured
SW
AT
Test Results: Streamflow
-Standard

Biological and Environmental Engineering
Soil & Water Research Group
0
500
1000
1500
2000
2500
3000
3500
1996 1998 2000 2002 2004
Cu
mu
lati
ve
Ru
no
ff (
mm
)
10
1
WetnessIndex
6
0
500
1000
1500
2000
2500
1996 1998 2000 2002 2004C
um
ula
tiv
e R
un
off
(m
m)
a b
SWAT-VSA SWAT-Standard
Test Results: Runoff from Pastures
Easton et al., 2008. J. Hydrol. 348: 279-291

Biological and Environmental Engineering
Soil & Water Research Group
swat_hrus
SURQ [mm]
1.978 - 4.014
4.014 - 4.440
4.440 - 4.783
4.783 - 5.214
5.214 - 5.75
swat_vsa_hrus
SURQ [mm]
0 - 0.939
0.939 - 2.201
2.201 - 4.532
4.532- 8.868
8.868- 10.213
SWAT-VSA Runoff (mm)
SWAT Runoff (mm)
0-0.93 0.93-2.20 2.20-4.53 4.53-8.86 8.86-10.21
0.66-0.93 0.93-2.20 2.20-4.53 4.53-8.86 8.86-10.21
a b
Test Results: Runoff
Easton et al., 2008. J. Hydrol. 348: 279-291
SWAT-VSA SWAT-Standard

Biological and Environmental Engineering
Soil & Water Research Group
SW_END [mm]
93 - 163
163 - 242
242 - 277
277 - 298
298 - 317
SW_END [mm]
65 - 99
99 -139
139 - 196
196 - 245
245 - 304
SWAT Soil Water (mm)
SWAT-VSA Soil Water (mm)
93-163 163-242 242-277 277-298 298-317
93-163 163-242 242-277 277-298 298-317
a b
Test Results: Soil water
Easton et al., 2008. J. Hydrol. 348: 279-291
SWAT-VSA SWAT-Standard

Biological and Environmental Engineering
Soil & Water Research Group
1m Cont.
585 m
600 m
WaterLevelLoggers
0 100 mNTest Results: Soil Water
Data curtsey of :Lyon et al. 2006. Adv. Water Resour. 29(2): 181-193.
Lyon et al. 2006. HESS. 10: 113-125.Wetness Index Classes
10
1

Biological and Environmental Engineering
Soil & Water Research Group
SWAT-VSA
Movie courtesy of Dr. Steve Lyon

Biological and Environmental Engineering
Soil & Water Research Group
R2 = 0.57
500
700
900
1100
1300
1500
500 700 900 1100 1300 1500Measured Water Table (mm)
SW
AT
Wat
er T
able
(m
m)
Mixed ForestPastureShrub
R2 = 0.79
700
900
1100
1300
1500
700 900 1100 1300 1500Measured Water Table (mm)
SW
AT
-VS
A W
ate
r T
ab
le (
mm
)
1098765
a b
Index
Test Results: Soil water
Easton et al., 2008. J. Hydrol. 348: 279-291

Biological and Environmental Engineering
Soil & Water Research Group
0
50
100
150
200
250
300
Oct-98 Apr-99 Oct-99 Apr-00 Oct-00 Apr-01 Oct-01 Apr-02 Oct-02 Apr-03 Oct-03 Apr-04
Dis
solv
ed
P (
kg)
Measured
SWAT-VSA
0
50
100
150
200
250
Oct-98 Apr-99 Oct-99 Apr-00 Oct-00 Apr-01 Oct-01 Apr-02 Oct-02 Apr-03 Oct-03 Apr-04
Dis
solv
ed P
(kg)
Measured
SWAT
r2 = 0.76E = 0.71
r2 = 0.68E = 0.47
a
b
0
300
0 300Measured
SW
AT0
300
0 300MeasuredS
WA
T
Test Results: Phosphorus
-Standard

Biological and Environmental Engineering
Soil & Water Research Group
swat_hrus
ORGP KG/HA
0 - 0.076
0.076 - 0.154
0.154 - 0.189
0.189 - 0.225
0.225 - 0.287
swat_vsa_hrus
ORGP KG/HA
0 - 0.044
0.044 - 0.088
0.088 - 0.223
0.223 - 0.694
0.694 - 0.99
SWAT-VSA Dissolved P (kg ha-1)
SWAT Dissolved P (kg ha-1)
0-0.04 0.04-0.09 0.09-0.22 0.22-0.69 0.69-0.99
0-0.04 0.04-0.09 0.09-0.22 0.22-0.69 0.69-0.99
a b
Test Results: PhosphorusSWAT-VSA SWAT-Standard

Biological and Environmental Engineering
Soil & Water Research Group
Take-home Messages• Storm runoff is generated from small parts of the
landscape• Areas prone to saturate – e.g., toe slopes, shallow soils,
topographically converging areas• Variable Source Areas – they expand and contract
• We can predict where and when storm runoff will be generated
• We can improve integrated and distributed predictions by considering VSAs• Implications for watershed management

Biological and Environmental Engineering
Soil & Water Research Group
Curve Numbering VSA hydrologyQ = Pe
2/(Pe+S)Watershed
UnsaturatedSaturated
AfQ
P
Steenhuis et al. 1995. ASCE Div Drain. & Irr. 121:234-238
Af = f(S,Pe)
Af = dQ/dPe
Af = 1-(S2/(Pe+S)2
As = 1-(S2/(σe+S)2
σe=S(√(1/(1-As))-1
Related Documents