BioInfoSummer, ANU, December 2003 Challenges in the Analysis of GeneChip Microarray data Sue Wilson CMA & CBiS, MSI ANU

BioInfoSummer, ANU, December 2003 Challenges in the Analysis of GeneChip Microarray data Sue Wilson CMA & CBiS, MSI ANU.
Dec 27, 2015
Welcome message from author
This document is posted to help you gain knowledge. Please leave a comment to let me know what you think about it! Share it to your friends and learn new things together.
Transcript
BioInfoSummer, ANU, December 2003
Challenges in the Analysis of GeneChip Microarray data
Sue WilsonCMA & CBiS, MSI
ANU

Outline
I Introduction to/ Summary of GeneChip technology
II Challenges* Relationship between I and mRNA* Design* Analysis* Others, including normalisation and multiple testing

Microarray technologyfor RNA expression
profiling
Largely encompasses 2 different technologies:
1. Spotted cDNA/oligo arrays
2. Short oligonucleotide arrays (Affymetrix’s GeneChip)
Other gene expression assay technologies include:
a. macroarrays
b. Serial analysis of gene expression (SAGE)
c. Long oligonucleotide arrays (Agilent Inkjet)
d. Fibre optic arrays (Illumina)
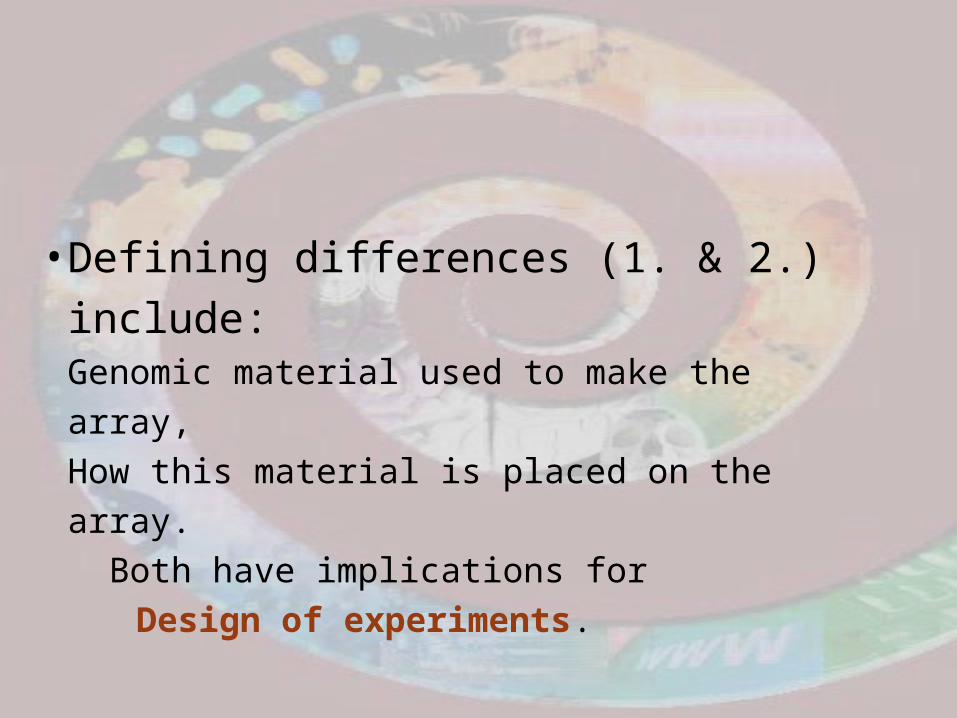
•Defining differences (1. & 2.) include:Genomic material used to make the array,How this material is placed on the array. Both have implications for
Design of experiments.

(Essentially) Shared Features
• HybridizationGenetic material fixed to array - ProbeLabeled c*NA - Target
• Obtaining TargetExtract RNA, reverse transcribe -> cDNA (Spotted - tag with fluorescent dye Oligo GeneChip - biotin-labelled cRNA from cDNA)
• Wash excess c*NA from array (Oligo GeneChip - stain with fluorescent molecule)
• Scan

(Essentially) Shared Features, C’td
The Data• Signal & Background
Image analysis• Transform?

(Essentially) Shared Features, C’td
The Data, c’td• Normalization & scaling
To remove differences between arrays that may be due to the following reasons: * biological - background, sample treatment * biochemical and molecular biology - buffers, enzymes,
reaction conditions * technological - GeneChip & wafer quality, hybridization
conditions
• Replication# & level - technical vs biological;
depends on question/s being addressed

(Essentially) Shared Features, C’td
‘Uncontrolled experimental variables may be introduced at any step in the wet laboratory workup of microarray experiments and may add to observed variances from array to array.’
HV Baker, Stat. Sci., 2003At design stage, important to recognise where UEVs may
be; often unavoidable. Potential sources vary with application. Eg, clinical studies for GE differences between tumour and normal tissue. UEVs may include age, sex, diet, diurnal variations in GE, type of anesthetic used, time from tissue removal to RNA stabilisation, method of RNA isolation, etc.; analogous for laboratory animals except that some of these UEVs can be controlled.
Differential recovery of specific cell types from tissue may bias the GE profile observed for a particular tissue type.

Affymetrix GeneChip technology (Summary)
• Short (25 mer) Oligonucleotides
• 40-60k DNA oligos on ~ 2.5 cm2 glass surface.
• Technology combines oligonucleotide synthesis with photolithographic computer chip technology.
• The oligonucleotides are synthesized on the slide.
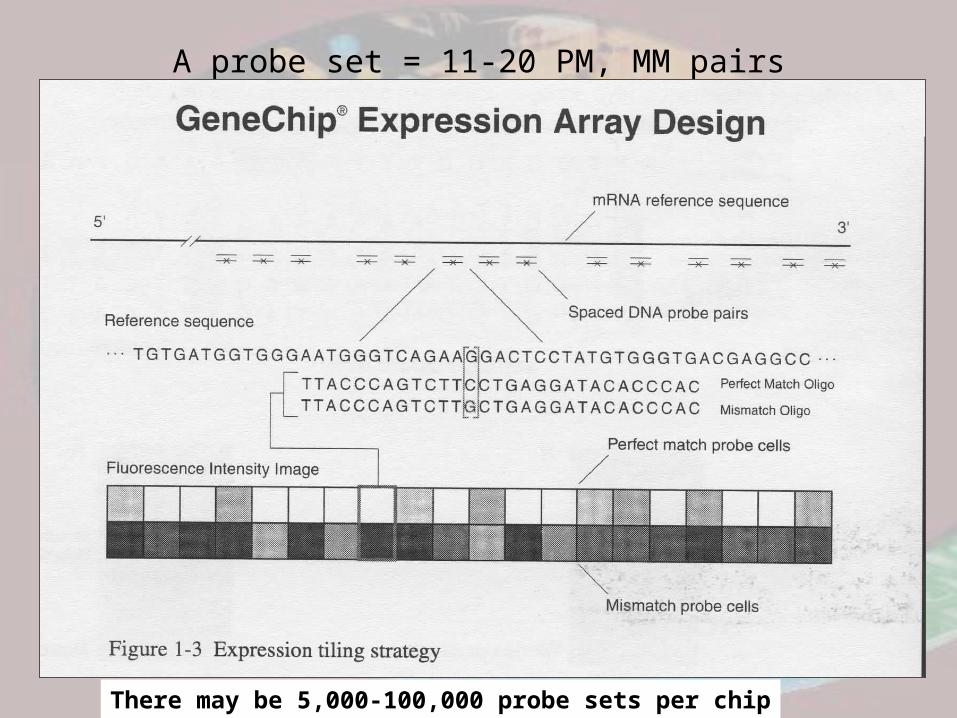
A probe set = 11-20 PM, MM pairs
There may be 5,000-100,000 probe sets per chip
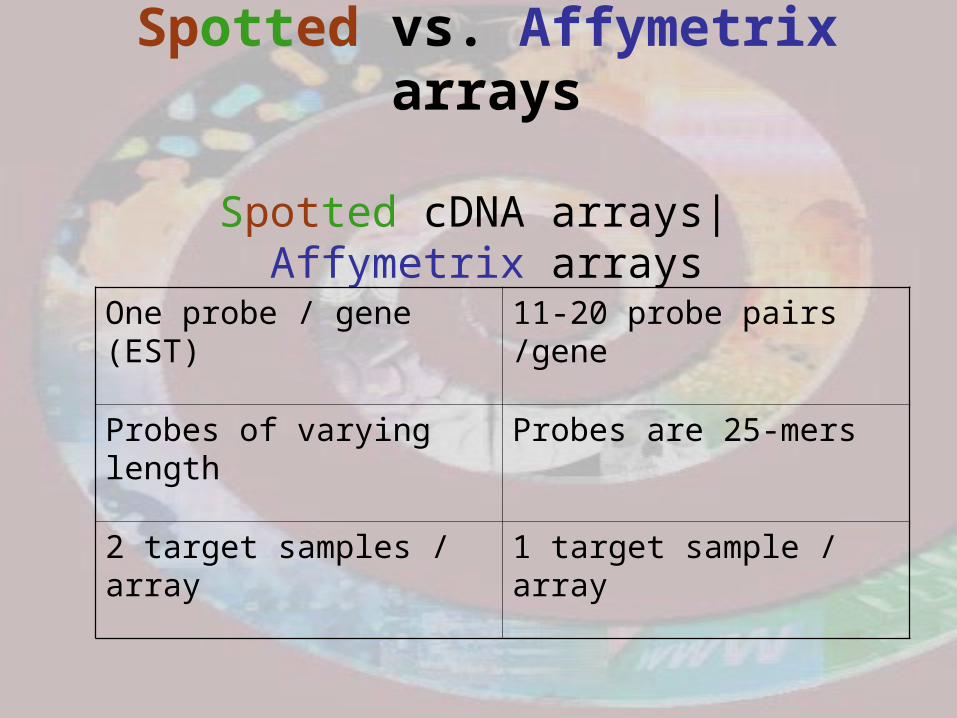
Spotted vs. Affymetrix arrays
Spotted cDNA arrays| Affymetrix arrays
One probe / gene (EST) 11-20 probe pairs /gene
Probes of varying length
Probes are 25-mers
2 target samples / array 1 target sample / array

Oligonucleotide chips
• The manufacturing of GeneChip® probe arrays is a combination of photolithography and combinatorial chemistry. See: Affymetrix Technology [on www]

Oligonucleotide chips

Affy Image analysis
• Raw data, DAT image files -> CEL files• Each probe cell: 10x10 pixels• Gridding: estimate location of probe cell
centres• Signal:
- Reduce -> 8x8 pixels (outer 36 removed)- The probe cell signal is the 75th percentile of 64 values
• Background: Average of lowest 2% probe cell values is subtracted
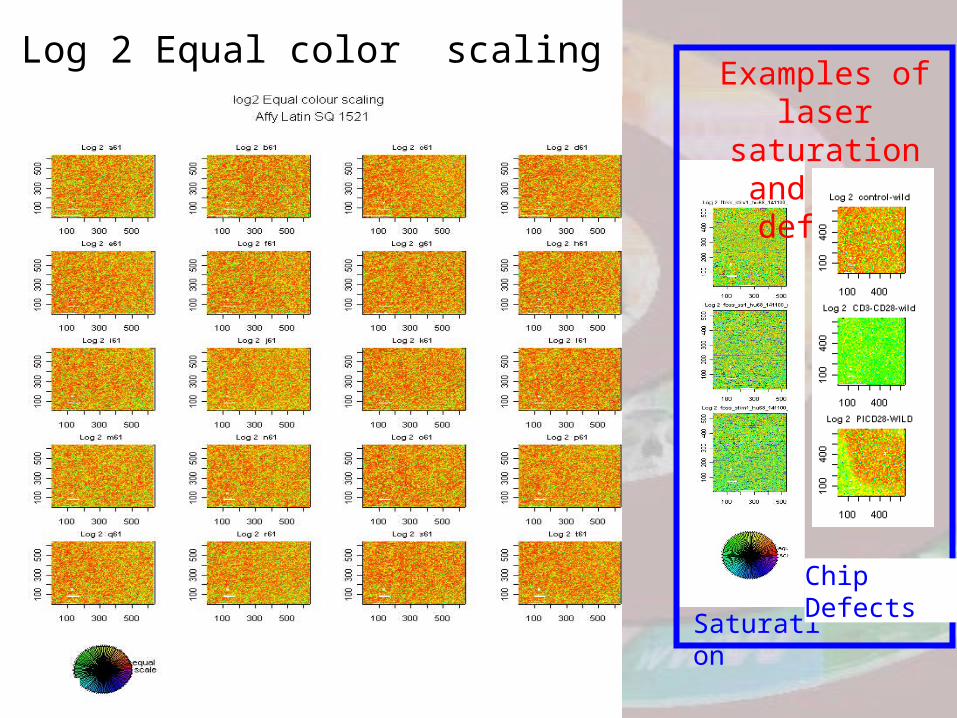
Log 2 Equal color scaling
Saturation
Examples of laser saturation and chip
defects
Chip Defects
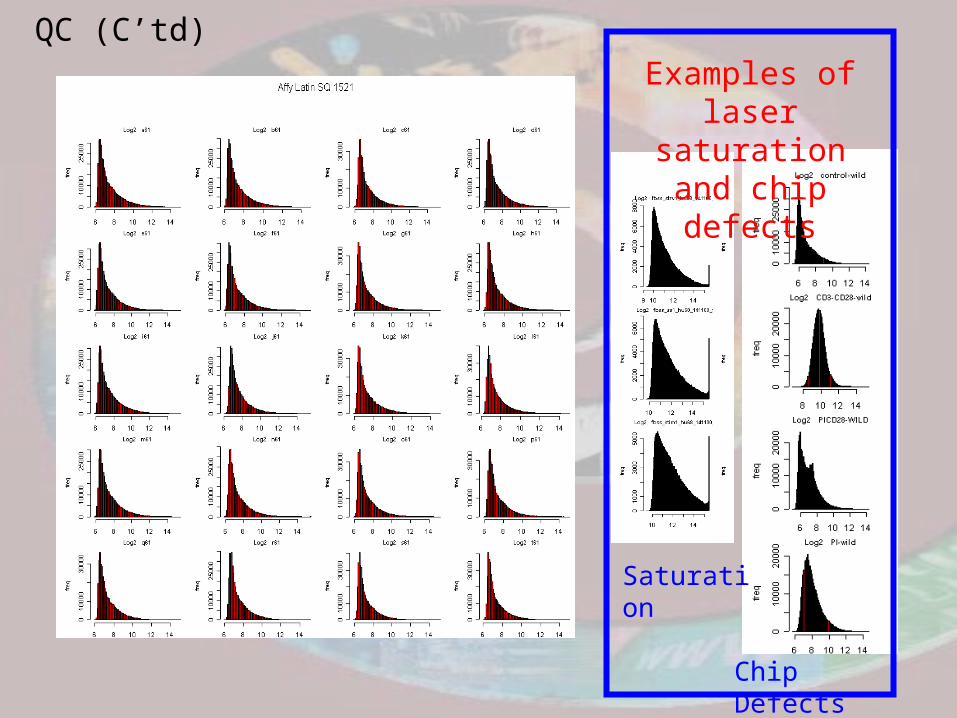
HistogramsExamples of laser
saturation and chip defects
Saturation
Chip Defects
QC (C’td)

Glynne et al (2000) Nature

Expression measures• Many expression measures are based
on differences PM - MMThe intention is to correct for background and NSB; Problem: MM also may measure ‘signal’.
• Many use just PM• Many summarise over probes (e.g.
Affy), others use the probe level data• …
What do we want to measure?Gene “Expression” (GE) / Gene activity[“perfect” Gene Specific Binding (GSB)]
What do we actually measure?Signal intensity (I) of indirectly labeled probes. This is often “massaged” to obtain a summary value termed “(gene) expression measurement”.
What is the relationship between(i) GE and I ?(ii) actual concentration and observed I ?
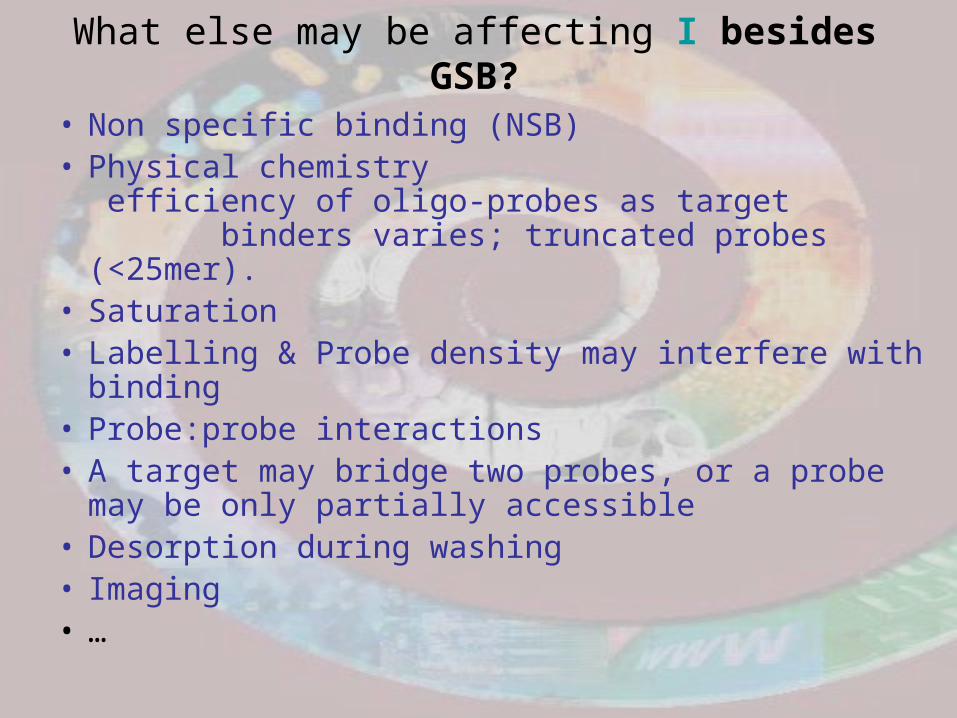
What else may be affecting I besides GSB?
• Non specific binding (NSB)• Physical chemistry
efficiency of oligo-probes as target binders varies; truncated probes (<25mer).
• Saturation• Labelling & Probe density may interfere with
binding• Probe:probe interactions• A target may bridge two probes, or a probe
may be only partially accessible• Desorption during washing• Imaging• …
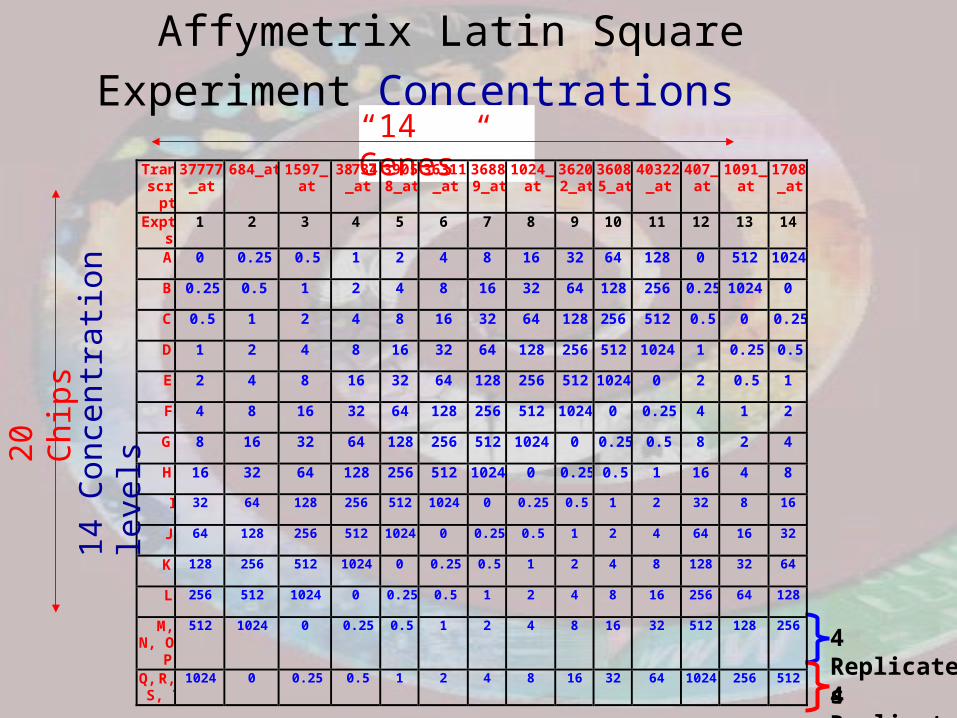
Affymetrix Latin Square Experiment Concentrations
“14 Genes”
20 C
hips
4 Replicates
4 Replicates
Transcri
pt
37777_at
684_at 1597_at
38734_at
39058_at
36311_at
36889_at
1024_at
36202_at
36085_at
40322_at
407_at
1091_at
1708_at
Expts
1 2 3 4 5 6 7 8 9 10 11 12 13 14
A 0 0.25 0.5 1 2 4 8 16 32 64 128 0 512 1024
B 0.25 0.5 1 2 4 8 16 32 64 128 256 0.25 1024 0
C 0.5 1 2 4 8 16 32 64 128 256 512 0.5 0 0.25
D 1 2 4 8 16 32 64 128 256 512 1024 1 0.25 0.5
E 2 4 8 16 32 64 128 256 512 1024 0 2 0.5 1
F 4 8 16 32 64 128 256 512 1024 0 0.25 4 1 2
G 8 16 32 64 128 256 512 1024 0 0.25 0.5 8 2 4
H 16 32 64 128 256 512 1024 0 0.25 0.5 1 16 4 8
I 32 64 128 256 512 1024 0 0.25 0.5 1 2 32 8 16
J 64 128 256 512 1024 0 0.25 0.5 1 2 4 64 16 32
K 128 256 512 1024 0 0.25 0.5 1 2 4 8 128 32 64
L 256 512 1024 0 0.25 0.5 1 2 4 8 16 256 64 128
M, N, O,
P
512 1024 0 0.25 0.5 1 2 4 8 16 32 512 128 256
Q, R, S, T
1024 0 0.25 0.5 1 2 4 8 16 32 64 1024 256 512
14 C
once
ntra
tion
leve
ls

Probe Response curves for the 14 spiked-in genes
PM MM
Outlier

PM Fitted values
Hyperbolic Response Functions Michaelis-Menton curve in enzyme kinetics
MM Fitted values
PM Fitted values
MM Fitted values

Langmuir Adsorption Model
Assume:1. (Adsorption) Target mRNA attaches to probes at a
rate proportional to concentration of specific target mRNA and fraction of unoccupied probes
2. (Desorption) Target mRNA detaches from probes at a rate proportional to fraction of occupied probes
→ At equilibrium, intensity I(x) at target concentration x follows “Langmuir Isotherm”:
Kx
bxIxI
++= 0)(

I(x)
x
Kx
bxIxI
++= 0)(
0I
bI +0
bI2
10 +
0 K

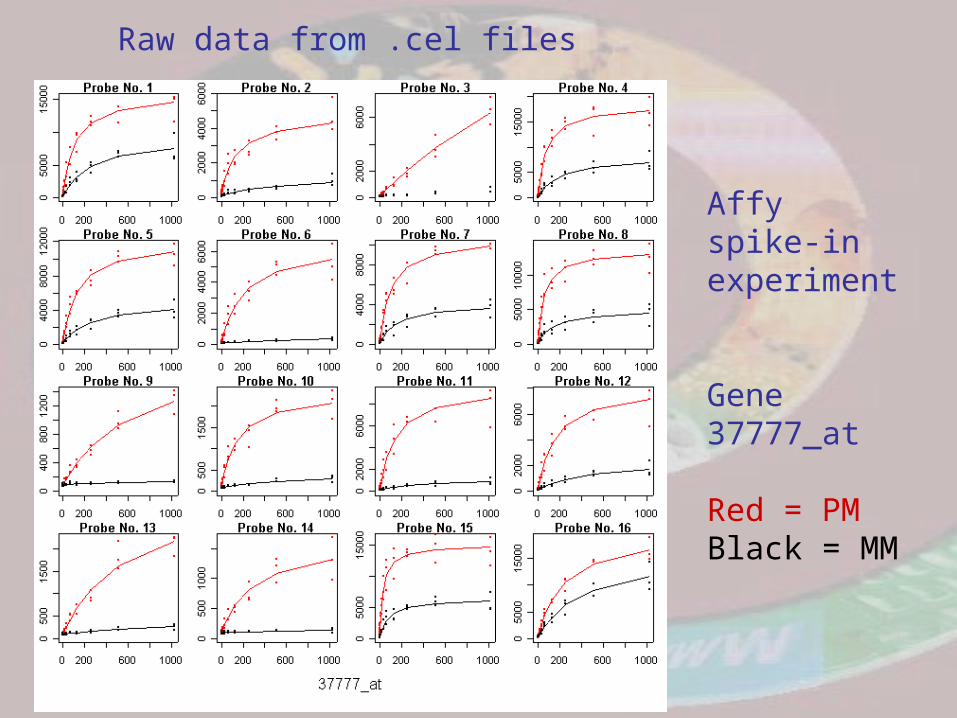
Raw data from .cel files
Affy spike-in experiment
Gene 37777_at
Red = PMBlack = MM
Raw data from .cel files
Affy spike-in experiment
Gene 37777_at
Red = PMBlack = MM
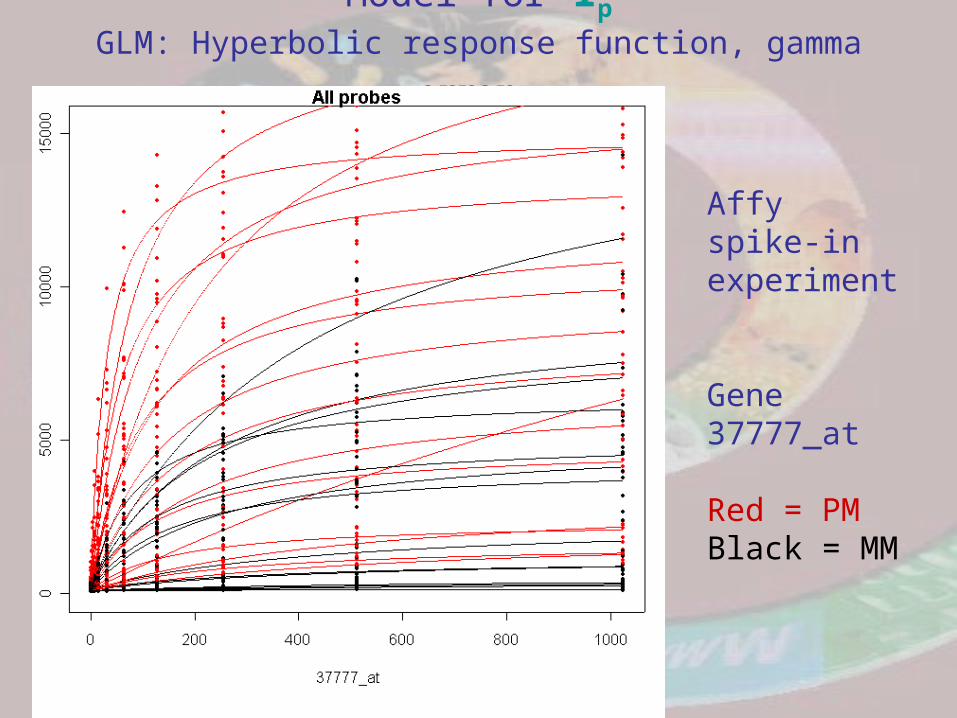
Model for Ip
GLM: Hyperbolic response function, gamma error
Affy spike-in experiment
Gene 37777_at
Red = PMBlack = MM

Implications
X Saturation to a single value (Held et al, 2003)
NB Hekstra et al (2003) removed ~30% of data!
PM-MM - Approximately linear for relatively small concentration levels.
Fold ChangeIt can be shown that all methods give estimated
fold changes that are biased below the true values. This bias increases with concentration due to saturation of the signal.

Estimating concentration(i) Estimate I0 , b, K, using, say, nucleotide
sequence for each probe
(ii) From observed I(x), estimate x, separately for each probe
(iii) Find median
Bootstrap at probe level & repeat (i), (ii), (iii).
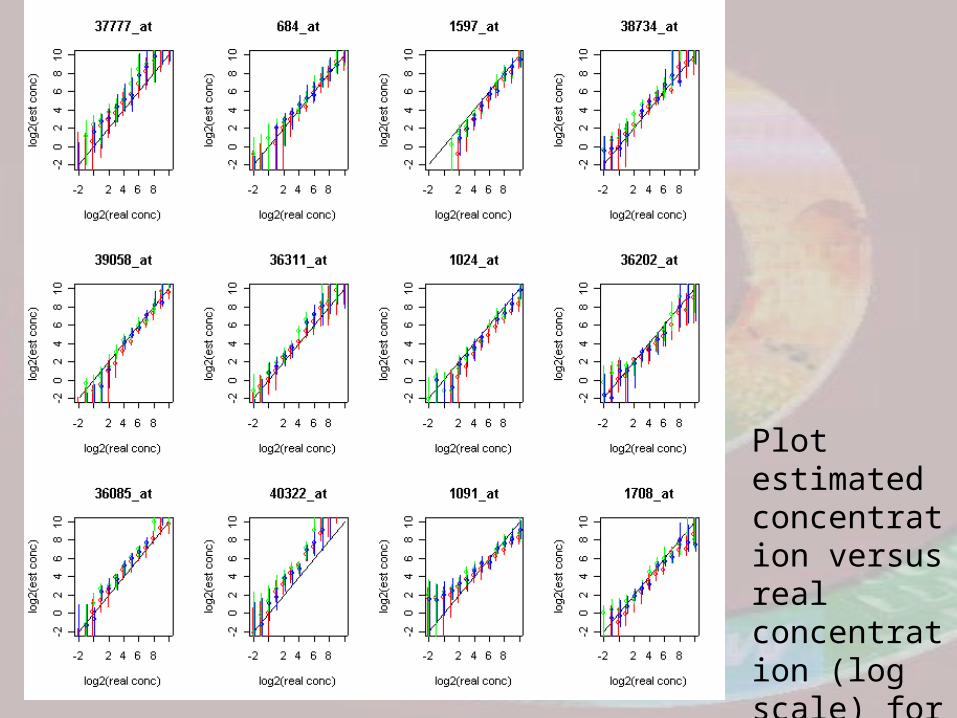
Plot estimated concentration versus real concentration (log scale) for 12 genes, and 95% coverage.

• Individual probes have very different responses depending on their nucleotide sequence!
• Temperature, pH, wafer effects, time to reach equilibrium etc. also important.
• Role (and usefulness) of MMs is not clear.• Sips model (replace x & K by x & K ) was
not overall statistically significant.
- Estimating absolute concentration values from I data still under development
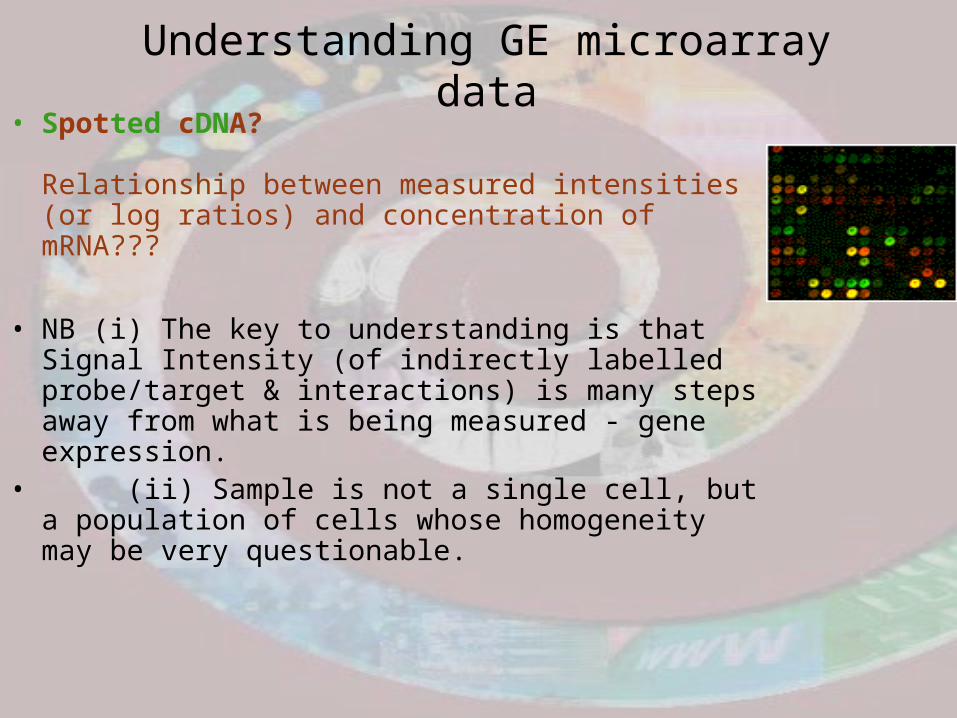
Understanding GE microarray data• Spotted cDNA?
Relationship between measured intensities (or log ratios) and concentration of mRNA???
• NB (i) The key to understanding is that Signal Intensity (of indirectly labelled probe/target & interactions) is many steps away from what is being measured - gene expression.
• (ii) Sample is not a single cell, but a population of cells whose homogeneity may be very questionable.

Design• We do not understand, as well as we would like for
the purposes of design, the different sources of variation in gene expression.
General Reviews: * Maindonald, Pittelkow & Wilson (2003)
in Goldstein (Ed.); see
cbis.anu.edu.au/microarray_site.html
* Yang & Speed (2003) in Speed (Ed.)

Another problem underpinning analysis
Nxv, N>>v Nxv, N<<v
Small N, large v
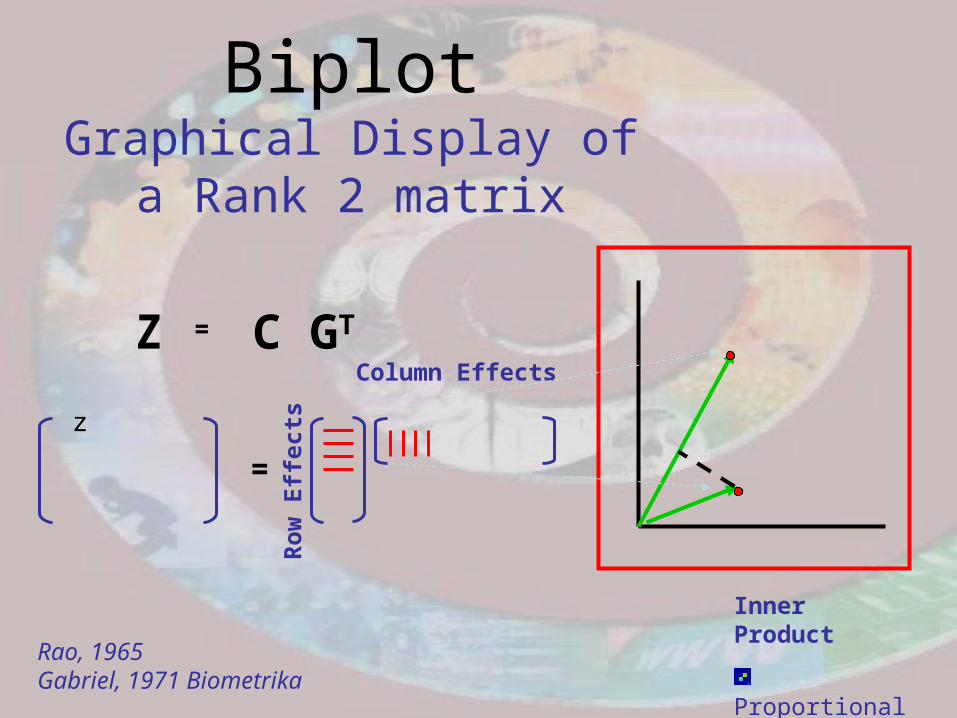
BiplotGraphical Display of a
Rank 2 matrix
Rao, 1965Gabriel, 1971 Biometrika
Inner Product
Proportional
Zero entries
Z GTC=
Column Effects
=
Ro
w E
ffec
tsz

Biplot - Microarray Data
Factorization metric in which to represent the data.
Approximation of Z by a matrix of rank 2
SVD
Choice of ZExpression level transformations ? (logs)
Row (chip) standardizing? (Scaling, Normalization)
Column (gene) mean correcting or standardization?
Gene selection (filtering) ?
Z GTC=
GR-1 TCRT=

Approximate Biplot
Eckhart and Young 1939Good 1969
•Minimizes ΣiΣj(zij-z(k)ij)2
•Goodness of Fit is
Σki=1i
2/Σri=1i
2
•cols of V = right singular vectors
= eigenvectors of ZtZ
•cols of U = left singular vectors
= eigenvectors of ZZt
= diag0
= diageigenvalues)
1
2
12
u1 u2
v2
v1
GTCZ =
Z(2) = U(2)(2)V(2)T

GE-biplotFactorization
Z=CGT= (UVT• If =0, C= U and GT=VT
Then if Z is mean corrected
and C= NcU and G=(1/Nc)VT
GGT= Sg
Matrix Z
•Log 2 expression level
•Chips - standardized
•Genes - mean corrected
Display
•Chips - vectors with annotation.
•Genes - points or symbols
Focus: Similarity of up down regulation.Variant of the h-plotCorsten and Gabriel (1976)
Goodness of Fit variances
Σki=1i
4/Σri=1i
4
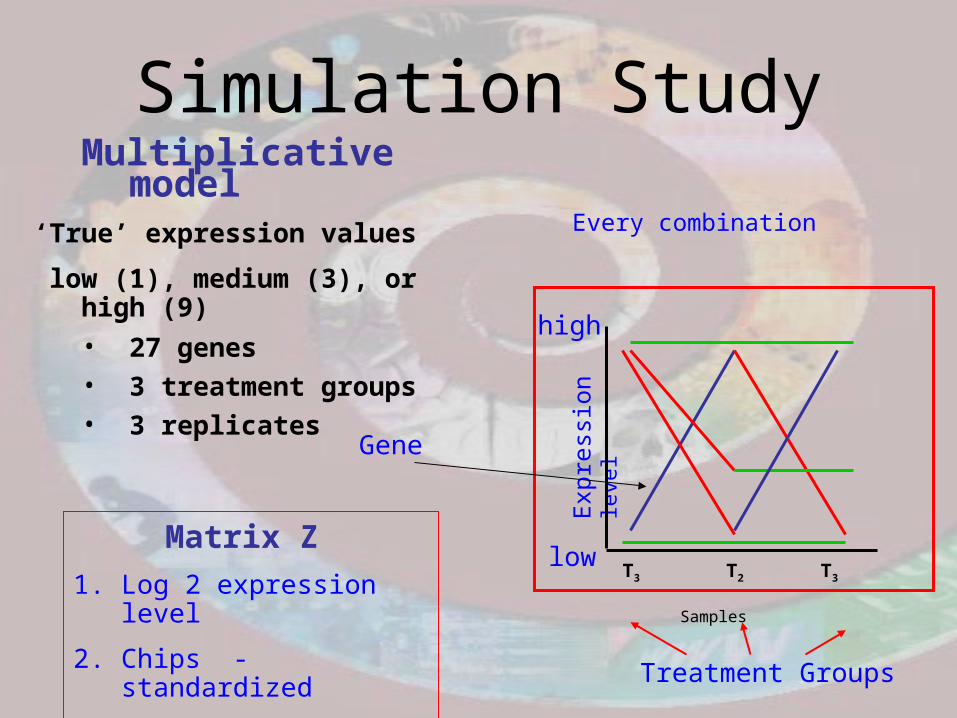
Simulation StudyMultiplicative model
‘True’ expression values
low (1), medium (3), or high (9)
• 27 genes• 3 treatment groups• 3 replicates
Treatment Groups
Samples
T3 T2 T3E
xpre
ssio
n le
vel
low
high
Every combination
Gene
Matrix Z
1. Log 2 expression level
2. Chips - standardized
3. Genes - mean corrected

Goodness of fit .98
Note
Chips
Replicates
Different treatments
Genes
•Similar up down regulation
•Non responding genes
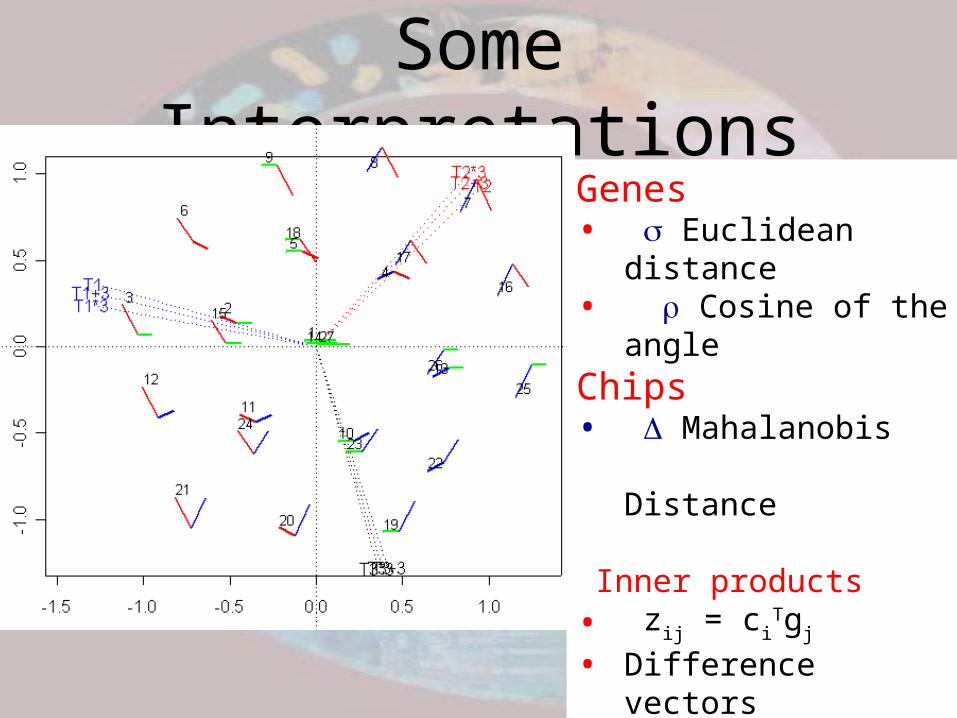
Some InterpretationsGenes• Euclidean distance• Cosine of the angleChips• Mahalanobis
Distance
Inner products• zij = ci
Tgj
• Difference vectors zij-zij' = ci
T(gj-gj')
zij-zi'j = (ciT- ci'
T)gj
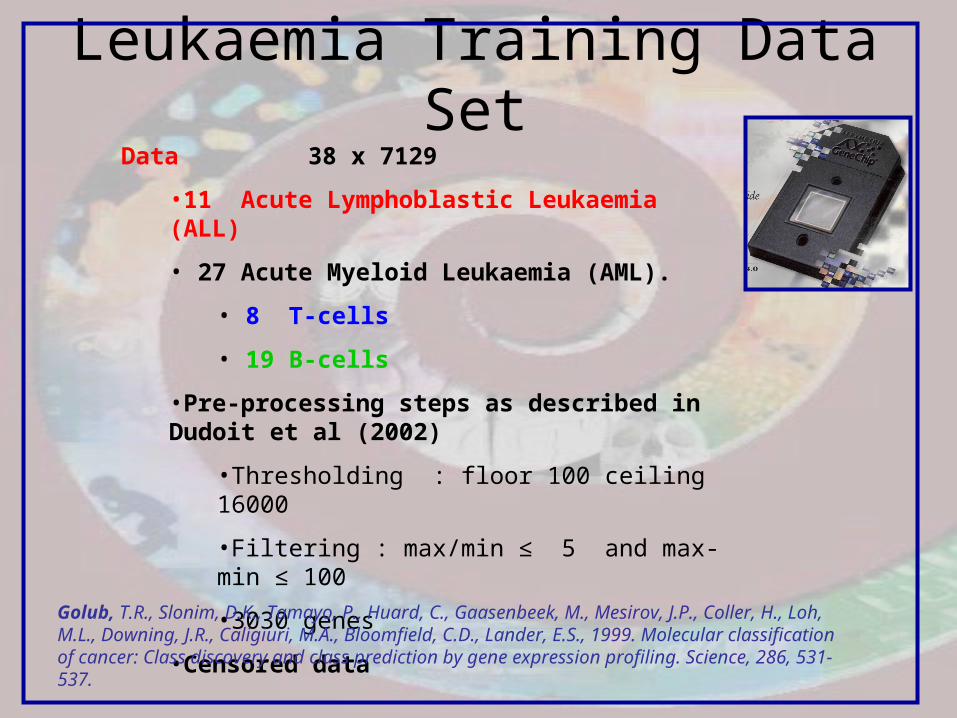
Leukaemia Training Data SetData 38 x 7129
•11 Acute Lymphoblastic Leukaemia (ALL)
• 27 Acute Myeloid Leukaemia (AML).
• 8 T-cells
• 19 B-cells
•Pre-processing steps as described in Dudoit et al (2002)
•Thresholding : floor 100 ceiling 16000
•Filtering : max/min ≤ 5 and max-min ≤ 100
•3030 genes
•Censored dataGolub, T.R., Slonim, D.K., Tamayo, P., Huard, C., Gaasenbeek, M., Mesirov, J.P., Coller, H., Loh, M.L., Downing, J.R., Caligiuri, M.A., Bloomfield, C.D., Lander, E.S., 1999. Molecular classification of cancer: Class discovery and class prediction by gene expression profiling. Science, 286, 531-537.

Leukaemia Data (3030 genes)
Golub et al.
Dudoit et al.
Ge et al.
Korenberg
Kiiveri
Goodness of Fit
I2= .59
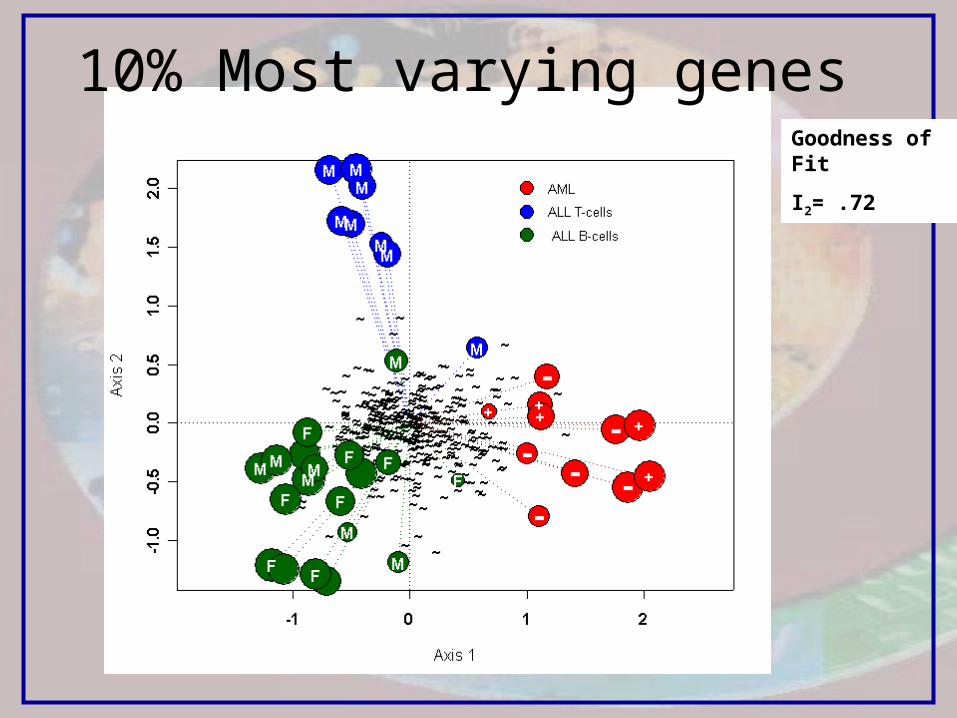
10% Most varying genesGoodness of Fit
I2= .72
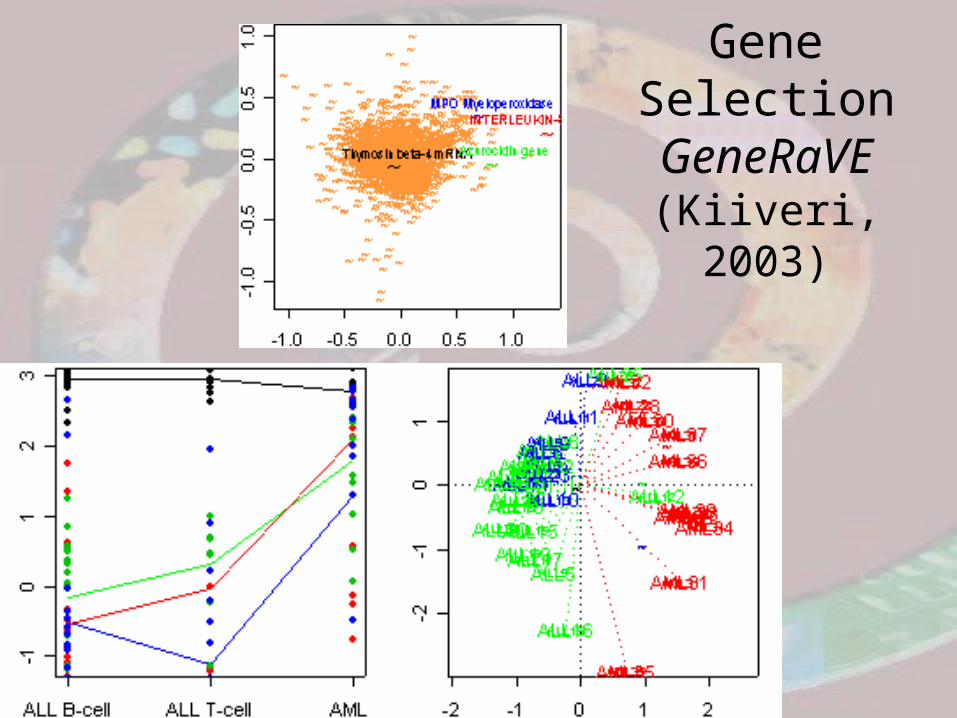
Gene Selection
GeneRaVE(Kiiveri, 2003)

1. The biplot is a useful visualization tool for microarray data
Simultaneous plotting of the genes and chips on the same plot
2. Many types of biplots
• Factorization
• Rank 2 approximation
• Matrix
3. GE-Biplot
• Log 2, Chip standardized, gene centered
• Factorization
• Plotting the chips as vectors and the genes as symbols
• Annotation
See cbis.anu.edu.au/microarray_site.html
Summary

Normalisation
Ad hocEffect? - Removing “signal”?Use in many applications
questionable
Gene Filtering
Ad hoc

Multiple testing
Neyman-Pearson framework vs Fisherian
FWE vs FDR
Open questions; see Dudoit et al (2003) Statistical Science, p.100–1

Multiple (vs Single) gene analyses
E.g. pairs PC2 ~ 106 comparisons
Set of genes change (e.g. with treatment)
Do gene networks/ biochemical pathways change?
Systems biology

Combining GE microarray data with phenotypic (e.g. clinical)
data
E.g. Survival analysis
+ Genotypic data
Design, Analysis & Interpretation of Microarray
Experiments
o These topics are still in their infancy
o Entirely satisfactory solutions still elude us - even to simple problems - let alone complex challenges!

Acknowledgements:Acknowledgements:
Yvonne Pittelkow
Conrad Burden
John Maindonald
http://cbis.anu.edu.au/
Spotted: Campbell’s animation
http://www.bio.davidson.edu/courses/genomics/chip/chip.htmlOligo
QuickTime™ and aCinepak decompressorare needed to see this picture.
Related Documents