Bioinformatics Richard Tseng and Ishawar Hosamani

Bioinformatics
Dec 30, 2015
Bioinformatics. Richard Tseng and Ishawar Hosamani. Outline. Homology modeling (Ishwar) Structural analysis Structure prediction Structure comparisons Cluster analysis Partitioning method Density-based method Phylogenetic analaysis. Structural Analysis. Overview Structure prediction - PowerPoint PPT Presentation
Welcome message from author
This document is posted to help you gain knowledge. Please leave a comment to let me know what you think about it! Share it to your friends and learn new things together.
Transcript
Bioinformatics
Richard Tseng and Ishawar Hosamani
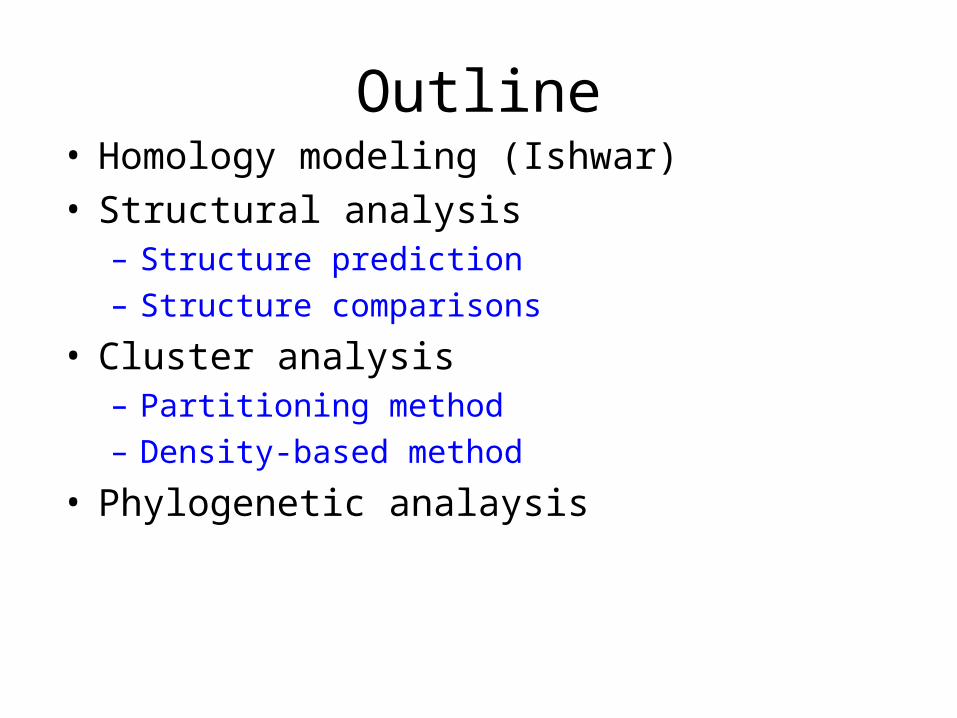
Outline• Homology modeling (Ishwar)• Structural analysis
– Structure prediction– Structure comparisons
• Cluster analysis– Partitioning method– Density-based method
• Phylogenetic analaysis
Structural Analysis
• Overview– Structure prediction– Structural alignment– Similarity
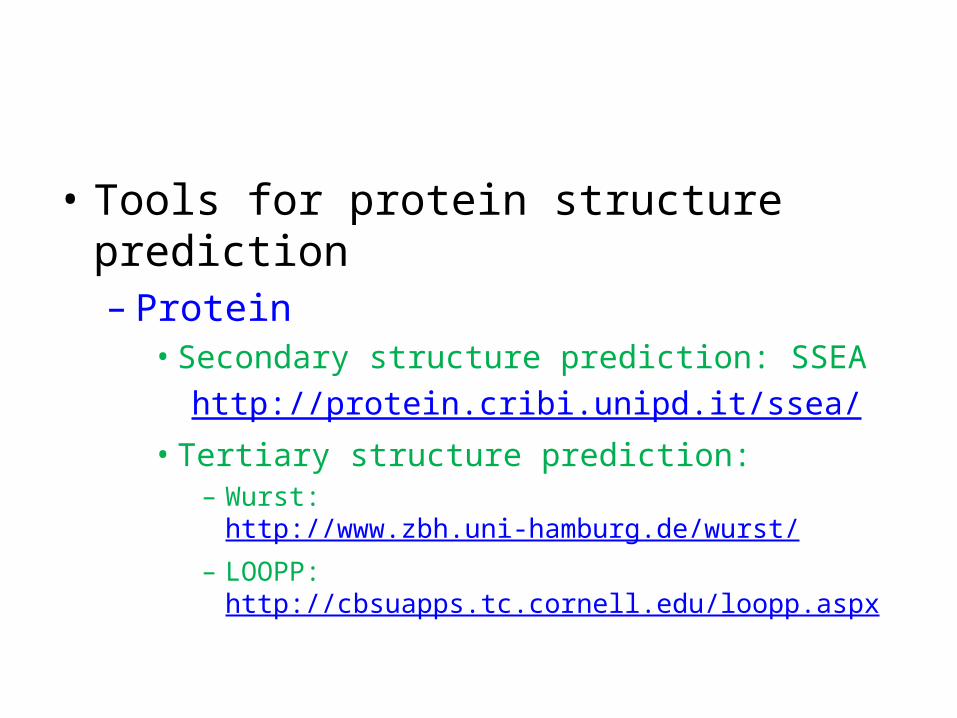
• Tools for protein structure prediction– Protein
• Secondary structure prediction: SSEAhttp://protein.cribi.unipd.it/ssea/
• Tertiary structure prediction: – Wurst: http://www.zbh.uni-hamburg.de/wurst/– LOOPP: http://cbsuapps.tc.cornell.edu/loopp.aspx

• WURST( Torda et al. (2004) Wurst: A protein threading server with a structural scoring function, sequence profiles and optimized substitution matrices
Nucleic Acids Res., 32, W532-W535)• Rationale
– Alignment: Sequence to structure alignments are done with a Smith-Waterman style alignment and the Gotoh algorithm
– Score function: fragment-based sequence to structure compatibility score and a pure sequence-sequence component substitution score
– Library: Dali PDB90 (24599 srtuctures)
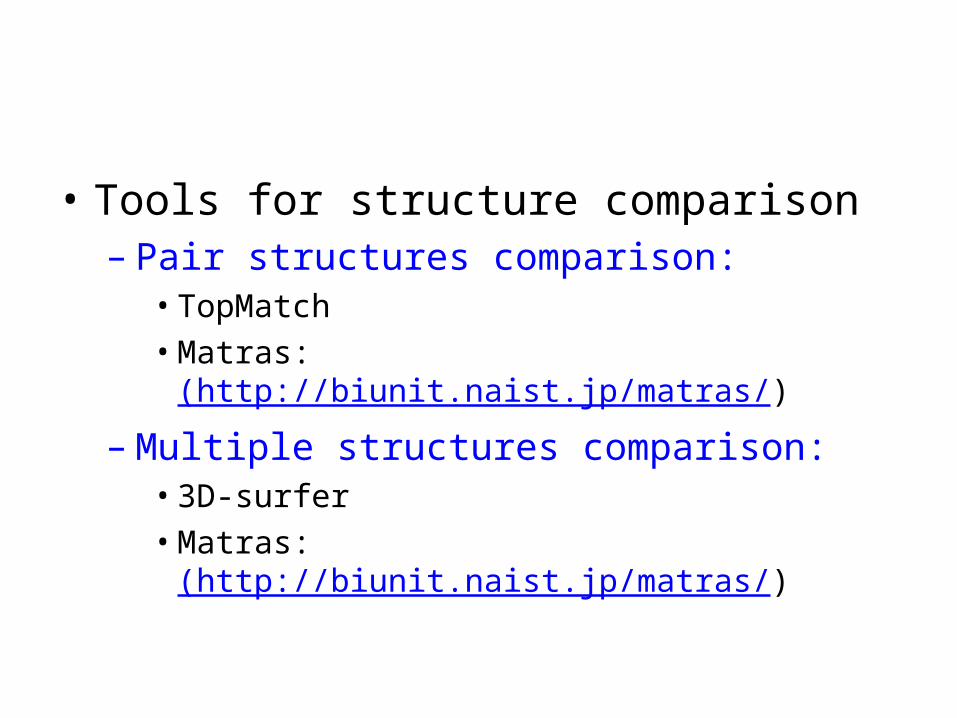
• Tools for structure comparison– Pair structures comparison:
• TopMatch• Matras: (http://biunit.naist.jp/matras/)
– Multiple structures comparison: • 3D-surfer• Matras: (http://biunit.naist.jp/matras/)
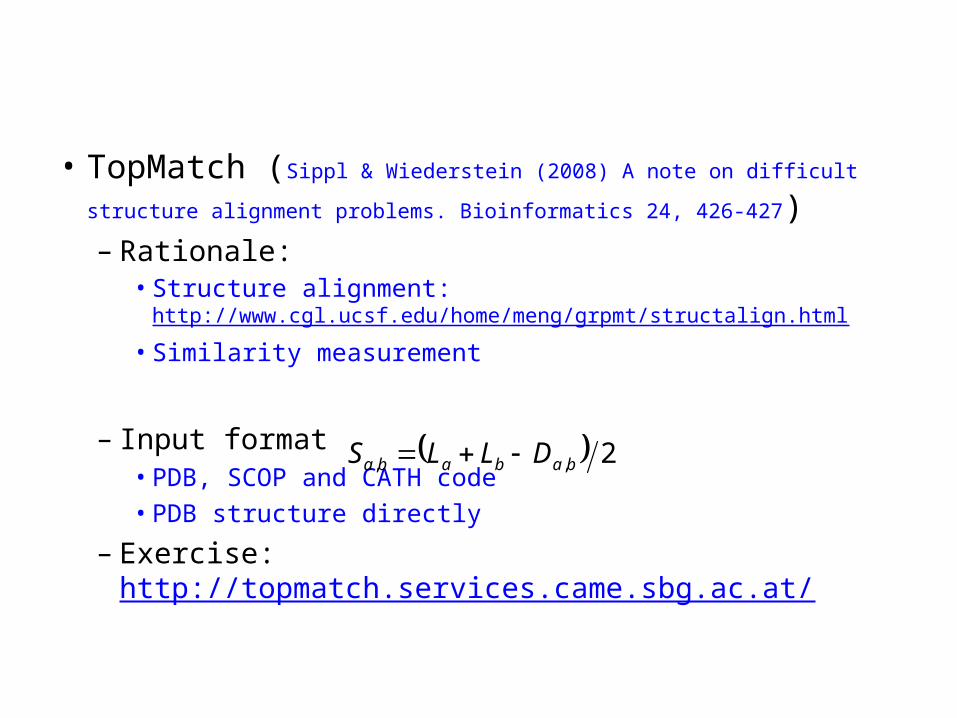
• TopMatch (Sippl & Wiederstein (2008) A note on difficult structure alignment
problems. Bioinformatics 24, 426-427)– Rationale:
• Structure alignment: http://www.cgl.ucsf.edu/home/meng/grpmt/structalign.html
• Similarity measurement
– Input format• PDB, SCOP and CATH code• PDB structure directly
– Exercise: http://topmatch.services.came.sbg.ac.at/
2,, bababa DLLS

• 3D-surfer (David La et al. 3D-SURFER: software for high throughput protein
surface comparison and analysis. Bioinformatics , in press. (2009))– Rationale
1. Define a surface function2. Transform the surface function into a 3D Zernike description
function
– Input format• PDB and CATH code• PDB structure directly
– Exercise: http://dragon.bio.purdue.edu/3d-surfer/
,,, mlnl
mnl YrRrZ

Cluster analysis
• Goal: – Grouping the data into classes or clusters, so that
objects within a cluster have high similarity in comparison to one another but are very dissimilar to objects in other clusters.
• Methods– Partitioning method: k-means– Density-based method: Ordering Points to
Identify the Clustering Structure (OPTICS)
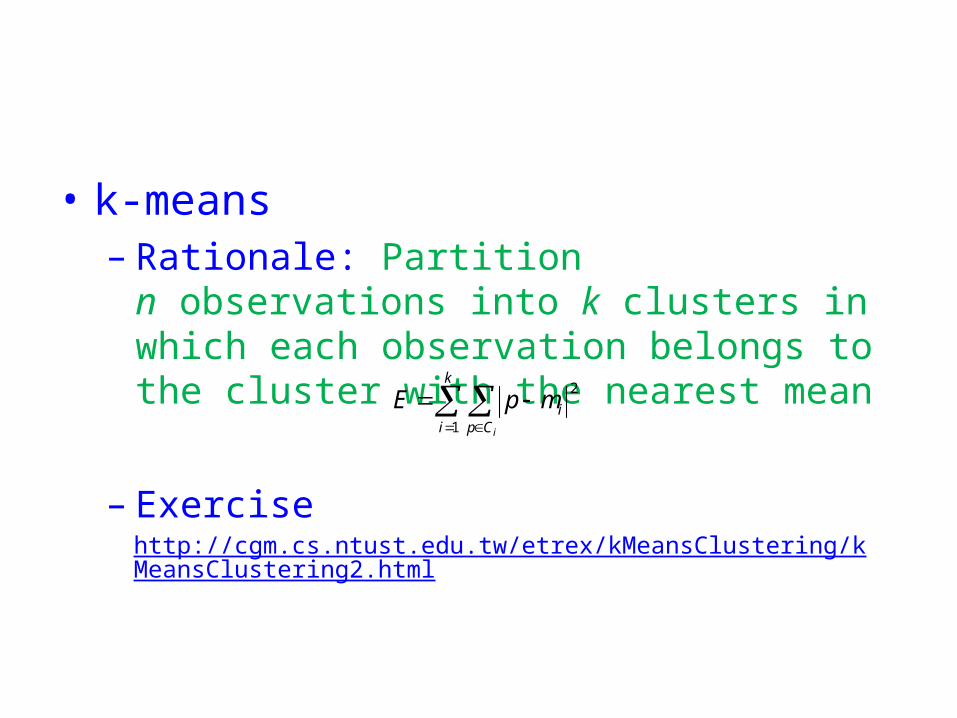
• k-means– Rationale: Partition n observations into k clusters
in which each observation belongs to the cluster with the nearest mean
– Exercise
http://cgm.cs.ntust.edu.tw/etrex/kMeansClustering/kMeansClustering2.html
k
i Cpi
i
mpE1
2
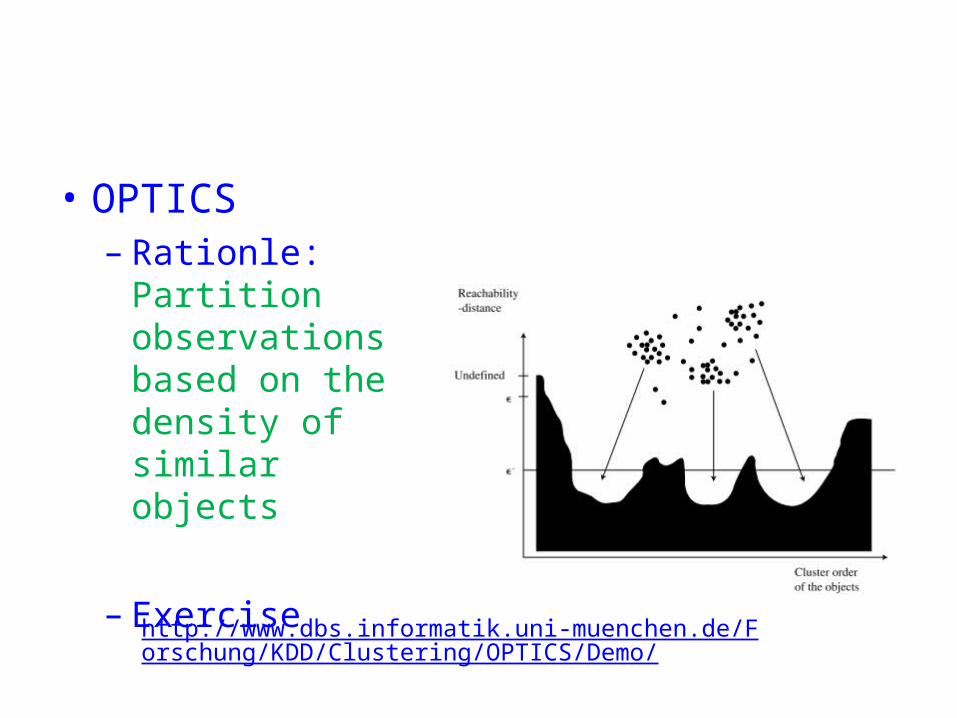
• OPTICS– Rationle: Partition
observations based on the density of similar objects
– Exercise
http://www.dbs.informatik.uni-muenchen.de/Forschung/KDD/Clustering/OPTICS/Demo/
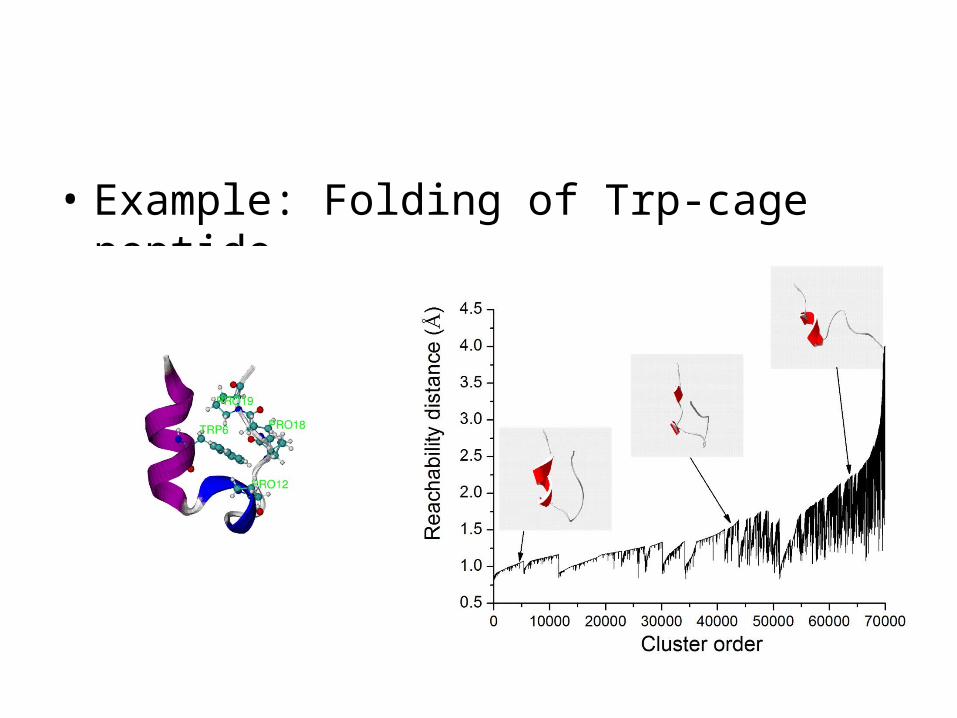
• Example: Folding of Trp-cage peptide
Phylogenetic analysis
• Overviews– Comparisons of more than two sequences– Analysis of gene families, including functional
predictions– Estimation of evolutionary relationships among
organisms

• Theoretical tree– Parsimony method– Distance matrix method– Maximum likelihood and Bayesian method– Invariants method

• Software– Collections of toolshttp://evolution.genetics.washington.edu/phylip/software.html – A web server version for tree construction and display
• PHYLIP, http://bioweb2.pasteur.fr/phylogeny/intro-en.html • Interactive tree of life, http://itol.embl.de/
– Mostly common used stand alone software• PHYLIP, tool for evaluating similarity of nucleotide and amino
acid sequences.http://evolution.gs.washington.edu/phylip.html • TreeView, tool for visualization and manipulation of family
tree.http://taxonomy.zoology.gla.ac.uk/rod/treeview.html • Matlab - bioinformatics tool box

• Example: Alignment phylogenetic tree of Tubulin family– Searching homologous sequences of Tubulin (PDB
code: 1JFF) from RCSB protein databank• Blast for pair sequence alignment• Clustalw for comparative sequence alignment
– Evaluating protein distance matrix • using “Protdist” of PHYILIP (Particularly, Point Accepted
Mutation (PAM) matrix is used)
– Clustering proteins using “Neighbor” of PHYILIP (Neightboring-Joint method is considered)
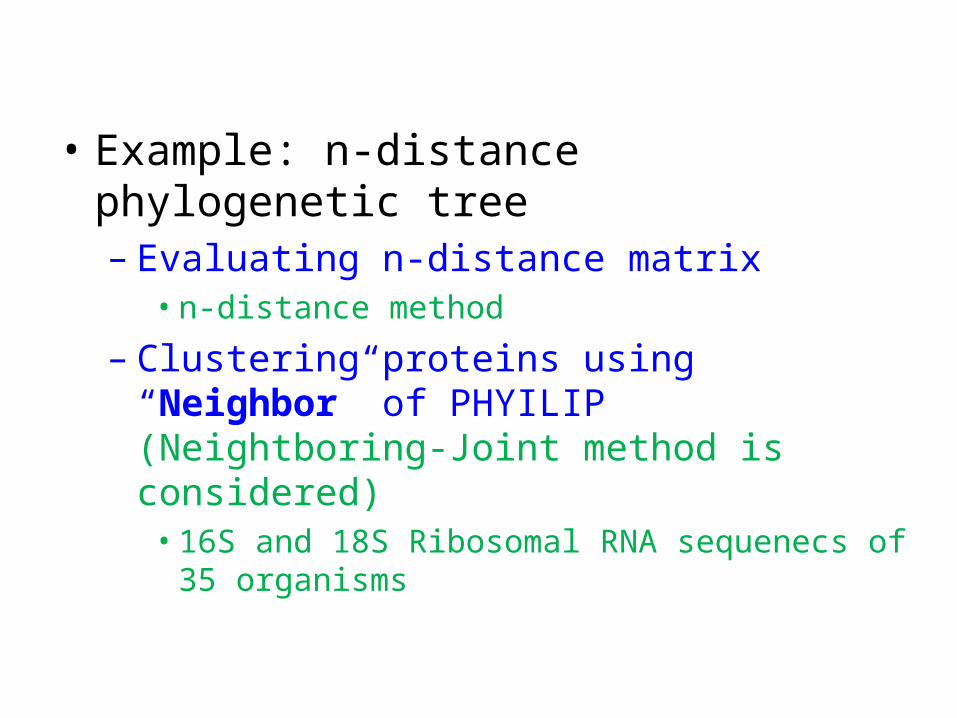
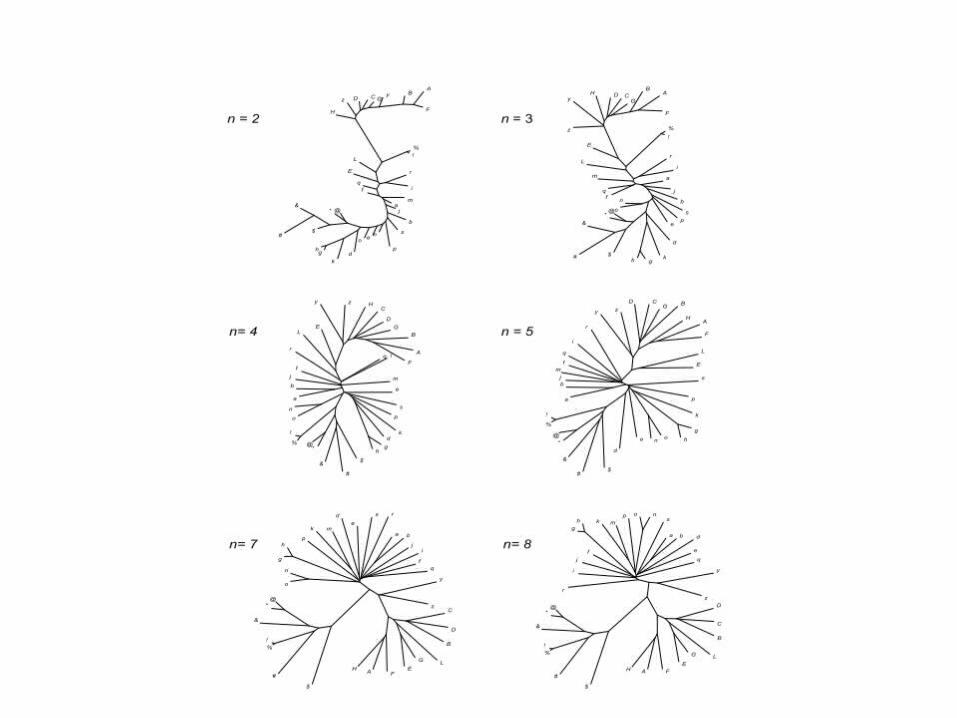
• Example: n-distance phylogenetic tree– Evaluating n-distance matrix
• n-distance method
– Clustering proteins using “Neighbor” of PHYILIP (Neightboring-Joint method is considered)
• 16S and 18S Ribosomal RNA sequenecs of 35 organisms

Summary
• Homology modeling• Tools for structure prediction and
comparisons• Tools for phylogenetic tree construction
Thanks for your attention!!

1Z5V_A 3CB2_A 1JFF_B 1FFX_B 1TUB_B 1Z2B_B
1Z5V_A 0 0.000010 1.349411 1.349411 1.303115 1.345634
3CB2_A 0.000010 0 1.350506 1.350506 1.303115 1.346730
1JFF_B 1.349411 1.350506 0 0.000010 0.000010 0.010729
1FFX_B 1.349411 1.350506 0.000010 0 0.000010 0.010729
1TUB_B 1.303115 1.303115 0.000010 0.000010 0 0.006725
1Z2B_B 1.345634 1.346730 0.010729 0.010729 0.006725 0
•Protein distance matrix

•Tubulin family tree
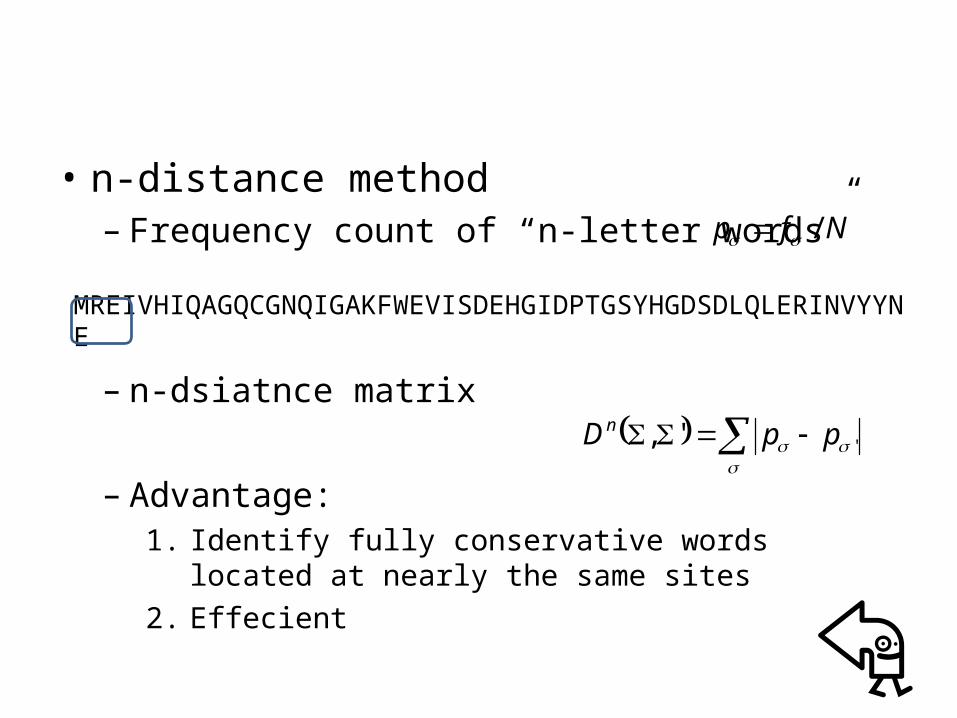
• n-distance method– Frequency count of “n-letter words”
– n-dsiatnce matrix
– Advantage: 1. Identify fully conservative words located at nearly the
same sites2. Effecient
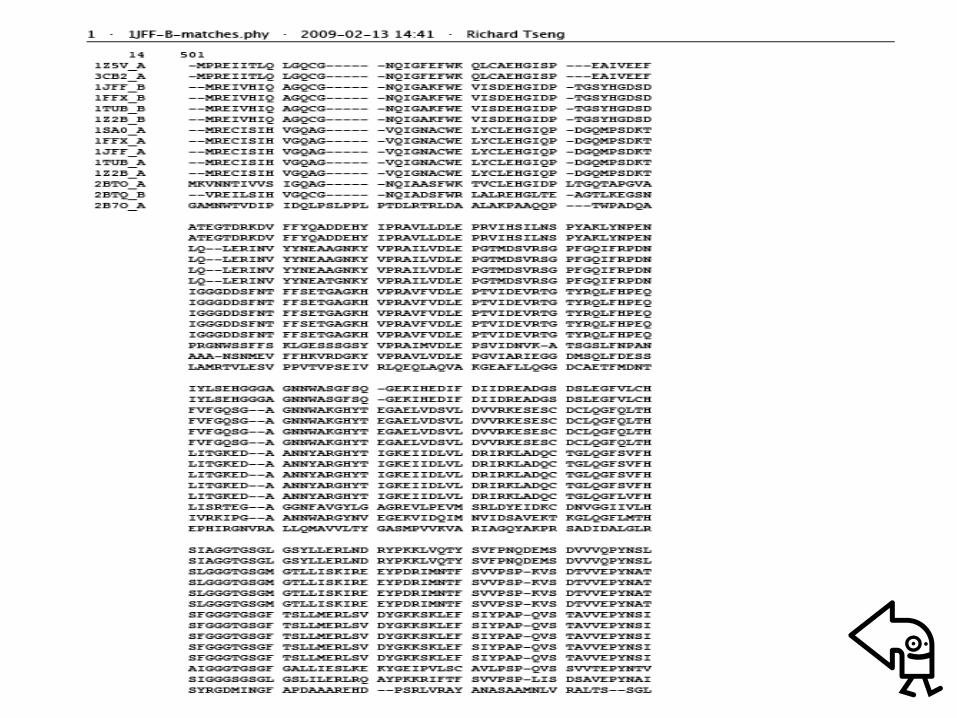
MREIVHIQAGQCGNQIGAKFWEVISDEHGIDPTGSYHGDSDLQLERINVYYNE
Nfp /
'', ppDn

Related Documents