Biography for William Swan Currently the “Cheap” Economist for Boeing Commercial Aircraft. Previous to Boeing, worked at American Airlines in Operations Research and Strategic Planning and United Airlines in Research and Development. Areas of work included Yield Management, Fleet Planning, Aircraft Routing, and Crew Scheduling. Also worked for Hull Trading, a major market maker in stock index options, and on the staff at MIT’s Flight Transportation Lab. Apparently has a hard time holding a steady job. Education: Master’s, Engineer’s Degree, and Ph. © Scott Adams

Welcome message from author
This document is posted to help you gain knowledge. Please leave a comment to let me know what you think about it! Share it to your friends and learn new things together.
Transcript

Biography for William Swan
Currently the “Cheap” Economist for Boeing Commercial Aircraft. Previous to Boeing, worked at American Airlines in Operations Research and Strategic Planning and United Airlines in Research and Development. Areas of work included Yield Management, Fleet Planning, Aircraft Routing, and Crew Scheduling. Also worked for Hull Trading, a major market maker in stock index options, and on the staff at MIT’s Flight Transportation Lab. Apparently has a hard time holding a steady job. Education: Master’s, Engineer’s Degree, and Ph. D. at MIT. Bachelor of Science in Aeronautical Engineering at Princeton. Likes dogs and dark beer. © Scott Adams

New Perspective on Fleet Planning
Prepared for AGIFORS 2002 Symposium
October 2002William M. SwanChief Economist
Boeing Commercial

Review of Fleet Plan Techniques
• Put and Take
• Push Down
• Vest Pocket
• Abandon all Hope

SEA
DFW
ORD DTW
BOS
19:65
19:66
19:78
19:79
19:85
19:86
19:89
19:90
20:10
20:12
Put ‘n Take Fleet Plan Replaces Airplanes in a Schedule

20 oldN110s
17 oldN110s
15 NewN142s
25 MediumN240s
15 NewN142s
10 NEWN220s
18 MediumN240s
Push Down Fleet Plan Reassigns Schedule
3
7
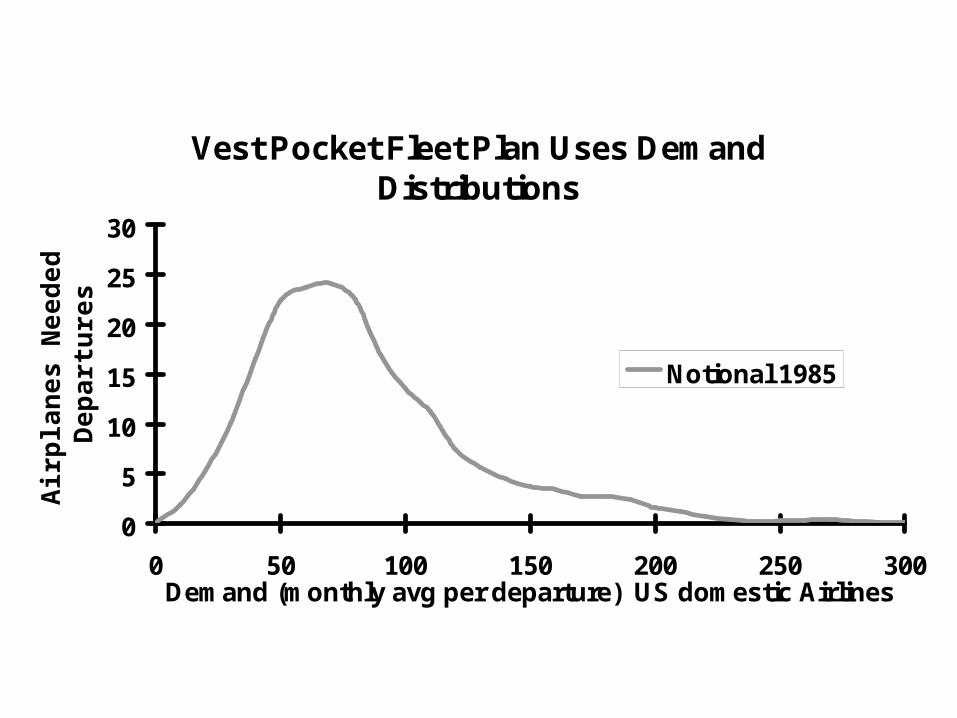
Vest Pocket Fleet Plan Uses Demand Distributions
0
5
10
15
20
25
30
0 50 100 150 200 250 300Demand (monthly avg per departure) US domestic Airlines
Air
pla
ne
s N
ee
de
d f
or
De
pa
rtu
res
Notional 1985

Divide Distribution by Airplane Size to get Fleet & Mix
0
5
10
15
20
25
30
0 50 100 150 200 250 300Demand (monthly avg per departure) US domestic Airlines
Air
pla
ne
s N
ee
de
d f
or
De
pa
rtu
res
Notional 1985
100-seat
150-seat200-seat

Grow Demand Distribution Based on Trends
0
5
10
15
20
25
30
35
40
0 50 100 150 200 250 300Demand (monthly avg per departure) US domestic Airlines
Air
pla
ne
s N
ee
de
d f
or
De
pa
rtu
res
Feb-90
Notion-85

Trend Changes with RJs
05
101520253035404550
0 50 100 150 200 250 300Demand (monthly avg per departure) US domestic Airlines
Air
pla
ne
s N
ee
de
d f
or
De
pa
rtu
res
Feb-95
Feb-90
Notion-85
Aside:

RJs Big Time
05
101520253035404550
0 50 100 150 200 250 300Demand (monthly avg per departure) US domestic Airlines
Air
pla
ne
s N
ee
de
d f
or
De
pa
rtu
res Feb-00
Feb-95
Feb-90
Notion-85
Further Aside:

Review of Fleet Plan Techniques
• Put and Take• Push Down
• Vest Pocket
• Abandon all Hope

Big Markets Do Not Mean Big Airplanes
150
200
250
300
350
400
450
0 1000 2000 3000 4000 5000 6000 7000
Seats/day Aug 2001 by Airport Pair
Sea
ts/D
epar
ture
Au
g 2
001,
Sam
e P
air
>5000km, 5+deps/week
Average

0
50
100
150
200
250
300
350
400
450
0 2000 4000 6000 8000 10000 12000 14000 16000 18000
Seats Per Day
Sea
ts P
er D
epar
ture
Average
Big Markets Do Not Mean Big Airplanes
All Airport Pairs under 5000km and over 1000 seats/day

Big Markets do not Mean Big Airplanes
0
50
100
150
200
250
0 1000 2000 3000 4000 5000 6000Seats/day in Airport Pair, European Regional Aug 2001
Sea
ts/D
epar
ture
data for markets > 4/week 1991 & 2001

Big Aircraft Markets Do Not Stay Big
150
200
250
300
350
400
450
150 200 250 300 350 400 450Seats/Departure Aug 1991
Sea
ts/D
epar
ture
Au
g 2
001,
Sam
e P
air
>5000km, 5+deps/week

150
200
250
300
350
400
450
150 200 250 300 350 400 450
Seats/Departure in 1990, Atlantic pairs
Sea
ts/D
ep in
200
0 (s
ame
pai
r)
Size in 1990 Not a Forecast for Size in 2000
Size in 1990 Not a Forecast for Size in 2000

Size in 1991 not a Forecast for 2001
0
50
100
150
200
250
50 100 150 200 250 300
Seats/Dep Aug 1991 Pairs (Europe>4/week)
Sea
ts/D
ep A
ug 2
001,
sam
e pa
ir
Size Getting Larger
Size Getting Smaller

Small Airplanes not in New Markets
150
200
250
300
350
400
450
5000 7000 9000 11000
Distance (km)
Se
ats New
Old
Atlantic Airport Pairs with Service Aug 2000 but not Aug 1995

Big Markets Do Not Mean Big Airplanes
150
200
250
300
350
400
450
0 1000 2000 3000 4000 5000 6000 7000
Seats/day Aug 2001 by Airport Pair
Sea
ts/D
epar
ture
Au
g 2
001,
Sam
e P
air
>5000km, 5+deps/week
Average

Small Airplanes Not in New Markets
150
200
250
300
350
400
450
5000 6000 7000 8000 9000 10000 11000 12000 13000
Distance (Km)
Sea
ts/D
epar
ture
, Au
g 2
001
>5000km, 5+dep/week

Small Airplanes not in New Markets ?
0
50
100
150
200
250
0 500 1000 1500 2000 2500Distance (Km), European Regional Markets
Sea
ts/D
ep, A
ug 2
001
Old Markets
New Markets
Log. (New Markets)
Log. (Old Markets)

Why No Pattern in Size?

Cost per Seat Declines with Size
$-
$50
$100
$150
$200
$250
$300
$350
0 100 200 300 400Seats
$/S
eat Cost/Seat

Revenues Track Costs[30 business + discount fill to 80% LF]
$-
$50
$100
$150
$200
$250
$300
$350
0 100 200 300 400Seats
$/S
eat
Cost/SeatRev/Seat

Revenues Track Costs II[30 business + 90 discount, with Spill]
$-
$50
$100
$150
$200
$250
$300
$350
0 100 200 300 400Seats
$/se
at
Cost/SeatRev/Seat

Any Size Will Do[Averaged Demand Curve]
$-
$50
$100
$150
$200
$250
$300
$350
0 100 200 300 400Seats
$/se
at
Cost/SeatRev/Seat

Any Airplane Size Works
• Cost and Revenue Lines are the same shape• Profit nearly the same at any size• Possibility of a minimum profitable size• Upper limit at twice that size?
– Limit not set by airplane technology– Limit possibly set by market entry, split in ½– Or does cost curve rise due to ground costs?

This is Speculation, Not Proof
• Strong lack of pattern in airplane size as used
• Need for model to explain observed behavior
• Proposed model explains what we see
• Proof by “Occam’s Toothbrush”
not convincing

Bonus: An example of business sleaze
(Occam’s Toothbrush) Introducing a technique often used in business
Proof by Assumptions “Test”What is the most reasonable set of assumptions
That fits all known data pointsAnd allows our guess to be right?

Any Size Will Do[from minimum to 2x]
$-
$50
$100
$150
$200
$250
$300
$350
0 100 200 300 400Seats
$/se
at
Cost/SeatRev/Seat

William Swan:
Data Troll
Story Teller
Economist
Chief Economist, Boeing Commercial Airplanes, Marketing


Related Documents