Biogeographical change in the tiger, Panthera tigris INTRODUCTION The effective conservation of endangered species in the wild and in captivity is often hampered by a lack of understanding of their geographical variation. Geographically and morphologically distinct popula- tions are most often called subspecies under the biolog- ical species concept (BSC) or species under the phylogenetic species concept (PSC), but because of the frequent lack of concordance between out-dated tax- onomies and genetics, the term ‘evolutionary significant unit’ (ESU) is used to describe this intraspecific varia- tion from a genetic perspective (King, 1993; Corbet, 1997). The problems for conservation are that the sub- species concept is firmly embedded in legislation used to protect endangered species (O’Brien & Mayr, 1991; Geist, 1992; Pennock & Dimmick, 1997), and that the use and definition of the taxonomic rank of sub- species has changed over time (Corbet, 1997). Formerly, subspecies names were given to populations as geo- graphic labels and were often based on single individu- als with aberrant morphology, or they were artificial constructs that arose from poor sampling along a cline of variation. As a result there is a plethora of subspecific names (many of which are still used today), which have no scientific basis. Conservation efforts are hampered because captive-breeding programmes may inadver- tently mix genetically and/or morphologically distinct populations, or may keep separate genetically and/or morphologically similar populations with apparently dif- ferent subspecies names. In the wild some populations may be currently recognized as taxonomically distinct, which after a thorough genetic and morphological analy- sis prove to be identical to neighbouring populations. Andrew C. Kitchener 1 and Andrew J. Dugmore 2 1 Department of Geology and Zoology, National Museums of Scotland, Royal Museum, Chambers Street, Edinburgh EH1 1JF, UK 2 Department of Geography, University of Edinburgh, Edinburgh EH8 9XP, UK (Received 13 May 1999; accepted 21 October 1999) Abstract The number of tiger subspecies is a major conservation issue that is difficult to resolve owing to small fragmented extant populations and limited historical samples in museums, which compromise the rigour of both molecular and morphological taxonomic studies. Rather than considering a static tax- onomic approach to geographical variation in the tiger, we consider the changing biogeographical range of the tiger through the last glacial–interglacial cycle, based on habitat associations of modern tiger specimen records, and environmental reconstructions from the Last Glacial Maximum (LGM; approximately 20 000 years before present (B.P.)). We regard this cycle as representative of the numerous glacial cycles that span the evolutionary history of the tiger since its appearance in the fos- sil record about two million years ago, thereby giving a deep-time perspective. The key issue is to determine the extent to which ancestral populations of the tiger were geographically isolated. If no geographical isolation is likely, and gene flow between tiger populations could be maintained until modern times, then diagnosably distinct populations could not have evolved. Our reconstructions show that only two tiger populations were likely to have experienced significant geographical isolation from the main species distribution; these were to the west of Tibet (during the LGM) and on Japan (through- out the glacial cycle). In addition, the LGM is likely to have seen the partial separation of peninsu- lar Malayan and Sunda Islands tigers from mainland populations. From a biogeographical perspective it seems probable that only three contemporary populations were sufficiently separated for the evo- lution of distinct populations, which can be regarded as subspecies or evolutionary significant units. Therefore, most variation in modern tiger populations is probably clinal, which has important impli- cations for future conservation strategies both in the wild and in captivity. All correspondence to: Andrew C. Kitchener. Tel: 0131-247 4240; Fax: 0131-220 4819; E-mail:[email protected].

Welcome message from author
This document is posted to help you gain knowledge. Please leave a comment to let me know what you think about it! Share it to your friends and learn new things together.
Transcript

Biogeographical change in the tiger, Panthera tigris
INTRODUCTION
The effective conservation of endangered species in thewild and in captivity is often hampered by a lack ofunderstanding of their geographical variation.Geographically and morphologically distinct popula-tions are most often called subspecies under the biolog-ical species concept (BSC) or species under thephylogenetic species concept (PSC), but because of thefrequent lack of concordance between out-dated tax-onomies and genetics, the term ‘evolutionary significantunit’ (ESU) is used to describe this intraspecific varia-tion from a genetic perspective (King, 1993; Corbet,1997). The problems for conservation are that the sub-species concept is firmly embedded in legislation usedto protect endangered species (O’Brien & Mayr, 1991;
Geist, 1992; Pennock & Dimmick, 1997), and thatthe use and definition of the taxonomic rank of sub-species has changed over time (Corbet, 1997). Formerly,subspecies names were given to populations as geo-graphic labels and were often based on single individu-als with aberrant morphology, or they were artificialconstructs that arose from poor sampling along a clineof variation. As a result there is a plethora of subspecificnames (many of which are still used today), which haveno scientific basis. Conservation efforts are hamperedbecause captive-breeding programmes may inadver-tently mix genetically and/or morphologically distinctpopulations, or may keep separate genetically and/ormorphologically similar populations with apparently dif-ferent subspecies names. In the wild some populationsmay be currently recognized as taxonomically distinct,which after a thorough genetic and morphological analy-sis prove to be identical to neighbouring populations.
Andrew C. Kitchener1 and Andrew J. Dugmore2
1 Department of Geology and Zoology, National Museums of Scotland, Royal Museum, Chambers Street, Edinburgh EH1 1JF, UK2 Department of Geography, University of Edinburgh, Edinburgh EH8 9XP, UK
(Received 13 May 1999; accepted 21 October 1999)
AbstractThe number of tiger subspecies is a major conservation issue that is difficult to resolve owing to smallfragmented extant populations and limited historical samples in museums, which compromise therigour of both molecular and morphological taxonomic studies. Rather than considering a static tax-onomic approach to geographical variation in the tiger, we consider the changing biogeographicalrange of the tiger through the last glacial–interglacial cycle, based on habitat associations of moderntiger specimen records, and environmental reconstructions from the Last Glacial Maximum (LGM;approximately 20 000 years before present (B.P.)). We regard this cycle as representative of thenumerous glacial cycles that span the evolutionary history of the tiger since its appearance in the fos-sil record about two million years ago, thereby giving a deep-time perspective. The key issue is todetermine the extent to which ancestral populations of the tiger were geographically isolated. If nogeographical isolation is likely, and gene flow between tiger populations could be maintained untilmodern times, then diagnosably distinct populations could not have evolved. Our reconstructions showthat only two tiger populations were likely to have experienced significant geographical isolation fromthe main species distribution; these were to the west of Tibet (during the LGM) and on Japan (through-out the glacial cycle). In addition, the LGM is likely to have seen the partial separation of peninsu-lar Malayan and Sunda Islands tigers from mainland populations. From a biogeographical perspectiveit seems probable that only three contemporary populations were sufficiently separated for the evo-lution of distinct populations, which can be regarded as subspecies or evolutionary significant units.Therefore, most variation in modern tiger populations is probably clinal, which has important impli-cations for future conservation strategies both in the wild and in captivity.
All correspondence to: Andrew C. Kitchener. Tel: 0131-247 4240;Fax: 0131-220 4819; E-mail:[email protected].
Clearly, limited conservation resources could be wastedin trying to ensure the survival of a population, which iscommoner elsewhere, but which is recognized as a puta-tively distinct population. Therefore, there is a need fora better understanding of geographical variation in endan-gered species to ensure their effective conservation.
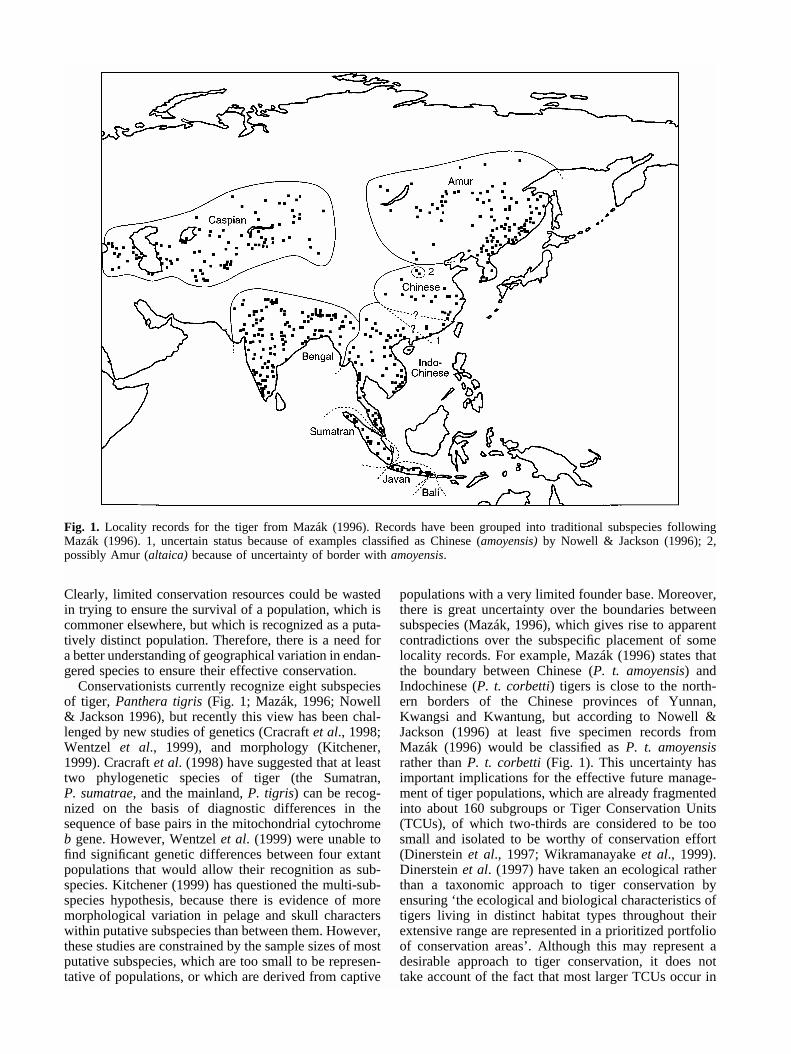
Conservationists currently recognize eight subspeciesof tiger, Panthera tigris (Fig. 1; Mazák, 1996; Nowell& Jackson 1996), but recently this view has been chal-lenged by new studies of genetics (Cracraft et al., 1998;Wentzel et al., 1999), and morphology (Kitchener,1999). Cracraft et al. (1998) have suggested that at leasttwo phylogenetic species of tiger (the Sumatran,P. sumatrae, and the mainland, P. tigris) can be recog-nized on the basis of diagnostic differences in thesequence of base pairs in the mitochondrial cytochromeb gene. However, Wentzel et al. (1999) were unable tofind significant genetic differences between four extantpopulations that would allow their recognition as sub-species. Kitchener (1999) has questioned the multi-sub-species hypothesis, because there is evidence of moremorphological variation in pelage and skull characterswithin putative subspecies than between them. However,these studies are constrained by the sample sizes of mostputative subspecies, which are too small to be represen-tative of populations, or which are derived from captive
populations with a very limited founder base. Moreover,there is great uncertainty over the boundaries betweensubspecies (Mazák, 1996), which gives rise to apparentcontradictions over the subspecific placement of somelocality records. For example, Mazák (1996) states thatthe boundary between Chinese (P. t. amoyensis) andIndochinese (P. t. corbetti) tigers is close to the north-ern borders of the Chinese provinces of Yunnan,Kwangsi and Kwantung, but according to Nowell &Jackson (1996) at least five specimen records fromMazák (1996) would be classified as P. t. amoyensisrather than P. t. corbetti (Fig. 1). This uncertainty hasimportant implications for the effective future manage-ment of tiger populations, which are already fragmentedinto about 160 subgroups or Tiger Conservation Units(TCUs), of which two-thirds are considered to be toosmall and isolated to be worthy of conservation effort(Dinerstein et al., 1997; Wikramanayake et al., 1999).Dinerstein et al. (1997) have taken an ecological ratherthan a taxonomic approach to tiger conservation byensuring ‘the ecological and biological characteristics oftigers living in distinct habitat types throughout theirextensive range are represented in a prioritized portfolioof conservation areas’. Although this may represent adesirable approach to tiger conservation, it does not take account of the fact that most larger TCUs occur in
Fig. 1. Locality records for the tiger from Mazák (1996). Records have been grouped into traditional subspecies followingMazák (1996). 1, uncertain status because of examples classified as Chinese (amoyensis) by Nowell & Jackson (1996); 2,possibly Amur (altaica) because of uncertainty of border with amoyensis.

border areas in countries where there is often acute polit-ical and social instability. This strategy alone may notbe successful for the conservation of the tiger, unless itis coupled with more intensive joint management of pop-ulations both in the wild and in captivity, as has beenproposed for the tiger (for a review, see Tilson &Christie, 1999), which may also include translocations,re-introductions and even embryo transfers. Therefore,uncertainty over the morphological and genetic distinc-tiveness of tiger populations may compromise the effec-tive management of critical populations in the wild, orresult in genetic corruption by inappropriate movementsof tigers based on false assumptions. Rigorous reassess-ment of geographical variation in the tiger is a key issue,which could provide insights that are critical for both insitu and ex situ conservation of the tiger. However, giventhe critical lack of specimens available for research anduncertainties over the boundaries between putative sub-species, alternative approaches have to be considered,the most powerful of which is a biogeographical analy-sis with a deep-time perspective.
In order for diagnosably distinct populations (sub-species, ESUs etc) to evolve, there must have been a sig-nificant period of isolation between populations topermit the evolution of unique morphological andgenetic characteristics. Before human impacts, variationin the tiger’s geographical distribution was primarilydetermined by the environmental changes of thePleistocene glaciations (Hemmer, 1987; Lowe &Walker, 1997; Kitchener, 1999). Although the precisenumber of glacial (cold) and interglacial (warm) periodsis unknown, ocean core evidence indicates at least 50cold stages in the last 2.6 million years (Shackleton,Berger & Peltier, 1990). Although the duration andintensity of these episodes has varied, all have producedsignificant shifts in global ecological zones and, byimplication, have driven changes in tiger distribution.The crux of our biogeographical approach is to simulatethe large-scale habitat shifts produced by the climaticchanges of the glacial cycles to see if they could haveproduced the geographical isolation of tiger populationsthat could have led to the development of diagnosablydistinct populations. Alternatively, regional populationsmay have remained in gene-flow contact throughout theglacial cycles, reducing the probability of the differen-tiation of local populations (Kitchener, 1999). A bio-geographical analysis offers a new approach todetermining which modern tiger populations are mostprobably diagnosably distinct and it complements exist-ing morphological and genetic studies. This approachalso avoids three fundamental problems created byrecent human-induced extinctions. First, the limitationsimposed by the highly fragmented distributions of mod-ern populations. Secondly, the restricted variability ofcaptive populations, which are derived from fewfounders and probably display little of the original mor-phological and genetic variation. Thirdly, the limitednumber of preserved tiger specimens with precise local-ity data that do not give an accurate geographical spreadand may not be representative of the original popula-
tions (e.g. Mazák, Groves & Van Bree, 1978, record onlyeight Bali tigers in museum collections).
In this paper we first tested the hypothesis that threeenvironmental factors can effectively define tiger distri-bution. We used established area-specific habitat data todefine general relationships between tigers and vegeta-tion zones, topography and precipitation, and assessedthe validity of the approach by comparing a modelledmaximum interglacial distribution (i.e. the modern worldwithout the impact of people) with a map of all knowntiger records.
Using the BIOME 3 habitat model (Haxeltine, 1986)with modifications, we extended our analysis to predictthe distribution of the tiger at the Last Glacial Maximum(LGM; approximately 20 000 years before present(B.P.)). Taking these extremes of the glacial cycle, wedetermined possible discontinuities in tiger distribution,which would have allowed the evolution of diagnosablydistinct populations and compared them with the knowndistribution of the eight putative subspecies recognizedtoday.
THE APPROACH
A key step in modelling changes in the global distribu-tion of tigers is to establish critical environmental limitsusing data that can be reconstructed for both interglacialand glacial periods. A primary control on tiger distrib-ution is the availability of prey (Miquelle et al., 1999),but as prey species vary from region to region, and theirchanging distribution through the Quaternary isunknown, this approach cannot be used. Instead wefocused attention on vegetation zones, topography andprecipitation, since these three factors can be recon-structed for the height of the last glacial period and couldeffectively constrain tiger distribution through theirimpact on prey species. Therefore, our first step was totest the hypothesis that vegetation zones, topography andprecipitation alone could define the overall distributionof tigers. We used established area-specific habitat datato define general relationships between these three vari-ables and published distribution maps for the tiger (e.g.Nowell & Jackson, 1996; Dinerstein et al., 1997;Miquelle et al., 1999; see Tables 1–3). We then assessedthe strength of the relationship by using the data to cre-ate a habitat/topography/precipitation (HTP) predictionmodel to define the global distribution of tigers and com-pared this simulated distribution to the specimen local-ity records of Mazák (1996) (Fig. 1).
As an alternative approach we created also a distrib-ution data prediction (DDP) model, based on the asso-ciation between Mazák’s (1996) distribution data, theBIOME 3 habitat classes (with modifications fromMathews, 1983; Olson, Watts & Allison, 1983; GVKG,1990), and selected categories of precipitation andtopography (see Tables 4–6). This method was likely torepresent a minimum distribution since tigers may havebeen under-recorded in some habitats, such as placeswhere specimens were difficult to collect, or areas rarelyor not visited by naturalists and collectors.

Fig. 2. The maximum interglacial distribution of the tiger as predicted by the HTP model. The 50 cm snow depth contour was replotted from Baranov et al. (1969).
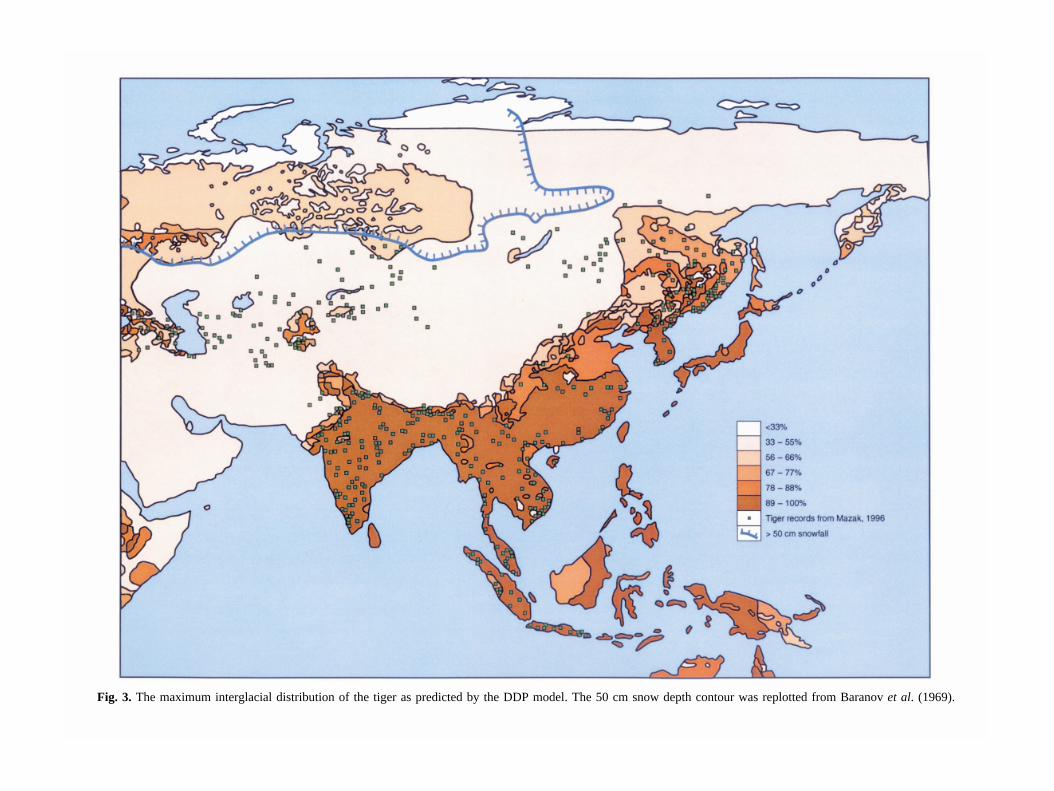
Fig. 3. The maximum interglacial distribution of the tiger as predicted by the DDP model. The 50 cm snow depth contour was replotted from Baranov et al. (1969).
MATERIALS AND METHODS
Model 1: habitat/topography/precipitation (HTP)probability model
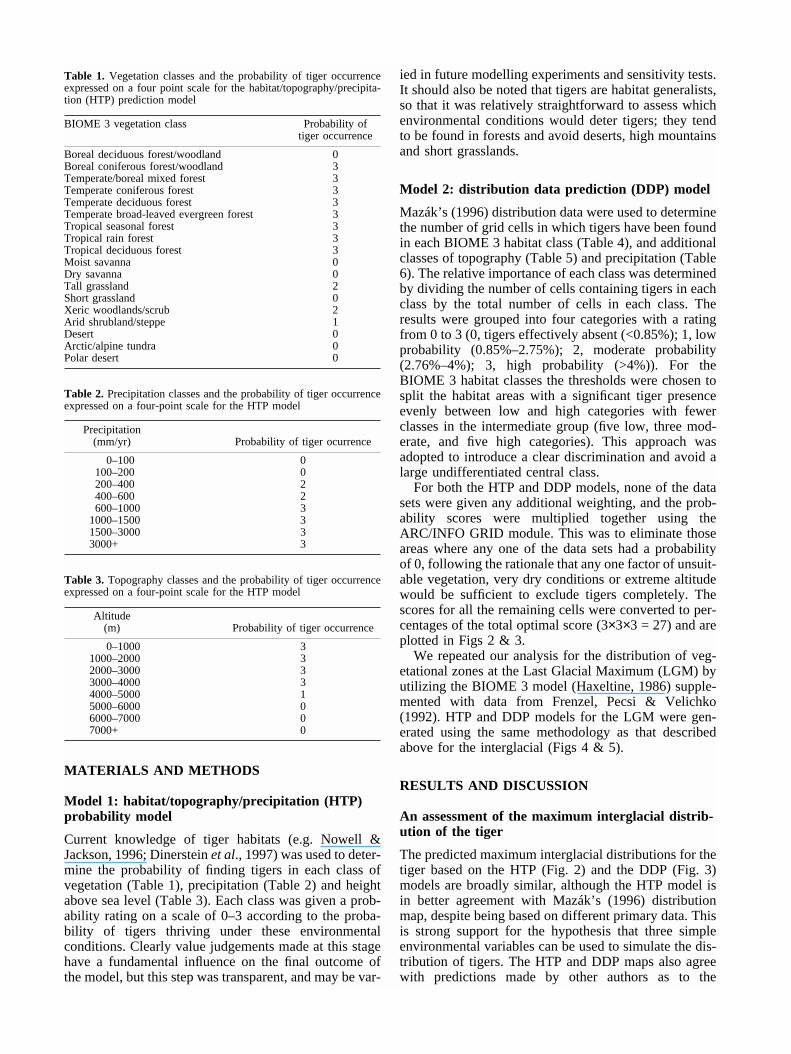
Current knowledge of tiger habitats (e.g. Nowell &Jackson, 1996; Dinerstein et al., 1997) was used to deter-mine the probability of finding tigers in each class ofvegetation (Table 1), precipitation (Table 2) and heightabove sea level (Table 3). Each class was given a prob-ability rating on a scale of 0–3 according to the proba-bility of tigers thriving under these environmentalconditions. Clearly value judgements made at this stagehave a fundamental influence on the final outcome ofthe model, but this step was transparent, and may be var-
ied in future modelling experiments and sensitivity tests.It should also be noted that tigers are habitat generalists,so that it was relatively straightforward to assess whichenvironmental conditions would deter tigers; they tendto be found in forests and avoid deserts, high mountainsand short grasslands.
Model 2: distribution data prediction (DDP) model
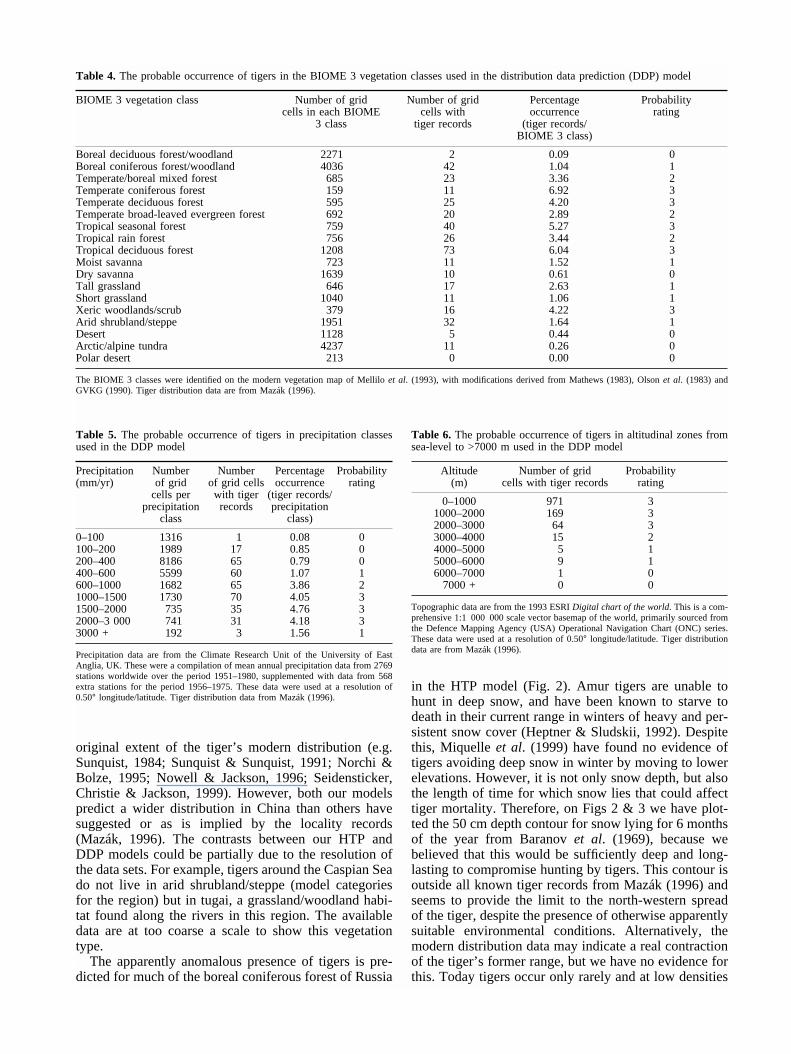
Mazák’s (1996) distribution data were used to determinethe number of grid cells in which tigers have been foundin each BIOME 3 habitat class (Table 4), and additionalclasses of topography (Table 5) and precipitation (Table6). The relative importance of each class was determinedby dividing the number of cells containing tigers in eachclass by the total number of cells in each class. Theresults were grouped into four categories with a ratingfrom 0 to 3 (0, tigers effectively absent (<0.85%); 1, lowprobability (0.85%–2.75%); 2, moderate probability(2.76%–4%); 3, high probability (>4%)). For theBIOME 3 habitat classes the thresholds were chosen tosplit the habitat areas with a significant tiger presenceevenly between low and high categories with fewerclasses in the intermediate group (five low, three mod-erate, and five high categories). This approach wasadopted to introduce a clear discrimination and avoid alarge undifferentiated central class.
For both the HTP and DDP models, none of the datasets were given any additional weighting, and the prob-ability scores were multiplied together using theARC/INFO GRID module. This was to eliminate thoseareas where any one of the data sets had a probabilityof 0, following the rationale that any one factor of unsuit-able vegetation, very dry conditions or extreme altitudewould be sufficient to exclude tigers completely. Thescores for all the remaining cells were converted to per-centages of the total optimal score (3×3×3 = 27) and areplotted in Figs 2 & 3.
We repeated our analysis for the distribution of veg-etational zones at the Last Glacial Maximum (LGM) byutilizing the BIOME 3 model (Haxeltine, 1986) supple-mented with data from Frenzel, Pecsi & Velichko(1992). HTP and DDP models for the LGM were gen-erated using the same methodology as that describedabove for the interglacial (Figs 4 & 5).
RESULTS AND DISCUSSION
An assessment of the maximum interglacial distrib-ution of the tiger
The predicted maximum interglacial distributions for thetiger based on the HTP (Fig. 2) and the DDP (Fig. 3)models are broadly similar, although the HTP model isin better agreement with Mazák’s (1996) distributionmap, despite being based on different primary data. Thisis strong support for the hypothesis that three simpleenvironmental variables can be used to simulate the dis-tribution of tigers. The HTP and DDP maps also agreewith predictions made by other authors as to the
Table 1. Vegetation classes and the probability of tiger occurrenceexpressed on a four point scale for the habitat/topography/precipita-tion (HTP) prediction model
BIOME 3 vegetation class Probability of tiger occurrence
Boreal deciduous forest/woodland 0 Boreal coniferous forest/woodland 3Temperate/boreal mixed forest 3Temperate coniferous forest 3Temperate deciduous forest 3Temperate broad-leaved evergreen forest 3Tropical seasonal forest 3Tropical rain forest 3Tropical deciduous forest 3Moist savanna 0Dry savanna 0Tall grassland 2Short grassland 0Xeric woodlands/scrub 2Arid shrubland/steppe 1Desert 0Arctic/alpine tundra 0Polar desert 0
Table 2. Precipitation classes and the probability of tiger occurrenceexpressed on a four-point scale for the HTP model
Precipitation(mm/yr) Probability of tiger ocurrence
0–100 0100–200 0200–400 2400–600 2600–1000 3
1000–1500 31500–3000 33000+ 3
Table 3. Topography classes and the probability of tiger occurrenceexpressed on a four-point scale for the HTP model
Altitude (m) Probability of tiger occurrence
0–1000 31000–2000 32000–3000 33000–4000 34000–5000 15000–6000 06000–7000 07000+ 0
original extent of the tiger’s modern distribution (e.g.Sunquist, 1984; Sunquist & Sunquist, 1991; Norchi &Bolze, 1995; Nowell & Jackson, 1996; Seidensticker,Christie & Jackson, 1999). However, both our modelspredict a wider distribution in China than others havesuggested or as is implied by the locality records(Mazák, 1996). The contrasts between our HTP andDDP models could be partially due to the resolution ofthe data sets. For example, tigers around the Caspian Seado not live in arid shrubland/steppe (model categoriesfor the region) but in tugai, a grassland/woodland habi-tat found along the rivers in this region. The availabledata are at too coarse a scale to show this vegetationtype.
The apparently anomalous presence of tigers is pre-dicted for much of the boreal coniferous forest of Russia
in the HTP model (Fig. 2). Amur tigers are unable tohunt in deep snow, and have been known to starve todeath in their current range in winters of heavy and per-sistent snow cover (Heptner & Sludskii, 1992). Despitethis, Miquelle et al. (1999) have found no evidence oftigers avoiding deep snow in winter by moving to lowerelevations. However, it is not only snow depth, but alsothe length of time for which snow lies that could affecttiger mortality. Therefore, on Figs 2 & 3 we have plot-ted the 50 cm depth contour for snow lying for 6 monthsof the year from Baranov et al. (1969), because webelieved that this would be sufficiently deep and long-lasting to compromise hunting by tigers. This contour isoutside all known tiger records from Mazák (1996) andseems to provide the limit to the north-western spreadof the tiger, despite the presence of otherwise apparentlysuitable environmental conditions. Alternatively, themodern distribution data may indicate a real contractionof the tiger’s former range, but we have no evidence forthis. Today tigers occur only rarely and at low densities
Table 4. The probable occurrence of tigers in the BIOME 3 vegetation classes used in the distribution data prediction (DDP) model
BIOME 3 vegetation class Number of grid Number of grid Percentage Probability cells in each BIOME cells with occurrence rating
3 class tiger records (tiger records/BIOME 3 class)
Boreal deciduous forest/woodland 2271 2 0.09 0Boreal coniferous forest/woodland 4036 42 1.04 1Temperate/boreal mixed forest 685 23 3.36 2Temperate coniferous forest 159 11 6.92 3Temperate deciduous forest 595 25 4.20 3Temperate broad-leaved evergreen forest 692 20 2.89 2Tropical seasonal forest 759 40 5.27 3Tropical rain forest 756 26 3.44 2Tropical deciduous forest 1208 73 6.04 3Moist savanna 723 11 1.52 1Dry savanna 1639 10 0.61 0Tall grassland 646 17 2.63 1Short grassland 1040 11 1.06 1Xeric woodlands/scrub 379 16 4.22 3Arid shrubland/steppe 1951 32 1.64 1Desert 1128 5 0.44 0Arctic/alpine tundra 4237 11 0.26 0Polar desert 213 0 0.00 0
The BIOME 3 classes were identified on the modern vegetation map of Mellilo et al. (1993), with modifications derived from Mathews (1983), Olson et al. (1983) andGVKG (1990). Tiger distribution data are from Mazák (1996).
Table 5. The probable occurrence of tigers in precipitation classesused in the DDP model
Precipitation Number Number Percentage Probability(mm/yr) of grid of grid cells occurrence rating
cells per with tiger (tiger records/precipitation records precipitation
class class)
0–100 1316 1 0.08 0100–200 1989 17 0.85 0200–400 8186 65 0.79 0400–600 5599 60 1.07 1600–1000 1682 65 3.86 21000–1500 1730 70 4.05 31500–2000 735 35 4.76 32000–3 000 741 31 4.18 33000 + 192 3 1.56 1
Precipitation data are from the Climate Research Unit of the University of EastAnglia, UK. These were a compilation of mean annual precipitation data from 2769stations worldwide over the period 1951–1980, supplemented with data from 568extra stations for the period 1956–1975. These data were used at a resolution of0.50° longitude/latitude. Tiger distribution data from Mazák (1996).
Table 6. The probable occurrence of tigers in altitudinal zones fromsea-level to >7000 m used in the DDP model
Altitude Number of grid Probability (m) cells with tiger records rating
0–1000 971 31000–2000 169 32000–3000 64 33000–4000 15 24000–5000 5 15000–6000 9 16000–7000 1 0
7000 + 0 0
Topographic data are from the 1993 ESRI Digital chart of the world. This is a com-prehensive 1:1 000 000 scale vector basemap of the world, primarily sourced fromthe Defence Mapping Agency (USA) Operational Navigation Chart (ONC) series.These data were used at a resolution of 0.50° longitude/latitude. Tiger distributiondata are from Mazák (1996).

Fig. 4. The distribution of the tiger at the last glacial maximum (approximately 20 000 B.P.) as predicted by the HTP model.
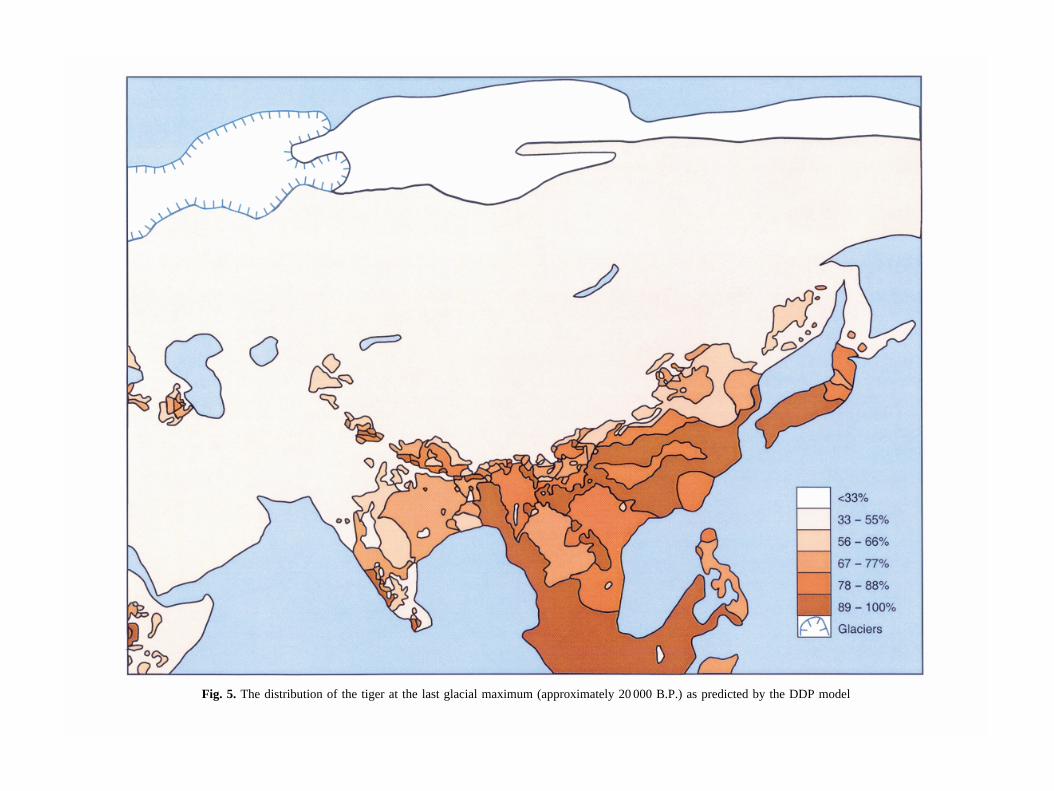
Fig. 5. The distribution of the tiger at the last glacial maximum (approximately 20 000 B.P.) as predicted by the DDP model
in boreal coniferous forest, probably because of low preydensity (Heptner & Sludskii, 1992; Nowell & Jackson,1996).
Both models predict that the tiger should occur todayin Japan and Borneo (Figs 2 & 3). Fossil evidence indi-cates that tigers occurred formerly in Japan and Borneo,but they have not been recorded there in historic times,probably due to human-induced extinctions (Hemmer,1968; Medway, 1977; Kitchener, 1999). Other areas forwhich the tiger’s presence is predicted (e.g. New Guinea,Australia, the Philippines and Africa) were clearly notaccessible to the tiger for colonization.
HTP and DDP models for the distribution of thetiger at the LGM
Both the HTP and DDP models predict an overall declinein the extent of the tiger’s distribution at the LGM(Figs 4 & 5). The overall distributions are shown to havecontracted southwards, but there are significant differ-ences between the two models. The HTP model predictsa greater probability of tigers over a wide area aroundthe Caspian and Aral seas, and a possible separation intotwo populations, one to the west and the other east of theCaspian Sea (Fig. 4). In contrast, the DDP model pre-dicts the presence of tigers in only a limited area to thesouth-west of the Caspian Sea (Fig. 5).
Both models predict that during the LGM there waslittle or no chance of tigers occupying the parts of east-ern Siberia that later became the range of the Amur tiger.During the LGM areas with a high probability of tigeroccurrence in the Russian Far East and Korea wouldhave been connected to China via suitable habitat acrossexposed continental shelf. The implication is that therehas been no barrier to complete gene flow been the puta-tive Amur and Chinese tiger subspecies throughout aglacial cycle. Throughout the glacial cycle it seems thatChina remained the core distribution for the tiger withlinks via the continental shelf to Hainan (where tigershave been recorded) and Formosa (where they have not).
The HTP model predicted a rather tenuous separationbetween the tigers in China and peninsular Malaya dur-ing the LGM, owing to the presence of short grasslandsin much of south east Asia (Figure 4). Both models alsosuggest that tigers were either absent or only present invery low numbers throughout much of the Indian sub-continent, owing to a similar presence of short grass-lands. The only notable exception being possibleenclaves of suitable habitat in the western Ghats ofsouth-west India, which may have extended acrossneighbouring shelf areas exposed by lower global sealevels. However, we believe that this is unlikely and,instead, tigers colonized most of India within the last12 000 years when suitable habitat returned. It is alsolikely that lions, Panthera leo, would have occupied theshort grasslands, thereby preventing the colonization oftigers into this sub-optimal habitat type. This wouldexplain why tigers never successfully occupied SriLanka; they might not have reached southern India untilafter the island of Sri Lanka was formed by rising inter-
glacial sea levels (see Hemmer, 1987; Kitchener, 1999).Alternatively tigers could have become extinct on SriLanka during the Holocene, but we have no evidencefor this. Both models predict suitable tiger habitat alongthe foothills of the Himalayas and in the Sundarbans.Therefore, assuming an evolutionary origin in easternAsia (discussed in Kitchener, 1999), both models sug-gest that tigers colonized western Asia via theHimalayan route (Heptner & Sludskii, 1992) rather thanthe central Asian route (Mazák, 1996).
The HTP model indicates a possible geographical sep-aration of tigers into three distinct populations; in theCaspian Sea region, the rest of the Asian mainland andpeninsular Malaya/Sunda Islands. Given sufficiently longgeographical isolation, these populations could haveevolved diagnosably distinct characteristics. Under theBSC these would be recognized as three subspecies (orthree species using the PSC), namely P. t. virgata(Caspian), P. t. tigris (Asian mainland) and P. t. sondaica(Sunda Islands/peninsular Malaya). This is most similarto the subspecies model 3 proposed by Kitchener (1999),and is not incompatible with the two taxa hypothesis pro-posed by Cracraft et al. (1998). However, it is doubtfulwhether separation times would have been long enoughfor full speciation within the last 12 000 years, which isconsistent with the molecular data of Wentzel et al.(1999). However, Cracraft et al.’s (1998) data suggest amuch longer separation time for Sumatran tigers than the12 000 years since the end of the last Ice Age, but manyof the tigers used in this study were captive bred and hadsimilar founders as ancestors (S. Christie, pers. comm.),so it is unclear how representative the diagnosably dis-tinct genetic sequences for cytochrome b are for theSumatran tiger. In contrast, the DDP model indicates onlytwo clearly separated LGM tiger distributions, whichmight represent only two diagnosably distinct popula-tions in the Caspian region and the rest of Asia. Bothmodels showed also that Japan’s tigers were totally iso-lated throughout the last glacial cycle and must have col-onized the islands more than 100 000 years ago. It ishighly probable that these tigers represented a very dis-tinct subspecies or even separate species of tiger, whichis unfortunately now extinct (Hemmer 1968).
One anomaly not predicted by the model is the appar-ent absence of Sunda Island tigers from the peninsularMalaya today, which is instead populated by mainlandtigers as indicated by their larger skull and carnassialtooth sizes (Mazák, 1996; Kitchener, 1999). One possi-ble explanation is the impact of the catastrophic volcaniceruption of Toba at around 75 000 B.P. that depositedover 2500 km3 of tephra across northern Sumatra, andproduced a recognizable layer of fallout across theIndian subcontinent (Ninkovich, Sparks & Ledbetter,1978; Westgate et al., 1998). This eruption would havedestroyed vegetation across large areas of northernSumatra and neighbouring peninsular Malaya.Depending on the rate of recovery of the vegetation, tigerrecolonization could have been at the same rate from thenorth and south, and could have coincided with the sep-aration of mainland and island populations by rising sea
levels at the end of the last glaciation, so resulting in theobserved biogeographical anomaly.
WIDER IMPLICATIONS
Developments of our biogeographical approach couldtackle a series of important questions relating to both theevolution and conservation of the tiger. Of particular rel-evance to evolutionary studies would be establishing thedynamics of change between the LGM and the presentday, so that we could estimate for how long populationswere isolated during the late Pleistocene, and predictboth the rate and patterns of recolonization during theHolocene. It should also be possible to determine the spa-tial development of human impact on the fragmentationof a once contiguous mid-Holocene tiger population.
It would also be possible to tackle a number of moreimmediate conservation and ecological concerns. Forexample, this approach could use current estimates ofpopulation densities of tigers in different habitats (e.g.Nowell & Jackson, 1996), to calculate the maximumtotal population of the tiger throughout its former range.The biogeographical approach could also be extended tosee how the current and former distributions of key com-petitors (e.g. lions, Panthera leo) and prey species (e.g.wild pigs, Sus spp. and deer, Cervus spp.) may influencetiger distribution and contribute positively to future con-servation and management plans. From this it would bepossible to predict areas where the tiger may still existoutside our current knowledge or suggest the best areasfor future translocations and reintroductions.
BIOGEOGRAPHICAL MODELS AND TIGERCONSERVATION
This biogeographical analysis suggests that there wereonly three populations that are diagnosably distinct dueto geographic isolation. Using formal taxonomy, thiswould be equivalent to three subspecies using the BSCor three species if applying the PSC (King, 1993). Ofthese, one is already extinct (the Caspian; virgata) andanother (the Sunda Islands=Sumatran; sondaica (includ-ing sumatrae)) is critically endangered and has beeneradicated from most of its former range. Clearly mostof the geographical variation seen in tigers today islargely clinal in response to environmental and ecolog-ical gradients throughout their mainland distribution.This biogeographical evaluation of tiger subspecies canbe tested using molecular methods and provides oppor-tunities for more appropriate conservation managementof extant fragmented populations. For example, ouranalysis suggests the conspecificity of Indochinese,Indian and Chinese tigers, which would allow for thegenetic reinforcement of the critically endangeredChinese population using these neighbouring popula-tions. Heptner & Sludskii (1992) record examples oftigers dispersing more than 1000 km, when followingmigratory prey species into areas not occupied normallyby tigers. Therefore, a distance of 1000 km could formthe basis of a rough guide for the ‘mixing’ of geo-
graphically distant populations. This provides a morepowerful and flexible approach to the conservation prob-lems facing many tiger populations today, rather thanpersisting with an inappropriate multi-subspeciesapproach, which could hamper their future survival. Italso complements Dinerstein et al.’s (1997) ecologicalapproach to tiger conservation, where a more proactivestrategy may be required to reinforce local populationsfrom captivity or by translocation.
In contrast, Amur tigers are isolated from other tigerpopulations by more than their maximum known dis-persal distance. Consequently, this population shouldreceive a high conservation ranking, since genetic re-inforcement from other populations would be inappro-priate today. Any introduction of genes from other tigerpopulations may well disrupt co-adapted gene com-plexes that have evolved to promote the Amur tiger’ssurvival in the far north of its current distribution, andthus compromise its survival.
We believe that biogeographical models offer a pow-erful tool to complement morphological and moleculartaxonomic studies of species and subspecies. They alsoprovide important insights into how and where diagnos-ably distinct populations may have evolved. Furthermore,they can also provide a better understanding of the sig-nificance of current distributions and so assist in con-servation and management of the tiger and otherendangered species.
Acknowledgements
Vegetation data were provided by Martin Sykes,University of Lund. We gratefully acknowledge dataprocessing by Robert Lee You, computing support bySteve Dowes, and cartography by Anona Lyons, all atthe University of Edinburgh, and Russian translations byMike Falchior. We are most grateful to the NMSCharitable Trust for their generous sponsorship of thecolour maps in this paper.
REFERENCES
Baranov, A. N., Arep’eva, N. I., Beliaeva, L. I., Blinova, N. I.,Dobrovol’skaia, N. V., Zarutskaia, I. P., Kel’ner, Yu. G., Lysiuk,V. N., Nikishov, A. V., Nikol’skaia, E. N., Rostovtseva, E. P.,Teplova, S. N., Terekhov, N. M. & Edelshtein, A. V. (Eds)(1969). Atlas of the USSR. 2nd edn. Moscow: Chief Office ofGeodesy and Cartography.
Corbet, G. B. (1997). The species in mammals. In Species: theunits of biodiversity: 341–356. Claridge, M. F., Dawah, H. A.& Wilson, M. R. (Eds). London: Chapman & Hall.
Cracraft, J., Feinstein, J., Vaughn, J. & Helm-Bychowski, K.(1998). Sorting out tigers (Panthera tigris): mitochondrialsequences, nuclear inserts, systematics and conservation genet-ics. Anim. Conserv. 1: 139–150.
Dinerstein, E., Wickramanayake, E., Robinson, J., Karanth, U.,Rabinowitz, A., Olson, D., Mathew, T., Hedao, P. & Connor,M. (1997). A framework for identifying high priority areas andactions for the conservation of tigers in the wild. Part 1. A frame-work for identifying high priority areas for the conservation offree-ranging tigers. Washington, DC: World Wildlife Fund andWildlife Conservation Society.

ESRI (1993). Digital chart of the world. http://www.esri.com:Environmental Systems Research Institute Inc.
Frenzel, B., Pecsi, M. & Velichko, A. A. (Eds) (1992). Atlas ofpalaeoclimates and palaeoenvironments of the northern hemi-sphere: late-Pleistocene-Holocene. Stuttgart: Gustav FischerVerlag.
Geist, V. (1992). Endangered species and the law. Nature, Lond.357: 274–276.
GVKG (1990). Vegetation of the USSR. Minsk: Institute ofGeography of the Siberian Department of the USSR Academyof Sciences, Botanical Institute of the USSR Academy ofSciences & Moscow State University Geography Department.
Haxeltine, A. (1986). Modelling the vegetation of the Earth. PhDthesis: Lund University.
Hemmer, H. (1968). Der Tiger Panthera tigris palaeosinensis(Zdansky, 1924) im Jungpleistozän Japans. Neues Jb Geol.Paläont. Abh. 129: 83–96.
Hemmer, H. (1987). The phylogeny of the tiger (Panthera tigris).In Tigers of the world: the biopolitics, management and con-servation of an endangered species: 51–63. Tilson, R. L. & Seal,U. S. (Eds). Park Ridge, NJ: Noyes Publications.
Heptner, V. G. & Sludskii, A. A. (1992). Mammals of the SovietUnion.Volume II, Part 2. Carnivora (hyenas and cats). Leiden:Brill.
King, M. (1993). Species evolution: the role of chromosomechange. Cambridge: Cambridge University Press.
Kitchener, A. C. (1999). Tiger distribution, phenotypic variationand conservation issues. In Riding the tiger. Tiger conservationin human-dominated landscapes: 19–39. Seidensticker, J.,Christie, S. & Jackson, P. (Eds). Cambridge: CambridgeUniversity Press.
Lowe, J. J. & Walker, M. J. C. (1997). Reconstructing Quaternaryenvironments. 2nd edn. London: Longman.
Mathews, E. J. (1983). Global vegetation and land use: new highresolution data bases for climate studies. J. Clim. Appl. Meteorol.22: 474–487.
Mazák, V. J. (1996). Der Tiger. Magdeburg: WestarpWissenschaften.
Mazák, V. J., Groves, C. P. & Van Bree, P. J. H. (1978). On askin and skull of the Bali tiger, and a list of preserved speci-mens of Panthera tigris balica (Schwarz, 1912). Zeits.Säugetierk. 43: 108–113.
Medway, Lord (1977). Mammals of Borneo. Kuala Lumpur:Malaysian Branch of the Royal Asiatic Society.
Mellilo, J. M., McGuire, A. D., Kicklighter, D. W., Moore III,M. B., Vorosmarty, C. J. & Schloss, A. L. (1993). Global cli-mate change and terrestrial net primary production. Nature,Lond. 363: 234–240.
Miquelle, D. G., Smirnov, E. N., Merrill, T. W., Myslenkov,A. E., Quigley, H. B., Hornocker, M. G. & Schleyer, B.(1999). Hierarchical spatial analysis of Amur tiger relationshipsto habitat and prey. In Riding the tiger. Tiger conservationin human-dominated landscapes: 71–99. Seidensticker, J.,Christie, S. & Jackson, P. (Eds). Cambridge: CambridgeUniversity Press.
Ninkovich, D., Sparks, R. S. J. & Ledbetter, M. T. (1978). The
exceptional magnitude and intensity of the Toba eruption,Sumatra: an example of the use of deep-sea tephra layers as ageological tool. Bull. Vulcanol. 41(3): 286–298.
Norchi, D. & Bolze, D. (1995). Saving the tiger: a conservationstrategy. WCS Policy Report no. 3. New York: WildlifeConservation Society.
Nowell, K. & Jackson, P. (1996). Wild cats. Status survey andconservation action plan. Gland, Switzerland: IUCN.
O’Brien, S. J. & Mayr, E. (1991). Bureaucratic mischief: recog-nizing endangered species and subspecies. Science 251:1187–1188.
Olson , J. S., Watts, J. A. & Allison, L. J. (1983). Carbon in livevegetation of major world ecosystems. ORNL –5682. OakRidge, TE: Oak Ridge National Laboratory.
Pennock, D. S. & Dimmick, W. W. (1997). Critique of the evo-lutionary significant unit as a definition for ‘distinct populationsegments’ under the US Endangered Species Act. Conserv. Biol.11: 611–619.
Seidensticker, J., Christie, S. & Jackson, P. (Eds) (1999). Ridingthe tiger. Tiger conservation in human-dominated landscapes.Cambridge: Cambridge University Press.
Shackleton, N. J., Berger, A. & Peltier, W. R. (1990). An alter-native astronomical calibration of the lower Pleistocenetimescale based on ODP Site 677. Trans. R. Soc. Edinb.: EarthSci. 81: 251–261.
Sunquist, M. (1984). Tiger. In The encyclopaedia of mammals:volume 1: 36–39. Macdonald, D. (Ed.). London: George Allen& Unwin.
Sunquist, M. & Sunquist, F. C. (1991). Tigers. In Great cats:94–104. Seidensticker, J. & Lumpkin, S. (Eds). London:Merehurst.
Tilson, R. & Christie, S. (1999). Effective tiger conservationrequires cooperation. Zoos as a support for tigers. In Riding thetiger. Tiger conservation in human-dominated landscapes:201–214. Seidensticker, J., Christie, S. & Jackson, P. (Eds).Cambridge: Cambridge University Press.
Wentzel, J., Stephens, J. C., Johnson, W., Menotti-Raymond, M.,Pecon-Slattery, J., Yuhki, N., Carrington, M., Quigley, H. B.,Miquelle, D. G., Tilson, R., Manansang, J., Brady, G., Zhi, L.,Wenshi, P., Shi-Qiang, H., Johnston, L., Sunquist, M., Karanth,K. U. & O’Brien, S. J. (1999). In Riding the tiger. Tiger con-servation in human-dominated landscapes: 40–49.Seidensticker, J., Christie, S. & Jackson, P. (Eds). Cambridge:Cambridge University Press.
Westgate, J. A., Shane, P. A. R., Pearce, N. J. G., Perkins, W. T.,Korisetar, R., Chesner, C. A. & Williams, M. A. J. (1998). AllToba occurences across peninsula India belong to the 75 000 yrB.P. eruption. Quatern. Res. 50(1): 107–112.
Wikramanayake, E. D., Dinerstein, E., Robinson, J. G., Karanth,K. U., Rabinowitz, A., Olson, D., Mathew, T., Hedao, P.,Connor, M., Hemley, G. & Bolze, D. (1999). Where can tigerslive in the future? A framework for identifying high-priorityareas for the conservation of tigers in the wild. In Riding thetiger. Tiger conservation in human-dominated landscapes:255–272. Seidensticker, J., Christie, S. & Jackson, P. (Eds).Cambridge: Cambridge University Press.
Related Documents