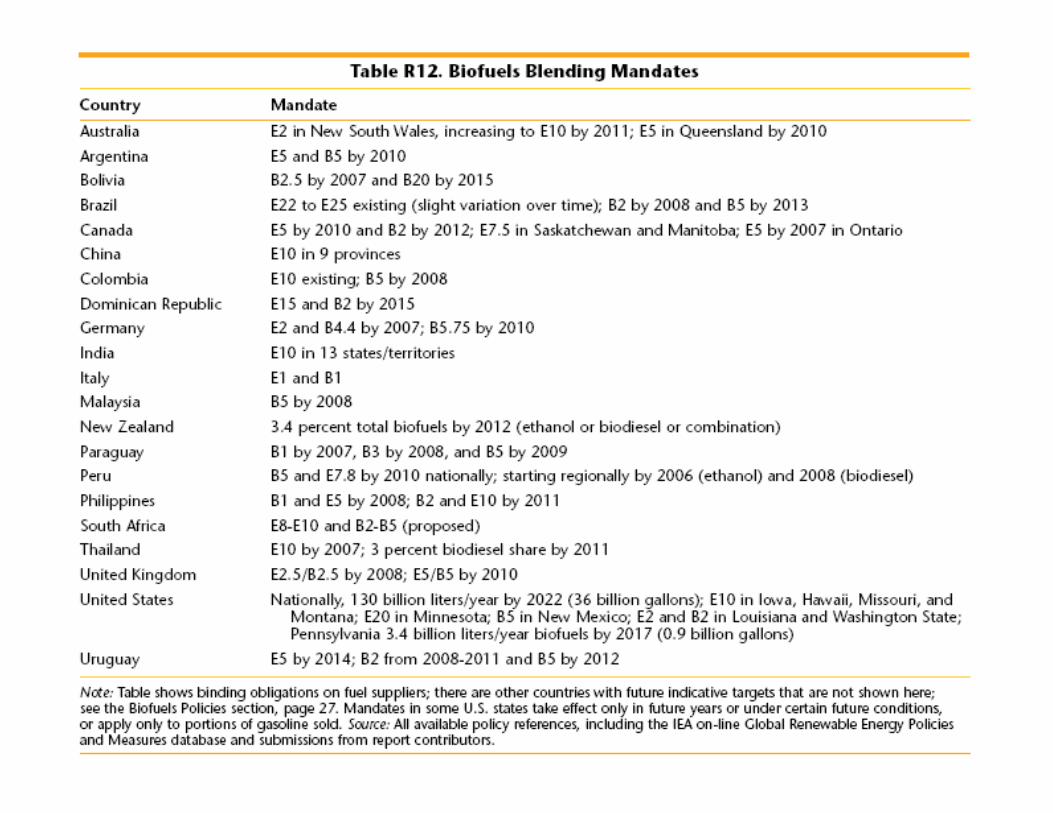
Biofuels: how much, how fast and how difficult. Prof. José Goldemberg University of São Paulo São Paulo, Brazil

Welcome message from author
This document is posted to help you gain knowledge. Please leave a comment to let me know what you think about it! Share it to your friends and learn new things together.
Transcript
Biofuels: how much, how fast and how difficult.
Prof. José GoldembergUniversity of São Paulo
São Paulo, Brazil
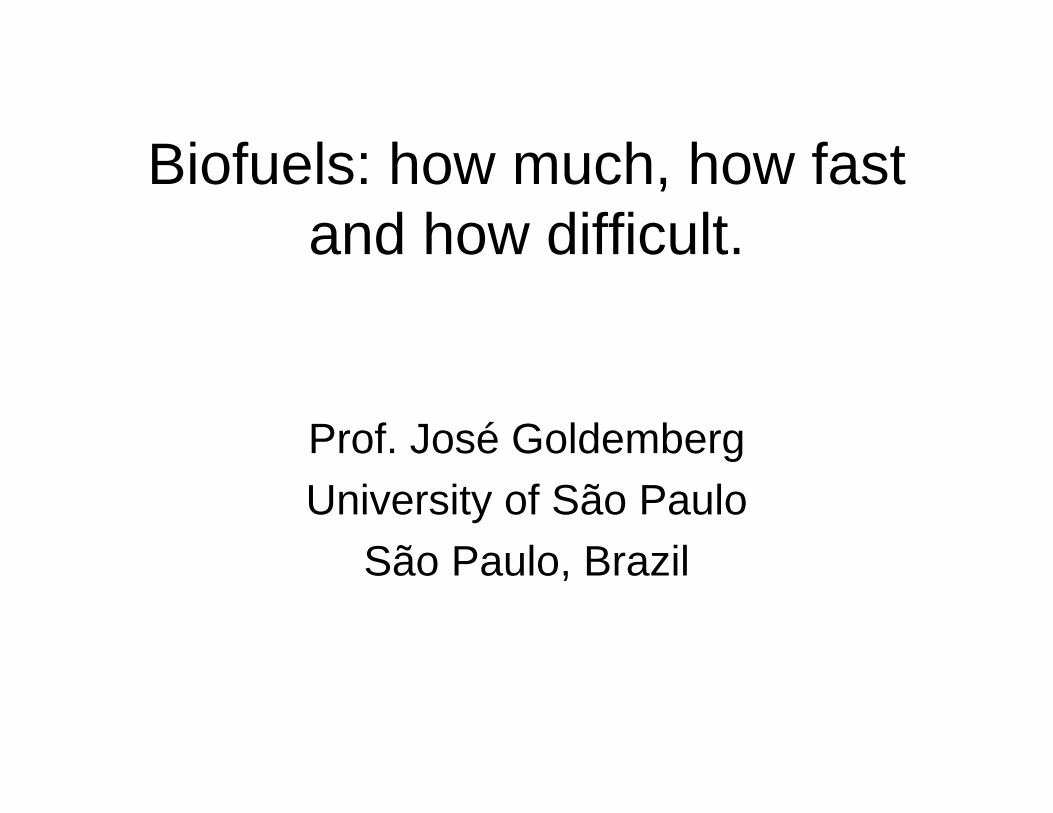
Land Use for Ethanol (2006)BRAZIL
Ethanol production from sugarcane Agricultural area (million ha)
(billion litres/year)(million bbl/day)
Sugarcane to ethanol
Sugarcane(total)
Production 17.8 0.31 2.9 5
To replace 10% total gasoline consumption* 189
3.3 31 ---
To replace 10% total petroleum consumption* 746
13 123 ---
Sugarcane agricultural area in the world ----
------- 20
UNITED STATES
Ethanol production from corn Agricultural area (million ha)
(billion litres/year) (million bbl/day) Corn to ethanol Corn (total)
Production 18.4 0.32 5.1 29
Corn agricultural area in the world --- --- --- 144
World’s total agricultural area: 1,228 million hectares *World petroleum consumption (2005): 4,478 billion litres/year* World gasoline consumption (2005): 1,292 billion litres/year
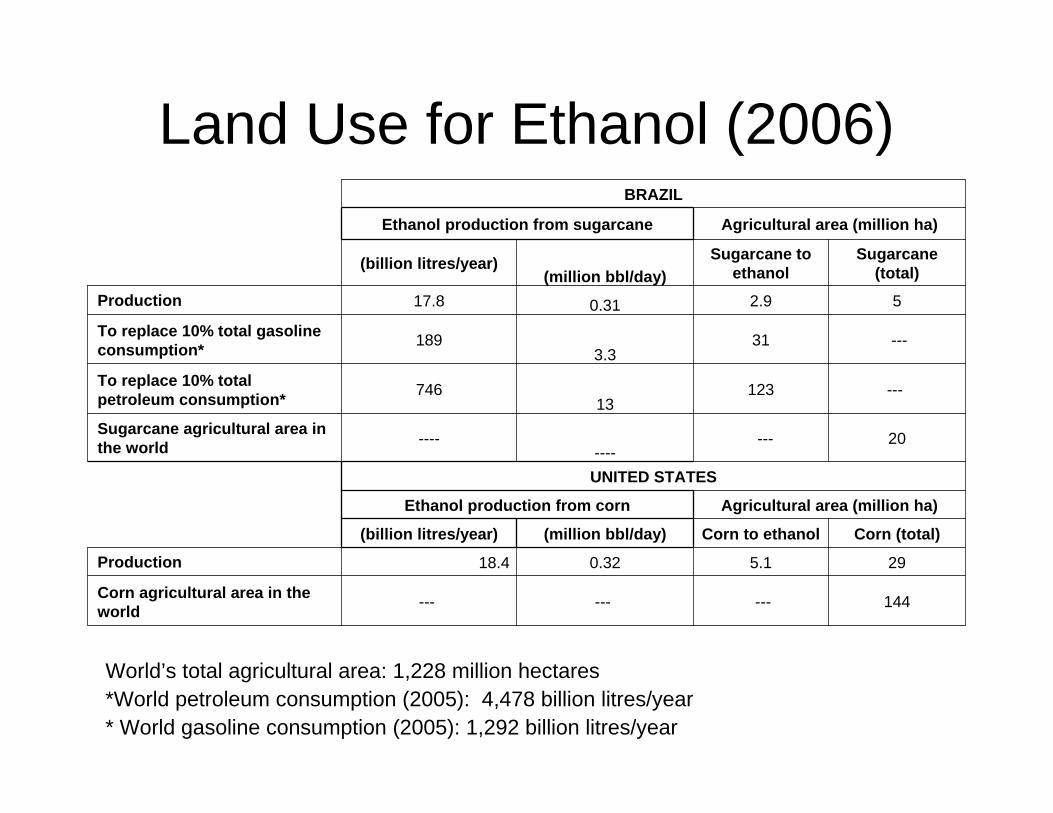
ETHANOL DEMAND PROJECTIONS1st Generation Technology
--2179.52022
??Gallon (billion)
Liters(billion)
European UnionBrazilUS
2nd Generation Technology
3.915------2020e
-----1556.8132015
--9.5364.9---2012/13
--4.717.82.9d4.918.65.1c2006
Gallons (billion)
Liters (billion)
Gallons (billions)
Liters (billion)
Area million/ha
Gallons (billion)
Liters (billion)
Area usedmillion/ha
European Union[i]Sugarcane (Brazil)b
Maize (US)a
a.productivity in 2006: 3,647 l/ha cornb.productivity in 2006: 6,138 l/ha sugarcanec.18% of total maize area in the US; 3.2% of total maize area in the world.d.13% of total sugarcane area in the world; 47% of the sugarcane area in
Brazil.a.present EU production 2 billion liters/year mainly from sugarbeets.
[i] Biofuels Research Advisory Council, 2006. Biofuels in the European Union – A vision for 2030 and beyond. — 40 pp. — 29.7 x 21.0 cm. ISBN 92-79-01748-9. ISSN 1018-5593 (EUR series – Luxemburg). Available at: http://ec.europa.eu/research/energy/pdf/biofuels_vision_2030_en.pdf
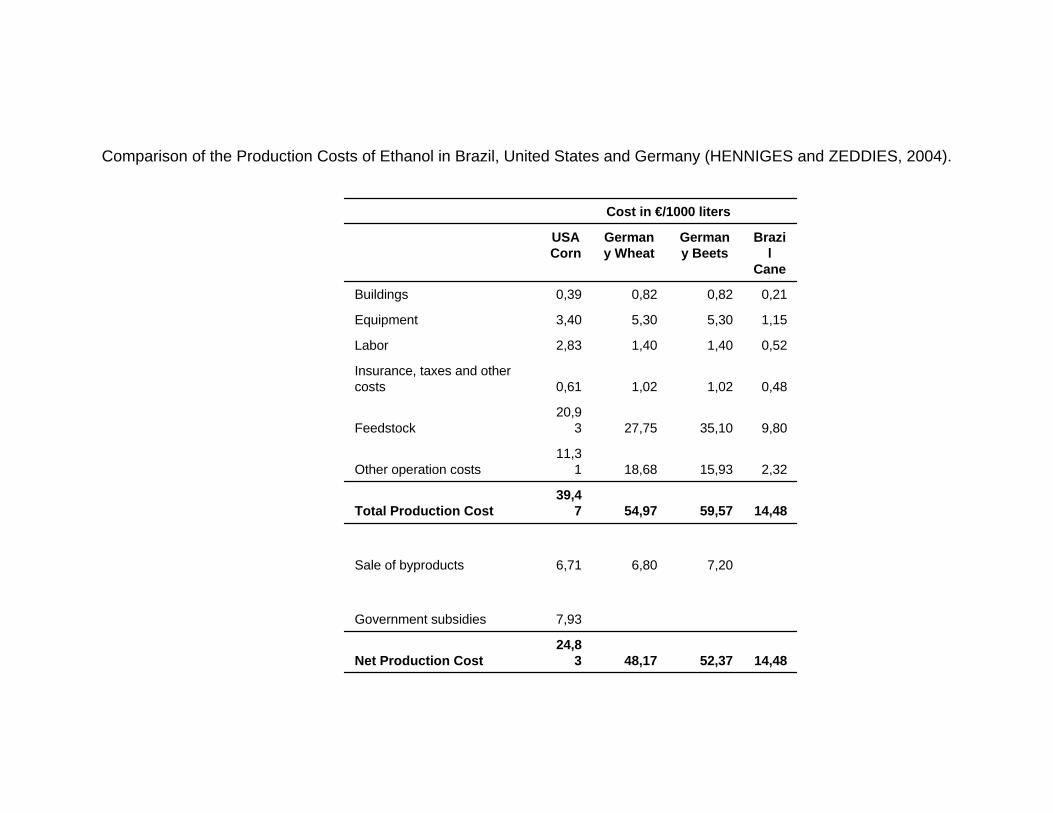
Comparison of the Production Costs of Ethanol in Brazil, United States and Germany (HENNIGES and ZEDDIES, 2004).
14,4852,3748,1724,8
3Net Production Cost
7,93Government subsidies
7,206,806,71Sale of byproducts
14,4859,5754,9739,4
7Total Production Cost
2,3215,9318,6811,3
1Other operation costs
9,8035,1027,7520,9
3Feedstock
0,481,021,020,61Insurance, taxes and other costs
0,521,401,402,83Labor
1,155,305,303,40Equipment
0,210,820,820,39Buildings
Brazil
Cane
Germany Beets
Germany Wheat
USACorn
Cost in €/1000 liters
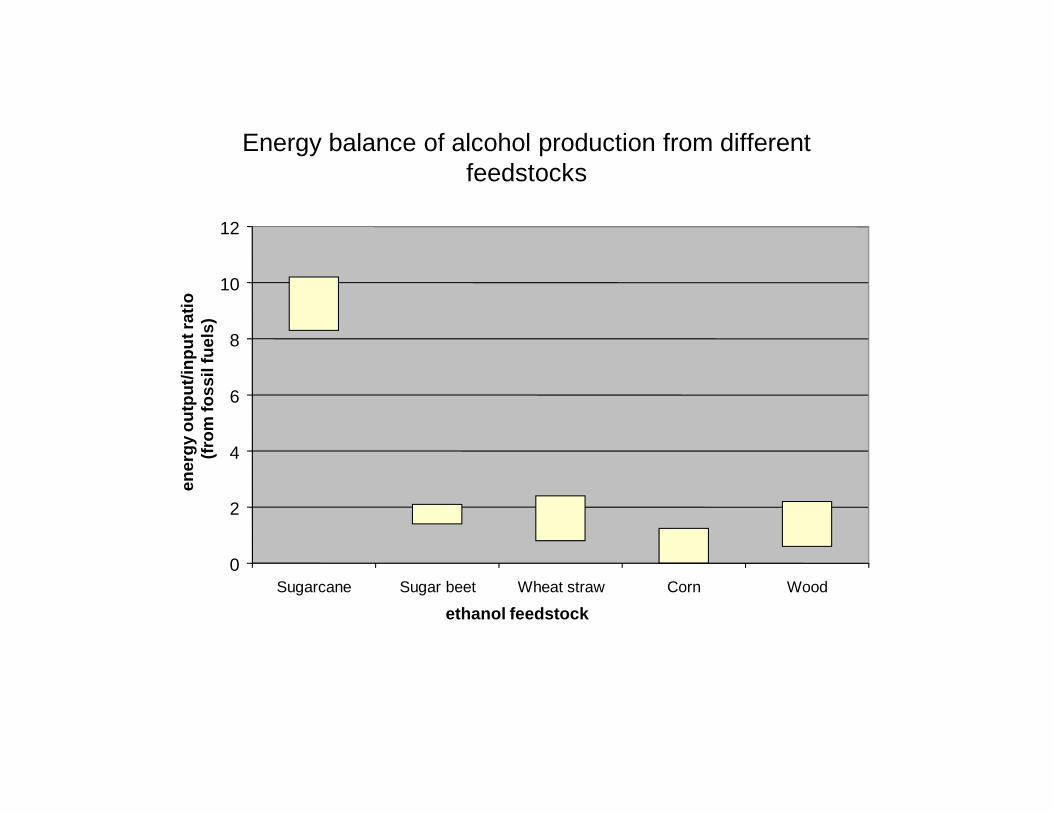
Energy balance of alcohol production from different feedstocks
0
2
4
6
8
10
12
Sugarcane Sugar beet Wheat straw Corn Wood
ethanol feedstock
ener
gy o
utpu
t/inp
ut ra
tio
(from
foss
il fu
els)
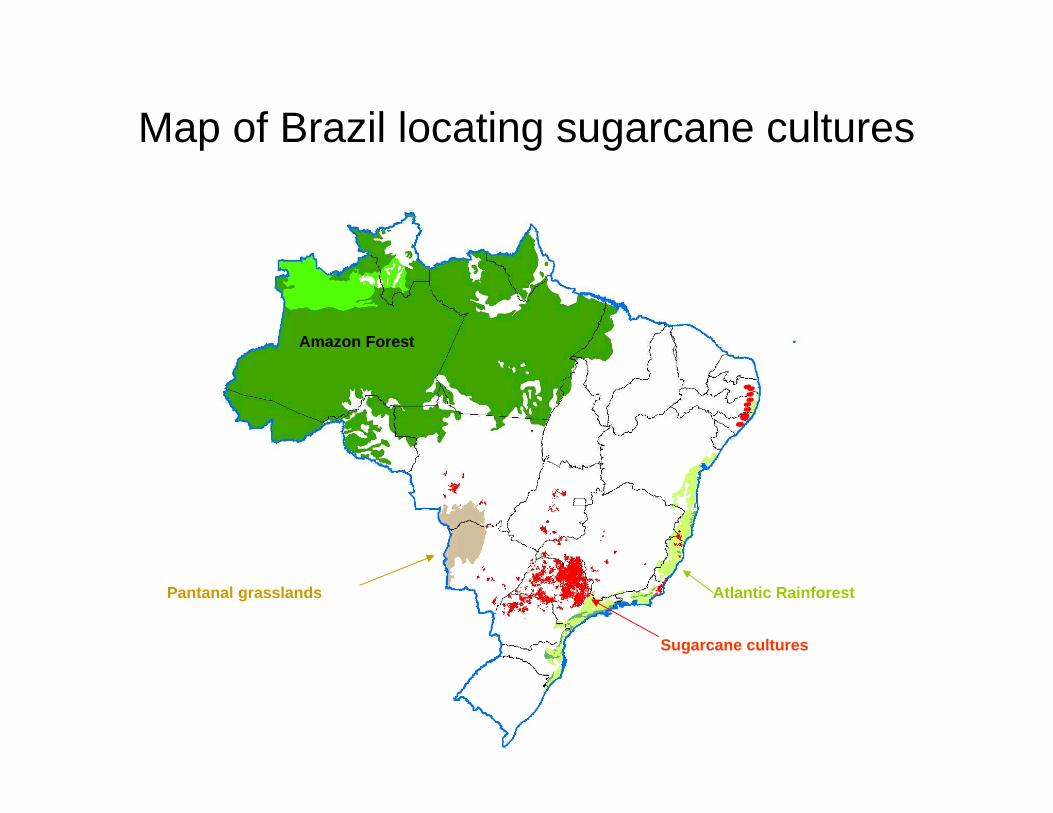
Map of Brazil locating sugarcane cultures
Amazon Forest
Sugarcane cultures
Pantanal grasslands Atlantic Rainforest
8
Introduction - The Brazilian Alcohol Program
• The world largest commercial program on biomass• Started in 1975 by Federal Government • Decision from Brazilian Federal Government to produce
ethanol in addition to sugar (from sugarcane): objective of reducing petroleum imports (Gulf War).
• High-octane fuel in vehicles, replacing lead and/or MTBE.
• 1,300,000 cars running on pure (hydrated) ethanol in Brazil
• 2,300,000 flex-fuel vehicles (both ethanol and gasoline, any blend)
• all gasoline blended with (anhydrous) ethanol: 20 to 26% of ethanol in volume basis – gasohol
• Nowadays - economically competitive to gasoline
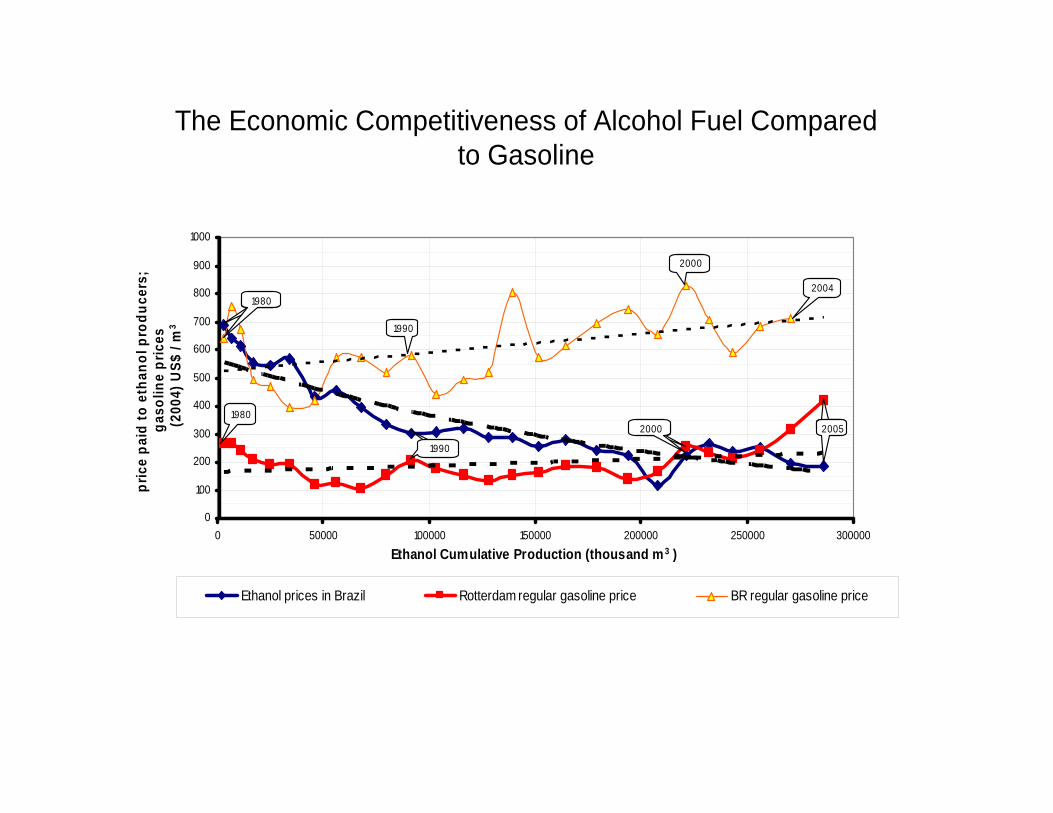
The Economic Competitiveness of Alcohol Fuel Compared to Gasoline
0
100
200
300
400
500
600
700
800
900
1000
0 50000 100000 150000 200000 250000 300000
Ethanol Cumulative Production (thousand m3 )
pric
e pa
id to
eth
anol
pro
duce
rs;
gaso
line
pric
es (2
004)
US$
/ m
3
Ethanol prices in Brazil Rotterdam regular gasoline price BR regular gasoline price
2000
1990
1980
1980
1990
2000 20052005
2000
2004
1990
1980
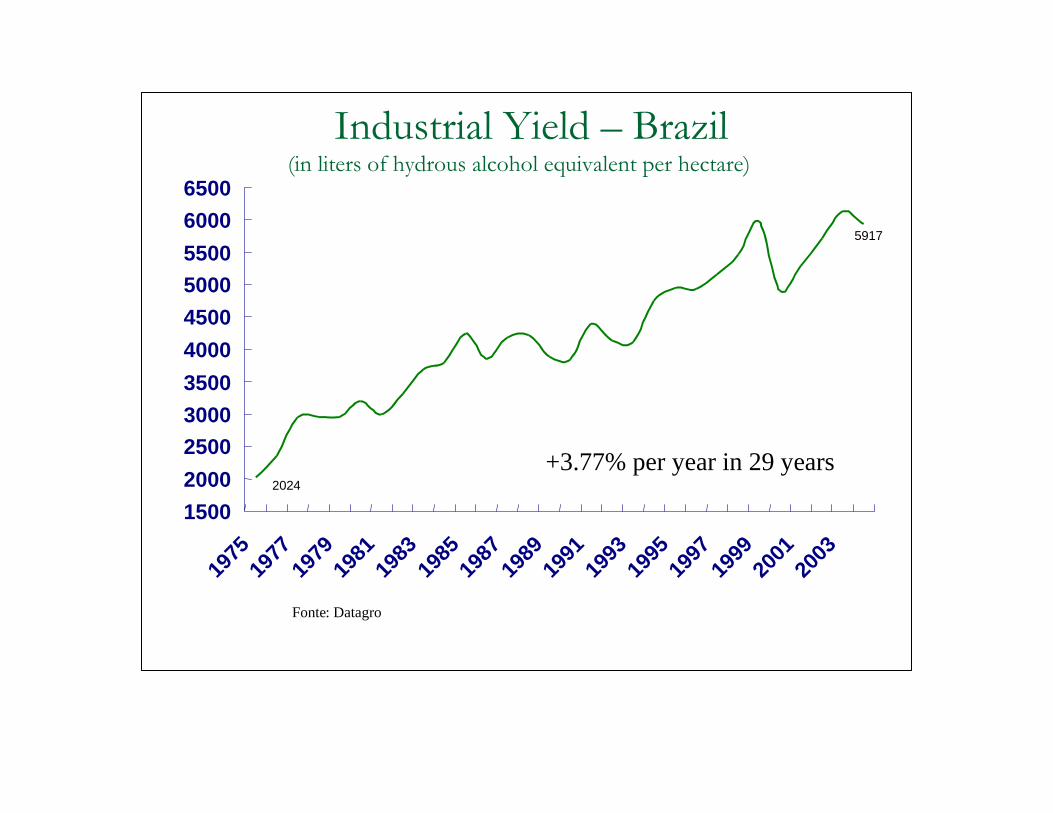
Industrial Yield – Brazil(in liters of hydrous alcohol equivalent per hectare)
15002000250030003500400045005000550060006500
1975
1977
1979
1981
1983
1985
1987
1989
1991
1993
1995
1997
1999
2001
2003
Fonte: Datagro
+3.77% per year in 29 years
5917
2024
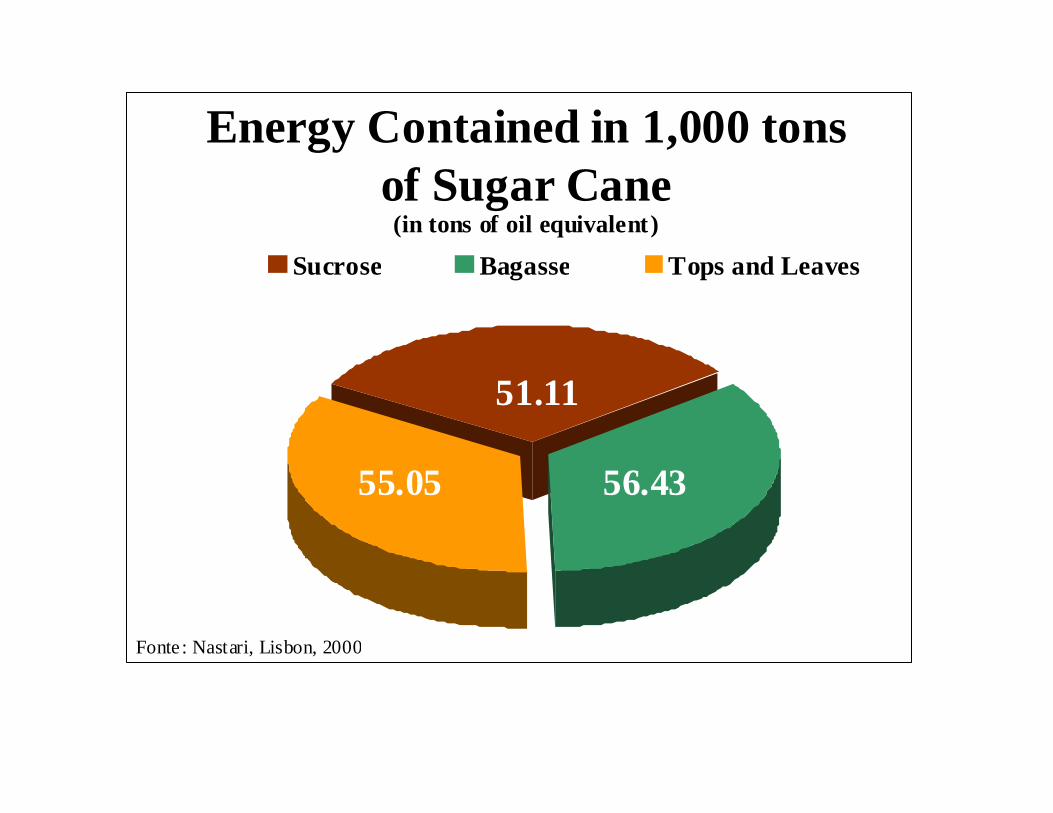
Energy Contained in 1,000 tons of Sugar Cane
(in tons of oil equivalent )
51.11
55.05 56.43
Sucrose Bagasse Tops and Leaves
Fonte: Nastari, Lisbon, 2000
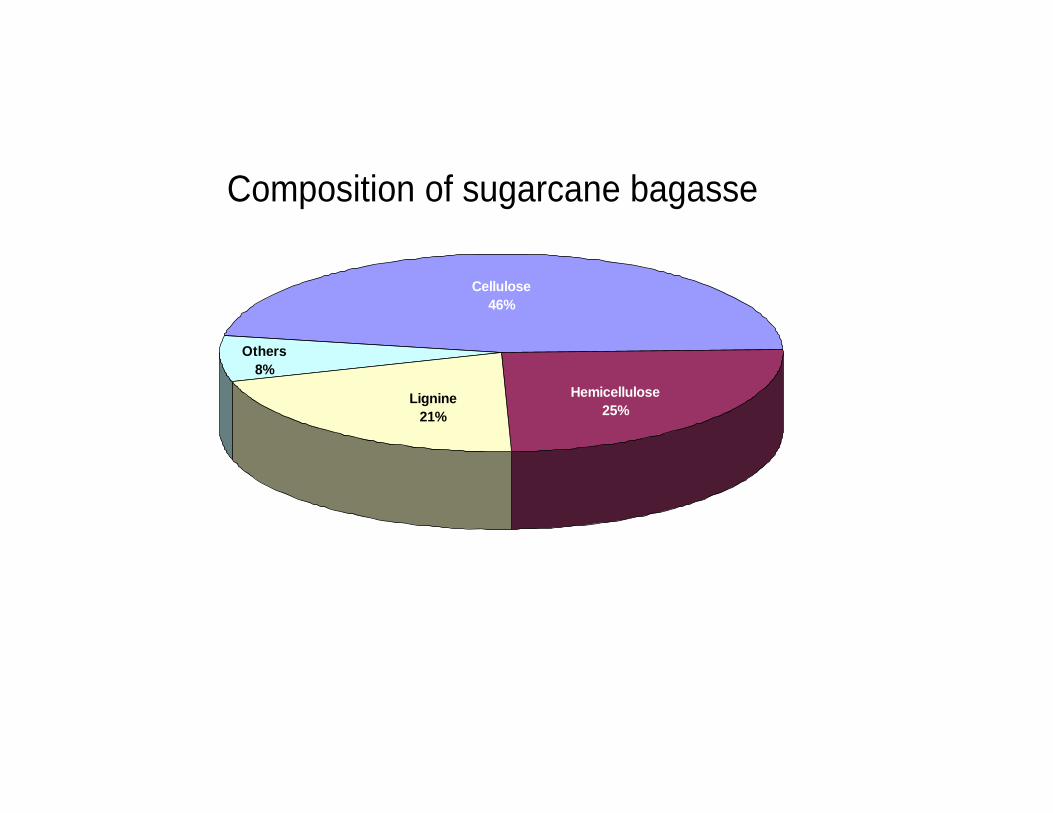
Hemicellulose25%
Cellulose46%
Others8%
Lignine21%
Composition of sugarcane bagasse
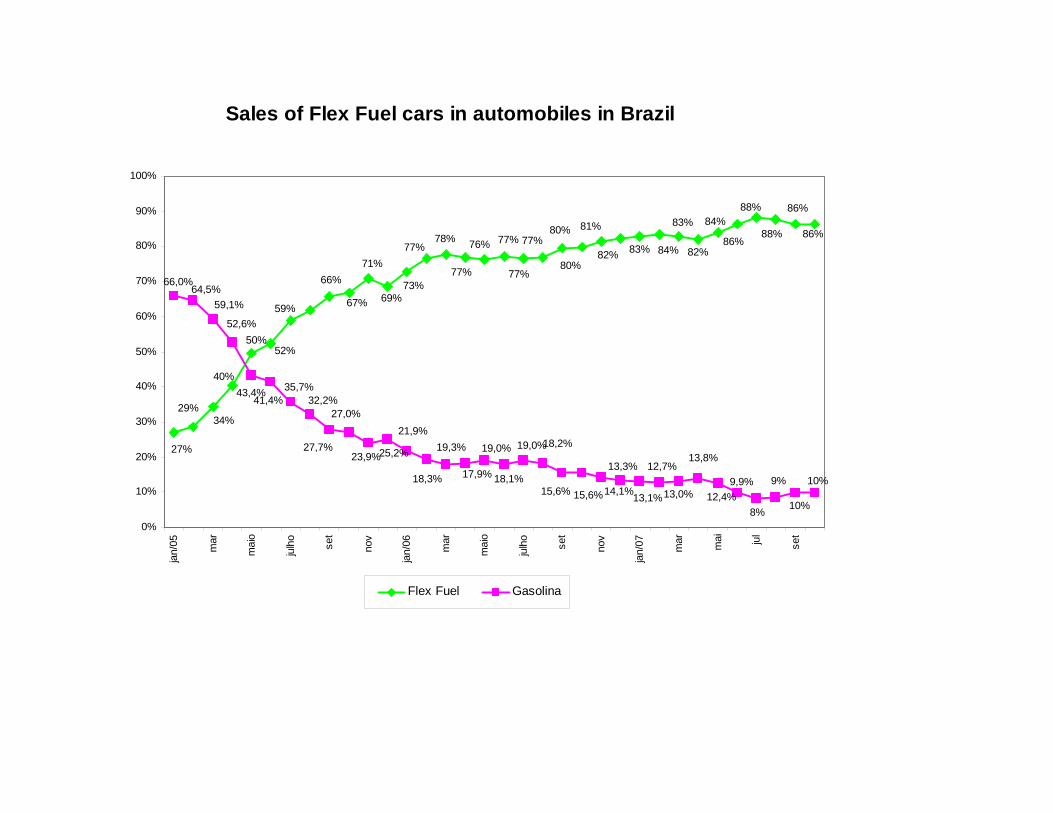
Sales of Flex Fuel cars in automobiles in Brazil
84%
27%
29%34%
40%
59%
66%
67% 69%73%
77%78%
77%
76% 77% 77%80%
80%
50%52%
71%77%
81%
82% 83% 84%
83%
82%86%
88%
88%
86%
86%
12,4%
18,2%19,0%19,0%
18,3% 17,9%
21,9%
25,2%23,9%
27,0%
27,7%
32,2%35,7%
41,4%43,4%
52,6%
59,1%64,5%
66,0%
15,6% 14,1%
13,3%
19,3%
15,6% 13,1%
12,7%
13,0%
13,8%
18,1% 9,9%
8%
9%
10%
10%
0%
10%
20%
30%
40%
50%
60%
70%
80%
90%
100%ja
n/05 mar
mai
o
julh
o
set
nov
jan/
06 mar
mai
o
julh
o
set
nov
jan/
07 mar mai jul
set
Flex Fuel Gasolina
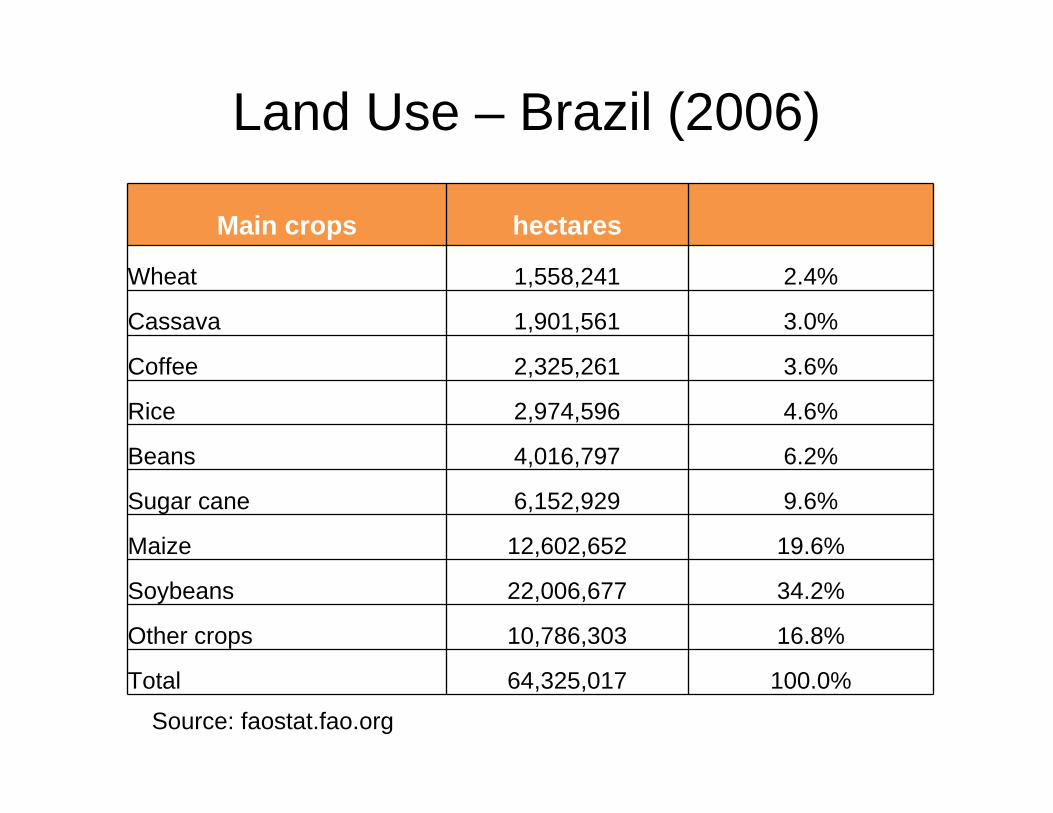
Land Use – Brazil (2006)
Main crops hectares
Wheat 1,558,241 2.4%
Cassava 1,901,561 3.0%
Coffee 2,325,261 3.6%
Rice 2,974,596 4.6%
Beans 4,016,797 6.2%
Sugar cane 6,152,929 9.6%
Maize 12,602,652 19.6%
Soybeans 22,006,677 34.2%
Other crops 10,786,303 16.8%
Total 64,325,017 100.0%
Source: faostat.fao.org
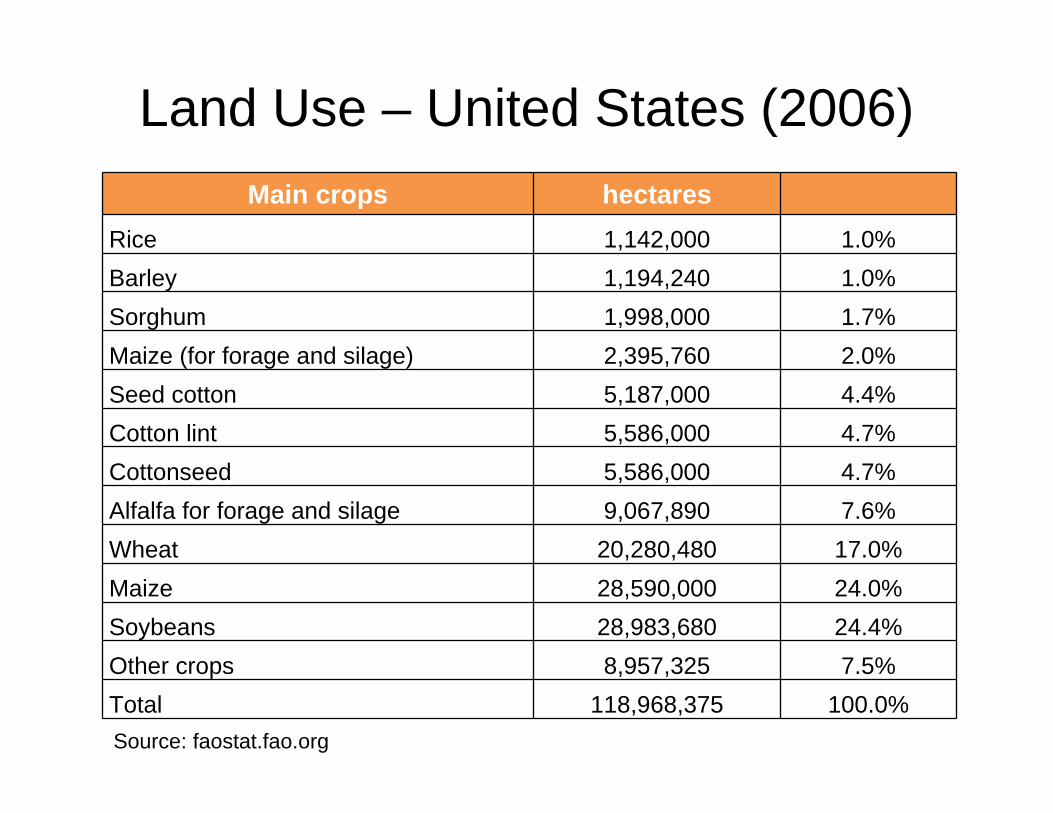
Land Use – United States (2006)Main crops hectares
Rice 1,142,000 1.0%Barley 1,194,240 1.0%Sorghum 1,998,000 1.7%Maize (for forage and silage) 2,395,760 2.0%Seed cotton 5,187,000 4.4%Cotton lint 5,586,000 4.7%Cottonseed 5,586,000 4.7%Alfalfa for forage and silage 9,067,890 7.6%Wheat 20,280,480 17.0%Maize 28,590,000 24.0%Soybeans 28,983,680 24.4%Other crops 8,957,325 7.5%Total 118,968,375 100.0%Source: faostat.fao.org
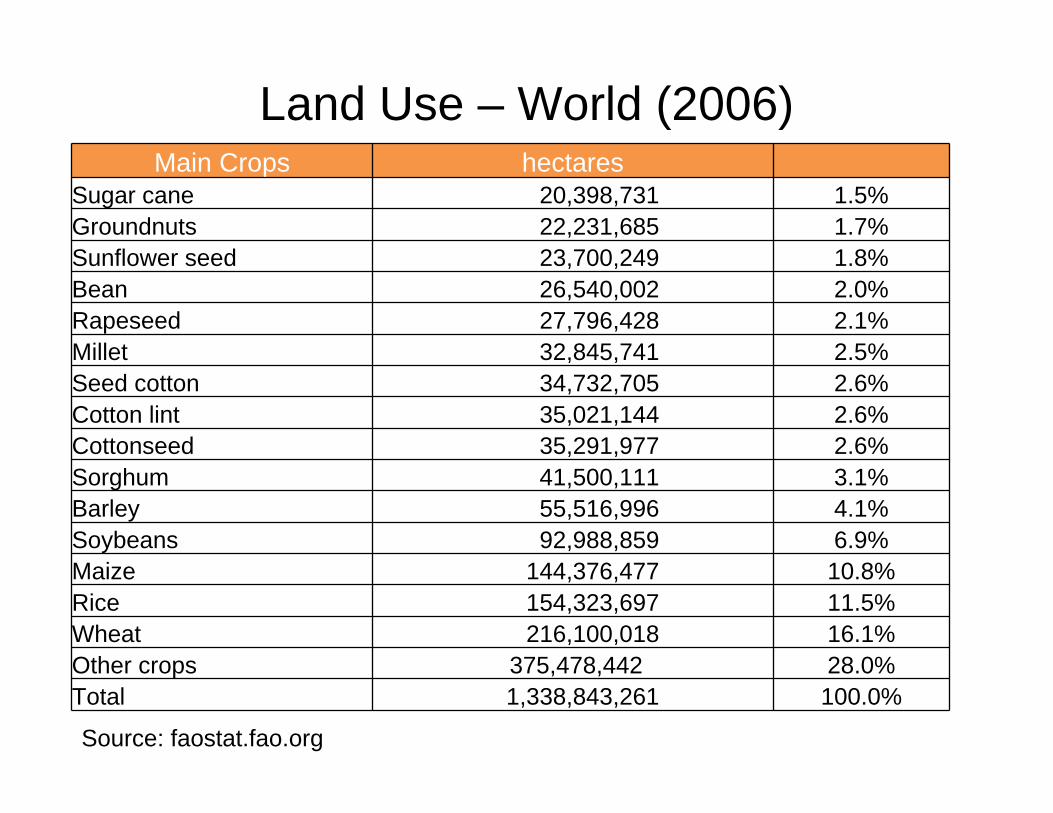
Land Use – World (2006)Main Crops hectares
Sugar cane 20,398,731 1.5%Groundnuts 22,231,685 1.7%Sunflower seed 23,700,249 1.8%Bean 26,540,002 2.0%Rapeseed 27,796,428 2.1%Millet 32,845,741 2.5%Seed cotton 34,732,705 2.6%Cotton lint 35,021,144 2.6%Cottonseed 35,291,977 2.6%Sorghum 41,500,111 3.1%Barley 55,516,996 4.1%Soybeans 92,988,859 6.9%Maize 144,376,477 10.8%Rice 154,323,697 11.5%Wheat 216,100,018 16.1%Other crops 375,478,442 28.0%Total 1,338,843,261 100.0%
Source: faostat.fao.org
Related Documents