THIS REPORT CONTAINS ASSESSMENTS OF COMMODITY AND TRADE ISSUES MADE BY USDA STAFF AND NOT NECESSARILY STATEMENTS OF OFFICIAL U.S. GOVERNMENT POLICY Date: GAIN Report Number: Approved By: Prepared By: Report Highlights: EU Member States are mandated to reach a minimum of 10 percent for renewable energy consumed in transport in 2020. To count against the 10 percent goal, biofuels must meet sustainability requirements laid down in the Renewable Energy Directive (RED). During 2007 – 2012, about a fifth of the domestic use of transport biofuels was imported from outside the EU, but a series of trade actions have been imposed to stymie this trade of bioethanol and biodiesel. The EC expects that solid biomass for heat and power generation will play an important role in meeting the 20 percent target for renewable energy use by 2020. Post: Commodities: Bioethanol, biodiesel, corn, wheat, soybean oil, rapeseed oil, palm oil and wood pellets The Hague Bob Flach, Karin Bendz, Roswitha Krautgartner and Sabine Lieberz Mary Ellen Smith EU Biofuels Annual 2013 Biofuels Annual EU-27 NL3034 8/13/2013 Required Report - public distribution

Biofuels Annual the Hague EU-27!8!13-2013
Nov 28, 2015
Biofuel Annual for Europe
Welcome message from author
This document is posted to help you gain knowledge. Please leave a comment to let me know what you think about it! Share it to your friends and learn new things together.
Transcript
THIS REPORT CONTAINS ASSESSMENTS OF COMMODITY AND TRADE ISSUES MADE BY
USDA STAFF AND NOT NECESSARILY STATEMENTS OF OFFICIAL U.S. GOVERNMENT
POLICY
Date:
GAIN Report Number:
Approved By:
Prepared By:
Report Highlights: EU Member States are mandated to reach a minimum of 10 percent for renewable energy consumed in transport in 2020. To
count against the 10 percent goal, biofuels must meet sustainability requirements laid down in the Renewable Energy
Directive (RED). During 2007 – 2012, about a fifth of the domestic use of transport biofuels was imported from outside the
EU, but a series of trade actions have been imposed to stymie this trade of bioethanol and biodiesel. The EC expects that
solid biomass for heat and power generation will play an important role in meeting the 20 percent target for renewable
energy use by 2020.
Post:
Commodities:
Bioethanol, biodiesel, corn, wheat, soybean oil,
rapeseed oil, palm oil and wood pellets The Hague
Bob Flach, Karin Bendz, Roswitha Krautgartner and Sabine Lieberz
Mary Ellen Smith
EU Biofuels Annual 2013
Biofuels Annual
EU-27
NL3034
8/13/2013
Required Report - public distribution
Executive Summary
Policy and Programs
Regulations influencing the EU biofuels market are the Biofuels Directive (2003/30), the EU Climate and Energy Package
(2009/147) and the Fuel Quality Directive (2009/30). The Package includes the “20/20/20” mandatory goals for 2020, one of
which is a 20 percent share for renewable energy in the EU total energy mix. Part of this 20 percent share is a 10 percent
minimum target for renewable energy consumed in transport to be achieved by all Member States.
Biofuels have to meet certain criteria to count against the 10 percent goal. In the Renewable Energy Directive (RED),
specific sustainability requirements are laid out. These include minimum GHG (greenhouse gas) emissions reductions, land
use and environmental criteria as well as economic and social criteria, and adherence to International Labor Organization
conventions.
In October 2012, the European Commission (EC) published a proposal on Indirect Land Use Change (ILUC). The proposal
aims at starting the transition from conventional biofuels to biofuels made from non-food feedstock. This would be done by
setting a cap on, and phasing out of public support for first generation biofuels after 2020, set a GHG saving requirement of
at least 60 percent for new installations, and to set new ILUC emission values. The EC hopes the proposal will be adopted
before the end of their mandate in 2014.
Conventional and Advanced Biofuels
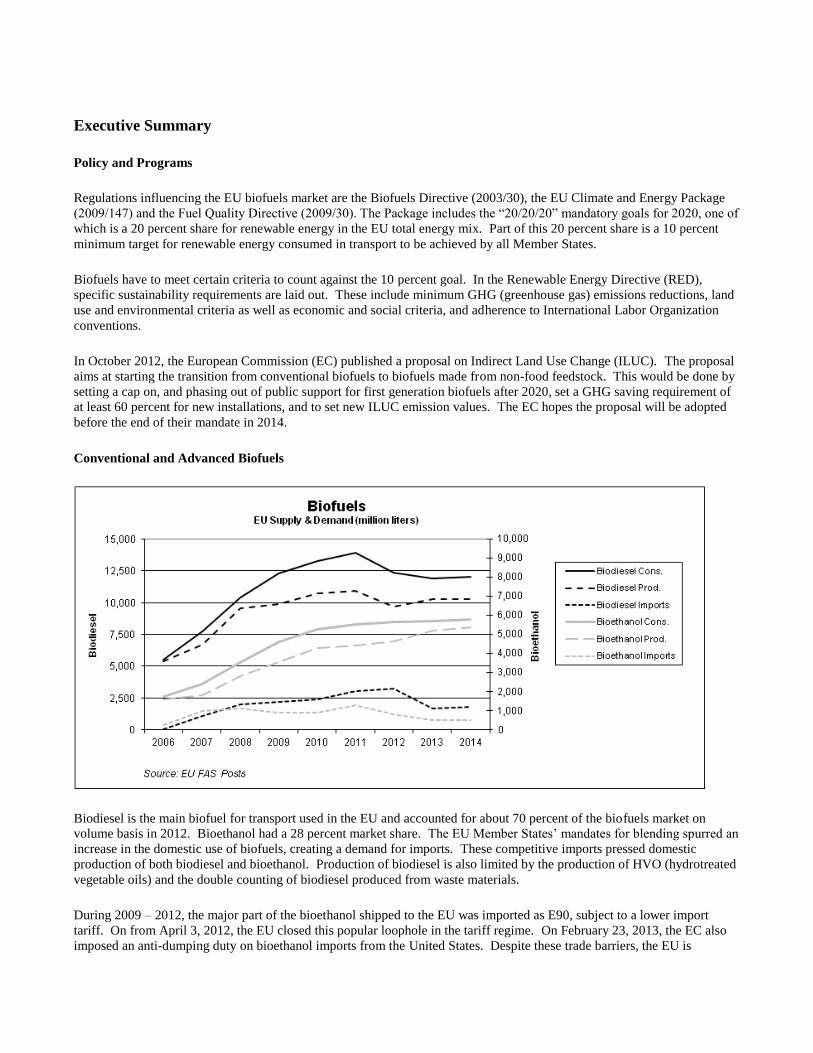
Biodiesel is the main biofuel for transport used in the EU and accounted for about 70 percent of the biofuels market on
volume basis in 2012. Bioethanol had a 28 percent market share. The EU Member States’ mandates for blending spurred an
increase in the domestic use of biofuels, creating a demand for imports. These competitive imports pressed domestic
production of both biodiesel and bioethanol. Production of biodiesel is also limited by the production of HVO (hydrotreated
vegetable oils) and the double counting of biodiesel produced from waste materials.
During 2009 – 2012, the major part of the bioethanol shipped to the EU was imported as E90, subject to a lower import
tariff. On from April 3, 2012, the EU closed this popular loophole in the tariff regime. On February 23, 2013, the EC also
imposed an anti-dumping duty on bioethanol imports from the United States. Despite these trade barriers, the EU is
expected continue to attract bioethanol from foreign markets. About 350 million liters of ethanol is expected to be supplied
through preferential trade measures, mainly used by Guatemala, Peru and Pakistan. The other likely source is Brazil. EU
imports from the United States are unlikely due to anti dumping duties.
Since the enforcement of countervailing and anti-dumping duties on imports of biodiesel from the United States in March
2009, U.S. supplied-biodiesel has been largely replaced by biodiesel from Argentina and Indonesia. In an attempt to curb
imports from these origins, the EC enforced anti dumping duties starting May 29, 2013. The enforced duties could open up
opportunities for biodiesel from other origins. Imports are likely to increase from Malaysia.
Feedstock for the anticipated biofuels production in 2013 is estimated at about 10.6 MMT of cereals, about 9.5 MMT of
sugar beets, and about 9.3 MMT of vegetable oils and animal fats. In 2012, the production of byproducts from bioethanol
and biodiesel production is forecast to reach 3.3 MMT of DDG and about 9.6 MMT of oil meals, respectively.
Biomass for heat and power
The EC expects heat and power production from biomass to play an important role in meeting the 20 percent target for
renewable energy use by 2020 and in the future reduction of CO2 emissions in Europe. A major part of the biomass used is
forecast to be forestry products. The forest sector is also expected to supply large quantities of biomass for conversion to
biogas.
Wood Pellets
The EU is the world’s largest wood pellet market, consuming about 14 MMT of pellets in 2012. Some experts are expecting
the market to increase to as much as 80 MMT in 2020. Since 2008, the demand for pellets has significantly outpaced
domestic production in Europe. This has resulted in increased imports from the United States. In 2012, U.S. wood pellets
exports to the EU rose with 70 percent to nearly 1.8 MMT, valued at US$ 331 million. If trade flows remain consistent with
current patterns, the United States has the potential to supply approximately US$ 650 million of wood pellets in 2014.
Biogas
The biogas sector is very diverse across Europe. Depending on national priorities, countries have structured their financial
incentives to favor different feedstocks. According to Eurostat data, Germany and the UK are the two largest biogas
producers in the EU. Germany generates 90 percent of its biogas from agricultural crops while the UK relies almost entirely
on landfill and sewage sludge gas.
Introduction Disclaimer: This report presents the situation and outlook for biofuels in the EU. This report presents the views of the
authors and does not reflect the official views of the U.S. Department of Agriculture (USDA). The data are not official
USDA data. Official government statistics on biofuels are not available in many instances. This report is based on analytical
assessments, not official data. This report was a group effort of the following FAS analysts: Karin Bendz of USEU/FAS Brussels Ornella Bettini of FAS/Rome covering Greece and Italy Mila Boshnakova of FAS/Sofia covering Bulgaria Monica Dobrescu of FAS/Bucharest covering Romania Bob Flach of FAS/The Hague covering the Benelux and the Nordics Marta Guerrero of FAS/Madrid covering Spain and Portugal Marie-Cecile Henard of FAS/Paris covering France
Mira Kobuszynska of FAS/Warsaw covering Poland and the Baltic States Roswitha Krautgartner of FAS/Vienna covering Austria and Slovenia

Sabine Lieberz of FAS/Berlin covering Germany Jana Mikulasova of FAS/Prague covering the Czech Republic and Slovakia Ferenc Nemes of FAS/Budapest covering Hungary Jennifer Wilson of FAS/London covering the UK and Ireland The chapters were coordinated by: Executive Summary by Bob Flach Policy and Programs by Karin Bendz Conventional Bioethanol by Bob Flach Conventional Biodiesel by Roswitha Krautgartner and Bob Flach Advanced Biofuels by Bob Flach Biomass for Heat & Power by Bob Flach (wood pellets) and Sabine Lieberz (biogas)
Policy and Programs
The Renewable Energy Directive The EU Energy and Climate Change Package (CCP) was adopted by the European Council on April 6, 2009. The
Renewable Energy Directive (RED), which is part of this package, entered into force on June 25, 2009, and had to be
transposed into national legislation in the Member States (MS) by December 5, 2010. MS were also required to submit
National Renewable Energy Action Plans (NREAP) by June 30, 2010. The adoption and requirement for the implementation
of the Directive did not give enough time for either the Member States or the Commission to prepare for the
implementation. These tight deadlines created many difficulties for everyone involved.
The EU Energy and Climate Change Package include the “20/20/20” goals for 2020:
• A 20 percent reduction in green house gas (GHG) emissions compared to 1990. • A 20 percent improvement in energy efficiency compared to forecasts for 2020. • A 20 percent share for renewable energy in the EU total energy mix. Part of this 20 percent share is a 10 percent minimum
target for renewable energy consumed in transport to be achieved by all MS.
The goal for 20 percent renewable energy in total energy consumption is an overall EU goal. The RED sets different targets
for different MS within this overall target, based on each MS’ capacity. Therefore, some MS will have to reach much higher
targets than the 20 percent renewable energy by 2020, whereas other MS will have much lower targets. Sweden, for
example, will have to reach 49 percent, while the target for Malta is only 10 percent. The targets for the four largest
economies of Europe: Germany, France, UK, and Italy, are 18, 23, 15, and 17 percent respectively. These targets were set by
the European Commission depending on the current situation and potential for growth in different MS.
In contrast, the 10 percent target for renewable energy in transport is obligatory for all MS. The Commission hopes that a 10
percent target in transport for all MS will alleviate concerns referred to in the European Climate Change Program (CCP) that
this sector is projected to account for most of the growth in energy consumption and thus requires more discipline. The latest
official number for the use of biofuel was 4.7 percent (volume basis) in 2010.
Biofuels have to meet certain sustainability criteria to be taken into account for the 10 percent goal:
• They must meet the sustainability criteria outlined below, including reducing GHG emissions by at least 35 percent compared
to fossil fuels. From 2017, the reduction has to be 50 percent, and at least 60 percent for new installations.
• Second-generation biofuels will receive double credit. This means that biofuels made out of ligno-cellulosic, non-food
cellulosic, waste and residue materials will count double towards the goal. Calculations are made on an energy basis.
• Renewable electricity consumed by cars will be counted by a factor of 2.5 and will therefore help countries achieve targets
faster.
The Fuel Quality Directive (FQD) is a Directive that complements the RED and mirrors some of the RED’s content such as
the sustainability criteria. A key requirement of the FQD is that all fuel suppliers (oil companies) must meet a 6 percent cut
in GHG emissions by 2020 across all fuel categories supplied to the market. This is designed to be consistent with the 10
percent use of biofuels and will tend to move demand toward biofuels with higher GHG savings. In addition, the FQD
limited ethanol blends to 10 percent or less when ethanol is used as an oxygenate. Thus a blend wall is created which risks
future growth in ethanol use in certain countries beginning at some future date. Fuel specifications for biodiesel place limits
on the palm oil and soy oil content of biodiesel.
Transposition of the RED
By May 2013, all EU MS apart from Poland had transposed the RED into national legislation. Most MS are also
implementing the sustainability criteria. There are, however, five MS that are not currently implementing the RED: Spain,
Portugal, Poland Slovenia and Finland. Finland is expected to start implementing within a couple of months.
The Commission is assessing whether MS’ that have notified full transposition have done so correctly, and has started the
procedure for legal actions against MS that are not in conformity with the requirements of the RED.
Sustainability Criteria
Biofuels must comply with the sustainability criteria provided in Article 17 of the RED to be eligible for financial support
and to count towards the target. These sustainability criteria have to be met by all biofuels whether produced within the EU
or imported. The sustainability criteria include reaching a minimum GHG emission saving; not being produced from
feedstock grown on land with high biodiversity value such as primary forests and highly biodiverse grasslands; not being
produced on land with high carbon stocks such as wetlands or continuously forested areas; and, not being produced on peat
land.
The RED specifies a 35 percent requirement for GHG emissions-saving threshold as a starting point. It increases to 50 and
60 percent in 2017, with the higher requirements for the new facilities. Environmental sustainability criteria covering bio-
diverse and high-carbon-stock lands are also laid out in the RED. Other sustainability criteria are mentioned and reporting
requirements are established. These cover other environmental criteria for soil, water, and air quality, as well as social
criteria, which focus on food price impact, and adherence to International Labor Organization conventions.
The biodiversity criteria apply on land that would have been classified as highly biodiverse in January 2008. Biofuels may
not be made from raw material obtained from land with high biodiversity value such as primary forest and other wooded
land, areas designated by law or by the relevant competent authority for nature protection purposes, highly biodiverse
grassland or highly biodiverse non-grassland. The Commission is also developing the criteria for biodiverse grasslands
based on an open consultation conducted early in 2010. Biofuels shall also not be made from raw materials produced on
land with high carbon stock such as wetlands, peatlands, or continuously forested areas.
The agricultural raw materials produced within the EU must be produced in accordance with the minimum requirements for
good agricultural and environmental conditions that are established in the common rules for direct support schemes under the
common agricultural policy (CAP) (Cross compliance Article 17 § 6 of the RED).

MS competent authorities are responsible for ensuring that biofuel counted towards targets, mandates, and tax credits fulfill
sustainability criteria. MS are not allowed to have higher or lower sustainability criteria than those set by the Commission,
and must accept all certification systems recognized by the Commission. However, with each MS having different
checklists, there will be 27 different national certification schemes that must be registered and recognized by the European
Commission – applying to biofuel produced in the EU member states as well as third countries.
GHG Emissions
To count toward the 10 percent target, biofuels must currently have a GHG emissions saving of at least 35 percent. GHG
emission savings are calculated using lifecycle analysis and following methodologies described in RED annexes.
The European Commission’s Joint Research Center (JRC) defines the GHG emissions savings for different raw materials
and selected production and supply pathways. The results of these are presented in the RED annex. JRC calculated GHG
emissions for cultivation, processing, transport, and distribution for different raw materials and used this to determine GHG
emissions savings. Net carbon emissions from indirect land-use change (ILUC) are not included. Under the RED, it is
possible to use actual numbers using proper documentation and Life Cycle Analysis procedures to achieve GHG emission
saving values which are higher than the defaults. It is always possible to claim the default value without any supporting
documentation. However, the biofuel always has to be certified by one of the means provided by the Commission.
Typical GHG1
savings Default GHG
2
savings
Rape seed biodiesel 45% 38%
Soy bean biodiesel 40% 31%
Sun flower biodiesel 58% 51%
Palm oil biodiesel (Process not specified) 36% 19%
Palm oil biodiesel (process with methane capture at oil mill) 62% 56%
Corn ethanol, Community produced (natural gas as process fuel in
CHP plant) 56% 49%
Sugar beet ethanol 61% 52%
Sugar cane ethanol 71% 71%
Waste vegetable or animal oil biodiesel 88% 83%
Source: European Commission, RED (Indirect land use is not included)
(1) Typical implies an estimate of the representative greenhouse gas emission saving for a particular biofuel production
pathway. (2) Default implies a value derived from a typical value by the application of pre-determined factors and that may, in
circumstances specified in this Directive, be used in place of an actual value.
When the default values are calculated the Commission applied a “discount factor” from the typical value, to ensure that the
biofuel pathway was not inflated. If the typical value is used for biodiesel made from soybeans, it would have a GHG saving
value of 40 percent and be above the 35 percent threshold.
According to the RED, biodiesel made from soy oil currently does not automatically comply with the GHG emission
criteria. The RED’s GHG emissions saving default reference value for soy diesel is 31 percent, which is below the minimum
GHG threshold. On closer examination, this value was calculated using a pathway where soybeans are first shipped from
Brazil, then transformed into soy oil and biodiesel in the EU. Using lifecycle analysis, the value for soy-based biodiesel
produced in and shipped from the United States, by nature of having a different pathway, would be different.

With no international standard in place for the calculation of GHG savings, there are some concerns that protectionists could
use GHG thresholds to hamper trade. Commission officials have stated they do not wish to have GHG saving numbers for
different geographical areas, but prefer to base these GHG numbers on specific pathways, such as no-till farming, to allow
for easier updates.
The Commission is currently working on updating the default values on GHG emissions in the RED. According to the RED,
this should be done every second year. But it has not been done since the RED was published in 2009. Reportedly in this
update of the Annex V there will be two different numbers for soybeans depending on the tilling practices used. The GHG
value for biodiesel is expected to be higher in the updated version of Annex V. It is said that corn will have a separate
number from other cereals. The reason for this is yet unclear but reportedly the GHG saving number for corn is anticipated
to be lower than the one for other cereals.
Certification Systems Some of the MS have developed national voluntary systems while some rely on the voluntary schemes adopted by the
European Commission for showing compliance with sustainability criteria. One of the ways to ensure that the biofuel used is
meeting the requirements of the RED is to have it certified by one of the voluntary certification systems.
The Commission has currently approved 13 voluntary schemes that can certify biofuels for all MS. MS must accept these
certification schemes and cannot demand anything more than they cover. The thirteen schemes are:
1. ISCC (International Sustainability and Carbon Certification) 2. Bonsucro EU 3. RTRS EU RED (Round Table on Responsible Soy EU RED) 4. RSB EU RED (Roundtable of Sustainable Biofuels EU RED) 5. 2BSvs (Biomass Biofuels voluntary scheme) 6. RBSA (Abengoa RED Bioenergy Sustainability Assurance) 7. Greenergy (Greenergy Brazilian Bioethanol verification programme) 8. Ensus voluntary scheme under RED for Ensus bioethanol production 9. Red Tractor (Red Tractor Farm Assurance Combinable Crops & Sugar Beet Scheme) 10. SQC (Scottish Quality Farm Assured Combinable Crops (SQC) scheme) 11. Red Cert 12. NTA 8080 13. RSPO RED (Roundtable on Sustainable Palm Oil RED)
The Commission is currently working on approving and publishing more certification scheme. The Commission considers
voluntary certification schemes its preferred mean of obtaining certification.
Double Counting The sometimes vague definition of what can and cannot be double-counted is causing concern. The definition of used
cooking oil makes it possible to mix unused oil with only a small portion of used cooking oil to qualify for double-counting.
Critics against double-counting in general say it reduces the actual portion of renewable energy in transportation to a level
below the 10 percent target set for 2020.
On January 16, 2013, the European Biodiesel Board (EBB) organized a meeting with the aim of creating a consortium that
would work on the issue with biodiesel eligible for double counting. Extra certification for double counted materials would
decrease the possibilities for fraud. The consortium is called Register of Biofuels Originating (RBO) Biofuels that can count
double, or more, are referred to as Extra Incentivized Biofuel (EIB)
One of the problems with double-counting is that it is up to each MS to decide what can be double counted. Without any
cross-border cooperation the possibility for fraud in this area is a big concern. Reportedly the two main problems with EIB
are: 1) Fraud as untrustworthy declarations on the nature of the product, and, 2) Untrustworthy multiple declarations of the
same product in different MS. This has led to batches of EIB being declared under many different schemes and the market is
flooded with those certificates, which is not good for the market.
Proposal on ILUC In October 2012 the Commission published its long awaited proposal on Indirect Land Use Change (ILUC). ILUC is an issue
related to the calculation of GHG calculations. The proposal, which will amend both the RED and the FQD was
accompanied by an impact assessment. The proposal aims at starting the transition from conventional biofuels to biofuels
made from non-food feedstock. The RED calls for ILUC to be taken into consideration when calculating GHG emissions
savings values for most first generation biofuels.
Over the last several years, discussions concerning food versus fuel made political support for biofuel riskier and reaching an
economically viable proposal on ILUC more difficult for the Commission, and in particular, DG Energy. Political pressure
against biofuels from NGOs, DG Environment, and Members of Parliament stems from the fear that agricultural or pasture
land, previously used for food and feed production, could be diverted to the production of biofuel; that non-agricultural land
could be brought into production; and that forests and other high carbon stock areas could be converted to agriculture
production, leading to further GHG emissions.
From the time the Commission published its ILUC proposal, it has been intensely debated by industry, the Parliament and
others concerned.
Specifically, the Commission proposal on ILUC would amend the RED and the FQD by:
Increasing the minimum GHG saving threshold for new installations to 60 percent as of July 1, 2014.
Including ILUC factors in the reporting by fuel suppliers and Member States.
Limiting the amount of food crop-based biofuels and bioliquids that can count towards the EU 10 percent target for
renewable energy in the transport sector by 2020 to the current consumption level of 5 percent.
Providing market incentives for biofuels with no or low indirect land use change emissions, and in particular the
second and third generation biofuels produced from feedstock that does not create an additional demand for land.
This includes algae, straw, and various types of waste, as they will contribute more towards the 10 percent
renewable energy in transport target of the RED.
The ILUC proposal applies only to biofuels and bioliquids which are defined as:
Biofuels - liquid or gaseous fuel for transport produced from biomass.
Bioliquids - liquid fuel for energy purposes other than for transport, including electricity and heating and cooling,
produced from biomass.
The proposal adds these weighting factors to second and third generation biofuel:
Biofuel from used cooking oil, animal fats (category I and II), non-food cellulosic material, ligno-cellulosic material
except saw logs and veneer logs will count twice towards the targets.
Biofuel from algae, biomass fraction of mixed municipal and industrial waste, straw, manure and sewage sludge,
palm oil mill effluent and empty palm fruit bunched, tall oil pitch, crude glycerin, bagasse, grape marcs and wine
lees, nut shells, husks, cobs, bark, branches, leaves, saw dust and cutter shavings will count four times towards the
targets.
Residues not mentioned above, including industrial residues such as molasses and animal fats (category III) would not be
given an added weighting factor.
The proposal would limit the use of first generation biofuels to 5 percent after 2020. After 2020, financial support would
only apply to biofuel that is not produced from crops that could be used for food and feed.
Reactions to the Proposal Finding a politically acceptable solution in some areas resulted in a watered down proposal. The proposal requires fuel
suppliers to include an ILUC factor in reporting but not in accounting for GHG savings on biofuel. MS will have to account
for ILUC in GHG savings when reporting to the Commission, though. The Commission proposal seeks to foster second-
generation biofuel by capping the portion of first-generation biofuel that can count towards targets.
The approach has been subject to criticism from both sides. Proponents of an ILUC factor are disappointed it will not apply
to the industry. The industry and farmers are concerned because of the potential economic impact on a developing sector.
Industry sees the Commission changing its direction from 2009 with this proposal since the investment in and production of
biofuel was encouraged by the adoption of the RED in that year. The EU industry believes this proposal will increase
uncertainties and even threatens its viability by discouraging investment. Industry also states that that more scientific
research on ILUC is still needed, making this proposal premature. Industry also believes that the 5 percent cap in 2020 will
destroy related sectors such as crushing and sugar facilities. EU farmers are protesting the proposal and the 5 percent cap,
claiming it will cut them off from an important market for their products if they are not permitted to sell to the bioenergy
industry.
The proposal amends the FQD and RED and so is subject to Parliament and Council approval. After the first reading by both
bodies, it will be clearer how far apart the two institutions are and whether a compromise can be reached.
Given the overwhelming response to the 5 percent cap, which more or less represents the current consumption in the EU, it is
likely that decision makers will increase the limit to at least 8 percent to give the industry the possibility to recoup costs.
This limit is seen by some as a compromise that also meets the demands from NGOs concerned about the impact of first-
generation biofuel feedstock production on food production, and the demands for an ILUC requirement in the RED.
On June 20, 2013, the European Parliament ITRE committee voted on the ILUC proposal. In July the ENVI committee will
vote, and the plenary vote could take place in September; however, it is more likely that the plenary vote will not happen
until March 2014, which is the last plenary meeting before the Parliament election take place.
The ITRE committees voted in favor of recommending to the Commission to raise the 5 percent cap on conventional biofuels
to 6.5 percent, introduce a 7.5 percent specific target for bioethanol, add a 2.5 percent sub target for advanced biofuels for
2020, and remove multiple counting for advanced biofuels.
The ENVI committee approved the report and suggests the cap is set at 5.5 percent and extended to include land-based
energy crops. The committee also suggests allowing MS to derogate from the 10 percent target in transport, provided they
achieved their overall target for renewable energy.
The Parliament will vote on the ILUC proposal at a plenary session on September 10, 2013. The report from the Parliament
will then be used in trilogue negotiations between the Council, the Commission and the Parliament starting later in 2013.
If the proposal is approved in its current state, it would likely benefit the use of biodiesel over bioethanol. There are no
blending restrictions under either the RED or the FQD for the use of biodiesel. The blending wall for bioethanol doesn’t
allow the EU to reach its targets even if all ethanol used in the EU was blended with bioethanol.
National Renewable Energy Action Plans The RED required MS to submit National Renewable Energy Action Plans (NREAPs) by June 30, 2010. Most MS did not
submit those plans on time; however, they have now all been submitted and the Commission is currently evaluating them.
These plans provide detailed roadmaps of how each MS expects to reach its legally binding 2020 target. Some of the MS are
asked for further information and clarifications and at least one has been asked to resubmit its report.
The information in the NREAPs predicts that the overall share of renewables in 2020 will be 20.7 percent, slightly exceeding
the target. Many MS say they will increase the use of biomass for the production of renewable energy. However, they do not
specify from where the biomass would come. Increased imports from third countries such as the U.S. could cover the
increased need.
Trade Policy
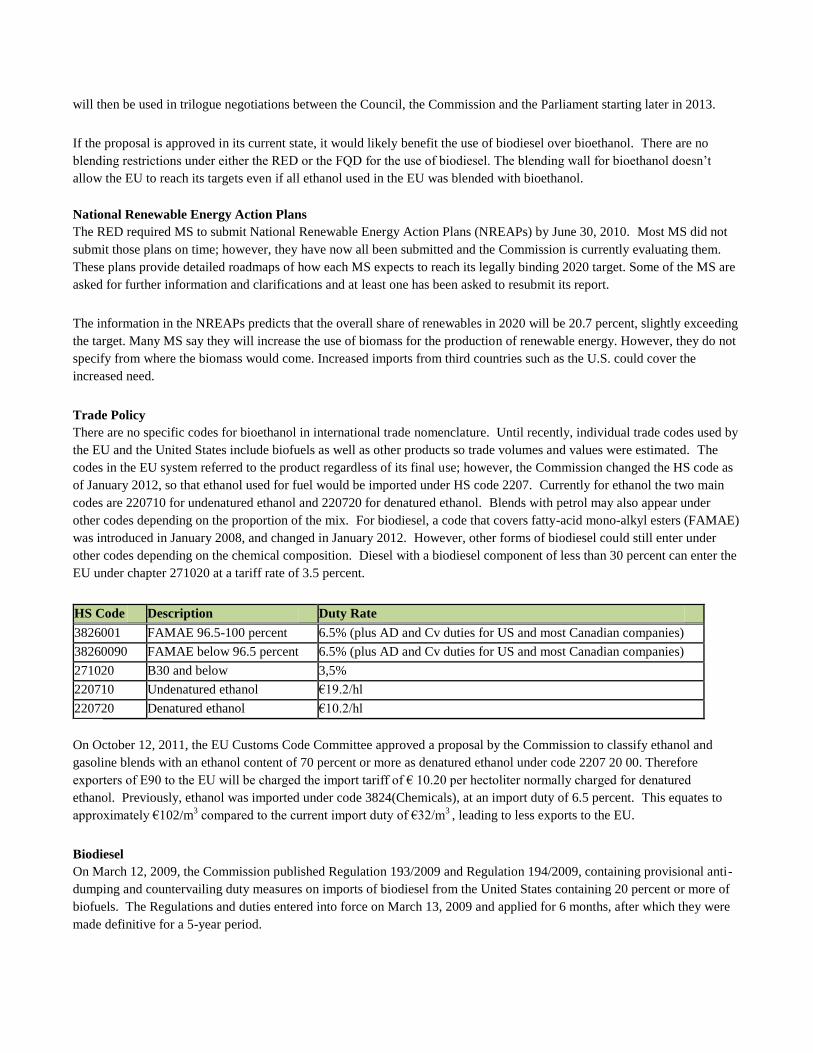
There are no specific codes for bioethanol in international trade nomenclature. Until recently, individual trade codes used by
the EU and the United States include biofuels as well as other products so trade volumes and values were estimated. The
codes in the EU system referred to the product regardless of its final use; however, the Commission changed the HS code as
of January 2012, so that ethanol used for fuel would be imported under HS code 2207. Currently for ethanol the two main
codes are 220710 for undenatured ethanol and 220720 for denatured ethanol. Blends with petrol may also appear under
other codes depending on the proportion of the mix. For biodiesel, a code that covers fatty-acid mono-alkyl esters (FAMAE)
was introduced in January 2008, and changed in January 2012. However, other forms of biodiesel could still enter under
other codes depending on the chemical composition. Diesel with a biodiesel component of less than 30 percent can enter the
EU under chapter 271020 at a tariff rate of 3.5 percent.
HS Code Description Duty Rate
3826001 FAMAE 96.5-100 percent 6.5% (plus AD and Cv duties for US and most Canadian companies)
38260090 FAMAE below 96.5 percent 6.5% (plus AD and Cv duties for US and most Canadian companies)
271020 B30 and below 3,5%
220710 Undenatured ethanol €19.2/hl
220720 Denatured ethanol €10.2/hl
On October 12, 2011, the EU Customs Code Committee approved a proposal by the Commission to classify ethanol and
gasoline blends with an ethanol content of 70 percent or more as denatured ethanol under code 2207 20 00. Therefore
exporters of E90 to the EU will be charged the import tariff of € 10.20 per hectoliter normally charged for denatured
ethanol. Previously, ethanol was imported under code 3824(Chemicals), at an import duty of 6.5 percent. This equates to
approximately €102/m3 compared to the current import duty of €32/m
3 , leading to less exports to the EU.
Biodiesel On March 12, 2009, the Commission published Regulation 193/2009 and Regulation 194/2009, containing provisional anti-
dumping and countervailing duty measures on imports of biodiesel from the United States containing 20 percent or more of
biofuels. The Regulations and duties entered into force on March 13, 2009 and applied for 6 months, after which they were
made definitive for a 5-year period.

On May 5, 2011, the European Commission published a decision to extend the definitive countervailing and anti-dumping
duties imposed on all biodiesel originating in the United States. The countervailing and anti-dumping duties were thus
extended on biodiesel blends of 20 percent or less originating from the United States. The measures adopted by the
Commission were retroactive and extended to August 13, 2012. They consist of countervailing duties on all imports of
biodiesel originating in the United States containing blends of 20 percent or less. For U.S. companies that were investigated
in 2009, the combined duties will apply, € 213.8 - € 409.2/ton. Other U.S. companies will be subject to the highest combined
duty of € 409.2/ton, based on the biodiesel content in the blend. The Council decision can be found at: http://eur-
lex.europa.eu/LexUriServ/LexUriServ.do?uri=OJ:L:2011:122:0001:0011:EN:PDF The different duties have drastically reduced the exports of biodiesel from the U.S. and the primary export countries to the
EU are currently Argentina and Indonesia. For more information see the trade chapter of this report. E90 Imports of E90 to the EU increased to such degree since the beginning of 2010 that EU industry considered it as dumping.
The EU industry claims that it was suffering because the United States has the ability to export ethanol at lower prices than
the EU can supply domestically. The European ethanol industry requested that the Commission investigate and take legal
action against the United States to protect the EU industry.
On November 25, 2011, the Commission notified in the Official Journal that they would be initiating an anti-subsidy and
anti-dumping investigation on bioethanol originating in the United States. On February 22, 2013, the Commission published Council Regulation (157/2013) imposing a definitive anti-dumping duty
on import of bioethanol originating in the United States. The rate of the anti-dumping duty is set at €63.3 per ton, and is
applicable in proportion by weight of the total content of pure ethyl alcohol produced from agricultural products. Ethanol for
other uses than for fuel is exempted from the ant-dumping duty. The regulation entered into force on February 23, 2013.
The duties for EU imports of ethanol from the U.S. are expected to cut off U.S. exports of bioethanol to the EU market. For
more information see the section on trade.
Biomass sustainability
The RED required the Commission to look into whether sustainability criteria for solid and gaseous biomass were needed.
On February 25, 2010, the Commission adopted a sustainability report for biomass other than biofuels and bioliquids. The
report makes recommendations on sustainability criteria for individual MS to use as guidance; however, no obligatory
sustainability criteria were set.
The report also stated that the Commission planned to consider the need for sustainability criteria on biomass again by
December 2011; however, as of June 2012, no report had been published. The Commission held a public consultation on
this issue and received 160 comments. The responses to the public consultation can be found here. The expected increase in
use of biomass has increased the interest for sustainability criteria, and the Commission was expected to publish a proposal
accompanied by an assessment report during the first half of 2013. Many MS have already introduced, or plan to introduce
sustainability criteria on biomass. The Commission is currently assessing whether there is a need for specific sustainability
criteria for biomass or whether the existing international, EU and MS national legislations would be sufficient to address
possible sustainability issues.
The Commission is currently working on the EU Forest strategy, which is expected to be published in 2014. The EU Forest
strategy, the EU Timber Regulation and the Land Use and Land Use Change and Forestry (LULUCF), that covers the issue
of GHG emissions, are the most important ones.
Review of the RED The RED stipulates that by December 31, 2014, the Commission shall present a report on some of the details in the RED.
These include:

A review of the minimum GHG emission saving thresholds;
The cost efficiency of the measures implemented to reach the 10 percent target;
The impact of biofuel production on the availability of foodstuffs at affordable prices; and,
An assessment of the feasibility of reaching the 10 percent target while ensuring the sustainability of biofuels
production in the Community and in third countries.
On the basis of this report the Commission will propose to modify the RED to address such aspects as the minimum GHG
savings if it considers appropriate.
Conventional Bioethanol EU Production, Supply and Demand Table
Ethanol Used as Fuel and Other Industrial Chemicals (Million Liters) Calendar Year 2006 2007 2008 2009 2010 2011e 2012e 2013f 2014f
Beginning Stocks 126 154 526 872 621 440 512 240 148 Fuel Begin Stocks 63 121 493 839 588 407 479 207 115 Production 2,258 2,453 3,466 4,203 4,918 5,042 5,270 5,840 6,030 Fuel Production 1,608 1,803 2,816 3,553 4,268 4,392 4,620 5,190 5,380 Imports 548 1,350 1,451 1,249 1,230 1,635 1,177 850 850 Fuel Imports 228 1,000 1,101 899 880 1,285 827 500 500 Exports 103 106 112 150 126 149 136 132 125 Fuel Exports 53 56 62 100 76 99 86 82 75 Consumption 2,675 3,325 4,459 5,553 6,203 6,456 6,583 6,650 6,710 Fuel Consumption 1,725 2,375 3,509 4,603 5,253 5,506 5,633 5,700 5,760 Ending Stocks 154 526 872 621 440 512 240 148 193 Fuel Ending Stocks 121 493 839 588 407 479 207 115 160 Bioethanol Production Capacity Number of Refineries 36 51 60 66 68 68 69 71 71 Capacity 2,066 3,458 5,138 6,234 7,570 7,759 8,468 8,481 8,481 Capacity Use (%) 78% 52% 55% 57% 56% 57% 55% 61% 63% Co-product Production, max theoretical (1,000 MT) DDGS 1,239 1,106 1,380 2,119 2,659 2,817 2,895 3,330 3,515 Corn Oil 11 15 37 70 75 89 122 144 146
Fuel Ethanol Feedstock Use (1,000 MT) Wheat 1,358 1,360 1,782 2,736 4,111 4,368 4,195 4,640 5,080 Corn 377 506 1,278 2,414 2,589 3,073 4,215 4,970 5,030 Barley 1,204 1,002 577 661 658 875 387 540 615 Rye 1,019 664 773 959 1,138 685 453 480 500 Sugar Beat 2,928 5,280 10,198 9,209 9,915 8,927 9,206 9,470 9,000 Market Penetration (Million Liters) Fuel Ethanol 1,725 2,375 3,509 4,603 5,253 5,506 5,633 5,700 5,760 Gasoline 140,244 135,195 128,130 123,231 115,881 115,649 115,420 115,190 114,960 Blend Rate (%) 1.2% 1.8% 2.7% 3.7% 4.5% 4.8% 4.9% 4.9% 5.0% e = estimate / f = forecast EU FAS Posts. Production Capacity Bioethanol production capacity is forecast to increase from about 2,100 million liters in 2006 to about 8,500 million liters in
2014. The majority of the production capacity has been installed in the Benelux countries, Germany, France, Spain, and the
UK. During the period 2007 - 2012, only fifty to sixty percent of the available capacity was utilized. This is partly due to
the fact that the EU is building its sector and new plants need a start up phase to be fully operational. During the seasons
2007/2008 and 2010/2011, utilization was also low due to high grain prices. Another reason for the underutilization was
competitive bioethanol imports from Brazil during 2007 - 2009, and from the United States during 2010 and 2012. Recent
restrictive measures on bioethanol imports (see trade section) created an opportunity for domestic producers to expand their
production and make use of their capacity. New investments in first generation bioethanol production capacity are not likely
due to uncertainty regarding future bioethanol policy (see the Policy Chapter).
Fuel Ethanol Production – Main Producers (million liters)
Calendar Year 2007r 2008r 2009r 2010r 2011e 2012f 2013f 2014f
Benelux 33 73 220 415 675 873 1,089 1,114
Germany 397 580 752 765 730 776 823 823
France 539 746 906 942 846 759 759 759
Spain 359 346 465 471 462 381 450 462
United Kingdom 44 70 70 278 427 253 280 443
Austria 15 89 175 199 216 228 230 230
Poland 120 114 165 194 167 211 215 228
Other 296 798 800 1,004 869 1,139 1,296 1,321
Total 1,803 2,816 3,553 4,268 4,392 4,620 5,190 5,380
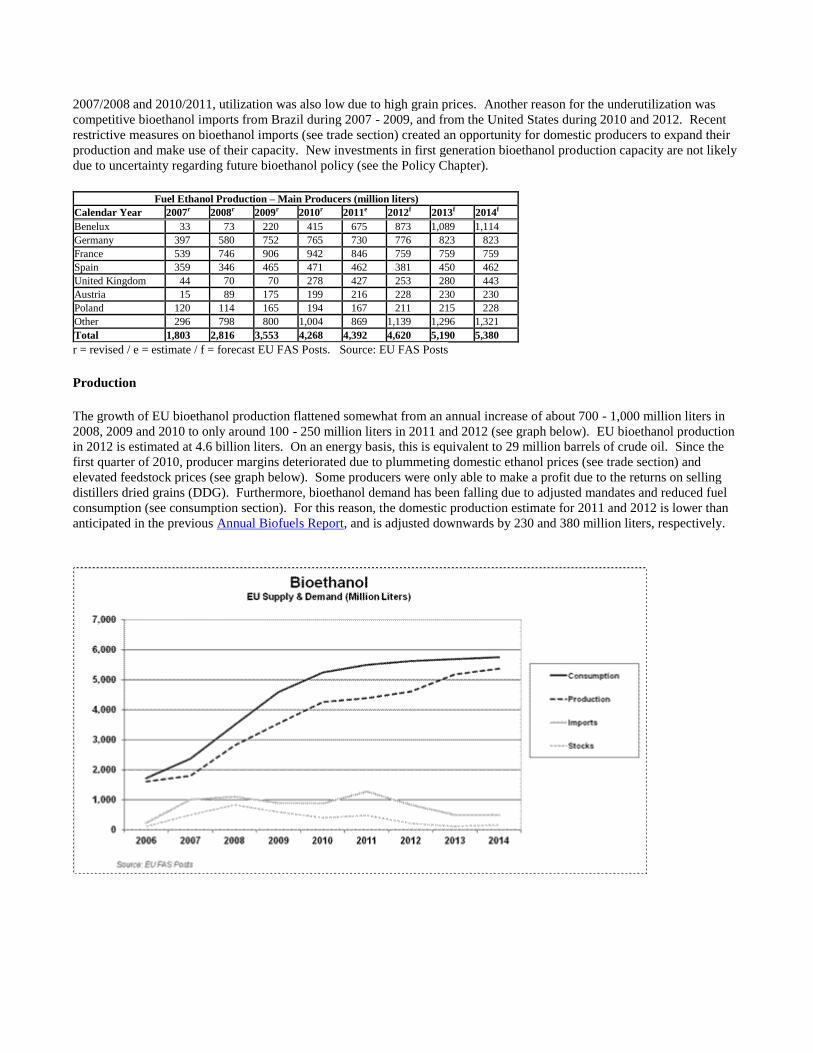
r = revised / e = estimate / f = forecast EU FAS Posts. Source: EU FAS Posts Production The growth of EU bioethanol production flattened somewhat from an annual increase of about 700 - 1,000 million liters in
2008, 2009 and 2010 to only around 100 - 250 million liters in 2011 and 2012 (see graph below). EU bioethanol production
in 2012 is estimated at 4.6 billion liters. On an energy basis, this is equivalent to 29 million barrels of crude oil. Since the
first quarter of 2010, producer margins deteriorated due to plummeting domestic ethanol prices (see trade section) and
elevated feedstock prices (see graph below). Some producers were only able to make a profit due to the returns on selling
distillers dried grains (DDG). Furthermore, bioethanol demand has been falling due to adjusted mandates and reduced fuel
consumption (see consumption section). For this reason, the domestic production estimate for 2011 and 2012 is lower than
anticipated in the previous Annual Biofuels Report, and is adjusted downwards by 230 and 380 million liters, respectively.

During 2013, EU bioethanol production is expected to recover. In MY2013/2014, the availability of feedstock supplies is
anticipated to improve (see FAS EU Grain and Feed Annual). Furthermore, competitive imports from Brazil and the United
States have been cutoff. The European commission (EC) reclassified E90 to a higher import tariff and imposed an anti-
dumping duty of 9.5 percent on ethanol imports from the United States (see trade section). These improved market
conditions are forecast to support domestic production in both 2013 and 2014.
Production increases are forecast in mainly the Benelux countries, the UK, Spain, and in lesser extent Germany. Production
in France and Poland is forecast to remain stagnant. The ports in the Benelux region provide easy access to feedstock and
serve as a hub for fossil fuel logistics, which makes it a strategic location for biofuels blending and further distribution. In
the UK, all plants are located on the east coast of England in close proximity to deep water ports. UK bioethanol production
has not yet reached maximum capacity due to technical start up problems, poor domestic wheat crops and depressed
domestic bioethanol prices. During 2013 and 2014, however, production is expected to increase. Production in Spain should
return to normal after a lower output in 2012 due to maintenance operations. This year German bioethanol production is
anticipated to recover after the dip in 2011 and 2012, which the German industry attributed to extensive E90 and ETBE
imports from the United States. In France, bioethanol production is forecast to stabilize after significant reduction in 2011 and 2012. For the past two years,
first generation biofuels have been under pressure due to reduction in national incentives. Production in Central and
Southeastern Europe is expected to stagnate with the exception of Hungary where a new bioethanol plant opened in the
spring of 2012 and is expected to scale up production in 2013. The ethanol plant will produce annually 200 million liter and
will mainly produce for exports during the first couple of years. Feedstock Use While plants in the United States and Brazil are predominantly located in the feedstock production regions, and focused on a
single feedstock, plants in the EU are often located close to the end-market and designed as multi-feed stock plants. In the
EU, bioethanol is mainly produced from wheat, corn, barley, rye, and sugar beet derivatives. Wheat is mainly used in
northwestern Europe, while corn is predominantly used in Central Europe and Spain. When the EU domestic wheat supply
is tight, producers in northwestern Europe commonly switch to imported corn. Rye is used for bioethanol production in
Poland, the Baltic Region and Germany, while barley is mainly used in Germany and Spain. In Italy, about thirty percent of
the bioethanol is produced from wine byproducts and about ten percent directly from wine. In northwestern Europe and in the Czech Republic sugar beets are used. During seasons of high grain prices, sugar beet
derivatives, mainly sugar syrup, are a favorable feedstock for bioethanol production. In MY2012/2013, production of
bioethanol from sugar syrup increased because of the availability of large supplies of EU out-of-quota sugar while cereal
prices surged (see FAS EU Sugar Annual). In the EU, the required feedstock for the 2013 production (5,190 million liters of bioethanol) is estimated at nearly 10.6
MMT of cereals and 9.5 MMT of sugar beets. This is about 3.7 percent of total EU cereal production and 7.7 percent of total
sugar beet production. Co-products of the bioethanol production are distillers dried grains (DDG), wheat gluten and yeast
concentrates. In 2013, the maximum theoretical production of co-products is forecast to reach 3.3 MMT. This is about 2.0
percent of total EU feed grain consumption. Consumption
Fuel Ethanol Consumption – Main Consumers (million liters)
Calendar Year 2007r 2008r 2009r 2010r 2011e 2012f 2013f 2014f
Germany 584 791 1,142 1,475 1,568 1,581 1,646 1,709
United Kingdom 94 152 354 582 696 1,013 1,139 1,266
France 539 814 805 782 777 759 759 759
Italy 0 176 232 306 480 482 482 482
Benelux 168 234 357 366 396 420 435 450
Other 990 1,342 1,713 1,742 1,589 1,378 1,239 1,094
Total 2,375 3,509 4,603 5,253 5,506 5,633 5,700 5,760
r = revised / e = estimate / f = forecast EU FAS Posts. Source: EU FAS Posts During 2006 – 2009, EU bioethanol consumption expanded by 0.6 to 1.2 million liters per year. But the growth has flattened
during 2010, 2011 and 2012, and is anticipated to further slow down during 2013 and 2014. For 2013 and 2014, the UK and
Germany are expected to be the main growth markets. Market expansion in other Member States is forecast to remain either
stagnant, such as in France, Spain and Italy, or expand only marginally, such as in the Benelux and Sweden. Based on
mandatory mandates, consumption growth in the UK is forecast to be at least 100 million liters per year. As of January 1,

2011, Germany allowed gasoline to contain up to 10 percent of bioethanol. The introduction of E10 is expected to increase
German bioethanol use by about 60 million liters in 2013 and 2014. In Germany and throughout the EU, an important drag
on further growth is the falling consumption of transport fuels. The downturn of France’s first generation biofuels consumption can be explained by reduced domestic and European
incentives. The most influential incentive set in favor of biofuel consumption consists of an environmental tax imposed on
blenders when the annual target blending is not reached. In addition, the petroleum tax rebate that biofuels have benefitted
has significantly declined and is likely to disappear. The French Agricultural Minister announced in September 2012 that a
plan that would put a “gradual end to public support for first generation-biofuels starting from 2014 and terminating
December 31, 2015,” as part of his national action plan to address high feedstock prices. In Spain, bioethanol consumption
is expected to decline in 2013 as a result of the end of the tax exemption for biofuels and the downward revision of
consumption mandates, and to remain stagnant in 2014. Due to the lower gasoline use and reduced incentives, EU bioethanol consumption is expected to grow only marginally from
5.63 billion liters in 2012 to 5.70 billion liters in 2013 and 5.76 billion liters in 2014. A surplus will be available in the
Benelux countries, and in some Central European countries, mainly Hungary and Austria. France and Spain will be for the
most part self sufficient. Germany and the UK are expected to be main deficit markets in 2013 and 2014 with a volume of
about 800 million liter. Other deficit markets are Italy (400), Denmark (250), Sweden (200), Finland (150), Poland (90) and
Romania (50). Trade During 2006 – 2012, the majority of the bioethanol has been imported by the Benelux countries, the UK, Sweden, and
Finland mainly through the port of Rotterdam. A part of the bioethanol imports is blended with gasoline in Rotterdam, but
most of the biofuel is blended at its final destination to fulfill local EU Member State requirements. The EU tariff on undenatured ethanol (HS 2207.10) is 192 Euro per thousand liters, while the tariff on denatured ethanol (HS
2207.20) is 102 Euro per thousand liters. By denaturing, ethanol is made unsuitable for human consumption by adding
substances according EC Regulation 3199/93. Most EU Member States only permit blending with undenatured ethanol,
protecting their domestic market by the higher tariff rate. The governments of the UK, the Netherlands, Finland, Denmark,
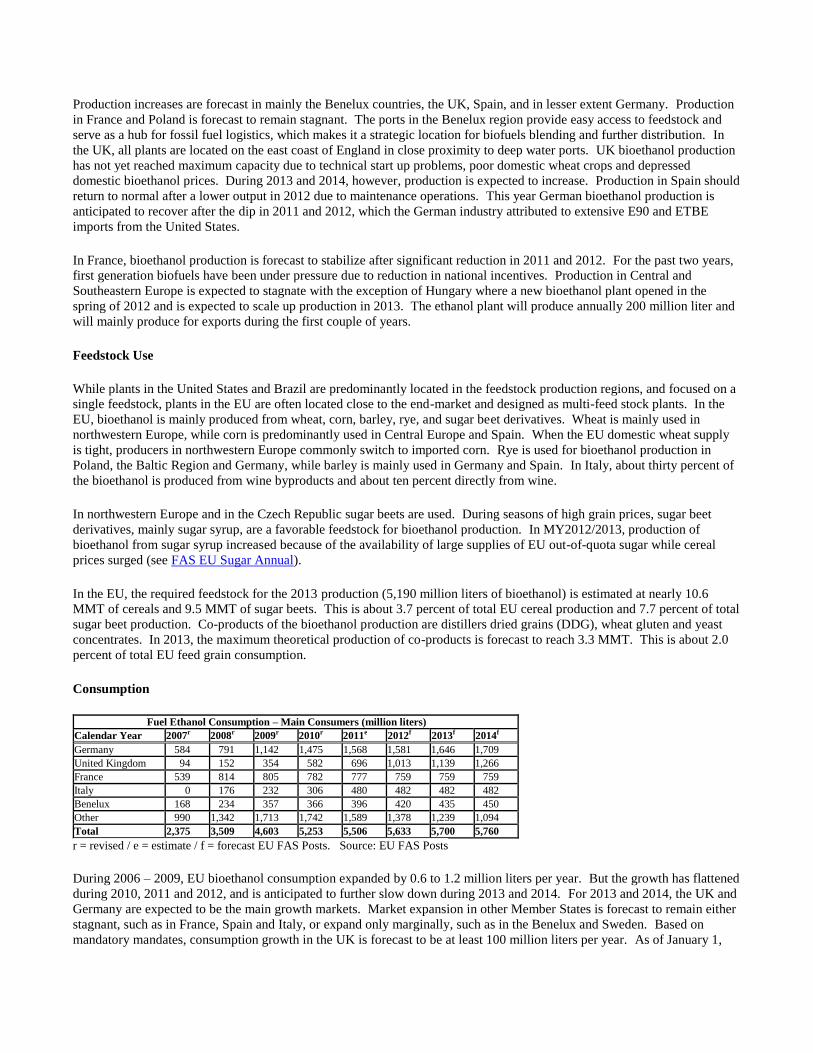
the Czech Republic and Slovakia, however, also permit blending with denatured ethanol. The bioethanol loophole In 2012, the EU closed a popular loophole in the tariff regime. During 2009 – 2012, the major part of the bioethanol shipped
to the EU was exported under HS 2207 but imported as a blend with a Binding Tariff Information (BTI) under the HS code
3824.90.97, subject to a lower tariff, namely 6.5 percent of the customs value. On a T1 FOB EU NW (duty unpaid, free on
board, in EU northwestern seaport) ethanol price of 600 euro per 1,000 liter, this is a duty of about 39 euro instead of 102
euro per 1,000 liter. This practice of blending gasoline with bioethanol is conducted either before arrival on the continent, or
under customs control on EU territory. As a result, a significant difference exists between the reported HS 2207 export
volume to the EU and reported HS 2207 import volume. This gap is roughly equal to the import volume under HS
3824.90.97 reported by Eurostat (see graph below).
During 2010, 2011 and 2012, the imports of bioethanol blends from Brazil were replaced by imports from the United States
(see graph above). Reportedly the majority has been imported as E90 (90 percent bioethanol). The termination of the
blender’s credit on December 31, 2011, had no noticeable effect on these imports. Because the E90 imports avoided the high
tariffs for HS 2207, the price deviation between the world and protected EU market disappeared, and as a result, EU
domestic prices for bioethanol plummeted. Bioethanol imports from Brazil were also replaced by increased imports of
ETBE, from both Brazil and the United States. In 2010, 2011 and 2012, the EU imported respectively 632, 611, and 433
million liter. Significant growth of ETBE imports is not anticipated due to the limited production capacity in the producing
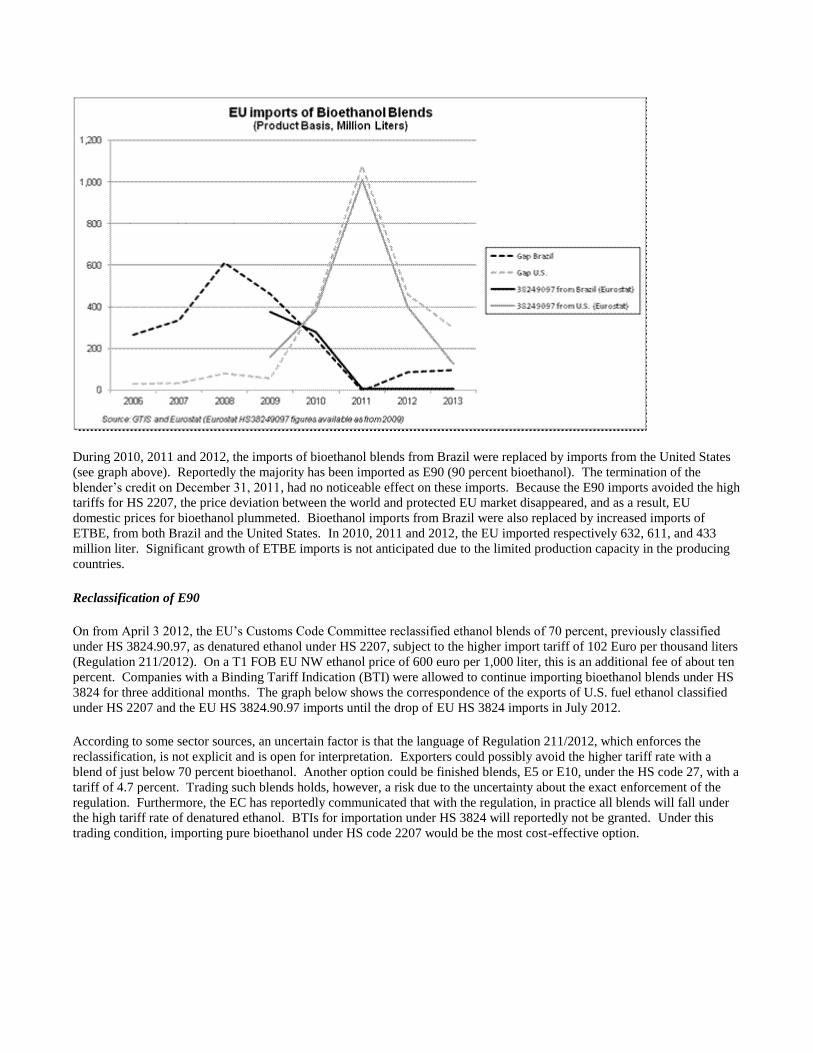
countries. Reclassification of E90 On from April 3 2012, the EU’s Customs Code Committee reclassified ethanol blends of 70 percent, previously classified
under HS 3824.90.97, as denatured ethanol under HS 2207, subject to the higher import tariff of 102 Euro per thousand liters
(Regulation 211/2012). On a T1 FOB EU NW ethanol price of 600 euro per 1,000 liter, this is an additional fee of about ten
percent. Companies with a Binding Tariff Indication (BTI) were allowed to continue importing bioethanol blends under HS
3824 for three additional months. The graph below shows the correspondence of the exports of U.S. fuel ethanol classified
under HS 2207 and the EU HS 3824.90.97 imports until the drop of EU HS 3824 imports in July 2012. According to some sector sources, an uncertain factor is that the language of Regulation 211/2012, which enforces the
reclassification, is not explicit and is open for interpretation. Exporters could possibly avoid the higher tariff rate with a
blend of just below 70 percent bioethanol. Another option could be finished blends, E5 or E10, under the HS code 27, with a
tariff of 4.7 percent. Trading such blends holds, however, a risk due to the uncertainty about the exact enforcement of the
regulation. Furthermore, the EC has reportedly communicated that with the regulation, in practice all blends will fall under
the high tariff rate of denatured ethanol. BTIs for importation under HS 3824 will reportedly not be granted. Under this
trading condition, importing pure bioethanol under HS code 2207 would be the most cost-effective option.
Anti-dumping duty Following a complaint from the European bioethanol industry (ePURE), the European Commission imposed an anti-
dumping duty on the bioethanol imports from the United States. On February 23, 2013, the duty was set at 62.3 euro per MT
(49.2 euro per 1,000 liter) for the coming five years (see for more information the Policy Chapter). This duty is in addition
to the import tariff of 102 euro per 1,000 liters, and as a consequence 1,000 liters of ethanol from the United States is
charged with 151.2 euro. This rate is expected to cut off U.S. exports of bioethanol to the EU. While the United States and
Brazil have gained free access to each other’s bioethanol markets, the EU is becoming an increasingly isolated market with
high import tariffs. During 2013 and 2014, EU bioethanol production expansion is not expected to be able to replace the imports from Brazil and
the United States. Even with the anticipated expansion in the Benelux and the UK of nearly 600 million liters in 2013 and
200 million liters in 2014, an annual import of about 500 million liters will be needed. The regulated demand in the EU, is
expected to raise domestic ethanol prices and will attract bioethanol from the market in Brazil, the United States or other
countries, unless oil companies chose to pay the penalties for not complying with the blending mandates. Germany and the
UK are expected to be main deficit markets in 2013 and 2014 with a volume of about 800 million liter each (see
consumption section). The question remains from which countries the 500 million liters of bioethanol will be imported. About 350 million liter of
ethanol is expected to be supplied through preferential trade measures, mainly used by Guatemala, Peru and Pakistan.
Guatemalan and Peruvian ethanol production is estimated at respectively about 270 million liters and 220 million liters
annually, while the domestic market is not fully developed (see the FAS Guatemala Biofuels Annual and the FAS Peru
Biofuels Annual). Under the EU Generalized Scheme of Preferences (GSP) Guatemala and Peru are able to export unlimited
quantities of ethanol duty-free during the period 2009 – 2013. An uncertain factor is the demand in the U.S. which could
attract ethanol from Latin America. It is however anticipated that production from this region will be better able to compete
with Brazilian ethanol on the EU market then on the U.S market as they have the competitive advantage to enter the EU
market duty-free. Also Pakistan has duty-free access for 2013 with a quota of 95 million liters, of which 40 million liters
were already allocated through the first half year. Based on historical import figures, about 100 million liters imported
through preferential trade measures is used for non-fuel purposes, and about 250 million liters could be used as transport
fuel. The other likely source is Brazil. Production in Brazil is forecast to increase significantly due to a record cane harvest and
low sugar prices. Despite government incentives, which will further support the domestic market, a surplus is expected to be
available for exports. As a consequence of the anti dumping duty, EU imports from the United States are the least likely.
Trade sources belief that only if high EU domestic grain prices are combined with low U.S. corn prices imports could
possibly resume during the fourth quarter of 2013. Imports of both corn and sugar cane ethanol are not expected to be constrained by the implementation of the sustainability
requirements laid down in the Renewable Energy Directive 2009/28/EC (RED) in national MS legislation (see policy section
of the report). Future policies of the EC and MS Governments’ interpretation and implementation of the RED remain
however an uncertain aspect in forecasting future bioethanol imports. Imports could be hampered by a stricter or even
inconsistent execution of the RED by the individual EU Member States. Stocks As a result of elevated domestic production and imports, ethanol stocks have been building during 2007 and 2008. The
current storage capacity for ethanol, bioethanol and ethanol for non-fuel use, in the port of Rotterdam is estimated at about
600 million liters. Due to the cutoff of imports, the ample stock available on the market in 2011 and 2012 is expected to be
depleted during this and next year.
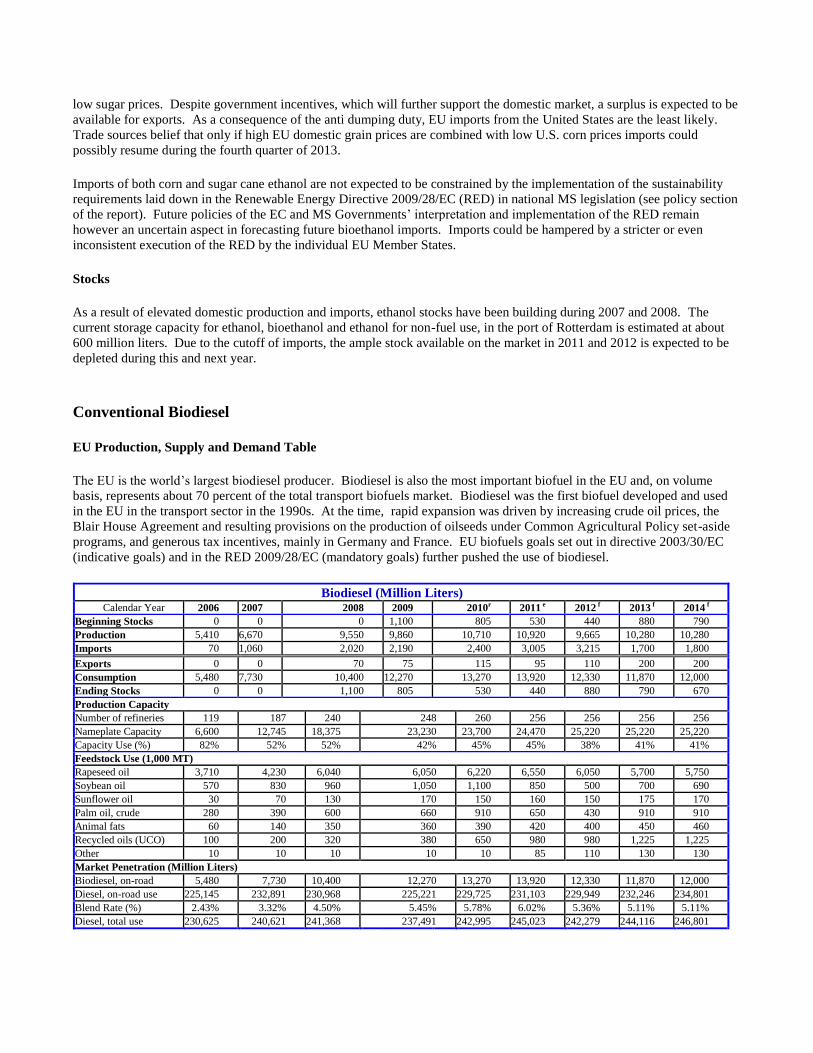
Conventional Biodiesel EU Production, Supply and Demand Table The EU is the world’s largest biodiesel producer. Biodiesel is also the most important biofuel in the EU and, on volume
basis, represents about 70 percent of the total transport biofuels market. Biodiesel was the first biofuel developed and used
in the EU in the transport sector in the 1990s. At the time, rapid expansion was driven by increasing crude oil prices, the
Blair House Agreement and resulting provisions on the production of oilseeds under Common Agricultural Policy set-aside
programs, and generous tax incentives, mainly in Germany and France. EU biofuels goals set out in directive 2003/30/EC
(indicative goals) and in the RED 2009/28/EC (mandatory goals) further pushed the use of biodiesel.
Biodiesel (Million Liters) Calendar Year 2006 2007 2008 2009 2010r 2011 e 2012 f 2013 f 2014 f
Beginning Stocks 0 0 0 1,100 805 530 440 880 790 Production 5,410 6,670 9,550 9,860 10,710 10,920 9,665 10,280 10,280 Imports 70 1,060 2,020 2,190 2,400 3,005 3,215 1,700 1,800 Exports 0 0 70 75 115 95 110 200 200 Consumption 5,480 7,730 10,400 12,270 13,270 13,920 12,330 11,870 12,000 Ending Stocks 0 0 1,100 805 530 440 880 790 670 Production Capacity Number of refineries 119 187 240 248 260 256 256 256 256 Nameplate Capacity 6,600 12,745 18,375 23,230 23,700 24,470 25,220 25,220 25,220 Capacity Use (%) 82% 52% 52% 42% 45% 45% 38% 41% 41% Feedstock Use (1,000 MT) Rapeseed oil 3,710 4,230 6,040 6,050 6,220 6,550 6,050 5,700 5,750 Soybean oil 570 830 960 1,050 1,100 850 500 700 690 Sunflower oil 30 70 130 170 150 160 150 175 170 Palm oil, crude 280 390 600 660 910 650 430 910 910 Animal fats 60 140 350 360 390 420 400 450 460 Recycled oils (UCO) 100 200 320 380 650 980 980 1,225 1,225 Other 10 10 10 10 10 85 110 130 130 Market Penetration (Million Liters) Biodiesel, on-road 5,480 7,730 10,400 12,270 13,270 13,920 12,330 11,870 12,000 Diesel, on-road use 225,145 232,891 230,968 225,221 229,725 231,103 229,949 232,246 234,801 Blend Rate (%) 2.43% 3.32% 4.50% 5.45% 5.78% 6.02% 5.36% 5.11% 5.11% Diesel, total use 230,625 240,621 241,368 237,491 242,995 245,023 242,279 244,116 246,801

r = revised / e = estimate / f = forecast EU FAS Posts. Production capacity as of December 31 of year stated. The PSD is built on
information in MT and converted to liters using a conversion rate of 1 MT = 1,136 liters. Sources: FAS Posts, Global Trade Atlas (GTA),
European Biodiesel Board (EBB), Eurostat. Note: Data for feedstock use is not available. The figures above represent estimates by EU
FAS posts. Production Capacity The years of rapid expansion in EU biodiesel production capacity seem to be over. From 2006 to 2009, production capacity
increased by 360 percent, followed by a comparatively small increase in 2011 of six percent. For 2012, capacity is forecast
to contract by 0.5 percent, driven by reductions in France and Germany. Capacity is expected to remain stable in 2013 and
2014. The waning interest in investing in biodiesel capacity is a result of difficult market conditions. From 2008 onwards,
comparatively low crude oil prices, high vegetable oil prices, increasing imports, and the financial crisiresulted in reduced or
negative production margins. As a result, capacity use dropped from 52 percent in 2007 to a mere 45 percent in 2011. It is
expected that capacity use wull drop even further, as a number of plants all over the EU temporarily stopped production or
closed. Reduced demand due to double counting provisions introduced in several member states, together with a cut in
minimum blending obligations in Spain in 2013, also suggests that the market will not support existing production capacity. The structure of the biodiesel sector is very diverse and plant sizes range from an annual capacity of 2,000 MT owned by a
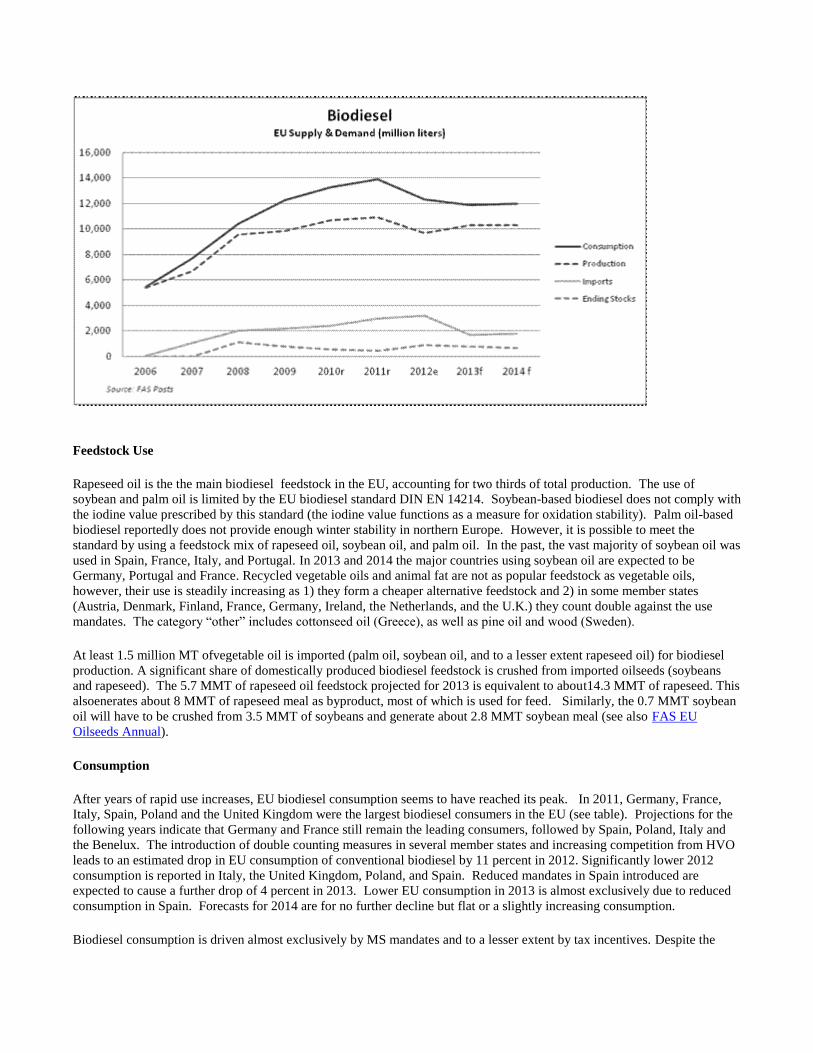
group of farmers to 600,000 MT owned by a large multi-national company. Production In contrast to previous expectations, EU biodiesel peaked in 2011 and domestic production does not seem to be benefiting
from increased use mandates. Double counting measures in some member states, and reduced mandates since 2013 in Spain,
are having a negative impact on EU demand and production. In addition there is increasing competition to conventional
biodiesel coming from increased production and availability of hydrotreated vegetable oils (HVO). Production of
conventional biodiesel in 2012 is forecast to drop by about eleven percent. Spain, France and Italy report significantly lower
production in 2012 and 2013 than previously expected. Only Poland foresees an increase in biodiesel production for 2012.
Expected lower imports due to anti-dumping duties for biodiesel from Argentina and Indonesia in 2013 and 2014 will
stimulate domestic production but output is nonetheless forecast to be a lower than in 2011. Germany, France and the Benelux remain the major producing countries within the EU. Due to the expected production
increases, Poland will rank fourth in biodiesel production in 2012.
EU Biodiesel Production – Main Producers (million liters)
Calendar Year 2006 2007 2008 2009 2010r 2011r 2012e 2013f 2014f
Germany 2,730 3,280 3,250 2,600 2,880 3,400 3,180 3,180 3,180
France 650 1,090 2,000 2,610 2,270 2,060 2,040 2,040 2,040
Benelux 50 290 430 840 910 950 1,000 1,050 1,090
Poland 100 60 310 420 430 410 670 720 740
Italy 680 530 760 900 830 700 570 570 570
Spain 140 170 280 700 1,370 740 510 400 400
Others 1,060 1,250 2,520 1,790 2,020 2,660 1,695 2,320 2,260
Total 5,410 6,670 9,550 9,860 10,710 10,920 9,665 10,280 10,280
Source: FAS EU Posts
Feedstock Use Rapeseed oil is the the main biodiesel feedstock in the EU, accounting for two thirds of total production. The use of
soybean and palm oil is limited by the EU biodiesel standard DIN EN 14214. Soybean-based biodiesel does not comply with
the iodine value prescribed by this standard (the iodine value functions as a measure for oxidation stability). Palm oil-based
biodiesel reportedly does not provide enough winter stability in northern Europe. However, it is possible to meet the
standard by using a feedstock mix of rapeseed oil, soybean oil, and palm oil. In the past, the vast majority of soybean oil was
used in Spain, France, Italy, and Portugal. In 2013 and 2014 the major countries using soybean oil are expected to be
Germany, Portugal and France. Recycled vegetable oils and animal fat are not as popular feedstock as vegetable oils,
however, their use is steadily increasing as 1) they form a cheaper alternative feedstock and 2) in some member states
(Austria, Denmark, Finland, France, Germany, Ireland, the Netherlands, and the U.K.) they count double against the use
mandates. The category “other” includes cottonseed oil (Greece), as well as pine oil and wood (Sweden). At least 1.5 million MT ofvegetable oil is imported (palm oil, soybean oil, and to a lesser extent rapeseed oil) for biodiesel
production. A significant share of domestically produced biodiesel feedstock is crushed from imported oilseeds (soybeans
and rapeseed). The 5.7 MMT of rapeseed oil feedstock projected for 2013 is equivalent to about14.3 MMT of rapeseed. This
alsoenerates about 8 MMT of rapeseed meal as byproduct, most of which is used for feed. Similarly, the 0.7 MMT soybean
oil will have to be crushed from 3.5 MMT of soybeans and generate about 2.8 MMT soybean meal (see also FAS EU
Oilseeds Annual). Consumption After years of rapid use increases, EU biodiesel consumption seems to have reached its peak. In 2011, Germany, France,
Italy, Spain, Poland and the United Kingdom were the largest biodiesel consumers in the EU (see table). Projections for the
following years indicate that Germany and France still remain the leading consumers, followed by Spain, Poland, Italy and
the Benelux. The introduction of double counting measures in several member states and increasing competition from HVO
leads to an estimated drop in EU consumption of conventional biodiesel by 11 percent in 2012. Significantly lower 2012
consumption is reported in Italy, the United Kingdom, Poland, and Spain. Reduced mandates in Spain introduced are
expected to cause a further drop of 4 percent in 2013. Lower EU consumption in 2013 is almost exclusively due to reduced
consumption in Spain. Forecasts for 2014 are for no further decline but flat or a slightly increasing consumption. Biodiesel consumption is driven almost exclusively by MS mandates and to a lesser extent by tax incentives. Despite the
declining trend 2012 and 2013 a few member states like Germany and the Benelux are expected to increase their
consumption but only to a small extent.
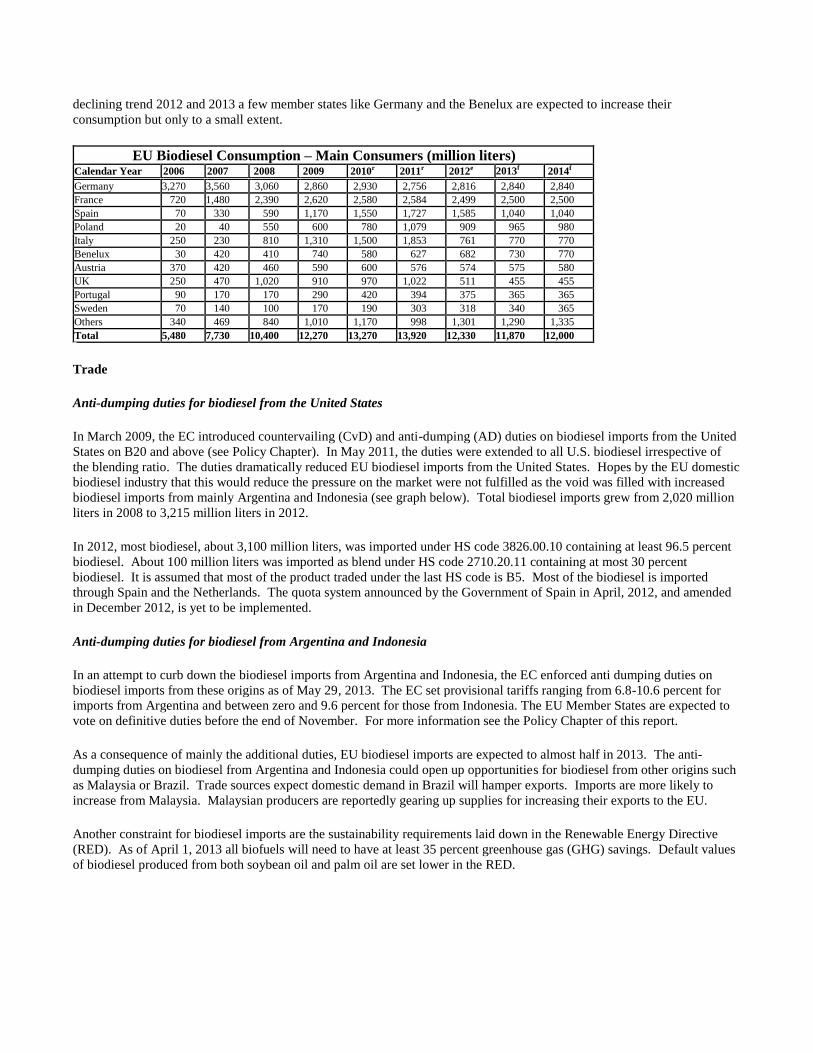
EU Biodiesel Consumption – Main Consumers (million liters) Calendar Year 2006 2007 2008 2009 2010r 2011r 2012e 2013f 2014f
Germany 3,270 3,560 3,060 2,860 2,930 2,756 2,816 2,840 2,840
France 720 1,480 2,390 2,620 2,580 2,584 2,499 2,500 2,500
Spain 70 330 590 1,170 1,550 1,727 1,585 1,040 1,040
Poland 20 40 550 600 780 1,079 909 965 980
Italy 250 230 810 1,310 1,500 1,853 761 770 770
Benelux 30 420 410 740 580 627 682 730 770
Austria 370 420 460 590 600 576 574 575 580
UK 250 470 1,020 910 970 1,022 511 455 455
Portugal 90 170 170 290 420 394 375 365 365
Sweden 70 140 100 170 190 303 318 340 365
Others 340 469 840 1,010 1,170 998 1,301 1,290 1,335
Total 5,480 7,730 10,400 12,270 13,270 13,920 12,330 11,870 12,000
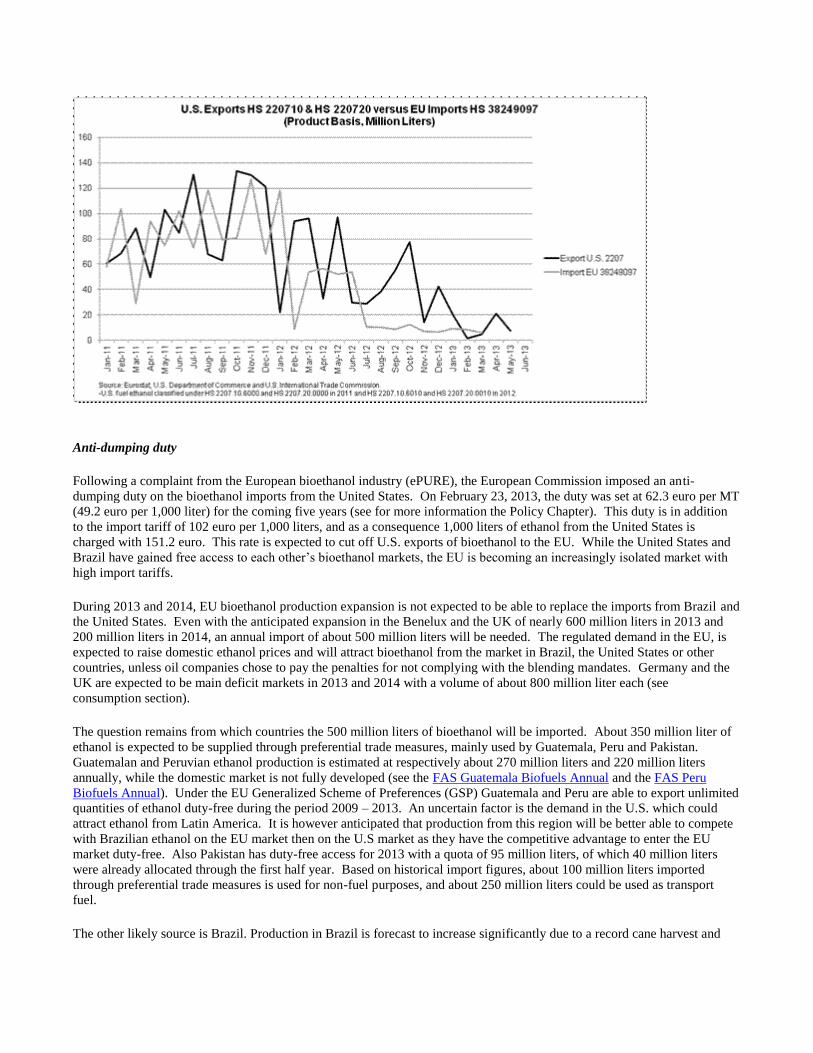
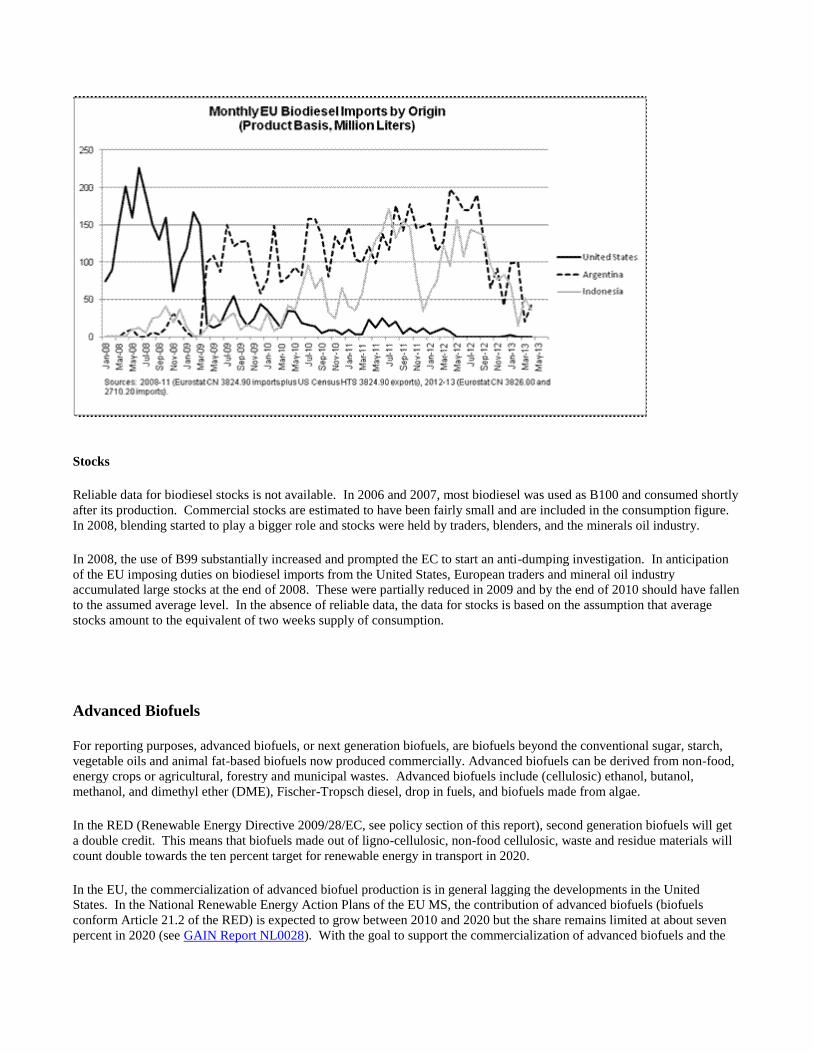
Trade Anti-dumping duties for biodiesel from the United States In March 2009, the EC introduced countervailing (CvD) and anti-dumping (AD) duties on biodiesel imports from the United
States on B20 and above (see Policy Chapter). In May 2011, the duties were extended to all U.S. biodiesel irrespective of
the blending ratio. The duties dramatically reduced EU biodiesel imports from the United States. Hopes by the EU domestic
biodiesel industry that this would reduce the pressure on the market were not fulfilled as the void was filled with increased
biodiesel imports from mainly Argentina and Indonesia (see graph below). Total biodiesel imports grew from 2,020 million
liters in 2008 to 3,215 million liters in 2012. In 2012, most biodiesel, about 3,100 million liters, was imported under HS code 3826.00.10 containing at least 96.5 percent
biodiesel. About 100 million liters was imported as blend under HS code 2710.20.11 containing at most 30 percent
biodiesel. It is assumed that most of the product traded under the last HS code is B5. Most of the biodiesel is imported
through Spain and the Netherlands. The quota system announced by the Government of Spain in April, 2012, and amended
in December 2012, is yet to be implemented. Anti-dumping duties for biodiesel from Argentina and Indonesia In an attempt to curb down the biodiesel imports from Argentina and Indonesia, the EC enforced anti dumping duties on
biodiesel imports from these origins as of May 29, 2013. The EC set provisional tariffs ranging from 6.8-10.6 percent for
imports from Argentina and between zero and 9.6 percent for those from Indonesia. The EU Member States are expected to
vote on definitive duties before the end of November. For more information see the Policy Chapter of this report. As a consequence of mainly the additional duties, EU biodiesel imports are expected to almost half in 2013. The anti-
dumping duties on biodiesel from Argentina and Indonesia could open up opportunities for biodiesel from other origins such
as Malaysia or Brazil. Trade sources expect domestic demand in Brazil will hamper exports. Imports are more likely to
increase from Malaysia. Malaysian producers are reportedly gearing up supplies for increasing their exports to the EU. Another constraint for biodiesel imports are the sustainability requirements laid down in the Renewable Energy Directive
(RED). As of April 1, 2013 all biofuels will need to have at least 35 percent greenhouse gas (GHG) savings. Default values
of biodiesel produced from both soybean oil and palm oil are set lower in the RED.
Stocks Reliable data for biodiesel stocks is not available. In 2006 and 2007, most biodiesel was used as B100 and consumed shortly
after its production. Commercial stocks are estimated to have been fairly small and are included in the consumption figure.
In 2008, blending started to play a bigger role and stocks were held by traders, blenders, and the minerals oil industry. In 2008, the use of B99 substantially increased and prompted the EC to start an anti-dumping investigation. In anticipation
of the EU imposing duties on biodiesel imports from the United States, European traders and mineral oil industry
accumulated large stocks at the end of 2008. These were partially reduced in 2009 and by the end of 2010 should have fallen
to the assumed average level. In the absence of reliable data, the data for stocks is based on the assumption that average
stocks amount to the equivalent of two weeks supply of consumption.
Advanced Biofuels For reporting purposes, advanced biofuels, or next generation biofuels, are biofuels beyond the conventional sugar, starch,
vegetable oils and animal fat-based biofuels now produced commercially. Advanced biofuels can be derived from non-food,
energy crops or agricultural, forestry and municipal wastes. Advanced biofuels include (cellulosic) ethanol, butanol,
methanol, and dimethyl ether (DME), Fischer-Tropsch diesel, drop in fuels, and biofuels made from algae. In the RED (Renewable Energy Directive 2009/28/EC, see policy section of this report), second generation biofuels will get
a double credit. This means that biofuels made out of ligno-cellulosic, non-food cellulosic, waste and residue materials will
count double towards the ten percent target for renewable energy in transport in 2020. In the EU, the commercialization of advanced biofuel production is in general lagging the developments in the United
States. In the National Renewable Energy Action Plans of the EU MS, the contribution of advanced biofuels (biofuels
conform Article 21.2 of the RED) is expected to grow between 2010 and 2020 but the share remains limited at about seven
percent in 2020 (see GAIN Report NL0028). With the goal to support the commercialization of advanced biofuels and the
bio-based economy in general the European Commission (EC) developed the following programs: -On February 13, 2012, the EC adopted a new strategy entitled "Innovating for Sustainable Growth: a Bioeconomy for
Europe". The main goal of the strategy is to reduce the EU’s dependency on fossil resources, for more information see the
Bioeconomy website of the EC. One of the policy areas under the strategy is biorefinery, including the production of
biofuels. The EC will fund biorefinery research and commercialization by the Horizon 2020 program. This financial
instrument has a budget of Euro 80 billion for the period 2014-2020. -The goals of the Biorefinery policy area overlap the goals of the European Strategic Energy Technology (SET) Plan. The
SET-Plan includes the European Industrial Bioenergy Initiative (EIBI), which key objective is to accelerate the commercial
development of sustainable bioenergy. The estimated budget is Euro 8 billion over 10 years to support 15-20 projects. -On July 10, 2013, the EC presented the Biobased Industries Public Private Partnership with the Biobased Industries
Consortium (BIC), a cross sector group of 48 private companies. The partnership plans to accelerate the exploitation of
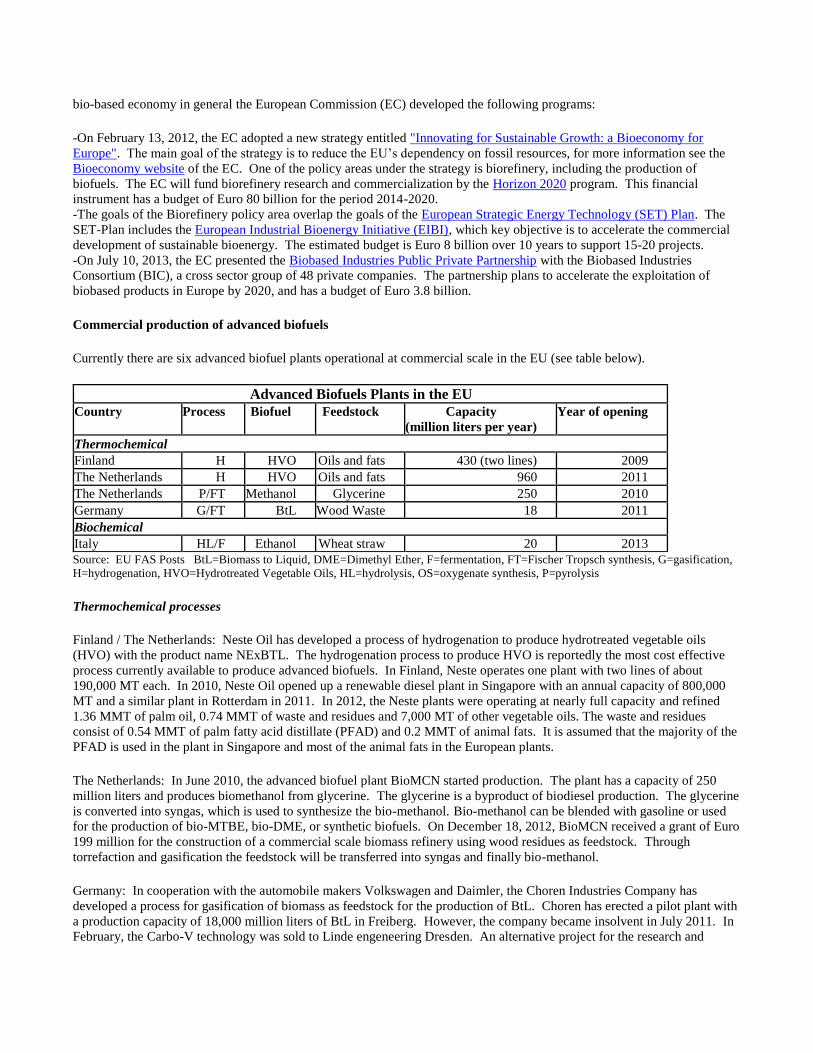
biobased products in Europe by 2020, and has a budget of Euro 3.8 billion. Commercial production of advanced biofuels Currently there are six advanced biofuel plants operational at commercial scale in the EU (see table below).
Advanced Biofuels Plants in the EU Country Process Biofuel Feedstock Capacity
(million liters per year) Year of opening
Thermochemical Finland H HVO Oils and fats 430 (two lines) 2009 The Netherlands H HVO Oils and fats 960 2011 The Netherlands P/FT Methanol Glycerine 250 2010 Germany G/FT BtL Wood Waste 18 2011 Biochemical Italy HL/F Ethanol Wheat straw 20 2013 Source: EU FAS Posts BtL=Biomass to Liquid, DME=Dimethyl Ether, F=fermentation, FT=Fischer Tropsch synthesis, G=gasification,
H=hydrogenation, HVO=Hydrotreated Vegetable Oils, HL=hydrolysis, OS=oxygenate synthesis, P=pyrolysis Thermochemical processes Finland / The Netherlands: Neste Oil has developed a process of hydrogenation to produce hydrotreated vegetable oils
(HVO) with the product name NExBTL. The hydrogenation process to produce HVO is reportedly the most cost effective
process currently available to produce advanced biofuels. In Finland, Neste operates one plant with two lines of about
190,000 MT each. In 2010, Neste Oil opened up a renewable diesel plant in Singapore with an annual capacity of 800,000
MT and a similar plant in Rotterdam in 2011. In 2012, the Neste plants were operating at nearly full capacity and refined
1.36 MMT of palm oil, 0.74 MMT of waste and residues and 7,000 MT of other vegetable oils. The waste and residues
consist of 0.54 MMT of palm fatty acid distillate (PFAD) and 0.2 MMT of animal fats. It is assumed that the majority of the
PFAD is used in the plant in Singapore and most of the animal fats in the European plants. The Netherlands: In June 2010, the advanced biofuel plant BioMCN started production. The plant has a capacity of 250
million liters and produces biomethanol from glycerine. The glycerine is a byproduct of biodiesel production. The glycerine
is converted into syngas, which is used to synthesize the bio-methanol. Bio-methanol can be blended with gasoline or used
for the production of bio-MTBE, bio-DME, or synthetic biofuels. On December 18, 2012, BioMCN received a grant of Euro
199 million for the construction of a commercial scale biomass refinery using wood residues as feedstock. Through
torrefaction and gasification the feedstock will be transferred into syngas and finally bio-methanol. Germany: In cooperation with the automobile makers Volkswagen and Daimler, the Choren Industries Company has
developed a process for gasification of biomass as feedstock for the production of BtL. Choren has erected a pilot plant with
a production capacity of 18,000 million liters of BtL in Freiberg. However, the company became insolvent in July 2011. In
February, the Carbo-V technology was sold to Linde engeneering Dresden. An alternative project for the research and

production of BtL fuels is run by the Karlsruhe Institute for Technology (KIT). It is known as the Bioliq® project. KIT
works on processes to convert crop residues and wood residues into diesel and gasoline fuels. The Bioliq®
process allows the
physical separation of the pyrolysis from the rest of the process. This means that feedstock can be converted into pyrolysis
oil in decentralized plants which is then shipped to a central plant for final conversion. This helps to reduce volume and
costs for feedstock transport. United Kingdom: In November 2009, BP and DuPont announced the formation of Kingston Research Ltd and the
establishment of an advanced biofuels research centre in Hull for demonstration of biobutanol technology. The first
commercial-scale biobutanol facility is expected to begin operating in 2014. Green Biologics (UK) has developed butanol-
producing genetically enhanced microbial strains and will integrate these into a novel fermentation process. This technology
advance should result in a step change in the economic viability of the fermentation and enable the large scale production. Biochemical processes Spain: Abengoa Bioenergy has built a demonstration plant in Babilafuente (Salamanca). The plant construction was
completed in December 2008 and it has been operating since September 2009. This plant has a 5 million liters/year
production capacity, and uses wheat and barley straw as feedstock. The process is based on enzymatic hydrolysis. Since
2013, in the same pilot facility up to 25,000 MT of urban solid waste per year can be processed to produce 1.5 million liters
of biofuels. Italy: In the last quarter of 2012, Beta Renewables started the production of cellulosic ethanol from wheat straw. The
Crescentino plant aims to produce 20 million liters of ethanol via 60,000 MT of non-food feedstock including rice straw,
wheat straw, corn stover, Arundo Donax and poplar. It will also generate electricity beyond what is needed to run the plant.
The Danish enzyme producer Novozymes is taken part in the project. Currently the plant is in its start up phase. Use of conventional and advanced biofuels by the aviation sector In 2011, the EC, Airbus, and the aviation and biofuel producers industries, launched the European Advanced Biofuels
Flightpath. This action is scheduled to achieve 2 million MT of sustainable biofuels used in the EU civil aviation sector by
the year 2020. In the short term, before 2015, the intention is to make 1,000 MT of Fisher-Tropsch biofuel available, and to
produce hydrotreated vegetable oil (HVO) suitable as aviation fuel. Since 2008, the aviation sector has been conducting test
flights with biofuels. On March 8, 2013, KLM launched the first ever intercontinental flight series on biofuel, between New
York and Amsterdam. Currently, the price of biojet fuel is about eight times the price of conventional kerosene. The
aviation industry expects that the economy of scale will make biojet fuel competitive around 2018.
Biomass for Heat and Power
The European Commission (EC) expects heat and power production from biomass to play an important role in meeting the
20 percent target for renewable use by 2020 and in the future reduction of CO2 emissions in Europe. Based on the
Renewable Energy Action Plans (NREAPs) submitted by the Member States to the EC, focus is on biomass for heating and
cooling rather than for electricity (see table below). A major part of the biomass used is forecast to be forestry products. The European Biomass Association (AEBIOM) expects the EU consumption of wood pellets to increase from 2.5 Mtoe in
2008 to 20 - 32 Mtoe in 2020. This is about 20 to 30 percent of the forecast biomass consumption in the NREAPs and equal
to a volume of 50 – 80 MMT. Based on the NREAPs, biogas production from biomass is expected to reach 8.4 Mtoe in
2020, which is about 8 percent of the projected total biomass use.
Renewable Energy Use and share of Biomass and Biofuels (Mtoe) Calendar Year 2005 2010 2015 2020 Heat & Cooling 54.3 67.8 84.7 111.5 -Of which Biomass 52.6 61.7 73.1 90.4 Electricity 41.2 54.9 77.5 104.6 -Of which Biomass 5.2 8.9 14.5 19.9

Transport 3.1 14.0 19.8 29.7 -Of which Biofuels 2.9 13.9 19.5 28.9 Based on the Renewable Energy Action Plans (NREAPs)
Wood Pellets
EU Production, Supply and Demand Table
Wood Pellets (1,000 MT) Calendar Year 2006 2007 2008 2009 2010 2011 2012c 2013c 2014c
Beginning Stocks 500 167 771 1244 620 999 777 877 907 Productiona 3,520 5,782 6,294 6,669 9,241 9,620c 10,000 10,150 10,300 Importsb 800 900 1,250 1,771 2,610 3,226 4,490 6,000 7,000 Exportsb 50 50 50 64 72 68 90 120 160 Consumptiona 4,603 6,028 7,021 9,000 11,400 13,000c 14,300 16,000 17,100 Ending Stocks 167 771 1,244 620 999 777 877 907 947 Production Capacity
Number of Plantsa 499 670c Capacitya 6,643 8,583 11,283 13,694 14,845 15,500c 16,000 16,200 16,400 Capacity Use (%) 53.0% 67.4% 55.8% 48.7% 62.2% 62.1% 62.5% 62.7% 62.8% Source: (a) The European Biomass Association (AEBIOM), (b) GTIS, (c) FAS Post Estimates The EU is the world’s largest wood pellets market, with a consumption of about 14.3 MMT of pellets in 2012 (see table
above). Driven by the EC mandates and Member State incentives, the demand is expected to expand further to about 17
MMT in 2014. Consumption forecasts for 2020 range from 35 MMT for Western Europe (Pöyry) to 50 – 80 MMT for the
total EU (AEBIOM). Future consumption will however, depend on a range of market and policy factors.
Main Pellet Producers (1,000 MT) Calendar Year 2007 2008 2009 2010 2011 2012
e 2013e
Germany 1,100 1,460 1,600 1,750 1,880 2,000 2,000 Sweden 1,360 1,580 1,580 1,650 1,340 1,340 1,350 Austria 700 625 695 850 940 890 950 Portugal - - 400 550 650 650 650 France 190 240 350 350 550 600 600 Italy 600 700 550 600 470 600 600 Poland 329 378 400 410 410 410 410 Total 5,782 6,294 6,669 9,241 9,620
e 10,000 10,150 Source: AEBIOM and Member State sector organisations, e = estimate EU FAS Posts. Germany and Sweden are the largest pellets producers in the EU. In 2011, Swedish production fell by about 300,000 MT.
The production cut has been partly replaced by competitive imports from the Baltic Region and Russia. During 2010, 2011
and 2012, Swedish imports have been increasing rapidly, mainly to the large-scale users. In the other major producing EU
Member States, production is expected to remain stagnant or increase only marginally. The weak investment climate and the
limited availability of feedstock supplies are constraining further capacity and production growth. The major raw material
for pellets has traditionally been sawdust and byproducts from sawmills. With the increasing competition for the sawdust
resources, a broader sustainable raw material basis is becoming necessary. There is an increased interest in forest residues,
wood waste and agricultural residues. In Central Europe some expansion is anticipated, mainly supplying the residential
heating market in that region. Capacity growth for supplying the demand in northwestern Europe will however not be
sufficient. Overall, EU wood pellet production is not expected to be able to keep up with the domestic demand. Consumption
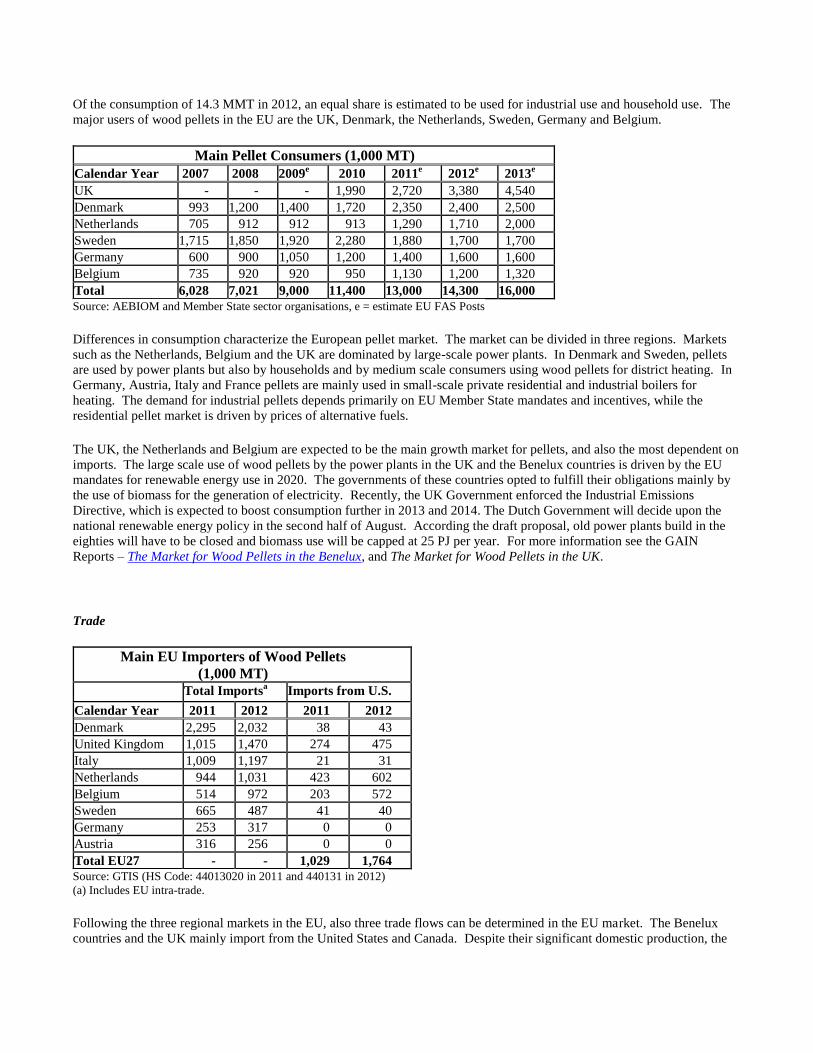
Of the consumption of 14.3 MMT in 2012, an equal share is estimated to be used for industrial use and household use. The
major users of wood pellets in the EU are the UK, Denmark, the Netherlands, Sweden, Germany and Belgium.
Main Pellet Consumers (1,000 MT) Calendar Year 2007 2008 2009
e 2010 2011e 2012
e 2013e
UK - - - 1,990 2,720 3,380 4,540 Denmark 993 1,200 1,400 1,720 2,350 2,400 2,500 Netherlands 705 912 912 913 1,290 1,710 2,000 Sweden 1,715 1,850 1,920 2,280 1,880 1,700 1,700 Germany 600 900 1,050 1,200 1,400 1,600 1,600 Belgium 735 920 920 950 1,130 1,200 1,320 Total 6,028 7,021 9,000 11,400 13,000 14,300 16,000 Source: AEBIOM and Member State sector organisations, e = estimate EU FAS Posts Differences in consumption characterize the European pellet market. The market can be divided in three regions. Markets
such as the Netherlands, Belgium and the UK are dominated by large-scale power plants. In Denmark and Sweden, pellets
are used by power plants but also by households and by medium scale consumers using wood pellets for district heating. In
Germany, Austria, Italy and France pellets are mainly used in small-scale private residential and industrial boilers for
heating. The demand for industrial pellets depends primarily on EU Member State mandates and incentives, while the
residential pellet market is driven by prices of alternative fuels. The UK, the Netherlands and Belgium are expected to be the main growth market for pellets, and also the most dependent on
imports. The large scale use of wood pellets by the power plants in the UK and the Benelux countries is driven by the EU
mandates for renewable energy use in 2020. The governments of these countries opted to fulfill their obligations mainly by
the use of biomass for the generation of electricity. Recently, the UK Government enforced the Industrial Emissions
Directive, which is expected to boost consumption further in 2013 and 2014. The Dutch Government will decide upon the
national renewable energy policy in the second half of August. According the draft proposal, old power plants build in the
eighties will have to be closed and biomass use will be capped at 25 PJ per year. For more information see the GAIN
Reports – The Market for Wood Pellets in the Benelux, and The Market for Wood Pellets in the UK.
Trade
Main EU Importers of Wood Pellets (1,000 MT)
Total Importsa Imports from U.S.
Calendar Year 2011 2012 2011 2012 Denmark 2,295 2,032 38 43 United Kingdom 1,015 1,470 274 475 Italy 1,009 1,197 21 31 Netherlands 944 1,031 423 602 Belgium 514 972 203 572 Sweden 665 487 41 40 Germany 253 317 0 0 Austria 316 256 0 0 Total EU27 - - 1,029 1,764 Source: GTIS (HS Code: 44013020 in 2011 and 440131 in 2012) (a) Includes EU intra-trade. Following the three regional markets in the EU, also three trade flows can be determined in the EU market. The Benelux
countries and the UK mainly import from the United States and Canada. Despite their significant domestic production, the
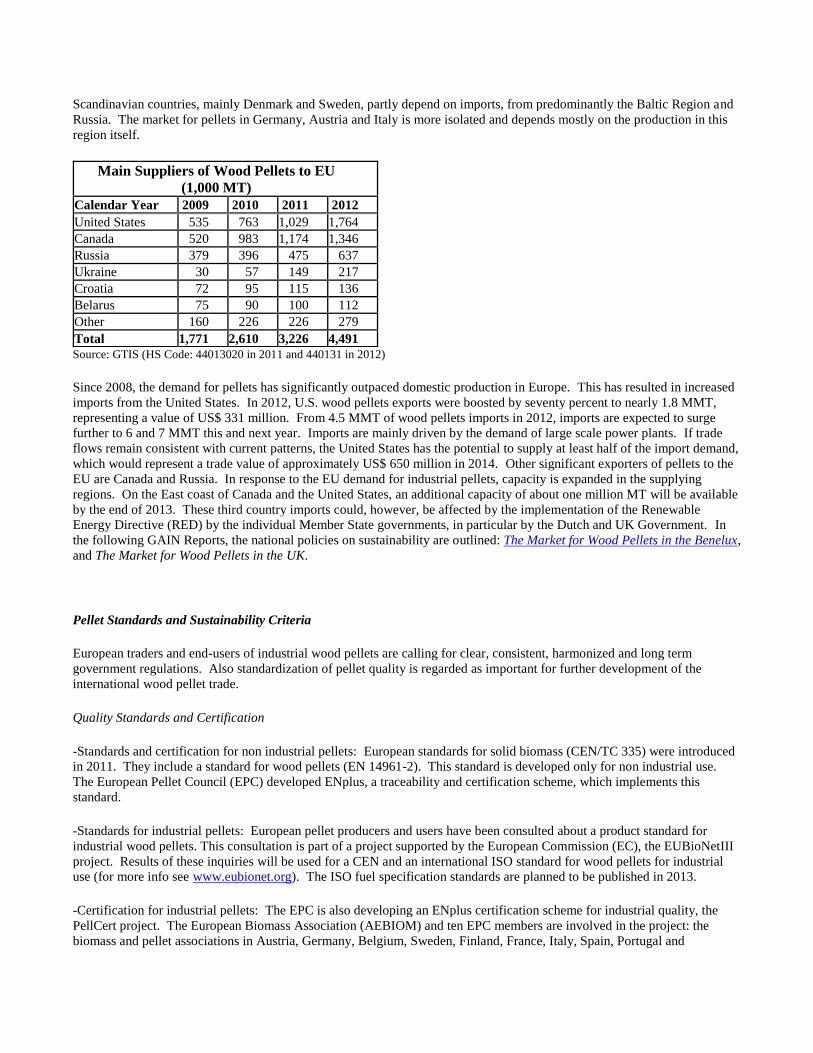
Scandinavian countries, mainly Denmark and Sweden, partly depend on imports, from predominantly the Baltic Region and
Russia. The market for pellets in Germany, Austria and Italy is more isolated and depends mostly on the production in this
region itself.
Main Suppliers of Wood Pellets to EU (1,000 MT)
Calendar Year 2009 2010 2011 2012 United States 535 763 1,029 1,764 Canada 520 983 1,174 1,346 Russia 379 396 475 637 Ukraine 30 57 149 217 Croatia 72 95 115 136 Belarus 75 90 100 112 Other 160 226 226 279 Total 1,771 2,610 3,226 4,491 Source: GTIS (HS Code: 44013020 in 2011 and 440131 in 2012) Since 2008, the demand for pellets has significantly outpaced domestic production in Europe. This has resulted in increased
imports from the United States. In 2012, U.S. wood pellets exports were boosted by seventy percent to nearly 1.8 MMT,
representing a value of US$ 331 million. From 4.5 MMT of wood pellets imports in 2012, imports are expected to surge
further to 6 and 7 MMT this and next year. Imports are mainly driven by the demand of large scale power plants. If trade
flows remain consistent with current patterns, the United States has the potential to supply at least half of the import demand,
which would represent a trade value of approximately US$ 650 million in 2014. Other significant exporters of pellets to the
EU are Canada and Russia. In response to the EU demand for industrial pellets, capacity is expanded in the supplying
regions. On the East coast of Canada and the United States, an additional capacity of about one million MT will be available
by the end of 2013. These third country imports could, however, be affected by the implementation of the Renewable
Energy Directive (RED) by the individual Member State governments, in particular by the Dutch and UK Government. In
the following GAIN Reports, the national policies on sustainability are outlined: The Market for Wood Pellets in the Benelux,
and The Market for Wood Pellets in the UK.
Pellet Standards and Sustainability Criteria European traders and end-users of industrial wood pellets are calling for clear, consistent, harmonized and long term
government regulations. Also standardization of pellet quality is regarded as important for further development of the
international wood pellet trade. Quality Standards and Certification -Standards and certification for non industrial pellets: European standards for solid biomass (CEN/TC 335) were introduced
in 2011. They include a standard for wood pellets (EN 14961-2). This standard is developed only for non industrial use.
The European Pellet Council (EPC) developed ENplus, a traceability and certification scheme, which implements this
standard. -Standards for industrial pellets: European pellet producers and users have been consulted about a product standard for
industrial wood pellets. This consultation is part of a project supported by the European Commission (EC), the EUBioNetIII
project. Results of these inquiries will be used for a CEN and an international ISO standard for wood pellets for industrial
use (for more info see www.eubionet.org). The ISO fuel specification standards are planned to be published in 2013. -Certification for industrial pellets: The EPC is also developing an ENplus certification scheme for industrial quality, the
PellCert project. The European Biomass Association (AEBIOM) and ten EPC members are involved in the project: the
biomass and pellet associations in Austria, Germany, Belgium, Sweden, Finland, France, Italy, Spain, Portugal and
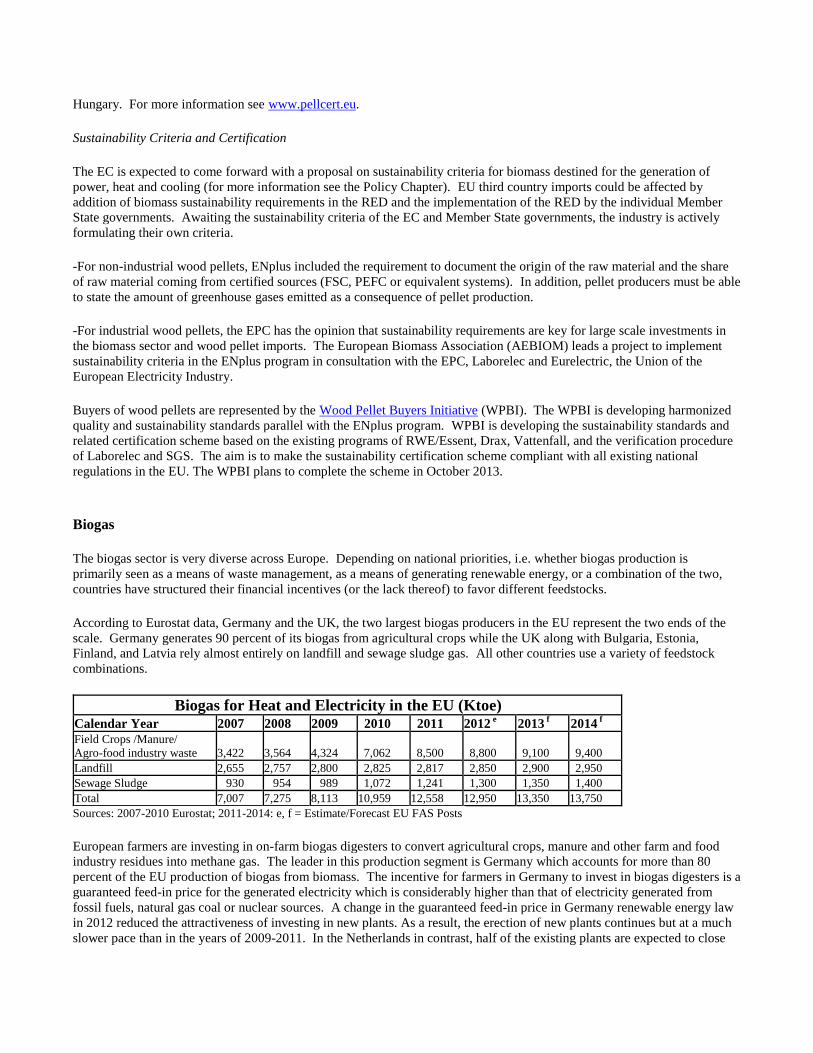
Hungary. For more information see www.pellcert.eu. Sustainability Criteria and Certification The EC is expected to come forward with a proposal on sustainability criteria for biomass destined for the generation of
power, heat and cooling (for more information see the Policy Chapter). EU third country imports could be affected by
addition of biomass sustainability requirements in the RED and the implementation of the RED by the individual Member
State governments. Awaiting the sustainability criteria of the EC and Member State governments, the industry is actively
formulating their own criteria. -For non-industrial wood pellets, ENplus included the requirement to document the origin of the raw material and the share
of raw material coming from certified sources (FSC, PEFC or equivalent systems). In addition, pellet producers must be able
to state the amount of greenhouse gases emitted as a consequence of pellet production. -For industrial wood pellets, the EPC has the opinion that sustainability requirements are key for large scale investments in
the biomass sector and wood pellet imports. The European Biomass Association (AEBIOM) leads a project to implement
sustainability criteria in the ENplus program in consultation with the EPC, Laborelec and Eurelectric, the Union of the
European Electricity Industry. Buyers of wood pellets are represented by the Wood Pellet Buyers Initiative (WPBI). The WPBI is developing harmonized
quality and sustainability standards parallel with the ENplus program. WPBI is developing the sustainability standards and
related certification scheme based on the existing programs of RWE/Essent, Drax, Vattenfall, and the verification procedure
of Laborelec and SGS. The aim is to make the sustainability certification scheme compliant with all existing national
regulations in the EU. The WPBI plans to complete the scheme in October 2013.
Biogas The biogas sector is very diverse across Europe. Depending on national priorities, i.e. whether biogas production is
primarily seen as a means of waste management, as a means of generating renewable energy, or a combination of the two,
countries have structured their financial incentives (or the lack thereof) to favor different feedstocks. According to Eurostat data, Germany and the UK, the two largest biogas producers in the EU represent the two ends of the
scale. Germany generates 90 percent of its biogas from agricultural crops while the UK along with Bulgaria, Estonia,
Finland, and Latvia rely almost entirely on landfill and sewage sludge gas. All other countries use a variety of feedstock
combinations.
Biogas for Heat and Electricity in the EU (Ktoe) Calendar Year 2007 2008 2009 2010 2011 2012
e 2013 f 2014
f Field Crops /Manure/ Agro-food industry waste 3,422 3,564 4,324 7,062 8,500 8,800 9,100 9,400 Landfill 2,655 2,757 2,800 2,825 2,817 2,850 2,900 2,950 Sewage Sludge 930 954 989 1,072 1,241 1,300 1,350 1,400 Total 7,007 7,275 8,113 10,959 12,558 12,950 13,350 13,750 Sources: 2007-2010 Eurostat; 2011-2014: e, f = Estimate/Forecast EU FAS Posts European farmers are investing in on-farm biogas digesters to convert agricultural crops, manure and other farm and food
industry residues into methane gas. The leader in this production segment is Germany which accounts for more than 80
percent of the EU production of biogas from biomass. The incentive for farmers in Germany to invest in biogas digesters is a
guaranteed feed-in price for the generated electricity which is considerably higher than that of electricity generated from
fossil fuels, natural gas coal or nuclear sources. A change in the guaranteed feed-in price in Germany renewable energy law
in 2012 reduced the attractiveness of investing in new plants. As a result, the erection of new plants continues but at a much
slower pace than in the years of 2009-2011. In the Netherlands in contrast, half of the existing plants are expected to close
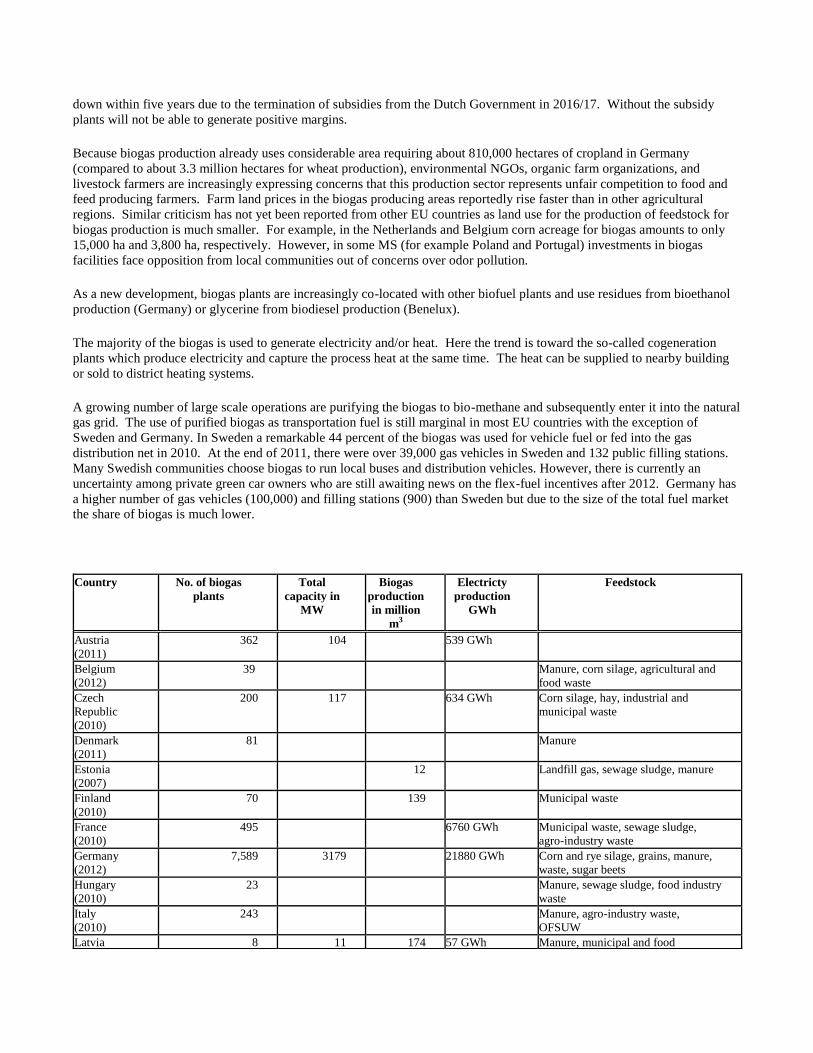
down within five years due to the termination of subsidies from the Dutch Government in 2016/17. Without the subsidy
plants will not be able to generate positive margins. Because biogas production already uses considerable area requiring about 810,000 hectares of cropland in Germany
(compared to about 3.3 million hectares for wheat production), environmental NGOs, organic farm organizations, and
livestock farmers are increasingly expressing concerns that this production sector represents unfair competition to food and
feed producing farmers. Farm land prices in the biogas producing areas reportedly rise faster than in other agricultural
regions. Similar criticism has not yet been reported from other EU countries as land use for the production of feedstock for
biogas production is much smaller. For example, in the Netherlands and Belgium corn acreage for biogas amounts to only
15,000 ha and 3,800 ha, respectively. However, in some MS (for example Poland and Portugal) investments in biogas
facilities face opposition from local communities out of concerns over odor pollution. As a new development, biogas plants are increasingly co-located with other biofuel plants and use residues from bioethanol
production (Germany) or glycerine from biodiesel production (Benelux). The majority of the biogas is used to generate electricity and/or heat. Here the trend is toward the so-called cogeneration
plants which produce electricity and capture the process heat at the same time. The heat can be supplied to nearby building
or sold to district heating systems. A growing number of large scale operations are purifying the biogas to bio-methane and subsequently enter it into the natural
gas grid. The use of purified biogas as transportation fuel is still marginal in most EU countries with the exception of
Sweden and Germany. In Sweden a remarkable 44 percent of the biogas was used for vehicle fuel or fed into the gas
distribution net in 2010. At the end of 2011, there were over 39,000 gas vehicles in Sweden and 132 public filling stations.
Many Swedish communities choose biogas to run local buses and distribution vehicles. However, there is currently an
uncertainty among private green car owners who are still awaiting news on the flex-fuel incentives after 2012. Germany has
a higher number of gas vehicles (100,000) and filling stations (900) than Sweden but due to the size of the total fuel market
the share of biogas is much lower.
Country No. of biogas
plants Total
capacity in
MW
Biogas
production
in million
m3
Electricty
production
GWh
Feedstock
Austria (2011)
362 104 539 GWh
Belgium (2012)
39 Manure, corn silage, agricultural and
food waste Czech
Republic (2010)
200 117 634 GWh Corn silage, hay, industrial and
municipal waste
Denmark (2011)
81 Manure
Estonia (2007)
12 Landfill gas, sewage sludge, manure
Finland (2010)
70 139 Municipal waste
France (2010)
495 6760 GWh Municipal waste, sewage sludge,
agro-industry waste Germany (2012)
7,589 3179 21880 GWh Corn and rye silage, grains, manure,
waste, sugar beets Hungary (2010)
23 Manure, sewage sludge, food industry
waste Italy (2010)
243 Manure, agro-industry waste,
OFSUW Latvia 8 11 174 57 GWh Manure, municipal and food
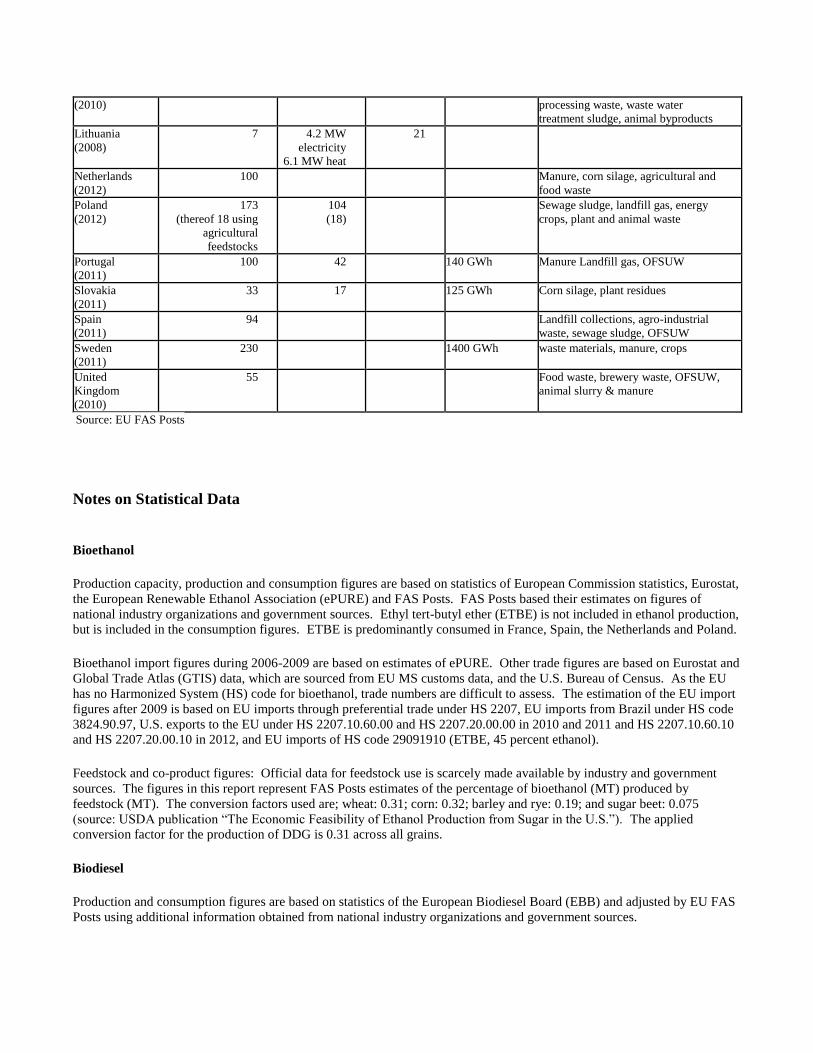
(2010) processing waste, waste water
treatment sludge, animal byproducts Lithuania
(2008) 7 4.2 MW
electricity 6.1 MW heat
21
Netherlands (2012)
100 Manure, corn silage, agricultural and
food waste Poland (2012)
173 (thereof 18 using
agricultural
feedstocks
104 (18)
Sewage sludge, landfill gas, energy
crops, plant and animal waste
Portugal (2011)
100 42 140 GWh Manure Landfill gas, OFSUW
Slovakia (2011)
33 17 125 GWh Corn silage, plant residues
Spain (2011)
94 Landfill collections, agro-industrial
waste, sewage sludge, OFSUW Sweden (2011)
230 1400 GWh waste materials, manure, crops
United
Kingdom (2010)
55 Food waste, brewery waste, OFSUW,
animal slurry & manure
Source: EU FAS Posts
Notes on Statistical Data
Bioethanol Production capacity, production and consumption figures are based on statistics of European Commission statistics, Eurostat,
the European Renewable Ethanol Association (ePURE) and FAS Posts. FAS Posts based their estimates on figures of
national industry organizations and government sources. Ethyl tert-butyl ether (ETBE) is not included in ethanol production,
but is included in the consumption figures. ETBE is predominantly consumed in France, Spain, the Netherlands and Poland. Bioethanol import figures during 2006-2009 are based on estimates of ePURE. Other trade figures are based on Eurostat and
Global Trade Atlas (GTIS) data, which are sourced from EU MS customs data, and the U.S. Bureau of Census. As the EU
has no Harmonized System (HS) code for bioethanol, trade numbers are difficult to assess. The estimation of the EU import
figures after 2009 is based on EU imports through preferential trade under HS 2207, EU imports from Brazil under HS code
3824.90.97, U.S. exports to the EU under HS 2207.10.60.00 and HS 2207.20.00.00 in 2010 and 2011 and HS 2207.10.60.10
and HS 2207.20.00.10 in 2012, and EU imports of HS code 29091910 (ETBE, 45 percent ethanol). Feedstock and co-product figures: Official data for feedstock use is scarcely made available by industry and government
sources. The figures in this report represent FAS Posts estimates of the percentage of bioethanol (MT) produced by
feedstock (MT). The conversion factors used are; wheat: 0.31; corn: 0.32; barley and rye: 0.19; and sugar beet: 0.075
(source: USDA publication “The Economic Feasibility of Ethanol Production from Sugar in the U.S.”). The applied
conversion factor for the production of DDG is 0.31 across all grains. Biodiesel Production and consumption figures are based on statistics of the European Biodiesel Board (EBB) and adjusted by EU FAS
Posts using additional information obtained from national industry organizations and government sources.

Trade figures are based on Global Trade Atlas (GTA) data, which are sourced from EU MS customs data, and the U.S.
Bureau of Census, and adjusted for U.S. exports of biodiesel blends. A specific customs code for pure biodiesel (B100) and
biodiesel blends down to B96.5 (HS 3824.90.91) was first introduced in the EU in January 2008. In January 2012 the code
was changed to HS 3826.00.10 for blends containing at least 96.5 percent biodiesel and HS 2710.20.11 for blends containing
at most 30 percent biodiesel. In this report is assumed that these two codes represent a blend of 99 and 5 percent,
respectively. Prior to 2008, biodiesel entering the EU was subsumed under the CN code 38.24.90.98 (other chemicals). CN stands for
“Combined Nomenclature” and is the equivalent of the “Harmonized System” used in the United States. Therefore,
biodiesel imports prior to 2008 are estimated based on industry information. The U.S. Bureau of the Census introduced HTS
export code 3824.90.40.30 in January 2011 which exclusively covers pure biodiesel (B100) and biodiesel blends above B30. Feedstock and co-product figures: Data for feedstock use is not available. The figures in this report represent estimates by
EU FAS posts.
Abbreviations and definitions used in this report Benelux = Belgium, the Netherlands and Luxembourg Biodiesel = Fatty acid methyl ester produced from agricultural feedstock (vegetable oils, animal fat, recycled cooking oils)
used as transport fuel to substitute for petroleum diesel
Bioethanol = Ethanol produced from agricultural feedstock used as transport fuel BtL = Biomass to Liquid
Bxxx = Blend of mineral diesel and biodiesel with the number indicating the percentage of biodiesel in the blend, e.g. B100
equals 100% biodiesel, while B5 equals 5% biodiesel and 95% conventional diesel. CEN = European Committee for Standardization (Comité Européen de Normalisation) DDG = distillers dried grains EBB = European Biodiesel Board
Exxx = Blend of mineral gasoline and bioethanol with the number indicating the percentage of bioethanol in the blend, e.g.
E10 equals 10% bioethanol and 90% conventional gasoline. GHG = greenhouse gas GJ = Gigajoule = 1,000,000,000 Joule or 1 million KJ Ha = Hectares, 1 hectare = 2.471 acres HS = Harmonized System of tariff codes HVO = Hydrotreated Vegetable Oil Ktoe = 1000 MT of oil equivalent = 41,868 GJ = 11.63 GWh MJ = Megajoule MMT = Million metric tons MS = Member State(s) of the EU MT = Metric ton (1,000 kg) Mtoe = Million tons of oil equivalent MWh = Mega Watt hours = 1,000 Kilo Watt hours (KWh) MY = Marketing Year NMS = New Member State(s) = Countries that joined the EU in/after 2004 Nordics = Denmark, Sweden, Finland, Norway and Iceland PVO = Pure vegetable oil used as transport fuel RME = Rapeseed Methyl Ester Toe = Tons of oil equivalent = 41,868 MJ = 11.63 MWh TWh = Tera Watt hours = 1 billion Kilo Watt hours (KWh) US$ = U.S. Dollar Energy content and Conversion rates [1] : Gasoline = 43.10 MJ/kg = 43.1 GJ/MT
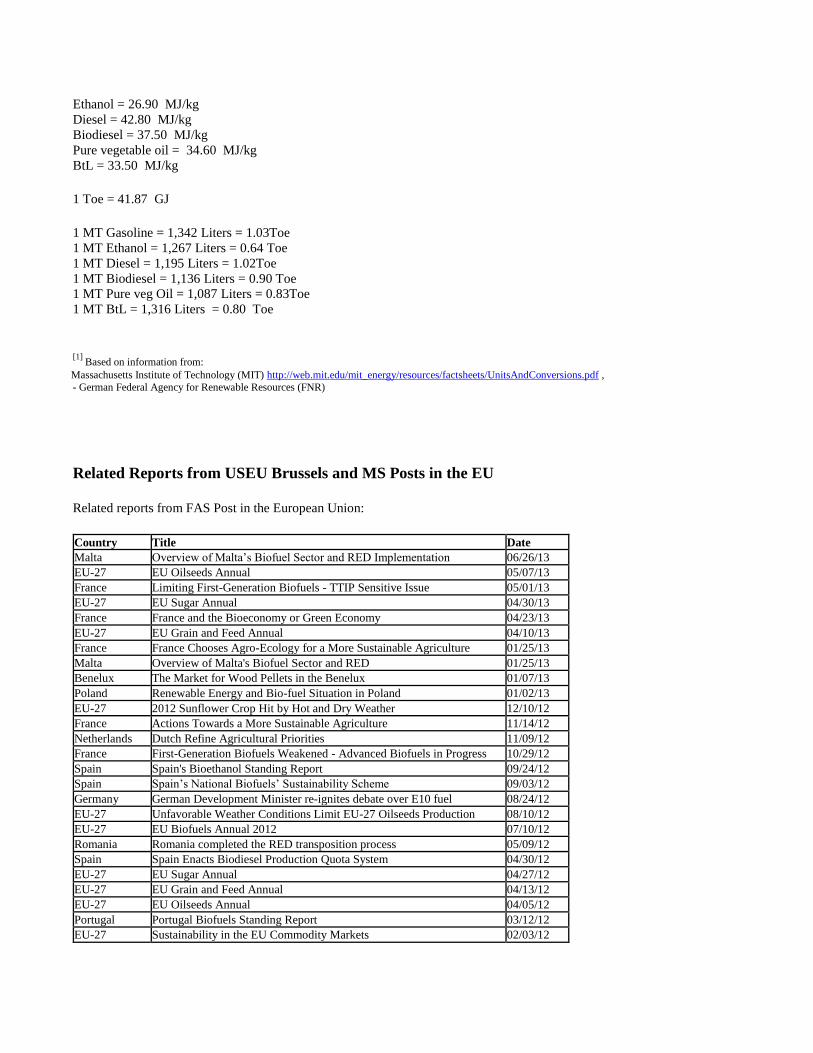
Ethanol = 26.90 MJ/kg Diesel = 42.80 MJ/kg Biodiesel = 37.50 MJ/kg Pure vegetable oil = 34.60 MJ/kg BtL = 33.50 MJ/kg 1 Toe = 41.87 GJ 1 MT Gasoline = 1,342 Liters = 1.03Toe 1 MT Ethanol = 1,267 Liters = 0.64 Toe 1 MT Diesel = 1,195 Liters = 1.02Toe 1 MT Biodiesel = 1,136 Liters = 0.90 Toe 1 MT Pure veg Oil = 1,087 Liters = 0.83Toe 1 MT BtL = 1,316 Liters = 0.80 Toe
[1] Based on information from:
- Massachusetts Institute of Technology (MIT) http://web.mit.edu/mit_energy/resources/factsheets/UnitsAndConversions.pdf , - German Federal Agency for Renewable Resources (FNR)
Related Reports from USEU Brussels and MS Posts in the EU Related reports from FAS Post in the European Union: Country Title Date Malta Overview of Malta’s Biofuel Sector and RED Implementation 06/26/13 EU-27 EU Oilseeds Annual 05/07/13 France Limiting First-Generation Biofuels - TTIP Sensitive Issue 05/01/13 EU-27 EU Sugar Annual 04/30/13 France France and the Bioeconomy or Green Economy 04/23/13 EU-27 EU Grain and Feed Annual 04/10/13 France France Chooses Agro-Ecology for a More Sustainable Agriculture 01/25/13 Malta Overview of Malta's Biofuel Sector and RED 01/25/13 Benelux The Market for Wood Pellets in the Benelux 01/07/13 Poland Renewable Energy and Bio-fuel Situation in Poland 01/02/13 EU-27 2012 Sunflower Crop Hit by Hot and Dry Weather 12/10/12 France Actions Towards a More Sustainable Agriculture 11/14/12 Netherlands Dutch Refine Agricultural Priorities 11/09/12 France First-Generation Biofuels Weakened - Advanced Biofuels in Progress 10/29/12 Spain Spain's Bioethanol Standing Report 09/24/12 Spain Spain’s National Biofuels’ Sustainability Scheme 09/03/12 Germany German Development Minister re-ignites debate over E10 fuel 08/24/12 EU-27 Unfavorable Weather Conditions Limit EU-27 Oilseeds Production 08/10/12 EU-27 EU Biofuels Annual 2012 07/10/12 Romania Romania completed the RED transposition process 05/09/12 Spain Spain Enacts Biodiesel Production Quota System 04/30/12 EU-27 EU Sugar Annual 04/27/12 EU-27 EU Grain and Feed Annual 04/13/12 EU-27 EU Oilseeds Annual 04/05/12 Portugal Portugal Biofuels Standing Report 03/12/12 EU-27 Sustainability in the EU Commodity Markets 02/03/12

Italy Italian Biofuels 2011 01/13/12
The GAIN Reports can be downloaded from the following FAS website: http://gain.fas.usda.gov/Pages/Default.aspx
Related Documents