Biofuel from Coconut Resources in Rotuma A Feasibility Study on the Establishment of an Electrification Scheme using local Energy Resources By Gerhard Zieroth, Leba Gaunavinaka and Wolf Forstreuter September 2007

Welcome message from author
This document is posted to help you gain knowledge. Please leave a comment to let me know what you think about it! Share it to your friends and learn new things together.
Transcript

Biofuel from Coconut Resources in Rotuma A Feasibility Study on the Establishment of an Electrification Scheme using local Energy Resources
By Gerhard Zieroth, Leba Gaunavinaka and Wolf Forstreuter September 2007

2
Acknowledgements This study has been realised within the framework of the Pacific Island Energy Policy and Strategic Action Planning Project (PIEPSAP) that is funded by the Government of Denmark under the European Union Energy Initiative. The authors would like to express their gratitude to the donor. We would also like to acknowledge the guidance and support provided by UNDP Samoa, which acts as the implementing agency for the PIEPSAP Project. The authors would also like to thank Dr John Fatiaki and his wife Mrs Sineva Fatiaki for their hospitality during our fieldwork on Rotuma. Without their contributions, support and encouragement this study would not have been possible. We would also like to express our gratitude to the numerous residents of Rotuma who have provided information and support in many ways and who have demonstrated a truly remarkable hospitality during our field research. Lastly we would also like to acknowledge the contributions of Daniel Fuerstenwerth and Andy Hamm who have shared the findings of their respective renewable energy research with us. Disclaimer
The findings, interpretations and conclusions expressed are entirely those of the authors G. Zieroth, L. Gaunavinaka and Dr. W. Forstreuter and should not be attributed in any manner to SOPAC, the Government of Fiji or Rotuman authorities. Circulation of Draft Report A draft version of this report has been circulated to SOPAC staff, the Fiji Department of Energy, the Coconut Development Authority and members of the Rotuma Island Council for comment. We appreciate the feedback received from Jan Cloin, SOPAC and we would like to thank Lala Bukarau of SOPAC for editing this publication.

3
Executive Summary Located 640 km North North West of Fiji’s capital Suva, Rotuma is Fiji’s remotest island. Disruptions in fuel supply and high supply cost for fuel have triggered interest to develop local coconut resources and other renewable energies. In 2005 an electrification project using coconut oil as a fuel was proposed under the regional Renewable Energy and Energy Efficiency Project (REEP) of the Asian Development Bank (ADB). ADB was unable to fund such a study and Fiji Government (DoE) requested the Pacific Islands Energy Policy and Strategic Action Planning Project (PIEPSAP) to assist in carrying out further studies. In June 2006 it was agreed between ADB, DoE and PIEPSAP to further investigate the feasibility of biofuels and other renewable energy resources. In response, PIEPSAP with support from the European Union- funded project “Reducing Vulnerability of Pacific ACP States” conducted field research on Rotuma and compiled the presented study. The results of the study are summarized below: Energy Demand Rotuma currently consumes a total of 300,000 litres of liquid fuels per annum. Diesel accounts for 185,000 litres alone followed by 45,600 litres of Multi-Purpose Kerosene and 36,000 litres of premix. All fuel is imported in 200 Litre drums with local prices in 2007 being well above F$ 2 per litre of product. Demand is expected to increase moderately over the next 10 years. Electricity generation consumes 85% of the diesel on the island with water pumping being the single most important use. Electricity generation capacity is approximately 480 kVA with water pumping accounting for approximately. 150 kVA and 330 kVA is distributed in numerous small size generators that power village mini grids. Electricity generation is plagued by high specific fuel consumption, frequent breakdowns of generation equipment and logistical difficulties to maintain and repair generators. Local Energy Resources Rotuma’s local energy resources include a good solar radiation with monthly averages never dropping below 5 kWh/m2/day. First indications from an ongoing wind-monitoring programme show average wind speeds above 5 m/s predominantly from the east. A full year monitoring is required to conclude if wind is a viable option for Rotuma. A detailed analysis of the coconut resources on Rotuma revealed a total production of 7.5 million nuts per annum of which approximately 5 million nuts are considered to be harvestable. Making allowances for traditional local consumption in the order of 1.5 million nuts leaves a potential of 3.5 million nuts available for other uses such as copra and/or coconut oil production. 3.5 million nuts could produce 2100 metric tons of wet copra or 1,155 tons of dry copra. This represents a coconut oil (CNO) production potential of 635 metric tons or 690,000 litres of CNO per annum. This represents a diesel equivalent of approximately 635,000 litres or more than three times the estimated annual diesel fuel consumption of 184,000 litres. The production of CNO could be significantly increased through a rehabilitation

4
programme that would include replanting and refurbishment of old plantations. Biofuel Production As copra production for export off island is still part of Rotuma’s economy, the use of copra for local oil production is feasible on Rotuma. CNO production should be done using small modular milling equipment that minimises risk and allows expansion of local oil production in line with demand. Production cost for a 100,000 litre per annum privately-owned and operated unit are estimated at F$ 1.5 per litre or F$ 1.63 per litre of diesel equivalent considering the lower heating value of CNO. Production costs are based on current roadside prices for green copra of 0.12 F$/kg, investment cost of F$ 150,000 for a mini mill, labour cost of 3 F$/hour and 23,000 kWh/a of electricity use for milling. Production cost could be decreased through the establishment of the oil mill as a community project where feedstock would be supplied by the beneficiaries of energy services. Further reduction in cost could be achieved through a grant contribution either from a donor or from an institution such as CIDA. Under favourable conditions production cost as low as F$ 1 per litre seems achievable. Use of CNO as Fuel Most unmodified compression ignition engines run on clean CNO as long as ambient temperatures stay above the solidification point of 24oC. This should by no means be taken as a recommendation to just go ahead and use CNO instead of diesel as serious damage to equipment is likely to occur due to some fuel characteristics of CNO that significantly deviate from the specifications for diesel. In most cases modifications of fuel systems and engines is required to allow medium- and long-term operation of a vehicle or a generator on CNO. Modifications may include fuel heating, additional filtration, installation of dual-tank systems, replacement of injector nozzles and injector pumps. CNO use also requires additional operation cost such as more frequent service of engines and more frequent replacement of fuel and oil filters and monitoring of engine oil quality. Best results can be expected for applications where engines are consistently operated under high loads and high operating temperatures. Such conditions can be easily maintained in water pumping which is by far the largest single diesel consumer on the island. Village electricity supply serving only peak times provides another opportunity for high engine loading provided the generators are sized properly. Our benefit-cost comparison shows that the use of CNO as a substitute fuel is financially viable as long as the supply cost for a litre of diesel are approximately F$ 0.40 to 0.50 higher than supply cost of a litre of CNO. At current supply cost for diesel well above F$ 2 per litre this condition is met, i.e. CNO use is feasible. The best case with respect to benefit-cost ratio is a centralised power supply based on a specifically-designed CNO power plant, which would serve the entire island of Rotuma. For such an application to be viable a price difference of only F$ 0.11 between the supply cost of diesel and the supply cost of CNO would be required. In order to gain further empirical data on CNO production and use, a community pilot project will be funded under PIEPSAP.

5
Abbreviations and Acronyms ACP African, Caribbean and Pacific countries (associated with EU) ADB Asian Development Bank ADO Automotive Diesel Oil BS British Standards CC Commerce Commission CI Compression Ignition CIDA Coconut Industry Development Authority CNO Coconut Oil CNOME Coconut Oil Methyl Ester DoE Department of Energy DI Direct Injection DME Direct Micro Expeller FEA Fiji Electricity Authority FJ$ Fiji dollar GoF Government of the Republic of the Fiji Islands GWh Gigawatt hour Ha Hectare = 10,000 m2 ICB International Competitive Bidding IPP Independent Power Producer IRR Internal Rate of Return kL Kilolitres kV Kilovolt kVA Kilovolt Ampere kW Kilowatt (1000 Watts) kWh Kilowatt Hour (Unit of electricity measured and billed) MPK Multi Purpose Kerosene (Jet A 1) MPE Ministry of Public Enterprises and Public Sector Reform MT Metric ton (1000 kg) MTC Ministry of Trade and Commerce MW Megawatt MWh Megawatt Hour MWE Ministry of Works and Energy NPV Net Present Value O&M Operation and Maintenance PIB Prices and Incomes Board PIC Pacific Island Country PIEPSAP Pacific Island Energy Policy and Strategic Action Planning PPP Public Private Partnership PWD Public Works Department RESCO Renewable Energy Service Company REEP Renewable Energy and Energy Efficiency Program Pacific RIC Rotuma Island Council RIL Rotuma Investment Limited SFC Specific Fuel Consumption l/kWh SOPAC Secretariat for the Pacific Islands Applied Geoscience Commission SWER Single Wire Earth Return TFL Telecom Fiji Limited UNDP United Nations Development Programme

6
ULP Unleaded Petrol VCO Virgin Coconut Oil
Heating Value of Fuels
Density Density Gross Energy Gross Energykg / litre l / tonne MJ / kg MJ / litre per GJ per litre
Coconut oil 0.92 1,100 38.4Biodiesel 0.89 1,124 40 35.6LPG 0.51 1,960 49.6 25.5 59.4 1.6Gasoline 0.735 1,360 46.5 34.2 73.9 2.5MPK 0.795 1,260 46.4 36.9 70.4 2.6Automotive diesel(ADO)
0.84 1,190 46 38.6 70.4 2.7
High sulphur fuel oil(IFO)
0.98 1,020 42.9 42 81.5 3.4
litres / kWh: Efficiency:0.46 0.22
0.35 0.31
0.284 0.36
0.30 - 0.33 28% - 32%Average efficiency of low speed, base load diesel (Pacific region)
Best practice, good load management small diesel
Diesel Conversion Efficiency:
Fuel CharacteristicsVegetable & Mineral Fuels:
Efficiencies and SFCsAverage efficiency for small diesel engine (< 100kW output)
Fuelkk CO2 equivalent
Average efficiency of large modern diesel engine(> 1000 kW output)

7
Table of Contents
Acknowledgements 2
Disclaimer 2
Circulation of Draft Report 2
Executive Summary 3
Abbreviations and Acronyms 5
Heating Value of Fuels 6
1.0 Introduction 10
1.1 Background 10
1.2 Objectives 10
1.3 Methodology 11
1.4 The Report 12
2.0 The Island of Rotuma 13
2.1 General Setting 13
2.2 Demography 14
2.3 History 14
2.4 Physical Characteristics 15
2.5 Infrastructure and Transport 16 2.5.1 Road Network 16 2.5.2 Water Supply 17 2.5.3 Air and Maritime Transport 18 2.5.4 Telecommunications 19
2.6 Local Government 19 2.6.1 District Administration 19 2.6.2 Central Administration 20 2.6.3 Rotuma Investment Limited 21
2.7 Tradition and Culture 21
2.8 Rotuma’s Economy 22
3.0 Rotuma’s Energy Sector 24
3.1 Energy in Rotuma’s Economy 24
3.2 Petroleum Products 25
3.3 Electricity 27 3.3.1 Government Station Ahau 27 3.3.2 Village Electrification 28

8
3.4 Traditional Fuels 32
4.0 Coconut Resource Analysis 33
4.1 Methodology 33
4.2 Stratification of Coconut Cover 33
4.3 Coconut Palm Density 35
4.4 Yields 38
4.5 Available Coconuts 39 4.5.1 Accessibility 39 4.5.2 Traditional Uses 40 4.5.3 Copra Yields 41 4.5.4 Harvesting Trials 42
4.6 Historic and Current Copra Production 43
5.0 Other Local Energy Resources 45
5.1 Wind Energy 45
5.2 Solar Energy 46
5.3 Ocean Energy 47 5.3.1 Ocean Thermal Energy Conversion 47 5.3.2 Wave Energy 47 5.3.3 Ocean Currents 48
6.0 Feasibility of CNO as a Diesel Substitute 49
6.1 General Considerations 49
6.2 Energy Demand Projections for Rotuma 49 6.2.1 Electricity 50 6.2.2 Liquid Fuels 51
6.3 Technologies Using Local Energy Resources 52 6.3.1 Solar 52 6.3.2 Wind 53
6.4 CNO as a Diesel Substitute 54 6.4.1 Oil Production 55 6.4.2 CNO in Compression Ignition Engines 57 6.4.3 Adapted Utilisation Pattern 58 6.4.4 Adapted Engines 58 6.4.5 Adaptation of Fuel 60
7.0 Economics of CNO based Fuels 62
7.1 CNO Production Cost 62 7.1.1 Assumptions 62

9
7.1.2 Cost per Litre CNO 63 7.2 Cost of Using CNO 64
7.2.1 Retrofitting Cost 66 7.2.2 Operating Cost 68 7.2.3 Repair and Overhaul 68
7.3 Benefit-Cost Comparison 69
7.4 Alternative Uses of Locally-Produced CNO 73
7.5 Economic Considerations 75
8.0 Project Design 77
8.1 Project Goal 77
8.2 Project Objectives 78
8.3 Project Preparation and Pilot Phase 79 8.3.1 Partner Contributions 79 8.3.2 Community Consultation 80
8.4 Full Scale Project 81 8.4.1 CNO Production 81 8.4.2 Central Power Generation 82 8.4.3 Inclusion of Wind Generators 84 8.4.4 High Voltage Distribution System 85
8.5 Institutional Issues 88
9.0 Environmental Issues 90
9.1 Legal Context 90
9.2 Proposed Project 92
9.3 Use of CNO 92
9.4 Global Environmental Considerations 93
9.5 Global Social Impacts 94
10.0 Conclusions and Recommendations 95
10.1 General 95
10.2 Methodologies 95
10.3 Local Energy Resources 95
10.4 Biofuel Production 96
10.5 Use of CNO as Fuel 96
10.6 Next Steps 97
Annex 1: Selected Bibliography 99

10
1.0 Introduction
1.1 Background
Rotuma is Fiji’s remotest island (see Figure 2). It is located 640 km North North West of Fiji’s capital Suva from where it is supplied with all essential goods including fuel. High supply cost for fuel and disruptions in supply have triggered interests to develop local coconut resources and other renewable energies as alternatives. In 2005 an electrification project using coconut oil as a fuel was proposed under the regional Renewable Energy and Energy Efficiency Project (REEP) of the Asian Development Bank (ADB). Originally submitted to REEP by the Coconut Industry Development Authority (CIDA) in October 2004, the Fiji Department of Energy (DoE) did not initially support the concept, preferring to develop 100% electrification on the island of Moala by renewable energy. The Steering Committee established for REEP, however, approved the concept in February 2005 and DoE agreed to provide support to the CIDA-proposed Rotuma biofuel electrification project. Thereafter Burgeap consultants performed an initial investigation under the REEP project. The consultants concluded that a feasibility study needed to be carried out and estimated the cost of such a study to be in the order of US$ 650,000.
ADB was unable to fund such a study and Fiji Government (DoE) requested the Pacific Island Energy Policy and Strategic Action Planning Project1 (PIEPSAP) to assist in carrying out further studies. In June 2006 it was agreed between ADB, DoE and PIEPSAP to further investigate the feasibility of biofuels using resources from both PIEPSAP and the European Union funded project “Reducing Vulnerability of Pacific ACP States”.
1.2 Objectives
The feasibility study presented here has multiple objectives. Firstly, the feasibility of an electrification project using locally-produced biofuel is to be comprehensively assessed inclusive of technical, economic, socio-economic, environmental and institutional aspects. Secondly, the study aims to establish a model for such assessments while a number of similar project concepts are currently being contemplated in Pacific Island Countries (PICs). As some biofuel projects in the Pacific region have shown disappointing results, it appears essential to demonstrate an approach to feasibility investigations that is cost-effective and at the same time able to deliver analytical depth that reduces project risks to levels acceptable to private sector investors, the financing and donor communities. In order to rationalise field surveys and planning work, a
1 PIEPSAP is a technical assistance project funded by the Government of Denmark under
the European Union Energy Initiative
11
significant part of the investigations undertaken in the framework of this study is based on the use of high-resolution satellite data and GIS software. Thus, a third objective of the model study relates to the test and demonstration of state-of-the-art Remote Sensing and GIS technology in resource assessments and infrastructure planning. An additional objective of the study relates to the effectiveness of inter-disciplinary applied research. The report demonstrates how interdisciplinary teamwork can push the frontier of knowledge management and methodological innovation further towards more efficient tools in comprehensive energy planning approaches.
1.3 Methodology
In order to achieve the objectives stated above, the study draws on existing work on biofuels. We have updated and supplemented it as necessary. The methodology aims at formulating a project that:
• optimises investments and resources in Rotuma; • minimizes risk through a phased development approach; • meets least-cost and benefit maximisation objectives; • attracts private sector participation; • recognizes the need to deliver benefits to the disadvantaged and to
do so in a way that does not compromise financial and economic performance of potential investors;
• is consistent with institutional, economic, social, environmental and legal constraints at national and community levels;
• acknowledges the experiences made with rural energy supply and rural electrification in Fiji and elsewhere;
• strikes an appropriate balance between conflicting goals of Government, investors, consumers, financiers, affected communities and other stakeholders.
The focus of the study is the energy supply situation in Rotuma. A diagnostic review identifies weaknesses and strengths of the current energy system and assesses solutions to the problems identified in a comprehensive manner. We also analyse how the current performance of the islands energy system impacts on other infrastructure services such as water supply and transport. In the next analytical step, we assess the resource potential of coconuts that can be harvested on Rotuma. Our methodology for the assessment is based on high-resolution satellite imagery (QuicBbird) and classification of identifiable coconut palm associations verified by ground truthing. This assessment yields quantitative data on the resource potential that could be harvested and locally processed. We then attempt to answer the question of how the coconut resource of the island can be best used to improve the living of ordinary Rotumans on the island. We do not restrict our analysis to the production of a substitute fuel but attempt to comprehensively assess all possible downstream uses. Following a comprehensive approach is crucial in light of the fact that even though Rotuma’s isolation creates a niche market situation, the shadow of the world market nevertheless falls on the
12
island. Sustainability of a project can only be achieved if solutions implemented are not only technically and institutionally feasible but also financially sound in the context of changing world market prices for the commodities involved. Against this background one of the challenges in analysing the financial and economic feasibility of biofuel is of course the significant uncertainty with respect to the projection of future prices for fossil fuels against which biofuel must compete. At the same time coconut oil (CNO), the feedstock for biofuel production is also subject to significant price fluctuations as a commodity traded on the world market. Moreover, there are secondary markets for coconut oils. High-quality oils such as Virgin Coconut Oil (VCO) have significantly higher value than crude CNO as a commodity. Therefore the study aims to systematically assess these alternative options in a comparative analysis using the Internal Rate of Return (IRR) as a benchmark. The report is based on a field survey performed by the authors from 19th July to 2nd August 2006. We have consulted a number of residents of Rotuma on subjects such as infrastructure performance, energy supply and coconut. In order to acknowledge the uniqueness of Rotuma’s agricultural systems, we have also conducted a number of trials and tests to collect empirical data on copra and oil yields, harvesting methods and harvesting costs. Additional field research was performed by Andy Hamm2 a PhD student of the University of Canterbury. Results of this research have been used in this report. While focussing on Rotuma as a case study, we have considered both international and regional experiences with biofuels in general and with coconut oil in particular.
1.4 The Report
The report presented here aims to be concise and comprehensive. We have tried to avoid re-iterating non-controversial or trivial issues about rural energy supply in general and biofuels in particular. We also try to refer the reader to other documents and reports where we believe that it would unnecessarily inflate our report to cite these sources at length. Section 2 provides a brief description of the island of Rotuma. It focuses on the features that are relevant for the project. Section 3 contains a description of Rotuma’s energy sector including the fuel supply chain power generation and the use of alternative energies. Section 4 assesses the coconut resource potential in detail. Section 5 examines other local renewable energy resources that could contribute to a sustainable energy supply for Rotuma and Section 6 examines the feasibility of CNO production and use. Section 7 assesses the economics of CNO as a substitute fuel. Section 8 summarises the design for both a pilot and a full-scale project. Section 9 assesses environmental impacts and Section 10 provides conclusions and recommendations.
2 PIEPSAP supported Andy Hamm’s field work in Rotuma through a research grant
13
2.0 The Island of Rotuma
2.1 General Setting
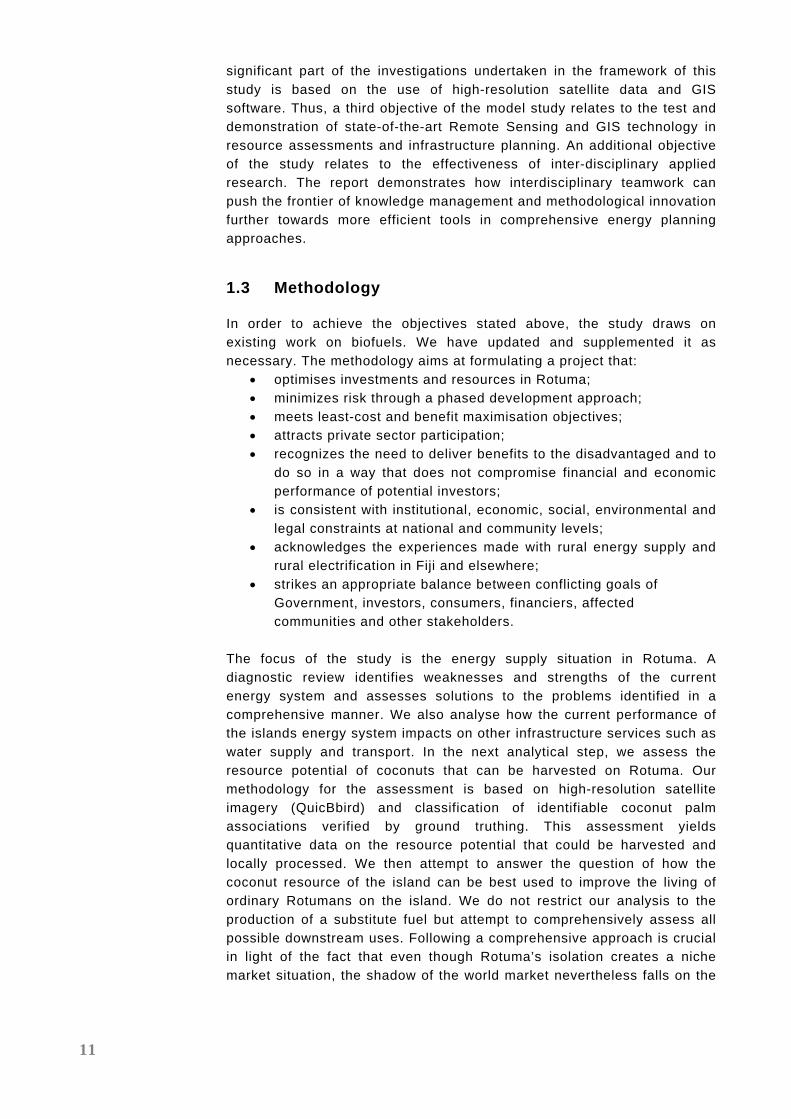
The island of Rotuma is located approximately 600 km to the north of Fiji’s capital Suva. It is located approximately 450km south of Tuvalu, 350 km to the west of Futuna, and over 700 km to the east of Vanuatu. Rotuma shares many characteristics with other small islands within and outside the Pacific region. Commonalities include remoteness, lack of reliable transport links, limited land-based resources, low capacity to exploit large exclusive economic zones (EEZs), dependence on a narrow range of primary commodities, exposure to natural disasters and difficult access to capital and other markets and the emigration of scarce managerial and entrepreneurial skills. On the other hand Rotuma is unique with its own historical, cultural, economic and social distinctiveness.
Figure 1: Rotuma is the furthest Island in the north of the Fiji group (Source: http://www2.hawaii.edu/oceanic/rotuma/os/hanua.html).

14
The island's geographical position places it very near to the junction of the boundaries of Micronesia, Melanesia and Polynesia, and influence from each of these areas can be found in the ethnic composition, language and culture of Rotumans.
2.2 Demography
The majority of Rotumans (10,000) now live off island either elsewhere in Fiji or abroad. Rotuma itself has a total population of about 2400. During Christmas/New Year’s holiday period the population can increase to 2800 depending on availability of transport. Villages are located along the coastline while the hilly interior is uninhabited except for some temporary shelters used by agriculturalists during fieldwork. The following Table 2 provides an overview of Rotuma’s current population by district. Altogether there are 15 main villages, some of which are divided in sub-villages.
Table 1: Rotuma’s Population by District District Population Households % Noa’atau 311 79 15 Oinafa 287 74 14 Malhaha 277 58 11 Itu’ti’u 887 192 37 Itu’mutu 165 33 6 Pepjei 167 30 6 Juju 296 59 11 Total 2,387 525 100
Source: Rotuma Island Council
2.3 History
Captain Edward Edwards on H.M.S. Pandora discovered Rotuma in 1791 while searching for the mutineers of the Bounty. The ship landed in Rotuma to restock supplies. The first half of the I9th century was a time of increasing contact with Europeans. Whalers replenished their provisions; labour recruiters engaged scores of young men to work on plantations in the Pacific. Rotumans joined visiting ships as crew members and sailed the high seas. In the second half of the I9th century, missionaries from the Wesleyan and Roman Catholic Churches established themselves and religious factionalism started to occur. Tensions between the Wesleyans and Catholics led to hostilities between the two groups. In order to calm the situation the paramount chiefs of Rotuma’s seven districts decided to petition to England for annexation which was effected in 1881. The Crown decided to administer Rotuma as a part of the Colony of Fiji. Government under English law reduced religious conflicts and allowed development. By the end of the l9th century Rotuma had experienced

15
extensive modernisation. However, Rotumans did not simply adopt European culture uncritically. A conservative society even today, Rotumans adopted foreign elements, and managed to retain their unique cultural identity. Around 1870 the first commercial traders established themselves in Rotuma and in all probability the island's first commercial product was coconut oil. It was not long, however, before the copra trade sprang up, and by 1875 copra had replaced coconut oil as Rotuma's main export. In 1881 Rotuma exported 446.5 tons of copra, 2 tons of coconuts, 104 gallons of coconut oil and 3 tons of kava; amounting to an estimated export value of £2800. Imports for the same year were valued at £2076, and included tools, clothing, food and sundry other articles of civilization. 3 Rotuma's subsistence economy has not been changed drastically by the addition of the monetary economy. However, access to Western products has altered the standard of living and has resulted in Rotuma's overall economy becoming closely linked to Fiji. Western products are now considered to be necessities. Many of these products depend on some form of energy and if there is an interruption of fuel supply (as experienced during the fieldwork for this study) the community suffers as much as any rural community in the world. A more comprehensive description of Rotumas history can be found in Alan Howard’s paper first published in the Journal of the Polynesian Society 70:272-299, 1961 and available at http://www.hawaii.edu/oceanic/rotuma/os/howsel/2hinterland.html
2.4 Physical Characteristics
Rotuma is Fiji’s northern-most island located 640 km north of the capital Suva. The Island is volcanic having 44 km2 in land area and is covered with dense vegetation. It is elongate in an easterly direction with a total length of 14.5 km. Rotuma’s geomorphology is dominated by volcanic cones and associated lava flows with little erosion. About 50 volcanic cones have been identified on the main island and its associated islets. The highest parts of the island are in the central districts of Juju and Malhalla reaching a maximum elevation of 262 metres. Steep cliffs of up to 30 meters are common on the island. A narrow isthmus connects the smaller westerly part with the main land mass (Figure 2). This isthmus and a few other plains on the island are depositional landforms, not formed by volcanism. Rotuma is surrounded by a fringing coral reef with a maximum width of 1.5 km in the easternmost part of the island. The volcanic soils are usually very fertile and well drained. The Oinafa basalts can be used as hard rock for building purposes and the Noa’tau Scoria is suitable as road aggregate4.
3 http://www.hawaii.edu/oceanic/rotuma/os/howsel/2hinterland.html 4 Woodhall, D. 1987. Geology of Rotuma, Fiji Mineral Resources Department.

16
Figure 2: Rotuma viewed from a cliff in the West of the Island
The fertile volcanic soils of Rotuma support agriculture that focuses on subsistence crops such as taro and cassava, and on animal husbandry for meat and eggs. The dominant staples yams, taro, cassava, and a range of banana cultivars are grown in a shifting system, where old gardens are commonly planted with coconuts, breadfruit, oranges, and other trees that most of the island’s agriculture can be described as a well-functioning agro- forestry system. Closely connected with Rotuman agro forestry is the pig-rearing system. The animals are kept in large communal stone-walled enclosures located separately from garden lands in protected secondary forest stands, often between villages and inland gardens. Trees provide much of the pig food, notably coconuts and the abundant papaya. Previous agricultural programmes promoted other cash crops such as cocoa and vanilla, unfortunately with little success. A more comprehensive description of Rotuma’s agricultural system can be found under:
http://www.unu.edu/unupress/unupbooks/80824e/80824E0c.htm
2.5 Infrastructure and Transport
2.5.1 Road Network
Rotuma’s residents live in 19 villages, all located in the coastal zone. The villages are connected by a sand road that is stabilized through concrete slabs in steeper parts which are prone to erosion during heavy rains. Although rough in some places the road provides reliable permanent access to all areas of the island. A PWD team regularly visits the island and performs road maintenance and repair. A secondary network of bush roads and smaller tracks provides access to the planting areas and facilities such as the water pumping stations. Residents report that the network of bush tracks lacks maintenance in parts and some of the tracks are overgrown.
Figure 3: Costal erosion nearMotusa

17
A serious threat to Rotuma’s circumferential main road is coastal erosion that has affected the integrity of the road in several places. PWD has started to combat coastal erosion with the deployment of gabions and other reinforcements but it appears that this approach is not always effective (see Figure 3). 2.5.2 Water Supply
All villages of Rotuma are connected to a central water supply system that is fed by three pumping stations located in Sumi, Motusa and Leptjea. Total daily water supply is between 8000 and 12,000 m3 per day. Diesel fuel consumption of the generator sets that power the pumps is reported to be approximately 110 – 130 litres per day. All consumers are metered and the households of Rotuma are charged the same tariffs as in Suva. Each pumping station is equipped with two Grundfoss submersible pumps of 5.5 kW. Two 40 kVA and one 27 kVA Wilson generators power the water pumps. The generators are oversized by a factor of 2 for the load they have to carry. 15 kVA and 20 kVA units would operate at a better fuel efficiency. Table 2: Characteristics of 27 kVA Wilson Generators Model P27P1S, Alternator LL2014C Engine Perkins 1004G, 4 cylinder in line, 1500 rpm, displacement
3990 cc, 16:1 compression ratio natural aspiration Cooling Water cooled, 25 KW cooling capacity Injection Direct injection Rating 27 KVA prime power, 10% overload capability 1 in 12 hours Fuel Use 10.3 litres per hour or 0.47 l/kWh at full load
At present water supply faces problems with the generators powering the pumping stations. Only two of four generators (Wilson 40 kVA units) are operational. In October 2004 the injector pump of the Sumi station failed and was sent to Suva for repair. It has not yet been returned. In addition, a general fuel shortage impacted the water supply during our field survey in July/August. In order to stretch fuel reserves until the arrival of new supplies the water system operator had to limit operating hours of the remaining two generators and ration water supply. There is also a defunct gravity water supply system that used to provide piped water to the villages of Itumuta and Savaea. The scheme consists of a water intake located in a stream close to the villages, a storage tank of approximately 60,000 litres and associated pipe work. Rehabilitation of the scheme has been considered in the past but was never implemented due to shortage of funds.
18
It is estimated that the scheme could be rehabilitated at the cost of approximately F$ 10,000. Such a project would reduce fuel consumption of the water pumps and provide a higher level of water supply security for the villages. 2.5.3 Air and Maritime Transport
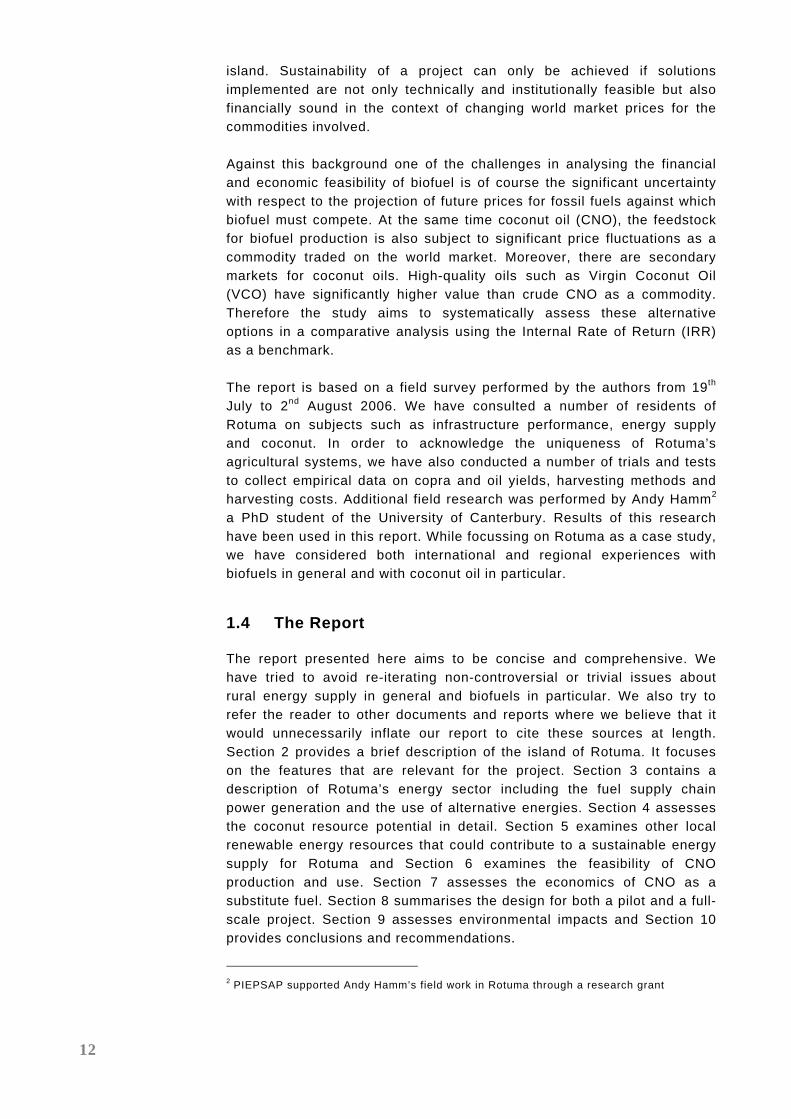
Air and maritime transport links with the outside world are critical for Rotuma. Rotuma has an unsealed airstrip of 1.5 km length that can become unserviceable due to water logging after heavy rains. This leads to cancellation or rescheduling of flights. During our field survey a team of civil aviation specialists visited the island in order to assess the feasibility of up-grading the Rotuma runway.
Figure 4: Aircraft and Ferry (shipwrecked) servicing Rotuma. In theory, there are twice-weekly flights from Fiji’s capital Suva. A small turboprop aircraft (Bandeirante 110) with an inbound passenger capacity of approximately 6-7 services the island of Rotuma (Figure 4 left). Since the Mobil fuel terminal ceased operation, there is no aviation kerosene on the island and aircraft have to carry sufficient fuel for the round trip of 1300 km. This limits inbound carrying capacity and demand for seats is frequently higher than capacity. Currently, Rotuma’s representatives negotiate the im-plementation of an accelerated programme of airstrip upgrading in order to remove one of the most critical transport constraints. Scheduled maritime transport foresees the call of a multi-purpose inter- island ferry once a month. Again this schedule is often subjected to delays. Another constraint to maritime transport is the Oinafa wharf itself. Although the facility had undergone several rehabilitations, there are still several problems including patches of shallow water at the docking point for the roll on – roll off ferry. In June 2006 the ferry “Bulou Ni Ceva” developed engine problems and was shipwrecked on the Oinafa reef (Figure4, right). The vessel may still hold a significant amount of fuel in its tanks and up until our field survey, no action had been taken to salvage the ship or remove the fuel from the wreck.
19
In general, many Rotuman residents feel that lack of reliable sea and air transport is one of the most serious problems for the island. Currently there is an initiative led by Rotuma’s elected representatives to upgrade the airstrip and improve shipping services. 2.5.4 Telecommunications
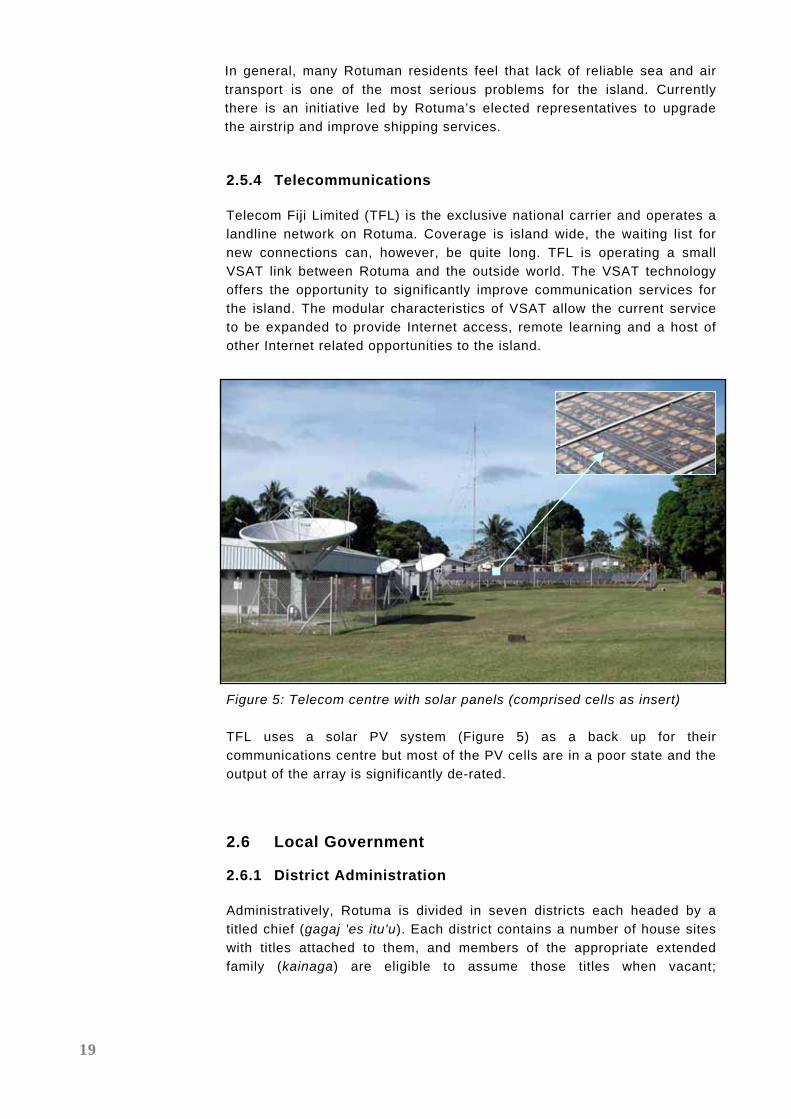
Telecom Fiji Limited (TFL) is the exclusive national carrier and operates a landline network on Rotuma. Coverage is island wide, the waiting list for new connections can, however, be quite long. TFL is operating a small VSAT link between Rotuma and the outside world. The VSAT technology offers the opportunity to significantly improve communication services for the island. The modular characteristics of VSAT allow the current service to be expanded to provide Internet access, remote learning and a host of other Internet related opportunities to the island.
Figure 5: Telecom centre with solar panels (comprised cells as insert)
TFL uses a solar PV system (Figure 5) as a back up for their communications centre but most of the PV cells are in a poor state and the output of the array is significantly de-rated.
2.6 Local Government
2.6.1 District Administration
Administratively, Rotuma is divided in seven districts each headed by a titled chief (gagaj 'es itu'u). Each district contains a number of house sites with titles attached to them, and members of the appropriate extended family (kainaga) are eligible to assume those titles when vacant;

20
collectively they have a responsibility to decide who should succeed to a vacant title. Titles are ranked, so that some are considered more desirable than others. Competition is keenest for those titles eligible for paramountcy. In most districts, three or four kainaga claim rights to a title suitable for the district chief. The second ranking title in each district is that of faufisi, who serves as the district chief's "right hand" and customarily acts as head of the district when the chief is absent. Lesser titles belong to village chiefs, and to those occupying special roles (such as head fisherman and messenger), while some titleholders play no functional role in district administration. For more details see:
http://www.rotuma.net/os/howsel/papers.html 2.6.2 Central Administration
The administrative center (Government Station) is in Ahau located in the Itu’ti’u district. The government station includes postal service, satellite telecommunications, hospital, administrative centre, school and the offices of the Rotuma Island Council (RIC). RIC’s role is defined in a special legislation called the Rotuma Act. Essentially the Councils manages the island, even passing and implementing regulations and by-laws. RIC also addresses land issues and arbitrates disputes. The RIC answers to the Prime Minister’s office. It administers an annual budget of approximately F$ 220,000 for salaries and other operating costs.
A District Officer (DO) represents the Fiji Government and is accountable to the Ministry of Regional Development. The DO advises the RIC together with the Senior Agricultural Officer and the Medical Officer. The RIC itself has fourteen members with voting power. One of the fourteen members is elected as chair of the RIC. In the RIC, a chief and an elected member represent each district. The RIC believes that consistent and credible policies that are vigorously implemented in all sectors are essential for the achievement of economic and social development. There is also a broad consensus amongst GoF and Rotuman leaders of the importance of good governance, public accountability, and transparency of action. The general approach to local government therefore places emphasis on participation, inclusiveness of political and operational levels and good governance. There is a police station on the island with a two-cell jail. The police officers hold the ultimate responsibility for keeping the peace on the island. They are responsible to their superiors in the regular Fiji Police Force system but are also supposed to be responsive to the orders of the DO in his role as magistrate. It is reported that few serious offences occur on the island and usually only two or three police officers are on active duty.

21
2.6.3 Rotuma Investment Limited
The RIC established the Rotuma Investment Limited (RIL), a corporate entity that was registered on 20 July 2001 with the Registrar of Companies. The RIC owns ninety-nine percent of RIL; the Chair of the Council holds the final one percent in trust. The Company was formed on behalf of the Council as a vehicle for promoting viable commercial ventures for the benefit of the Rotuman people. Through its directors, RIL intends to appraise various investment options in the areas of properties, shipping, retail outlets, agricultural, and fishing projects. The Company operates on a commercial basis with the aim to develop business or investment projects that are of economic and social benefit to the Rotuman population. The RIL maintains a link to the Rotuman Association (RA), formerly known as the Seven District Organization Committee and it has been recommended to include representatives of the RA comprising of representatives from each of the seven districts in Suva.
A Board of Directors appointed by the Island Council currently manages RIL. The Board regularly meets to discuss and decide on company matters. RIL received from Government through the Council, a grant of $100,000, which has been deposited with a bank as its working capital. Up until now the only major activity promoted by RIL is the construction of an office complex in Ahau to be rented to GoF. The planning and designs for the office complex have been completed and construction is expected to start soon. The project has a value of approximately F$ 1.8 million.
The current RIL Board includes the following members:
Brig. Paul Manueli, (Chair) John Tevita, (Secretary) Kafoa Muaror (Legal Counsel) Sakaraia Tuilakepa (Accountant) Terence Erasito (Engineer) Victor Fatiaki (Shipping) Hon Dr. John Fatiaki (Senator) Gagaj Maraf Solomone (Rotuma Council) Tartarani Rigamoto (Rotuma Council) Maj. Gen. Jioji Konrote (Observer)
2.7 Tradition and Culture
Rotumans are ethnically Polynesian. In general, the residents of Rotuma appear to live happy lives on an island that is naturally beautiful with a good endowment of natural resources. Soils are very fertile, there are good drinking water resources and the waters surrounding the island teem with marine life. There is no abject poverty, let alone destitution and most if not all, resident families of Rotuma receive some support from Rotumans who are

22
economically successful off island either in the cities of Fiji or abroad. Assisting family members is a strong part of the culture. There is however the feeling that there is lack of opportunity and lack of reliable cash income. Remittances are a haphazard support for the local families and it appears that most families would appreciate a local source of income that allows covering regular expenses such as school fees and utility bills.
There are indications that a significant number of Rotuman residents subscribe to a conservative and traditional world view and consequently do not always aspire to pursue rapid economic development and modernisation. Andy Hamm performed an aspirations survey on Rotuma, which clearly revealed that community life and the majority of Rotuma’s residents considers collective activities important. Strong identification with village or extended family networks (kainaga) frequently take the place of affinity to national groupings and diversity and differentiation can be as pronounced as those between neighbouring countries.
2.8 Rotuma’s Economy
Rotuma’s cash economy is driven by three sources of income: remittances, government salaries, and export of copra. Next to the cash economy, exists a significant informal subsistence sector that produces a variety of agricultural products that are sometimes sold for cash but are mostly consumed by the producing families or shared with friends and relatives. In 2005, copra sales from the island amounted to 700 mt with a subsidy supported mill gate value of F$ 520 per ton of dry copra (Fiji 2 Quality). The copra producers received an average of approximately 2205 F$/ton of dry copra based on a buying price of F$ 0.10 per kg. 80 F$ per ton had to be paid in freight. This leaves approximately 220 F$/ton which mostly accrues to the traders who buy copra in small quantities, transport it to a dryer, dry it and ship it off to the oil mill in Savusavu. However, not all of the copra shipped out of Rotuma is actually paid for by the mill. Traders report that the quantities received by the mill are often significantly lower than what was shipped and sometimes shipments are rejected due to poor quality. Seemingly this poor quality is a result of long transit and storage times. The estimate of total cash inflow from copra sales should therefore be corrected downwards. We assume that after allowances for losses copra earned Rotuma approximately F$ 220,000. Remittances are estimated to be in the order of F$ 1.5 million per annum. This covers only transactions passing through Western Union and the postal service. Reportedly there is also a significant inflow of cash that is brought in when Rotumans living off island come to visit especially during the holiday season. While remittances play a role in almost all island
5 Copra is bought by traders normally freshly cut at the roadside. Prices in 2005 were
around 0.1 F$ per kg. Fresh copra contains approximately 45% moisture of which
approximately 35% is driven out by traditional low tech drying.

23
economies in the Pacific, Rotuma seems to attract unusually large amounts. A study performed by PIEPSAP on Namdrik, Marshall Islands for instance revealed that annual remittances averaged F$ 300 per household compared with an average of F$ 2850 remitted annually to a household on Rotuma. It is important to note that sending remittances home works not only to increase the standard of living for family members at home; it also ensures the maintenance of migrants’ land rights and personal investments, should there ever be a desire or need to return home.

24
3.0 Rotuma’s Energy Sector
3.1 Energy in Rotuma’s Economy
Fiji currently requires approximately 300 million litres (ML) per year of liquid fuels for land, sea and air transport, electricity generation, industrial production and household use. At current world market prices this represents import costs of more than FJ$ 200 million. Although annual growth rates have only been in the order of 2 %, from 1990 to 2000, consumption seems to have accelerated significantly in 2005 and 2006.
Figure 6 Future prices for crude September 06 to September 07. (Source: www.wtrg.com) With no control over world market price development, only limited room to influence retail prices through fiscal measures and no local substitutes currently developed the economy’s leading sectors are heavily exposed to price volatility. There is also the threat of potential supply disruption. However, it should be noted here that many predictions made with respect to oil price developments around mid 2006 proved to be off. We did not see the US$ 100 per barrel of crude that proponents of “peak oil” forecasted for end of 2006. On the contrary, world market prices fell sharply in the second half of 2006 approaching US$ 50 a barrel in January 2007 but rose again to US$ 80 in September 2007 (Figure 6). Rotuma’s energy sector shares many characteristics and problems with other islands in the Pacific. Commonalities include: remoteness; small and

25
aging populations; limited land-based resources; low capacity to exploit existing resources; dependence on unreliable transport; exposure to supply interruptions; difficult access to capital and other markets and the emigration of scarce managerial and entrepreneurial skills. In addition economic activities that involve significant scale economies are typically not competitive in national, regional or global markets. As in other remote island locations in the Pacific social and economic vulnerability is significant in Rotuma’s energy sector. Petroleum shortages and supply interruptions typically have a number of significant impacts including interruptions in island transport and electricity and water supply. At the time of the field investigations water supply was rationed due to fuel shortages. When fuel shortages occur the island bus service ceases to operate and as a consequence students can often not reach their schools. Hospital services are also affected.
3.2 Petroleum Products
Rotuma imports all five types of petroleum products that are available in Fiji. The most important fuel is diesel that is mainly used in power generation. There are also approximately 30-40 cars, trucks, construction machinery and buses on the island that are fuelled with diesel. Kerosene follows as a popular household fuel. Premix is mostly used in some small outboard engines but also in brushcutters and lawn mowers. ULP powers a few cars that have petrol engines and approximately 30 motorbikes. White benzene or “shellite” is used to power cookers and lamps. Since mid-2004 when Mobil ceased to operate its fuel storage facility all products are brought to the island in 200 litres drums. The defunct Mobil depot is located on the road to the village of Fapufa near Motusa (Figure 7). It was built at a cost of about FJ$375,000 and was commissioned in February 1997. The capacity is 200 tonnes of products. The depot has four tanks and used to store Diesel, ULP, MPK and Premix. The depot had sufficient capacity to store a nine-month uplift. With the MPK stock under professional management by Mobil it was possible to refuel aircraft on Rotuma. As this is no longer possible loading capacities of flights is constrained as aircrafts need to carry fuel for the entire round trip thus reducing passenger and cargo load substantially on the Suva-Rotuma leg. While the depot was operational, products were pumped from coastal tankers anchored south of Motusa through a pipeline. This pipeline was damaged during a cyclone some years ago. Mobil did not seem to consider rehabilitation of the facility commercially viable. Maximum prices set by the Government and other factors resulted in Mobil claiming losses on fuel sales to Rotuma. At present all fuel is purchased by a number of individual customers and shipped and stored in 200 Litre drums. A survey of fuel sales carried out in

26
August 2006 found that in a total supply of 125 drums of which 77 were diesel (Table 3).
Table 3: Fuel Supply Survey August 2006 and Projected Annual Volumes
Product Diesel ULP Premix Shellite MPK Total
Supply August 06
(drums) 77 9 15 5 19 125
Estimated supply (drums) 924 108 180 60 228 1,500
Annual Supply litres 184,800 21,600 36,000 12,000 45,600 300,000
Value @ Aug 06 Prices 351,388 48,118 74,457 21,884 70,447 566,295
Table 4 summarises a projected annual supply on the basis of the August 2006 survey together with the value assuming August 2006 prices. The last row of the table are displays maximum retail prices as fixed by the Fiji price and income board in May 2006 (for retail outlets within 15 km of the Oinafa Wharf). There is an obvious discrepancy between supply cost and allowable retail price, i.e. a retailer that applies PIB fixed prices would have lost substantially in all controlled product categories. This disincentive to supply Rotuma may be one of the reasons why fuel supply is currently unreliable and erratic. Other issues are related to a fragmentation of suppliers and cash flow problems that small scale supplier’s experience.
Table 4: Projected Annual Supply and Cost Implications
Product Diesel ULP Premix Shellite MPK
Price per drum Suva F$ 368.29 433.54 401.65 352.74 296.98
Transport F$ 12 12 12 12 12
Price CIF Rotuma F$ 380.29 445.54 413.65 364.74 308.98
Price per litre F$ 1.90 2.23 2.07 1.82 1.54
Government Price 05/06 1.65 1.96 1.94 na 1.43
For the purpose of this study, it is assumed that at present 85% of the annual diesel supply are being used in power generation with the balance of approximately 28,000 litres being used in vehicles and construction machinery. An additional market for locally produced CNO could emerge if ships and ferries calling decided to top up their bunkers with CNO. This possibility has not been taken into consideration for the present project design. It could nevertheless become an attractive option once a functioning CNO production capable of producing quality oil has been established and experiences with using the oil have been made. For the time being, power generation should be the focus of biofuel activities in Rotuma.

27
Figure 7: Rotuma Fuel Prices as advertised by Sisters & defunct fuel terminal
3.3 Electricity
Most households on Rotuma have access to electricity supplied either by individual generators or village mini-grids that have been established under the rural electrification scheme of the Fiji Department of Energy. Supply is typically restricted to several hours a day with some flexibility to extend supply hours in case of special requirements. 3.3.1 Government Station Ahau
A Wilson P44E 415/240V3 phase prime power generator connected to a low voltage underground mini grid supplies power to the Government offices and 27 households in the vicinity of the Government station in Ahau. The generator is powered by a Perkins 1004G direct-injection four-cylinder diesel engine. The genset is rated 44 kVA/35kW. The system normally operates for eight hours daily from 08:00-12:00 and 18:00-22:00, however supply hours may be extended of reduced depending on availability of fuel. The reported fuel consumption for Ahau is approximately two 200-litre drums a week. This translates into 57 litres per day or 7.1 litres per hour of operation. This is consistent with the rated fuel consumption of the genset that the manufacturer lists at 12 litres per hour at full load at standard reference conditions of 27 C air inlet temperature, 500 feet altitude and 60% relative humidity.6 Loading of the generator is high during week-day morning hours when PWD runs it workshop and offices and the hospital are fully operational. There is no logbook at the Rotuma powerhouse recording kWh of energy produced, or maintenance work undertaken. Only the fuel consumption, which averages 350-400 litres of diesel per week or about 20,000 litres per year, is noted by the operator. It is highly recommended to log some basic operational data such as operating hours,
6 Specific fuel consumption according to BS 2869/1998

28
energy sent out, fuel and lube consumed and maintenance and repair work performed. According to the Public Works Department (PWD) Water Supply Office, an additional 50,000 litres per year are used for three generator sets that power PWD’s submersible water pumps. Government’s total diesel consumption for power generation is thus approximately 70,000 litres per annum. The 27 households connected to the government grid, consume approximately 1400 kWh per month or an average of 50 kWh per household. At fuel supply cost at F$ 2.20 per litre cost of the tariff charged in August 2006 was FJ$0.1575 per kWh plus 12.5% value added tax (VAT) or FJ$0.1772/kWh. This is significantly lower than the FEA tariff which stood at F$ 0.21 per kWh for the first 200 units. At fuel supply cost of F$2.00 per litre of diesel and an assumed average specific fuel consumption of 0.4 litre of diesel per kWh the fuel cost alone is already F$ 0.8 per kWh. I.e. the households connected to the Ahau pay less than 20% of the cost to supply. Such pricing is not sustainable and sends the wrong price signals to the consumers. It is recommended to gradually raise tariffs to more sustainable levels. 3.3.2 Village Electrification
Village electrification in Rotuma has been implemented as a series of individual small-scale projects, many of them supported by the GoF (Department of Energy) Rural Electrification Program. This programme requires villages to apply for electrification and pay up-front 10% of the estimated investment cost. DoE in co-operation with PWD then designs and procures the generators and contracts out construction of the systems. Practically all rural electrification schemes follow a similar design consisting of a small powerhouse where three-phase diesel generators are located. The generators feed a low voltage distribution system to which the individual houses are connected. Supply is metered in some villages. The villages implement their own tariffs and revenue collection. Supply is usually restricted to a couple of hours in the evening and in the morning. Although operators of the village electrification schemes have received some training through DoE, technical problems are common and breakdowns are reported frequently. Fuel contamination (water) causes technical problems. There is also anecdotal evidence that specific fuel consumptions are quite high, although a systematic recording of inputs and outputs of the mini grids does not take place. Some schemes, however, show serious flaws in design and construction. A frequent problem is the use of oversized generators. The following load curve for Losa shows that the 12 kW generator never reached 2.5 kW load during the recording period. Similar recordings for Motusa and Juju confirm that generators are oversized. The Motusa generator’s operator

29
keeps a comprehensive log that includes maximum loads. According to these records, even the Christmas period maximum loading on the generator was only 50%. I.e. most generators on Rotuma hardly ever reach a load where efficient operations of the units are technically possible. While generators are normally sized to accommodate future load growth, it While generators are normally sized to accommodate future load growth, it appears that over-sizing of equipment is common. This is also evident in the selection of the generators that power Rotuma’s water pumps. The load of these units is determined by the size of the pumps, i.e. there is no load growth to be expected. Over sizing of generation equipment is estimated to result in a significant increase (20–30 %) in specific fuel consumption. Residents of Itumuta on the other hand complained that the generators are unable to supply the demand of the village. Inspection of the units revealed that only one phase of each of the two three-phase generators (10 and 13 kVA) was connected to the grid, resulting in extremely low performance and high specific fuel consumption. The following table displays the generators that were installed in Rotuma in August 2006 (Table 5). It should be noted that there are also approximately 15–20 small size private generator sets in use on the island. These generators are sometimes rented out for special occasions or in case of breakdowns of village generators.
Load curve - Losa Village Generator- May 27, 2006
0
0.5
1
1.5
2
2.5
18:01 18:31 19:01 19:31 20:01 20:31
Time
Load
[kW
Figure 8: Load Curve for Losa Village Generator – May 27, 2006.

30
Table 5: Generators on Rotuma.
There is not sufficient data to determine the operating efficiency of the
individual village electrification schemes on Rotuma, as most schemes do not have meters to log kWh sent out or actual fuel consumed per day. It appears however, that average specific fuel consumptions are quite high. Taking the Losa generator as an example the daily output of this unit would be around 7 kWh during the typical three operating hours in the evening. During this period average fuel consumption is reported to be 5 litres of diesel, which means that SFC would be in the range of 0.7 litres per kWh for energy sent out of the powerhouse. This is approximately twice as much as best-practice values for small diesel generators but very much in line with typical values in other diesel-powered rural electrification schemes. Andy Hamm calculated a SFC of 2 litres per kWh for the Malhaha school generator, a 22 kVA unit that operates typically at approximately 10 % of its rated capacity. (Average load approximately 2 kW). While this SFC figure seems to indicate an extremely low operating efficiency, it could be possible because of the obvious mismatch between power demand and generator capacity.
In conclusion it seems that the village power systems are plagued with a number of problems that stem from inappropriate sizing; flawed installation; low operating efficiency; fuel shortage; poor fuel quality; high fuel cost; lack of operator training and difficulties with spare part supplies.
District Village Fuel Daily hoursBrand kVA Phase Installed (l/day) h
Itu’ti’u Hapmak Lister 17.5 3 1998 10 4Deutz 40 3 2004 18 6
Yanmar 10 1 2000KL 6 1 2004
Ahau Wilson 44 3 ? 57 8Powermat
e5 1 ?
Lau Lister 17 3 1991 4 3Losa Deutz 15 3 2004 5 3Savlei Lister 25 3 2002 7 4Tuakoi Deutz 16 3 2004 6
Malhaha Elsio Lister 5 1 2005 6 3Pephaua Deutz 10 3 1995 7 4Else’e Lister 13 3 1980 10 3
Oinafa Lopta Lister 20 3 2002 10 5Oinafa Deutz 8 3 2003 12 10
Noa’tau Maragtteu Deutz 27 3 2003 17 6
Kalvaka Deutz 16 3 2004 12 6Pepjei Pepjei Deutz 15 3 1985 4Juju Tuai Lister 7 1 1985
Haga Hatz 16 3 2005 7 4Mission Deutz 8 3 2004 4Juju & Saukana
Lister 6 1 1984 6 4
Itu’muta Lister 10 3 2003 6Lister 13 3 2003 8
Water Supply Perkins 108 3 2002 133 24
Totals 477.5 216
Maftoa
Genset
Motusa

31
However, the systems do supply power in a flexible way allowing the communities to adjust operating hours, tariffs and procurement of fuel and spare parts according to their needs. Average availability of the existing generation equipment on Rotuma is estimated at approximately 75%. This may frustrate local residents when the power is out for 25% of the time that it should be on, it is still better than the average for similar rural electrification schemes across the Pacific. Figure 9: Generator and Powerhouse on Rotuma Even without a biofuel initiative there is considerable room to improve the operation of diesel-powered equipment on Rotuma. Firstly, new equipment should be adequately sized for demand. Secondly, an educational campaign that addresses both operators and consumers of services could concentrate on issues such as load management, better data logging, appropriate installation of equipment and improved load balancing. In a third step, interconnection of nearby village mini-grids could help to overcome the problem of insufficient loads by allowing two neighbouring villages to share one generator.

32
3.4 Traditional Fuels
Traditional fuels such as firewood and coconut husks are mainly used for copra trying and traditional earth oven (lovo) cooking. Although LPG and kerosene are the most popular cooking fuels, some families use fuelwood or the abundant coconut husks. This occurs when there are supply disruptions of kerosene and LPG or a family lacks cash to procure modern fuels. There are no data on the use of traditional fuels on Rotuma but anecdotal evidence found during the field visit suggested that there are no shortages of fuelwood or other biomass.
Figure 10: Cooking with Coconut Husks in Rotuma The proposed project will either have to use biomass fuel in the form of coconut husks and shells or wood to fuel copra trying equipment. An alternative would be the establishment of solar drying equipment. .

33
4.0 Coconut Resource Analysis
4.1 Methodology
Across the Pacific price volatility for fossil fuels and concerns related to energy security have triggered significant interest in the development of local biofuels based on coconut oil, palm oil and possibly other oil-bearing plants such as Jatropha. International experience has shown that sustained availability of biomass resources is the key to successful projects. Resource assessments therefore become a necessity especially in situations where resources have not been managed in an optimal fashion, as it is the case for most coconut stands in PIC. The questions that need to be answered here are: (i) how much feedstock will be available for a biofuel production unit over the technical lifetime of an investment i.e. for a period of at least ten years and (ii) what are the supply cost for the feedstock that a biofuel facility has to pay. We have tested the use of high-resolution satellite imagery for a rapid assessment of the coconut resource on Rotuma. A pan-sharpened high-resolution QuickBird image allows a detailed analysis of the current and mid-term production potential when used as a backdrop for the stratification of biomass cover and subsequent estimation of palms per hectare. It also allows modelling of harvesting by calculating transport distances for copra to roadsides. The methodology applied in the resource assessment is discussed in more detail below.
4.2 Stratification of Coconut Cover
Coconut palms appear to be the dominant vegetation and the first impression with respect to Rotuma is that it has abundant coconut resource. However, this superficial impression had to be revised when analysing the coconut area and the productivity of existing stands more precisely. The pan-sharpened QuickBird image has a resolution of 60 cm and thus allows identification of vegetation types. Stratification is possible with a high level of accuracy as even individual palms can be identified on the image. For the purpose of this study the visible surface of the island was stratified into seven distinguished categories.

34
Figure 11: The Pan-sharpened QuickBird Image data.
Two strata were defined to have nearly no coconut palms a) “hill vegetation”; and b) “scrub and agricultural vegetation”. Hill vegetation is the vegetation on the volcanic cones, which contained practically no palms. This vegetation type covers 4% of the total surface area of Rotuma. Scrub and agricultural land covers 13%. A third land-use type is “human infrastructure” which is the aggregate of housing areas, airport runway and main roads. This stratum contains some coconut palms around the residential buildings but this resource was not considered relevant as a potential fuel resource as the net quantities are small and the coconuts harvested from these palms are essentially used as food or pig fodder. This land-use type accounts for 3% of the total surface area.
Figure 12: Stratification into seven layers/strata
Out of a pan-sharpened QuickBird image a GISbackdrop was produced allowing a stratificationand subsequent estimation of palms per hectarein MapInfo GIS environment as on-screendelineation.
35
The largest surface area is the stratum labelled “natural forest”, which covers 53% of Rotuma’s area. Coconut palms also grow here, however, only at a density of approximatelyimately less than 10 palms per hectare. The image data allow a clear separation of “natural forest” from areas stocked with coconuts. Whenever palms were visible in greater densities the area was classified as “scattered coconut”. The stratum labelled as “scattered coconut” covers 8% of Rotuma’s area. Scattered coconuts mainly grow on agricultural or grass land. The stratum “scattered coconut” was partly delineated within “natural forest”. The low density of coconut palms per hectare in this category will make harvesting too costly and this resource is not considered commercially viable for larger scale coconut oil production. The stratum “natural coconut” covers remnant or unmanaged plantations. In these areas coconut palms have regenerated naturally and palms of different ages and sizes grow together typically in association with thick under-growth. Commercial harvesting of coconuts is possible but will incur significantly higher cost as compared with coconut plantations. The satellite image separates these areas from others by the typical coconut texture. These areas have to be cleaned to allow a commercial utilisation of the coconut. The stratum “natural coconut” covers 12% of Rotuma’s land mass. The term “coconut plantation” is used for areas where the planting lines were clearly visible in the satellite image. This type of coconut plantation covers 8% of Rotuma’s area. The under-growth vegetation is grass or agricultural crops allowing easy access to the coconuts and a cost effective harvest. The two strata “coconut plantation” and “natural coconut” are considered to produce harvestable coconuts, which could be used for CNO production. Together they cover 860 hectares or approximately 20% of Rotuma’s land area. This is less than what seemed apparent at first glance.
4.3 Coconut Palm Density
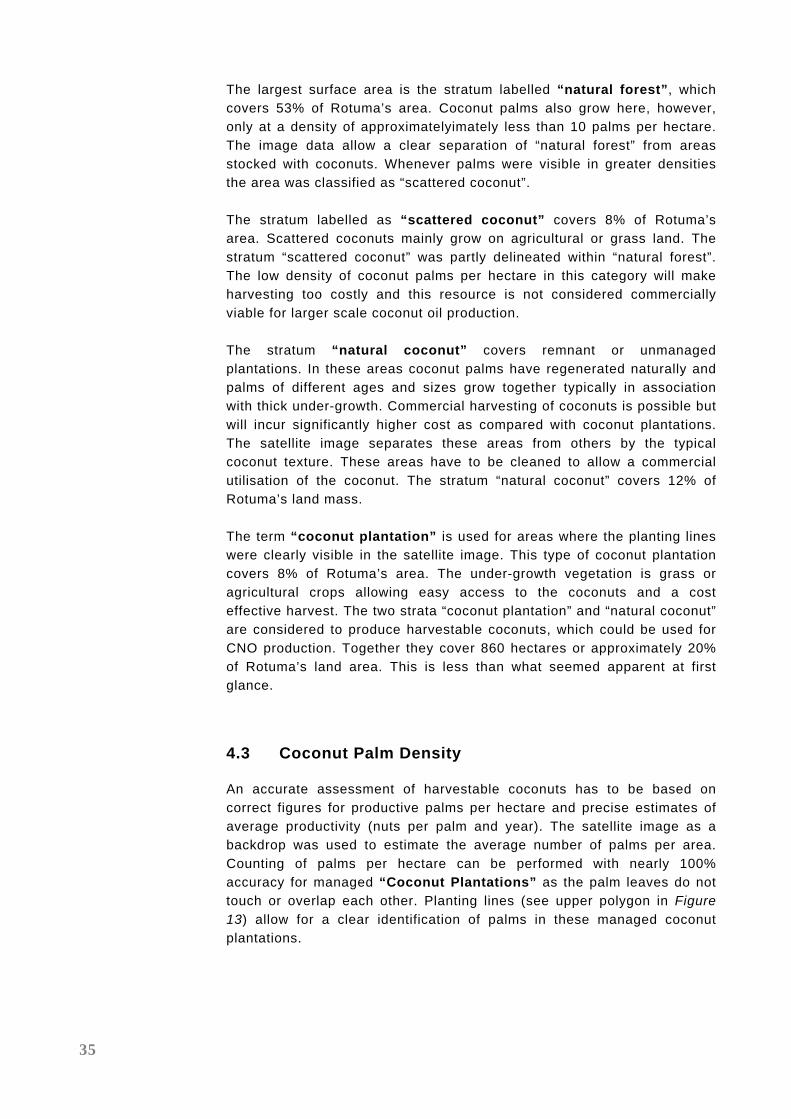
An accurate assessment of harvestable coconuts has to be based on correct figures for productive palms per hectare and precise estimates of average productivity (nuts per palm and year). The satellite image as a backdrop was used to estimate the average number of palms per area. Counting of palms per hectare can be performed with nearly 100% accuracy for managed “Coconut Plantations” as the palm leaves do not touch or overlap each other. Planting lines (see upper polygon in Figure 13) allow for a clear identification of palms in these managed coconut plantations.

36
Figure 13: Counting of Palms per hectare Unmanaged coconut plantations (lower polygon) have a clear coconut texture with which these areas can be delineated from other land cover types. Where there are no small palms in the undergrowth, we have a clear contrast between palm-leaf texture and vegetation growing underneath. The contrast between coconut leaves and the underlying grass makes it easy to see and count them correctly. The counting of coconut palms per hectare is made possible when a correlation between the visible palms on the image and palms on the ground (from field data) is established. Field verification showed nearly 100% validation of the figure counted for the areas on the satellite images, which were visited. The two strata “Coconut Plantation” and “Natural Coconut” are the ones considered to produce harvestable coconuts, which could be used for biofuel production. Together they cover 860 hectares, 20% of Rotuma’s land area, less than originally expected. For “Coconut Plantations” (CP), 610 coconut palm samples were taken from 26 areas of 25 X 25 m grids. Of these, density was calculated to be 128.6 palms per hectare with a standard deviation of ±34.5. Within the stratum “Natural Coconut” the interpretation of the satellite image can lead to an underestimation of palms per hectare. The leaves of several palms mostly overlap and make recognition of individual palms difficult. While old palms are clearly visible in the canopy, however, the younger and slightly shorter palms are more relevant as they produce more coconuts. The underestimation when counting palms in the satellite image data varied between 30 and 100% according to field verification on the ground (Figure 13). It was not possible however to establish a clear correlation especially for areas covered with young palms as a result of natural regeneration.

37
Figure 14: Coconut Palms
Managed coconut plantations show a clear contrast of palm-leaf texture and vegetation growing underneath. They also allow an easy harvest of coconuts, where the coconut collector does not have to walk through thick undergrowth.
Unmanaged coconut plantations have palms of different age. Palms in the understorey are not visible in the satellite image, however, they can produce more coconuts than very old and tall ones. Clearly, more detailed fieldwork is required to determine potential yields of unmanaged plantations. These plantations can be rehabilitated through thinning and replanting. In case a larger-scale CNO production is envisaged this analysis should be performed by an agriculturist with experience in coconut production. This assessment should yield a medium to long term management plan for Rotuma’s coconut resources. The assessment should also address issues such as the nutrient cycle (how much biomass in the form of husks and shells can be safely removed from groves) and the options for a more integrated use of the resource (timber, shells, husks, coconut water, leafs, copra).

38
4.4 Yields
The coconut palm is unique in that once it attains the normal bearing stage, it continues to bear a bunch of nuts in every leaf level almost at monthly intervals all the year round and throughout its life extending over 60 or 70 years. According to FAO, healthy coconut palms yield between 70 and 100 nuts per ha and year with a maximum of 150 nuts per year for high yielding hybrids. Obviously, the yield of an individual palm depends on a large variety of parameters. The most important ones include:
variety (hybrid or ordinary); age of palm; soil quality; Fertilization spacing of plantation; water availability; occurrence of extreme weather, strong winds and hurricanes; Pests and fire attacks.
CIDA assumes an average yield of 115 nuts per tree and year for the varieties used in Fiji. This seems to be a somewhat optimistic estimate. Obviously yields can be increased by fertiliser application.7 However, fertiliser application in smallholder production is not practised in Fiji or in Rotuma. Green manure, however, is added in most managed plantations. Palms planted outside the Ministry of Agriculture extension campaigns that finished in 2001 are unlikely to be from first-grade plant material. These factors reduce potential yields of the existing stands. On the other hand, Rotuma’s agro-ecological conditions are very good, soils are rich in nutrients and rainfall normally provides sufficient water for good plant productivity, i.e. for managed plantations, a comparatively high yield can be assumed. There is no reliable information on the age of Rotuma’s coconut stands, i.e. we were not able to make productivity adjustments as a function of the plantations or individual palm age. Although height of a palm can be correlated to its age – at least for the first twenty years of the growth cycle of the local Tall varieties – existing data are not sufficient to compute this relationship. While some senile palms were found during field investigations, there was, however, no visible evidence of senility in the larger percentage of the existing stands. As Rotuma has participated in both the 1966/80 and the 1981/2001 replanting campaigns, it is safe to assume that the majority of current stands are still at productive age.
7 The recommended dose of fertilisers is 500 g of N, 300 g of P2O5 and 1200 g of K2O per
palm per year for the ordinary Tall variety. Hybrids and varieties, with a high yield
potential, should be fertilised with 1000 g of N, 500 g of P2O5 and 2000 g of K2O. For soils,
which are poor in organic matter, the application of green manure or compost at 50 kg per
palm is also recommended. http://www.pnbkrishi.com/coconut.htm

39
Spacing of palms in managed plantations average 129 palms per hectare and is in line with good practice for optimising yields in mixed production systems. Natural rainwater availability in Rotuma seems sufficient to sustain productivity of the stands. There was no serious hurricane in recent years that would have impacted coconut productivity and there was no evidence of severe attack of pests or fire damage. Thus, for the purpose of this study it is assumed that a Rotuman Tall, the most common variety in Rotuma yields 60 nuts per tree and year in plantations that are managed but not fertilised by mineral fertilisers. The stratum “Natural Coconut” which is characterised by an average density of 350 palms per hectare is assumed to yield 20 nuts per palm and year. For the stratum “Scattered Coconut”, characterised by low planting densities of an average 61 palms per hectare are is assumed to yield 50 nuts per hectare and year (see following Table 6). Table 6: Total Production of Nuts on Rotuma. According to our analysis Rotuma’s coconut stands produce approximately 7.3 million nuts per year. Obviously, not all the nuts would be available for a local CNO production. In the following section we estimate the potential harvestable for a local oil production.
4.5 Available Coconuts
4.5.1 Accessibility
Firstly, we have to make allowances for accessibility. It is not practical or economical to harvest coconuts that grow far away from an access road, on hillsides or on palms that are located in stands that are heavily overgrown. A typical harvesting procedure involves either whole nuts or green copra to be manually carried out of the groves in traditional frond baskets. The product is then collected by truck. We have considered only those stands as practically accessible that are within 350 metres of an access road. Further, we consider only 30 % of the areas of the stratum “Natural Coconut” accessible because of thick undergrowth in the remaining stands. Hillsides have already been excluded in the stratification exercise. This correction brings the amount of available coconuts to 5 million nuts per year. The following Table 7 displays the quantities of available coconuts after making allowances for accessibility. It should be noted here that this
StratumArea [Hectare] Palms/Hectare
Coconuts/Palm/Year
Coconuts/Year
Coconut Plantation 340 129 60 2,631,600Natural Coconut 522 350 20 3,654,000Scattered Coconuts 341 61 50 1,040,100Total 7,325,700

40
parameter can be controlled, i.e. the quantity of accessible nuts can be increased through the construction of access roads. Also, cleaning up of overgrown coconut stands will increase the quantity of available coconuts. Table 7: Total Nuts within 350 Metres of Access Road and 30 % accessibility of Natural Coconut. 4.5.2 Traditional Uses
In Rotuma, like in most Pacific islands Coconuts are traditionally used daily for a variety of purposes. Green nuts are cut from palms as drinking nuts served at meetings and functions, coconut cream is a popular ingredient for many local dishes, copra is also consumed as a snack and the flesh of coconuts is fermented inside the nut to produce a type of coconut cheese. Coconut oil is also extracted at the household level for cooking and cosmetic purposes. Residents estimate that every household in Rotuma consumes an average of 6-8 nuts per day. For the purpose of our calculation we assume the higher figure of 8 that results in a household consumption of 1.53 million nuts per year or approximately 30 % of the available and accessible nuts. This is highly consistent with a CIDA estimate that assumes that 30 % of the local coconut production is consumed at household level. After making allowances for local consumption and traditional uses 3.5 million nuts per year are considered currently available for copra or a local CNO production. It should be noted that this figure can be increased considerably through a revival of Rotuma’s coconut industry. Clearing of overgrown plantations, provision of access and replanting could probably double the amount of available coconuts in the medium and long term.
Figure 15: Coconut Uses
StratumArea [Hectare] Palms/Hectare
Coconuts/Palm/Year
Coconuts/Year
Coconut Plantation 324 129 60 2,507,800Natural Coconut 153 350 30 1,609,700Scattered Coconuts 318 61 50 969,900Total 5,087,400
41
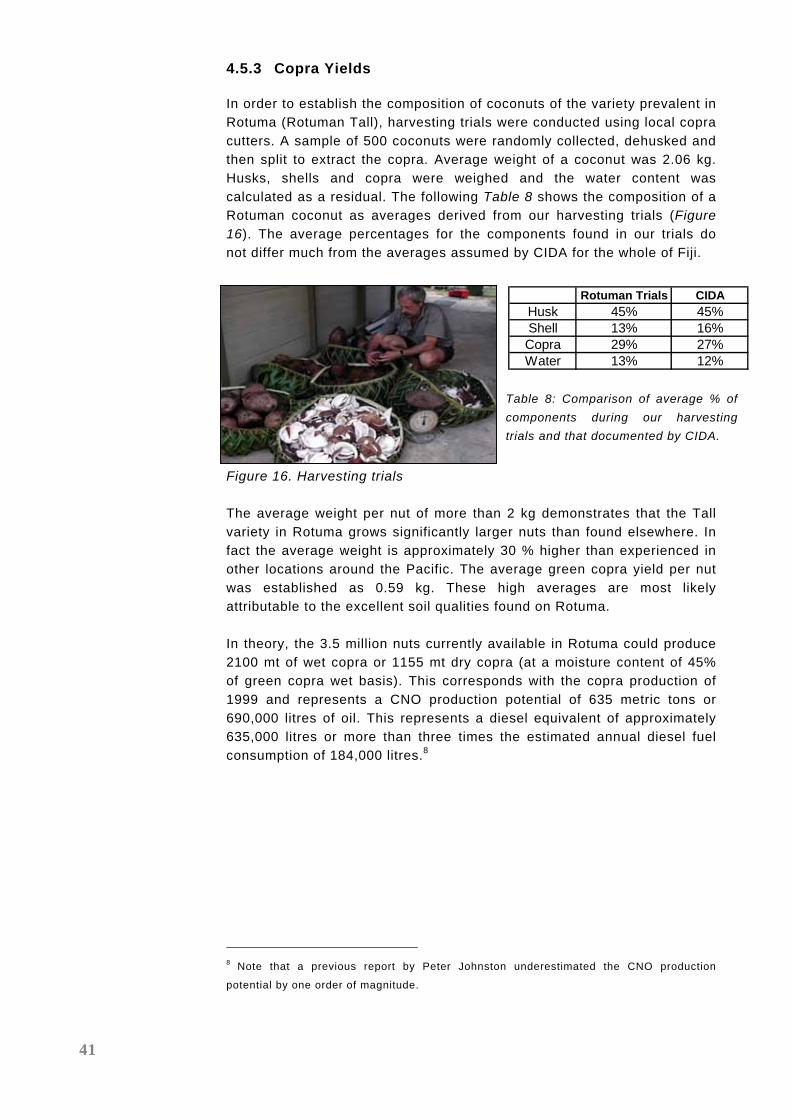
4.5.3 Copra Yields
In order to establish the composition of coconuts of the variety prevalent in Rotuma (Rotuman Tall), harvesting trials were conducted using local copra cutters. A sample of 500 coconuts were randomly collected, dehusked and then split to extract the copra. Average weight of a coconut was 2.06 kg. Husks, shells and copra were weighed and the water content was calculated as a residual. The following Table 8 shows the composition of a Rotuman coconut as averages derived from our harvesting trials (Figure 16). The average percentages for the components found in our trials do not differ much from the averages assumed by CIDA for the whole of Fiji. Figure 16. Harvesting trials The average weight per nut of more than 2 kg demonstrates that the Tall variety in Rotuma grows significantly larger nuts than found elsewhere. In fact the average weight is approximately 30 % higher than experienced in other locations around the Pacific. The average green copra yield per nut was established as 0.59 kg. These high averages are most likely attributable to the excellent soil qualities found on Rotuma. In theory, the 3.5 million nuts currently available in Rotuma could produce 2100 mt of wet copra or 1155 mt dry copra (at a moisture content of 45% of green copra wet basis). This corresponds with the copra production of 1999 and represents a CNO production potential of 635 metric tons or 690,000 litres of oil. This represents a diesel equivalent of approximately 635,000 litres or more than three times the estimated annual diesel fuel consumption of 184,000 litres.8
8 Note that a previous report by Peter Johnston underestimated the CNO production
potential by one order of magnitude.
Rotuman Trials CIDAHusk 45% 45%Shell 13% 16%Copra 29% 27%Water 13% 12%
Table 8: Comparison of average % ofcomponents during our harvestingtrials and that documented by CIDA.

42
4.5.4 Harvesting Trials
The question “How much copra can you cut in day?” when asked in a rural context in the Pacific typically yields a wide range of replies. In order to provide some empirical evidence to support assumptions made for this studies, harvesting trials were carried out on Rotuma. While copra cutters would cut copra for a roadside price of 12 Fiji cents per kg, it is necessary to analyse labour productivity in order to determine if there are labour market constraints that require mechanisation of a larger scale production. The harvesting trials were set up to reflect the normal practice of copra cutting. An experienced copra cutter was engaged together with an inexperienced cutter. Both cutters were requested to do their normal copra cutting exercise that essentially consists of four steps: Fabrication of a basket, collection of nuts from underneath the palms, cutting of copra, and transporting copra baskets to the roadside. Harvesting trials were performed in an area that classifies as “Natural Coconut” i.e. a grove that was not identified as a managed copra plantation. The results can therefore be considered as conservative given that within a managed plantation, collection of nuts and moving of product would normally be unobstructed and thus faster. The results of the harvesting trials show a significant difference in the copra cutters’ performances. The average hourly production rate of the experienced cutter amounted to 39.4 kg fresh copra supplied at the roadside while the less experienced cutter managed an hourly production of 19.1 kg. This production rate includes basket making and carrying the basket of copra to the road taking 8 minutes and 4 minutes, respectively. Given that copra cutting will typically be performed by workers with different skill levels we assume an average productivity of 30 kg of fresh copra per hour. At current roadside copra prices this corresponds with an hourly wage rate of F$ 3.6. The procedure leaves husks, shells and water in the coconut grove. Harvesting trials were also performed for de-husked nuts. As a more integrated oil extraction facility may want to use the valuable shells and the water contained in the nut copra cutting may become obsolete and the collection and de-husking of nuts may be a preferred procedure. The hourly productivity again varied: the experienced cutter managed to collect, de-husk and transport 102 nuts in an hour the less experienced worker produced 74 nuts. We assume a rate of 80 nuts an hour to be a realistic average for this type of harvesting. In case entire nuts are required for a facility, the collection rate was also tested yielding approximately 140 nuts per hour. With this type of harvesting the manufacturing time of the baskets become more significant as much larger volumes need to be transported.
Figure 17 De-husked Nuts

43
4.6 Historic and Current Copra Production
The total area under coconuts (Cocos nucifera) in Fiji is estimated to be approximately 58,900 ha planted at an average of 115 trees per ha. (6.8 million trees). 80% of Fiji’s copra production is in the hand of smallholders. The families that rely on copra production earn less than F$ 500 p.a. and are considered amongst the poorest households in the country. CIDA estimates that a total of 100,000 people in Fiji still depend on income from copra and coconuts. Historically, copra production in Fiji peaked in the 1950ies when more than 40,000 mt of copra were being exported. 60 % of this production originated in private estates. During the last decade production peaked in 2002 when the national total was above 15,000 mt. Today 80% of copra production originates from smallholders. In 2003 when hurricane Ami devastated a large portion of the crop, production fell to 9,500. Since then production has gradually increased to 11,300 mt in 2005. CIDA forecasts 2006 production to be 14,000 mt. Fiji’s largest copra producer is the island of Vanua Levu where approximately 50% of all copra originates. The following Figure 18 displays the annual production of Fiji’s largest producers. Rotuma is the fourth largest, after Taveuni. Figure 18: Annual Copra Production for Fiji in Tonnes: 1998 – 2005 (Source: CIDA).
In order to control plant material, introduce new varieties and hybrids the Fiji Ministry of Agriculture provided extension services to coconut producers. As coconut was considered a top commodity to generate revenue in rural areas, there were two major re-planting campaigns led by Fiji’s Ministry of Agriculture. Although these campaigns included Rotuma,
Annual Copra Production Fiji
0100020003000400050006000700080009000
10000
1998 1999 2000 2001 2002 2003 2004 2005
Year
Met
ric
Ton Vanua Levu
LauTaveuniRotuma
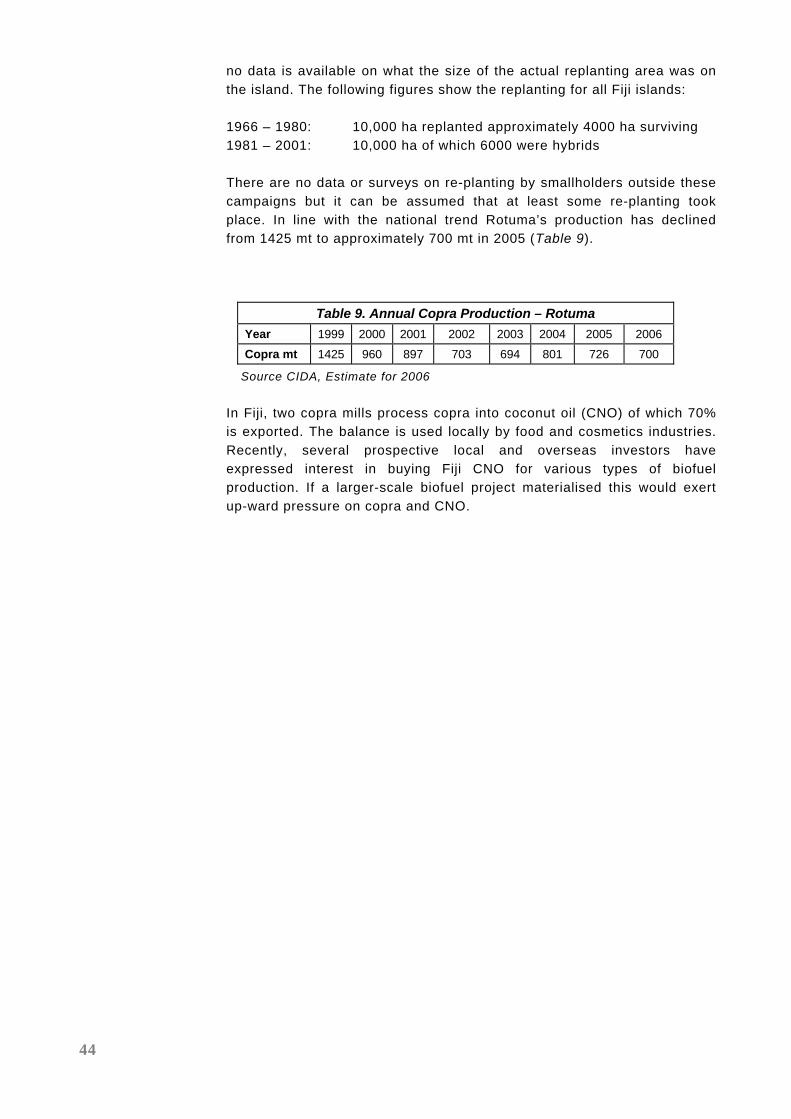
44
no data is available on what the size of the actual replanting area was on the island. The following figures show the replanting for all Fiji islands: 1966 – 1980: 10,000 ha replanted approximately 4000 ha surviving 1981 – 2001: 10,000 ha of which 6000 were hybrids There are no data or surveys on re-planting by smallholders outside these campaigns but it can be assumed that at least some re-planting took place. In line with the national trend Rotuma’s production has declined from 1425 mt to approximately 700 mt in 2005 (Table 9).
Table 9. Annual Copra Production – Rotuma
Year 1999 2000 2001 2002 2003 2004 2005 2006
Copra mt 1425 960 897 703 694 801 726 700
Source CIDA, Estimate for 2006 In Fiji, two copra mills process copra into coconut oil (CNO) of which 70% is exported. The balance is used locally by food and cosmetics industries. Recently, several prospective local and overseas investors have expressed interest in buying Fiji CNO for various types of biofuel production. If a larger-scale biofuel project materialised this would exert up-ward pressure on copra and CNO.

45
5.0 Other Local Energy Resources
5.1 Wind Energy
Rotuma regularly experiences extended periods of strong south-easterly trade winds that can last for several weeks. There are also calm periods with no usable wind at all. This regime indicates that wind could be used as a fuel saver in conjunction with another firm energy source such as diesel or biofuel. Unfortunately, information on Rotuma’s wind regime are scanty at the moment. No comprehensive study of the wind resource has been carried out for Fiji’s islands. Results of wind measurements taken by FEA are not accessible as the Government owned utility treats these data as commercially confidential. Andy Hamm took short-term recordings of wind speeds during April - June 2006. The monitoring unit was located at both Ahau Government Station and on Afgaha Island. The latter is exposed to the prevailing easterly trade winds that are predominant on Rotuma. Mean wind speeds at 10 metres above ground were 1.8 and 3.9 meters/second, respectively. The following graph shows the distribution of wind speeds and the corresponding Weilbull distribution for the Afgaha site together with a wind rose (Figure 19). Clearly these measurements can only provide a first clue of wind resources on Rotuma. A mean wind speed of 3.9 metres/second, however, indicates that a more comprehensive analysis is warranted. Consequently, the PIEPSAP Project has procured a 30 meters wind-monitoring tower that will allow to assessment of the local wind regime. The monitoring mast was installed in March 2007. A full year of monitoring will be required in order to compute generation cost of wind turbines on Rotuma.
0
0.05
0.1
0.15
0.2
0.25
1 2 3 4 5 6 7 8 9 10 11 12 13 14 15 16 17 18 19 20 21 22 23 24 25
Wind speed (m/s)
Data DistributionWeibull Distribution (2.02, 4.6)
Demo version
0
2
4
6
8
10
12
14 N
NNE
NE
ENE
E
ESE
SE
SSE
S
SSW
SW
WSW
W
WNW
NW
NNW
Figure 19: Wind Speed Distribution and the corresponding Weibull distribution for the Afgaha site.
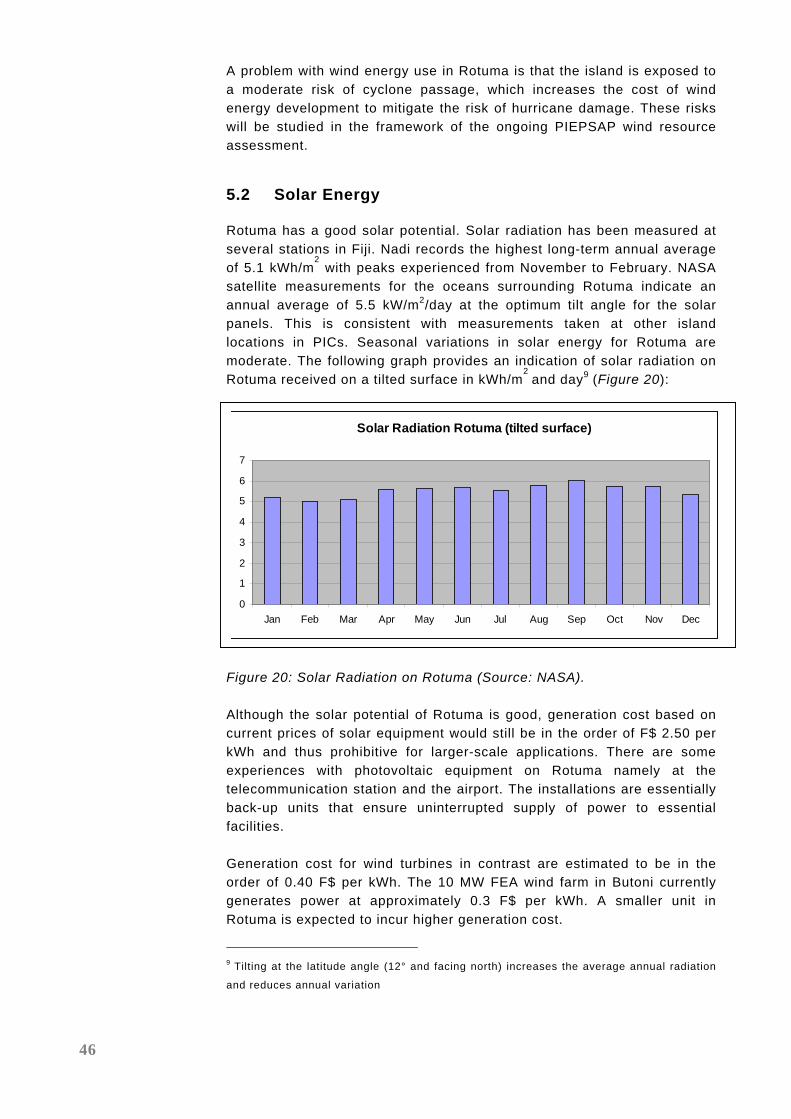
46
A problem with wind energy use in Rotuma is that the island is exposed to a moderate risk of cyclone passage, which increases the cost of wind energy development to mitigate the risk of hurricane damage. These risks will be studied in the framework of the ongoing PIEPSAP wind resource assessment.
5.2 Solar Energy
Rotuma has a good solar potential. Solar radiation has been measured at several stations in Fiji. Nadi records the highest long-term annual average of 5.1 kWh/m
2 with peaks experienced from November to February. NASA
satellite measurements for the oceans surrounding Rotuma indicate an annual average of 5.5 kW/m2/day at the optimum tilt angle for the solar panels. This is consistent with measurements taken at other island locations in PICs. Seasonal variations in solar energy for Rotuma are moderate. The following graph provides an indication of solar radiation on Rotuma received on a tilted surface in kWh/m
2 and day9 (Figure 20):
Figure 20: Solar Radiation on Rotuma (Source: NASA).
Although the solar potential of Rotuma is good, generation cost based on current prices of solar equipment would still be in the order of F$ 2.50 per kWh and thus prohibitive for larger-scale applications. There are some experiences with photovoltaic equipment on Rotuma namely at the telecommunication station and the airport. The installations are essentially back-up units that ensure uninterrupted supply of power to essential facilities. Generation cost for wind turbines in contrast are estimated to be in the order of 0.40 F$ per kWh. The 10 MW FEA wind farm in Butoni currently generates power at approximately 0.3 F$ per kWh. A smaller unit in Rotuma is expected to incur higher generation cost.
9 Tilting at the latitude angle (12° and facing north) increases the average annual radiation
and reduces annual variation
Solar Radiation Rotuma (tilted surface)
0
1
2
3
4
5
6
7
Jan Feb Mar Apr May Jun Jul Aug Sep Oct Nov Dec

47
5.3 Ocean Energy
5.3.1 Ocean Thermal Energy Conversion
Power can be generated from two sources of heat at different temperatures levels. The temperature gradients in tropical oceans provide a measure of the ocean thermal resource. As the surface water temperature usually lies between 24ºC and 33ºC, the temperature at depths of 500 to 1000 m remains between 3ºC and 9ºC. This gradient can be exploited through the Rankine cycle, a thermodynamic cycle that has been developed for conventional thermal power plant in which a liquid is evaporated, expanded and then condensed. Both an open and a closed version of the Rankine cycle have been tested. In the open cycle seawater is used as the working fluid. Warm surface water is evaporated under a partial vacuum. The steam produced propels a turbine, and is then condensed using cold seawater (4ºC - 7ºC) pumped from the deep ocean.
In the closed cycle a secondary working fluid such as ammonia, or freon is vaporised led through a turbine and re-condensed continuously in a closed system. The overall thermal efficiency of an OTEC plant is extremely low. It is only 2-3% when power required for pumping the water and losses are included in the evaluation. Another technical limitation for OTEC is the large size of machinery that is required to make use of the small temperature gradients. Although OTEC operating principles are well documented and no scientific or technical breakthroughs of great magnitude are required, the schemes tested so far have posed complex engineering and cost problems, and no prototype of commercial size has been built yet. For the foreseeable future the technology will not be relevant for locations such as Rotuma. 5.3.2 Wave Energy
Data on wave energy are available for some sites in the Fiji group. While wave conditions vary considerably depending on location and directional exposure the records provide an indication for available resources for the waters surrounding Rotuma. A regional wave energy monitoring project was conducted in the early 1990s with Norwegian funding. Wave height, wave periods and wave energy were recorded through data buoys moored off the shores of several islands. For an undisturbed site south of Kadavu an estimated annual average wave power of 22.9 kW per metre of wavefront was recorded. On the northern shores of Viti Levu and Vanua Levu, the resource was estimated from satellite data to be around 9 kW/m on average. A pilot project proposed for New Caledonia10 assumes an annual output of a “Pelamis” unit in the order of 1.8 GWh per annum at an average of 210 kW for a 1.2 MW unit. 10 Pelamis Project

48
Although a number of pilot activities are ongoing at various sites, there is no commercial technology available that could be deployed in Rotuma and therefore wave energy is at present not considered as a viable option for Rotuma. 5.3.3 Ocean Currents
Constant flows of ocean currents and near shore tidal currents carry significant amounts of energy that can be converted to electricity. The total worldwide power in ocean currents has been estimated to be about 5,000 GW, with power densities of up to 15 kW/m2. Currents flows are affected by wind, water salinity and temperature, topography of the ocean floor, and the earth's rotation. Most ocean currents are driven by wind and solar heating of the waters near the equator. Some ocean currents result from density and salinity variations of water. These currents are relatively constant and flow in one direction only, in contrast to the tidal currents closer to shore. Some examples of ocean currents are the Gulf Stream, Florida Straits Current, and California Current. A number of countries are pursuing ocean current energy, including Japan, China, USA and some European Union countries; however, marine current energy is at an early stage of development. There are no commercial grid-connected turbines currently available; only a small number of prototypes and demonstration units have been tested. Some of these technologies have been developed for use with tidal currents in near shore environments11. In 2003, the world’s first grid-connected tidal-current plant opened in Hammerfest, Norway. The 300-kW plant generates 700 MWh of electricity per year. Other locations pursuing tidal-generated power include San Francisco; Devon, England; and British Columbia. The near shore tidal current energy technologies employed could become interesting for locations such as Rotuma when commercially available. For marine current energy to be utilized, a number of problems need to be addressed, including avoidance of turbulence from cavitations (formation of air bubbles), marine growth build-up, corrosion control, conflicts with other potential uses of the same area of the ocean and mitigation of environmental impacts. Logistics of operation and maintenance are likely to be complex and generation costs are potentially high. At present ocean current turbines are not considered an option for Rotuma.
11 http://ocsenergy.anl.gov/guide/current/index.cfm
49
6.0 Feasibility of CNO as a Diesel Substitute
6.1 General Considerations
Most Rotumans feel that the island required a small-scale industry that provides stable income for low-income families and creates some added value on the island. At present this local source of income is copra. Although this opportunity will continue to exist provided that there is no fundamental change in government policy with respect to transport subsidies and price support for copra, more economic activities could be created on Rotuma if copra or coconuts were further processed on island. Even without the launch of a fuel substitution programme or biofuel programme, processing of coconuts into marketable products could increase the total income made on the island. Virgin coconut oil as an ingredient for high-quality cosmetics currently fetches prices in the vicinity of F$ 5.00 per litre12 and could thus be a viable proposition. High-quality CNO that fulfils US purity standards (Food and Drug Administration Certification) fetches a wholesale price of approximately F$ 3000 a ton. This is considerably more than the F$ 400 the local copra cutters currently get per ton of CNO equivalent. On the other hand the income that could be obtained from the export of high quality oil typically exceeds the value of a litre of pure, good quality CNO as a fuel substitute. In any event, there is a strong case to be made for the local production of a high-quality CNO rather than relying on the export of raw or tried copra at comparatively low prices. As it happens, the specification required for a viable diesel substitute are very similar to those required for high-quality CNO applications in both the cosmetics and food industries (total contamination, phosphorous, acid value, ash). While this study’s terms does not include an investigation into the supply chain management and marketing of high-quality oils for other purposes than fuel, it is argued that whatever effort will be made in these areas will be extremely beneficial if a project could demonstrate that a local production of CNO is feasible. A local CNO production would then offer a higher energy security for the island and at the same time provide the opportunity to supply other markets if and when this is more profitable than burning the oil in internal combustion engines.
6.2 Energy Demand Projections for Rotuma
This study uses a planning horizon of 15 years. This time line is considered sufficient to recover capital invested into CNO production. On the other hand it does not project too far into the future as uncertainty with
12 The PIFS Adviser, J. Morris, possesses more accurate data on this. They could,
however, not be released for reasons of commercial confidentiality

50
respect to commodity prices increases significantly when planning horizons are extended. We project both electrcity demand and total diesel demand which consists essentially of the fuel used for power generation and all other uses (transport, machinery).
6.2.1 Electricity
In case of electricity the prediction of demand is more complex than forecasting fuel demand. With electricity both energy demand and load, i.e. the demand in relation to time needs to be forecasted. Demand forecasting is basically an attempt to comprehend the developments in electricity demand in a comprehensive manner and to advance knowledge by frequently gathering and evaluating information on consumer demand and its elasticity. External factors that may influence demand, such as economic development, demographic and technological changes also need to be analysed in order to predict changes in the electricity demand. Demand forecasting for a very small electricity market like Rotuma’s is composed of two aspects: (a) changes that occur steadily in response to changes like aggregate income, population growth, and migration; and (b) changes that occur suddenly, motivated by investment decisions of the government or private sector. As development occurs in a society both are expected to grow over time. In the case of Rotuma, there are however, external constraints such as restricting supply to a number of hours per day. While the intensity of domestic electricity use is driven by household income (a function of employment, wage levels, and remittances) and electricity price, appliance purchase (especially refrigeration and air conditioning) is also a response to variations in service levels, i.e. a middle-income household may not purchase a refrigerator when power is only available for 4 hours a day and food cannot be safely stored in this appliance. Commercial and government demand is currently also constrained by restricted service levels. The commercial sector usually responds to these conditions with the procurement of independent generation capacity. In Rotuma there is a possibility of larger future loads forced by discrete projects such as the building of a new hospital complex, the upgrading of schooling facilities (computer lab and e-learning) and the establishment of an oil extraction facility itself. There is also a remote chance of some specialised tourism (such as game fishing) emerging. Such projects need to be tracked closely and the Rotuma Island Council will need to develop a consultative process that enables them to keep abreast of all relevant changes in a timely way. Forecasting future electricity demand for Rotuma is difficult as there are no reliable historical data on consumption. However, there is some information that can be used to arrive at a plausible guess with respect to the current situation. We have used the reported average operating hours of existing generators and compared them with the reported fuel consumption. This compilation produces plausible results if we assume a

51
low average capacity factor13 in the order of 20-25 %. Average specific fuel consumptions at an average capacity factor of 25 % would be approximately 0.46 litres per kWh a plausible value for the type of power generation found in Rotuma. Reported fuel consumption data and operating hours have been compiled to arrive at an estimate of average daily electricity generation and associated fuel consumption. Table 10 displays the results. Table 10: Current Power Generation on Rotuma Accordingly, total average daily generation is approximately 470 kWh that includes 324 kWh used in water pumping alone. The total amount of fuel used is approximately 360 litres per day or 132,000 litres per year. Given the low efficiency that prevails in electricity generation on Rotuma, at least 15% of this fuel could be conserved through adequate sizing and better management of the generators. 6.2.2 Liquid Fuels
Apart from electricity generation diesel fuel is mainly used in road transport and in construction machinery operated by PWD or their
13 Average load divided by rated capacity
Location kVA Phase (l/day) Op hours kWh/day SFC l/kWh
Itu’ti’u Hapmak 17.5 3 10 4 17.5 0.571Motusa 40 3 18 6 60.0 0.300
10 1 5 4 10.0 0.5006 1 2 2 3.0 0.667
Ahau 44 3 57 8 88.0 0.648Lau 17 3 4 3 12.8 0.314Losa 15 3 5 3 11.3 0.444Savlei 25 3 7 4 25.0 0.280Tuakoi 16 3 6 4 16.0 0.375
Malhaha Elsio 5 1 6 4 5.0 1.200Pephaua 10 3 7 4 10.0 0.700Else’e 13 3 10 4 13.0 0.769
Oinafa Lopta 20 3 10 5 25.0 0.400Oinafa 8 3 12 10 20.0 0.600
Noa’tau Maragtteu 27 3 17 6 40.5 0.420Kalvaka 16 3 12 6 24.0 0.500
Pepjei Pepjei 15 3 4 3 11.3 0.356Juju Tuai 7 1 3 3 5.3 0.571
Haga 16 3 7 4 16.0 0.438Mission 8 3 4 2 4.0 1.000Juju 6 1 6 4 6.0 1.000
Itu’muta Maftoa 10 3 6 4 10.0 0.60013 3 8 5 16.3 0.492
Water Supply 108 3 133 12 324.0 0.412Totals 472.5 359 773.8 0.464

52
contractors. Assuming a total supply of 185,000 litres in 2006, these other uses account for approximately 53,000 litres per annum. The other fuel products imported into Rotuma can either not be replaced by CNO (as in the case of petrol) or are insignificant in terms of quantities. Our base case scenario for Rotuma’s diesel fuel demand over the period 2008 – 2018 assumes a moderate growth rate of 2.5 % p.a (Figure 21). This business as usual scenario does not consider any major developments such as investments in tourism or fisheries nor does it assume discrete demand increases from infrastructure developments (hospital, schools, water). In case an inter connected 11 kV grid is installed on the island, that supplies 24 hours electricity, consumption of electricity will probably increase by 30 – 40 %. As such a centralised system would achieve a higher efficiency, i.e. the increase in specific fuel consumption would be less than the increase in demand.
Figure 21: Diesel Fuel Demand Forecast 2008 – 2022. Our base case scenario foresees an increase in annual diesel consumption to approximately 200,000 litres in 2010 and to approximately 270,000 litres in 2022. This is equivalent to approximately 290,000 litres of CNO in the base case and 335,000 litres in the high case. As described in section 5, the CNO production potential of Rotuma exceeds high case demand projections for diesel fuel by a factor of 2. Unlike the fuel requirements for transport, diesel use in electricity generation can not only be replaced by biofuel but also by other local resources as described below.
6.3 Technologies Using Local Energy Resources
6.3.1 Solar
Rotuma has a good solar potential throughout the year and there are a few photovoltaic installations on the island. The resource is usable as a fuel
Diesel Fuel Demand Forecast
0
50000
100000
150000
200000
250000
300000
350000
2008 2009 2010 2011 2012 2013 2014 2015 2016 2017 2018 2019 2020 2021 2022
Low CaseHigh CaseBase Case

53
saver in hybrid configurations i.e. connected to individual diesel systems. There are, however, limitations to this. Firstly, the operating hours of most diesel systems (early morning and evening) do not coincide with sunshine. Solar generation would thus require battery storage which makes a costly way of generating electricity even more expensive. Secondly, generation cost would be in the order of F$ 2.5 per unit and thus higher than those of a well-run diesel system under current supply cost. In case of an interconnected system that operates 24/7 the solar option would be easier to establish. In case such a system (either based on CNO, diesel or in a hybrid configuration) would be realised it is recommended to review the option of grid connected solar again. Stand alone “Solar Home Systems” do not have a market in Rotuma as practically all households are connected to a power grid. For the purpose of this study, solar will therefore not be further analysed. 6.3.2 Wind
At present there are only fragmented data on Rotuma’s wind resource. Within the next 12 months, however, there will be sufficient data to evaluate technical the feasibility and generation cost in detail.14 Available data suggest that wind based power generation will be significantly less costly than solar. Thus, wind also offers the option of fuel saving in a grid parallel operation. Again, this required the establishment of an inter connected grid system on the island. Generation cost are expected to be in the vicinity of F$ 0.4 – 0.5 per kWh15. While this is lower than diesel based generation at current supply cost, it is technically quite demanding to achieve wind penetration figures that justify the complexity and technical vulnerability of a wind/diesel hybrid system.
Due to the intermittent nature of wind, wind turbines alone cannot supply an isolated electric network. They need diesel generators or battery storage as a dispatchable sources of electricity.
14 This study will be updated as soon as wind data from the PIEPSAP funded wind
monitoring unit becomes available 15 FEA’s 10 MW Butoni wind farm produces power at approximately F$ 0.30 per kWh
Figure 22. Wind Monitoring Mast on Rotuma.

54
Such systems have been implemented in a number of locations including remote islands comparable to Rotuma. However, the majority of wind-diesel hybrid systems operating worldwide are diesel driven isolated electric networks with wind turbines in grid-parallel operation with low wind penetration figures typically in the range of 5-15%. Wind turbines in such systems are also referred to as fuel savers. The actual penetration rate of standard grid parallel systems depends on both the wind resources and the load curves. In order to ensure grid stability, a simple rule of thumb can be applied for simple grid parallel systems: The wind generated electricity at any time should not be greater than the power supplied from the diesel generator(s). A second option exists if the isolated network incorporates consumers that are dispatchable and not time bound. In conjunction with water pumps or ice making facilities grid-parallel wind-diesel systems can achieve wind penetration rates of up to 30 %. In Rotuma, the water-pumping load is quite significant and ice making could also be an option. Higher wind penetration can also be achieved through the use of a resistor bank that turns surplus wind power into hot water. This, however, is not really advisable in the absence of a demand for large quantities of hot water. Higher penetration rates also require additional grid-stabilising measures, such as dynamic reactive power compensation if asynchronous generators are being used. Technically, there is also the possibility to achieve very high wind penetration (80% and higher) through the integration of battery storage, fast acting mechanical storage (flywheel) and an intelligent control system. Given a good wind resource, such a system can avoid situations when diesel generators have to operate at low specific fuel consumptions that result from low engine loads. The diesel can even be switched off completely. While technically feasible (a few systems have been realised world wide) this configuration has three major drawbacks: Firstly, the systems are not suitable for situations with high load growth. Secondly, the systems are quite complex and require highly-trained operating staff. Thirdly investment cost for such integrated systems are very high resulting in electricity supply cost that may exceed the supply cost of conventional diesel generation. Thus, for the Rotuma situation, the second option of a conventional high-penetration configuration in conjunction with water pumping seems the most appropriate at this stage.
6.4 CNO as a Diesel Substitute
The detailed resource assessment described in Section 5 clearly shows that CNO could be produced in sufficient quantities to meet Rotuma’s demand for diesel in vehicles, pumps and power generation. Technical challenges associated with biofuel production and use will be discussed next.

55
6.4.1 Oil Production
It is well documented that the good quality of the vegetable oil that is used as a diesel substitute is an important precondition for a long-term, trouble-free operation. Those insights have triggered a comprehensive research to analyse relevant fuel properties of vegetable oil and to define appropriate testing procedures. This work has eventually led to the German industrial standard DIN V 51605 which specifies properties for vegetable oil used in adapted engines. Although this standard is based on rapeseed oil it provides a good quality guideline for any fuel-grade oil production. It should be noted that maintaining these standards requires serious efforts in working hygiene and quality control: Tests of supposedly fuel-grade oils from 30 small-scale oil mills in Germany in 2003 has shown that only four mills supplied vegetable oil that reliably matched the standard. I.e. quality control will also be a major issue in any oil production facility on Rotuma. There are two methods to produce CNO in an island community such as Rotuma: Firstly, there is the conventional Mini Mill (expeller) that uses copra as an input (Figure 23). The copra needs to be sufficiently dry to minimise moisture content in the oil. Residual moisture content of 5 % is desirable. This is achievable by the traditional copra drying process or through solar drying. Dried copra is cut and then sent through an expeller, typically a continuous screw press. Thereafter, the oil settles in a tank and is then filtered. Centrifuge, press filters, bag filters or a combination are typically used to achieve the required filtration. Cooking the oil drives out residual water content. The oil quality obtained in such processes depends mainly on the quality of the copra input. Contaminated copra yields high total contamination values of the oil (standard according to DIN V 51605 max. 24 mg/kg). If copra is left lying around its surface oxidizes and the oil extracted from such copra becomes rancid. This results in high acid values that easily exceed acceptable values.16 While sub-standard oils will still burn in diesel engines, additional cost of maintence and repair will increase significantly.
16 PIEPSAP had a CNO sample from Marshall Islands tested in a certified lab. The acid
value was 8.64 mgKOH/g and thus more than 4 times the maximum value of DIN 51605.

56
Figure 23: Mini Expeller and Filter Press with approximately 15 l/hour capacity (Oekotec Germany) Secondly, there is the so-called Direct Micro Expeller (DME) process that uses grated wet copra. The product is also called virgin oil (VCO) and is typically used for cosmetic and food purposes. The oil is clear and has little odour. Good filtration, sometimes in centrifuges and fermentation are also common steps in the process of producing VCO. Both methods are suitable for producing a diesel substitute. However, the DME process is labour intensive and – given a good quality control – produces an oil that fetches wholesale prices in the order of F$5-10 per litre. In principle both options could be used in Rotuma. The low labour productivity of the DME process may, however, not be suitable for Rotuma where labour is not abundant. The labour productivity of a simple DME process would be in the order of 1 litre per worker per hour. This does not seem to make much economic sense if a diesel substitute is being produced whose value is F$ 2 per litre. As our copra harvesting trials have clearly shown, a copra cutter who only needs a cane knife can earn F$3-5 an hour by cutting copra. Although there are more mechanised ways to produce VCO from freshly ground copra, the investment requirements increase accordingly. Although both the Mini Mill and the DME plant could be used to produce coconut oil on a remote island a Mini Mill seems to be a more appropriate route if fuel is the main product. While the Mini Mill is more efficient and less labour-intensive it requires at least one skilled operator who can maintain the mill and train other staff. Although we consider the mini-mill option as more appropriate if fuel is the main product a DME oil extraction unit could still be a sensible project for Rotuma but it should aim for the cosmetics market where wholesale prices in the order of F$ 5 are achievable if the workforce is devoted to maintaining high quality standards of its product. Given our demand projections for diesel, an initial oil production should not exceed 100,000 – 120,000 litres per annum, (at 200 working days approximately 500 – 600 litres per day or 60 – 70 litres per hour). Mills that can produce these quantities are readily available from a number of sources (China, Germany, Malaysia, India). A production of 100,000 litres per annum would not be sufficient to substitute all diesel currently consumed on Rotuma. It is however, unlikely that a full substitution of all diesel is technically feasible. There will be numerous applications that require blending of CNO with diesel in order to avoid damage to the respective engines. Should a CNO production facility aiming to substitute diesel be established in Rotuma, there is a need to enforce a serious quality control and to check oil quality regularly. The most critical parameters include: Acidity, total contamination and water content.
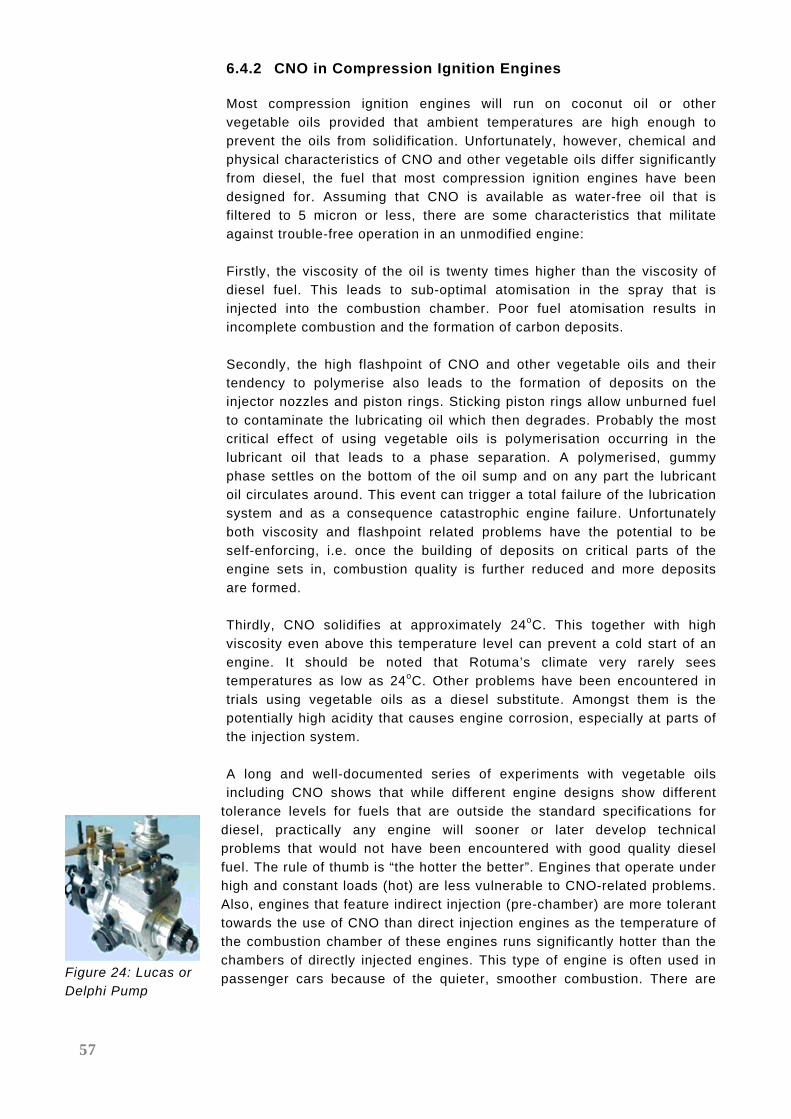
57
6.4.2 CNO in Compression Ignition Engines
Most compression ignition engines will run on coconut oil or other vegetable oils provided that ambient temperatures are high enough to prevent the oils from solidification. Unfortunately, however, chemical and physical characteristics of CNO and other vegetable oils differ significantly from diesel, the fuel that most compression ignition engines have been designed for. Assuming that CNO is available as water-free oil that is filtered to 5 micron or less, there are some characteristics that militate against trouble-free operation in an unmodified engine: Firstly, the viscosity of the oil is twenty times higher than the viscosity of diesel fuel. This leads to sub-optimal atomisation in the spray that is injected into the combustion chamber. Poor fuel atomisation results in incomplete combustion and the formation of carbon deposits. Secondly, the high flashpoint of CNO and other vegetable oils and their tendency to polymerise also leads to the formation of deposits on the injector nozzles and piston rings. Sticking piston rings allow unburned fuel to contaminate the lubricating oil which then degrades. Probably the most critical effect of using vegetable oils is polymerisation occurring in the lubricant oil that leads to a phase separation. A polymerised, gummy phase settles on the bottom of the oil sump and on any part the lubricant oil circulates around. This event can trigger a total failure of the lubrication system and as a consequence catastrophic engine failure. Unfortunately both viscosity and flashpoint related problems have the potential to be self-enforcing, i.e. once the building of deposits on critical parts of the engine sets in, combustion quality is further reduced and more deposits are formed. Thirdly, CNO solidifies at approximately 24oC. This together with high viscosity even above this temperature level can prevent a cold start of an engine. It should be noted that Rotuma’s climate very rarely sees temperatures as low as 24oC. Other problems have been encountered in trials using vegetable oils as a diesel substitute. Amongst them is the potentially high acidity that causes engine corrosion, especially at parts of the injection system. A long and well-documented series of experiments with vegetable oils including CNO shows that while different engine designs show different
tolerance levels for fuels that are outside the standard specifications for diesel, practically any engine will sooner or later develop technical problems that would not have been encountered with good quality diesel fuel. The rule of thumb is “the hotter the better”. Engines that operate under high and constant loads (hot) are less vulnerable to CNO-related problems. Also, engines that feature indirect injection (pre-chamber) are more tolerant towards the use of CNO than direct injection engines as the temperature of the combustion chamber of these engines runs significantly hotter than the chambers of directly injected engines. This type of engine is often used in passenger cars because of the quieter, smoother combustion. There are Figure 24: Lucas or
Delphi Pump

58
also engine components that do not tolerate the use of CNO-based fuels. The Lucas type rotary injection pump pictured in Figure 24 is such a component. If an engine is equipped with such a pump, it is not advisable to even trial CNO or CNO blends. In order to avoid engine problems that stem from the use of CNO three strategies can be applied:
Adaptation of Utilisation Pattern; Adaptation of Engine; and Adaptation/Processing of fuel
6.4.3 Adapted Utilisation Pattern
In an adapted utilisation pattern a user who is aware of the specific requirements of using CNO pays close attention to avoid the engine running on low loads and in idle speed as much as possible. Obviously, this would be difficult in most land transport situations where numerous individual vehicles are used by individual operators. “Adapted” utilisation also implies a change in maintenance procedures. Oil and filter exchange intervals are reduced and regular cleaning of the outside of the injection nozzles would be recommended. Caution with respect to irregularities is also needed, i.e. when a fuel filter is recognized as clog up, it is immediately changed. In case of obvious malfunctioning, use of the engine is stopped and the support of a technician is sought. To some up the option to rely on adapted utilisation is risky and required a very skilled operator to be recommendable17. 6.4.4 Adapted Engines
Adaptation of engines can involve a number of measures. The most common being the fitting of a dual-tank system with switches and the pre-combustion heating of CNO via heat exchanger. Other measures include but are not necessarily limited to the following:
Replacement of seals and hoses of the fuel-supply system that are not vegetable oil compatible.
Fuel hoses which are replaced with larger diameter hoses, to reduce resistance to the flow of fuel.
Exchange of fuel pump for a model with higher volumetric yield or an additional fuel pump.
Installation of cleanable fuel pre-filters to reduce the need for fuel filter replacements.
Installation of parallel fuel filter with a switching device.
17 Fürstenwerth, D. (2006) “Potentials of Coconut Oil as Diesel Substitute in Pacific island
countries” MSc. Study, Aachen RWTH University, Germany
59
A heat exchanger is added before or at the fuel filter to reduce viscosity of the oil in the filter.
Installation of an additional electrical pre-heater in one-tank systems to assist in cold starting.
Replacement of glow plugs with a model of higher heating capacity (hotter start up).
Replacement of glow plug control to allow a longer glow time. Installation of electrical resistance heating of the injection
nozzle. Advance of injection timing to provide more time for good
air/fuel mixture. Increase of opening pressure of the injection nozzles to
improve the spray pattern and atomisation Thermal isolation of piston to achieve higher combustion-
chamber temperatures (direct injection only). Reduction of oil change and fuel filter change intervals.
These modifications can reduce fuel-related problems but hardly completely avoids them. There are a few adapted engines where manufacturers and/or suppliers provide limited warrantee for vegetable oil operation. One of these engine models that had its warranty officially extended to the use of vegetable oil is the Deutz 912W series. These engines are available with 3 to 6 cylinders (35 to 69 kW in the original version) and feature a swirl chamber type indirect injection (pre-chamber). Even without modification this engine has shown considerable tolerance when operated on good quality vegetable oil. There are reports of a 600-hour test that showed no problems with 100 % vegetable oil.18 If sold for the use of vegetable oils, these engines are equipped with a second fuel tank and an additional fuel pump to start and stop on diesel. Unfortunately, the main supplier of the engine the “Henkelhausen GmbH & Co. KG, Krefeld”, does not offer the vegetable oil version any more. Suppliers, such as “Energy Relais” in France still offer this engine configured for vegetable oil use today. On Rotuma there are several Deutz engines in operation, however without the additions mentioned above. Together with the Lister engines they would be candidates for trials provided good quality oil can be supplied and the load management ensures a hot operation for the engines. In general, it is important that an engine operator (vehicle or generator) is fully aware of the potential problems that can be caused by using CNO or CNO blends as a fuel. Problems do seldom develop suddenly. Normally there are preliminary signs that indicate that trouble is developing. These signs include frequent filter clogging, loss in engine power, unusual exhaust fume colour, overheating of engine, loss or undue increase in oil pressure, fuel leaks, carbon deposits at injector nozzles and cold start difficulties. When these signs are read, understood and acted upon,
18 Knuth, H. (senior scientific engineer, Deutz AG, Germany)

60
serious damage to the respective engine can normally be avoided. Therefore, it is recommended that all users of CNO or CNO blends be properly briefed before these alternative fuels are used. It is also recommended to compile a concise brochure that describes the requirements for trouble free CNO operation together with a trouble shooting guideline. 6.4.5 Adaptation of Fuel
The technical problems with straight vegetable oils can be overcome through a chemical transformation of the oil into so-called biodiesel. This fuel is standardised and consists of vegetable oil methyl ester (ASTM-D 6751 in the US and EN14214 in the EU). If used in low-level blends up to 5% practically, all engine manufacturers extend their warranties to the fuel. The majority of engine manufactures allow larger proportions of biodiesel, typically up to 20%. Some manufacturers extend warranties for 100% biodiesel use for certain engine models. In Europe mainly rapeseed oil is esterified. However, there is also a growing body of experience with CNO esterification mainly in the Philippines. The process involves methanol and a catalyst (in most cases sodium hydroxide) and produces glycerine as a by-product usable in soap manufacturing. The biodiesel market in Europe has grown to approximately 1.8 million tonnes per annum driven by very large government incentives in the form of tax exemptions. Production of biodiesel incurs considerably cost. They vary between F$ 0.5 per litre for large-scale industrial productions to a level above F$ 1 for small-scale productions that would be required for a situation such as Rotuma. At today’s prices for CNO and diesel this is considered prohibitive. The hope to offset this comparatively high cost by the sale of glycerine has been frustrated in recent years as the large volumes generated in Europe’s biodiesel production have seriously depressed the market price for this product. While small size-plants to manufacture biodiesel are available biodiesel production is not considered recommendable for a remote location such as Rotuma. Firstly, production cost would be very high. Secondly, the process involves a highly-toxic chemical (methanol) that has to be imported. Thirdly, the process is demanding with respect to working hygiene and quality control. It should also be noted that CNO is not an easy feedstock for biodiesel. The high content of free fatty acids makes the conventional alkali catalysed esterification difficult. Thus, we will focus on the use of straight clean CNO or blends of diesel and clean CNO in adapted or un-adapted engines. Ruling out esterification for Rotuma leaves the option of blending CNO with diesel oil in order to improve fuel properties of the straight CNO. CNO mixes well with diesel in any blend provided the diesel used is water free.19
19 If diesel is contaminated with water a gel like substance forms that clogs filters rapidly.

61
Clearly, the higher the diesel content the closer the blend’s fuel properties are to straight diesel oil. For Rotuma’s situation blending is evidently an interesting option if a conservative approach is taken. Whenever there is doubt bending should start with low ratios of CNO in order to build experience and operators’ confidence. There is a considerable variety of diesel engines on the island and a CNO – diesel blend may reduce technical problems considerably in certain engines whose design and operating mode are not conducive to CNO use. It is difficult to advise on blending ratios, but a relatively safe approach is to start tests for a certain application with a low level blend i.e. 10 – 20 % CNO and test it. Depending on results the content of CNO can then be gradually increased. It should be noted that blending of diesel and CNO requires the CNO to be water free. Even small contaminations with water that would be tolerated when used as straight CNO are known to cause filter clogging through the formation of a gel like substance.

62
7.0 Economics of CNO based Fuels
7.1 CNO Production Cost
In this section the economics of CNO production are being discussed. Essentially we attempt to answer the question whether a Rotuman-based CNO production in the order of 100 tonnes of oil per year could be a profitable business either as a project that exports CNO or supplies CNO to the local fuel market. Assuming a market potential for approximately 100 tonnes of CNO p.a. as a fuel substitute on Rotuma, there are essentially two approaches to achieve such a production: a) a centralised medium-scale milling operation that produces the total amount at one production site; and b) a decentralised approach where CNO is produced in several (or all) villages on Rotuma. Clearly the centralised approach has the advantages of lower production cost (economies of scale) and an easier quality control of the final product. The decentralised approach reduces transport cost (copra and CNO) and allows a gradual introduction of the technology. We recommend aiming for a central production facility, although a decentralised approach remains a possibility. 7.1.1 Assumptions
All financial and economic calculations are based on a 20-years project. The assumed discount rate is 15%, average inflation rate is assumed to be 2 %. All costs are escalated using this inflation rate. Revenues are also inflated using 2 %. We assume that CNO is produced from dried copra. Copra is currently bought at 0.12 $/kg ($120 per tonne) at the roadside. Transport to the extraction facility is considered to average about $ 40 per tonne. The copra is dried in a traditional copra dryer which is assumed to cost $ 50 per tonne of fresh copra. Moisture content of fresh copra is assumed to be 45%. Residual moisture after drying will be between 5 and 10 %. Extraction rate is assumed to be 1.75 kg of dry copra per kg of oil equivalent to an extraction rate of 57%20; i.e. a facility that aims at producing 100 tonnes of oil per annum needs to purchase 250 tonnes of fresh copra. At 250 working days per year and 8 hour shifts, a minimill capable to produce 60 litres of oil per hour is required. The mill is assumed to consist of a copra cutter (2.5 kW) a screw press 7.5 kW and a filter press of 1 kW. It is assumed that two units will be installed (one stand-by unit). Cost of mechanical equipment is assumed to be US$ 45,000 transport and installation is assumed to be US$ 8000. A production shed is assumed to cost US$ 30,000. Lifetime of mechanical equipment is
20 Note that larger mills operate at approximately 62 – 65 % extraction rates

63
assumed to be 6 years, the building’s lifetime is 20 years. Maintenance cost are assumed to be 5% of capital investment. Further assumptions include:
Electricity Value: 0.5 US$ per kWh Consumption 22,647 kWh per annum Labor rate: 1.85 US$ per hour (3 FJ$) Number of staff: 5 200 l Drum Use: 130 p.a. Value of press cake: 100 US$ per tonne21
7.1.2 Cost per Litre CNO
Based on the assumptions enumerated above we have run a simple financial model covering expenses and revenue over a 20-year project period. As a base case scenario we assume that the CNO is produced by a private enterprise. Such a venture had to aim for a financial rate of return on capital in the order of 20 %. We therefore try to define a wholesale price that would allow this rate of return. The following spread sheet displays the results of our base case: Table 11: Cash Flow and Internal Rate of Return Base Case
21 Current world market price approximately 220 US$ per tonne
Year Copra Maintenance Capital Labour Electrcity Drums Total CNO Cake Total Net Cash1 0 83,000 - 0 0 83,000 - - - (83,000) 2 53,288 4150 0 19,063 11,324 2574 90,398 100,644 5,500 106,144 15,746 3 54,353 4233 0 19,444 11,550 2625 92,206 102,657 5,610 108,267 16,061 4 55,440 4318 0 19,833 11,781 2678 94,050 104,710 5,722 110,432 16,383 5 56,549 4404 0 20,230 12,017 2731 95,931 106,804 5,837 112,641 16,710 6 57,680 4492 0 20,635 12,257 2786 97,849 108,940 5,953 114,894 17,044 7 58,834 4582 0 21,047 12,502 2841 99,806 111,119 6,072 117,192 17,385 8 60,010 4674 53,000 21,468 12,752 2898 154,803 113,342 6,194 119,536 (35,267) 9 61,211 4767 0 21,898 13,007 2956 103,839 115,608 6,318 121,926 18,088
10 62,435 4862 0 22,336 13,267 3015 105,915 117,921 6,444 124,365 18,449 11 63,683 4960 0 22,782 13,533 3076 108,034 120,279 6,573 126,852 18,818 12 64,957 5059 0 23,238 13,803 3137 110,194 122,685 6,704 129,389 19,195 13 66,256 5160 0 23,703 14,079 3200 112,398 125,138 6,839 131,977 19,579 14 67,581 5263 0 24,177 14,361 3264 114,646 127,641 6,975 134,616 19,970 15 68,933 5368 53,000 24,660 14,648 3329 169,939 130,194 7,115 137,309 (32,630) 16 70,312 5476 0 25,153 14,941 3396 119,278 132,798 7,257 140,055 20,777 17 71,718 5585 0 25,657 15,240 3464 121,663 135,454 7,402 142,856 21,193 18 73,152 5697 0 26,170 15,545 3533 124,097 138,163 7,550 145,713 21,616 19 74,615 5811 0 26,693 15,856 3604 126,579 140,926 7,701 148,627 22,049 20 76,108 5927 0 27,227 16,173 3676 129,110 143,745 7,855 151,600 22,490
Value CNO FJ$/Litre 1.50Diesel Equivalent FJ$/Litre 1.63 IRR 15%
Cost in US$ Revenue US$

64
As the table above shows, a 15 % IRR requires a CNO wholesale price ex-production facility of 1.50 F$ per litre. Considering lower volumetric heating values of CNO this amounts to 1.62 in diesel equivalent. In other words if and when the local diesel price goes above 1.62 FJ$ per litre it is worth considering the use of CNO. This does however not account for additional downstream cost of using a fuel that is outside the normal specifications for diesel. Such costs are incurred through increased maintence, shorter life of engines etc. They will be assessed in detail in Section 7.2.2. In order to demonstrate the production cost range we have also defined best and worst case scenarios. Assumptions and results are shown below:
Table 12: Sensitivity Analysis
The sensitivity analysis shows a production cost band of approximately 0.40 FJ$ in the production cost per litre of CNO, i.e. an operator/investor who is accepting a lower IRR and saves on raw material, investment and labour will be able to produce CNO at FJ$ 1.35 per litre. This scenario could be possible in a community project where raw material is partly supplied as a community contribution. On the other hand a purely private sector investor who needs a return commensurate with the risk of such an investment demands 25% IRR. He invests in top-grade equipment and pays an average wage of F$ 3.5 per hour and procures raw material at FJ$ 600 per tonne of oil would require a CNO price of FJ$ 1.75 per litre.
We have also tested the impact of a donor contribution of US$ 50,000 against the initial investment. This scenario leaves all base case assumptions intact including the financing of replacement of mechanical equipment every six years. In such a case the required ex factory price for CNO is FJ$ 1.40 or FJ$ 1.52 in diesel equivalent.
7.2 Cost of Using CNO
As discussed in Section 6 the use of straight CNO or blends of CNO and diesel will impose additional cost on the user of such non-spec fuels. We assume here that the production unit on Rotuma will be able to ensure quality standards in line or close to the German standard DIN V 51605. Adherence to this standard will be keep fuel-related downstream costs at a minimum. A typical and well-known problem occurring when vegetable oils are used is clogging of fuel filters. This hinders the flow of fuel to the
Best WorstIRR Target 10% 25%Raw Material Cost 500 600Investment cost -15% 15%Labor $/hour 2.5 3.5Cost CNO FJ$/l 1.34 1.75Diesel equivalent F$/l 1.46 1.90

65
engine, reduces power output and eventually causes the engine to stop. The fuel filter has to be replaced as soon as it starts to clog up, which incurs cost.
The most important fuel characteristics that determine additional cost are listed in Table 13 together with options to mitigate deviations from the standard:
Table 13: Selected Fuel Properties DIN V 51605
DIN V 51605 sets specifications for modern car engines that have been adapted to run on vegetable oils. Fuel quality requirements of such engines tend to be amongst the most restrictive, hence certain values of the standard can be considered as overly conservative for cases where indirect injection engines are used that are more tolerant to fuel quality. It needs to be understood, however, that even if the above standard is strictly adhered to, the user of CNO-based fuels will incur additional cost that could have been avoided if diesel fuel was used. We distinguish three categories:
Retrofitting cost (dual tank, valves, fuel hoses, fuel heater, additional filters).
Operating cost (more frequent oil and filter changes, cleaning of injectors).
Engine overhaul, major repair and replacement after catastrophic failure.
It should be noted that the exact amount of additional cost depends on a large number of parameters other than adherence to good fuel quality mentioned above. These include, but are not limited to, the following:
Load (high, constant loads reduce additional operational cost).
Engine size (larger engines tend to incur less additional cost).
Slow speed engines typically incur lower additional cost (large slow speed engines designed for the use of heavy fuel oil are therefore well suited for vegetable oil use).
Lower compression ratios incur higher cost. General wear and tear on the respective engine.
Property Value Unit MitigationHeating Value min 36 MJ/kg Mixing with DieselKinematic Viscosity max 36 mm2/s Heating prior to cpombustionCarbon Residue max 0.4 % Mixing with DieselTotal Contamination max 24 mg/kg Good Filtration, HygieneAcid Value max 2 mg KOH/g Caustic soda removal of soapAsh Content max 0.01 % Good Filtration, HygieneWater Content max 750 mg/kg Proper Copra drying, heating CNO
Figure 25. Historical Engine

66
Quality of lube oil used (the use of higher quality lube oils may reduce other additional cost, but incurs an additional cost in itself
Age of engine design. (So-called historical engines are generally more tolerant towards vegetable oil use than modern engines. Engines of this type are still manufactured in India, Figure 25).
7.2.1 Retrofitting Cost
As there are numerous suppliers of retrofit kits, the first cost category can be easily determined. For a diesel engine in the 50 – 100 kW range a complete retrofit kit with additional tank, valves, fuel heater, hoses and filter is in the order of US$ 800 – 1500 (Figure 26). A heat exchanger with hoses and connectors cost approximately US$200 and a special filter cost approximately US$ 30.
Figure 26: Two conversion kits, a special vegetable oil filter and a fuel heater.
The conversion of a 30-kW diesel generator to a full dual-fuel unit with switch valves, dual tank etc would cost approximately US$ 5,000. There are also vegetable oil generator sets that are designed for use of vegetable oils. Such a unit would use a modified engine, typically with a cylinder head that features a pre-chamber (indirect injection) adapted pistons, special injector pump and injector nozzles, fuel switching, dual tank etc. Such units are manufactured in small quantities often as individual units per special order and are quite expensive. The nature of

67
the retrofitting involves very significant economies of scale as the comparison of two different generator sizes show. These are ex-factory prices from Energie Relais, France without packaging. The specific investment cost (US$/kVA) more than double for a 29 kVA genset in comparison with the larger 104-kVA unit (Figure 14a).
Table 14a: Investment cost for a 29 KVA vs. a 104KVA unit.
Fully-adapted engines and generator sets for CNO that carry a supplier warranty22 cost more than twice the cost of a regular diesel unit and thus require a substantial price differential between diesel supply cost and CNO production cost. We will discuss this in detail in Section 7.3.
In response to growing interest in using straight rapeseed oil for on-farm and other stand-alone power generation in Europe there are now also a few generator sets available that are configured to run 100 % on rapeseed oil, i.e. these generators are equipped with indirect ignition engines and additional fuel filtering and heating but without a dual tank system and three-way switching valves and controls. These generators are considerably cheaper than the more complex dual fuel systems adapted to CNO. Some examples are listed in Table 14b.
Table 14b: Ex factory cost for rapeseed oil generators
The units listed in Table 14b carry a warranty of 1 year when operated on straight rapeseed oil. Given that Rotuma hardly encounters ambient temperatures that cause CNO to solidify these units could work quite well on straight CNO, especially when a good loading can be guaranteed.
22 It should be noted that the supplier of the generator sets listed above provides a
warranty that is limited to 2000 hours only
Base Engine KVA US$ US$/KVADeutz F4L 412 29 51300 1769Deutz F8L 413 104 82350 792
KVA Engine Make Cost ex Europe US$6 Lombardini 125128 Lombardini 133829 Perkins 1414411 Lombardini 1400813 Perkins 1450020 Perkins 15912
at 1.36 US$ per Euro

68
7.2.2 Operating Cost
Additional operating costs include mainly more frequent oil and filter changes and more frequent general service intervals. Additional cost also arises from the need to adapt utilisation pattern. Costs of operating a generator at higher loads than normally required fall into this category. In practical terms this could for instance mean that when a village generator is operated on CNO all electricity consumers such as lights are kept on even if not required. Engine modifications that may be needed to accommodate CNO may also increase specific fuel consumption. An example would be to convert a direct-injection (DI) engine to an indirect-injection unit that is inherently less efficient than the DI version due to higher thermal losses. For the purpose of our financial and economic analysis we assume that a operating cost premium is needed to compensate for additional operating costs that stem from more frequent oil changes, filter changes etc. For example, an engine that is operated 500 hours a year having an average consumption of 10 litres24 of fuel per hour would require an additional FJ$ 500 per year in Operation and Maintenance (O&M). A generator set that runs 1000 hours a year would at the same average fuel consumption incur FJ$ 1000 per annum as additional cost. It should be noted that these are estimates. The actual additional cost will vary considerably and will depend on parameters such as load collective and operating temperatures.
7.2.3 Repair and Overhaul
Repair costs that may arise due to the use of CNO as a fuel substitute include a variety of incidents that include numerous events from a simple cleaning of the fuel system to the replacement of an engine that has failed due to a polymerisation of the lube oil and a subsequent catastrophic failure of the engine. In Table 15 these items are listed together with an estimated cost and a probability of the event occurring in a year.
Table 15: Additional Repair Cost
According to our estimates an operator of a CN- fuelled Compression Ignition engine had to set aside approximately F$ 3000 in additional repair
24 This could be a truck driving an average of 1.4 hours a day throughout the year.
US$ spare parts US$ Labour Probability % Total Cost $Cleaning of fuel system 0 80 15% 12Replace Injector Nozzles 400 200 10% 60Failure Injector Pump 1500 700 5% 110Clean engine change piston rings 1200 800 15% 300Replace engine (total failiure) 15000 5000 5% 1000Total 1482
69
cost per annum for events related to fuel induced problems. For the generator set mentioned in Section 7.2.2 which consumes 10,000 litres of fuel per annum this translates into additional fuel cost of approximately FJ$ 0.30 per litre of fuel. Again, it should be noted that these are estimates and the outcome in the real world depends on a number of parameters. Adapted utilisation pattern and preventive measures in the O&M category will reduce the need for repairs and overhauls.
7.3 Benefit-Cost Comparison
Obviously, the use of CNO as a fuel substitute only makes sense if in the long run, benefits from using CNO or CNO blends outweigh the cost of producing and using such fuels. Unfortunately, a cost-benefit analysis is not a straight forward exercise, as a large number of variables have to be considered. We have therefore adopted the approach of analysing a few cases that we consider typical for Rotuma and tested the financial viability of these typical applications as case studies. In order to accommodate the fact that major parameters will vary in reality, we have also performed a sensitivity analysis. The cases we have analysed include:
1 Investment in a new village size generator that is purposely designed to run on CNO (with supplier warranty).
2 Investment in purposely-designed central generation unit that powers a 11 kV grid which in turn supplies the entire island.
3 Retrofitting of existing village generator with dual fuel system (no supplier warranty).
4 Operation of a light truck retrofitted with a dual tank system (dual fuel mode).
5 Operation of a light truck retrofitted with a fuel heater and filter only (single fuel configuration either CNO or blends).
6 Operation of a larger vehicle (bus or truck) with dual tank system.
These six cases cover more than 90 % of Rotuma’s current diesel consumption. We have computed costs (retrofitting and additional operational cost) and benefits (saving in fuel cost) and determined the net present values of the net benefit streams. Using the Excel goal seek function we have asked the question how much the fuel price difference in diesel equivalent has to be in order to justify additional costs of retrofitting and operation. We have then varied discount rates in order to check the sensitivity of the results. As a special case we have also tested a case where a donor funds the initial investment in an electrification project and only additional operating costs have to be borne by the community. This case could materialise if, for instance, the European Union agreed to support a biofuel initiative on Rotuma.

70
The results of our calculation are summarized in Table 16, which displays the cost differentials between 1 litre of diesel oil and 1 litre of CNO required to render the use of pure CNO viable.
Table 16. Cost Differential FJ$ Per Litre CNO The calculation includes an adjustment for the lower volumetric heating value (energy content) of CNO versus diesel. On the following two pages the calculations for all the six case studies assuming a discount rate of 15 % is shown. The results show a band of cost differentials between 0.1 and 0.55 for the various applications tested. Clearly, the larger generator that was assumed to operate 5000 hours a year at a central power plant shows the best results: In this case it requires only a marginal cost difference of FJ$ 0.11 per litre between supply cost of diesel and supply cost of a litre of CNO. The additional cost for investing in a dedicated CNO generator and additional operating cost that relate to more frequent oil and filter changes etc. would be easily off-set by the savings in fuel cost. In fact, if we run the calculation at an assumed supply cost of FJ$ 1.6 per litre, the project would yield an internal rate of return of more than 200%. The net present value of savings minus extra cost over a 10-year lifetime of the generator are in the order of FJ$ 133,000. The calculations also show that the economics of fuel switching are very sensitive to annual operating hours or total fuel consumption. The individual car that operates only 500 hours a year requires a much higher cost differential (approximately 0.5 FJ$ per litre) to off-set additional expenses while the public bus that was assumed to operate 800 hours a year and consumes 50 % more per operating hour only requires a differential of FJ$ 0.25 per litre. Clearly, the CNO option at current supply cost levels for diesel in the order of FJ$ 2 per litre renders local production of CNO as a fuel substitute an attractive option as long as production cost can be kept in the 1.5 FJ$ per litre range. It should, however, also be noted that a project that produces CNO at this cost is exposed to the risk of falling fuel prices. Assuming that supply cost for diesel in Rotuma drops to say FJ$ 1.50 local CNO production cost had to drop considerably to remain competitive.
Discount Rate % Case 1 Case 2 Case 3 Case 4 Case 5 Case 65 0.37 0.10 0.36 0.50 0.48 0.24
10 0.44 0.10 0.38 0.53 0.48 0.2315 0.50 0.11 0.40 0.55 0.48 0.26

71
Table 17. Generator Operation
Case 2Assumptions: Year Investment Operating Savings Total CashCost 104 KVA (Deutz 8FL913FW) 130,000 1 -50,000 -600 10058 -40542Cost 104 KVA standard 80,000 2 -600 10058 9458Lifetime (years) 10 3 -600 10058 9458Overhaul year 5 8000 4 -600 10058 9458Assumptions Genset KW 83.2 5 -8000 -600 10058 1458SFC l/KWh 0.35 6 -600 10058 9458Load % 70% 7 -600 10058 9458Average Load 58.24 8 -600 10058 9458Discount Rate 15% 9 -600 10058 9458Annual Operating Hours 5000 10 -600 10058 9458Fuel Cost FJ$/l 2 11Cost Differential FJ$ per litre Diesel 0.10Cost Differential FJ$ per litre CNO 0.11 NPV $14.01
Additional Annual Cost FJ$
Case 1Assumptions: Year Investment Operating Savings Total CashCost 29 KVA (Deutz 4FL912W) 80,000 1 -40000 -300 7726 -32574Cost 29 KVA standard 40,000 2 -300 7726 7426Lifetime (years) 10 3 -300 7726 7426Overhaul year 5 5000 4 -300 7726 7426Assumptions Genset KW 23.2 5 -5000 -300 7726 2426SFC l/KWh 0.4 6 -300 7726 7426Load % 60% 7 -300 7726 7426Average Load 13.92 8 -300 7726 7426Discount Rate 15% 9 -300 7726 7426Annual Operating Hours 3000 10 -300 7726 7426Fuel Cost FJ$/l 2Cost Differential FJ$ per litre Diesel 0.46Cost Differential FJ$ per litre CNO 0.50 NPV $0.00
Additional Annual Cost FJ$
Case 3Assumptions: Year Investment Operating Savings Total CashRetrofit Deutz 40 KVA 5,000 1 -5,000 -1000 2362 -3638Cost 40 KVA standard 0 2 -1000 2362 1362Lifetime (years) 10 3 -1000 2362 1362Overhaul year 5 5000 4 -1000 2362 1362Assumptions Genset KW 32 5 -5000 -1000 2362 -3638SFC l/KWh 0.5 6 -1000 2362 1362Load % 40% 7 -1000 2362 1362Average Load 12.8 8 -1000 2362 1362Discount Rate 15% 9 -1000 2362 1362Annual Operating Hours 1000 10 -1000 2362 1362Fuel Cost FJ$/l 2 11Cost Differential FJ$ per litre Diesel 0.37Cost Differential FJ$ per litre CNO 0.40 NPV $0.00
Additional Annual Cost FJ$

72
Table 18: Vehicle Operation Clearly, an electrification project that covers the entire island of Rotuma through a 11 kV grid returns the best results when we compare CNO and diesel as fuels. This does not necessarily mean that the electrification of Rotuma through the 11 kV grid and a central power station is economically
Case 6Assumptions: Year Investment Operating Savings Total CashRetrofit Diesel Bus (Dual Tank) 5,000 1 -5,000 -1000 2857 -3143Bus Truck standard 0 2 -1000 2857 1857Lifetime (years) 10 3 -1000 2857 1857Overhaul year 5 10000 4 -1000 2857 1857Assumptions Engine KW 120 5 -10000 -1000 2857 -8143SFC l/hour 15 6 -1000 2857 1857Load % 40% 7 -1000 2857 1857Average Load 48 8 -1000 2857 1857Discount Rate 15% 9 -1000 2857 1857Annual Operating Hours 800 10 -1000 2857 1857Fuel Cost FJ$/l 2 11Cost Differential FJ$ per litre Diesel 0.24Cost Differential FJ$ per litre CNO 0.26 NPV $0.00
Additional Annual Cost FJ$
Case 4Assumptions: Year Investment Operating Savings Total CashRetrofit Diesel Truck (Dual Tank) 3,000 1 -3,000 -500 1515 -1985Cost Truck standard 0 2 -500 1515 1015Lifetime (years) 10 3 -500 1515 1015Overhaul year 5 5000 4 -500 1515 1015Assumptions Engine KW 80 5 -5000 -500 1515 -3985SFC l/hour 10 6 -500 1515 1015Load % 40% 7 -500 1515 1015Average Load 32 8 -500 1515 1015Discount Rate 15% 9 -500 1515 1015Annual Operating Hours 300 10 -500 1515 1015Fuel Cost FJ$/l 2 11Cost Differential FJ$ per litre Diesel 0.51Cost Differential FJ$ per litre CNO 0.55 NPV $0.00
Additional Annual Cost FJ$
Case 5Assumptions: Year Investment Operating Savings Total CashRetrofit Diesel Truck Fuel Heater/Filter 500 1 -500 -750 1332 82Cost Truck standard 0 2 -750 1332 582Lifetime (years) 10 3 -750 1332 582Overhaul year 5 5000 4 -750 1332 582Assumptions Engine KW 80 5 -5000 -750 1332 -4418SFC l/hour 10 6 -750 1332 582Load % 40% 7 -750 1332 582Average Load 32 8 -750 1332 582Discount Rate 15% 9 -750 1332 582Annual Operating Hours 300 10 -750 1332 582Fuel Cost FJ$/l 2 11Cost Differential FJ$ per litre Diesel 0.44Cost Differential FJ$ per litre CNO 0.48 NPV ($0.00)
Additional Annual Cost FJ$
73
feasible in itself. Our assessment only shows that this option has the best benefit-cost ratio when CNO is compared with diesel as a fuel. An economic assessment of such a project requires cost data on 11 kV distribution systems that PIEPSAP was not able to obtain from the Fiji Department of Energy or Fiji Electricity Authority.
7.4 Alternative Uses of Locally-Produced CNO
Coconut oil and palm kernel oil are lauric oils (lauric acid content of close to 50%). This characteristic affords particular advantages in food and industrial uses compared with other oils. The major edible uses for lauric oils are in ice cream, margarine, chocolate and confectionary products and the main non-edible uses are in detergents and soaps. While most coconut oil is used for non-edible purposes, the medium chain fatty acids (MCFA), or medium chain triglycerides, that make up lauric oils are regarded to have particular digestive health advantages. Copra and coconut oil account for about 60% of world trade in lauric oils. The Philippines are the industry leader accounting for about 40% of world copra production and 60% of world exports of coconut oil. The PICs make up around 5% of world copra production. While this share is relatively small, it is higher than for any other commodity other than oil palm. CNO attracts a premium of approximately 15% over other vegetable oils because of its special role in the cosmetics industry where it is used as a basis for the finest detergents and soaps. However, the privileged position of CNO as a lauric oil in the market place is now under threat with the emergence of genetically modified rapeseed oil that has a high lauric content. (for details see: Andrew McGregor “Trade liberalization and implications for the FIC edible oil producers”, Trade Development Office, Suva, June 2003) The graphs in Figure 27 show the development of world market prices for lauric oils from January 2000 to May 2007 and a comparison of Palm oil price development with mineral crude from 2005 – 2007. It is interesting to note that on a per barrel basis crude mineral oil clearly started to trail palm oil (which essentially attracts the same price as CNO) since July 2006. At present the gap is approximately US$ 40 on a per barrel basis.

74
Figure 27: Development of World Market Prices for Lauric oils (Source: Oil World Flash. May 18, 2007).
The lauric oil market is regarded as competitive, with supply and demand fundamentals determining price. The international coconut oil and copra market is characterised by little product differentiation with limited opportunity for niche marketing that could create opportunities for smaller countries – although the emergence of cold press virgin coconut oil may prove to be an exception. At current prices the net back value of CNO in Rotuma would be in the vicinity of US$ 650 with an estimated US$ 200 to bring the oil to the main markets in Europe or the USA. Unfortunately, the production price of F$ 1.5 per litre as shown in our base case translates into a cost of US$ 1006 per tonne. In other words, for Rotuman CNO to be exportable to the world market either the world market price had to go up to approximately 1200 US$ per tonne or the production price had to come down to below FJ$ 1 per litre. Although the differential in our base case scenario looks large at the moment, a combination of reduction in production cost and further price increases on the world market could render the export of CNO viable in a relatively short period of time. Experts in global oil seed markets predict sharp increases in vegetable oil and oilseed prices as a result of mandatory biofuel targets imposed by the European Union and others. It estimated global 2007-08 production of the seven main oilseeds at 384.2 million tonnes, far below consumption of 401.8 million tonnes. This compares to 2006-07 production of 396.2 million tonnes and consumption of 387.3 million tonnes.25 Hence if a CNO production facility is established
25
http://economictimes.indiatimes.com/Markets/Commodities/Global_food_crisis_looming_on_biofuels/arti
cleshow/2338552.cms
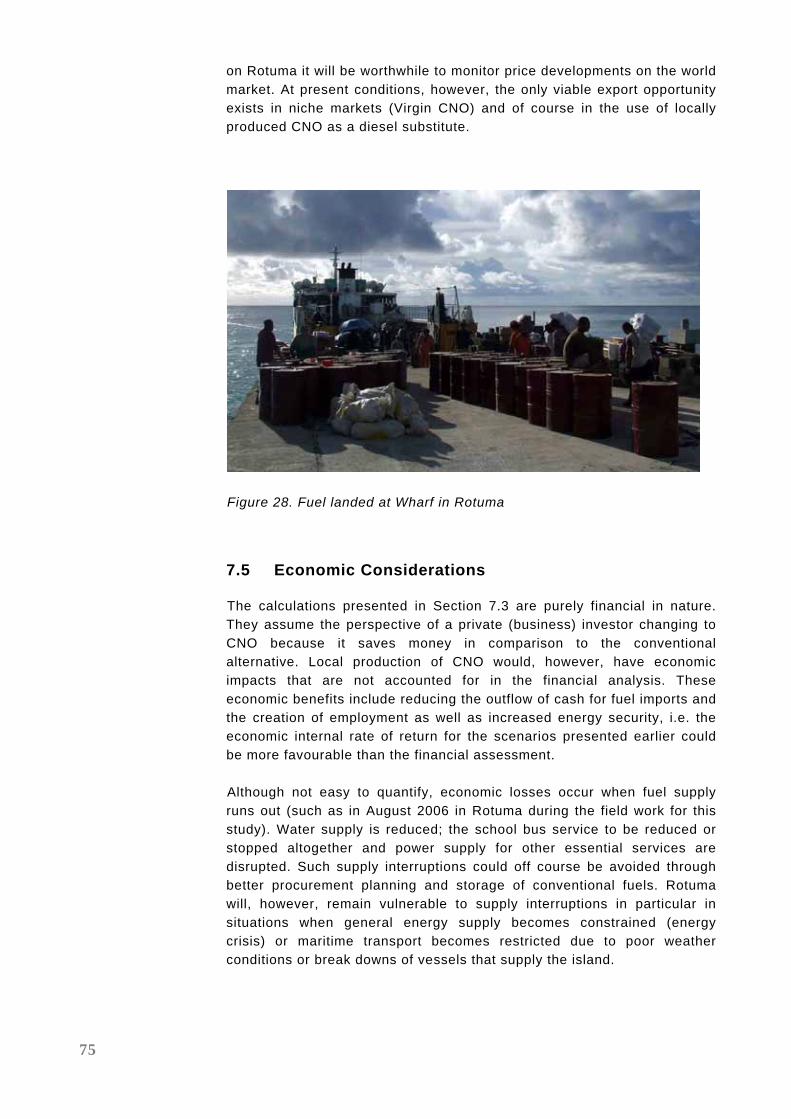
75
on Rotuma it will be worthwhile to monitor price developments on the world market. At present conditions, however, the only viable export opportunity exists in niche markets (Virgin CNO) and of course in the use of locally produced CNO as a diesel substitute.
Figure 28. Fuel landed at Wharf in Rotuma
7.5 Economic Considerations
The calculations presented in Section 7.3 are purely financial in nature. They assume the perspective of a private (business) investor changing to CNO because it saves money in comparison to the conventional alternative. Local production of CNO would, however, have economic impacts that are not accounted for in the financial analysis. These economic benefits include reducing the outflow of cash for fuel imports and the creation of employment as well as increased energy security, i.e. the economic internal rate of return for the scenarios presented earlier could be more favourable than the financial assessment. Although not easy to quantify, economic losses occur when fuel supply runs out (such as in August 2006 in Rotuma during the field work for this study). Water supply is reduced; the school bus service to be reduced or stopped altogether and power supply for other essential services are disrupted. Such supply interruptions could off course be avoided through better procurement planning and storage of conventional fuels. Rotuma will, however, remain vulnerable to supply interruptions in particular in situations when general energy supply becomes constrained (energy crisis) or maritime transport becomes restricted due to poor weather conditions or break downs of vessels that supply the island.

76
Some proponents of biofuels claim that biofuel production can significantly improve trade balance deficits that are typical for Pacific Island countries and conserve foreign exchange through import substitution. These claims are usually not supported by facts. If Fiji directed all its 10 million litres of CNO production to biofuel this would replace only 2.5% of its petroleum imports. Considering the forgone revenue of CNO exports it becomes very clear that the macro-economic impact would be marginal and of no strategic significance. We therefore maintain that CNO should only be considered as an option for niche markets where it can improve economic conditions and energy security of island which suffer from high transport cost and difficult logistics. Thus, the findings of this study are only valid for such a situation and should not be extrapolated to the macro level. With terms of trade for conventional fossil fuels and vegetable oils now closely linked, Fiji as a country may be better off to export its CNO to the world market and use the revenues to procure standard fuel. This would avoid all additional costs associated with the use of fuels that are outside normal specifications and would also be a less risky strategy. When considering the macro level it should also be kept in mind that supply cost are a function of volume, i.e. a significant reduction in diesel supply due to a national scale biofuel programme will increase supply cost for the reduced quantities of conventional fuel. Last but not least there are fiscal implications of local biofuel production that are often overlooked. It appears that proponents of biofuel programs often assume that a locally produced fuel should be exempted from taxes and levies. With fuel taxes being a significant contributor to Government revenue this would result in a deterioration of the Government’s fiscal position.
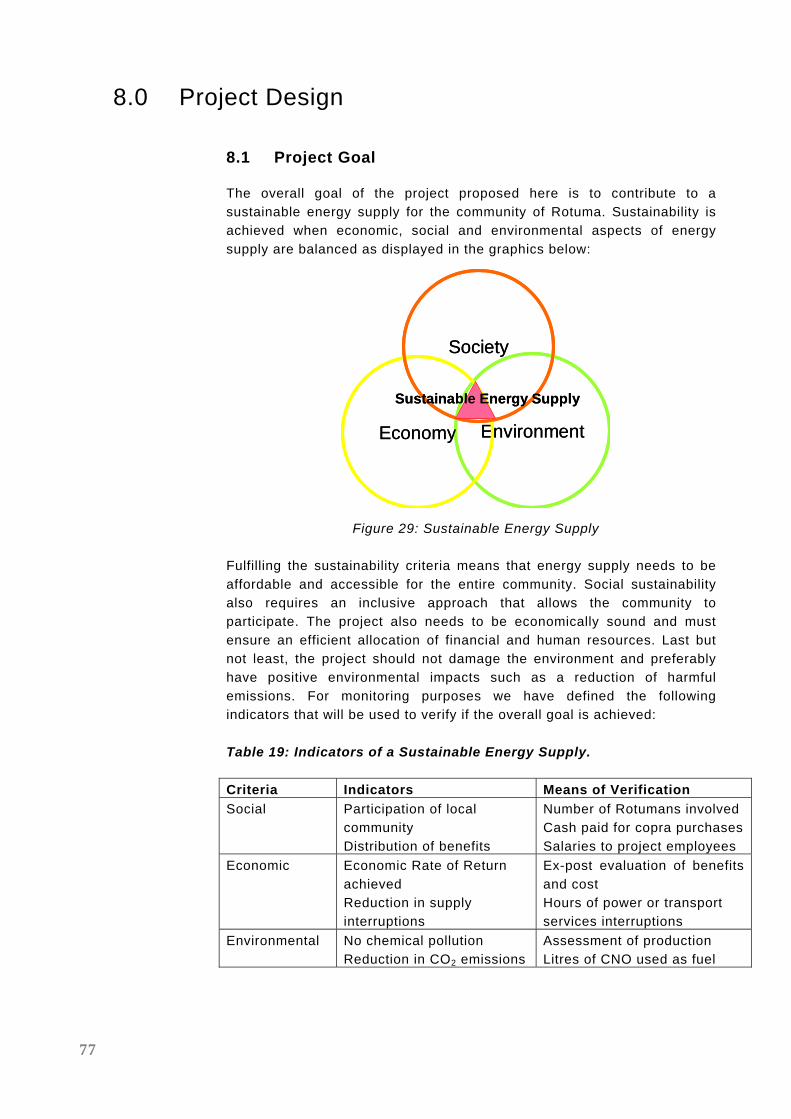
77
8.0 Project Design
8.1 Project Goal
The overall goal of the project proposed here is to contribute to a sustainable energy supply for the community of Rotuma. Sustainability is achieved when economic, social and environmental aspects of energy supply are balanced as displayed in the graphics below:
Figure 29: Sustainable Energy Supply Fulfilling the sustainability criteria means that energy supply needs to be affordable and accessible for the entire community. Social sustainability also requires an inclusive approach that allows the community to participate. The project also needs to be economically sound and must ensure an efficient allocation of financial and human resources. Last but not least, the project should not damage the environment and preferably have positive environmental impacts such as a reduction of harmful emissions. For monitoring purposes we have defined the following indicators that will be used to verify if the overall goal is achieved: Table 19: Indicators of a Sustainable Energy Supply. Criteria Indicators Means of Verification Social Participation of local
community Distribution of benefits
Number of Rotumans involved Cash paid for copra purchasesSalaries to project employees
Economic Economic Rate of Return achieved Reduction in supply interruptions
Ex-post evaluation of benefits and cost Hours of power or transport services interruptions
Environmental No chemical pollution Reduction in CO2 emissions
Assessment of production Litres of CNO used as fuel
EnvironmentEconomy
Society
Sustainable Energy Supply
EnvironmentEconomy
Society
Sustainable Energy Supply

78
8.2 Project Objectives
The proposed project consists of two phases: (1) A preparatory phase that includes the establishment of a pilot CNO production and (2) testing of CNO as a substitute fuel in various applications on Rotuma. This pilot phase will also include wind monitoring and wind resource assessment. The second phase includes the establishment of a full-scale local CNO production and enabling of major diesel users to convert to CNO. The objectives of the two phases can be summarised in Table 20. Table 20: Preparatory Phase Objectives Indicators Means of
Verification Establishment of a Pilot CNO production by end of 2007
Mini oil mill delivered, installed and functioning
Commissioning Report.
Production of at least 3,000 litre of CNO by July 2008
Amount of CNO produced per month.a
Project records.
Test feasibility of CNO and CNO/diesel blends in vehicles and generators
Hours of operation with CNO or CNO/diesel blends.
Project records and test summary report.
Detailed assessment of local renewable energy resources
Wind data available and cost of wind generation established
Project records and PIEPSAP reports.
Detailed design of full scale project
Agreement on project design by all stakeholders.
Project agreement signed.
Funding for full scale project identified
Financial resources sufficient to implement full scale project.
Project agreement project signed.
At the end of the preparatory phase it is expected to have solid empirical data on:
Costs to produce CNO on Rotuma. Institutional design and possible business models Quality of CNO produced in Rotuma. Engine adaptations and adaptations of utilization pattern required
to use CNO or CNO blends in diesel engines on Rotuma. Cost of adaptations. Cost for two options of a full-size project (central electrification and
decentralised use of CNO in village generators). Possible sources of funding to support a full-scale project.
These data will allow a detailed project design for Phase II of the project. The main objective of Phase II is essentially to maximise the production and use of local renewable energy sources following a least cost approach. A detailed list of objectives is provided in Table 21.

79
Table 21: Main Project Phase Objectives Indicators Means of
Verification Establishment of a 100 tons per year CNO production by end of 2008.
Oil mill delivered, installed and functioning. Amount of CNO produced per month.
Commissioning Report; Oil mill records.
Generation of income for local population from production of CNO.
Salaries paid, payments for copra.
Oil mill records, payroll.
Use of CNO and CNO/diesel blends in vehicles and generators.
Hours of operation with CNO or CNO/diesel blends; (Amount of CNO used per month).
Power station records
Establishment of an efficient sustainable least-cost electricity supply system on Rotuma
Physical installation, hours of electricity supply, cost to consumers.
Project records, Power plant records, tariff schedule
Maximise use of local renewable energy resources.
kWh produced using renewable energy resources (wind, biofuel).
Project records, power plant records.
Reduction of greenhouse gas emissions.
Quantities of diesel substituted by renewable energies.
Oil mill sales records, power plant records.
8.3 Project Preparation and Pilot Phase
8.3.1 Partner Contributions
The pilot phase will be executed as a joint community-based project. A Memorandum of Understanding between PIEPSAP and the community will guide project implementation. PIEPSAP will undertake the following:
Supply a pilot CNO production facility having a production capacity of approximately 30 liters of oil per day.
Assist in setting up a pilot production plant. Provide guidance with respect to CNO production and
utilisation. Carry out laboratory analysis of oil samples to check on
suitability of CNO quality for fuel use. Provide retrofitting equipment for diesel engines up to FJD 1000 Document production and utilisation trials. Assist in broad stakeholder consultations on a full-scale project Prepare a project document for a full-scale project.
The community of Motusa will undertake the following:

80
Provide to the project free of charge at least 6 (four) tons of
copra. Provide space for the installation of the pilot production unit Provide free of charge the labor required to produce at least
3,000 litres of CNO. Provide the electricity required to operate the pilot unit. Conduct and monitor CNO use trials in various applications.
8.3.2 Community Consultation
During the pilot phase data and information will also be collected on possible institutional arrangements and design features of a full-scale project. This will include an analysis of the comparative advantages of a decentralised approach where individual communities produce and use their own CNO versus a centralised approach where CNO is produced in a single facility and electricity is generated in a central power station and distributed through a 11-kV system. The following options will be discussed with stakeholders on Rotuma:
1. Centralised versus decentralized CNO production 2. Private operation of CNO production versus community approach
or RIC-managed public enterprise, possibly as a venture for Rotuma Investment Ltd.
3. Central electrification versus upgrading of existing village power supplies.
4. Copra purchases from individuals versus barter arrangement copra for CNO. This option is a traditional milling approach whereby the mill retains a certain quantity of the product in return for its services.
The consultation process on the design of a full-scale project will be a key element of the pilot phase. With ongoing activities in both the production and utilisation of CNO, the consultations can be based on real life experiences and the demonstration of the principle of using local resources. Consultations will be context specific and will be conducted:
free from manipulation, oppression or domination; early enough to scope key issues listed above to ensure that
results will have an effect on the project decisions; targeted at those parts of the Rotuman community most likely to be
affected by the project; with relevant information being disseminated to stakeholders in
advance; as a dialogue so that all sides have the opportunity and to
exchange views and information, and to have their issues addressed;
well-documented to keep track of the key issues raised and with reporting back to those consulted;

81
gender-inclusive reflecting that men and women often have differing views, roles and needs; and
Ongoing as required during the full life-cycle of both the pilot and the full scale project.
The basic concept followed in the consultation process will be that of informed participation. This is an intensive and active form of consultation. Typically, this involves a more in-depth exchange of views and participation in project activities leading to joint analysis and decision-making. This increased level of involvement tends to generate a shared sense of ownership in a process and its outcomes. In particular stakeholder groups on Rotuma that will be materially affected by components of the project include landowners with rights to coconut groves, copra cutters, generator operators, pump operators, fuel traders and technicians and mechanics. It will be important to properly inform them and encourage their participation in matters that have direct bearing on them. During the pilot phase the key issue of increasing energy efficiency will also be addressed. Energy efficiency measures increase the benefits from each unit of energy consumed, or use less energy to achieve the same level of service. In Rotuma, like elsewhere in Fiji, major barriers to improved energy efficiency include lack of information, inadequate pricing signals, lack of standards (for appliances and machinery) and conflicting incentives for producers and consumers. Other factors also affect energy efficiency. Perceptions, fashions, habits, traditions and culture all affect people’s energy choices. PIEPSAP will support an educational and awareness campaign that will enhance the communities’ knowledge on energy efficiency and technology choices.
8.4 Full Scale Project
8.4.1 CNO Production
Our resource assessment has clearly shown that Rotuma has more than sufficient coconuts to meet its diesel demand within the bounds of technical feasibility, i.e. a CNO production of 100,000 – 150,000 litres a year would not meet any raw material supply constraint. While we currently believe that a centralised approach would be more conducive to quality control and optimised production cost this needs to be confirmed during the pilot phase. The cost to establish such a facility including redundant machinery and building would be approximately FJ$ 135,000. Annual operating cost including raw material, labour, electricity and consumables would be approximately FJ$ 140,000. Production cost without a supporting grant would be in the order of FJ$ 1.50 – 1.60 per litre of oil. With a donor-funded grant subsidy for the installation, production cost could be brought down to FJ$ 1.40 – 1.45 per litre of oil.

82
The key characteristic of a full-scale CNO production project are summarised in Table 22:
Table 22. Key Characteristics of a full-scale CNO Production Everything else being equal CNO production cost using a decentralised approach would be higher. If however communities provided the labour and raw material as their contributions, CNO production cost could be brought down to approximately FJ$ 0.70 per litre. 8.4.2 Central Power Generation
The orginal biofuel proposal formulated under the REEP project did not discuss the option of decentralised CNO use and suggested a central reticulated electricity supply for Rotuma. While comparatively expensive with regard to the initial investment this approach would enhance efficiency; reduce long-run electrcity supply cost (particularly if a donor assists with grant support); and would also allow the inclusion of other forms of renewable energy such as wind and solar. Electricity services for households on Rotuma have not been adequate in the past. While most of Rotuma’s population has access to decentralised electricity networks these small grids are plagued with a number of problems typical for village electricity schemes. High supply cost, low reliability and limited service availability are issues that could be adressed through a centralised system that would generate electrcity in a power plant and distribute it through a 11-kV ring that essentially connects the individual mini grids and replaces the decentralised production of electricity. The grid would also power the three water pumping stations. Such a system could either be powered by CNO or by diesel. Depending on the results of the local wind monitoring currently being performed under PIEPSAP wind energy might offer a viable opportunity for fuel saving. CNO
Investment Machinery FJ$ 85,860Investment Building 48,600Total Investment Cost FJ$ 134,460
Operating requirementsElectricity kWh per year 22,700Electricity cost FJ$ per year 18,350Raw material fresh copra t per year 236Raw material cost dry copra FJ$ per year 86,326Labour Input person hours per year 2,060Labour cost FJ$ per year 31,000Consumables F$ per year 4,170Maintenance FJ$ per year 6,730Total Operating Cost FJ$ per year 146,576

83
use in such a facility requires generator sets whose engines are specially designed for CNO use. A CNO-fueled system would have to be sized in such a way that engines that run on CNO always operate at high loads, i.e. a power house would ideally harbour several generator sets that would allow flexibility in load management. Fortunately, the pumping loads in Rotuma can be used to somewhat even the load curve in times of low loading. Another option would be to operate generators on a dual-fuel basis where diesel would be used in low-load situations instead of CNO. The load of such a system would depend on a number of parameters. The most important being:
Service levels (hours of supply per day). Load management, in particular water pumping load. Tariffs for electricity consumed. Community response to education and awareness (energy
conservation).
In order to maintain the option of a high subsitution of diesel through CNO and at the same time retain a sufficient stand-by capacity a central power station should be equipped with three or four generator sets. At present, total installed capacity on Rotuma is approximately 400 KVA. However, many existing generators are operated at very low loads as described in Section 3 of this report. While peak loads can be expected during evening hours it is unlikely that daily loads will exceed 100 kVA. This includes the pumping loads which have a peak load of 41 kVA when all six 5.5 kW Grundvoss pumps are simultaneously operated. The oil extraction facility itself would have a load of 14 KVA which leaves approximately 40 kVA for all other consumers. Evening loads would most probably not exceed 100 kVA either assuming that there is no pumping load. With switchable loads such as water pumping the CNO extraction plant itself; and perhaps an ice-making facility, it should be possible to manage system load and optimise specific fuel consumption figures. For the purpose of this study and subject to further confirmation we assume that a central power supply would consist of 3 units at 100 KVA each. One option would be to the Deutz F8L413FW 104 KVA set that is offered by Energie Relais in a CNO version. Table 23: Total cost of the generation plant excluding transformers is estimated as follows (FJ$) Depending on service levels the plant would generate approximately 300,000 – 400,000 kWh per annum and consume with good load
3 Units 104 kVA 396,000Transport on site 79,200Installation 39,600Tanks and auxilliaries 80,000Building 90,000Total 684,800

84
management approximately 100,000 – 124,000 litres of diesel per annum. Running the plant in a conservative way as a dual-fuel operation (start, stop and low loads in diesel mode) we estimate that approximately 70 % of the diesel can be replaced by CNO. This corresponds with an annual CNO demand of 75,000 to 95,000 litres. These calculations are based on an an assumed specific fuel consumption (SFC) of 0.35 litre per kWh, a figure quoted by the supplier of the generator sets mentioned above. The establishment of a centralised power supply system would render existing generation facilities obsolete. There are two options: The existing units could be relocated to villages outside Rotuma or they could be kept as stand-by units in case the central supply failed. The latter would require a switching system that allows isolating the respective village grid from the main system together with an electronic device that prevents “islanding” of a stand by unit in the absence of grid power. “Islanding” is a potential hazard in cases when current leaks into a system that is not energized (for maintenance purposes) and a stand-by unit that operates is not fully isolated. 8.4.3 Inclusion of Wind Generators
Wind energy development will involve certain risks that need to be managed effectively in order to ensure a successful project outcome for the operator of the Rotuman power grid and the electricity consumers. Uncertainty about the wind regime at possible sites for grid connected wind turbines is currently been addressed through wind monitoring, data processing and modelling of wind generator output. A comparative analysis of energy supply cost (long run average supply cost of wind, diesel CNO and solar kWh delivered to the grid needs to be included in the analysis before a decision on a wind generator can be taken. Technological risks could be reduced through an appropriate procurement procedure or could be mitigated through a capacity building programme that would enable the power system operator to acquire the skills and knowledge necessary to successfully operate a wind turbine. However, there are various risks that are inherent when using wind generators in small systems such as the potential Rotuma grid. Stability problems and the risks of a mismatch of supply and demand need to be carefully assessed. There is a need to assess the impact of wind participation on specific fuel consumption over an anticipated load profile over the project life. Over a significant range of operating wind speeds, the electrical power output of a single wind turbine corresponds closely to the temporal characteristics of the wind-flow field incident on the wind turbine. This causes voltage fluctuations. Although the inertia of the rotor averages out, somehow short-term fluctuations may cause flicker emissions that are not desirable. In extreme cases, voltage fluctuations can cause a voltage collapse as

85
voltage drops result in increased reactive power consumption that causes a further drop in voltage. Wind generators are more likely to suffer from frequency fluctuations, rather than cause them. However, system frequencies below the 50 Hz level could cause an increase in reactive power consumption of the wind generator and thus feed back into the system. Also, frequency fluctuations change the synchronous speed of generators and may cause aerodynamic losses. This technical aspect is of particular relevance to the Rotuman system and needs to be assessed and preferably modelled. There is also a need to assess which turbines available on the international market are acceptable for a possible Rotuman application. Wind generators equipped with induction generators require reactive power from the grid for excitation, i.e. they lower the system power factor. In addition, the step-up transformers required also consume reactive power. These parameters together with the reactive power consumption of electric motors within the system have to be taken into consideration when specifying the wind generator suitable for Rotuma. At this stage it is recommended to aim for a wind turbine that is equipped with a synchronous generator a AC/DC/AC power conditioning unit and a battery storage that would allow to optimise system operation. PIEPSAP currently conducts a comprehensive survey of all wind turbines internationally available in the 10 – 300 KW range, i.e. the range that would be suitable for Rotuma. 8.4.4 High Voltage Distribution System
A centralised generation system required a full-scale reticulation of Rotuma. If the establishment of a full-scale electrification project materialises we recommend that the 11-kV distribution system be based on the technologies and standards used by FEA. Not only would that avoid the introduction of unfamiliar standards, it would also facilitate the licensing of such a facility by FEA and spare part procurement. The 11 kV lines would feed the existing village grids and the pumping stations through 20 kVA transformers. Little or no modification of the village reticulation systems would be required. In case villages intend to retain their existing small generators transfer switches would be needed to allow change of supply from grid to stand-by units. For the 11-kV system itself, two options exist: a) Overhead lines and transformers on power poles; and b) Underground cables with supply through pillar boxes and ground-mounted transformers. Option a) is significantly cheaper but has higher maintenance costs, in particular with respect to trimming vegetation. It is also vulnerable to damage by hurricane and vehicles. Option b) is more expensive has no visual impact and is not vulnerable to hurricanes. Fault location may, however, be more difficult.

86
Given the comparative low risk of hurricanes and the fact that FEA’s standard for 11-kV reticulation is overhead we have assumed that a power grid for Rotuma would be based on overhead lines. In order to quantify the extent of a reticulation system for Rotuma we have designed a 11 kV system using the GIS environment established for the coconut resource assessment (Table 24). The high-resolution satellite image procured under the project allows identifying easements for overhead power lines as a function of available space (vegetation, buildings). An overview of a preliminary system design is displayed on Figure 30. The calculated quantities of major system components are listed in Table 24: Table 24. Components of an 11 KV System Total Line Length (kilometre) 38
Number of power poles assuming 70 meters average distance: 500
Number of transformers 22
Approximate number of circuit breakers 30
In order to perform a full cost-benefit analysis for the project and to present a comprehensive report to potential donors we have made repeated attempts to obtain information from FEA’s CEO and the Director of Energy on standards used by FEA and the costing for the major 11 kV system components and installation costs. Unfortunately these repeated requests for information were not successful. The following data would be required for a full design and costing exercise:
Unit cost for 1 km of 11 kV conductors (three phase). Unit cost for 1 km of 11 kV underground cable (three phase). Unit cost for 1 km of low voltage cable. Type and unit cost of power poles used in 11 kV/415V distribution
systems (single and multiple circuit poles). Transformer unit cost 11,000-415 V (100/50/20 kVA). Unit cost of and types of switches, circuit breakers. Unit cost of power-pole mounted street light. Labour input and labour cost estimates for the installation of 11kV
distribution system.
Additional information e.g. maintenance cost including trimming of vegetation would also be very helpful.

87
Figure 30: Preliminary design full-scale 11 kV power system

88
8.5 Institutional Issues
There are a number of open questions with respect to the institutional set up for the implementation of a full-scale project. We have to distinguish between the CNO production side and the electricity supply. While the CNO production itself could be run as a commercial enterprise i.e. an operation that returns a financial profit, the electricity supply part is more complex. CNO production even for the full-scale project involves only moderate up-front investment. At current prices for the relevant inputs and outputs, the venture is self-sustainable. The major risks are a drop in international fuel markets and reluctance of the consumers in Rotuma to take technical risks associated with the use of a non-specification fuel in their machinery. While the first risk is out of the control of the stakeholders of the project reluctance of the market to take up a new product can be mitigated by educational campaigns and demonstrations during the pilot phase. At such moderate risk levels, the CNO production could be a venture for the Rotuma Investment Ltd, a company that was purposely set up to invest in development projects on Rotuma. We recommend establishing the full-scale CNO production as a project for this investment company with an option to contract operation of the mill to a private operator under a management contract arrangement. This arrangement offers a good compromise between the preference of Rotumans’ for community-owned projects, and efficiency gains that can be expected from a private sector operator. Figure 29.Community consultations on Rotuma
A purely private sector operation would, however, be a viable alternative. In such a case, a private entrepreneur would take all the risks. The concept would at least initially create a monopoly situation with some market power held by the enterprise. Obviously, market power would be a

89
constraint as consumers could resort to diesel and copra sellers to sell their product in the traditional way for export to Fiji. The recommended pilot phase will be run as a community project in Motusa. However, further investigations will be included with respect to an optimal institutional set up. With a small-scale milling operation, on-going further stakeholder consultation will be facilitated as the subject of these consultations will be visible.
Figure 31. Institutional set up for a CNO Production on Rotuma Figure 31 shows the institutional set up for a CNO production unit under Rotuma Investment Ltd. The yellow arrows are material flows, financial flows are depicted in red. In such a set up the CNO production unit would buy copra from transporters who in turn would buy from copra cutters. Copra cutters would either use their own groves or compensate the respective owners for the extraction of coconuts. The CNO production unit would sell directly to users (in 200-l drums) or to retailers and to a power generator. A provision could be made for a certain quantity to be made available for community services free of charge. This could for instance include the school bus. With respect to power generation there are two options: Either the existing generators are being retrofitted to run in dual-fuel mode or a central power station supplies a grid as described in Section 7.4.4. At present the villages on Rotuma operate their own power supply systems. There is limited support through the Rural Electrification Unit of the Fijian Government and the Public Works Department. In case a decentralised approach is chosen for a full-scale project little would change. It would be necessary to train mill operators and enhance local capacity to more carefully operate generators that are powered by CNO. Communities would buy their CNO from the production unit, in cases where there is shortage of cash, special arrangements could be made to barter copra for CNO. Such an arrangement would avoid hardship for communities that are temporarily short of cash.
Rotuma Investment Ltd
CNO Production Rotuma
Copra Transporters
Copra Cutters
Land Owners
CNO to Community
CNO to Users
CNO to Retailers
CNO to Power Generation

90
9.0 Environmental Issues
9.1 Legal Context
The Environmental Management Bill guides the assessment and approval process for development projects in Fiji. According to the Bill the following projects require a full-scale EIA process and subsequent approval by the Department of Environment27:
(a) a proposal that could result in erosion of any coast, coastline, beach or foreshore;
(b) a proposal that could result in the pollution of any marine waters, ground water, freshwater body or other water resource;
(c) a proposal that could result in the contamination or degradation of any agricultural area or land important for agriculture;
(d) a proposal for construction of an airport; (e) a proposal for construction of a hotel or tourist resort; (f) a proposal for mining, reclaiming of minerals or reprocessing of
tailings; (g) a proposal for construction of a dam, artificial lake, hydro-electric
scheme or irrigation project; (h) a proposal for heavy industrial development or noxious industrial
development; (i) a proposal for commercial logging or for a saw milling operation; (j) a proposal that could alter tidal action, wave action, currents or
other natural processes of the sea, including but not limited to reclamation of the sea, mangrove areas, foreshore, rivers or creeks, or construction of a jetty, dock, wharf, pier or bridge;
(k) a proposal that would introduce pollutants or properties to the air that are disagreeable or potentially harmful to people and wildlife;
(l) a proposal that could jeopardize the continued existence of any protected, rare, threatened or endangered species or its critical habitat or nesting grounds;
(m) a proposal that could deplete populations of migratory species including, but not limited to, birds, sea turtles, fish, marine mammals;
(n) a proposal that could harm or destroy designated or proposed protected areas including, but not limited to, conservation areas, national parks, wildlife refuges, wildlife preserves, wildlife sanctuaries, mangrove conservation areas, forest reserves, fishing grounds (including reef fisheries), fish aggregation and spawning sites, fishing or gleaning areas, fish nursery areas,
27 The EIA administrator is the Fiji Department of Environment
91
urban parks, recreational areas and any other category or area designated by a written law;
(n) a proposal that could destroy or damage an ecosystem of national importance, including, but not limited to, a beach, coral reef, rock and gravel deposit, sand deposit, island, native forest, agricultural area, lagoon, sea-grass bed, mangrove swamp, natural pass or channel, natural lake or pond, a pelagic (open ocean) ecosystem or an estuary;
(p) a proposal that would result in the introduction of genetically modified organisms or of non-native species that could compete with or destroy any native species;
(q) a proposal for the construction of a landfill facility, composting plant, marine outfall or waste water treatment plant;
(r) a proposal that involves dredging or excavating a river bed; (s) a proposal that is controversial from an environmental
standpoint, or is not supported for environmental or resource management reasons by a significant number of representatives from the local community, local government, churches, villages and other groups;
(t) a proposal that could lead to the depletion of non-renewable resources;
(u) a proposal that could challenge or contravene established customary controls over the use of natural resources;
(v) a proposal that could result in any trans-boundary movement of wastes that could have an impact on human health, the environment or natural resources in any neighbouring country;
(w) a proposal financed by an international or local development finance institution and which requires an EIA as a condition of the finance;
(x) a proposal for farming or agricultural method or system that could result in the contamination or degradation of any agricultural area or land important for agriculture.
Clause 33 of the Bill defines development projects that require an Environment Impact Assessment. These are divided into three categories. The first category is those developments that are sent to the EIA Administrator. The second category is those developments that are to be dealt with by the approving authority. The third category is developments that will not need an EIA. We do not believe that a comparatively small-scale project that does not involve the use or production of any harmful chemicals, that relies on traditional land use methods and that only requires a very small land area falls into one of the categories listed in the bill. Nevertheless, for the sake of consistency we will discuss some environmental issues of the project in the following sections. The project discussed here could be considered as a proposal for a commercial development and would thus require the approval of an authority in line with the provisions of the Environmental Management Bill.

92
9.2 Proposed Project
A CNO production plant is proposed for Rotuma that will have a production capacity of 100,000 – 150,000 litres of CNO per annum. The main use of CNO will be the substitution of diesel oil. The location of the facility will be in or adjacent to one of the villages. It will require good road access and a land area of approximately 1000 m2. The facility will include a collection system for copra by light truck from the roadside. Fresh copra will be produced in the traditional way inside coconut groves. All biomass other that copra (husks, shells, coconut water) will remain in the groves, i.e. extractions of soil minerals will be minimised. The oil extraction plant itself will not employ any chemicals or other harmful substances. The technology used will involve small-to-medium size machinery such as copra cutters, screw presses, and filter presses operated by small electric motors. Noise emissions will occur but a minimum distance of 100 m between the production facility and the nearest residential dwelling will be sufficient to avoid any nuisance for local residents. The process will generate two products: CNO and press cake. The CNO will be of food quality and as such will not pose any threat to the environment, as micro organisms would decompose spillages quickly. There is no risk of contamination of drinking water, a threat that is quite significant when diesel oil is spilled. The second product, oil cake is a valuable animal fodder and as such will not pose a disposal problem. In case no use as animal fodder is possible it could be used as mulch in vegetable gardens or fields.
9.3 Use of CNO
CNO as a diesel substitute has the advantage of being chemically less reactive, i.e. fire risks during storage and use will be significantly reduced compared to diesel. Ideally, the products of complete combustion of hydrocarbons such as diesel are carbon dioxide (CO2) and water. However, in reality combustion in a diesel engine occurs mainly through a diffusion flame and is therefore incomplete. This causes the formation of partially oxidised compounds such as carbon monoxide (CO) and aldehydes and hydrocarbons. Research has shown that straight vegetable oils are competitive with conventional diesel in some emission categories; problems were identified for other kinds of emissions. Higher NOx levels, and higher aldehyde (Formaldehyde) levels have been reported. However, the overall emission balance should still be in favour of CNO as significantly less is sulphur will be emitted in comparison with diesel oil.28 . The only potential negative impact of using CNO as a diesel substitute is
28 For details see: Fürstenwerth, D. (2006) “Potentials of Coconut Oil as Diesel Substitute
in Pacific island countries” MSc. Study, Aachen RWTH University, Germany

93
the larger quantities of waste engine oil that will be generated. As outlined in Section 6 a safe use of CNO as a diesel substitute requires more frequent change of engine oil. This engine oil requires safe disposal, i.e. the project has to include safeguards to ensure this. Waste oil should be collected in 200-litre drums and shipped out of Rotuma for safe disposal.
9.4 Global Environmental Considerations
Assuming that no land is cleared for the plantation of coconut palms, theory suggests that CNO of other biofuels are carbon neutral – i.e. plant material when burnt releases the same amount of carbon back into the atmosphere as it absorbed (sequestered) during its lifetime. Thus, some proponents claim that biofuels are a suitable global solution for greenhouse gas mitigation. However, once the energy inputs into the farming system in terms of fertilisers, transportation and carbon dioxide released from the soil by tillage etc. are accounted for, the net impact is substantially reduced; varying widely according to crop and production technique. For most current production systems for biofuels (biodiesel from rapeseed oil in Europe or fuel ethanol from corn in USA or from sugar cane in Brazil) the actual reduction of carbon emissions achieved is rather small or even negative, i.e. ill-conceived biofuel projects may even result in more carbon emissions compared with their fossil competitors. Detailed studies of the Brazilian large-scale bioethanol programme show that for every hectare of land used for sugar cane to produce fuel ethanol as a gasoline replacement, 13 tons less fossil carbon are released into the atmosphere than if the petroleum had been used directly, i.e. at a first glance the ethanol program reduces greenhouse gas emissions. A closer look, however, reveals that by simply allowing natural forest to regenerate on the land used to grow the sugar cane would absorb around 20 tons of carbon dioxide per hectare from the atmosphere per year. Environmental groups have also expressed serious concern about the practice of large-scale clear felling of indigenous forests in Asia and South America for biofuel production projects that would be hard pressed to mitigate over their entire lifetime the carbon emissions they have caused through the destruction of these forests. Additionally, there is also considerable loss in natural habitats and biodiversity. In order to deal with such issues in a scientific and unbiased way the International Energy Agency (IEA) has established Task Force 40 whose mission is to address sustainability issues in biomass trade. One possible approach to avoid ambiguity could be biomass certification according to a number of ecological and social sustainability criteria such as the energy balance, competition with food supply, deforestation, soil erosion, biodiversity, employment, wages and health care. Current certification systems, such as forestry and agricultural certification systems, as well as some first attempt for biomass certification, only cover these sustainability

94
aspects globally. However, coverage of land-use, possible leakage effects and induced land use are critical components that need to be addressed.29 In contrast to heavily mechanised large-scale agro industrial biofuel production, CNO production on Rotuma would reduce carbon emissions. The feedstock would come from existing plantations managed traditionally with little or no use of mineral fertilisers. Short transport distances for copra bought at the roadside would not add large amounts of carbon either and the vehicles could be fuelled fully or partially with CNO. The locally- produced biofuel would not only replace fossil fuels that are locally used but also reduce carbon emissions that are attributed to the transport of fossil fuels from source to the location of consumption. In conclusion, a biofuel project in Rotuma would have very little if any negative environmental impact. On the contrary the use of CNO as a diesel substitute would greatly reduce the risks associated with the spilling of diesel in a fragile environment such as Fiji.
9.5 Global Social Impacts
Rotuma clearly represents a niche market situation where an under-utilised resource (coconuts and land) could be used to replace a critical and costly imported commodity (diesel fuel) while generating local employment and revenue. Local social impacts would be positive. However, Rotuma is not completely isolated from the world market and thus vulnerable to terms of trade on the global markets. With mandatory biofuel targets now in place for the European Union and other industrialised countries a significant increase in demand for oilseeds and vegetable oils for biofuel production could lead to a global food crisis as raw materials are switched to bio energy output. Hamburg-based oilseeds analysts Oil World noted that “It is high time to realise that the world community is approaching a food crisis in 2008 unless usage of agricultural products for biofuels is curbed or ideal weather conditions and sharply higher crop yields are achieved in 2008”. Global grain and vegetable oil stocks are already at historically low levels. As the global supply and demand balance of the seven major oilseeds tightens there will be a growing incentive for oil seed producers around the world to supply the global biofuel market. While price increases on the world market would initially be positive for Rotuma as a producer and exporter, there is a risk that global trade conditions could lead to local competition between the local use of coconuts for food and export, i.e. the risk of negative social impacts needs to be carefully monitored and managed. "Development of the biofuel sector will require special government attention to environmental and food security concerns," according to FAO, the specialised United Nations organisation, that leads international efforts to combat hunger.
29 A comprehensive discussion of sustainability issues of biofuels can be found under:
http://www.earthscan.co.uk/news/printablearticle.asp?sp=&v=3&UAN

95
10.0 Conclusions and Recommendations
10.1 General
Disruptions in fuel supply and high cost of supply fuel to Rotuma, Fiji’s northernmost island, merit consideration on developing local energy resources such as biofuel and wind. Currently all fuel is imported in 200-litre drums with local prices in 2007 being well above F$ 2 per litre of product. CNO and wind resources hold the potential to improve energy security on the island, to generate local revenue and to reduce risks of environmental pollution through spillage of fossil fuels. While not all of Rotuma’s current fuel demand of 300,000 litres per annum can be substituted, a large percentage of the 185,000 litres of diesel consumed on the island could be replaced. Diesel replacement in electricity generation would be the most promising avenue to pursue. It is plagued by high specific fuel consumption, frequent breakdowns of generation equipment and logistical difficulties to maintain and repair generators.
10.2 Methodologies
Using remote sensing techniques based on high resolution image data proved to be an effective way to assess biomass resources on Rotuma. The QuickBird backdrops acquired for this pilot project have also facilitated planning for an electricity distribution network. Should wind data prove interesting, the image data will allow modelling of wind generator output and facilitate optimisation of wind generator location. Apart from energy-related uses, the remote sensing data together with GIS technology will support a variety of infrastructure and agriculture-related planning on Rotuma.
10.3 Local Energy Resources
Rotuma’s local energy resources include a good solar radiation with monthly averages never dropping below 5 kWh/m2/day. First indications from an ongoing wind-monitoring programme show average wind speeds above 5 m/s predominantly from the east. PIEPSAP has already installed a monitoring station and at least a one year monitoring will be required to conclude if wind is a viable option for Rotuma. A detailed analysis of the coconut resources on Rotuma revealed a total production of 7.5 million nuts per annum of which approximately 5 million nuts are considered to be harvestable. Making allowances for traditional local consumption in the order of 1.5 million nuts leaves a potential of 3.5 million nuts available for other uses such as copra and/or coconut oil production. 3.5 million nuts could produce 2100 metric tons of wet copra or 1155 tons of dry copra.

96
This represents a coconut oil (CNO) production potential of 635 metric tons or 690,000 litres of CNO per annum. This represents a diesel equivalent of approximately 635,000 litres or more than three times the estimated annual diesel fuel consumption of 185,000 litres. The production of CNO could be significantly increased through a rehabilitation programme that would include replanting and refurbishment of plantations.
10.4 Biofuel Production
As copra production for export off island is still part of Rotuma’s economy, the use of copra for local oil production is feasible on Rotuma. CNO production should be done using small modular milling equipment that minimises risk and allows expansion of local oil production in line with demand. Production cost for a 100,000 litre per annum privately owned and operated unit are estimated at F$ 1.5 per litre or F$ 1.63 per litre of diesel equivalent considering the lower heating value of CNO. Production costs are based on current roadside prices for green copra of 0.12 F$/kg, investment cost of F$ 150,000 for a Mini Mill, labour cost of F$/hour 3 and 23,000 kWh/a of electricity use for milling. Production cost could be decreased through the establishment of the oil mill as a community project where feedstock would be supplied by the beneficiaries of energy services. Further reduction in cost could be achieved through a grant contribution either from a donor or from an institution such as CIDA. Under favourable conditions, a production cost of as low as F$ 1 per litre seems achievable. It is not recommended to pursue the production of coconut oil methyl ester (biodiesel) on Rotuma as cost would be prohibitively high and its production would involve methanol that is a toxic substance.30
10.5 Use of CNO as Fuel
Diesel fuel powers vehicles, generators and construction machinery on Rotuma. In most cases modifications of fuel systems and engines will be required to allow medium-and long-term operation of a vehicle or a generator on CNO. Modifications may include fuel heating, additional filtration, installation of dual-tank systems, replacement of injector nozzles and injector pumps. There are also generators available that are already adapted for CNO use. Whenever new generation equipment is procured, consideration should be given to a generator that has the capability to operate on CNO. CNO can also be blended with diesel in order to avoid or reduce technical problems related to the use of straight CNO. CNO use also requires additional operation cost such as more frequent service of engines and more frequent replacement of fuel and oil filters and monitoring of engine oil quality. Best results can be expected for applications where engines are consistently operated under high loads and high-operating temperatures.
30 A fatality has been reported in September 07 in Fiji related to the ingestion of Methanol
97
Such conditions can be easily maintained in water pumping which is by far the largest single diesel consumer on the island. Village electricity supply serving only peak times provides another opportunity for high engine loading provided the generators are sized properly. Our benefit cost comparison shows that the use of CNO as a subsitute fuel is financially viable as long as the supply cost of a litre of diesel are approximately F$ 0.40 to 0.50 higher than supply cost of a litre of CNO. At current supply cost for diesel well above F$ 2 per litre this condition is met, i.e. CNO use is feasible. The best case with respect to benefit cost ratio is a centralised power supply based on a specifically designed CNO power plant which would serve the entire island of Rotuma. For such an application to be viable a price difference of only F$ 0.11 between the supply cost of diesel and the supply cost of CNO would be required.
10.6 Next Steps
Our resource assessment has clearly shown that Rotuma has more than sufficient coconuts to meet its diesel demand within the bounds of technical feasibility, i.e. a CNO production of 100,000 – 150,000 litres a year would not meet any raw material supply constraint. While we currently believe that a centralised approach would be more conducive to quality control and optimised production cost this needs to be confirmed during a pilot phase. The cost to establish such a facility including redundant machinery and building would be approximately FJ$ 135,000. Annual operating costs including raw material, labour, electricity and consumables would be approximately FJ$ 140,000. Production cost without a supporting grant would be in the order of FJ$ 1.50 – 1.60 per litre of oil. With a donor-funded grant subsidy for the installation, production cost could be brought down to FJ$ 1.40 – 1.45 per litre of oil. In order to gain further empirical data on CNO production and use, a community pilot project will be funded under PIEPSAP and implemented with the community of Motusa Village. A Memorandum of Understanding that outlines the contributions of both PIEPSAP and the community has already been concluded. According to the MoU PIEPSAP will undertake the following:
Supply a pilot CNO production facility having a production capacity of approximately 30 liters of oil per day.
Assist in setting up a pilot production plant. Provide guidance with respect to CNO production and
utilisation. Carry out laboratory analysis of oil samples to check on
suitability of CNO quality for fuel use. Provide retrofitting equipment for diesel engines up to FJD 1000 Document production and utilisation trials. Assist in broad stakeholder consultations on a full-scale project Prepare a project document for a full-scale project.
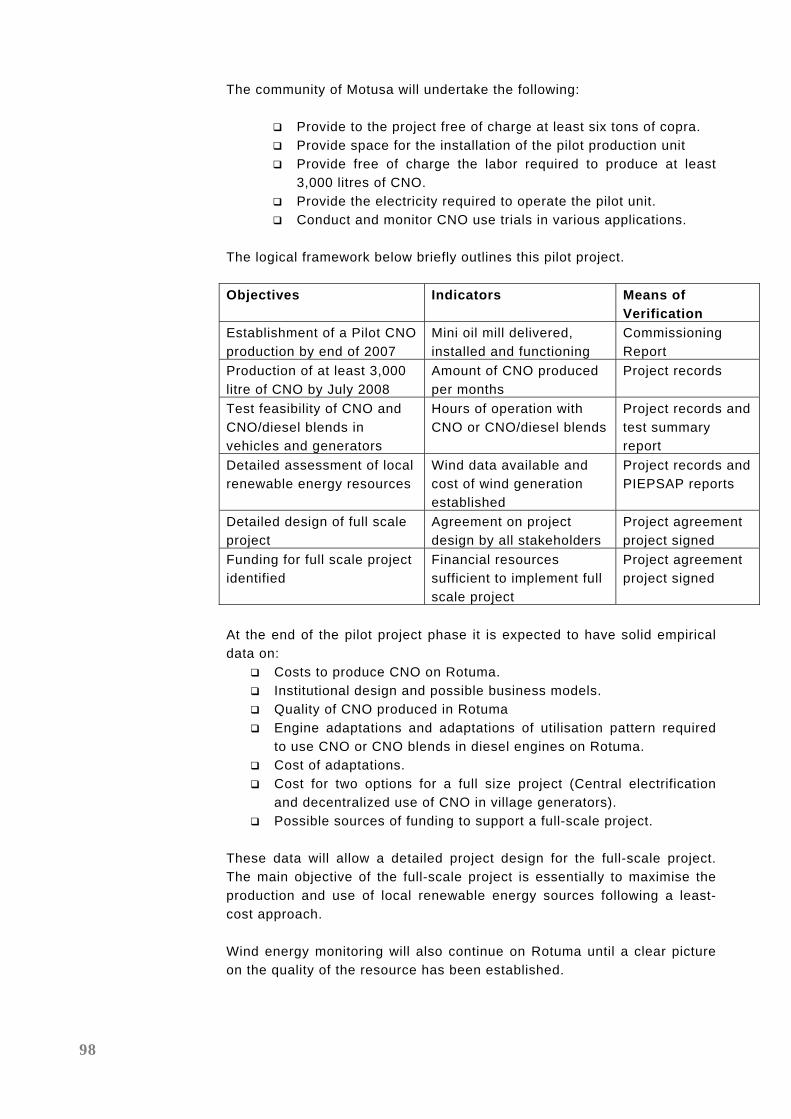
98
The community of Motusa will undertake the following:
Provide to the project free of charge at least six tons of copra. Provide space for the installation of the pilot production unit Provide free of charge the labor required to produce at least
3,000 litres of CNO. Provide the electricity required to operate the pilot unit. Conduct and monitor CNO use trials in various applications.
The logical framework below briefly outlines this pilot project. Objectives Indicators Means of
Verification Establishment of a Pilot CNO production by end of 2007
Mini oil mill delivered, installed and functioning
Commissioning Report
Production of at least 3,000 litre of CNO by July 2008
Amount of CNO produced per months
Project records
Test feasibility of CNO and CNO/diesel blends in vehicles and generators
Hours of operation with CNO or CNO/diesel blends
Project records and test summary report
Detailed assessment of local renewable energy resources
Wind data available and cost of wind generation established
Project records and PIEPSAP reports
Detailed design of full scale project
Agreement on project design by all stakeholders
Project agreement project signed
Funding for full scale project identified
Financial resources sufficient to implement full scale project
Project agreement project signed
At the end of the pilot project phase it is expected to have solid empirical data on:
Costs to produce CNO on Rotuma. Institutional design and possible business models. Quality of CNO produced in Rotuma Engine adaptations and adaptations of utilisation pattern required
to use CNO or CNO blends in diesel engines on Rotuma. Cost of adaptations. Cost for two options for a full size project (Central electrification
and decentralized use of CNO in village generators). Possible sources of funding to support a full-scale project.
These data will allow a detailed project design for the full-scale project. The main objective of the full-scale project is essentially to maximise the production and use of local renewable energy sources following a least-cost approach. Wind energy monitoring will also continue on Rotuma until a clear picture on the quality of the resource has been established.

99
Annex 1: Selected Bibliography
Further reading on the subject of biofuels: Cameron, A. (2006) “Green or Grey – Sustainability issues of biofuel production” Earthcan Article Fresco, L.O. (2006) “Biomass for food or fuel: Is there a dilemma?” The Duisenberg Lecture Singapore, September 17, 2006 Fürstenwerth, D. (2006) “Potentials of Coconut Oil as Diesel Substitute in Pacific island countries” MSc. Study, Aachen RWTH University, Germany McDonnell, K., Ward, S., McNulty, P.; “Results of Engine and Vehicle Testing of Semi-refined Rapeseed Oil”; in: Proceedings of the 10th international Rapeseed Congress; Canberra, Australia, 1999; McGregor, A “Trade liberalization and implications for the FIC edible oil producers”, Trade Development Office, Suva, June 2003 Monibot, G. (2005) “Biofuel, Worse Than Fossil Fuel” The Guardian 6th December 2005 Peterson, C., Jones S. (University of Idaho, USA); “Using Unmodified Vegetable Oils as a Diesel Fuel Extender - A Literature Review”; conference paper “Bioenergy 2002”; University of Idaho; Moscow, USA, 2002 Prateepchaikul, G., Apichato, T.; “Palm oil as Fuel for Agricultural Diesel Engines: Comparative Testing against Diesel Oil”; Songklanakarin Journal of Science and Technology (Thailand), Vol. 25 Nr. 3, May-June 2003; (04.03.2006)
Raturi, A. (2006) “Status of and potential for utilising coconut oil in power generation and industrial use in Pacific island countries”, Draft, for World Bank, Unitech, Lae. Shaheed, A., Swain, E.; “Combustion Analysis of Coconut Oil and its Methyl Esters in a Diesel Engine”; Proceedings of the Institution of Mechanical Engineers Part D – Journal of Automobile Engineering, Vol. 213 Part A, p. 417- 425. 1999 Smeets E, et al (2005) “The impact of sustainability criteria on the costs and potentials of bioenergy production”, University of Utrecht May 2005. Vaïtilingom, G. et al. (1995) “Crude Copra Oil, a biofuel for diesel engines” CIRAD / SPC, New Caledonia Weihenstephan, (2006) “Quality Standard for Rapeseed oil as a fuel” DIN 51 605, 05/2000, Technologie und Förderzentrum Germany Zieroth, G. et al (1985) “Biofuels for developing countries: Promising strategy or dead end?” GTZ, Germany

100
Related Documents