Bioenergy Production from MSW by Solid-State Anaerobic Digestion Sarina J. Ergas, Daniel H. Yeh Greg Hinds, George Dick, Meng Wang Department of Civil & Environmental Engineering University of South Florida, Tampa, FL Presentation to TAG February 16, 2016

Welcome message from author
This document is posted to help you gain knowledge. Please leave a comment to let me know what you think about it! Share it to your friends and learn new things together.
Transcript
Bioenergy Production from MSW
by Solid-State Anaerobic Digestion
Sarina J. Ergas, Daniel H. Yeh
Greg Hinds, George Dick, Meng Wang
Department of Civil & Environmental Engineering
University of South Florida, Tampa, FL
Presentation to TAG
February 16, 2016

Intro to HS-AD (a.k.a. SS-AD)
Designed to process feedstocks with > 15% total solids content.
1
Biogas
Leachate/Digestate
Recirculation
Additives
Organic Waste
Inoculum
Pre-Processing/
Pretreatment
Parasitic
Energy
High-Solids
Anaerobic
Digestion
Digestate
Processing
Digestate Utilization
or Disposal - Biofertilizer, compost, or
soil amendment
- Further conversion
- Disposal in LF or WtE
Biogas
Processing
Biogas Utilization - Combined heat & power
- Compressed natural gas
- Natural gas grid injection
Digestate


Research Motivation
Anaerobic Digestion (AD) of OFMSW results in:
Energy recovery/renewable energy generation
Reduces fugitive GHG emissions from landfills
Offsets GHG emissions from fossil-fuel derived energy
Nutrient recovery/organic fertilizer production
Reduces landfill leachate volume and strength
Offsets impacts of inorganic fertilizer production
High-Solids AD (HS-AD) advantages over Liquid AD:
Reduced parasitic energy demand
Reduced reactor volume requirements
Reduced water usage and leachate generation
3
Research Objectives
Overall Goals
Contribute to the fundamental science of HS-AD and evaluate
potential for implementation in FL
Specific Objectives
1. State-of-the-Art of HS-AD
Trends and drivers in the industry and appropriate technologies for FL
2. Enhancing Bioenergy Production
Improve biodegradability of yard waste and explore co-digestion strategies
3. Potential for HS-AD Implementation in FL
Identify promising locations for HS-AD based on existing MSW
infrastructure and potential bioenergy production, GHG emissions
reductions and nutrient recovery.
Evaluate economics and develop policy recommendations.
4
Objective 1: State-of-the-Art
Goals
Understand trends and identify primary drivers in the industry
Identify appropriate technologies for implementation in FL
Methodology
Review published and “grey” literature
Developed chronological database of US HS-AD projects
Visits to facilities in California and the Netherlands
5

HS-AD Technology Classifications
6
Anaerobic
Digestion
L-AD
HS-AD
Batch
Continuous
Single-Stage
Multi-Stage
Thermophilic
Mesophilic
SS-OFMSW
MS-OFMSW
Mixed MSW Single-Stage
Multi-Stage
Thermophilic
Mesophilic
Single-Stage
Multi-Stage
Single-Stage
Multi-Stage
Single-Substrate
Codigestion
SS-OFMSW
MS-OFMSW
Mixed MSW
TS Content Loading
Conditions Operating
Temperature Feedstock Number of Stages

0
5
10
15
20
25
30
2011 2012 2013 2014 2015 2016 2017
Ap
pro
xim
ate
To
tal
Nu
mb
er o
f F
ull
-Sca
le
HS
-AD
Fa
cili
ties
in
th
e U
S
HS-AD Development in the US
Projected
based on
projects in
planning,
permitting, and
construction
phases
7
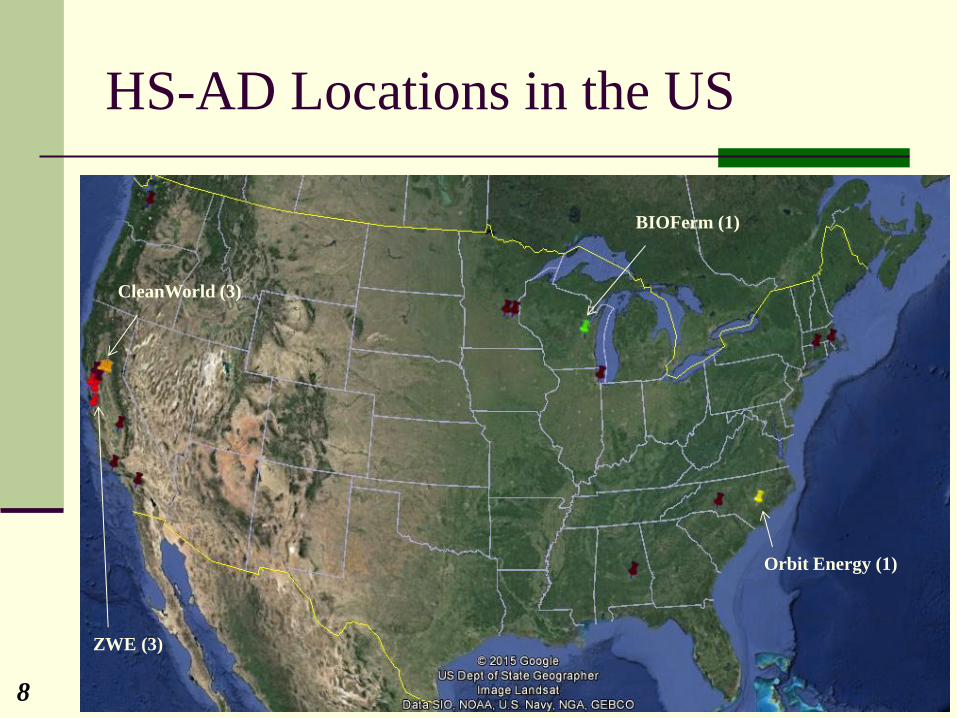
HS-AD Locations in the US
CleanWorld (3)
ZWE (3)
BIOFerm (1)
Orbit Energy (1)
8

HS-AD Development Timeline
9
Liquid AD
(L-AD) widely
implemented
Sharp increase in
landfill bans and
taxation in the EU
Source-separation
mandates increasing
in number in the EU
Development of
HS-AD begins
in the EU
1970 1980 1990 2000 2010 2020
Development of
HS-AD begins
in the US
Addition of
OFMSW to L-AD
systems begins
Accelerating development of
OFMSW recycling
legislation and renewable
energy incentives in the US
Stand-alone HS-AD
capacity surpasses
L-AD in the US;
Single-stage batch
systems are dominant
technology type
HS-AD becomes
dominant AD type for
OFMSW in the EU

Summary of Major Findings
10
Policy promoting OFMSW recycling in the US increasing: 20 states now have yard waste landfill bans, 5 have food waste bans
7 have landfill diversion targets
Over 200 communities offer separate collection of food waste
Required source-separation in San Francisco, Seattle, VT, and CT
29 states now have renewable portfolio standards
HS-AD implementation parallels policy development
HS-AD has surpassed L-AD for OSFMW processing capacity
CA is leading the way with policy and HS-AD development
Single-stage, batch, thermophilic, “garage” type systems are
the most suitable for Florida
Low cost, simple operation, reliable

Objective 2: Enhancing Bioenergy
The Lignocellulosic Challenge
11
Complex
Organic Matter
Hydrolysis
Soluble Organic
Molecules
H2 + CO2
Acetic Acid
VFAs Biogas
(CH4 + CO2)
Acidogenesis
(Fermentation)
Acetogenesis
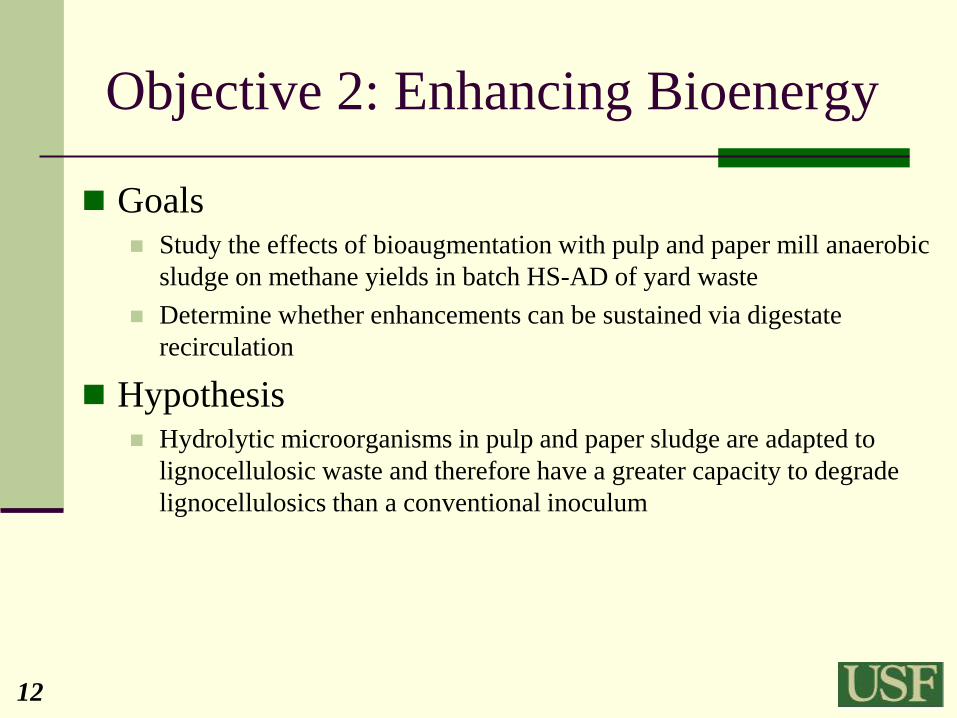
Objective 2: Enhancing Bioenergy
Goals Study the effects of bioaugmentation with pulp and paper mill anaerobic
sludge on methane yields in batch HS-AD of yard waste
Determine whether enhancements can be sustained via digestate
recirculation
Hypothesis Hydrolytic microorganisms in pulp and paper sludge are adapted to
lignocellulosic waste and therefore have a greater capacity to degrade
lignocellulosics than a conventional inoculum
12
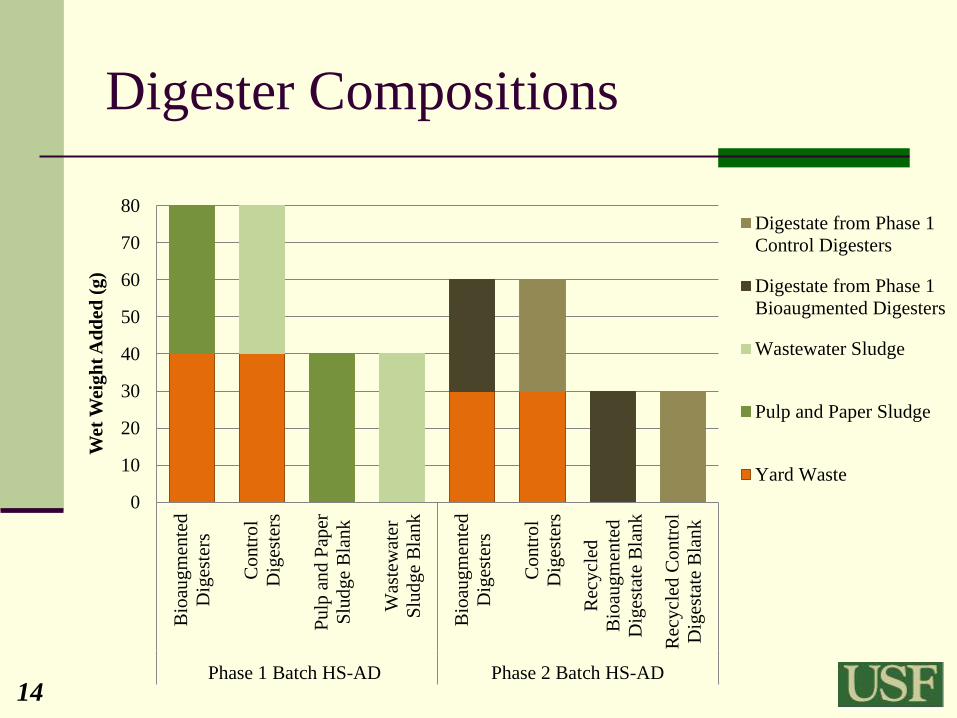
Digester Compositions
14
0
10
20
30
40
50
60
70
80
Bio
aug
men
ted
Dig
este
rs
Co
ntr
ol
Dig
este
rs
Pu
lp a
nd P
aper
Slu
dge
Bla
nk
Was
tew
ater
Slu
dge
Bla
nk
Bio
aug
men
ted
Dig
este
rs
Contr
ol
Dig
este
rs
Rec
ycl
ed
Bio
augm
ente
d
Dig
esta
te B
lank
Rec
ycl
ed C
ontr
ol
Dig
esta
te B
lank
Phase 1 Batch HS-AD Phase 2 Batch HS-AD
Wet
Wei
gh
t A
dd
ed (
g)
Digestate from Phase 1
Control Digesters
Digestate from Phase 1
Bioaugmented Digesters
Wastewater Sludge
Pulp and Paper Sludge
Yard Waste

Phase 1 Specific Methane Yields
0
20
40
60
80
100
0 20 40 60 80 100
Sp
ecif
ic M
eth
an
e Y
ield
(L
CH
4/k
g V
S)
Time (Days)
Phase 1 Bioaugmentation: Yard waste inoculated with pulp and paper sludge
Phase 1 Control: Yard waste inoculated with wastewater sludge
15
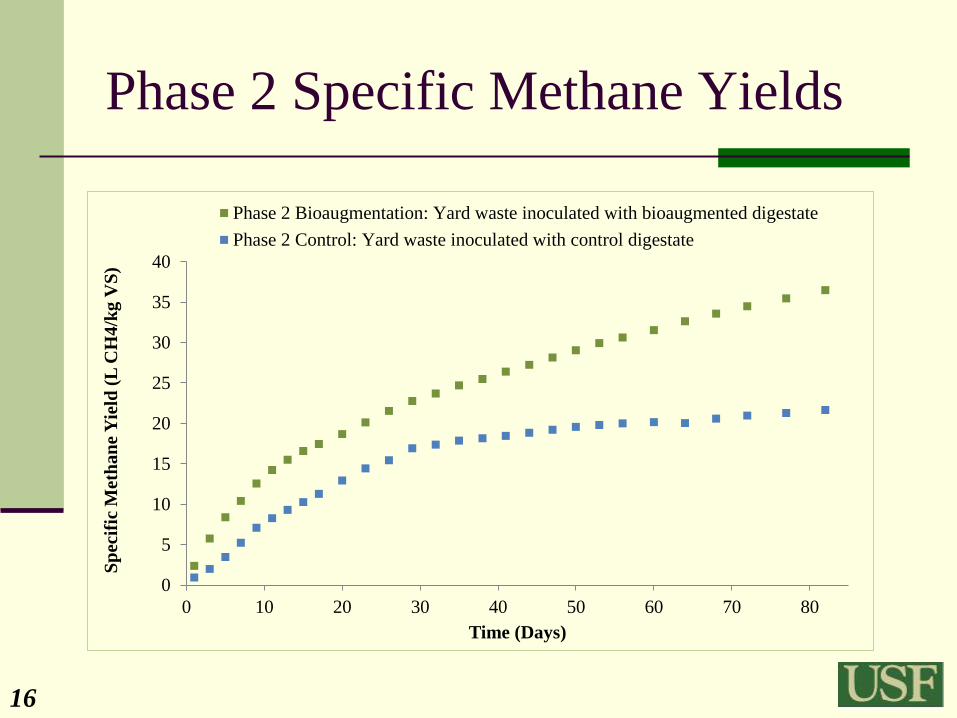
Phase 2 Specific Methane Yields
0
5
10
15
20
25
30
35
40
0 10 20 30 40 50 60 70 80
Sp
ecif
ic M
eth
an
e Y
ield
(L
CH
4/k
g V
S)
Time (Days)
Phase 2 Bioaugmentation: Yard waste inoculated with bioaugmented digestate
Phase 2 Control: Yard waste inoculated with control digestate
16

Summary of Major Findings
Results suggest that this strategy could serve as a low impact
alternative to pretreatment
Significant enhancements in methane yields achieved and sustained
through bioaugmentation with pulp & paper sludge
Chemical and lignocellulosic data support hypothesis
VFA concentrations indicate methanogenesis was rate-limiting in
bioaugmented digesters while hydrolysis was limiting in control digesters
16%, 16%, and 2% less lignin, cellulose, and hemicellulose in
bioaugmented digestate relative to control digestate
Need for future research:
Effects of varying substrate to inocula ratios
Mechanisms of methane yield enhancement
Bioaugmentation of OFMSW co-digestion mixtures – food, yard, biosolids.
Pilot and full-scale testing
17

Objective 3: Implementation in FL
Goals
Identify best FL counties for HS-AD implementation based on:
Existing MSW infrastructure
Potential bioenergy production & GHG emissions reductions
Potential for nutrient recovery.
Evaluate economics and develop policy recommendations.
Methodology
Review published and “grey” literature and FDEP data
Consider findings from State-of-the-Art assessment
Estimate potential bioenergy production, GHG reductions and
nutrient recovery
18

Incentive for HS-AD Implementation
75% recycling goal by 2020 Current statewide recycling rate = 50%
Yard and food waste recycling rates = 51% and 7%, respectively
12% of waste stream is yard waste and 7% is food waste
Up to 13% increase in recycling rate achievable via OFMSW recycling
Renewable energy generation Up to 500MW of renewable energy could be produced
175 MW electricity (~1% of FL total demand, > $120M) + 200 MW heat
OR: 80 million DGEs of CNG per year (~11.5% of FL total demand)
660,000 MTCO2E per year offset (~$3.2M - $400M)
Nutrient recovery Up to 7,000 TPY and 3,500 TPY of N and P, respectively (~$ 2.1M)
19


21
OFMSW Recycling Infrastructure
Liquid AD (a)
1a - Harvest Power
Composting (b)
1b - George B. Wittmer Assoc., Inc.12
2b - New River LF
3b - Watson C&D
4b - Vista LF
5b - Solorganics, Inc.
6b - 1 Stop Landscape and Brick, Inc.
7b - Bay Mulch, Inc.
8b - Mother’s Organics, Inc.
9b - Busch Gardens
10b - Bay Mulch, Inc. Plant City
11b - BS Ranch and Farm, Inc.
12b - 1 Stop Landscape, Inc.
13b - Okeechobee LF
14b - JFE-Brighton McGill13
15b - MW Horticulture Recycling12
16b - Environmental Turnkey, LLC.
NOTES: 1Not listed by FDEP; 2Yard waste composting only; 3Permitted by Seminole Tribe
1b
2b
1a
3b
4b 6b
7b
9b
8b
10b 11b
13b
5b
12b 14b
15b
16b

Outlook in Florida
Counties where implementation is most feasible:
Miami-Dade, Broward, Palm Beach, Hillsborough, Orange,
Pinellas, Duval, Lee, and Alachua
Ideal locations for demonstration:
Universities, existing composting plants, or landfills with LFGTE
Primary barrier: Economics
Average landfill tipping fee in FL = $43.65
Break-even HS-AD tipping fee without energy sales = $41 – $53
With energy sales = $4 – $32
Lack of markets for compost and lack of regulatory drivers
22
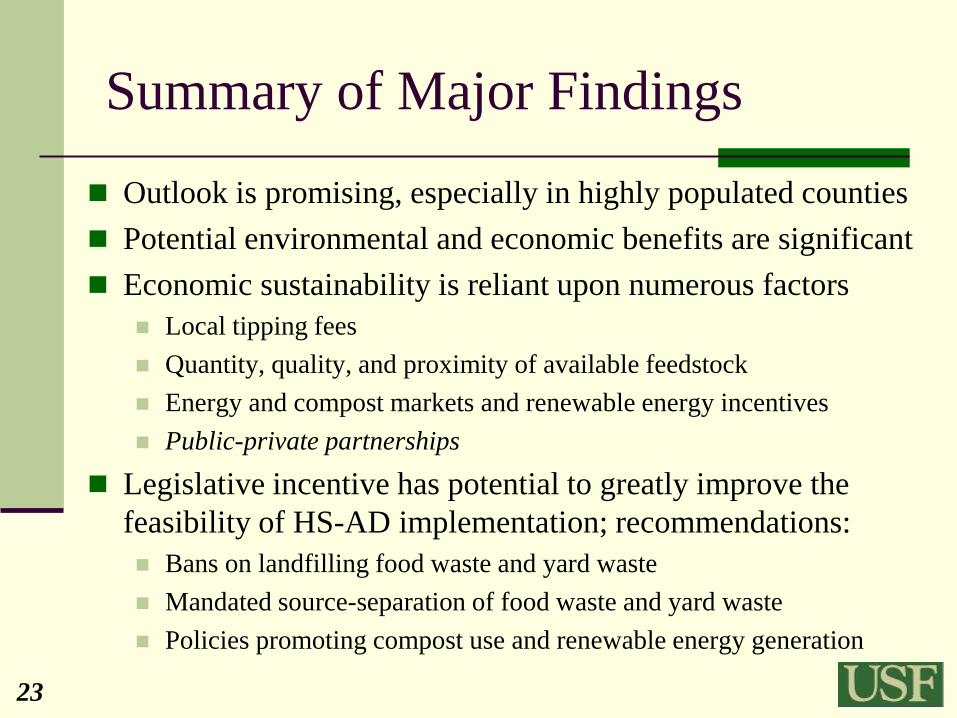
Summary of Major Findings
Outlook is promising, especially in highly populated counties
Potential environmental and economic benefits are significant
Economic sustainability is reliant upon numerous factors
Local tipping fees
Quantity, quality, and proximity of available feedstock
Energy and compost markets and renewable energy incentives
Public-private partnerships
Legislative incentive has potential to greatly improve the
feasibility of HS-AD implementation; recommendations:
Bans on landfilling food waste and yard waste
Mandated source-separation of food waste and yard waste
Policies promoting compost use and renewable energy generation
23
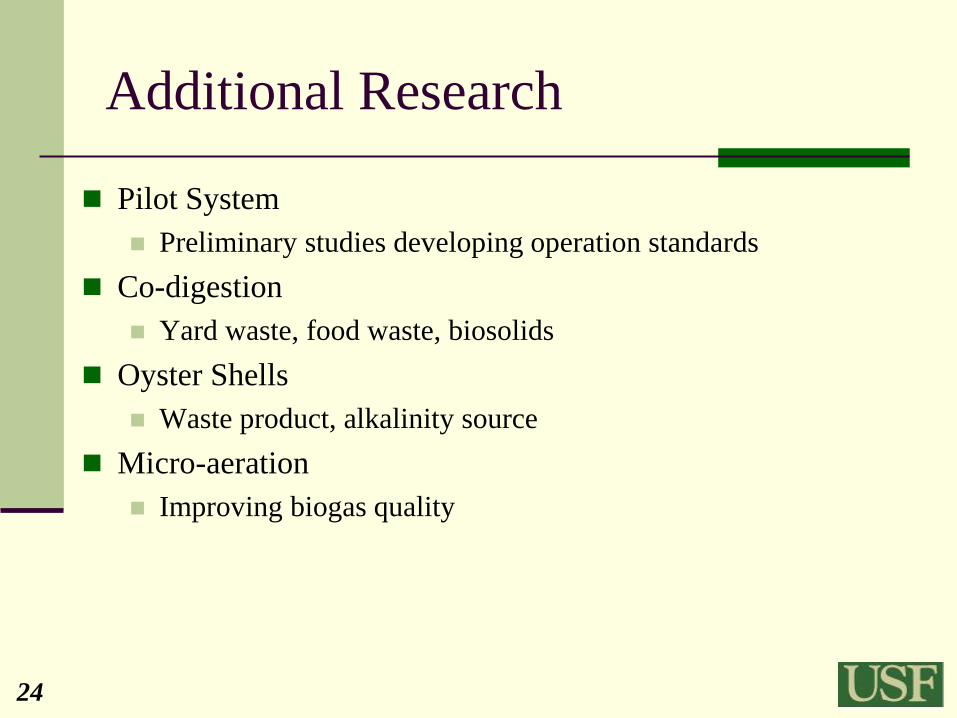
Additional Research
Pilot System
Preliminary studies developing operation standards
Co-digestion
Yard waste, food waste, biosolids
Oyster Shells
Waste product, alkalinity source
Micro-aeration
Improving biogas quality
24

Students & Postdoc
Name Rank Department Institution
Hinds, Gregory MS Civil & Environmental Engineering USF
Dick, George MS Civil & Environmental Engineering USF
Wang, Meng Postdoctoral
Researcher Civil & Environmental Engineering USF
Anferova, Natalia Visiting PhD
student
Water Technology & Environmental
Eng.
Prague Univ.
Chemistry &
Technology
Dixon, Phillip PhD Civil & Environmental Engineering USF
Name Rank Department Institution
Ariane Rosario Third Year Civil & Environmental Engineering USF
Lensey Casimir Fourth Year Civil & Environmental Engineering USF
Graduate and Postdoc
Undergraduate

Acknowledgements
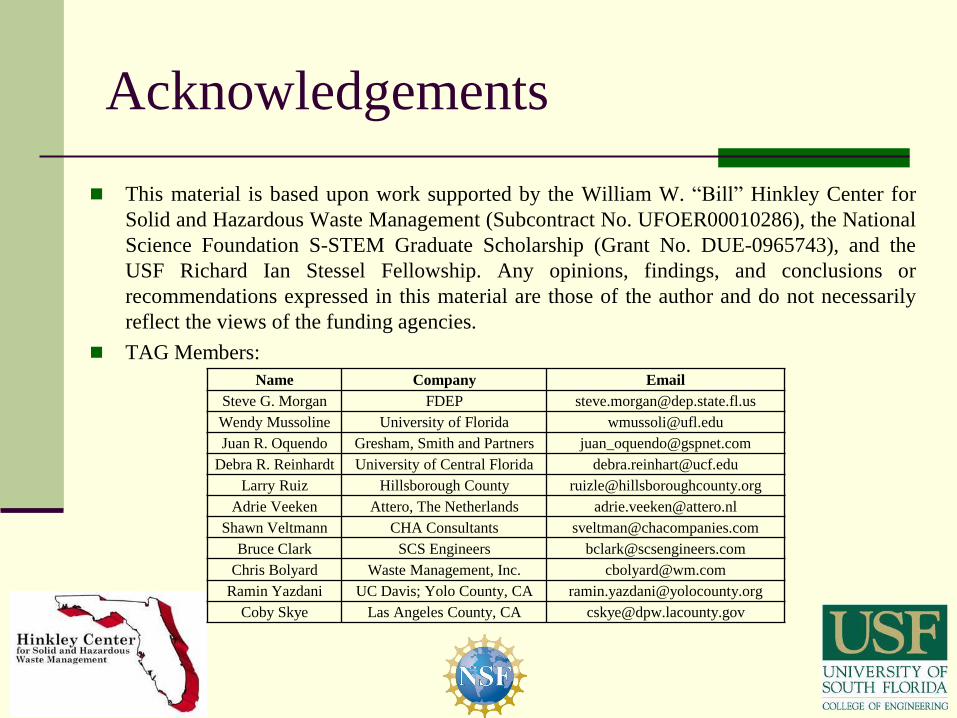
This material is based upon work supported by the William W. “Bill” Hinkley Center for
Solid and Hazardous Waste Management (Subcontract No. UFOER00010286), the National
Science Foundation S-STEM Graduate Scholarship (Grant No. DUE-0965743), and the
USF Richard Ian Stessel Fellowship. Any opinions, findings, and conclusions or
recommendations expressed in this material are those of the author and do not necessarily
reflect the views of the funding agencies.
TAG Members:
Name Company Email
Steve G. Morgan FDEP [email protected]
Wendy Mussoline University of Florida [email protected]
Juan R. Oquendo Gresham, Smith and Partners [email protected]
Debra R. Reinhardt University of Central Florida [email protected]
Larry Ruiz Hillsborough County [email protected]
Adrie Veeken Attero, The Netherlands [email protected]
Shawn Veltmann CHA Consultants [email protected]
Bruce Clark SCS Engineers [email protected]
Chris Bolyard Waste Management, Inc. [email protected]
Ramin Yazdani UC Davis; Yolo County, CA [email protected]
Coby Skye Las Angeles County, CA [email protected]

Vendor Name Main Office
Location
Founding
Year Primary Partnerships
# of Facilities
in Operation
in the US
# of Facilities
in Development
in the US
Zero Waste Energy, LLC California 2009
Eggersmann Group, Bulk
Handling Systems,
Environmental Solutions Group
≥ 3 ≥ 7
CleanWorld Corporation California 2009 UC Davis, Synergex ≥ 3 ≥ 1
Orbit Energy, Inc. North Carolina 2002 McGill Environmental ≥ 1 ≥ 5
BIOFerm Energy Systems Wisconsin 2007 Viessmann Group, Schmack
Biogas ≥ 1 ≥ 1
Organic Waste Systems, Inc.
Belgium
(subsidiary in
Ohio)
1988 NR ≥ 0 ≥ 1
Harvest Power, Inc. Massachusetts 2008 GICON Bioenergie GmbH ≥ 0 ≥ 1
Eisenmann Corporation
Germany
(subsidiary in
Illinois)
1977 NR ≥ 0 ≥ 2
Turning Earth, LLC.
Denmark
(subsidiary in
Georgia)
2009 Solum Group,
Aikan A/S ≥ 0 ≥ 1
EcoCorp, Inc. Maryland 2000 NR ≥ 0 ≥ 0
HS-AD Vendors in the US

US Technology Characteristics
Vendor Name Operating
Temperature
TS
Content
Loading
Conditions
Number of
Stages
Retention
Time
Parasitic Energy
Demand
Zero Waste Energy, LLC Thermophilic < 50% Batch 1 21 days 20%
CleanWorld Corporation
(formerly CleanWorld
Partners, LLC)
Thermophilic ~10% Continuous 3 20-30 days
Orbit Energy, Inc. Thermophilic < 45% Continuous 1 “short” 8%
BIOFerm Energy Systems Mesophilic 25-35% Batch 1 28 days 5-10%
Organic Waste Systems, Inc. Thermophilic or
Mesophilic < 50% Continuous 1 20 days NR
Harvest Power, Inc. Thermophilic NR Batch 2 ≥ 14 days NR
Eisenmann Corporation Thermophilic NR Continuous 1 NR NR
Aikan North America, Inc. Thermophilic NR Batch 2 NR NR
EcoCorp, Inc. Thermophilic 35-40% Continuous 1 20 days 20%
NR = Not Reported; Information reported here was derived from technology vendor websites and personal communications

Inocula and Substrate Characterization
Pulp and
Paper Sludge
Wastewater
Sludge
Yard Waste for
Phase 1 Batch
HS-AD
Digestate from
Phase 1 Bioaugmented
Digesters
Digestate from
Phase 1 Control
Digesters
Yard Waste
for Phase 2
Batch HS-AD
Alkalinity
(mg/L as CaCo3) 2,100 580 50 400 140 25
TS
(% of wet weight) 10.0 ± 0.2 0.6 ± 0.0 50.8 ± 3.4 18.5 ± 0.1 23.7 ± 0.3 64.2 ± 0.5
VS
(% of wet weight) 8.4 ± 0.1 0.4 ± 0.0 46.4 ± 2.9 16.6 ± 0.1 21.7 ± 0.2 60.1 ± 0.4
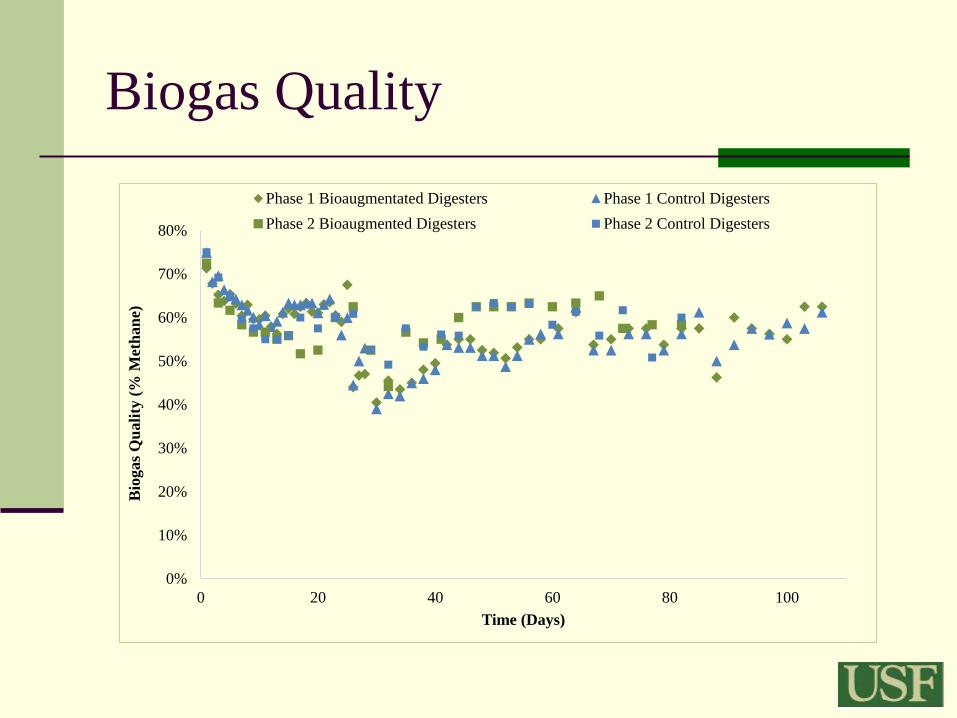
Biogas Quality
0%
10%
20%
30%
40%
50%
60%
70%
80%
0 20 40 60 80 100
Bio
gas
Qu
ali
ty (
% M
eth
an
e)
Time (Days)
Phase 1 Bioaugmentated Digesters Phase 1 Control Digesters
Phase 2 Bioaugmented Digesters Phase 2 Control Digesters

Chemical Analysis
0
200
400
600
800
1000
1 7 21 42 63 106
Alk
ali
nit
y (
mg
/L a
s C
aC
O3)
Time (days)
0
500
1000
1500
2000
2500
3000
3500
4000
1 7 21 42 63 106
sCO
D (
mg/L
)
Time (days)
Phase 1 Bioaugmented Digesters Phase 1 Control Digesters
0
50
100
150
200
250
1 7 21 42 63 106Tota
l A
mm
on
ia N
itro
gen
(m
g/L
)
Time (days)
0
200
400
600
800
1000
1200
1 7 21 42 63 106
VF
A (
mg
/L a
s A
ceta
te)
Time (days)
pH = 7.1-8.4 (in bioaugmented digesters); 6.3-8.0 (in control digesters)

Lignocellulosic Analysis
Lignin, cellulose, and hemicellulose contents in the bioaugmented digestate
were 2%, 16%, and 16% less, respectively, than in the control digestate
0
5
10
15
20
25
30
35
40
45
50
Bioaugmented
Digestate
Control
Digestate
Lignin
% o
f D
ry W
eig
ht
0
2
4
6
8
10
12
14
Bioaugmented
Digestate
Control
Digestate
Cellulose
0
1
2
3
4
5
6
7
8
9
10
Bioaugmented
Digestate
Control
Digestate
Hemicellulose
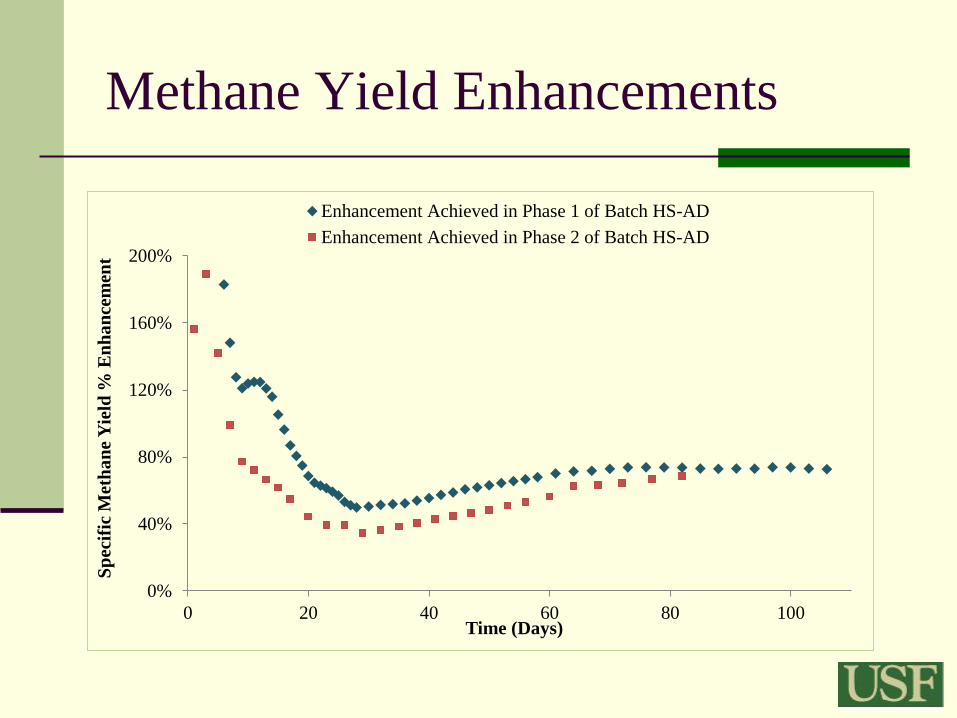
Methane Yield Enhancements
0%
40%
80%
120%
160%
200%
0 20 40 60 80 100
Sp
ecif
ic M
eth
an
e Y
ield
% E
nh
an
cem
ent
Time (Days)
Enhancement Achieved in Phase 1 of Batch HS-AD
Enhancement Achieved in Phase 2 of Batch HS-AD

Benefits of HS-AD Implementation in FL
Yard Waste Food Waste Total
Assumed Generation Rate (short tons/year) = 3,700,000 2,200,000 5,900,000
Assumed Volatile Solids Fraction (% by wet weight) = 0.60 0.15
Assumed Biogas Generation (m3/kg VS) = 0.30 0.50
Total Energy Content (GWh/year) = 3,520 870 4,390
Total Electricity Generation Potential (GWh/year) = 1,230 300 1,530
Total Electricity Generation in Florida (GWh/year) = 246,200
Fraction of Florida Electricity Demand Fulfilled = 0.5% 0.1% 0.6%
OR:
CNG Generation (DGE/year) = 63,400,000 15,700,000 79,100,000
Total CNG Consumption in Florida (DGE/year) = 688,000,000
Fraction of Florida CNG Demand Fulfilled = 9.2% 2.3% 11.5%
Note: Assumes 9.7 kWh-m-3 CH4, 9.8 kWh-L-1diesel, 35% electrical conversion efficiency, and 67% CNG conversion
efficiency; mass conversion factor = 907 kg per short ton
Nitrogen Phosphorous
Assumed Digestate Generation Rate (short tons/year) = 3,540,000 3,540,000
Assumed Total Solids Content (%) = 20% 20%
Assumed Available Fraction (%) = 1.0% 0.5%
Nutrient Recovery Potential (short tons/year) = 7,080 3,540
Note: Assumes 40% mass reduction in HS-AD; mass conversion factor = 907 kg per short ton
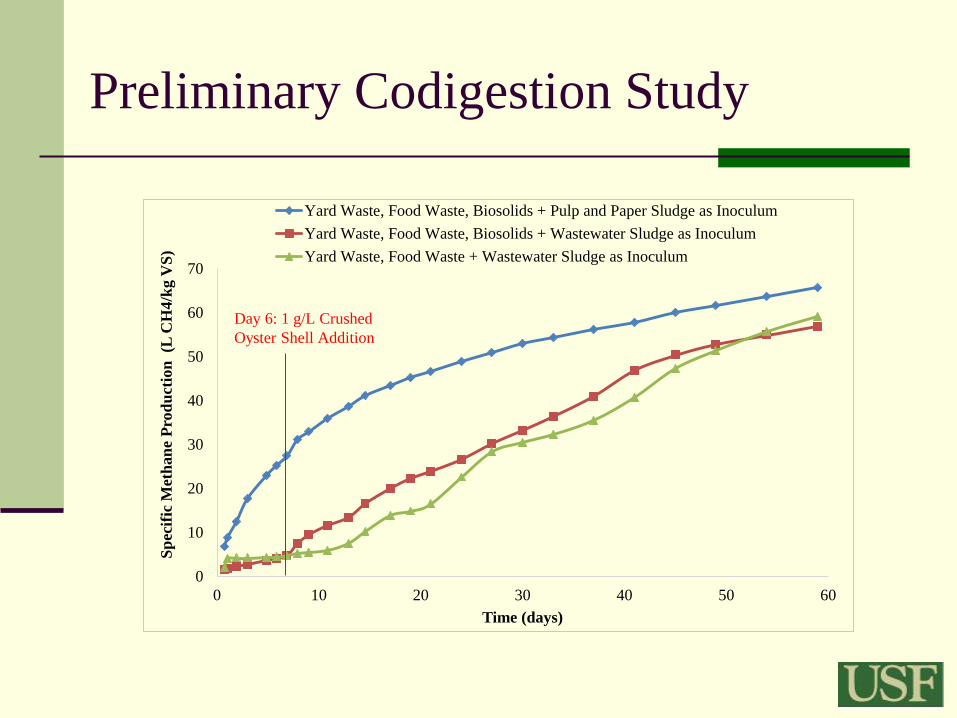
Preliminary Codigestion Study
0
10
20
30
40
50
60
70
0 10 20 30 40 50 60
Sp
ecif
ic M
eth
an
e P
rod
uct
ion
(L
CH
4/k
g V
S)
Time (days)
Yard Waste, Food Waste, Biosolids + Pulp and Paper Sludge as Inoculum
Yard Waste, Food Waste, Biosolids + Wastewater Sludge as Inoculum
Yard Waste, Food Waste + Wastewater Sludge as Inoculum
Day 6: 1 g/L Crushed
Oyster Shell Addition
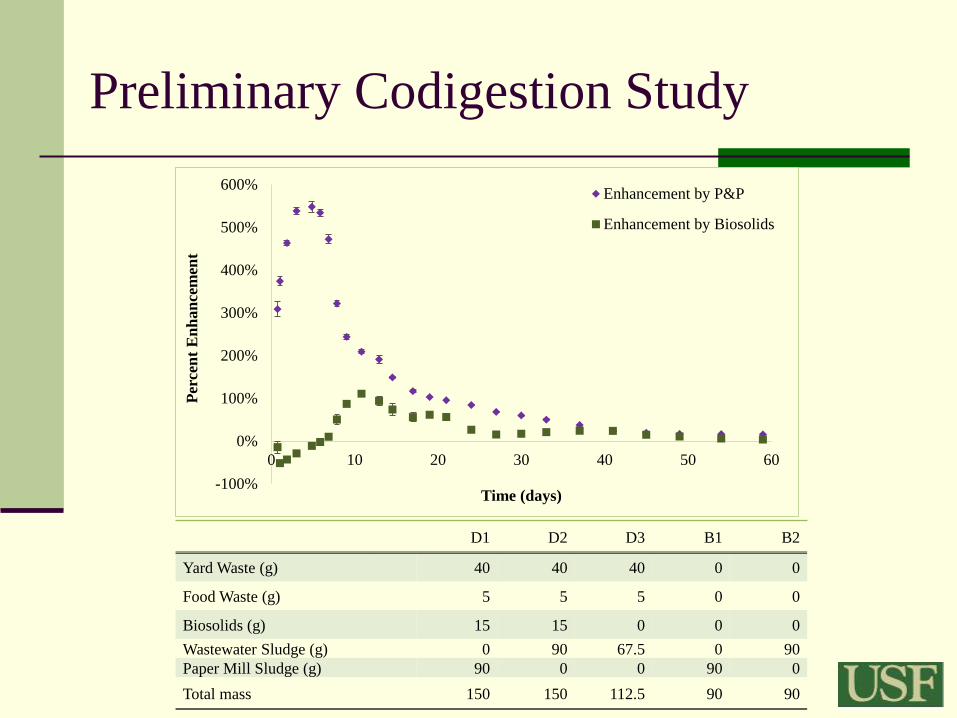
Preliminary Codigestion Study
D1 D2 D3 B1 B2
Yard Waste (g) 40 40 40 0 0
Food Waste (g) 5 5 5 0 0
Biosolids (g) 15 15 0 0 0
Wastewater Sludge (g) 0 90 67.5 0 90
Paper Mill Sludge (g) 90 0 0 90 0
Total mass 150 150 112.5 90 90
-100%
0%
100%
200%
300%
400%
500%
600%
0 10 20 30 40 50 60
Per
cen
t E
nh
an
cem
ent
Time (days)
Enhancement by P&P
Enhancement by Biosolids
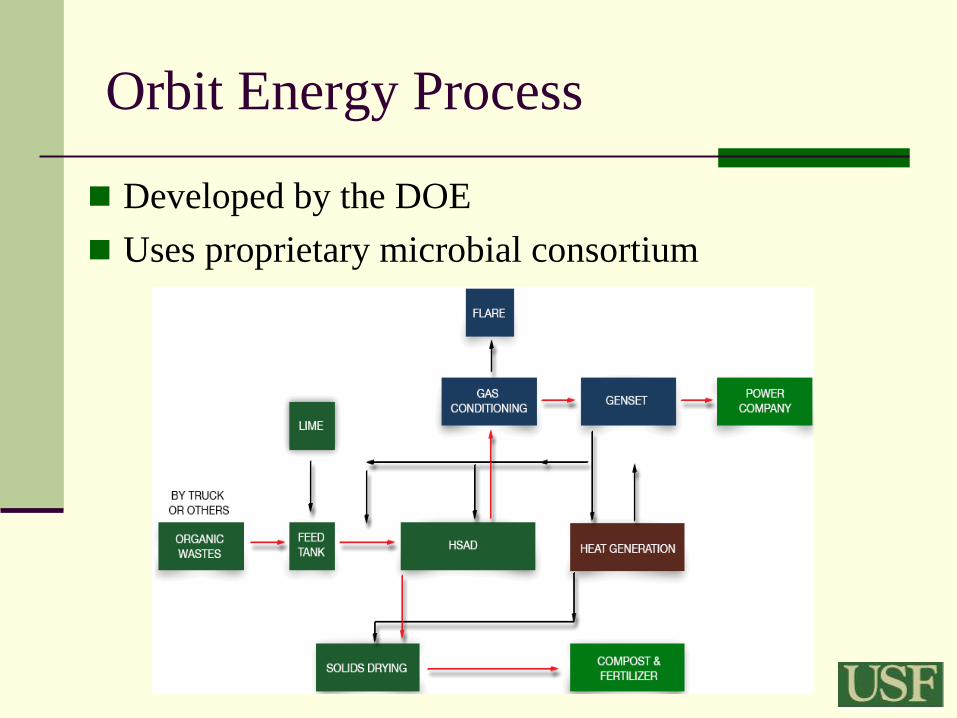
Orbit Energy Process
Developed by the DOE
Uses proprietary microbial consortium


DRANCO Diagram, Sordisep Process,
and Brecht I and II Facilities


Related Documents