Bioenergy in Pennsylvania: Online database, map, and report Mary S. Booth Partnership for Policy Integrity October 16, 2014

Bioenergy in Pennsylvania: Online database, map, and report Mary S. Booth Partnership for Policy Integrity October 16, 2014.
Dec 17, 2015
Welcome message from author
This document is posted to help you gain knowledge. Please leave a comment to let me know what you think about it! Share it to your friends and learn new things together.
Transcript
Bioenergy in Pennsylvania: Online database, map, and report
Mary S. BoothPartnership for Policy Integrity
October 16, 2014
2
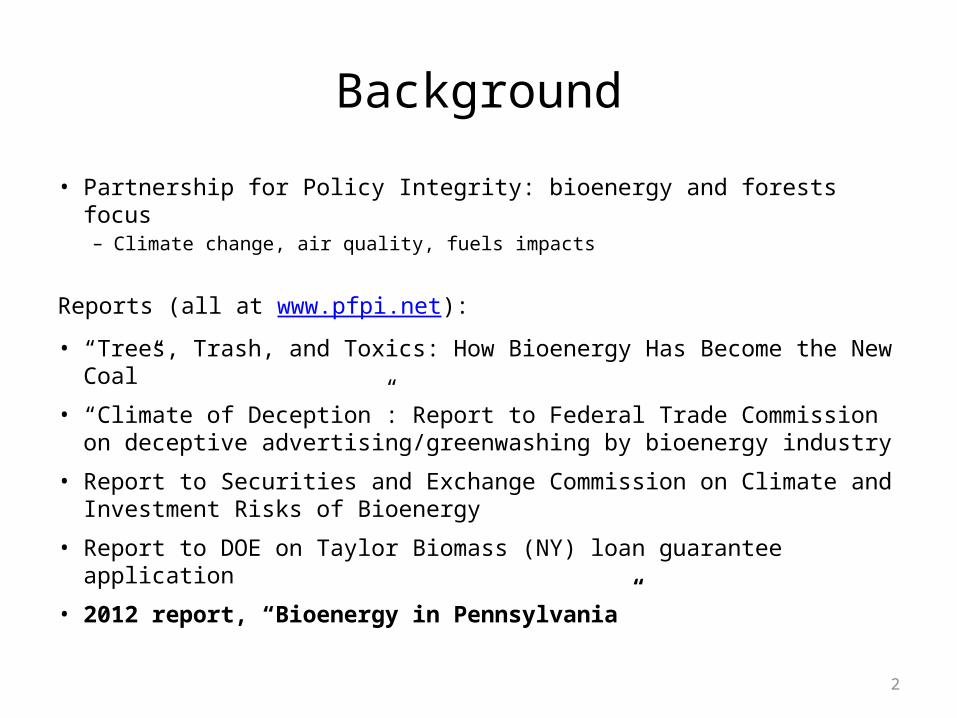
Background
• Partnership for Policy Integrity: bioenergy and forests focus– Climate change, air quality, fuels impacts
Reports (all at www.pfpi.net):
• “Trees, Trash, and Toxics: How Bioenergy Has Become the New Coal”
• “Climate of Deception”: Report to Federal Trade Commission on deceptive advertising/greenwashing by bioenergy industry
• Report to Securities and Exchange Commission on Climate and Investment Risks of Bioenergy
• Report to DOE on Taylor Biomass (NY) loan guarantee application
• 2012 report, “Bioenergy in Pennsylvania”
3
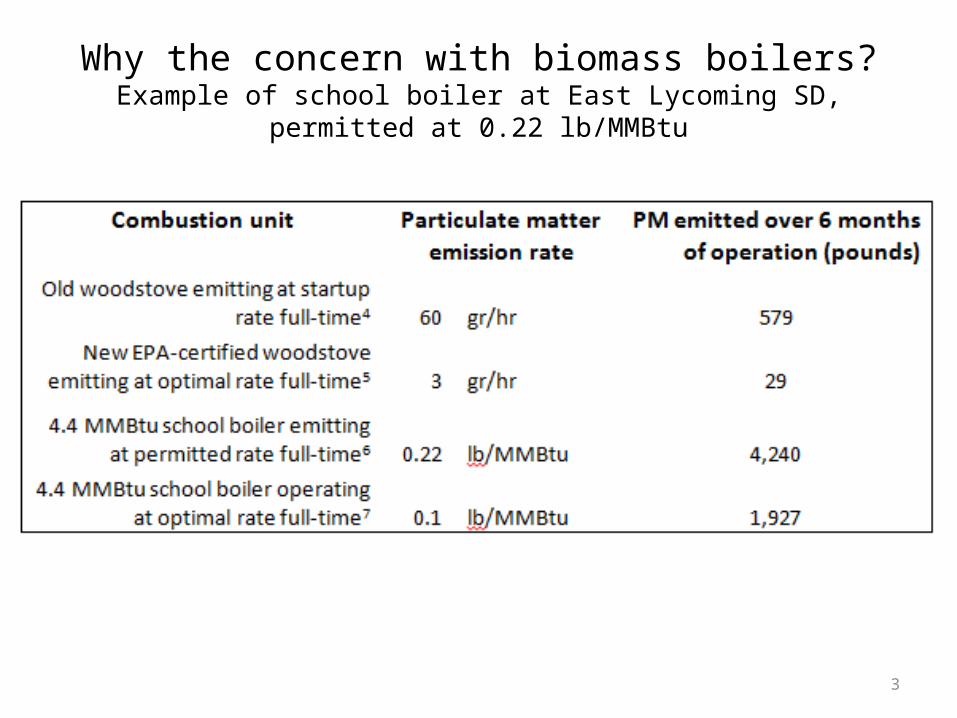
Why the concern with biomass boilers?Example of school boiler at East Lycoming SD, permitted at 0.22
lb/MMBtu
4
Goals of this presentation
• Describe Pennsylvania bioenergy database, report (formal release date is Tues Oct. 21)
• Facilitate its use• Get input on how to improve this project, and the next project
(map, database of most polluting facilities in Pennsylvania; emphasis on permit accountability)
5
What we did
• Pennsylvania Bulletin (www.pabulletin.com): Data for wood/biomass-fired boilers on boiler capacity, pollution emissions, emission controls, permit number, and permit renewal date
• Permits are renewed every five years – goal is to increase review during renewal
• Map and database at http://www.pfpi.net/biopower-in-pennsylvania– Leave username blank; password is …
6
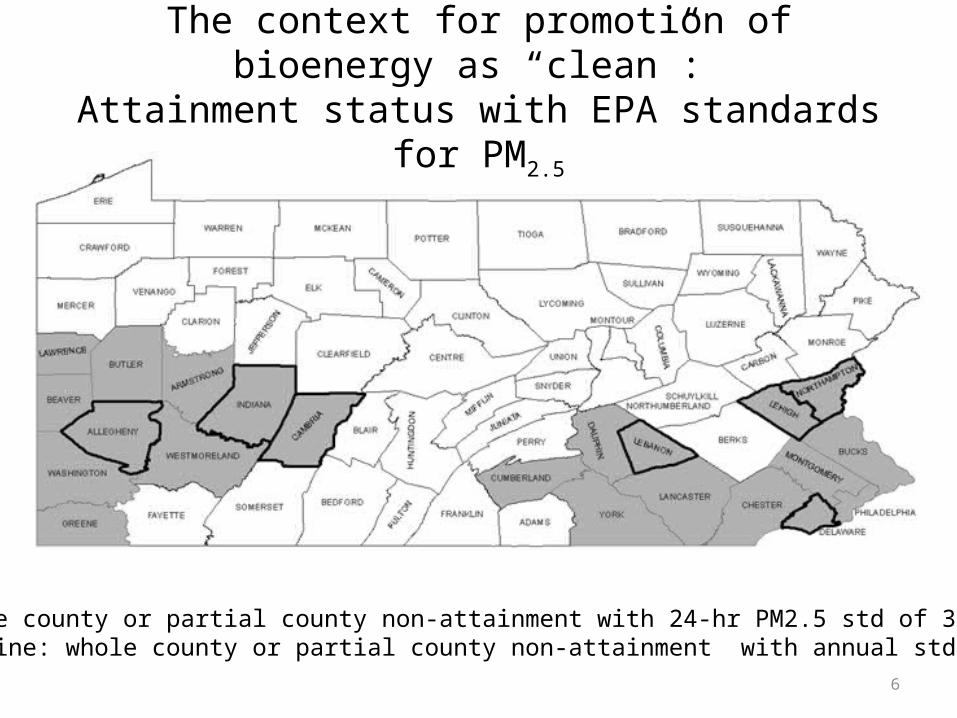
The context for promotion of bioenergy as “clean”: Attainment status with EPA standards for PM2.5
Grey: whole county or partial county non-attainment with 24-hr PM2.5 std of 35 µg/m2
Black outline: whole county or partial county non-attainment with annual std of 12 µg/m2
7
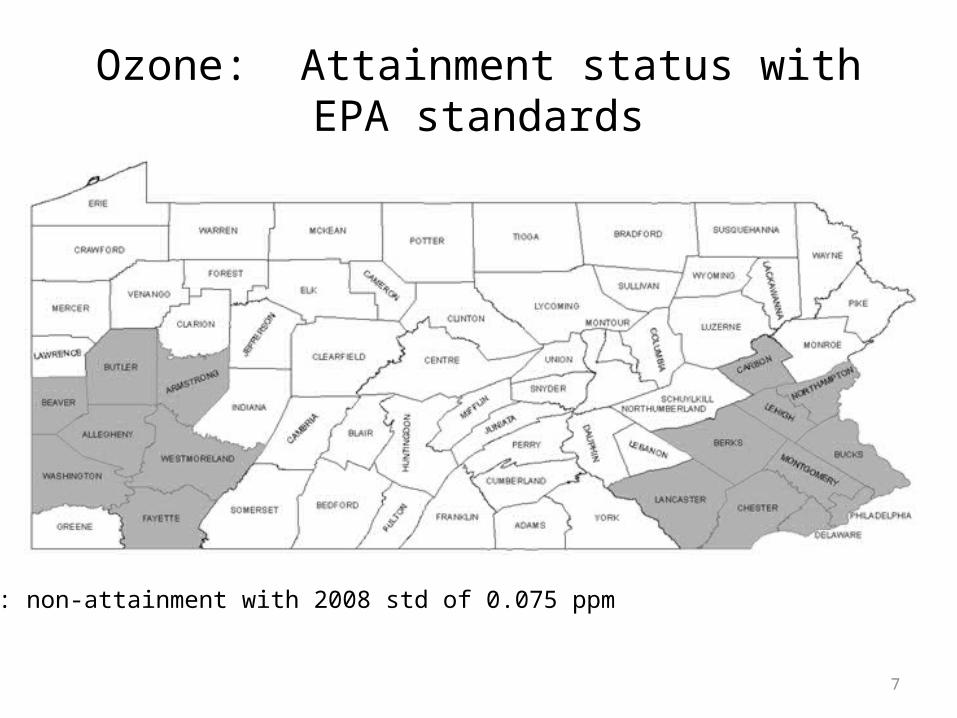
Ozone: Attainment status with EPA standards
Grey: non-attainment with 2008 std of 0.075 ppm
8
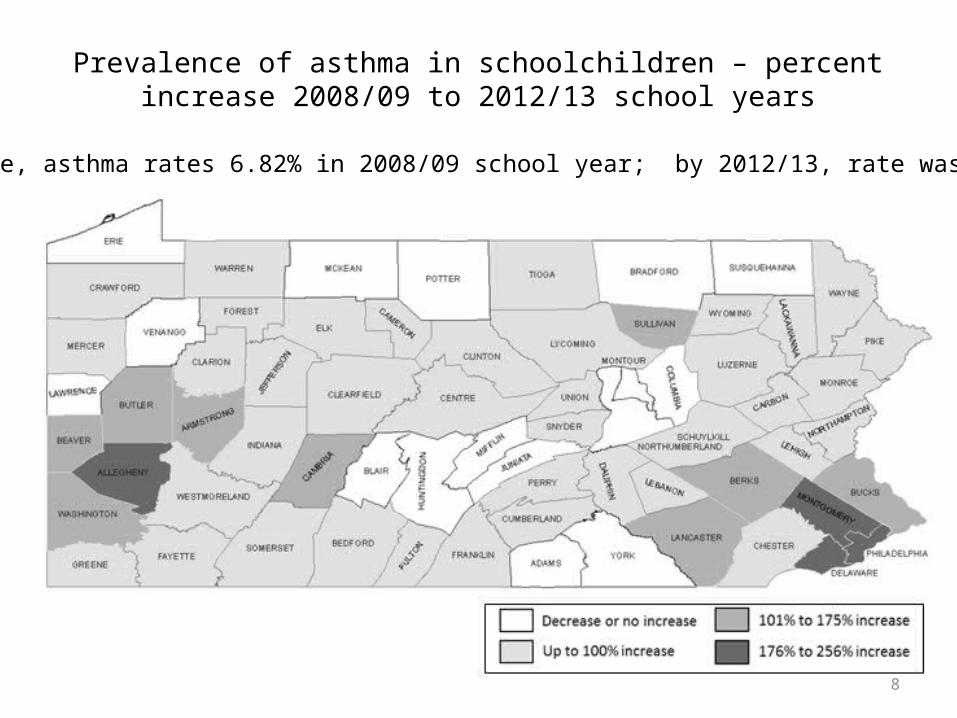
Prevalence of asthma in schoolchildren – percent increase 2008/09 to 2012/13 school years
Statewide, asthma rates 6.82% in 2008/09 school year; by 2012/13, rate was 12.18%
9
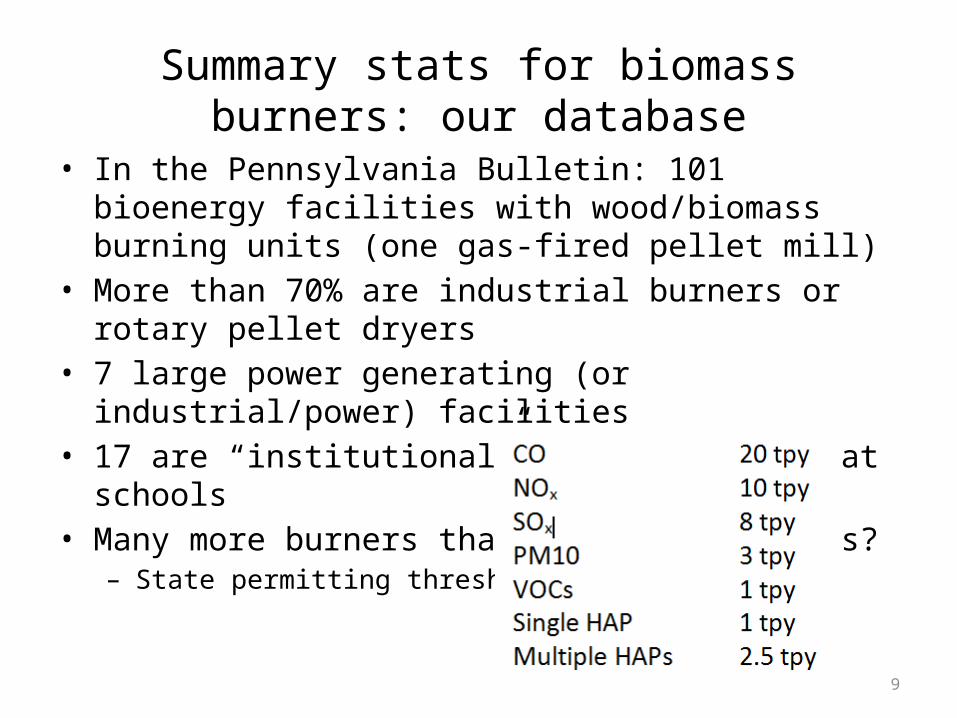
Summary stats for biomass burners: our database
• In the Pennsylvania Bulletin: 101 bioenergy facilities with wood/biomass burning units (one gas-fired pellet mill)
• More than 70% are industrial burners or rotary pellet dryers • 7 large power generating (or industrial/power) facilities • 17 are “institutional” boilers; 12 are at schools• Many more burners that don’t get permits?
– State permitting thresholds:
10
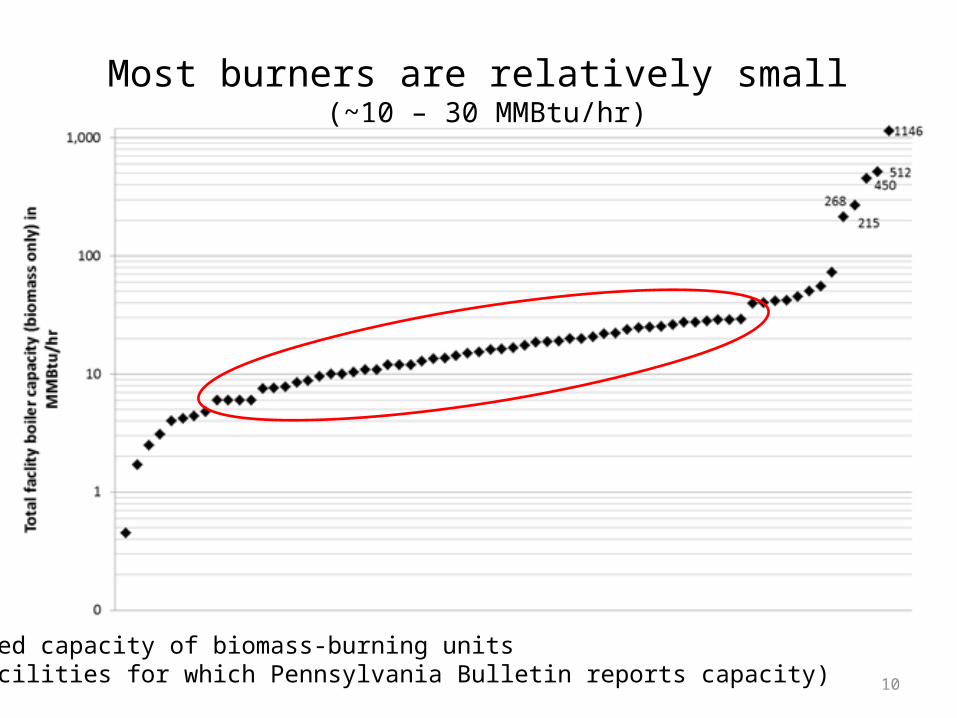
Most burners are relatively small (~10 – 30 MMBtu/hr)
Combined capacity of biomass-burning units (at facilities for which Pennsylvania Bulletin reports capacity)
11
Pollution controls
• No NOx controls at smaller burners• PM controls minimal – cyclones,
multicyclones; almost no ESP’s or baghouses

12
Particulate matter: potential to emit at varying emissions rates
EPA’s boiler rule threshold: 10+ MMBtu/hr – sets standards for new burners only. Pennsylvania boiler population: boilers <10 MMBtu/hr or permitted prior to boiler rule standard
Potential to emit, per MMBtu of boiler capacity: • 0.22 lb/MMBtu x 1 MMBtu/hr x 8,760 hr/yr = 1,927.2 lb/yr (typical
Pennsylvania permitting rate)
• 0.07 lb/MMBtu: 613 lb/yr (EPA std for new boilers 10 – 30 MMBtu/hr)
• 0.03 lb/MMBtu: 263 lb/yr (EPA std for new boilers 30+ MMBtu/hr)

13
Modeling particle pollution costs
• Impact of each additional ton of air pollution increased by background air pollution
• EPA modeling: cost of ten tons of PM2.5 is $200,000+. • Air Pollution Emission Experiments and Policy Analysis Model
(APEEP): weights impacts by background air pollution

14
APEEP estimates: marginal cost of one ton PM2.5
for all counties of the US
Pennsylvania counties (red): some of the highest costs in the country
15
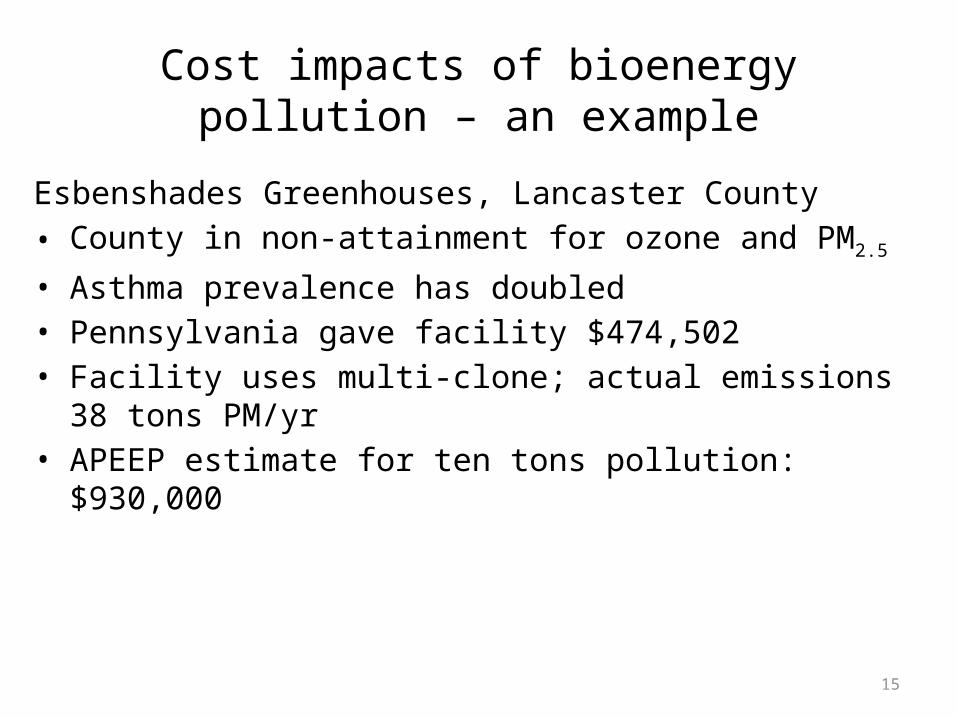
Cost impacts of bioenergy pollution – an example
Esbenshades Greenhouses, Lancaster County• County in non-attainment for ozone and PM2.5
• Asthma prevalence has doubled• Pennsylvania gave facility $474,502 • Facility uses multi-clone; actual emissions 38 tons PM/yr• APEEP estimate for ten tons pollution: $930,000

16
Grants and loans accountability – examples (see report for full table)
17
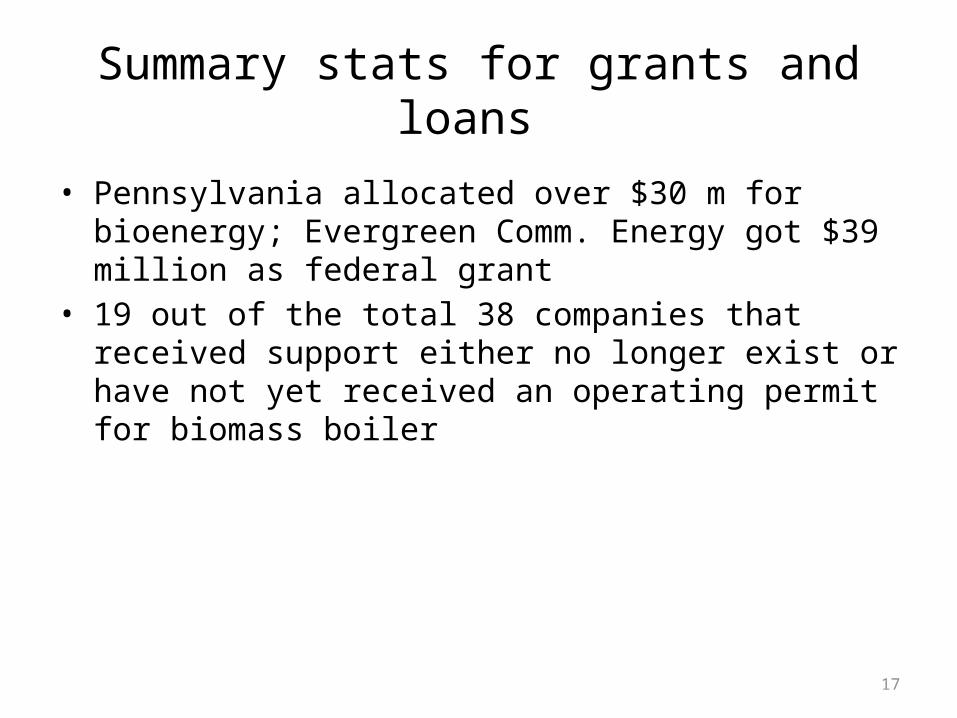
Summary stats for grants and loans
• Pennsylvania allocated over $30 m for bioenergy; Evergreen Comm. Energy got $39 million as federal grant
• 19 out of the total 38 companies that received support either no longer exist or have not yet received an operating permit for biomass boiler
18
Ongoing work, question for all
• How to increase public and groups participation in facility air permitting?
Related Documents