BioEnergy and BioEnergy and BioChemicals BioChemicals Development and the Development and the Potential Role of Potential Role of Forests Forests An Opportunity for An Opportunity for Minnesota Minnesota

BioEnergy and BioChemicals Development and the Potential Role of Forests An Opportunity for Minnesota.
Dec 18, 2015
Welcome message from author
This document is posted to help you gain knowledge. Please leave a comment to let me know what you think about it! Share it to your friends and learn new things together.
Transcript

BioEnergy and BioEnergy and BioChemicals Development BioChemicals Development
and the and the Potential Role of ForestsPotential Role of Forests
An Opportunity for An Opportunity for MinnesotaMinnesota
BioEnergy and BioChemicals BioEnergy and BioChemicals Development and the Development and the
Potential Role of ForestsPotential Role of Forests
• Current energy trends.
• Bio-energy as an alternative to fossil fuels.
• Minnesota’s bio-energy potential.• Bio-energy in an integrated bio-economy.• Public policy considerations in bio-energy/ bio-chemicals development.
Current Energy Current Energy TrendsTrends

U.S. energy U.S. energy consumption and consumption and
imports are rising.imports are rising.
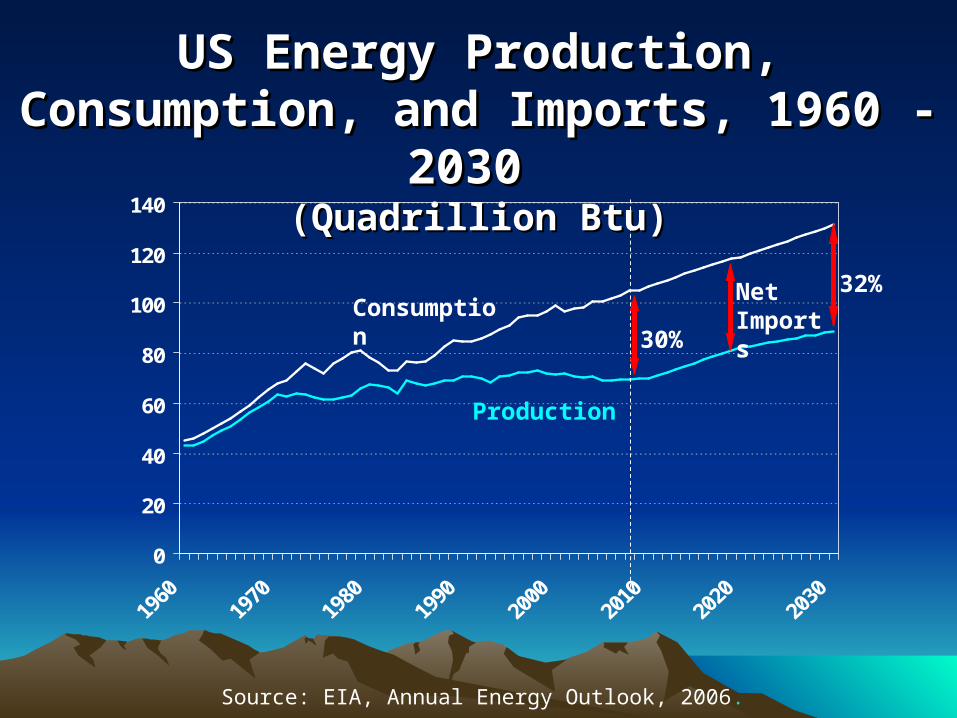
US Energy Production, Consumption, US Energy Production, Consumption, and Imports, 1960 - 2030 and Imports, 1960 - 2030
(Quadrillion Btu)(Quadrillion Btu)
0
20
40
60
80
100
120
140
Source: EIA, Annual Energy Outlook, 2006.
Consumption
Production
Net Imports
30%
32%
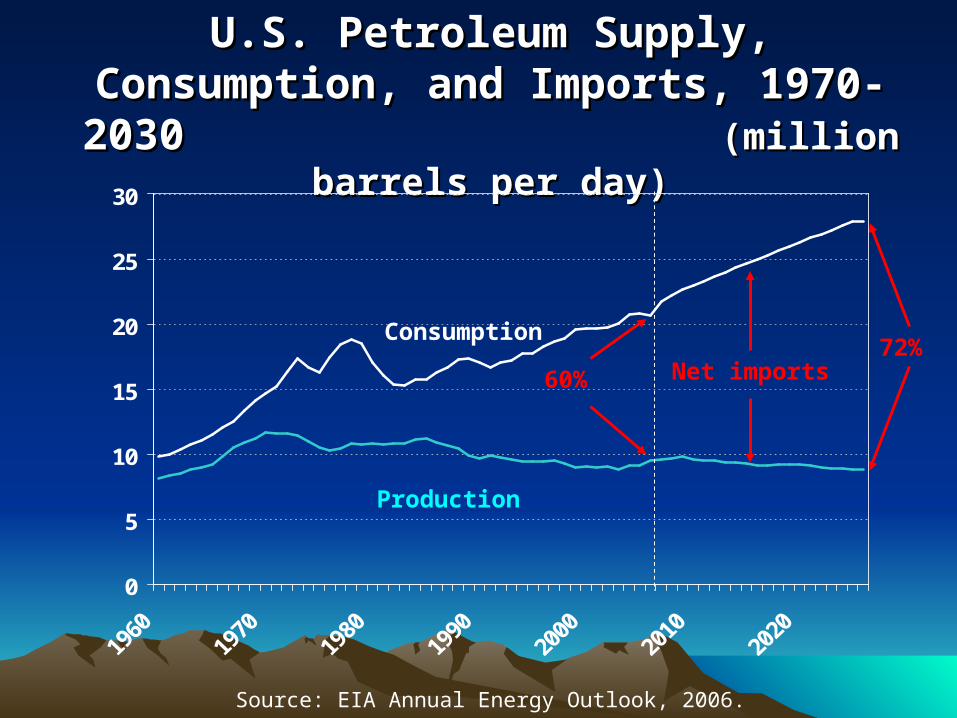
U.S. Petroleum Supply, Consumption, U.S. Petroleum Supply, Consumption, and Imports, 1970-2030and Imports, 1970-2030
(million barrels per day)(million barrels per day)
0
5
10
15
20
25
30
Source: EIA Annual Energy Outlook, 2006.
Production
Consumption
Net imports60%72%
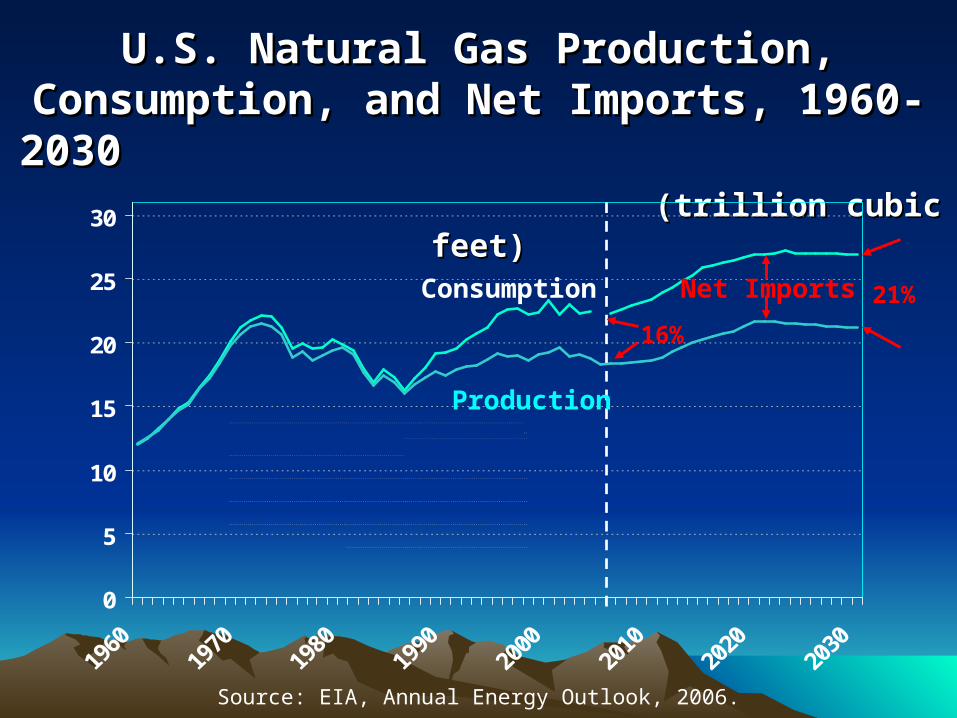
U.S. Natural Gas Production, Consumption, U.S. Natural Gas Production, Consumption, and Net Imports, 1960-2030and Net Imports, 1960-2030
(trillion cubic feet)(trillion cubic feet)
0
5
10
15
20
25
30
16%
21%Net ImportsConsumption
Production
Source: EIA, Annual Energy Outlook, 2006.

U.S. Trade Deficit, Energy Products, U.S. Trade Deficit, Energy Products, 1974 - 20061974 - 2006
050
100150200250300350400
Billion
Dollars
Year
Source: USDOE, Energy Information Administration, 2006.

Global energy Global energy consumption is consumption is
increasing rapidly.increasing rapidly.

World Energy Consumption, World Energy Consumption, 1970-20301970-2030
207243
284 309347 366 400
722665
613563
510446
0
100
200
300
400
500
600
700
800
1970 1975 1980 1985 1990 1995 2000 2005 2010 2015 2020 2025 2030
Qu
adr
illio
n B
tu
History Projections
Source: U.S. Department of Energy, EIA 2006.

China Petroleum Net Imports, China Petroleum Net Imports, 1993-20301993-2030
Barrels/Day
Year Average Daily Imports
1990 Net exporter
1995 240,000
2006 (est.) 3,600,000
2030 (est.) 10,900,000Source: Energy Information Administration, 2006 and Congressional Budget Office, 2006.

Peak production of Peak production of petroleum globally is petroleum globally is
within sight.within sight.

World Petroleum Consumption World Petroleum Consumption 1800 - 21001800 - 2100
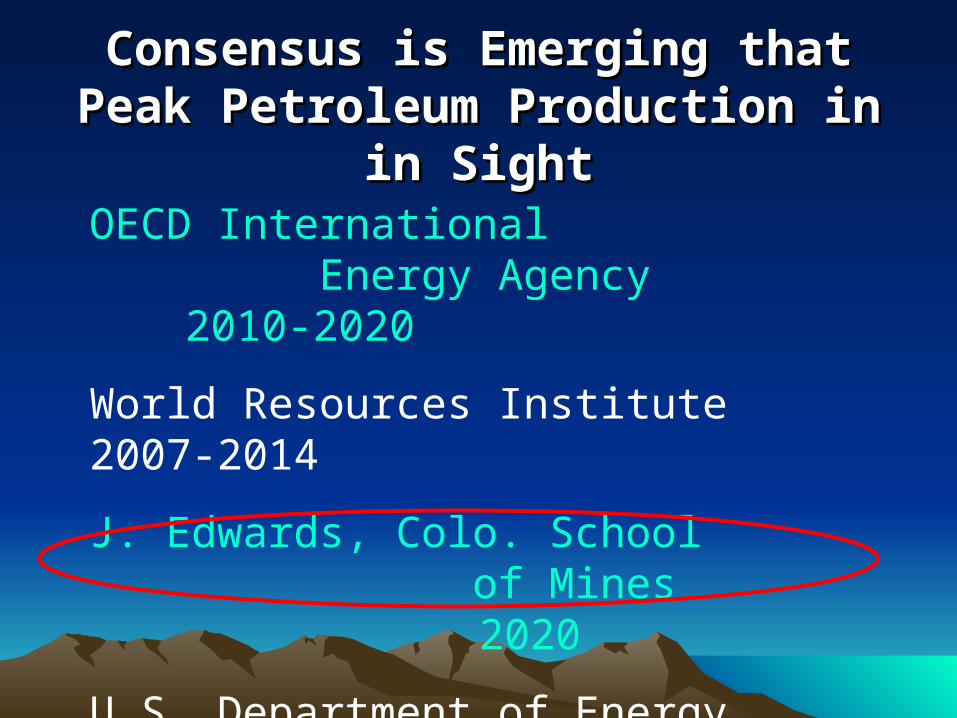
Consensus is Emerging that Peak Consensus is Emerging that Peak Petroleum Production in in SightPetroleum Production in in Sight
OECD International Energy Agency2010-2020
World Resources Institute 2007-2014
J. Edwards, Colo. School of Mines 2020
U.S. Department of Energy 2037
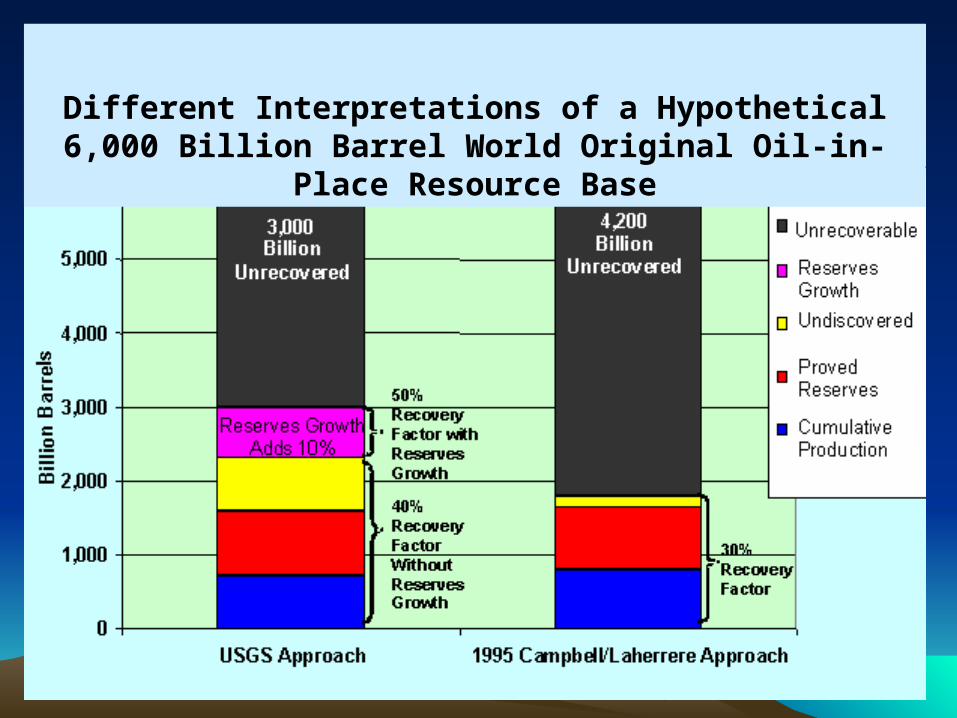
Different Interpretations of a Hypothetical 6,000 Billion Barrel World Original Oil-in-Place Resource Base


Bio-Energy as an Bio-Energy as an Alternative to Fossil Alternative to Fossil
FuelsFuels
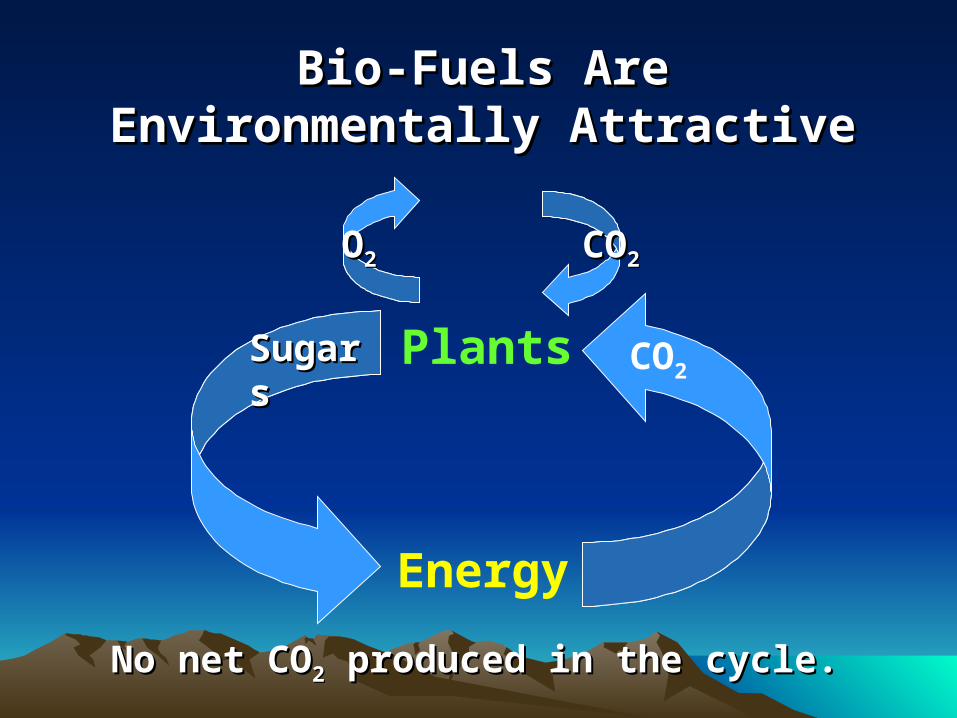
Plants
Energy
CO2
COCO22OO22
SugarSugarss
No net CONo net CO22 produced in the cycle. produced in the cycle.
Bio-Fuels Are Environmentally Bio-Fuels Are Environmentally AttractiveAttractive

There are also a number of There are also a number of potential sources of bio-potential sources of bio-
energy.energy.

Forms of Bio-Energy ResourcesForms of Bio-Energy Resources
• Wood• Pulping liquor• Municipal solid waste• Organic materials in
wastewater• Landfill gas• Biomass

Potential Sources of Biomass Potential Sources of Biomass EnergyEnergy
• Energy crops• Agricultural crop
residues• Forest biomass
– Logging residues– Thinnings
• Corn (ethanol)
Potential supplies of biomass Potential supplies of biomass are much greater than those are much greater than those
now used for energy now used for energy generation.generation.

A recent report from the U.S. A recent report from the U.S. Departments of Agriculture and Departments of Agriculture and
Energy suggests the annual Energy suggests the annual availability of over 1.3 billion dry availability of over 1.3 billion dry
tons of biomass in the United tons of biomass in the United States.States.
Source: Perlack et al. (2005).

Estimated Potential Biomass by Source – United States
Form of Biomass
Estimated Volume Available Annually
(million dry tons)
Energy crops 377
Crop residues 428
Woody biomass 368
Total 1,173
Source: Perlack et al. (2005).

There are a number of There are a number of options for utilizing options for utilizing
biomass as an energy biomass as an energy source.source.
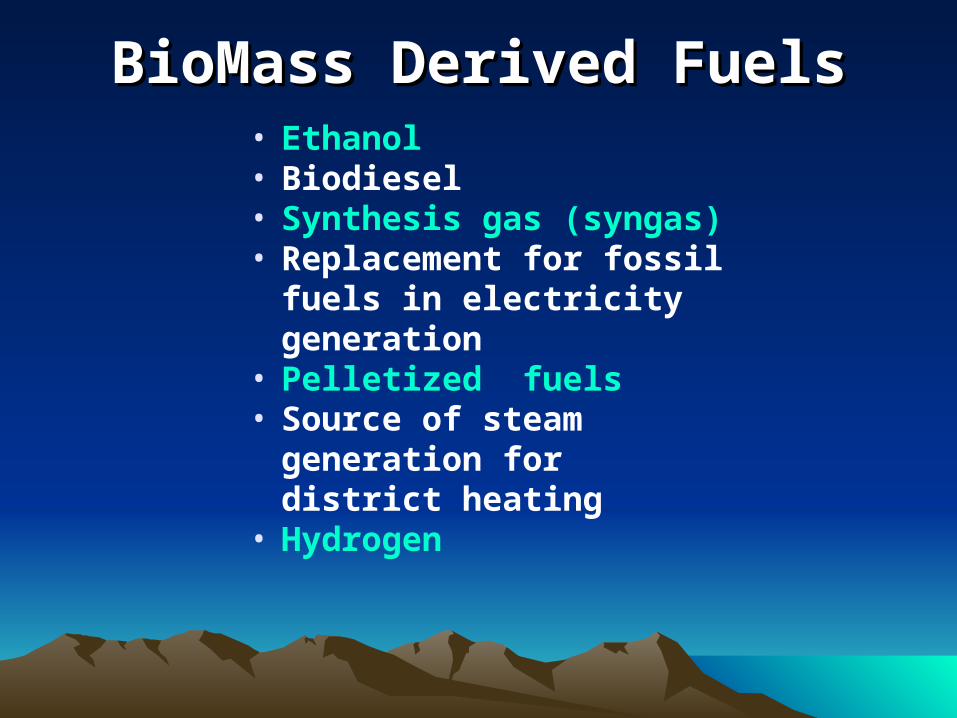
BioMass Derived FuelsBioMass Derived Fuels• Ethanol• Biodiesel• Synthesis gas (syngas)• Replacement for fossil
fuels in electricity generation
• Pelletized fuels• Source of steam
generation for district heating
• Hydrogen
Minnesota’s Minnesota’s Bio-Energy Bio-Energy
PotentialPotential
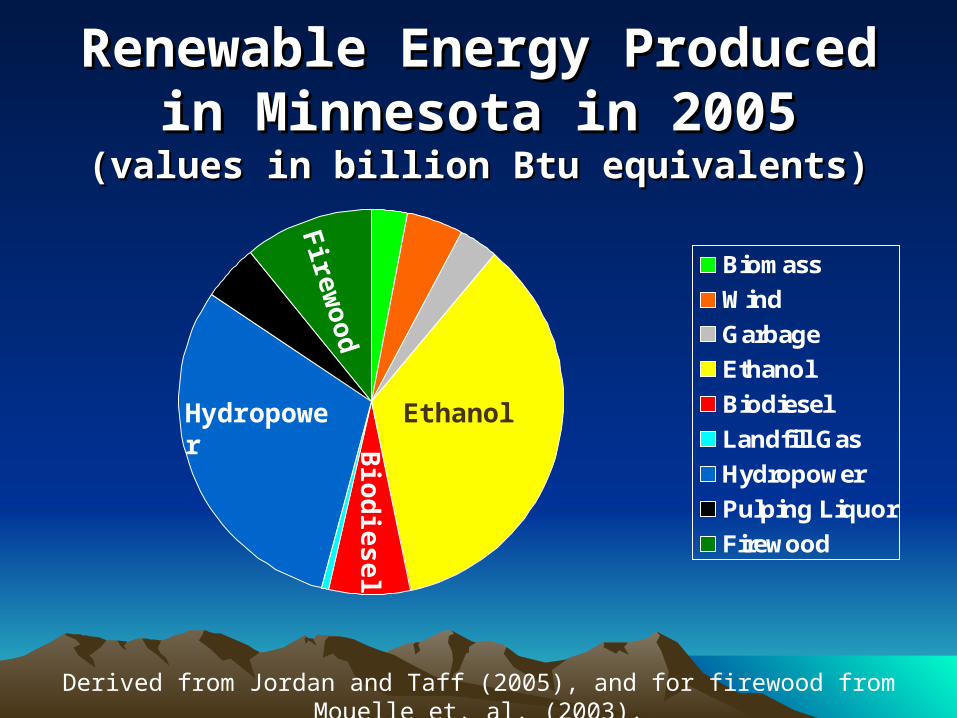
Renewable Energy Produced in Renewable Energy Produced in Minnesota in 2005Minnesota in 2005
(values in billion Btu equivalents)(values in billion Btu equivalents)
Biomass
Wind
Garbage
Ethanol
Biodiesel
Landfill Gas
Hydropower
Pulping Liquor
Firewood
EthanolHydropower
Firew
oo
dB
iod
ies
el
Derived from Jordan and Taff (2005), and for firewood from Mouelle et. al. (2003).

Profile of Renewable Electricity Profile of Renewable Electricity Production in Minnesota, 2005Production in Minnesota, 2005
Hydro
Wind
RDF
Biomass
Other
Non-renewable
Renewable
Source: Minnesota Department of Commerce (2005).
Non-renewables – 50,100,000 MWh
Renewables - 6,200,000 MWh
56,300,000 MWh
Minnesota has significant opportunity for further
development of bio-energy.

Biomass Resources in Minnesota by Three Studies
Source of Biomass
Biomass in Resources from ORNL database (tons/year
at < $50/ton)
Biomass
Resources from NREL GIS Group (tons/year)
Biomass Resource from 1997
ILSR Inventory
(tons/year)
Average of All Biomass Resource
Data (tons/year)
Forest residue
874,900 - - 874,900
Mill residue 1,121,000 1,017,688 571,960 903,549
Agricultural residue
11,935,896
40,709,527
22,040,438
24,895,287
Energy crops
5,783,002 - - 5,783,002
Urban wood waste
1,532,529
-
-
1,532,529
Total 21,247,327 41,727,215 22,612,398 33,989,267
Source: NREL (2005)
Ethanol Production Ethanol Production PotentialPotential

Ethanol Production in the United States, 1980-2006
0
1000
2000
3000
4000
5000
6000
1980 1983 1986 1989 1992 1995 1998 2001 2004
Source: Renewable Fuels Association (2006). (2006 est.)
The corn ethanol industry in the U.S. reached a
production capacity of over 6 billion gallons annually in
2006.

Potential annual production Potential annual production of ethanol in the U.S. is of ethanol in the U.S. is estimated at 50 billion estimated at 50 billion gallons.gallons. To put this in perspective, gasoline consumption in the U.S. in 2006 was 140 billion gallons.

Geographic Location of U.S. Ethanol Production Facilities, 2006
Source: Renewable Fuels Association, 2007.(http://www.ethanolrfa.org/objects/documents/plantmap_040307.pdf)

Ethanol Production and Ethanol Production and Consumption in Minnesota Consumption in Minnesota
1990-20061990-2006
0
100
200
300
400
500
600
1990 1992 1994 1996 1998 2000 2002 2004 2006
Production
Consumption
Source: Minnesota Department of Commerce (2007).

Geographic Location of U.S. Biodiesel Production Facilities,
2006
Source: National Biodiesel Board, 2007.(http://www.biodiesel.org/buyingbiodiesel/producers_marketers/
ProducersMap-Existing.pdf)

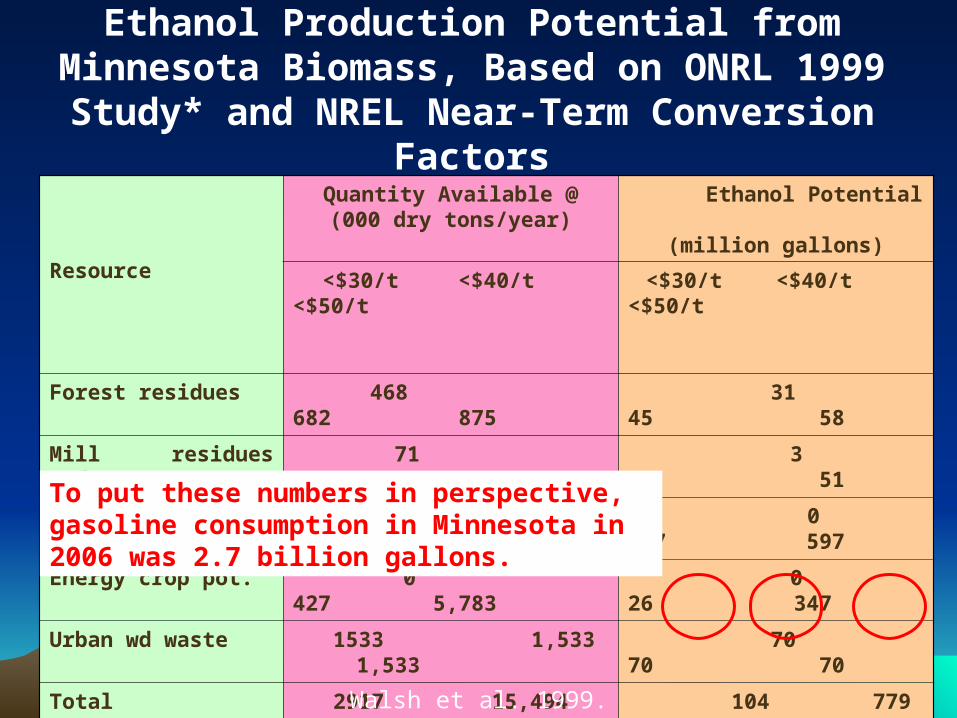
Ethanol Production Potential from Minnesota Biomass, Based on ONRL 1999 Study* and NREL Near-Term Conversion
Factors
Resource
Quantity Available @(000 dry tons/year)
Ethanol Potential (million gallons)
<$30/t <$40/t <$50/t
<$30/t <$40/t <$50/t
Forest residues 468 682 875
31 45 58
Mill residues (wd) 71 916 1,121
3 42 51
Ag. residues 0 11,936 11,936
0 597 597
Energy crop pot. 0 427 5,783
0 26 347
Urban wd waste 1533 1,533 1,533
70 70 70
Total 2917 15,494 21,348
104 779 1,122
Walsh et al. 1999.
In 2006, Minnesota produced 550 million gallons of ethanol from corn. Production nationwide was 6.0 billion gallons.
Ethanol Production Potential from Minnesota Biomass, Based on ONRL 1999 Study* and NREL Near-Term Conversion
Factors
Resource
Quantity Available @(000 dry tons/year)
Ethanol Potential (million gallons)
<$30/t <$40/t <$50/t
<$30/t <$40/t <$50/t
Forest residues 468 682 875
31 45 58
Mill residues (wd) 71 916 1,121
3 42 51
Ag. residues 0 11,936 11,936
0 597 597
Energy crop pot. 0 427 5,783
0 26 347
Urban wd waste 1533 1,533 1,533
70 70 70
Total 2917 15,494 21,348
104 779 1,122
Walsh et al. 1999.
To put these numbers in perspective, gasoline consumption in Minnesota in 2006 was 2.7 billion gallons.
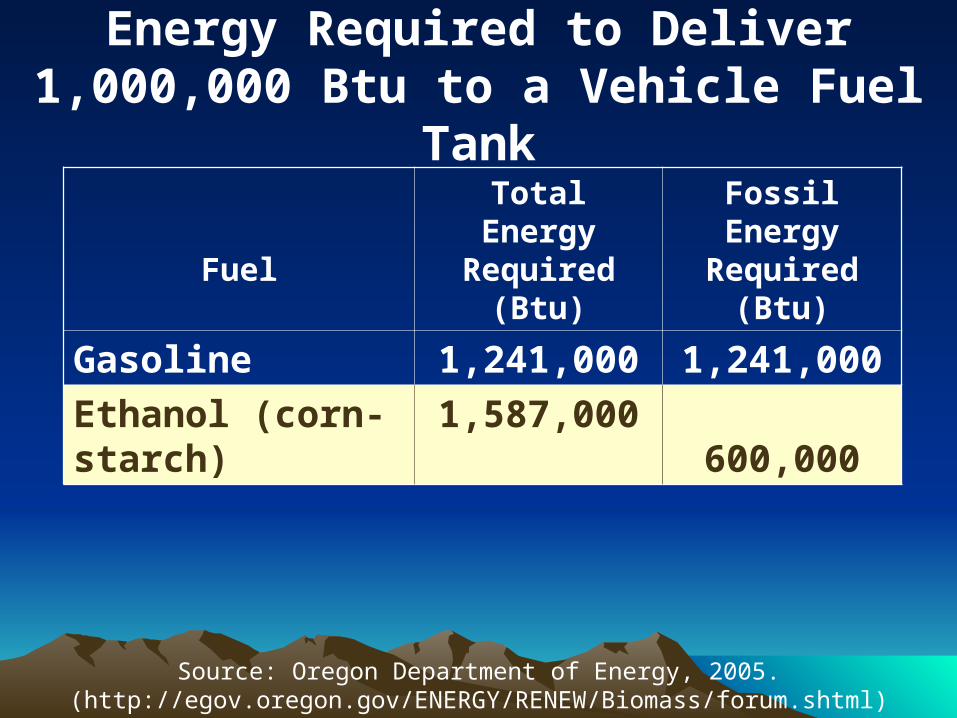
Energy Required to Deliver 1,000,000 Btu to a Vehicle Fuel Tank
Fuel
Total Energy Required (Btu)
Fossil Energy Required
(Btu)
Gasoline 1,241,000 1,241,000
Ethanol (corn-starch)
1,587,000 600,000
Source: Oregon Department of Energy, 2005. (http://egov.oregon.gov/ENERGY/RENEW/Biomass/forum.shtml)
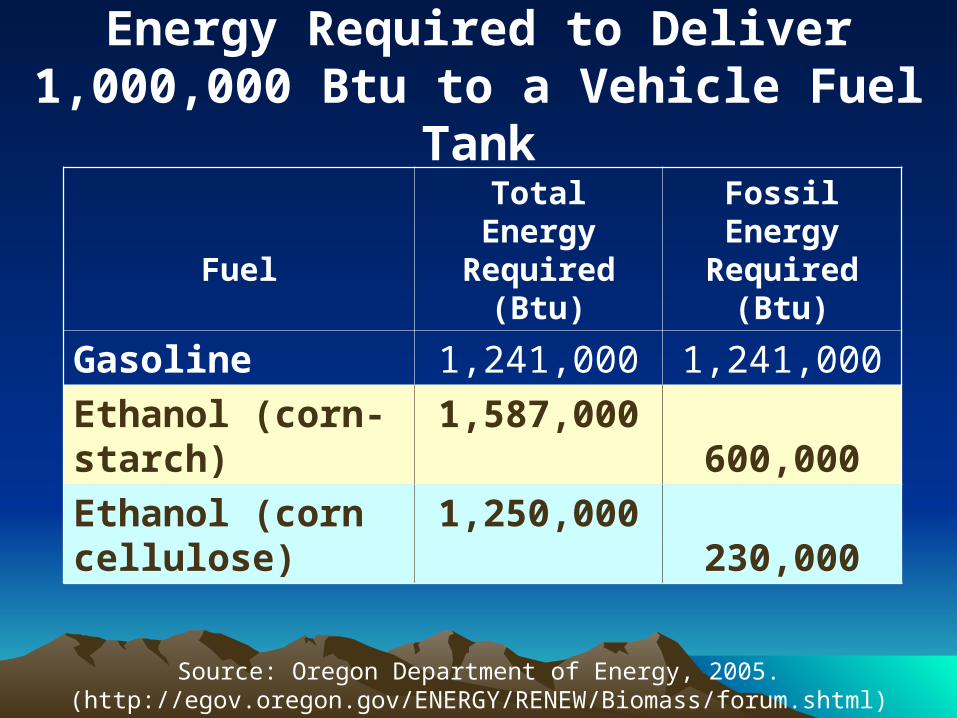
Energy Required to Deliver 1,000,000 Btu to a Vehicle Fuel Tank
Fuel
Total Energy Required (Btu)
Fossil Energy Required
(Btu)
Gasoline 1,241,000 1,241,000
Ethanol (corn-starch)
1,587,000 600,000
Ethanol (corn cellulose)
1,250,000 230,000
Ethanol (wood) 2,600,000 10,000
Source: Oregon Department of Energy, 2005. (http://egov.oregon.gov/ENERGY/RENEW/Biomass/forum.shtml)

Electric Generating Electric Generating PotentialPotential
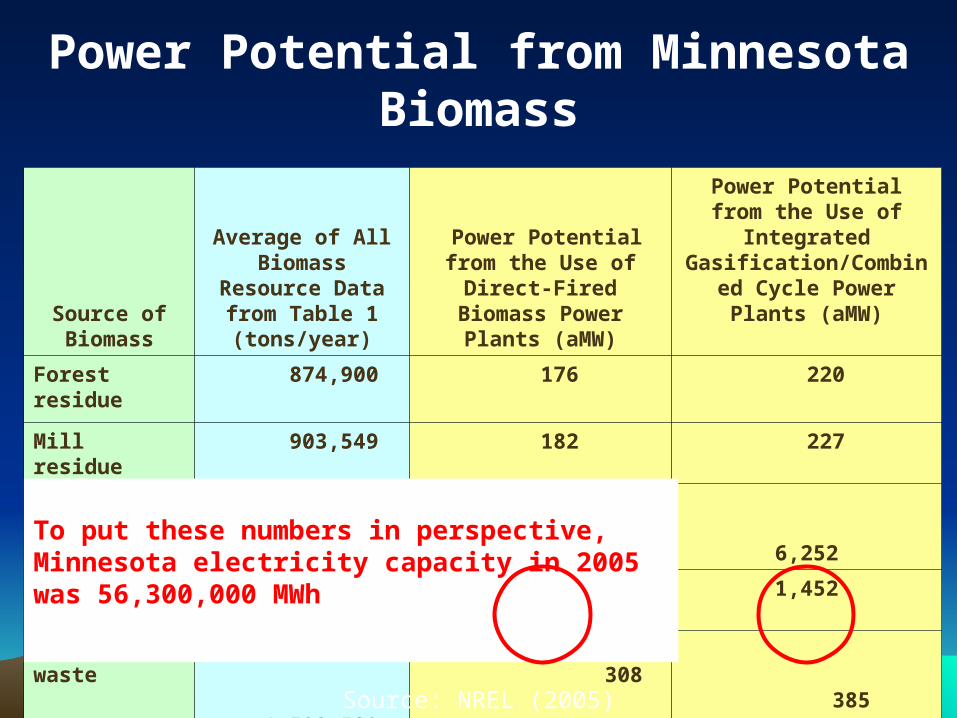
Power Potential from Minnesota Biomass
Source of Biomass
Average of All
Biomass Resource Data from Table 1 (tons/year)
Power Potential
from the Use of Direct-Fired
Biomass Power Plants (aMW)
Power Potential from the Use of
Integrated Gasification/Combin
ed Cycle Power Plants (aMW)
Forest residue
874,900 176 220
Mill residue 903,549 182 227
Agricultural residue
24,895,287
5,009
6,252
Energy crops
5,783,002 1,164 1,452
Urban wood waste
1,532,529
308
385
Total 33,989,267 6,389 8,536
Source: NREL (2005)
To put these numbers in perspective, Minnesota electricity capacity in 2005 was 56,300,000 MWh

Potential Power Obtainable from Minnesota’s Plant-Based Bio-Resources,
Based on ONRL 1999 Study and NREL Conversion Factors
Resource
Quantity Available @(000 dry tons/year)
Electric Potential (aMW)
<$30/t <$40/t <$50/t
<$30/t<$40/t <$50/t
Forest residues 468 682 875
94 137 176
Mill residues (wd) 71 916 1,121
12 149 182
Ag. residues 0 11,936 11,936
0 2,401 2,401
Energy crop pot. 0 427 5,783
0 86 1,164
Urban wd waste 1533 1,533 1,533
308 308 308
Total 2917 15,494 21,348
414 3,081 4,231
Source: National Renewable Energy Laboratory, 2004.

Bio-Energy in an Bio-Energy in an Integrated Integrated Bio-Economy Bio-Economy
A singular focus on bio-A singular focus on bio-energy might be a energy might be a
mistake.mistake.
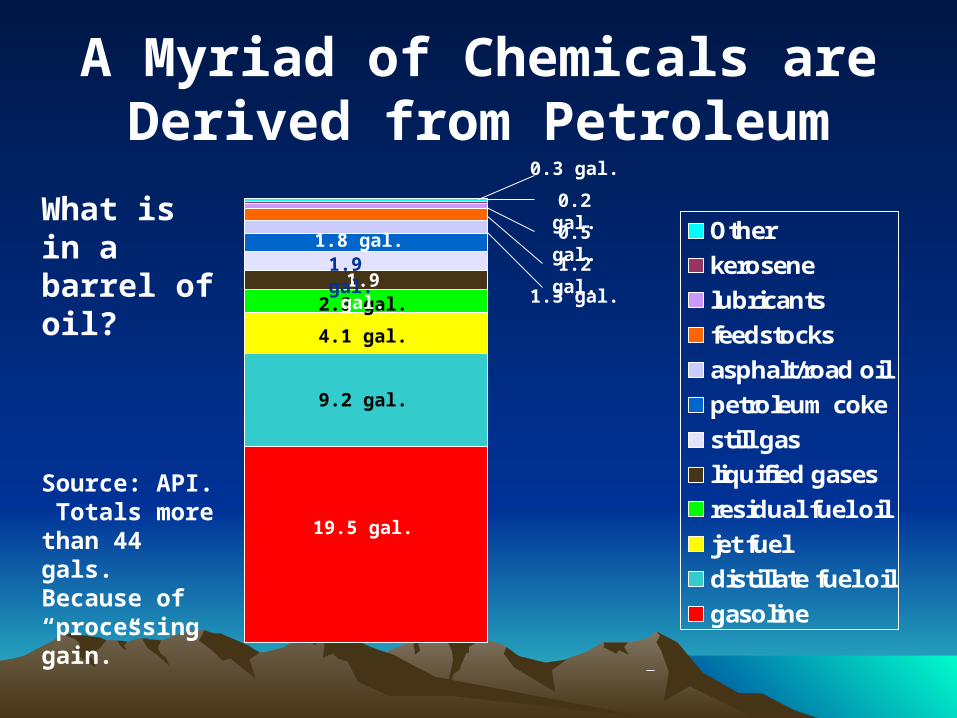
A Myriad of Chemicals are Derived from Petroleum
Other
kerosene
lubricants
feedstocks
asphalt/road oil
petroleum coke
still gas
liquified gases
residual fuel oil
jet fuel
distillate fuel oil
gasoline
Source: API. Totals more than 44 gals. Because of “processing gain.”
What is in a barrel of oil?
19.5 gal.
9.2 gal.
4.1 gal.
2.3 gal.1.9 gal.1.9 gal.1.8 gal.
0.3 gal.
0.2 gal.
0.5 gal.
1.2 gal.
1.3 gal.

Chemical and Material Demand 10% from Renewable Resources by 2020 ~$400 billion/year in products (2 times current Forest Products)
US DOE Technology Roadmap for Plant/Crop based Renewable Resources 2020, Renewable Vision, February 1999 www.oit.doe.gov/agriculture/
Bio-economy – the Future is Now

A Vision of the BioEconomy in the Year 2020
Biorefinery: Cluster of biobased industries producing chemicals, fuels, power, products, and materials.
Source: NREL

O2
CO2
BL Recovery Power Boiler
Paper Manufacture
Black liquor, residuals
90 x 106 mt CO2
Purchased Energy (30% of energy needs - $2.0 billion)
Pulpmill Energy, Steam,
Chemicals
Energy, Steam,
Chemicals
Current Current Chemical Paper Chemical Paper
MillMill

O2
CO2
Black liquor, residuals
66 x 104 mt CO2 Power export ($3.8 billion)
Biorefinery
Pulp ($5.5 billion)
The Forest The Forest BiorefineryBiorefinery
- Extract Hemicelluloses
- New products, chemicals, polymers ($3.3 billion)
-Black liquor gasifier
- Wood residual gasifier
- Combined cycle system
- Process to mfg. liquid fuels and chemicals
or
Liquid Fuels/ Chemicals ($5.5 billion)
Syngas
Paper mfg.

An Integrated Bio-Economy Has Many Facets
Raw Material Options
- Trees - Grasses - Agricultural Crops - Agricultural Residues - Animal Wastes - Municipal Solid Waste
Technologies- Acid/enzymatic hydrolysis- Fermentation- Bioconversion- Chemical Conversion- Composite products technologies- Gasification- Combustion- Co-firing S
ourc
e:
Adapte
d F
rom
Iow
a In
dust
ries
of
the F
utu
re,
20
04.
End-UsesProducts– Plastics– Functional Monomers– Solvents– Chemical Intermediates– Phenolics– Adhesives– Hydraulic Fluids– Fatty acids– Carbon black– Paints– Dyes, Pigments, and Ink– Detergents– Paper– Horticultural products – Fiber boards– Solvents– Plastic filler– Abrasives– Building productsFuelPower
These products will be made from a variety of biochemicals
and biofeedstocks arising from biorefineries.

SummarySummary

Questions?Questions?
For more information:For more information:www.dovetailinc.orgwww.dovetailinc.org
Related Documents


![Forests, bioenergy and climate change mitigationtask38.ieabioenergy.com/wp-content/uploads/2017/01/... · century through large-scale changes in energy systems … [and that] bioenergy](https://static.cupdf.com/doc/110x72/5f0c94947e708231d4361cc8/forests-bioenergy-and-climate-change-century-through-large-scale-changes-in-energy.jpg)