welcome

Welcome message from author
This document is posted to help you gain knowledge. Please leave a comment to let me know what you think about it! Share it to your friends and learn new things together.
Transcript
welcome
Credit Seminar on
BiodrainageCourse Incharge
Dr. G. Ravi Babu
Associate Professor & Head
Dept. of Soil and Water Engineering
By
Ch.AppaRao
BEM-12-001
INTRODUCTION
Biodrainage may be defined as “pumping of excess soil water
using bio-energy through deep-rooted vegetation with high rate
of transpiration.”
The biodrainage system consists of fast growing tree species,
which absorb water from the capillary fringe located above the
ground water table.
The absorbed water is translocated to different parts of plants
and finally more than 98% of the absorbed water is transpired
into the atmosphere mainly through the stomata.
This combined process of absorption, translocation and
transpiration of excess ground water into the atmosphere by
the deep rooted vegetation conceptualizes bio-drainage.

Merits of biodrainage over conventional drainage systems
Relatively less costly to raise biodrainage plantations
No maintenance cost from 3rd year onward
No operational cost, as the plants use their bio-energy indraining out the excess ground water into atmosphere.
Increase in worth with age instead of depreciation
No need of any drainage outfall and disposal of drainageeffluent
No environmental problem, as the plants drain out filteredfresh water into the atmosphere
In- situ solution of the problem of water logging and salinity
Preventive as well as curative system for waterlogging andsalinity

Combined drainage- cum – disposal system
Moderates the temperature of the surrounding by transpiration
and a cushion for moderating frost, cold and heat wave impacts
Helps in carbon sequestration and carbon credits
Mitigates the problem of climate change and contributes to
increased forest cover
Purifies the atmosphere by absorbing CO2 and releasing O2
Acts as wind break and shelter belts in agroforestry system
Provides higher income to the farmer due to the production of
food, fodder, fuel wood and small timber
Where to apply:
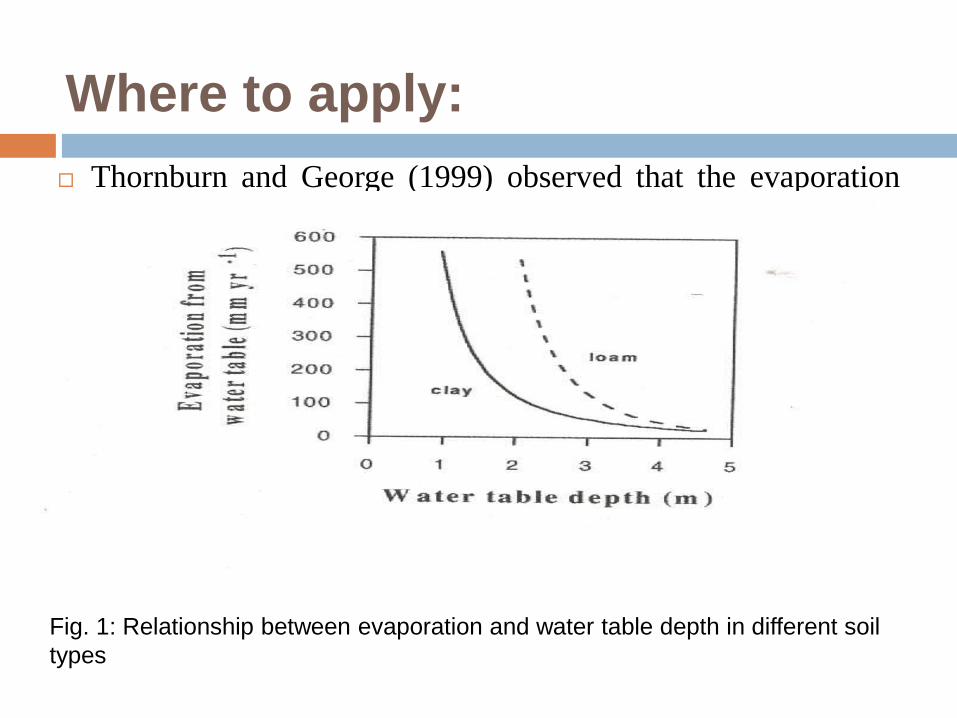
Thornburn and George (1999) observed that the evaporation
from the soil takes place up to a depth of 4 m (Fig. 1).
Fig. 1: Relationship between evaporation and water table depth in different soil
types

CASE STUDIES
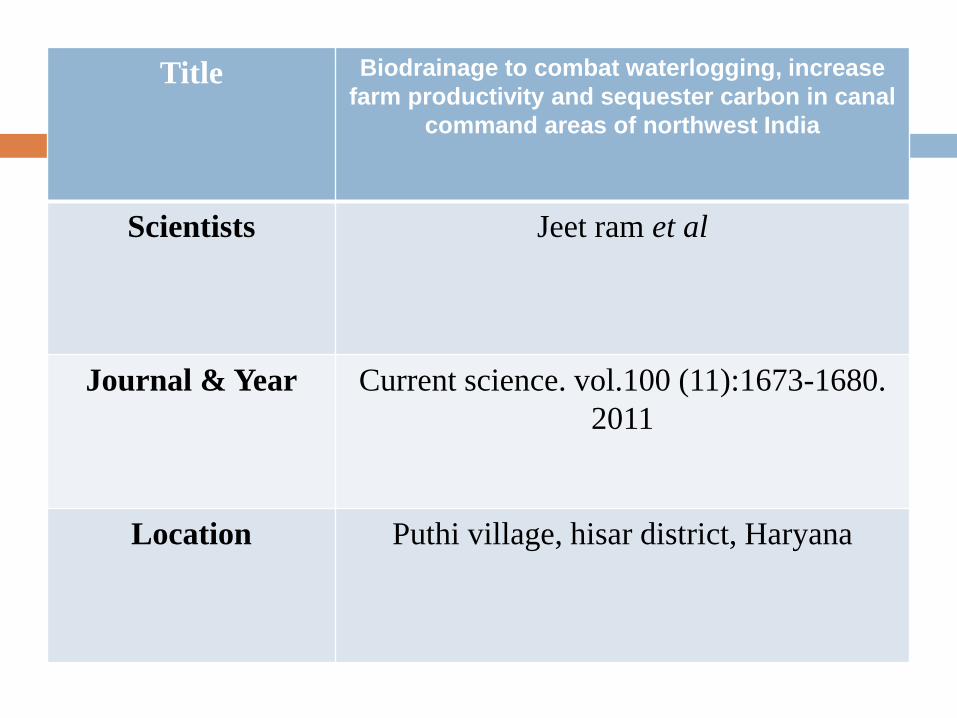
Title Biodrainage to combat waterlogging, increase
farm productivity and sequester carbon in canal
command areas of northwest India
Scientists Jeet ram et al
Journal & Year Current science. vol.100 (11):1673-1680.
2011
Location Puthi village, hisar district, Haryana

Fig.2 land locked area of puthi research plot.
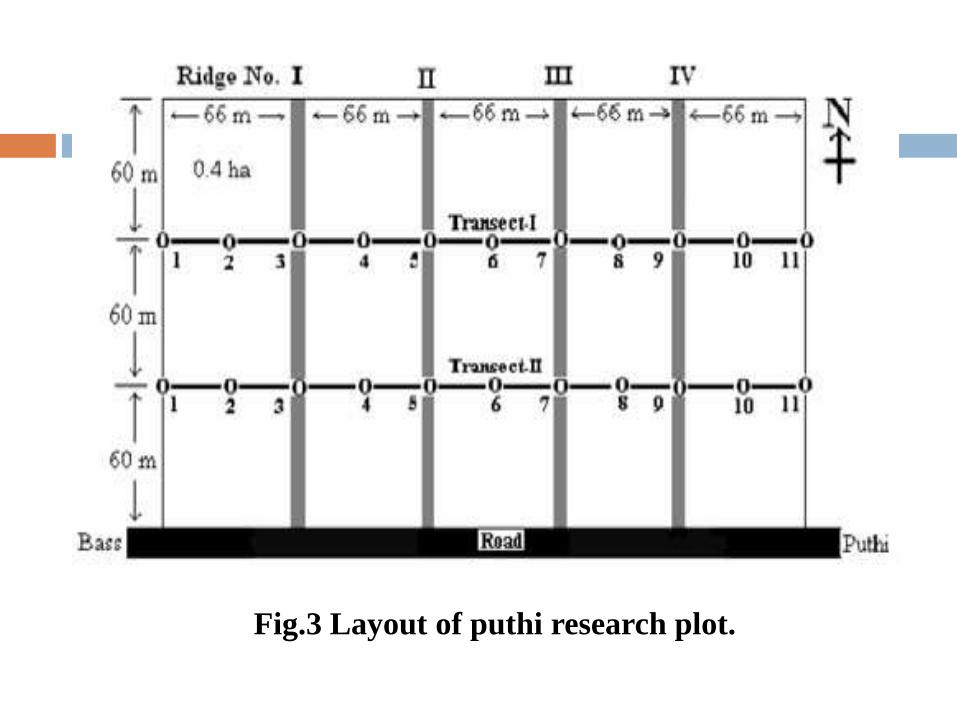
Fig.3 Layout of puthi research plot.

Table 1. Fresh shoot biomass of 22, 5-year and 4-month-old trees
of clonal eucalyptus tereticornis.
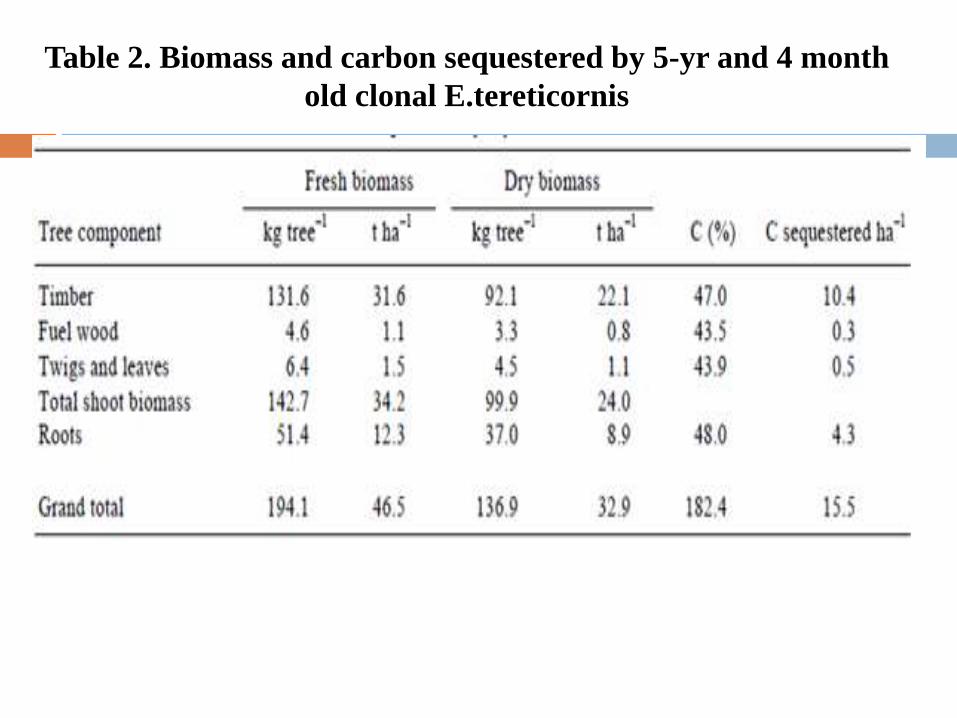
Table 2. Biomass and carbon sequestered by 5-yr and 4 month
old clonal E.tereticornis
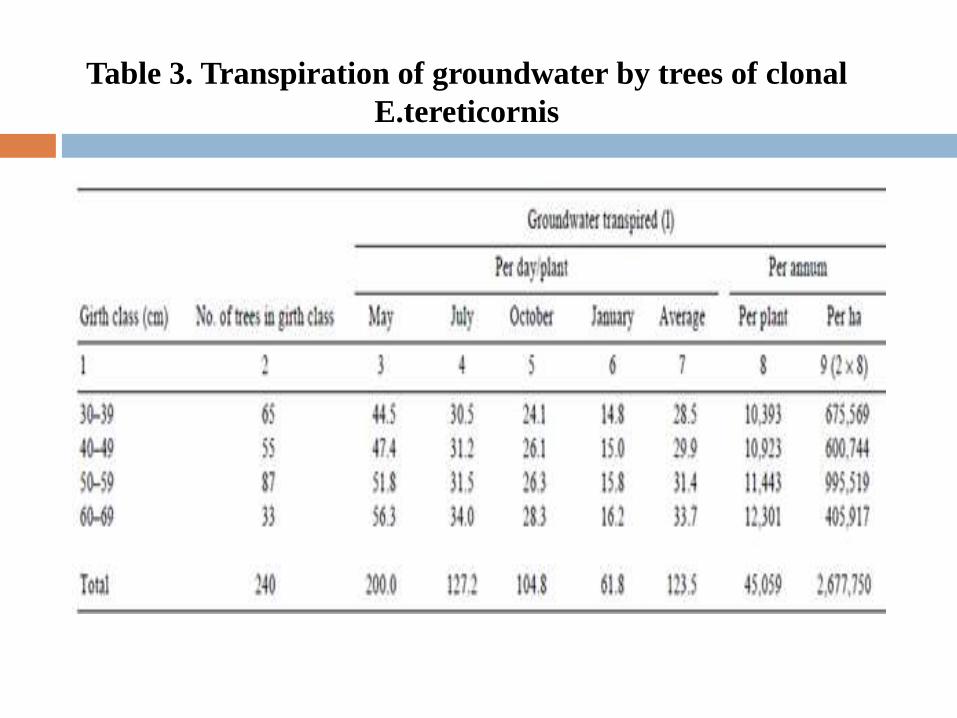
Table 3. Transpiration of groundwater by trees of clonal
E.tereticornis

Fig.4 wheat yield obtained with and without eucalyptus
plantation.

Fig.5 effect of plantation on soil electrical conductivity of the
saturation extract (ECe)(ds /m) and ph of the soil saturation
paste (pHs).
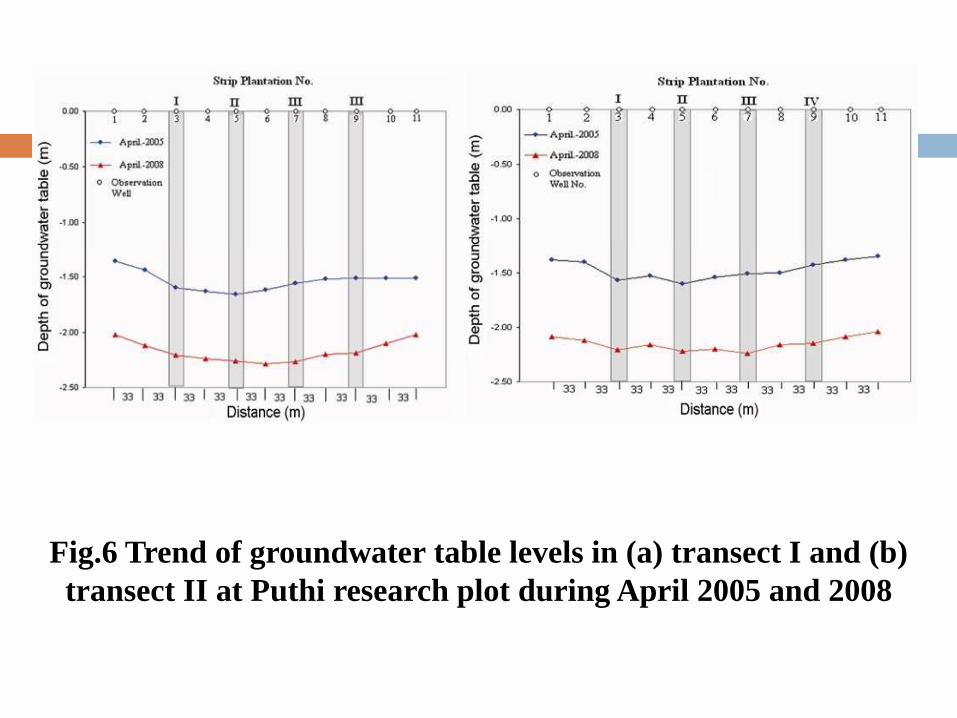
Fig.6 Trend of groundwater table levels in (a) transect I and (b)
transect II at Puthi research plot during April 2005 and 2008
Conclusions
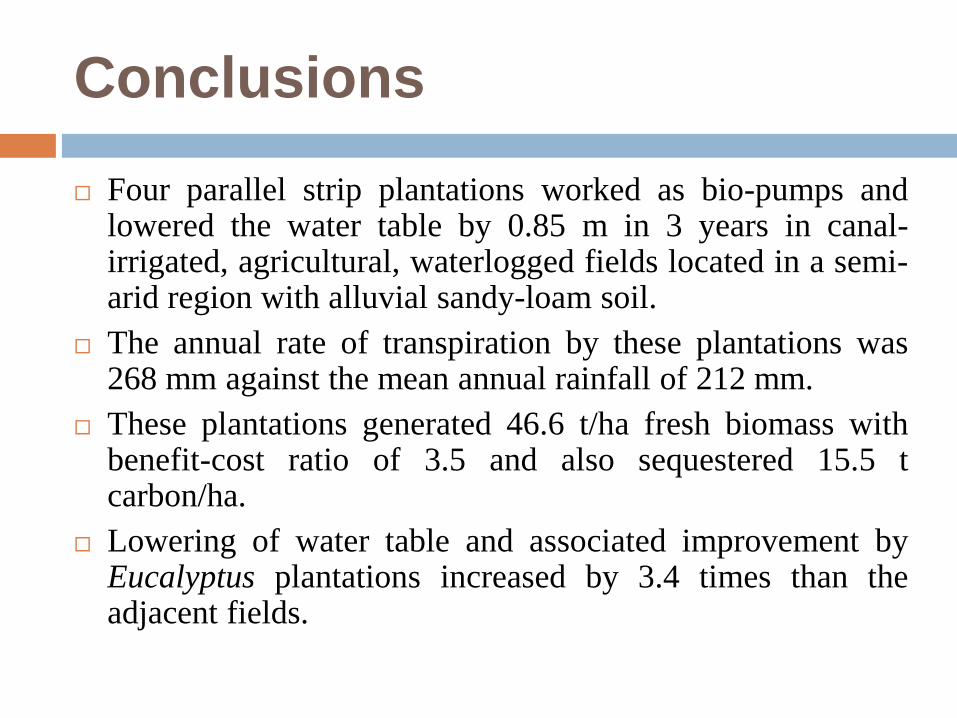
Four parallel strip plantations worked as bio-pumps andlowered the water table by 0.85 m in 3 years in canal-irrigated, agricultural, waterlogged fields located in a semi-arid region with alluvial sandy-loam soil.
The annual rate of transpiration by these plantations was268 mm against the mean annual rainfall of 212 mm.
These plantations generated 46.6 t/ha fresh biomass withbenefit-cost ratio of 3.5 and also sequestered 15.5 tcarbon/ha.
Lowering of water table and associated improvement byEucalyptus plantations increased by 3.4 times than theadjacent fields.

Title Biodrainage Potential of Eucalyptus
Tereticornis for Reclamation of Shallow
water table areas in North West India
Scientists J. ram et al
Journal & Year Agroforest Syst. vol.69:147-165.
2007
Location Dhob-bhali research plot , Rohtak district,
Haryana

Fig. 7 Location of (a) Haryana state in north-west India
and (b) Dhob-Bhali research plot in Rohtak district of
Haryana state

Fig. 8 Layout of Dhob-Bhali research plot. Legend. (•)
Observation well,( ) road,( IIIIII ) railway line and ( )
plantation
) road,
( IIIIII ) railway line and () plantation

Fig. 9 fluctuations of ground water table during 1974-2004 in
rohtak district.legend.(-o-) june and (-^-) October.
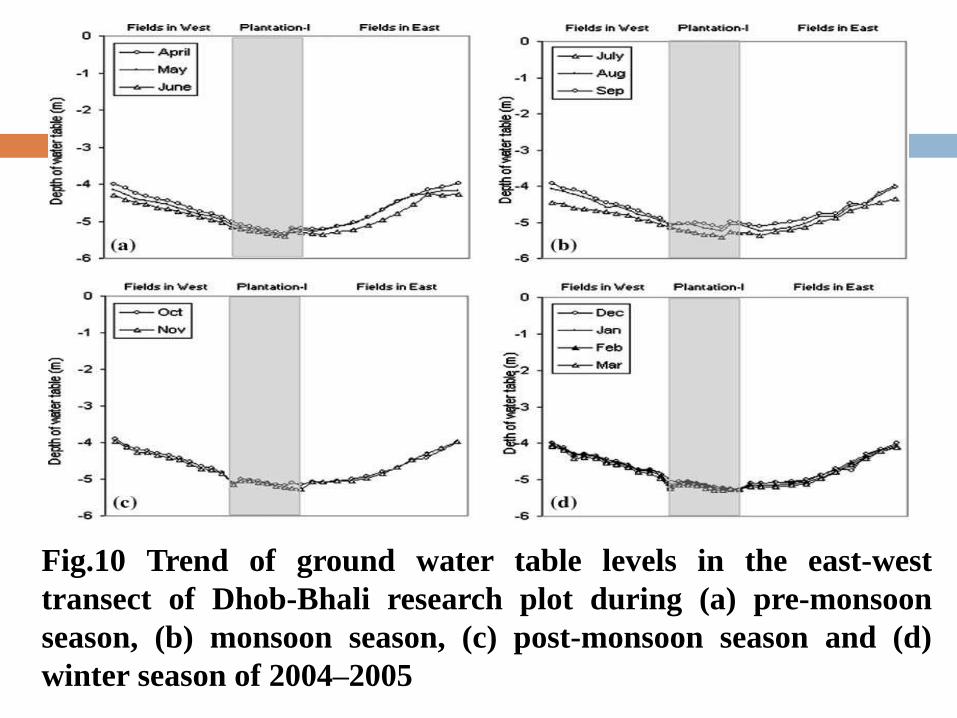
Fig.10 Trend of ground water table levels in the east-west
transect of Dhob-Bhali research plot during (a) pre-monsoon
season, (b) monsoon season, (c) post-monsoon season and (d)
winter season of 2004–2005

Fig.11 Mean trend of ground water table levels in the east-west
transect of Dhob-Bhali research plot during 2004–2005 and
2005–2006.

Fig.12 Trend of ground water table levels in the north-south
transect of Dhob-Bhali research plot during (a) pre-monsoon
season, (b) monsoon season, (c) post-monsoon season and (d)
winter season of 2004–2005
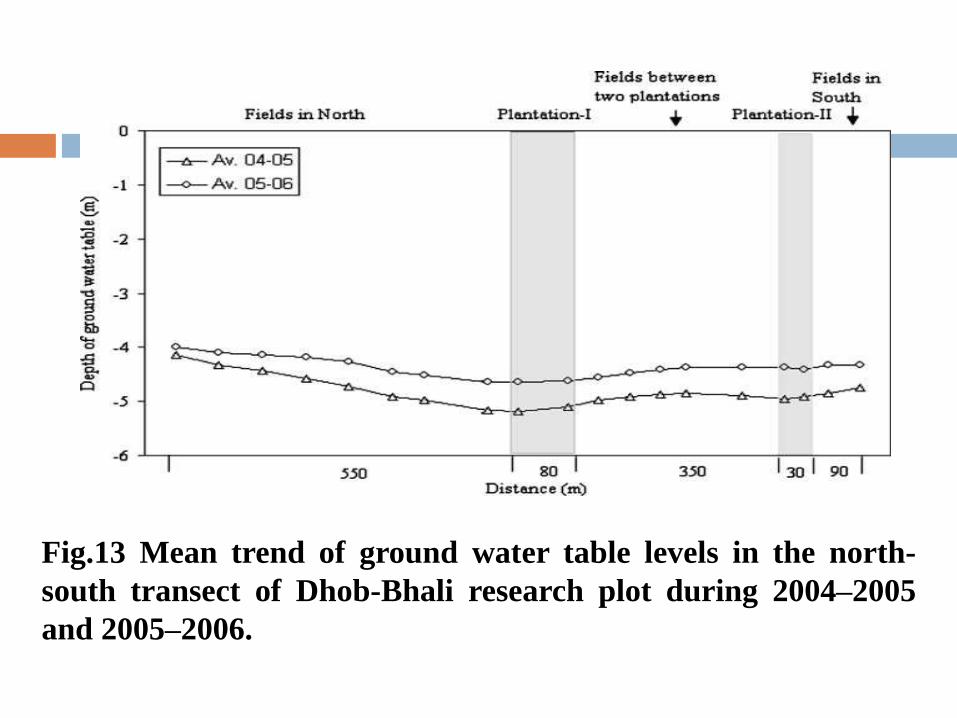
Fig.13 Mean trend of ground water table levels in the north-
south transect of Dhob-Bhali research plot during 2004–2005
and 2005–2006.

Fig.14 Trend of (a)ground water table salinity and ground water
table levels (b) soil salinity and ground water table levels and (c)
soil salinity of the zone of capillary fringe and ground water
table levels during may 2004 in east west transect. (.) ground
water table and (^) salinity.

Fig. 15 Fluctuations in g.w.t and g.w.t salinity during May
of 2004, 2005 and 2006. Legend. ( ) May 2004, ( ) May
2005 and ( ) May 2006

Conclusions
The average g.w.t. in the plantations was 4.95 m and the
average g.w.t. in the control located in the adjacent fields
was 4.04 m and hence, the drawdown of g.w.t. was 0.91 m.
Throughout the study of 2 years, the g.w.t. underneath the
plantations remained lower than the g.w.t. in the adjacent fields
without plantation.
The g.w.t. in the plantations was lowered up to a maximum
depth of 5.63 m below the ground level.
The spatial extent of lowering of g.w.t. in the adjacent fields was
up to a distance of more than 730 m from the edge of a plantation.
The sinker roots reached the zone of capillary fringe up to a
depth of 4.40 m clearly indicating that the Eucalyptus trees
were absorbing capillary water of the g.w.t.
Title Biodrainage for preventing waterlogging and
concomitant wood yields in arid agro-
ecosystems in north-western india
Scientists O P toky et al
Journal & Year Journal of scientific and industrial
research. vol.70 :639-644.
2011
Location Haryana Agricultural University, hisar
district, Haryana

Experimental site comprised of 30 acres (12 ha) ofwaterlogged land at CCS HAU farm square number1799-1800 along with Balsamand canal whichflows nearly in the east west transact.
With a long term view of reclaiming this abandonedwaterlogged site, biodrainage plantations have beenraised as strip plantations on field bunds which areabout 60 m apart from each other.
Field bunds were 2.9 m broad at base, 2.6 m broadat top, 0.45 m in height and extend to a length of150 m from north to south. Two rows of trees were
planted on each bund with a row to row distance of1.3 m. Plant to plant distance was 1.5 m inEucalyptus and 3 m in other species.
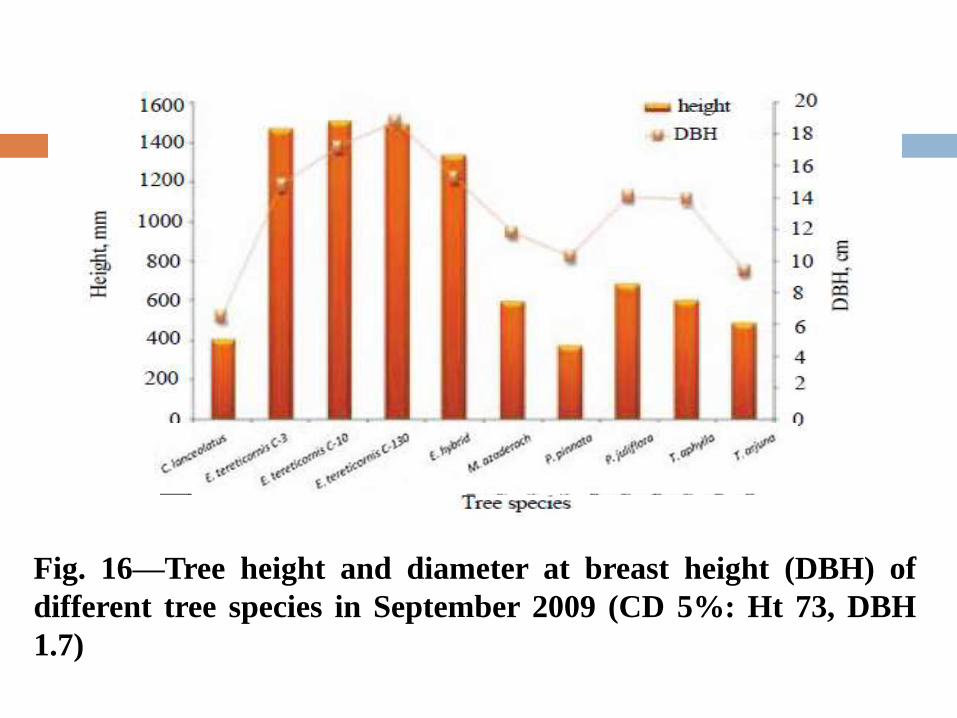
Fig. 16—Tree height and diameter at breast height (DBH) of
different tree species in September 2009 (CD 5%: Ht 73, DBH
1.7)

Fig. 17—Strip plantation of some representative tree species on
ridges at the field in university campus: a) Eucalyptus
tereticornis C-10; b) Eucalyptus tereticornis C-3; c) Tamarix
aphylla; and d) Prosopis juliflora (marked leaf area is difference
between C-10 and C-3 of E. tereticornis)

Fig.18 —Leaf area index of different tree species in September
2009 (CD at 5%: 0.17)
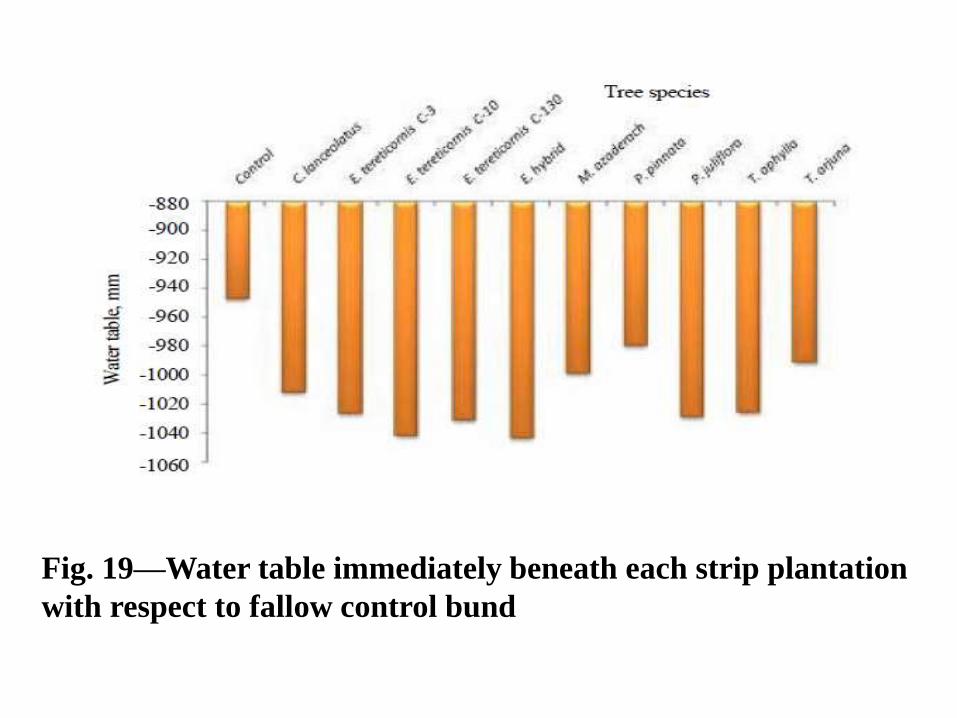
Fig. 19—Water table immediately beneath each strip plantation
with respect to fallow control bund

Table 5. water table fluctuations measured as mean of monthly
values from a well located 20m east of each bund during
experiments
Conclusions:
Tree species vary in their “biodrainage potential” as evidenced
by the extent of lowering of water table immediately beneath
the plantations.
Eucalyptus species has a higher biodrainage potential as
compared to relatively slow biodariners like T. Aphylla and
P.pinnata.

THANKYOU