BIOCHEMISTRY LAB CHE555 Lecture 6: 3 March 2011 Enzyme Kinetics A chromogenic reaction catalyzed by β-galactosidase is used to visualize the effects of substrate concentration and inhibitors of different types on enzyme-catalyzed reaction velocity. Experiment #7, pages 95-104, 123-130. days 1 and 2 Background (Enzyme Kinetics) ! Enzymes influence the rate at which equilibrium is obtained, but not the equilibrium position of the reaction. ! Kinetics, in this context, is the study of reaction product formation as a function of time. The rate of product formation is a measure of the reaction velocity. v = d ([ P ]) dt = − d ([ S ]) dt S P → v = reaction velocity

Welcome message from author
This document is posted to help you gain knowledge. Please leave a comment to let me know what you think about it! Share it to your friends and learn new things together.
Transcript

BIOCHEMISTRY LAB
CHE555Lecture 6: 3 March 2011
Enzyme Kinetics A chromogenic reaction catalyzed by β-galactosidase is used to visualize the effects of substrate concentration and inhibitors of different types on enzyme-catalyzed reaction velocity.
Experiment #7, pages 95-104, 123-130.days 1 and 2
Background (Enzyme Kinetics)
! Enzymes influence the rate at which equilibrium is obtained, but not the equilibrium position of the reaction.
! Kinetics, in this context, is the study of reaction product formation as a function of time. The rate of product formation is a measure of the reaction velocity.
v = d([P])dt
= −d([S])dt
S P→
v = reaction velocity
Biology needs reactions that are not ‘naturally’ fast, because
it needs stable compounds.
3Wolfenden and Snider (2001) Acc. Chem. Res. 34:938-945.
Enzymes accelerate reactions by up to x 1021
4 Wolfenden & Snider (2001) Acc. Chem. Res. 34(12): 938-945
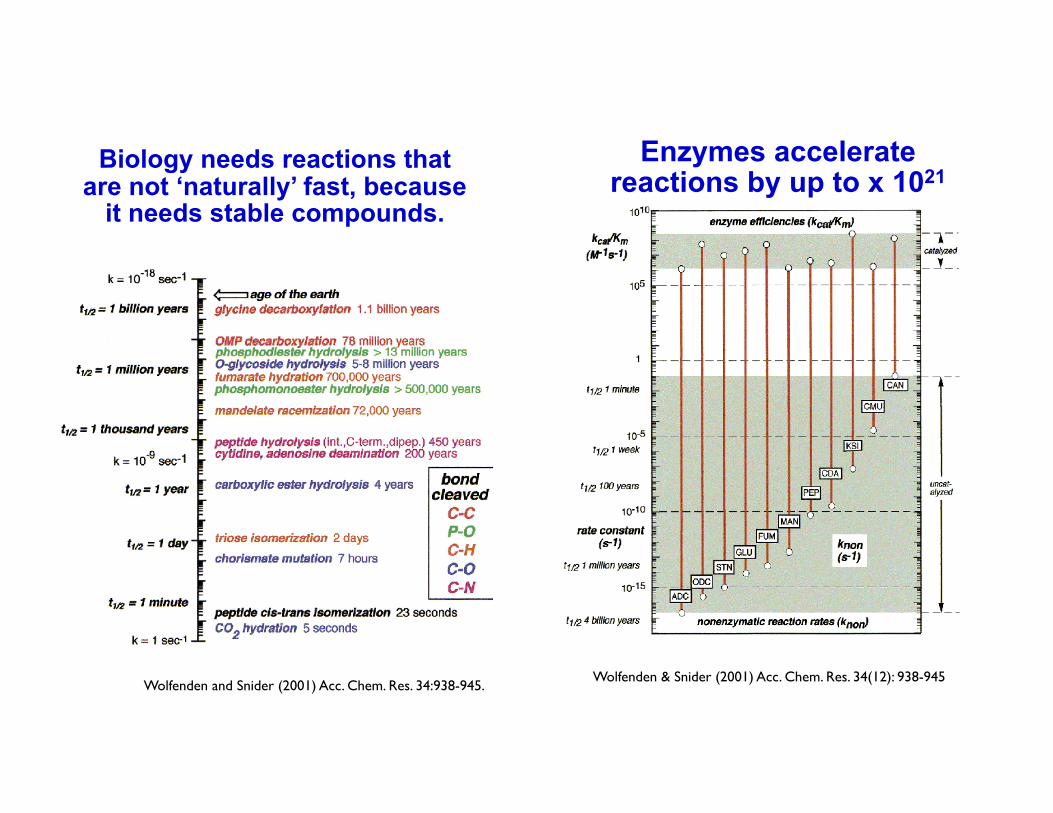
Reaction equilibrium vs. velocity.
! We measure the initial reaction velocity, when [P] ≈ 0 and [S] ≈ [S]0.5
[S]eq[P]eq
[S]0
[P]0
Keq = [S]eq
[P]eq
d[P]/dt = v
v0 = k3[ET] [S]0KM + [S]0
Concentration
time
Rate-limiting step and transition state energy.
! The reaction is accelerated by lowering the free energy of transition state activation.
ΔF° = ΔG° = -RT ln Keq
Keq = e-ΔG°/RT
kvel = e-ΔG /RT‡kBTh
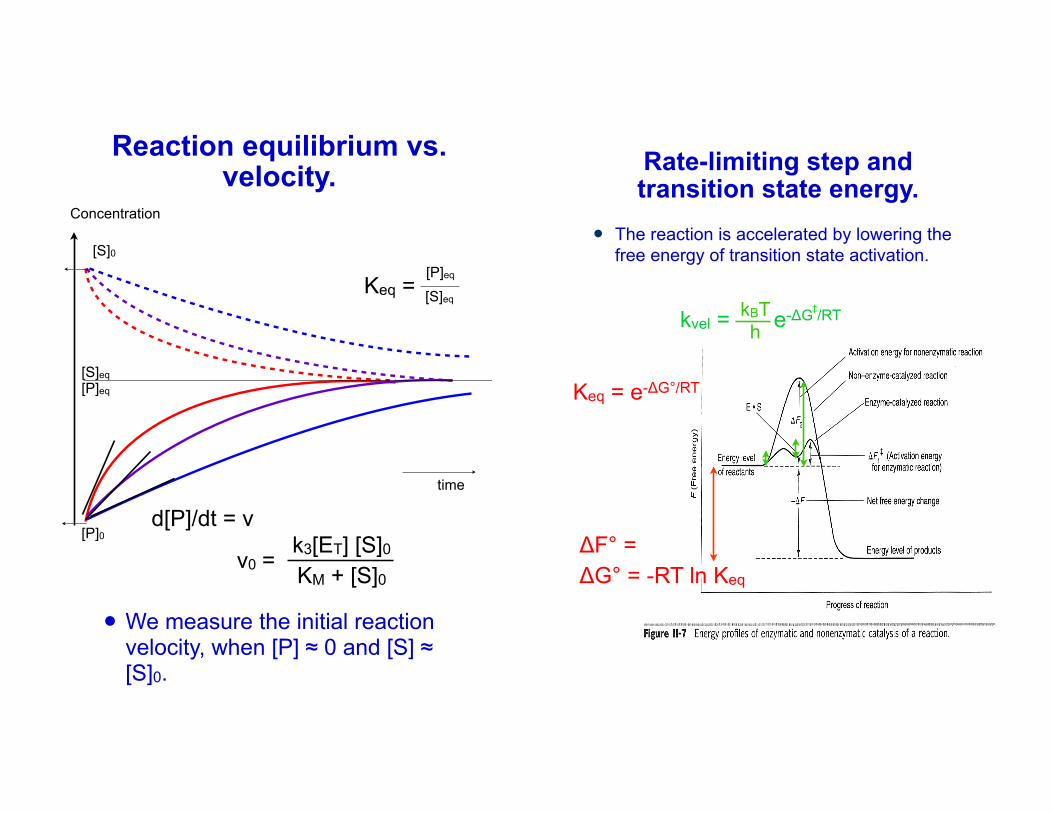
Observed Initial Rate of Reaction
– measure and plot initial velocity (vo) as a function of substrate concentration ([S]0). Initial velocity is used to eliminate effects of product buildup (slowing down reaction).
– At some point adding more substrate does not further increase the reaction rate. A plateau is observed corresponding to saturation of the enzyme.
– For single substrate, Vmax occurs when all of substrate is in ES state.
Figure II-8
Background (Michaelis-Menton)
! The Michaelis-Menton equation describes the relationship between initial velocity (vo) and initial substrate concentration ([S]0 ).
– KM (the Michaelis constant) is equal to the substrate concentration that yields vo equal to Vmax/2 .
– This constant is used as a general measure of the stability of the enzyme substrate interaction.
– KM has the form of dissociation constant. The analogy is best when k3 << k2.
– Officially; KM = (k2 + k3) / (k1)– (More generally KM = (k-1 + k2) / (k1) )
– Vmax is the velocity achieved when all enzyme is saturated with substrate.
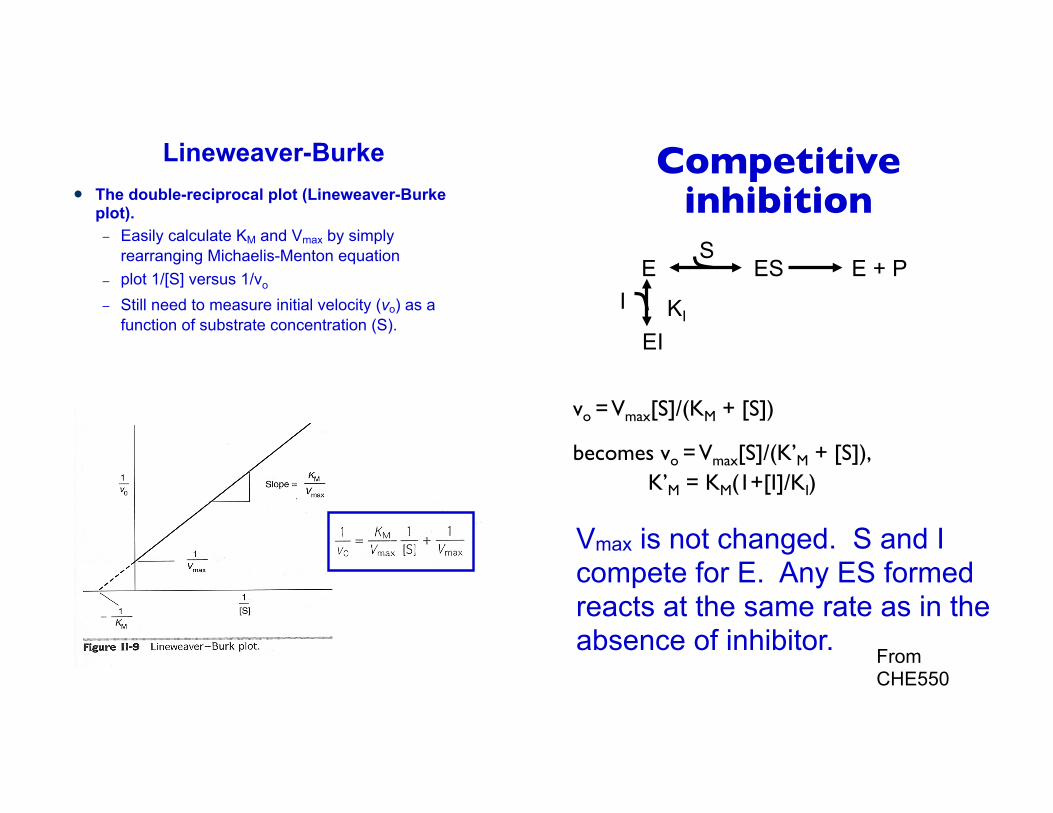
Lineweaver-Burke! The double-reciprocal plot (Lineweaver-Burke
plot). – Easily calculate KM and Vmax by simply
rearranging Michaelis-Menton equation– plot 1/[S] versus 1/vo
– Still need to measure initial velocity (vo) as a function of substrate concentration (S).
vo = Vmax[S]/(KM + [S])
becomes vo = Vmax[S]/(K’M + [S]), K’M = KM(1+[I]/KI)
ES
I
EI
ES E + P
KI
Vmax is not changed. S and I compete for E. Any ES formed reacts at the same rate as in the absence of inhibitor.
Competitive inhibition
From CHE550
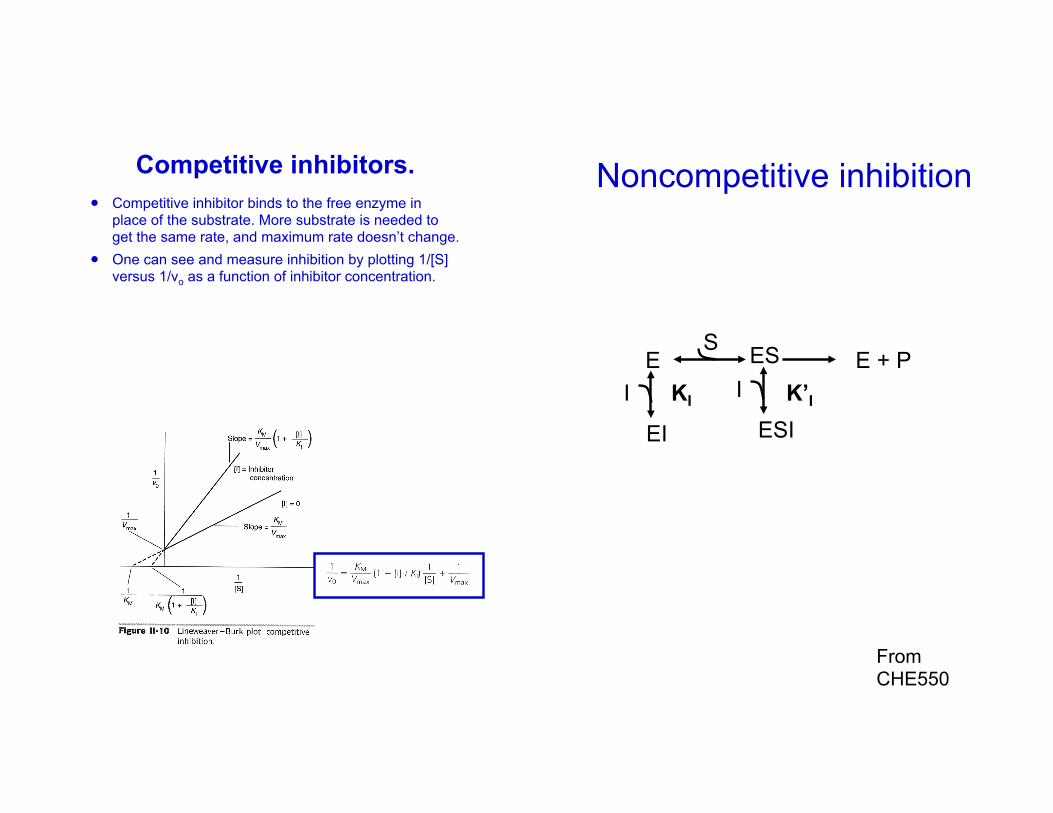
Competitive inhibitors.! Competitive inhibitor binds to the free enzyme in
place of the substrate. More substrate is needed to get the same rate, and maximum rate doesn’t change.
! One can see and measure inhibition by plotting 1/[S] versus 1/vo as a function of inhibitor concentration.
ES
I
EI
ES E + PKI K’II
ESI
Noncompetitive inhibition
From CHE550
KI = K’I
vo = Vmax[S]/(KM + [S])
becomes vo = V’max [S]/(K’M + [S]),
K’M = KM V’max = Vmax/ (1+[I]/K’I)
Inhibitor binding does not affect the E ↔ ES equilibrium
PURE noncompetitive: KI = K’I
ES
I
EI
ES E + P
KI K’II
ESI
From CHE550
Noncompetitive Inhibitors.! Noncompetitive inhibitor binds to free enzyme or
enzyme-substrate complex. Notice how the curves differ from that for a competitive inhibitor.
Figure II-11
Pure non-competitive, Mixed non-competitive
vo = Vmax[S]/(KM + [S])
becomes vo = V’max [S]/(K’M + [S]),
K’M = KM/(1+[I]/K’I)
V’max = Vmax/ (1+[I]/K’I)
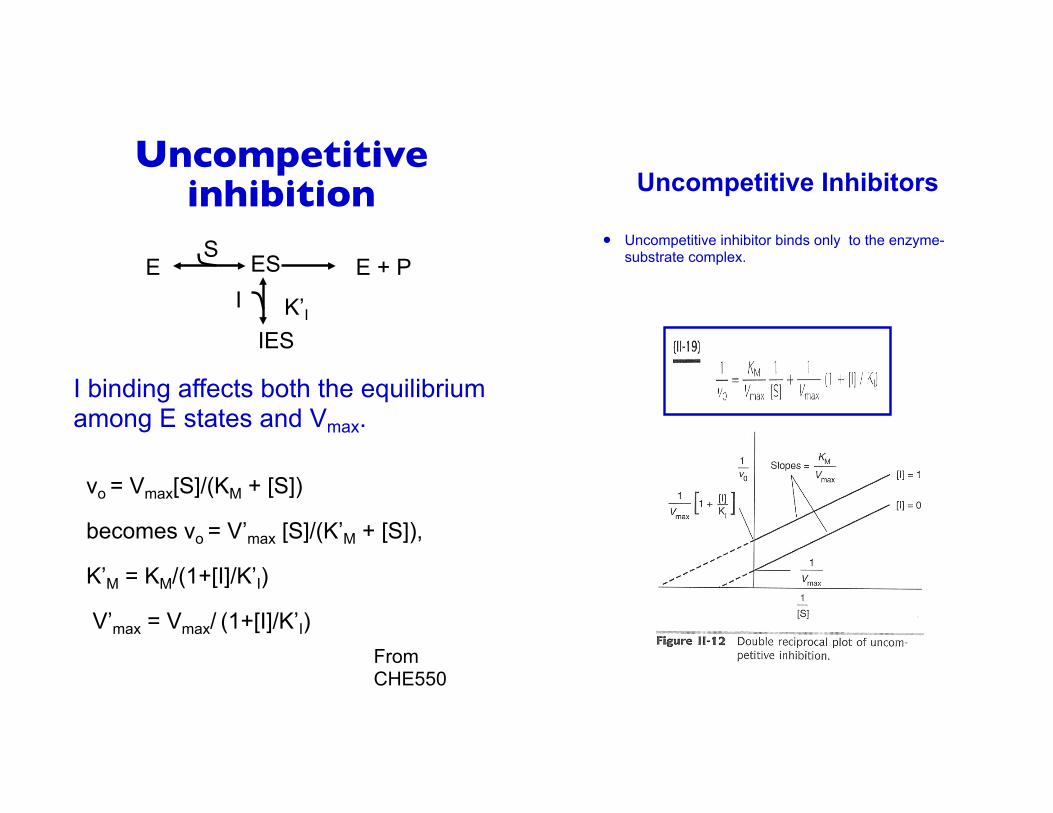
ES
I
IES
ES E + P
K’I
I binding affects both the equilibrium among E states and Vmax.
Uncompetitive inhibition
From CHE550
Uncompetitive Inhibitors
! Uncompetitive inhibitor binds only to the enzyme-substrate complex.

β-galactosidase
17
Lactose → glucose + galactose.
Homotetramer.Product of the lacZ gene.
The protein can be expressed in two parts. lacZα and lacZΩ.Catalytic activity requires both.
Chromogenic substrates
A common chromogenic substrate
18http://en.wikipedia.org/wiki/X-gal
5-bromo-4-chloro-3-indolyl- beta-D-galactopyranoside
X-gal
X-gal is cleaved by β-galactosidase yielding galactose and 5-bromo-4-chloro-3-hydroxyindole. The latter is then oxidized into 5,5'-dibromo-4,4'-dichloro-indigo, an insoluble blue product.
indole group
Because this product precipitates, it can be used as a tissue stain. It will stain any tissues expressing the lacZ gene.Thus the lacZ gene has been widely used as a reporter gene, upon cloning downstream of regulatory sequences of interest, or next to genes whose regulation you would like to document.
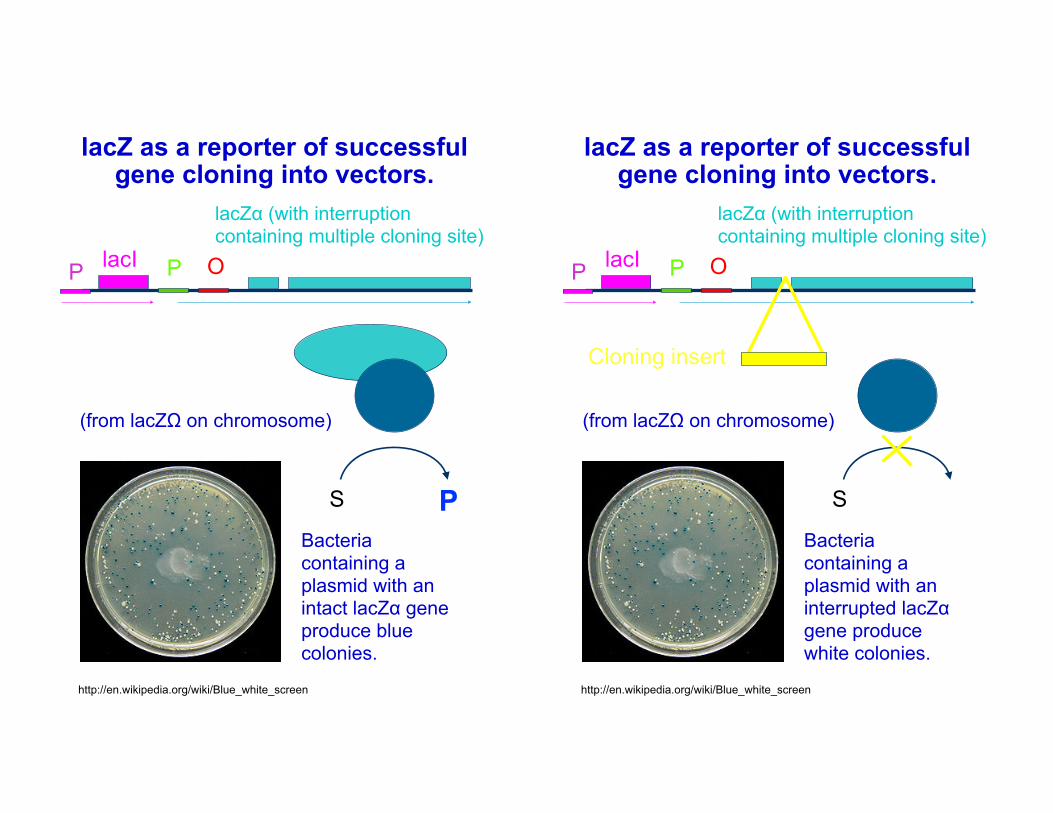
lacZ as a reporter of successful gene cloning into vectors.
19http://en.wikipedia.org/wiki/Blue_white_screen
lacZα (with interruption containing multiple cloning site)
P OlacIP
(from lacZΩ on chromosome)
S PBacteria containing a plasmid with an intact lacZα gene produce blue colonies.
lacZ as a reporter of successful gene cloning into vectors.
20http://en.wikipedia.org/wiki/Blue_white_screen
lacZα (with interruption containing multiple cloning site)
P OlacIP
(from lacZΩ on chromosome)
S
Cloning insert
Bacteria containing a plasmid with an interrupted lacZα gene produce white colonies.

The Experiment (1)! We will employ the enzyme β-galactosidase,
which allows lactose metabolism in the bacterium Escherichia coli.
! We will use o-nitrophenyl-β,D-galactopyranoside (ONPG) instead of lactose because it is hydrolyzed into a color-containing solution (so we can monitor the reaction).
! We will study its kinetics in the absence and presence of inhibitors. This will be done using time-dependent spectroscopy.
Two Experiments! Day 1: Determine the enzyme concentrations
that produce linear kinetics. This concentration will be used for Day 2 experiments
– Steps 1-7, Determine Enzyme Activity– Make the several dilutions of enzyme
before beginning to use the spectrophotometer.
– Steps 8-10, data analysis– Calculate the extinction coefficient of ONP.
! Day 2 Kinetic parameters KM, Vmax and KI:– Steps 1-5, Determine KM and Vmax
– Steps 6-9, data analysis– Steps 1-4, Inhibitor Effects on Activity
– Steps 8-10, data analysis (do one inhibitor only)! In Group A: Sam, Andrea, Richard, Joseph, Emily, Jack please
use MGP. Brittany, Sarah N., Steven, John, Susannah, Jessica please use MTG.
!
In Group B: Sarah G., Brandon, Stephanie, Byron, Leah please use MGP. Shuang Liu, Jesse, Maks, Matthew, Michael please use MTG.

© A.-F. Miller 2013
Student Lockers & Groups23
Name Locker GroupSam Beavin L41C ABrittany Buurman L35C ASarah Garner L35C BAndrea Hiller L44C AShuang Liu L44C BSarah Negaard L34C ABrandon Nelson L34C BRichard Rathbun L31C AJesse Reed L31C BSteven Shofner L28C AJoseph Bodnar L41C->28C B->AStephanie Carpenter L28C BJohn Drury L25C AMaks Gold L25C BEmily Hall L38C AByron Hempel L38C BSusannah Hubler L44C AMatthew Hudzinski L44C BJack Moore L41C ALeah Neeley L41C BJessica Phelps L35C AMichael Sudkamp L35C B
Changes From the Book! We will follow the experimental protocol
exactly for Days 1 and 2 except– Skip steps 11-14 on Day 1 (determination of
enzyme concentration)– use either MGP, or MTG on Day 2 (see prev.
pg. for who should do which).– omit steps 11-13 on Day 2.
! We will not be doing Days 3 and 4.! Technical tweaks
– Do not vortex enzyme-containing solutions. Invert or swish in and out of a pipettor.
– Start a timer as you add enzyme. Record the time at which you make your first absorbance reading if it is not exactly at 30 sec. Do the same for any time point that is not at the target time.
– Work with a buddy who can adjust your pipettor for the next addition while you work with the spectrophotometer.
– For step 10, first plot activity vs. enzyme amount present, and use only points that fall in a linear regime, when calculating your stock solution activity.

Data Analysis
Run your long time course with a buddy, each of you can put a tube in the same spectrophotometer and you can each take turns reading absorbances
Data Analysis
Prepare a table in advance so that during the experiment you will be filling in boxes with absorbances (also allow a column for time of observation). Write your results down in real time.
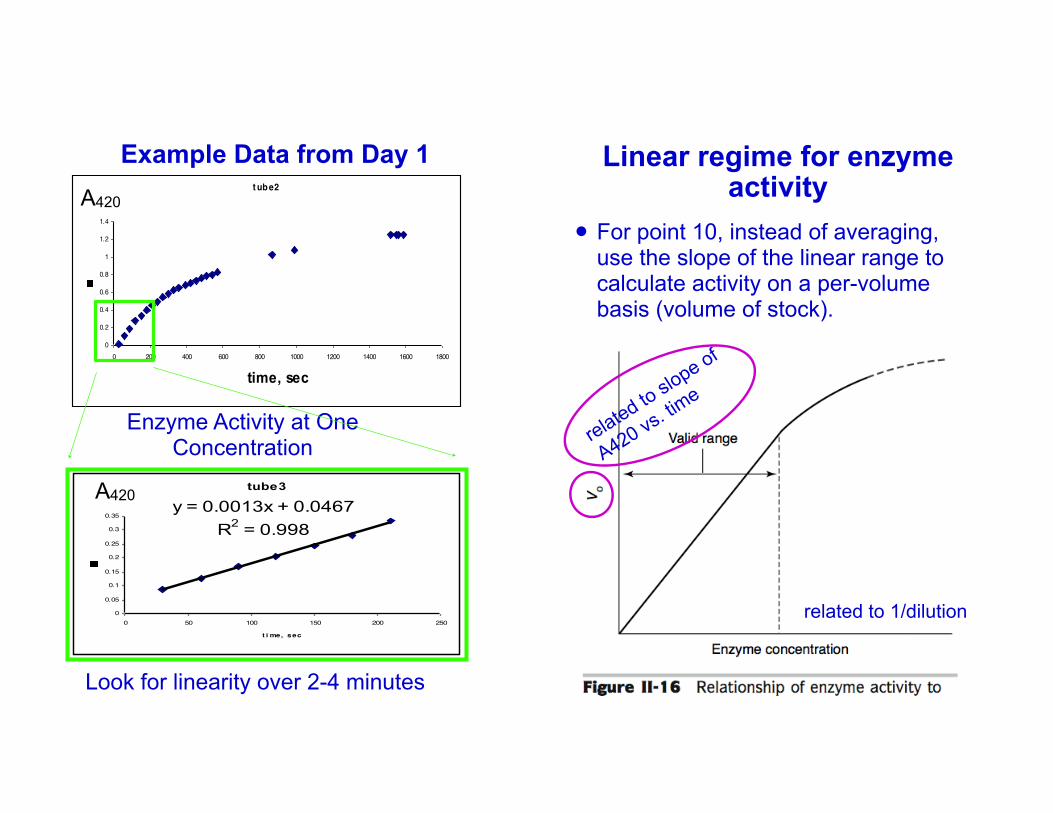
Example Data from Day 1
Enzyme Activity at One Concentration
Look for linearity over 2-4 minutes
A420
A420
Linear regime for enzyme activity
28
! For point 10, instead of averaging, use the slope of the linear range to calculate activity on a per-volume basis (volume of stock).
related to 1/dilution
related to slope of
A420 vs. time
Experimental Considerations
! Pay careful attention to which steps have experiments and which have data analysis. You can do the data analysis later.
! Make sure your data is saved, for example to the hard drive of one of the computers, in case your memory stick goes bad.
! Delete all old files from the spec. to free up more ‘experiments’ for use.
! It will be easy to confuse substances, so please be careful.
Safety Considerations
! Observe all normal laboratory safety practices.
Related Documents