Biochemical characterization of recombinant nucleoside hydrolase from Mycobacterium tuberculosis H37Rv Priscila Lamb Wink a,b , Zilpa Adriana Sanchez Quitian a,b , Leonardo Astolfi Rosado a,b , Valnes da Silva Rodrigues Júnior a , Guilherme Oliveira Petersen a,b , Daniel Macedo Lorenzini a , Thiago Lipinski-Paes c , Luis Fernando Saraiva Macedo Timmers a,c , Osmar Norberto de Souza b,c , Luiz Augusto Basso a,b,⇑ , Diogenes Santiago Santos a,b,⇑ a Centro de Pesquisas em Biologia Molecular e Funcional (CPBMF), Instituto Nacional de Ciência e Tecnologia em Tuberculose (INCT-TB), Pontifícia Universidade Católica do Rio Grande do Sul (PUCRS), 6681/92-A Av. Ipiranga, 90619-900 Porto Alegre, RS, Brazil b Programa de Pós-Graduação em Biologia Celular e Molecular, Pontifícia Universidade Católica do Rio Grande do Sul (PUCRS), Porto Alegre, RS, Brazil c Laboratório de Bioinformática, Modelagem e Simulação de Biossistemas (LABIO), Faculdade de Informática, Pontifícia Universidade Católica do Rio Grande do Sul (PUCRS), Porto Alegre, RS, Brazil article info Article history: Received 13 June 2013 and in revised form 13 August 2013 Available online 26 August 2013 Keywords: Mycobacterium tuberculosis Nucleoside hydrolase Substrate specificity Thermodynamics pH-rate profile Spectrofluorimetry abstract Tuberculosis (TB) is a major global health threat. There is a need for the development of more efficient drugs for the sterilization of the disease’s causative agent, Mycobacterium tuberculosis (MTB). A more comprehensive understanding of the bacilli’s nucleotide metabolic pathways could aid in the develop- ment of new anti-mycobacterial drugs. Here we describe expression and purification of recombinant iunH-encoded nucleoside hydrolase from MTB (MtIAGU-NH). Glutaraldehyde cross-linking results indi- cate that MtIAGU-NH predominates as a monomer, presenting varied oligomeric states depending upon binding of ligands. Steady-state kinetics results show that MtIAGU-NH has broad substrate specificity, accepting inosine, adenosine, guanosine, and uridine as substrates. Inosine and adenosine displayed posi- tive homotropic cooperativity kinetics, whereas guanosine and uridine displayed hyperbolic saturation curves. Measurements of kinetics of ribose binding to MtIAGU-NH by fluorescence spectroscopy suggest two pre-existing forms of enzyme prior to ligand association. The intracellular concentrations of inosine, uridine, hypoxanthine, and uracil were determined and thermodynamic parameters estimated. Thermo- dynamic activation parameters (E a , DG # , DS # , DH # ) for MtIAGU-NH-catalyzed chemical reaction are pre- sented. Results from mass spectrometry, isothermal titration calorimetry (ITC), pH-rate profile experiment, multiple sequence alignment, and molecular docking experiments are also presented. These data should contribute to our understanding of the biological role played by MtIAGU-NH. Ó 2013 Elsevier Inc. All rights reserved. Introduction Tuberculosis (TB 1 ) is an infectious disease caused by the bacillus Mycobacterium tuberculosis (MTB) and primarily affects the lungs (pulmonary TB) but can infect other organ systems (extra-pulmon- ary TB) [1]. The disease remains a major threat to global health, and TB accounts for 2.0% of all Disability Adjusted Life Years (DALYs). It is the third leading cause of DALYs among infectious diseases after human immunodeficiency virus (HIV) and malaria [2]. The World Health Organization (WHO) estimated that in 2011, there were 8.7 million incident TB cases (13% of which occurred in those co-infected with HIV), and 1.4 million deaths, 430,000 of which in HIV-positive individuals [3]. The current regimen for treating TB was established more than 30 years ago using drugs which were developed in the 0003-9861/$ - see front matter Ó 2013 Elsevier Inc. All rights reserved. http://dx.doi.org/10.1016/j.abb.2013.08.011 ⇑ Corresponding authors. Address: Av. Ipiranga 6681 – Tecnopuc – Prédio 92A, 90619-900 Porto Alegre, RS, Brazil. Fax: +55 51 33203629. E-mail addresses: [email protected] (L.A. Basso), [email protected] (D.S. Santos). 1 Abbreviations used: BCG, bacillus Calmette–Guerin; CFU, colony-forming units; CHES, 2-(N-Cyclohexylamino)ethanesulfonic Acid; CV, column volumes; DALYs, Disability Adjusted Life Years; DMSO, dimethyl sulfoxide; ESI-MS, electrospray ionization mass spectrometry; HEPES, N-2-Hydroxyethylpiperazine-N 0 -2-ethanesulfonic Acid; HIV, human immunodeficiency virus; IAG-NH, purine-specific inosine–adenosine–guanosine preferring nucleoside hydrolase; ICP-OES, inductively coupled plasma optical emission spectroscopy; IG-NH, inosine–guanosine preferring nucleoside hydrolase; IPTG, isopropyl b-D-thiogalactopyranoside; ITC, isothermal titration calorimetry; IU-NH, inosine– uridine preferring nucleoside hydrolase; LB, Luria–Bertani; MES, 2-(N-Morpholino)ethanesulfonic Acid; MTB, Mycobacterium tuberculosis; MtIAGU-NH, iunH-encoding nucleoside hydrolase from MTB; NH, nucleoside hydrolase; OADC, oleic acid–albumin–dextrose–catalase; PCR, polymerase chain reaction; PNP, purine nucleoside phosphorilase; SDS–PAGE, Dodecyl sulfate–polyacrylamide gel electrophoresis; TB, tuberculosis; WHO, World Health Organization. Archives of Biochemistry and Biophysics 538 (2013) 80–94 Contents lists available at ScienceDirect Archives of Biochemistry and Biophysics journal homepage: www.elsevier.com/locate/yabbi

Welcome message from author
This document is posted to help you gain knowledge. Please leave a comment to let me know what you think about it! Share it to your friends and learn new things together.
Transcript

Archives of Biochemistry and Biophysics 538 (2013) 80–94
Contents lists available at ScienceDirect
Archives of Biochemistry and Biophysics
journal homepage: www.elsevier .com/ locate /yabbi
Biochemical characterization of recombinant nucleoside hydrolase fromMycobacterium tuberculosis H37Rv
0003-9861/$ - see front matter � 2013 Elsevier Inc. All rights reserved.http://dx.doi.org/10.1016/j.abb.2013.08.011
⇑ Corresponding authors. Address: Av. Ipiranga 6681 – Tecnopuc – Prédio 92A, 90619-900 Porto Alegre, RS, Brazil. Fax: +55 51 33203629.E-mail addresses: [email protected] (L.A. Basso), [email protected] (D.S. Santos).
1 Abbreviations used: BCG, bacillus Calmette–Guerin; CFU, colony-forming units; CHES, 2-(N-Cyclohexylamino)ethanesulfonic Acid; CV, column volumes; DALYs, DAdjusted Life Years; DMSO, dimethyl sulfoxide; ESI-MS, electrospray ionization mass spectrometry; HEPES, N-2-Hydroxyethylpiperazine-N0-2-ethanesulfonic Acid; HIVimmunodeficiency virus; IAG-NH, purine-specific inosine–adenosine–guanosine preferring nucleoside hydrolase; ICP-OES, inductively coupled plasma opticalspectroscopy; IG-NH, inosine–guanosine preferring nucleoside hydrolase; IPTG, isopropyl b-D-thiogalactopyranoside; ITC, isothermal titration calorimetry; IU-NH,uridine preferring nucleoside hydrolase; LB, Luria–Bertani; MES, 2-(N-Morpholino)ethanesulfonic Acid; MTB, Mycobacterium tuberculosis; MtIAGU-NH, iunH-encoding nhydrolase from MTB; NH, nucleoside hydrolase; OADC, oleic acid–albumin–dextrose–catalase; PCR, polymerase chain reaction; PNP, purine nucleoside phosphorilase; SDDodecyl sulfate–polyacrylamide gel electrophoresis; TB, tuberculosis; WHO, World Health Organization.
Priscila Lamb Wink a,b, Zilpa Adriana Sanchez Quitian a,b, Leonardo Astolfi Rosado a,b,Valnes da Silva Rodrigues Júnior a, Guilherme Oliveira Petersen a,b, Daniel Macedo Lorenzini a,Thiago Lipinski-Paes c, Luis Fernando Saraiva Macedo Timmers a,c, Osmar Norberto de Souza b,c,Luiz Augusto Basso a,b,⇑, Diogenes Santiago Santos a,b,⇑a Centro de Pesquisas em Biologia Molecular e Funcional (CPBMF), Instituto Nacional de Ciência e Tecnologia em Tuberculose (INCT-TB), Pontifícia Universidade Católica do Rio Grandedo Sul (PUCRS), 6681/92-A Av. Ipiranga, 90619-900 Porto Alegre, RS, Brazilb Programa de Pós-Graduação em Biologia Celular e Molecular, Pontifícia Universidade Católica do Rio Grande do Sul (PUCRS), Porto Alegre, RS, Brazilc Laboratório de Bioinformática, Modelagem e Simulação de Biossistemas (LABIO), Faculdade de Informática, Pontifícia Universidade Católica do Rio Grande do Sul (PUCRS),Porto Alegre, RS, Brazil
a r t i c l e i n f o
Article history:Received 13 June 2013and in revised form 13 August 2013Available online 26 August 2013
Keywords:Mycobacterium tuberculosisNucleoside hydrolaseSubstrate specificityThermodynamicspH-rate profileSpectrofluorimetry
a b s t r a c t
Tuberculosis (TB) is a major global health threat. There is a need for the development of more efficientdrugs for the sterilization of the disease’s causative agent, Mycobacterium tuberculosis (MTB). A morecomprehensive understanding of the bacilli’s nucleotide metabolic pathways could aid in the develop-ment of new anti-mycobacterial drugs. Here we describe expression and purification of recombinantiunH-encoded nucleoside hydrolase from MTB (MtIAGU-NH). Glutaraldehyde cross-linking results indi-cate that MtIAGU-NH predominates as a monomer, presenting varied oligomeric states depending uponbinding of ligands. Steady-state kinetics results show that MtIAGU-NH has broad substrate specificity,accepting inosine, adenosine, guanosine, and uridine as substrates. Inosine and adenosine displayed posi-tive homotropic cooperativity kinetics, whereas guanosine and uridine displayed hyperbolic saturationcurves. Measurements of kinetics of ribose binding to MtIAGU-NH by fluorescence spectroscopy suggesttwo pre-existing forms of enzyme prior to ligand association. The intracellular concentrations of inosine,uridine, hypoxanthine, and uracil were determined and thermodynamic parameters estimated. Thermo-dynamic activation parameters (Ea, DG#, DS#, DH#) for MtIAGU-NH-catalyzed chemical reaction are pre-sented. Results from mass spectrometry, isothermal titration calorimetry (ITC), pH-rate profileexperiment, multiple sequence alignment, and molecular docking experiments are also presented. Thesedata should contribute to our understanding of the biological role played by MtIAGU-NH.
� 2013 Elsevier Inc. All rights reserved.
Introduction
Tuberculosis (TB1) is an infectious disease caused by the bacillusMycobacterium tuberculosis (MTB) and primarily affects the lungs(pulmonary TB) but can infect other organ systems (extra-pulmon-ary TB) [1]. The disease remains a major threat to global health,and TB accounts for 2.0% of all Disability Adjusted Life Years (DALYs).
It is the third leading cause of DALYs among infectious diseases afterhuman immunodeficiency virus (HIV) and malaria [2]. The WorldHealth Organization (WHO) estimated that in 2011, there were 8.7million incident TB cases (13% of which occurred in those co-infectedwith HIV), and 1.4 million deaths, 430,000 of which in HIV-positiveindividuals [3]. The current regimen for treating TB was establishedmore than 30 years ago using drugs which were developed in the
isability, human
emissioninosine–
ucleosideS–PAGE,
P.L. Wink et al. / Archives of Biochemistry and Biophysics 538 (2013) 80–94 81
middle of the 20th century [4]. At the present time, the only ap-proved TB vaccine is the bacillus Calmette–Guerin (BCG), whichthe WHO recommends in infants to prevent incident disease in chil-dren. However, this vaccine confers variable protection to adoles-cents and adults. Moreover, it is not effective in preventingreactivation of the disease in those with latent TB infection [5,6].
There is an urgent need for the development of new and moreefficient drugs for the treatment of TB. Strategies for the discov-ery of new anti-mycobacterial targets include elucidation of therole played by proteins in biochemical pathways essential formycobacterial growth and/or persistence [7]. Nucleotide meta-bolic pathways provide a promising source for the discovery ofnew antibacterial drug targets as the enzymes and pathways in-volved frequently differ from their human counterparts. Purineand pyrimidine salvage pathways in MTB remain an incompletelyexplored possibility for drug development as purine and pyrimi-dine biosynthesis are essential steps, supplying building blocksfor DNA and RNA synthesis [8]. Enzymes from these pathwaysare thus attractive anti-tubercular drug targets [8]. Several homo-logues to enzymes in the purine and pyrimidine pathways havebeen identified in the genome sequence of MTB H37Rv [9]. A bet-ter understanding of the characteristics of the enzymes involvedin purine and pyrimidine salvage pathways in MTB will aid inthe design of analogs that may selectively inhibit MTB replicationand survival. Ideally this class of compounds will be activeagainst strains of MTB that are resistant to drugs currently usedto treat the disease and, hopefully, also clear latent infections[10].
Nucleoside hydrolases (or nucleoside N-ribohydrolases; NH)catalyze the irreversible hydrolysis of N-glycosidic bond of ribonu-cleosides forming a-D-ribose and the corresponding base [11]. NHsare widely distributed in nature, and have been identified in anumber of sources, including bacteria [12–15], yeast [16–21], pro-tozoa [16–20,22], insects [23], and mesozoans [24], indicating thatnucleoside hydrolysis plays an important role in many organisms.Interestingly, neither nucleoside hydrolase activity nor the encod-ing genes have ever been detected in mammals. Although found inmost organisms, the metabolic role of NHs has been well estab-lished only in protozoan parasites such as Crithidia fascicula-ta[16,18,25,26], Trypanosoma brucei brucei[19], and Leshmaniamajor[20]. Because parasitic protozoans lack the de novo pathwayto synthesize purine nucleosides, they rely on nucleoside hydrolaseto supply purine nucleosides by salvaging them from the host [16].Thus, NH from parasitic protozoa in particular has been studiedextensively by X-ray crystallography, kinetic methods and site-di-rected mutagenesis [11]. Nucleoside hydrolases have been classi-fied into three subclasses according to their substrate specificity:the base-specific inosine–uridine preferring nucleoside hydrolase(IU-NH) [16,20], the purine-specific inosine–adenosine–guanosinepreferring nucleoside hydrolase (IAG-NH) [27,28] and an inosine–guanosine preferring nucleoside hydrolase (IG-NH) [17]. Recentdata suggest that this classification has to be extended as there ex-ists an increasing number of NHs that do not fit in any of thesegroups [14,24,29]. Moreover, there seems to be little correlationbetween the level of amino acid identity and nucleobase specific-ity. The iunH gene (MTB Rv3393) has been proposed by sequencehomology to encode a polypeptide chain with IU-NH activity [9],and this gene product has been predicted not to be required forin vitro growth of MTB [30]. In addition, high-resolution globalphenotypic profiling results have prompted the proposal that theiunH-gene product is not required for in vitro growth in glyceroland cholesterol (a critical carbon source during infection) media[31]. However, as pointed out by Griffin et al. [31], homologousrecombination and high-density mutagenesis genetic approachesfor defining essential genes have advantages and limitations. Hu-mans lack this enzyme and rely on a different set of enzymatic
reactions to supply their nucleoside requirements. To the best ofour knowledge, there has been no formal proof as to ascertainthe correct assignment to the open reading frame of iunH gene inMTB. In addition, the mode of action of this gene product has notyet been reported. Accordingly, biochemical studies on iunH-geneproduct seem to be worth pursuing.
Our manuscript describes polymerase chain reaction (PCR)amplification, cloning, expression and purification of recombinantiunH-encoded NH protein. Determination of metal identity andconcentration by inductively coupled plasma optical emissionspectroscopy suggest the presence of a Ca2+ ion per enzyme sub-unit. Glutaraldehyde cross-linking results indicate that the recom-binant protein is predominantly present in solution in amonomeric state, having varied oligomeric states depending uponbinding of distinct ligands. Steady-state kinetics results, using acontinuous spectrophotometric assay, indicate that the recombi-nant protein has broad substrate specificity, accepting inosine,adenosine, guanosine, and uridine as substrates. Accordingly, therecombinant protein will henceforth be referred to as MtIAGU-NH. Inosine and adenosine displayed positive homotropic cooper-ativity kinetics, whereas guanosine and uridine displayed hyper-bolic saturation curves. Fluorescence spectroscopy measurementsof kinetics of ribose binding to MtIAGU-NH suggest two forms offree enzyme in solution. Results for mass spectrometry, isothermaltitration calorimetry (ITC), pH-rate profiles, multiple sequencealignment, and molecular docking experiments are also presented.The intracellular concentrations of inosine, uridine, hypoxanthine,and uracil in MTB bacilli were determined. Equilibrium constants,standard free energy (DG�), and intracellular concentration of a-ri-bose to make the process favorable (DG < 0) were evaluated. Ther-modynamic activation parameters (Ea, DG#, DS#, DH#) for MtIAGU-NH-catalyzed chemical reaction are presented. It is hoped that thedata presented here may contribute to our understanding of MtIA-GU-NH mode of action, thereby providing a solid basis for the ra-tional design of inhibitors of this enzyme’s activity with potentialuse as chemotherapeutic agents to treat TB. These inhibitors mayalso be useful to chemical biologists interested in designing func-tion-based chemical compounds to elucidate the biological roleof MtIAGU-NH in the context of whole MTB cells.
Materials and methods
Gene amplification, cloning, and protein expression
Synthetic oligonucleotide primers were designed to containNdeI (primer sense 50TCCATATGAGCGTCGTATTCGCCGACGTCG30)and HindIII (primer antisense 50CCAAGCTTTCACGTTCGGCGCGCGAATCG30) restriction sites (highlighted in italics). The iunH gene(Rv3393) was PCR amplified from total genomic DNA of MTB strainH37Rv using Pfu DNA polymerase (Stratagene, Foster City, USA) inthe presence of 10% dimethyl sulfoxide (DMSO) (final concentra-tion). The PCR product (927 bp) was then purified from agarosegel with a QIAGEN QIA quick gel extraction kit (Qiagen, Venlo,Netherlands), cloned into the pCR-Blunt� vector (Invitrogen, LifeTechnologies, Grand Island, USA) and subcloned into thepET-23a(+) expression vector (Novagen, Merck KGaA, Darmstadt,Germany) using the NdeI and HindIII restriction enzymes (NewEngland Biolabs, Ipswich, USA). In order to confirm the product’sidentity and integrity as well as to ensure that no mutations wereintroduced in the cloned fragment the MTB iunH gene was se-quenced with automatic DNA sequencing.
Escherichia coli C41(DE3) electro-competent cells were trans-formed with recombinant pET23a(+) containing the iunH gene byelectroporation (Gene Pulser II; Capacitance Extender II; PulseController II, Bio-Rad Laboratories, Hercules, USA) and grown on

82 P.L. Wink et al. / Archives of Biochemistry and Biophysics 538 (2013) 80–94
Luria–Bertani (LB) agar plates containing 50 lg mL�1 ampicillin. LBmedium (50 mL) was inoculated with a single colony and cellswere grown at 180 rpm at 37 �C overnight. The culture (9 mL)was inoculated in 500 mL of Terrific Broth medium, with the sameantibiotic concentration, and grown in a shaker set at 180 rpm and37 �C until they achieved an OD600 reading of 0.4–0.6. The cellswere grown for an additional 18 h after induction with 0.5 mM iso-propyl b-D-thiogalactopyranoside (IPTG) at 30 �C. Cells were har-vested by centrifugation at 8,000g for 30 min at 4 �C and storedat -20 �C. Soluble and insoluble fractions were analyzed by 12%Dodecyl sulfate–polyacrylamide gel electrophoresis (SDS–PAGE)[32].
Protein purification
HPLC was done using an ÄKTA System (GE Healthcare� Life Sci-ences, Pittsburgh, USA) and performed at 4 �C. Approximately 5 gof wet cell paste was suspended in 50 mL of 50 mM Tris HCl pH7.5 (buffer A) containing a protease inhibitor cocktail tablet (Com-plete EDTA-free, Roche Diagnostics, Basel, Switzerland) and gentlystirred for 30 min in the presence of 0.2 mg mL�1 lysozyme (SigmaAldrich, Saint Louis, USA). Cells were disrupted by sonication (10pulses of 10 s each at 60% amplitude) and centrifuged at 48,000gfor 30 min. To precipitate nucleic acids and ribonuclear proteins,the supernatant was treated with 1% (w/v) streptomycin sulfate(final concentration) for 30 min under slow agitation and centri-fuged at 48,000g for 30 min. The supernatant was dialyzed againstbuffer A and loaded on a HiPrep Q-Sepharose Fast Flow anion ex-change column (GE Healthcare� Life Sciences, Pittsburgh, USA)pre-equilibrated with buffer A, washed 3 column volumes (CV) ofthe same buffer, and the adsorbed proteins were eluted with a lin-ear gradient (0–100%) of 20 CV of 50 mM Tris HCl pH 7.5 contain-ing 150 mM NaCl (buffer B) at 1 mL min�1 flow rate. The adsorbedrecombinant MtIAGU-NH was eluted at approximately 75 mMNaCl and all fractions were analyzed by SDS–PAGE. The fractionscontaining the MtIAGU-NH activity were pooled and concentratedto a final volume of 7 mL using a 50 mL stirred ultrafiltration cell(Millipore, Billerica, USA) with a 10 kDa cutoff filter, and loadedon a HiLoad Superdex 200 26/60 size exclusion column (GE Health-care� Life Sciences, Pittsburgh, USA), previously equilibrated withbuffer A. Proteins were isocratically eluted with 1 CV of buffer Aat 0.3 mL min�1 flow rate, and the fractions containing the targetprotein were pooled and loaded on a High Resolution Mono Q16/10 anion exchange column (GE Healthcare� Life Sciences, Pitts-burgh, USA), previously equilibrated with buffer A. The columnwas washed with 1 CV, adsorbed proteins were eluted with a lineargradient (0–100%) of 20 CV of buffer B, and the target protein waseluted with 70 mM NaCl. The active fractions containing homoge-neous MtIAGU-NH were concentrated and dialyzed against 0.5 L of50 mM Tris HCl pH 7.5 containing 50 mM NaCl (buffer C). Proteinconcentration was determined by the method of Bradford usingthe Bio-Rad Protein Assay Kit (Bio-Rad, Hercules, USA) and bovineserum albumin as standard [33].
MtIAGU-NH identification by mass spectrometry
The homogeneous MtIAGU-NH was submitted to electrosprayionization mass spectrometry (ESI-MS) to confirm the enzyme’sidentity. The protein was digested with trypsin and the resultingpeptides were separated and analyzed by liquid chromatographyassociated with mass spectrometry with induced fragmentationcollision. The results were used to identify the amino acid se-quence through search software (Protein Discover, Thermo FisherScientific, Waltham, USA).
Inductively coupled plasma optical emission spectroscopy (ICP-OES)analysis of metal content
ICP-OES (PerkinElmer Optima 4300 DV, PerkinElmer Sciex, Can-ada) measurements were employed to assess metal identity andconcentration. Prior to these measurements, recombinant homoge-neous MtIAGU-NH was extensively dialyzed against 50 mM TrisHCl pH 7.5 and concentrated by ultrafiltration to a protein concen-tration of 2 mg mL�1.
MtIAGU-NH quaternary structure
Determination of MtIAGU-NH molecular mass in solution wasperformed injecting 100 lL protein suspension (11 lM homoge-neous recombinant MtIAGU-NH in 50 mM Tris HCl pH 7.5 contain-ing 50 mM NaCl) into a HighLoad 10/30 Superdex-200 gelchromatography (GE Healthcare� Life Sciences, Pittsburgh, USA)at 0.4 mL min�1 flow rate and isocratic elution with 1 CV of50 mM Tris HCl pH 7.5 containing 200 mM NaCl. Protein elutionwas monitored at 215, 254, and 280 nm. The LMW and HMW GelFiltration Calibration Kits (GE Healthcare� Life Sciences, Pittsburgh,USA) were used to prepare a calibration curve, measuring the elu-tion volumes (Ve) of standard proteins (ferritin, catalase, aldolase,ovalbumin, coalbumin, and ribonuclease A). These values wereused to calculate their respective partition coefficients (Kav, Eq.(1)). Blue dextran 2000 (GE Healthcare� Life Sciences, Pittsburgh,USA) was used to determine the void volume (V0). Vt is the totalbead volume of the column. The Kav value for each protein wasplotted against their corresponding molecular mass to obtain anestimate for free MtIAGU-NH molecular mass in solution.
Kav ¼Ve � V0
V t � V0ð1Þ
Glutaraldehyde cross-linking studies were performed to obtainestimates for the oligomeric state of both free MtIAGU-NH and en-zyme in the presence of products. The method described by Fadou-loglou et al. was employed using crystallization plates [34]. Inshort, the reservoir was filled with 120 lL of 25% (v/v) glutaralde-hyde acidified with HCl, and a drop of 10 lL of protein suspension(15 lM homogeneous recombinant MtIAGU-NH in 50 mM Tris HClpH 7.5 containing 50 mM NaCl) was placed on the cover slip, whichin turn was used to seal the well (forming a hanging drop insidethe well). Drops of 10 lL of protein suspension in the presence of4 mM of ribose, hypoxanthine, uracil, adenine, and guanine wereemployed to determine the oligomeric states of MtIAGU-NH inthe presence of products. The plates were incubated at 30 �C fordifferent time intervals and protein drops were subsequently ana-lyzed by 12% SDS–PAGE.
Steady-state kinetic parameters
All chemicals in enzyme activity measurements were pur-chased from Sigma Aldrich (Saint Louis, USA). MtIAGU-NH activitywas measured by a continuous spectrophotometric assay in quartzcuvettes using a UV–visible Shimadzu spectrophotometer UV2550equipped with a temperature-controlled cuvette holder.
The kinetic properties of MtIAGU-NH for inosine, adenosine,guanosine, and uridine were spectrophotometrically determinedusing the difference in absorption between the nucleoside andthe purine or pyrimidine base. MtIAGU-NH enzyme activity wasmeasured in the presence of varying concentrations of substratein 50 mM Tris HCl pH 7.5 containing 50 mM NaCl at 30 �C. Thereaction was started with addition of concentrations of MtIAGU-NH that yielded decreasing linear absorbance time courses forthe conversion of nucleoside substrates into products in a total vol-ume of 0.3 mL. The De values (mM�1cm�1) used were: inosine,

P.L. Wink et al. / Archives of Biochemistry and Biophysics 538 (2013) 80–94 83
0.92 at 280 nm; uridine, 2.1 at 280 nm; adenosine, 1.4 at 276 nm;guanosine, 0.11 at 300 nm [16]. All assays were performed induplicate. One unit of enzyme activity (U) was defined as theamount of enzyme catalyzing the conversion of 1 lmol of sub-strate into product per minute at 30 �C.
The experimental data were either fitted to the Hill equation(Eq. (2)) for a sigmoidal saturation curve or to the Michaelis–Men-ten equation (Eq. (3)) for a hyperbolic saturation curve [35,36]. Forthese equations, v is the steady-state velocity, Vmax is the maximalvelocity, S is the substrate concentration, KM is the Michaelis–Men-ten constant, n is the Hill coefficient (indicating the cooperative in-dex), and K0.5 is the substrate concentration in whichv = 0.5Vmax[35,36]. All data were analyzed by nonlinear regressionusing the SigmaPlot software (SigmaPlot 9.01, Systac Software, Inc.,Melbourne, USA).
v ¼ Vmax½S�n
Kn0:5 þ ½S�
n ð2Þ
v ¼ Vmax½S�KM þ ½S�
ð3Þ
As no saturation for uridine could be detected by the continu-ous spectrophotometric assay, ITC measurements were carriedout. MtIAGU-NH activity measurements were thus performedusing an ITC200 microcalorimeter (Microcal, Inc., Pittsburgh, USA)at 30 �C and a syringe of 39.7 lL total volume with the mixturestirring at 500 rpm. A heating reference of 11 lcal s�1 was usedin all experiments. After an initial delay of 60 s, reactions were ini-tiated by injecting 7.2 lL of enzyme solution (86.2 lM) into thesample cell (for a total volume of 203 lL) loaded with substrate(2.5 mM uridine). A second enzyme injection was performed aftera 3 h lag time to obtain the correct baseline and also to determinethe dilution heat of enzyme in solution, which was subtracted fromthe total reaction heat. The apparent enthalpy of reaction (DHapp)is determined from area under the curve divided by the total num-ber of moles of uridine (same as dividing the total heat generatedin the reaction by the amount of product formed when the sub-strate is totally consumed) [37].
To measure enzyme activity, after an initial delay of 60 s, reac-tions were initiated by injecting 3 lL of enzyme solution(34.5 lM) into the sample cell (for a total volume of 203 lL) loadedwith variable substrate concentrations (5–150 mM uridine). Sub-strate and enzyme solutions were suspended in the same buffer(50 mM Tris HCl pH 7.5 containing 50 mM NaCl) to minimize the ef-fects of heat dilution. The reference cell (200 lL) was loaded withMilliQ water for all experiments. The initial velocity for MtIAGU-NH was measured by taking the difference in heat flux measuredbetween the base line and 60 s, and the maximal heat flux after en-zyme solution injection into the calorimeter cell containing thesubstrate medium at variable concentrations. A steady state isreached when the enzyme velocity remains constant (Origin 7,OriginLab Corp., USA). Experiments were carried out in duplicate.The heat transferred during the enzyme-catalyzed reaction was di-rectly proportional to the reaction rate and can be described by Eq.(4), where DHapp is the reaction enthalpy variation, V is the calori-metric cell volume and [P] is the product concentration, and dQ/dt represents the heat flow that is proportional to the rate of prod-uct formation (d[P]/dt) [37].
d½P�dt¼ 1
VDHapp
dQdt
ð4Þ
The kinetic parameters (Vmax and KM) were obtained by fittingthe calorimetric data to the Michaelis–Menten equation (Eq. (3))using nonlinear least square regression analysis in the Sigmaplot9.01 software program. The definition for unit of enzyme activitywas the same as for the spectrophotometric assays.
Fluorescence spectroscopy
Data from cross-linking experiments demonstrates that the en-zyme can form dimers, trimers or tetramers in solution in the pres-ence of products. We thus deemed appropriate to try to studywhether or not this equilibrium could be detected by a differentexperimental approach. As the binding of ribose (a common prod-uct of nucleoside hydrolysis) to free MtIAGU-NH causes a quenchin tryptophan fluorescence, fluorescence spectroscopy was em-ployed to study the kinetics of MtIAGU-NH:ribose binary complexformation. Fluorescence titration at varying ribose concentrations(1–56 mM) in a 2 mL solution containing 1 lM MtIAGU-NH in50 mM Tris–HCl pH 7.5 and 50 mM NaCl was carried out at30 �C. Excitation and emission wavelengths were, respectively,280 and 333 nm. Slits for excitation and emission were, respec-tively, 3 and 5 nm. Control measurements were performed underthe same conditions, except that no ligand was added. These valueswere subtracted from those obtained in the presence of enzyme.MtIAGU-NH:ribose binary complex formation was characterizedby a monophasic quench in protein fluorescence. Accordingly, thedata were fitted to a single exponential function, yielding the ob-served rate constants (kobs). The kobs values were fitted as a func-tion of varied substrate concentration (A) to an equationdescribing a hyperbolic decay (Eq. (5)), in which Kd is the intrinsicdissociation constant, and k2 and k-2 are, respectively, limiting for-ward and reverse first-order rate constants for an isomerizationprocess between two forms of free enzyme that must occur beforesubstrate binding [38–41].
kobs ¼k2Kd
Aþ Kd
� �þ k�2 ð5Þ
The overall dissociation constant (KD(overall)) is given by the ratioof the product of the concentrations of all free species to the sum-mation of the concentrations of all complexes [41], as shown in Eq.(6) for the mechanism depicted in Fig. 5A.
KDðoverallÞ ¼ð½E�� þ ½E�Þ½ribose�
½E� � ribose� þ ½E� ribose� ð6Þ
Since the interaction of ribose with the E⁄ isomer of MtIAGU-NHis assumed to be negligible so that [E�ribose]� [E⁄�ribose], Eq.(6) reduces to Eq. (7).
KDðoverallÞ ¼ð½E�� þ ½E�Þ½ribose�½E� ribose� ð7Þ
The equilibrium constant (K2) for the conversion from E⁄ to E,and Kd are defined in Eq. (8) and Eq. (9), respectively
K2 ¼½E�½E�� ¼
k2
k�2ð8Þ
Kd ¼½E�½ribose�½E� ribose� ¼
k�1
k1ð9Þ
Rearranging Eqs. (8) and (9) to give, respectively, [E⁄] = [E]/K2
and [E�ribose] = ([E][ribose])/Kd, and substituting them into Eq.(7), yields an expression for KD(overall) (Eq. (10)) [41].
KDðoverallÞ ¼ Kd1
K2þ 1
� �ð10Þ
Intracellular concentrations in MTB
In order to quantify the intracellular concentration of inosine,uridine, hypoxanthine and uracil in the bacilli, the MTB H37Rv lab-oratory strain was cultured as described by Rodrigues-Junior et al.[42]. Briefly, MTB colonies cultured in Ogawa solid medium were

84 P.L. Wink et al. / Archives of Biochemistry and Biophysics 538 (2013) 80–94
suspended in sterile 0.9% saline solution containing 0.05% Tween-80 (Sigma–Aldrich, Saint Louis, USA). We assessed the number ofviable organisms in an aliquot of this cell suspension by plating se-rial dilutions on Middlebrook 7H10 agar (Difco, Sparks, USA) platescontaining 10% Middlebrook oleic acid–albumin–dextrose–cata-lase (OADC) enrichment (Becton–Dickinson, Frankin Lakes, USA).Plates were incubated at 37 �C for three weeks prior to countingthe number of MTB colony-forming units (CFU). The MTB suspen-sion was autoclaved at 121 �C for 20 min, followed by sonication (3pulses of 10 s, at an amplitude value of 21%), prior to chromato-graphic analysis. An HPLC equipped with a quaternary pump,DAD detector, degasser, column oven and an automatic injectionsystem (all HPLC components and software Chromeleon� fromThermo� Scientific (Sunnyvale, USA) was used in this set of exper-iments). Stock standard solutions (400 lM) of inosine, uridine,hypoxanthine, and uracil were prepared by diluting each standardin ultrapure water. Standard solutions were prepared by dilutingthe stock solution in ultrapure water to give final concentrationsof 0.048, 0.097, 0.195, 0.390, 0.781, 1.562, 3.125, 6.25, and12.50 lM in a final volume of 1.0 mL.
Chromatographic separations were carried out using an RP col-umn (250 mm, 4.6 mm, 5 lm Sephasil peptide ST C-18, GE Health-care� Life Sciences, Pittsburgh, USA) at 20 �C. The mobile phasewas 0.1% glacial acetic acid (Merck�, Darmstadt, Germany) in bot-tle A and a mixture of methanol:water 80:20 (v/v) in bottle B. Aflow rate of 0.5 mL min�1 was employed and a linear gradient upto 100% B was started at 33 min and maintained until 50 min.The column was equilibrated with 100% A for 10 min. The DADdetector was set at 254 nm and a full scan was continuously per-formed with a total run time of 60 min.
Determination of equilibrium constants for MtIAGU-NH
In order to determine reaction spontaneity of MtIAGU-NH, theequilibrium constants (Keq) were identified at the point of equilib-rium between inosine, ribose and hypoxanthine or between uri-dine, ribose and uracil. The Keq was measured at 30 �C in 50 mMTris–HCl pH 7.5 containing 50 mM NaCl by fixing the ratio of[hypoxanthine]/[inosine] or [uracil]/[uridine] at 1 and varying theratio of [ribose]/[water]. The enzyme velocity was determined atvarious [ribose]/[water] ratios with ribose concentration rangingfrom 1 mM to 660 mM. All measurements were performed induplicate. The point at which the curve crosses the abscissa isequal to Keq (no net enzyme reaction). The values of Keq permitto obtain estimates for the standard free energy (DG�) using Eq.(11), in which R is the gas constant (8.324 J K�1 mol�1; or1.987 cal K�1 mol�1) and T is the temperature in Kelvin(T = �C + 273.15).
DG�¼ �RT ln Keq ð11Þ
As intracellular concentrations of uridine, uracil, inosine andhypoxanthine were determined, the free energy of the reaction(DG) could be estimated from Eq. (12), in which DG� is the stan-dard free energy. Assuming dilute solutions, we could tentativelyregard the intracellular water concentration as at a constant valueof 55.5 M ((1000 g L�1)/(18.015 g mol�1)).
DG ¼ DG�þ RT ln
½base�½a-ribose�½nucleoside�½H2O�
� �ð12Þ
Activation energy
The activation energy (Ea) was assessed by measuring the vari-ation of kcat of MtIAGU-NH as a function of temperature. Initialvelocity measurements were thus carried out in the presence of
inosine (6.0 mM), uridine (2.7 mM), adenosine (2.0 mM), and gua-nosine (3.0 mM), at temperatures ranging from 15 to 40 �C (from288.15 to 313.15 K). All assays were performed in duplicate. TheEa was calculated from the slope (Ea/R) of the Arrhenius plot(Fig. 7) fitting the data to Eq. (13), in which R is the gas constant(8.314 J mol�1 K�1) and the constant A represents the product ofthe collision frequency (Z) and a steric factor (p) based on the col-lision theory of enzyme kinetics [43]. It should be pointed out thathere it is assumed a simplistic approach to explain a complex phe-nomenon and that A is independent of temperature.
ln kcat ¼ ln A� Ea
R
� �1T
ð13Þ
The enthalpy (DH#), entropy (DS#), and Gibbs free energy (DG#)of activation were estimated using the following equations derivedfrom the transition state theory of enzymatic reactions [43]:
DH# ¼ Ea � RT ð14Þ
DG# ¼ RT lnkB
hþ ln T � ln kcat
� �ð15Þ
and
DS# ¼ DH# � DG#
Tð16Þ
Energy values are in kJ mol�1, with kcat in s�1, to conform to theunits of the Boltzmann (1.3805 � 10�23 J K�1) and Planck(6.6256 � 10�34 J s�1) constants and R is as for Eq. (13). Errors onDG# were calculated using Eq. (17) [43].
ðDGÞErr ¼RTðkcatÞErr
kcatð17Þ
pH-rate profile
Prior to determining the dependence of the kinetic parameterson pH values, the pH-rate profiles, MtIAGU-NH enzyme stabilitywas assessed over a wide pH range (4.5–10.0) by pre-incubatingthe enzyme for 2 min at 30 �C in 100 mM 2-(N-Morpholino)eth-anesulfonic Acid (MES)/N-2-Hydroxyethylpiperazine-N’-2-ethane-sulfonic Acid (HEPES)/2-(N-Cyclohexylamino)ethanesulfonic Acid(CHES) buffer mixture [44], and monitoring the activity in 50 mMTris–HCl pH 7.5 containing 50 mM NaCl. These pre-incubationexperiments were carried out to identify denaturing values and en-sure enzyme stability over the pH range studied. The pH-rate pro-files were determined by measuring initial velocities in thepresence of varying inosine concentrations (1–200 lM) in100 mM MES/HEPES/CHES buffer mixture over the following pHvalues: 5.5, 6.0, 6.5, 7.0, 7.5, 8.0, 8.5, 9.0, 9.5 [44]. All measurementswere performed in duplicate or triplicate. The pH-rate profile wasgenerated by plotting log(kcat) versus the pH values (from 5.5 to9.5), and data were fitted to Eq. (18), in which y is the apparent ki-netic parameter, C is the pH-independent plateau value of y, H isthe hydrogen ion concentration, and Ka is the apparent acid disso-ciation constant for the ionizing group.
log y ¼ logC
1þ HKa
!ð18Þ
It appears pertinent to point out that the determination of stea-dy-state kinetic parameters, ITC measurements, fluorescence spec-troscopy, determination of equilibrium constants, and activationenergy data acquisition were all carried out at a constant pH value(7.5), in which the kinetic parameters are pH-independent.

P.L. Wink et al. / Archives of Biochemistry and Biophysics 538 (2013) 80–94 85
Multiple sequence alignment
The amino acid sequences of protozoan parasite nucleosidehydrolases (C. fasciculata (U_43371) and L. major (AY_603045.1)),whose three-dimensional structures have previously been solvedor for which mutagenesis studies have been reported to verifyessential residues, were included in the alignment to compare withMtIAGU-NH. Multiple amino acid sequence alignment was per-formed with Clustal W software [45], using the Blossum matrixfor amino acid substitutions and the default parameters to identifyessential residues for nucleoside substrates binding, as well to inferpossible structural similarities.
Fig. 1. SDS–PAGE (12%) analysis for the three chromatographic steps of purificationof recombinant MtIAGU-NH (�33 kDa) that yielded homogeneous protein, Lane 1,Molecular Weight Protein Marker (Fermentas); lane 2, crude extract; lane 3, Q-Sepharose anion exchange column; lane 4, Superdex-200 size exclusion; lane 5,MonoQ High Resolution anion exchange column.
Table 1Purification protocol of recombinant MtIAGU-NH. Typical results of a three-steppurification protocol for 5 g wet cell paste from 0.5 L media.
Step Totalprotein(mg)
Totalactivityª
(U)
Specificactivity(U mg�1)
Purification(fold)
Yield(%)
Crude extract 243.4 5.1 0.02 1 100Q-Sepharose FF 36.2 0.9 0.03 1.19 17.6Superdex 200 3.8 0.3 0.07 3.38 5.9Mono-Q 3.3 0.4 0.12 5.52 7.8
All experiments were performed in duplicate.
Molecular modeling studies
The homology modeling approach, implemented in the MODEL-LER 9v10 program, was used to build a structural model for MtIA-GU-NH [46]. The protocol included the generation of 10 models. Allmodels were submitted to the energy function DOPE evaluationthat is implemented in the MODELLER 9v10 aiming to choose thebest structures. Furthermore, we used the MOLPROBITY webserverPROCHECK [47], ANOLEA [48], VERIFY-3D [49], PROSAII [50] pro-grams to assess stereo chemical quality of the models. Moleculardocking experiments were performed to analyze the binding modeof nucleoside substrates to MtIAGU-NH protein. Ligands, Ca2+, andMtIAGU-NH were prepared using AutoDockTools1.5.2 while dock-ing simulations were performed with AutoDock4.2, allowing ligandflexibility. The validation procedure was made with the crystalstructure of C. fasciculata IU-NH associated with a transition-stateinhibitor (PDB ID: 2MAS). For all simulations the 3-D grid dimen-sion used to define MtIAGU-NH active site and for scoring functionevaluation was 60 � 60 � 60 with spacing of 0.375. The Lamarck-ian Genetic Algorithm was employed as the docking algorithmwith 20 runs and the remaining parameters set to their default val-ues, except for ga_num_evals, which was set to 2,500,00. Intermo-lecular hydrogen bonds were assessed using the program LIGPLOT[51]. All figures were generated using the PyMol program [52].
ª One enzyme unit is defined as the amount of MtIAGU-NH that converts 1 lmol ofuridine to uracil at 30 �C per minute.
Results and discussion
Amplification, cloning, expression, and purification of MTB nucleosidehydrolase (MtIAGU-NH)
The iunH gene was amplified from the MTB genome in the pres-ence of 10% DMSO in the reaction mixture. The DMSO co-solventhelps overcome polymerase extension difficulties that result fromsecondary DNA structures while also enhancing the denaturationof Guanosine–Cytosine-rich DNAs [53], which is consistent withthe 65.6% G + C content of the MTB genome [31]. A PCR amplifica-tion fragment consistent with the expected size for the MTB iunHsequence (927 bp) was detected on agarose gel (data not shown)and the fragment was cloned into pCR-Blunt vector, and subclonedinto pET23a(+) expression vector between the NdeI and BamHIrestriction sites. Accurate construction without mutations wasconfirmed with enzyme restriction analysis and automatic DNA se-quence analysis.
SDS–PAGE analysis showed expression of a protein in the solu-ble fraction with an apparent subunit molecular mass of �33 kDain agreement with the predicted molecular mass of MtIAGU-NH(32,937.5 Da). The heterologous expression in E. coli C41(DE3) hostcells was achieved after 18 h of cell growth upon reaching an OD600
of 0.4–0.6 at 30 �C in Terrific Broth medium with IPTG induction(data not shown). The pET expression system makes use of a
powerful T7 polymerase, under control of the IPTG-inducible la-cUV5 promoter for transcription of genes of interest, which arepositioned downstream of the bacteriophage T7 late promoter[54]. Recombinant MtIAGU-NH was purified to homogeneity(Fig. 1) using a three-step purification protocol that employedstandard anionic exchange and size exclusion columns, with a pro-tein yield of 7.8% (Table 1). Homogeneous enzyme was stored at�80 �C with no loss of activity.
MtIAGU-NH identification by mass spectrometry
The homogeneous recombinant protein, digested with trypsin,was submitted to ESI-MS (analysis as described in the experimen-tal procedures section) and showed identity and integrity of MtIA-GU-NH. 213 spectra were obtained and identified with 19 differentpeptides from the MtIAGU-NH amino acid sequence. These pep-tides covered approximately 52% of the whole sequence and thesubunit molecular mass of MtIAGU-NH was determined as32,839.0 Da (data not shown). The results of mass spectrometryanalysis combined with the amino acid sequencing demonstratedremoval of the N-terminal methionine residue, and that the puri-fied protein was indeed MtIAGU-NH.

Fig. 2. MtIAGU-NH quaternary structure determination by glutaraldehyde cross-linking experiments. Incubation times (numbers in black) are shown at the bottom of eachlane. Lane numbers are shown in white against a solid black background. M: Page Ruler Marker (Fermentas). (A) Apo MtIAGU-NH; (B) MtIAGU-NH incubated with ribose; (C)MtIAGU-NH incubated with hypoxanthine; (D) MtIAGU-NH incubated with adenine; (E) MtIAGU-NH incubated with uracil; (F) MtIAGU-NH incubated with guanine.Formation of dimers, trimers and tetramers can be visualized in (B–F) in addition to monomers that appear in (A).
86 P.L. Wink et al. / Archives of Biochemistry and Biophysics 538 (2013) 80–94
Metal analysis by ICP-OES
Determination of metal concentration and identity by ICP-OESyielded 2.3 ± 0.1 mg L�1 of Ca2+. These results indicate the presenceof one mol of Ca2+ (57.4 lM) per mol of enzyme subunit (60.7 lM),thereby suggesting that MtIAGU-NH is a metalloenzyme.
MtIAGU-NH quaternary structure
A value of 23.8 kDa for the apparent molecular mass of homoge-neous recombinant MtIAGU-NH was estimated by gel filtrationchromatography, fitting the elution volume of the single peak toEq. (1) (data not shown). This result suggests that MtIAGU-NH isa monomer in solution, since ESI-MS analysis suggested a valueof 32,839.0 Da for the subunit molecular mass of the recombinantprotein. The monomeric state of MtIAGU-NH is in contrast tonucleoside hydrolases from other organisms such as C. fasciculataand L. major, which have been demonstrated to be homotetramersin solution [20,27], or Trypanosoma vivax which has been demon-strated to be a homodimer in solution [28].
Cross-linking experiments were pursued to confirm the gel fil-tration chromatography results. The glutaraldehyde cross-linkingresults show that MtIAGU-NH is a monomer in solution, even after60 min of incubation time in the absence of the reaction products
(Fig. 2A). Dimers, trimers and tetramers were visualized on SDS–PAGE gel stained with Coomassie brilliant blue when MtIAGU-NHwas incubated for 20 min in the presence of the reaction productsribose (Fig. 2B), hypoxanthine (Fig. 2C), adenine (Fig. 2D), uracil(Fig. 2E), and guanine (Fig. 2F). Goodey and Benkovic reported thatthe binding of an allosteric effector results in the redistribution ofprotein conformational ensembles and alters the rates of theirinterconversion, thereby modulating the geometry of active andbinding sites [55]. As suggested by the cross-linking results, theprotein oligomeric state appears to be modulated by ribose, hypo-xanthine, adenine, uracil, and guanine products, resultant from thehydrolysis of their corresponding nucleosides catalyzed by MtIA-GU-NH (see next section).
Steady-state kinetic parameters
Saturation curves for MtIAGU-NH specific activity plottedagainst increasing concentrations of inosine (Fig. 3A), adenosine(Fig. 3B), guanosine (Fig. 3C), and uridine (Fig. 3D) were shownto obey distinct functions. Steady-state kinetic parameters are gi-ven in Table 2. Fitting the sigmoidal data for inosine and adenosinesaturation curves to Eq. (2) yielded values of 2.2 mM for K0.5 and0.49 s�1 for kcat for inosine, and 0.70 mM for K0.5 and 0.26 s�1 forkcat for adenosine. These results suggest positive homotropic

Fig. 3. Steady-state kinetic constants for MtIAGU-NH. (A) Varied inosine concentrations; (B) varied adenosine concentrations; (C) varied guanosine concentrations; (D) varieduridine concentration. MtIAGU-NH velocity measurements employed absorbance spectroscopy for inosine, adenosine and guanosine; and ITC for uridine. The inset of D givesthe heat flow as a function of time (lcal s�1) for the hydrolysis of uridine into uracil and ribose. The arrow indicates the time at which the second injection took place (seeexperimental procedures).
P.L. Wink et al. / Archives of Biochemistry and Biophysics 538 (2013) 80–94 87
cooperative kinetics for inosine and adenosine. To the best of ourknowledge sigmoidal profiles for purine and pyrimidine substratesaturation curves have never been observed for NH enzymes pro-duced by parasitic protozoa. It is tempting to suggest that the lim-iting value for the Hill coefficient (n) is 4 as MtIAGU-NH can formtetramers in solution in the presence of hypoxanthine (Fig. 2C) andadenine (Fig. 2D) products. The n values of 2.9 and 3.4 indicatestrong positive homotropic cooperativity for, respectively, inosineand adenosine. Saturation curves for increasing guanosine(Fig. 3C) and uridine (Fig. 3D) concentrations followed hyperbolicMichaelis–Menten kinetics. Values for the steady-state constantswere calculated fitting the data to Eq. (3), yielding KM and kcat val-ues of, respectively, 1.6 mM and 0.96 s�1 for guanosine, and 25 mMand 9.9 s�1 for uridine (Table 2).
As the curve for uridine did not achieve saturation with a con-tinuous spectrophotometric assay, we employed a thermodynamicapproach using ITC to be able to compare the kinetic parameters ofuridine with the other substrates. Downward baseline displace-ment after enzymatic injection indicates an exothermic reaction;the MtIAGU-NH DHapp was�9.5 (±0.4) � 10�4 cal mol�1 for uridinehydrolysis (Fig. 3D – inset). The kinetic parameters obtained by ITCfor the purified MtIAGU-NH enzyme are shown and compared withthe other substrates (inosine, adenosine, and guanosine) in Table 2.ITC is a sensitive technique that directly determines the thermody-namic and kinetic parameters of enzymatic reactions by measuringthe heat absorbed or released during a chemical reaction (binding,dilution, or transformation) [37]. As described by Bianconi, calori-metric enthalpy is the sum of the different heat effects that take
place during a reaction [56]. Other researchers have reported thatcalorimetric and spectrophotometric data agree well [56,57].Accordingly, ITC was employed to compare the kinetic parametersof MtIAGU-NH using uridine as a substrate.
The activity measurements demonstrate that the MTB iunHgene product has broad substrate specificity (Table 2), and wasthus (as pointed out in the Introduction section) designated asMtIAGU-NH enzyme. Interestingly, even though the KM value foruridine is larger than for the other nucleosides tested, its maxi-mum velocity value is also larger. For instance, the specificity con-stant (kcat/KM) value for uridine is approximately 396 M�1 s�1
whereas it is 600 M�1 s�1 for guanosine, suggesting that the appar-ent second-order rate constants for these substrates are somewhatsimilar. Although the specificity constants for inosine and adeno-sine could not be estimated because saturation curves were sig-moidal; the kcat values for inosine, adenosine and guanosine aresimilar, and the K0.5 values for inosine and adenosine are in thesame concentration range of the KM value for guanosine.
Many enzymes that are subject to regulatory control have pro-ven to be oligomeric proteins [58]. Interestingly, gel filtration chro-matography suggested that apo MtIAGU-NH is monomeric insolution, whereas cross-linking results showed that this enzymemight shift to different oligomeric states in the presence of prod-ucts. Unfortunately, cross-linking studies could not be performedin the presence of nucleosides as there would be catalysis in anaqueous solution. It has been shown that polymerization of an en-zyme in the presence of a modifier can provide a mechanism forallosteric behavior [59,60]. Brown and Reichard showed that the

Table 2Kinetic constants for the substrates of MtIAGU-NH.
Substrate K0.5 (mM) na KM
(mM)Vmax
(U mg�1)kcat (s�1)
Inosineb 2.2 ± 0.1 2.9 ± 0.5 – 0.89 ± 0.05 0.49 ± 0.02Adenosineb 0.70 ± 0.03 3.4 ± 0.6 – 0.47 ± 0.02 0.26 ± 0.01Guanosineb – – 1.6 ± 0.3 1.7 ± 0.1 0.96 ± 0.05Uridinec – – 25 ± 3 18.1 ± 0.4 9.9 ± 0.4
All measurements were performed in duplicate.ª n = the Hill coefficient.
b These results were collected by spectrophotometry.c This result was collected by ITC.
88 P.L. Wink et al. / Archives of Biochemistry and Biophysics 538 (2013) 80–94
E. coli ribonucleoside diphosphate reductase complex undergoesaggregation in the presence of the negative modifier dATP [61].Most enzymes showing allosteric behavior (altered activity in thepresence of ligands that bind at a site other than the catalytic cen-ter) are oligomeric, or have such high molecular weights that it isprobable that they are oligomeric. Because of this association ofoligomeric structure with allosteric behavior, allosteric mecha-nisms are usually discussed in terms of interaction between pro-tomers [58].
Fluorescence spectroscopy
The kinetics of binding of ribose to MtIAGU-NH was evaluatedby fluorescence spectroscopy. The change in protein fluorescenceupon ribose binding to MtIAGU-NH was characterized by a mono-phasic quench in tryptophan fluorescence (Fig. 4 – Inset(A)), andthe data were thus fitted to a single exponential function. Thedependence of the apparent rate constants (kobs) on ribose concen-tration showed a hyperbolic decrease (Fig. 4). The dependence ofthe kobs on product concentration can be utilized to infer whetheror not two forms of free enzyme are present in solution. If free en-zyme exists in equilibrium between two forms, E and E⁄, the for-mer interacting significantly with substrate and the latterinteracting negligibly (Fig. 5A), one expects a decrease in the kobs
value as ligand concentration is raised [38–41]. On the other hand,if there is one form of free enzyme in solution (Fig. 5B), increasing
Fig. 4. Kinetics of MtIAGU-NH-ribose binary complex formation, showing the dependencerepresentative curve for the monophasic quench in protein fluorescence upon ribose (7.4amplitude of fluorescence signals as a function of ribose concentrations.
substrate levels are accompanied by a hyperbolic increase in thevalue of kobs [38–41]. The binding kinetics data for MtIAGU-NH:ri-bose binary complex formation is consistent with the mechanismdepicted in Fig. 5A, which is described by the concerted mecha-nism of symmetry model proposed by Monod et al., that predictstwo free MtIAGU-NH isomers in equilibrium, E and E⁄, with prod-uct (ribose) binding effectively to E and negligibly to E⁄ [62]. In thismechanism, isomerization is thought to be slower than the bindingsteps. This model predicts that the rate constant of association ofribose to MtIAGU-NH is limited by the first-order isomerizationrate constant (k2) from E⁄ to E as ribose concentration approachesinfinity, because only E binds substrate considerably. Data fitting toEq. (5) yielded values for k2, k-2 (the rate constant for the isomeri-zation from E to E⁄ in Fig. 5A), and Kd (Table 3).
Analysis of the proposed model for ribose binding to MtIAGU-NH (Fig. 5) allows evaluation of the overall dissociation constant(KD(overall)) for the MtIAGU-NH:ribose binary complex formation,which provides information on possible additional steps in thebinding sequence. A value of KD(overall) = 2.2 mM was obtainedusing Eq. (10). Fluorescence spectroscopy measurements couldnot be carried out for the products hypoxanthine or uracil due tothe fact that, different from ribose, they absorb in the wavelengthsused to assess MtIAGU-NH fluorescence, resulting in inner-filter ef-fects that precluded reliable data collection. It is tempting to sug-gest that the E�¡E equilibrium prior to ribose binding may bereporting on the different oligomeric states of MtIAGU-NH demon-strated by the glutaraldehyde cross-linking results (Fig. 2B). How-ever, whether or not the pre-existing equilibrium process ofdifferent oligomeric forms of MtIAGU-NH in solution can be as-cribed to an equilibrium between less active or more active of en-zymes needs more experimental evidence. The amplitude of thespectroscopic signals of the monophasic quench in protein fluores-cence plotted against ribose concentrations showed a hyperbolicincrease (Fig. 4 – Inset(B)). Fitting the amplitude data to a hyper-bolic equation yielded a value for the dissociation constant of10 ± 2 mM. As this value is somewhat larger than KD(overall)
(2.2 mM), additional step(s) that was(were) not taken into accountin the simple model given in Fig. 5A may have to be considered.However, it appears not to be warranted to put forward any morecomplex model based on the experimental results presented.
of the observed association rate constant on ribose concentration. Inset (A) shows amM) binding to MtIAGU-NH (1 lM). Inset (B) shows the hyperbolic increase of the

Fig. 5. Two possible allosteric mechanisms. (A) The symmetry or concerted modewith two forms of free enzyme at equilibrium in solution. (B) The sequentialinduced-fit model, with only one form of free enzyme and a slow isomerizationthe enzyme-ligand binary complex.
Table 3Rate and equilibrium parameters of MtIAGU-NH:ribosebinary complex formation.
Parametera Value ± standard error
Kd 1.7 ± 0.4 mMb
k2 5.2 (±0.5) � 10�3 sb
k�2 1.40 (± 0.08) � 10�3 sb
KD(overall) 2.2 ± 0.1 mMc
K2 3.7 ± 0.4d
a All parameters are derived from the kinetics of ribosebinding to MtIAGU-NH.
b Fitting observed association rate constants to Eq. (5).c Calculated by Eq. (10).d Obtained from Eq. (8).
Table 4Intracellular concentrations of substrates and products of the MtIAGU-NH-catalyzedreaction in MTB bacilli.
Minimumconcentration (mM)
Maximumconcentration (mM)
Substrates Inosine 17.8 ± 0.3 285 ± 5Uridine 196 ± 39 3134 ± 618
Products Hypoxanthine 27.5 ± 0.5 440 ± 8Uracil 19.6 ± 0.1 313 ± 2
All measurements were performed in triplicate.
P.L. Wink et al. / Archives of Biochemistry and Biophysics 538 (2013) 80–94 89
l,orof
Accordingly, further approaches will have to be pursued to ascer-tain whether or not there is(are) additional step(s) to be includedin the minimal model given in Fig. 5A.
Intracellular concentrations in MTB
The intracellular concentrations of inosine, uridine, hypoxan-thine, and uracil in MTB bacilli were determined by HPLC priorto determining equilibrium constants for MtIAGU-NH. Accordingto the standard curves, retention times for inosine, uridine, hypo-xanthine, and uracil were 42.90, 33.40, 24.52, and 13.18 min,respectively (data not shown). The intracellular concentrations ofinosine, hypoxanthine, uridine and uracil are given in Table 4. Itshould be pointed out that we have assumed that each cell volumecould be represented by a cylinder (V = pr2h, in which ‘‘r’’ repre-sents the radius and ‘‘h’’ the length). These values were consideredto be in the range 0.3–0.6 lm for diameter and 1–4 lm for length[1]. The lowest values were employed to estimate the maximumconcentrations and the largest ones to estimate the minimum con-centrations (Table 4).
Determination of MtIAGU-NH equilibrium constants
The ratio of [hypoxanthine]/[inosine] or [uracil]/[uridine] wasfixed at 1, and the ratio of [ribose]/[water] was varied from1.8 � 10�5 to 1.2 � 10�2 for the reaction with the purine or1.8 � 10�5 to 6 � 10�3 for the reaction with the pyrimidine todetermine MtIAGU-NH equilibrium constants. Hydrolytic reactionsare regarded as experimentally irreversible because of the ratherlarge concentration of water in comparison to other reactants. Plot-ting the MtIAGU-NH enzyme activity as a function of [ribose]/[water] ratio gives a straight line (Fig. 6), in which the point atwhich this line crosses the abscissa (no enzyme activity) gives anestimate for the equilibrium constant. This analysis yielded valuesof 0.0076 for Keq of inosine (Fig. 6A) and 0.0037 for Keq of uridine(Fig. 6B). The standard free energy (DG�) can thus be calculatedby Eq. (11).This analysis gives values at 30 �C (303.15 K) for DG�of 12.3 kJ mol�1 (2.94 kcal mol�1) for inosine and 14.1 kJ mol�1
(3.37 kcal mol�1) for uridine, which suggests that both reactionsare not spontaneous. If we take into account the intracellular con-centrations of inosine and uridine substrates and the reactionproducts (hypoxanthine and uracil) found in the HPLC quantifica-tion in MTB bacilli, we can employ Eq. (12) to obtain estimatesfor free energy of the reaction (DG). The intracellular concentrationof uridine is approximately 10-fold larger than the concentration ofuracil (Table 4). The concentration of inosine is slightly lower thanthe concentration of hypoxanthine (Table 4). We have been unableto both determine the MTB intracellular concentration of a-riboseand find a value for its concentration in the literature we searched.Notwithstanding, a minimum intracellular concentration for a-ri-bose needed to make the process favorable (DG < 0) can be esti-mated. The intracellular concentration of a-ribose should besmaller than approximately 270 mM for inosine hydrolysis andthan 2 M for uridine hydrolysis. Accordingly, it appears to be rea-sonable to conclude that these processes are likely favorable inthe intracellular milieu of MTB bacilli. There are, however, otherMTB enzymes that catalyze reactions that could provide free basesand nucleosides. For instance, purine nucleoside phosphorylase(PNP) is involved in the metabolism of both purine and pyrimidine[63]. PNP catalyzes the reversible phosphorolysis of the N-glyco-sidic bond of a-purine (deoxy)ribonucleosides to generate ß-(deoxy)ribose 1-phosphate and the corresponding purine bases[64,65]. The PNP from MTB has been shown to be more specificto natural 6-oxopurine nucleosides and synthetic compounds,and does not catalyze the phosphorolysis of adenosine [66].
Activation energy
We assessed the activation energy for the enzyme-catalyzedchemical reaction by measuring the dependence of kcat on temper-ature for four substrates (Fig. 7). The activation energies of MtIA-GU-NH reactions were calculated by determining the slope (�Ea/R) of the Arrhenius plots. The thermodynamic activation parame-ters evaluated using Eqs. (13)–(17) are given in Table 5.
The Ea values for inosine, adenosine, guanosine and uridine (Ta-ble 5) represent the minimum amount of energy necessary to ini-tiate the MtIAGU-NH-catalyzed chemical reaction. It should,however, be pointed out that larger concentrations of uridine couldnot be employed in the enzyme assay due to its large KM value(25 mM) and limited solubility in aqueous solutions. The Ea valuesfor adenosine and guanosine are somewhat larger than for inosineand uridine (Table 5), suggesting lower activation energy for theformer substrates. The values of free activation energy (DG#) rep-resent the energy barrier required for reactions to occur. The DG#
values can also be regarded as the variation of the Gibbs energy be-tween the activated enzyme:substrate(s) activated complex andenzyme:substrate(s) in the ground state. No differences in DG#
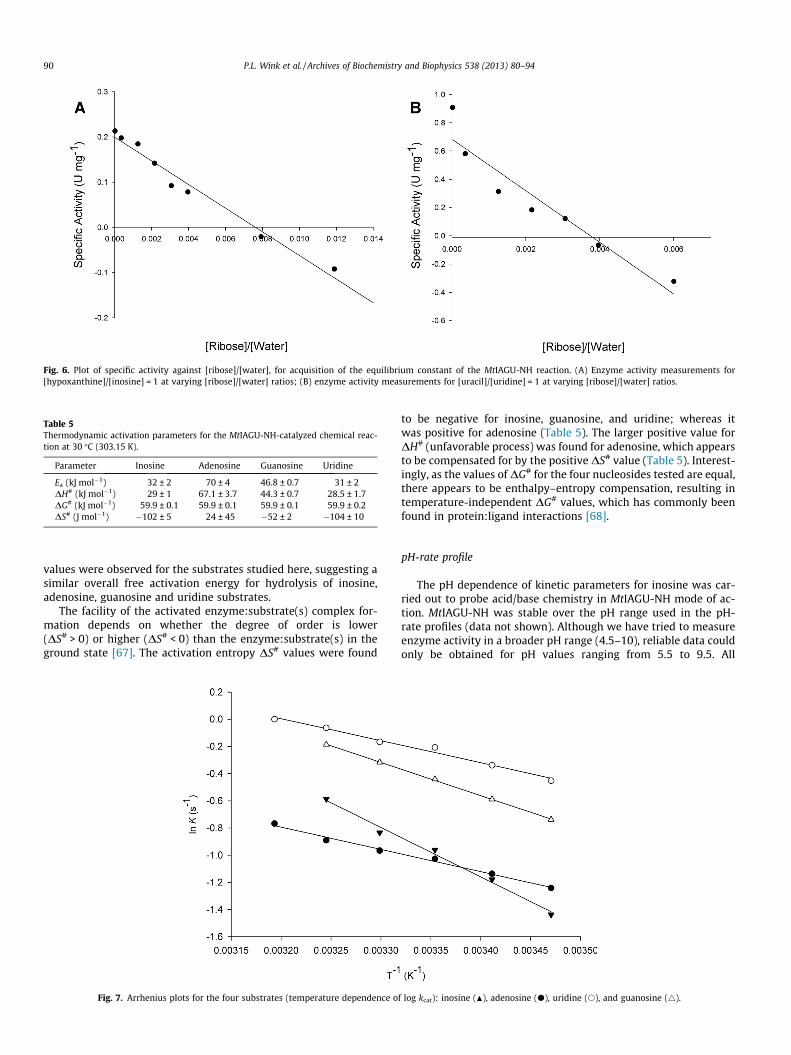
Fig. 6. Plot of specific activity against [ribose]/[water], for acquisition of the equilibrium constant of the MtIAGU-NH reaction. (A) Enzyme activity measurements for[hypoxanthine]/[inosine] = 1 at varying [ribose]/[water] ratios; (B) enzyme activity measurements for [uracil]/[uridine] = 1 at varying [ribose]/[water] ratios.
Table 5Thermodynamic activation parameters for the MtIAGU-NH-catalyzed chemical reac-tion at 30 �C (303.15 K).
Parameter Inosine Adenosine Guanosine Uridine
Ea (kJ mol�1) 32 ± 2 70 ± 4 46.8 ± 0.7 31 ± 2DH# (kJ mol�1) 29 ± 1 67.1 ± 3.7 44.3 ± 0.7 28.5 ± 1.7DG# (kJ mol�1) 59.9 ± 0.1 59.9 ± 0.1 59.9 ± 0.1 59.9 ± 0.2DS# (J mol�1) �102 ± 5 24 ± 45 �52 ± 2 �104 ± 10
90 P.L. Wink et al. / Archives of Biochemistry and Biophysics 538 (2013) 80–94
values were observed for the substrates studied here, suggesting asimilar overall free activation energy for hydrolysis of inosine,adenosine, guanosine and uridine substrates.
The facility of the activated enzyme:substrate(s) complex for-mation depends on whether the degree of order is lower(DS# > 0) or higher (DS# < 0) than the enzyme:substrate(s) in theground state [67]. The activation entropy DS# values were found
Fig. 7. Arrhenius plots for the four substrates (temperature dependence o
to be negative for inosine, guanosine, and uridine; whereas itwas positive for adenosine (Table 5). The larger positive value forDH# (unfavorable process) was found for adenosine, which appearsto be compensated for by the positive DS# value (Table 5). Interest-ingly, as the values of DG# for the four nucleosides tested are equal,there appears to be enthalpy–entropy compensation, resulting intemperature-independent DG# values, which has commonly beenfound in protein:ligand interactions [68].
pH-rate profile
The pH dependence of kinetic parameters for inosine was car-ried out to probe acid/base chemistry in MtIAGU-NH mode of ac-tion. MtIAGU-NH was stable over the pH range used in the pH-rate profiles (data not shown). Although we have tried to measureenzyme activity in a broader pH range (4.5–10), reliable data couldonly be obtained for pH values ranging from 5.5 to 9.5. All
f log kcat): inosine (N), adenosine (d), uridine (s), and guanosine (4).

Fig. 8. The pH dependence data of log kcat for inosine hydrolysis were fitted to Eq. (17), yielding a pKa value of 5.7.
P.L. Wink et al. / Archives of Biochemistry and Biophysics 538 (2013) 80–94 91
saturation curves in the latter pH range were sigmoidal. The pHdependence of kcat is concerned with the chemical step and its va-lue follows the pKa of groups that play critical roles in catalysis. ThepH-rate data of kcat for inosine hydrolysis showed a profile of acurve with slope of 1 that goes to a slope of zero as a function ofincreasing pH values (Fig. 8). Fitting the pH-rate data to Eq. (18)yielded a value of 5.7 (±0.4) for pKa. However, as no reliable datacould be collected below pH 5.5, only a rough estimate of theapparent pKa value on the acidic limb could be obtained. Notwith-standing, the pH-rate data suggest that protonation of a group withpKa value of approximately 5.7 prevents catalysis. In addition, sinceinosine has no ionizable groups over this pH range, this pKa valuerepresents an ionizable group on the enzyme that is involved incatalysis.
It has been suggested that a histidine residue (His241) is essen-tial for activity of inosine–uridine-preferring nucleoside hydrolase
Fig. 9. Sequence alignment of nucleoside hydrolases from M. tuberculosis (Mtb), C. fascinvolved in the ribose binding mode are indicated by black solid circles (d). Amino acidsrole in nucleoside hydrolase catalysis is indicated by a black solid cross (+). Overall iden(64.18% similarity), and from M. tuberculosis and L. major is 28.04% (61.99% similarity).
(IU-NH) from C. fasciculata[18]. The His241Ala mutation caused a2100-fold loss in kcat for inosine and this residue was proposedto act as a proton donor for leaving group activation in C. fasciculataIU-NH catalysis [18]. The values for K0.5 (substrate concentration inwhich v = 0.5Vmax) and n (Hill coefficient) showed no obvioustrends in pH-dependence plots of MtIAGU-NH enzyme activity(data not shown). These results are in agreement with the role ofHis241 of C. fasciculata IU-NH as being only in catalysis and notsubstrate binding [18]. In addition, sequence alignment shows thatthe His241 of C. fasciculata IU-NH is conserved in both L. major IU-NH and MtIAGU-NH (Fig. 9). On the other hand, it has been pro-posed for the inosine–adenosine–guanosine-preferring nucleosidehydrolase (IAG-NH) from T. vivax that Asp10 is the general basein the reaction mechanism that abstracts a proton from a nucleo-philic water molecule [27]. Moreover, the data for C. fasciculataIU-NH showed a bell-shaped pH profile (range: 5.6–10.5) for
iculata (Cfa), and L. major (Lma). The family signature is highlighted. Amino acidsinvolved in substrate recognition are shaded. The conserved His residue that plays atity between nucleoside hydrolases from M. tuberculosis and C. fasciculata is 28.35%,

Table 6Intermolecular contacts for MtIAGU-NH:nucleoside binary complexes.
Dockings Hydrogenbonds
Electrostaticinteractions
Hydrophobic interactions
Adenosine Glu160 Asp13 Asp14, Asn38, His77, Phe80, His81,Met149, Gln156, Trp161, Asn162,Tyr225, His241, Asp242
Guanosine Asp13,Asn38His77
Glu160 Asp14, Phe80, His81, Thr123,Met149, Gln156, Trp161, Asn162,Tyr225, Asp242
Inosine Asn38,Gln156,Asn162
Glu160,Trp161
His77, Phe80, His81, Met149,Leu189
Uridine Glu160,Tyr225
Asp13, Asn38, His77, Phe80, His81,Met149, Gln156, Asn162, His229,His241
92 P.L. Wink et al. / Archives of Biochemistry and Biophysics 538 (2013) 80–94
inosine, describing two essential groups necessary for catalysis,during which the enzyme requires one group to be deprotonated(pK 7.1) and one group to be protonated (pK 9.1) [25]. Accordingly,site-directed mutagenesis should be carried out to ascertainwhether the His241 plays any role in MtIAGU-NH catalysis, andthe possibility that groups with larger pKa values may play any rolein either catalysis or substrate binding.
Homology modeling
A structural model for the 308-amino-acid polypeptide chain ofMtIAGU-NH was built to try to provide support for the probableinvolvement of amino acid residues in the enzyme’s mode of ac-tion. Alignment was performed to evaluate protein similarities,identify enzyme signature and search for appropriate templatesusing the PROSITE web server [69]. Sequence alignment data(Fig. 9) suggested that C. fasciculata IU-NH (PDB ID: 2MAS) [70] isan appropriate template for molecular modeling studies.
The topology of MtIAGU-NH is similar to C. fasciculata IU-NH[26]. MtIAGU-NH has 12 a-helices (a1 (Ile12-Ala23), a2(Val41-Cys55), a3 (Lys79-His81), a4 (Ala103-Ser113), a5(Thr127-Arg134), a6 (Ala138-Leu142), a7 (Trp161-Arg164), a8(Glu168-Thr175), a9 (Leu189-Arg193), a10 (Pro199-Ser207), a11
Fig. 10. Molecular model for MtIAGU-NH associated with nucleosides. (A) MtIAGUNH:guanosine. The a-helices are colored in light green and b-sheets in light blue. Theseatom (carbon = yellow, nitrogen = blue, oxygen = red and hydrogen = white) and repreinteractions are illustrated as sticks and colored by atom (carbon = grey, nitrogen = blue,generated with PyMol [52].
(Arg216-Ala231), a12 (Asp242-Met250), and a13 (Pro290-Phe304), in addition to nine b-strands (b1 (Asp26-Thr35), b2(Pro61-Gly65), b3 (Gly120-Val122), b4 (Leu146-Gly150), b5(Gln182-Val186), b6 (Leu254-Arg258), b7 (Thr261-Asp265), b8(Ala269-Asp273) and b9 (Arg283-Asp289). MtIAGU-NH subunit isfolded into a single-domain globular structure that can be dividedinto three regions (see Graphical Abstract) as has been suggestedfor C. fasciculata IU-NH [26]. The first consists of an a,b core com-prising segments b1–b6, a1–a6, b7 and a10. The second is a lobeconsisting of the four a-helices (a7–a9 and a11) that appears tohave a purely structural function, shielding the hydrophobic resi-dues of the core domain from the solvent. The third region consistsof two short segments of b structure, strands b8 and b9, and formsthe subunit–subunit interface [26].
Molecular docking experiments
To compare differences in the binding of substrates to MtIAGU-NH, the patterns of hydrogen bonds, and electrostatic and hydro-phobic interactions were studied. Table 6 gives a summary of inter-actions for binary complexes formed between MtIAGU-NH andadenosine, guanosine, inosine and uridine.
Most of the hydrogen bonds and electrostatic interactions forMtIAGU-NH:nucleoside binary complexes involve the ribose moi-ety of substrates, which is more buried into the enzyme’s activesite than the base moiety (Fig. 10). A similar binding pattern wasobserved when comparing the amino acid residues involved inthe ribose binding mode in MtIAGU-NH (Asp13, Asn38, Glu160,Asn162) with nucleoside hydrolases of different organisms. Thissuggests that molecular dockings experiments reproduced the cor-rect binding mode of the ribose moiety of nucleosides. The analysisof base portion for each substrate molecule revealed some differ-ences. Contrary to the ribose portion, adenine makes no hydrogenbonds contacts with MtIAGU-NH amino acids (>3.5 Å). On the otherhand, hydrophobic contacts could be observed for adenine (Phe80,Trp161, Tyr225). Guanine makes one hydrogen bond (Asp13).Hypoxanthine makes two hydrogen bonds with Gln156 andAsn162. Uracil makes two hydrogen bonds with Glu160 andTyr225 (Fig. 10).
-NH:adenosine; (B) MtIAGU-NH:uridine (C) MtIAGU-NH:inosine; (D) MtIAGU-secondary structures are represented as ribbon diagrams. All ligands are colored bysented as sticks. The residues that are making hydrogen bonds or electrostaticoxygen = red and hydrogen = white). Calcium ion is shown as a green sphere. Image
P.L. Wink et al. / Archives of Biochemistry and Biophysics 538 (2013) 80–94 93
Conclusion
The complete genome sequencing of MTB H37Rv strain hasaccelerated the study and validation of molecular targets aimedat the rational design of anti-TB drugs [9]. Target-based rationaldesign of new agents with anti-TB activity includes a thoroughanalysis of functional and structural components of MTB enzymes.Enzyme inhibitors make up roughly 25% of the drugs marketed inUnited States [71]. Enzymes catalyze multistep chemical reactionsto achieve rate accelerations by stabilization of transition statestructure(s) [72]. Accordingly, mechanistic analysis should alwaysbe a top priority for enzyme-targeted drug programs aiming at therational design of potent enzyme inhibitors. Moreover, the recogni-tion of the limitations of high-throughput screening approaches inthe discovery of candidate drugs has rekindled interest in rationaldesign methods [73]. However, the first step to validate enzymetargets must include experimental data demonstrating that thegene predicted by in silico analysis to encode a particular proteincatalyzes the proposed chemical reaction.
Although our understanding of purine metabolism in MTB isstill incomplete, it is known that this bacterium expresses all en-zymes for the de novo synthesis of purine nucleotides [10]. Accord-ingly, MTB is not a purine auxotroph [74]. However, little is knownabout the nutritional adaptability of MTB in the course of TB infec-tion [75]. Whether MTB relies on complex nutrient molecules up-take from host (salvage pathways) or on synthesis of essentialmolecules from simple and passive diffusible precursors (de novosynthesis pathways) is still not clear. The de novo synthesis is ahigh-energy demanding process. Whether MTB will sway betweende novo or salvage pathways is an unanswered question. However,it is tempting to suggest that the ability of MTB of scavenging freeextracellular nitrogenous bases via the salvage pathway is likely toplay a role in survival under conditions of low energy availability,rapid multiplication, or nutrient starvation to maintain the nucle-otide pool [76]. Attempts to ascertain the role of MtIAGU-NH inMTB survival in vivo during both active and latent TB should how-ever be pursued to provide a solid experimental basis for its role.Interestingly, the broad substrate specificity of MtIAGU-NH maypoint to a pivotal metabolic role in MTB. It has been pointed outthat inhibitors of the enzymes that disrupt the purine salvage path-way would be expected to be toxic to latent MTB [10]. At any rate,a combination of inhibitors of enzymes of both de novo synthesisand salvage pathways are more likely to be effective against activeand latent TB infection.
Understanding the mode of action of MtIAGU-NH will inform uson how to better design inhibitors targeting this enzyme. In addi-tion, understanding the mode of action of an enzyme can be usedto inform functional annotation of newly determined sequencesand structures, to select appropriate enzyme scaffolds for engi-neering new functions, and to refine definitions in the current ECclassifications [77]. Bacterial nucleoside hydrolases have been pro-posed to be attractive drug targets because they are not present inhumans, which rely on a different set of enzymatic reactions tosupply their nucleoside requirements. Accordingly, the results herepresented may contribute to both function-based drug design andfunctional genomic efforts. The results here presented may alsohelp chemical biologists to design function-based chemical com-pounds to carry out either loss-of-function (inhibitors) or gain-of-function (activators) experiments to reveal the biological roleof MtIAGU-NH in the context of whole MTB cells [78].
Acknowledgments
This work was supported by funds awarded by Decit/SCTIE/MS-MCT-CNPq-FNDCT-CAPES to National Institute of Science and
Technology on Tuberculosis (INCT-TB) to D.S.S. and L.A.B. L.A.B.and D.S.S. also acknowledge financial support awarded by FA-PERGS-CNPq-PRONEX-2009. L.A.B. (CNPq, 520182/99-5), O.N.S(CNPq, 559917/2010-4) and D.S.S. (CNPq, 304051/1975-06) are Re-search Career Awardees of the National Research Council of Brazil(CNPq). P.L.W., L.A.R, V.S.R.J, and T.L.P. acknowledge scholarshipsawarded by CNPq. Z.A.S.Q., G.O.P, and L.F.S.M.T. acknowledgescholarships awarded by CAPES.
References
[1] R.G. Ducati, A. Ruffino-Netto, L.A. Basso, D.S. Santos, Mem. Inst. Oswaldo Cruz101 (2006) 697–714.
[2] C.J.L. Murray, T. Vos, R. Lozano, M. Naghavi, A.D. Flaxman, et al., Lancet 380(2012) 2197–2223.
[3] World Health Organization, Global Tuberculosis Report 2012, WHO Press,Geneva, 2012.
[4] W.J. Burman, Clin. Infect. Dis. 50 (2010) S165–S172.[5] B.B. Trunz, P. Fine, C. Dye, Lancet 367 (2006) 1173–1180.[6] S.H. Kaufmann, G. Hussey, P.H. Lambert, Lancet 375 (2010) 2110–2119.[7] R.G. Ducati, L.A. Basso, D.S. Santos, Curr. Drug Targets 8 (2007) 423–435.[8] K.A. Kantardjieff, C. Vasquez, P. Castro, N.M. Warfel, B.S. Rho, T. Lekin, C.Y. Kim,
B.W. Segelke, T.C. Terwilliger, B. Rupp, Acta Crystallogr., D 61 (2005) 355–364.[9] S.T. Cole, R. Brosch, J. Parkhill, T. Garnier, C. Churcher, D. Harris, S.V. Gordon, K.
Eiglmeier, S. Gas, C.E. Barry, F. Tekaia, K. Badcock, D. Basham, D. Brown, T.Chillingworth, R. Connor, R. Davies, K. Devlin, T. Feltwell, S. Gentles, N. Hamlin,S. Holroyd, T. Hornsby, K. Jagels, A. Krogh, J. McLean, S. Moule, L. Murphy, K.Oliver, J. Osborne, M.A. Quail, M.A. Rajandream, J. Rogers, S. Rutter, K. Seeger, J.Skelton, R. Squares, S. Squares, J.E. Sulston, K. Taylor, S. Whitehead, B.G. Barrell,Nature 393 (1998) 537–544.
[10] W.B. Parker, M.C. Long, Curr. Pharm. Des. 13 (2007) 599–608.[11] W. Versées, J. Steyaert, Curr. Opin. Struct. Biol. 13 (2003) 731–738.[12] Y. Takagi, B.L. Horecker, J. Biol. Chem. 225 (1957) 77–86.[13] M. Terada, M. Tatibana, O. Hayaishi, J. Biol. Chem. 242 (1967) 5578–5585.[14] J. Ogawa, S. Takeda, S.X. Xie, H. Hatanaka, T. Ashikari, T. Amachi, S. Shimizu,
Appl. Environ. Microbiol. 67 (2001) 1783–1787.[15] C. Petersen, L.B. Møller, J. Biol. Chem. 276 (2001) 884–894.[16] D.W. Parkin, B.A. Horenstein, D.R. Abdulah, B. Estupiñán, V.L. Schramm, J. Biol.
Chem. 266 (1991) 20658–20665.[17] B. Estupiñán, V.L. Schramm, J. Biol. Chem. 269 (1994) 23068–23073.[18] D.N. Gopaul, S.L. Meyer, M. Degano, J.C. Sacchettini, V.L. Schramm,
Biochemistry 35 (1996) 5963–5970.[19] R. Pellé, V.L. Schramm, D.W. Parkin, J. Biol. Chem. 273 (1998) 2118–2126.[20] W. Shi, V.L. Schramm, S.C. Almo, J. Biol. Chem. 274 (1999) 21114–21120.[21] J.E. Kurtz, F. Exinger, P. Erbs, R. Jund, Curr. Genet. 41 (2002) 132–141.[22] L. Cui, G.R. Rajasekariah, S.K. Martin, Gene 280 (2001) 153–162.[23] J.M. Ribeiro, J.G. Valenzuela, Insect Biochem. Mol. Biol. 33 (2003) 13–22.[24] W. Versées, E. Van Holsbeke, S. De Vos, K. Decanniere, I. Zegers, J. Steyaert, Acta
Crystallogr., D 59 (2003) 1087–1089.[25] D.W. Parkin, V.L. Schramm, Biochemistry 34 (1995) 13961–13966.[26] M. Degano, D.N. Gopaul, G. Scapin, V.L. Schramm, J.C. Sacchettini, Biochemistry
35 (1996) 5971–5980.[27] W. Versées, K. Decanniere, R. Pellé, J. Depoorter, E. Brosens, D.W. Parkin, J.
Steyaert, J. Mol. Biol. 307 (2001) 1363–1379.[28] D.W. Parkin, J. Biol. Chem. 271 (1996) 21713–21719.[29] R. Mitterbauer, T. Karl, G. Adam, Appl. Environ. Microbiol. 68 (2002) 1336–
1343.[30] C.M. Sassetti, D.H. Boyd, E.J. Rubin, Mol. Microbiol. 48 (2003) 77–84.[31] J.E. Griffin, J.D. Gawronski, M.A. DeJesus, T.R. Ioerger, B.J. Akerley, C.M. Sassetti,
PLoS Pathog. 7 (2011) e1002251.[32] U.K. Laemmli, Nature 227 (1970) 680–685.[33] M.M. Bradford, R.A. Mcroire, W.L. Williams, Anal. Biochem. 72 (1976) 248–
254.[34] V.E. Fadouloglou, M. Kokkinidis, N.M. Glykos, Anal. Biochem. 373 (2008) 404–
406.[35] I. Segel, Enzyme Kinetics, Behavior and Analysis of Rapid Equilibrium and
Steady-state Enzyme Systems, John Wiley and Sons, Inc., New York, 1975.[36] R.A. Copeland, Evaluation of Enzyme Inhibitors in Drug Discovery, John Wiley
and Sons, Inc., New Jersey, 2005.[37] M.L. Bianconi, Biophys. Chem. 126 (2007) 59–64.[38] K. Hiromi, Kinetics of Fast Enzyme Reactions: Theory and Practice, Halsted
Press, New York, 1979. pp. 1–19.[39] H. Nakatani, K. Hiromi, J. Biochem. 87 (1980) 1805–1810.[40] R.R. Lobb, D.S. Auld, Experientia 40 (1984) 1197–1206.[41] R.G. Silva, L.A. Rosado, D.S. Santos, L.A. Basso, Arch. Biochem. Biophys. 471
(2008) 1–10.[42] V.S. Rodrigues-Junior, A. Santos Junior, A.J. Santos, C.Z. Schneider, J.B. Calixto,
E.H.S. Sousa, L.G.F. Lopes, A.A. Souto, L.A. Basso, D.S. Santos, M.M. Campos, Int.J. Antimicrob. Agents 40 (2012) 182–185.
[43] T. Lonhienne, E. Baise, G. Feller, V. Bouriotis, C. Gerday, Biochim. Biophys. Acta1545 (2001) 349–356.
[44] P.F. Cook, W.W. Cleland, Enzyme Kinetics and Mechanism, Garland SciencePublishing, New York, 2007. pp. 253–323.

94 P.L. Wink et al. / Archives of Biochemistry and Biophysics 538 (2013) 80–94
[45] C. Combet, C. Blanchet, C. Geourjon, G. Deléage, Trends Biochem. Sci. 25 (2000)147–150.
[46] A. Sali, T.L. Blundell, J. Mol. Biol. 234 (1993) 779–815.[47] R.A. Laskowski, M.W. Macarthur, D.S. Moss, J.M. Thornton, J. Appl. Crystallogr.
26 (1993) 283–291.[48] F. Melo, E. Feytmans, J. Mol. Biol. 277 (1998) 1141–1152.[49] R. Luthy, J.U. Bowie, D. Eisenberg, Nature 356 (1992) 83–85.[50] M. Wiederstein, M.J. Sippl, Nucleic Acids Res. 35 (2007) W407–410.[51] A.C. Wallace, R.A. Laskowski, J.M. Thornton, Protein Eng. 8 (1995) 127–134.[52] W.L. DeLano, DeLano Scientific, San Carlos, CA, USA, 2002. <http://
www.pymol.org>.[53] P.R. Winship, Nucleic Acids Res. 17 (1989) 1266.[54] K.C. Kelley, K.J. Huestis, D.A. Austen, C.T. Sanderson, M.A. Donohue, S.K. Stickel,
E.S. Kawasaki, M.S. Osburne, Gene 156 (1995) 33–36.[55] N.M. Goodey, S.J. Benkovic, Nat. Chem. Biol. 4 (2008) 474–482.[56] M.L. Bianconi, J. Biol. Chem. 278 (2003) 18709–18713.[57] M.J. Todd, J. Gomez, Anal. Biochem. 296 (2001) 179–187.[58] R.L. Blakley, M. Schrock, K. Sommer, P.F. Nixon, Ann. N. Y. Acad. Sci. 186 (1971)
119–130.[59] C. Frieden, J. Biol. Chem. 242 (1967) 4045–4052.[60] L.W. Nichol, W.J. Jackson, D.J. Winzor, Biochemistry 6 (1967) 2449–2456.[61] N.C. Brown, P. Reichard, J. Mol. Biol. 46 (1969) 39–55.[62] J. Monod, J. Wyman, J.P. Changeux, J. Mol. Biol. 12 (1965) 88–118.[63] L. Mascia, M. Cappiello, S. Cherri, P.L. Ipata, Biochim. Biophys. Acta 1474 (2000)
70–74.
[64] H.M. Kalckar, J. Biol. Chem. 167 (1947) 429–443.[65] D.J. Porter, J. Biol. Chem. 267 (1992) 7342–7351.[66] R.G. Ducati, D.S. Santos, L.A. Basso, Arch. Biochem. Biophys. 486 (2009) 155–
164.[67] T. Lonhienne, C. Gerday, G. Feller, Biochim. Biophys. Acta 1543 (2000)
1–10.[68] T.S.G. Olsson, J.E. Ladbury, W.R. Pitt, M.A. Williams, Protein Sci. 20 (2011)
1607–1618.[69] C.J.A. Sigrist, L. Cerutti, N. Hulo, A. Gattiker, L. Falquet, M. Pagni, A. Bairoch, P.
Bucher, Brief Bioinformatics 3 (2002) 265–274.[70] M. Degano, S.C. Almo, J.C. Sacchettini, V.L. Schramm, Biochemistry 37 (1998)
6277–6285.[71] J.G. Robertson, Biochemistry 44 (2005) 5561–5571.[72] J.G. Robertson, Curr. Opin. Struct. Biol. 17 (2007) 674–679.[73] J.E. Ladbury, G.K. Klebe, E. Freire, Nat. Rev. Drug Discov. 9 (2010) 23–27.[74] H.I. Boshoff, X. Xu, K. Tahlan, C.S. Dowd, K. Pethe, L.R. Camacho, T.H. Park, C.S.
Yun, D. Schnappinger, S. Ehrt, K.J. Williams, C.E. Barry, J. Biol. Chem. 283 (2008)19329–19341.
[75] W. Eisenreich, T. Dandekar, J. Heesemann, W. Goebel, Nat. Rev. Microbiol. 8(2010) 401–412.
[76] R.G. Ducati, A. Breda, L.A. Basso, D.S. Santos, Curr. Med. Chem. 18 (2011) 1258–1275.
[77] D.E. Almonacid, E.R. Yera, J.B.O. Mitchell, P.C. Babbitt, PLoS Comput. Biol. 6(2010) e10000700.
[78] A.C. Bishop, V.L. Chen, J. Chem. Biol. 2 (2010) 1–9.
Related Documents