Biochemical and Biophysical Analysis of Substrate Recognition, Global Unfolding and Degradation by Eukaryotic Proteasome By AMIT KUMAR SINGH GAUTAM LIFE09200604009 Tata Memorial Centre Mumbai A thesis submitted to the Board of Studies in Life Sciences In partial fulfillment of requirements For the Degree of DOCTOR OF PHILOSOPHY Of HOMI BHABHA NATIONAL INSTITUTE April, 2013

Welcome message from author
This document is posted to help you gain knowledge. Please leave a comment to let me know what you think about it! Share it to your friends and learn new things together.
Transcript

Biochemical and Biophysical Analysis of
Substrate Recognition, Global Unfolding
and Degradation by Eukaryotic
Proteasome
By
AMIT KUMAR SINGH GAUTAM
LIFE09200604009
Tata Memorial Centre
Mumbai
A thesis submitted to the
Board of Studies in Life Sciences
In partial fulfillment of requirements
For the Degree of
DOCTOR OF PHILOSOPHY
Of
HOMI BHABHA NATIONAL INSTITUTE
April, 2013

i
Homi Bhabha National Institute
Recommendations of the Viva Voce Board As members of the Viva Voce Board, we certify that we have read the dissertation
prepared by Mr. Amit Kumar Singh Gautam entitled ‘Biochemical and biophysical
analysis of substrate recognition, global unfolding and degradation by eukaryotic
proteasome’ and recommend that it may be accepted as fulfilling the dissertation
requirement for the Degree of Doctor of Philosophy.
_____________________________________________________Date:
Chairman– Dr. S. M Zingde
_____________________________________________________Date:
Guide / Convener– Dr. P. Venkatraman
_____________________________________________________Date:
Member 1– Dr. S.N. Dalal
____________________________________________________ Date:
Member 2– Prof. V. Kumar
_____________________________________________________Date:
Member 3– Prof. S. Mazumdar
Final approval and acceptance of this dissertation is contingent upon the candidate’s
submission of the final copies of the dissertation to HBNI.
I hereby certify that I have read this dissertation prepared under my direction and
recommend that it may be accepted as fulfilling the dissertation requirement.
Date:
Place: Dr. P. Venkatraman
PI & SO ‘F’, Ph D supervisor

ii
STATEMENT BY AUTHOR
This dissertation has been submitted in partial fulfillment of requirements for an
advanced degree at Homi Bhabha National Institute (HBNI) and is deposited in the
Library to be made available to borrowers under rules of the HBNI.
Brief quotations from this dissertation are allowable without special permission,
provided that accurate acknowledgement of source is made. Requests for permission for
extended quotation from or reproduction of this manuscript in whole or in part may be
granted by the Competent Authority of HBNI when in his or her judgment the proposed
use of the material is in the interests of scholarship. In all other instances, however,
permission must be obtained from the author.
Amit Kumar Singh Gautam

iii
DECLARATION
I, hereby declare that the investigation presented in the thesis has been carried out by
me. The work is original and has not been submitted earlier as a whole or in part for a
degree / diploma at this or any other Institution / University.
Amit Kumar Singh Gautam
ACTREC, Navi Mumbai
April, 2013

iv
CERTIFICATE
I certify that the thesis titled “Biochemical and biophysical analysis of substrate
recognition, global unfolding and degradation by eukaryotic proteasome” submitted for
the degree of Doctor of Philosophy by Mr. Amit Kumar Singh Gautam is a record of the
research carried out by him during the period 2006 to 2013 under my supervision. This
work has not formed the basis for the award of any degree, diploma, associateship or
fellowship at this or any other institute or university.
ACTREC, Navi Mumbai,
April, 2013
Dr. P. Venkatraman
PI & SO ‘F’, Ph D supervisor

v
To the lotus feet of
Sai

vi
Acknowledgments
I take this opportunity to convey my gratefulness to one and all those who have
supported and guided me through the entire tenure of PhD work.
First and foremost, a sincere and heart filled gratitude to my mentor Dr. Prasanna
Venkatraman for being such a wonderful and motivating guide. Her stimulating
suggestions, experience and encouragement accompanied by the freedom of thought that
she granted, has not only helped me to discover my potential but also kept me sparked
throughout my PhD tenure. Ma’am, I can never thank you enough for all that I have
learned from you. I will always be proud to be known as your first PhD student. A
special thanks to Venkat sir, whose motivating thoughts and positive spark have helped
me to re-discover myself and grow as an independent researcher.
I am thankful to Dr. Rajiv Sarin (Director, ACTREC) and Dr. Surekha Zingde (Deputy
Director, ACTREC) for providing me an opportunity to work in this institution and the
excellent infrastructure. I also thank DBT for funding the project and my fellowship. I
am fortunate to have Dr. S. Zingde (ACTREC), Dr. S. Dalal (ACTREC), Dr. V. Kumar
(BARC) and Dr. S. Mazumdar (TIFR) as my doctoral committee members. Their expert
comments, critical analysis of the results and helpful suggestions have contributed
significantly to the work. A special thanks to Dr. P. Balaram (IISC, Bangalore) for
suggestions on the helix stabilizing mutation and Dr. Saraswathi Vishveshwara (IISC,
Bangalore) who guided us with the MD simulations. I am thankful to my thesis
evaluators Dr. Varadharajan (IISc) and Dr. Matouschek (University of Texsas) for
their valuable comments and suggestions. I will also like to thank Dr. Hideyoshi
Yokosawa (Hokkaido University, Japan) for providing yeast strains for proteasome
purification, Dr. Stephen Sliger (University of Illinois, Illinois, USA) for providing
sperm whale myoglobin cDNA and Dr. Chris Tyler Smith, University of Oxford, UK
I am extremely thankful to, the common instrument facility specially Mr. Dandekar for
his constant support and help with instruments, the sequencing facility photography,
library, administration and accounts department of ACTREC for their constant help and
support.

vii
I want to express my warmest thanks to all the Prasanna lab family members Vinay Sir
(ready to help), Kamlesh (meticulous), Manoj (friend and philosopher), Nikhil (good at
assembling information, a true spiritual person), Padma (multitasking and straight
foreword), Indrajit (born artist) for their help in numerable ways during the entire
period. Thanks to Dr. Vinita and Dr. Priya postdocs in the lab. A special thanks to
Yogesh, Shrikant, Rakesh, Ajit, Dhanesh, Sudhish, Pratibha, Hemant and all other
trainees who have worked with me. I learned a lot while working with you guys. I will
also like to thank Pradnya and Satish. All these people have made the lab a true
‘Prasanna Lab Family’ for all these years.
I owe a lot to all my friends Amit R, Amit F, Atul, Lalit, Tabish, Ajit, Manoj, Sapna,
Pallavi, Amit V, Manoj B and the entire student’s community of ACTREC who kept the
tough and tense days of my PhD as joyous as possible. Amit R, you deserve special
thanks, for being such a wonderful roommate; you are the most down to earth person I
have ever seen. I am extremely thankful to one of my oldest friends Renku for being
patient listeners and keeping my days fun filled. I would also like to thank my MSc
friends Jawed, Vandana, Jitu, Awadesh, Vijith and Prasad.
And now, the most important people in my life, my family. Mummy and Papa, you
always have been my greatest strength and source of inspiration. Whatever I have
achieved today is all because of your blessings and sacrifices. I feel so proud and
blessed to be your son. Nani, Nana, Mama and Mami, with whom I spent my childhood.
Ma and Baba for the trust they showed in me by giving their daughter’s hand in mine.
Thanks to my younger brothers Manish (excellent manager and social person) and
Deepak (think different), sisters Shikha and Deepa; chacha and chachi. Finally, Polo,
my invaluable companion and a brilliant scientist by herself. She is the source of
perennial support. Thank you for being in my life.

viii
Contents
Page No.
Synopsis 1
List of abbreviations 18
List of figures 19
List of tables 20
Chapter 1: Introduction and Review of Literature
1.1 Discovery of proteasomal machinery 23
1.2 Proteasome regulates various cellular processes 23
1.3 Architecture of 26S proteasome 26
1.3.1 The 20S Core Particle 26
1.3.2 19S regulatory particle 28
1.3.2.1 The Proteasome Base sub-complex 31
1.3.2.1A ATPases in Base 31
1.3.2.1B Non-ATPase in base 33
1.3.2.2 Lid subcomplex 34
1.4 Proteasome degradation pathways 35
1.4.1 Ubiquitin dependent proteasomal degradation 36
1.4.2A Ub independent proteasomal degradation 37
1.4.2B Protein Processing 42
1.5 Degradation signals 45
1.6 Models of substrate unfolding and translocation by proteasome 47
1.7 Recent advancement in understanding 26S proteasomal degradation 48
Rationale of the study
Aims and objectives
Chapter 2: Establishment of in vitro model system
2.1 INTRODUCTION 59
2.2 MATERIALS AND METHODS 60
2.2.1 Expression and affinity purification of 26S and 20S proteasome 60
2.2.1A Yeast cell culture 63
2.2.1B Lysis 63
2.2.1C Affinity purification of proteasome: 63
ix
2.2.2 Characterization of purified proteasome 64
2.2.2A Proteasomal activity assay 65
2.2.2B In-gel activity assay 65
2.2.2C SDS PAGE 67
2.2.2D Casein degradation 67
2.2.3 Expression and purification Mb 67
2.2.3A ApoMb preparation 69
2.2.4 Characterization of purified Mb 69
2.2.4A UV-visible spectrometry 69
2.2.4B Gel-filtration chromatography 70
2.2.5 Proteasomal degradation 70
2.3 RESULTS AND DISCUSSION 71
2.3.1 Purification and characterization of proteasome 71
2.3.2 Purification and characterization of Mb 73
2.3.3 Degradation of apoMb by proteasome 75
2.5 SUMMARY 77
Chapter 3: Substrate recognition is an essential step in
proteasomal degradation
3.1 INTRODUCTION 79
3.2 MATERIALS AND METHODS 80
3.2.1 Proteasome and Mb interaction 80
3.2.2 Response of proteasomal ATPases upon substrate recognition 82
3.3 RESULTS AND DISCUSSION
3.3.1 Proteasome and Mb interaction kinetics 83
3.3.2 Response of proteasome upon substrate recognition 84
3.4 SUMMARY 87
Chapter 4: Effect of ‘trans-acting elements’ on substrate
half-life
4.1 INTRODUCTION 90
4.2 MATERIALS AND METHODS 91

x
4.2.1 PEST fusion to the C-terminus of Mb 91
4.2.1A Insertion of PEST sequences in Mb 91
4.2.1B Expression and purification of PEST fused Mb 92
4.2.2 Fusion of probable ‘degron’ to C-terminus of Mb 94
4.2.2A Generating pRSTEV Vector 95
4.2.2B Cloning wtMb in pRSTEV 96
4.2.2C Cloning Mb p8 and p13 in pRSTEV 97
4.2.2D Cloning Mb ODC in pRSTEV 97
4.2.3 Expression and purification of wt and fusion proteins 99
4.2.4 Proteasome degradation assay 100
4.3 RESULT AND DISCUSSION 101
4.3.1 Cloning and purification of PEST sequence fused apoMb 101
4.3.2 Cloning and purification of ‘probable degrons’ fused apoMb 102
4.3.3 Effect of PEST or ‘probable degron’ on apoMb half-life 104
4.4 SUMMARY 105
Chapter 5: Importance of local secondary structure in apoMb
degradation
5.1 INTRODUCTION 107
5.2 MATERIALS AND METHODS 108
5.2.1 Prediction of helical propensity 108
5.2.2 Molecular dynamics simulation of wt and F-helix mutant 108
5.2.3 Mutagenesis, expression and purification 109
5.2.4 Secondary structure of wt and F-helix mutant 110
5.2.4A Determination of protein concentration 111
5.2.4B Cleaning quartz cuvette 111
5.2.4C Instrument setting and data collection 111
5.2.4D Data analysis 112
5.2.5 Global stability of wt and F-helix mutant 113
5.2.5A Tryptophan fluorescence 113
5.2.5B Thermal denaturation 113
5.2.5C Equilibrium unfolding 114
5.2.6 Limited proteolysis of wt and F-helix mutant 115

xi
5.2.6A Tricin SDS PAGE 115
5.2.6B MALDI MS of cleaved products 116
5.2.7 Proteasomal degradation of wt and F-helix mutant 118
5.3 RESULTS AND DISCUSSION
5.3.1 Strategy for F-helix stabilization 118
5.3.2 F-helix was stable during MD simulation 119
5.3.3 F-helix mutant Mb was more helical than wt 120
5.3.4 F-helix was stabilized in apo F-helix mutant 121
5.3.5 Overall stability of F-helix mutant was not affected 123
5.3.6 Exposure of F-helix was essential for apoMb degradation 124
5.4 SUMMARY 126
Chapter 6: Identification of proteasome recognition element
in apoMb
6.1 INTRODUCTION 129
6.2 MATERIALS AND METHODS 129
6.2.1 Screening of overlapping Mb peptides for proteasome binding 130
6.2.1A Designing overlapping peptides to pan entire Mb sequence 130
6.2.1B Peptide reconstitution 130
6.2.2 Peptide and apoMb competition for proteasome binding 131
6.2.3 Structure guided approach to identify proteasome interacting residues 132
6.2.3A Identification of probable proteasome interacting residues 132
6.2.3B Mutation, expression, purification and affinity with proteasome 132
6.3 RESULTS AND DISCUSSION 133
6.3.1 Designing peptides to pan entire Mb sequence 133
6.3.2 Screening peptides for 26S proteasome binding 135
6.3.3 ApoMb interacted with proteasome mainly through A-helix 135
6.3.4 Structure guided approach to identify proteasome interacting residues 137
6.4 SUMMARY 139

xii
Chapter 7: Structure function correlation of proteasomal
degradation
7.1 INTRODUCTION 142
7.2 MATERIALS AND METHODS 142
7.2.1 Identification of buried residue in Mb helices 142
7.2.2 Mutagenesis, expression and purification 143
7.2.3 Secondary structure of Cys mutants of Mb 143
7.2.4 Tryptophan Fluorescence of Cys mutants of Mb 144
7.2.5 Thermal stability of Mb mutants 144
7.2.6 Affinity of Mb mutants with proteasome 144
7.2.7 Proteasomal degradation of Mb mutants 145
7.3 RESULTS AND DISCUSSION 145
7.3.1 Identification of buried residues in Mb 145
7.3.2 Effect of structure on proteasomal degradation 145
7.3.3 Effect of affinity of substrates for proteasomal degradation 149 7.4 SUMMARY 151
Chapter 8: Conclusions 154
Significance of the study 158
Bibliography 159
Reprints of published articles 165

Synopsis Page 1
Synopsis

Synopsis Page 2
Homi Bhabha National Institute
Ph. D. PROGRAMME
1. Name of the Student: Amit Kumar Singh Gautam
2. Name of the Constituent Institution: Tata Memorial Centre, Advanced Centre for
Treatment Research and Education in Cancer
3. Enrolment No. : LIFE09200604009 (01/09/2006)
4. Title of the Thesis: Biochemical and biophysical analysis of substrate recognition,
global unfolding and protein degradation by eukaryotic proteasome
5. Board of Studies: Life science

Synopsis Page 3
SYNOPSIS
Introduction:
For the healthy survival of every organism, all cellular processes must be stringently
controlled. Most of these processes are spatiotemporally regulated by the 26S
proteasome, a giant ATP dependent protease (Glickman and Ciechanover, 2002; Hanna
and Finley, 2007; Wolf and Hilt, 2004). Proteasomes are multi subunit and multi
specific proteases which are conserved across all kingdoms (Glickman and Ciechanover,
2002; Hanna and Finley, 2007; Wolf and Hilt, 2004). Deregulation in the proteasome
machinery can result in several lethal diseases and disorders (Glickman and
Ciechanover, 2002; Wolf and Hilt, 2004).
The most abundant functional complex of the proteasomes in eukaryotes is the 26S holo
complex. 26S proteasomes are composed of 20S proteolytic core particle sandwiched by
one or two 19S regulatory particles (Baumeister et al., 1998). The cylindrical 20S
particle contains four heptameric rings around a central pore. Interior surface of the
middle two rings (β-ring) have proteolytic activity (Groll, Ditzel et al. 1997). Only
unfolded substrates gain access to catalytic sites via a narrow 13Å pore, which is
guarded by a gate that can be opened by the interaction of 20S proteolytic core with the
19S regulatory particle (Glickman and Ciechanover, 2002; Groll et al., 2000; Groll et
al., 1997). The 19S regulatory particle is composed of two distinct sub complexes called
the base and lid. Base is composed of six homologous AAA+
ATPases arranged as a
spiral staircase that abuts the outer rings of the 20S. Lid is composed of at least ten non
ATPases subunits. The 19S regulatory particle is thought to be responsible for substrate
recognition, binding, unfolding and translocation (Henderson et al., 2011; Navon and
Goldberg, 2001; Ogura and Tanaka, 2003).

Synopsis Page 4
Substrates for degradation are targeted via ubiquitin dependent or independent
pathways. They are recruited to the proteasome either via multi-ubiquitin tag or an
adaptor (trans-acting element) but before the substrate is subjected to degradation, these
elements are removed. Beside these targeting molecules, an unstructured region in the
substrate seems to be mandatory for proteasomal degradation (Janse et al., 2004; Lee et
al., 2001; Prakash et al., 2009; Prakash et al., 2004). Although such observations have
led to a better understanding of the mechanism of degradation, many of the fundamental
questions regarding the mechanism are still unanswered. Some of the key questions that
need answers are:
1. How are substrates recruited to proteasome?
2. What are the cis-acting elements in the substrates that help in substrate
recognition?
3. If an unstructured region is necessary, how does it originate within substrate?
4. What are the sequence and structural requirements for protein degradation?
5. What are the rate limiting steps in proteasomal degradation?
We believe that these questions can only be answered if model systems capable of
recapitulating the various hierarchical steps involved in the proteasomal degradation
without the help of any trans-acting elements and composed only of purified
components are created.
Objective:
Our aim therefore is to develop an in vitro model system for the characterization of
substrate recognition, global unfolding and degradation by eukaryotic proteasome.

Synopsis Page 5
Results and discussion:
1. Establishment of in vitro model system
Selection of model substrate: A few well known factors that affect the half-life of
proteins are ubiquitination, post-translational modification, misfolding of proteins and
loss of one of the binding partners (Baumeister et al., 1998; Glickman and Ciechanover,
2002; Prakash et al., 2009; Prakash et al., 2004). It is reported that upon ligand removal
some proteins become more labile for degradation by proteases. We chose to test
myoglobin (Mb) as a ‘model substrate’ for the proteasome primarily because it can be
readily obtained in both the holo and apo forms (heme free). Additional characteristics
that make myoglobin an attractive model system are – a) Both holo and apo forms have
well defined tertiary structure, b) crystal structure of holo and NMR structure of apo
form is known, allowing targeted protein manipulations and structural interpretations
possible (Arcovito et al., 2007; Eliezer and Wright, 1996; Phillips, 1980), c) protein is
largely α-helical (less stable than the β-sheet), d) extensive studies have been performed
to understand the thermodynamics and kinetic properties of apoMb unfolding (Feng et
al., 1999; Jamin, 2005; Jamin and Baldwin, 1996; Lecomte et al., 1996; Onufriev et al.,
2003; Samatova et al., 2010)
Purification and characterization of Myoglobin: Using cation-exchange
chromatography we could achieve single step purification of holomyoglobin (holoMb).
Purified protein was >95% pure on SDS PAGE. UV-visible spectrum showed the
characteristic Soret peak for bound heme, indicating that the protein is well folded.
Acid-acetone method was used to remove heme group of holoMb which resulted in loss
of the soret peak.
Purification and characterization of proteasome: 26S and 20S Proteasomes were
affinity (3X FLAG tagged RPN11 or Pre1) purified using M2-agarose (Sone et al.,
Synopsis Page 6
2004). Purification steps were monitored using fluorogenic substrate Suc-LLVY-AMC.
In-gel activity assay showed that purified 26S and 20S proteasomes were intact and
active.
Degradation of apomyoglobin by proteasome: Upon reconstitution of pure myoglobin
and the 26S proteasome apoMb was found to be degraded by proteasome while ligand
bound holoMb was resistance to degradation. However, we were surprised to find that
contrary to our expectation that ligand free apoMb an all helical protein would be
degraded fast by the proteasome, the degradation was a slow process and it took 12h for
the proteasome to degrade 50% of apoMb. Unfolded substrates can be degraded by 20S
proteasome alone but globular proteins require 19S regulatory particle for unfolding and
translocation. Purified 20S proteasome was unable to degrade apoMb indicating that
recognition of apoMb it’s unfolding and translocation to the catalytic core requires the
19S regulatory particle. The process of unfolding and translocation requires energy.
Accordingly, in the presence of ATPγS (non-hydrolysable analogue of ATP), minimal
degradation of apoMb was observed.
Taken together, the above findings suggest that apoMb was specifically degraded
by purified proteasome in an ATP dependent manner. This is the first
demonstration of the ability of 26S proteasome to degrade a globular protein in
vitro in the absence of ubiquitin, adaptor or other trans-acting element.
2. Substrate recognition is an essential step in proteasomal degradation
One possible reason for the failure of the proteasome to degrade holoMb could be the
failure to recognize this form of the substrate. To check whether holoMb and
proteasome interacted and to assess the affinity of apoMb for proteasomes, we
developed a quantitative binding assay based on ELISA. Proteasomes were immobilized
by anti-Flag antibody and after incubation with holo or apoMb, bound amount of ligand

Synopsis Page 7
was quantified using standard steps involved in ELISA holoMb did not interact with
immobilized proteasome while apoMb bound tightly (Kd=3.5nM). As reported for
substrate of several chaperones and AAA ATPases, apoMb stimulated the ATPase
activity of the proteasome. (Benaroudj et al., 2003; Cashikar et al., 2002). HoloMb
however did not stimulate the ATPase activity again, suggesting that holoMb was not
recognized and therefore was not degraded by proteasome. However, even after tight
association and eliciting a response from proteasome, degradation of apoMb was a slow
process (half-life = 12h). Contrary to the observation that substrate localization is
sufficient for efficient degradation (Janse et al., 2004), our findings suggest that all
encounters with substrate may not be productive; any of the downstream processes like
chain unfolding or translocation could be rate limiting in proteasomal degradation. We
conclude that substrate recognition by proteasome is essential, but may not be sufficient
of efficient degradation.
In addressing the differential effect of proteasome on apo and holoMb, we have
developed a method by which the affinity of proteasome and substrate interaction could
be quantified independent of other steps required for proteolysis. This provides a novel
method to discriminate between substrates and non substrates of the proteasome.
3. Effect of unstructured ‘cis-acting trans elements’ on substrate half-life
PEST fusion: A small number of protein sequences when fused in ‘trans’ shorten the
half-life of protein. Although why certain sequences should behave so is not well
understood, these sequences are utilized to study the mechanism of degradation, and are
called as ‘degrons’. Some proteins containing one or more regions rich in proline (P),
glutamic acid (E), serine (S), and threonine (T) were found to exhibit less than 2 hours
of intracellular half-lives (Rogers et al., 1986). These are generally called as PEST
sequences. To test the effect of PEST sequences on apoMb half-life, PEST sequences

Synopsis Page 8
from GCN4 (apoMb PEST 1), Hac1 (apoMb PEST 2) and ABCA1 (apoMb PEST 3)
were fused to the C-terminus of apoMb. Fusion of these PEST sequences did not affect
the half-life of apoMb.
Quest to find the probable ‘degron’: Although the role of ‘degron’ in the degradation
step is not clear, few recent observations suggest that long unstructured regions (90-120
residue) when fused to protein (as cis-acting trans elements), render them susceptible for
degradation (Prakash et al., 2009; Prakash et al., 2004). These unstructured regions may
help in initiation of degradation (Prakash et al., 2009; Prakash et al., 2004). Since
presence of such long unstructured regions in proteins is not very common we tested the
ability of short sequences to act as ‘degrons’ by fusing them to the C-terminus of Mb.
These sequences were- a) C-terminus of ODC– essential for ubiquitin independent
degradation of ODC, was able to shorten the half-life of GFP when fused to its C
terminus (MbODC) (Corish and Tyler-Smith, 1999); b) C-terminus of E12 – know to
interact with PSMD9, a non-ATPase subunit of proteasome (Mb E12) (Thomas et al.,
2009); c) Short regions from N and C-terminus of proteins– In indigenous screening
these were found to interact with immobilized 26S proteasome (Mb P8 and Mb P13).
Compared to wt, none of the fusion proteins could significantly shorten the half-life of
Mb. Fusion of short sequences which are ‘trans in origin’ did not facilitate Mb
degradation. Reasons could be: a) Due to very high affinity of apoMb (Kd=3.5 nM) for
proteasome, additional interactions as a result of fusion of these elements might not
facilitate degradation; b) Local structural changes may be more important than fusing
unstructured sequences to the termini
3. Importance of local secondary structure in apoMb degradation
In order to understand the reason behind failure of proteasome to recognize and to
degrade holoMb, crystal structure of holoMb and NMR structure of apoMb were

Synopsis Page 9
analyzed. Heme pocket in holoMb is surrounded by B, C, E helices from top and side
and F helix from the bottom. Upon heme removal, dramatic structural change was
observed in the F-helix (K79 to F106) while, structure of other helixes involved in heme
binding were unaffected. The F-helix in apoMb is in conformational equilibrium
between partially folded and unfolded state. Circular dichroism data reflected that
apoMb was 18% (F-helix contribute 17% of total helicity of holoMb) less structured
than that of holoMb. This unstructured region in the protein might act as recognition
element or initiator of degradation. We hypothesized that stabilization of F-helix would
affect the half-life of Mb. We modified G80 (EF loop), P88 and S92 (F-helix) to Ala and
H97 (FG–loop) to Asn with the intention to stabilize the F-helix even in the absence of
heme. The Wt and mutant F-helix (G80A P88A S92A and H97N) were analyzed by
AGADIR, a program based on helix/coil transition theory that provides residue level
helicity. As compared to wt, mutant F-helix was more helical in the 78 to 106 region.
Quick molecular dynamics simulation of ligand free wt and mutant F-helix protein for
2.8ns at 400K showed that F-helix melts almost immediately in wt whereas in the
mutant, the helix was stable and remained so until the end of simulation. These
modifications were incorporated in Mb cDNA. F-helix mutant protein was purified,
secondary structure of holo as well as apo form were determined by CD. No remarkable
change was observed in holo form of wt and F-helix mutant protein by CD
spectroscopy. On the other hand, apoF-helix mutant was 9±2% more helical than that of
apowtMb. Since, increase in secondary structure due to incorporation of mutations may
affect the overall stability of the protein, tryptophan fluorescence, thermal denaturation
and chemical denaturant induced unfolding experiments were performed. There was no
significant change in melting temperature, tryptophan environment and the
thermodynamic stability (G of urea unfolding) of apowt and F-helix mutant Mb,

Synopsis Page 10
suggesting that overall fold of apo F-helix mutant is similar to that of apowtMb.
Structural stabilization was most likely confined to local region in the protein (F-helix).
To further prove the stabilization of F-helix, we took the help of limited proteolysis,
where a specific protease is allowed to act on a protein at suboptimal conditions. Apowt
generated two fragments with trypsin (nick after K96) and chymotrypsin (nick after
L89) indicating that F-helix was floppy in the wt structure. But, F-helix mutant was
relatively resistance to cleavage by these enzymes thereby proving that F-helix was
stable in the mutant protein. Apowt and F-helix mutants were tested for proteasomal
degradation. As hypothesized, mutant protein was relatively stable for proteasomal
degradation. Interestingly the affinity of mutant protein was not compromised and
mutant like the wt apoMb structure was able to stimulate proteasomal ATPases.
Taken together, the above results provide following insights
1. F-helix was stabilized in mutant protein.
2. Local secondary structural alterations can determine the life time of a
protein.
3. Floppy F-helix (78-106) was essential for apoMb degradation.
These observations provide the first evidence for structure function correlation of in
vitro proteasomal degradation and identification and origin of intrinsic degradation
signal (cis-acting element) in the substrate.
4. Recognition element in apoMb
The floppy F-helix of apoMb may act as recognition element and/or as an initiator of
degradation. To test this and identify the interacting surface on apoMb, overlapping
peptides that pan entire 153 amino acid sequence were synthesized with biotin at the N-
terminus and screened for binding to the proteasome by ELISA. Peptide from A-helix
not only bound tightly to the proteasome but was also able to compete for apoMb
Synopsis Page 11
binding (Ki=0.8±0.4M). Other regions in Mb (B-helix and CD-loop) also interact with
the proteasome but with much lower affinity and unlike the A-helix peptide, these
peptides were unable to abolish binding of apoMb. A specifically designed 23 residue
peptide covering the sequence from 77-100 in the F-helix region could not inhibit
binding of apoMb to the proteasome. In presence of MG132 (proteasomal inhibitor), a
short stretch of floppy F-helix, residues 69-83 (C-termini of E-helix and EF loop) and
90-104 (C-termini of the F-helix, FG-loop and N-termini of the G-helix) were able to
bind and partially inhibit apoMb proteasome interaction. It is likely that floppy F-helix
enters the central channel of the 20S proteasome in the form of a loop and acts as an
initiator of degradation.
Using structure as a guide we identified few solvent exposed residues in the A-helix that
may interact with the proteasome. These were mutated to Alanine and binding studies
indicated that two of the residues in A-helix provide bulk of the binding energy.
Taken together, due to heme removal F-helix of Mb becomes floppy and apoMb with
the floppy F-helix and not the holo protein was degraded by proteasome. This is
supported by the behaviour of the F-helix stabilized mutant which was degraded slower
than the wt. It seems that the floppy F helix mediates initial encounters between apoMb
and proteasome. Strong interaction originated from A-helix of apoMb then strengthens
these interactions. Floppy F-helix thus anchored and may act as initiator of degradation.
5. Strategies to understand structure function correlation- unfolding
intermediates as a rate limiting step
To better understand the role of local secondary structure, overall stability and the
affinity of substrate for proteasomal degradation, one buried residue in each of the
helices of Mb was replaced by a cysteine (A-helix-V10C, B-helix-G25C, C-heilix-
T39C, G-helix-L104C and L115C, H-helix-M131C). Structural characterization of these

Synopsis Page 12
proteins indicated that secondary structure of apo G25C, L115C and L104C was
compromised. However, tertiary structure characterization by tryptophan fluorescence
indicated that at least one of the tryptophan was solvent exposed in all mutants. Overall
stability of these mutant proteins was monitored by thermal denaturation. ApoG25C was
least stable while stability of apoL104C, L115C and M131C was compromised to some
extent. ApoG25C can be treated as molten globule as this protein was less than 50%
helical; tryptophan environment was severely affected in this mutant and did not follow
two state transition during thermal denaturation. All cys mutants were tested for
proteasomal degradation, only two mutant proteins apoL115C and L104C (both
mutations in the G-helix) were found to have a shorter half-life (8hr) than apowt. We
could not find direct correlation between binding affinity and half-life of the cysteine
mutants tested.
Once recognized other processes like unfolding are likely to be more rate limiting than
affinity per se. One of the rate limiting steps would be the creation of a disordered
region that can enter the catalytic chamber. If F-helix was entering the central channel as
a loop, 29 residue long floppy F-helix will be 5.3nm (3.8Å/residue) but the length
required to reach catalytic core is 15 nm. Destabilizing G-helix (apo L104C and
L115C) adjacent to the floppy F-helix propagates the disorderness and facilitates
degradation. Creating such a long loop catalyzed by proteasomal AAA+
ATPases would
be a key rate limiting step.
Although degradation of 153 residues (all helical) long apoMb was a slow process,
recognition was fast. Floppy F-helix would be captured by AAA+ ATPase of
proteasome either the ATPases would pull at the protein and create a loop long enough
to reach the active site or due to the cooperative nature of protein unfolding the entire
protein might collapse to initiate degradation. However, this process in apoMb does not

Synopsis Page 13
seem to be that straight forward. Parallel observation in literature indicate that even
denaturant induced unfolding of apoMb is complex due to the formation of a stable long
lived intermediate by the AGH helices. It is possible that similar unfolding intermediate
is abundant during proteasomal AAA+ ATPase mediated apoMb unfolding and
destabilizing of such an intermediate would be the key rate limiting step. Unfolding
intermediate would be less stable in short lived G-helix mutants like L104C and L115C.
It is to be pointed out that there are not many examples in literature where degradation
of substrate starts from an internal region leading to complete degradation. If
degradation is not initiated from the internal loop, there are two possibilities- a) One of
the termini would be pulled into the catalytic chamber and degradation would take place
in either N to C or C to N direction, b) Due to the destabilization of adjacent helices, a
loop long enough to reach catalytic site would be created and degradation might start
with a cut to generate two termini resulting in simultaneous degradation of both the
polypeptides.
In the latter case, two polypeptides would enter the catalytic core and might compete
with each other for translocation. Apart from the above stated rate limiting steps, this
translocation step could also berate limiting in the substrates where degradation does not
start from termini.
Summary:
In order to dissect the various hierarchical steps in proteasomal degradation, to identify
motifs for substrate recognition and identify the rate limiting steps we have developed
an in vitro model system using purified 26S proteasomes and apoMb. We report for the
first time that purified 26S proteasome have the ability to directly recognize and degrade
a globular protein (apoMb) in the absence of ubiquitin, extrinsic degradation tags or
adaptor proteins. Removal of heme exposes a previously buried F-helix which is

Synopsis Page 14
dynamic in nature. This Floppy F-helix sensitizes the proteasomal ATPases to the
presence of the substrate. ApoMb is then anchored to the proteasome primarily through
A-helix; it is further stabilized by additional interactions with B-helix and CD-loop.
Floppy F-helix enters the central channel in the form of a loop and acts as initiator of
degradation. Adjacent helices are unraveled by AAA+ ATPases of proteasome to
generate an unstructured region long enough to reach the active site. Stabilization of
unfolding intermediate seems to slow down degradation.
It is clear from our observation that degradation of even a small all helical protein is a
well-controlled but complex process. Some of rate limiting steps in proteasomal
degradation that we recognize from our model system are -
a) Substrate recognition is essential but does not ensure efficient degradation
b) Initiation requires exposure of a ‘cis-acting element’
c) Floppy/unstructured region of sufficient length is required for initiation of
degradation
d) Substrate unfolding probably occurs through chain unraveling
e) Unfolding intermediates my accumulate
f) Translocation to catalytic core may be competitive depending on the
directionality of degradation
Significance:
Apomyoglobin emerges as a new model substrate for in depth study of ubiquitin
independent degradation. It can be used to investigate sequence, structure,
thermodynamic and kinetic aspects of not only proteasomal degradation but also for
other compartmentalized proteases. Our finding will open new quest for ‘cis-acting
elements’ in other ATPase dependent systems. Our interaction study can be optimized
for other labile multi-subunit complex systems.

Synopsis Page 15
References:
Arcovito, A., Benfatto, M., Cianci, M., Hasnain, S.S., Nienhaus, K., Nienhaus, G.U., Savino, C., Strange, R.W.,
Vallone, B., and Della Longa, S. (2007). X-ray structure analysis of a metalloprotein with enhanced active-site
resolution using in situ x-ray absorption near edge structure spectroscopy. Proc Natl Acad Sci U S A 104, 6211-6216.
Baumeister, W., Walz, J., Zuhl, F., and Seemuller, E. (1998). The proteasome: paradigm of a self-compartmentalizing
protease. Cell 92, 367-380.
Benaroudj, N., Zwickl, P., Seemuller, E., Baumeister, W., and Goldberg, A.L. (2003). ATP hydrolysis by the
proteasome regulatory complex PAN serves multiple functions in protein degradation. Mol Cell 11, 69-78.
Cashikar, A.G., Schirmer, E.C., Hattendorf, D.A., Glover, J.R., Ramakrishnan, M.S., Ware, D.M., and Lindquist, S.L.
(2002). Defining a pathway of communication from the C-terminal peptide binding domain to the N-terminal ATPase
domain in a AAA protein. Mol Cell 9, 751-760.
Corish, P., and Tyler-Smith, C. (1999). Attenuation of green fluorescent protein half-life in mammalian cells. Protein
Eng 12, 1035-1040.
Eliezer, D., and Wright, P.E. (1996). Is apomyoglobin a molten globule? Structural characterization by NMR. J Mol
Biol 263, 531-538.
Feng, Z., Ha, J.H., and Loh, S.N. (1999). Identifying the site of initial tertiary structure disruption during
apomyoglobin unfolding. Biochemistry 38, 14433-14439.
Glickman, M.H., and Ciechanover, A. (2002). The ubiquitin-proteasome proteolytic pathway: destruction for the sake
of construction. Physiol Rev 82, 373-428.
Groll, M., Bajorek, M., Kohler, A., Moroder, L., Rubin, D.M., Huber, R., Glickman, M.H., and Finley, D. (2000). A
gated channel into the proteasome core particle. Nat Struct Biol 7, 1062-1067.
Groll, M., Ditzel, L., Lowe, J., Stock, D., Bochtler, M., Bartunik, H.D., and Huber, R. (1997). Structure of 20S
proteasome from yeast at 2.4 A resolution. Nature 386, 463-471.
Hanna, J., and Finley, D. (2007). A proteasome for all occasions. FEBS Lett 581, 2854-2861.
Henderson, A., Erales, J., Hoyt, M.A., and Coffino, P. (2011). Dependence of proteasome processing rate on substrate
unfolding. J Biol Chem 286, 17495-17502.
Jamin, M. (2005). The folding process of apomyoglobin. Protein Pept Lett 12, 229-234.
Jamin, M., and Baldwin, R.L. (1996). Refolding and unfolding kinetics of the equilibrium folding intermediate of
apomyoglobin. Nat Struct Biol 3, 613-618.
Janse, D.M., Crosas, B., Finley, D., and Church, G.M. (2004). Localization to the proteasome is sufficient for
degradation. J Biol Chem 279, 21415-21420.
Lecomte, J.T., Kao, Y.H., and Cocco, M.J. (1996). The native state of apomyoglobin described by proton NMR
spectroscopy: the A-B-G-H interface of wild-type sperm whale apomyoglobin. Proteins 25, 267-285.
Lee, C., Schwartz, M.P., Prakash, S., Iwakura, M., and Matouschek, A. (2001). ATP-dependent proteases degrade
their substrates by processively unraveling them from the degradation signal. Mol Cell 7, 627-637.
Navon, A., and Goldberg, A.L. (2001). Proteins are unfolded on the surface of the ATPase ring before transport into
the proteasome. Mol Cell 8, 1339-1349.
Ogura, T., and Tanaka, K. (2003). Dissecting various ATP-dependent steps involved in proteasomal degradation. Mol
Cell 11, 3-5.
Onufriev, A., Case, D.A., and Bashford, D. (2003). Structural details, pathways, and energetics of unfolding
apomyoglobin. J Mol Biol 325, 555-567.
Phillips, S.E. (1980). Structure and refinement of oxymyoglobin at 1.6 A resolution. J Mol Biol 142, 531-554.
Prakash, S., Inobe, T., Hatch, A.J., and Matouschek, A. (2009). Substrate selection by the proteasome during
degradation of protein complexes. Nat Chem Biol 5, 29-36.
Prakash, S., Tian, L., Ratliff, K.S., Lehotzky, R.E., and Matouschek, A. (2004). An unstructured initiation site is
required for efficient proteasome-mediated degradation. Nat Struct Mol Biol 11, 830-837.
Rogers, S., Wells, R., and Rechsteiner, M. (1986). Amino acid sequences common to rapidly degraded proteins: the
PEST hypothesis. Science 234, 364-368.
Samatova, E.N., Melnik, B.S., Balobanov, V.A., Katina, N.S., Dolgikh, D.A., Semisotnov, G.V., Finkelstein, A.V.,
and Bychkova, V.E. (2010). Folding intermediate and folding nucleus for IN and UIN transitions in
apomyoglobin: contributions by conserved and nonconserved residues. Biophys J 98, 1694-1702.
Sone, T., Saeki, Y., Toh-e, A., and Yokosawa, H. (2004). Sem1p is a novel subunit of the 26 S proteasome from
Saccharomyces cerevisiae. J Biol Chem 279, 28807-28816.
Thomas, M.K., Tsang, S.W., Yeung, M.L., Leung, P.S., and Yao, K.M. (2009). The roles of the PDZ-containing
proteins bridge-1 and PDZD2 in the regulation of insulin production and pancreatic beta-cell mass. Curr Protein Pept
Sci 10, 30-36.
Wolf, D.H., and Hilt, W. (2004). The proteasome: a proteolytic nanomachine of cell regulation and waste disposal.
Biochim Biophys Acta 1695, 19-31.

Synopsis Page 16
Publications:
Publication from thesis
a. Published:
Amit Kumar Singh Gautam, Satish Balakrishnan, Prasanna Venkatraman (2012)
Direct and Ubiquitin independent recognition and degradation of a folded protein by the
eukaryotic proteasomes- origin of intrinsic degradation signals. PLoS ONE 7(4):
e34864. Doi:10.1371/journal.pone.0034864.
Other publications
b. Vinita Wadhawan, Yogesh A Kolhe, Nikhil Sangith, Amit Kumar Singh
Gautam and Prasanna Venkatraman (2012).Biochemical Journal. From prediction to
experimental validation-Desmoglein 2 is a functionally relevant substrate of matriptase
in epithelial cells and their reciprocal relationship is important for cell adhesion.
Signature of Student:
Date:
Doctoral Committee:
S. No. Name Designation Signature Date
1 Dr. Surekha M Zingde Chairman
2 Dr. Prasanna Venkatraman Convener
3 Dr. Sorab Dalal Member
4 Dr. Vinay Kumar Member
5 Prof. Shymalava Mazumdar Member

Synopsis Page 17
Forwarded through
Dr. S.V. Chiplunkar Dr. S. M. Zingde Dr. R. Sarin Chairperson Dy. Director CRI Director
Academic and Training Program ACTREC ACTREC
ACTREC
Dr. K.S. Sharma
Director Academics,
Tata Memorial Centre

Page 18
List of Abbreviations
ºC : Degree Celsius
µg : Microgram
µl : Micro liter
Å : Angstrom
AAA : ATPases Associated with various cellular Activities
ATP : Adenosine triphosphate
bp : Base pairs
CP : Proteasome core particle
Da : Dalton
DHFR : Dihydrofolate reductase
DNA : Deoxyribonucleic acid
DTT : Dithiothreitol
E1 : Ubiquitin activating enzyme
E2 : Ubiquitin conjugating enzyme
E3 : Ubiquitin ligase
E. coli : Escherichia coli
E6-AP : E6 – associated protein
EDTA : Ethylene diamine tetraacetic acid
HPV : Human Papillomavirus
mM : Milli molar
ND : Not determined
ng : Nano gram
PCR : Polymerase chain reaction
p105 : 105 kDa NF-kB precursor protein
p50 : 50 kDa NF-kB processed transcription factor
PAGE : Polyacrylamide gel electrophoresis
PMSF : Phenylmethyl sulfonyl fluoride
RP : proteasome regulatory particle
Rb : Retinoblastoma protein
S : Svedberg sedimentation coefficient
S. cerevisiae : Saccharomyces cerevisiae
SDS : Sodium Dodecyl Sulphate
Ub : Ubiquitin

Page 19
List of Figures
Figure
No
Figure title Page
No
1.1 Proteasome regulates almost all the cellular process in the cell 25
1.2 20S CP structure 28
1.3 Architecture of 26S proteasome 29
1.4 Architecture of proteasomal ATPases 33
1.5 Ub dependent and independent proteasomal degradation 37
1.6 Classical and non-classical proteasome degradation 43
2.1 Purification and characterization of 26S and 20S proteasome 72
2.2 Purification and characterization of Mb 75
2.3 Purified 26S proteasome degrades apoMb in vitro 76
3.1 ApoMb was recognized by 26S proteasome 85
3.2 Stability of 26S proteasome and apoMb 87
4.1 Overview of cloning, expression and purification of Mb C-terminal
fusion proteins
95
4.2 Cloning strategy of Mb-ODC 98
4.3 Generation of pRSTEV vector and Purification of Mb fusion protein 103
4.4 Effect of PEST sequences and ‘degrons’ fusion on Mb half-life 104
5.1 Stabilization F-helix of Mb 119
5.2 Effect of mutation on secondary structure and overall stability of
F-helix mutant
121
5.3 Stabilization of F-helix rendered apoMb more resistant to degradation
by the proteasome
123
6.1 Mb overlapping peptide screening 133
6.2 A-helix imparted most of binding forces involved in apoMb and
proteasome interaction
136
6.3 Mutation in A-helix residues resulted loss in apoMb and proteasome
affinity
137
7.1 Effect of Cys mutation on secondary structure, Trp environment and
Tm of Mb
146
7.2 Mutation of buried Leu residues in the G-helix shortens the half-life of
apoMb
148
7.3 Unfolding intermediates of apoMb and Mb F-helix conformation
variants
151
8 A model for the mechanistic steps involved in the proteasomal
degradation of apoMb
155

Page 20
List of Tables
Table
No
Table title Page
No
1.1 Some of the cellular processes regulated by proteasome 24
1.2 19S regulatory particle, known domains and effect of deletion of on
survival
30
1.3 Summary of 26S proteasome EM Map 32
1.4 Examples of Ub-independent degradation and their regulators 40
1.5 Adaptors in proteasomal degradation 45
1.6 Some model substrate and system used to understand proteasomal
degradation
52
2.1 Monitoring proteasome purification steps by fluorogenic substrate 72
4.1 Oligonucleotides used for PEST fusion in Mb 92
4.2 Oligonucleotides used for fusion of ‘probable degrons’ to Mb 97
4.3 Effect of PEST fusion on physicochemical property of Mb 102
4.4 Sequence, calculated pI and M.W. of Mb fusion proteins 103
5.1 Oligonucleotides used to stabilize floppy helix 110
5.2 Calculated and mass obtained from MS of limited proteolysis
fragments
122
5.3 Thermodynamic parameters from the urea equilibrium unfolding 124
5.4 Comparison of wt holo, apo and apo F-helix mutants 125
6.1 Primer sequence used for A-helix mutation 132
6.2 Mb overlapping peptide library 134
6.3 Sequence and % inhibition of Mb peptides 137
6.4 Kd of wt and A-helix mutant proteins with 26S proteasome 138
7.1 Oligonucleotides used for Cys mutagenesis 144
7.2 Cys mutant, their helical interface and neighboring residues in 3D 145
7.3 Effect of secondary structure, Trp environment, melting temperature
(Tm) and affinity (Kd) of apoMb on proteasomal degradation
149

Chapter 1. Introduction and review Page 21
Chapter 1
Introduction and Review of
Literature

Chapter 1. Introduction and review Page 22
Proteasome is unusually large, multi-subunit, ATP dependent compartmentalized
protease. By regulating the functional concentration of cellular proteins, it regulates
almost all the cellular events. It also takes care of misfolded and damaged proteins and
in this way maintains homeostasis. Unlike other proteases, proteasome most of the time
completely degrade globular protein into small peptides. Proteasome also play an
important role in protein processing and antigen presentation. The most abundant
proteasome in eukaryotic cells are known as 26S proteasome consisting of protease
(20S) and regulatory component (19S). Globular proteins are targeted to proteasome
mainly by the covalent post translation modification, poly ubiquitination or by adaptor
proteins. Exposed unordered region in the protein is essential for efficient degradation.
Proteasome bound substrates are then presumably unfolded by proteasomal ATPases
which is further traslocated to the catalytic core. Substrate binding, release, chain
unfolding and translocation are all ultimately linked to degradation. Protein
modifications due to mutations, amino acid repeats and aberrant levels of substrate or
proteasome regulatory protein (E3 ligases) can adversely affect the efficiency at which
substrates are cleared and in turn could lead to several pathological consequences. In
recent years with the help of very few model substrates, some fundamental questions are
being addressed such as: a) what is the minimal length of Ub required, b) which
processes are ATP dependent, c) whether regulatory component communicate with the
proteolytic component, d) what are the requirement for efficient degradation etc. But,
still we are far from understanding the mechanistic details of protein degradation by
proteasome. There are two essential elements in the proteasomal degradation,
proteasome localization and presence of unordered or floppy region. Nevertheless, some
protein localized to proteasome but escape degradation. Some of the other unanswered
question are- a) how does unstructured region originate in a substrate, b) what is the

Chapter 1. Introduction and review Page 23
fundamental mechanism underlying the various steps involved in the degradation of a
substrate, its thermodynamic and kinetic parameters. Moreover, direct role of 26S
ATPases in protein unfolding has not been demonstrated till date.
1.1 Discovery of proteasomal machinery: Proteins are the essential
macromolecules that participate and regulate virtually every cellular process. The first
breakthrough in the field of protein degradation came in 1942, when Rudolph
Schönheimer postulated in his book ‘The Dynamic State of Body Constituents’ that
proteins are being constantly build up and broken down. Initially, lysosome was
believed to be solely responsible for cellular protein quality control machinery. In 1977,
while working on reticulocyte that lack lysosomes on maturation, Etlinger and Goldberg
for the first time established a cell free ATP dependent proteolytic system (Etlinger and
Goldberg, 1977). Ciechanover and Hershko fractionated the crude reticulocyte cell
extract on an anion-exchange resin as (APF)-I and II and found that combination of
both the fractions reconstituted the energy-dependent proteolytic activity (Ciehanover et
al., 1978; Hough et al., 1987). Later, APF-II was further sub-fractionated into APF-IIa
and APF-IIb. APF-IIb contained the E1-E3 ubiquitin conjugating enzymes and APF-IIa
was shown to contain proteasomes (Hershko et al., 1979). APF-I was identified as
ubiquitin (Wilkinson et al., 1980). Eventually, in 2004 Avram Hershko, Aaron
Ciechanover and Irwin rose were awarded for Nobel Prize in Chemistry for the
discovery of ‘Ub dependent degradation of protein’.
1.2 Proteasome regulates various cellular processes: For the healthy cell
survival, tight spatiotemporal regulation of cellular processes is an absolute mandate.
There are several ways by which cellular processes are regulated tightly. One of the
most important is degradation, which is by nature an irreversible process. In higher
eukaryotes, only membrane-associated proteins and alien proteins such as those of

Chapter 1. Introduction and review Page 24
bacterial and viral origin are destroyed by hydrolytic enzymes in lysosomes.
Degradation of the majority (80-90%) of intracellular proteins is regulated by the 26S
proteasome (Craiu et al., 1997; Rock et al., 1994). Depending on their function, the
half-life of cellular protein varies from minutes to years. Structural proteins are long
lived, while regulatory proteins are degraded in few minutes. For example, for cell cycle
progression specific cyclin must be quickly degraded so that another cyclin could play
its part. The proteasomal system is so specific and perfect that it only degrades cyclin A
or B from Cyclin-CDK complex and the CDKs are untouched (Nishiyama et al., 2000).
Proteasome regulates almost all the cellular processes such as cell cycle progression,
differentiation, apoptosis, DNA repair, cellular quality control, autophagy, regulation of
transcription and generation of peptides for antigen presentation (Glickman and
Ciechanover, 2002) (Table. 1.1). Proteasome maintain cellular homeostasis by
degrading globular proteins with high specificity. It not only regulates the functional
concentration of proteins in cytoplasm and nucleus but also takes care of misfolded,
unfolded, oxidized and unwanted proteins, thereby acting as ‘molecular sweeper’
(Glickman and Ciechanover, 2002) (Fig 1.1).
Table 1.1 Some of the cellular processes regulated by proteasome
Cellular process Regulatory proteins/proteasome substrate
Cell cycle Cyclins A, D, and E, p53, p21, p27, mdm2, HIF-1a
(major E3 ligases are SCF and APC complex)
DNA transcription I kappa B alpha, c-myc, c-Jun, c-fos, AP-1, STAT-1
DNA repair DNA-PKcs, rad 23
Apoptosis p53, p21, mdm2, bcl2, bax, caspase-3
Inflammation and
immunity
I kappa B, tumor necrosis factor-R1, processing of p105
Cell growth/ signal
transduction
Epidermal growth factor receptor, insulin-like growth factor
receptor, and platelet-derived growth factor receptor
ER associated
degradation
CFTR, misfolded protein

Chapter 1. Introduction and review Page 25
Figure 1.1 Proteasome regulates all most all the cellular process in the cell
The cellular machinery crosstalk with each other and are interdependent, any
defect in the master regulator (Ub-proteasome system) may lead to an imbalance
thereby resulting in several diseases and disorders (Dahlmann, 2007). The first human
disorder identified due to defect in the proteasome system was Angelman Syndrome.
Mutations in the E3 ligase, E6-AP has been shown to be the cause of this syndrome that
is characterized by mental retardation, seizures and abnormal gait (Kishino et al., 1997).
The G201V mutation in β4i (PSMB8) has been shown to be associated with Nakajo-
Nishimura syndrome (NNS); symptoms include periodic fever, skin rash, partial
lipomuscular atrophy and joint contracture (Arima et al., 2011). Also, uncontrolled
proteasomal degradation of tumor suppressors and stabilization of oncogenes have been
correlated with various cancers. One of the proteasome inhibitor, PS 134 (Velcade- a
boronic dipeptide) is being used for the treatment of leukemia. Apart from this, several
proteasome inhibitors are in different phases of clinical trials for several solid tumors
and diseases.

Chapter 1. Introduction and review Page 26
1.3 Architecture of 26S proteasome: 26S proteasome belongs to the family of
compartmentalized proteases where regulatory component and proteolytic components
may exist in free form (Baumeister et al., 1998). Substrate specificity is maintained by
regulatory component and their access to the free proteolytic core is generally forbidden
by close gate (Baumeister et al., 1998).
26S (S=Svedberg sedimentation coefficient) proteasome is 2.4 MDa multi-
specific, multi-subunit ATP dependent protease. It is composed of ~700 kDa 20S core
particle (CP) harboring proteolytic activity, sandwiched between two 19S regulatory
particles (Glickman and Ciechanover, 2002). The most abundant form of proteasome
found in the eukaryotic cell is the 26S proteasome. The 19S regulatory particle (RP) is
responsible for substrate recognition and unfolding of globular protein so that it can be
translocated to small gate at 20S core particle for degradation in to small peptides
(Glickman and Ciechanover, 2002). 20S CP can also associate with other regulatory
complexes like 11S and PA200 (Glickman and Ciechanover, 2002).
1.3.1 The 20S Core Particle: The 20S CP can be found either isolated or associated
with the 19S RP. Purified 20S is relatively stable than that of 26S. High resolution
structures of 20S proteasome are similar in archaea, mycobacteria, yeast and mammal
(Groll et al., 1997; Unno et al., 2002). 20S CP is structurally hollow barrel-shaped
composed of 28 subunits, arranged into four hetero-heptameric rings of ∼150 Å X
∼120 Å dimension (Groll et al., 1997). The complex is assembled from 14 gene
products and exhibits twofold (C2) symmetry with four stacked rings - two inner β rings
and two outer α rings, achieving overall stoichiometry of α1-7β1-7β1–7α1–7. The interior
surface of 20S CP forms a central channel along with three large cavities separated by
narrow constrictions. The two cavities between the α and β-subunit rings of ∼40 Å x
∼50 Å dimension is known as antechamber and apparently, store the substrate in

Chapter 1. Introduction and review Page 27
unfolded conformation (Ruschak et al., 2010; Sharon et al., 2006). The central catalytic
chamber of ∼40 Å x ∼55 Å dimension harbors the protease active sites. Proteasomes
belong to the N-terminal nucleophile (Ntn) family of hydrolases (Seemuller et al.,
1995). The γ-oxygen atom of the N-terminal Thr1, liberated by autolytic removal of
pro-peptide acts as the nucleophile, the α-amino group most likely acts as proton
acceptor in the hydrolysis of peptide bonds, while a water molecule is thought to shuttle
a proton between them (Seemuller et al., 1995). In eukaryotes only three of the seven β-
type subunits harbor N-terminal threonine residue required for proteolytic activity
making six active sites per 20S molecule. Like several other proteases, some of the β-
subunits are translated in premature form and later processed to the mature form. Each
active site can cleave a broad range of peptide sequences, β1 cleaves after acidic
residues (caspase like), β2 after basic residues (trypsin like), and β5 after hydrophobic
residues (chymotrypsin like) (Borissenko and Groll, 2007). Upon IFN-γ induction, β1,
β2, β5 are replaced by β1i, β2i, β5i and are referred to as immunoproteasome (Yewdell,
2005). Immunoproteasome is responsible for generation of peptides for antigen
presentation by MHC class I molecules (Yewdell, 2005). Combination of different
active sites of broad specificity ensures that the encounter of an unfolded substrate with
them will result in digestion of the substrate in small pieces. Repetitive sequences like
poly Q or Gly-Ala repeats have been shown to be resistance for proteolytic cleavage by
26S proteasome (Hoyt et al., 2006; Venkatraman et al., 2004). The size distribution of
released peptides is broad, ranging from 4 to 25 residues, with an average length of 7 to
9 residues.
Because the active sites face the interior surface of the CP, the substrates must
gain access to this space. The entry to 20S CP chamber is regulated by the N-terminal
tails of the α-subunits which form a 13Å gate (Groll et al., 1997) (Fig 1.2). In free 20S,
Chapter 1. Introduction and review Page 28
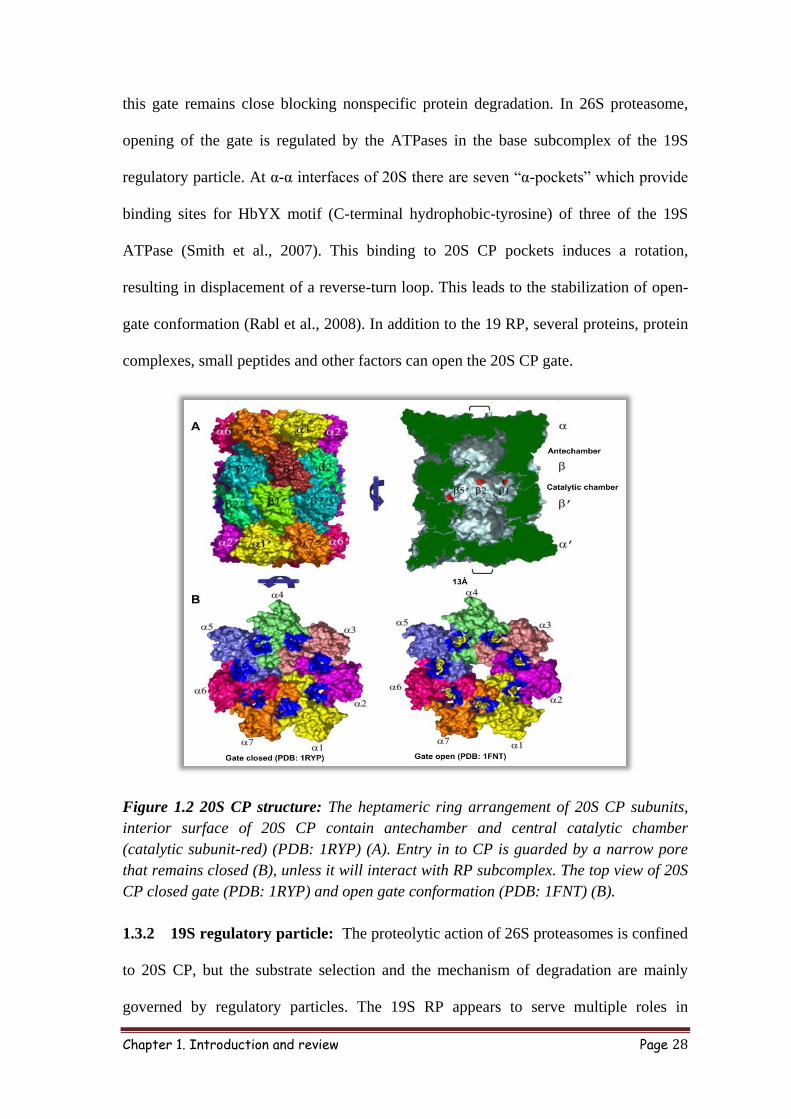
this gate remains close blocking nonspecific protein degradation. In 26S proteasome,
opening of the gate is regulated by the ATPases in the base subcomplex of the 19S
regulatory particle. At α-α interfaces of 20S there are seven “α-pockets” which provide
binding sites for HbYX motif (C-terminal hydrophobic-tyrosine) of three of the 19S
ATPase (Smith et al., 2007). This binding to 20S CP pockets induces a rotation,
resulting in displacement of a reverse-turn loop. This leads to the stabilization of open-
gate conformation (Rabl et al., 2008). In addition to the 19 RP, several proteins, protein
complexes, small peptides and other factors can open the 20S CP gate.
Figure 1.2 20S CP structure: The heptameric ring arrangement of 20S CP subunits,
interior surface of 20S CP contain antechamber and central catalytic chamber
(catalytic subunit-red) (PDB: 1RYP) (A). Entry in to CP is guarded by a narrow pore
that remains closed (B), unless it will interact with RP subcomplex. The top view of 20S
CP closed gate (PDB: 1RYP) and open gate conformation (PDB: 1FNT) (B).
1.3.2 19S regulatory particle: The proteolytic action of 26S proteasomes is confined
to 20S CP, but the substrate selection and the mechanism of degradation are mainly
governed by regulatory particles. The 19S RP appears to serve multiple roles in

Chapter 1. Introduction and review Page 29
regulating proteasomal activity e.g.: a) substrates recognition, b) presumably unfolding
and c) translocation to the 20S catalytic particle. It may even influence the nature of
products generated by proteolysis (Glickman and Ciechanover, 2002). The RP contains
about 19 subunits, which has been subdivided into the lid and base sub-complexes. A
10-protein ‘base’ sub-complex binds directly to the 20S α-ring activating gate opening,
and a 9-protein ‘lid’ sub-complex is involved in substrate recognition.
Figure 1.3 Architecture of 26S proteasome: The high resolution EM map of 26S
proteasome (A and B), lid subcomplex makes extensive interaction with base and the
CP (A). ATPases of base subcomplex for N-ring and AAA ring with a central pore for
substrate unfolding and translocation (C). Lid subcomplex form hand like structure and
play major role in placing Ub receptors Rpn 10 and 13 as well as DUb RNP11 (B and
D); on top of central channel formed by ATPases (C). [Adopted from- (Lander et al.,
2012)].
Although, 19S subunits have been identified and specific functions have been
assigned to some of them, the organization of the 19S complex remains unclear.
However, recent cryo-EM map by single particle analysis has provided glimpse of the

Chapter 1. Introduction and review Page 30
architecture of 26S holo-complex (9Å to 7.4Å) (Beck et al., 2012; Lander et al., 2012;
Lasker et al., 2012) (Fig. 1.3 and table 1.3). With the help of these EM maps, the
position of ATPases and Ub binding domain containing subunits could be assigned in
26S proteasome. One of the other key finding was the interaction of some of the lid
subunits directly to 20 CP. (Fig 1.3 A and B).
Table 1.2 19S regulatory particle, known domains and effect of deletion of on survival
AAA: ATPase associated with diverse cellular activities, ANK: ankyrin repeats, DUb: Deubiquitylating
enzyme, L: Deletion result in lethal phenotype in yeast, (L): Deletion result in embryonic lethality in
mouse, NL: non-lethal in yeast, (NL): non-lethal in mouse, MPN: Mpr1, Pad1 N-terminal, NLS: Nuclear
localization signal, NL: Deletion non-lethal in yeast,(NL): Deletion embryonically Non-lethal in mouse,
Ntn: N-terminal nucleophile hydrolase, PAC: Proteasome assembling chaperone, PAM: PCI associated
module, PC: proteasome/cyclosome repeat, HbYX: hydrophobic-tyrosine-X, PCI: proteasome,
COP9,eIF3, PDZ:DLG/ZO-1, PIPs: Proteasome interacting proteins, Pru: Pleckstrin-like receptor for
ubiquitin, VWA: Von Willebrand factor type A.
Budding
yeast Human
Activity or
domain type Lethality
Comments
(other names)
Rpt1 PSMC2 AAA L ATPase
Rpt2 PSMC1 AAA, HbYX L (NL) ATPase and gate opening
Rpt3 PSMC4 AAA, HbYX L (L) ATPase and gate opening
Rpt4 PSMC6 AAA L
Rpt5 PSMC3 AAA, HbYX L (L) ATPase and gate opening
Rpt6 PSMC5 AAA L
Rpn1 PSMD2 PC L PIPs scaffold
Rpn2 PSMD1 PC, NLS L PIPs scaffold
Rpn3 PSMD3 PCI, PAM L
Rpn5 PSMD12 PCI L
Rpn6 PSMD11 PCI, PAM L
Rpn7 PSMD6 PCI L
Rpn8 PSMD7 MPN L
Rpn9 PSMD13 PCI NL
Rpn10 PSMD4 VWA, UIM (2) NL (L) Ub receptor
Rpn11 PSMD14 MPN, JAMM L DUb
Rpn12 PSMD8 PCI L
Rpn13 ADRM1 Pru NL Ub receptor, Uch37 recruit
Shuttling proteasomal subunits
PSMD10 Ankyrin
PSMD9 PDZ NL PIP
Chapter 1. Introduction and review Page 31
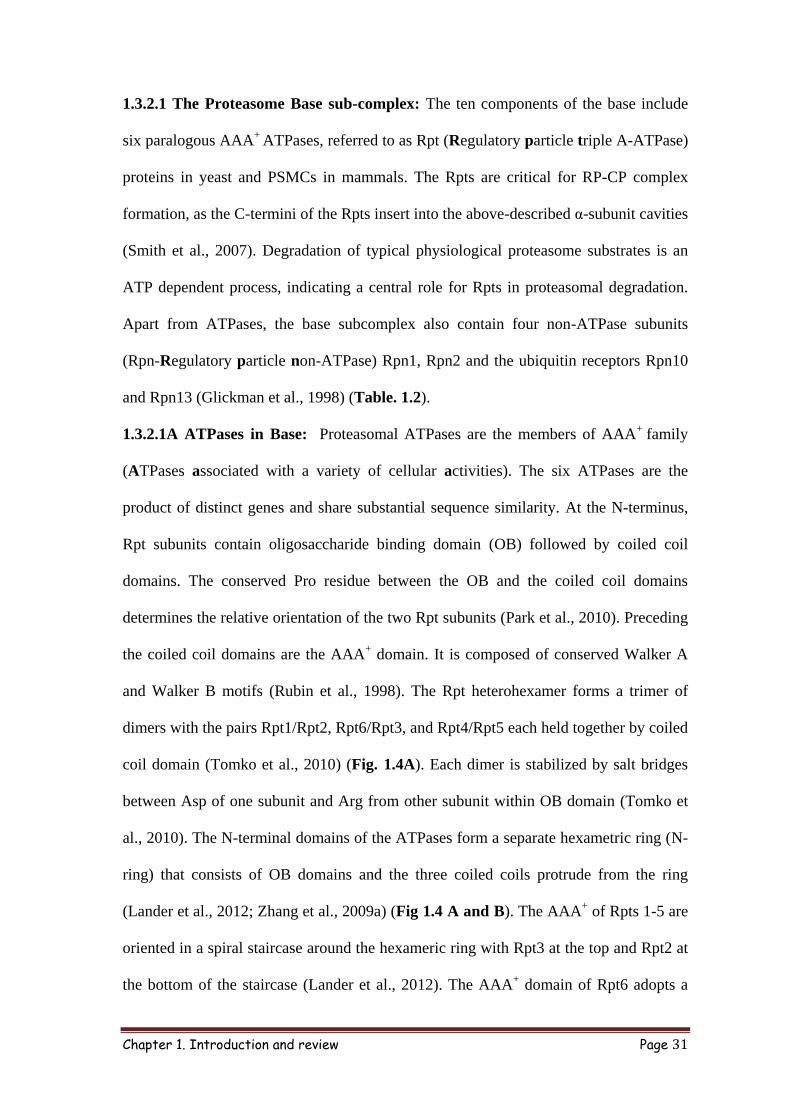
1.3.2.1 The Proteasome Base sub-complex: The ten components of the base include
six paralogous AAA+
ATPases, referred to as Rpt (Regulatory particle triple A-ATPase)
proteins in yeast and PSMCs in mammals. The Rpts are critical for RP-CP complex
formation, as the C-termini of the Rpts insert into the above-described α-subunit cavities
(Smith et al., 2007). Degradation of typical physiological proteasome substrates is an
ATP dependent process, indicating a central role for Rpts in proteasomal degradation.
Apart from ATPases, the base subcomplex also contain four non-ATPase subunits
(Rpn-Regulatory particle non-ATPase) Rpn1, Rpn2 and the ubiquitin receptors Rpn10
and Rpn13 (Glickman et al., 1998) (Table. 1.2).
1.3.2.1A ATPases in Base: Proteasomal ATPases are the members of AAA+
family
(ATPases associated with a variety of cellular activities). The six ATPases are the
product of distinct genes and share substantial sequence similarity. At the N-terminus,
Rpt subunits contain oligosaccharide binding domain (OB) followed by coiled coil
domains. The conserved Pro residue between the OB and the coiled coil domains
determines the relative orientation of the two Rpt subunits (Park et al., 2010). Preceding
the coiled coil domains are the AAA+ domain. It is composed of conserved Walker A
and Walker B motifs (Rubin et al., 1998). The Rpt heterohexamer forms a trimer of
dimers with the pairs Rpt1/Rpt2, Rpt6/Rpt3, and Rpt4/Rpt5 each held together by coiled
coil domain (Tomko et al., 2010) (Fig. 1.4A). Each dimer is stabilized by salt bridges
between Asp of one subunit and Arg from other subunit within OB domain (Tomko et
al., 2010). The N-terminal domains of the ATPases form a separate hexametric ring (N-
ring) that consists of OB domains and the three coiled coils protrude from the ring
(Lander et al., 2012; Zhang et al., 2009a) (Fig 1.4 A and B). The AAA+ of Rpts 1-5 are
oriented in a spiral staircase around the hexameric ring with Rpt3 at the top and Rpt2 at
the bottom of the staircase (Lander et al., 2012). The AAA+ domain of Rpt6 adopts a

Chapter 1. Introduction and review Page 32
tilted orientation, bridging Rpt2 and Rpt3 (Fig. 1.4 C). The coiled coils formed by
Rpt1/2 and Rpt4/5 are flexible and can undergo 40º swinging motions. It is
hypothesized that this will allow them to grab substrates bound to Rpn10 and Rpn13 via
ubiquitin chains (Lasker et al., 2012) (Fig. 1.4A).
Table 1.3 Summary of 26S proteasome EM Map
Reports (Lander et al., 2012) (Lasker et al., 2012) (Beck et al., 2012)
Organism S. cerevisiae S. pombe S. cerevisiae
Resolution 9 Å 8.5 Å 7.4 Å
Source Recombinant lid and 26S was
purified for cell
Purified Purified
Assumption C2 symmetry C2 symmetry No C2 symmetry
Analysis Reconstituted lid, helped in
localization of lid subunits.
Subunit position was
determined by means of fusion
constructs and automated
segmentation methods. Based
on PAN structure, Rpts were
docked on EM map of the 19S.
Yeast two hybrid, cross-
linking data, known
subunit structure were
compiled, extensive
computational methods
were used to get and score
possible configurations.
These data were further
used for subunit position
docking of comparative
models of the subunits in
EM map and refined by
flexible fitting.
C2 symmetry is
confined to 20S due to
the presence of PIPs.
both 19S may not be
identical. EM map in
conjunction with
molecular dynamics-
based flexible fitting to
build holocomplex
model.
Lid Lid subunits from Hand-like
structure where five PCI
subunits (Rpn3,7,6,5 and 9)
form the fingers. Rpn11 lies in
the palm of the hand and
interact with Rpn8 which
connects Rpn3 and Rpn9. As
compared to free lid, large
conformational changes were
observed in Rpn8 and 11 in
holocomplex. This may regulate
DUb activity of Rpn11.
The six PCI subunits
(Rpn3,5,6,7,9 and 12) form
horseshoe like structure
covering a large part of the
ATPase (Rpt3,6, and 4) as
roof. The subunit order in
the horseshoe is
Rpn9/5/Rpn6/7/Rpn3/2.
The PCI subunits form
a scaffold that
positions the Rpn8/11
heterodimer in close
vicinity to the mouth of
ATPase and anchor the
RP to the CP.
ATPase The C-terminal ‘small AAA+’
subdomains (Rpt 1-5) arrange
in one plane above the 20S
core, ‘large AAA+’ subdomains
(Rpt1–5) are oriented in a spiral
staircase around the hexameric
ring, with Rpt3 at top and Rpt2
at the bottom. The AAA of
Rpt6 adopts a tilted orientation
and bridge Rpt2 and Rpt3.
Several lid subunits (Rpn6, 5
and 7) interact directly with
AAA+ domains of the Rpts.
Rpn10 and Rpn13 are
positioned above the coiled
coils of the Rpt4/5 and
Rpt1/2 dimers,
respectively. Rpt1/2 and
Rpt4/5 coils can undergo
40º swinging motions to
grab substrates bound to
Rpn10 and Rpn13 via
ubiquitin chains.
The coiled coil of
Rpt6/3 is less flexible
as it interacts with PC-
domain of Rpn2 and a
large coiled-coil bundle
formed by the C-
termini of the lid.
Rpt1/2 coiled coils
appear to interact with
Rpn1 while the coiled
coil of Rpt4/5 doesn’t
interact with any Rpn
subunit.

Chapter 1. Introduction and review Page 33
It has been shown that ATP binding and hydrolysis play different roles in 26S
proteasome. In presence of non-hydrolysable analogue of ATP (ATPγS), 26S
proteasome was able to translocate and degrade unfolded and denatured proteins, while
there was no degradation of globular proteins (Benaroudj et al., 2003). This observation
suggests that unfolding requires energy from ATP hydrolysis, whereas ATP binding
alone may be sufficient for 19S-20S association, gate opening, and probably
translocation of unfolded substrates (Liu et al., 2006).
Figure 1.4 Architecture of proteasomal ATPases: Proteasomal ATPases form dimer of
trimer (Rpt1/2, Rpt 3/6 and Rpt 4/5) (A). The atomic model of the AAA-ATPase, based
on EM map showed that ATPase complex form N-ring of larger pore size (B) while
AAA-ring which is arranged as spiral staircase like structure (C) Rpt1/2 and Rpt4/5
coils can undergo 40º swinging motions to grab substrates bound to Rpn10 and Rpn13
via ubiquitin chains (A). (Dark blue: Rpt1/6/4; light blue: Rpt2/3/5, Walker A-red and
Walker B-orange). [Adapted from- (Beck et al., 2012)].
1.3.2.1B Non-ATPase in base: The non ATPases of base subcomplex include the
scaffolding proteins Rpn1 and Rpn2 and the ubiquitin receptors Rpn10 and Rpn13
(Glickman et al., 1998). Rpn1 and 2 are the largest proteasomal subunits and contain
proteasome cyclosome (PC) repeats (Kajava, 2002) (Table. 1.2). In recent EM
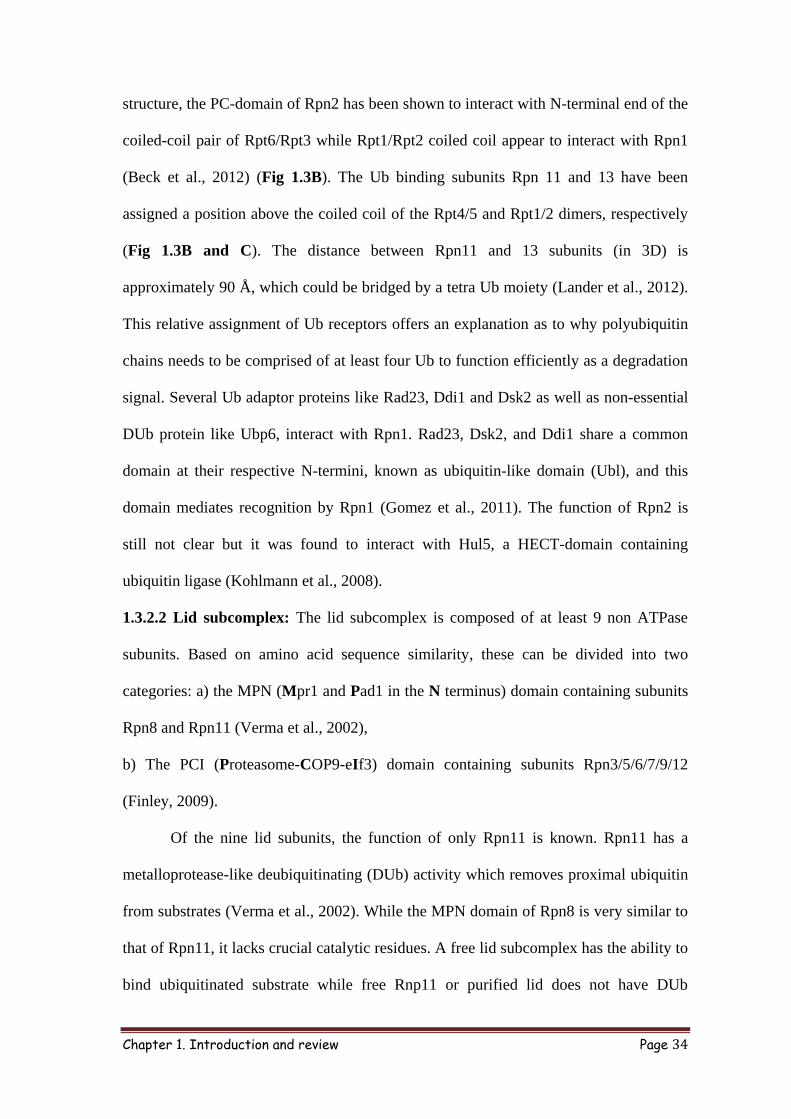
Chapter 1. Introduction and review Page 34
structure, the PC-domain of Rpn2 has been shown to interact with N-terminal end of the
coiled-coil pair of Rpt6/Rpt3 while Rpt1/Rpt2 coiled coil appear to interact with Rpn1
(Beck et al., 2012) (Fig 1.3B). The Ub binding subunits Rpn 11 and 13 have been
assigned a position above the coiled coil of the Rpt4/5 and Rpt1/2 dimers, respectively
(Fig 1.3B and C). The distance between Rpn11 and 13 subunits (in 3D) is
approximately 90 Å, which could be bridged by a tetra Ub moiety (Lander et al., 2012).
This relative assignment of Ub receptors offers an explanation as to why polyubiquitin
chains needs to be comprised of at least four Ub to function efficiently as a degradation
signal. Several Ub adaptor proteins like Rad23, Ddi1 and Dsk2 as well as non-essential
DUb protein like Ubp6, interact with Rpn1. Rad23, Dsk2, and Ddi1 share a common
domain at their respective N-termini, known as ubiquitin-like domain (Ubl), and this
domain mediates recognition by Rpn1 (Gomez et al., 2011). The function of Rpn2 is
still not clear but it was found to interact with Hul5, a HECT-domain containing
ubiquitin ligase (Kohlmann et al., 2008).
1.3.2.2 Lid subcomplex: The lid subcomplex is composed of at least 9 non ATPase
subunits. Based on amino acid sequence similarity, these can be divided into two
categories: a) the MPN (Mpr1 and Pad1 in the N terminus) domain containing subunits
Rpn8 and Rpn11 (Verma et al., 2002),
b) The PCI (Proteasome-COP9-eIf3) domain containing subunits Rpn3/5/6/7/9/12
(Finley, 2009).
Of the nine lid subunits, the function of only Rpn11 is known. Rpn11 has a
metalloprotease-like deubiquitinating (DUb) activity which removes proximal ubiquitin
from substrates (Verma et al., 2002). While the MPN domain of Rpn8 is very similar to
that of Rpn11, it lacks crucial catalytic residues. A free lid subcomplex has the ability to
bind ubiquitinated substrate while free Rnp11 or purified lid does not have DUb

Chapter 1. Introduction and review Page 35
property (Verma et al., 2002). In light of recent high resolution EM map, large
conformational change was observed in Rpn8 and 11 between free lid and in
holocomplex (Lander et al., 2012). This change has been proposed to regulate DUb
activity of RNP11. In 26S holocomplex, Rpn8 interacts with Rpt3/6 pair while Rpn11
interacts with Rpn1 of base subcomplex. Some of the lid subunit have been shown to
directly interact with AAA+, e.g. Rpn 7 interact with AAA
+ domain Rpt2 and 6 while
Rpn6 and 5 with Rpt 3 (Beck et al., 2012). Lid subunits form hand-like structure where
five PCI subunits (Rpn3, Rpn7, Rpn6, Rpn5 and Rpn9) form the fingers and Rnp11
palm (Lander et al., 2012). Rpn8 not only connects Rpn3 and Rpn9 but also the palm of
the hand Rpn11 (Lander et al., 2012). The six PCI subunits form horseshoe-like
structure covering a large part of the ATPase (Rpt3, Rpt6, and Rpt4) in form of a roof
(Lasker et al., 2012). The subunit order in the horseshoe heterohexamer is Rpn9/Rpn5/
Rpn6/Rpn7/Rpn3/Rpn12 (Lasker et al., 2012). PCI subunits have scaffolding function
and also play important role in maintaining inter subunit contacts, thereby stabilizing
base, lid and 19S with 20S. The scaffold formed by PCI subunits also positions the
Rpn8/Rpn11 heterodimer in close vicinity to the mouth of ATPase ring, so that the
engaged substrate can be deubiquitinated before entering translocation channel. The
Rpn2 from base is thought to help in stabilization of lid conformation with the help of
Rpn3, Rpn8 and the Rpn11 which extend towards the base. Unlike conventional model
recent EM Map also showed that lid subunits interact directly with 20S CP (Lander et
al., 2012). It seems that the function of PCI subunit is to bring the essential machinery
in 3D space, necessary for efficient degradation (Fig. 1.3A and B).
1.4 Proteasome degradation pathways: In eukaryotic cells proteins are degraded by
proteasome by various ways but broadly it could be divided into-
a) Classical pathway (Ub dependent) and

Chapter 1. Introduction and review Page 36
b) Non classical pathway (Ub independent and processing). While Ub dependent
pathway is well understood, recent reports suggest proteasome can also degrade
substrate without Ub tag.
1.4.1 Ubiquitin dependent proteasomal degradation: Ubiquitin (Ub) is an
evolutionarily conserved 76-residue protein. Protein ubiquitination is one of the very
important post translation modifications. There are 7 Lys residues in Ub, while chains
of four or more Ub linked mostly through K48, tag the protein for degradation, other
linkages and mono Ub, are associated with other cellular functions (Hicke, 2001;
Weissman, 2001). Ub modification is multistep, energy consuming process. In the first
step, Ub gets activated by E1 enzyme (activating enzyme) in the presence of ATP
forming Ub-E1 thiolester. This can be recognized by several E2 enzymes (conjugating
enzyme) and Ub is transferred by another thiol ester linkage. E2 enzymes help in
bringing activated Ub to the substrate. Finally, E2 enzymes associate with E3 enzymes
(Ub ligase) which are responsible for the final target selection and specificity. With
some exception, E3 enzymes can be broadly classified into two distinct families: a)
HECT domain (Homologous to E6-AP carboxyl terminus) family, which forms a
covalent (thiolester) bond with the ubiquitin before transferring it to the substrate. b)
RING domain (really interesting new gene) contain Cys and His residues that co-
ordinate two metal atoms (Pickart, 2001; Weissman, 2001). As compared to HECT
domain ubiquitination by RING finger E3 family involves direct transfer of Ub from
Ub-E2 complex to the targeted protein without the addition of thiolester.
E3 ligase sequentially attaches other Ub molecules on the Lys residue of the first
Ub molecule. Poly-ubiquitination of some of the substrates is assisted by U-box-domain
containing E3 ligases (also called E4 ligases) (Hoppe, 2005). After the attachment of
multi Ub degradation tag, substrates are recruited to proteasome. There are five Ub

Chapter 1. Introduction and review Page 37
receptors currently known to be associated with the proteasome, two of them are
proteasome subunits (Rpn10 and Rpn13). Rad23, Dsk2, and Ddi1 contain Ub binding
domain as well as Ubl domain with which these ‘shuttling’ or adaptor proteins interact
with 19S RP (Gomez et al., 2011). The Ub tags are removed before substrate unfolding
and degradation by Cys protease family member called DUb enzyme (Rnp11) (Fig. 1.5)
(Verma et al., 2002).
Figure 1.5 Ub dependent and independent proteasomal degradation: When the
substrates are ready for degradation, they are either targeted to proteasome through
Ub dependent or independent manner. Several adaptor proteins may help in recruiting
substrate to the proteasome. The essential loosely structured or unstructured (Cis-
acting) element may originate from substrate during or before targeting it to the
proteasome system.
1.4.2A Ub independent proteasomal degradation: Most of the well-studied
proteasomal substrates are degraded by Ub-dependent pathway. However, recently
several substrates have been identified which do not follow the classical pathway. The
non-classical proteasomal degradation can be broadly grouped into following: a) Ub-

Chapter 1. Introduction and review Page 38
independent degradation (also include degradation directly by 20S CP) b) Protein
processing. Generally, unfolded or oxidized proteins do not need the help of 19S RP.
The role of Ub is presumably done by exposed hydrophobic regions in the unfolded
proteins. In case of Ub independent degradation of globular proteins, these are recruited
to proteasome by ‘adaptor’ or ‘shuttling proteins’ (Chattopadhyay et al., 2001) (Table
1.5). Apart from adaptor protein, substrate must contain an ‘unstructured region’ for
efficient degradation (Prakash et al., 2004) (Fig. 1.5). Recently, several non-classical
proteasome substrates have been identified, for example-ornithine decarboxylase
(ODC), Thymidylate synthase, α-synuclein, p21Cip1
, tau, proteasome substrate RPN4,
p53, p73, HIF-1α, Rb, p105 subunit of NF-kB, pertussis toxin, NFAT5, Aurora-
Akinase, pp89, KLF5, hepatitis C virus (HCV) F protein, c-Jun, calmodulin (CaM) and
troponin C (Finley, 2009; Sorokin et al., 2009). Many of these substrates are degraded
by both Ub dependent as well as independent pathways. In these cases, it is difficult to
predict which pathway is default; probably it is mainly dependent on the signal and cell
type. Several viral proteins also have been found to play key role in proteasomal
degradation by regulating the dependence of Ub for proteasome degradation. Few
important substrates that follow Ub independent pathways is discussed below (and
Table 1.4):
ODC: Ornithine decarboxylase (ODC) was the first example of Ub-independent
degradation of a globular protein (Bercovich et al., 1989; Rosenberg-Hasson et al.,
1989). ODC degradation was ATP-dependent and regulated by a protein called
antizyme 1 (AZ1) (Pegg, 2006). ODC is the initial enzyme in the polyamines
biosynthesis. In response to excess cellular polyamines, level of AZ1 increases and
binds to ODC, resulting in destruction of enzymatically active homodimer of the same.
This eventually leads to ODC degradation. It was shown that the formation of the

Chapter 1. Introduction and review Page 39
ODC/AZ1 complex induces the exposure of the 37-residues from ODC C-terminus,
which increases the efficiency of proteasomal recognition (Ghoda et al., 1989). C-
terminus of ODC has been shown to harbor two recognition elements - the sequence
ARINV along with C441 forms one recognition element while AZ1 in conjunction with
other residues constitute a second recognition element. ODC/AZ1 complex compete
with Ub for proteasome interaction (Takeuchi et al., 2008). AZ1 was later shown to
regulate the intracellular half-life of several substrates (Sorokin et al., 2009). Fusion of
ODC C-terminus to the GFP has been shown to shorten its intracellular half-life (Corish
and Tyler-Smith, 1999).
p53: Wt p53 is the most studied tumor suppressor that accumulates in response
to DNA damage as well as other types of stress and induce either growth arrest or
apoptosis. Mutation in p53 and its regulator has been associated with at least 50% of the
cancers. p53 has been shown to be regulated both by Ub dependent and independent
processes. Several E3 ligases have been shown to regulate half-life of p53. Some of
these include Mdm2, E6-AP/E6, ARF-BP1, COP1, CHIP, Pirh2 and Topors (Sorokin et
al., 2009). The role of these ligases is mostly cell type dependent and their elevated
levels have been directly correlated with different types of cancers. Mdm2, one of most
popular E3 ligases, belongs to RING domain E3 ligase. It directly binds to N-terminus
of p53 and targets it for Ub-dependent degradation; or associate with gankyrin
(PSMD10) and PSMC4 to promote p53 ubiquitination and degradation (Brooks and Gu,
2006; Marine and Lozano, 2010). In cervical cancer, E6 protein of HPV (Human
papilloma virus), p53 and E6-AP (E6-associated protein or Ubiquitin-protein ligase
E3A) form a ternary complex and E6-AP ubiquitinates p53 for degradation (Camus et
al., 2007). In p53 there are two binding sites for E6 protein; one is in the DNA-binding
domain and other at the C-terminus. The existence of alternative pathway was observed

Chapter 1. Introduction and review Page 40
when in Ub-defective system (thermo sensitive E1 or ectopic expression of lysine-less
Ub), p53 was not completely stabilized. E6 has also been shown to degrade p53 in Ub
independent manner (Camus et al., 2007). Another p53 regulator is NQO1 (NADH
quinone oxidoreductase 1), which binds to p53 in NADH-dependent manner.
Interestingly, the presence of competitive inhibitor of NQO1 (dicoumarol) results in
dissociation of the NQO1-p53 complex and p53 becomes highly unstable and degraded
by 20S CP (Anwar et al., 2003; Asher et al., 2002; Asher et al., 2003).
NQO1 has been found to co-elute with 20S but not with 26S proteasome. This
association has been shown to prevent the degradation of several proteins, such as p53,
p73, and ODC. NQO1 plays the role of ‘gatekeeper’ of the 20S proteasome and
degradation is dependent on NADH concentration, at high levels of NADH substrates
are protected and does not enter the 20S CP (Asher et al., 2005).
Table 1.4 Examples of Ub-independent degradation and their regulators
Substrate Proteasome Regulators Remarks
ODC 20S and 26S NQO1(-) and AZ1(+) C-terminal 37 amino acids are
essential
Cyclin D1 26S AZ1 (+) in vitro experiment
Aurora-A
kinase
AZ1 (+) and Aurora-A
kinase-interacting protein 1
(+)
p21CIP1 PA28γ-20S,
20S and 26S
Cyclin D1, HSP90/WISp39
(-) and MDM2 (+)
Binds α7 subunit of 20S
directly, co-eluted with both
20S and 26S
c-Fos Phosphorylation of C-
terminal S364 and 374 by
Rsk1/2 and Erk1/2 (-)
C-terminal destabilization
region (Ub-independent
degradation of nuclear c-Fos)
Fra 1 C-terminal 30-40 residues
are essential
C-terminal destabilization
region
p53 20S and 26S NOQ 1(-), E6/E6AP (+) Exposed C terminus result in
E6 and NOQ1 independent
degradation.
HIF-1α 20S and 26S Acetylated Hsp90 and
Hsp70 (+) leads to improper
folding of HIF protein.
Depending on oxygen
concentration follow deferent
degradation path
Rb 20S MDM2(+) Rb MDM2 bind to α7 of 20S
Thymidylat
e synthase
No known regulators N-terminal 30 residue are
important
SRC-
3/AIB1
PA28γ-20S HAT domain of SRC-3 binds
to PA28γ

Chapter 1. Introduction and review Page 41
Rb: Both Ub-dependent and Ub-independent degradation mechanisms have
been described for Rb. Several viral proteins like E7 (HPV), EBNA3C (Epstein Barr
virus) and NS5B (hepatitis C virus) have been shown to enhance the degradation of Rb.
Human cytomegalovirus (HCMV) protein pp71 has been shown to help in Ub
independent degradation of Rb (Kalejta and Shenk, 2003). There are two contradictory
reports regarding the role of Mdm2 in Rb degradation. It was demonstrated that Mdm2
binds to the hypophosphorylated Rb and enhances its ubiquitination (Sdek et al., 2004;
Uchida et al., 2005). On the other hand, Rb was found to be part of 20S CP/ Mdm2
complex. Both the RING-domain of Mdm2 and C-pocket of Rb were found to be
necessary for binding of α7 of 20S CP, leading to degradation of Rb (Sdek et al., 2005).
There are two possibilities, either Mdm2 regulates Rb degradation by both the pathway
simultaneously or its Ub dependent or independent action is cell type dependent.
p21Cip1
: p21Cip1
is the inhibitor of cyclin-dependent kinase that was shown to be
degraded in Ub-dependent manner. But, Lys less p21Cip1
(non-ubiqutinable) has also
been shown to be degraded by proteasome (Sheaff et al., 2000). In some cell lines,
different RP like PA28γ has been found to be associated with Ub-independent
degradation of p21Cip1
(Chen et al., 2007). In some cases p21Cip1
was degraded directly
by 20 CP, by interaction of its C-terminus with α7 of the 20S CP (Touitou et al., 2001).
M140: Murine cytomegalovirus (MCMV) US22 family genes M36, M139,
M140, and M141 promote efficient replication of the virus in macrophages. A PEST
sequence was identified in the C-terminal region of pM141 (360-378) which was
responsible for its proteasomal degradation. The residues 306-380 of pM141 contain
pM140 binding region (Bolin et al., 2010). Binding of pM140 protects its binding
partner, pM141, from degradation by the proteasome in ubiquitin-independent manner
(Bolin et al., 2010).

Chapter 1. Introduction and review Page 42
Thymidylate synthase (TS): It catalyzes the conversion of dUMP to dTMP,
essential for DNA replication. The intracellular half-life of TS is 10-12 hour (Kitchens
et al., 1999). The proteasomal degradation of Lys less mutant of TS showed that TS
degradation is independent of Ub. Mutagenesis studies have demonstrated that the N-
terminal 30 residue contains the primary half-life determinant of TS and that
penultimate Pro2 residue is necessary for degradation (Pena et al., 2006).
1.4.2B Protein Processing: The classical proteasomal degradation mechanism involves
substrate localization to proteasome, unfolding and degradation into small peptides. The
degradation progresses through N to C or C to N terminus and in some case by
endoproteolysis. Sometimes proteasomal degradations are non-processive and a stable
domain may escape degradation. It was shown that three polypeptide chains may enter
the catalytic chamber simultaneously. The endoproteolytic activity and non-processive
proteasomal degradation was demonstrated with the help of synthetic substrate where
proteins α-synuclein and/or p21Cip1 were fused to the C and/or N-termini of GFP
protein (GFP-α-synuclein, GFP-p21Cip1 or α-synuclein-GFP, p21Cip1-GFP) (Liu et
al., 2003). The α-Synuclein and p21Cip1 are unstructured proteins and have been shown
to be degraded by 20S or 26S proteasome in ub-independent manner. GFP on the other
hand is a structured protein. The 20S and 26S proteasomes were able to degrade only
the unstructured part (α-synuclein or p21Cip1) leaving GFP intact. This demonstrated
that the substrate can be degraded by the proteasome from either end of the polypeptide
chain and during this process encounter with stable domain may lead to incomplete
degradation leaving stable part intact. When GFP was fused to both the termini (GFP-α-
synuclein-GFP and GFP-p21Cip1-GFP) only unstructured protein was degraded leaving
GFP intact (Liu et al., 2003). This clearly indicates that proteasome can degrade
substrate even from internal region (endoproteolysis).

Chapter 1. Introduction and review Page 43
Figure 1.6 Classical and non-classical proteasomal degradation: Due to elevated
intracellular level of product formed by ODC, AZ1 level increases, it binds to ODC.
Binding of AZ1 to ODC exposes C-terminal PEST sequences essential for degradation
in Ub independent manner (A). p53 is targeted for degradation by various E3 ligases
(Mdm2), it was also degraded with the help of viral protein E6 and cellular protein
E6AP by both Ub dependent or independent manner (B). Sometimes proteasome help in
generation of active form of the protein. Processing of p150 starts from an internal
region in the protein and N-terminus is protected by stop signal GRR, while C-terminus
is degraded by proteasome (C).
Proteasome regulates the function of several proteins by processing and/or
providing mature polypeptide; this action can also be dependent or independent of Ub.
Some of the examples are given below-
NF-kB p105: NF-kB is a dimeric transcription factor. It controls the expression
of a wide range of genes. Besides, depending on cell type and condition they regulate
cell proliferation or apoptosis. The NF-kB family consists of five members: p50, p52,
p65/RelA, c-rel, and RelB. Of these p50 and p52 are formed as a result of processing
from precursors p105 and p100 respectively. The p105 processing can be performed
both by the 26S proteasome and 20S CP (Coux and Goldberg, 1998). p105 is composed
of 4 domains: the N-terminal domain (NTD), the dimerization domain (DimD), ankyrin-

Chapter 1. Introduction and review Page 44
repeat domain (ARD) and a death domain (DD). The DimD and ARD domains are
connected through a 180-residue long flexible region and acts as site of processing and
the N-terminus of this region contains a glycine-rich region (GRR) that acts as stop
signal (Orian et al., 1999). External stimuli activates IkB kinaseβ, which
phosphorylates p105 at residues Ser927 and Ser932, thereby triggering its proteasomal
degradation. 20S CP was also shown to generate p50 from p105 in vitro (Moorthy et al.,
2006). In this case, the processing begins from the unstructured region of p105 by
endoproteolysis. However, due to the presence of GRR the degradation of N-terminal
region is prevented while C-terminal region was degraded.
Y-box-binding protein 1 (YB-1): YB-1 is a DNA/RNA-binding nuclear-
cytoplasmic shuttling protein. In the nucleus, it has been implicated in a variety of
functions, including transcription, replication, DNA repair, DNA recombination and
alternative pre mRNA splicing. In the cytoplasm, YB-1 is involved in various aspects of
mRNA metabolism. The cleavage of YB-1 by 20S into two fragments was shown in
vitro, but in cells mostly the N- terminal fragment is predominant. This may be due to
the degradation of C-terminal fragment. The cleavage is performed by the caspase-like
activity (after Glu219) of the 20S CP (Sorokin et al., 2005). After the proteasome
processing, the N-terminal fragment of YB-1 gets accumulated in the nucleus (C
terminal region contain cytoplasmic retention signal). Besides this processing, the full
length protein may undergo complete degradation by proteasome. It seems, the
functional amount of YB-1 in the cell is controlled by the Ub-dependent degradation,
whereas in presence of certain stimuli or condition, it is processed.
eIF4G and eIF3a: elF4G and elF3a are translation initiation factors. In rabbit
reticulocyte lysates, the fragments of eIF4G (factor eIF4F) and eIF3a (factor eIF3) were
found. It was shown in vitro that the 20S proteasome was able to cleave eIF4G and

Chapter 1. Introduction and review Page 45
eIF3a in Ub independent manner and inhibited the translation of mRNAs that are
dependent on these factors (De Benedetti and Graff, 2004; Dong and Zhang, 2006).
Table 1.5 Adaptors in proteasomal degradation
Ub-dependent degradation
Name Proposed role
Rad23 Contain N-terminal Uba (binds proteasome) and C- terminal Ubl domain (bind
Ub). Act by increasing local proteasome concentration in regions where quick
degradation is necessary (at the site of DNA damage) or increase the
ubiquitinated substrate concentration for quick degradation.
Dsk2
Ddi1
NUB1
Other Adaptors of Ub-dependent degradation
Name Proposed role
Cdc48/p97 ATP dependent chaperone may help in substrate unfolding.
E3 ligases Increase substrate concentration as well as Ub length.
Ub-independent degradation
Name Proteasome substrates
AZ1 ODC, Arora Kinase A, Cyclin D1
HBZ
FAT10 Also proteasome substrate
NOQ1 ODC, p53, p73
1.5 DEGRADATION SIGNALS
Degradation signals are a major determinant of a protein’s lifespan. The widely used
degradation signal in archaea and prokaryotic system is ssRA. In bacterial system, ssRA
tagging occurs when a ribosome gets stuck due to truncated mRNA. It cannot detach
from the defective mRNA without a termination codon. A special type of RNA known
as ssRA ("small stable RNA A") or tmRNA ("transfer-messenger RNA") rescues the
ribosome by adding an eleven codon degradation tag followed by a stop codon (Keiler
et al., 1996; Tu et al., 1995). This allows the ribosome detachment from truncated
mRNA and ssRA tagged incomplete protein then gets degraded by the proteases ClpXP
or ClpAP. Although the originally identified ssRA/tmRNA tag had the sequence
AANDENYALAA, additional designed degradation tags that differ in the last three
residues (AAV, ASV, LVA, LAA) have been found to affect protein half-lives.
In eukaryotic system, ssRA like sequence is not identified till date. The N-end
rule degron was the first degradation signal identified in eukaryotes. Other degradation

Chapter 1. Introduction and review Page 46
signals that have been studied in detail are the Ub tagging signal (like phosphorylation),
the PEST sequence, and the destruction box. According to the N-end rule the nature of
the N-terminal amino acid defines the half-life of a protein. Newly synthesized proteins
normally contain an N-terminal methionine. To create an N-end rule degradation signal,
the stabilizing Met at the N-terminus has to be removed. Depending on their N-terminal
amino acid, the half-lives of proteins range from a few minutes to hours (Bachmair et
al., 1986).
Some substrates harbor a non-cleavable N-terminal ubiquitin that functions as a
degradation signal itself. Ufd4 and Ufd2, which are an E3 and E4 ligase, respectively,
recognize these and help in degradation.
The anaphase promoting complex (APC) is a multi-subunit E3 protein. APC is
responsible for ubiquitination of cell cycle regulators at the metaphase-anaphase and
mitosis-G1 transitions. APC substrates (like cyclin A and B) contain two degradation
motifs: destruction box (D-box- RTVLGVIGD) and KEN box (Glotzer et al., 1991;
Yamano et al., 1998). Most APC substrates contain D-box and are degraded quickly by
proteasome.
Proteins with short intracellular half-life contain a region rich in Pro, Glu, Ser
and Thr, these regions are called as PEST sequences (Rechsteiner and Rogers, 1996;
Rogers et al., 1986; Wang et al., 2003). PEST sequences are hydrophilic stretches, about
12 amino acids in length and contain at least one Pro, one Glu or Asp and one Ser or
Thr. They are flanked by Lys, Arg or His residues, but positively charged residues
should not be present within the PEST sequence.
Most of these degradation signals are the signal for ubiquitination. Degradation
signal similar to ssRA have not been identified in higher organism.

Chapter 1. Introduction and review Page 47
1.6 MODELS OF SUBSTRATE UNFOLDING AND TRANSLOCATION BY
PROTEASOME
Like other compartmentalized protease and due to the fact that folded proteins cannot
enter the narrow catalytic core it was thought that ATPases of 19S RP unfolds the
substrate. But whether unfolding and translocation are separate events or concurrent and
whether these processes are inter-dependent is largely unknown. There are two schools
of thoughts about the unfolding and translocation.
Model I proposes that unfolding occurs on the surface of the proteasome and
that translocation is a distinct process that can begin only when unfolding will generate
the unstructured region required to enter translocation channel. Studies carried out with
the PAN protease are in agreement with this model (Navon and Goldberg, 2001). This
model emphasizes on establishment of multiple contacts between the substrate and the
surface of the ATPase ring as well as ATP-driven motion within the ring, which
mechanically unfolded the substrate.
An alternative model proposes that unfolding of the substrate is driven by its
interactions within the translocation channel. Unfolding occurs due to translocation,
which is induced by pulling action of the translocation motor on the substrate. Model II
is simplistic because it reduces unfolding and translocation to a single process for which
a single strong interaction site is sufficient (Pickart and Cohen, 2004; Prakash et al.,
2004).
The mechanism of substrate unfolding has not been clearly elucidated for 26S
proteasome. Some clues can be derived from PAN-20S system, where GFP-ssRA
unfolding and degradation has been demonstrated and this process was found to be
dependent on ATP hydrolysis. PAN alone was able to unfold GFP-ssRA but PAN-20S
accelerated this processes without affecting the rate of ATP hydrolysis (Navon and

Chapter 1. Introduction and review Page 48
Goldberg, 2001). Interestingly blocking the proteolytic activity of 20S affected the rate
of unfolding, thereby suggesting that all these processes are interdependent and coupled
to one another (Navon and Goldberg, 2001; Zhang et al., 2009b). Series of mutational
and structure guided biochemical analysis suggest that two PAN ATPase - subcomplex
I (formed by OB domain) and II (AAA+ domain) might play different roles. Substrate
binds to the distal face of subcomplex I and degradation tag is then recognized by
surface motifs in subcomplex II, cycles of ATP hydrolysis result in a pulling force that
is exerted on the folded substrate protein (Zhang et al., 2009b). Translocation is
hindered when the folded substrate is pulled against the narrow interface between the
two sub-complexes (CC-OB domain) (Zhang et al., 2009b). Continuous pulling forces
from subcomplex II generates tension on the leading end of the substrate, resulting in
unfolding and resumption of translocation.
In 26S proteasome ATP binding and hydrolysis play different role. For instance,
ATP binding is sufficient for 19S and 20S assembly while hydrolysis is required for
substrate unfolding and translocation (Liu et al., 2006). Unlike PAN where single
ATPase form hexameric complex, eukaryotic ATPases are six different gene products,
which form dimer of trimer to form hexameric complex.
1.7 RECENT ADVANCEMENT IN UNDERSTANDING 26S PROTEASOMAL
DEGRADATION
Proteasome is a master regulator of virtually all the cellular events and despite its
clinical utility; we are only beginning to understand the molecular mechanism of
proteasomal degradation. This is mainly due to the fact that there are very few model
substrates and system to answer the fundamental questions about proteasomal
degradation like: a) what are degradation signals, b) how substrate are recruited to the
proteasome, c) how sometimes recruited substrate escape degradation, c) whether 19S

Chapter 1. Introduction and review Page 49
and 20S regulate to each other, if yes than how, d) how substrate are unfolded and
traslocated to the catalytic core, e) what is mechanism of unfolding etc. Recently, high
resolution EM map of 26S proteasome has become available, the salient finding have
been discussed earlier. Some of model substrate and system used to understand the
proteasomal degradation are listed in table 1.6, most of these systems use reticulocyte
lysate as a source of proteasome, substrates are either tagged with tetra Ub, or other
localization factor and unstructured regions were derived from other proteins. Some of
recent findings, relevant in the present context are summarized below-
a) Pioneer study from Dr. Matouschek’s group suggests that short lived proteins
usually contain a long unstructured region and degradation initiate from the
unstructured region (Prakash et al., 2009; Prakash et al., 2004). Mostly they have used
dihydrofolate reductase (DHFR) or barnase as a proteasomal substrate and attached
either minimal Ub signal (tetra Ub) or Ub-like domain (Ubl) for proteasome
recruitment. Ub tags are recognized mainly by Rpn10 and Rpn13 while Ubl is mainly
recognized by Rpn1. Tetra Ub-DHFR was stable for degradation but when long
unstructured region was attached, it was degraded by proteasome and unstructured
region was the first to get degraded. Later, Dr. Coffino’s group also showed that GFP
protein when fused with Rpn10 localized to proteasome but it was degraded only when
the C-terminal of ODC was fused to it, again emphasizing the requirement of loosely
folded structure for efficient proteasomal degradation (Takeuchi et al., 2007).
Recently, either Ub-DHFR or UBL-DHRF was fused 20 to 150 residues
unstructured region derived from cytochrome b2 or F0 ATPase and their degradation
was monitored. The minimal length of unstructured fusion for Ub4-DHFR was 29-34
residues, while for Ubl-DHFR it was 33-44 residues (Inobe et al., 2011). Not only the
length but their placement from recognition tag also affected degradation. If substrate

Chapter 1. Introduction and review Page 50
was recognized by Ub, unstructured region adjacent to the Ub accelerated degradation.
In contrast, in case of recognition by Ubl tag, unstructured region should be long and
separated in space from the UbL tag for efficient degradation (Inobe et al., 2011).
The difference in the length of unstructured region and spacing between
recognition and unstructured region can be understood in the light of EM map. Ub-
recognition subunit (Rpn10 and 13) as well as the Dub subunit, Rpn11 are placed above
ATPase ring. UBL recognizing subunit Rnp1 on the other hand is physically separated
from translocation channel at ATPase ring, which is `why Ub tagged protein needed
shorter unstructured region while Ubl tagged protein not only needed longer
unstructured region but also unstructured region was far from recognition region (Ubl).
b) Although, it has been demonstrated long back that proteasome can degrade
proteins in N to C, C to N direction as well from the internal region of protein by
endoproteolysis (discussed earlier), recent report suggests that the stability of termini
provides the direction of degradation (Berko et al., 2012). It was shown that
unstructured proteins do not have any preference for direction, while direction of
degradation for some substrates are fixed. This property results from interactions of the
substrate’s termini with the regulatory ATPase and could be predicted based on the
calculated relative stabilities of the N and C termini. It was also demonstrated that the
direction of degradation affected the peptide generated by proteasome and thereby
influence the antigen presentation by MHC class I (Berko et al., 2012).
c) Mono ubiquitination is linked with membrane fusion as well as transcription in a
proteolysis independent manner. Few recent reports suggest connection between mono
ubiquitination and proteasomal degradation, e.g., Cyclin B1 and phospholipase D.
Mono ubiquitinated substrates which are <150 residue in length can be degraded by
proteasome but longer protein require poly Ub chain (Shabek et al., 2012). These
Chapter 1. Introduction and review Page 51
observations also suggest that proteasome is versatile in context of substrate
recognition.
d) The stability of protein near the degradation signal (Ub and/or long unstructured
region) has been shown to affect the efficiency of protein degradation. Coffino’s group
have shown that rate of ATP hydrolysis (unfolding) does not change no matter whether
a stable or unstructured protein is subjected to proteasomal degradation, stable protein
takes more time for degradation. Titin I27 protein module or human DHFR as well as
their mutants of varying stability were fused to Rpn10 for proteasome localization and
C-terminal degron of ODC was attached to it. The rate of ATP consumption and half-
life of these proteins were analyzed. As compared to stable protein destabilized protein
was degraded faster while ATP turnover did not change (110/min./proteasome)
(assuming other processes are not rate limiting and saturating substrate concentration)
(Henderson et al., 2011).
e) 19S and 20S are spatially and functionally distinct but they regulate the function
of each other. This was experimentally demonstrated by blocking the 20S proteasomal
active sites by specific inhibitor which resulted in stabilization of the 26S holo-complex.
Moreover, binding of poly Ub proteins to the 19S regulator results in stimulation of the
protease activity of 20S proteasome suggesting that binding of polyUb substrates to the
19S regulator transfers the signal of substrate recognition, may be in the form of
conformational changes to the 20S proteasome (Bech-Otschir et al., 2009).

Chapter 1. Introduction and review Page 52
Table 1.6 Some model substrate and system used to understand proteasomal
degradation
Substrate Source of
substrate
Source of
proteasome
ubiquitination Degradation
signal
References
N-degron
DHFR-barstar
hybrid
In vitro
translation
Reticulocyte
lysate
N terminal Ub,
N-end rule
pathway
Linker and 18
residue (318-335)
of lac repressor
(Prakash et
al., 2009)
N-degron-
DHFR-barstar
and USR
barnase
heterodimer
In vitro
translation
Reticulocyte
lysate
N terminus
DHFR-barstar is
ubiquitinated
USR or
cytochrome b2
Ub4-USR2-
barstar and
USR1 barnase
Purified Purified
proteasome
Ub tag is
attached 102
amino acid long
linker or 129
amino acid p105
1-95 residues of
cytochrome b2
DHFR,
circularly
permutated
DHFR, barnase,
DHFR-barnase
In vitro
translation
Reticulocyte
lysate
Ub is attached to
40 residue linker
derived from lac
repressor
Lac repressor (Lee et al.,
2001)
N-Usignal-
DHFR-barnase-
C, N-barnase-
DHFR-Usignal-
C
In vitro
translation
and partial
purified
substrate
Reticulocyte
lysate
N-end rule
pathway
1–95 of
cytochrome b2 or
residues 1–40 of
lac repressor
(Prakash et
al., 2004)
N-Usignal-
DHFR-
unstructured-
6Xhis
Purified Reticulocyte
lysate
Ub was attached
N to C terminus
1–95 of
cytochrome b2 or
residues 1–40 of
lac repressor
N-Ubl- DHFR-
RBD-DHFR-C,
N-Ubl-Uba-
RBD-Uba-
unstructured
region-C
In vitro
translation
and partial
purified
Purified
They have
also done in
vivo
Ubl and 2 Uba
domain
1–95 of
cytochrome b2 or
residues 1–40 of
lac repressor
(Fishbain et
al., 2011)
UbcH10,Ub4
UbcH10, Ub4
PEST UbcH10
Purified Purified Tetra Ub PEST- 37aa of
ODC
(Zhao et al.,
2010)
Titin I27-cODC,
RPN10- Titin
I27-cODC,
RPN10-DHFR-
cODC
Purified Purified RPN10 was
used for
localization
PEST- 37aa of
ODC
(Henderson
et al., 2011)
p21,α-synuclein Purified 20S and 26S
Purified
Both proteins are
natively
disordered
(Liu et al.,
2003)
GFP-p21, GFP-
α-synuclein,
GFP-p21-GFP
and GFP- α-
synuclein-GFP
Purified 20S and 26S
Purified
ubi not required p21,α-synuclein
proteins are
natively
disordered
Ornithine
decarboxylase
(ODC),
DHFR ODC,
Purified
radio
labeled
Purified and
reticulocyte
lysate
Ub-not required.
Antizyme 1
(AZ1) is
necessary
disordered
37-residue region
at the C-terminal
end.
(Takeuchi et
al., 2007;
Takeuchi et
al., 2008;

Chapter 1. Introduction and review Page 53
GFP ODC Zhang et al.,
2003)
Fpr1-rapamycin
binding domain
of Tor1
Rpn10 Fpr1
complex, Tor
fused His 3
Purified Purified Ub not required.
Fpr1 was fused
to proteasomal
subunit. Tor was
fused to His3
Tapamycin
hetero dimers
Fpr1 and tor1 and
His3 translocate
to proteasome
(Janse et al.,
2004)
Thymidylate
synthase
In vivo Cellular Ub-independent Internal N-
terminal
(Forsthoefel
et al., 2004;
Pena et al.,
2006)
URS 1- one copy of unstructured region from lac repressor, USR2- 210 amino acid long, 2 copies of unstructured
region

Rationale and objectives
Page 54
Rationale of the study
&
Aim and objectives

Rationale and objectives
Page 55
RATIONALE OF THE STUDY
All biological processes are tightly regulated by compartmentalized, ATP dependent
protease, the 26S proteasome. Substrates are degraded by proteasome either by Ub
dependent or independent pathway. The substrates are recruited to the proteasome either
by Ub or adaptor proteins. Despite localization to the proteasome, all proteins are not
amenable for proteasomal degradation. Many proteins are found be heavily
ubiquitinated as well as recruited to the proteasome but escape degradation. Therefore,
the question arises whether ‘trans acting elements’ like Ub or adaptors are sufficient, or
the choice lies in the substrate itself (‘cis-acting’). One of the possible ‘cis-acting’
element might be the ‘unstructured region’ present in the substrates. A clue towards
involvement of such regions was obtained from faster degradation of protein, when
fused with long unstructured region derived from another protein. This clearly indicated
the requirement of an element other than proteasomal binding for efficient degradation.
When such elements are buried inside, even if the substrate gets localized to the
proteasome it will not be degraded. Now, the question arises, how these elements get
exposed or present themselves to the proteasome and whether there is a preference for
any specific sequence or conformation. Despite being a necessary regulator of several
cellular processes and recent clinical utility, many fundamental aspects of proteasomal
degradation are still largely unknown. This is mainly due the limited availability of
model systems to understand the process. This is further complicated by the complex
architecture of the 26S proteasome and the fact that not all proteins are amenable for
degradation in vitro.
More specifically, the role of protein sequence, structure, thermodynamic and
kinetic aspects of degradation is largely an unexplored arena. To the best of our
knowledge the inherent ability to of purified 26S proteasome to degrade a globular

Rationale and objectives
Page 56
protein without the help of trans-acting elements has not been demonstrated till date.
Some of the fundamental question that we are interested in are -
1. What are the cis-acting elements in the substrates?
2. If an unstructured region is necessary, how does it originate within
substrate?
3. What are the sequence and structural requirements for protein degradation?
4. What are the rate limiting steps in proteasomal degradation?
We believe that these questions can only be answered if a model system
composed of purified components, which could recapitulate the various hierarchical
steps involved in the proteasomal degradation, without the help of any trans-acting
elements could be created. With this background, the following objectives were
proposed.
AIMS and OBJECTIVES
The aim is to develop an in vitro model system for the characterization of substrate
recognition, global unfolding and degradation by eukaryotic proteasome.
Special focus:
1. To establish an in vitro model system that would recapitulate the hierarchical
steps in proteasomal degradation.
2. To explore how proteasome senses the presence of substrate and develop an
assay with which the affinity of substrate with proteasome could be deciphered.

Rationale and objectives
Page 57
3. Using structural and biophysical approach for understanding structure function
correlation.
4. To identify ‘cis-acting’ element and try to understand so as how it originated in
substrate.
5. To understand the effect of local secondary structure on proteasomal
degradation.
6. To identify proteasome interacting surfaces in substrate.
Finally, we propose to combine all the information in the form of a model that
would help in understanding proteasomal degradation in greater details.
Chapter 2. Establishment of model system Page 58
Chapter 2
Establishment of in vitro model
system

Chapter 2. Establishment of model system Page 59
2.1. INTRODUCTION
Due to its compartmentalized nature, multi subunit composition, a gated mechanism of
substrate entry and requirement for substrate unfolding, the mechanism of protein
degradation by the proteasomes and the various rate limiting steps involved are not well
understood. Few well known factors that affect the half-life of proteins are
ubiquitination, post-translational modification, misfolding of proteins (thyroglobulin,
factor XII, antithrombin etc.) and loss of one of the binding partner (viral protein
pM140 protects pM141 from degradation; free α and β globin subunit degrade fast but,
hetero-tetramer is stable) (Bolin et al., 2010; Goldberg, 2003). Some substrate for which
E2 and E3 ubiquitination enzymes are known can be ubiquitinated in vitro using E1,
suitable E2 and E3 enzymes or a tetra ubiquitin tag can be fused to the substrate
(Thrower et al., 2000). These modified substrates have been used to understand the role
of ubiquitination and recruitment of substrate to the proteasome (Prakash et al., 2009).
Interestingly, even ubiquitinated substrates were not amenable for degradation unless
they also carry a long unstructured in trans (Prakash et al., 2009; Prakash et al., 2004).
Nevertheless the numbers of examples are very few and there are fundamental questions
that remain unanswered including the role of sequence, conformation and structure of
the substrate in determining the half-life of the protein. Besides, signals other than
ubiquitin that are likely to avoid premature release of the substrate are not well
understood. The origin of intrinsic degradation signals is not known.
We decided to develop a new model system to address these questions and chose
to test myoglobin (Mb) as a putative model substrate. Myoglobin (Mb) is a single-chain
globular protein of 153 residues, exist in both heme (porphyrin ring with iron) bound
holo and heme free apo form (Kendrew et al., 1958). Mb is oxygen binding protein
found in muscle tissues. The additional characteristics that make myoglobin an

Chapter 2. Establishment of model system Page 60
attractive model substrate are a) Both holo and apo forms have well defined tertiary
structure, b) crystal structure of holo and NMR structure of apo form is known,
allowing targeted protein manipulations and structural interpretations possible (Eliezer
and Wright, 1996; Kendrew et al., 1958), c) protein is largely α-helical (expected to be
less stable than the β-sheet), d) extensive studies have been done to understand the
thermodynamics and kinetic properties of protein unfolding by chemical denaturants
(Barrick and Baldwin, 1993; Eliezer et al., 2000; Eliezer et al., 1998).
To establish the model system we need pure, intact and active proteasome as
well as Mb. Utilizing the basic nature (theoretical pI 9) of myoglobin we were able to
purify it in one step. Proteasome was purified by affinity chromatography. We
hypothesized that ligand free form of Mb will be susceptible for proteasomal
degradation. We have standardized the in vitro proteasome degradation assay using
purified components and established that a globular protein can be degraded in vitro
without the assistance of trans-acting factors by purified proteasome.
2.2. MATERIALS and METHODS
2.2.1 Expression and affinity purification of 26S and 20S proteasome: Eukaryotic
26S proteasome has been purified from plants, yeast, rabbit muscle and red blood cells
(Fischer et al., 1994; Otsuka et al., 1998; Yang et al., 2004). The homologous 20S
proteolytic particles from archaea and mycobacteria as well as the ATPase homolog
PAN (Protein Activated Nucleotidase) from archaebacteria have been purified by
recombinant technology (Benaroudj and Goldberg, 2000; Wilson et al., 2000). Classical
method of proteasome purification involves large amount of material from natural
sources with protocols extending over a couple of days. The purification principle
embodies both the acidic nature of the proteasome (using anion exchange
Chapter 2. Establishment of model system Page 61
chromatography) and its huge size (using gel filtration chromatography or
ultracentrifugation) (Fischer et al., 1994; Yang et al., 2004). Purification has become
relatively easier due to advancement in genetic techniques and availability of several
fusion tags. Commonly used tags are the Protein A and the FLAG (Leggett et al., 2002;
Verma et al., 2000). Protein A is a 56 kDa protein found in the cell wall of the
bacterium S. aureus. Due to very high affinity of protein A with IgG, proteasome from
these strains are purified using IgG agarose. Unlike many common epitopes, the
octapepide sequence DYKDDDDK or the FLAG tag, is position-insensitive and is the
first example of a fully functional short epitope tag reported for the purification of
proteasomes both from yeast and the mammalian cells. The anti-FLAG M2 antibody
recognizes this epitope present in tandem and purification is normally done using this
antibody coupled to agarose. These tags have been successfully fused to subunits of
every sub-complex of the proteasome, for example RPN11 from lid, RPN1 from base
and PRE1 from the 20S particle (Sone et al., 2004). These tags are generally
incorporated by replacing the chromosomal copy and can precipitate/purify the entire
26S complex. Recently, such tags have been used creatively to either affinity purify or
enrich the proteasomes from mammalian cells by co-immunoprecipitation (Bousquet-
Dubouch et al., 2009; Wang et al., 2007). Not only were the resulting proteasomes
characterized by mass spectrometry but, several interacting proteins were also identified
providing a glimpse at the interaction network.
Two factors are indispensable for 26S proteasome purification - ATP and
glycerol, both of which are included in all purification steps. Purification of different
proteasomal sub-complexes like 20S core particle, base and lid has also been attempted.
This strategy combines the power of sub-complex specific tag to capture the entire 26S
and then the use of varying concentrations of salt for preferentially dissociating other

Chapter 2. Establishment of model system Page 62
sub-complexes by differential elution. For example, to purify 20S proteasome, PRE1
subunit is used to capture 26S proteasome and incubation with high salt (and/or
depleting ATP) to dissociate the 19S RP (Leggett et al., 2002).
We have used FLAG tagged subunits generated by Hideyoshi Yokosawa group
(Hokkaido University, Japan) in S. cerevisiae for proteasome purification essentially
following the methods described by them with some modifications (Sone et al., 2004).
Liquid nitrogen was used for yeast cells lysis and purification steps were monitored by
proteasomal activity assay using fluorogenic substrate.
Material: Anti-FLAG M2-agarose (Sigma), ATP (Sigma), 3XFLAG peptide (Sigma),
Glycerol, MgCl2, NaCl, liquid nitrogen and mortar-pestle.
Yeast strain: YYS40 (for 26S proteasome) and YYS37 (for 20S proteasome) used for
proteasome purification were kind gift from Hideyoshi Yokosawa (Hokkaido University,
Japan). In these strains genomic copy of RPN11 (YYS40) or PRE1 (YYS37) was
replaced by FLAG tagged version.
Instruments: Sorval RC 5C (for centrifugation), Rotospin (Tarson).
Essential buffers and regents:
100 mM ATP: 1 g ATP was dissolved in 20 ml sterile water. Wherever pH adjustment
was required, it was done with 100 mM NaOH (care must be taken as pH increases
suddenly), and then volume was adjusted to 20 ml. Small aliquots of stock was stored at
-80°C freezer.
1 M MgCl2: 2 g of MgCl2.6H2O was dissolved in 8 ml sterile water and volume was
adjusted to 10ml.
Note- MgCl2 powder is hygroscopic, once opened must be stored in a desiccator.
Buffer A: 50 mM Tris pH 7.5, 150 mM NaCl, 10 mM MgCl2 and 10% glycerol
Buffer B: Buffer A + 4 mM ATP

Chapter 2. Establishment of model system Page 63
Buffer C: Buffer A+ 2 mM ATP
Buffer D: Buffer C+0.2% Triton X100
Buffer E: 50 mM Tris pH 7.5, 500 mM NaCl and 10% glycerol
Media: Yeast nutrient-rich medium (YPD)- 2% glucose, 2% polypeptone, 1% yeast
extract, 400 g/ml adenine, and 20 g/ml uracil.
2.2.1A Yeast cell culture: Isolated colony of either YYS40 (for 26S proteasome) or
YYS37 strain (for 20S proteasome) was inoculated in 10 ml YPD media and incubated
at 25ºC at 200 rpm for 24 hr. 1 ml of starter culture was then inoculated in 500 ml of
YPD media and incubated at 25ºC at 200 rpm. When A600 was ~2 (typically after 24 to
30 h of growth), cells were harvested by centrifugation at 6K for 5 min. Cell pellet was
washed by resuspending the pellet in cold MQ water followed by cold buffer A and
buffer B. After centrifugation cell pellet was stored at -80ºC freezer till further use.
Note: When proteasome was purified from cells harvested in late stationary phase, yield
of 26S proteasome was relatively low. Unlike cultures grown from an inoculum, starting
from a single colony ensures yield of consistently active, intact preparation of 26S
proteasome.
2.2.1B Lysis: Yeast cell pellet was suspended in cold buffer B (1 ml buffer B/g of cell
pellet) and added in drops to a pre-chilled mortar filled with liquid nitrogen to make
what is typically called the noodle. Cells were ground in liquid nitrogen to a fine
powder using pestle (1 h for 10 to 12 g pellet). Lysed cells in powder form were
carefully collected in a centrifuge tube and stored on ice (20-30 min). Cell lysate was
then supplemented with buffer B (in total for 2 ml buffer B/g of cell pellet) and
centrifuged at 18K for 1 h to get rid of cell debris.
2.2.1C Affinity purification of proteasome: Anti-FLAG M2-Agarose beads (~100 to
150 l for 500 ml culture) were equilibrated with buffer B in a 10 ml column. Cleared

Chapter 2. Establishment of model system Page 64
cell lysate was filtered through cheese cloth to remove lipids and other debris. If needed
pH was adjusted to 7.5. Lysate was incubated with M2-Agarose for 3 h (on rotospin at
15 rpm). Bound proteasomes were washed with 20 ml of buffer C followed by 20 ml of
buffer D and 30 ml of buffer C. For 20S proteasome purification, all the purification
steps were performed using the above buffer system without ATP. Subsequent to the
washing step, M2-agarose beads were incubated with buffer E for 1 h to dissociate the
base and lid components, beads were again washed with 10 ml buffer A. Either the
bound 26S or the 20S proteasomes were eluted by incubating beads with 100 g/ml 3X
FLAG peptide (v/v typically 100 l for 100 l beads) in buffer C for 30 min. Purified
proteasome may be dialyzed to remove FLAG peptide (dialysis buffer must contain at
least 1 mM ATP and 10% glycerol) or snap frozen and directly stored as small aliquots
at -80ºC freezer.
Note: All the proteasome purification steps must be done in cold (4ºC). The elution step
was repeated to get better yield.
2.2.2 Characterization of purified proteasome: Proteasome activity assay, In-gel
activity assay and degradation of a protein by proteasome are used to characterize
proteasome purified from any source or method. Proteasome activity assay using
fluorogenic substrate can be used not only to monitor the purification steps but also to
characterize purified proteasome. In-gel activity combines the power of native PAGE in
resolving intact complexes in their native state and ability of proteases to act on their
substrates in situ (Elsasser et al., 2005). It provides unequivocal evidence of not only
intact nature of huge multi-subunit complex but also its activity status. The ability of
26S and 20S proteasome to degrade unstructured protein casein and ATP hydrolysis by
proteasomal ATPases can also be used to characterize purified proteasome.
Chapter 2. Establishment of model system Page 65
2.2.2A Proteasomal activity assay: Purified proteasome was characterized by utilizing
its protease (in this case chymotrypsin) activity. Most popular protease substrates are
fluorogenic. Fluorophore such as 7-Amino-4-methylcoumarin (AMC) were attached
after tetrapeptide protease recognition sequence. To monitor proteasome purification
steps and to characterize purified proteasomes we used Suc-LLVY-AMC substrate.
Material: Suc-LLVY-AMC (Calbiochem) and MG132 (Calbiochem), Black 96 well plate
(Nunc).
Reaction buffer: 50 mM Tris pH 7.5, 5 mM MgCl2, 1 mM ATP and 50 M Suc-LLVY-
AMC.
In black 96 well ELISA plates 70l reaction buffer was taken. 2l of lysate,
unbound or eluted proteasome (at least in duplicate) was added, and the amount of free
AMC generation was measured by collecting the emission at 460 nm using Mithras
(LB 940) plate reader (counting time: 0.1sec, lamp energy: 5000, total time: 5 min).
Fluorescence intensity was corrected for ‘substrate only’ control and normalized for
protein concentration (determined by Bradford reagent). To check the 20S proteasome
activity, the assay was performed with or without 0.05% SDS.
2.2.2B In-gel activity assay: In-gel activity assay is a very informative technique as
this single experiment can provide information whether proteasome is intact and active.
Essential buffers and regents:
5X gel buffer: 450 mM each Tris base and boric acid, final pH ~8.3 (no buffering
required), can be stored at RT for few months.
5X non denaturing sample buffer: 250 mM Tris‐HCl (pH 7.4), 50% glycerol and 60
ng/ml xylene cyanol (can be stored at RT for few weeks or -20°C freezer for long time).
Running buffer: 1X gel buffer supplemented with 1mM ATP, 5 mM MgCl2 and 0.5 mM
EDTA (for saving ATP, only cathode buffer was supplemented with ATP).

Chapter 2. Establishment of model system Page 66
Developing buffer: 50 mM Tris pH 7.5, 1 mM ATP, 5 mM MgCl2 and 50 M Suc-LLVY-
AMC.
Gel mixture: 90 mM Tris/borate, 4% acrylamide, 1 mM ATP, 5 mM MgCl2, 0.5 mM
EDTA, 1 mM DTT, 0.1% APS and before pouring the gel 0.1% TEMED.
4% Native PAGE: Gel mixture was prepared in 1X gel buffer with ATP and poured
(~8ml) into a mini-gel apparatus set with 1.5 mm spacers (Bio‐Rad) without stacking. 2
g of proteasome was mixed with non-denaturing sample buffer and loaded carefully on
the wells. Proteasome was resolved at 80 to 100V for 4 h (or until xylene cyanol run
off) in cold room maintained at 4˚C.
Note: Glass plates used for casting native gel must be clean and dry otherwise gel might
stick to the plate during removal after electrophoresis.
In-gel activity: After electrophoresis, gel was carefully dislodged in water. The plate
may be dipped in ice cold water and the gel rolled off to keep it intact. Gel was
incubated in developing buffer for 20 to 30 min at 37°C in an incubator. For 20S
proteasome, developing buffer was supplemented with 0.05% SDS. Gel was carefully
placed on clean UV transilluminator, visualized and photographed under UV. To
monitor subpopulations of proteasome, gel was then stained with Coomassie brilliant
blue (CBB).
Note – 4% gel is very fragile and care must be taken. Gel should not fold during
developing as it may result in appearance of ‘ghost bands’. It is better to use UV
transparent dish or if placing gel directly on UV transilluminator, using small quantity
of water will not only avoid distortion of gel but also it will make handling the gel
essay.

Chapter 2. Establishment of model system Page 67
2.2.2C SDS PAGE: Proteasome is a multi-subunit protein. Subunit composition and
purity were assessed by resolving purified proteasome on 12% SDS PAGE followed by
CBB staining.
2.2.2D Casein degradation: β-casein is a small unstructured protein, the degradation of
which is used to check the activity of several proteases including the 26S proteasome.
Material: ATP (Sigma), HEPES (Sigma), DTT (Sigma) and MgCl2
2X degradation buffer: 40 mM HEPES/NaOH pH 7.5, 6 mM ATP, 30 mM MgCl2, 2 mM
DTT.
25 g β-casein was incubated with 2 g of proteasome in degradation buffer (70
l reaction volume). Casein without proteasome was taken as control. All reactions
were carried out at 37ºC. 10 l aliquots were withdrawn at 0, 0.5, 1 and 2 h in 3 X
loading buffer (containing SDS), and stored at -20ºC freezer. These aliquots were
resolved on a 15% SDS-PAGE. After CBB staining, substrate remaining was quantified
by Image-J software.
2.2.3 Expression and purification Mb: Mb is all helical heme binding protein. Out of
its eight alpha helices four are involved in heme binding. The protein is expressed in
bacterial system and generally purified by combining two or more techniques like
ammonium sulfate precipitation, ion exchange chromatography and gel-filtration
chromatography (Springer and Sligar, 1987). Several mammalian proteins do not
express and fold properly in bacterial system due to codon bias. Mammalian genes can
be optimized for bacterial expression by using preferred codon. We utilized the basic
nature of Mb (Calculated pI 9) and were able to optimize cation-exchange
chromatography for one step purification. Due to the ability of Mb to bind heme that
results in reddish brown color of the complex, it was relatively easy to monitor the
purification steps.

Chapter 2. Establishment of model system Page 68
Material: CM52 cellulose (Whatman).
Plasmid: Synthetic sperm whale Mb in pUC19 vector, kind gift from S.G.Sligar
(University of Illinois, llinois, USA) (Springer and Sligar, 1987).
Media: LB broth, for selection 100 g/ml ampicillin was used.
Instrument: Ultrasonic homogenizer (300VT, BioLogics, Inc), Sorval RC 5C (for
centrifugation)
Essential buffers and regents:
Purification buffer: 10 mM sodium phosphate buffer pH 6.8
Elution buffer: 30 mM sodium phosphate buffer pH 6.8.
Synthetic sperm whale myoglobin cloned in pUC19 was transformed in DH5.
Single colony was inoculated in 10 ml LB broth and incubated for 5 h at 37ºC. The
starter culture was then inoculated in 1 l LB broth and incubated for 20 h at 37ºC. Dark
brown cells were harvested at 6K rpm for 7 min and either stored in -80ºC freezer or
used directly for purification. Cell pellet was suspended in purification buffer (10 ml for
1 liter of pellet). Cells were lysed using 5 mm sonication probe for 10 cycles of 1 min
each (1cycle=70% pulse). Cell debris was removed by centrifugation at 18K for 10 min.
The pH of supernatant was adjusted to 6.4 using 1 M sodium dihydrogen phosphate
with continuous stirring at 4ºC. Cell lysate was then incubated on ice for 1 h and
centrifuged at 18K rpm for 1 h. CM 52 cellulose (5-7 ml) was equilibrated using five
column volume of purification buffer, clear reddish brown lysate was then diluted 1/5th
with water and loaded on top of CM cellulose column. Mb binds on top of CM cellulose
as a reddish brown ring. Bound Mb was washed with ten column volume of purification
buffer. Eluted Mb was reddish brown in color. Purification steps and purity was
checked by 15% SDS PAGE analysis.

Chapter 2. Establishment of model system Page 69
Note: Accuracy of pH and salt concentration is essential for reproducible results. The
pH meter should be calibrated before making buffers for purification.
2.2.3A ApoMb preparation: Classical technique to remove prosthetic group heme
from the Mb combines denaturation of Mb by HCl (up to pH 2) and heme extraction
using ethyl methyl ketone. We found this technique cumbersome and non-reproducible
with ~50% loss of protein. To avoid such problems and to get high yield we have used
acid-acetone method for apoMb preparation (Griko et al., 1988).
Material- Acetone (SD fine), 3.5 kDa cutoff dialysis bag (Thermo scientific).
Reagents: Acidified acetone: 500 l of 1 M HCl in 200 ml acetone. Store in -20ºC.
For apoMb preparation, 25 ml chilled acidified acetone (-20ºC) was taken in a
100 ml beaker and holoMb was added in small drops. Contents were stirred for 5 min
at -20ºC (color of the acetone turns light brown) and carefully transferred to precooled
centrifuge tube and centrifuged at 18K for 30 min. Pellet was washed with 10 ml of
chilled acetone and centrifuged at 18K for 20 min. Acetone was removed carefully and
pellet was allowed to semi-dry. Pellet was dissolved in MQ water and dialyzed against
MQ water at 4ºC. Protein was then centrifuged at 16K for 15 min to remove any
insoluble aggregate. UV-visible spectrum was collected to monitor loss of soret band.
2.2.4 Characterization of purified Mb: Purified Mb is generally characterized by
monitoring UV-visible spectrum for heme binding, SDS PAGE to access the purity and
molecular mass.
2.2.4A UV-visible spectrometry: Heme binding proteins have characteristic
absorbance at 410 nm referred as soret band. The classical method to characterize
purified holoMb is to monitor the soret band, by collecting the UV-visible spectrum.
UV-visible spectrum of holo or apoMb was collected (Jasco v-650) from 500 to 240
nm.

Chapter 2. Establishment of model system Page 70
2.2.4B Gel-filtration chromatography: Size exclusion or gel-filtration
chromatography has been used to purify and characterize the quaternary structure of the
protein. In this technique molecule with larger molecular hydrodynamic volume migrate
faster than the smaller one.
Material: Supedex-75 column (GE Healthcare)-120 ml beads (in house packed)
Instrument: Biologic duo flow liquid chromatography system (Bio-Rad) equipped with
on line UV-visible detector.
To test if heme removal resulted in any dramatic change in the globular structure
of apoMb, we performed gel-filtration chromatography using Superdex-75 matrix at 0.5
ml/min flow rate. Chromatogram was monitored by collecting absorbance at 280 nm.
2.2.5 Proteasomal degradation:
Material: ATP (Sigma), ATPγS (Sigma), PMSF (Sigma), MG132 (Calbiochem), Velcade
(Janssen Pharmaceuticals) and epoxomicin (Calbiochem).
12 M of holo or apoMb were incubated with 50 nM 26S proteasome in the
degradation buffer (20 mM HEPES/NaOH pH 7.5, 3 mM ATP, 15 mM MgCl2, 1 mM
DTT, 2.5-3.5% glycerol). To test whether apoMb was degraded by 20S, proteasomal
degradation reaction was performed using 50 nM 20S proteasome. Specificity of
proteasomal degradation was checked by performing degradation reaction with or
without active site inhibitors like MG132, Velcade, epoxomicin and nonspecific serine
protease inhibitor PMSF. Degradation was also done in the presence of ATPγS a non-
hydrolysable analogue of ATP. The nucleotides obtained from Sigma were used
directly. In incubations with ATPγS (3mM), the final assay buffer contained 0.3 mM
ATP from the elution buffer used to purify proteasomes.
All reactions were carried out at 37ºC. 10 l aliquots were withdrawn at 0, 8, 12, 16 and
19h in 3 X samples loading buffer (containing SDS), and stored at -20ºC freezer. These

Chapter 2. Establishment of model system Page 71
aliquots were resolved on a 15% SDS-PAGE. After CBB staining, substrate was
quantified by Image-J software.
2.3. RESULTS and DISCUSSION
2.3.1 Purification and characterization of proteasome: Purification of unusually
large multi-subunit protein complex with several enzymatic activities could be
challenging. For 26S proteasome complex purification, it is essential to perform entire
purification step in presence ATP and stabilizing agents like glycerol. We have adopted
affinity method for the purification of 26S and 20S proteasome from S. cerevisiae. Due
to the presence of a tough cell wall, lysis of yeast cell at the same time retaining active
and intact proteasome is difficult. We used liquid nitrogen method for yeast cell lysis.
Proteasomes were then purified using anti-FLAG M2-agarose. Average yield of 26S
and 20S proteasome from a 7 g pellet grown from 500 ml culture was ~140 g and ~80
g respectively (26S proteasome= ~280 µg/lit and 20S proteasome=~160 µg/lit).
Purification steps were monitored using fluorogenic substrate Suc-LLVY-AMC.
Proteasomal chymotrypsin sites cleave this substrate after tyrosine to generate free
AMC, fluorescent intensity of which can be measured by 340 nm excitation and
recording emission at 460 nm. The chymotrypsin activity of proteasome in the lysate,
unbound as well as the eluted fraction was measured and normalized for protein
concentration (Table 2.1). To test the specificity of proteasome activity the assay was
performed in the presence of 10 M MG132 (Fig. 2.1C).

Chapter 2. Establishment of model system Page 72
Table 2.1 Monitoring proteasome purification steps by fluorogenic substrate
Purification step Fluorescence intensity (AU/g)
Batch 1 Batch 2
Lysate 523 806
Unbound 335 445
Elution 1 127942 142328
Elution 2 50466 59014
Figure 2.1 Purification and characterization of 26S and 20S proteasome: Proteasome
was affinity purified, in-gel activity assay showed both 26S and 20S proteasome were
intact and active (A). 26S proteasome was resolved on SDS PASGE for verifying it
composition (B). 26S and 20S protease activity was measured, 26S was active and its
activity was inhibited in presence of MG132(C). Only in presence of SDS when the gate
of catalytic core was opened, activity of 20S could be measured (C). In vitro purified
proteasome was able to degrade casein (D) (black-casein only, gray casein with 26S
proteasome). Data represent mean values of at least three independent ±S.D.
In the absence of 19S regulatory particle, 20S proteasomes remain in ‘gate
closed’ conformation. The gate of 20S proteasome can be stimulated to open even
without regulatory particle using 0.05% SDS, salts or peptide derived from proteasomal

Chapter 2. Establishment of model system Page 73
ATPases (Smith et al., 2007). To check the 20S proteasome activity, assay was
performed with or without 0.05% SDS (Fig. 2.1C).
In order to avoid batch to batch variation and achieve data reproducibility, each
batch of purified 26S and 20S proteasome was characterized by monitoring the protease
activity of proteasome, In-gel activity assay, SDS PAGE and casein degradation. With
the help of In-gel activity assay, the protease activity of intact proteasome was measured
after resolving it on native PAGE. In-gel activity assay of purified 26S and 20S
proteasome was done. In case of 26S proteasome, one or two bands are expected under
UV. The top band corresponds to doubly capped (19S-20S-19S) and bottom to singly
capped proteasome (19S-20S). 26S proteasome purified by above method results in
>90% doubly capped population (Fig 2.1A). Similarly, in presence of SDS, single band
corresponding to 20S was observed (Fig. 2.1A). Under UV we could only monitor the
AMC fluorescence due the chymotrypsin activity of 20S (19S-20S, 19S-20S-19S or
only 20S), the free 19S alone, free lid or base sub-complexes could be visualized by
CBB staining of gel after In-gel activity assay. Subunit composition and purity of the
proteasome was assessed by resolving purified proteasome on 12% SDS PAGE
followed by CBB staining. All the component of 26S proteasome could be identified on
the basis of their molecular weight (Fig. 2.1B). Purified proteasome was further
characterized by testing its ability to degrade an unstructured protein in vitro. Purified
26S proteasome degraded casein in 2h (Fig. 2.1D).
From above results it was evident that eluted 26S and 20S proteasome was in
holo form, active and retain all the essential functions of proteasome.
2.3.2 Purification and characterization of Mb: Due to codon bias several mammalian
proteins may not express and fold properly in bacterial system. Mb cDNA was
optimized for bacterial expression by using preferred codon (kind gift from S.G. Sligar,

Chapter 2. Establishment of model system Page 74
University of Illinois, USA) (Springer and Sligar, 1987) and expressed in bacterial
system. We utilized the basic nature of Mb (Calculated pI 9) and were able to optimize
cation-exchange chromatography for one step purification. Due to the heme binding, it
was relatively easy to monitor purification steps as holoMb was reddish brown in color
(Fig. 2.2A). Purification steps were also monitored by SDS PAGE analysis (Fig. 2.2B).
Complete binding of Mb to the column was achieved as negligible unbound Mb was
seen by SDS PAGE analysis (Fig. 2.2B). Mb eluted from CM-cellulose column was
found to be more than 95% pure on SDS PAGE (Fig. 2.2B). When UV-visible spectrum
of Mb was collected from 500 nm to 240 nm two peaks were observed. Apart from the
characteristic protein peak (280 nm) due to aromatic amino acids in protein, Soret peak
at 410 nm due to heme binding was observed in case of holoMb. This band was absent
when heme was removed (Fig. 2.2C). Heme binding also indicated that the purified Mb
was well folded. We found acid extraction of heme cumbersome and non-reproducible
with ~50% loss of protein. To avoid such problems and to obtain maximum yield, we
have used acid-acetone method for apoMb preparation. Absence of heme was confirmed
by loss of soret peak (Fig. 2.2C). Absorbance at 280 nm, 410 nm and 260 nm were
analyzed to evaluate the extent of heme binding (A410/280) and nucleotide contamination
A280/260. Proteins with A410/280 to ~4 in the case of the holo form and apo proteins with
A280/260 ratio ≥1.5 were used for all assays.
Ligand removal might result in alteration in tertiary structure/quaternary
structure of the protein or induce aggregation. Holo and apoMb was resolved by gel-
filtration chromatography. Both holo and apoMb eluted at the same retention volume
indicating that overall fold in apoMb has not been affected due to heme removal (Fig.
2.2D). The above observations suggest that purified Mb was pure, well folded and
quaternary structure of apoMb was similar to that of holo form.

Chapter 2. Establishment of model system Page 75
Figure 2.2 Purification and characterization of Mb: Mb was purified by ion exchange
chromatography, column bound protein was brownish red in color (A). Purification
steps were monitored by SDS PAGE analysis, commercial horse Mb was used as
control (B). HoloMb showed characteristic soret peak due to heme binding which was
negligible in apoMb (C). Holo (solid line) and apoMb (dash line) elute at same
retention volume indicating overall fold of apoMb is similar to holoMb (D).
2.3.3 Degradation of apoMb by proteasome: To test the hypothesis whether in vitro
proteasome will be able to degrade a well folded protein, apo or holoMb were incubated
with 26S proteasome. Aliquots were withdrawn at different time points and degradation
was monitored by decrease in band intensity of Mb on SDS PAGE. The holoMb was
found to be resistant to proteasomal degradation, while ligand free apo form was
degraded with the half-life of 12h (Fig. 2.3A). Degradation was inhibited by
chymotrypsin active site inhibitor MG132 (200 M) as well as by more specific
inhibitors like Velcade (100 M) and epoxomicin (200 M) (Fig. 2.3B). Nonspecific
serine protease PMSF (1 mM) had no effect on apoMb degradation (Fig. 2.3B). These
data show that apoMb degradation was specific to purified 26S proteasome. The 20S

Chapter 2. Establishment of model system Page 76
proteasome alone was unable to degrade apoMb indicating the necessity of 19S for
upstream events like recognition and chain unraveling (Fig. 2.3B).
The process of unfolding and translocation requires active participation of
proteasomal ATPases. Negligible degradation was observed when degradation reaction
was performed in presence of non-hydrolysable analogue of ATP, ATPγS (Fig. 2.3B).
This observation further proves that apoMb was degraded by purified 26S proteasome
in an ATP dependent manner.
Figure 2.3 Purified 26S proteasome degrades apoMb in vitro: Apo and holoMb when
incubated with 26S proteasome only apoMb was amenable for proteasomal degradation
(A). ApoMb degradation was inhibited in presence of proteasomal inhibitors (MG132,
Velcade and epoxomicin) and non-hydrolysable ATP analogue, ATPγS (B). ApoMb was
resistance for degradation by 20S proteasome indicating the importance of regulatory
particles (B). Data represent mean values of at least three independent ±S.D.
All the above observations provide unequivocal evidence that in vitro 26S
proteasome can degrade a well folded apoMb without the help of ‘trans-acting
elements’ in an ATP dependent manner.

Chapter 2. Establishment of model system Page 77
2.4. SUMMARY
In order to develop an in vitro model system for in depth understanding of proteasomal
degradation we chose to test Mb as a substrate. We successfully purified both the
substrate and proteasome and found that proteasome is self-sufficient to degrade a
globular substrate. The results obtain form the above experiments can be summarized
as-
a) 26S and 20S proteasome purified by affinity chromatography were active
and intact.
b) Purified 26S proteasome was able to degrade apoMb, a globular protein
without the help of ubiquitin or other trans-acting elements in vitro.
c) Myoglobin purified by cation exchange chromatography was >95% pure.
d) Heme binding suggest that eluted myoglobin was in well folded holo form.
e) ApoMb prepared by acid acetone method was devoid of heme group.
f) Heme bound holoMb was resistance for degradation.
g) ApoMb was degraded specifically by proteasome as degradation was
inhibited in presence of proteasome active site specific inhibitors.
h) 19S subunits were essential for apoMb degradation as 20S alone was unable
to degrade apoMb.
i) Proteasomal ATPases were actively involved in apoMb degradation.
To the best of our knowledge this is the first demonstration of the inherent ability of
26S proteasome to degrade a globular protein in vitro in the absence of ubiquitin,
adaptor or other trans-acting element.
Chapter 3. Substrate recognition- a rate limiting step Page 78
Chapter 3
Substrate recognition is an essential step in proteasomal degradation

Chapter 3. Substrate recognition- a rate limiting step Page 79
3.1. Introduction
ApoMb was degraded by proteasome in an ATP dependent manner while holoMb was
stable. There could be several possibilities for the stability of holoMb, such as a) it was
not recognized by proteasome or b) it was structurally too stable to be unfolded by
proteasome. To test whether holoMb was recognized at all by proteasome and to
monitor the binding affinity we designed methods that could faithfully provide a
measure of affinity of substrate recognition by 26S proteasome that can be delinked
from the post recognition steps like unfolding and degradation. In case of Ub dependent
proteasomal degradation, substrates are recruited to proteasome with the help of poly
ubiquitin. At least two of the proteasomal subunits contain one or more ubiquitin
binding domain (UBD) (Deveraux et al., 1994). Proteasome also degrade substrates
through an ub independent pathway. In such cases substrates are thought to be recruited
to proteasome through an adaptor protein. However, there is limited knowledge about
the kinetics of substrate and proteasome interaction mainly because of the bulky,
complex structure of proteasome and its tendency to dissociate into sub complexes.
Qualitatively, interaction of poly Ub chain with proteasome has been shown by pull
down, IP and density sedimentation assays. Binding has been estimated indirectly using
enzyme kinetics and Ub competition assays. Affinity of ubiquitin for proteasome was
obtained using Ub-fusion tags of DHFR and correlating the rate of degradation with
affinity, assuming that the downstream processes are not a contributing factor (Thrower
et al., 2000). Although this study provides the first evidence that at least four Ub tags
are required for degradation of substrate, it does not present a clear idea about substrate
and proteasome interaction kinetics (Thrower et al., 2000).
There are several techniques by which protein-protein interaction kinetics can be
measured but requirements of each of these methods are unique and dependent on many

Chapter 3. Substrate recognition- a rate limiting step Page 80
properties of the ligand and the receptor. One of the fastest methods that also provide
kinetic measurement is the label free technique called surface plasma resonance (SPR).
This technique not only provides dissociation constant but also rate of association and
dissociation in real time. SPR has been successfully used to show the effects of
nucleotide in 20S and PAN association (Smith et al., 2005). While binding of
unstructured proteins like casein with 20S proteasome has been demonstrated
(Hutschenreiter et al., 2004), to the best of our knowledge the affinity of substrate to the
26S proteasome has not been demonstrated till date. We standardized binding assay
using anti-FLAG antibody to capture the 26S proteasome and tested holo and apoMb
binding to the immobilized proteasome.
Interaction of some of the ATPases with their client substrate is accompanied by
an increase in the rate of ATP hydrolysis (Benaroudj et al., 2003; Cashikar et al., 2002).
This response may act as an indicator of substrate interaction by the proteasomes. We
hypothesized that in the absence of substrate (apoMb) basal level of ATP hydrolysis
would be observed while in presence of it, ATPase activity would increase. There are
several ways by which ATP hydrolysis can be quantified. Most of these methods are
based on quantitation of the amount of either ADP or Pi generated due to ATP
hydrolysis. Such studies could provide newer insights into proteasomal degradation and
help in screening of new binding partners or inhibitors.
3.2. MATERIALS and METHODS
3.2.1 Proteasome and Mb interaction: Binding affinity of apoMb and proteasome was
determined be Enzyme-linked immunosorbent assay (ELISA). Multi-subunit complex
of 26S proteasome was captured by antibody coated on ELISA plate and the amount of
bound Mb was quantified using Mb specific antibody (Fig. 3.1A).

Chapter 3. Substrate recognition- a rate limiting step Page 81
Materials: ELISA plate (NUNC- Maxisorb), 3, 3′,5,5′-Tetramethylbenzidine (TMB
substrate-Calbiochem).
Antibodies: Anti FLAG antibody (raised in rabbit–Sigma), anti-Mb antibody (raised in
mouse-Cell Signaling), anti-mouse HRP (Amersham).
Instrument: Multi well plate reader (Spectra max190).
Essential buffers:
Bicarbonate/carbonate coating buffer: 0.08 g Na2CO3 and 0.14 g NaHCO3 were
dissolved in 50 ml MQ water, pH ~9.6 (no need to adjust).
Note- coating buffer should be prepared fresh.
Wash buffer (TBST): 50 mM Tris pH 7.5,150 mM NaCl and 0.05 % Tween 20.
Blocking buffer: 2% BSA in TBST
Dilution buffer: 1 mM ATP, 5 mM MgCl2 and 0.1 % BSA in TBST
Note: after adding ATP, dilution buffer must be stored at 4ºC (not more than 24 h).
Maxisorb ELISA plate wells were coated overnight at 4ºC with 2 g/ml of rabbit
anti FLAG antibody (90 to 100 l/well). To avoid nonspecific binding each well were
blocked by incubating with 200l of blocking buffer for 1h at 37ºC. In dilution buffer 1
g/ml (0.37 nM) of 26S proteasome was immobilized on plate. Varying concentrations
of apo or holoMb (580 nM to 0.006 nM) were incubated with immobilized proteasomes.
After washing the plate to remove unbound Mb, amount of 26S proteasome bound Mb
was quantified by using 100 l/well of anti-Mb antibody (1:500) followed by anti-
mouse HRP antibody (1:5000, 100 l/well). Wells were washed and incubated with 100
l/well of peroxidase substrate TMB. TBM reacts with HRP to produce a blue
byproduct the color intensity is proportional to the amount of 26S proteasome bound
Mb. After 15 minutes, reaction was stopped using 50 l/well 2 M H2SO4, and
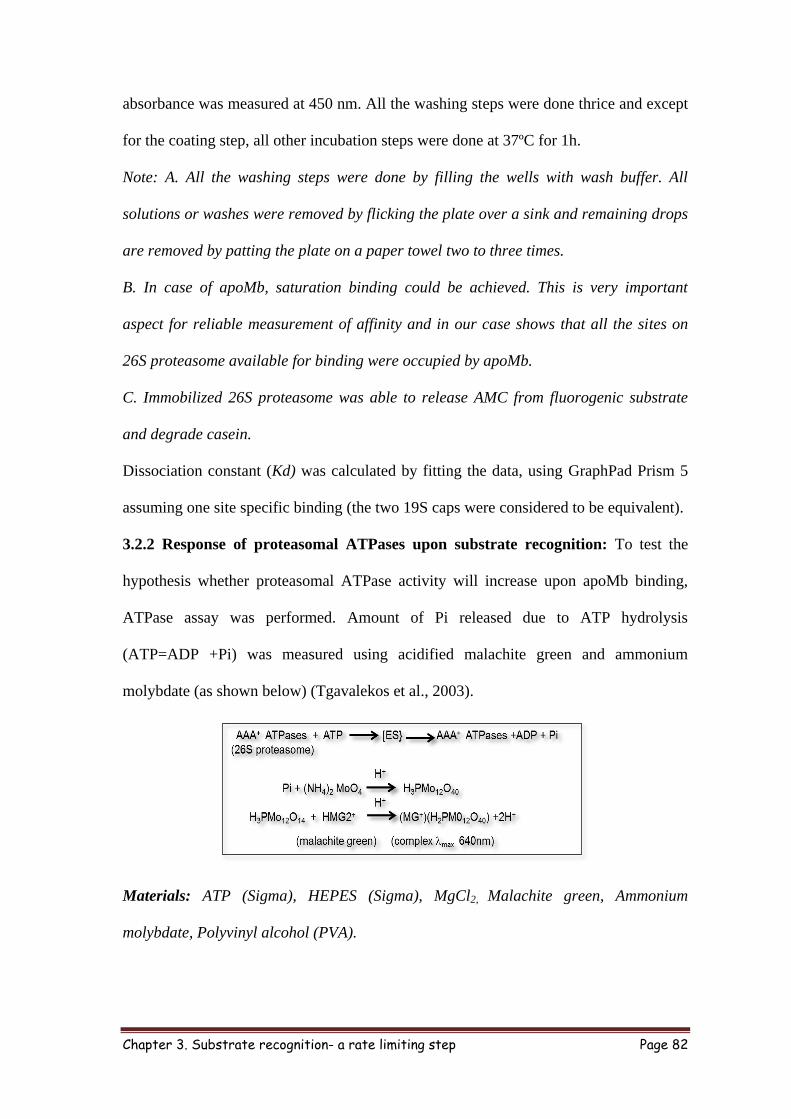
Chapter 3. Substrate recognition- a rate limiting step Page 82
absorbance was measured at 450 nm. All the washing steps were done thrice and except
for the coating step, all other incubation steps were done at 37ºC for 1h.
Note: A. All the washing steps were done by filling the wells with wash buffer. All
solutions or washes were removed by flicking the plate over a sink and remaining drops
are removed by patting the plate on a paper towel two to three times.
B. In case of apoMb, saturation binding could be achieved. This is very important
aspect for reliable measurement of affinity and in our case shows that all the sites on
26S proteasome available for binding were occupied by apoMb.
C. Immobilized 26S proteasome was able to release AMC from fluorogenic substrate
and degrade casein.
Dissociation constant (Kd) was calculated by fitting the data, using GraphPad Prism 5
assuming one site specific binding (the two 19S caps were considered to be equivalent).
3.2.2 Response of proteasomal ATPases upon substrate recognition: To test the
hypothesis whether proteasomal ATPase activity will increase upon apoMb binding,
ATPase assay was performed. Amount of Pi released due to ATP hydrolysis
(ATP=ADP +Pi) was measured using acidified malachite green and ammonium
molybdate (as shown below) (Tgavalekos et al., 2003).
Materials: ATP (Sigma), HEPES (Sigma), MgCl2, Malachite green, Ammonium
molybdate, Polyvinyl alcohol (PVA).

Chapter 3. Substrate recognition- a rate limiting step Page 83
Essential buffers:
Assay buffers: 25 mM HEPES/NaOH pH7.5, 3 mM ATP, 15 mM MgCl2.
Dye buffer: 3:1 mixture of 4.2 % Ammonium molybdate (in 5 M HCl) and 0.4 %
Malachite green (in MQ water) supplemented with 0.3 % polyvinyl alcohol (PVA) as
stabilizing agent.
A 50l assay buffer containing 0.01 g/l 26S proteasome (3.7pM) with or without
5g (580nM) of the substrate was incubated at 37ºC for 15 min. ATP only and protein
only were taken as control. The amount of inorganic phosphate generated was measured
by adding 450 l of dye buffer and monitoring absorbance at 650 nm in 96 well plate
(Spectra max190). Data was subtracted from ATP control, Pi released was measured
calorimetrically and quantified using a standard graph. Data was represented as
nanomoles of Pi released.
Note: A. Dye buffer should be filtered before use. Dye buffer should not be stored for
long time as molybdate tend to oxidize. Care must be taken when using dye buffer, it is
highly acidic and gives permanent color. All reagents should be prepared carefully.
Phosphate based buffer must not be used for ATPases assay.
3.3. RESULTS and DISCUSSION
3.3.1 Proteasome and Mb interaction kinetics: For determining the kinetics of Mb
and proteasome interaction, we tried surface plasma resonance (SPR) using biacore
3000 (GE Amersham) as well as proteon XPR36 (Bio-Rad) platforms but found it was
difficult to keep 26S proteasome intact on chip during regeneration step; also the size of
the complex was too big to avoid bulk effect. To obtain affinity constants of interaction
we standardized a simple, reproducible and robust method based on ELISA. We
immobilized 26S proteasome on ELISA plate using anti FLAG antibody. To test

Chapter 3. Substrate recognition- a rate limiting step Page 84
whether holoMb was interacting with proteasome and to measure the affinity of apoMb
different concentrations of holo or apo Mb was incubated with immobilized 26S
proteasome. Unbound Mb was washed and the amount of bound Mb was quantified.
ApoMb interacted very tightly with 26S proteasome (Kd=3.5±1 nM), while in case of
holoMb saturation was not achieved at the highest concentration tested (570nM) (Fig.
3.1B). The observation that degradation resistant holoMb was not interacting with
proteasome suggested that substrate interaction could be a most important step in
proteasomal degradation. However, the fact that despite being bound tightly to the
proteasome with very high affinity, apoMb was degraded with a half-life of 12 h,
illustrates that although substrate interaction was essential but not sufficient for efficient
degradation.
Our data differs from the observation that localization of substrate to the proteasome
is sufficient for efficient degradation (Janse et al., 2004) and suggest that any of
downstream steps like unfolding, translocation, initiation of degradation could be rate
limiting.
3.3.2. Response of proteasome upon substrate recognition: Several ATPase elicits
response in the form of elevated rate of ATP hydrolysis upon substrate recognition. If
proteasome is behaving similarly in presence of Mb or known substrate, rate of ATP
hydrolysis should increase (Fig. 3.1C). ATPase assay was performed with or without
Mb and amount of Pi released was measured. Basal ATP hydrolysis was observed with
26S proteasome alone and with holoMb, the activity was elevated several fold with
apoMb and casein (Fig. 3.1D). This observation further provided evidence that holoMb
was not recognized by proteasome.

Chapter 3. Substrate recognition- a rate limiting step Page 85
Figure 3.1 ApoMb was recognized by 26S proteasome: Immobilized 26S proteasome
was incubated with varying concentrations of apo or holoMb, the amount of proteasome
bound Mb was quantified calorimetrically using antiMb antibody and HRP conjugated
secondary antibody system (A). ApoMb bound tightly to the proteasome, all the binding
sites available on 26S proteasome was saturated with apoMb (B). We hypothesis in
absent of Mb and 26S proteasome interaction basal level of ATP hydrolysis will take
place while if Mb was recognized by proteasome it will elicited response in the form of
elevated ATPases activity (C). ATPases activity of 26S proteasome with or without Mb
was monitored calorimetrically. ApoMb was able to activate proteasomal ATPases.
Casein was taken as positive control (D).
ApoMb was able to activate the AAA+
ATPases of proteasome either by direct
interaction with one or more of them and bring about conformation changes or apoMb
interacts with non-ATPase subunits and relays the signal to the ATPase subunits
eventually resulting in elevated ATPase activity. Several lid subunits have been found
to interact directly with AAA+ domains of the Rpt subunits. Rpn7 interacts with the
AAA+
domains of Rpt2 and Rpt6, while Rpn6 and Rpn5 interact with Rpt3 (Lander et
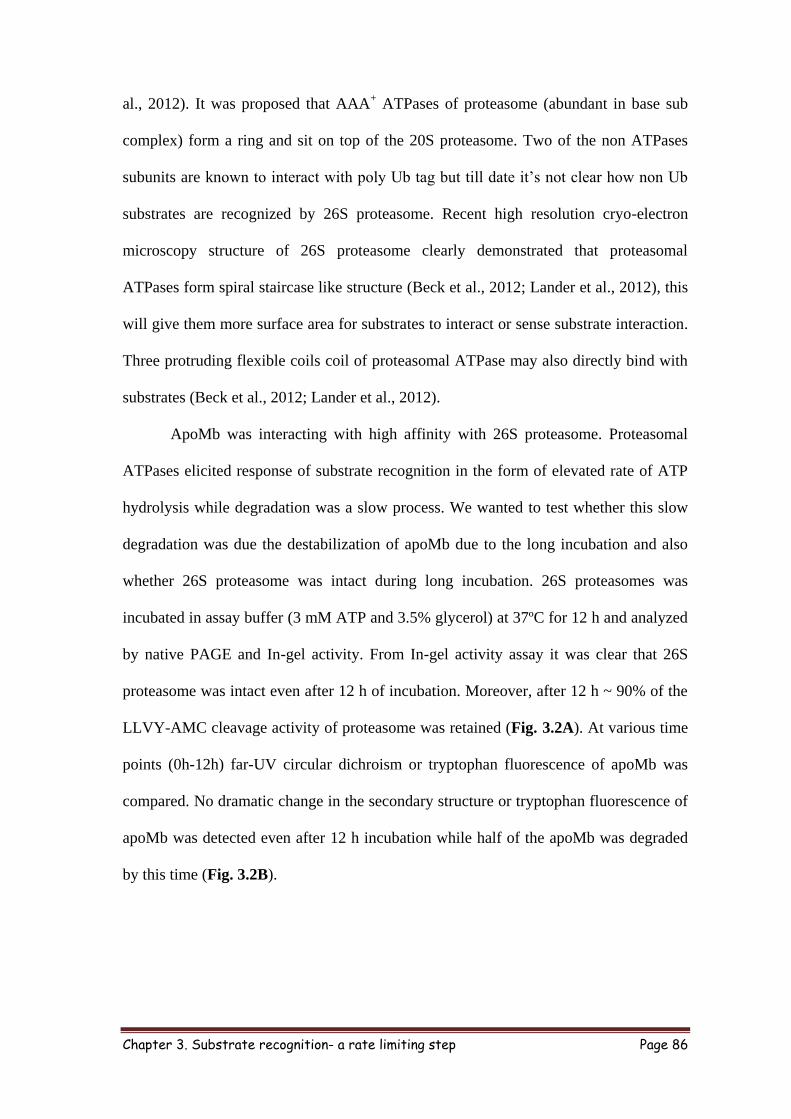
Chapter 3. Substrate recognition- a rate limiting step Page 86
al., 2012). It was proposed that AAA+ ATPases of proteasome (abundant in base sub
complex) form a ring and sit on top of the 20S proteasome. Two of the non ATPases
subunits are known to interact with poly Ub tag but till date it’s not clear how non Ub
substrates are recognized by 26S proteasome. Recent high resolution cryo-electron
microscopy structure of 26S proteasome clearly demonstrated that proteasomal
ATPases form spiral staircase like structure (Beck et al., 2012; Lander et al., 2012), this
will give them more surface area for substrates to interact or sense substrate interaction.
Three protruding flexible coils coil of proteasomal ATPase may also directly bind with
substrates (Beck et al., 2012; Lander et al., 2012).
ApoMb was interacting with high affinity with 26S proteasome. Proteasomal
ATPases elicited response of substrate recognition in the form of elevated rate of ATP
hydrolysis while degradation was a slow process. We wanted to test whether this slow
degradation was due the destabilization of apoMb due to the long incubation and also
whether 26S proteasome was intact during long incubation. 26S proteasomes was
incubated in assay buffer (3 mM ATP and 3.5% glycerol) at 37ºC for 12 h and analyzed
by native PAGE and In-gel activity. From In-gel activity assay it was clear that 26S
proteasome was intact even after 12 h of incubation. Moreover, after 12 h ~ 90% of the
LLVY-AMC cleavage activity of proteasome was retained (Fig. 3.2A). At various time
points (0h-12h) far-UV circular dichroism or tryptophan fluorescence of apoMb was
compared. No dramatic change in the secondary structure or tryptophan fluorescence of
apoMb was detected even after 12 h incubation while half of the apoMb was degraded
by this time (Fig. 3.2B).

Chapter 3. Substrate recognition- a rate limiting step Page 87
Figure 3.2 Stability of 26S proteasome and apoMb: Two different preparations (P1
and P2) of 26S proteasome were incubated at 37°C for 12h in assay buffer. In gel
activity and coommassie staining of native gel was performed (A). ApoMb was
incubated at 37°C and at the indicated time CD and fluorescence spectra were collected
(B).
3.4 SUMMARY
We have successfully demonstrated for the first time, the affinity of substrate and
immobilized proteasome interaction without the presence of ubiquitin or adaptors. A
very high affinity was observed between apoMb and proteasome but the effect was not
reflected in degradation. The possible explanations could be-
a) ‘Off rate’ of apoMb and proteasome interaction could be high.
b) Downstream processes like translocation, unfolding and initiation of degradation
could be rate-limiting.
We optimized ELISA to immobilize the proteasome and keep it intact. This
method could be utilized for screening an array of proteasomal substrates and inhibitors.

Chapter 3. Substrate recognition- a rate limiting step Page 88
Although the generality of ATPase response needs to be investigated, nevertheless it
gives a way to screen for potential proteasome substrates and inhibitors that would
artificially keep proteasomal ATPases busy. It will also be interesting to monitor
ATPases response for several forms of Ub modifications. For instance, whether
ubiquitinated substrates also elicit the ATPase response? Several heavily ubiquitinated
proteins interact with proteasome but do not get degraded- is it because of their inability
of these proteins to stimulate ATPase activity.
Methods described above for studying substrate protein interaction provide two
different aspects of this recognition step- a ELISA based method provide binding
affinity of apoMb with 26S proteasome, while proteasomal ATPase stimulation showed
the response of proteasome upon substrate recognition. Development of these methods
have opened new dimension in understanding proteasomal degradation and screening of
new binding partners or inhibitors.
Together, these observations suggest that substrate recognition is essential step in
proteasomal degradation but all encounters of substrate with proteasome may not be
productive. It seems that binding and downstream event should be coupled for the
substrate and proteasome interaction to be productive and ATPase stimulation may be
a key determinant in linking these steps.

Chapter 4. Effect of ‘trans-acting elements’ Page 89
Chapter 4
Effect of ‘trans-acting elements’ on substrate half-life

Chapter 4. Effect of ‘trans-acting elements’ Page 90
4.1. INTRODUCTION
Depending on their function, the half-life of proteins in a living cell ranges from few
seconds to several days. This controlled turnover of a protein is tightly regulated by the
proteasome machinery. However, the mechanism by which the half-life of a protein is
decided is still not very clear. Some of the short lived proteins carry a signature known
as degradation signals or degrons. In bacterial and archebacterial system, a degron
called SsrA is popular. SsrA is an 11 residue (AANDENYALAA) sequence, that when
fused to proteins with very long half-life in trans, shortens their half- life (Benaroudj
and Goldberg, 2000). For example green fluorescence protein (GFP) is very stable in
the cell while, GFP SsrA is relatively unstable (Benaroudj and Goldberg, 2000;
Benaroudj et al., 2003). In eukaryotic system SsrA like sequences are not well
characterized. C-terminus of ornithine decarboxylase (ODC) may be considered as the
eukaryotic equivalent. ODC gets degraded by proteasome in an Ub-independent
manner. The C-terminal sequences of ODC and antizyme has been shown to be
important for this process (Chattopadhyay et al., 2001; Li and Coffino, 1993). The C-
terminal sequence of ODC has been shown to compete with Ub for proteasomal
interaction (Zhang et al., 2003). This C-terminal sequence was found to be rich in
proline (P), glutamic acid (E), serine (S), and threonine (T) called PEST. Apart from
ODC, other proteins with similar PEST rich sequences were found to exhibit less than 2
h of intracellular half-lives (Rogers et al., 1986). In addition to such signals, N-terminal
residues have also been shown to dictate half-life of proteins and these signals are
termed as ‘N-end rule’ (Bachmair et al., 1986; Varshavsky, 1996). However, how
exactly these sequence help in shortening the half-life is still unanswered. There are
several hypothesis, for instance, the ‘degrons’ might help in substrate recognition and/or
act as initiators of degradation. The length, sequence, complexity and location of fusion

Chapter 4. Effect of ‘trans-acting elements’ Page 91
of these ‘degrons’ are other important factors. Most probably these ‘degrons’ are
context dependent, it is likely it may or may not help in degradation of all the test
proteins.
ApoMb was found self-sufficient to interact tightly with proteasome but degradation
was a long process. We therefore asked whether fusion of ‘degrons’ in ‘trans’ will affect
the half-life of apoMb. Some of the known PEST sequences as well as sequences
known to interact with proteasome were tested to address this.
4.2 MATERIALS and METHODS
4.2.1 PEST fusion to the C-terminus of Mb: The PEST sequences from ABCA1
(ATP dependent cassette transporter1), GCN4 (Yeast transactivator) and Hac1
(transcription factor) were fused to the C terminus of Mb cDNA, purified by ion-
exchange chromatography and tested for proteasomal degradation assay.
4.2.1A Insertion of PEST sequences in Mb: Synthetic sperm whale Mb cDNA was
cloned between PstI and KpnI site of pUC19. PEST sequences from GCN4 (apoMb
PEST 1), Hac1 (apoMb PEST 2) and ABCA1 (apoMb PEST 3) were converted to
nucleotide and codon preferred by bacterial system were used for the same. This was
then annealed to form a cassette. The cassette was prepared in a such way that it
contained nucleotide corresponding to PEST along with two stop codons and for
directional cloning, sticky end of BsteII (in Mb cDNA) and KnpI (vector) at the ends.
Material: Restriction enzymes (Fermentas) PstI, KpnI and BsteII, T4 DNA ligation kit
(Fermentas).
Single stranded oligonucleotides containing PEST sequence were synthesized in
such a way which when annealed to each other would generate a double stranded

Chapter 4. Effect of ‘trans-acting elements’ Page 92
cassette comprising of sticky ends corresponding to restriction enzymes BsteII and KpnI
(Table 4.1). 10 M of both the single stranded oligonucleotides were diluted in Tris
EDTA buffer (10mM Tris pH 8, 1mM EDTA), denatured at 95ºC for 5 min and
incubated at 72ºC for 10 min in a water bath. Following this, the water bath was turned
off to allow slow reduction of temperature to room temperature, ensuring proper
annealing of two strands. This double stranded cassette was annealed to BsteII and KpnI
digested pUC19 plasmid using T4 DNA ligase. The annealed product was transformed
in DH5α and colonies were screened for fusion product by restriction digestion using
PstI and KpnI enzymes. Positive clones were confirmed by gel shift as compared to
wild type (wt Mb =500 bp). The fusion of all the PEST sequences in Mb cDNA was
further verified by Sanger sequencing.
Table 4.1: Oligonucleotides used for PEST fusion in Mb
Name Primer sequence
PEST
1Mb F
GTTACCAGGGTAGCAGCAGCACCGATAGCACCCCGTAATGAGGTAC
PEST
1Mb R
CTCATTACGGGGTGCTATCGGTGCTGCTGCTACCCTG
PEST
2Mb F
GTTACCAGGGTCATAGCAGCAGCGATACCTTCACCCCGAGCCCGCTGAA
CTGCACCATGGAACCGGCGACCCTGAGCCCGTAATGAGGTAC
PEST
2Mb R
CTCATTACGGGCTCAGGGTCGCCGGTTCCATGGTGCAGTTCAGCGGGCT
CGGGGTGAAGGTATCGCTGCTGCTATGACCCTG
PEST
3Mb F
GTTACCAGGGTCGCCCGTTTACCGAAGATGATGCGGCGGATCCGAACGA
TAGCG ATATTGATCCGGAAAGCCGCGAAACCGATTAATGAGGTAC
PEST
3Mb R
CTCATTAATCGGTTTCGCGGCTTTCCGGATCAATATCGCTATCGTTCGGA
TCCGCCGCATCATCTTCGGTAAACGGGCGACCCTG
4.2.1B Expression and purification of PEST fused Mb: PEST fusion proteins were
expressed in DH5α as discussed above. Due to the fusion of PEST sequences, the pI of
the fusion protein might change. Therefore, depending on the calculated pI, the
purification strategy was designed. The calculated pI of PEST1 Mb was similar to wt.
Hence, it was purified by cation exchange chromatography. Since, the expression level
of PEST 2 Mb was suboptimal, several attempts to purify PEST2 Mb in optimum

Chapter 4. Effect of ‘trans-acting elements’ Page 93
amount failed. PEST3 Mb was purified by anion-exchange followed by gel-filtration
chromatography.
Material: DEAE cellulose (Sigma), 25 ml column (Bio-rad), Amicon ultra centrifugal
filter units (Millipore).
Essential buffer and reagents:
For DEAE cellulose regeneration: 0.1N NaOH containing 0.5 M NaCl, 0.5M NaCl, 0.1
M HCl containing 0.5 M NaCl and 1M NaCl pH 7-8 ( with NaOH).
Purification buffer: 10 mM sodium phosphate buffer pH 6.8
Elution buffer: 30 mM sodium phosphate buffer pH 6.8 supplemented with 25 mM or 50
mM NaCl.
Regeneration of DEAE resin: DEAE resin was suspended in MQ water (5 ml/g
bead) and poured in column. Resin was washed twice with 2 column volume (CV) 0.1
M NaOH containing 0.5 M NaCl followed by 0.5 M NaCl and 0.1 M HCl containing
0.5 M NaCl. Resin was washed with MQ until the effluent pH was 5 or greater. At this
stage resin can be stored in 1M NaCl pH 7-8 at 4°C (with preservative).
Note: A. If in the final stage, pH of effluent is not ~5, wash several times with MQ and
repeat the regeneration all over again.
B. Resin should not be left in NaOH or HCl for more than 30 min.
Partial purification PEST3 Mb by DEAE cellulose: DEAE cellulose resin was
equilibrated with 2 CV of 10X purification buffer followed by 5 CV of 1X purification
buffer. PEST3 Mb expressing cells were lysed by sonication, cleared lysate was loaded
on DEAE cellulose column, bound protein was washed with 10-15 CV of purification

Chapter 4. Effect of ‘trans-acting elements’ Page 94
buffer. PEST3 Mb was eluted in holo form (reddish brown in color) with the help of 30
mM sodium phosphate buffer supplemented with 25 or 50 mM NaCl.
PSET3 Mb purification by gel-filtration chromatography: Purity of Mb PEST3
eluted from DEAE cellulose column was analyzed on 15% SDS PAGE. To get rid of
contaminating proteins, eluted proteins were concentrated using Amicon filter units (3.5
kDa cut-off, Millipore) and further purified by gel-filtration chromatography. Gel-
filtration fractions were resolved on 15% SDS PAGE and pure protein fractions were
pooled together.
Mb PEST1 and Mb PEST3 were converted to apo form; heme removal was confirmed
by UV-Visible spectrometry and proteasomal degradation of PEST1 and PEST3 Mb
was done as described previously.
4.2.2 Fusion of probable ‘degron’ to C-terminus of Mb: We chose to test the effect
of the following trans-acting elements on apoMb half-life.
The C-terminus of ODC was shown to be essential for its ubiquitin independent
degradation. It was able to shorten the intracellular half-life of GFP when fused to its C-
terminus (Corish and Tyler-Smith, 1999).
Short sequences derived from N and C-terminus of proteins found to interact with 26S
proteasome by indigenous screening (Mb P8 and Mb P13).
Due to the fusion of sequences of varying length and character, the
physicochemical properties of Mb might change and interfere with purification. Hence,
we decided to switch to affinity purification of Mb using 6 X- histidine tags. The
cloning and purification strategy of Mb fusion is summarized in the following
schematic (Fig. 4.1).

Chapter 4. Effect of ‘trans-acting elements’ Page 95
Figure 4.1: Overview of cloning, expression and purification of Mb C-terminal fusion
proteins.
4.2.2A. Generating pRSTEV Vector: The pRSETA vector (Invitrogen) has 6X-
histidin tag the T7 gene, 10 leader sequences for high level of protein expression,
Xpress epitope and enterokinase (EK) recognition and cleavage sequence. All together
these components contribute to ~3 kDa extra sequences. In order to get tag free protein
(if needed) we replaced Xpress epitope, ER recognition and cleavage site with available
protease site (TEV or thrombin) using single step PCR without any cloning in single
shot, deletion of Xpress epitope and EK as well as insertion of TEV site was achieved
without affecting the MCS.
Material: pfu PCR kit (Fermentas), 25 mM dNTPs, DMSO, DpnI (Fermentas).
Bacterial strain: XL1 blue
A 50 l PCR reaction containing 50-60 ng template plasmid and control reaction
(without pfu) was set-up. The proofreading activity of pfu enzyme provided error free
amplification. The following PCR condition was used: initial denaturation- 95ºC for 5
min, denaturation- 95ºC for 1 min, annealing- 50ºC for 1 min, extension- 72ºC for

Chapter 4. Effect of ‘trans-acting elements’ Page 96
1min/kbp and number of cycle 19. The 10 l PCR product and control reaction (every
component except pfu enzyme) were resolved on 0.8% agarose gel. After confirming
amplification, DpnI digestion was setup in a 25 l reaction using 20 l of PCR product,
2 l of 10X Tango buffer and 10 units of DpnI for at least 8 h at 37ºC. DpnI would
digest the parental plasmid (cleave adenomethylated dam sites). The digested product
was then transformed in XL1 blue cells. The colonies were screened, plasmids isolated
and finally sequence verified for insertion of TEV recognition sequence and deletion of
EK site.
4.2.2B. Cloning wtMb in pRSTEV: The cDNA of Wt Mb was amplified from pUC
19 Mb and cloned in pRSTEV vector via PCR cloning vector pJET.
Material: pfu PCR kit, pJET 1.2/blunt PCR cloning kit, BamHI and KpnI from
Fermentas. Gene gel elute kit (Sigma).
Bacterial strain: DH5α
Mb was amplified using pfu enzyme and Mb cDNA cloned in pUC19 as
template. The following PCR condition was used: initial denaturation - 95ºC for 5 min,
denaturation- 95ºC for 1 min, annealing- 55ºC for 1 min, extension- 72ºC for 1 min/kbp
and number of cycle 29. Pfu polymerase does not have terminal transferase activity,
hence the blunt end PCR product was gel extracted using gene gel elute kit, ligated with
50 ng of linearized pJET vector and transformed in DH5α cells. pJET PCR cloning kit
utilizes insertional inactivation of the lethal eco47IR gene to obtain a positive clones.
Clones were screened for insert using BamHI and KnpI digestion and the insert was gel
extracted. The pRSTEV vector was serially digested with BamHI and KpnI, resolved on
0.8% agarose gel and gel extracted. The insert and vector were ligated with the help of
T4 DNA ligase. The ligated product was transformed in DH5α, colonies were screened

Chapter 4. Effect of ‘trans-acting elements’ Page 97
using BamHI and KpnI digestion and one of them was sequence verified for wtMb
sequence.
4.2.2C. Cloning Mb p8 and p13 in pRSTEV: The cloning steps were similar to the
above described method. The forward primer was common for the amplification of wt
or fusion proteins (P8 and P13). The reverse primers comprised of nucleotides
corresponding to C-terminus of Mb, tri-glycine bridge, fusion sequence followed by two
stop codons and KnpI site (Table 4.2). Forward primer pRSTEV Mb F and respective
reverse primes were used in PCR.
Table 4.2: Oligonucleotides used for fusion of ‘probable degrons’ to Mb
Name Primer sequence
PRTEV F CAGCAAATGGGTGAAAACCTGTATTTCCAGGGTGGATCCGAGCT
C
PRTFV R GAGCTCGGATCCACCCTGGAAATACAGGTTTTCACCCATTTGCTG
PRTEV MB F GGATTCATGGTTCTGTCTGAAGGT
PRTEV MB R GGTACCTCATTAACCCTGGTACC
PRTEV MB P8 R GGTACCTCATTACGGTTTTAGGTTCTGGAAGATTTGGTCCAGGTG
TTTCATTGAGTCACCCTGGTAAC
PRTEV MB 13 R GGTACCTCATTAGATTTCTGGGTATGACGGGAATGATGCGATTCC
GCAGTGGTTTCCACCCTGGTAAC
PMB ODC F GGGTTACCAGGGTCATGGCTTCCCGCCGG
PMB ODC R CCGGTACCTCATTAACGGTCCATCCCGCTCTC
4.2.2D. Cloning Mb ODC in pRSTEV: ODC C-terminal sequences were taken from
reported pZeoGFP-ODC construct (kind gift from Chris Tyler Smith, University of
Oxford,UK) (Corish and Tyler-Smith, 1999).
Material: pfu PCR kit and DpnI from fermentas.
In order to clone the C-terminal sequences of ODC, an altogether different
approach was used. PCR reaction was carried out with unique primer pair. The forward
primer was designed such that the 5’ end would contain the C-terminal encoding
sequence of Mb and 3’ end, the ODC sequences.

Chapter 4. Effect of ‘trans-acting elements’ Page 98
Figure 4.2: Cloning strategy of MbODC. With the help of specially designed primers
set comprising of ODC, C-terminal Mb (forward) and ODC, stop codon and vector
sequences (reverse), ODC sequence was amplified from pZeoGFP-ODC (A). This PCR
product was treated with DpnI and used as a primer for second step of PCR using
pRSTEV MB as template; this PCR step will allow the ODC sequence to fuse to Mb.
After DpnI digestion pRSTEV Mb ODC was used for fusion protein production (B).
The 3’end of the reverse primer on the other hand comprised of ODC sequences,
two stop codons and pRSTEV complimentary sequences (Fig. 4.2). Using this primer
set and pZeoGEP-ODC as template, PCR was done using following conditions: initial
denaturation - 95ºC for 5 min, denaturation- 95ºC for 1 min, annealing - 55ºC for 30
sec, extension- 72ºC for 1 min/kbp and number of cycle 29. The template (pZEO GFP-
ODC) was next digested by DpnI, leaving the unmethylated amplified product intact.
The amplified product harbored the ODC C-terminal sequence in between Mb (last few
residues) and pRSTEV vector sequences (few nucleotides after KpnI site). For second
round of PCR, 2l of this product was used as mega primers and pRSTEV Mb as
template. Following condition was used for PCR initial denaturation - 95ºC for 5 min,
Chapter 4. Effect of ‘trans-acting elements’ Page 99
denaturation- 95ºC for 1 min, annealing - 55ºC for 1 min, extension- 72ºC for 1 min/kbp
and number of cycle 19. After confirming amplification on 0.8% agarose gel, as
described above unmodified parental plasmid was digested using DpnI and transformed
in XL1 blue cells. The colonies were picked, plasmid DNA was extracted and digested
with BamHI and KpnI. One of the positive clones was verified by Sanger sequencing.
4.2.3 Expression and purification of wt and fusion proteins: Wt and mutant Mb were
transformed in BL21 DE3 cells. Growth condition and IPTG induction was optimized
for apoMb production.
Material: IPTG (Sigma), Ni-NTA-agarose (Invitrogen), 25 ml column (Bio-Rad), 10X
protease inhibitor cocktail (Sigma) and lysozyme (Sigma).
Bacterial strain: BL21 DE3.
Essential buffers and reagents:
5X Native purification buffer (100 ml): 250 mM Sodium phosphate monobasic
(NaH2PO4), 2.5 M NaCl, Add 90 ml of Milli Q water, adjust pH to 8 with NaOH. Make
volume to 100 ml.
1X Lysis buffer (20ml): 5X Native binding buffer (4 ml), 2 mM β-Mercaptoethanol,
0.1% Triton X -100, 10% Glycerol, and 1 X protease inhibitor (pH 8.0).
Binding buffer (50 ml): 1X Native binding buffer, 2 mM β-Mercaptoethanol, 0.1%
Triton X -100, 10% Glycerol and 10 mM imidazole, pH 8.0.
Wash buffer (50 ml): 1X Native binding buffer, 2 mM β-Mercaptoethanol, 0.1% Triton
X -100, 10% Glycerol and 20 mM imidazole, pH 8.0.
Elution buffer (50 ml): 1X Native binding buffer, 2mM β-Mercaptoethanol, 0.1% Triton
X -100, 10% Glycerol and 250 mM imidazole, pH 8.0.
Instrument: Ultrasonic homogenizer (300VT, BioLogics, Inc), Sorval RC 5C (for
centrifugation), Rotospin (Tarson).
Chapter 4. Effect of ‘trans-acting elements’ Page 100
The BL21 DE3 cells were transformed with pRSTEV Mb or mutant plasmid.
Single colony was inoculated in 10 ml of LB broth and incubated at 37ºC for 5 h, 2 ml
of this starter culture was inoculated in 1 l LB broth. Cells were grown up to A600nm 0.4-
0.6 at 37ºC then 100 μM IPTG was added to induce the recombinant protein expression.
The cells were further incubated for 16 h at 18°C and harvested by centrifugation.
Pellets were either stored at -80ºC freezer or used for purification, whereby the pellet
was suspended in 1X lysis buffer and incubated on ice for 30 min followed by cell lysis
using 5 mm sonication probe for 6 to 8 cycle of 1 min each (70% pulsar). Cell debris
was removed by centrifugation for 1 h at 18K and cleared lysate was stored on ice. The
Ni-NTA beads (2 to 3ml) were taken in 25 ml column washed several times with MQ
water and equilibrated with 15 ml of native binding buffer. The cleared cells lysate was
incubated with Ni-NTA column on rotospin at 15 rpm for 1 h at ~4ºC. The flow through
was collected to test the protein binding. The column was washed with 100 ml of 1X
wash buffer to remove impurity and protein was then eluted using imidazole. The
purification was checked on 15% SDS PAGE.
Note: A. Incubation on ice up to 2h after addition of lysis buffer require less sonication
cycle.
B. Used Ni-NTA beads can be regenerated by incubating it with 0.5 N NaOH for 30 min
and washing thoroughly with MQ water.
Protein purified by Ni-NTA affinity column were concentrated to about 2 mg/ml
and further purified by gel filtration chromatography as described earlier. The protein
fractions were collected and analyzed on 15% SDS PAGE. Pure protein fractions were
pooled together, concentrated and dialyzed overnight with 50 mM Tris pH 7.5.
4.2.4 Proteasome degradation assay: Apo form of wt and different Mb fusion protein
were tested for proteasomal degradation as described earlier.
Chapter 4. Effect of ‘trans-acting elements’ Page 101
4.3 RESULT and DISCUSSION
ApoMb was self-sufficient for proteasomal degradation. We wanted to test whether
trans-acting elements would affect the half-life of apoMb. The sequence, length,
complexity and location of fusion are not defined. Effect of most of the trans-acting
property is context dependent. To check the effect of some of the trans-acting elements
on Mb half-life, we chose to test PEST sequences from a few reported proteins. These
included known ‘degrons’ like C-terminal sequences of ODC, few sequences from N or
C-terminal peptides of proteins found to interact with proteasome obtained by in house
screening.
4.3.1. Cloning and purification of PEST sequence fused apoMb: To test the effect of
some of PEST sequences on apoMb half-life, we selected the reported PEST sequences
(8 to 24 residues) from ABCA1, GCN4, and Hac1 with intracellular half-life of less
than 1 h. Deletion of PEST sequences of these proteins resulted in intracellular
stabilization of these proteins (Kornitzer et al., 1994; Pal et al., 2007; Wang et al.,
2003). To fuse these sequences to the C-terminus of Mb cDNA, a cassette with PEST
sequence and sticky ends corresponding to BsteII and KpnI was designed and ligated to
linearized pUC 19 Mb (with same enzyme sets). The PEST sequence and
physicochemical property of PEST fused Mb is summarized in table 4.3. The calculated
pI of PEST 1 (GCN4) was similar to wt Mb. PEST1 was purified by cation-exchange
chromatography. Due to the fusion of PEST sequences, rich in acidic residues, the
calculated pI of Mb PEST3 (ABCA1) dropped to 6. PEST 3 was partially purified on
anion exchange resin followed by gel-filtration chromatography. PEST2 (Hac1) was
probably unstable in bacterial cells, several attempts to purify PEST2 Mb in optimum
amount failed. Hence, PEST 2 was not persuaded further.

Chapter 4. Effect of ‘trans-acting elements’ Page 102
Table 4.3: Effect of PEST fusion on physicochemical property of Mb
Protein Name of ‘PEST’ containing protein Calculated pI MW
(kDa)
Wt Mb 9 17.3
Mb
PEST1
GCN4 (Yeast trans activator)- 8 residue PEST
(SSSTDSTP)
8.7 18
Mb
PEST2
Hac1 (transcription factor)- 23 residue PEST
(HSSSDTFTPSPLNCTM EPA TLSP)
7.9 19.7
Mb
PEST3
ABCA1 (ATP dependent cassette transporter1) - 24
residue PEST (RPFTEDDAADPNDSDIDPE
SRETD)
6 20
4.3.2. Cloning and purification of ‘probable degrons’ fused apoMb: Ornithine
decarboxylase has been shown to be degraded with the help of antizyme by proteasome
in Ub independent manner. The intracellular half-life of C-terminal ODC sequences
fused GFP (to C terminus) has also been shown to be shorter than GFP alone (Corish
and Tyler-Smith, 1999). We wanted to test whether the C-terminus of ODC (with
critical Cys) would help Mb to be degraded faster by 26S proteasome.
In the quest of finding SsrA like sequences in eukaryotic system, short
sequences (15 residues long) from N and C-terminus of proteins were selected.
Considering that in most of the known proteasomal substrate, degradation starts from N/
C-termini and generally termini are more flexible in a protein, we designed an
indigenous screening method to identify sequences that may interact with immobilized
proteasome. Two peptides interacted tightly with proteasome (P8 and P13) and were
selected to test their ability to affect Mb half-life. The sequence and calculated pI of Mb
fusion protein is summarized in table 4.4. Fusion of these sequences will affect the pI of
the fusion protein. In order to maintain uniformity, we switched to affinity purification
of these fusion proteins using pRSET A 6X his tag purification vector (Invitrogen). It
contains IPTG inducible promoter for recombinant gene expression and apart from
other essential component of expression vector it has Xpress epitope and EK
recognition and cleavage site to get Tag free recombinant protein. The TEV protease

Chapter 4. Effect of ‘trans-acting elements’ Page 103
expression construct was available in lab. We first generated pRSTEV vector by
replacing Xpress epitope and EK site by TEV protease cleavage site without affecting
the multiple cloning site of pRSET A (Fig. 4.3A). This vector was used for expression
and purification of wt and C-terminal fusion Mb proteins.
Table 4.4: Sequence, calculated pI and M.W. of Mb fusion proteins
Name Fusion sequence MW
(kDa)
Calculated
pI
Wt NA 17.3 9
Mb ODC HGFPPEVEEQDDGTLPMSCAQESGMDR 21.9 6.39
Mb P8 DSMKHLDQIFQNLKP 19.1 8.96
Mb P13 GNHCGIASFPSYPEI 18.9 8.56
Figure 4.3: Generation of pRSTEV vector and Purification of Mb fusion protein: The
original pRSET A vector was modified to replace Xpress epitope and EK site with TEV
or thrombin cleavage site (A). Mb ODC was expressed in BL21 DE3 and purified by Ni-
NTA resin followed by gel-filtration chromatography (B). Mb ODC eluted from Ni-NTA
column, gel-filtration fractions and protein after dialysis was analyzed on 15% SDS
PAGE (C). The purified protein was found to be >95% pure.
These ‘probable degrons’ were cloned at the C-terminus of Mb in the modified
pRSTEV vector. Proteins were expressed in BL21 DE3. When IPTG was added at
higher cell density (A600 nm > 0.8) the Ni-NTA purified wt protein was in holo form

Chapter 4. Effect of ‘trans-acting elements’ Page 104
while at low cell density (A600 nm =0.4 to 0.6) it was in apo form. For all the fusion
proteins, expression was done at A600 nm~04. Wt and the fusion proteins were purified
by Ni-NTA chromatography followed by gel-filtration chromatography (Fig. 4.3B). Wt
as well as fusion proteins were >95% pure on SDS PAGE. MbODC Ni-NTA
purification and gel-filtration chromatogram has been shown as a representative of
fusion protein (Fig. 4.3C).
Figure 4.4: Effect of PEST sequences and ‘degrons’ on Mb half-life. The proteasomal
degradation of apo PEST 1 Mb or PEST 3 Mb was done and substrate remaining was
monitored, these PEST sequences were not able to shorten the half-life of apoMb (A).
Mb fusion proteins were subjected to proteasomal degradation assay and substrate
remaining at 12 h was monitored, none of the fusion protein tested helped in shorting
the half-life of Mb (B). In case of Mb ODC at 8 h and 12 h cleaved fragment was
observed.
4.3.3 Effect of PEST or ‘probable degron’ on apoMb half-life: The apo form of Mb
PEST 1 or 3 along with wtMb was incubated with proteasome. The half-life of wt and
both the PEST fused proteins were comparable. Similarly none of the probable degrons
tested were able to shorten the half-life of apoMb. In case of Mb ODC, truncated
product was observed at lower time scale, which might be due to cleavage or
degradation of ODC sequences.

Chapter 4. Effect of ‘trans-acting elements’ Page 105
4.4 SUMMARY
Although the role of ‘degron’ in the degradation step is not clear, few recent
observations suggest that long unstructured regions (90 to 120 residues) fused (in trans)
to proteins, render them susceptible for degradation (Prakash et al., 2009; Prakash et al.,
2004). These unstructured regions may help in initiation of degradation most likely by
helping the polypeptide to reach the active site. However, generation of such long
unstructured regions in a protein is rare other than the intrinsically disordered regions.
In contrast to these long unstructured regions short sequence of 11 residues like SsrA
has been shown to destabilize proteins like GFP rendering it susceptible to degradation
by homologous ATP dependent proteases like 20S-PAN complex from archaebacteria
and CLPX protease systems (Benaroudj and Goldberg, 2000; Benaroudj et al., 2003).
The exact role of such degrons is still unclear.
We tested the ability of short sequences which have the potential to act as
‘degrons’ by fusing them to the C-terminus of Mb. Fusion of short, trans acting
elements tested did not facilitate Mb degradation. Some of the possible explanations
could be -
a) Due to very high affinity of apoMb (nM) for proteasome, additional interactions
due to fusion of these elements may not facilitate degradation.
b) In apoMb, degradation might not be starting from C-terminus or else these
would work better when attached to the N terminus of Mb.
c) Local structural changes might be more important than fusing unstructured
sequences to the termini.

Chapter 5. Importance of local secondary structure Page 106
Chapter 5
Importance of local secondary structure in apoMb degradation

Chapter 5. Importance of local secondary structure Page 107
5.1 Introduction
In the previous chapter we described the effect of some trans-acting elements in apoMb
degradation. None of these elements tested were able to affect the half-life of apoMb.
We have also observed that holoMb was neither recognized nor degraded by the
proteasome. There is no change in the amino acid sequence between holo and apo form.
This throws open the following questions: is it the structure or conformation of apoMb
which makes it susceptible for degradation? The crystal structure of holo Mb showed
that out of the eight helices of Mb, four of them are involve in formation of heme
pocket- helices B, C and E make top and side while F forms the bottom of this pocket
(Kendrew et al., 1958). Distal His residue from F-helix of Mb has been shown to
directly interact with heme. Comparison of the crystal structure of holo and NMR
structure of apoMb showed that 78-106 residues (F-helix region) in apoMb were in
dynamic equilibrium between partially folded and unfolded state, since resonance
corresponding to this region was not detectable (Eliezer and Wright, 1996). It is most
likely that this region (Floppy F-helix) is acting as ‘the cis-acting element’ for apoMb
degradation. In holoMb this region was buried and we found no ATPases stimulation as
well as degradation, but upon heme removal ATPase stimulation and degradation by
26S proteasome was seen. And as mentioned above the F-helix becomes floppy in
apoMb suggesting its probable role in ATPase stimulation and degradation of apoMb.
As suggested earlier, an unstructured region might act as recognition element or
as initiator of degradation. If this is true, then local stabilization of this helix may result
in stabilization of apoMb. Stabilization of local F-helix without affecting the global
stability could be challenging as modified residues may rewire the non-covalent
interaction network and result in stabilization of overall structure. Under such
circumstances, it will be difficult to propose the role the floppy helix. We, therefore,
Chapter 5. Importance of local secondary structure Page 108
took expert advice of Prof. P. Balaram (IISc Bangalore) in engineering the floppy F-
helix to induce helicity even in the absence of heme. If our hypothesis is correct this
will provide us the opportunity to dissect the structure function correlation and
understand the several steps in proteasomal degradation where degradation is not guided
by Ub or other factors.
5.2 MATERIALS and METHODS
The floppy F-helix (78 to 106) encompasses the EF-loop, F-helix, FG-loop and first few
residues from G-helix. We wanted to engineer the helix in such a way that once formed,
it remains stable in the absence of heme. The Gly80 in the EF-loop, Pro 88 and Ser 92
within the helix were changed to helix stabilizing residue Ala as well as H97 in the FG-
loop to Asn.
5.2.1 Prediction of helical propensity: Agadir predicts the helical behavior of
monomeric peptides based on helix coil transition theory. For short sequences, it
provides residue level helical content.
Program: AGADIR (http://agadir.crg.es)
Analysis parameter: pH-7.5, Temperature- 298K and ionic strength - 0.15
We compared the residue level helix content of 78-106 residues (floppy F-helix)
in WtMb, and G80A/P88A/S92A/H97N.
5.2.2 Molecular dynamics simulation of wt and F-helix mutant: We wanted to test
the effect of the above mentioned replacements on stability of F-helix by molecular
dynamic simulation. Based on known physical principles, this computational method
provides time dependent detailed information on the fluctuations and conformational
changes of proteins.

Chapter 5. Importance of local secondary structure Page 109
Program and tools used: Amber 10 and Amber tools, modeler 9v7
PDB: 2JHO
Molecular dynamic simulation was performed using AMBER 10 and Amber
Tools. The initial co-ordinates were obtained from the PDB file 2JHO. The holo Mb
was then stripped of all metal ions and the heme moiety to create apoMb. All the
hydrogen atoms and anisotropic atoms were removed. A program from Amber tools
called LEaP was then used to add the hydrogen atoms. ApoMb was solvated in TIP3P
model of water. For energy minimization using Sander, a combination of steepest
descent and conjugate gradient methods was used for 2000 steps. Energy minimized
apoMb was equilibrated to a temperature of 400K over 10 ps. An all atom force field
was used for simulation with the temperature set to 400K for a period of 2.8 ns. The
trajectories resulting from the simulation were converted to a PDB file and analyzed
using Visual Molecular Dynamics (VMD).The apoMb was then mutated with residues
intended to stabilize the F-helix. The mutant was created and modeled using modeler
9v7 with 2JHOas the template. Molecular dynamic simulation of the mutant was
performed exactly as described for the wild type (performed by Satish Balakrishnan in
Dr Saraswathi’s lab in IISc Bangalore).
5.2.3 Mutagenesis, expression and purification: To generate the F-helix stabilized
mutant, G80A was generated with the help of one set of mutation primer (F-helix 2)
(Table 5.1). The PCR product was treated with DpnI to digest parental wtMb containing
plasmid. 2µl of this product was further used for second round of PCR using primers
harboring P88A, S92A and H97N replacements (Table 5.1). PCR mixture and condition
was similar to site directed mutagenesis described earlier. After confirming mutation by
Sanger sequencing, F-helix mutant Mb was expressed in DH5α and purified by cation
exchange chromatography as described earlier.

Chapter 5. Importance of local secondary structure Page 110
Table 5.1 Oligonucleotides used to stabilize floppy helix
Mb mutant Prime sequence
F-helix1F
(P88AS92AH97N)
CTCAAAGCGCTTGCGCAAGCGCATGCTACTAAAAACAAGA
TCC
F-helix1R
(P88AS92AH97N)
GGATCTTGTTTTTAGTAGCATGCGCTTGCGCAAGCGCTTTG
AG
F-helix 2 F (G80A) CCTTAAGAAAAAAGCCCATCATGAAG
F-helix 2 R (G80A) CTTCATGATGGGCTTTTTTCTTAAGG
5.2.4 Secondary structure of wt and F-helix mutant: The Secondary structure of
holo as well as apo form of wt and F-helix mutant was compared using far-UV circular
dichroism spectroscopy (CD). CD is based on differential absorption of left and right-
handed circularly polarized light that arises due to structural asymmetry of a molecule.
It is one of the well characterized biophysical technique used to determine secondary
(peptide bond below 240 nm), and tertiary structure (aromatic amino acid side chains
260 to 320 nm) of purified proteins, to study the effect of several extrinsic and intrinsic
factors on protein structure and stability (effect of pH, temperature, chaotropic agents
etc.), to monitor protein folding or unfolding, co-factor binding and protein-protein
interactions. Different types of secondary structure (α-helix, β-sheet, turn and other)
found in proteins provide characteristic CD spectra in far-UV range (240-180), for
example, α-helical proteins have negative ellipticity (unit of CD spectrometry) at 222
nm and 208 nm and a positive ellipticity around 190 nm. Based on the high agreement
between secondary structures derived from CD and X-ray crystallography several
algorithms and databases have been developed to provide an estimation of the
secondary structure composition of proteins from accurate CD data. Widely used
algorithms include SELCON (self-consistent), VARSLC (variable selection), CDSSTR,
K2d and CONTIN (Provencher and Glockner, 1981; Sreerama and Woody, 1993). We
have used online server DICHROWEB that provide flexibility of analyzing our data by

Chapter 5. Importance of local secondary structure Page 111
various algorithms and databases as well as using several reference sets (Lobley et al.,
2002; Whitmore and Wallace, 2004).
Material: Quartz cuvette (2mm), Nitric acid
Instrument: CD Polarimeter (Jasco, J815)
Buffers: 20 mM sodium phosphate buffer, pH 7.5
5.2.4A Determination of protein concentration: Concentration of apoMb was
determined by UV absorbance at 280 nm using an extinction coefficient 15470 M-1
cm-1
(as estimated by ExPASy-ProtParam tool). Determination of holoMb concentration by
UV absorbance at 280 nm using same extinction coefficient may not be accurate as
heme affects the absorbance at 280 nm. For accurate holo protein concentration,
estimation using either Bradford assay with BSA as standard or absorbance at 280 nm
using extinction coefficient 34500 M-1
cm-1
was used. Proteins with A280/260 ratio ≥1.5
were used for CD spectrometry.
5.2.4B Cleaning quartz cuvette: The CD cuvette was washed for 1 min with
concentrated nitric acid, then several times with MQ water and finally with ethanol and
air dried.
Note: Nitric acid must be handled carefully as it is corrosive and powerful oxidizing
agent.
5.2.4C Instrument setting and data collection: To save the optics, instrument was
purged with N2 gas at 10–15 l/min for 10 to 15 min before turning on the lamp. After
turning on instrument and accessories (like peltier cell holder, water batch and
computer), lamp was allowed to stabilize (20 to 30 min). Far-UV CD spectrum of holo
as well as apo form of wt and F-helix mutant (2M) was collected from 260 to 190 nm
(Settings: Scan speed 50 nm/sec, accumulation 5, data pitch 0.1, at 24ºC) and subtracted

Chapter 5. Importance of local secondary structure Page 112
from buffer spectra. After collecting the spectra instrument, accessories were turned off;
N2 gas was purged for another 10 min.
5.2.4D Data analysis: CD data from 3 to 5 different experiments with different protein
preparations was used for data analysis. CD spectra is plotted as ellipticity () on Y-axis
and wavelength (nm) on X-axis. Data is represented in the form of the Mean Residual
Ellipticity (MRE or []) since this value is concentration independent and fixed for a
protein. Ellipticity was converted to mean residue ellipticity using the formula ([] =
/number of amino acid in the protein x molar concentration x path length in mm)
where is ellipticity at given wavelength. It was then saved in Dichroweb format and
subsequently analyzed by SELCON3 and CONTIN by Dichroweb server using
reference set 7 (http://dichroweb.cryst.bbk.ac.uk/html/home.shtml). While analysis the
data using these algorithms, experimental and reconstituted CD spectra overlapped with
each other thereby showing that the secondary structure composition provided by the
programme was reliable.
Note: CD is very informative technique provided we take care of some of the following
factors: 1. Proteins should be of at least 95% purity on SDS PAGE. 2. Protein should be
free of insoluble protein aggregates as due to differential light scattering the shape and
ellipticity of CD spectra will be affected. 3. Suitable buffer system like Phosphate, Tris
and borate buffer (concentration <100 mM and pH 6-10) should be used for farUV
CD, some buffers system like HEPES, MOPS, MES, PIPES absorb strongly below 200
nm and should only be used at low concentrations. 4. Accurate protein concentration is
essential for faithful CD data. 5. Multiple scan of CD spectra will improve the
signal/noise (S/N) ratio as S/N ratio is proportional to the square root of the number of
scans. 6. For reliable data, detector should not saturate (dynode voltage should be less

Chapter 5. Importance of local secondary structure Page 113
than 700V). 7. On the basis of experimental requirement appropriate algorithm and
data set should be used for the analysis.
5.2.5 Global stability of wt and F-helix mutant: Stabilizing a floppy helix may result
in overall stabilization of protein structure. To test overall stability of apo F-helix
mutant, we compared the tryptophan environment, thermal stability and urea
denaturation of apowt and F-helix mutant.
5.2.5ATryptophan fluorescence: Tryptophan environment has been used as a measure
of global stability. Trp environment of wt and F-helix mutant proteins was analyzed by
fluorescence spectroscopy.
Material: Cuvette (2 mm)
Instrument: Fluorescence spectrometer Fluorolog (Horiba)
Buffer: 20mMHEPES pH 7.5, 1mM ATP and 5mM MgCl2
Excitation was set at 295 nm and emission was monitored from 305 to 400 nm
(slit width 5 nm, at 25ºC, steps 0.1 sec, average of 2 scan). Fluorescence intensity of
protein was subtracted from the buffer and the data was represented as relative
fluorescence intensity.
5.2.5B Thermal denaturation: Thermal stability of protein is an index of global
stability. The co-operative nature of melting curve shows that the protein was well
folded.
Material: Quartz cuvette (5mm)
Instrument: CD Polarimeter (Jasco, J815)
Buffers: 20 mM sodium phosphate buffer, pH 7.5
Thermal denaturation of apo wt and F-helix mutant was done simultaneously
using multi cell cuvette holder. A Far-UV CD spectrum (250 to 190) was collected from

Chapter 5. Importance of local secondary structure Page 114
10ºC to 90ºC with an increment of 1ºC/min. At each data point sample was equilibrated
for 5 min.
Data analysis: Ellipticity at 222 nm at different temperature was collected. It was use to
estimate ellipticity of fully folded (f) and unfolded form (u) using nonlinear
regression (GraphPad Prism). The f and u derived from this was used to calculate
fraction folded at any temperature (α). α = [F]/ ([F] + [U]) = (t-u)/(f-u), Where [F]
and [U] are concentration of folded and unfolded form respectively and t is the
observed ellipticity at given temperature. To calculate the Tm, the fraction folded at
given temperature was further analyzed using nonlinear regression (GraphPad Prism).
5.2.5C Equilibrium unfolding: Equilibrium unfolding using chemical denaturants
provide thermodynamic stability of protein.
Material: Quartz cuvette (1mm)
Instrument: CD Polarimeter (Jasco, J815).
Data analysis software: GraphPad Prism 5.
Buffers: 20 mM sodium phosphate buffer pH 7.5.
10M urea: 10M urea was prepared in 20mM sodium phosphate buffer pH 7.5.
To determine the thermodynamic stability, apo form of wt or the F-helix mutant
proteins (5 M) were incubated overnight with different concentrations of urea (0M to
7M urea) with 0.2 M increment at 25ºC and the CD spectra was collected from 240 to
200 nm.
Data analysis: Ellipticity at 222nm at varying urea concentration was used for analysis.
The data was fitted as described by Shirley using Graph pad (Shirley, 1995). Free
energy change was calculated byGu = -RT lnK = -RT ln [(f-)/ ( - u)] where R is
the gas constant (1.987 calories/deg/mol) and T is the absolute temperature (K), is
ellipticity at given urea concentration, f and u represent the ellipticity of the folded
Chapter 5. Importance of local secondary structure Page 115
and unfolded protein respectively. For a well folded protein Gu is generally varies
linearly with denaturant concentration (urea). The free energy of protein in absence of
denaturant G (H2O) was calculated by the linear extrapolation model. A ‘least square’
analysis was used to fit the data to equation Gu = G(H2O) - m[Urea], where m
measures dependence of free energy on denaturant concentration and amount of
polypeptide exposed to solvent on unfolding.
5.2.6 Limited proteolysis of wt and F-helix mutant: Well folded proteins are hard
to degrade by proteases as recognition sequences are not accessible. When proteolysis
experiments are done in suboptimal condition it is referred to as limited proteolysis
(Fontana et al., 2004; Picotti et al., 2004). In these conditions protease will be able
cleave the most accessible or flexible region in the protein. Limited proteolysis has been
used to find flexible local structure, folding intermediate and isolating protein fragments
that can fold autonomously (or domains). We planned to use limited proteolysis to find
out the floppy region in apoMb and whether it was stabilized in F-helix mutant.
Material: Trypsin (Sigma) and chymotrypsin (Sigma).
2X Proteolysis buffer: 40 mM Tris pH 7.5 (in case of chymotrypsin supplemented with
1 mM CaCl2).
Apowt and F-helix mutant Mb were incubated with trypsin or chymotrypsin at
1/25 (w/w) enzyme to substrate ratio in 1X proteolysis buffer. Just after addition of
protease an aliquot was withdrawn (0 min) and reaction was incubated at 25ºC. Aliquots
were withdrawn at 15, 30 and 60 min and reaction was stopped by adding 3Xsample
buffer (containing SDS) or 1% TFA. Samples were resolved on Tricine SDS PAGE and
stained by CBB. Reaction stopped by TFA was stored at -20ºC for MALDI MS
analysis.

Chapter 5. Importance of local secondary structure Page 116
5.2.6ATricin SDS PAGE: Routinely used glycine-SDS PAGE cannot resolve protein
<10kDa. For the separation of small protein and peptides, Tricine-SDS PAGE is a
popular choice. The different separation characteristics of the two techniques are
directly related to the difference in pKa values of glycine and Tricine functional groups.
The limited proteolysis products were expected to be of <10kDa, we therefore adopted
Tricine SDS PAGE for the separation of cleaved products.
Material: Glycerol, 10% APS, TEMED.
Essential buffers:
10X Anode buffer: 1M Tris pH 8.9 (with HCl)
Cathode buffer: 1M Tris, 1M Tricine and 1% SDS, pH ~8.9 (pH adjustment is not
required).
Gel buffer: 3M Tris pH 8.45(with HCl) and 0.3% SDS
48% Acrylamide stock: 46.5 g acrylamide and 3 g of bisacrylamide was dissolved in 70
ml water and later volume was adjusted to 100 ml.
3X SDS sample buffer: 150 mM Tris/HCl (pH 7.0), 12% SDS, 6% β-mercaptoethanol,
30% glycerol and 0.05% Coomassie blue G-250.
Mini SDS PAGE apparatus (Bio-Rad)
16% Tricine separating gel was prepared using 1X gel buffer, 0.033% APS and
33% TEMED. Using separate cathode and anode buffer, limited proteolysis product was
resolved initially at 50V for 30 min then at 120V for 3 to 4 h.
5.2.6B MALDI MS of cleaved products: From mass spectrometry accurate mass of
macromolecule can be measured. To find out site of trypsin and chymotrypsin cleavage,
we excised the band from polyacrylamide gel and mass of the fragment was analyzed by
MALDI MS. Aliquots withdrawn during limited proteolysis reaction were also analyzed
directly by MALDI MS. For extraction of protein from polyacrylamide gel, coommassie

Chapter 5. Importance of local secondary structure Page 117
stained gel pieces were first washed, cysteine crosslinking reduction and alkylation of
protein was done before extraction.
Material: TFA, Acetonitrile, DTT (Sigma), Iodoacetamide, α-Cyano-4-hydroxycinnamic
acid (HCCA).
Essential buffers:
Wash buffer: 1:1 mixture of 100 mM NH4HCO3 and acetonitrile (50mM NH4HCO3 and
50% acetonitrile mixture).
Reducing buffer: 10 mM dithiotreitol / 50 mM NH4HCO3 (freshly prepared).
Alkylation buffer: 55 mM iodoacetamide in 50 mM NH4HCO3 (freshly prepared, protect
from light).
Extraction buffer: 50% Acetonitrile and water mixture containing 5%TFA.
Reconstitution buffer: 10% acetonitrile in water containing 0.1% TFA
Instrument: Brucker Ultraflex II MALDI TOF-TOF
Protein gel corresponding to full length and cleaved products were excised,
wash several times with water (4 changes, 5 min each). Gel pieces were further washed
for 15 min with wash buffer followed by treated with acetonitrile. Gel was rehydrated
with 50 mM NH4HCO3 and after 5 min equal volume of acetonitrile was added and
incubated for 15 min. Gel pieces were again treated with acetonitrile to dehydrate it and
incubated in reducing buffer for 45 min at 56°C. After cooling to room temperature,
reduced protein was alkylated using freshly prepared 55 mM iodoacetamide (in 50 mM
NH4HCO3) for 30 min in the dark. Gel pieces were again washed with washing buffer
and dehydrated using acetonitrile as described earlier and dried using vacuum centrifuge
(~30min). The full length or cleaved products were extracted by incubating
corresponding gel pieces with extraction buffer for 30 min. This step was repeated
twice. Extracted polypeptides were dried and reconstituted in 20 l of reconstitution

Chapter 5. Importance of local secondary structure Page 118
buffer. Reconstituted peptides or reaction mixture were mixed with matrix (HCCA)
(v/v-1:1) and crystalized on MALDI plate by ‘dry droplet’ method. Peptides were
analyzed by mass spectrometry on the Brucker Ultraflex IIMALDI TOF-TOF. The
resulting MS data was analyzed using Flex analysis 3.0 software (Brucker Daltonik).
5.2.7 Proteasomal degradation of wt and F-helix mutant: Apo wt and F-helix
mutant Mb were incubated with 26S proteasome and degradation was monitored by
quantifying substrate remaining as described earlier.
5.3 RESULTS and DISCUSSION
5.3.1 Strategy for F-helix stabilization: HoloMb was stable for proteasomal
degradation. Upon heme removal, dramatic structural change was observed in the F-
helix, none of the other helices involved in heme binding were affected. The NMR
structure of apoMb showed the residues from 78 to 106 were in dynamic equilibrium
between partially folded and unfolded state (Fig. 5.1A) (Eliezer and Wright, 1996). We
hypothesized that this fluctuating helix, which was buried in holo protein, might be
responsible for apoMb degradation. Since apoMb gets degraded without the assistance
of ‘trans-acting element’ this fluctuating structure in protein may act as recognition
element or act as initiator of degradation. Stabilization of F-helix may affect any of
these steps and therefore should affect the proteasome mediate degradation of apoMb.
We wanted to engineer the helix in such a way that helix once formed remains
stable in the absence of heme. Residues 78 to 106
(KKGHHEAELKPLAQSHATKHKIPIKYLEF) encompass the EF-loop, F-helix, FG-
loop and first few residues from G-helix. The Gly 80 in the EF-loop, Pro 88 and Ser 92
within the helix were planned to convert in to helix stabilizing residue Ala. The FG-loop
is formed by KHKI (96-99) residues (Fig 5.1B). The H97N substitution was tested in

Chapter 5. Importance of local secondary structure Page 119
FG-loop. The helical propensity of 78-106 residues in wt and the replacement
G80A/P88A/S92A/H97N was analyzed using Agadir. Agadir works on helix coil
transition theory and for short peptide provides residue level helical propensity. The
G80A/P88A/S92A/H97N substitutions were substantially more helical than wt
sequence in 78-106 regions (Fig. 5.1C). We used this mutant for further analysis and
referred this as ‘F-helix mutant’.
5.3.2 F-helix was stable during MD simulation: MD simulation of heme free form
of Wt and mutant was done at 400K for 2.8 ns. The f-helix in wt melted at the
beginning of the simulation while in mutant it was stable even until end (Fig. 5.1D).
This observation indicates that floppy F-helix was less dynamic in heme free form of F-
helix mutant.
Figure 5.1 Stabilization F-helix of Mb: The comparison of X-ray crystal structure of
holo (PDB=2JHO) and NMR structure of apoMb (Eliezer and Wright, 1996) showed
that 78-106 region was in dynamic equilibrium between partially folded and unfolded
stage (A). The proposed modification for stabilizing floppy helix is highlighted in red
(B). Prediction of the helical propensity of 78-106 region in Wt and

Chapter 5. Importance of local secondary structure Page 120
G80AP88AS92AH97N (brown) using AGADIR (C). MD simulation of wt apoMb and
the F-helix mutant was done at 400 K, wt melts immediately while, F-helix mutant
remains stable even at the end of 2.8 ns simulation (D).
5.3.3 F-helix mutant Mb was more helical than wt: When a protein is destabilized
or stabilized it is reflected in its secondary structure. We first compared the secondary
structures of holo and apo form of Mb by Far-UV CD spectrometry. Mb is all helical (A
to H-8 helices) protein, we found signature negative ellipticity at 222, 209 nm and
positive ellipticity around 190 nm. The Mean Residue Ellipticity (MRE) at 222 and
209nm of holoMb was more than apoMb showing that heme removal resulted in loss of
helicity (Fig. 5.2A). Using SELCON, CONTIN (from Dichroweb) and MRE at 222 nm
for calculating secondary structural component, we found that heme removal resulted in
18% loss in helicity (pH 7.5 and 24ºC). A 20% change in helicity has been reported at
near neutral pH (Griko et al., 1988). If we observe the secondary structural components
of holo (α-helix-94%, β-sheet-0% and other- 6%) and apoMb (α-helix-79%, β-sheet-
0%, turn 6% and other- 15%), loss of helicity resulted in increase in unordered
conformation (from 6% to 15%).
From the AGADIR prediction and MD simulation it was clear that F-helix was
stabilized in F-helix mutant. These changes were incorporated in Mb cDNA by site
directed mutagenesis, protein was purified and heme was removed. The secondary
structure of the holo and the apo forms of F-helix mutant were compared with their wt
counterpart. The secondary structure of holo form of wt and F-helix mutant was
comparable (Fig. 5.2A). The apoF-helix mutant was 9% (±2%) more helical than that of
apowtMb (Fig. 5.2A). As compared to holo, apoMb was 18% less helical, half of the
loss in helicity (9%) was recovered due to helix stabilizing mutations. Therefore the
designed mutations were able to stabilize the heme free form of Mb making it ‘holo
like’ structure without heme.
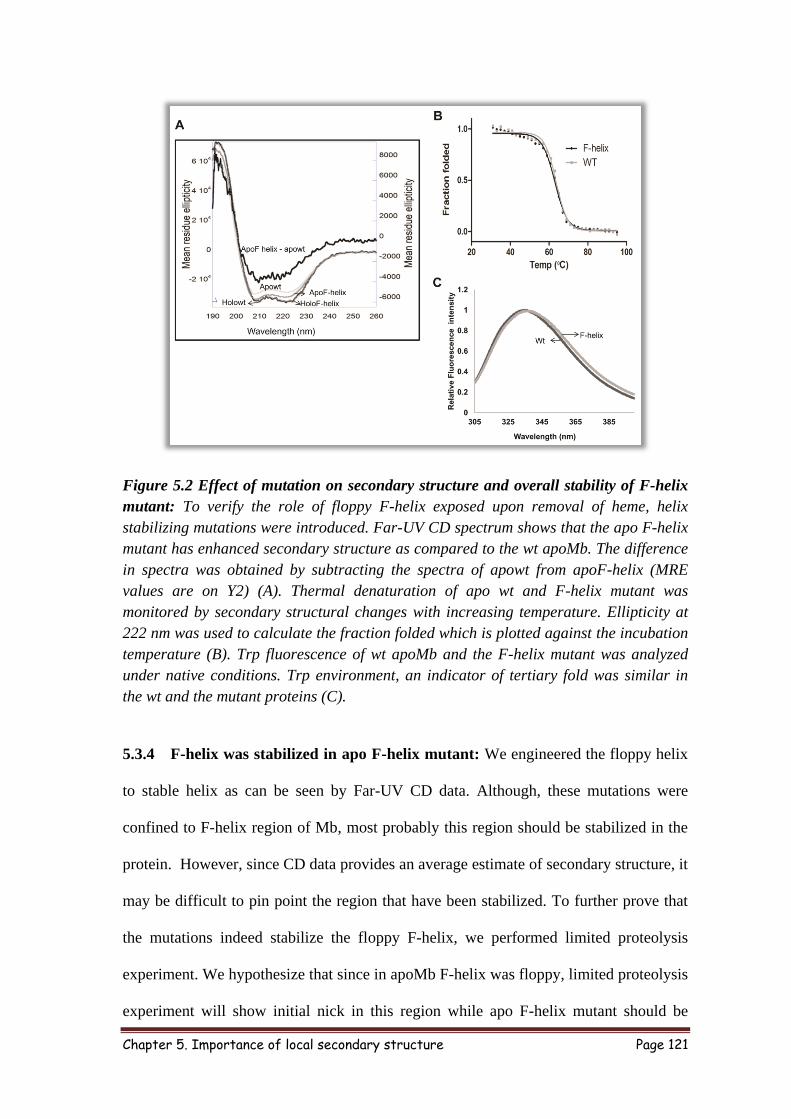
Chapter 5. Importance of local secondary structure Page 121
Figure 5.2 Effect of mutation on secondary structure and overall stability of F-helix
mutant: To verify the role of floppy F-helix exposed upon removal of heme, helix
stabilizing mutations were introduced. Far-UV CD spectrum shows that the apo F-helix
mutant has enhanced secondary structure as compared to the wt apoMb. The difference
in spectra was obtained by subtracting the spectra of apowt from apoF-helix (MRE
values are on Y2) (A). Thermal denaturation of apo wt and F-helix mutant was
monitored by secondary structural changes with increasing temperature. Ellipticity at
222 nm was used to calculate the fraction folded which is plotted against the incubation
temperature (B). Trp fluorescence of wt apoMb and the F-helix mutant was analyzed
under native conditions. Trp environment, an indicator of tertiary fold was similar in
the wt and the mutant proteins (C).
5.3.4 F-helix was stabilized in apo F-helix mutant: We engineered the floppy helix
to stable helix as can be seen by Far-UV CD data. Although, these mutations were
confined to F-helix region of Mb, most probably this region should be stabilized in the
protein. However, since CD data provides an average estimate of secondary structure, it
may be difficult to pin point the region that have been stabilized. To further prove that
the mutations indeed stabilize the floppy F-helix, we performed limited proteolysis
experiment. We hypothesize that since in apoMb F-helix was floppy, limited proteolysis
experiment will show initial nick in this region while apo F-helix mutant should be

Chapter 5. Importance of local secondary structure Page 122
relatively stable towards proteolysis provided it has been stabilized in mutant protein.
We choose trypsin and chymotrypsin for our experiment. Trypsin or chymotrypsin
cleaved the apoMb in F-helix region. Along with the full length protein (17.3kDa) two
fragments corresponding to 1-96, 97-153 (trypsin) and 1-89, 90-150 (chymotrypsin)
were observed in Tricin SDS PAGE (Fig. 5.3 B and C). Rate of cleavage of
chymotrypsin was faster than trypsin, at 60 min the intensity of full length as well as the
cleaved product decreased showing further cleavage of the nicked products (Fig. 5.3 C).
To identify site of cleavage, direct reaction mixture or gel extracted cleaved fragments
were analyzed by Matrix-assisted laser desorption/ionization mass spectrometry
(MALDI MS). Trypsin and chymotrypsin cleave apoMb after Lys 96 and Leu 89
respectively (Fig. 5.3A and table. 5.2) (Picotti et al., 2004). Apo F-helix mutant was
very stable towards protease cleavage, minimal amount of products could be seen upon
prolonged incubation when most of the wt apoMb was cleaved.
Previous reports, AGADIR prediction, MD simulation, far-UV CD and limited
proteolysis showed that upon heme removal major structural changes were confined to
F-helix region (78-106) of Mb. We engineered the F-helix region of Mb to induce
helicity even in the absence of heme. Taking together above experiments provide
enough evidence to prove that designed mutations in F-helix region were able to
stabilize the F-helix in absence of heme.
Table 5.2 Calculated and mass obtained from MS of limited proteolysis
fragments
Protease Fragments Calculated
mass (Da)
m/z (Da)
Uncut 17330 17341
Trypsin 1-96 10911.6 10924
97-154 6437.4 6448
Chymotrypsin 1-89 10187.8 10199
90-154 7161.2 7176

Chapter 5. Importance of local secondary structure Page 123
Figure 5.3 Stabilization of F-helix rendered apoMb more resistant to degradation by
the proteasome: Cleavage sites of trypsin and chymotrypsin on Mb are
diagrammatically represented (in F-helix underlined amino acids are mutated) (A).
Trypsin (B) and chymotrypsin (C) were added to wt and F-helix mutant. Aliquots at
various time intervals were analyzed by Tricine-SDS Page. Cleaved of apoMb by
chymotrypsin was almost instantaneous (0 min). The F-helix mutant was stable for
cleavage by trypsin and chymotrypsin (B and C). Apo wt and apo F-helix proteins were
incubated with proteasome. The rate of degradation was followed by SDS-PAGE. Data
represent the mean values ±S.D of at least three independent experiments for wt apoMb
and five independent experiments for F-helix mutant (D).
5.3.5 Overall stability of F-helix mutant was not affected: Stabilization of local
region in a protein might results in building several new long range interactions
resulting in global stabilization of the protein. Stability of apo form of wt and F-helix
mutant protein was deciphered using several biophysical techniques like tryptophan
environment, thermal denaturation and equilibrium unfolding using urea. Tryptophan
fluorescence of apo wt and F-helix mutant Mb was measured to check whether
mutations have affected the tertiary structure of the protein. The emission maximum and
relative fluorescence intensity of both the protein were similar indicating, tryptophan

Chapter 5. Importance of local secondary structure Page 124
environment of both the proteins was comparable (Fig. 5.2C). Thermal stability of
protein has been used to determine the thermodynamic stability of the protein. The
secondary structural changes (ellipticity at 222 nm) of wt and mutant protein were
measured as a function of temperature. Both the proteins showed two state transitions of
thermal denaturation illustrating co-operative nature of unfolding, the characteristic of
well folded protein. The melting temperature (temperature at which protein is 50%
unfolded) of wt and mutant protein was 63°C indicating overall fold of the mutant
protein was not affected by mutation (Fig. 5.2B). To further prove that mutations had a
major effect on the secondary structure and that the global stability was unaffected, we
compared the thermodynamic stability of wt apoMb and the F-helix mutant by urea
denaturation at pH 7.5. Secondary structure of both the proteins was measured as a
function of urea concentration. Free energy of stabilization was calculated using the
equation G=G (H2O)-m [urea] where G (H2O) is G in the absence of urea and m,
the dependence of G on urea. The G, midpoint transition (urea concentration required
to unfold 50%), and m of both apo wt and F-helix mutant protein were similar (Table
5.3).
Table 5.3 Thermodynamic parameters from the urea equilibrium unfolding
The above experiments provide clear evidence that mutations in the F-helix
primarily stabilize the secondary structure in the floppy F-helix and global stability was
not affected.
5.3.6 Exposure of F-helix was essential for apoMb degradation: It is clear by now
that the F-helix was stabilized in mutant protein. We checked the effect of these
mutations on proteasomal degradation, apo F-helix mutant was found to be more stable
Wt F-helix
ΔG (H2O) (kcal mol-1
) 6.14± 0.25 6.12±0.25
M (kcal mol-1
M-1
) -1.41±0.05 -1.49±0.06
Cm (M) 4.3 4.09

Chapter 5. Importance of local secondary structure Page 125
than wt (Fig. 5.3D). We observed substantial increase (4h) in the half-life of
proteasomal degradation in F-helix stabilized mutant. The proteasomal stability in F-
helix mutant could be due to compromised affinity with proteasome. To rule out this
possibility, proteasome binding assay was done with apo wt and F-helix mutant. The
affinity of mutant protein with proteasome was not compromised (Kd=0.57±1nM)
(Table 5.4). This result also indicates that the residues mutated may not be directly
involved in interaction
While holoMb was not recognized and degraded by proteasome, heme removal
resulted in exposure of a buried helix. ApoMb on the other hand bound tightly, elicited
response from proteasome and was degraded by it. Stabilization of exposed helix made
it difficult for the 26S proteasome to degrade the mutant apoMb. Long unstructured
sequences when attached in trans has been shown to enhance the proteasomal
degradation of protein, but how such unstructured regions may originate in the substrate
remains unclear. The above results not only strongly support the requirement of floppy
region for degradation but provide the elegant example how ‘cis-acting elements’ may
get exposed and regulate the half-life of protein. ApoMb is a natural intermediate in
biosynthesis of holoMb. Although, in vivo how Mb turnover is regulated has not been
investigated, it seems that nature protects the protein from proteasome and other
proteases by stabilizing the floppy helix due to heme binding.
Table 5.4 Comparison of wt holo, apo and apo F-helix mutants
Protein % helix
(SELCON 3)
F-helix Affinity
(Kd nM)
Tm (ºC) Average half-
life (h)
Apowt 79 Floppy 3.5±1 63 12
HoloMb 94 Buried ND 80 ND
Apo F-helix 85 Stabilized 0.57±0.1 63 16

Chapter 5. Importance of local secondary structure Page 126
5.4 SUMMARY
The clues obtained from structural comparison of both the form of Mb led us to
engineer helix stabilizing amino acids in floppy F-helix. We found that F-helix was
thermodynamically stable in mutant protein by MD simulation. The Far-UV CD data
suggested that apoMb was 18% less helical than its holo form and helix stabilizing
mutations does not affect the secondary structure of holo form while apo form of mutant
was about 9% more stable than wt. From limited proteolysis experiment we proved that
F-helix of apoMb was indeed floppy in nature and it is stabilized in mutant. The
tryptophan environment, melting temperature and free energy of stabilization of apowt
and mutant Mb were comparable, establishing that overall stability of mutant was
similar to wt. The affinity of mutant protein was not compromised while mutant protein
was relatively stable for proteasomal degradation.
Taken together these results provide direct proof that the disordered F-helix is
stabilized by mutation and therefore conformational changes involving this helix must
be responsible for the effect on degradation. These results also reflect the fact that the
proteasome is sensitive to local secondary structural alterations. Some of the important
findings are -
a) Conformational change such as exposing a previously buried region (‘Cis-acting
element’) was necessary for recognition.
b) Localization and high affinity binding was necessary but not sufficient for efficient
degradation.
c) Local changes in the secondary structure alone can determine the half-life of a
protein. Similar types of alterations have been reported when a protein undergoes
post translational modification or ligand/binding partner is removed.

Chapter 5. Importance of local secondary structure Page 127
Several heavily ubiquitinated proteins have been found to be interacting with
proteasome but escape degradation. The process of presentation of ‘cis-acting element’
might be a key switch in decision making to degrade or not to degrade.

Chapter 6. Identification of recognition element Page 128
Chapter 6
Identification of proteasome recognition element in apoMb
Chapter 6. Identification of recognition element Page 129
6.1 INTRODUCTION
It is by far established that apoMb interacts with proteasome with very high affinity (Kd
= 3.5±1 nM) without the help any extrinsic factors. However, it was not clear which
region of Mb was involved in this high affinity interaction. Since, this interaction was
direct and did not involve any trans-acting elements like Ub or adaptor proteins, direct
mapping of the binding site is possible and would be highly informative. Such
identification may provide new insights into the structural and sequence determinants of
substrate interaction. One would be able to determine whether the proteasome
interacting region of apoMb is floppy as assumed for other substrates or structured and
whether there are any sequence preferences.
The floppy helix was important for apoMb degradation. However its role was
still not very clear- it might act as key recognition element or initiator of degradation.
To explore both the possibility and to identify proteasome binding surface on apoMb,
we used an altogether different approach. Overlapping peptides are well known for their
use in epitope mapping (Halimi et al., 1996). We combined this with competition
studies and structure based approach to identify key residues in apoMb required for
interaction with the proteasome.
6.2 MATERIALS and METHODS
Protein-protein interaction is an important part of all the cellular processes. To
understand the binding surfaces involved in apoMb and proteasome interaction. We
have designed following strategy -

Chapter 6. Identification of recognition element Page 130
Strategy-identification of recognition element in apoMb
6.2.1 Screening of overlapping Mb peptides for proteasome binding:
Material: ATP (Sigma), MG132 (Calbiochem), streptavidin alkaline phosphatase
(Sigma) and p-nitrophenyl phosphate (pNPP-Genei).
Peptides: peptides were synthesized by solid phase chemistry with biotin tag at the N-
terminus and KGG as linker (Genepro biotech).
6.2.1A Designing overlapping peptides to pan entire Mb sequence: We designed 15
residue peptides, of which 12 were common between two consecutive peptides. Biotin
tag was added to the N-terminus of these peptides for detection during screening and
KGG linker was used, to provide flexibility. A total of 47 peptides spanning all the eight
helices (A to H) and loops were synthesized
6.2.1B Peptide reconstitution: 47 peptides spanning entire Mb sequence were received
as lyophilized powder along with their HPLC retention time and mass spectrometry data
demonstrating their purity, homogeneity and accurate molecular mass. Several organic
and inorganic solvents are available for reconstituting the peptides. In order to maintain
Chapter 6. Identification of recognition element Page 131
uniformity, all the peptides were reconstituted in DMSO at 12.5 mM concentration and
stored in -20ºC freezer in small aliquots.
Note: Normally peptide solubility becomes one of the challenges as it is difficult to
predict a solvent suitable for all the peptides to be tested. Complete dissolution of the
peptide is necessary or it will result in variation of its concentration. By using routine
techniques it is difficult to accurately measure the peptide concentration after
reconstitution. Due to these issues organic solvents like DMSO or DMF are popular
when organic solvents do not affect the reaction.
Peptide screening method was similar to apoMb and proteasome binding assay
using ELISA (as described earlier). The 26S proteasome was immobilized on Maxisorb
plate with the help of anti-FLAG antibody. After blocking, 1 M (also tested 10 M
and 0.1 M) of all the peptides were incubated with proteasome at 37ºC for 1 h.
Unbound peptides were washed away. Peptides interacting with proteasome were
quantified by alkaline phosphatase conjugated streptavidin and pNPP substrate.
Alkaline phosphatase converts pNPP to a chromogenic product p-nitrophenol. After 20
min incubation, reaction was stopped by 2 N NaOH and amount of 26S proteasome
bound peptides were quantified by collecting absorbance at 405 nm.
In order to rule out the possibility that those peptides that did not interact might
have been degraded during the incubation step, binding assay was performed in
presence of 0.1 M proteasome inhibitor MG132.
6.2.2 Peptide and apoMb competition for proteasome binding: In order to test the
ability of proteasome interacting peptides to compete for apoMb binding, we performed
a competition study with those peptides which were found to be interacting with
proteasome in screening experiments.
Material: as described earlier.

Chapter 6. Identification of recognition element Page 132
8 nM apoMb (Kd=3.5nM) and varying concentration (0 to 100M) of peptides
were incubated with immobilized proteasome in presence of 0.1 M MG132. The
amount of proteasome bound apoMb was quantified as described earlier. Inhibitor
constant was calculated (Ki) by fitting the graph assuming one site binding (graph pad).
6.2.3 Structure guided approach to identify proteasome interacting residues
6.2.3A Identification of probable proteasome interacting residues: To identify
which residues in A-helix were responsible for proteasome binding, we undertook a
structure guided approach. Upon heme removal bulk of the conformation fluctuations
were confined to F-helix (apoMb NMR) and A-helix was not directly involved in heme
binding. We analyzed the A-helix in the crystal structure of holoMb (2JHO) and found
R group of four residues (Q9, H13, K17 and E19) to be solvent exposed.
6.2.3B Mutation, expression, purification and affinity for proteasomal binding: All
the four residues identified by structure guided approach were mutated to Ala by site
directed mutagenesis. Primers used for mutagenesis are listed in table 6.1.
Table 6.1.Primer sequence used for A-helix mutation
Name Forward primer Reverse primer
Q9A AGGTGAATGGGCTCTGGTTCTG CAGAACCAGAGCCCATTCACCT
H13A CTGGTTCTGGCTGTTTGGGCTAAAG CTTTAGCCCAAACAGCCAGAACCAG
K17A TGTTTGGGCTGCTGTTGAAGCTG CAGCTTCAACAGCAGCCCAAACA
E19A TGGGCTAAAGTTGCTGCTGACGTCG CGACGTCAGCAGCAACTTTAGCCCA
The resulting mutants were sequence verified, expressed in DH5α, purified by
cation exchange chromatography and apo form was prepared as discussed earlier. In
order to test whether above mentioned mutants had any effect on proteasome binding
affinity the binding assay was performed (as described earlier).

Chapter 6. Identification of recognition element Page 133
6.3 RESULTS and DISCUSSION
6.3.1 Designing peptides to pan entire Mb sequence: In order to identify
proteasome interacting surface on apoMb, entire Mb sequence was panned using
overlapping peptides. We designed 15 residue peptides with biotin tag added to the N-
terminus and KGG linker was used to provide flexibility. A total of 47 peptides
spanning all the eight helices (A to H) and loops (Fig. 6.1A) were synthesized. The
helix code, sequence and molecular weight are given in table 6.2.
Figure 6.1 Mb overlapping peptide screening: 15 residue long overlapping
peptides were designed to cover the entire Mb sequence (A). Peptides (1M) were
screened for proteasome binding (B). Peptides corresponding to A-helix bound
tightly (B).
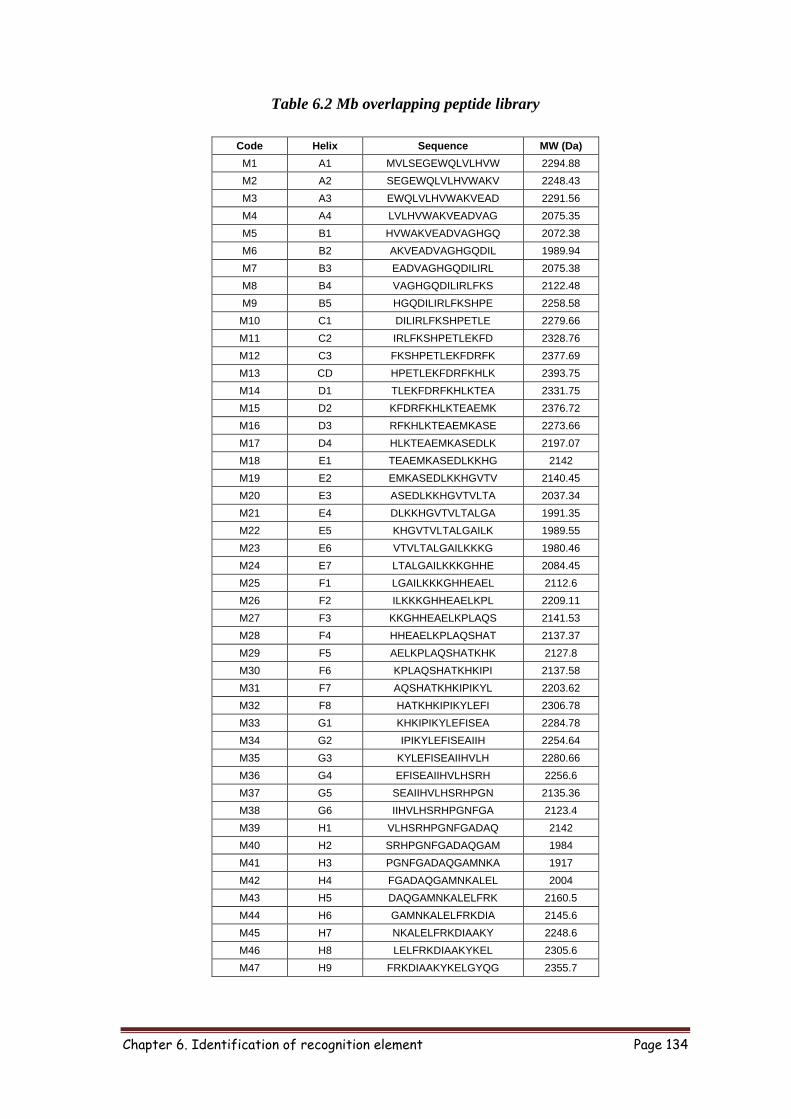
Chapter 6. Identification of recognition element Page 134
Table 6.2 Mb overlapping peptide library
Code Helix Sequence MW (Da)
M1 A1 MVLSEGEWQLVLHVW 2294.88
M2 A2 SEGEWQLVLHVWAKV 2248.43
M3 A3 EWQLVLHVWAKVEAD 2291.56
M4 A4 LVLHVWAKVEADVAG 2075.35
M5 B1 HVWAKVEADVAGHGQ 2072.38
M6 B2 AKVEADVAGHGQDIL 1989.94
M7 B3 EADVAGHGQDILIRL 2075.38
M8 B4 VAGHGQDILIRLFKS 2122.48
M9 B5 HGQDILIRLFKSHPE 2258.58
M10 C1 DILIRLFKSHPETLE 2279.66
M11 C2 IRLFKSHPETLEKFD 2328.76
M12 C3 FKSHPETLEKFDRFK 2377.69
M13 CD HPETLEKFDRFKHLK 2393.75
M14 D1 TLEKFDRFKHLKTEA 2331.75
M15 D2 KFDRFKHLKTEAEMK 2376.72
M16 D3 RFKHLKTEAEMKASE 2273.66
M17 D4 HLKTEAEMKASEDLK 2197.07
M18 E1 TEAEMKASEDLKKHG 2142
M19 E2 EMKASEDLKKHGVTV 2140.45
M20 E3 ASEDLKKHGVTVLTA 2037.34
M21 E4 DLKKHGVTVLTALGA 1991.35
M22 E5 KHGVTVLTALGAILK 1989.55
M23 E6 VTVLTALGAILKKKG 1980.46
M24 E7 LTALGAILKKKGHHE 2084.45
M25 F1 LGAILKKKGHHEAEL 2112.6
M26 F2 ILKKKGHHEAELKPL 2209.11
M27 F3 KKGHHEAELKPLAQS 2141.53
M28 F4 HHEAELKPLAQSHAT 2137.37
M29 F5 AELKPLAQSHATKHK 2127.8
M30 F6 KPLAQSHATKHKIPI 2137.58
M31 F7 AQSHATKHKIPIKYL 2203.62
M32 F8 HATKHKIPIKYLEFI 2306.78
M33 G1 KHKIPIKYLEFISEA 2284.78
M34 G2 IPIKYLEFISEAIIH 2254.64
M35 G3 KYLEFISEAIIHVLH 2280.66
M36 G4 EFISEAIIHVLHSRH 2256.6
M37 G5 SEAIIHVLHSRHPGN 2135.36
M38 G6 IIHVLHSRHPGNFGA 2123.4
M39 H1 VLHSRHPGNFGADAQ 2142
M40 H2 SRHPGNFGADAQGAM 1984
M41 H3 PGNFGADAQGAMNKA 1917
M42 H4 FGADAQGAMNKALEL 2004
M43 H5 DAQGAMNKALELFRK 2160.5
M44 H6 GAMNKALELFRKDIA 2145.6
M45 H7 NKALELFRKDIAAKY 2248.6
M46 H8 LELFRKDIAAKYKEL 2305.6
M47 H9 FRKDIAAKYKELGYQG 2355.7
Chapter 6. Identification of recognition element Page 135
6.3.2 Screening peptides for 26S proteasome binding: 26S proteasome was
immobilized on ELISA plate and incubated with overlapping peptides. Proteasome
bound peptides were quantified by streptavidin alkaline phosphatase and pNPP
substrate. We found A-helix peptides bound most tightly at all the concentration tested
(Fig. 6.1B). Some peptides from B-helix, CD loop, E-helix (C terminus of E-helix, EF
loop and first 2 residues from F-helix) and F7 (C terminus of F-helix, FG-loop and first
5 residues for G-helix) were also found consistently bound to proteasome but with
lesser affinity (Fig. 6.1B).
6.3.3 ApoMb interacted with proteasome mainly through A-helix: Mb peptides
might degrade during incubation with proteasome. To test this, we performed the
binding experiment in presence of proteasome inhibitor MG132. The affinity of peptide
with proteasome was unaltered except for F7 peptides; in presence of MG132 it bound
tighter with proteasome. We decided to perform all the peptide related binding
experiments in presence of MG12. ApoMb and proteasome binding assay was also done
in presence of MG132. The Kd of apoMb and proteasome interaction in presence or
absence of MG132 was comparable (Fig 6.2A).
If peptides and apoMb occupied similar binding surfaces on 19S regulatory particle,
there should be a competition between them for interaction with proteasome. To check
this, we performed a competition study with those peptides which were found to be
interacting with proteasome in screening experiments. 8 nM apoMb (Kd=3.5 nM) and
varying concentration (0 to 100 M) of peptides were incubated with proteasome in
presence of MG132. A few peptides were found to be competing with apoMb for
proteasomal binding. At 3 M concentration, A-helix peptide alone was able to inhibit
about 80% of apoMb binding with Ki of 0.8±0.4 M (Fig 6.2B). On the other hand even
at the highest concentration tested (100 M), B-helix (40%), CD-loop (48%), E7-
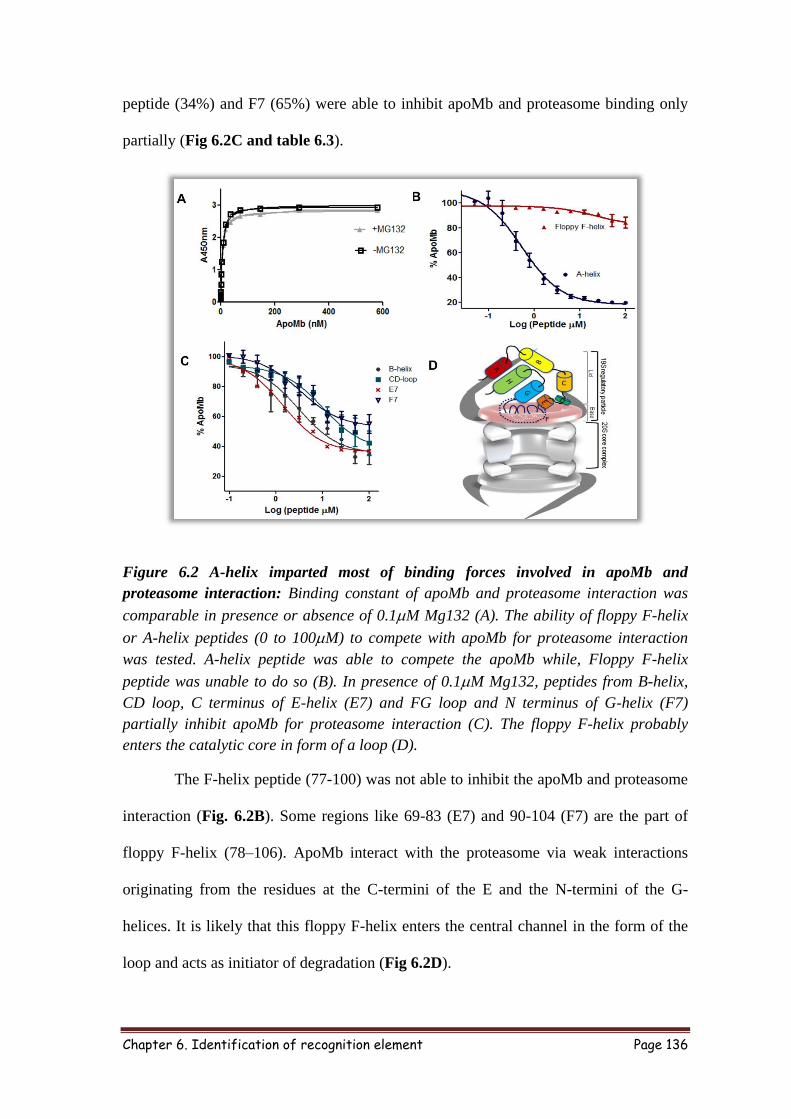
Chapter 6. Identification of recognition element Page 136
peptide (34%) and F7 (65%) were able to inhibit apoMb and proteasome binding only
partially (Fig 6.2C and table 6.3).
Figure 6.2 A-helix imparted most of binding forces involved in apoMb and
proteasome interaction: Binding constant of apoMb and proteasome interaction was
comparable in presence or absence of 0.1M Mg132 (A). The ability of floppy F-helix
or A-helix peptides (0 to 100M) to compete with apoMb for proteasome interaction
was tested. A-helix peptide was able to compete the apoMb while, Floppy F-helix
peptide was unable to do so (B). In presence of 0.1M Mg132, peptides from B-helix,
CD loop, C terminus of E-helix (E7) and FG loop and N terminus of G-helix (F7)
partially inhibit apoMb for proteasome interaction (C). The floppy F-helix probably
enters the catalytic core in form of a loop (D).
The F-helix peptide (77-100) was not able to inhibit the apoMb and proteasome
interaction (Fig. 6.2B). Some regions like 69-83 (E7) and 90-104 (F7) are the part of
floppy F-helix (78–106). ApoMb interact with the proteasome via weak interactions
originating from the residues at the C-termini of the E and the N-termini of the G-
helices. It is likely that this floppy F-helix enters the central channel in the form of the
loop and acts as initiator of degradation (Fig 6.2D).

Chapter 6. Identification of recognition element Page 137
Table 6.3 Sequence and % inhibition of Mb peptides
Peptide Peptide sequence % inhibition (100 M)
A-helix
(Ki=0.8±0.4M)
SEGEWQLVLHVWAKV -
B-helix VAGHGQDILIRLFKS 40
CD-loop HPETLEKFDRFKHLK 48
E7-peptide LTALGAILKKKGHHE 34
F7-peptide AQSHATKHKIPIKYL 65
6.3.4 Structure guided approach to identify proteasome interacting residues: It
was clear from above experiments that A-helix in apoMb provided most of binding
forces for proteasome interaction. To identify which residues in A-helix were
responsible for proteasome binding, the A-helix of Mb was analyzed from the crystal
structure of holoMb (2JHO). We found side chain of four residues Q9, H13, K17 and
E19 were solvent exposed (Fig.6.3A).
Figure 6.3 Mutation in A-helix residues resulted loss in apoMb and proteasome
affinity: Solvent exposed R group containing residues in A-helix of Mb was identified by
analyzing crystal structure of Mb (2jho) (A). Proteasome binding affinity of wt and
mutant proteins were measured (B).
All the four residues (Q9, H13, K17 and E19) identified by structure guided
approach were mutated to Ala by site directed mutagenesis. The binding affinity for
apoQ9A, H13A, K17A, E19A and wt (as control) with proteasome was determined by

Chapter 6. Identification of recognition element Page 138
binding assay. As compared to wt, all A-helix mutants tested bound weakly to
proteasome; most remarkable difference being observed in Q9A (Fig. 6.3B). In this
case, complete saturation was not achieved at the highest concentration tested. In the
case of H13A (Kd=39±12 nM) and E19A (Kd=24±10 nM) Kd was respectively 11 and
7 fold higher than wt. While dissociation constant of Q9A (Kd=424±20 nM) and that of
K17A (Kd=96±5 nM) was found to be respectively 121 fold and 27 fold higher than wt
(Kd=3.5±1 nM) suggesting that at least these residues could be directly involved in
apoMb and proteasome interaction.
A-helix peptide showed highest affinity with proteasome in peptide screening
experiment and was able to almost completely inhibit the apoMb and proteasome
binding. We concluded that bulk of the binding energy between apoMb and
proteasome was derived from A-helix. It is believed that unstructured or
conformationally dynamic regions in the protein are involved in interaction but here we
have shown that A-helix of apoMb is crucial for this interaction, while B-helix, CD
loop, part of E and F-helix further stabilize the apoMb binding to the proteasome.
Table 6.4.Kd of wt and A-helix mutant protein with 26S proteasome
Protein Kd (nM) Fold change
Wt 3.5±1 -
Q9A 424±20 121
H13A 39±12 11
K17A 96±5 27.4
E19A 24±10 7

Chapter 6. Identification of recognition element Page 139
6.4 SUMMARY
ApoMb was degraded by purified 26S proteasome; conformationally flexible F-helix of
apoMb was very important for this process. Floppy F-helix apoMb could be important
in substrate recognition or may act as a primer for degradation despite being in the
middle of protein. We hypothesized that if floppy F-helix was responsible for apoMb
and proteasome interaction, peptide derived from F-helix (77-100) should inhibit
apoMb and 26S proteasome binding. It was observed that full length F-helix peptide
was not able to inhibit apoMb and 26Sproteasome binding. To identify 26S proteasome
binding surfaces in apoMb, we deigned overlapping peptides covering entire primary
structure of Mb. These peptides were screened for 26S proteasome binding and then
tested for their ability to compete with apoMb for proteasome interaction. It was
observed that A-helix peptides not only interacted tightly but also was able to inhibit
apoMb and proteasome interaction. Apart from A-helix, peptides form B-helix, CD-
loop, N-terminus of E-helix along with EF-loop (E7) and C-terminus of F-helix FG-
loop (F7) were able to partially inhibit the interaction. By structure guided approach we
could identify the key residues in A-helix responsible for providing bulk of the binding
forces. The degradation process was probably initiated from the floppy F-helix, an
internal part of apoMb.
Details of binding surfaces of substrate for 26S proteasome interaction have not
been identified. With the help of peptide panning, inhibition studies and structure
guided approach, we not only have provided the affinity but also identified some of
the key residues involved in apoMb and proteasome interactions.
Our method has broader application for example -
a) To identify protein-protein interaction surfaces

Chapter 6. Identification of recognition element Page 140
b) Peptide mimetic of other inhibitors can be designed from the information
derived from above methods
c) Peptides derived from different proteins can be used for screening binding
partners
d) In enzyme kinetic to understand inhibitors or activators.
If more of such substrate-proteasome binding surfaces become available, we would
be able to understand the sequence and/or structure requirements of substrate for
proteasomal degradation.

Chapter 7. Structure function correlation Page 141
Chapter 7
Structure function correlation of
proteasomal degradation

Chapter 7. Structure function correlation Page 142
7.1 INTRODUCTION
We have made the following observations so far: a) Ligand free form of Mb was
recognized and degraded by the purified 26S proteasome. b) The trans-acting elements
tested did not alter the half-life of the protein. c) Local stabilization of floppy helix
increased the half-life of the protein. d) ApoMb interacts with proteasome mainly
through A-helix and degradation starts most probably from the floppy helix.
One of the major observations was that the local secondary structure was important
for proteasomal degradation. It would therefore be interesting to understand what
happens when helix to disorder transitions are induced in other regions of apoMb. To
answer this and to understand the role of local secondary structure, overall stability and
the affinity of substrate with proteasomal degradation, we designed a multipurpose
strategy. One buried residue of each of the Mb helices were identified by calculating the
solvent accessibility surface area of each residue and mutated to Cys. Replacing buried
residues from different helices to Cys would allow us to not only understand substrate
requirement and identify rate limiting factors for proteasomal degradation but also
would provide with a tool to monitor substrate unfolding. There were no Cys in Mb,
introducing Cys in various helices may disrupt their helicity and also provide flexibility
of monitoring each and every helix during unfolding or degradation. Thiol specific
environment sensitive fluorophore may be utilized to monitor role of proteasomal
ATPases.
7.2 MATERIALS and METHODS
7.2.1 Identification of buried residue in Mb helices: The relative solvent accessibility
surface area (rSASA) was calculated using ASA-View server. This server presents
solvent accessibility of each residue of the protein provided the structure is known. To

Chapter 7. Structure function correlation Page 143
identify a buried residue from each of the Mb helices, PDB 2JHO was used and least
solvent exposed residue was identified from various Mb helices (A-helix-V10, B-helix-
G25, C-heilix-T39, E-helix-G73C, G-helix-L104 and L115, H-helix-M131). The work
plane of Mb Cys mutants is summarized below-
V10 A-helix
G25 B-helix
T39 C-helix
G73 E-helix
L104 G-helix
L115 G-helix
M131 H-helix
Work flow of Mb Cys mutants
7.2.2 Mutagenesis, expression and purification: The buried residues identified
from Mb helices were converted to Cys by site directed mutagenesis. Primer pair used
for creating the mutations is listed in table 7.1. The mutations were confirmed by
sequencing. Mutant proteins were expressed in DH5α and purified by cation exchange
chromatography.
7.2.3 Secondary structure of Cys mutants of Mb: Mutating buried residues of Mb
to Cys might destabilize the protein structure locally as well as globally. Cys disulfide
crosslinking also might affect the secondary structure of the proteins. Apo form of
mutant and wt proteins was treated with 2 mM DTT at 37ºC to reduce the oxidized
Purified and apo prepared
Mutated by SDM, sequence verified
Structural aspects
Secondary structure –CD Tryptophan environment Global stability –Thermal
denaturation
Affinity with proteasome
Effect of all these factors on proteasomal degradation

Chapter 7. Structure function correlation Page 144
disulphide. DTT treated proteins were centrifuged and used for all biophysical
experiments. The secondary structure of all the Cys mutants were measured by Far-UV
CD in 20 mM sodium phosphate buffer pH 7.5 and 1 mM DTT. DTT absorbs strongly
below 200 nm, to minimize this 1 mm path length cuvette was used for CD experiment.
The secondary structure component was calculated by SELCON and CONTIN using
Dichroweb server.
Table 7.1 Oligonucleotides used for Cys mutagenesis
Mb
mutant Prime sequences
V10C F GAATGGCAGCTGTGCCTGCATGTTTGGGC
V10C R GCCCAAACATGCAGGCACAGCTGCCATTC
G25C F CGTCGCTGGTCATTGCCAGGACATCTTGATTCG
G25C R CGAATCAAGATGTCCTGGCAATGACCAGCGACG
T39C F CTCATCCGGAATGCCTGGAAAAATTCGATCG
T39C R CGATCGAATTTTTCCAGGCATTCCGGATGAG
G73C F GTTAACTGCCCTATGCGCTATCCTTAAGAAAAAAGG
G73C R CCTTTTTTCTTAAGGATAGCGCATAGGGCAGTTAAC
L104C F AGAGATGAATTCGCAGTATTTGATCGG
L104C R CCGATCAAATACTGCGAATTCATCTCT
L115C F CGATCATCCATGTTTGCCATTCTAGACATCC
L115C R GGATGTCTAGAATGGCAAACATGGATGATCG
M131C F CTCAGGGTGCTTGCAACAAAGCTCTCGAG
M131C R CTCGAGAGCTTTGTTGCAAGCACCCTGAG
7.2.4 Tryptophan Fluorescence of Cys mutants of Mb: To understand the effect of
mutation on tryptophan environment, tryptophan fluorescence of all the mutants were
collected and represented as relative fluorescence.
7.2.5 Thermal stability of Mb mutants: The global stability of mutants might be
different than wt due to rewiring of tertiary contacts. The melting temperature of Mb
mutants was derived from thermal denaturation curve as described earlier.
7.2.6 Affinity of Mb mutants with proteasome: The mutated residue might be
directly interacting with proteasome or other changes might affect the affinity of these
mutants with proteasome. The affinity of Mb mutants was measured in binding assay,
using immobilized 26S proteasome.

Chapter 7. Structure function correlation Page 145
7.2.7 Proteasomal degradation of Mb mutants: Mb mutants were subjected to
proteasomal degradation. The effect of secondary structure, tertiary structure, global
stability and affinity was correlated with the half-life of proteins.
7.3 RESULTS and DISCUSSION
7.3.1 Identification of buried residues in Mb helices: Using ASA-View server and
holoMb crystal structure (PDB 2JHO), the relative solvent accessibility of each residue
of Mb was calculated. We identified buried residue from various helices of Mb. The
following buried residues- V10 (A-helix), G25 (B-helix), T39 (C-helix), G73 (E-helix),
L104, L115 (G-helix) and M131 (H-helix) were then used to test the effect of structure
(secondary as well as tertiary structure and global stability) and binding affinity on
proteasomal degradation. In holoMb the identified residue interacted with residues from
different helices (Table 7.2).
Table 7.2 Cys mutant, their helical interface and neighboring residues in 3D
structure
Protein Helix interface Residues around 4ºA
V10C A-G A130, M131, A134
G25C B-E G65, L69
T39C C-B and C-G L32, F33,Y103
G73C E-A W14
L104C G-H F138, R139, I142
L115C G-A and G-H V13, F123, M131
M131C H-A and H-G V10, I112, L115
7.3.2 Effect of structure on proteasomal degradation: Mb does not contain any Cys
residue. Therefore, replacing a buried residue with bulky and charged Cys might affect
local secondary structure and/or overall stability of the protein. The secondary structural
characterization of Mb mutants indicated that apo form of G25C, G73C, L115C and
L104C were less helical than that of apowt (Fig. 7.1A and table 7.3). The helical
content of apoV10C, T39C and M131C were similar to apowtMb (Fig. 7.1A). The
tertiary structure characterization by tryptophan fluorescence indicated that the

Chapter 7. Structure function correlation Page 146
tryptophan environment of all cysteine mutants was affected. Around 20% decrease in
fluorescent intensity was observed in V10C, T39C, L104C, L115C and M131C mutants
indicating at least one of the Trp (W7 or W14) was partially solvent exposed in the
mutants (Fig. 7.1B). The melting temperature (the temperature at which half the protein
molecules are unfolded) of mutant proteins was monitored by thermal denaturation. Tm
of V10C and T39C was partially affected while L104C, L115C, M131C showed about
10ºC change in Tm (Fig. 7.1C).
Figure 7.1 Effect of Cys mutation on secondary structure, Trp environment and Tm
of Mb: The far-UV CD spectrum was collected for wt and Cys mutants in presence 1
mM DTT at pH 7.5 (A). Trp fluorescence of wt and Cys mutants were collected, protein
sample was excited at 295 nm and emission spectrum was collected from 305 to 400 nm
(B). Thermal stability of wt and Mb mutants were determined by collecting far-UV
spectrum as a function of increasing temperature and ellipticity at 222 nm was used to
determine fraction folded (C and D).
ApoG25C and G73C behaved like unstructured or molten globule protein. These
proteins were less than 50% helical, displayed more than 30% decrease in Trp

Chapter 7. Structure function correlation Page 147
fluorescence and most importantly did not follow two state transition during thermal
denaturation (Fig. 7.1 A, B and D). Besides, they had the tendency to precipitate during
incubation. Because of the above reasons G25C and G73C proteins were not included in
analysis.
The mutant proteins were tested for proteasomal degradation. The helical content,
Tm and half-life of V10C and T39C mutants were comparable with that of the wt. On
the other hand, Tm of L104C, L115C and M131C were reduced by ~10ºC while
secondary structure was adversely affected in L104C and L115C. Notably, only L104C
and L115C (less helical than wt) were found to have a shorter half-life (<8hr) as
compared apowt (12h) (Fig. 7.2 A and B). To show that our observation was indeed
correct, the degradation experiment was repeated several times in presence or absence
of proteasome inhibitor MG132. Limited proteolysis of apoL104C and L115C indicated
that trypsin or chymotrypsin sites were more exposed in these mutants (Fig 7.2C). The
Tm of Leu mutants was ~10ºC less than that of wt, this is mainly contributed by change
in secondary structure of these mutants. To show that Leu mutants were not behaving
like intrinsically disordered protein, apoL104C, L115C mutants and known unstructured
protein casein was incubated with 20S proteasome. Casein was degraded by 20S
proteasome in 3h, while G-helix mutant L104C was stable towards 20S degradation
(Fig.7.2D). This observation further supported that degradation of apoL104C and
L115C was tightly regulated by 19S RP. Although, Tm of M131 mutant was affected
while helicity as well as half-life was comparable to that of wt indicating the local
secondary structure rather than overall stability is more important for proteasomal
degradation.
Interestingly, the L104 is part of the floppy F-helix (78-106) while L115C was at the
C-terminal of G-helix. In holo Mb L104 interacts with residues from H-helix while

Chapter 7. Structure function correlation Page 148
L115 with those of A and H-helix. As compared to apowt, L104C and L115C were 17
and 21% less helical respectively. It is most likely that disorderness of floppy F-helix
has been propagated to the adjacent helices which facilitated degradation by creating a
loop of sufficient length. If F-helix was entering the central channel as a loop, 29
residues long floppy F-helix would have been 5.3 nm (3.8Å/residue) but the length
required to reach catalytic core is 15 nm. Therefore, the disorderness gets propagated to
the adjacent G-helix (apo L104C and L115C) which in turn might facilitate degradation.
Hence, in substrates wherein the degradation starts from an internal region creating a
long loop, catalyzed by proteasomal AAA+ ATPases, could be a key rate limiting step.
Figure 7.2 Mutation of buried Leu residues in the G-helix shortens the half-life of
apoMb: Apo L115C (A) and L104C (B) mutant proteins were incubated with
proteasome in the presence or absence of MG132. Rate of degradation was followed by
SDS-PAGE. Data represent mean values of at least three independent experiments
± S.D. Limited proteolysis of Leu mutants was done using chymotrypsin and resolved on
Tricine-SDS PAGE (C). ApoL104C and unstructured casein was incubated with 20S
proteasome, substrate remaining was quantified as described in methods L104C was
stable for degradation while casein was degraded by 20S proteasome (D).

Chapter 7. Structure function correlation Page 149
7.3.3 Effect of affinity of substrates for proteasomal degradation: The affinity of
Cys mutants with proteasome was measured by ELISA. The affinity of V10C, L104C,
and L115C with 26S proteasome was not compromised (Table 7.3). While, T39C and
M131C bound less tightly to proteasome. The holo Mb structure indicated that T39 in
C-helix interacts with residues within the CD loop while M131 interacts with residues
from A and G-helix. From peptide panning and competition experiment it was clear that
A-helix and CD-loop were involved in holding apoMb to proteasome. Probably T39C
and M131C were influencing the proteasome interacting residues in these helices or
affecting the conformation of A-helix and CD loop. When affinity with proteasome was
correlated with degradation, we could not find direct correlation with binding affinity
and half-life of the Cys mutants of Mb.
Table 7.3 Effect of secondary structure, Trp environment, melting temperature (Tm)
and affinity (Kd) of apoMb on proteasomal degradation
ND= not determined
*2-4% variation in helicity was observed in three independent experiments.
© Data for CONTIN (not shown) was similar to SELCON 3.
# Kd represents mean value of three independent experiments ±S.D.
$ Fractional helical content = ([Θ]222 – 3,000)/(-36,000 – 3,000) (Morrisett et al., 1973).
Protein % Helix*
Relative Trp
fluorescence
Tm
(°C)
Affinity to
proteasome
(Kd nM)#
Half-life
(h)
By
222nm
$
SELCON3
©
Holowt 92 94 ND 80 ND ND
Apowt 76 79 1 63 3.5±1 12
V10C
A-helix
74
79 0.82
No shift
60 1.25±0.3 12
T39C
C-helix
74
79 0.82
1nm red shift
62 19.5±7 12
Stabilized
F-helix
85 87 1
No shift
63 0.57±0.1 16
L104C
G-helix
60 62 0.82
1nm blue shift
54 0.6±0.5 6-7
L115C
G-helix
58 58 0.83
1nm blue shift
56 0.63±0.3 7-8
M131C
H-helix
75
79 0.89
2nm red shift
55 45±20 12

Chapter 7. Structure function correlation Page 150
The degradation of small, all helical proteins by 26S proteasome was a slow
process, although, these were recognized by proteasome quickly. Floppy F-helix would
be captured by AAA+ ATPase of proteasome and due to the pulling force applied by
ATPases, loop long enough to reach active site would be created. Alternatively, due to
the cooperative nature of protein unfolding, the unfolding of substrate by proteasomal
ATPases might collapse entire structure of protein. However, in case of apoMb
degradation this process does not seem to be that straight forward. Even the denaturant
induced unfolding of apoMb is a complex process due to accumulation of stable long
lived intermediate formed by AGH helices (Fig. 7.3A). It is possible that similar
unfolding intermediate is abundant during proteasomal AAA+
ATPase mediated apoMb
unfolding and that destabilizing such an intermediate would be the key rate limiting
step. Unfolding intermediate would be less stable in short lived G-helix mutants L104C
and L115C while much more stable in F-helix mutant.
There are not many examples where degradation of substrate starts from an internal
region and results in complete degradation. If degradation is not starting from the
termini, there are two possibilities for initiation of degradation-
a) One of the termini will be pulled in the catalytic chamber and degradation would
take place in either N to C or C to N direction.
b) Due to the destabilization of adjacent helices, loop of sufficient length to reach
the catalytic site would be created and degradation might start with a cut to
generate two termini resulting in simultaneous degradation of both the
polypeptides.
In later case two polypeptides would simultaneously translocate to the catalytic core and
might compete with each other. Apart from the above stated rate limiting steps, this

Chapter 7. Structure function correlation Page 151
translocation step could also be rate limiting in case of substrates where degradation
does not start from the termini.
Figure 7.3 Unfolding intermediates of apoMb and Mb F-helix conformation variants:
The denaturant mediated apoMb unfolding goes through a stable unfolding
intermediate enriched in AGH-helices (A). The conformation of F-helix (region 76-106,
gray) affects the half-life of Mb. In holoMb it was buried and protein was not degraded
by proteasome, due to heme removal it got exposed and apoMb was recognized and
degraded by proteasome. When the helix was engineered to stabilize it, the half-life
increased while in case of Leu mutants disorder was propagated in other helices that
resulted in faster degradation (B).The variation in half-life could be due to the varying
stability of unfolding intermediates. In case of F-helix mutant, the intermediate might be
more stable while in case of Leu mutants it would be less stable.
7.4 SUMMARY
In order to understand the structure function correlation and role of local conformation
in proteasomal degradation of a substrate, buried residues from various Mb helices were
identified and converted to Cys. The effect of Cys replacement on secondary structure,
Trp environment, thermal stability and affinity with proteasome was determined and
correlated with the half-life of the Cys mutant (Table 7.3). Out of the 5 Cys mutants,
the half-life of two proteins ‘both from G-helix’ was substantially shorter than wt. Some
of key observations are as follow

Chapter 7. Structure function correlation Page 152
a) Proteasome is more sensitive to local structural changes rather than overall
stability.
b) Floppy or unstructured region of sufficient length was required for efficient
degradation.
c) Substrate recognition is a necessary step but high affinity binding may not
always facilitate degradation, as downstream processes could be rate limiting.
d) Formation of stable unfolding intermediate could be rate limiting in proteasomal
degradation.
e) Degradation initiation site might affect post recognition processes in
proteasomal degradation.

Chapter 8. Conclusions Page 153
Chapter 8
Conclusions

Chapter 8. Conclusions Page 154
CONCLUSIONS
In order to dissect the hierarchical steps in proteasomal degradation, identify the
sequence and structural requirements as well as the rate limiting steps in proteasomal
degradation, we have developed an in vitro model system using purified 26S
proteasomes and apoMb. To the best of our knowledge, this is the first report wherein
we successfully demonstrated the inherent ability of purified 26S proteasome to degrade
a globular protein (apoMb) in vitro in the absence of ubiquitin, adaptor or other trans-
acting elements. The key observations have been summarized in the form of a model
that provides insights into the process of proteasomal degradation of apoMb (Fig. 8).
Briefly, heme bound form was not recognized and degraded by proteasome; removal of
heme exposes a previously buried F-helix which is dynamic in nature. This floppy F-
helix sensitizes the proteasomal ATPases to the presence of the substrate. ApoMb is
then anchored to the proteasome primarily through A-helix; it is further stabilized by
additional interactions with B-helix and CD-loop. Degradation is initiated by insertion
of the floppy F-helix in the form of a loop into the central channel. Adjacent helices are
unraveled by AAA+ ATPases of proteasome to generate an unstructured region long
enough to reach the active site chamber. Stabilization of an unfolded intermediate seems
to slow down degradation.

Chapter 8. Conclusions Page 155
Figure 8 A model for the mechanistic steps involved in the proteasomal degradation
of apoMb: Removal of heme exposes a previously buried F-helix which is in a dynamic
equilibrium between a partially folded and unfolded structure. This transition is a rate
limiting step. Exposure of this floppy helix sensitizes the proteasome to the presence of
the substrate. ApoMb is anchored to the proteasome by interactions primarily through
the A-helix additional interactions originating from B-helix and CD loop stabilize it
further. Degradation is primed by the insertion of the floppy helix in the form of a loop
into the central channel that runs across the proteasome. An intermediate composed of
AGH helices is likely to be formed. Melting of this intermediate by the ATPases to
generate an unstructured region long enough to reach the active site is a likely rate
limiting step. Mutations can stabilize or destabilize this unfolding intermediate affecting
the rate of degradation.
Our model system provides the following new insights:
a) Although the requirement of unstructured region for efficient proteasomal
degradation is well known but, how such regions originate in the substrate was
Chapter 8. Conclusions Page 156
not clear. We have shown that ligand removal (and similar changes) can
originate the unstructured or floppy region of the protein.
b) Identified an intrinsic degradation signal in the substrate.
c) Substrate recognition is essential step in proteasomal degradation, but all
encounters of substrate with proteasome may not be productive. Substrate
binding and downstream event should be coupled for productive substrate
interaction and that ATPases may be a key determinant in linking these steps.
d) Direct interaction between proteasome and its substrate as well as the
determinants of protein-protein interactions between the two have not been
reported till date. With the help of peptide panning, inhibition studies and
structure guided approach, we identified some of the key residues in apoMb that
directly interact with proteasome.
e) In addition to the structure adjacent to the degradation signals, the unfolding
intermediates formed in globular proteins regardless of their secondary structural
status may be key determinants of the rate of degradation.
Using structure guided design, site directed mutagenesis, parallel biophysical studies
and proteolytic susceptibility as a probe for protein dynamics we showed the
mechanism of degradation of all helical protein apoMb. It is clear from our observation
that degradation of even a small protein is a well-controlled but complex process. Some
of rate limiting steps in proteasomal degradation that emerge from our study are-
a) Substrate recognition- essential but may not be sufficient for efficient
degradation. Exposure of ‘cis-acting element'.
b) Floppy/unstructured region of sufficient length for initiation of degradation.
c) Substrate unfolding through chain unraveling.

Chapter 8. Conclusions Page 157
d) Stabilization of unfolding intermediate.
e) Translocation to catalytic core.

Significance Page 158
SIGNIFICANCE OF THE STUDY
ApoMb emerges as a new model substrate for in depth study of ubiquitin independent
degradation. It can be used to investigate sequence, structure, thermodynamic and
kinetic aspects of not only proteasomal degradation but also for other
compartmentalized proteases. Our finding might open new quest for ‘cis-acting
elements’ in other ATPase dependent systems. The interaction study can be optimized
for other labile multi-subunit complex system. The peptide panning, competition and
structure guided approach can be used to identify protein-protein interaction surfaces in
other system; peptides derived from different proteins can be used to screen binding
partners and peptide mimetic or other inhibitors can be designed from the information
derived from this study.

Bibliography Page 159
BIBLIOGRAPHY
Anwar, A., Dehn, D., Siegel, D., Kepa, J.K., Tang, L.J., Pietenpol, J.A., and Ross, D. (2003). Interaction
of human NAD(P)H:quinone oxidoreductase 1 (NQO1) with the tumor suppressor protein p53 in cells
and cell-free systems. J Biol Chem 278, 10368-10373.
Arima, K., Kinoshita, A., Mishima, H., Kanazawa, N., Kaneko, T., Mizushima, T., Ichinose, K.,
Nakamura, H., Tsujino, A., Kawakami, A., et al. (2011). Proteasome assembly defect due to a proteasome
subunit beta type 8 (PSMB8) mutation causes the autoinflammatory disorder, Nakajo-Nishimura
syndrome. Proc Natl Acad Sci U S A 108, 14914-14919.
Asher, G., Lotem, J., Sachs, L., Kahana, C., and Shaul, Y. (2002). Mdm-2 and ubiquitin-independent p53
proteasomal degradation regulated by NQO1. Proc Natl Acad Sci U S A 99, 13125-13130.
Asher, G., Lotem, J., Tsvetkov, P., Reiss, V., Sachs, L., and Shaul, Y. (2003). P53 hot-spot mutants are
resistant to ubiquitin-independent degradation by increased binding to NAD(P)H:quinone oxidoreductase
1. Proc Natl Acad Sci U S A 100, 15065-15070.
Asher, G., Tsvetkov, P., Kahana, C., and Shaul, Y. (2005). A mechanism of ubiquitin-independent
proteasomal degradation of the tumor suppressors p53 and p73. Genes Dev 19, 316-321.
Bachmair, A., Finley, D., and Varshavsky, A. (1986). In vivo half-life of a protein is a function of its
amino-terminal residue. Science 234, 179-186.
Barrick, D., and Baldwin, R.L. (1993). Three-state analysis of sperm whale apomyoglobin folding.
Biochemistry 32, 3790-3796.
Baumeister, W., Walz, J., Zuhl, F., and Seemuller, E. (1998). The proteasome: paradigm of a self-
compartmentalizing protease. Cell 92, 367-380.
Bech-Otschir, D., Helfrich, A., Enenkel, C., Consiglieri, G., Seeger, M., Holzhutter, H.G., Dahlmann, B.,
and Kloetzel, P.M. (2009). Polyubiquitin substrates allosterically activate their own degradation by the
26S proteasome. Nat Struct Mol Biol 16, 219-225.
Beck, F., Unverdorben, P., Bohn, S., Schweitzer, A., Pfeifer, G., Sakata, E., Nickell, S., Plitzko, J.M.,
Villa, E., Baumeister, W., et al. (2012). Near-atomic resolution structural model of the yeast 26S
proteasome. Proc Natl Acad Sci U S A 109, 14870-14875.
Benaroudj, N., and Goldberg, A.L. (2000). PAN, the proteasome-activating nucleotidase from
archaebacteria, is a protein-unfolding molecular chaperone. Nat Cell Biol 2, 833-839.
Benaroudj, N., Zwickl, P., Seemuller, E., Baumeister, W., and Goldberg, A.L. (2003). ATP hydrolysis by
the proteasome regulatory complex PAN serves multiple functions in protein degradation. Mol Cell 11,
69-78.
Bercovich, Z., Rosenberg-Hasson, Y., Ciechanover, A., and Kahana, C. (1989). Degradation of ornithine
decarboxylase in reticulocyte lysate is ATP-dependent but ubiquitin-independent. J Biol Chem 264,
15949-15952.
Berko, D., Tabachnick-Cherny, S., Shental-Bechor, D., Cascio, P., Mioletti, S., Levy, Y., Admon, A.,
Ziv, T., Tirosh, B., Goldberg, A.L., et al. (2012). The Direction of Protein Entry into the Proteasome
Determines the Variety of Products and Depends on the Force Needed to Unfold Its Two Termini. Mol
Cell.
Bolin, L.L., Hanson, L.K., Slater, J.S., Kerry, J.A., and Campbell, A.E. (2010). Murine cytomegalovirus
US22 protein pM140 protects its binding partner, pM141, from proteasome-dependent but ubiquitin-
independent degradation. J Virol 84, 2164-2168.
Borissenko, L., and Groll, M. (2007). 20S proteasome and its inhibitors: crystallographic knowledge for
drug development. Chem Rev 107, 687-717.
Bousquet-Dubouch, M.P., Baudelet, E., Guerin, F., Matondo, M., Uttenweiler-Joseph, S., Burlet-Schiltz,
O., and Monsarrat, B. (2009). Affinity purification strategy to capture human endogenous proteasome
complexes diversity and to identify proteasome-interacting proteins. Mol Cell Proteomics 8, 1150-1164.
Brooks, C.L., and Gu, W. (2006). p53 ubiquitination: Mdm2 and beyond. Mol Cell 21, 307-315.
Camus, S., Menendez, S., Cheok, C.F., Stevenson, L.F., Lain, S., and Lane, D.P. (2007). Ubiquitin-
independent degradation of p53 mediated by high-risk human papillomavirus protein E6. Oncogene 26,
4059-4070.
Cashikar, A.G., Schirmer, E.C., Hattendorf, D.A., Glover, J.R., Ramakrishnan, M.S., Ware, D.M., and
Lindquist, S.L. (2002). Defining a pathway of communication from the C-terminal peptide binding
domain to the N-terminal ATPase domain in a AAA protein. Mol Cell 9, 751-760.
Chattopadhyay, M.K., Murakami, Y., and Matsufuji, S. (2001). Antizyme regulates the degradation of
ornithine decarboxylase in fission yeast Schizosaccharomyces pombe. Study in the spe2 knockout strains.
J Biol Chem 276, 21235-21241.
Chen, X., Barton, L.F., Chi, Y., Clurman, B.E., and Roberts, J.M. (2007). Ubiquitin-independent
degradation of cell-cycle inhibitors by the REGgamma proteasome. Mol Cell 26, 843-852.

Bibliography Page 160
Ciehanover, A., Hod, Y., and Hershko, A. (1978). A heat-stable polypeptide component of an ATP-
dependent proteolytic system from reticulocytes. Biochem Biophys Res Commun 81, 1100-1105.
Corish, P., and Tyler-Smith, C. (1999). Attenuation of green fluorescent protein half-life in mammalian
cells. Protein Eng 12, 1035-1040.
Coux, O., and Goldberg, A.L. (1998). Enzymes catalyzing ubiquitination and proteolytic processing of
the p105 precursor of nuclear factor kappaB1. J Biol Chem 273, 8820-8828.
Craiu, A., Gaczynska, M., Akopian, T., Gramm, C.F., Fenteany, G., Goldberg, A.L., and Rock, K.L.
(1997). Lactacystin and clasto-lactacystin beta-lactone modify multiple proteasome beta-subunits and
inhibit intracellular protein degradation and major histocompatibility complex class I antigen
presentation. J Biol Chem 272, 13437-13445.
Dahlmann, B. (2007). Role of proteasomes in disease. BMC Biochem 8 Suppl 1, S3.
De Benedetti, A., and Graff, J.R. (2004). eIF-4E expression and its role in malignancies and metastases.
Oncogene 23, 3189-3199.
Deveraux, Q., Ustrell, V., Pickart, C., and Rechsteiner, M. (1994). A 26 S protease subunit that binds
ubiquitin conjugates. J Biol Chem 269, 7059-7061.
Dong, Z., and Zhang, J.T. (2006). Initiation factor eIF3 and regulation of mRNA translation, cell growth,
and cancer. Crit Rev Oncol Hematol 59, 169-180.
Eliezer, D., Chung, J., Dyson, H.J., and Wright, P.E. (2000). Native and non-native secondary structure
and dynamics in the pH 4 intermediate of apomyoglobin. Biochemistry 39, 2894-2901.
Eliezer, D., and Wright, P.E. (1996). Is apomyoglobin a molten globule? Structural characterization by
NMR. J Mol Biol 263, 531-538.
Eliezer, D., Yao, J., Dyson, H.J., and Wright, P.E. (1998). Structural and dynamic characterization of
partially folded states of apomyoglobin and implications for protein folding. Nat Struct Biol 5, 148-155.
Elsasser, S., Schmidt, M., and Finley, D. (2005). Characterization of the proteasome using native gel
electrophoresis. Methods Enzymol 398, 353-363.
Etlinger, J.D., and Goldberg, A.L. (1977). A soluble ATP-dependent proteolytic system responsible for
the degradation of abnormal proteins in reticulocytes. Proc Natl Acad Sci U S A 74, 54-58.
Finley, D. (2009). Recognition and processing of ubiquitin-protein conjugates by the proteasome. Annu
Rev Biochem 78, 477-513.
Fischer, M., Hilt, W., Richter-Ruoff, B., Gonen, H., Ciechanover, A., and Wolf, D.H. (1994). The 26S
proteasome of the yeast Saccharomyces cerevisiae. FEBS Lett 355, 69-75.
Fishbain, S., Prakash, S., Herrig, A., Elsasser, S., and Matouschek, A. (2011). Rad23 escapes degradation
because it lacks a proteasome initiation region. Nat Commun 2, 192.
Fontana, A., de Laureto, P.P., Spolaore, B., Frare, E., Picotti, P., and Zambonin, M. (2004). Probing
protein structure by limited proteolysis. Acta Biochim Pol 51, 299-321.
Forsthoefel, A.M., Pena, M.M., Xing, Y.Y., Rafique, Z., and Berger, F.G. (2004). Structural determinants
for the intracellular degradation of human thymidylate synthase. Biochemistry 43, 1972-1979.
Ghoda, L., van Daalen Wetters, T., Macrae, M., Ascherman, D., and Coffino, P. (1989). Prevention of
rapid intracellular degradation of ODC by a carboxyl-terminal truncation. Science 243, 1493-1495.
Glickman, M.H., and Ciechanover, A. (2002). The ubiquitin-proteasome proteolytic pathway: destruction
for the sake of construction. Physiol Rev 82, 373-428.
Glickman, M.H., Rubin, D.M., Fried, V.A., and Finley, D. (1998). The regulatory particle of the
Saccharomyces cerevisiae proteasome. Mol Cell Biol 18, 3149-3162.
Glotzer, M., Murray, A.W., and Kirschner, M.W. (1991). Cyclin is degraded by the ubiquitin pathway.
Nature 349, 132-138.
Goldberg, A.L. (2003). Protein degradation and protection against misfolded or damaged proteins. Nature
426, 895-899.
Gomez, T.A., Kolawa, N., Gee, M., Sweredoski, M.J., and Deshaies, R.J. (2011). Identification of a
functional docking site in the Rpn1 LRR domain for the UBA-UBL domain protein Ddi1. BMC Biol 9,
33.
Griko, Y.V., Privalov, P.L., Venyaminov, S.Y., and Kutyshenko, V.P. (1988). Thermodynamic study of
the apomyoglobin structure. J Mol Biol 202, 127-138.
Groll, M., Ditzel, L., Lowe, J., Stock, D., Bochtler, M., Bartunik, H.D., and Huber, R. (1997). Structure
of 20S proteasome from yeast at 2.4 A resolution. Nature 386, 463-471.
Halimi, H., Dumortier, H., Briand, J.P., and Muller, S. (1996). Comparison of two different methods
using overlapping synthetic peptides for localizing linear B cell epitopes in the U1 snRNP-C autoantigen.
J Immunol Methods 199, 77-85.
Henderson, A., Erales, J., Hoyt, M.A., and Coffino, P. (2011). Dependence of proteasome processing rate
on substrate unfolding. J Biol Chem 286, 17495-17502.

Bibliography Page 161
Hershko, A., Ciechanover, A., and Rose, I.A. (1979). Resolution of the ATP-dependent proteolytic
system from reticulocytes: a component that interacts with ATP. Proc Natl Acad Sci U S A 76, 3107-
3110.
Hicke, L. (2001). Protein regulation by monoubiquitin. Nat Rev Mol Cell Biol 2, 195-201.
Hoppe, T. (2005). Multiubiquitylation by E4 enzymes: 'one size' doesn't fit all. Trends Biochem Sci 30,
183-187.
Hough, R., Pratt, G., and Rechsteiner, M. (1987). Purification of two high molecular weight proteases
from rabbit reticulocyte lysate. J Biol Chem 262, 8303-8313.
Hoyt, M.A., Zich, J., Takeuchi, J., Zhang, M., Govaerts, C., and Coffino, P. (2006). Glycine-alanine
repeats impair proper substrate unfolding by the proteasome. EMBO J 25, 1720-1729.
Hutschenreiter, S., Tinazli, A., Model, K., and Tampe, R. (2004). Two-substrate association with the 20S
proteasome at single-molecule level. EMBO J 23, 2488-2497.
Inobe, T., Fishbain, S., Prakash, S., and Matouschek, A. (2011). Defining the geometry of the two-
component proteasome degron. Nat Chem Biol 7, 161-167.
Janse, D.M., Crosas, B., Finley, D., and Church, G.M. (2004). Localization to the proteasome is sufficient
for degradation. J Biol Chem 279, 21415-21420.
Kajava, A.V. (2002). What curves alpha-solenoids? Evidence for an alpha-helical toroid structure of
Rpn1 and Rpn2 proteins of the 26 S proteasome. J Biol Chem 277, 49791-49798.
Kalejta, R.F., and Shenk, T. (2003). Proteasome-dependent, ubiquitin-independent degradation of the Rb
family of tumor suppressors by the human cytomegalovirus pp71 protein. Proc Natl Acad Sci U S A 100,
3263-3268.
Keiler, K.C., Waller, P.R., and Sauer, R.T. (1996). Role of a peptide tagging system in degradation of
proteins synthesized from damaged messenger RNA. Science 271, 990-993.
Kendrew, J.C., Bodo, G., Dintzis, H.M., Parrish, R.G., Wyckoff, H., and Phillips, D.C. (1958). A three-
dimensional model of the myoglobin molecule obtained by x-ray analysis. Nature 181, 662-666.
Kishino, T., Lalande, M., and Wagstaff, J. (1997). UBE3A/E6-AP mutations cause Angelman syndrome.
Nat Genet 15, 70-73.
Kitchens, M.E., Forsthoefel, A.M., Rafique, Z., Spencer, H.T., and Berger, F.G. (1999). Ligand-mediated
induction of thymidylate synthase occurs by enzyme stabilization. Implications for autoregulation of
translation. J Biol Chem 274, 12544-12547.
Kohlmann, S., Schafer, A., and Wolf, D.H. (2008). Ubiquitin ligase Hul5 is required for fragment-
specific substrate degradation in endoplasmic reticulum-associated degradation. J Biol Chem 283, 16374-
16383.
Kornitzer, D., Raboy, B., Kulka, R.G., and Fink, G.R. (1994). Regulated degradation of the transcription
factor Gcn4. EMBO J 13, 6021-6030.
Lander, G.C., Estrin, E., Matyskiela, M.E., Bashore, C., Nogales, E., and Martin, A. (2012). Complete
subunit architecture of the proteasome regulatory particle. Nature 482, 186-191.
Lasker, K., Forster, F., Bohn, S., Walzthoeni, T., Villa, E., Unverdorben, P., Beck, F., Aebersold, R., Sali,
A., and Baumeister, W. (2012). Molecular architecture of the 26S proteasome holocomplex determined
by an integrative approach. Proc Natl Acad Sci U S A 109, 1380-1387.
Lee, C., Schwartz, M.P., Prakash, S., Iwakura, M., and Matouschek, A. (2001). ATP-dependent proteases
degrade their substrates by processively unraveling them from the degradation signal. Mol Cell 7, 627-
637.
Leggett, D.S., Hanna, J., Borodovsky, A., Crosas, B., Schmidt, M., Baker, R.T., Walz, T., Ploegh, H., and
Finley, D. (2002). Multiple associated proteins regulate proteasome structure and function. Mol Cell 10,
495-507.
Li, X., and Coffino, P. (1993). Degradation of ornithine decarboxylase: exposure of the C-terminal target
by a polyamine-inducible inhibitory protein. Mol Cell Biol 13, 2377-2383.
Liu, C.W., Corboy, M.J., DeMartino, G.N., and Thomas, P.J. (2003). Endoproteolytic activity of the
proteasome. Science 299, 408-411.
Liu, C.W., Li, X., Thompson, D., Wooding, K., Chang, T.L., Tang, Z., Yu, H., Thomas, P.J., and
DeMartino, G.N. (2006). ATP binding and ATP hydrolysis play distinct roles in the function of 26S
proteasome. Mol Cell 24, 39-50.
Lobley, A., Whitmore, L., and Wallace, B.A. (2002). DICHROWEB: an interactive website for the
analysis of protein secondary structure from circular dichroism spectra. Bioinformatics 18, 211-212.
Marine, J.C., and Lozano, G. (2010). Mdm2-mediated ubiquitylation: p53 and beyond. Cell Death Differ
17, 93-102.
Moorthy, A.K., Savinova, O.V., Ho, J.Q., Wang, V.Y., Vu, D., and Ghosh, G. (2006). The 20S
proteasome processes NF-kappaB1 p105 into p50 in a translation-independent manner. EMBO J 25,
1945-1956.

Bibliography Page 162
Morrisett, J.D., David, J.S., Pownall, H.J., and Gotto, A.M., Jr. (1973). Interaction of an apolipoprotein
(apoLP-alanine) with phosphatidylcholine. Biochemistry 12, 1290-1299.
Navon, A., and Goldberg, A.L. (2001). Proteins are unfolded on the surface of the ATPase ring before
transport into the proteasome. Mol Cell 8, 1339-1349.
Nishiyama, A., Tachibana, K., Igarashi, Y., Yasuda, H., Tanahashi, N., Tanaka, K., Ohsumi, K., and
Kishimoto, T. (2000). A nonproteolytic function of the proteasome is required for the dissociation of
Cdc2 and cyclin B at the end of M phase. Genes Dev 14, 2344-2357.
Orian, A., Schwartz, A.L., Israel, A., Whiteside, S., Kahana, C., and Ciechanover, A. (1999). Structural
motifs involved in ubiquitin-mediated processing of the NF-kappaB precursor p105: roles of the glycine-
rich region and a downstream ubiquitination domain. Mol Cell Biol 19, 3664-3673.
Otsuka, Y., Homma, N., Shiga, K., Ushiki, J., Ikeuchi, Y., and Suzuki, A. (1998). Purification and
properties of rabbit muscle proteasome, and its effect on myofibrillar structure. Meat Sci 49, 365-378.
Pal, B., Chan, N.C., Helfenbaum, L., Tan, K., Tansey, W.P., and Gething, M.J. (2007). SCFCdc4-
mediated degradation of the Hac1p transcription factor regulates the unfolded protein response in
Saccharomyces cerevisiae. Mol Biol Cell 18, 426-440.
Park, S., Tian, G., Roelofs, J., and Finley, D. (2010). Assembly manual for the proteasome regulatory
particle: the first draft. Biochem Soc Trans 38, 6-13.
Pegg, A.E. (2006). Regulation of ornithine decarboxylase. J Biol Chem 281, 14529-14532.
Pena, M.M., Xing, Y.Y., Koli, S., and Berger, F.G. (2006). Role of N-terminal residues in the ubiquitin-
independent degradation of human thymidylate synthase. Biochem J 394, 355-363.
Pickart, C.M. (2001). Mechanisms underlying ubiquitination. Annu Rev Biochem 70, 503-533.
Pickart, C.M., and Cohen, R.E. (2004). Proteasomes and their kin: proteases in the machine age. Nat Rev
Mol Cell Biol 5, 177-187.
Picotti, P., Marabotti, A., Negro, A., Musi, V., Spolaore, B., Zambonin, M., and Fontana, A. (2004).
Modulation of the structural integrity of helix F in apomyoglobin by single amino acid replacements.
Protein Sci 13, 1572-1585.
Prakash, S., Inobe, T., Hatch, A.J., and Matouschek, A. (2009). Substrate selection by the proteasome
during degradation of protein complexes. Nat Chem Biol 5, 29-36.
Prakash, S., Tian, L., Ratliff, K.S., Lehotzky, R.E., and Matouschek, A. (2004). An unstructured initiation
site is required for efficient proteasome-mediated degradation. Nat Struct Mol Biol 11, 830-837.
Provencher, S.W., and Glockner, J. (1981). Estimation of globular protein secondary structure from
circular dichroism. Biochemistry 20, 33-37.
Rabl, J., Smith, D.M., Yu, Y., Chang, S.C., Goldberg, A.L., and Cheng, Y. (2008). Mechanism of gate
opening in the 20S proteasome by the proteasomal ATPases. Mol Cell 30, 360-368.
Rechsteiner, M., and Rogers, S.W. (1996). PEST sequences and regulation by proteolysis. Trends
Biochem Sci 21, 267-271.
Rock, K.L., Gramm, C., Rothstein, L., Clark, K., Stein, R., Dick, L., Hwang, D., and Goldberg, A.L.
(1994). Inhibitors of the proteasome block the degradation of most cell proteins and the generation of
peptides presented on MHC class I molecules. Cell 78, 761-771.
Rogers, S., Wells, R., and Rechsteiner, M. (1986). Amino acid sequences common to rapidly degraded
proteins: the PEST hypothesis. Science 234, 364-368.
Rosenberg-Hasson, Y., Bercovich, Z., Ciechanover, A., and Kahana, C. (1989). Degradation of ornithine
decarboxylase in mammalian cells is ATP dependent but ubiquitin independent. Eur J Biochem 185, 469-
474.
Rubin, D.M., Glickman, M.H., Larsen, C.N., Dhruvakumar, S., and Finley, D. (1998). Active site mutants
in the six regulatory particle ATPases reveal multiple roles for ATP in the proteasome. EMBO J 17,
4909-4919.
Ruschak, A.M., Religa, T.L., Breuer, S., Witt, S., and Kay, L.E. (2010). The proteasome antechamber
maintains substrates in an unfolded state. Nature 467, 868-871.
Sdek, P., Ying, H., Chang, D.L., Qiu, W., Zheng, H., Touitou, R., Allday, M.J., and Xiao, Z.X. (2005).
MDM2 promotes proteasome-dependent ubiquitin-independent degradation of retinoblastoma protein.
Mol Cell 20, 699-708.
Sdek, P., Ying, H., Zheng, H., Margulis, A., Tang, X., Tian, K., and Xiao, Z.X. (2004). The central acidic
domain of MDM2 is critical in inhibition of retinoblastoma-mediated suppression of E2F and cell growth.
J Biol Chem 279, 53317-53322.
Seemuller, E., Lupas, A., Stock, D., Lowe, J., Huber, R., and Baumeister, W. (1995). Proteasome from
Thermoplasma acidophilum: a threonine protease. Science 268, 579-582.
Shabek, N., Herman-Bachinsky, Y., Buchsbaum, S., Lewinson, O., Haj-Yahya, M., Hejjaoui, M.,
Lashuel, H.A., Sommer, T., Brik, A., and Ciechanover, A. (2012). The size of the proteasomal substrate
determines whether its degradation will be mediated by mono- or polyubiquitylation. Mol Cell 48, 87-97.

Bibliography Page 163
Sharon, M., Witt, S., Felderer, K., Rockel, B., Baumeister, W., and Robinson, C.V. (2006). 20S
proteasomes have the potential to keep substrates in store for continual degradation. J Biol Chem 281,
9569-9575.
Sheaff, R.J., Singer, J.D., Swanger, J., Smitherman, M., Roberts, J.M., and Clurman, B.E. (2000).
Proteasomal turnover of p21Cip1 does not require p21Cip1 ubiquitination. Mol Cell 5, 403-410.
Shirley, B.A. (1995). Urea and guanidine hydrochloride denaturation curves. Methods Mol Biol 40, 177-
190.
Smith, D.M., Chang, S.C., Park, S., Finley, D., Cheng, Y., and Goldberg, A.L. (2007). Docking of the
proteasomal ATPases' carboxyl termini in the 20S proteasome's alpha ring opens the gate for substrate
entry. Mol Cell 27, 731-744.
Smith, D.M., Kafri, G., Cheng, Y., Ng, D., Walz, T., and Goldberg, A.L. (2005). ATP binding to PAN or
the 26S ATPases causes association with the 20S proteasome, gate opening, and translocation of unfolded
proteins. Mol Cell 20, 687-698.
Sone, T., Saeki, Y., Toh-e, A., and Yokosawa, H. (2004). Sem1p is a novel subunit of the 26 S
proteasome from Saccharomyces cerevisiae. J Biol Chem 279, 28807-28816.
Sorokin, A.V., Kim, E.R., and Ovchinnikov, L.P. (2009). Proteasome system of protein degradation and
processing. Biochemistry (Mosc) 74, 1411-1442.
Sorokin, A.V., Selyutina, A.A., Skabkin, M.A., Guryanov, S.G., Nazimov, I.V., Richard, C., Th'ng, J.,
Yau, J., Sorensen, P.H., Ovchinnikov, L.P., et al. (2005). Proteasome-mediated cleavage of the Y-box-
binding protein 1 is linked to DNA-damage stress response. EMBO J 24, 3602-3612.
Springer, B.A., and Sligar, S.G. (1987). High-level expression of sperm whale myoglobin in Escherichia
coli. Proc Natl Acad Sci U S A 84, 8961-8965.
Sreerama, N., and Woody, R.W. (1993). A self-consistent method for the analysis of protein secondary
structure from circular dichroism. Anal Biochem 209, 32-44.
Takeuchi, J., Chen, H., and Coffino, P. (2007). Proteasome substrate degradation requires association plus
extended peptide. EMBO J 26, 123-131.
Takeuchi, J., Chen, H., Hoyt, M.A., and Coffino, P. (2008). Structural elements of the ubiquitin-
independent proteasome degron of ornithine decarboxylase. Biochem J 410, 401-407.
Tgavalekos, N.T., Venegas, J.G., Suki, B., and Lutchen, K.R. (2003). Relation between structure,
function, and imaging in a three-dimensional model of the lung. Ann Biomed Eng 31, 363-373.
Thrower, J.S., Hoffman, L., Rechsteiner, M., and Pickart, C.M. (2000). Recognition of the polyubiquitin
proteolytic signal. EMBO J 19, 94-102.
Tomko, R.J., Jr., Funakoshi, M., Schneider, K., Wang, J., and Hochstrasser, M. (2010). Heterohexameric
ring arrangement of the eukaryotic proteasomal ATPases: implications for proteasome structure and
assembly. Mol Cell 38, 393-403.
Touitou, R., Richardson, J., Bose, S., Nakanishi, M., Rivett, J., and Allday, M.J. (2001). A degradation
signal located in the C-terminus of p21WAF1/CIP1 is a binding site for the C8 alpha-subunit of the 20S
proteasome. EMBO J 20, 2367-2375.
Tu, G.F., Reid, G.E., Zhang, J.G., Moritz, R.L., and Simpson, R.J. (1995). C-terminal extension of
truncated recombinant proteins in Escherichia coli with a 10Sa RNA decapeptide. J Biol Chem 270,
9322-9326.
Uchida, C., Miwa, S., Kitagawa, K., Hattori, T., Isobe, T., Otani, S., Oda, T., Sugimura, H., Kamijo, T.,
Ookawa, K., et al. (2005). Enhanced Mdm2 activity inhibits pRB function via ubiquitin-dependent
degradation. EMBO J 24, 160-169.
Unno, M., Mizushima, T., Morimoto, Y., Tomisugi, Y., Tanaka, K., Yasuoka, N., and Tsukihara, T.
(2002). The structure of the mammalian 20S proteasome at 2.75 A resolution. Structure 10, 609-618.
Varshavsky, A. (1996). The N-end rule: functions, mysteries, uses. Proc Natl Acad Sci U S A 93, 12142-
12149.
Venkatraman, P., Wetzel, R., Tanaka, M., Nukina, N., and Goldberg, A.L. (2004). Eukaryotic
proteasomes cannot digest polyglutamine sequences and release them during degradation of
polyglutamine-containing proteins. Mol Cell 14, 95-104.
Verma, R., Aravind, L., Oania, R., McDonald, W.H., Yates, J.R., 3rd, Koonin, E.V., and Deshaies, R.J.
(2002). Role of Rpn11 metalloprotease in deubiquitination and degradation by the 26S proteasome.
Science 298, 611-615.
Verma, R., Chen, S., Feldman, R., Schieltz, D., Yates, J., Dohmen, J., and Deshaies, R.J. (2000).
Proteasomal proteomics: identification of nucleotide-sensitive proteasome-interacting proteins by mass
spectrometric analysis of affinity-purified proteasomes. Mol Biol Cell 11, 3425-3439.
Wang, N., Chen, W., Linsel-Nitschke, P., Martinez, L.O., Agerholm-Larsen, B., Silver, D.L., and Tall,
A.R. (2003). A PEST sequence in ABCA1 regulates degradation by calpain protease and stabilization of
ABCA1 by apoA-I. J Clin Invest 111, 99-107.

Bibliography Page 164
Wang, X., Chen, C.F., Baker, P.R., Chen, P.L., Kaiser, P., and Huang, L. (2007). Mass spectrometric
characterization of the affinity-purified human 26S proteasome complex. Biochemistry 46, 3553-3565.
Weissman, A.M. (2001). Themes and variations on ubiquitylation. Nat Rev Mol Cell Biol 2, 169-178.
Whitmore, L., and Wallace, B.A. (2004). DICHROWEB, an online server for protein secondary structure
analyses from circular dichroism spectroscopic data. Nucleic Acids Res 32, W668-673.
Wilkinson, K.D., Urban, M.K., and Haas, A.L. (1980). Ubiquitin is the ATP-dependent proteolysis factor
I of rabbit reticulocytes. J Biol Chem 255, 7529-7532.
Wilson, H.L., Ou, M.S., Aldrich, H.C., and Maupin-Furlow, J. (2000). Biochemical and physical
properties of the Methanococcus jannaschii 20S proteasome and PAN, a homolog of the ATPase (Rpt)
subunits of the eucaryal 26S proteasome. J Bacteriol 182, 1680-1692.
Yamano, H., Tsurumi, C., Gannon, J., and Hunt, T. (1998). The role of the destruction box and its
neighbouring lysine residues in cyclin B for anaphase ubiquitin-dependent proteolysis in fission yeast:
defining the D-box receptor. EMBO J 17, 5670-5678.
Yang, P., Fu, H., Walker, J., Papa, C.M., Smalle, J., Ju, Y.M., and Vierstra, R.D. (2004). Purification of
the Arabidopsis 26 S proteasome: biochemical and molecular analyses revealed the presence of multiple
isoforms. J Biol Chem 279, 6401-6413.
Yewdell, J.W. (2005). Immunoproteasomes: regulating the regulator. Proc Natl Acad Sci U S A 102,
9089-9090.
Zhang, F., Hu, M., Tian, G., Zhang, P., Finley, D., Jeffrey, P.D., and Shi, Y. (2009a). Structural insights
into the regulatory particle of the proteasome from Methanocaldococcus jannaschii. Mol Cell 34, 473-
484.
Zhang, F., Wu, Z., Zhang, P., Tian, G., Finley, D., and Shi, Y. (2009b). Mechanism of substrate unfolding
and translocation by the regulatory particle of the proteasome from Methanocaldococcus jannaschii. Mol
Cell 34, 485-496.
Zhang, M., Pickart, C.M., and Coffino, P. (2003). Determinants of proteasome recognition of ornithine
decarboxylase, a ubiquitin-independent substrate. EMBO J 22, 1488-1496.
Zhao, M., Zhang, N.Y., Zurawel, A., Hansen, K.C., and Liu, C.W. (2010). Degradation of some
polyubiquitinated proteins requires an intrinsic proteasomal binding element in the substrates. J Biol
Chem 285, 4771-4780.

Direct Ubiquitin Independent Recognition andDegradation of a Folded Protein by the EukaryoticProteasomes-Origin of Intrinsic Degradation SignalsAmit Kumar Singh Gautam, Satish Balakrishnan, Prasanna Venkatraman*
Advanced Centre for Treatment, Research and Education in Cancer, Kharghar, Navi Mumbai, India
Abstract
Eukaryotic 26S proteasomes are structurally organized to recognize, unfold and degrade globular proteins. However, allexisting model substrates of the 26S proteasome in addition to ubiquitin or adaptor proteins require unstructured regionsin the form of fusion tags for efficient degradation. We report for the first time that purified 26S proteasome can directlyrecognize and degrade apomyoglobin, a globular protein, in the absence of ubiquitin, extrinsic degradation tags or adaptorproteins. Despite a high affinity interaction, absence of a ligand and presence of only helices/loops that follow thedegradation signal, apomyoglobin is degraded slowly by the proteasome. A short floppy F-helix exposed upon ligandremoval and in conformational equilibrium with a disordered structure is mandatory for recognition and initiation ofdegradation. Holomyoglobin, in which the helix is buried, is neither recognized nor degraded. Exposure of the floppy F-helixseems to sensitize the proteasome and primes the substrate for degradation. Using peptide panning and competitionexperiments we speculate that initial encounters through the floppy helix and additional strong interactions with N-terminal helices anchors apomyoglobin to the proteasome. Stabilizing helical structure in the floppy F-helix slows downdegradation. Destabilization of adjacent helices accelerates degradation. Unfolding seems to follow the mechanism of helixunraveling rather than global unfolding. Our findings while confirming the requirement for unstructured regions indegradation offers the following new insights: a) origin and identification of an intrinsic degradation signal in the substrate,b) identification of sequences in the native substrate that are likely to be responsible for direct interactions with theproteasome, and c) identification of critical rate limiting steps like exposure of the intrinsic degron and destabilization of anunfolding intermediate that are presumably catalyzed by the ATPases. Apomyoglobin emerges as a new model substrate tofurther explore the role of ATPases and protein structure in proteasomal degradation
Citation: Singh Gautam AK, Balakrishnan S, Venkatraman P (2012) Direct Ubiquitin Independent Recognition and Degradation of a Folded Protein by theEukaryotic Proteasomes-Origin of Intrinsic Degradation Signals. PLoS ONE 7(4): e34864. doi:10.1371/journal.pone.0034864
Editor: Sue Cotterill, St. Georges University of London, United Kingdom
Received August 25, 2011; Accepted March 8, 2012; Published April 10, 2012
Copyright: � 2012 Singh Gautam et al. This is an open-access article distributed under the terms of the Creative Commons Attribution License, which permitsunrestricted use, distribution, and reproduction in any medium, provided the original author and source are credited.
Funding: The work was supported by BT/PR7977/BRB/10/509/2006 Department of Biotechnology, India and ACTREC. A.K.S.G. is funded by a fellowship from theDepartment of Biotechnology, India. The funders had no role in study design, data collection and analysis, decision to publish, or preparation of the manuscript.
Competing Interests: The authors have declared that no competing interests exist.
* E-mail: [email protected]
Introduction
Almost every cellular pathway involved in the biology of an
eukaryotic organism is homeostatically regulated by the Ubiquitin
Proteasome System (UPS) [1,2,3]. Impairment in the function of
UPS components results in the accumulation of proteins leading to
cellular stress and apoptosis [2]. Unlike other proteases, the
proteasomes (26S) degrade fully folded proteins and generate short
peptides and amino acids [4]. Under specific circumstances
degradation is restricted to a single endoproteolytic cleavage to
release intact functional domains [5,6,7]. Most proteins are
normally tagged for degradation by a post-translational modifica-
tion called ubiquitination while others do not require this
modification [1]. Substrate recognition, binding/release, chain
unfolding, translocation and degradation are common to both
ubiquitin dependent, independent processes and to other ATP
dependent compartmentalized proteases. Any of these steps can be
rate limiting [8,9,10,11].
Despite its long and well established role in cellular homoeo-
stasis and recent clinical utility, many basic aspects of proteasomal
degradation are largely unknown. Role of protein sequence,
structure, thermodynamic and kinetic aspects of degradation is
only beginning to be addressed. The complex architecture of the
enzyme (26S proteasome) and the fact that not all proteins are
amenable for degradation in vitro are major deterrents to such
studies.
The major functional unit of the proteasome is the 26S holo
complex made up of two modules- the 19S regulatory particles
and the 20S proteolytic core [12]. The 20S proteolytic core is a
central four ringed cylindrical barrel made up of seven membered
a-b-a-b ring structure. Three types of catalytic sites, the trypsin-
like (b2), caspase-like (b1) and the chymotrypsin-like (b5) are
located within each b-ring. The outer a-rings are sandwiched by
the 19S regulatory particles [1,13]. The 19S regulatory particles
are made up of at least 13 non-identical subunits, 6 of which are
ATPases. Some of these subunits are responsible for substrate
recognition via ubiquitin [14,15]. At least one of the subunit is a
deubiquitinating enzyme which releases the polyubiquitin chain
before the substrate enters the proteolytic core. The ATPases are
presumed to unfold and translocate the polypeptide chain into the
20S particles where proteolysis takes place. Access to 20S is
restricted by a closed gate guarded by loops in the a-ring which
PLoS ONE | www.plosone.org 1 April 2012 | Volume 7 | Issue 4 | e34864
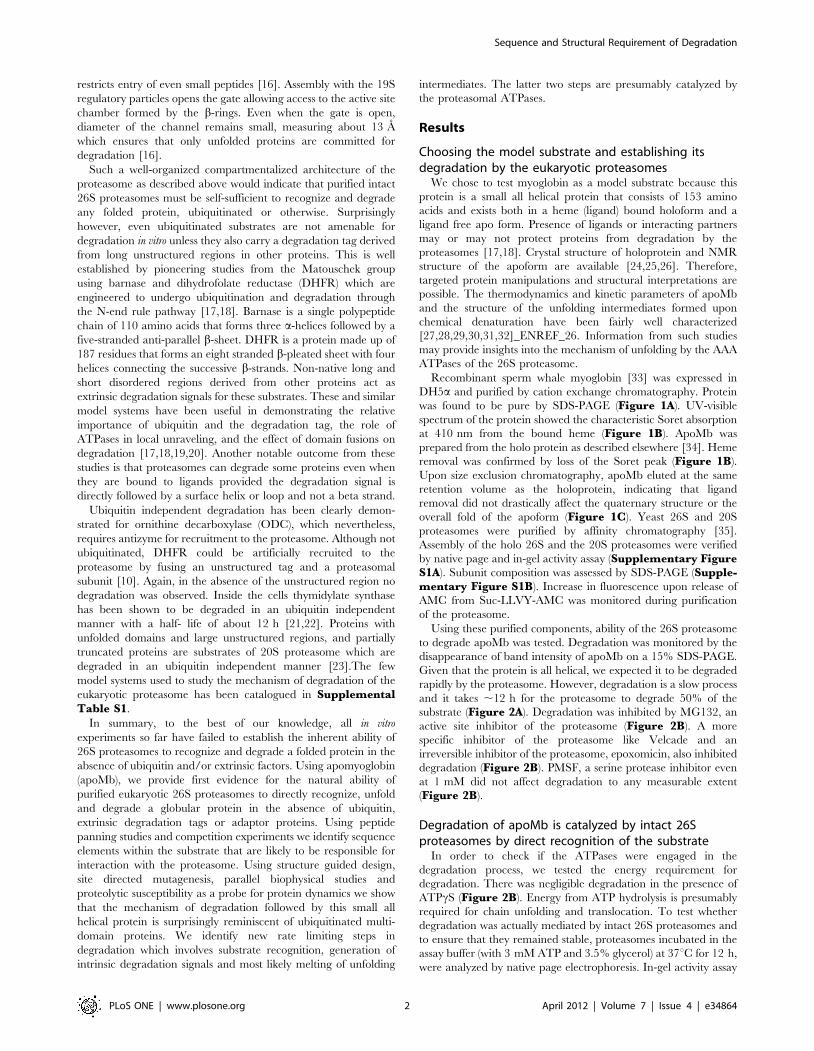
restricts entry of even small peptides [16]. Assembly with the 19S
regulatory particles opens the gate allowing access to the active site
chamber formed by the b-rings. Even when the gate is open,
diameter of the channel remains small, measuring about 13 A
which ensures that only unfolded proteins are committed for
degradation [16].
Such a well-organized compartmentalized architecture of the
proteasome as described above would indicate that purified intact
26S proteasomes must be self-sufficient to recognize and degrade
any folded protein, ubiquitinated or otherwise. Surprisingly
however, even ubiquitinated substrates are not amenable for
degradation in vitro unless they also carry a degradation tag derived
from long unstructured regions in other proteins. This is well
established by pioneering studies from the Matouschek group
using barnase and dihydrofolate reductase (DHFR) which are
engineered to undergo ubiquitination and degradation through
the N-end rule pathway [17,18]. Barnase is a single polypeptide
chain of 110 amino acids that forms three a-helices followed by a
five-stranded anti-parallel b-sheet. DHFR is a protein made up of
187 residues that forms an eight stranded b-pleated sheet with four
helices connecting the successive b-strands. Non-native long and
short disordered regions derived from other proteins act as
extrinsic degradation signals for these substrates. These and similar
model systems have been useful in demonstrating the relative
importance of ubiquitin and the degradation tag, the role of
ATPases in local unraveling, and the effect of domain fusions on
degradation [17,18,19,20]. Another notable outcome from these
studies is that proteasomes can degrade some proteins even when
they are bound to ligands provided the degradation signal is
directly followed by a surface helix or loop and not a beta strand.
Ubiquitin independent degradation has been clearly demon-
strated for ornithine decarboxylase (ODC), which nevertheless,
requires antizyme for recruitment to the proteasome. Although not
ubiquitinated, DHFR could be artificially recruited to the
proteasome by fusing an unstructured tag and a proteasomal
subunit [10]. Again, in the absence of the unstructured region no
degradation was observed. Inside the cells thymidylate synthase
has been shown to be degraded in an ubiquitin independent
manner with a half- life of about 12 h [21,22]. Proteins with
unfolded domains and large unstructured regions, and partially
truncated proteins are substrates of 20S proteasome which are
degraded in an ubiquitin independent manner [23].The few
model systems used to study the mechanism of degradation of the
eukaryotic proteasome has been catalogued in SupplementalTable S1.
In summary, to the best of our knowledge, all in vitro
experiments so far have failed to establish the inherent ability of
26S proteasomes to recognize and degrade a folded protein in the
absence of ubiquitin and/or extrinsic factors. Using apomyoglobin
(apoMb), we provide first evidence for the natural ability of
purified eukaryotic 26S proteasomes to directly recognize, unfold
and degrade a globular protein in the absence of ubiquitin,
extrinsic degradation tags or adaptor proteins. Using peptide
panning studies and competition experiments we identify sequence
elements within the substrate that are likely to be responsible for
interaction with the proteasome. Using structure guided design,
site directed mutagenesis, parallel biophysical studies and
proteolytic susceptibility as a probe for protein dynamics we show
that the mechanism of degradation followed by this small all
helical protein is surprisingly reminiscent of ubiquitinated multi-
domain proteins. We identify new rate limiting steps in
degradation which involves substrate recognition, generation of
intrinsic degradation signals and most likely melting of unfolding
intermediates. The latter two steps are presumably catalyzed by
the proteasomal ATPases.
Results
Choosing the model substrate and establishing itsdegradation by the eukaryotic proteasomes
We chose to test myoglobin as a model substrate because this
protein is a small all helical protein that consists of 153 amino
acids and exists both in a heme (ligand) bound holoform and a
ligand free apo form. Presence of ligands or interacting partners
may or may not protect proteins from degradation by the
proteasomes [17,18]. Crystal structure of holoprotein and NMR
structure of the apoform are available [24,25,26]. Therefore,
targeted protein manipulations and structural interpretations are
possible. The thermodynamics and kinetic parameters of apoMb
and the structure of the unfolding intermediates formed upon
chemical denaturation have been fairly well characterized
[27,28,29,30,31,32]_ENREF_26. Information from such studies
may provide insights into the mechanism of unfolding by the AAA
ATPases of the 26S proteasome.
Recombinant sperm whale myoglobin [33] was expressed in
DH5a and purified by cation exchange chromatography. Protein
was found to be pure by SDS-PAGE (Figure 1A). UV-visible
spectrum of the protein showed the characteristic Soret absorption
at 410 nm from the bound heme (Figure 1B). ApoMb was
prepared from the holo protein as described elsewhere [34]. Heme
removal was confirmed by loss of the Soret peak (Figure 1B).
Upon size exclusion chromatography, apoMb eluted at the same
retention volume as the holoprotein, indicating that ligand
removal did not drastically affect the quaternary structure or the
overall fold of the apoform (Figure 1C). Yeast 26S and 20S
proteasomes were purified by affinity chromatography [35].
Assembly of the holo 26S and the 20S proteasomes were verified
by native page and in-gel activity assay (Supplementary FigureS1A). Subunit composition was assessed by SDS-PAGE (Supple-mentary Figure S1B). Increase in fluorescence upon release of
AMC from Suc-LLVY-AMC was monitored during purification
of the proteasome.
Using these purified components, ability of the 26S proteasome
to degrade apoMb was tested. Degradation was monitored by the
disappearance of band intensity of apoMb on a 15% SDS-PAGE.
Given that the protein is all helical, we expected it to be degraded
rapidly by the proteasome. However, degradation is a slow process
and it takes ,12 h for the proteasome to degrade 50% of the
substrate (Figure 2A). Degradation was inhibited by MG132, an
active site inhibitor of the proteasome (Figure 2B). A more
specific inhibitor of the proteasome like Velcade and an
irreversible inhibitor of the proteasome, epoxomicin, also inhibited
degradation (Figure 2B). PMSF, a serine protease inhibitor even
at 1 mM did not affect degradation to any measurable extent
(Figure 2B).
Degradation of apoMb is catalyzed by intact 26Sproteasomes by direct recognition of the substrate
In order to check if the ATPases were engaged in the
degradation process, we tested the energy requirement for
degradation. There was negligible degradation in the presence of
ATPcS (Figure 2B). Energy from ATP hydrolysis is presumably
required for chain unfolding and translocation. To test whether
degradation was actually mediated by intact 26S proteasomes and
to ensure that they remained stable, proteasomes incubated in the
assay buffer (with 3 mM ATP and 3.5% glycerol) at 37uC for 12 h,
were analyzed by native page electrophoresis. In-gel activity assay
Sequence and Structural Requirement of Degradation
PLoS ONE | www.plosone.org 2 April 2012 | Volume 7 | Issue 4 | e34864

as well as coommassie staining was performed. The holo complex
was essentially intact and 20S proteasomes were undetectable. A
very small signal corresponding to singly capped 26S proteasomes
was detectable in the in-gel activity assay (Supplemental FigureS2A). Moreover, proteasomes thus incubated retained ,88%
activity as measured by the release of Amc from Suc-LLVY-AMC
(Supplemental Table S2). Isolated 20S proteasome was unable
to degrade apoMb emphasizing the importance of 19S regulatory
particles in the pre degradation processes (Figure 2B).
While our assumption that the ligand bound holoprotein would
be more resistant to degradation proved correct, the reason for its
stability was not quite obvious. A pertinent question to ask is
whether the proteasome recognizes the holoprotein at all. We
standardized an Enzyme-linked immunosorbent assay (ELISA) to
probe the interaction between substrate and the proteasome.
ApoMb was found to bind with high affinity to the immobilized
proteasome (Kd = 3.561 nM), while the holoprotein did not bind
to any appreciable extent (Figure 2C). In contrast to the 26S
proteasomes, the 20S proteasomes seemed to bind to both holo
and apoMb, but binding was not saturated (highest concentration
tested was 580 nM) (Supplemental Figure S3). As mentioned
above, 26S proteasomes remain intact over prolonged incubation
and dissociation into 20S if any is undetectable. Even if present
they are unlikely to compete for binding due to huge affinity
differences between the 20S and 26S proteasomes.
A well-known property of substrates recognized by chaperones
and AAA ATPases [36,37] of the proteasome, is their ability to
stimulate the ATPase activity. While apoMb was able to stimulate
the ATPase activity by two fold (Figure 2D), the holoprotein
commensurate with its failure to be recognized by the proteasome,
had no effect on the ATPase activity. Taken together these results
indicate that the degradation we observe is due to intact 26S
particles that directly recognize the apo form of Mb. The ATPases
must catalyze unfolding of the protein.
Stimulation of ATPase activity by apoMb was at a much faster
time scale (in the order of minutes) and during this time, the
protein was completely stable. These results indicate that despite
high affinity binding, and eliciting a response from the protea-
some, a substrate can be released prematurely. It seems that
binding and down-stream events like chain unfolding and
translocation must be coupled for the encounters to be productive.
Any of these steps could be rate limiting.
Structural elements involved in degradationTo determine the structural basis of degradation of apoMb, we
compared the available crystal structure of the holo protein (PDB
ID 2JHO) and the NMR structure of the apoform [25]. Removal
Figure 1. Purification and characterization of holo and apo myoglobin (Mb). (A) Mb was purified by cation exchange chromatography andwas adjudged to be pure by SDS-PAGE analysis. (B) UV-visible spectrum of the holo and apoMb were recorded from 500 nm to 240 nm. A distinctSoret peak (410 nm) was observed in the holo form the intensity of which was reduced to about 95% in the apoMb indicating successful removal ofheme. (C) Quaternary structure of apoMb was assessed by gel permeation chromatography. ApoMb (dash line) eluted at the same retention volumeas the holo protein (solid line) demonstrating similarity in the protein fold.doi:10.1371/journal.pone.0034864.g001
Sequence and Structural Requirement of Degradation
PLoS ONE | www.plosone.org 3 April 2012 | Volume 7 | Issue 4 | e34864
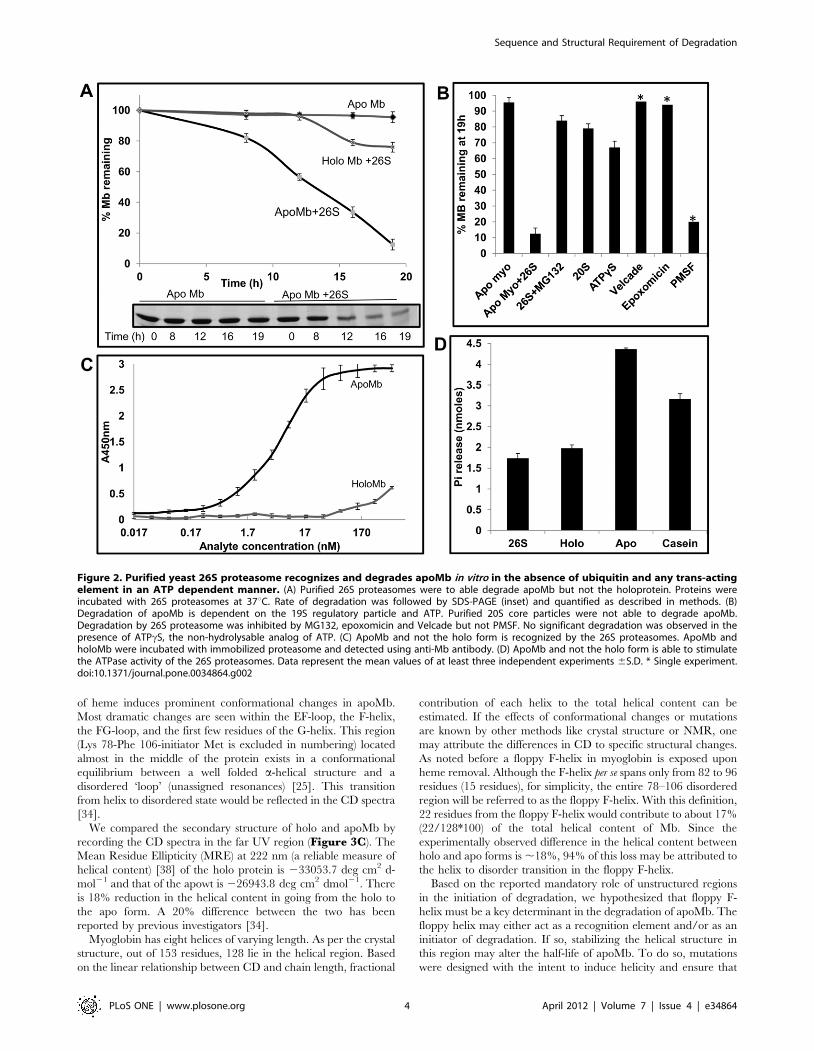
of heme induces prominent conformational changes in apoMb.
Most dramatic changes are seen within the EF-loop, the F-helix,
the FG-loop, and the first few residues of the G-helix. This region
(Lys 78-Phe 106-initiator Met is excluded in numbering) located
almost in the middle of the protein exists in a conformational
equilibrium between a well folded a-helical structure and a
disordered ‘loop’ (unassigned resonances) [25]. This transition
from helix to disordered state would be reflected in the CD spectra
[34].
We compared the secondary structure of holo and apoMb by
recording the CD spectra in the far UV region (Figure 3C). The
Mean Residue Ellipticity (MRE) at 222 nm (a reliable measure of
helical content) [38] of the holo protein is 233053.7 deg cm2 d-
mol21 and that of the apowt is 226943.8 deg cm2 dmol21. There
is 18% reduction in the helical content in going from the holo to
the apo form. A 20% difference between the two has been
reported by previous investigators [34].
Myoglobin has eight helices of varying length. As per the crystal
structure, out of 153 residues, 128 lie in the helical region. Based
on the linear relationship between CD and chain length, fractional
contribution of each helix to the total helical content can be
estimated. If the effects of conformational changes or mutations
are known by other methods like crystal structure or NMR, one
may attribute the differences in CD to specific structural changes.
As noted before a floppy F-helix in myoglobin is exposed upon
heme removal. Although the F-helix per se spans only from 82 to 96
residues (15 residues), for simplicity, the entire 78–106 disordered
region will be referred to as the floppy F-helix. With this definition,
22 residues from the floppy F-helix would contribute to about 17%
(22/128*100) of the total helical content of Mb. Since the
experimentally observed difference in the helical content between
holo and apo forms is ,18%, 94% of this loss may be attributed to
the helix to disorder transition in the floppy F-helix.
Based on the reported mandatory role of unstructured regions
in the initiation of degradation, we hypothesized that floppy F-
helix must be a key determinant in the degradation of apoMb. The
floppy helix may either act as a recognition element and/or as an
initiator of degradation. If so, stabilizing the helical structure in
this region may alter the half-life of apoMb. To do so, mutations
were designed with the intent to induce helicity and ensure that
Figure 2. Purified yeast 26S proteasome recognizes and degrades apoMb in vitro in the absence of ubiquitin and any trans-actingelement in an ATP dependent manner. (A) Purified 26S proteasomes were to able degrade apoMb but not the holoprotein. Proteins wereincubated with 26S proteasomes at 37uC. Rate of degradation was followed by SDS-PAGE (inset) and quantified as described in methods. (B)Degradation of apoMb is dependent on the 19S regulatory particle and ATP. Purified 20S core particles were not able to degrade apoMb.Degradation by 26S proteasome was inhibited by MG132, epoxomicin and Velcade but not PMSF. No significant degradation was observed in thepresence of ATPcS, the non-hydrolysable analog of ATP. (C) ApoMb and not the holo form is recognized by the 26S proteasomes. ApoMb andholoMb were incubated with immobilized proteasome and detected using anti-Mb antibody. (D) ApoMb and not the holo form is able to stimulatethe ATPase activity of the 26S proteasomes. Data represent the mean values of at least three independent experiments 6S.D. * Single experiment.doi:10.1371/journal.pone.0034864.g002
Sequence and Structural Requirement of Degradation
PLoS ONE | www.plosone.org 4 April 2012 | Volume 7 | Issue 4 | e34864
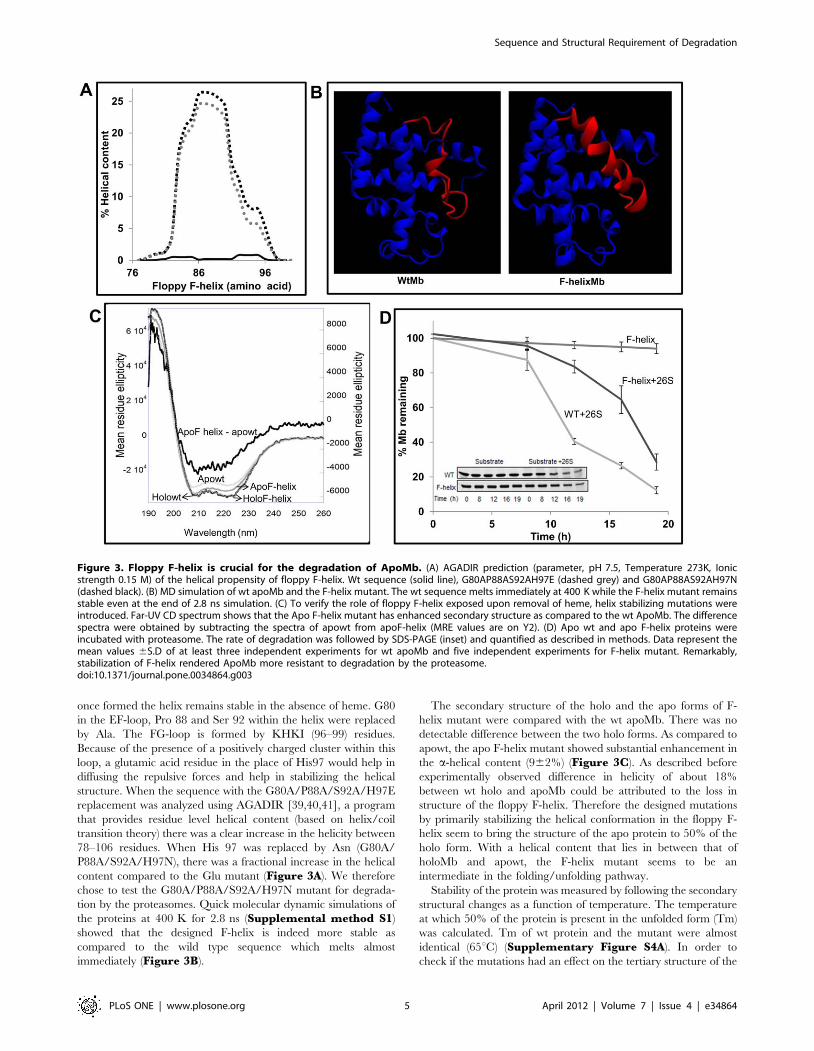
once formed the helix remains stable in the absence of heme. G80
in the EF-loop, Pro 88 and Ser 92 within the helix were replaced
by Ala. The FG-loop is formed by KHKI (96–99) residues.
Because of the presence of a positively charged cluster within this
loop, a glutamic acid residue in the place of His97 would help in
diffusing the repulsive forces and help in stabilizing the helical
structure. When the sequence with the G80A/P88A/S92A/H97E
replacement was analyzed using AGADIR [39,40,41], a program
that provides residue level helical content (based on helix/coil
transition theory) there was a clear increase in the helicity between
78–106 residues. When His 97 was replaced by Asn (G80A/
P88A/S92A/H97N), there was a fractional increase in the helical
content compared to the Glu mutant (Figure 3A). We therefore
chose to test the G80A/P88A/S92A/H97N mutant for degrada-
tion by the proteasomes. Quick molecular dynamic simulations of
the proteins at 400 K for 2.8 ns (Supplemental method S1)
showed that the designed F-helix is indeed more stable as
compared to the wild type sequence which melts almost
immediately (Figure 3B).
The secondary structure of the holo and the apo forms of F-
helix mutant were compared with the wt apoMb. There was no
detectable difference between the two holo forms. As compared to
apowt, the apo F-helix mutant showed substantial enhancement in
the a-helical content (962%) (Figure 3C). As described before
experimentally observed difference in helicity of about 18%
between wt holo and apoMb could be attributed to the loss in
structure of the floppy F-helix. Therefore the designed mutations
by primarily stabilizing the helical conformation in the floppy F-
helix seem to bring the structure of the apo protein to 50% of the
holo form. With a helical content that lies in between that of
holoMb and apowt, the F-helix mutant seems to be an
intermediate in the folding/unfolding pathway.
Stability of the protein was measured by following the secondary
structural changes as a function of temperature. The temperature
at which 50% of the protein is present in the unfolded form (Tm)
was calculated. Tm of wt protein and the mutant were almost
identical (65uC) (Supplementary Figure S4A). In order to
check if the mutations had an effect on the tertiary structure of the
Figure 3. Floppy F-helix is crucial for the degradation of ApoMb. (A) AGADIR prediction (parameter, pH 7.5, Temperature 273K, Ionicstrength 0.15 M) of the helical propensity of floppy F-helix. Wt sequence (solid line), G80AP88AS92AH97E (dashed grey) and G80AP88AS92AH97N(dashed black). (B) MD simulation of wt apoMb and the F-helix mutant. The wt sequence melts immediately at 400 K while the F-helix mutant remainsstable even at the end of 2.8 ns simulation. (C) To verify the role of floppy F-helix exposed upon removal of heme, helix stabilizing mutations wereintroduced. Far-UV CD spectrum shows that the Apo F-helix mutant has enhanced secondary structure as compared to the wt ApoMb. The differencespectra were obtained by subtracting the spectra of apowt from apoF-helix (MRE values are on Y2). (D) Apo wt and apo F-helix proteins wereincubated with proteasome. The rate of degradation was followed by SDS-PAGE (inset) and quantified as described in methods. Data represent themean values 6S.D of at least three independent experiments for wt apoMb and five independent experiments for F-helix mutant. Remarkably,stabilization of F-helix rendered ApoMb more resistant to degradation by the proteasome.doi:10.1371/journal.pone.0034864.g003
Sequence and Structural Requirement of Degradation
PLoS ONE | www.plosone.org 5 April 2012 | Volume 7 | Issue 4 | e34864

protein, tryptophan fluorescence was measured. The emission
maximum and the fluorescence intensity were almost identical in
both the wt and mutant proteins (Supplementary Figure S4B).
The results indicate that the overall fold of the protein is not
affected by mutation.
To further verify that the mutations had a major effect on the
secondary structure rather than on the global stability of the
protein, we compared the thermodynamic stability of wt apoMb
and the F-helix mutant by subjecting them to urea denaturation at
pH7.5 (pH at which degradation is performed). At near neutral
pH (6–7) apoMb undergoes two state transitions [34,42,43]. We
observed the same and using the equation DG =DG(H2O)-
m[urea] (DG(H2O) is DG in the absence of urea and m, the
dependence of DG on urea), the free energy of stabilization was
calculated [44]. It is clear that the DG and the urea concentration
required to unfold 50% of the protein are very similar. Thus
mutations in the F-helix region seem to primarily stabilize the
secondary structure in the floppy F-helix without affecting the
overall stability of the protein (Table 1).
We checked the effect of these mutations on degradation of
apoMb and found that as predicted, stabilization of the F-helix
altered the half-life of apoMb. It takes 16 h for the proteasome to
degrade 50% of the F-helix mutant (Figure 3D) while the same is
achieved in 12 h in the case of the wt protein. This result reflects
the fact that the proteasome is sensitive to local secondary
structural alterations in this ubiquitin independent degradation of
single domain all helical protein.
To further prove that the mutations indeed stabilize the floppy
F-helix we performed limited proteolytic digests, a technique used
as an index of protein conformational status and dynamics [45].
Accessibility of a putative cleavage site is an important
determinant in endoproteolysis and is a parameter that can be
quantified. Recently we had combined this quantifiable parameter
called Solvent Accessible Surface Area from crystal structure of
proteins and sequence specificity of proteases to developed an
algorithm called PNSAS (Prediction of Natural Substrates from
Artificial Substrate of Proteases) to predict natural substrates of
endoproteases [46].
Initial nicking of apoMb by trypsin or chymotrypsin results in
the generation of two fragments through a cut within the floppy F-
helix. Trypsin cuts between Lys 96 and His 97 while chymotrypsin
nicks between residues Leu 89 and Ala 90 [47] (Figure 4A).
Therefore, if mutations have indeed stabilized the floppy F-helix,
the F-helix mutant should be relatively resistant to cleavage by
these enzymes. Addition of trypsin or chymotrypsin to wt apoMb
generates two fragments. As compared to trypsin (Figure 4B),
chymotrypsin (Figure 4C) cleaves wtapoMb at much faster rate
and the cleaved products can be seen immediately after addition of
chymotrypsin. The cleaved products were analyzed by MS and
they correspond to the expected fragment size (data not shown).
With time further hydrolysis of the fragments takes place. In sharp
contrast, the F-helix mutant is highly stable and very little of the
cleaved products were seen upon prolonged incubation (Figure 4B and C).
To test whether mutations in the floppy F-helix had an effect on
the affinity of the protein for the proteasome which may explain
the increase in half-life, an ELISA was performed. Binding of F-
helix mutant to the proteasome was not adversely affected
(Kd = 0.5761 nM vs 3.561 nM for the wt) (Table 2) indicating
that the residues mutated are not directly involved in interaction.
Taken together these results provide direct proof that the
disordered F-helix is stabilized by mutation and therefore
conformational changes involving this helix must be responsible
for the effect on degradation.
Recognition element in apoMbThe floppy F-helix may either serve as a recognition element or
as an initiator of degradation. To test whether this region is
involved in interaction with the proteasome and to map other
proteasome binding sites on apoMb, 15 amino acid sequences with
8 amino acid overlap between two contiguous regions were
selected. These peptides were synthesized with biotin at the N-
terminus and screened for binding to the proteasome (Supple-mentary Figure S5A). Peptides with the sequence from A-helix
bound strongly to the proteasome. Two other peptides which
encompassed B-helix and the CD-loop showed weak affinity.
To rule out the possibility that the lack of binding of some of the
other peptides could be due to their degradation by proteasome,
we used 100 nM of MG132 during all incubation steps in ELISA.
Interaction of peptides derived from A-helix, B-helix and CD-loop
region were not significantly altered but peptides E7 (69–83,
forming part of the C-termini of the E-helix and the EF-loop) and
F7 (90–104, forming C-termini of the F-helix, FG-loop and N-
termini of the G-helix) showed measurable binding. These
peptides were then tested in a competition assay. Commensurate
with the direct binding studies, the A-helix peptide inhibited
binding of apoMb with a Ki of 0.860.4 mM (Figure 5A). At
100 mM concentration, B-helix and the CD-loop peptides brought
about 40 and 48% inhibition in the binding of apoMb to the
proteasome respectively (Figure 5B). At the same concentration,
E7 and F7 brought about 34 and 65% inhibition respectively
(Figure 5B). In sharp contrast, the A-helix peptide singularly
achieved near complete inhibition with 80% of interaction
between apoMb and the proteasome abrogated at a concentration
of ,3 mM. Thus bulk of the binding energy between apoMb and
proteasome seems to be derived from the more structured A-helix
region. Using a binding assay that is independent of proteolysis
and ATPase stimulation, we have been able to map the possible
interactions between different regions of apoMb and the
proteasome.
A specifically designed 23 residue peptide covering the sequence
from 77–100 in the F-helix region could not inhibit binding of
apoMb to the proteasome at the concentrations tested (data not
shown). Barring a short stretch of residues between 69–77 that
forms the C-termini of E-helix, the sequence of floppy F-helix (78–
106) overlaps with the E7 and F7 peptides. Therefore apoMb is
likely to interact with the proteasome via weak interactions
originating from the residues at the C-termini of the E and the
N-termini of the G-helices. This region is highly disordered. It is
likely that this floppy F-helix enters the central channel of the
Table 1. Thermodynamic parameters from urea denaturation.
Wt F-helix
DG (H2O)(kcal mol21)
6.1460.25 6.1260.25
m(kcal mol21M21)
21.4160.05 21.4960.06
Cm (M) 4.3 4.09
The urea-induced unfolding was analyzed in 20 mM po4 buffer pH7.5,assuming DG has a linear dependence on the urea concentration:DG =DG(H2O)-m[urea], where DG(H2O) is an estimate of the value of DG in theabsence of urea and m is a measure of the dependence of DG on the ureaconcentration. The values for each data point are averages calculated on thebasis of at least four independent experiments. Errors shown are derived fromthe curve-fitting calculations.doi:10.1371/journal.pone.0034864.t001
Sequence and Structural Requirement of Degradation
PLoS ONE | www.plosone.org 6 April 2012 | Volume 7 | Issue 4 | e34864
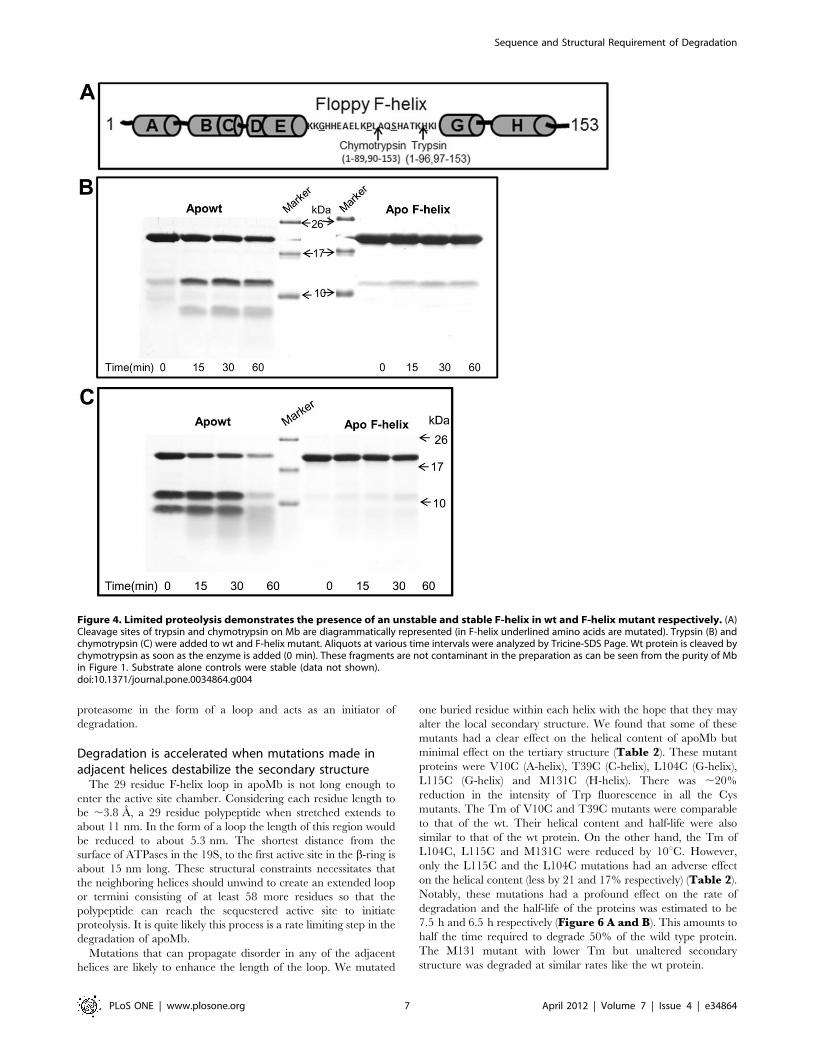
proteasome in the form of a loop and acts as an initiator of
degradation.
Degradation is accelerated when mutations made inadjacent helices destabilize the secondary structure
The 29 residue F-helix loop in apoMb is not long enough to
enter the active site chamber. Considering each residue length to
be ,3.8 A, a 29 residue polypeptide when stretched extends to
about 11 nm. In the form of a loop the length of this region would
be reduced to about 5.3 nm. The shortest distance from the
surface of ATPases in the 19S, to the first active site in the b-ring is
about 15 nm long. These structural constraints necessitates that
the neighboring helices should unwind to create an extended loop
or termini consisting of at least 58 more residues so that the
polypeptide can reach the sequestered active site to initiate
proteolysis. It is quite likely this process is a rate limiting step in the
degradation of apoMb.
Mutations that can propagate disorder in any of the adjacent
helices are likely to enhance the length of the loop. We mutated
one buried residue within each helix with the hope that they may
alter the local secondary structure. We found that some of these
mutants had a clear effect on the helical content of apoMb but
minimal effect on the tertiary structure (Table 2). These mutant
proteins were V10C (A-helix), T39C (C-helix), L104C (G-helix),
L115C (G-helix) and M131C (H-helix). There was ,20%
reduction in the intensity of Trp fluorescence in all the Cys
mutants. The Tm of V10C and T39C mutants were comparable
to that of the wt. Their helical content and half-life were also
similar to that of the wt protein. On the other hand, the Tm of
L104C, L115C and M131C were reduced by 10uC. However,
only the L115C and the L104C mutations had an adverse effect
on the helical content (less by 21 and 17% respectively) (Table 2).
Notably, these mutations had a profound effect on the rate of
degradation and the half-life of the proteins was estimated to be
7.5 h and 6.5 h respectively (Figure 6 A and B). This amounts to
half the time required to degrade 50% of the wild type protein.
The M131 mutant with lower Tm but unaltered secondary
structure was degraded at similar rates like the wt protein.
Figure 4. Limited proteolysis demonstrates the presence of an unstable and stable F-helix in wt and F-helix mutant respectively. (A)Cleavage sites of trypsin and chymotrypsin on Mb are diagrammatically represented (in F-helix underlined amino acids are mutated). Trypsin (B) andchymotrypsin (C) were added to wt and F-helix mutant. Aliquots at various time intervals were analyzed by Tricine-SDS Page. Wt protein is cleaved bychymotrypsin as soon as the enzyme is added (0 min). These fragments are not contaminant in the preparation as can be seen from the purity of Mbin Figure 1. Substrate alone controls were stable (data not shown).doi:10.1371/journal.pone.0034864.g004
Sequence and Structural Requirement of Degradation
PLoS ONE | www.plosone.org 7 April 2012 | Volume 7 | Issue 4 | e34864

Careful look at the crystal structure shows that L104 is present
in the N-terminal region of G-helix, but forms part of the
disordered region (78–106) in apoMb. In the holo protein, L104
interacts with residues in the H-helix. L115C is in the C-terminal
half of the G-helix and interacts with residues in the A-helix.
Compared to apowt, the respective loss in the helical content of
L104C and L115C mutants is 17 and 21%. Likewise, the
respective loss in helical content as compared to holo protein is
32 and 36%. As noted before, the difference between the holoMb
and wtapoMb is 18% which is largely accounted for by the loss in
the helical content of the floppy F-helix. Therefore, additional
losses in these two Leu mutants must involve other regions of the
protein. This is reflected in the limited proteolysis experiments
which show that the sites for cleavage are more readily accessible
in both the Leu mutants as compared to wt apoMb (Supple-
mental Figure S6A). The ‘disordered conformation’ of the F-
helix is stabilized in the mutant proteins rendering it more
susceptible to proteolysis. While disruption of helix-helix packing
and co-operative nature of folding could also account for the loss
in helical content, the primary driving force is likely to involve
propagation of the disorder into adjacent helices which facilitates
degradation.
Discussion
In order to investigate the sequence and structural requirements
for the degradation of an ubiquitin independent substrate by the
eukaryotic proteasomes, and identify the rate limiting steps, we
developed an in vitro model system composed of affinity purified
yeast 26S proteasomes and pure apoMb.
Table 2. Effect of apoMb secondary structure, Trp environment, melting temperature (Tm) and affinity (Kd) on proteasomaldegradation.
Protein % Helix* Relative Trp fluorescence Tm (6C)Affinity to proteasome(Kd nM)# Half-life (h)
By 222 nm$ SELCON3�
Holowt 92 94 ND 80 ND ND
ApoWT 76 79 1 65 3.561 12
V10CA-helix
74 79 0.82No shift
60 1.2560.3 12
T39CC-helix
74 79 0.821 nm red shift
63 19.567 12
StabilizedF-helix
85 87 1No shift
65 0.5760.1 16
L104CG-helix
60 62 0.821 nm blue shift
56 0.660.5 6–7
L115CG-helix
58 58 0.831 nm blue shift
56 0.6360.3 7–8
M131CH-helix
75 79 0.892 nm red shift
55 45620 12
ND = not determined.*2-4% variation in helicity was observed in three independent experiments.�Data for CONTIN (not shown) was similar to SELCON 3.#Kd represents mean value of three independent experiments 6S.D.$Fractional helical content = ([h] 222–3,000)/(236,000–3,000) [38].doi:10.1371/journal.pone.0034864.t002
Figure 5. Floppy F-helix sensitizes the proteasome for the presence of substrate and the interaction is reinforced by N-terminalhelices. Overlapping peptides panning the entire length of myoglobin were tested for binding to the immobilized proteasome by ELISA. (A) A-helixpeptide which bound strongly to the proteasome was tested for its ability to compete with apoMb. This peptide brought about 80% inhibition at3 mM concentration. (B) The B-helix, CD-loop, E7 and F7 peptides which share sequences with the floppy F-helix also inhibited the binding of apoMb.However they were considerably less potent than the A-helix peptide. All incubations were done in the presence of 100 nM MG132. Data representmean values of at least three independent 6S.D. For E7 S.D. is not plotted for clarity.doi:10.1371/journal.pone.0034864.g005
Sequence and Structural Requirement of Degradation
PLoS ONE | www.plosone.org 8 April 2012 | Volume 7 | Issue 4 | e34864
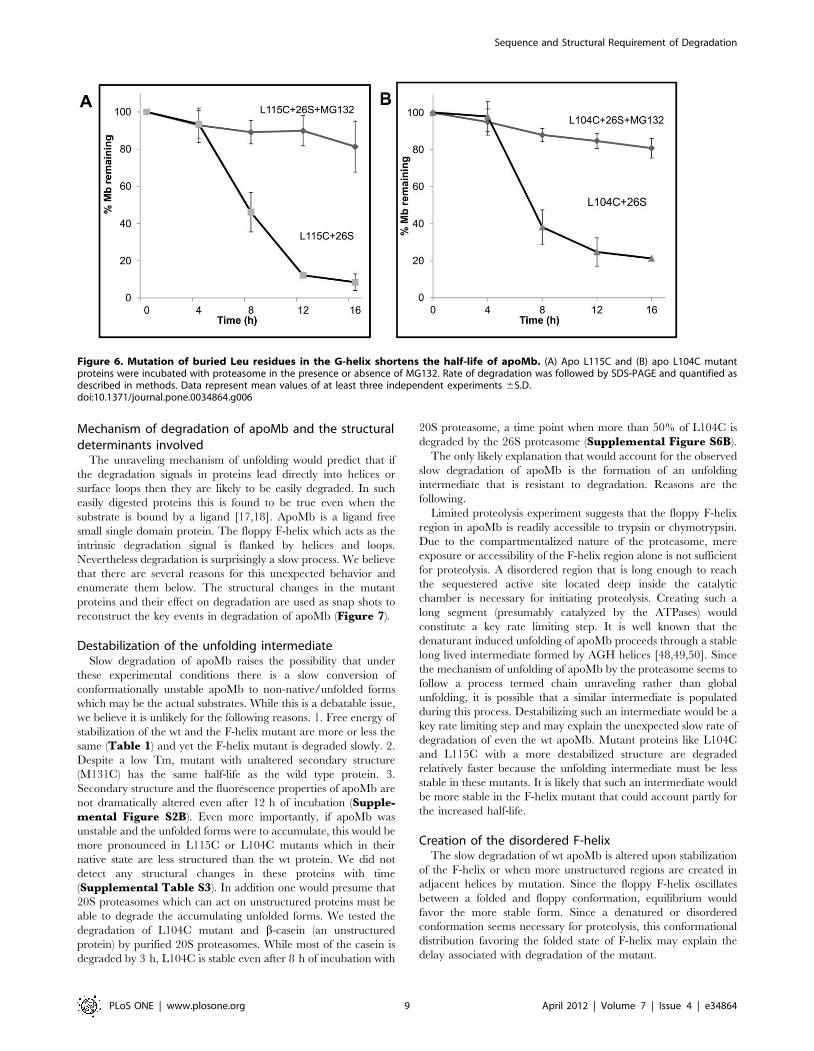
Mechanism of degradation of apoMb and the structuraldeterminants involved
The unraveling mechanism of unfolding would predict that if
the degradation signals in proteins lead directly into helices or
surface loops then they are likely to be easily degraded. In such
easily digested proteins this is found to be true even when the
substrate is bound by a ligand [17,18]. ApoMb is a ligand free
small single domain protein. The floppy F-helix which acts as the
intrinsic degradation signal is flanked by helices and loops.
Nevertheless degradation is surprisingly a slow process. We believe
that there are several reasons for this unexpected behavior and
enumerate them below. The structural changes in the mutant
proteins and their effect on degradation are used as snap shots to
reconstruct the key events in degradation of apoMb (Figure 7).
Destabilization of the unfolding intermediateSlow degradation of apoMb raises the possibility that under
these experimental conditions there is a slow conversion of
conformationally unstable apoMb to non-native/unfolded forms
which may be the actual substrates. While this is a debatable issue,
we believe it is unlikely for the following reasons. 1. Free energy of
stabilization of the wt and the F-helix mutant are more or less the
same (Table 1) and yet the F-helix mutant is degraded slowly. 2.
Despite a low Tm, mutant with unaltered secondary structure
(M131C) has the same half-life as the wild type protein. 3.
Secondary structure and the fluorescence properties of apoMb are
not dramatically altered even after 12 h of incubation (Supple-mental Figure S2B). Even more importantly, if apoMb was
unstable and the unfolded forms were to accumulate, this would be
more pronounced in L115C or L104C mutants which in their
native state are less structured than the wt protein. We did not
detect any structural changes in these proteins with time
(Supplemental Table S3). In addition one would presume that
20S proteasomes which can act on unstructured proteins must be
able to degrade the accumulating unfolded forms. We tested the
degradation of L104C mutant and b-casein (an unstructured
protein) by purified 20S proteasomes. While most of the casein is
degraded by 3 h, L104C is stable even after 8 h of incubation with
20S proteasome, a time point when more than 50% of L104C is
degraded by the 26S proteasome (Supplemental Figure S6B).
The only likely explanation that would account for the observed
slow degradation of apoMb is the formation of an unfolding
intermediate that is resistant to degradation. Reasons are the
following.
Limited proteolysis experiment suggests that the floppy F-helix
region in apoMb is readily accessible to trypsin or chymotrypsin.
Due to the compartmentalized nature of the proteasome, mere
exposure or accessibility of the F-helix region alone is not sufficient
for proteolysis. A disordered region that is long enough to reach
the sequestered active site located deep inside the catalytic
chamber is necessary for initiating proteolysis. Creating such a
long segment (presumably catalyzed by the ATPases) would
constitute a key rate limiting step. It is well known that the
denaturant induced unfolding of apoMb proceeds through a stable
long lived intermediate formed by AGH helices [48,49,50]. Since
the mechanism of unfolding of apoMb by the proteasome seems to
follow a process termed chain unraveling rather than global
unfolding, it is possible that a similar intermediate is populated
during this process. Destabilizing such an intermediate would be a
key rate limiting step and may explain the unexpected slow rate of
degradation of even the wt apoMb. Mutant proteins like L104C
and L115C with a more destabilized structure are degraded
relatively faster because the unfolding intermediate must be less
stable in these mutants. It is likely that such an intermediate would
be more stable in the F-helix mutant that could account partly for
the increased half-life.
Creation of the disordered F-helixThe slow degradation of wt apoMb is altered upon stabilization
of the F-helix or when more unstructured regions are created in
adjacent helices by mutation. Since the floppy F-helix oscillates
between a folded and floppy conformation, equilibrium would
favor the more stable form. Since a denatured or disordered
conformation seems necessary for proteolysis, this conformational
distribution favoring the folded state of F-helix may explain the
delay associated with degradation of the mutant.
Figure 6. Mutation of buried Leu residues in the G-helix shortens the half-life of apoMb. (A) Apo L115C and (B) apo L104C mutantproteins were incubated with proteasome in the presence or absence of MG132. Rate of degradation was followed by SDS-PAGE and quantified asdescribed in methods. Data represent mean values of at least three independent experiments 6S.D.doi:10.1371/journal.pone.0034864.g006
Sequence and Structural Requirement of Degradation
PLoS ONE | www.plosone.org 9 April 2012 | Volume 7 | Issue 4 | e34864

Recently the NMR structure of F-helix stabilized apoMb has
been solved. Two mutants that could enhance the secondary
structure in the F-helix were designed using AGADIR. One of the
mutant protein F2 (P88K/S92K double mutant) has the same free
energy of stabilization like the wt protein [43]. The predicted
enhancement in secondary structure of F2 was confirmed by CD
and NMR resonances that were undetectable in apowt could now
be assigned to the F-helix region. These NMR structures provide
support for our claim that mutations in F-helix (G80A/P88A/
S92A/H93N) which results in enhanced secondary structure,
(AGADIR, CD and limited proteolysis) with no apparent effect of
global stability (similar DG and Tm like wtapoMb), is most likely
due to the conversion of the disordered floppy F-helix to a more
stable form. As indicated by the limited proteolysis experiment
melting of this F-helix in the mutant to a disordered structure is a
slow process. It is likely that conversion of the F-helix to a
disordered state and therefore creation of degron are catalyzed by
the ATPases of the proteasome. This may explain some of the
delay observed in the half-life of the mutant as compared to the wt
protein. Notably no detectable degradation takes place when the
helix is buried in the holoform. Thus, formation of an endogenous
degron seems to be a key rate limiting step.
Other Rate limiting steps in degradationRecognition is one of the key rate limiting steps. A direct
interaction between the proteasome and its substrate as well as the
determinants of protein-protein interactions between the two have
not been reported till date. Using overlapping peptides that pan
the entire sequence of apoMb, sequences that can directly interact
with the proteasome and/or compete with apoMb for binding
were identified. Results from these experiments identify the
probable regions within the substrate that are important for
interaction with the proteasome. Peptides derived from the F-helix
region are weak inhibitors of interaction. One of the main reasons
for the failure of the proteasome to degrade holoMb is the very
weak affinity of interaction primarily due to unavailability of the
floppy F-helix. Taking these two observations together we believe
that initial encounters between apoMb and the proteasome is most
likely mediated through the floppy F-helix which sensitizes the
proteasome and primes the substrate for degradation. This is
further supported by the fact the mutant despite having a more
Figure 7. A model for the mechanistic steps involved in the degradation of apoMb based on structural changes in mutations usedas snap shots. Removal of heme exposes a previously buried F-helix which is in a dynamic equilibrium between a partially folded and unfoldedstructure. This transition is a rate limiting step. Exposure of this floppy helix sensitizes the proteasome to the presence of the substrate. ApoMb isanchored to the proteasome by interactions primarily through the A-helix. Additional interactions stabilize the enzyme-substrate complex.Degradation is primed by the insertion of the floppy helix in the form of a loop into the central channel that runs across the proteasome. Anintermediate composed of AGH helices is likely to be formed. Melting of this intermediate by the ATPases to generate an unstructured region longenough to reach the active site is a likely rate limiting step. Mutations can stabilize or destabilize this unfolding intermediate affecting the rate ofdegradation.doi:10.1371/journal.pone.0034864.g007
Sequence and Structural Requirement of Degradation
PLoS ONE | www.plosone.org 10 April 2012 | Volume 7 | Issue 4 | e34864

stable F-helix than the wt apoMb, is able to interact with the
proteasome. Furthermore, since sequence from A-helix is not only
able to directly bind to the proteasome with high affinity, but is
also able to completely neutralize the binding of apoMb, the bulk
of the interaction between apoMb and proteasome is likely to be
mediated by the A-helix aided by sequences from B helix and CD
loop.
Available literature suggests that the conformation and the
stability of the A-helix are very similar in the holo and apoprotein
[25]. The structure of the A-helix region seems unaltered between
the holo and the apoform and yet holoMb is not recognized to any
significant extent by intact 26S proteasome. This seemingly
contradictory observation can be reconciled if one imagines that
the primary interaction is mediated by the disordered F-helix
exposed only in apoMb (EF loop and FG loop as seen by the
peptide panning studies). This probably alters the conformation of
A-helix in a manner that allows binding to the proteasome. The
bound conformation of the A helix must be different from that of
unbound apoMb. A peptide which is free and flexible may adopt
the bound conformation that would explain its ability to inhibit
apoMb. Recognition through F-helix region seems mandatory for
other interactions to take place.
How does the rate of degradation of different mutantproteins correlate with their binding affinity?
One expects a direct correlation between affinity and rate of
degradation. The maximum difference in binding affinity between
apowt and any of the mutant protein studied is within an order of
magnitude and the correlations are direct in some cases and
inverse in others. M131C and T39C with ,7–10 fold lower
affinity are degraded to the same extent as the wt (Table 2). They
have similar helical content like the wt apoMb. The F-helix
mutant with ,6 times more affinity than the wt is degraded slowly.
This is likely due to a) the slow transition between the folded and
unfolded forms of the floppy F-helix and b) the presence of a stable
unfolding intermediate. The two Leu mutants with 6 fold higher
affinity are degraded much faster than the wt protein. Thus
destabilization of the adjacent helices and/or the unfolding
intermediate seem to be the driving force that accelerates
degradation rather than affinity per se.
Analysis of the crystal structure of the holo protein indicates that
T39 in C-helix interacts with residues within the CD loop. M131
interacts with two residues in the A-helix and one in the G-helix.
Since our competition experiments with the peptides indicated
that the A helix and CD loop are involved in interaction with the
proteasome, it seems that T39 and M131 may have a role to play
in influencing this interaction. Based on the extensive interaction
between the helices of apoprotein and the proteasome uncovered
by our peptide panning and competition experiments, cooperative
nature of these interactions cannot be ruled out. Moreover
existence of additional interactions that are not revealed by
peptide panning experiments cannot be ruled out.
Taken together these results indicate that the major influence on
the rate of degradation seems to be the folded state of the helices
and the proteasome is tolerant to small changes in binding affinity.
But exposure of the F-helix or the intrinsic degron which is critical
for initial recognition constitutes the first major rate limiting step
in degradation. Mutations of the residues in the A-helix and
identification of the subunit/s of the 19S regulatory particles
involved in recognition of apoMb would further enhance our
understanding of the mechanism involved in degradation.
What are the general aspects of ApoMb degradation?ApoMb is likely to represent ligand free form of proteins and
proteins which have dissociated from their binding partners or
subunits. In such cases previously buried interacting region may
become exposed. Many proteins contain disordered loops within
their structure that are highly flexible. Some if not all may be
responsible for degradation by the proteasome. L104C and L115C
mutants may represent molten globule forms of the protein that
need to be rapidly cleared by the proteasome to prevent their
accumulation and toxicity.
In the absence of ubiquitin or in addition to ubiquitin, high
affinity interaction like those mediated by sequences within the
protein like the predicted A helix region may be important in
preventing premature release of a substrate. Similar to what seems
to be happening with apoMb, ATPase induced unfolding by the
mechanism of helix unraveling is likely to create intermediates in
other proteins. Such unfolding intermediates in single domain
proteins would mimic multi domain proteins in which the
degradation signal meets up with a difficult domain or leads into
a beta strand that seems resistant to unfolding by the proteasome
[17,18]. Therefore in addition to the structure adjacent to the
degradation signals, the intermediates formed in globular proteins
regardless of their secondary structural status may be key
determinants of the rate of degradation. Such intermediates
probably are impediment to global unfolding of the substrate by
the ATPases.
Origin of intrinsic degradation signal or native degron in
proteins. It has been well demonstrated that even when a
protein is ubiquitinated, efficient degradation requires long
unstructured regions [17,18]. However what is unclear is the
origin of such unstructured regions in proteins. By using a
substrate that can be degraded in the absence of extrinsic
degradation tags. Our study identifies the possible origin of such
intrinsic degradation signals. The minimal required length of the
disordered sequence seems to be a short stretch that is 29 residues
long in the middle of the protein which originates from a well-
defined secondary structural element like the a-helix. This region
remains buried and is exposed only upon ligand removal. Long
disordered regions $100 residues are common among intrinsically
disordered proteins. The source of short disordered segments
within other folded proteins may be reminiscent of any one of the
following. Short stretches of peptides lacking a well-defined
electron density (mobile) have been identified in 40% of the
proteins (all species) for which high resolution crystal structures are
available in the Protein Data Bank (PDB). In addition sequences (2
residues and longer) that seem to be poised for structural transition
to a disordered conformation called the ‘dual personality’
segments (some of them similar to the F-helix) have also been
identified within the PDB [51,52,53]. Post translational
modification like phosphorylation, ubiquitination or mutations
(like L104C and L115C) may create such disordered segments
[54,55]. Such flexible segments may also be made available by
conformational changes upon ligand removal or due to the release
of an interacting partner.
In summary, we have unequivocally demonstrated that purified
eukaryotic 26S proteasomes can degrade a folded protein in vitro
by recognizing sequence/s present within the substrate unaided by
ubiquitin or adaptor proteins. While confirming to the known
mechanism of degradation of ubiquitinated multi domain proteins
fused with unstructured regions, degradation of apoMb and its
mutants has revealed several new insights. We believe that apoMb
would serve as a new model protein for in depth characterization
of the sequence, structure, thermodynamic and kinetic aspects of
degradation and the role of proteasomal ATPases in facilitating
Sequence and Structural Requirement of Degradation
PLoS ONE | www.plosone.org 11 April 2012 | Volume 7 | Issue 4 | e34864

degradation. In addition since apoMb can be directly recognized
by the proteasome and degraded without ubiquitin, it would be an
appropriate model protein to investigate the explicit role of
ubiquitination in proteasomal degradation.
Materials and Methods
PlasmidsSperm whale Mb cDNA was a gift from S.G.Sligar [33].
Mutations in Mb were created by site directed mutagenesis
(primers– Table S4) and sequence verified.
ProteinsMyoglobin and its mutants were purified by cation exchange
chromatography using CM52 cellulose (Whatman). Mb over
expressing DH5a cells were lysed in 10 mM PO4 buffer (pH 6.8)
by sonication. The pH of lysate was adjusted to 6.4 and incubated
on ice for 1 h. After centrifugation the lysate was loaded on to CM
cellulose column. After thorough washing, bound Mb was eluted
with 30 mM PO4, pH 6.8. Purity was checked by 15% SDS-
PAGE. ApoMb was prepared by acid-acetone method [34]. The
heme free proteins were extensively dialyzed against milliQ water
at 4uC. Heme removal was confirmed by recording the UV-visible
spectrum between 240 to 500 nm (Jasco v-650). Protein
concentrations (in milliQ water) were determined by UV
absorbance at 280 nm using an extinction coefficient
15470 M21 cm21 for ApoMb (as estimated by ExPASy-Prot-
Param tool which agrees well with literature reported value [42])
and 34500 M21 cm21 for holoMb [42]. Proteins with A280/260
ratio $1.5 were used for all assays. After completion of the
experiment (CD), proteins were analyzed by SDS-PAGE to further
ensure that equivalent concentrations of different proteins were
indeed used.
To check the quaternary structure of apoMb gel filtration was
performed using Superdex 75 (GE Healthcare) matrix on Biologic
duo flow (Bio-rad). A280 of the holo and apoMb loaded on the
column were the same.
Yeast strains carrying the flag tagged 26S and 20S proteasome
(YYS40-RPN11 3X FLAG) and YYS37-PRE1 3XFLAG; kind gift
by Hideyoshi Yokosawa) were purified by affinity chromatography
[35].
Proteasomal degradation12 mM substrate and 50 nM 26S or 20S proteasomes were
incubated in the degradation buffer (20 mM HEPES/NaOH
pH 7.5, 3 mM ATP, 15 mM MgCl2, 1 mM DTT, 2.5–3.5%
glycerol). Substrate alone or substrate with MG132 treated 26S
proteasome was taken as control. Degradation was also tested in
the presence of ATPcS a non-hydrolysable analogue of ATP. The
nucleotides obtained from Sigma were used directly. In incuba-
tions with ATPcS (3 mM), the final assay buffer contained
0.3 mM ATP from the elution buffer used to purify proteasomes.
Other active site inhibitors of proteasome Velcade and epoxomi-
cin as well as the serine protease inhibitor PMSF were tested
likewise.
All reactions were carried out at 37uC. 10 ml aliquots were
withdrawn at 0 h, 8 h, 12 h, 16 h and 19 h and added to 3X-SDS
sample loading buffer, and stored at 220uC. These aliquots were
resolved on a 15% SDS-PAGE. After Coomassie brilliant blue
staining, substrate remaining was quantified by Image-J.
Proteasome-substrate interactionInteraction of proteasome with the substrate was monitored by
ELISA. Briefly Nunc Maxisorb plate was coated with 2 mg/ml of
anti-FLAG antibody (Sigma) in 100 mM sodium carbonate buffer
pH 9.5. Plate was blocked with TBST containing 2% BSA. 1 mg/
ml (0.37 nM) 26S proteasome was then captured using the dilution
buffer (TBST supplemented with 1 mM ATP, 5 mM MgCl2 and
0.1%BSA). After washing with TBST, varying concentrations of
apoMb (580 nM to 0.006 nM) were incubated with immobilized
proteasomes. Finally, the amount of proteasome bound Mb was
quantified by antiMb antibody (1:500, Cell Signaling) followed by
antimouse HRP antibody (1:5000, Amersham) with TMB as the
substrate. The reaction was stopped using 2 M H2SO4, and
absorbance was measured at 450 nm (Spectra max190). Kd was
calculated by fitting the data, using Graph Pad Prism 5 assuming
one site specific binding (the two 19S caps were considered to be
equivalent).
To detect binding of myoglobin derived peptides to the
proteasome ELISA was similarly performed with biotinylated
peptides (10 mM to 0.1 mM). Bound peptides were detected using
streptavidin alkaline phosphatase and quantitated using 100 ml of
16 pNPP substrate. After 20 minutes the reaction was stopped
with of 2N NaOH and absorbance was measured at 405 nm.
Ability of peptides to compete with Mb for binding to the
proteasome was tested by incubating 8 nM apoMb in presence of
varying concentrations (100 mM to 0.01 mM) of the peptides. Ki
was calculated by fitting the graph assuming one site binding.
ATPase assayTo characterize the purified proteasome and to establish the
ability of proteasome to recognize apoMb, ATP hydrolysis was
monitored in the presence and the absence of the substrate. Assay
buffer (25 mM HEPES/NaOH pH7.5, 3 mM ATP,15 mM
MgCl2) containing 0.01 mg/ml 26S proteasome (3.7pM) with or
without 5 mg (580 nM) of the substrate was incubated at 37uC for
15 min. Amount of inorganic phosphate formed was estimated by
calorimetry [56] (Spectra max190) and quantified using a standard
graph.
Limited proteolysisLimited proteolysis of apowt or apoF-helix was performed using
trypsin or chymotrypsin at 1/25 (w/w) ratio of enzyme to substrate
in 20 mM Tris pH7.5 (1 mM CaCl2 was supplemented in case of
chymotrypsin). Aliquots were withdrawn at 0, 15, 30 and 60 min
and the reaction was stopped by adding 3X-SDS sample buffer for
Tricine-PAGE. These aliquots were resolved on Tricine SDS-
PAGE and stained by Coomassie brilliant blue.
Far-UV Circular DichroismFar-UV CD spectrum (Jasco, J815) of Mb and its mutant
proteins was recorded between 260 and 190 nm (Settings: Scan
speed 50 nm/sec, accumulation 5, data pitch 0.1, at 24uC) in
20 mM PO4 buffer, pH 7.5. In case of cysteine mutants of Mb
samples were first treated with 1 mM DTT in 20 mM PO4 buffer,
pH 7.5 for 1 h at 37uC. All data were converted to mean residue
ellipticity. The data were saved in Dichroweb format and
subsequently analyzed by SELCON3 and CONTIN using
Dichroweb [57,58]. Thermal denaturation of wt Mb and its
mutants was followed by scanning the CD spectra from 10uC to
90uC with an increment of 1uC/min. Sample was equilibrated for
5 min at each given temperature. Ellipticity at 222 nm at different
temperature was used to calculate fraction unfolded. To determine
the thermodynamic stability of wtapoMb and the F-helix mutant,
both proteins (5 mM) were incubated overnight in different
concentrations of urea (PO4 buffer pH 7.5) at 25uC and the CD
spectra were taken. The data was fitted as described by Shirley
[44].
Sequence and Structural Requirement of Degradation
PLoS ONE | www.plosone.org 12 April 2012 | Volume 7 | Issue 4 | e34864

Tryptophan fluorescenceTrp environment in wtapoMb and mutant proteins was
analyzed by fluorescence spectroscopy. Excitation was set at
295 nm and emission was monitored between 305–400 nm (slit
width 5 nm, Fluorolog, Horiba). Fluorescence intensity of protein
was subtracted from the buffer and the data is represented as
relative fluorescence intensity.
Supporting Information
Figure S1 Characterization of affinity purified protea-some. (a) To ensure that the purified proteasomes are intact and
active, 20S and 26S proteasomes were resolved on a 4% native
PAGE. In gel peptidase activity was performed by incubating the
gels with Suc-LLVY-AMC and for the detection of 20S
proteasome activity, 0.05% SDS was also used. Gels were stained
with Coomassie brilliant blue to detect the proteins. (b) Subunit
composition was verified by resolving purified 26S proteasome on
a 12% SDS-PAGE.
(TIF)
Figure S2 Stability of 26S proteasome and apoMb. (A)
Two different preparation (P1 and P2) of 26S proteasome was
incubated at 37uC for 12 h in assay buffer. In gel activity and
coommassie staining of native gel was performed. (B) Wt apoMb
was incubated at 37uC and at the indicated time CD and
fluorescence spectra were collected.
(TIF)
Figure S3 Both apoMb and holo form bind with 20Sproteasomes. ApoMb and holoMb were incubated with
immobilized 20S proteasome and detected using anti-Mb
antibody.
(TIF)
Figure S4 F-helix stabilization does not significantlyaffect the thermal stability or the Trp environment ofMb. (a) Thermal denaturation of apo wt and F-helix mutant was
monitored by secondary structural changes. Ellipticity at 222 nm
was used to calculate the fraction folded which is plotted against
the incubation temperature. (b) Trp fluorescence of wt apoMb and
the F-helix mutant was analyzed under native conditions. Trp
environment, an indicator of tertiary fold was similar in the wt and
mutant proteins.
(TIF)
Figure S5 Identification of proteasome interactingregion/s on apoMb by peptide panning. (a) Overlapping,
biotinylated peptides (1 mM) corresponding to the primary
sequence of Mb were incubated with the immobilized proteasome.
A-helix peptide bound tightly to the proteasome, while B-helix,
CD-loop and F-helix peptide bind weakly. (b) Amino acid
sequences of peptides which were used for competition experi-
ments are listed.
(TIF)
Figure S6 Proteolytic stability of leu mutants of Mb. (A)
Limited proteolysis of L104C and L115C mutant was done with
chymotrypsin, F-helix in these proteins seems to be more
unstructured than wt. (B) Relatively less structured L104C protein
was incubated with 20S proteasome, substrate remaining was
quantified as described in methods, L104C was stable for
degradation while an unstructured protein casein was degraded
by 20S proteasome.
(TIF)
Table S1 Model systems used to study the mechanism of
degradation of the eukaryotic proteasome.
(DOCX)
Table S2 Probing the stability of 26S proteasomes by Suc-
LLVY-Amc cleaving activity.
(DOCX)
Table S3 Conformational Stability of wt and mutant ApoMb.
(DOCX)
Table S4 Primer sequences used for site directed mutagenesis of
Mb.
(DOCX)
Method S1 Molecular dynamic simulation of wt myoglobin and
F-helix mutant.
(DOCX)
Acknowledgments
We thank Hideyoshi Yokosawa (Hokkaido University, Japan) for yeast
strains and Stephen Sliger (University of Illinois, Illinois, USA) for sperm
whale myoglobin cDNA. We thank Prof. P. Balaram (IISC, Bangalore), for
suggestions on the helix stabilizing mutation. Thanks to Prof. Saraswathi
Vishveshwara (IISC, Bangalore) who guided us with the MD simulations.
We thank Indrajit Sahu JRF for artistic input.
Author Contributions
Performed the experiments: AKSG SB. Analyzed the data: PV AKSG.
Contributed reagents/materials/analysis tools: PV. Wrote the paper: PV.
Conceived and directed the project: PV. Designed the experiment: PV
AKSG. Assisted writing the manuscript: AKSG.
References
1. Glickman MH, Ciechanover A (2002) The ubiquitin-proteasome proteolytic
pathway: destruction for the sake of construction. Physiol Rev 82: 373–428.
2. Wolf DH, Hilt W (2004) The proteasome: a proteolytic nanomachine of cell
regulation and waste disposal. Biochim Biophys Acta 1695: 19–31.
3. Hanna J, Finley D (2007) A proteasome for all occasions. FEBS Lett 581:
2854–2861.
4. Kisselev AF, Akopian TN, Woo KM, Goldberg AL (1999) The sizes of peptides
generated from protein by mammalian 26 and 20 S proteasomes. Implications
for understanding the degradative mechanism and antigen presentation. J Biol
Chem 274: 3363–3371.
5. Liu CW, Corboy MJ, DeMartino GN, Thomas PJ (2003) Endoproteolytic
activity of the proteasome. Science 299: 408–411.
6. Palombella VJ, Rando OJ, Goldberg AL, Maniatis T (1994) The ubiquitin-
proteasome pathway is required for processing the NF-kappa B1 precursor
protein and the activation of NF-kappa B. Cell 78: 773–785.
7. Rape M, Jentsch S (2002) Taking a bite: proteasomal protein processing. Nature
Cell Biology 4: E113–116.
8. Navon A, Goldberg AL (2001) Proteins are unfolded on the surface of the
ATPase ring before transport into the proteasome. Mol Cell 8: 1339–1349.
9. Ogura T, Tanaka K (2003) Dissecting various ATP-dependent steps involved in
proteasomal degradation. Mol Cell 11: 3–5.
10. Henderson A, Erales J, Hoyt MA, Coffino P (2011) Dependence of proteasome
processing rate on substrate unfolding. J Biol Chem 286: 17495–17502.
11. Venkatraman P, Wetzel R, Tanaka M, Nukina N, Goldberg AL (2004)
Eukaryotic proteasomes cannot digest polyglutamine sequences and release
them during degradation of polyglutamine-containing proteins. Mol Cell 14:
95–104.
12. Baumeister W, Walz J, Zuhl F, Seemuller E (1998) The proteasome: paradigm
of a self-compartmentalizing protease. Cell 92: 367–380.
13. Groll M, Ditzel L, Lowe J, Stock D, Bochtler M, et al. (1997) Structure of 20S
proteasome from yeast at 2.4 A resolution. Nature 386: 463–471.
14. Deveraux Q, Ustrell V, Pickart C, Rechsteiner M (1994) A 26 S protease subunit
that binds ubiquitin conjugates. J Biol Chem 269: 7059–7061.
15. Lam YA, Lawson TG, Velayutham M, Zweier JL, Pickart CM (2002) A
proteasomal ATPase subunit recognizes the polyubiquitin degradation signal.
Nature 416: 763–767.
16. Groll M, Bajorek M, Kohler A, Moroder L, Rubin DM, et al. (2000) A gated
channel into the proteasome core particle. Nat Struct Biol 7: 1062–1067.
Sequence and Structural Requirement of Degradation
PLoS ONE | www.plosone.org 13 April 2012 | Volume 7 | Issue 4 | e34864

17. Prakash S, Inobe T, Hatch AJ, Matouschek A (2009) Substrate selection by the
proteasome during degradation of protein complexes. Nat Chem Biol 5: 29–36.18. Prakash S, Tian L, Ratliff KS, Lehotzky RE, Matouschek A (2004) An
unstructured initiation site is required for efficient proteasome-mediated
degradation. Nat Struct Mol Biol 11: 830–837.19. Lee C, Schwartz MP, Prakash S, Iwakura M, Matouschek A (2001) ATP-
dependent proteases degrade their substrates by processively unraveling themfrom the degradation signal. Mol Cell 7: 627–637.
20. Janse DM, Crosas B, Finley D, Church GM (2004) Localization to the
proteasome is sufficient for degradation. J Biol Chem 279: 21415–21420.21. Forsthoefel AM, Pena MM, Xing YY, Rafique Z, Berger FG (2004) Structural
determinants for the intracellular degradation of human thymidylate synthase.Biochemistry 43: 1972–1979.
22. Pena MM, Xing YY, Koli S, Berger FG (2006) Role of N-terminal residues inthe ubiquitin-independent degradation of human thymidylate synthase.
Biochem J 394: 355–363.
23. Baugh JM, Viktorova EG, Pilipenko EV (2009) Proteasomes can degrade asignificant proportion of cellular proteins independent of ubiquitination. J Mol
Biol 386: 814–827.24. Arcovito A, Benfatto M, Cianci M, Hasnain SS, Nienhaus K, et al. (2007) X-ray
structure analysis of a metalloprotein with enhanced active-site resolution using
in situ x-ray absorption near edge structure spectroscopy. Proc Natl AcadSci U S A 104: 6211–6216.
25. Eliezer D, Wright PE (1996) Is apomyoglobin a molten globule? Structuralcharacterization by NMR. J Mol Biol 263: 531–538.
26. Phillips SE (1980) Structure and refinement of oxymyoglobin at 1.6 A resolution.J Mol Biol 142: 531–554.
27. Feng Z, Ha JH, Loh SN (1999) Identifying the site of initial tertiary structure
disruption during apomyoglobin unfolding. Biochemistry 38: 14433–14439.28. Samatova EN, Melnik BS, Balobanov VA, Katina NS, Dolgikh DA, et al. (2010)
Folding intermediate and folding nucleus for I–.N and U–.I–.N transitionsin apomyoglobin: contributions by conserved and nonconserved residues.
Biophys J 98: 1694–1702.
29. Jamin M, Baldwin RL (1996) Refolding and unfolding kinetics of theequilibrium folding intermediate of apomyoglobin. Nat Struct Biol 3: 613–618.
30. Lecomte JT, Kao YH, Cocco MJ (1996) The native state of apomyoglobindescribed by proton NMR spectroscopy: the A-B-G-H interface of wild-type
sperm whale apomyoglobin. Proteins 25: 267–285.31. Onufriev A, Case DA, Bashford D (2003) Structural details, pathways, and
energetics of unfolding apomyoglobin. J Mol Biol 325: 555–567.
32. Jamin M (2005) The folding process of apomyoglobin. Protein Pept Lett 12:229–234.
33. Springer BA, Sligar SG (1987) High-level expression of sperm whale myoglobinin Escherichia coli. Proc Natl Acad Sci U S A 84: 8961–8965.
34. Griko YV, Privalov PL, Venyaminov SY, Kutyshenko VP (1988) Thermody-
namic study of the apomyoglobin structure. J Mol Biol 202: 127–138.35. Sone T, Saeki Y, Toh-e A, Yokosawa H (2004) Sem1p is a novel subunit of the
26 S proteasome from Saccharomyces cerevisiae. J Biol Chem 279:28807–28816.
36. Cashikar AG, Schirmer EC, Hattendorf DA, Glover JR, Ramakrishnan MS, etal. (2002) Defining a pathway of communication from the C-terminal peptide
binding domain to the N-terminal ATPase domain in a AAA protein. Mol Cell
9: 751–760.37. Benaroudj N, Zwickl P, Seemuller E, Baumeister W, Goldberg AL (2003) ATP
hydrolysis by the proteasome regulatory complex PAN serves multiple functionsin protein degradation. Mol Cell 11: 69–78.
38. Morrisett JD, David JS, Pownall HJ, Gotto AM, Jr. (1973) Interaction of an
apolipoprotein (apoLP-alanine) with phosphatidylcholine. Biochemistry 12:1290–1299.
39. Munoz V, Serrano L (1994) Elucidating the folding problem of helical peptides
using empirical parameters. Nat Struct Biol 1: 399–409.40. Munoz V, Serrano L (1995) Elucidating the folding problem of helical peptides
using empirical parameters. II. Helix macrodipole effects and rationalmodification of the helical content of natural peptides. J Mol Biol 245: 275–296.
41. Munoz V, Serrano L (1995) Elucidating the folding problem of helical peptides
using empirical parameters. III. Temperature and pH dependence. J Mol Biol245: 297–308.
42. Harrison SC, Blout ER (1965) Reversible Conformational Changes ofMyoglobin and Apomyoglobin. J Biol Chem 240: 299–303.
43. Nishimura C, Dyson HJ, Wright PE (2011) Consequences of stabilizing thenatively disordered f helix for the folding pathway of apomyoglobin. J Mol Biol
411: 248–263.
44. Shirley BA (1995) Urea and guanidine hydrochloride denaturation curves.Methods Mol Biol 40: 177–190.
45. Fontana A, de Laureto PP, Spolaore B, Frare E, Picotti P, et al. (2004) Probingprotein structure by limited proteolysis. Acta Biochim Pol 51: 299–321.
46. Venkatraman P, Balakrishnan S, Rao S, Hooda Y, Pol S (2009) A sequence and
structure based method to predict putative substrates, functions and regulatorynetworks of endo proteases. PLoS One 4: e5700.
47. Picotti P, Marabotti A, Negro A, Musi V, Spolaore B, et al. (2004) Modulationof the structural integrity of helix F in apomyoglobin by single amino acid
replacements. Protein Sci 13: 1572–1585.48. Eliezer D, Chung J, Dyson HJ, Wright PE (2000) Native and non-native
secondary structure and dynamics in the pH 4 intermediate of apomyoglobin.
Biochemistry 39: 2894–2901.49. Cavagnero S, Nishimura C, Schwarzinger S, Dyson HJ, Wright PE (2001)
Conformational and dynamic characterization of the molten globule state of anapomyoglobin mutant with an altered folding pathway. Biochemistry 40:
14459–14467.
50. Hughson FM, Wright PE, Baldwin RL (1990) Structural characterization of apartly folded apomyoglobin intermediate. Science 249: 1544–1548.
51. Sickmeier M, Hamilton JA, LeGall T, Vacic V, Cortese MS, et al. (2007)DisProt: the Database of Disordered Proteins. Nucleic Acids Res 35: D786–793.
52. Zhang Y, Stec B, Godzik A (2007) Between order and disorder in proteinstructures: analysis of ‘‘dual personality’’ fragments in proteins. Structure 15:
1141–1147.
53. Le Gall T, Romero PR, Cortese MS, Uversky VN, Dunker AK (2007) Intrinsicdisorder in the Protein Data Bank. J Biomol Struct Dyn 24: 325–342.
54. Iakoucheva LM, Radivojac P, Brown CJ, O’Connor TR, Sikes JG, et al. (2004)The importance of intrinsic disorder for protein phosphorylation. Nucleic Acids
Res 32: 1037–1049.
55. Hagai T, Levy Y (2010) Ubiquitin not only serves as a tag but also assistsdegradation by inducing protein unfolding. Proc Natl Acad Sci U S A 107:
2001–2006.56. Cogan EB, Birrell GB, Griffith OH (1999) A robotics-based automated assay for
inorganic and organic phosphates. Anal Biochem 271: 29–35.57. Whitmore L, Wallace BA (2004) DICHROWEB, an online server for protein
secondary structure analyses from circular dichroism spectroscopic data. Nucleic
Acids Res 32: W668–673.58. Lobley A, Whitmore L, Wallace BA (2002) DICHROWEB: an interactive
website for the analysis of protein secondary structure from circular dichroismspectra. Bioinformatics 18: 211–212.
Sequence and Structural Requirement of Degradation
PLoS ONE | www.plosone.org 14 April 2012 | Volume 7 | Issue 4 | e34864

Page | 1
From prediction to experimental validation-Desmoglein 2 is a functionally
relevant substrate of matriptase in epithelial cells and their reciprocal relationship
is important for cell adhesion.
Vinita Wadhawan, Yogesh A Kolhe, Nikhil Sangith, Amit Kumar Singh Gautam and Prasanna
Venkatraman*.
Advanced Centre for Treatment, Research and Education in Cancer, Tata Memorial Centre,
Kharghar Navi Mumbai-410210, India.
*Corresponding author: [email protected]
Accurate identification of substrates of a protease is critical in defining its physiological functions. We recently predicted that desmoglein-2 (Dsg-2), a desmosomal protein is a candidate substrate of a transmembrane serine protease called matriptase. Present report is an experimental validation of this prediction. As demanded by our published method PNSAS, ‘Prediction of Natural Substrates from Artificial Substrate of Proteases’, (PLoS One. 2009 May 27;4(5):e5700), this enzyme-substrate pair shares a common subcellular distribution and the predicted cleavage site is accessible to the protease. Matriptase knock down cells showed enhanced immunoreactive Dsg-2 at cell surface and formed bigger cell clusters. When matriptase was mobilized from intracellular storage deposits to the cell surface, there was a decrease in the band intensity of Dsg-2 in plasma membrane fractions with a concomitant accumulation of a cleaved product in conditioned medium. Exogenous addition of pure, active recombinant matriptase decreased the surface levels of immunoreactive Dsg-2 while the levels of CD 44 and E cadherin were unaltered. Dsg-2 with a mutation at the predicted cleavage site is resistant to cleavage by matriptase. Thus Dsg-2 seems to be a functionally relevant physiological substrate of matriptase. Since breakdown of cell-cell contact is the first major event in invasion, this reciprocal relationship is likely to have a profound role in cancers of epithelial origin. Our algorithm has the potential to become an integral tool for discovering new protease-substrate pairs. Page heading: Matriptase cleaves Dsg-2, a desmosomal protein and alters phenotype of the cell.
Key words: Matriptase, algorithm, Dsg-2, cellular adhesion, invasion, epithelial cancers
Abbreviations used: PDB, Protein Data Bank; PNSAS, Prediction of Natural Substrates from Artificial Substrate of Proteases ; Dsg-2, Desmoglein-2; EMT, Epithelial Mesenchymal Transition; ECM, Extra Cellular Matrix; S1P, Sphingosine-1-phosphate; HEK 293 Human Embryonic Kidney 293; HCT-116 wt, Human Colonic Adenocarcinoma 116 wild type; DAPI, 4, 6-diamidino-2-phenylindole; DABCO, 1,4-diazabicyclo[2.2.2]octane; LSM, Laser Scanning Microscope; IF, Immunofluorescence; SASA, Solvent Accessible Surface Area; DOPE, Discrete Optimized Protein Energy; DIC, Differential interference contrast.
Biochemical Journal Immediate Publication. Published on 11 Jul 2012 as manuscript BJ20111432T
HIS
IS N
OT
TH
E V
ER
SIO
N O
F R
EC
OR
D -
see
doi
:10.
1042
/BJ2
0111
432
Acce
pted
Man
uscr
ipt
Licenced copy. Copying is not permitted, except with prior permission and as allowed by law.
© 2012 The Authors Journal compilation © 2012 Biochemical Society

Page | 2
INTRODUCTION: Proteases play a central role in cellular homeostasis and are responsible for the spatio-
temporal regulation of function. Many putative proteases have been recently identified through genomic approaches leading to a surge in global profiling attempts to characterize their natural substrates. In order to complement the ongoing efforts to identify physiologically relevant substrates of proteases and assess their cellular functions under normal and pathological conditions, we had recently proposed a novel prediction strategy [1]. We used sequence information from experimentally proven substrates of endoproteases and incorporated dual filters to identify the most likely candidates. These filters imposed a strong quantitative rule to assess the accessibility of a potential cleavage site and a qualitative colocalization rule which would ensure their likely hood of interaction. By using these criteria we had catalogued potential substrates of serine proteases from the Protein Data Bank (PDB) and the Uniprot. Identity of the substrates were used for functional annotation to reveal novel functions of the proteases [1]. We have developed a web based server for users to identify such cleavage sites on their query substrate http://www.actrec.gov.in/pi-webpages/Prasanna/index.htm.
Matriptase is a type II serine protease found in the membrane of epithelial cells [2]. Under physiological conditions, matriptase plays a crucial role in hair follicle development by processing profilaggrin to filaggrin monomers [3]. The matriptase-prostatin cascade, with matriptase acting upstream of prostatin has been found crucial in epithelial differentiation[4]. Matriptase also plays a crucial role in regulating the survival of developing T-lymphocytes in thymic microenvironment [5].Through its action on substrates, like pro-HGF/SF-1 and pro-PA [6,7,8,9] matriptase is likely to impart invasive properties to cancer cells. A potential association between matriptase deregulation and ras mediated carcinogenesis has been reported [10]
Matriptase is over expressed in many cancer tissues [11,12] like primary breast carcinomas [13,14], ovarian tumours of epithelial origin [15,16,17] and prostate cancer [18]. Clinico-pathological correlation between expression levels of matriptase and different grades of these tumours suggest that matriptase could be a good biomarker for diagnosis and treatment of malignant breast tumours, a favourable prognostic marker in ovarian cancer and in staging of human prostate adenocarcinoma [14, 15,16, 17, 18]. In vitro inhibition of matriptase prevented the growth of prostate and colon carcinoma cell lines with invasive properties [19]. Thus, a strong correlation exists between matriptase and cell invasive properties. In addition matriptase seems to possess strong tumorogenic potential. However the mechanism by which matriptase would mediate invasion remains unclear. Identification of novel substrates would help in correlating changes in expression levels, activity and the observed phenotype. Recently using our method called PNSAS [1] we had identified desmoglein-2 (Dsg-2) as a novel putative substrate of matriptase. Dsg-2 is a desmosomal protein which harbours a putative cleavage site for matriptase, LGRS (P3P2P1-P1’) between residues number 565 and 566.
Desmosomes are intercellular junctions that confer strong cell–cell adhesion properties. They are found in epithelia and cardiac muscles and are located at the cell membrane, where they act as anchors for intermediate filaments. The core of the desmosomal adhesive complex primarily consists of desmogleins (Dsg1-4) and desmocollins (Dsc1-3). These glycoproteins belong to the cadherin superfamily of proteins. Decrease in the levels of desmosomal proteins desmoplakin and plakophilin-1 in oral cancer tissues and decrease in desmoplakin in breast cancer tissues in relation to normal tissues emphasizes the importance of these cell junction proteins in disease progression and metastasis. This may be true of other tumour types like adenocarcinoma and oral squamous cell carcinomas as well [20,21,22,23,24] One of the
Biochemical Journal Immediate Publication. Published on 11 Jul 2012 as manuscript BJ20111432T
HIS
IS N
OT
TH
E V
ER
SIO
N O
F R
EC
OR
D -
see
doi
:10.
1042
/BJ2
0111
432
Acce
pted
Man
uscr
ipt
Licenced copy. Copying is not permitted, except with prior permission and as allowed by law.
© 2012 The Authors Journal compilation © 2012 Biochemical Society

Page | 3
mechanisms by which early stage tumour cells acquire an invasive phenotype is by undergoing epithelial to mesenchymal transition (EMT) This is accompanied by secretion of proteases which together results in disruption of adherent junctions and desmosomal integrity enabling cancer cells to dissociate from the primary tumour site and invade surrounding tissues [21]. Lately, Dsg-2 was reported to be a substrate of kallikerin-7, a chymotryptic-like serine protease, in pancreatic cancer cells [25].
Therefore the unique ability of tumour cells to invade and metastasize can be attributed to a fundamental de regulation between its pro adhesion components and the proteases that degrade the extra cellular matrix (ECM) and break cell-cell contact [26]. Since Dsg-2 is responsible for cell-cell adhesion and matriptase is an enzyme implicated in cell invasion, we asked if Dsg-2 would be a relevant physiological substrate of matriptase. Using evidence from cell biological and biochemical studies we show that Dsg-2 is indeed a physiologically relevant substrate of matriptase. Reciprocal levels of the enzyme and its cognate substrate at the cell surface results in altering the cell adhesion properties of HCT-116 cells implying a role for matriptase in cell invasion through its novel substrate Dsg-2.
MATERIALS & METHODS
Materials Chemicals and reagents. Formaldehyde solution was obtained from MERCK (catalog. no. 61783705001046). Sphingosine-1-phosphate (S1P) (S9666) was purchased from Sigma. S1P was prepared at a 10 µg/ml in HPLC grade methanol and final working solution was prepared at 50 ng/ml. Bovine Serum Albumin (BSA) (A7906), IPTG (I 6758) and Mitomycin C (M0503) were procured from Sigma. Ampicillin (RM 645) was obtained from Himedia. Cell culture conditions Experiments were conducted on human colonic carcinoma cell line HCT-116 wt, (a kind gift from Dr. Sorab Dalal), and human embryonic kidney 293 cells (HEK 293). These cells were cultured in Dulbecco’s minimal essential medium (DMEM) supplemented with 10 % fetal calf serum, 1.5 g/L sodium bicarbonate and 1 % antibiotic-antimycotic solution containing streptomycin, amphotericin B and penicillin. Antibodies Monoclonal anti-Dsg 2 antibody clones 6D8, clone AH12.2, recognizing extra cellular domain were purchased from Invitrogen (32-6100) and Santa Cruz Biotechnology (sc-80663) respectively. Rabbit anti-human matriptase antibody obtained from Bethyl laboratories (A300-221A) recognizes extracellular protease domain (residues 800 to 855) Secondary HRP labelled anti-mouse (NA 931) and anti-rabbit (NA 934) antibodies were procured from GE Healthcare. Primary rat monoclonal CD 44 antibody, Alexa 488 conjugated sheep anti-rat IgG antibody, anti-rat-HRP labelled secondary antibodies were kind gifts from Dr. R. Kalraiya and primary monoclonal anti E-cadherin antibody was gifted by Dr. S. N. Dalal. Total cell lysate preparation and subcellular fractionation Cell lysate from 95% confluent dishes of HCT-116 wt cells were trypsinized and washed twice with 1X PBS. Pellets were suspended in lysis buffer (50mM Tris pH 7.5, 125mM NaCl, 0.5% NP40 with 1X cocktail of protease inhibitors), briefly vortexed and incubated in ice for 30 min. Cell suspension was then centrifuged at 15000 rpm (Plastocraft Rota 4R rotor) for 15 min at 4ºC. Supernatant was collected and stored at -20ºC. Subcellular Protein Fractionation Kit (78840) by
Biochemical Journal Immediate Publication. Published on 11 Jul 2012 as manuscript BJ20111432T
HIS
IS N
OT
TH
E V
ER
SIO
N O
F R
EC
OR
D -
see
doi
:10.
1042
/BJ2
0111
432
Acce
pted
Man
uscr
ipt
Licenced copy. Copying is not permitted, except with prior permission and as allowed by law.
© 2012 The Authors Journal compilation © 2012 Biochemical Society

Page | 4
Pierce and Thermo Scientific were used for preparing membrane and cytosolic fractions. Amount of protein in cell lysates was estimated by Bradford method using BSA as standard. SDS-PAGE and Western Blot Cell lysates were mixed with 1X Lammelli’s sample buffer under non boiling conditions and proteins were separated on 10% SDS PAGE. To detect Dsg-2, samples were boiled for 5 minutes followed by electrophoresis on a 7.5% SDS PAGE. Proteins were transferred to PVDF membrane overnight at 4 ºC (Bradford wet transfer blotting apparatus set at 70V and 200mA). Unbound sites were blocked using 3% BSA in Tris-Buffer Saline (pH 7.4) containing 0.05% Tween 20 (TBST) for 2h. Incubation with primary antibody for matriptase (1:250) and desmoglein-2 AH12.2 clone (1:250) was performed for 2h at RT. Secondary antibodies for matriptase (1:5000) and desmoglein-2 (1:2500) were incubated for 1h at RT. Each incubation step was followed by six washes, each for 10 minutes, with TBST buffer. Blots were developed using ECL plus kit (GE Amersham RPN2132) on Kodak X-Ray films. Detection of shed ectodomain of Dsg-2 in the conditioned medium of HCT-116 wt cells One million HCT-116 cells were seeded in six 90-mm dishes and allowed to grow till they reached 98% confluence. Growth medium from confluent monolayers was removed and cells were subjected to overnight serum starvation. Cells were washed twice with 1X PBS and incubated in a serum free medium containing 50 ng/ml (S1P) for 2h at 37 ºC. Post incubation, conditioned media were collected, pooled and centrifuged at 400g for 5 minutes at 4°C and then concentrated using Amicon Ultra-4 centrifugal filter units, 10-kDa nominal molecular weight limit (Millipore, Billerica, MA), according to manufacturer's instructions. To detect shed Dsg-2 equal concentrations of control and S1P treated conditioned media were mixed with Lammelli’s buffer and immunoblotted as described above. Primary Dsg-2 AH12.2 clone (1:250) was incubated for 2h at RT followed by anti-mouse-HRP (1:2500) for 1h at RT. Immunofluorescence microscopy Cells were seeded onto autoclaved cover slips and grown to confluence. For S1P based experiments, cells were subjected to overnight serum starvation, followed by incubation with 50 ng/ml S1P for 2h. For siRNA mediated matriptase down regulation, cells were treated with 50 nM of siRNA against matriptase with 2.5 µl/ml of transfection reagent. Cells were incubated for 24 h and then siRNA containing media was replaced by normal complete medium. Cells were allowed to proliferate for another 24h and fixed (see below). To study the effect of exogenously added purified recombinant matriptase, HCT-116 wt cells were incubated with at 5 or 10 g/ml of proteolytically active (constituted in incomplete DMEM adjusted to pH 8.8) for 2h at 37°C. For immune staining cells were fixed and permeabilized (3.7 % formaldehyde for 20 min at RT and 0.05% Triton X for 10 min at RT, respectively). 3 % BSA was used to block nonspecific sites (37 ºC for 30 min). For co localization studies of matriptase with any of the following proteins-Dsg-2, CD44 or E-cadherin, fixed cells were stained with rabbit polyclonal anti-matriptase antibody (1:50 dilution in 3 % BSA in 1X PBS) and anti-desmoglien-2 antibody (both 6D8 clone and AH12.2 clone (1:50) or rat anti CD44 (1:50) or anti E-cadherin mouse (1:50) for 2h at 37ºC. Secondary antibodies were diluted to 1:100 in 3% BSA in 1X PBS and incubation was carried out for 1h at RT. Matriptase Alexa 488 (A11008, Invitrogen) or Alexa 568 (A11011, Invitrogen) conjugated goat anti-rabbit IgG antibody, Dsg-2 Alexa 568 and E-cadherin Alexa 568 conjugated goat anti-mouse IgG antibody (A11004, Invitrogen), and CD44 Alexa 488 conjugated sheep anti-rat IgG antibody were used as secondary antibody conjugates. Individual controls for each primary or the secondary antibodies were used. Each incubation step was followed by two washes with 1X PBS.
Biochemical Journal Immediate Publication. Published on 11 Jul 2012 as manuscript BJ20111432T
HIS
IS N
OT
TH
E V
ER
SIO
N O
F R
EC
OR
D -
see
doi
:10.
1042
/BJ2
0111
432
Acce
pted
Man
uscr
ipt
Licenced copy. Copying is not permitted, except with prior permission and as allowed by law.
© 2012 The Authors Journal compilation © 2012 Biochemical Society
Page | 5
To visualize nuclei and DNA, cells were stained with 1 μg/ml 4, 6-diamidino-2-phenylindole (DAPI) for 30 seconds at 37 ºC followed by 1 PBS wash. All cover slips were mounted in PBS containing 50% glycerol and 5mM DABCO (1, 4-diazabicyclo[2.2.2]octane). Confocal images were obtained using LSM 510 Meta Carl Zeiss Confocal system with Argon 488 nm and Helium/Neon 543 lasers. Images were acquired using Observer Z.1 microscope using plan-apochromat X 63 oil objective with 2x optical zoom. Processing of the acquired images, mean fluorescence intensity and overlap coefficient measurements were done using Laser Scanning Microscope (LSM) software Hanging Drop Assay Cell counts were adjusted to 20,000 cells/l in complete DMEM medium. They were suspended as 35l sized drops from the lid of a well (24 well plates) and incubated for 16 h at 37 ºC in 5% CO2 incubator. 1X PBS was used to maintain humidity. Post incubation each drop was mixed 5 times, fixed with 10 µl of 3% glutaraldehyde and aliquots were spread on autoclaved coverslips to be air dried [27]. Finally cover slips were mounted on slides as described before. Images of 5 random fields for each sample were taken with a plan-Neofluar lens (numerical aperture (NA) 0.3) at X10 objective on an upright AxioImager Z1 microscope (Carl Zeiss, Germany). The area of cell clusters was determined using Axiovision rel 4.5 software (Zeiss). Specific knock down of matriptase using small interfering RNA On target plus smart pool siRNA for matriptase (L-003712-00), SiGLO green transfection indicator (D-001630-01-05) siRNA and transfecting reagent (T2001-63) and 5x siRNA buffer (B-002000UB100) were purchased from Dharmacon Scientific. Lyophilized siRNAs were reconstituted and diluted in the requisite buffers in DEPC (D-5758, Sigma) treated autoclaved eppendorfs. siRNAs were reconstituted in 1X siRNA buffer and their integrity was confirmed by nanodrop spectrophotometer as per manufacturer’s instructions. Further dilutions were carried out with 1X siRNA buffer to obtain 20M and 100M stocks further diluted to 50 nM for reactions. Transfection efficiency of 77% was observed by FACS in SiGLO transfected HCT-116 wt, cells. For optimal knockdown of matriptase, 30,000 HCT-116 wt cells/ml were seeded on autoclaved coverslips or sterile 35 mm dishes. They were treated with 50 nM of matriptase siRNA in 2.5 µl/ml of transfection reagent. FITC labelled siRNA served as the negative control. After 24h incubation media was replaced by normal complete medium. Cells were allowed to proliferate for another 24h and harvested for western blotting, IF or cell adhesion assays. Constructs, expression, and purification of active protease domain of matriptase Matriptase cDNA in pcDNA 3.1 vector was a kind gift from Dr. CY Lin. The nucleotides corresponding to 596-855 amino acids (the autocatalytic and proteolytic domains of matriptase) were cloned using BamH1 and KpnI restriction enzymes with the forward (GGATCCGGCTCAGATGAGAAGGACTGC) and reverse primers (GGTACCTACCCCAGTGTTCTCTTTGAT) from Sigma. The PCR product was ligated to pRSETA vector and transformed in Escherichia coli Rosetta stain. Expression was induced with 100µM IPTG for 16 h at 24 ºC. Bacterial cells were harvested, suspended in lysis buffer (50mM Tris (pH 8.0), 500mM NaCl, 10% glycerol and 1mM BME), sonicated (10 cycles of 1 cycle per minute) and centrifuged at 20,000 rpm (Sorval RC 5 plus SS 34) for 30 min, supernatant was collected and pH was adjusted to 8. The catalytic domain of matriptase was purified using Ni NTA affinity chelating column (30210, Qiagen) followed by size exclusion chromatography (Superdex75, 16/60 column). Protein fractions were collected from 60 to 80 mL and samples were run on a 12% SDS –PAGE. Fractions containing a single band at 27 kDa corresponding to molecular weight of matriptase were pooled. Enzyme activity was monitored by incubating 120
Biochemical Journal Immediate Publication. Published on 11 Jul 2012 as manuscript BJ20111432T
HIS
IS N
OT
TH
E V
ER
SIO
N O
F R
EC
OR
D -
see
doi
:10.
1042
/BJ2
0111
432
Acce
pted
Man
uscr
ipt
Licenced copy. Copying is not permitted, except with prior permission and as allowed by law.
© 2012 The Authors Journal compilation © 2012 Biochemical Society

Page | 6
μg β-casein with 0.25g/μl of purified recombinant matriptase in 200 µl of reaction mixture (Tris 100 mM pH8.8 containing 0.5g/ml BSA). β-casein alone served as the control. Samples were incubated for 5 h and subjected to SDS PAGE (15%) analysis. Cloning of Dsg-2 and creation of R565A mutant During processing and trafficking of Dsg-2 en route to cell surface, the signal and propeptide sequences (1-50) will be cleaved. Therefore any tag at the N-termini will have to be fused after the 50th amino acid. How this will affect folding, processing, transport and yield of Dsg-2 at the membrane surface is hard to predict. Tag at the C-terminus will not be reflective of proteolysis since it would protrude into the cytoplasm and may remain even after cleavage at the extracellular domain. Therefore we chose to over express the wt (cDNA of hDsg-2 was a kind gift from Dr. Werner W. Franke) and mutant Dsg-2 in their native form. We used the pCMV 3X FLAG vector for cloning (Invitrogen) because a) we routinely use this vector in the lab for all mammalian protein expression; b) all proteins so far have exhibited excellent expression without alteration in localization or function; c) no toxicity has been observed so far. Wt Dsg-2 was cloned between NotI and BamHI restriction sites with forward primer. (AATGTGCGGCCGCGATGGCGCGGACGCGGGAC) and reverse primer (ATCGTCGGATCCTTAGGAGTAAGAATGCTGTA). When Dsg-2 is translated and processed the Flag tag will be removed and is unlikely to cause any problem associated with folding and trafficking. Site directed mutagenesis (R565A within LGRS) was performed using PCR based amplification with forward primer GAAAAAGCTTGGGGCGAGTGAAATTCAGTT and reverse primer AACTGAATTTCACTCGCCCCAAGCTTTTTCT. Over expression of wt and mutant Dsg-2 in HEK 293 cells HEK 293 cells were seeded on autoclaved coverslips and grown to 80 % confluence. They were transfected with any of the following: pCMV 10 3X FLAG construct containing no gene or, Dsg2 wt or mutant Dsg 2 (Arg565Ala) using calcium phosphate method. Cells were incubated for 48 h and treated with purified recombinant proteolytically active matriptase at 10 g/ml and processed for IF as previously described. Statistical analysis For each assay (where applicable) three independent experiments were performed. The P value for the intensity measurements was statistically analyzed using unpaired “t”test and ANNOVA of SPSS version 15 and Graphpad Prism software. All statistical data were calculated from three independent experiments.
Biochemical Journal Immediate Publication. Published on 11 Jul 2012 as manuscript BJ20111432T
HIS
IS N
OT
TH
E V
ER
SIO
N O
F R
EC
OR
D -
see
doi
:10.
1042
/BJ2
0111
432
Acce
pted
Man
uscr
ipt
Licenced copy. Copying is not permitted, except with prior permission and as allowed by law.
© 2012 The Authors Journal compilation © 2012 Biochemical Society

Page | 7
RESULTS
Predicted cleavage site KLGR~SEIQ in the ectodomain of Dsg-2 is accessible to matriptase Using our prediction program called ‘PNSAS’ we had identified Dsg-2 as one of the putative substrates of matriptase [1]. Both Dsg-2 and matriptase are cell surface proteins. Dsg-2 is very important for cell adhesiveness and breaching of cell cell contact is one of the early events in invasion and metastasis. Matriptase is an enzyme implicated in metastasis. Therefore we were curious to find if matriptase regulated the cell surface expression of Dsg-2 by cleaving it. If so changes in expression levels of active matriptase would reciprocally influence surface levels of Dsg-2. Information from Uniprot derived sequence of Dsg-2 Q14126 is schematically represented to indicate the topological distribution and glycosylation sites of different regions of the protein (Figure 1a). Matriptase cleavage site is indicated by the asterix symbol. P3P2P1-P1’ positions of the putative matriptase cleavage site in Dsg-2 are occupied by LGR-S with the scissile bond located between R565 and S566. Molecular sizes of the expected cleavage fragments are also indicated (Figure 1a). Since such a short sequence may be shared both by substrates and non substrates of a protease, our program imposes filters to narrow down on the most likely physiologically relevant candidate substrates. One of the filters uses surface accessibility which is computed from high resolution three dimensional structure of the protein. There is no structure for Dsg2- in the PDB. However this protein belongs to cadherin family (member 5) of proteins. The protein fold consists of four cadherin and six desmoglein repeats. The FASTA sequence of Dsg-2 (Uniprot) was submitted to Modbase [28]. The most probable structure was built using 1L3W, the X-ray structure of c-cadherin ectodomain. The target sequence 50-599 of Dsg-2 exhibited 34% sequence identity with 2-540 AA of c-cadherin. The cleavage site LGR-S (scissile bond between 565 and 566) is neither part of the desmoglein repeat or the cadherin domain. But the region is nevertheless clearly modelled and could be overlaid with the corresponding region from c-cadherin (not shown). We also independently modelled the structure of Dsg-2 using homology modelling against known structures in PDB. Mouse N-cadherin ectodomain with a 34% identity in the region between 51-601 and low DOPE score (Discrete Optimized Protein Energy) was modelled using modeller and the structure was verified using Ramachandran Plot. It is clear from Figure 1b that region LGRS is in a solvent exposed part of the modelled protein and the putative cleavage site is likely to be well accessible to the protease. The Solvent Accessible Surface Area (SASA) value of the octapeptide KLGRSEIQ (562-569) harbouring the putative cleavage site between 565 and 566 was calculated using Surface Racer 5 [29]. This value can be compared to a well accessible, known protease cleavage site in -antitrypsin (AAGA~MFLE; 1QLP; SASA value 811.6) which is cleaved by matrix metallo peptidase 7 to obtain the relative SASA value (rSASA) a quantitative index of accessibility. We had used this protein earlier as the reference point for calculating relative rSASA values of endo proteases [1]. Using this reference, the rSASA value for Dsg-2 cleavage site will be 0.78 indicating that the site must be readily accessible to matriptase
Colocalization of matriptase and Dsg-2 in HCT-116 wt cells In order for an enzyme to act on its substrate, both should be found in the same subcellular compartment. Therefore the second filter that is imposed by PNSAS is subcellular distribution. Both matriptase and its candidate substrate, Dsg-2 are transmembrane proteins. To ascertain the presence of these two proteins at the membrane surface and to analyze the extent to which
Biochemical Journal Immediate Publication. Published on 11 Jul 2012 as manuscript BJ20111432T
HIS
IS N
OT
TH
E V
ER
SIO
N O
F R
EC
OR
D -
see
doi
:10.
1042
/BJ2
0111
432
Acce
pted
Man
uscr
ipt
Licenced copy. Copying is not permitted, except with prior permission and as allowed by law.
© 2012 The Authors Journal compilation © 2012 Biochemical Society

Page | 8
they colocalize in HCT-116 wt cells, a double immunostaining was performed. Matriptase antibody that we chose exclusively recognizes an epitope in the extra cellular domain spanning the 615-822 AA regions. The monoclonal Dsg-2 (clone 6D8) antibody recognizes an epitope in the extracellular domain of Dsg-2 harbouring the predicted cleavage site. Using these antibodies for immunostaining we found that matriptase and Dsg-2 are present on the surface of HCT cells with an overlap coefficient of 0.9 indicating that 90% of matriptase and Dsg-2 are close to each other (Figure 2a and 2b; Table-1). Western blot of sub cellular fractions of HCT-116 wt with the same matriptase specific antibody and AH12.2 clone for Dsg-2 revealed two immunoreactive bands, in the membrane fractions of the cells. They correspond to ~80 kDa for matriptase and ~130kDa in the case of Dsg2 (Figure 2c). siRNA mediated downregulation of matriptase in HCT-116 wt cells results in more immunoreactive Dsg -2 at the cell surface In order to demonstrate that Dsg-2 is a candidate substrate for matriptase in the cellular context, we used siRNA to down regulate the enzyme in HCT-116 wt cells. If Dsg-2 was a substrate for matriptase then upon depletion of the enzyme, levels of immunoreactive Dsg-2 should increase. The antibody we chose is established to interact with the extracellular domain harbouring the cleavage site. After 48h of siRNA treatment, western blot showed 95% decrease in band intensity of matriptase confirming knock down (Figure 3a). Parallel immunofluorescence studies showed that, the intensity of matriptase signal in siRNA treated cells was diminished by 61% (P = 0.023) with a concomitant 55% increase in the intensity of Dsg-2 (P = 0.022) (Figure 3b and 3c). To verify that the up regulation of Dsg-2 on the cell surface was a specific response to matriptase down regulation, we checked levels of two other surface proteins CD44 and E-cadherin in knock down cells. Among these two proteins CD 44 carried a potential cleavage site QART while E-cadherin lacked any known cleavage site for matriptase. We observed no measurable differences in the levels of CD44 (Supplementary Figure S2a, S2b and S2c) and E-cadherin (Supplementary Figure S3a and S3b) between control and siRNA treated HCT-116 wt cells. Lack of cleavage of CD44 harbouring a putative cleavage site for matriptase is probably due to its inaccessibility or requirement for additional levels of regulation. We could not model the structure of CD44 due to lack of appropriate templates. It seems that cleavage of Dsg-2 by matriptase is a specific and well regulated process in the context of a cell. Matriptase down regulated cells form bigger cell clusters due to increased levels of Dsg-2 Dsg-2 is a key desmosomal protein involved in maintaining cell-cell contact via homophilic and heterophilic interactions with other desmosomal proteins of adjacent cells. Increase in the levels of Dsg-2 at the cell surface is expected to increase cell adhesiveness. If cleavage of Dsg-2 by matriptase was functionally relevant then one may expect increase in cell-cell contact in matriptase knock down cells mediated by Dsg-2. To test this possibility a hanging drop assay was performed [27]. As expected, cells treated with siRNA for matriptase formed bigger clusters (152.1 ± 38.3 μm) when compared to the control cells (21.7 ± 3.0 μm) (Figure 4a, 4b and 4c). This indicates that activity of matriptase is an important regulator of cell cell adhesion via Dsg-2 and this reciprocal relationship between the levels of matriptase and Dsg-2 could be one of the parameters that determine cell invasiveness.
Biochemical Journal Immediate Publication. Published on 11 Jul 2012 as manuscript BJ20111432T
HIS
IS N
OT
TH
E V
ER
SIO
N O
F R
EC
OR
D -
see
doi
:10.
1042
/BJ2
0111
432
Acce
pted
Man
uscr
ipt
Licenced copy. Copying is not permitted, except with prior permission and as allowed by law.
© 2012 The Authors Journal compilation © 2012 Biochemical Society

Page | 9
Exogenously added pure active recombinant matriptase decreases the levels of immunoreactive Dsg -2 on the cell surface of HCT-116 wt cells To further prove that matriptase alters levels of Dsg-2 at cell surface by cleaving it, a recombinant matriptase corresponding to 596-855 AA, was expressed, isolated and purified. A single band at 27 kDa corresponding to molecular weight of recombinant matriptase was observed (Figure 5a). This was confirmed to be matriptase by western blot (data not shown).
Purified matriptase was able to hydrolyze -casein, an unstructured protein used routinely to monitor the in vitro activity of endoproteases. Following 5h of incubation with matriptase distinct fragments of β-casein corresponding to ~17 kDa, 12 kDa, 11 kDa and 9 kDa were observed only in the presence of recombinant matriptase (Figure 5b). HCT-116 wt cells were then incubated with this proteolyticaly active pure recombinant matriptase at 5 and 10 g/ml concentrations for 2h and were processed for immunostaining. There was a marked reduction in the immunostaining of Dsg-2 in matriptase treated cells.. The
mean fluorescence intensity of Dsg-2 in cells treated with 5 and 10g/ml of matriptase was 55.7% (P = 0.006) and 34.1% (P = 0.032) respectively as compared to their untreated counterparts (Figure 6a, 6b and 6c). Unlike Dsg-2, no effect was seen in the intensity of CD44 and E-cadherin (supplementary figures S4a, S4b, S4c and S4d) levels. Cells without any matriptase at pH 7.5 and at 8.8 (optimum pH for matriptase activity) had comparable intensity values for Dsg-2 (Figure 6a) thereby confirming that pH per se did not induce any change in Dsg-2 expression. In both control and treated samples, the cells displayed fillopodial projections, which may be due to serum starvation. Mobilization of intracellular pools of matriptase to cell surface by Sphingosine-1-Phosphate (S1P) decreases surface levels of Dsg-2
Previous studies have reported that S1P caused accumulation and activation of matriptase at mammary epithelial cell-cell contacts [2, 3and 4]. In order to further establish specific cleavage of Dsg-2 by endogenous matriptase, we stimulated HCT-116 wt cells with S1P. Subsequent to treatment with S1P, there was a time dependent progressive increase in the levels of matriptase (48.7% increase post 2h of incubation (P = 0.01). There was a corresponding decrease in immunoreactive Dsg-2 amounting to 40.3% (P = 0.017) loss in intensity (Figure 7a and 7b). Under the same conditions, intensity values of Dsg-2 and matriptase of untreated cells remained essentially unaltered. These results confirm the reciprocal relationship between endogenous matriptase and Dsg-2 which reiterates that Dsg-2 is a physiologically relevant substrate of matriptase. To facilitate identification of the cleaved products, cell lysates, concentrated conditioned media, of control and S1P treated HCT-116 cells were immunoblotted. A distinct decrease in the band intensity of Dsg-2 in whole cell lysates was accompanied by concomitant appearance of a ~80 kDa fragment in the conditioned media of both the samples (Figure 7c). In correlation with the presence of more active matriptase at the cell surface, the 80 kDa band in the S1P treated cells exceeded that of the control cells. Based on previous reports, we envisaged that this fragment could be the shed ectodomain of Dsg-2 [25]. Appearance of the 80 kDa fragment in control cells is likely due to the normal ongoing cleavage of Dsg-2 at cell surface by matriptase which is further augmented by S1P treatment. Some amount of this product could be due to ongoing apoptosis-like mechanisms which might contribute to anikoisis or detachment of cells from the surface via cleavage of adhesion promoting proteins like Dsg-2.
Biochemical Journal Immediate Publication. Published on 11 Jul 2012 as manuscript BJ20111432T
HIS
IS N
OT
TH
E V
ER
SIO
N O
F R
EC
OR
D -
see
doi
:10.
1042
/BJ2
0111
432
Acce
pted
Man
uscr
ipt
Licenced copy. Copying is not permitted, except with prior permission and as allowed by law.
© 2012 The Authors Journal compilation © 2012 Biochemical Society
Page | 10
In order to verify the identity of the cleaved products, the Uniprot sequence of Dsg-2 was submitted to Expasy Protparam (http://www.expasy.org/tools/protparam.html) [30] and the theoretical molecular weights of the expected fragments were calculated. After removing both the pro and signal peptide sequences, the molecular weight of Dsg2 was calculated to be 116 kDa. However, an immune reactive product at 130 kDa, was consistently detected upon western blotting of the membrane fraction, indicating that this is probably the glycosylated form of Dsg-2. If matriptase cleaved at the predicted site within Dsg-2 (LGR-S) it would generate two fragments: a 50-565AA fragment of ~57 kDa (57661.9) which would harbour the epitope for AH12.2 antibody [31] and a 566-1119AA fragment of ~ 59 kDa (59020.3) (Figure 1a). Consistent with this estimate, coomassie staining of the S1P treated conditioned media revealed a product at ~58-60 kDa (Figure 7d) which was not immune reactive and an immune reactive band at a higher molecular weight ~80 kDa. This fragment with aberrant molecular weight may originate from the epitope harbouring segment 50-565AA and is likely to be glycosylated like the parent protein. Matriptase cleaves Dsg-2 at the scissile bond within LGR~S So far all results show that matriptase cleaves endogenous Dsg-2 and the cleavage most likely occurs within LGR(P1)~S (P1’). In order to unequivocally establish the specific cleavage site, it will be important to show that mutation at the predicted site in Dsg-2 prevents cleavage by matriptase. We decided to over express wt and mutant Dsg-2 (R565A) carrying a point mutation at Arginine 565 (R565A) and incubate them with purified matriptase. HEK 293 cells were transfected with wt and mutant Dsg-2 (R565A) under the constitutive promoter CMV. To confirm over expression, 48 h post transfection, cells were harvested for western blotting (Figure 8a) or were immunostained. Both western blot and immune fluorescence based mean fluorescence intensity measurement confirmed > 1.8 times over expression of Dsg-2 in wt and mutant populations. Transfected cells were incubated with 10 g/ml of proteolyticaly active recombinant matriptase, as described earlier. There was a marked reduction in the immunostaining of Dsg-2 in cells treated with matriptase. The mean fluorescence intensity of Dsg-2 in matriptase treated, untransfected cells was 44.9% (P < 0.0001), in cells over expressing wt Dsg-2 28.5% (P < 0.0001) and in cells over expressing mutant 75.6% (P < 0.0001) as compared to their respective untreated counterparts (Figure 8b). The 25% loss in Dsg-2 intensity in the mutant cells is probably due to matriptase mediated degradation of the endogenous Dsg-2 rather than proteolysis of mutant Dsg-2. Hence, we can safely conclude that the inability of matriptase to cleave mutant Dsg-2 could be due to the absence of Arg565 at the P1 position of the scissile bond in the LGRS sequence that is recognized and cleaved by matriptase. To eliminate observer bias, wider fields (152 um x152 um) accommodating a greater number of cells, were randomly chosen and acquired as ‘tile images’ using Zen software. Similar differences in Dsg-2 immunostaining between matriptase treated and untreated wt or mutant over expressing cells was observed. This corroborates our above results that the mutation affected the ability of matriptase to cleave Dsg-2 at the predicted site (data not shown). Our repeated attempts to recapitulate immunofluorescence results by western blotting were unsuccessful. We assume that, in light of excessive expression of wt and mutant Dsg-2 by the cells, 10 µg/ml of matriptase may be insufficient to bring about significant proteolysis that could be detected in cell lysates. Cells treated with matriptase exceeding 10µg/ml, underwent rapid and progressive detachment from the cover slips. To avoid compromising cell’s viability
Biochemical Journal Immediate Publication. Published on 11 Jul 2012 as manuscript BJ20111432T
HIS
IS N
OT
TH
E V
ER
SIO
N O
F R
EC
OR
D -
see
doi
:10.
1042
/BJ2
0111
432
Acce
pted
Man
uscr
ipt
Licenced copy. Copying is not permitted, except with prior permission and as allowed by law.
© 2012 The Authors Journal compilation © 2012 Biochemical Society

Page | 11
we decided to work with 10 µg/ml matriptase and employ immunofluorescence to simultaneously visualize and reliably quantify the subtle changes in the Dsg-2 expression levels in response to matriptase. Discussion We had recently proposed a method, called PNSAS, to predict putative substrates of endoproteases with the hope that it will be a useful complementary approach in the current day attempts towards global profiling of proteases and their substrates. Power of this method lies in the use of short peptide motifs which on one hand are big enough to provide specificity and on the other, small enough to cover a broad spectrum of proteins. In addition our method uses of physiologically relevant filters namely, accessibility in terms of folded structure of a protein and subcellular localization. We chose to test the ability of matriptase to cleave Dsg-2 a surface membrane protein important for cell adhesion. Breaching of cell-cell contact is an important event in the process of invasion and metastasis. By a systematic study which combined biochemical and cell biological techniques, we have clearly demonstrated that matriptase regulates steady state levels of Dsg-2. To do so we have used a) pure active recombinant matriptase added exogenously to cleave Dsg-2 at cell surface and b) altered the endogenous surface levels of active matriptase by either down regulating its expression or by mobilizing it from subcellular deposits. By combining IF and western blot analysis to monitor the levels of Dsg-2 under these different conditions, we show that decrease in levels of Dsg-2 is accompanied by what seems to be a cleaved product in the conditioned medium of treated cells. We were able to demonstrate the specificity of this cleavage process using CD44 and E-cadherin the levels of which were unaffected. In addition we overexpressed a mutant Dsg-2 (R565A) in which the predicted cleavage site at P1 (R565) was mutated to Ala. Upon exogenous addition of purified matriptase, HEK 293 cells expressing the mutant Dsg-2 retained significantly higher levels of the immunopositive Dsg-2 as compared to cells expressing wt Dsg-2 or the untransfected cells. These experiments in toto provide strong evidence that Dsg-2 is cleaved by matriptase at the predicted site. Our modelled structure shows that this is a distinct possibility since the predicted site is in a well accessible region. Presence of Dsg-2 with intact extracellular domain at the cell surface when matriptase was down regulated resulted in increased cell-cell contact and adhesiveness. Matriptase as briefed in the introduction is over expressed in many solid tumours of epithelial origin and is implicated in cell invasion and metastasis. However the mechanism by which matriptase can achieve these remains unclear. By demonstrating the ability of matriptase to regulate the levels of Dsg-2 we provide a plausible rationale for the role of matriptase in cell invasion and metastasis. Similar to our cell based studies, when the levels of matriptase go up Dsg-2 is likely to be cleaved more in tumour tissues by matriptase. This would provide a gain of function phenotype by which cells would increase their motility by breaking cell- cell contact creating an environment conducible for invasion and metastasis. Whether a similar inverse correlation in the levels of Dsg-2 and matriptase exits in cells of solid tumours and whether they are responsible for invasive properties remains to be seen. Since cell invasive properties are controlled by many factors it will be difficult to establish a direct correlation between the two phenomena. Nevertheless our results suggest such strong possibility exists and provides proof of principle that our prediction program is likely to get integrated in global profiling studies of in vivo substrates of endoproteases.
Acknowledgements
Biochemical Journal Immediate Publication. Published on 11 Jul 2012 as manuscript BJ20111432T
HIS
IS N
OT
TH
E V
ER
SIO
N O
F R
EC
OR
D -
see
doi
:10.
1042
/BJ2
0111
432
Acce
pted
Man
uscr
ipt
Licenced copy. Copying is not permitted, except with prior permission and as allowed by law.
© 2012 The Authors Journal compilation © 2012 Biochemical Society

Page | 12
The authors would like to acknowledge Vaishali, Tanuja and Jairaj of ACTREC Digital Imaging Centre, for their assistance in acquisition of LSM confocal images. Sadhana Kannan for help with statistical analysis. Funding This project was partially funded by Intramural Grant IRGB no. 2383 and by Lady Tata Memorial Trust. REFERENCES
1. Venkatraman, P., Balakrishnan, S., Rao, S., Hooda, Y. and Pol, S. (2009) A sequence and structure based method to predict putative substrates, functions and regulatory networks of endo proteases. PLoS One. 4, e5700
2. Oberst, M. D., Singh, B., Ozdemirli, M., Dickson, R. B., Johnson, M. D. and Lin C.Y. (2003) Characterization of Matriptase Expression in Normal Human Tissues. The Journal of Histochemistry & Cytochemistry. 51, 1017–1025
3. Pearton, D., Dale, B. A. and Presland, R. B. (2002) Functional analysis of the profilaggrin N-terminal peptide: identification of domains that regulate nuclear and cytoplasmic distribution. J. Investigative Dermatol. 119, 661-69
4. Netzel-Arnett, S., Currie, B. M., Szabo, R., Lin, C. Y., Chen, C., Chai, K. X., Antalis, T. M., Bugge, T. H. and List , K. (2006) Evidence for a matriptase-prostasin proteolytic cascade regulating terminal epidermal differentiation J. Biol. Chem. 281, 32941–32945
5. List, K., Haudebschild, C. C., Szabo, R., Chen, W. J., Wahl, S. M., Swaim, W., Engleholm, L. H., Behrendt, N. and Bugge, T. H. (2002) Matriptase/MT-SP1 is required for postnatal survival, epidermal barrier function, hair follicle development, and thymic homeostasis. Oncogene. 21, 3765-79
6. Takeuchi, T., Harris, J. L., Huang, W., Yan, K. W., Coughlin, S. R. and Craik, C. S. (2000) Cellular localization of membrane-type serine protease 1 and identification of protease activated receptor-2 and single-chain urokinase-type plasminogen activator as substrates. J. Biol. Chem. 275, 26333– 26342
7. Lee, S. L., Dickson, R. B. and Lin, C. Y. (2000) Activation of hepatocyte growth factor and urokinase/plasminogen activator by matriptase, an epithelial membrane serine protease. J. Biol. Chem. 275, 36720–36725
8. Uhland, K. (2006) Matriptase and its putative role in cancer. Cell. Mol. Life Sci. 63, 2968–2978
9. List, K. (2009) Matriptase: a culprit in cancer. Future Oncol. 5, 97-104 10. List, K., Szabo, R., Molinolo, A., Sriuranpong, V., Redeye, V., Murdock, T., Burke, B.,
Neilson, B. S., Gutkind, S. and Bugge, T. H. (2005) Deregulated matriptase causes ras-independent multistage carcinogenesis and promotes ras-mediated malignant transformation. Genes & Dev. 19, 1934–1950
11. Oberst, M. D., Anders, J., Xie, B., Singh, B., Ossandon, M., Johnson, M. D., Dickson, R. B. and Lin, C. Y. (2001) Matriptase and HAI-1 are expressed by normal and malignant epithelial cells in vitro and in vivo. Am J Pathol. 4, 1301-11
12. Jin, X., Hirosaki, T., Lin, C. Y., Dickson, R. B., Shouichi, H., Kitamura, H. and Miyazaki, K. (2005) Production of soluble matriptase by human cancer cell lines and cell surface activation of its zymogen by trypsin. J. Cell Biochem. 95, 632–647
13. Benaud, C. M., Oberst, M., Dickson, R. B. and Lin, C. Y. (2002) Deregulated activation of matriptase in breast cancer cells. Clin Exp Metastasis. 19, 639-49
Biochemical Journal Immediate Publication. Published on 11 Jul 2012 as manuscript BJ20111432T
HIS
IS N
OT
TH
E V
ER
SIO
N O
F R
EC
OR
D -
see
doi
:10.
1042
/BJ2
0111
432
Acce
pted
Man
uscr
ipt
Licenced copy. Copying is not permitted, except with prior permission and as allowed by law.
© 2012 The Authors Journal compilation © 2012 Biochemical Society

Page | 13
14. Jin, J. S., Cheng, T. F., Tsai, W. C., Sheu, L. F., Chiang, H. and Yu, C. P. (2007) Expression
of the serine protease, matriptase, in breast ductal carcinoma of Chinese women: correlation
with clinicopathological parameters. Histol Histopathol. 22, 305-9
15. Oberst, M. D., Johnson, M. D., Dickson, R. B., Lin, C. Y, Singh, B., Stewart, M., Williams, A., Naufussi-al, A., Smyth, J. F., Gabra, H. and Sellar, G. C. (2002) Expression of the serine protease matriptase and its inhibitor HAI-1 in epithelial ovarian cancer: correlation with clinical outcome and tumor clinicopathological parameters. Clin Cancer Res 8, 1101-7.
16. Tanimoto, H., Shingemasa, K., Tian, X., Gu, L., Beard, J. B., Sawasaki, T. and O’ Brien, T. J. (2005) Transmembrane serine protease TADG-15 (ST14/Matriptase/MT-SP1): expression and prognostic value in ovarian cancer. Br. J. Cancer 92, 278-83
17. Johnson, M. D., Oberst, M. D., Lin, C. Y. and Dickson, R. B. (2003) Possible role of matriptase in the diagnosis of ovarian cancer. Expert. Rev. Mol. Diagn. 3, 331-8
18. Saleem, M., Adhami, V. M., Zhong, W., Longley, B. J., Lin, C. Y., Dickson, R. B., Reagan-Shaw, S., Jarrard, D. F. and Mukhtar, H. (2006) A novel biomarker for staging human prostate adenocarcinoma: overexpression of matriptase with concomitant loss of its inhibitor, hepatocyte growth factor activator inhibitor-1. Cancer Epidemiol Biomarkers Prev .15, 217-27
19. Forbs, D, Thiel, S., Stella, M. C., Sturzebecher, A., Schweinitz, A., Steinmeter, T, Sturzebecher, J. and Uhland K. (2005) In vitro inhibition of matriptase prevents invasive growth of cell lines of prostate and colon carcinoma. Int. J. Oncol. 27, 1061-70
20. Chidgey, M. and Dawson, C. (2007) Desmosomes: a role in cancer? Br J Cancer 96, 1783-1787
21. Davies, E. L., Cochrane, R. A., Hiscox, S., Jiang,W. G., Sweetland, H. M. and Mansel, R. E. (1997) The role of desmoglein 2 and E-cadherin in the invasion and motility of human breast cancer cells. Int. J. Oncol. 11, 415-419
22. Narayana, N., Gist, J., Smith, T., Tylka, D., Trogdon, G. and Wahl, J. K. (2010) Desmosomal component expression in normal, dysplastic, and oral squamous cell carcinoma. Dermatol Res Pract. 2010; 2010:649731. Epub Mar 18
23. Hiraki, A. T., Shinohara, M., Ikebe, T., Nakamura, S., Kurahara, S. and Garrod, D. R. (1996) Immunohistochemical staining of desmosomal components in oral squamous cell carcinomas and its association with tumour behaviour. British Journal of Cancer. 73, 1491–1497
24. Krunic, A. L., Garrod, D. R., Madani, S., Buchanan, M. D. and Clark, R. E. (1998) Immunohistochemical staining for desmogleins 1 and 2 in keratinocytic neoplasms with squamous phenotype: actinic keratosis, keratoacanthoma and squamous cell carcinoma of the skin. British Journal of Cancer. 77, 1275–1279
25. Ramani, V. C., Hennings, L. and Haun, R. S. (2008) Desmoglein 2 is a substrate of kallikrein 7 in pancreatic cancer. BMC Cancer. 8, 373
26. Roycik, M.D, Fang, X. and Sang Q.-X. (2009) A fresh prospect of extracellular matrix hydrolytic enzymes and their substrates. Current Pharmaceutical Design. 15, 1295-1308–7
27. Kundu, S. T., Gosavi, P., Khapare, N., Patel, R., Hosing, A. S., Maru, G. B., Ingle, A., Decaprio, J. A. and Dalal, S. N. (2008) Plakophilin3 downregulation leads to a decrease in cell adhesion and promotes metastasis. Int J Cancer. 123, 2303-14
28. Pieper, U., Webb, B.M., Barkan, D.T., Schneidman-Duhovny, D., Schlessinger, A., Braberg, H., Yang, Z., Meng, E. C., Pettersen, E. F., Huang, C. C., Datta, R. S. Sampathkumar, P., Madhusudhan, M. S., Sjolander, K., Ferrin, T. E., Burley, S. K. and Sali, A. (2011) MODBASE, a database of annotated comparative protein structure models and associated resources. Nucleic Acids Res. 39, 465-474.
Biochemical Journal Immediate Publication. Published on 11 Jul 2012 as manuscript BJ20111432T
HIS
IS N
OT
TH
E V
ER
SIO
N O
F R
EC
OR
D -
see
doi
:10.
1042
/BJ2
0111
432
Acce
pted
Man
uscr
ipt
Licenced copy. Copying is not permitted, except with prior permission and as allowed by law.
© 2012 The Authors Journal compilation © 2012 Biochemical Society

Page | 14
29. Tsodikov, O. V., Record, M. T. Jr. and Sergeev, Y. V. (2002) A novel computer program for fast exact calculation of accessible and molecular surface areas and average surface curvature. J. Comput. Chem. 23, 600-609.
30. Gasteiger, E., Hoogland, C., Gattiker, A., Duvaud, S., Wilkins, M. R., Appel, R. D. and Bairoch, A. (2005) Protein Identification and Analysis Tools on the ExPASy Server. In: J.M. Walker (Ed). The proteomics protocols handbook. Humana Press. 2nd Edition 571-607
31. Nava, P., Laukoetter, M. G., Hopkins, A. M., Laur, O., Gerner-Smidt, K., Green, K. J., Parkos, C. A. and Nusrat, A. (2007) Desmoglein-2: A novel regulator of apoptosis in the intestinal epithelium. Mol. Biol. Cell 18, 4565–78
Figure Legends: Figure 1 Presence of a predicted matriptase specific cleavage site on Dsg2 and its accessibility. (a) Topology of Dsg-2 and expected size of the matriptase generated products. (b) Dsg-2 structure was modelled based on its homology to cadherin. Residues 562-569 harbouring the predicted cleavage site between R565-S566 (P1-P1’) are represented as sticks. Figure 2. Detection and colocalization of matriptase and Dsg-2 on the surface of HCT-116 wt cells. (a) Double immunolabeling was performed using respective antibodies specific to the extracellular domain of matriptase and Dsg-2. (b) The merged confocal micrograph shows an overlap coefficient of 0.9 (Bar 5 µm). Data is representative of three independent experiments. (c) Western blot of sub cellular fractions of HCT-116 wt cells showing the presence of Dsg-2 (AH 12.2 clone ~130 kDa) and matriptase (~80 kDa) in membrane fractions. Lane 1 is cytosolic fraction and Lane 2 is membrane fraction. Figure 3. Effect of down regulation of matriptase on immune reactivity of cell surface Dsg-2 in HCT-116 wt cells. (a) Upper panel shows western blot of control and matriptase siRNA treated cell lysates. Cell lysates from control (Lane 1) and matriptase siRNA treated HCT-116 wt cells (Lane 2) were probed for matriptase (~80 kDa) expression. Lower panel shows coomassie stained PVDF membrane demonstrating equal loading of samples. (b) Graphical representation of the mean fluorescence intensities of Dsg-2 and matriptase in control and matriptase siRNA treated cells. Mean fluorescence intensities were measured using LSM software. 50 cells were chosen at random. .
Figure 4. Effect of down regulation of matriptase on cell-cell adhesion. (a) DIC image of cells in both control and matriptase knockdown cells at X20 magnification. (b) Upper panel shows western blot of control and matriptase siRNA treated cell lysates. Cell lysates from control (Lane 1), 50 nM matriptase treated siRNA (Lane 2) and 100 nM treated siRNA (Lane 3) HCT-116 wt cells were probed for matriptase (~80 kDa) expression. (c) Graphical representation of the cluster size in control and HCT-116 cells treated with 50 and 100nM of siRNA against matriptase. > 5 fields were chosen at random.
Figure 5. Purification of recombinant matriptase and its effect on β-casein degradation. (a) 12% SDS PAGE showing protein profile of matriptase during purification. Samples from Ni NTA (Lane 1), Sephadex S200 fraction (Lane 2) and prestained marker (Lane 3) were loaded. (b) Degradation of β-casein by purified recombinant matriptase. Samples from β-casein incubated with matriptase for 0 h (Lane 1),for 5 h (Lane 2) and prestained marker (Lane 3) were
Biochemical Journal Immediate Publication. Published on 11 Jul 2012 as manuscript BJ20111432T
HIS
IS N
OT
TH
E V
ER
SIO
N O
F R
EC
OR
D -
see
doi
:10.
1042
/BJ2
0111
432
Acce
pted
Man
uscr
ipt
Licenced copy. Copying is not permitted, except with prior permission and as allowed by law.
© 2012 The Authors Journal compilation © 2012 Biochemical Society

Page | 15
run on 15% SDS PAGE. Image is a composite presentation of samples run in different wells of the same gel, as shown by the lines dividing the lanes.
Figure 6. Effect of recombinant matriptase on the immunoreactivity of Dsg-2 at cell surface of HCT-116 wt cells. Difference in immunoreactive levels of Dsg-2 in control and cells treated with pure matriptase was monitored using IF; (a) Dsg-2 in control HCT-116 wt cells incubated in serum free DMEM at pH 7.5 and at pH 8.8. (b) HCT-116 wt cells treated with 5 μg/ml and 10 μg/ml of pure matriptase (Bar 5 µm). (c) Graphic representation of mean fluorescence intensity of Dsg-2 (measured as described earlier) in control and matriptase treated HCT-116 cells.
Figure 7. Effect of S1P on the relative levels of cell surface matriptase and Dsg-2 in HCT-116 wt cells. (a) Graphical representation of the mean fluorescence intensities of Dsg-2 and matriptase in control and 50ng/ml S1P treated cells. Mean fluorescence intensities were measured as before. (b) Upper panel shows western blot of conditioned media and lysates of control and cells treated with S1P. Conditioned media from S1P treated cells (Lane 1) and control cells (Lane 2), lysates from S1P treated cells (Lane 3) and control cells (Lane 4) were probed for Dsg-2 expression. Lower panel shows the coomassie stained PVDF membrane demonstrating equal loading of samples. (c) Coomassie staining of pooled conditioned media of control and 50ng/ml S1P treated HCT-116 wt cells. Fragments corresponding to cleaved products at ~80 kDa and ~58-60 kDa regions can be seen. Prestained protein marker is in (Lane 1), conditioned medium of control cells (Lane 2) and conditioned medium of S1P treated HCT-116 cells (Lane 3). Figure 8: Effect of recombinant matriptase on the immunoreactivity of Dsg-2 in HEK 293 cells over expressing wt or mutant (R565A) Dsg-2. (a) Upper panel shows western blot of lysates of HEK 293 control, wt and mutant (R565A) Dsg-2 over expressing cells. Lysates from untransfected control cells (Lane 1), wt Dsg-2 over expressing cells (Lane 2) and mutant Dsg-2 over expressing cells (Lane 3) were probed for Dsg-2 expression. Lower panel shows coomassie stained PVDF membrane demonstrating equal loading of samples. Image is a composite presentation of samples run in different wells of the same gel, as shown by the lines dividing the lanes. (b) Difference in immunoreactive levels of Dsg-2 in control and cells treated with pure matriptase was monitored by IF. Upper panel shows untreated control, wt and mutant Dsg-2 over expressing HEK 293 cells and lower panel shows the corresponding cells treated with 10 µg/ml of pure matriptase. (Bar 10 µm). (c) Graphic representation of mean fluorescence intensity (measured as before) of Dsg-2 in untreated and matriptase treated control, wt and mutant Dsg-2 over expressing HEK 293 cells.
Biochemical Journal Immediate Publication. Published on 11 Jul 2012 as manuscript BJ20111432T
HIS
IS N
OT
TH
E V
ER
SIO
N O
F R
EC
OR
D -
see
doi
:10.
1042
/BJ2
0111
432
Acce
pted
Man
uscr
ipt
Licenced copy. Copying is not permitted, except with prior permission and as allowed by law.
© 2012 The Authors Journal compilation © 2012 Biochemical Society

Page | 16
Biochemical Journal Immediate Publication. Published on 11 Jul 2012 as manuscript BJ20111432T
HIS
IS N
OT
TH
E V
ER
SIO
N O
F R
EC
OR
D -
see
doi
:10.
1042
/BJ2
0111
432
Acce
pted
Man
uscr
ipt
Licenced copy. Copying is not permitted, except with prior permission and as allowed by law.
© 2012 The Authors Journal compilation © 2012 Biochemical Society

Table 1. Colocalization of matriptase and Dsg-2 in HCT-116 wt cells.
Double Immunostaining for Matriptase and Dsg-2 was carried out to ascertain their
colocalization on the cell surface following protocol described in materials and methods. The
extent of their co localization was measured as an overlap coefficient of their individual
intensities using LSM software. An overlap Coefficient of 0.9 is indicative of 90% colocalization
between matriptase and Dsg-2.
Colocalization coefficient CH3-
T1
Colocalization coefficient CH3-
T3
Weighted Colocalization
Coefficient CH3-T1
Weighted Colocalization
Coefficient CH3-T3
Overlap Coefficient
0.186 0.191 0.182 0.198 0.9
Biochemical Journal Immediate Publication. Published on 11 Jul 2012 as manuscript BJ20111432T
HIS
IS N
OT
TH
E V
ER
SIO
N O
F R
EC
OR
D -
see
doi
:10.
1042
/BJ2
0111
432
Acce
pted
Man
uscr
ipt
Licenced copy. Copying is not permitted, except with prior permission and as allowed by law.
© 2012 The Authors Journal compilation © 2012 Biochemical Society
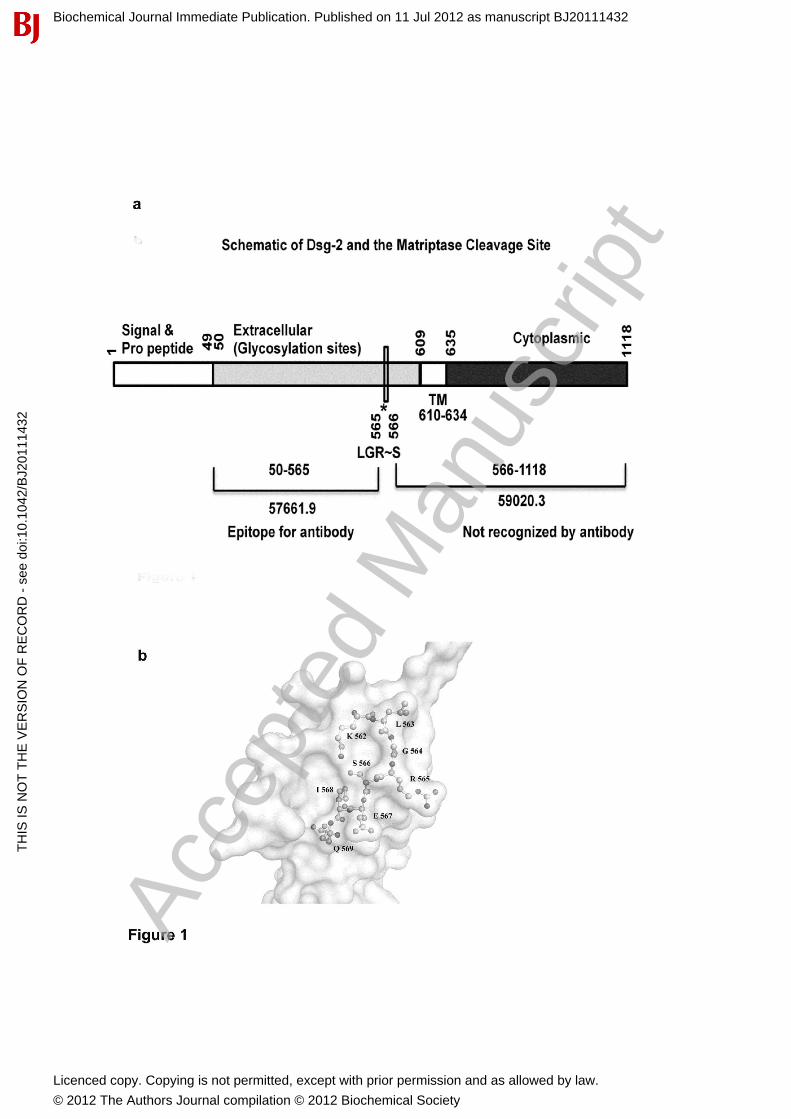
Related Documents