pharmaceuticals Article Bioanalytical Assay Development and Validation for the Pharmacokinetic Study of GMC1, a Novel FKBP52 Co-chaperone Inhibitor for Castration Resistant Prostate Cancer Oscar Ekpenyong 1,2 , Candace Cooper 1,3 , Jing Ma 1 , Naihsuan C. Guy 4 , Ashley N. Payan 4 , Fuqiang Ban 5 , Artem Cherkasov 5 , Marc B. Cox 4 , Dong Liang 1 and Huan Xie 1, * 1 Department of Pharmaceutical Sciences, College of Pharmacy and Health Sciences, Texas Southern University, Houston, TX 77004, USA; [email protected] (O.E.); [email protected] (C.C.); [email protected] (J.M.); [email protected] (D.L.) 2 Department of Pharmacokinetics, Pharmacodynamics & Drug Metabolism, Merck & Co., Inc., South San Francisco, CA 94080, USA 3 Technical Services, Pfizer & Co., Inc., McPherson, KS 67460, USA 4 Department of Biological Sciences, University of Texas at El Paso, El Paso, TX 79968, USA; [email protected] (N.C.G.); [email protected] (A.N.P.); [email protected] (M.B.C.) 5 Vancouver Prostate Centre, University of British Columbia, 2660 Oak Street, Vancouver, BC V6H 3Z6, Canada; [email protected] (F.B.); [email protected] (A.C.) * Correspondence: [email protected]; Tel.: +1-713-313-4340 Received: 5 October 2020; Accepted: 9 November 2020; Published: 13 November 2020 Abstract: Background: GMC1 (2-(1H-benzimidazol-2-ylsulfanyl)-N-[(Z)-(4-methoxyphenyl) methylideneamino] acetamide) effectively inhibits androgen receptor function by binding directly to FKBP52. This is a novel mechanism for the treatment of castration resistant prostate cancer (CRPC). Methods: an LC-MS/MS method was developed and validated to quantify GMC1 in plasma and urine from pharmacokinetics studies in rats. An ultra-high-performance liquid chromatography (UHPLC) system equipped with a Waters XTerra MS C18 column was used for chromatographic separation by gradient elution with 0.1% (v/v) formic acid in water and methanol. A Sciex 4000 QTRAP ® mass spectrometer was used for analysis by multiple reaction monitoring (MRM) in positive mode; the specific ions [M+H] + m/z 340.995 → m/z 191.000 and [M+H] + m/z 266.013 → m/z 234.000 were monitored for GMC1 and internal standard (albendazole), respectively. Results: GMC1 and albendazole had retention times of 1.68 and 1.66 min, respectively. The calibration curves for the determination of GMC1 in rat plasma and urine were linear from 1–1000 ng/mL. The LC-MS/MS method was validated with intra- and inter-day accuracy and precision within the 15% acceptance limit. The extraction recovery values of GMC1 from rat plasma and urine were greater than 95.0 ± 2.1% and 97.6 ± 4.6%, respectively, with no significant interfering matrix effect. GMC1 is stable under expected sample handling, storage, preparation and LC-MS/MS analysis conditions. Conclusions: Pharmacokinetic evaluation of GMC1 revealed that the molecule has a biexponential disposition in rats, is distributed rapidly and extensively, has a long elimination half-life, and appears to be eliminated primarily by first order kinetics. Keywords: GMC1; bioanalytical method; LC-MS/MS; pharmacokinetics; prostate cancer; drug development Pharmaceuticals 2020, 13, 386; doi:10.3390/ph13110386 www.mdpi.com/journal/pharmaceuticals

Welcome message from author
This document is posted to help you gain knowledge. Please leave a comment to let me know what you think about it! Share it to your friends and learn new things together.
Transcript
pharmaceuticals
Article
Bioanalytical Assay Development and Validation forthe Pharmacokinetic Study of GMC1, a Novel FKBP52Co-chaperone Inhibitor for Castration ResistantProstate Cancer
Oscar Ekpenyong 1,2 , Candace Cooper 1,3, Jing Ma 1, Naihsuan C. Guy 4, Ashley N. Payan 4,Fuqiang Ban 5, Artem Cherkasov 5, Marc B. Cox 4 , Dong Liang 1 and Huan Xie 1,*
1 Department of Pharmaceutical Sciences, College of Pharmacy and Health Sciences,Texas Southern University, Houston, TX 77004, USA; [email protected] (O.E.);[email protected] (C.C.); [email protected] (J.M.); [email protected] (D.L.)
2 Department of Pharmacokinetics, Pharmacodynamics & Drug Metabolism, Merck & Co., Inc.,South San Francisco, CA 94080, USA
3 Technical Services, Pfizer & Co., Inc., McPherson, KS 67460, USA4 Department of Biological Sciences, University of Texas at El Paso, El Paso, TX 79968, USA;
[email protected] (N.C.G.); [email protected] (A.N.P.); [email protected] (M.B.C.)5 Vancouver Prostate Centre, University of British Columbia, 2660 Oak Street, Vancouver, BC V6H 3Z6,
Canada; [email protected] (F.B.); [email protected] (A.C.)* Correspondence: [email protected]; Tel.: +1-713-313-4340
Received: 5 October 2020; Accepted: 9 November 2020; Published: 13 November 2020�����������������
Abstract: Background: GMC1 (2-(1H-benzimidazol-2-ylsulfanyl)-N-[(Z)-(4-methoxyphenyl)methylideneamino] acetamide) effectively inhibits androgen receptor function by binding directly toFKBP52. This is a novel mechanism for the treatment of castration resistant prostate cancer (CRPC).Methods: an LC-MS/MS method was developed and validated to quantify GMC1 in plasma andurine from pharmacokinetics studies in rats. An ultra-high-performance liquid chromatography(UHPLC) system equipped with a Waters XTerra MS C18 column was used for chromatographicseparation by gradient elution with 0.1% (v/v) formic acid in water and methanol. A Sciex 4000QTRAP® mass spectrometer was used for analysis by multiple reaction monitoring (MRM) inpositive mode; the specific ions [M+H]+ m/z 340.995 → m/z 191.000 and [M+H]+ m/z 266.013 →m/z 234.000 were monitored for GMC1 and internal standard (albendazole), respectively. Results:GMC1 and albendazole had retention times of 1.68 and 1.66 min, respectively. The calibrationcurves for the determination of GMC1 in rat plasma and urine were linear from 1–1000 ng/mL.The LC-MS/MS method was validated with intra- and inter-day accuracy and precision within the15% acceptance limit. The extraction recovery values of GMC1 from rat plasma and urine were greaterthan 95.0 ± 2.1% and 97.6 ± 4.6%, respectively, with no significant interfering matrix effect. GMC1 isstable under expected sample handling, storage, preparation and LC-MS/MS analysis conditions.Conclusions: Pharmacokinetic evaluation of GMC1 revealed that the molecule has a biexponentialdisposition in rats, is distributed rapidly and extensively, has a long elimination half-life, and appearsto be eliminated primarily by first order kinetics.
Keywords: GMC1; bioanalytical method; LC-MS/MS; pharmacokinetics; prostate cancer;drug development
Pharmaceuticals 2020, 13, 386; doi:10.3390/ph13110386 www.mdpi.com/journal/pharmaceuticals
Pharmaceuticals 2020, 13, 386 2 of 16
1. Introduction
Androgen receptor (AR)-regulated genes contribute to the initiation and progression of prostatecancer (PCa). Signaling via the AR axis is considered to be important in facilitating prostatecarcinogenesis, although the precise mechanisms driving PCa are still being elucidated [1]. Current PCatherapies antagonize androgen receptors (AR) by competing for its ligand binding site [1–4]. However,these treatment options become ineffective once androgen-dependence is lost and PCa eventuallymoves into a castration resistance state [5–7]. Thus, there is an urgent need for new anti-androgenswith entirely novel mechanisms of action. The 52 kDa FK506 binding protein (FKBP52) is a knownpositive regulator of AR as well as glucocorticoid (GR) and progesterone receptors (PR) and β-catenin.As such, FKBP52 represents a potential therapeutic target in PCa [2,8–13]. A series of small moleculesthat selectively inhibit FKBP52, mediated by enhancement of AR signaling by targeting the AR bindingfunction 3 surface (BF3), have been identified and characterized [2,9,14,15]. More recently, GMC1,a new chemical entity, was also identified through structure-based in silico screening as a potentialligand for the FKBP52 peptidyl-prolyl-cis-trans-isomerase (PPIase) pocket [11,13,16]. It has been furtherdemonstrated that GMC1 effectively inhibits AR and GR activity in a variety of cell lines [16]. The IC50
of GMC1 in MDA-kb2 cell AR reporter assays is 8.83 ± 3.55 µM, and in 52KO MEFs AR reporterassays is 0.66 ± 0.48 µM. Compared to previously reported FKBP52 inhibitors, GMC1 is predictedto simultaneously attenuate a variety of targets implicated in prostate cancer. This lead moleculeeffectively inhibits receptor activity in the low to mid micro-molar concentrations, AR-dependentprostate-specific antigen (PSA) secretion from a variety of prostate cancer cells, and 22Rv1 prostatecancer cell proliferation [2,16].
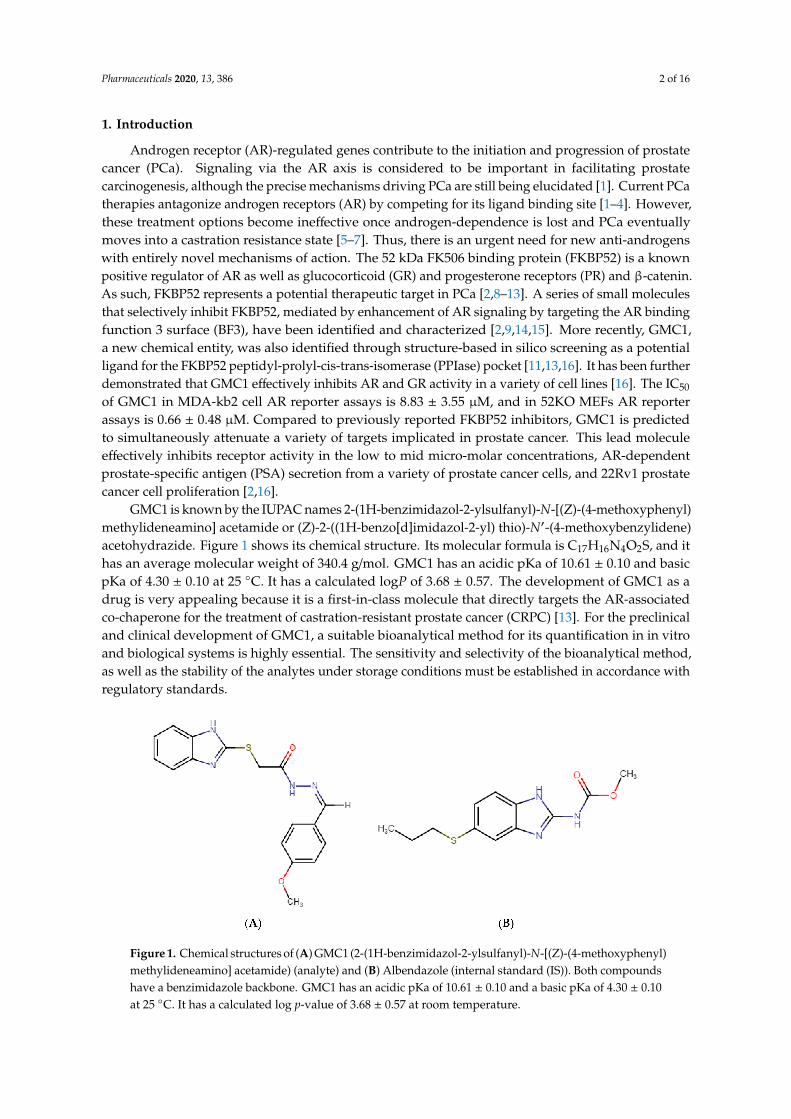
GMC1 is known by the IUPAC names 2-(1H-benzimidazol-2-ylsulfanyl)-N-[(Z)-(4-methoxyphenyl)methylideneamino] acetamide or (Z)-2-((1H-benzo[d]imidazol-2-yl) thio)-N′-(4-methoxybenzylidene)acetohydrazide. Figure 1 shows its chemical structure. Its molecular formula is C17H16N4O2S, and ithas an average molecular weight of 340.4 g/mol. GMC1 has an acidic pKa of 10.61 ± 0.10 and basicpKa of 4.30 ± 0.10 at 25 ◦C. It has a calculated logP of 3.68 ± 0.57. The development of GMC1 as adrug is very appealing because it is a first-in-class molecule that directly targets the AR-associatedco-chaperone for the treatment of castration-resistant prostate cancer (CRPC) [13]. For the preclinicaland clinical development of GMC1, a suitable bioanalytical method for its quantification in in vitroand biological systems is highly essential. The sensitivity and selectivity of the bioanalytical method,as well as the stability of the analytes under storage conditions must be established in accordance withregulatory standards.
Figure 1. Chemical structures of (A) GMC1 (2-(1H-benzimidazol-2-ylsulfanyl)-N-[(Z)-(4-methoxyphenyl)methylideneamino] acetamide) (analyte) and (B) Albendazole (internal standard (IS)). Both compoundshave a benzimidazole backbone. GMC1 has an acidic pKa of 10.61 ± 0.10 and a basic pKa of 4.30 ± 0.10at 25 ◦C. It has a calculated log p-value of 3.68 ± 0.57 at room temperature.
Pharmaceuticals 2020, 13, 386 3 of 16
Herein, we report the development and validation of a simple, sensitive, and reproducible liquidchromatography-tandem mass spectrometry (LC-MS/MS) method for quantification of GMC1 in ratplasma and urine. We established the specificity, sensitivity and linearity, reproducibility, recovery,and dilution integrity of the assay in accordance with the United States Food and Drug Administration(FDA) bioanalytical method validation guidance [17]. Additionally, we assessed the stability of theanalyte in samples under anticipated storage and handling conditions, as well as sample processingand analytical (LC-MS/MS) procedures. Following an in vivo pharmacokinetic study of GMC1 in adultmale Sprague-Dawley (SD) rats, the fully validated assay method was deployed to determine theconcentration of GMC1 in plasma and urine samples.
2. Results and Discussion
Validated analytical methods for quantification of drugs, their metabolites, and biomarkers arecritical for successful drug discovery undertakings [4]. Herein, we report the development and fullvalidation of a rapid, sensitive, and reproducible LC-MS/MS method for quantification of GMC1in plasma and urine samples. The pharmacokinetic disposition of GMC1 in rats was subsequentlyevaluated using this analytical method. Our analytical method will therefore be very useful for studiesrelated to the preclinical and clinical development of GMC1.
2.1. Chromatography and MS Conditions
The mobile phase, chromatographic column, column temperature, and source parameters wereoptimized for the signal intensity and peak shape. Symmetrical peak shape and optimal peak intensitywere obtained with a Waters® Xterra MS C18 column (2.1× 50 mm, 3.5 µm), and 0.1% (v/v) formic acid inwater and 0.1% (v/v) formic acid in methanol as aqueous and organic phases, respectively. Methanol asthe organic phase yielded a better response compared to acetonitrile. Electrospray ionization (ESI)in positive mode was better suited for this analyte compared to atmospheric chemical ionization(APCI) and negative mode. Ion source parameters were optimized until the best intensity for thedetermination of the analyte was attained. The intensity of the analyte in samples prepared in mobileor organic phase containing formic acid seemed to diminish over time compared to samples preparedwithout any modifiers or additives. Hence standard solutions and protein precipitation solvent weredevoid of formic acid.
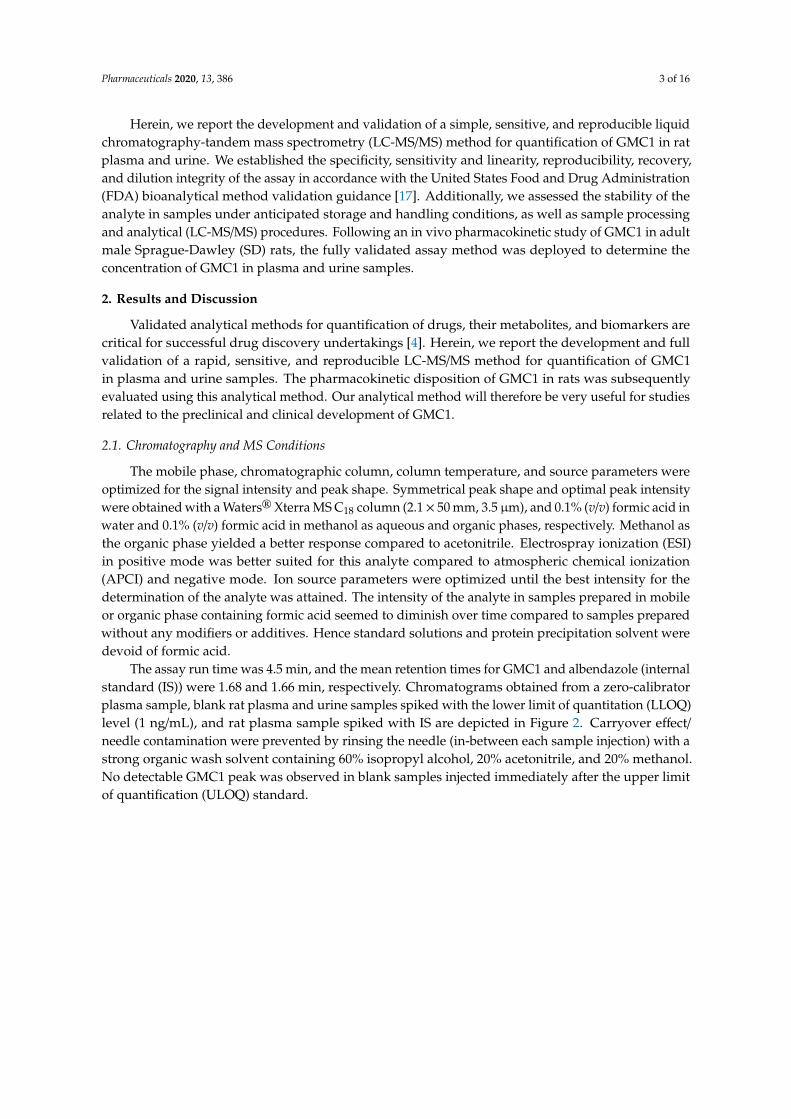
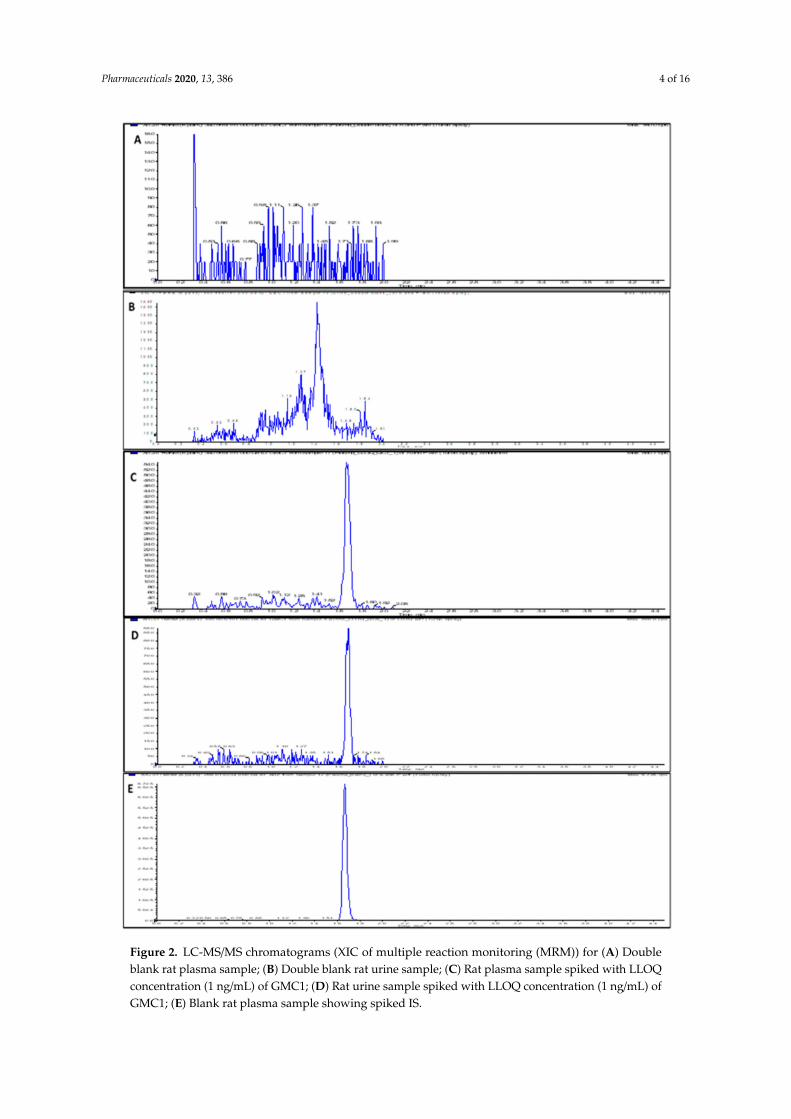
The assay run time was 4.5 min, and the mean retention times for GMC1 and albendazole (internalstandard (IS)) were 1.68 and 1.66 min, respectively. Chromatograms obtained from a zero-calibratorplasma sample, blank rat plasma and urine samples spiked with the lower limit of quantitation (LLOQ)level (1 ng/mL), and rat plasma sample spiked with IS are depicted in Figure 2. Carryover effect/needle contamination were prevented by rinsing the needle (in-between each sample injection) with astrong organic wash solvent containing 60% isopropyl alcohol, 20% acetonitrile, and 20% methanol.No detectable GMC1 peak was observed in blank samples injected immediately after the upper limitof quantification (ULOQ) standard.
Pharmaceuticals 2020, 13, 386 4 of 16
Figure 2. LC-MS/MS chromatograms (XIC of multiple reaction monitoring (MRM)) for (A) Doubleblank rat plasma sample; (B) Double blank rat urine sample; (C) Rat plasma sample spiked with LLOQconcentration (1 ng/mL) of GMC1; (D) Rat urine sample spiked with LLOQ concentration (1 ng/mL) ofGMC1; (E) Blank rat plasma sample showing spiked IS.
Pharmaceuticals 2020, 13, 386 5 of 16
2.2. Method Validation
2.2.1. Specificity and Selectivity
The specificity and selectivity of the assay (assessed to preclude interference from componentsof biological matrices and cross-reacting molecules) was evaluated by analyzing replicates of blanksamples from different sources. As shown in Figure 2, the blank and zero calibrator samples weredevoid of interfering signal at the observed retention times for both the analyte and internal standard.The instrument response for IS in blank rat plasma and urine samples was 2.9% and 3.3% of the averageIS response for the standards and quality controls (QCs). In addition to specificity and selectivity,the observed IS response also indicates that the internal standard is stable when spiked into theprecipitant solvent.
2.2.2. Sensitivity and Linearity
The linear range for calibration curves for the determination of GMC1 in rat plasma and urinewas from 1–1000 ng/mL, respectively, and the co-efficient for linear regression was accepted if greaterthan 0.99. The equations for the calibration curves in plasma and urine, respectively, were y = 9.89e−4x+ 1.01e−4 and y = 1.54e−3x + 7.99e−4. The limit of detection (LOD) was based on a signal-to-noise (S/N)ratio of 3:1, while the LLOQ was selected based on an S/N ratio of at least 5:1. The measured LLOQ(1 ng/mL) of GMC1 in rat plasma and urine gave an S/N ratio much greater than five.
2.2.3. Precision, Accuracy and Dilution Integrity
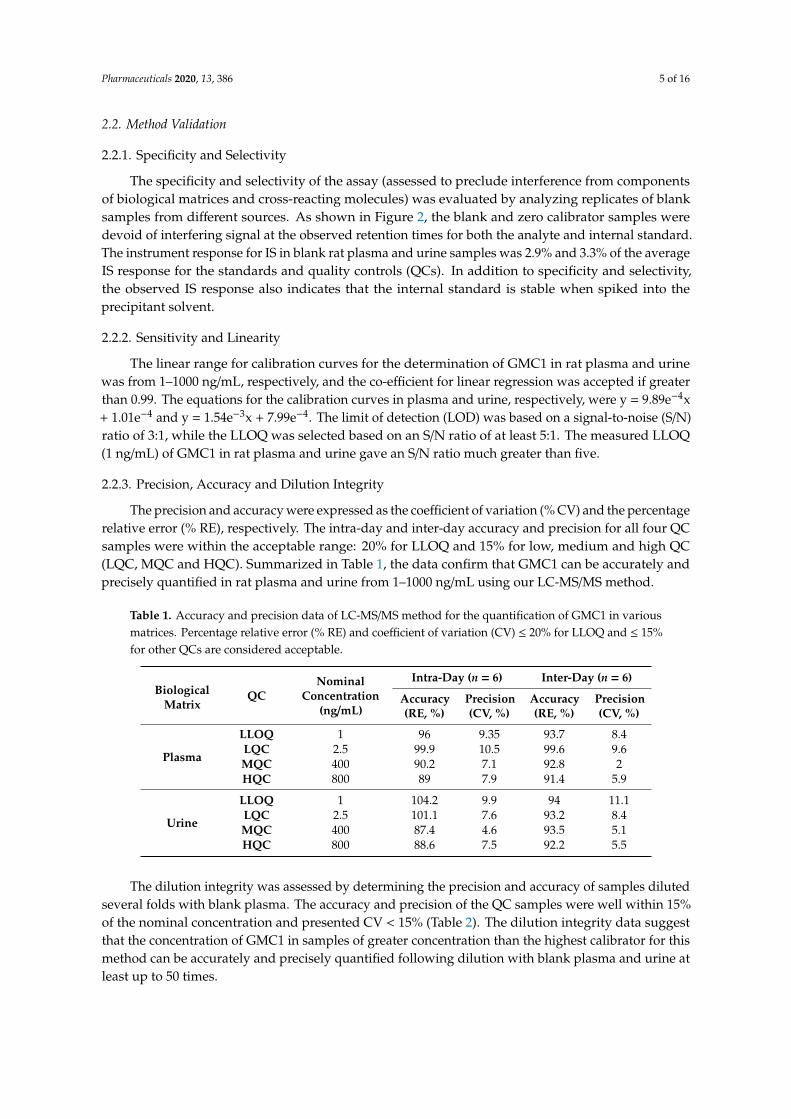
The precision and accuracy were expressed as the coefficient of variation (% CV) and the percentagerelative error (% RE), respectively. The intra-day and inter-day accuracy and precision for all four QCsamples were within the acceptable range: 20% for LLOQ and 15% for low, medium and high QC(LQC, MQC and HQC). Summarized in Table 1, the data confirm that GMC1 can be accurately andprecisely quantified in rat plasma and urine from 1–1000 ng/mL using our LC-MS/MS method.
Table 1. Accuracy and precision data of LC-MS/MS method for the quantification of GMC1 in variousmatrices. Percentage relative error (% RE) and coefficient of variation (CV) ≤ 20% for LLOQ and ≤ 15%for other QCs are considered acceptable.
BiologicalMatrix
QCNominal
Concentration(ng/mL)
Intra-Day (n = 6) Inter-Day (n = 6)
Accuracy(RE, %)
Precision(CV, %)
Accuracy(RE, %)
Precision(CV, %)
Plasma
LLOQ 1 96 9.35 93.7 8.4LQC 2.5 99.9 10.5 99.6 9.6MQC 400 90.2 7.1 92.8 2HQC 800 89 7.9 91.4 5.9
Urine
LLOQ 1 104.2 9.9 94 11.1LQC 2.5 101.1 7.6 93.2 8.4MQC 400 87.4 4.6 93.5 5.1HQC 800 88.6 7.5 92.2 5.5
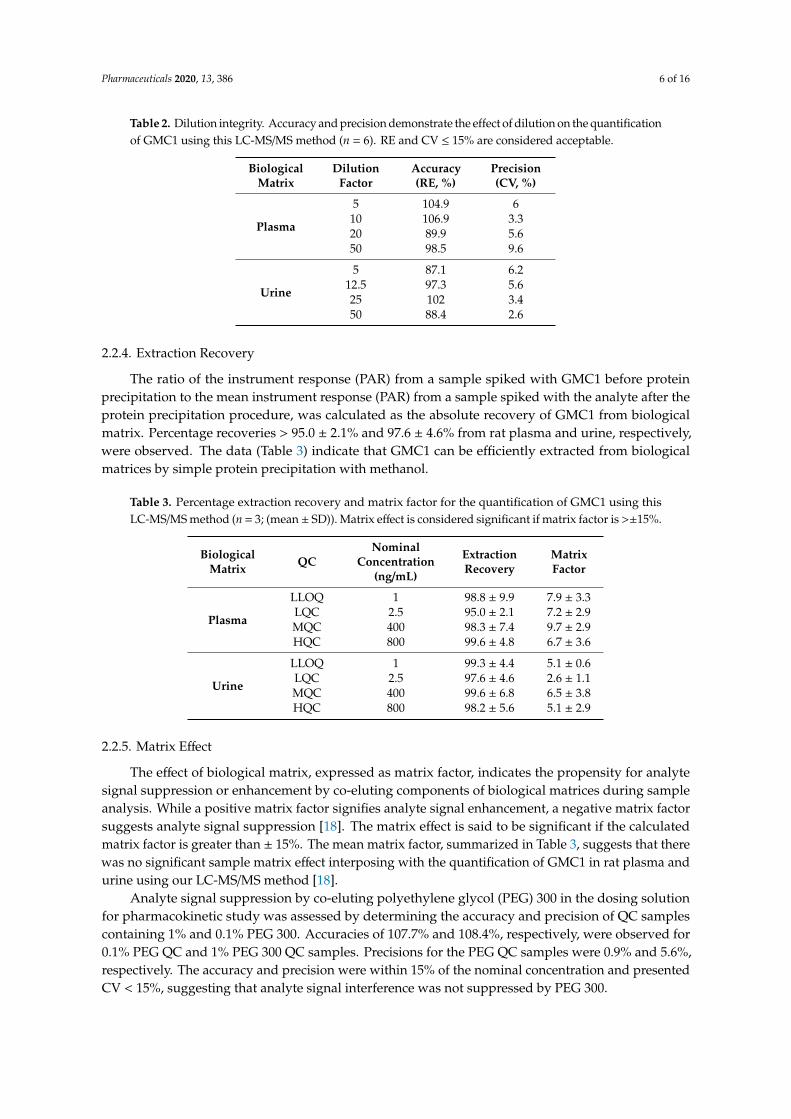
The dilution integrity was assessed by determining the precision and accuracy of samples dilutedseveral folds with blank plasma. The accuracy and precision of the QC samples were well within 15%of the nominal concentration and presented CV < 15% (Table 2). The dilution integrity data suggestthat the concentration of GMC1 in samples of greater concentration than the highest calibrator for thismethod can be accurately and precisely quantified following dilution with blank plasma and urine atleast up to 50 times.
Pharmaceuticals 2020, 13, 386 6 of 16
Table 2. Dilution integrity. Accuracy and precision demonstrate the effect of dilution on the quantificationof GMC1 using this LC-MS/MS method (n = 6). RE and CV ≤ 15% are considered acceptable.
BiologicalMatrix
DilutionFactor
Accuracy(RE, %)
Precision(CV, %)
Plasma
5 104.9 610 106.9 3.320 89.9 5.650 98.5 9.6
Urine
5 87.1 6.212.5 97.3 5.625 102 3.450 88.4 2.6
2.2.4. Extraction Recovery
The ratio of the instrument response (PAR) from a sample spiked with GMC1 before proteinprecipitation to the mean instrument response (PAR) from a sample spiked with the analyte after theprotein precipitation procedure, was calculated as the absolute recovery of GMC1 from biologicalmatrix. Percentage recoveries > 95.0 ± 2.1% and 97.6 ± 4.6% from rat plasma and urine, respectively,were observed. The data (Table 3) indicate that GMC1 can be efficiently extracted from biologicalmatrices by simple protein precipitation with methanol.
Table 3. Percentage extraction recovery and matrix factor for the quantification of GMC1 using thisLC-MS/MS method (n = 3; (mean± SD)). Matrix effect is considered significant if matrix factor is >±15%.
BiologicalMatrix QC
NominalConcentration
(ng/mL)
ExtractionRecovery
MatrixFactor
Plasma
LLOQ 1 98.8 ± 9.9 7.9 ± 3.3LQC 2.5 95.0 ± 2.1 7.2 ± 2.9MQC 400 98.3 ± 7.4 9.7 ± 2.9HQC 800 99.6 ± 4.8 6.7 ± 3.6
Urine
LLOQ 1 99.3 ± 4.4 5.1 ± 0.6LQC 2.5 97.6 ± 4.6 2.6 ± 1.1MQC 400 99.6 ± 6.8 6.5 ± 3.8HQC 800 98.2 ± 5.6 5.1 ± 2.9
2.2.5. Matrix Effect
The effect of biological matrix, expressed as matrix factor, indicates the propensity for analytesignal suppression or enhancement by co-eluting components of biological matrices during sampleanalysis. While a positive matrix factor signifies analyte signal enhancement, a negative matrix factorsuggests analyte signal suppression [18]. The matrix effect is said to be significant if the calculatedmatrix factor is greater than ± 15%. The mean matrix factor, summarized in Table 3, suggests that therewas no significant sample matrix effect interposing with the quantification of GMC1 in rat plasma andurine using our LC-MS/MS method [18].
Analyte signal suppression by co-eluting polyethylene glycol (PEG) 300 in the dosing solutionfor pharmacokinetic study was assessed by determining the accuracy and precision of QC samplescontaining 1% and 0.1% PEG 300. Accuracies of 107.7% and 108.4%, respectively, were observed for0.1% PEG QC and 1% PEG 300 QC samples. Precisions for the PEG QC samples were 0.9% and 5.6%,respectively. The accuracy and precision were within 15% of the nominal concentration and presentedCV < 15%, suggesting that analyte signal interference was not suppressed by PEG 300.
Pharmaceuticals 2020, 13, 386 7 of 16
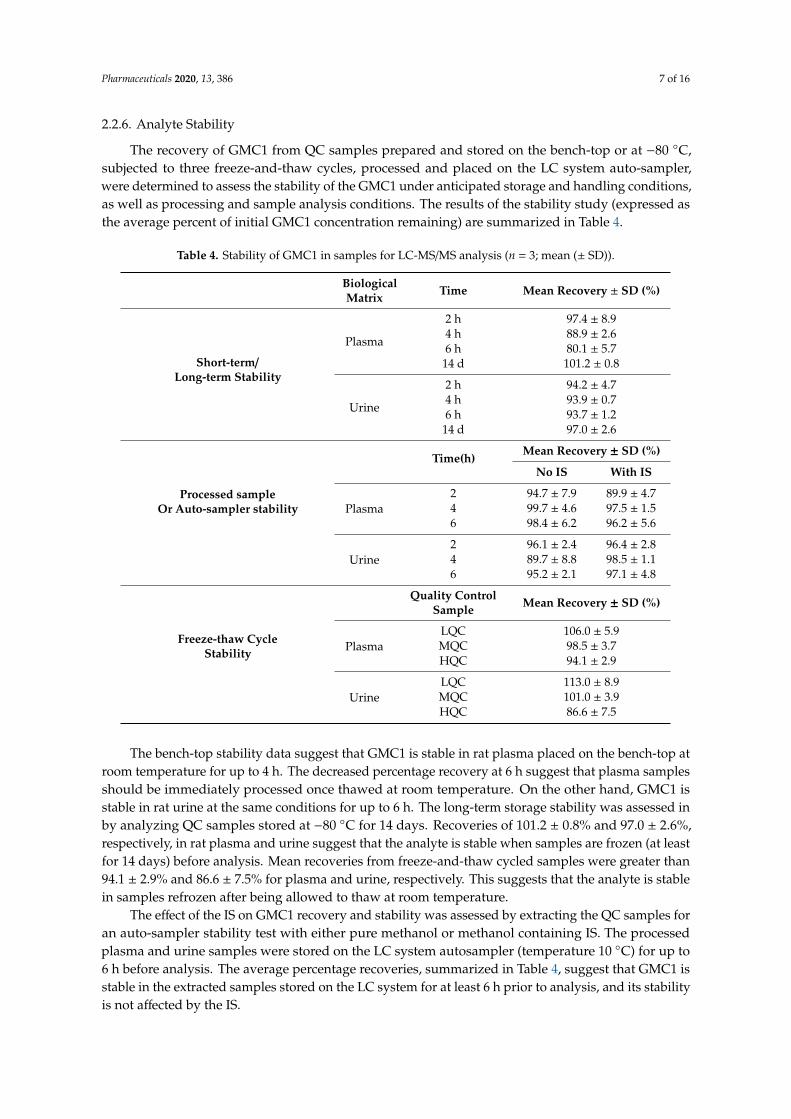
2.2.6. Analyte Stability
The recovery of GMC1 from QC samples prepared and stored on the bench-top or at −80 ◦C,subjected to three freeze-and-thaw cycles, processed and placed on the LC system auto-sampler,were determined to assess the stability of the GMC1 under anticipated storage and handling conditions,as well as processing and sample analysis conditions. The results of the stability study (expressed asthe average percent of initial GMC1 concentration remaining) are summarized in Table 4.
Table 4. Stability of GMC1 in samples for LC-MS/MS analysis (n = 3; mean (± SD)).
BiologicalMatrix Time Mean Recovery ± SD (%)
Short-term/Long-term Stability
Plasma
2 h 97.4 ± 8.94 h 88.9 ± 2.66 h 80.1 ± 5.7
14 d 101.2 ± 0.8
Urine
2 h 94.2 ± 4.74 h 93.9 ± 0.76 h 93.7 ± 1.2
14 d 97.0 ± 2.6
Processed sampleOr Auto-sampler stability
Time(h)Mean Recovery ± SD (%)
No IS With IS
Plasma2 94.7 ± 7.9 89.9 ± 4.74 99.7 ± 4.6 97.5 ± 1.56 98.4 ± 6.2 96.2 ± 5.6
Urine2 96.1 ± 2.4 96.4 ± 2.84 89.7 ± 8.8 98.5 ± 1.16 95.2 ± 2.1 97.1 ± 4.8
Freeze-thaw CycleStability
Quality ControlSample Mean Recovery ± SD (%)
PlasmaLQC 106.0 ± 5.9MQC 98.5 ± 3.7HQC 94.1 ± 2.9
UrineLQC 113.0 ± 8.9MQC 101.0 ± 3.9HQC 86.6 ± 7.5
The bench-top stability data suggest that GMC1 is stable in rat plasma placed on the bench-top atroom temperature for up to 4 h. The decreased percentage recovery at 6 h suggest that plasma samplesshould be immediately processed once thawed at room temperature. On the other hand, GMC1 isstable in rat urine at the same conditions for up to 6 h. The long-term storage stability was assessed inby analyzing QC samples stored at −80 ◦C for 14 days. Recoveries of 101.2 ± 0.8% and 97.0 ± 2.6%,respectively, in rat plasma and urine suggest that the analyte is stable when samples are frozen (at leastfor 14 days) before analysis. Mean recoveries from freeze-and-thaw cycled samples were greater than94.1 ± 2.9% and 86.6 ± 7.5% for plasma and urine, respectively. This suggests that the analyte is stablein samples refrozen after being allowed to thaw at room temperature.
The effect of the IS on GMC1 recovery and stability was assessed by extracting the QC samples foran auto-sampler stability test with either pure methanol or methanol containing IS. The processedplasma and urine samples were stored on the LC system autosampler (temperature 10 ◦C) for up to6 h before analysis. The average percentage recoveries, summarized in Table 4, suggest that GMC1 isstable in the extracted samples stored on the LC system for at least 6 h prior to analysis, and its stabilityis not affected by the IS.
Pharmaceuticals 2020, 13, 386 8 of 16
2.3. Pharmacokinetic Study
The validated LC-MS/MS method was deployed to quantify GMC1 in rat plasma and urinesamples from pharmacokinetic study of GMC1 in SD rats. Adult male SD rats were dosed a single2 mg/kg i.v. bolus of GMC1. Plasma and urine samples collected from the study were analyzed usingthis assay method for GMC1 concentrations.
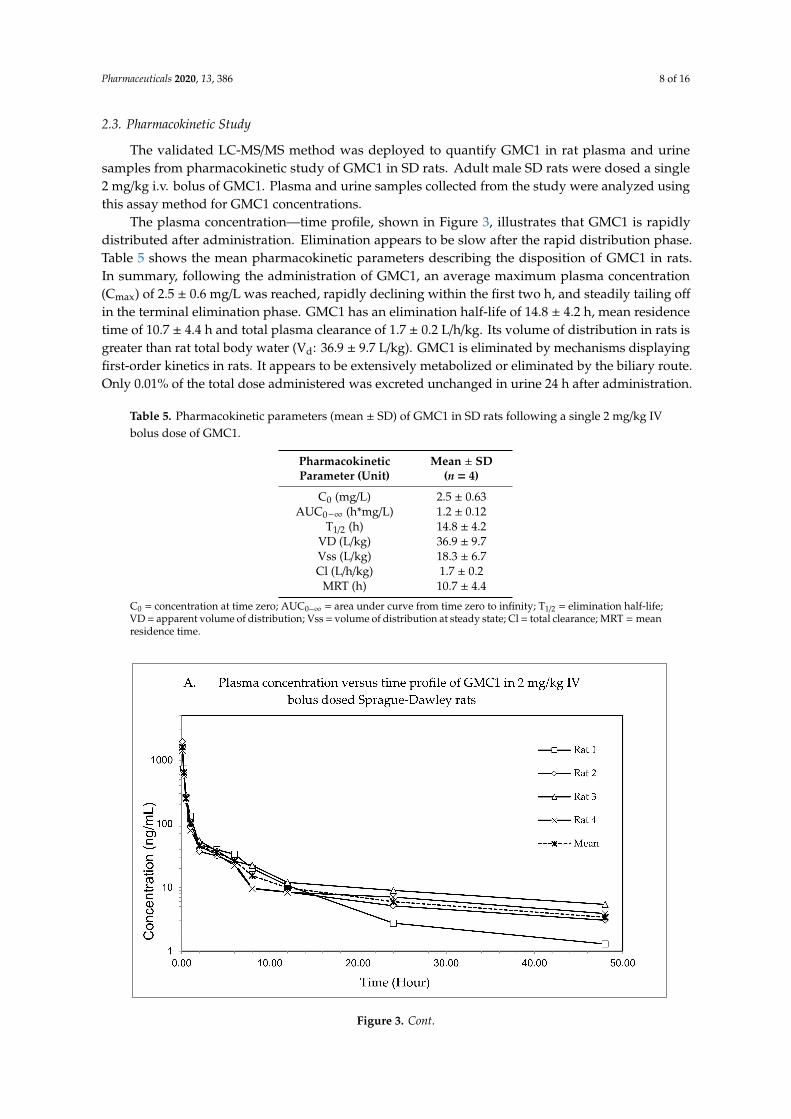
The plasma concentration—time profile, shown in Figure 3, illustrates that GMC1 is rapidlydistributed after administration. Elimination appears to be slow after the rapid distribution phase.Table 5 shows the mean pharmacokinetic parameters describing the disposition of GMC1 in rats.In summary, following the administration of GMC1, an average maximum plasma concentration(Cmax) of 2.5 ± 0.6 mg/L was reached, rapidly declining within the first two h, and steadily tailing off
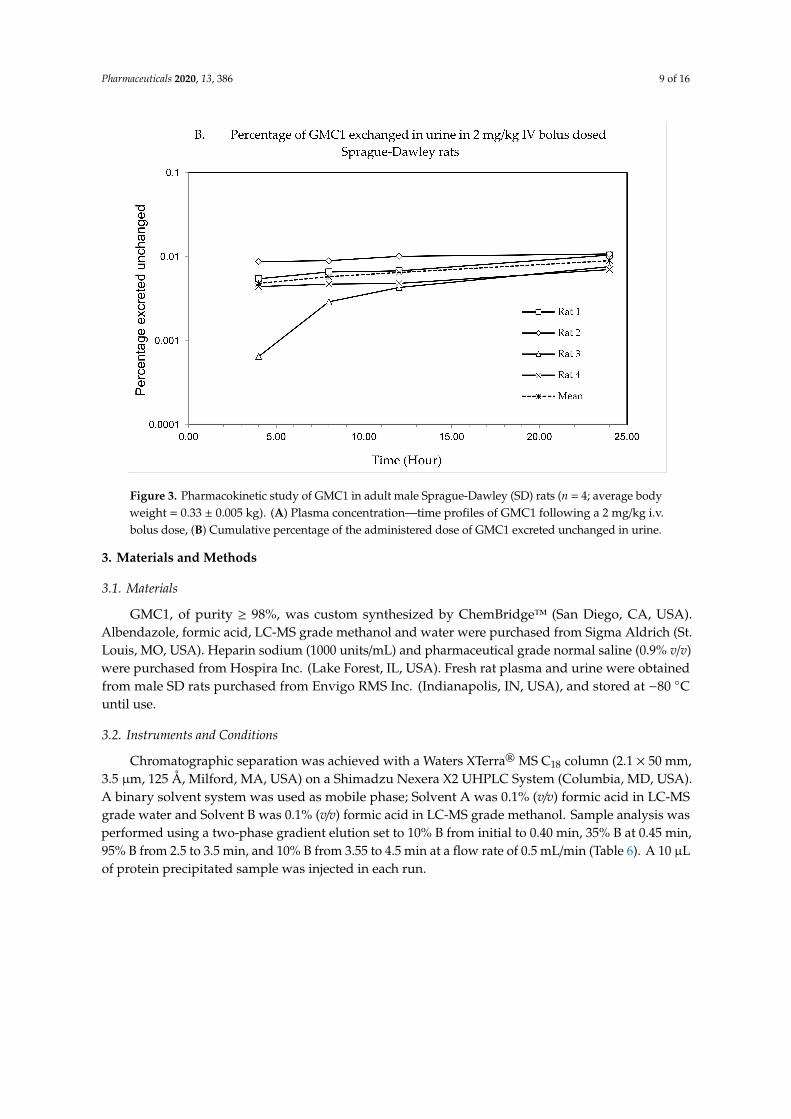
in the terminal elimination phase. GMC1 has an elimination half-life of 14.8 ± 4.2 h, mean residencetime of 10.7 ± 4.4 h and total plasma clearance of 1.7 ± 0.2 L/h/kg. Its volume of distribution in rats isgreater than rat total body water (Vd: 36.9 ± 9.7 L/kg). GMC1 is eliminated by mechanisms displayingfirst-order kinetics in rats. It appears to be extensively metabolized or eliminated by the biliary route.Only 0.01% of the total dose administered was excreted unchanged in urine 24 h after administration.
Table 5. Pharmacokinetic parameters (mean ± SD) of GMC1 in SD rats following a single 2 mg/kg IVbolus dose of GMC1.
PharmacokineticParameter (Unit)
Mean ± SD(n = 4)
C0 (mg/L) 2.5 ± 0.63AUC0−∞ (h*mg/L) 1.2 ± 0.12
T1/2 (h) 14.8 ± 4.2VD (L/kg) 36.9 ± 9.7Vss (L/kg) 18.3 ± 6.7Cl (L/h/kg) 1.7 ± 0.2
MRT (h) 10.7 ± 4.4
C0 = concentration at time zero; AUC0−∞ = area under curve from time zero to infinity; T1/2 = elimination half-life;VD = apparent volume of distribution; Vss = volume of distribution at steady state; Cl = total clearance; MRT = meanresidence time.
Figure 3. Cont.
Pharmaceuticals 2020, 13, 386 9 of 16
Figure 3. Pharmacokinetic study of GMC1 in adult male Sprague-Dawley (SD) rats (n = 4; average bodyweight = 0.33 ± 0.005 kg). (A) Plasma concentration—time profiles of GMC1 following a 2 mg/kg i.v.bolus dose, (B) Cumulative percentage of the administered dose of GMC1 excreted unchanged in urine.
3. Materials and Methods
3.1. Materials
GMC1, of purity ≥ 98%, was custom synthesized by ChemBridge™ (San Diego, CA, USA).Albendazole, formic acid, LC-MS grade methanol and water were purchased from Sigma Aldrich (St.Louis, MO, USA). Heparin sodium (1000 units/mL) and pharmaceutical grade normal saline (0.9% v/v)were purchased from Hospira Inc. (Lake Forest, IL, USA). Fresh rat plasma and urine were obtainedfrom male SD rats purchased from Envigo RMS Inc. (Indianapolis, IN, USA), and stored at −80 ◦Cuntil use.
3.2. Instruments and Conditions
Chromatographic separation was achieved with a Waters XTerra® MS C18 column (2.1 × 50 mm,3.5 µm, 125 Å, Milford, MA, USA) on a Shimadzu Nexera X2 UHPLC System (Columbia, MD, USA).A binary solvent system was used as mobile phase; Solvent A was 0.1% (v/v) formic acid in LC-MSgrade water and Solvent B was 0.1% (v/v) formic acid in LC-MS grade methanol. Sample analysis wasperformed using a two-phase gradient elution set to 10% B from initial to 0.40 min, 35% B at 0.45 min,95% B from 2.5 to 3.5 min, and 10% B from 3.55 to 4.5 min at a flow rate of 0.5 mL/min (Table 6). A 10 µLof protein precipitated sample was injected in each run.
Pharmaceuticals 2020, 13, 386 10 of 16
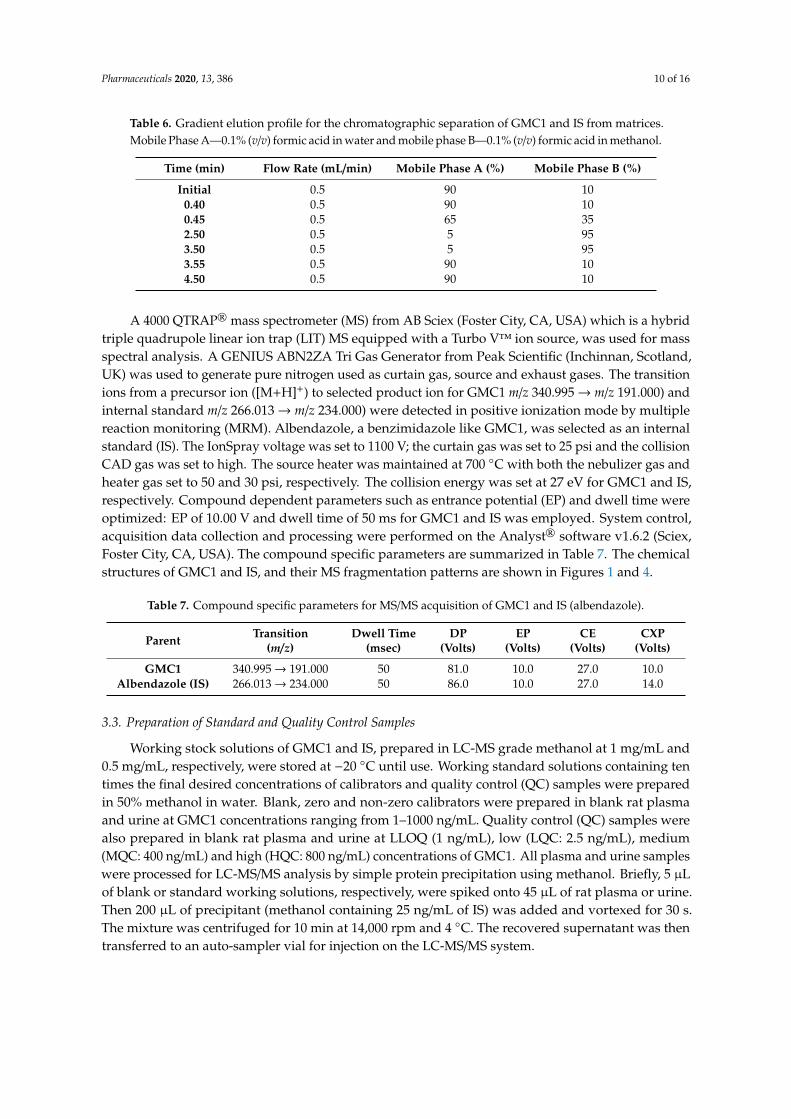
Table 6. Gradient elution profile for the chromatographic separation of GMC1 and IS from matrices.Mobile Phase A—0.1% (v/v) formic acid in water and mobile phase B—0.1% (v/v) formic acid in methanol.
Time (min) Flow Rate (mL/min) Mobile Phase A (%) Mobile Phase B (%)
Initial 0.5 90 100.40 0.5 90 100.45 0.5 65 352.50 0.5 5 953.50 0.5 5 953.55 0.5 90 104.50 0.5 90 10
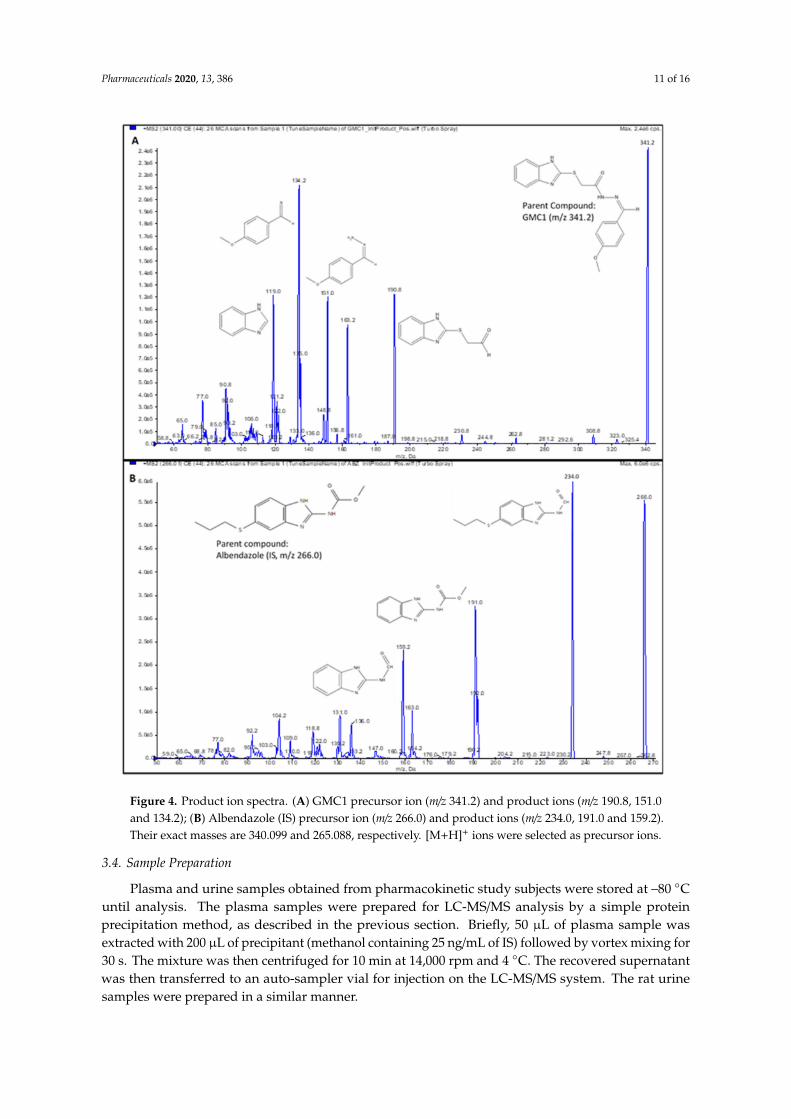
A 4000 QTRAP® mass spectrometer (MS) from AB Sciex (Foster City, CA, USA) which is a hybridtriple quadrupole linear ion trap (LIT) MS equipped with a Turbo V™ ion source, was used for massspectral analysis. A GENIUS ABN2ZA Tri Gas Generator from Peak Scientific (Inchinnan, Scotland,UK) was used to generate pure nitrogen used as curtain gas, source and exhaust gases. The transitionions from a precursor ion ([M+H]+) to selected product ion for GMC1 m/z 340.995→ m/z 191.000) andinternal standard m/z 266.013→ m/z 234.000) were detected in positive ionization mode by multiplereaction monitoring (MRM). Albendazole, a benzimidazole like GMC1, was selected as an internalstandard (IS). The IonSpray voltage was set to 1100 V; the curtain gas was set to 25 psi and the collisionCAD gas was set to high. The source heater was maintained at 700 ◦C with both the nebulizer gas andheater gas set to 50 and 30 psi, respectively. The collision energy was set at 27 eV for GMC1 and IS,respectively. Compound dependent parameters such as entrance potential (EP) and dwell time wereoptimized: EP of 10.00 V and dwell time of 50 ms for GMC1 and IS was employed. System control,acquisition data collection and processing were performed on the Analyst® software v1.6.2 (Sciex,Foster City, CA, USA). The compound specific parameters are summarized in Table 7. The chemicalstructures of GMC1 and IS, and their MS fragmentation patterns are shown in Figures 1 and 4.
Table 7. Compound specific parameters for MS/MS acquisition of GMC1 and IS (albendazole).
Parent Transition(m/z)
Dwell Time(msec)
DP(Volts)
EP(Volts)
CE(Volts)
CXP(Volts)
GMC1 340.995→ 191.000 50 81.0 10.0 27.0 10.0Albendazole (IS) 266.013→ 234.000 50 86.0 10.0 27.0 14.0
3.3. Preparation of Standard and Quality Control Samples
Working stock solutions of GMC1 and IS, prepared in LC-MS grade methanol at 1 mg/mL and0.5 mg/mL, respectively, were stored at −20 ◦C until use. Working standard solutions containing tentimes the final desired concentrations of calibrators and quality control (QC) samples were preparedin 50% methanol in water. Blank, zero and non-zero calibrators were prepared in blank rat plasmaand urine at GMC1 concentrations ranging from 1–1000 ng/mL. Quality control (QC) samples werealso prepared in blank rat plasma and urine at LLOQ (1 ng/mL), low (LQC: 2.5 ng/mL), medium(MQC: 400 ng/mL) and high (HQC: 800 ng/mL) concentrations of GMC1. All plasma and urine sampleswere processed for LC-MS/MS analysis by simple protein precipitation using methanol. Briefly, 5 µLof blank or standard working solutions, respectively, were spiked onto 45 µL of rat plasma or urine.Then 200 µL of precipitant (methanol containing 25 ng/mL of IS) was added and vortexed for 30 s.The mixture was centrifuged for 10 min at 14,000 rpm and 4 ◦C. The recovered supernatant was thentransferred to an auto-sampler vial for injection on the LC-MS/MS system.
Pharmaceuticals 2020, 13, 386 11 of 16
Figure 4. Product ion spectra. (A) GMC1 precursor ion (m/z 341.2) and product ions (m/z 190.8, 151.0and 134.2); (B) Albendazole (IS) precursor ion (m/z 266.0) and product ions (m/z 234.0, 191.0 and 159.2).Their exact masses are 340.099 and 265.088, respectively. [M+H]+ ions were selected as precursor ions.
3.4. Sample Preparation
Plasma and urine samples obtained from pharmacokinetic study subjects were stored at –80 ◦Cuntil analysis. The plasma samples were prepared for LC-MS/MS analysis by a simple proteinprecipitation method, as described in the previous section. Briefly, 50 µL of plasma sample wasextracted with 200 µL of precipitant (methanol containing 25 ng/mL of IS) followed by vortex mixing for30 s. The mixture was then centrifuged for 10 min at 14,000 rpm and 4 ◦C. The recovered supernatantwas then transferred to an auto-sampler vial for injection on the LC-MS/MS system. The rat urinesamples were prepared in a similar manner.
Pharmaceuticals 2020, 13, 386 12 of 16
3.5. Method Validation
A full validation of the LC-MS/MS method was performed according to the “US FDA, Centerfor Drug Evaluation and Research: Guidance for Industry—Bioanalytical Method Validation” [17].The validated parameters were sensitivity and linearity, specificity and selectivity, accuracy andprecision, dilution integrity, matrix effect, extraction recovery and analyte stability.
3.5.1. Specificity and Selectivity
Blank rat plasma and urine samples from six different sources were analyzed to exclude anyendogenous co-eluting interference or peaks close to the expected retention times of analytes and IS.The assay selectivity and specificity were also assessed by comparing the instrument response for theIS in blank samples to the average instrument response for IS in standards and QCs.
3.5.2. Sensitivity and Linearity
The sensitivity of the assay was determined by analyzing six replicates of lower limit ofquantification (LLOQ) QC in plasma and urine. Precision and accuracy ≥ 20% were consideredacceptable to establish sensitivity. The LLOQ was based on a signal-to-noise (S/N) ratio greater than5:1 while the limit of detection (LOD) was defined based on an S/N of 3:1.
Linearity was assessed by plotting calibration curves of GMC1 in rat plasma and urine, respectively.The calibration curves were constructed by plotting the peak area ratio (PAR) of GMC1 to IS againstnominal concentrations of GMC1. Parameters such as slope, intercept and correlation coefficient oflinear regression equation were estimated using least square regression analysis using a 1/x2 weighting.
3.5.3. Precision, Accuracy and Dilution Integrity
Six replicates of LLOQ, LQC, MQC and HQC samples were analyzed using a calibration curveconstructed on the same day to determine the intra-day accuracy and precision. The inter-day accuracyand precision was determined by analyzing six replicates of LLOQ QC, LQC, MQC and HQC samplesusing 3 different calibration curves constructed on three different days. The assay accuracy wasestablished by the percentage relative error (% RE) from the nominal GMC1 concentrations, while thepercentage coefficient of variation (% CV) was considered as the assay precision. The accuracy andprecision in rat plasma and urine were determined in a similar manner.
The dilution integrity was established by determining the accuracy and precision of themeasurement of rat plasma and urine samples with a GMC1 concentration 2.5X of the higheststandard and diluted with up to 50 times to fall within the linear range of the assay. Rat plasma andurine samples containing 2500 ng/mL of GMC1 were prepared and diluted 5, 10, 20, and 50 timeswith blank rat plasma or 5, 12.5, 25 and 50 times with blank rat urine, respectively. This experimentwas conducted in sextuplets. Following LC-MS/MS analysis, the concentrations of six replicates werecorrected with the dilution factor and the percent accuracy and precision were then determined.
3.5.4. Extraction Recovery
The extraction recovery was determined by analyzing triplicates of QC samples, rat plasmaand urine spiked with the respective concentrations of GMC1, before or after protein precipitation.The percentage recovery of GMC1 was calculated using Equation (1):
% Recovery =Responsepre−extraction spike sample
Responsepost−extraction spike sample× 100% (1)
where Responsepre-extraction spike sample is the average peak area count for GMC1 in plasma or urinesample spike with the analyte pre-protein precipitation, and Responsepost-extraction spike sample is theaverage peak area count for samples spiked with GMC1 after protein extraction.
Pharmaceuticals 2020, 13, 386 13 of 16
3.5.5. Matrix Effect
The matrix effect was determined to assess the effect of components of biological matrices on thequantification of GMC1 in such biological matrices. A set of rat plasma and urine QC samples and QCsamples in a neat solution (35% methanol) were analyzed to determine the matrix effect. Equation (2)was used to calculate the matrix factor:
Matrix factor (%) =
Responsepost−extraction spike sample −Responseneat sample
Response neat sample
× 100 (2)
where Responsepost-extraction spike sample is the mean peak area for a sample spiked with GMC1 postprotein precipitation, and Responseneat sample is the mean peak area for QC samples of same GMC1concentration in matrix-free solution (35% methanol).
Interference of analyte signal by co-eluting PEG, used as an excipient in dosing solutions forpharmacokinetic studies, is well documented [19,20]. Signal interference by PEG 300 used in this studywas evaluated by determining the precision and accuracy of six replicates of QC samples preparedin rat plasma spiked with 0.1% PEG 300 and 1% PEG 300, respectively. The PEG QC samples werecompared to plasma QC samples devoid of PEG 300.
3.5.6. Analyte Stability
The stability of GMC1 in samples under anticipated storage and handling conditions, as well assample preparation and LC-MS/MS analysis procedures was assessed by determining the percentagerecovery of the analyte from samples subjected to short-term storage on the bench-top, freeze-and-thawcycles, and processed and stored on the LC system auto-sampler prior to analysis. All the stability testexperiments were conducted in triplicates.
Three sets of plasma and urine QC samples were left on the bench-top for 2, 4, and 6 h, respectively;each set was analyzed and compared to fresh samples of the same analyte concentration to establishthe bench-top storage (short-term) stability of GMC1 in rat plasma and urine. The long-term stabilityof samples stored in frozen condition (−80 ◦C) before analysis was assessed by measuring the meanpercentage recovery of GMC1 from rat plasma and urine samples stored for 14 days. The instrumentresponse from the frozen samples was compared to the mean response from freshly prepared samples.
The stability of GMC1 in rat plasma and urine samples after freeze–thaw cycle was evaluatedby analyzing QC samples exposed to three cycles of freeze (at −80 ◦C) and thaw (room temperature).The mean percentage recoveries from the samples were measured against fresh QC samples of thesame GMC1 concentration. Additionally, GMC1 stability in processed (protein precipitated) samplesstored on the autosampler before LC-MS/MS analysis was assessed by analyzing plasma and urineQC samples extracted with methanol and placed in the auto-sampler for 2 to 6 h prior to analysis.A set of the samples was precipitated with methanol containing IS, while the other set with plainmethanol (without IS). Both sample sets were compared to fresh samples of similar GMC1 concentration.The temperature of the auto-sampler was set to 10 ◦C.
3.6. Pharmacokinetic Study
Adult male SD rats (body weight 300 to 350 g) were purchased from Envigo RMS, Inc, (Indianapolis,IN, USA) and kept in an environmentally controlled room (fed ad libitum) for at least one week beforeexperiments. The protocol for the animal experiment was reviewed and approved by the InstitutionalAnimal Care and Use Committee at Texas Southern University, and all animal experiments wereconducted according to the National Institute of Health “Guide for the Care and Use of LaboratoryAnimals, 8th Edition” [21].
Jugular veins of the rats (n = 4) were cannulated under anesthesia one day prior to the study.A co-solvent formulation containing 10 mg/mL of GMC1 in 50% v/v of Labrasol® and PEG 300,respectively, was prepared and diluted 10X with normal saline prior to administration. Each rat was
Pharmaceuticals 2020, 13, 386 14 of 16
administered a single 2 mg/kg intravenous (i.v.) bolus dose of the diluted GMC1 solution. About 250 µLserial blood was obtained from each rat prior to dosing and at 5, 15 and 30 min, 1, 2, 4, 6, 8, 12, 24 and 48 hafter administration into heparinized blood sample collecting tubes. The blood was centrifuged to obtainplasma which was frozen at −80 ◦C until LC-MS/MS analysis. Urine from each rat was also collected forup to 24 h after dosing and also stored at the same condition until analysis. GMC1 concentration in theplasma and urine samples was determined within 48 h using our LC-MS/MS assay method.
3.7. Pharmacokinetic Analysis
Pharmacokinetic parameters for GMC1 were estimated using Phoenix WinNonlin v7.0(Certara USA Inc., Princeton, NJ, USA). Non-compartmental analysis was performed to estimate theterminal elimination half-life (t1/2), total clearance (CL), area under the plasma concentration time curve(AUC0–∞), plasma concentration at time zero (C0), apparent volume of distribution (VD), volume ofdistribution at steady state (Vss), and mean residence time (MRT). The AUC0−∞ was calculated by alinear log trapezoidal (linear up log down) method. Uniform weighting scheme as well as 1/Y, 1/Y2,and 1/(Yhat)2 were compared for the most suitable weighting for the non-compartmental analysis.The optimal weighting was selected based on the correlation coefficient and observed vs. predicted fitof the plasma concentration vs. time plot. Based on these criteria, the uniform weighting scheme wasmost suited for the pharmacokinetic analysis on the individual profiles.
4. Conclusions
A simple, sensitive, and reproducible LC-MS/MS method was developed and fully validated forquantification of levels of the novel drug candidate, GMC1, in plasma and urine samples. This methodwas confirmed to be accurate and precise for the quantification of GMC1 in samples within the linearrange of assay, from 1–1000 ng/mL of GMC1. The analyte stability in biological samples was notimpacted by anticipated sample storage, handling, preparation, and LC-MS/MS analysis conditions,or the presence or absence of an internal standard and was also easily extractable from the biologicalmatrices by simple protein precipitation. The pharmacokinetic data from this study revealed thatGMC1 has a bi-phasic disposition in adult male SD rats. It is distributed extensively and is eliminatedprimarily by first order kinetics; it has a long plasma elimination half-life. This LC-MS/MS assaymethod will be very essential in subsequent studies of GMC1.
5. Patents
Cox, M.B.; Xie, H.; Ekpenyong, O. “Intravenous Formulation and LC/MS/MS Analysis Method forGMC1” US10,010,534, 3 July 2018.
Author Contributions: Conceptualization, H.X. and M.B.C.; methodology, O.E. and H.X.; software, O.E.;validation, O.E., C.C.; formal analysis, O.E.; investigation, O.E., C.C. and J.M.; resources, N.C.G., A.N.P., F.B., A.C.and M.B.C.; data curation, O.E., D.L. and H.X.; writing—original draft preparation, O.E.; writing—review andediting, H.X., D.L.; visualization, H.X.; supervision, H.X.; project administration, H.X.; funding acquisition, H.X.,D.L., M.B.C. All authors have read and agreed to the published version of the manuscript.
Funding: The study was funded partially by the National Institute on Minority Health and Health Disparities(NIMHD) grant (U54MD007605) and by Cancer Prevention and Research Institute of Texas (CPRIT) Core FacilitiesSupport Awards (RP180748) to H.X. and D.L.; NIMHD grant (U54MD007592) and the Lizanell and Colbert ColdwellFoundation (RP110444-P2), and the DOD Prostate Cancer Research Program (PCRP) (W81XWH-17-1-0435) toM.B.C.
Conflicts of Interest: The continued development of GMC1 is supported by a sponsored research agreementbetween the University of Texas at El Paso and Maia Biotechnology Inc. The authors declare that they have noother known competing financial interests or personal relationships that could have appeared to influence thework reported in this paper.
Pharmaceuticals 2020, 13, 386 15 of 16
References
1. Heinlein, C.A.; Chang, C. Androgen Receptor in Prostate Cancer. Endocr. Rev. 2004, 25, 276–308. [CrossRef][PubMed]
2. De Leon, J.T.; Iwai, A.; Feau, C.; Garcia, Y.; Balsiger, H.A.; Storer, C.L.; Suro, R.M.; Garza, K.M.; Lee, S.;Kim, Y.S.; et al. Targeting the regulation of androgen receptor signaling by the heat shock protein 90cochaperone FKBP52 in prostate cancer cells. Proc. Natl. Acad. Sci. USA 2011, 108, 11878–11883. [CrossRef][PubMed]
3. Yeh, S.; Niu, Y.; Miyamoto, H.; Chang, T.; Chang, C. Differential Roles of Androgen Receptor in ProstateDevelopment and Cancer Progression. In Androgen Action in Prostate Cancer; Tindall, D., Mohler, J., Eds.;Springer Science & Business Media: Berlin, Germany, 2009; pp. 73–89.
4. Tran, C.; Ouk, S.; Clegg, N.J.; Chen, Y.; Watson, P.A.; Arora, V.; Wongvipat, J.; Smith-Jones, P.M.; Yoo, D.;Kwon, A.; et al. Development of a second-generation antiandrogen for treatment of advanced prostatecancer. Science 2009, 324, 787–790. [CrossRef] [PubMed]
5. Kobayashi, T.; Inoue, T.; Kamba, T.; Ogawa, O. Experimental Evidence of Persistent Androgen-Receptor-Dependency in Castration-Resistant Prostate Cancer. Int. J. Mol. Sci. 2013, 14, 15615–15635. [CrossRef] [PubMed]
6. Decker, K.F.; Zheng, D.; He, Y.; Bowman, T.; Edwards, J.R.; Jia, L. Persistent androgen receptor-mediatedtranscription in castration-resistant prostate cancer under androgen-deprived conditions. Nucleic Acids Res.2012, 40, 10765–10779. [CrossRef] [PubMed]
7. Scher, H.I.; Sawyers, C.L. Biology of progressive, castration-resistant prostate cancer: Directed therapiestargeting the androgen-receptor signaling axis. J. Clin. Oncol. 2005, 23, 8253–8261. [CrossRef] [PubMed]
8. Cheung-Flynn, J.; Prapapanich, V.; Cox, M.B.; Riggs, D.L.; Suarez-Quian, C.; Smith, D.F. Physiological rolefor the cochaperone FKBP52 in androgen receptor signaling. Mol. Endocrinol. 2005, 19, 1654–1666. [PubMed]
9. Storer Samaniego, C.; Suh, C.J.H.; Arundhati, C.; Karen, O.; Naihsuan, G.; Jeffrey, C.S.; Prasenjit, D.;Yumoto, F.; Fletterick, R.J.; Strom, A.M.; et al. The FKBP52 Cochaperone Acts in Synergy with beta-Cateninto Potentiate Androgen Receptor Signaling. PLoS ONE 2015, 10, e0134015. [CrossRef] [PubMed]
10. Azad, A.A.; Zoubeidi, A.; Gleave, M.; Chi, K.N. Targeting heat shock proteins in metastatic castration-resistantprostate cancer. Nat. Rev. Urol. 2015, 12, 26–36. [CrossRef] [PubMed]
11. Cox, M.; Skouta, R.; Cherkasov, A. Pharmaceutical Compositions Directly Targeting FKBP52 for the Treatmentof Prostate Cancer and Methods of Using Same. U.S. Patent 010322113B2, 17 August 2017.
12. Guy, N.C.; Garcia, Y.A.; Cox, M.B. Therapeutic Targeting of the FKBP52 Co-Chaperone in Steroid HormoneReceptor-Regulated Physiology and Disease. Curr. Mol. Pharmacol. 2015, 9, 109–125. [CrossRef] [PubMed]
13. Neckers, L.M.; Cox, M.B.; Neckers, J.B.; Kim, Y.S.; Iwai, A.; Yangmin Ning, Y.; Kugelman-Tonos, J.;Balsiger, H.A.; Fletterick, R. Pharmaceutical Compositions Which Inhibit FKBP52-Mediated Regulation ofAndrogen Receptor Function and Methods of Using Same. U.S. Patent 20120283215A1, 4 March 2020.
14. Liang, S.; Bian, X.; Liang, N.; Sivils, J.C.; Neckers, L.M.; Cox, M.B.; Xie, H. Solution formulation developmentand efficacy of MJC13 in a preclinical model of castration-resistant prostate cancer. Pharm. Dev. Technol. 2016,21, 121–126. [CrossRef] [PubMed]
15. Liang, S.; Bian, X.; Sivils, J.; Neckers, L.M.; Cox, M.B.; Xie, H. Quantification of a New Anti-Cancer MoleculeMJC13 Using a Rapid, Sensitive, and Reliable Liquid Chromatography-Tandem Mass Spectrometry Method.Am. J. Mod. Chromatogr. 2014, 1, 1–11. [PubMed]
16. Cox, M.; Xie, H.; Ekpenyong, O. Intravenous Formulation and LC/MS/MS Analysis Method for GMC1. U.S.Patent 10,010,534, 3 July 2018.
17. United States Food and Drug Administration. Guidance for Industry—Bioanalytical Method Validation.Center for Drug Evaluation and Center for Drug Evaluation and Research and Center for Veterinary Medicine,Editors. 2018. Available online: http://www.fda.gov/cder/guidance (accessed on 28 May 2019).
18. Matuszewski, B.K.; Constanzer, M.L.; Chavez-Eng, C.M. Strategies for the Assessment of Matrix Effect inQuantitative Bioanalytical Methods Based on HPLC-MS/MS. Anal. Chem. 2003, 75, 3019–3030. [CrossRef][PubMed]
19. Ekpenyong, O.; Cooper, C.; Ma, J.; Liang, N.; Olaleye, O.; Xie, H. A simple, sensitive and reliable LC-MS/MSmethod for the determination of 7-bromo-5-chloroquinolin-8-ol (CLBQ14), a potent and selective inhibitorof methionine aminopeptidases: Application to pharmacokinetic studies. J. Chromatogr. B Analyt. Technol.Biomed. Life Sci. 2018, 1097–1098, 35–43. [CrossRef] [PubMed]

Pharmaceuticals 2020, 13, 386 16 of 16
20. Tong, X.S.; Wang, J.; Zheng, S.; Pivnichny, J.V.; Griffin, P.R.; Shen, X.; Donnelly, M.; Vakerich, K.; Nunes, C.;Fenyk-Melody, J. Effect of signal interference from dosing excipients on pharmacokinetic screening of drugcandidates by liquid chromatography/mass spectrometry. Anal. Chem. 2002, 74, 6305–6313. [CrossRef] [PubMed]
21. National Research Council (US) Committee for the Update of the Guide for the Care and Use of LaboratoryAnimals. Guide for the Care and Use of Laboratory Animals, 8th ed.; National Academies Press: Washington,DC, USA, 2011.
Publisher’s Note: MDPI stays neutral with regard to jurisdictional claims in published maps and institutionalaffiliations.
© 2020 by the authors. Licensee MDPI, Basel, Switzerland. This article is an open accessarticle distributed under the terms and conditions of the Creative Commons Attribution(CC BY) license (http://creativecommons.org/licenses/by/4.0/).
Related Documents