• REVIEW • Bio-feedback treatment of fecal incontinence: Where are we, and where are we going? Giuseppe Chiarioni, Barbara Ferri, Antonio Morelli, Guido Iantorno, Gabrio Bassotti ELSEVIER PO Box 2345, Beijing 100023, China World J Gastroenterol 2005;11(31):4771-4775 www.wjgnet.com World Journal of Gastroenterology ISSN 1007-9327 [email protected] © 2005 The WJG Press and Elsevier Inc. All rights reserved. Giuseppe Chiarioni, Gastroenterological Rehabilitation Division of the University of Verona, Valeggio sul Mincio Hospital, Azienda Ospedaliera of Verona, Italy Barbara Ferri, Gastroenterology and Digestive Endoscopy Institute, Policlinico “GB Rossi”, University of Verona Medical School, Italy Antonio Morelli, Gabrio Bassotti, Gastroenterology and Hepatology Section, Department of Clinical and Experimental Medicine, University of Perugia Medical School, Italy Guido Iantorno, Digestive Motility Unit, Gastroenterology Municipal Hospital “Dr. C.Bonorino Udaondo”, Buenos Aires, Argentina Correspondence to: Dr. Gabrio Bassotti, Strada del Cimitero, 2/a 06131 San Marco (Perugia), Italy. [email protected] Fax: +39-75-584-7570 Received: 2004-12-03 Accepted: 2005-02-18 Abstract Abstract Abstract Abstract Abstract Fecal incontinence is a disabling disease, often observed in young subjects, that may have devastating psycho-social consequences. In the last years, numerous evidences have been reported on the efficacy of bio-feedback techniques for the treatment of this disorder. Overall, the literature data claim a success rate in more than 70% of cases in the short term. However, recent controlled trials have not confirmed this optimistic view, thus emphasizing the role of standard care. Nonetheless, many authors believe that this should be the first therapeutic approach for fecal incontinence due to the efficacy, lack of side-effects, and scarce invasiveness. Well-designed randomized, controlled trial are eagerly awaited to solve this therapeutic dilemma. © 2005 The WJG Press and Elsevier Inc. All rights reserved. Key words: Biofeedback; Fecal incontinence Chiarioni G, Ferri B, Morelli A, Iantorno G, Bassotti G. Bio- feedback treatment of fecal incontinence: Where are we, and where are we going? World J Gastroenterol 2005; 11 (31): 4771-4775 http://www.wjgnet.com/1007-9327/11/4771.asp INTRODUCTION INTRODUCTION INTRODUCTION INTRODUCTION INTRODUCTION Fecal incontinence is a common health care problem, with modest physical but important psychosocial consequences that can be distressful and incapacitating, up to complete social isolation [1] . Fecal incontinence is one of the fields in which bio-feedback techniques are thought to be most successful, and owing to the fact that bio-feedback procedures have had a strong impact in gastro-enterology, behavioral research in this area has greatly increased in recent years [2,3] . The term bio-feedback training refers to the use of various devices (mechanical, electrical) that are supposedly able to increase the awareness of a biological response, so that patients can learn, through a process of “trial and error”, to improve their voluntary control of this response [4] . Bio- feedback training sessions are usually supplemented by home practice training (Kegel exercises), with the purpose of enforcing muscle strength through an increase of the number of muscle fibers innervated by existing nerves. It is commonly thought that bio-feedback is not able to repair or generate new neural pathways. The increase of patient’s awareness of somatic sensations, and the improvement of motor skills, which represent the basis of biologic self-regulation, are critical points for bio-feedback training. For instance, a cause of fecal incontinence is the loss of the ability to feel rectal fullness, a major point for contracting the pelvic floor muscles to avoid incontinence [5] . In these patients, the goal of bio- feedback training is to improve the ability to detect rectal filling through sensory re-training [6,7] . Types of bio-feedback training for fecal incontinence Bio-feedback treatment of fecal incontinence was proposed by Engel and coworkers, 30 years ago [8] . Patients were taught to improve their ability to voluntarily contract the external anal sphincter during rectal filling, either by improving the strength of the sphincter (motor skills training) or by increasing the ability to perceive weak rectal distention (discrimination training) or by combining the previous two mechanisms (training in the coordination of sphincter contractions with rectal sensation). No side effects were reported and the treatment was generally well accepted. Further trials had shown that therapeutic goals can be achieved through training, that employs measurements of pressures (manometry) or electrical activity (electromyography, EMG) in the anal canal [2,3] . Manometric bio-feedback Bio-feedback training aimed at increasing the strength of the external anal sphincter has usually been carried out by recording anal canal pressures, coupled to visual/auditory signals proportional to the pressures themselves. Anal pressure may be recorded by balloon probes or by perfused catheters [4] . During manometric recording, the patient is required to squeeze as to prevent defecation while being given visual feedback and verbal guidance on how to reach

Welcome message from author
This document is posted to help you gain knowledge. Please leave a comment to let me know what you think about it! Share it to your friends and learn new things together.
Transcript
• REVIEW •
Bio-feedback treatment of fecal incontinence: Where are we, and
where are we going?
Giuseppe Chiarioni, Barbara Ferri, Antonio Morelli, Guido Iantorno, Gabrio Bassotti
ELSEVIER
PO Box 2345, Beijing 100023, China World J Gastroenterol 2005;11(31):4771-4775www.wjgnet.com World Journal of Gastroenterology ISSN [email protected] © 2005 The WJG Press and Elsevier Inc. All rights reserved.
Giuseppe Chiarioni, Gastroenterological Rehabilitation Divisionof the University of Verona, Valeggio sul Mincio Hospital, AziendaOspedaliera of Verona, ItalyBarbara Ferri, Gastroenterology and Digestive Endoscopy Institute,Policlinico “GB Rossi”, University of Verona Medical School, ItalyAntonio Morelli, Gabrio Bassotti, Gastroenterology and HepatologySection, Department of Clinical and Experimental Medicine,University of Perugia Medical School, ItalyGuido Iantorno, Digestive Motility Unit, GastroenterologyMunicipal Hospital “Dr. C.Bonorino Udaondo”, Buenos Aires,ArgentinaCorrespondence to: Dr. Gabrio Bassotti, Strada del Cimitero, 2/a06131 San Marco (Perugia), Italy. [email protected]: +39-75-584-7570Received: 2004-12-03 Accepted: 2005-02-18
AbstractAbstractAbstractAbstractAbstract
Fecal incontinence is a disabling disease, often observedin young subjects, that may have devastating psycho-socialconsequences. In the last years, numerous evidences havebeen reported on the efficacy of bio-feedback techniquesfor the treatment of this disorder. Overall, the literaturedata claim a success rate in more than 70% of cases inthe short term. However, recent controlled trials havenot confirmed this optimistic view, thus emphasizing therole of standard care. Nonetheless, many authors believethat this should be the first therapeutic approach forfecal incontinence due to the efficacy, lack of side-effects,and scarce invasiveness. Well-designed randomized,controlled trial are eagerly awaited to solve this therapeuticdilemma.
© 2005 The WJG Press and Elsevier Inc. All rights reserved.
Key words: Biofeedback; Fecal incontinence
Chiarioni G, Ferri B, Morelli A, Iantorno G, Bassotti G. Bio-feedback treatment of fecal incontinence: Where are we,and where are we going? World J Gastroenterol 2005; 11(31): 4771-4775
http://www.wjgnet.com/1007-9327/11/4771.asp
INTRODUCTIONINTRODUCTIONINTRODUCTIONINTRODUCTIONINTRODUCTION
Fecal incontinence is a common health care problem, withmodest physical but important psychosocial consequencesthat can be distressful and incapacitating, up to completesocial isolation[1]. Fecal incontinence is one of the fields inwhich bio-feedback techniques are thought to be most
successful, and owing to the fact that bio-feedback procedureshave had a strong impact in gastro-enterology, behavioralresearch in this area has greatly increased in recent years[2,3].The term bio-feedback training refers to the use of variousdevices (mechanical, electrical) that are supposedly able toincrease the awareness of a biological response, so thatpatients can learn, through a process of “trial and error”,to improve their voluntary control of this response[4]. Bio-feedback training sessions are usually supplemented by homepractice training (Kegel exercises), with the purpose ofenforcing muscle strength through an increase of the numberof muscle fibers innervated by existing nerves. It iscommonly thought that bio-feedback is not able to repairor generate new neural pathways.
The increase of patient’s awareness of somatic sensations,and the improvement of motor skills, which representthe basis of biologic self-regulation, are critical points forbio-feedback training. For instance, a cause of fecalincontinence is the loss of the ability to feel rectal fullness,a major point for contracting the pelvic floor muscles toavoid incontinence[5]. In these patients, the goal of bio-feedback training is to improve the ability to detect rectalfilling through sensory re-training[6,7].
Types of bio-feedback training for fecal incontinenceBio-feedback treatment of fecal incontinence was proposedby Engel and coworkers, 30 years ago[8]. Patients were taughtto improve their ability to voluntarily contract the externalanal sphincter during rectal filling, either by improvingthe strength of the sphincter (motor skills training) or byincreasing the ability to perceive weak rectal distention(discrimination training) or by combining the previous twomechanisms (training in the coordination of sphinctercontractions with rectal sensation). No side effects werereported and the treatment was generally well accepted.Further trials had shown that therapeutic goals can beachieved through training, that employs measurements ofpressures (manometry) or electrical activity (electromyography,EMG) in the anal canal[2,3].
Manometric bio-feedbackBio-feedback training aimed at increasing the strength ofthe external anal sphincter has usually been carried out byrecording anal canal pressures, coupled to visual/auditorysignals proportional to the pressures themselves. Analpressure may be recorded by balloon probes or by perfusedcatheters[4]. During manometric recording, the patient isrequired to squeeze as to prevent defecation while beinggiven visual feedback and verbal guidance on how to reach
4772 ISSN 1007-9327 CN 14-1219/ R World J Gastroenterol August 21, 2005 Volume 11 Number 31
this goal. The patients may also be taught to inhibit wrongresponses such as contraction of the abdominal muscles.Asking the patient to squeeze may be obtained in responseto balloon distention of the rectum[9] or without rectaldistention[10]. Some authors have suggested that improvingsqueeze duration is more important than maximizing analstrength. Therefore, patients are taught to pursue thistherapeutic goal as a part of the bio-feedback protocol[10,11].
EMG bio-feedbackStrengthening the pelvic floor muscle may also be achievedby showing the patient, a recording of the integrated(average) EMG activity from the striated muscles whichsurround the anal canal[12]. In EMG training, the patient isasked to squeeze and relax without rectal distention, andhome exercises in which the patient is required to repeatedlysqueeze the pelvic floor muscles (Kegel exercises) are usuallyadded to the training to further strengthen these muscles.Other methods of EMG recording of the pelvic flooremploy an anal plug with surface electrodes[13], very easy touse and requiring no preparation.
Sensory discrimination trainingThis is aimed at increasing the patient’s ability to perceiveand respond to rectal distention[14]. After inserting withinthe rectum a catheter-mounted balloon, the latter is inflatedwith different air volumes; the patient is then asked to signalwhen the feeling of distention is perceived, or to contractthe pelvic floor muscles in response to the distention. Forthese purposes, easily perceived distention with large volumesof air is firstly given, the volumes of distention are graduallydecreased until the patient is able to perceive them withdifficulty. Repeated distention slightly above and below thesensory threshold of the patient, coupled to the investigator’sfeedback on the accuracy of detection, teach the patient torecognize distention of even weaker intensity[3,4]. This typeof sensory training is often coupled to sphincter strengthtraining, asking the patient always to contract (as strongly aspossible) in response to rectal distention and providingfeedback on the strength of contraction and accuracy ofdetection [3,4]. Several evidences suggest that sensorydiscrimination training (aimed at reducing the threshold forperception of rectal distention) is very important for aneffective bio-feedback procedure[6-8,15]. We have recentlyevaluated 24 patients with severe, solid-stool fecalincontinence[16] by teaching them to squeeze in response torectal distention; the patients were evaluated 3 mo afterbio-feedback training, and were classified as responders(>75% decrease of incontinence episodes) or non-responders.Comparison of the two groups showed that respondersdisplayed significantly lower sensory thresholds after trainingwith respect to non-responders, but squeeze pressureswere not significantly different between groups. Sensorythresholds measured before bio-feedback training were goodpredictors of which patients would respond to it; in fact,patients with more severe sensory impairment had poorresponse to bio-feedback training[16]. Sphincter strength andseverity of fecal incontinence before bio-feedback trainingwere not useful as predictors of outcome.
METHODSMETHODSMETHODSMETHODSMETHODS
An internet-based comprehensive search strategy of theMedline and Science Citation Index was performed usingthe keywords bio-feedback and fecal incontinence, invarious combinations with the Boolean operators AND,OR, and NOT. Only articles related to human studies wereused, and manual cross-referencing was also performed.Articles published in English between January 1965 andSeptember 2004 were selected; however, a search in non-English languages and in journals was also older than 1965performed in our library. Letters were excluded, and abstractswere quoted only when the full papers were unavailable.
Usefulness of bio-feedback in fecal incontinenceMost of the available studies concerning the use of bio-feedback to treat fecal incontinence have been carried outby manometric means; however, a clear superiority ofpressure vs EMG feedback has not surfaced[17], and onlyone study aimed at comparing pressure vs EMG feedbacktraining showed no significant differences between the twotechniques[18].
Looking at all the studies available in literature regardlessof etiology, it is found that about 2/3 of patients display at leasta 75% decrease of their episodes of fecal incontinence[19,20],although only about 50% of them developed completecontinence. However, it must be stressed that (1) no uniformcriteria for defining improvement or assessing outcome havebeen adopted; (2) inclusion criteria differed; (3) treatmentprotocols varied and (4) only few prospective, randomized,parallel-group studies have been published, not enough todraw conclusions on the overall efficacy of bio-feedbacktraining. In addition, recent randomized studies have notconfirmed the optimistic outcome of previous open studies.These trials will be examined in detail in the followingparagraph.
In a first randomized controlled study, bio-feedback plusbehavioral management was compared to behavioralmanagement alone in children with fecal incontinence dueto myelomeningocele[21]; both groups displayed significantimprovement, suggesting that bio-feedback has the sameeffects as behavioral management for most children withmyelomeningocele. However, it must be stressed thatpatients with spinal cord defects show commonly worstresponses to bio-feedback than patients with incontinencedue to other causes[22]. In a second controlled study, vander Plas and coworkers studied 71 children with fecalincontinence without constipation and randomized them tostandard care and laxatives or standard care and laxativesplus bio-feedback. At 12-18 mo follow-up, approximately50% of children in both groups showed significant symptomsimprovement. A trend toward better outcome was shownin the bio-feedback group, but statistical significance wasnot reached[23]. In the first randomized study of bio-feedbackin adults with fecal incontinence, a complex cross-over designwas employed making interpretation of results quitedifficult[24]. Twenty-five patients were initially randomizedto either three sessions, sensory discrimination trainingwithout bio-feedback on sphincter strength or equivalentdistention without feedback on the accuracy of their
Chiarioni G et al. Biofeedback and fecal incontinence 4773
detection of the strength of contractions. Patients in thesensory training group had significant decrease of frequencyof episodes of incontinence with respect to controls, butbetween-group differences did not reach statisticalsignificance (probably due to small sample size). Controlpatients were then given sensory training, and displayedimprovement in continence. Thereafter, all patients wererandomized again to sphincter-strengthening exerciseswithout bio-feedback or to squeeze in response to rectaldistention with feedback. Overall, the patients had furtherimprovement of continence in this second step of the study,but no significant differences were observed between groups,suggesting that sensory training is important for the treatmentof incontinence, although the results are not definitive dueto the small size samples. Recently, the St. Mark groupreported a large, randomized, controlled study on 171adults with fecal incontinence[25]. Patients were randomizedinto four groups: (1) standard care with advice; (2) standardcare with advice plus anal sphincter exercises taught verballyand via digital examinations; (3) same as group 2 plus bio-feedback therapy run at the clinic; (4) same as group 3 plussphincter exercises guided by a home bio-feedback device.Approximately half of patients in all groups reportedimprovement of symptoms at one year follow-up. Interestingly,quality of life measurements, bowel symptoms and analsphincter pressures were improved in similar percentage inall groups. Bio-feedback therapy yielded no greater benefitthan did standard care with advice on an intention-to-treatanalysis.
This trial appears methodologically sound in mostinstances with few, relevant limitations mostly related tothe lack of details of the bio-feedback protocol used. Typeand dosage of anti-diarrheal medications used in all thegroups were also not provided. The results of this trial areat variance with a previous open study coming from thesame Center, where bio-feedback therapy was reported toimprove symptoms in the majority of patients with fecalincontinence[26]. Moreover, another prospective, randomized,controlled study comparing pelvic floor exercises plus analexercises taught via digital examination with eithermanometry or anal ultrasound-guided bio-feedback in 120adults with fecal incontinence had failed to show anyadditional benefit of behavior therapy over Kegel exercisesin terms of clinical outcome, quality of life measurements,and anal pressures[27]. In this trial, a clinical benefit was evidentin the short term in approximately 70% of all patients. Thesame group then reported this clinical benefit as substantiallypreserved in the long term follow-up[28]. Interestingly, qualityof life measurements and subjective perception of “catchingup” with incontinence improved even in patients whoseincontinence scores worsened. Therefore, intervention “per se”seems to improve subjective symptoms perception in fecalincontinence.
Do predictors of outcome existAlthough it is traditionally thought that subgroups of patients(demented, mentally retarded, young children, severelydepressed, mobility impaired) are less prone to respondto bio-feedback training, there are few data to supportthese concepts as guidelines[29]. The available data may be
summarized as follows: (1) severe mechanical damageof the anal sphincters is generally associated with poorbio-feedback responses[30,31]; (2) major sensory impairmentdetermines a poor response to bio-feedback training[16,26,32];(3) although many studies have not found the response tobio-feedback predictable on the basis of pretreatmentfindings[33-35], there are reports showing that a low basalpressure of the internal anal sphincter is associated withpoor outcomes[36]; (4) abnormally prolonged pudendalnerve conduction times are employed to identify subjectswith pudendal nerve injuries as a cause of incontinence;these measurements correlate poorly with the response tobio-feedback[37]; (5) there is no significant associationbetween fecal incontinence and anxiety or depression[38,39],the latter, however, may decrease the patient’s ability tolearn and to comply with home practice[40]; (6) the associationof constipation by outlet dysfunction may affect outcomeunfavorably[41].
Associate treatmentsThere are several reports of miscellaneous combinationsof bio-feedback with surgical procedures to treat fecalincontinence. Results described as positive have beenreported for high imperforate anus repair[42], gracilis muscletransposition[43], and anterior resection of the rectum andtotal colectomy with ileo-anal anastomosis[44]; however, allthese were uncontrolled studies, and the patient sample’swere small. Other studies associated electrical stimulationwith pelvic floor bio-feedback in a miscellaneous group ofpatients (including subjects with fecal incontinence andsubjects with constipation due to pelvic floor dysfunction),and claimed that this association was more effective that asingle approach[45]. Real-time ultrasonographic imaging ofthe pelvic floor muscles has also been employed to teachpatients with fecal incontinence to squeeze the external analsphincter[46], but the trials with this technique are still ongoing.Loening-Baucke implemented standard medical care witha pressure bio-feedback protocol in a small group of adultswith fecal incontinence. No additional benefit could beevidenced compared to standard medical care alone[47].
ConclusionsAlthough fecal incontinence is a socially devastating disorder,many physicians are still unaware that it is often amenableto treatment[48]. Recently, well-designed, randomized trialshave shown that standard medical care implemented withsimple pelvic floor exercises is effective in a large percentageof patients with fecal incontinence. Attention to diet,scheduled defecations and judicious use of anti-diarrhealmedications seem to preserve a relevant role in this“untreatable” disease. Traditionally, bio-feedback techniqueshave been rated to offer a suitable non-invasive method ofapproaching the problem superior to conservative simplertherapeutic measurements. This has not been confirmedby randomized, controlled trials. Notwithstanding thereported symptoms improvement in over 2/3 of fecallyincontinent patients shown in open trials, and the commonbelief that behavior therapy is a safe and effectivetherapeutic option for many patients with fecal incontinence,experimental evidence is giving conflicting results. Properly
designed and carefully analyzed bio-feedback trials areactually needed to prove the effectiveness of this treatmentin fecal incontinence. Meanwhile, it is reassuring to knowthat simple therapeutic measurements may effectively helpthese individuals affected by such a disabling disorder.
REFERENCESREFERENCESREFERENCESREFERENCESREFERENCES
1 Bharucha AE. Fecal incontinence. Gastroenterology 2003; 124:1672-1685
2 Bassotti G, Whitehead WE. Biofeedback as a treatment ap-proach to gastrointestinal tract disorders. Am J Gastroenterol1994; 89: 158-164
3 Bassotti G, Chiarioni G. Terapia conductual, relajaciòn, ybiorretroalimentaciòn en los trastornos funcionales del tractodigestivo inferior. In Montoro Huguet MA, ed. Principiosbàsicos de Gastroenterologìa para médicos de familia. Madrid:Jarpyo Editores 2002: 377-390
4 Whitehead WE, Heymen S, Schuster MM. Motility as atherapeutic modality: bio-feedback treatment of gastrointes-tinal disorders. In Schuster MM, Crowell MD, Koch KL, eds.Schuster Atlas of Gastrointestinal Motility, Second edition.Hamilton: BC Decker Inc 2002: 381-397
5 Sun WM, Read NW, Miner PB. Relation between sensationand anal function in normal subjects and patients with faecalincontinence. Gut 1990; 31: 1056-1061
6 Wald A, Tunuguntla AK. Anorectal sensorimotor dysfunc-tion in fecal incontinence and diabetes mellitus. Modificationwith bio-feedback therapy. N Engl J Med 1984; 310: 1282-1287
7 Buser WD, Miner PB. Delayed rectal sensation with fecalincontinence. Successful treatment using anorectal manometry.Gastroenterology 1986; 91: 1186-1191
8 Engel BT, Nikoomanesh P, Schuster MM. Operant condition-ing of rectosphincteric responses in the treatment of fecalincontinence. N Engl J Med 1974; 290: 646-649
9 Glia A, Gylin M, Akerlund JE, Lindfors U, Lindberg G. Bio-feedback training in patients with fecal incontinence. Dis Co-lon Rectum 1998; 41: 359-364
10 Patankar SK, Ferrara A, Larach SW, Williamson PR, PerozoSE, Levy JR, Mills J. Electromyographic assessment of bio-feedback training for fecal incontinence and chronicconstipation. Dis Colon Rectum 1997; 40: 907-911
11 Chiarioni G, Scattolini C, Bonfante F, Vantini I. Liquid stoolincontinence with severe urgency: anorectal function and ef-fective bio-feedback therapy. Gut 1993; 34: 1576-1580
12 Cox DJ, Sutphen J, Borowitz S, Dickens MN, Singles J, White-head WE. Simple electromyographic bio-feedback treatmentfor chronic pediatric constipation/encopresis: preliminaryreport. Biofeedback Self Regul 1994; 19: 41-50
13 Eisman E, Tries J. A new probe for measuring electromyo-graphic activity from multiple sites in the anal canal. DisColon Rectum 1993; 36: 946-952
14 Whitehead WE, Wald A, Diamant NE, Enck P, PembertonJH, Rao SSC. Functional disorders of the anus and rectum. InDrossman DA, Corazziari E, Talley NJ, Thompson WG,Whitehead WE, eds. Rome II. The functional gastrointestinaldisorders, second edition. Mc Lean, VA: Degnon Associates 2000:483-532
15 Latimer PR, Campbell D, Kasperski J. A component analy-sis of bio-feedback in the treatment of fecal incontinence. Bio-feedback Self Regul 1984; 9: 311-324
16 Chiarioni G, Bassotti G, Stanganini S, Vantini I, WhiteheadWE. Sensory retraining is key to bio-feedback therapy forformed stool fecal incontinence. Am J Gastroenterol 2002; 97:109-117
17 Heymen S, Jones KR, Ringel Y, Scarlett Y, Whitehead WE.Biofeedback treatment of fecal incontinence: a critical review.Dis Colon Rectum 2001; 44: 728-736
18 Heymen S, Wexner SD, Vickers D, Nogueras JJ, Weiss EG,Pikarsky AJ. Prospective, randomized trial comparing four
bio-feedback techniques for patients with constipation. DisColon Rectum 1999; 42: 1388-1393
19 Enck P. Biofeedback training in disordered defecation: a criti-cal review. Dig Dis Sci 1993; 38: 1953-1960
20 Rao SS, Enck P, Loenig-Baucke V. Biofeedback therapy fordefecation disorders. Dig Dis 1997; 15(Suppl 1): 78-92
21 Whitehead WE, Parker L, Bosmajian L, Morril-Corbin ED,Middaugh S, Garwood M, Cataldo MF, Freeman J. Treatmentof fecal incontinence in children with spina bifida: compari-son of bio-feedback and behavioral modification. Arch PhysMed Rehabil 1986; 67: 218-224
22 Cerulli MA, Nikoomanesh P, Schuster MM. Progress in bio-feedback conditioning for fecal incontinence. Gastroenterology1979; 76: 742-746
23 van der Plas RN, Benninga MA, Redekop WK, Taminiau JA,Buller HA. Randomised trial of bio-feedback training forencopresis. Arch Dis Childh 1996; 75: 367-374
24 Miner PB, Donnelly TC, Read NW. Investigation of mode ofaction of bio-feedback in treatment of fecal incontinence. DigDis Sci 1990; 35: 1291-1298
25 Norton C, Chelvanayagam S, Wilson-Barnett J, Redfern S,Kamm MA. Randomized controlled trial of bio-feedback forfecal incontinence. Gastroenterology 2003; 125: 1320-1329
26 Norton C, Kamm MA. Outcome of bio-feedback for faecalincontinence. Br J Surg 1999; 86: 1159-1163
27 Solomon MJ, Pager CK, Rex J, Roberts RA, Manning J.Randomized, controlled trial of bio-feedback with analmanometry, transanal ultrasound, or pelvic floor retrainingwith digital guidance alone in the treatment of mild to mod-erate fecal incontinence. Dis Colon Rectum 2003; 46: 703-710
28 Pager CK, Solomon MJ, Rex J, Roberts RA. Long-term out-comes of pelvic floor exercises and bio-feedback treatmentfor patients with fecal incontinence. Dis Colon Rectum 2002;45: 997-1003
29 Whitehead WE, Wald A, Norton NJ. Treatment options forfecal incontinence. Dis Colon Rectum 2001; 44: 131-144
30 Iwai N, Nagashima S, Shimotake T, Iwata G. Biofeedbacktherapy for fecal incontinence after surgery for anorectalmalformations: preliminary results. J Pediatr Surg 1993; 28:863-866
31 Leroi AM, Dorival MP, Lecoturier MF, Saiter C, Welter ML,Touchais JY, Denis P. Pudendal neuropathy and severity ofincontinence but not presence of an anal sphincter defect maydetermine the response to bio-feedback therapy in fecalincontinence. Dis Colon Rectum 1999; 42: 762-769
32 Kraemer M, Ho YH, Tan W. Effectiveness of anorectal bio-feedback therapy for faecal incontinence: medium-termresults. Tech Coloproctol 2001; 5: 125-129
33 Sangwan YP, Coller JA, Barrett RC, Roberts PL, Murray JJ,Schoetz DJ. Can manometric parameters predict response tobio-feedback therapy in fecal incontinence? Dis Colon Rectum1995; 38: 1021-1025
34 Keck JO, Staniunas RJ, Coller JA, Barrett RC, Oster ME,Schoetz DJ, Roberts PL, Murray JJ, Veidenheimer MC.Biofeedback training is useful in fecal incontinence butdisappointing in constipation. Dis Colon Rectum 1994; 37:1271-1276
35 Ferrara A, De Jesus S, Gallagher JT, Williamson PR, LarachSW, Pappas D, Mills J, Sepulveda JA. Time-related decay ofthe benefits of bio-feedback therapy. Tech Coloproctol 2001; 5:131-135
36 Hamalainen KJ, Raivio P, Antila S, Palmu A, Mecklin JP.Biofeedback therapy in rectal prolapse patients. Dis ColonRectum 1996; 39: 262-265
37 Diamant NE, Kamm MA, Wald A, Whitehead WE. AGAtechnical review on anorectal testing technique. Gastroenterol-ogy 1999; 116: 735-760
38 Nelson R, Furner S, Jesudason V. Fecal incontinence in Wis-consin nursing homes: prevalence and association. Dis ColonRectum 1998; 41: 1226-1229
39 Heymen S, Wexner SD, Gulledge AD. MMPI assessment ofpatients with functional bowel disorders. Dis Colon Rectum
4774 ISSN 1007-9327 CN 14-1219/ R World J Gastroenterol August 21, 2005 Volume 11 Number 31

1993; 36: 593-59640 American Psychiatric Association. Diagnostic and statistical
manual of mental disorders, 4th ed rev. American PsychiatricAssociation, Washington (DC), 1999
41 Fernandez-Fraga X, Azpiroz F, Aparici A, Casaus M,Malagelada JR. Predictors of response to bio-feedback treatmentin anal incontinence. Dis Colon Rectum 2003; 46: 1218-1225
42 Arnbjorsson E, Breland U, Kullendorff CM, Michaelsson C,Okmian L. Physiotherapy to improve faecal control afterStephen’s rectoplasty in high imperforate anus. ZKinderchirurgie 1986; 41: 101-103
43 Sielezneff I, Bauer S, Bulgare JC, Sarles JC. Gracilis muscletransposition in the treatment of faecal incontinence. Int JColorect Dis 1996; 11: 15-18
44 Ho YH, Chiang JM, Tan M, Low JY. Biofeedback therapy for
excessive stool frequency and incontinence following ante-rior resection or total colectomy. Dis Colon Rectum 1996; 39:1289-1292
45 Menard C, Trudel C, Cloutier R. Anal reeducation for post-operative fecal incontinence in congenital diseases of the rec-tum and anus. J Pediatr Surg 1997; 32: 867-869
46 Solomon MJ, Rex J, Eyers AA, Stewart P, Roberts R. Biofeed-back for fecal incontinence using transanal ultrasonography.Dis Colon Rectum 2000; 43: 788-792
47 Loening-Baucke V. Efficacy of bio-feedback training in im-proving faecal incontinence and anorectal physiologic function.Gut 1990; 31: 1395-1402
48 Rudolph W, Galandiuk S. A practical guide to the diagnosisand management of fecal incontinence. Mayo Clin Proc 2002;77: 271-275
Science Editor Guo SY Language Editor Elsevier HK
Chiarioni G et al. Biofeedback and fecal incontinence 4775
• GASTRIC CANCER •
Preventing prolonged post-operative ileus in gastric cancer patients
undergoing gastrectomy and intra-peritoneal chemotherapy
De-Chuan Chan, Yao-Chi Liu, Cheng-Jueng Chen, Jyh-Cherng Yu, Heng-Cheng Chu, Fa-Chang Chen, Teng-Wei Chen,
Huan-Fa Hsieh, Tzu-Ming Chang, Kuo-Liang Shen
ELSEVIER
PO Box 2345, Beijing 100023, China World J Gastroenterol 2005;11(31):4776-4781www.wjgnet.com World Journal of Gastroenterology ISSN [email protected] © 2005 The WJG Press and Elsevier Inc. All rights reserved.
De-Chuan Chan, Yao-Chi Liu, Cheng-Jueng Chen, Jyh-CherngYu, Teng-Wei Chen, Kuo-Liang Shen, Division of GeneralSurgery, Tri-Service General Hospital, National Defense MedicalCenter, National Defense University, Taipei, Taiwan, ChinaHeng-Cheng Chu, Division of Gastroenterology and Hepatology,Department of Internal Medicine, Tri-Service General Hospital,National Defense Medical Center, National Defense University,Taipei, Taiwan, ChinaFa-Chang Chen, Department of Anesthesiology, Tri-Service GeneralHospital, National Defense Medical Center, National DefenseUniversity, Taipei, Taiwan, ChinaHuan-Fa Hsieh, Yee-Zen General Hospital, Taoyuan, Taiwan, ChinaTzu-Ming Chang, Department of Surgery, Shalu Tungs’ MemorialHospital, Tai-Chung, Taiwan, ChinaCorrespondence to: Dr. De-Chuan Chan, Division of General Surgery,National Defense Medical Center, National Defense University,Taipei 114, Taiwan, China. [email protected]: +886-2-87927191 Fax: +886-2-87927372Received: 2005-01-11 Accepted: 2005-01-26
AbstractAbstractAbstractAbstractAbstract
AIM: To assess the efficacy of metoclopramide (Met) forprevention of prolonged post-operative ileus in advancedgastric cancer patients undergoing D2 gastrectomy andintra-peritoneal chemotherapy (IPC).
METHODS: Thirty-two advanced gastric cancer patientsundergoing D2 gastrectomy and IPC were allocated totwo groups. Sixteen patients received Met immediatelyafter operation (group A), and 16 did not (group B). Another16 patients who underwent D2 gastrectomy without IPCwere enrolled as the control group (group C). All patientshad received epidural pain control. The primary endpointswere time to first post-operative flatus and time until oralfeeding with a soft diet without discomfort. Secondaryendpoints were early complications during hospitalization.
RESULTS: Gender, the type of resection, operating time,blood loss, tumor status and amount of narcotics werecomparable in the three groups. However, the group C patientswere older than those in groups A and B (67.5±17.7 vs
56.8±13.2, 57.5±11.7 years, P = 0.048). First bowel flatusoccurred after 4.35±0.93 d in group A, 4.94±1.37 d in groupB, and 4.71±1.22 d in group C (P>0.05). Oral feeding of asoft diet was tolerated 7.21±1.92 d after operation in groupA, 10.15±2.17 d in group B, and 7.53±1.35 d in group C(groups A and C vs group B, P<0.05). There was no significantdifference in respect to the first flatus among the threegroups. However, the time of tolerating oral intake withsoft food in groups A and C patients was significantly
shorter than that in group B patients. Levels of C-reactiveprotein (CRP) were significantly lower in group C andthere was a more prominent and prolonged response inCRP level in patients undergoing IPC. The incidence ofpost-operative complications was similar in the threegroups except for prolonged post-operative ileus. Therewas no increased risk of anastomotic leakage in patientsreceiving Met.
CONCLUSION: The results suggest that a combinationof intravenous Met and epidural pain control may berequired to achieve a considerable decrease in time toresumption of oral soft diet in advanced gastric cancerpatients who underwent gastrectomy and IPC. Furthermore,the administration of Met did not increase anastomoticleakage. Met has a role in the prevention of prolongedpost-operative ileus.
© 2005 The WJG Press and Elsevier Inc. All rights reserved.
Key words: Metoclopramide; C-reactive protein; Gastriccancer; Intraperitoneal chemotherapy
Chan DC, Liu YC, Chen CJ, Yu JC, Chu HC, Chen FC, ChenTW, Hsieh HF, Chang TM, Shen KL. Preventing prolongedpost-operative ileus in gastric cancer patients undergoinggastrectomy and intra-peritoneal chemotherapy. World J
Gastroenterol 2005; 11(31): 4776-4781
http://www.wjgnet.com/1007-9327/11/4776.asp
INTRODUCTIONINTRODUCTIONINTRODUCTIONINTRODUCTIONINTRODUCTION
The long-term results of treatment for resectable gastriccancer have not shown any significant improvement inrecent decades[1]. Analyses of surgical treatment failure aftercurative resection have indicated intra-peritoneal recurrenceis the major pattern of tumor recurrence[2]. Large randomizedtrials of intravenous or radiotherapy have failed to demonstrateany benefit for lowering intra-peritoneal recurrence[3,4].
Therefore, intra-peritoneal chemotherapy (IPC) asan adjuvant to surgery, may be considered as a rationaltherapeutic modality.
Although the role of IPC in treating peritoneal seedingor preventing peritoneal recurrence for advanced gastriccancer is still controversial, its use in prophylactic treatmentin potentially curative gastric cancer resection has shownimproved survival and lower peritoneal recurrence rates inJapan and Korea[5,6]. There are some prospective randomizedtrials that have shown a patient with surgery plus IPC was
1.3 more times more likely to survive 5 years than a patientwith surgery alone[6]. However, prolonged post-operative ileus(POI) is one of the most commonly reported complicationsof IPC[7-9]. In the situation of an immunocompromised conditioninduced by surgical trauma, cancer, and chemotherapy,prolonged gastro-intestinal (GI) tract stasis can increase thepotential for bacterial overgrowth and translocation,potentially leading to systemic sepsis and multiple organfailure, both of which are the most prevalent post-operativecomplications causing death[10,11].
To our knowledge, there are few reports concerningaggressive treatment or prevention of POI in patientsundergoing IPC. Most treatments for this problem are largelysupportive, including naso-gastric (NG) decompression,intravenous hydration and parenteral nutrition.
Metoclopramide (Met) antagonizes central and peripheraldopamine receptors and sensitizes GI tract receptors toacetylcholine[12-14]. These actions increase peristalsis in theantrum, duodenum, and jejunum and increase the loweresophageal pressure. In previous studies about the effectof Met on intestinal motility, major surgical procedures havenot been combined with intensive regional chemotherapy.The incidence of prolonged POI was reported as relativelylow and the prophylactic use of Met as seemingly unnecessaryor ineffective[15-19].
The present study was a prospective, controlled trialin which only gastric cancer patients who underwentsub-total or total gastrectomy were enrolled. The aim ofthe study was to assess the effects of Met on the IPC-inducedileus.
MAMAMAMAMATERIALS AND METHODSTERIALS AND METHODSTERIALS AND METHODSTERIALS AND METHODSTERIALS AND METHODS
This study was approved by the institutional review boardof Tri-Service General Hospital and informed consent wasobtained from patients and family members. It was aprospective, controlled study conducted in the abovehospital from March 2001 to October 2004, involvingpatients lesser than 70 years who had undergone R0curative gastrectomy with D2 lymph node, i.e., N1 and N2,dissection[20] followed by IPC for advanced gastric cancer,including T3 (serosal penetration) or T4 (invasion of adjacentorgans), according to the Japanese Classification of GastricCarcinoma[21]. The type of resection, total or sub-total gastre-ctomy, depended on the location and Bormann type ofprimary tumor. After the potentially curative operation wasperformed, the peritoneal cavity was extensively washed,using seven liters of physiologic saline (1 L, seven times),followed by IPC with mitomycin-C (MMC) 10 mg in 1 Lnormal saline, for 60 min for all patients. The patients wereallocated into two groups of 16 patients each. Patients in groupA received intravenous Met 10 mg, every 8 h, commencingimmediately after completion of the operation and continueduntil oral feeding with soft diet was resumed or abdominalcramping pain developed. Patients in group B received anequivalent volume of 5% dextrose in water, and did notreceive Met. A control group (group C) of further 16 patientsdid not receive IPC and Met. All patients had receivedepidural pain control for the first three post-operative days,and then pain control was changed to intramuscular meperidine
on post-operative day (POD) four in three groups.
Epidural pain controlBefore surgery, a thoracic epidural catheter was inserted atT8-T10 and advanced 5 cm into the epidural space. A test doseof 3 mL of 2% lidocaine containing epinephrine (5 µg/mL)was administered to rule out intra-thecal or intravascularmisplacement. After pre-operative assessment of the epiduralblock, general anesthesia was induced with fentanyl (2 µg/kg),cisatracurium (2 mg), thiamylal (3-5 mg/kg), and lidocaine(1.5 mg/mg) by intravenous (IV) administration, and trachealintubation was facilitated with succinylcholine (1.5 mg/mg).General anesthesia was maintained with desflurane in oxygen(300 mL/min) in a totally closed circuit system where the end-tidal desflurane concentration was maintained at 7.5±0.5%.Cisatracurium was used for muscle relaxation. No additionalintravenous opioid was given during operation. Standardmonitors included pulse oximetry, electrocardiography,central venous pressure measurement, and intra-arterialpressure measurement via a radial artery catheter. At the endof surgery, the residual neuromuscular block was antagonizedwith edrophonium (4 mg) and atropine (0.6 mg); theendotracheal tube was removed when the patient breathedspontaneously. After surgery, all patients received a uniformepidural pain control regimen consisting of morphine (1 mg)in 10 mL of 0.095% bupivacaine every 8 h until 72 h. If painrelief was insufficient, meperidine (50 mg every 6 h) wasgiven. Acetaminophen tablets or meperidine were administeredafter termination of epidural pain control.
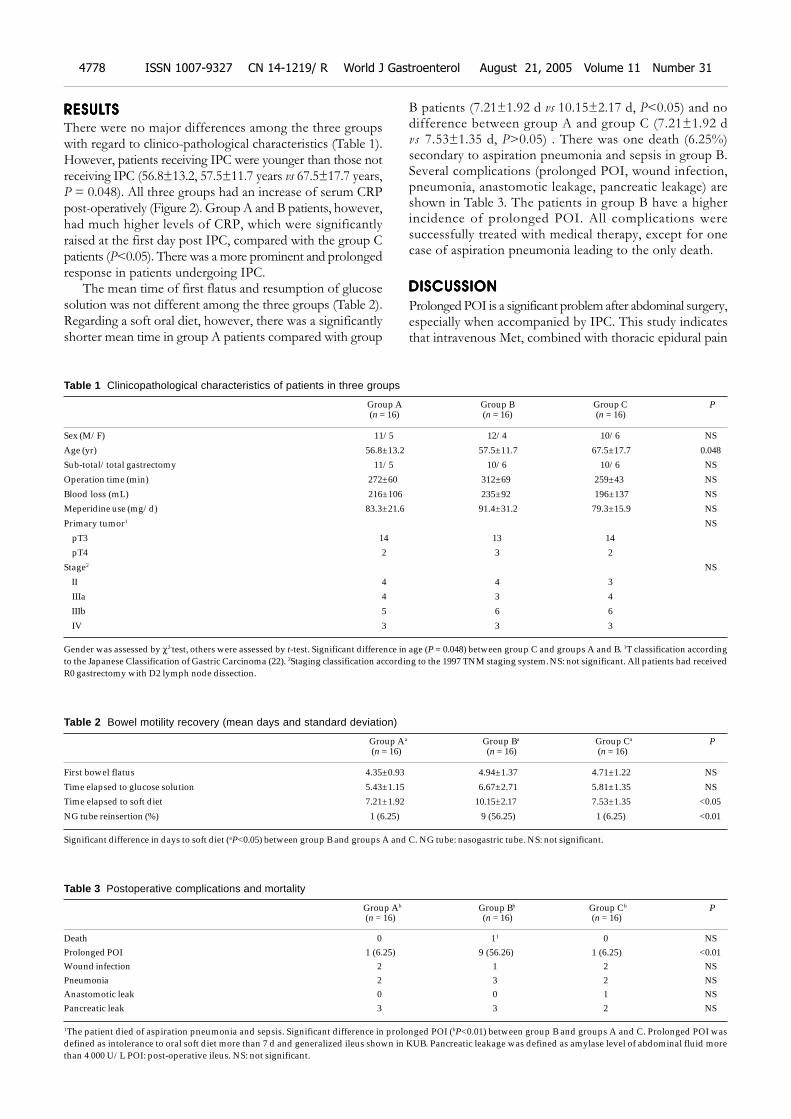
Postoperative careSerum electrolytes were monitored and corrected in thefirst seven post-operative days for all patients. SerumC-reactive protein (CRP) levels and abdominal drainage fluidamylase levels were determined post-operatively in all patients.Pancreatic leakage was suspected if the amylase levels ofabdominal drainage fluid rose to more than 4 000 U/L[22].NG tubes were removed immediately after operation inpatients receiving a total gastrectomy and maintained forone day in patients receiving a sub-total gastrectomy.Indication of NG tube reinsertion was biliary vomiting orabdominal distension. Oral intake with 5% glucose solutionresumed immediately after the first bowel flatus, and thenprogressed to a soft diet two days later, if no abdominaldiscomfort developed. Patients who could not resume oralintake of a soft diet beyond the seventh POD and havegeneralized ileus shown in plain abdominal x-ray film (KUB)(Figure 1), were defined as having prolonged POI. Theepidural catheter was removed routinely on the third POD(approximately 72 h after surgery). The main aim of thestudy was to compare the length of time of IPC-inducedileus. Therefore, data collected included time to the firstpost-operative bowel flatus, and number of days requiredfor patients to tolerate a soft oral diet. Narcotic use wasrecorded for comparison among the three groups. Otherinformation analyzed included operation time, type ofresection, blood loss, and complications.
Student’s t-test, Fisher exact test or the Mann-WhitneyU-test were used in the statistical analysis. Probabilities ofless than 0.05 were accepted as significant.
Chan DC et al. Metoclopramide prevents post-operative ileus in gastric cancer 4777
RESULRESULRESULRESULRESULTSTSTSTSTS
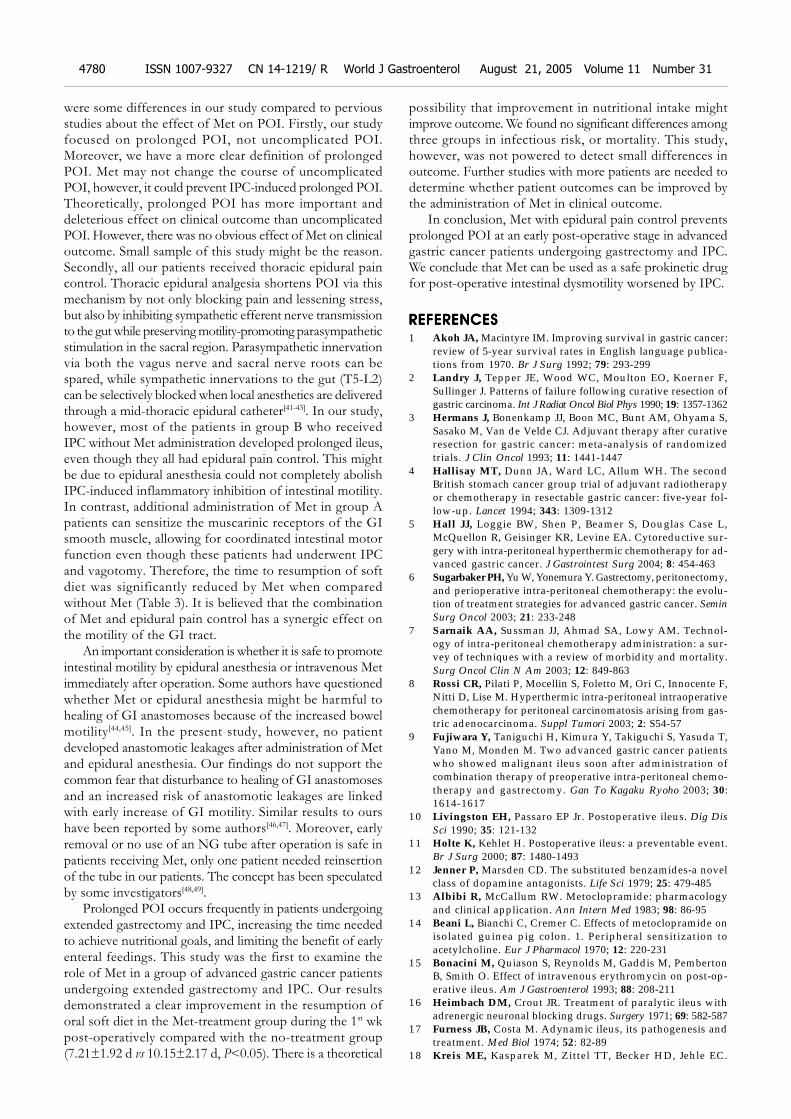
There were no major differences among the three groupswith regard to clinico-pathological characteristics (Table 1).However, patients receiving IPC were younger than those notreceiving IPC (56.8±13.2, 57.5±11.7 years vs 67.5±17.7 years,P = 0.048). All three groups had an increase of serum CRPpost-operatively (Figure 2). Group A and B patients, however,had much higher levels of CRP, which were significantlyraised at the first day post IPC, compared with the group Cpatients (P<0.05). There was a more prominent and prolongedresponse in patients undergoing IPC.
The mean time of first flatus and resumption of glucosesolution was not different among the three groups (Table 2).Regarding a soft oral diet, however, there was a significantlyshorter mean time in group A patients compared with group
B patients (7.21±1.92 d vs 10.15±2.17 d, P<0.05) and nodifference between group A and group C (7.21±1.92 dvs 7.53±1.35 d, P>0.05) . There was one death (6.25%)secondary to aspiration pneumonia and sepsis in group B.Several complications (prolonged POI, wound infection,pneumonia, anastomotic leakage, pancreatic leakage) areshown in Table 3. The patients in group B have a higherincidence of prolonged POI. All complications weresuccessfully treated with medical therapy, except for onecase of aspiration pneumonia leading to the only death.
DISCUSSIONDISCUSSIONDISCUSSIONDISCUSSIONDISCUSSION
Prolonged POI is a significant problem after abdominal surgery,especially when accompanied by IPC. This study indicatesthat intravenous Met, combined with thoracic epidural pain
Table 1 Clinicopathological characteristics of patients in three groups
Group A Group B Group C P (n = 16) (n = 16) (n = 16)
Sex (M/F) 11/5 12/4 10/6 NS
Age (yr) 56.8±13.2 57.5±11.7 67.5±17.7 0.048
Sub-total/total gastrectomy 11/5 10/6 10/6 NS
Operation time (min) 272±60 312±69 259±43 NS
Blood loss (mL) 216±106 235±92 196±137 NS
Meperidine use (mg/d) 83.3±21.6 91.4±31.2 79.3±15.9 NS
Primary tumor1 NS
pT3 14 13 14
pT4 2 3 2
Stage2 NS
II 4 4 3
IIIa 4 3 4
IIIb 5 6 6
IV 3 3 3
Gender was assessed by χ2-test, others were assessed by t-test. Significant difference in age (P = 0.048) between group C and groups A and B. 1T classification accordingto the Japanese Classification of Gastric Carcinoma (22). 2Staging classification according to the 1997 TNM staging system. NS: not significant. All patients had receivedR0 gastrectomy with D2 lymph node dissection.
Table 2 Bowel motility recovery (mean days and standard deviation)
Group Aa Group Ba Group Ca P (n = 16) (n = 16) (n = 16)
First bowel flatus 4.35±0.93 4.94±1.37 4.71±1.22 NS
Time elapsed to glucose solution 5.43±1.15 6.67±2.71 5.81±1.35 NS
Time elapsed to soft diet 7.21±1.92 10.15±2.17 7.53±1.35 <0.05
NG tube reinsertion (%) 1 (6.25) 9 (56.25) 1 (6.25) <0.01
Significant difference in days to soft diet (aP<0.05) between group B and groups A and C. NG tube: nasogastric tube. NS: not significant.
Table 3 Postoperative complications and mortality
Group Ab Group Bb Group Cb P(n = 16) (n = 16) (n = 16)
Death 0 11 0 NSProlonged POI 1 (6.25) 9 (56.26) 1 (6.25) <0.01Wound infection 2 1 2 NSPneumonia 2 3 2 NSAnastomotic leak 0 0 1 NSPancreatic leak 3 3 2 NS
1The patient died of aspiration pneumonia and sepsis. Significant difference in prolonged POI (bP<0.01) between group B and groups A and C. Prolonged POI wasdefined as intolerance to oral soft diet more than 7 d and generalized ileus shown in KUB. Pancreatic leakage was defined as amylase level of abdominal fluid morethan 4 000 U/L POI: post-operative ileus. NS: not significant.
4778 ISSN 1007-9327 CN 14-1219/ R World J Gastroenterol August 21, 2005 Volume 11 Number 31
control, could effectively prevent prolonged IPC-inducedileus in gastric cancer patients. Further it is indicated thatthe administration of intravenous Met in patients receivingGI resection does not increase the risk of leakage of thenewly constructed GI anastomosis.
IPC, with or without hyperthermia, has been usedsuccessfully for a variety of intra-abdominal malignancies,especially ovarian and GI tract cancer[23,24]. Although ithas many advantages, such as a high cytotoxic level ofintra-peritoneal drug and less systemic toxicity, it is associatedwith morbidity. Prolonged POI is one of the most consistentand common side effect[7,8,25,26]. Prolonged POI was alsoobserved in our study in which intra-peritoneal infusionof MMC was performed in 32 patients. Of these patients,10 (31.2%) developed prolonged POI, especially in groupB (56.25%). This is a higher incidence compared with aprevious report that indicated an incidence of 42%. Thereason of the higher incidence might partly be due to usgiving a more clear definition of prolonged POI in ourstudy.
POI is a poorly understood complication in post-surgicalpatients. The autonomic nervous system, inflammatorymediators, neurotransmitters, and opioid receptors have allbeen implicated in the pathophysiology of POI[27-32]. With
respect to the inflammatory response to surgery, Cannonand Murphy demonstrated in 1906 that opening the peritoneumin dogs and surgical manipulation of the bowel resulted indecreased peristalsis[33]. More recently Kalff et al.[31], showedan association between bowel manipulation and impairedcontractile activity, noting increased neutrophil infiltrationof the muscularis. Surgical manipulation of the bowel andsubsequent ileus has been linked to the release of inflammatorymediators from WBC. The inflammatory mediators releasedas part of a stress response contributes to the developmentof POI. In general, it is characterized as a temporary impairmentof intestinal motility after surgery. Usually different areasof the GI tract resume function at different times. Thestomach can take 24-48 h to recover, whereas the colonrequires 72-120 h to resume normal motility patterns. Thus,uncomplicated POI resolves spontaneously after approximately3-5 d[34,35]. Moreover, some studies indicated that after 7 dof fasting, the intestinal mass decreased by nearly 50%,which might increase the risk of bacterial translocation andseptic complications[36-38]. Therefore, we made a definitionof prolonged POI as intolerance of soft diet exceeding 7 dafter operation and generalized ileus in KUB. Abdominalsurgical procedures may be responsible for the uncomplicatedPOI. However, extensive surgical procedures, IPC, or acombination of both, may be responsible for prolongedileus. Stimulation in the small intestine, such as mechanicalinflammation after surgical manipulation, may be enhancedby chemical inflammation after IPC, and thus prolongreasonably predictable uncomplicated POI. This was clearlyobserved in our study which indicated that more patientsreceiving IPC developed prolonged POI than patients notreceiving IPC. Indeed, the concentration of acute phaseprotein (CRP) in the blood samples of the patients receivingIPC exceeded the level in patients not receiving IPC, suggestingIPC may worsen POI by increasing an inflammatory response.
Prolonged POI and GI tract stasis, in the situation ofan immuno-compromised condition induced by cancer,surgical trauma and chemotherapy, will increase the potentialfor bacterial overgrowth and translocation, which could leadto systemic sepsis and multiple organ failure. Both thesepost-operative complications are the most prevalent causesof death[9,10]. Clearly, it is important to find a strategy forpreventing or treating these problems.
Met has been used as a prokinetic agent for many yearsand may potentially influence motility throughout the GItract[11-13]. It has both a central and peripheral anti-dopamineeffect as well as a direct and indirect stimulatory effect oncholinergic receptors. Dopaminergic receptors have beenidentified throughout the GI tract. It has also been suggestedthat the prokinetic effect of Met may be due to the stimulatoryeffect on cholinergic receptors and the blockade of dopaminereceptors that inhibit the release of acetylcholine. Thisinhibition of dopamine and augmentation of acetylcholinerelease are thought to sensitize the muscarinic receptors ofthe GI smooth muscle, allowing for coordinated intestinalmotor function. However, results of several studies on theeffect of Met on POI have been varied. Some studies havesupported the hypothesis that Met reduces the length ofPOI[39,40], whereas others refute it[14-19]. In this study, the effectof Met on preventing prolonged POI was obvious. There
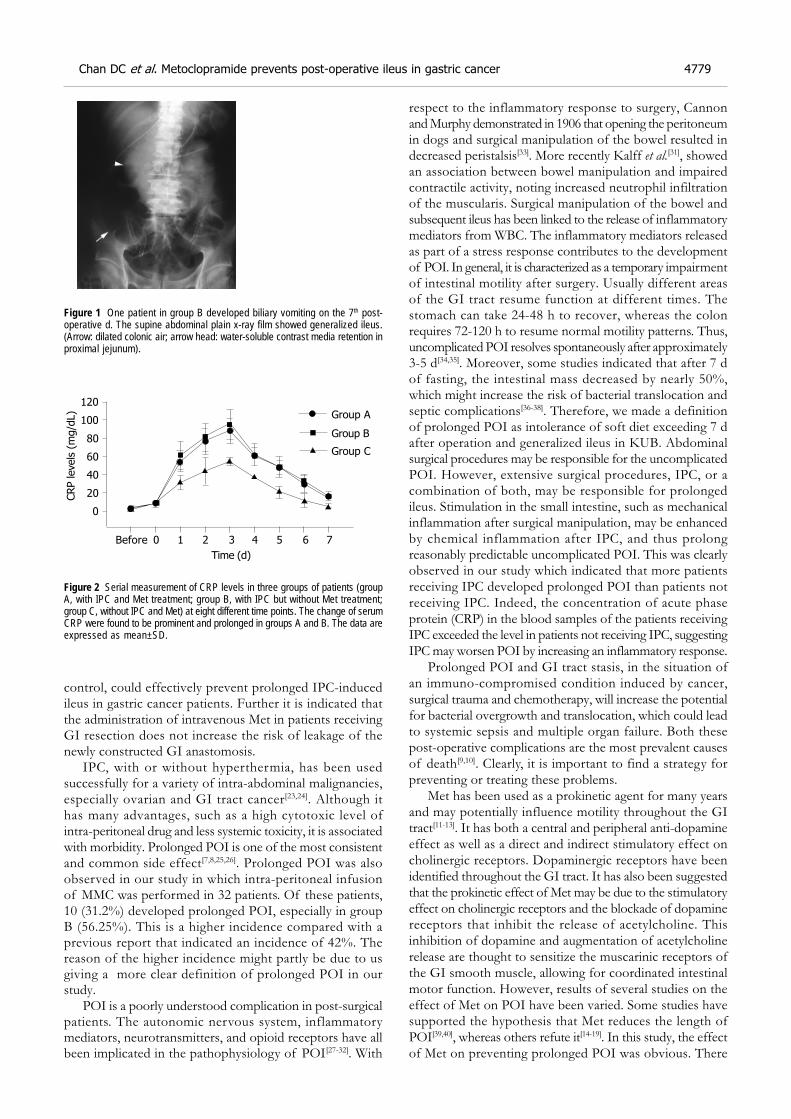
Figure 1 One patient in group B developed biliary vomiting on the 7th post-operative d. The supine abdominal plain x-ray film showed generalized ileus.(Arrow: dilated colonic air; arrow head: water-soluble contrast media retention inproximal jejunum).
Figure 2 Serial measurement of CRP levels in three groups of patients (groupA, with IPC and Met treatment; group B, with IPC but without Met treatment;group C, without IPC and Met) at eight different time points. The change of serumCRP were found to be prominent and prolonged in groups A and B. The data areexpressed as mean±SD.
CRP levels
(m
g/d
L)
Before 0 1 2 3 4 5 6 7
Time (d)
120
100
80
60
40
20
0
Group A
Group B
Group C
Chan DC et al. Metoclopramide prevents post-operative ileus in gastric cancer 4779
were some differences in our study compared to perviousstudies about the effect of Met on POI. Firstly, our studyfocused on prolonged POI, not uncomplicated POI.Moreover, we have a more clear definition of prolongedPOI. Met may not change the course of uncomplicatedPOI, however, it could prevent IPC-induced prolonged POI.Theoretically, prolonged POI has more important anddeleterious effect on clinical outcome than uncomplicatedPOI. However, there was no obvious effect of Met on clinicaloutcome. Small sample of this study might be the reason.Secondly, all our patients received thoracic epidural paincontrol. Thoracic epidural analgesia shortens POI via thismechanism by not only blocking pain and lessening stress,but also by inhibiting sympathetic efferent nerve transmissionto the gut while preserving motility-promoting parasympatheticstimulation in the sacral region. Parasympathetic innervationvia both the vagus nerve and sacral nerve roots can bespared, while sympathetic innervations to the gut (T5-L2)can be selectively blocked when local anesthetics are deliveredthrough a mid-thoracic epidural catheter[41-43]. In our study,however, most of the patients in group B who receivedIPC without Met administration developed prolonged ileus,even though they all had epidural pain control. This mightbe due to epidural anesthesia could not completely abolishIPC-induced inflammatory inhibition of intestinal motility.In contrast, additional administration of Met in group Apatients can sensitize the muscarinic receptors of the GIsmooth muscle, allowing for coordinated intestinal motorfunction even though these patients had underwent IPCand vagotomy. Therefore, the time to resumption of softdiet was significantly reduced by Met when comparedwithout Met (Table 3). It is believed that the combinationof Met and epidural pain control has a synergic effect onthe motility of the GI tract.
An important consideration is whether it is safe to promoteintestinal motility by epidural anesthesia or intravenous Metimmediately after operation. Some authors have questionedwhether Met or epidural anesthesia might be harmful tohealing of GI anastomoses because of the increased bowelmotility[44,45]. In the present study, however, no patientdeveloped anastomotic leakages after administration of Metand epidural anesthesia. Our findings do not support thecommon fear that disturbance to healing of GI anastomosesand an increased risk of anastomotic leakages are linkedwith early increase of GI motility. Similar results to ourshave been reported by some authors[46,47]. Moreover, earlyremoval or no use of an NG tube after operation is safe inpatients receiving Met, only one patient needed reinsertionof the tube in our patients. The concept has been speculatedby some investigators[48,49].
Prolonged POI occurs frequently in patients undergoingextended gastrectomy and IPC, increasing the time neededto achieve nutritional goals, and limiting the benefit of earlyenteral feedings. This study was the first to examine therole of Met in a group of advanced gastric cancer patientsundergoing extended gastrectomy and IPC. Our resultsdemonstrated a clear improvement in the resumption oforal soft diet in the Met-treatment group during the 1st wkpost-operatively compared with the no-treatment group(7.21±1.92 d vs 10.15±2.17 d, P<0.05). There is a theoretical
possibility that improvement in nutritional intake mightimprove outcome. We found no significant differences amongthree groups in infectious risk, or mortality. This study,however, was not powered to detect small differences inoutcome. Further studies with more patients are needed todetermine whether patient outcomes can be improved bythe administration of Met in clinical outcome.
In conclusion, Met with epidural pain control preventsprolonged POI at an early post-operative stage in advancedgastric cancer patients undergoing gastrectomy and IPC.We conclude that Met can be used as a safe prokinetic drugfor post-operative intestinal dysmotility worsened by IPC.
REFERENCESREFERENCESREFERENCESREFERENCESREFERENCES
1 Akoh JA, Macintyre IM. Improving survival in gastric cancer:review of 5-year survival rates in English language publica-tions from 1970. Br J Surg 1992; 79: 293-299
2 Landry J, Tepper JE, Wood WC, Moulton EO, Koerner F,Sullinger J. Patterns of failure following curative resection ofgastric carcinoma. Int J Radiat Oncol Biol Phys 1990; 19: 1357-1362
3 Hermans J, Bonenkamp JJ, Boon MC, Bunt AM, Ohyama S,Sasako M, Van de Velde CJ. Adjuvant therapy after curativeresection for gastric cancer: meta-analysis of randomizedtrials. J Clin Oncol 1993; 11: 1441-1447
4 Hallisay MT, Dunn JA, Ward LC, Allum WH. The secondBritish stomach cancer group trial of adjuvant radiotherapyor chemotherapy in resectable gastric cancer: five-year fol-low-up. Lancet 1994; 343: 1309-1312
5 Hall JJ, Loggie BW, Shen P, Beamer S, Douglas Case L,McQuellon R, Geisinger KR, Levine EA. Cytoreductive sur-gery with intra-peritoneal hyperthermic chemotherapy for ad-vanced gastric cancer. J Gastrointest Surg 2004; 8: 454-463
6 Sugarbaker PH, Yu W, Yonemura Y. Gastrectomy, peritonectomy,and perioperative intra-peritoneal chemotherapy: the evolu-tion of treatment strategies for advanced gastric cancer. SeminSurg Oncol 2003; 21: 233-248
7 Sarnaik AA, Sussman JJ, Ahmad SA, Lowy AM. Technol-ogy of intra-peritoneal chemotherapy administration: a sur-vey of techniques with a review of morbidity and mortality.Surg Oncol Clin N Am 2003; 12: 849-863
8 Rossi CR, Pilati P, Mocellin S, Foletto M, Ori C, Innocente F,Nitti D, Lise M. Hyperthermic intra-peritoneal intraoperativechemotherapy for peritoneal carcinomatosis arising from gas-tric adenocarcinoma. Suppl Tumori 2003; 2: S54-57
9 Fujiwara Y, Taniguchi H, Kimura Y, Takiguchi S, Yasuda T,Yano M, Monden M. Two advanced gastric cancer patientswho showed malignant ileus soon after administration ofcombination therapy of preoperative intra-peritoneal chemo-therapy and gastrectomy. Gan To Kagaku Ryoho 2003; 30:1614-1617
10 Livingston EH, Passaro EP Jr. Postoperative ileus. Dig DisSci 1990; 35: 121-132
11 Holte K, Kehlet H. Postoperative ileus: a preventable event.Br J Surg 2000; 87: 1480-1493
12 Jenner P, Marsden CD. The substituted benzamides-a novelclass of dopamine antagonists. Life Sci 1979; 25: 479-485
13 Albibi R, McCallum RW. Metoclopramide: pharmacologyand clinical application. Ann Intern Med 1983; 98: 86-95
14 Beani L, Bianchi C, Cremer C. Effects of metoclopramide onisolated guinea pig colon. 1. Peripheral sensitization toacetylcholine. Eur J Pharmacol 1970; 12: 220-231
15 Bonacini M, Quiason S, Reynolds M, Gaddis M, PembertonB, Smith O. Effect of intravenous erythromycin on post-op-erative ileus. Am J Gastroenterol 1993; 88: 208-211
16 Heimbach DM, Crout JR. Treatment of paralytic ileus withadrenergic neuronal blocking drugs. Surgery 1971; 69: 582-587
17 Furness JB, Costa M. Adynamic ileus, its pathogenesis andtreatment. Med Biol 1974; 52: 82-89
18 Kreis ME, Kasparek M, Zittel TT, Becker HD, Jehle EC.
4780 ISSN 1007-9327 CN 14-1219/ R World J Gastroenterol August 21, 2005 Volume 11 Number 31
Neostigmine increases post-operative colonic motility inpatients undergoing colorectal surgery. Surgery 2001; 130:449-456
19 Jepsen S, Klaerke A, Nielsen PH, Simonsen O. Negative ef-fect of Metoclopramide in post-operative adynamic ileus. Aprospective, randomized, double blind study. Br J Surg 1986;73: 290-291
20 Maruyama K, Okabayashi K, Kinoshita T. Progress in gas-tric cancer surgery in Japan and its limits of radicality. WorldJ Surg 1987; 11: 418-425
21 Japanese Gastric Cancer Association. Gastric cancer. In: Japa-nese Classification of Gastric Carcinoma. 2nd English ed. 1998:10-24
22 Sano T, Sasako M, Katai H, Maruyama K. Amylase concen-tration of drainage fluid after total gastrectomy. Br J Surg1997; 84: 1310-1312
23 Zanon C, Clara R, Chiappino I, Bortolini M, Cornaglia S,Simone P, Bruno F, De Riu L, Airoldi M, Pedani F. Cytoreductivesurgery and intra-peritoneal chemohyperthermia for recur-rent peritoneal carcinomatosis from ovarian cancer. World JSurg 2004; 28: 1040-1045
24 Yano M, Yasuda T, Fujiwara Y, Takiguchi S, Miyata H,Monden M. Preoperative intra-peritoneal chemotherapy forpatients with serosa-infiltrating gastric cancer. Surg Oncol 2004;88: 39-43
25 van der Vange N, van Goethem AR, Zoetmulder FA, KaagMM, van de Vaart PJ, ten Bokkel Huinink WW, Beijnen JH.Extensive cytoreductive surgery combined with intra-opera-tive intra-peritoneal perfusion with cisplatin under hyper-thermic conditions (OVHIPEC) in patients with recurrentovarian cancer: a feasibility pilot. Eur J Surg Onco 2000; 26:663-668
26 Gilly FN, Beaujard A, Glehen O, Grandclement E, Caillot JL,Francois Y, Sadeghi-Looyeh B, Gueugniaud PY, Garbit F,Benoit M, Bienvenu J, Vignal J. Peritonectomy combined withintra-peritoneal chemohyperthermia in abdominal cancer withperitoneal carcinomatosis: phase I-II study. Anticancer Res1999; 19: 2317-2321
27 Bauer AJ, Boeckxstaens GE. Mechanisms of post-operativeileus. Neurogastroenterol Motil 2004; 16 (Suppl 2): 54-60
28 Luckey A, Livingston E, Tache Y. Mechanisms and treatmentof post-operative ileus. Arch Surg 2003; 138: 206-214
29 Barquist E, Bonaz B, Martinez V, Rivier J, Zinner MJ, Tache Y.Neuronal pathways involved in abdominal surgery-inducedgastric ileus in rats. Am J Physiol 1996; 270: R888-R894
30 Tache Y, Monnikes H, Bonaz B, Rivier J. Role of CRF in stress-related alterations of gastric and colonic motor function. AnnN Y Acad Sci 1993; 697: 233-243
31 Kalff JC, Schraut WH, Simmons RL, Bauer AJ. Surgical ma-nipulation of the gut elicits an intestinal muscularis inflam-matory response resulting in postsurgical ileus. Ann Surg 1998;228: 652-663
32 Kalff JC, Buchholz BM, Eskandari MK, Hierholzer C, SchrautWH, Simmons RL, Bauer AJ. Biphasic response to gut ma-nipulation and temporal correlation of cellular infiltrates andmuscle dysfunction in rat. Surgery 1999; 126: 498-509
33 Kalff JC, Carlos TM, Schraut WH, Billiar TR, Simmons RL,Bauer AJ. Surgically induced leukocytic infiltrates within therat intestinal muscularis mediate post-operative ileus. Gas-troenterology 1999; 117: 378-387
34 Cannon W, Murphy F. The movements of the stomach andintestines in some surgical conditions. Ann Surg 1906; 43:512-536
35 Prasad M, Matthews J. Deflating post-operative ileus. Gas-troenterology 1999; 117: 489-492
36 Dou Y, Gregersen S, Zhao J, Zhuang F, Gregersen H. Morpho-metric and biomechanical intestinal remodeling induced byfasting in rats. Dig Dis Sci 2002; 47: 1158-1168
37 Baue AE. The role of the gut in the development of multipleorgan dysfunction in cardiothoracic patients. Ann Thorac Surg1993; 55: 822-829
38 Deitch EA, Berg R. Bacterial translocation from the gut: amechanism of infection. J Burn Care Rehabil 1987; 8: 475-482
39 Jooste CA, Mustoe J, Collee G. Metoclopramide improvesgastric motility in critically ill patients. Intensive Care Med1999; 25: 464-468
40 MacLaren R. Intolerance to intragastric enteral nutrition incritically ill patients: complications and management. Phar-macotherapy 2000; 20: 1486-1498
41 Liu S, Carpenter RL, Neal JM. Epidural anesthesia andanalgesia. Anesthesiology 1995; 82: 1474-1506
42 Carpenter RL. Gastrointestinal benefits of regional anesthe-sia/analgesia. Reg Anesth 1996; 21: 13-17
43 Steinbrook RA. Epidural anesthesia and gastrointestinalmotility. Anesth Analg 1998; 86: 837-844
44 Garcia-Olmo D, Paya J, Lucas FJ, Garcia-Olmo DC. The ef-fects of the pharmacological manipulation of post-operativeintestinal motility on colonic anastomoses. An experimentalstudy in a rat model. Int J Colorectal Dis 1997; 12: 73-77
45 Jansen M, Fass J, Tittel A, Mumme T, Anurov M, Titkova S,Polivoda M, Ottinger A, Schumpelick V. Influence of post-operative epidural analgesia with bupivacaine on intestinalmotility, transit time, and anastomotic healing. World J Surg2002; 26: 303-306
46 Holte K, Kehlet H. Epidural analgesia and risk of anasto-motic leakage. Reg Anesth Pain Med 2001; 26: 111-117
47 Fotiadis RJ, Badvie S, Weston MD, Allen-Mersh TG. Epidu-ral analgesia in gastrointestinal surgery. Br J Surg 2004; 91:828-841
48 Chung HY, Yu W. Reevaluation of routine gastrointestinaldecompression after gastrectomy for gastric cancer.Hepatogastroenterology 2003; 50: 1190-1192
49 Yoo CH, Son BH, Han WK, Pae WK. Nasogastric decompres-sion is not necessary in operations for gastric cancer: prospec-tive randomised trial. Eur J Surg 2002; 168: 379-383
Science Editor Guo SY Language Editor Elsevier HK
Chan DC et al. Metoclopramide prevents post-operative ileus in gastric cancer 4781
• Helicobacter pylori •
High concentrations of human βββββ-defensin 2 in gastric juice of
patients with Helicobacter pylori infection
Hajime Isomoto, Hiroshi Mukae, Hiroshi Ishimoto, Yoshito Nishi, Chun-Yang Wen, Akihiro Wada, Ken Ohnita, Toshiya
Hirayama, Masamitsu Nakazato, Shigeru Kohno
ELSEVIER
PO Box 2345, Beijing 100023, China World J Gastroenterol 2005;11(31):4782-4787www.wjgnet.com World Journal of Gastroenterology ISSN [email protected] © 2005 The WJG Press and Elsevier Inc. All rights reserved.
Hajime Isomoto, Hiroshi Mukae, Hiroshi Ishimoto, YoshitoNishi, Ken Ohnita, Shigeru Kohno, Second Department of InternalMedicine, Nagasaki University School of Medicine, Sakamoto 1-7-1,Nagasaki, JapanChun-Yang Wen, Department of Molecular Pathology, AtomicBomb Disease Institute, Nagasaki University School of Medicine,Sakamoto 12-4, Nagasaki, JapanAkihiro Wada, Toshiya Hirayama, Department of Bacteriology,Institute of Tropical Medicine, Nagasaki University School ofMedicine, Sakamoto 12-4, Nagasaki, JapanMasamitsu Nakazato, Third Department of Internal Medicine,Miyazaki Medical College, Kiyotake, Miyazaki, JapanCorrespondence to: Dr. Hajime Isomoto, Second Department ofInternal Medicine, Nagasaki University School of Medicine, 1-7-1Sakamoto, Nagasaki 852-8501, Japan. [email protected]: +81-95-849-7567 Fax: +81-95-849-7568Received: 2004-09-19 Accepted: 2005-01-05
AbstractAbstractAbstractAbstractAbstract
AIM: Human β-defensin (HBD)-1 and HBD-2 are endogenousantimicrobial peptides. Unlike HBD-1, the HBD-2 expressionis augmented by Helicobacter pylori (H pylori). We soughtto determine HBD-1 and HBD-2 concentrations in gastricjuice during H pylori infection.
METHODS: HBD-1 and HBD-2 concentrations weremeasured by radioimmunoassay in plasma and gastricjuice of 49 H pylori-infected and 33 uninfected subjectsand before and after anti-H pylori treatment in 13 patientswith H pylori-associated gastritis. Interleukin (IL)-1β andIL-8 concentrations in gastric juice were measured byenzyme-linked immunosorbent assay (ELISA). Histologicalgrades of gastritis were determined using two biopsyspecimens taken from the antrum and corpus. Reversephase high performance liquid chromatography (RP-HPLC)was used to identify HBD-2.
RESULTS: HBD-2 concentrations in gastric juice, but notin plasma, were significantly higher in H pylori-positivethan -negative subjects, albeit the post-treatment levelswere unchanged. Immunoreactivity for HBD-2 wasexclusively identified in H pylori-infected mucosa by RP-HPLC. HBD-2 concentrations in gastric juice correlated withhistological degree of neutrophil and mononuclear cellinfiltration in the corpus. IL-1β levels correlated with thoseof IL-8, but not HBD-2. Plasma and gastric juice HBD-1concentrations were similar in H pylori-infected anduninfected subjects.
CONCLUSION: Our results place the β-defensins, especially
HBD-2, in the front line of innate immune defence.Moreover, HBD-2 may be involved in the pathogenesis ofH pylori-associated gastritis, possibly through its functionas immune and inflammatory mediator.
© 2005 The WJG Press and Elsevier Inc. All rights reserved.
Key words: β-Defensin 1; β-Defensin 2; Helicobacter pylori
Isomoto H, Mukae H, Ishimoto H, Nishi Y, Wen CY, Wada A,Ohnita K, Hirayama T, Nakazato M, Kohno S. High concentrationsof human β-defensin 2 in gastric juice of patients withHelicobacter pylori infection. World J Gastroenterol 2005;11(31): 4782-4787
http://www.wjgnet.com/1007-9327/11/4782.asp
INTRODUCTIONINTRODUCTIONINTRODUCTIONINTRODUCTIONINTRODUCTION
Helicobacter pylori (H pylori) infection is the major cause ofchronic gastritis and peptic ulcer disease and is a risk factorfor gastric cancer[1,2]. The non-invasive organism colonizesthe gastric epithelium and elicits specific antibodies againstvarious immunogenic proteins derived from the bacteria[3].H pylori-associated gastritis is characterized by intenseinfiltration of neutrophils and mononuclear cells into thelamina propria[4,5]. However, despite these humoral andcellular immune responses, the infection usually lasts alifetime in the absence of antibiotic treatment[5]. Moreover,current anti-H pylori combination regimens are rathercomplicated and do not always result in cure of theinfection because H pylori strains often develop resistanceto antibiotic drugs[3,6].
Recently, various endogenous anti-microbial peptideshave been identified as key elements of innate host defenceagainst infection[7,9]. Defensins, single chain cationic peptidesof molecular weight ranging from 3 000 to 4 500 Da, areone of the most extensively studied classes of such naturallyoccurring antibiotics[7,9]. They exhibit a wide variety ofmicrobicidal activities against Gram-positive and -negativebacteria, mycobacteria, fungi and certain enveloped viruses[7,9].Human defensins are divided into α- and β-defensins, basedon the arrangements of three intra-molecular disulfidebridges[7,9]. At present, four members of β-defensins havebeen isolated in humans[7-11]. They are essentially synthesizedin the epithelial compartment at various mucosal sites[7-11].
Recent in vitro studies showed the constitutive expressionof human β-defensin (HBD)-1 and induced expression ofHBD-2 in several gastric cancer cell lines in response to
H pylori infection[12-14]. Exclusive enhancement of HBD-2expression upon H pylori infection was also noted in patientswith chronic gastritis[15,16]. However, there is no informationon the secretion of HBD-2 into the gastric lumen in vivo orits concentrations in gastric juice during H pylori infection.
We have developed a sensitive, specific radioimmunoassay(RIA) for HBD[17]. Employing this assay system, we measuredHBD-2 concentrations in gastric juice of H pylori-infectedand uninfected individuals. This study paves the way forfurther understanding of the mechanisms involved in hostimmune response to this pathogen.
MAMAMAMAMATERIALS AND METHODSTERIALS AND METHODSTERIALS AND METHODSTERIALS AND METHODSTERIALS AND METHODS
Patients and samplingA total of 82 patients referred for diagnostic uppergastro-intestinal endoscopy between September 2002 andAugust 2003 were enrolled in the present study. Thefollowing exclusion criteria were applied for enrollment inthe study. (1) The use of non-steroidal anti-inflammatorydrugs, proton pump inhibitors, histamine H2-receptorantagonists or antibiotics within 4 wk prior to the presentstudy; (2) History of severe concomitant diseases, uppergastro-intestinal surgery, peptic ulcer diseases and gastriccancer. On the day of endoscopy, blood samples were taken,transferred into tubes containing EDTA-2Na and aprotinin,centrifuged, plasma separated, and stored at -80 untilassay.
At the beginning of endoscopy (XQ 200; OlympusOptical Co., Tokyo, Japan), a sample of the gastric juicewas aspirated into collection tube containing EDTA-2Naand aprotinin using an aspiration instrument (PW-6P-1,Olympus) under endoscopic guidance. Gastric juice sampleswere immediately neutralized to pH 7.0 with 1 N NaOHand frozen at -80 until measurement. Two biopsyspecimens were endoscopically obtained from both theantrum within 2 cm of the pyloric ring and the middleportion of the corpus along the greater curvature, fixed in10% buffered formalin and embedded in paraffin. Onewas used for rapid urease test (Helicocheck, OtsukaPharmaceutical Co., Tokushima, Japan) and another forhistopathological and immunohistochemical assessments.
Fourteen patients with H pylori-associated gastritis weretreated with eradication therapy consisting of lansoprazole(30 mg twice daily), amoxicillin (750 mg twice daily) andclarithromycin (400 mg twice daily) for 7 d[18]. Four weeksafter cessation of the treatment, patients were examined byendoscopy again, and gastric juice and biopsy specimens weretaken in a similar fashion to that performed before treatment.
Eradication of H pylori was considered successful when13C-urea breath test was negative[18].
Histopathological examinationParaffin-embedded biopsy specimens were cut into 4-
µm thick sections and stained with hematoxylin and eosin.Each histological parameter of activity (neutrophils), chronicinflammation (mononuclear cells), glandular atrophy andintestinal metaplasia in the antrum and corpus of patientswith H pylori infection was scored as 0, 1, 2 or 3 correspondingto none, mild, moderate or severe, respectively, based on
the Sydney system[19,20]. Intestinal metaplasia was definedby the presence of goblet cells in glandular mucosa withAlcian blue (pH 2.50)/periodic acid-Schiff staining[21].
Furthermore, the density of H pylori colonizationassessed with Giemsa staining was also scored from 0 to 3,based on the above classification system[19,20]. The biopsyspecimens were examined blindly without knowledge of theresults of β-defensins measurement.
Diagnosis of H pylori infectionH pylori status was assessed by serology (anti-H pylori
immunoglobulin G antibody, HEL-p TEST, AMRAD Co.,Melbourne, Australia), rapid urease test and histology withGiemsa staining. Patients were considered positive for H pylori
infection when at least two of these examinations yieldedpositive results[20,22]. On the other hand, patients were definedas H pylori-negative, if all test results were negative[23].
Measurement of interleukin (IL)-1βββββ and -8 levels in gastricjuiceThe concentrations of interleukin (IL)-1β and -8 in gastricjuice were measured as described previously[20,22,24]. Thesamples were assayed for total protein by a modified Lowrymethod, diluted to 0.5 mg/mL total protein concentration,and frozen at -80 until assay. Measurement of the twocytokines in the aliquots was performed using commerciallyavailable assay kits (Research and Diagnostics, Minneapolis,MN, USA), which employ the quantitative immunometricsandwich enzyme immunoassay technique. These assays wereperformed in duplicate according to the instructions providedby the manufacturer. In our study, inter- and intra-assayvariabilities were <10%, respectively[20,22].
Measurement of HBD-1 and -2 levels in plasma and gastricjuiceThe concentrations of HBD-2 in plasma and gastric juice sampleswere measured by RIA established in our laboratory[17].Briefly, full-length HBD-2 was synthesized using a peptidesynthesizer (model 430, Applied Biosystems, Foster City,CA, USA) and purified by reverse phase high performanceliquid chromatography (RP-HPLC). Synthetic HBD-2was used for immunizing New Zealand white rabbits bymultiple intracutaneous and subcutaneous injections. It wasradio-iodinated and the 125I-labelled peptide was purified byRP-HPLC on a TSK ODS 120A column (Tosoh Co.,Tokyo). The diluted sample or a standard peptide solution(100 µL) was incubated for 24 h with 100 µL antiserumdiluent (final dilution 1:4 200 000). The 125I-labelled solution(16 000 cpm in 100 µL) was added and the mixture wasincubated again for another 24 h. Normal rabbit serumand anti-rabbit IgG goat serum were then added and storedfor 16 h. Bound and free ligands were separated bycentrifugation. All procedures were performed at 4 andduplicate assays were carried out. Volumes of 0.5 mL plasmaand 1-2 mL gastric juice were used to determine the levelsof HBD-2. The concentrations of HBD-1 were alsomeasured in similar fashions. The intra-assay and inter-assaycoefficients of variation were <10%, respectively, in boththe RIA analyses[15,23].
Isomoto H et al. H pylori and β-defensin 2 levels in gastric juice 4783
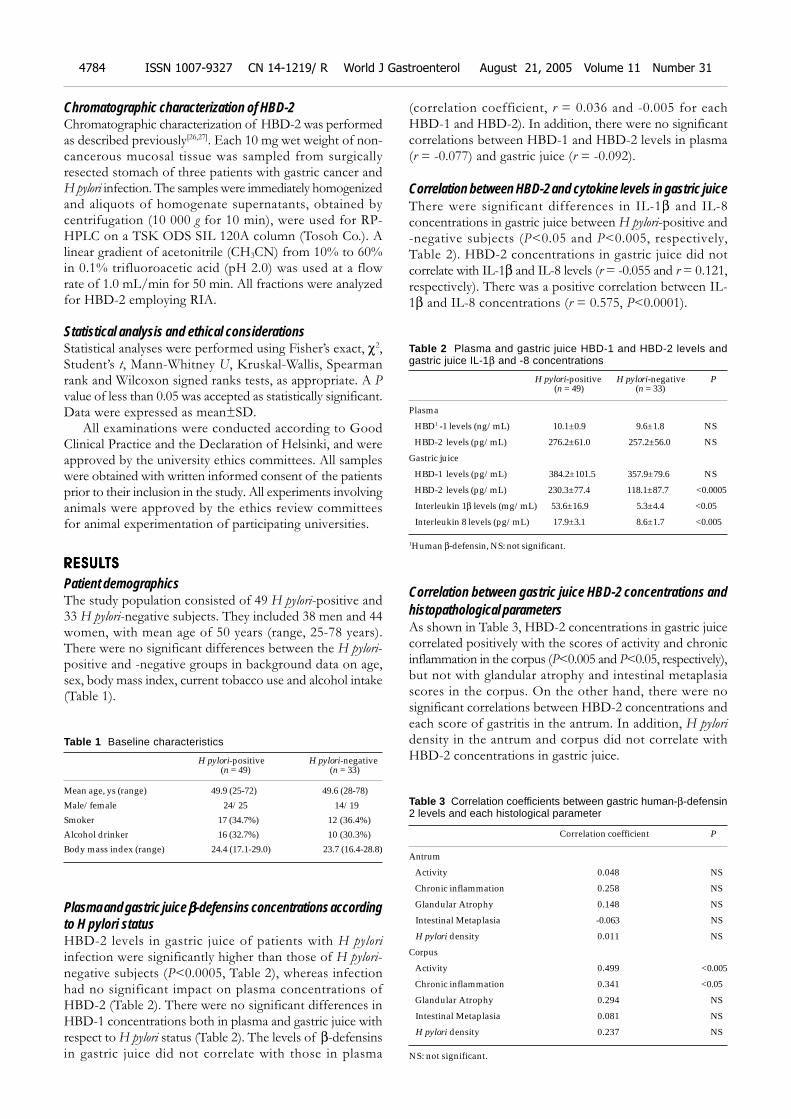
Chromatographic characterization of HBD-2Chromatographic characterization of HBD-2 was performedas described previously[26,27]. Each 10 mg wet weight of non-cancerous mucosal tissue was sampled from surgicallyresected stomach of three patients with gastric cancer andH pylori infection. The samples were immediately homogenizedand aliquots of homogenate supernatants, obtained bycentrifugation (10 000 g for 10 min), were used for RP-HPLC on a TSK ODS SIL 120A column (Tosoh Co.). Alinear gradient of acetonitrile (CH3CN) from 10% to 60%in 0.1% trifluoroacetic acid (pH 2.0) was used at a flowrate of 1.0 mL/min for 50 min. All fractions were analyzedfor HBD-2 employing RIA.
Statistical analysis and ethical considerationsStatistical analyses were performed using Fisher’s exact, χ2,Student’s t, Mann-Whitney U, Kruskal-Wallis, Spearmanrank and Wilcoxon signed ranks tests, as appropriate. A Pvalue of less than 0.05 was accepted as statistically significant.Data were expressed as mean±SD.
All examinations were conducted according to GoodClinical Practice and the Declaration of Helsinki, and wereapproved by the university ethics committees. All sampleswere obtained with written informed consent of the patientsprior to their inclusion in the study. All experiments involvinganimals were approved by the ethics review committeesfor animal experimentation of participating universities.
RESULRESULRESULRESULRESULTSTSTSTSTS
Patient demographicsThe study population consisted of 49 H pylori-positive and33 H pylori-negative subjects. They included 38 men and 44women, with mean age of 50 years (range, 25-78 years).There were no significant differences between the H pylori-positive and -negative groups in background data on age,sex, body mass index, current tobacco use and alcohol intake(Table 1).
Table 1 Baseline characteristics
H pylori-positive H pylori-negative (n = 49) (n = 33)
Mean age, ys (range) 49.9 (25-72) 49.6 (28-78)
Male/female 24/25 14/19
Smoker 17 (34.7%) 12 (36.4%)
Alcohol drinker 16 (32.7%) 10 (30.3%)
Body mass index (range) 24.4 (17.1-29.0) 23.7 (16.4-28.8)
Plasma and gastric juice βββββ-defensins concentrations accordingto H pylori statusHBD-2 levels in gastric juice of patients with H pylori
infection were significantly higher than those of H pylori-negative subjects (P<0.0005, Table 2), whereas infectionhad no significant impact on plasma concentrations ofHBD-2 (Table 2). There were no significant differences inHBD-1 concentrations both in plasma and gastric juice withrespect to H pylori status (Table 2). The levels of β-defensinsin gastric juice did not correlate with those in plasma
(correlation coefficient, r = 0.036 and -0.005 for eachHBD-1 and HBD-2). In addition, there were no significantcorrelations between HBD-1 and HBD-2 levels in plasma(r = -0.077) and gastric juice (r = -0.092).
Correlation between HBD-2 and cytokine levels in gastric juiceThere were significant differences in IL-1β and IL-8concentrations in gastric juice between H pylori-positive and-negative subjects (P<0.05 and P<0.005, respectively,Table 2). HBD-2 concentrations in gastric juice did notcorrelate with IL-1β and IL-8 levels (r = -0.055 and r = 0.121,respectively). There was a positive correlation between IL-1β and IL-8 concentrations (r = 0.575, P<0.0001).
Table 2 Plasma and gastric juice HBD-1 and HBD-2 levels andgastric juice IL-1β and -8 concentrations
H pylori-positive H pylori-negative P (n = 49) (n = 33)
Plasma
HBD1 -1 levels (ng/mL) 10.1±0.9 9.6±1.8 NS
HBD-2 levels (pg/mL) 276.2±61.0 257.2±56.0 NS
Gastric juice
HBD-1 levels (pg/mL) 384.2±101.5 357.9±79.6 NS
HBD-2 levels (pg/mL) 230.3±77.4 118.1±87.7 <0.0005
Interleukin 1β levels (mg/mL) 53.6±16.9 5.3±4.4 <0.05
Interleukin 8 levels (pg/mL) 17.9±3.1 8.6±1.7 <0.005
1Human β-defensin, NS: not significant.
Correlation between gastric juice HBD-2 concentrations andhistopathological parametersAs shown in Table 3, HBD-2 concentrations in gastric juicecorrelated positively with the scores of activity and chronicinflammation in the corpus (P<0.005 and P<0.05, respectively),but not with glandular atrophy and intestinal metaplasiascores in the corpus. On the other hand, there were nosignificant correlations between HBD-2 concentrations andeach score of gastritis in the antrum. In addition, H pylori
density in the antrum and corpus did not correlate withHBD-2 concentrations in gastric juice.
Table 3 Correlation coefficients between gastric human-β-defensin2 levels and each histological parameter
Correlation coefficient P
Antrum
Activity 0.048 NS
Chronic inflammation 0.258 NS
Glandular Atrophy 0.148 NS
Intestinal Metaplasia -0.063 NS
H pylori density 0.011 NS
Corpus
Activity 0.499 <0.005
Chronic inflammation 0.341 <0.05
Glandular Atrophy 0.294 NS
Intestinal Metaplasia 0.081 NS
H pylori density 0.237 NS
NS: not significant.
4784 ISSN 1007-9327 CN 14-1219/ R World J Gastroenterol August 21, 2005 Volume 11 Number 31
Effects of eradication treatment on gastric juice concentrationsof HBD-2, IL-1βββββ and IL-8Successful eradication of H pylori was achieved in 10 of 14(71%) with the triple therapy. At 4 wk after completion ofthe 7-d treatment, HBD-2 concentrations in gastric juiceof these patients were not significantly different from thosemeasured before eradication therapy (Table 4). However,H pylori eradication was associated with a significant fall inIL-1β, and IL-8 levels of gastric juice compared with pre-treatment levels (P<0.05 and P<0.005, respectively, Table 4).
In patients who were still infected with H pylori afterantibiotic treatment, HBD-2, IL-1β and IL-8 levels in gastricjuice remain unchanged compared to the pre-treatmentconcentrations (Table 4).
Chromatographic characterization of HBD-2Immunoreactive HBD-2 was identified in the gastric mucosainfected with H pylori on RP-HPLC coupled with RIA(Figure 1). The peak was situated at a position identical tothat of synthetic HBD-2 peptide. Each sample preparedyielded the same chromatographic pattern.
Figure 1 Representative RP-HPLC profiles of the HBD-2 molecules in H pylori-infected gastric mucosa.
DISCUSSIONDISCUSSIONDISCUSSIONDISCUSSIONDISCUSSION
Recent studies have shown the inducible expression of HBD-2messenger ribonucleic acid (mRNA) in response to H pylori
infection in cultured gastric epithelial cells[12-14]. In clinicalsetting of gastritis, the HBD-2 mRNA and peptide expressionis evidently increased in gastric mucosa infected with theorganism[15,16]. There are a few in vitro observations of thesecretion of HBD-2 peptide upon H pylori infection. Georgeet al.[26], showed its enhanced release in supernatants from
infected gastric cancer cell lines by Western blotting.However, the actual concentrations of such antimicrobialpeptides at the local site of human stomach during H pylori
infection remain unknown. Our sensitive RIA systemallowed us to determine the HBD-2 concentrations in gastricjuice, as well as in other body fluids and blood[17,25]. Thus,we demonstrated, for the first time, that the HBD-2 levelsin gastric juice of H pylori-infected patients were significantlyhigher than those of uninfected ones, suggesting itsphysio-pathological significance in the bacterial infection.In contrast, H pylori status did not have a significant impacton plasma HBD-2 levels. Immunoreactivity for HBD-2was identified in H pylori-infected gastric mucosa by RT-HPLC combined with RIA. In agreement with the resultsof previous studies[15,16], immunohistochemical staining againstanti-HBD-2 antibody within the infected mucosa wasconfined to the superficial epithelial cells. Taken together,we believe that H pylori infection stimulates the biosynthesisof HBD-2 in gastric mucosa, primarily in epitheliaconfronting this organism[15], and the product is mainlyreleased into the gastric lumen.
In the present study, however, there was no significantdifference in gastric juice, HBD-2 levels before and 4 wkafter cure of the infection, and in certain cases, post-treatment HBD-2 levels were rather increased comparedto the pre-treatment ones. In contrast, Hamanaka et al.[15],reported that epithelial HBD-2 expression assessed byimmunohistochemistry was markedly decreased in gastricspecimens obtained 4 wk after eradication of H pylori,concomitant with the pronounced reduction of its transcriptsto undetectable levels by reverse transcription-polymerasechain reaction (RT-PCR). These results must be interpretedwithin the context of studies’ limitations including their smallsample sizes, differences in samples assessed-gastric biopsytissues vs gastric juice- and diverse methodologicalapproaches to HBD-2. Nevertheless, one might postulatethe mingling of HBD-2 secreted by the other cells thangastric epithelial cells, such as esophageal squamous cells, inthe gastric juice. In fact, more than 95% of biopsy specimensfrom the esophagus were positive for the β-defensin mRNAon RT-PCR analysis[16]. Several recent studies have shownthat elimination of H pylori infection would lead to thedevelopment of gastro-esophageal reflux disease, probablyin some cases, in association with post-treatment increasein acid secretion[27-29]. At present, however, there is noinformation available as to whether the esophageal HBD-2expression is altered during this condition or upon suchstimuli as refluxates with increased acidity.
Table 4 Gastric juice HBD-2 and IL-1β and -8 levels before and after anti-H pylori therapy
Successful eradication of H pylori (n = 10) Failed eradication (n = 4)
Before therapy After therapy P Before therapy After therapy P
Gastric juice HBD1-2 levels (pg/mL) 182.2±57.6 210.1±66.4 NS 137.4±65.2 112.9±79.3 NS Interleukin 1β levels 17.7±10.2 0.5±0.3 <0.05 88.5±80.9 64.7±64.1 NS (pg/mL) Interleukin 8 levels 22.3±2.1 12.8±1.8 <0.005 18.1±6.1 18.6±4.5 NS (pg/mL)
1Human β-defensin, NS: not significant.
100
75
50
25
0
0 10 20 30 40 50
Fraction number
ir-h
BD
-2 (
pg/m
g)
60
10
CH
3CN
(%
)
hBD-2
Isomoto H et al. H pylori and β-defensin 2 levels in gastric juice 4785
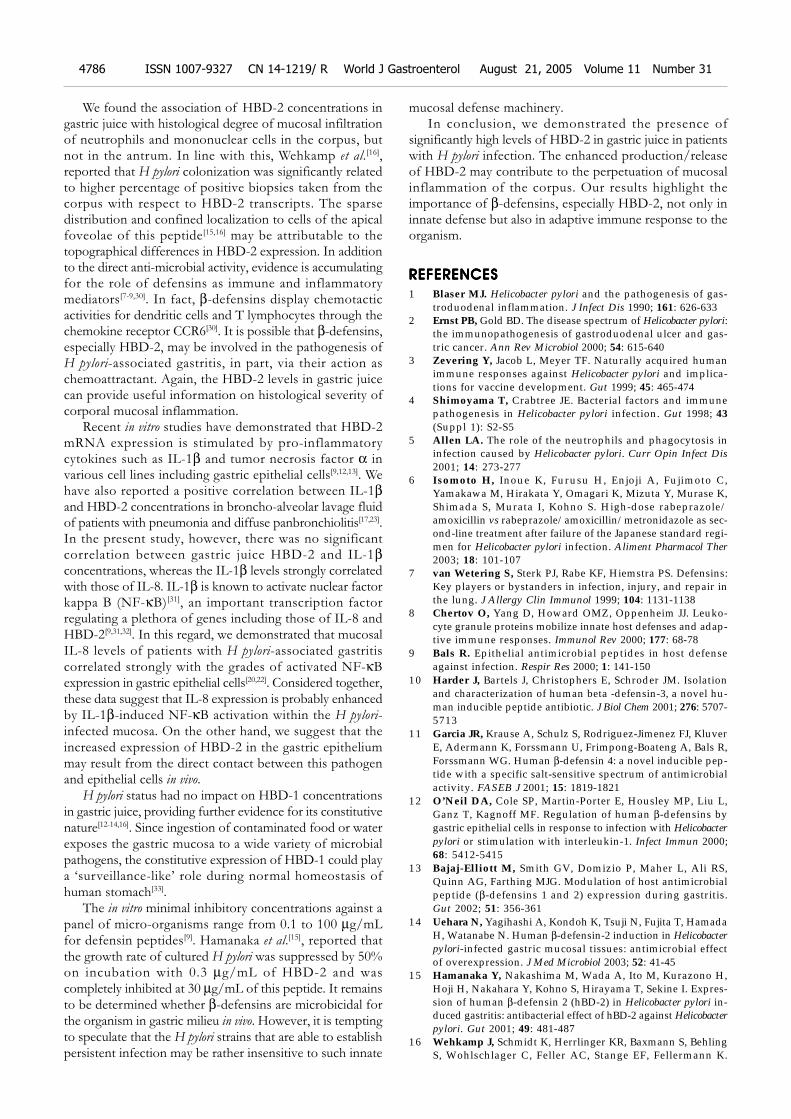
We found the association of HBD-2 concentrations ingastric juice with histological degree of mucosal infiltrationof neutrophils and mononuclear cells in the corpus, butnot in the antrum. In line with this, Wehkamp et al.[16],reported that H pylori colonization was significantly relatedto higher percentage of positive biopsies taken from thecorpus with respect to HBD-2 transcripts. The sparsedistribution and confined localization to cells of the apicalfoveolae of this peptide[15,16] may be attributable to thetopographical differences in HBD-2 expression. In additionto the direct anti-microbial activity, evidence is accumulatingfor the role of defensins as immune and inflammatorymediators[7-9,30]. In fact, β-defensins display chemotacticactivities for dendritic cells and T lymphocytes through thechemokine receptor CCR6[30]. It is possible that β-defensins,especially HBD-2, may be involved in the pathogenesis ofH pylori-associated gastritis, in part, via their action aschemoattractant. Again, the HBD-2 levels in gastric juicecan provide useful information on histological severity ofcorporal mucosal inflammation.
Recent in vitro studies have demonstrated that HBD-2mRNA expression is stimulated by pro-inflammatorycytokines such as IL-1β and tumor necrosis factor α invarious cell lines including gastric epithelial cells[9,12,13]. Wehave also reported a positive correlation between IL-1βand HBD-2 concentrations in broncho-alveolar lavage fluidof patients with pneumonia and diffuse panbronchiolitis[17,23].In the present study, however, there was no significantcorrelation between gastric juice HBD-2 and IL-1βconcentrations, whereas the IL-1β levels strongly correlatedwith those of IL-8. IL-1β is known to activate nuclear factorkappa B (NF-κB)[31], an important transcription factorregulating a plethora of genes including those of IL-8 andHBD-2[9,31,32]. In this regard, we demonstrated that mucosalIL-8 levels of patients with H pylori-associated gastritiscorrelated strongly with the grades of activated NF-κBexpression in gastric epithelial cells[20,22]. Considered together,these data suggest that IL-8 expression is probably enhancedby IL-1β-induced NF-κB activation within the H pylori-infected mucosa. On the other hand, we suggest that theincreased expression of HBD-2 in the gastric epitheliummay result from the direct contact between this pathogenand epithelial cells in vivo.
H pylori status had no impact on HBD-1 concentrationsin gastric juice, providing further evidence for its constitutivenature[12-14,16]. Since ingestion of contaminated food or waterexposes the gastric mucosa to a wide variety of microbialpathogens, the constitutive expression of HBD-1 could playa ‘surveillance-like’ role during normal homeostasis ofhuman stomach[33].
The in vitro minimal inhibitory concentrations against apanel of micro-organisms range from 0.1 to 100 µg/mLfor defensin peptides[9]. Hamanaka et al.[15], reported thatthe growth rate of cultured H pylori was suppressed by 50%on incubation with 0.3 µg/mL of HBD-2 and wascompletely inhibited at 30 µg/mL of this peptide. It remainsto be determined whether β-defensins are microbicidal forthe organism in gastric milieu in vivo. However, it is temptingto speculate that the H pylori strains that are able to establishpersistent infection may be rather insensitive to such innate
mucosal defense machinery.In conclusion, we demonstrated the presence of
significantly high levels of HBD-2 in gastric juice in patientswith H pylori infection. The enhanced production/releaseof HBD-2 may contribute to the perpetuation of mucosalinflammation of the corpus. Our results highlight theimportance of β-defensins, especially HBD-2, not only ininnate defense but also in adaptive immune response to theorganism.
REFERENCESREFERENCESREFERENCESREFERENCESREFERENCES
1 Blaser MJ. Helicobacter pylori and the pathogenesis of gas-troduodenal inflammation. J Infect Dis 1990; 161: 626-633
2 Ernst PB, Gold BD. The disease spectrum of Helicobacter pylori:the immunopathogenesis of gastroduodenal ulcer and gas-tric cancer. Ann Rev Microbiol 2000; 54: 615-640
3 Zevering Y, Jacob L, Meyer TF. Naturally acquired humanimmune responses against Helicobacter pylori and implica-tions for vaccine development. Gut 1999; 45: 465-474
4 Shimoyama T, Crabtree JE. Bacterial factors and immunepathogenesis in Helicobacter pylori infection. Gut 1998; 43(Suppl 1): S2-S5
5 Allen LA. The role of the neutrophils and phagocytosis ininfection caused by Helicobacter pylori. Curr Opin Infect Dis2001; 14: 273-277
6 Isomoto H, Inoue K, Furusu H, Enjoji A, Fujimoto C,Yamakawa M, Hirakata Y, Omagari K, Mizuta Y, Murase K,Shimada S, Murata I, Kohno S. High-dose rabeprazole/amoxicillin vs rabeprazole/amoxicillin/metronidazole as sec-ond-line treatment after failure of the Japanese standard regi-men for Helicobacter pylori infection. Aliment Pharmacol Ther2003; 18: 101-107
7 van Wetering S, Sterk PJ, Rabe KF, Hiemstra PS. Defensins:Key players or bystanders in infection, injury, and repair inthe lung. J Allergy Clin Immunol 1999; 104: 1131-1138
8 Chertov O, Yang D, Howard OMZ, Oppenheim JJ. Leuko-cyte granule proteins mobilize innate host defenses and adap-tive immune responses. Immunol Rev 2000; 177: 68-78
9 Bals R. Epithelial antimicrobial peptides in host defenseagainst infection. Respir Res 2000; 1: 141-150
10 Harder J, Bartels J, Christophers E, Schroder JM. Isolationand characterization of human beta -defensin-3, a novel hu-man inducible peptide antibiotic. J Biol Chem 2001; 276: 5707-5713
11 Garcia JR, Krause A, Schulz S, Rodriguez-Jimenez FJ, KluverE, Adermann K, Forssmann U, Frimpong-Boateng A, Bals R,Forssmann WG. Human β-defensin 4: a novel inducible pep-tide with a specific salt-sensitive spectrum of antimicrobialactivity. FASEB J 2001; 15: 1819-1821
12 O’Neil DA, Cole SP, Martin-Porter E, Housley MP, Liu L,Ganz T, Kagnoff MF. Regulation of human β-defensins bygastric epithelial cells in response to infection with Helicobacterpylori or stimulation with interleukin-1. Infect Immun 2000;68: 5412-5415
13 Bajaj-Elliott M, Smith GV, Domizio P, Maher L, Ali RS,Quinn AG, Farthing MJG. Modulation of host antimicrobialpeptide (β-defensins 1 and 2) expression during gastritis.Gut 2002; 51: 356-361
14 Uehara N, Yagihashi A, Kondoh K, Tsuji N, Fujita T, HamadaH, Watanabe N. Human β-defensin-2 induction in Helicobacterpylori-infected gastric mucosal tissues: antimicrobial effectof overexpression. J Med Microbiol 2003; 52: 41-45
15 Hamanaka Y, Nakashima M, Wada A, Ito M, Kurazono H,Hoji H, Nakahara Y, Kohno S, Hirayama T, Sekine I. Expres-sion of human β-defensin 2 (hBD-2) in Helicobacter pylori in-duced gastritis: antibacterial effect of hBD-2 against Helicobacterpylori. Gut 2001; 49: 481-487
16 Wehkamp J, Schmidt K, Herrlinger KR, Baxmann S, BehlingS, Wohlschlager C, Feller AC, Stange EF, Fellermann K.
4786 ISSN 1007-9327 CN 14-1219/ R World J Gastroenterol August 21, 2005 Volume 11 Number 31
Defensin pattern in chronic gastritis: HBD-2 is differentiallyexpressed with respect to Helicobacter pylori status. J Clin Pathol2003; 56: 352-357
17 Hiratsuka T, Nakazato M, Date Y, Ashitani JI, MinematsuT, Chino N, Matsukura S. Identification of human beta-defensin-2 in respiratory tract and plasma and its increase inbacterial pneumonia. Biochem Biophys Res Commun 1998; 249:943-947
18 Isomoto H, Inoue K, Furusu H, Nishiyama H, Shikuwa S,Omagari K, Mizuta Y, Murase K, Murata I, Kohno S. Lafutidine,a novel histamine H2-receptor antagonist, versus lansoprazolein combination with amoxicillin and clarithromycin for eradi-cation of Helicobacter pylori. Helicobacter 2003; 8: 111-119
19 Price AB. The Sydney system; histological division. JGastroenterol Hepatol 1991; 6: 209-222
20 Isomoto H, Miyazaki M, Mizuta Y, Takeshima F, Murase K,Inoue K, Yamasaki K, Murata I, Koji T, Kohno S. Expressionof nuclear factor kB in Helicobacter pylori-infected gastric mu-cosa detected with Southwestern histochemistry. Scand JGastroenterol 2000; 35: 247-254
21 Morini S, Zullo A, Hassan C, Lorenzetti R, Stella F, MartiniMT. Gastric cardiac inflammation: Role of Helicobacter pyloriinfection and symptoms of gastroesophageal reflux disease.Am J Gastroenterol 2001; 96: 2337-2340
22 Isomoto H, Mizuta Y, Miyazaki M, Takeshima F, Omagari K,Murase K, Nishiyama T, Inoue K, Murata I, Kohno S. Impli-cation of NF-kB in Helicobacter pylori-associated gastritis. AmJ Gastroenterol 2000; 95: 2768-2776
23 Isomoto H, Furusu H, Morikawa T, Mizuta Y, Nishiyama T,Omagari K, Murase K, Inoue K, Murata I, Kohno S. 5-d vs 7-day triple therapy with rabeprazole, clarithromycin andamoxicillin for Helicobacter pylori eradication. Aliment PharmacolTher 2000; 14: 1619-1623
24 Isomoto H, Wang A, Mizuta Y, Akazawa Y, Ohba K, OmagariK, Miyazaki M, Murase K, Hayashi T, Inoue K, Murata I,Kohno S. Elevated levels of chemokines in esophageal mu-
cosa of patients with reflux esophagitis. Am J Gastroenterol2003; 98: 551-556
25 Hiratsuka T, Mukae H, Iiboshi H, Ashitani J, Nabeshima K,Minematsu T, Chino N, Ihi T, Kohno S, Nakazato M. In-creased concentrations of human β-defensins in plasma andbronchoalveolar lavage fluid of patients with diffusepanbronchiolitis. Thorax 2003; 58: 425-430
26 George JT, Boughan PK, Karageorgiou H, Bajaj-Elliott M.Host anti-microbial response to Helicobacter pylori infection.Mol Immunol 2003; 40: 451-456
27 Labenz J, Blum AL, Bayerdorffer E, Meining A, Stolte M,Borsch G. Curing Helicobacter pylori infection in patients withduodenal ulcer may provoke reflux esophagitis. Gastroenter-ology 1997; 112: 1442-1447
28 Fallone CA, Barkun AN, Friedman G, Mayrand S, Loo V,Beech R, Best L, Joseph L. Is Helicobacter pylori eradicationassociated with gastroesophageal reflux disease? Am JGastroenterol 2000; 95: 914-920
29 Iijima K, Ohara S, Sekine H, Koike T, Kato K, Asaki S,Shimosegawa T, Toyota T. Changes in gastric acid secretionassayed by endoscopic gastrin test before and after Helicobacterpylori eradication. Gut 2000; 46: 20-26
30 Raj PA, Dentino AR. Current status of defensins and theirrole in innate and adaptive immunity. FEMS Microbiol Lett2002; 206: 9-18
31 Barnes PJ, Karin M. Nuclear factor-κB-a pivotal transcrip-tion factor in chronic inflammatory diseases. N Engl J Med1997; 336: 1066-1071
32 Wada A, Ogushi K, Kimura T, Hojo H, Mori N, Suzuki S,Kumatori A, Se M, Nakahara Y, Nakamura M, Moss J,Hirayama T. Helicobacter pylori-mediated transcriptional regu-lation of the human β-defensin 2 gene requires NFκB. CellMicrobiol 2001; 3: 114-123
33 Zhao C, Wang I, Lehrer RI. Widespread expression of β-defensin hBD-1 in human secretory glands and epithelial cells.FEBS Lett 1996; 396: 319-322
Science Editor Guo SY Language Editor Elsevier HK
Isomoto H et al. H pylori and β-defensin 2 levels in gastric juice 4787
• BASIC RESEARCH •
Effect of IL-10 on the expression of HSC growth factors in hepatic
fibrosis rat
Mei-Na Shi, Wei-Da Zheng, Li-Juan Zhang, Zhi-Xin Chen, Xiao-Zhong Wang
ELSEVIER
PO Box 2345, Beijing 100023, China World J Gastroenterol 2005;11(31):4788-4793www.wjgnet.com World Journal of Gastroenterology ISSN [email protected] © 2005 The WJG Press and Elsevier Inc. All rights reserved.
Mei-Na Shi, Wei-Da Zheng, Li-Juan Zhang, Zhi-Xin Chen,Xiao-Zhong Wang, Department of Gastroenterology, UnionHospital of Fujian Medical University, Fuzhou 350001, FujianProvince, ChinaSupported by Technology and Science Foundation of FujianProvince, No. 2003 D05Correspondence to: Xiao-Zhong Wang, Department ofGastroenterology, Union Hospital of Fujian Medical University,Fuzhou 350001, Fujian Province, China. [email protected]: +86-591-83357896-8482Received: 2004-08-30 Accepted: 2004-12-08
AbstractAbstractAbstractAbstractAbstract
AIM: To study the effect of IL-10 on the expression ofgrowth factors - transforming growth factor-β1 (TGF-β1),epidermal growth factor (EGF), hepatocyte growthfactor (HGF)and platelet-derived growth factor (PDGF)of hepatic stellate cells (HSCs) of hepatic fibrosis rat andthe anti-fibrogenic role of exogenous IL-10.
METHODS: Hepatic fibrosis was induced by CCl4administration intra-peritoneally. Sixty clean male Sprague-Dawley (SD) rats were randomly divided into three groups:normal control group (GN, 8 rats), hepatic fibrosis modelgroup (GC, 28 rats) and IL-10 treated group (GI, 24 rats).At the beginning of the 7th and 11th wk, rats in each groupwere routinely perfused with pronase E and type IV collag-enase through a portal vein catheter and the suspensionobtained from the liver was spun by centrifugation with11% Nycodenz density gradient to isolate HSCs. Histologicalexamination was used to determine the degree of hepaticfibrosis. RT-PCR was employed to analyze mRNA expressionfrom freshly isolated cells. Immunocytochemistry wasperformed to detect protein expression in primary culturedHSCs.
RESULTS: Rat hepatic fibrosis was developed with theincrease of injection frequency of CCl4, and HSCs weresuccessfully isolated. At the 7th and 11th wk, TGF-β1, EGF,and HGF mRNA in GC increased obviously compared withGN (P = 0.001/0.042, 0.001/0.001, 0.001/0.001) and GI(P = 0.001/0.007, 0.002/0.001, 0.001/0.001). For TGF-β1,no difference was observed between GI and GN. For EGF,mRNA level in GI increased compared with GN during the7th wk (P = 0.005) and 11th wk (P = 0.049). For HGF, mRNAlevel in GI decreased compared with GN at the 7th wk(P = 0.001) and 11th wk (P = 0.021). Between these twotime points, TGF-β1 expression at the 7th wk was higherthan that of the 11th wk (P = 0.049), but for EGF, theformer was lower than the latter (P = 0.022). As for PDGFmRNA, there was no significant difference between these
groups, but difference seemed to exist in protein levels.Results by immunocytochemistry of TGF-β1 and EGF wereparalleled with the above findings.
CONCLUSION: The expression of TGF-β1, EGF and HGFincreased in HSC of hepatic fibrosis rat and decreasedafter treatment with IL-10. IL-10 plays an anti-fibrogenicrole by suppressing growth factors expression.
© 2005 The WJG Press and Elsevier Inc. All rights reserved.
Key words: Hepatic fibrosis; Hepatic stellate cells;Interleukin-10; Transforming growth factor-β1; Epidermalgrowth factor; Hepatocyte growth factor; Platelet-derivedgrowth factor
Shi MN, Zheng WD, Zhang LJ, Chen ZX, Wang XZ. Effect ofIL-10 on the expression of HSC growth factors in hepaticfibrosis rat. World J Gastroenterol 2005; 11(31): 4788-4793
http://www.wjgnet.com/1007-9327/11/4788.asp
INTRODUCTIONINTRODUCTIONINTRODUCTIONINTRODUCTIONINTRODUCTION
Hepatic fibrosis, which represents the wound healingresponse of the liver is a common sequel to diverse liverinjuries, characterized by increased deposition and alteredcomposition of extracellular matrix (ECM). Hepatic stellatecells (HSCs) are the major source of ECM, and believed to bethe crucial cell type in the development of hepatic fibrosis[1,2]
and growth factors were considered to exert their effectsthrough autocrine or paracrine on HSCs during the process[3].It has been reported that interleukin-10 (IL-10) could relievethe degree of rat hepatic fibrosis induced by carbontetrachloride (CCl4). In the present study, based on theestablished hepatic fibrosis rat model and IL-10 treatedmodel, we isolated HSCs, detected the expression of TGFβ1,EGF, HGF and PDGF of HSC, and tried to explore therelationship between growth factors and hepatic fibrosis andthe possible mechanisms of the anti-fibrogenic activities ofexogenous IL-10 in vivo.
MAMAMAMAMATERIALS AND METHODSTERIALS AND METHODSTERIALS AND METHODSTERIALS AND METHODSTERIALS AND METHODS
Establishment of animal modelsSixty clean male SD rats, weighing 200-300 g, were dividedrandomly into three groups: normal control group (GN,8 rats), hepatic fibrosis model group (GC, 28 rats) andIL-10 treated group (GI, 24 rats). All rats were bred underroutine conditions (room temperature, 22±2 ; humidity,55±5%; light, 12 h per day; drinking tap water and food
ad libitum. Animal food was provided by BK Company inShanghai, China. Rats in GN were injected intra-peritoneallywith saline at a dose of 2 mL/kg twice a wk; rats in theother two groups received intra-peritoneal injection of500 ml/L CCl4 dissolved in castor oil 2 mL/kg twice a weekas described previously[4]. From the 3rd wk, rats in the treatedgroup were given intra-peritoneally IL-10 dissolved in saline4 ug/kg, 20 min before CCl4 administration, as proposedby Nelson et al,[5]. The intervention stated above lasted tothe end of the experiment.
Histological examinationAt the beginning of the 7th and 11th wk, two rats of eachgroup were selected randomly for histological examination.The liver tissues were fixed in 40 g/L formaldehyde andembedded with paraffin. Sections were stained with hematoxylinand eosin (HE) and examined under a light microscope.
Isolation, culture and identification of HSCsIsolation, culture and identification of HSCs have beendescribed thoroughly in our previous experiments[6]. Briefly,at the beginning of the 7th and 11th wk, five rats of eachgroup were selected randomly to perfuse successively with0.13% pronase E and 0.025% type-IV collagenase througha portal vein catheter. The liver tissue suspension was incubatedwith 0.02% pronase E and 0.025% type-IV collagenase withagitation. Then the suspension obtained from the digestedliver was spun by centrifugation with 11% Nycodenz densitygradient to purify HSCs. Thereafter, HSCs were seeded atapproximately 1×10⁶ cells/mL of Dulbecco’s modified eaglemedium (DMEM) with 20% fetal calf serum in 96-well plates.Then HSCs were kept in culture at 37 in a 50 mL/LCO2 atmosphere for 72 h. They were identified by theirtypical phase-contrast microscopic appearance and byimmunocytochemistry using antibody directed againstdesmin. Cell vitality was checked by trypan blue exclusion.
RNA extraction and RT-PCRTotal RNA was extracted from freshly isolated HSCs,according to the RNA isolation kit instructions (JingmeiBiotechnology Company of Shenzhen). Its quantity andpurity were assessed by measuring the optical density at260 and 280 nm. After measurement of RNA amount,samples were either used immediately for reverse transcription(RT) or stored at -70 .
For RT, 1 µg total RNA was reversely transcribed followingthe instructions of first strand cDNA synthesis kit (JingmeiBiotechnology Company of Shenzhen). Reaction mixtures of20 µL were transcribed using the following program: at 42 for 60 min, 99 for 5 min, and stored at -20 .
For PCR, primers coding for the house-keeping geneβ-actin was added to the reaction mixture spontaneously tostandardize the results. Reactive systems contained cDNA2 µL, 10×buffer 5 µL, 25 mmol/L MgCl2 5 µL, 10 mmol/Ld NTP 1 µL, 20 mmol/L target gene sense and anti-senseprimers 1 µL, 20 mmol/L β-actin primer pairs 1 µL, TaqDNA polymerase 3 U, with a total volume of 50 µL byadding aqua. Then PCR was performed with cycle parametersof 45 s at 94 , 30 s at 55 (TGF-β1) or 58 (EGF)or 66 (HGF) or 62 (PDGF) and 60 s at 72 afterpre-denaturation for 5 min at 94 °C; final elongation timewas 7 min at 72 . The number of corresponding cyclesfor TGF-β1, EGF, HGF and PDGF were 30, 32, 34 and34, respectively. Primers were designed with reference toGenBank (Table 1). PCR products were immediatelyanalyzed by 2% agarose gel electrophoresis and the densityof resultant bands was semi-quantified by scanningdensitometry with the ratio of TGF-β1/β-actin2, EGF/β-actin1, HGF/β-actin1 and PDGF/β-actin2.
ImmunocytochemistryMost of HSCs were attached to the dishes after 72 h ofprimary culture. Then the 96-well plates were washed twicewith 0.1 mol/L PBS and fixed with poly-formaldehyde at4 overnight. The following procedures were performedaccording to the instructions of streptavidin-peroxidase (S-P)kit (Beijing Zhongshan Company). Briefly, cells were washedwith PBS, incubated with bovine serum albumin in PBS,reacted with primary antibody dissolved in PBS, washed,incubated with peroxidase-conjugated second antibody,washed, and reacted for 20 min with S-P. Color reaction wasdeveloped by incubation with DAB. For negative controls, theprimary antibody was replaced by PBS. Table 2 summarizesthe characteristics of the antibodies used in this study.
Statistical analysisAll data were expressed as mean±SE. The significance forthe difference between the groups was analyzed withSPSS10. 0 by one-way ANOVA.
RESULRESULRESULRESULRESULTSTSTSTSTS
Histological examinationHepatic fibrosis, as shown histologically, became remarkablewith the treatment of CCl4. During the 7th wk, specimensfrom GC showed steatosis and ballooning degeneration, thecollagen fibers increased and began to extend to theparenchyma, a great number of mononuclear cells andunusual neutrophils surrounded the centrilobular veins andfibrotic septa (Figure 1A), while only a few inflammatory
Table 1 Primer sequences used in this study
mRNA Sense primers Antisense primers Product length (bp)
TGF-β1 CTC TGC AGG CGC AGC TCT G GGA CTC TCC ACC TGC AAG AC 392EGF GAC AAC TCC CCT AAG GCT TA CATGCA CAC GCC ACC ATT 567GAG GCA GTA CCC ATC GTA CGAHGF TCT TGA CCC TGA CAC CCC GTG ATT CAG CCC CAT CCG G 269PDGF GAT CCG CTC CTT TGA TGA TC GTC TCA CAC TTG CAT GCC AG 435β-actin1 AGC ACT TGC GGT CCA CGA GAG CTA TGA GCT GCC TGA 410β-actin2 CCA ACC GTG AAA AGA TGA CC CAG GAG GAG CAA TGA TCT TG 660
Shi MN et al. Effect of IL-10 on hepatic fibrosis 4789
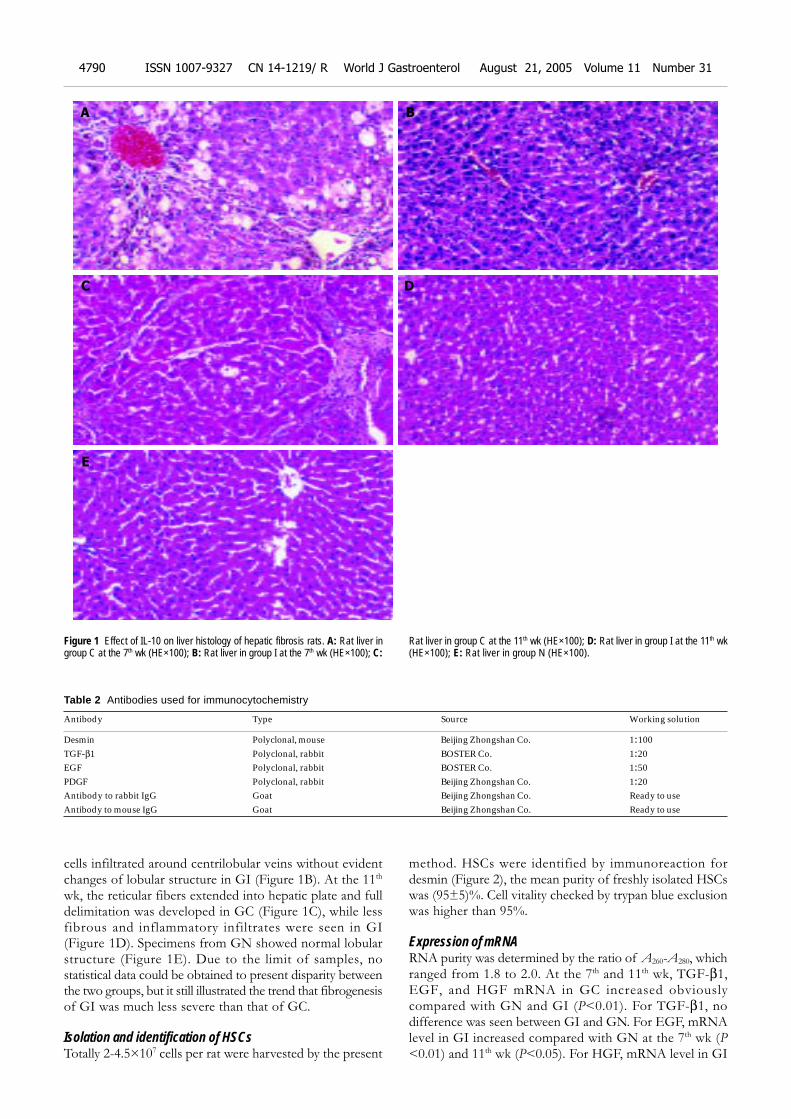
cells infiltrated around centrilobular veins without evidentchanges of lobular structure in GI (Figure 1B). At the 11th
wk, the reticular fibers extended into hepatic plate and fulldelimitation was developed in GC (Figure 1C), while lessfibrous and inflammatory infiltrates were seen in GI(Figure 1D). Specimens from GN showed normal lobularstructure (Figure 1E). Due to the limit of samples, nostatistical data could be obtained to present disparity betweenthe two groups, but it still illustrated the trend that fibrogenesisof GI was much less severe than that of GC.
Isolation and identification of HSCsTotally 2-4.5×10⁷ cells per rat were harvested by the present
method. HSCs were identified by immunoreaction fordesmin (Figure 2), the mean purity of freshly isolated HSCswas (95±5)%. Cell vitality checked by trypan blue exclusionwas higher than 95%.
Expression of mRNARNA purity was determined by the ratio of A260-A280, whichranged from 1.8 to 2.0. At the 7th and 11th wk, TGF-β1,EGF, and HGF mRNA in GC increased obviouslycompared with GN and GI (P<0.01). For TGF-β1, nodifference was seen between GI and GN. For EGF, mRNAlevel in GI increased compared with GN at the 7th wk (P<0.01) and 11th wk (P<0.05). For HGF, mRNA level in GI
Figure 1 Effect of IL-10 on liver histology of hepatic fibrosis rats. A: Rat liver ingroup C at the 7th wk (HE×100); B: Rat liver in group I at the 7th wk (HE×100); C:
Rat liver in group C at the 11th wk (HE×100); D: Rat liver in group I at the 11th wk(HE×100); E: Rat liver in group N (HE×100).
Table 2 Antibodies used for immunocytochemistry
Antibody Type Source Working solution
Desmin Polyclonal, mouse Beijing Zhongshan Co. 1:100TGF-β1 Polyclonal, rabbit BOSTER Co. 1:20EGF Polyclonal, rabbit BOSTER Co. 1:50PDGF Polyclonal, rabbit Beijing Zhongshan Co. 1:20Antibody to rabbit IgG Goat Beijing Zhongshan Co. Ready to useAntibody to mouse IgG Goat Beijing Zhongshan Co. Ready to use
A
C D
E
B
4790 ISSN 1007-9327 CN 14-1219/ R World J Gastroenterol August 21, 2005 Volume 11 Number 31
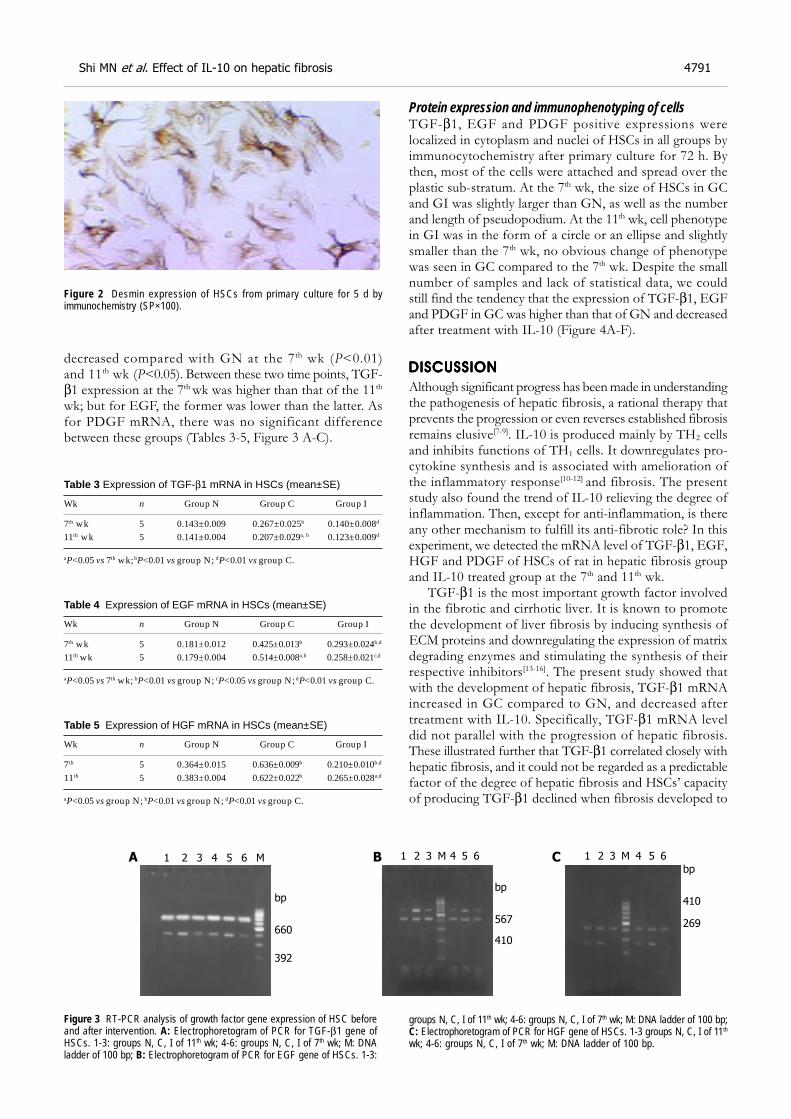
decreased compared with GN at the 7 th wk (P<0.01)and 11th wk (P<0.05). Between these two time points, TGF-β1 expression at the 7th wk was higher than that of the 11th
wk; but for EGF, the former was lower than the latter. Asfor PDGF mRNA, there was no significant differencebetween these groups (Tables 3-5, Figure 3 A-C).
Table 3 Expression of TGF-β1 mRNA in HSCs (mean±SE)
Wk n Group N Group C Group I
7th wk 5 0.143±0.009 0.267±0.025b 0.140±0.008d
11th wk 5 0.141±0.004 0.207±0.029a, b 0.123±0.009d
aP<0.05 vs 7th wk; bP<0.01 vs group N; dP<0.01 vs group C.
Table 4 Expression of EGF mRNA in HSCs (mean±SE)
Wk n Group N Group C Group I
7th wk 5 0.181±0.012 0.425±0.013b 0.293±0.024b,d
11th wk 5 0.179±0.004 0.514±0.008a,b 0.258±0.021c,d
aP<0.05 vs 7th wk; bP<0.01 vs group N; cP<0.05 vs group N; dP<0.01 vs group C.
Table 5 Expression of HGF mRNA in HSCs (mean±SE)
Wk n Group N Group C Group I
7th 5 0.364±0.015 0.636±0.009b 0.210±0.010b,d
11th 5 0.383±0.004 0.622±0.022b 0.265±0.028a,d
aP<0.05 vs group N; bP<0.01 vs group N; dP<0.01 vs group C.
Protein expression and immunophenotyping of cellsTGF-β1, EGF and PDGF positive expressions werelocalized in cytoplasm and nuclei of HSCs in all groups byimmunocytochemistry after primary culture for 72 h. Bythen, most of the cells were attached and spread over theplastic sub-stratum. At the 7th wk, the size of HSCs in GCand GI was slightly larger than GN, as well as the numberand length of pseudopodium. At the 11th wk, cell phenotypein GI was in the form of a circle or an ellipse and slightlysmaller than the 7th wk, no obvious change of phenotypewas seen in GC compared to the 7th wk. Despite the smallnumber of samples and lack of statistical data, we couldstill find the tendency that the expression of TGF-β1, EGFand PDGF in GC was higher than that of GN and decreasedafter treatment with IL-10 (Figure 4A-F).
DISCUSSIONDISCUSSIONDISCUSSIONDISCUSSIONDISCUSSION
Although significant progress has been made in understandingthe pathogenesis of hepatic fibrosis, a rational therapy thatprevents the progression or even reverses established fibrosisremains elusive[7-9]. IL-10 is produced mainly by TH2 cellsand inhibits functions of TH1 cells. It downregulates pro-cytokine synthesis and is associated with amelioration ofthe inflammatory response[10-12] and fibrosis. The presentstudy also found the trend of IL-10 relieving the degree ofinflammation. Then, except for anti-inflammation, is thereany other mechanism to fulfill its anti-fibrotic role? In thisexperiment, we detected the mRNA level of TGF-β1, EGF,HGF and PDGF of HSCs of rat in hepatic fibrosis groupand IL-10 treated group at the 7th and 11th wk.
TGF-β1 is the most important growth factor involvedin the fibrotic and cirrhotic liver. It is known to promotethe development of liver fibrosis by inducing synthesis ofECM proteins and downregulating the expression of matrixdegrading enzymes and stimulating the synthesis of theirrespective inhibitors[13-16]. The present study showed thatwith the development of hepatic fibrosis, TGF-β1 mRNAincreased in GC compared to GN, and decreased aftertreatment with IL-10. Specifically, TGF-β1 mRNA leveldid not parallel with the progression of hepatic fibrosis.These illustrated further that TGF-β1 correlated closely withhepatic fibrosis, and it could not be regarded as a predictablefactor of the degree of hepatic fibrosis and HSCs’ capacityof producing TGF-β1 declined when fibrosis developed to
Figure 2 Desmin expression of HSCs from primary culture for 5 d byimmunochemistry (SP×100).
Figure 3 RT-PCR analysis of growth factor gene expression of HSC beforeand after intervention. A: Electrophoretogram of PCR for TGF-β1 gene ofHSCs. 1-3: groups N, C, I of 11th wk; 4-6: groups N, C, I of 7th wk; M: DNAladder of 100 bp; B: Electrophoretogram of PCR for EGF gene of HSCs. 1-3:
groups N, C, I of 11th wk; 4-6: groups N, C, I of 7th wk; M: DNA ladder of 100 bp;C: Electrophoretogram of PCR for HGF gene of HSCs. 1-3 groups N, C, I of 11th
wk; 4-6: groups N, C, I of 7th wk; M: DNA ladder of 100 bp.
660
392
bp
1 2 3 4 5 6 M 1 2 3 M 4 5 6
567
410
bp
410
269
bp
1 2 3 M 4 5 6A CB
Shi MN et al. Effect of IL-10 on hepatic fibrosis 4791
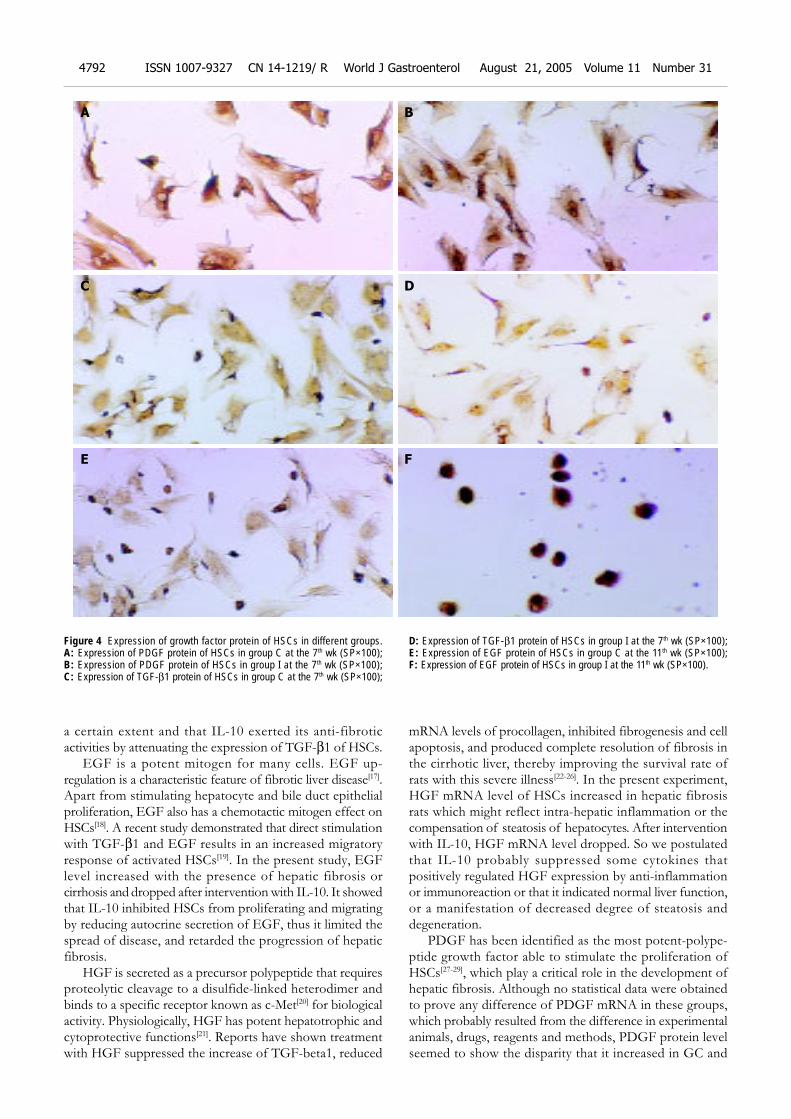
a certain extent and that IL-10 exerted its anti-fibroticactivities by attenuating the expression of TGF-β1 of HSCs.
EGF is a potent mitogen for many cells. EGF up-regulation is a characteristic feature of fibrotic liver disease[17].Apart from stimulating hepatocyte and bile duct epithelialproliferation, EGF also has a chemotactic mitogen effect onHSCs[18]. A recent study demonstrated that direct stimulationwith TGF-β1 and EGF results in an increased migratoryresponse of activated HSCs[19]. In the present study, EGFlevel increased with the presence of hepatic fibrosis orcirrhosis and dropped after intervention with IL-10. It showedthat IL-10 inhibited HSCs from proliferating and migratingby reducing autocrine secretion of EGF, thus it limited thespread of disease, and retarded the progression of hepaticfibrosis.
HGF is secreted as a precursor polypeptide that requiresproteolytic cleavage to a disulfide-linked heterodimer andbinds to a specific receptor known as c-Met[20] for biologicalactivity. Physiologically, HGF has potent hepatotrophic andcytoprotective functions[21]. Reports have shown treatmentwith HGF suppressed the increase of TGF-beta1, reduced
mRNA levels of procollagen, inhibited fibrogenesis and cellapoptosis, and produced complete resolution of fibrosis inthe cirrhotic liver, thereby improving the survival rate ofrats with this severe illness[22-26]. In the present experiment,HGF mRNA level of HSCs increased in hepatic fibrosisrats which might reflect intra-hepatic inflammation or thecompensation of steatosis of hepatocytes. After interventionwith IL-10, HGF mRNA level dropped. So we postulatedthat IL-10 probably suppressed some cytokines thatpositively regulated HGF expression by anti-inflammationor immunoreaction or that it indicated normal liver function,or a manifestation of decreased degree of steatosis anddegeneration.
PDGF has been identified as the most potent-polype-ptide growth factor able to stimulate the proliferation ofHSCs[27-29], which play a critical role in the development ofhepatic fibrosis. Although no statistical data were obtainedto prove any difference of PDGF mRNA in these groups,which probably resulted from the difference in experimentalanimals, drugs, reagents and methods, PDGF protein levelseemed to show the disparity that it increased in GC and
Figure 4 Expression of growth factor protein of HSCs in different groups.A: Expression of PDGF protein of HSCs in group C at the 7th wk (SP×100);B: Expression of PDGF protein of HSCs in group I at the 7th wk (SP×100);C: Expression of TGF-β1 protein of HSCs in group C at the 7th wk (SP×100);
D: Expression of TGF-β1 protein of HSCs in group I at the 7th wk (SP×100);E: Expression of EGF protein of HSCs in group C at the 11th wk (SP×100);F: Expression of EGF protein of HSCs in group I at the 11th wk (SP×100).
A
C D
E
B
F
4792 ISSN 1007-9327 CN 14-1219/ R World J Gastroenterol August 21, 2005 Volume 11 Number 31
decreased in GI compared to GN.Our experiment showed IL-10 exerted anti-fibrotic effect
not only by anti-inflammatory reaction but by suppressingthe expression of growth factors. Whether IL-10 plays anadverse role in liver regeneration by downregulating theexpression of HGFmRNA awaits further studies. Basedon the biological effect model of HGF, it is necessary toelucidate its activities at protein and receptor levels, whichshould provide a promising prospect for the therapy ofhepatic fibrosis.
REFERENCESREFERENCESREFERENCESREFERENCESREFERENCES
1 Bataller R, Bremmer DA. Hepatic stellate cells as a target forthe treatment of liver fibrosis. Semin Liver Dis 2001; 21: 437-451
2 Wang FS , Wu ZZ. Current situation in studies of gene therapyof liver cirrhosis and liver fibrosis. Shijie Huaren Xiaohua Zazhi2000; 8: 371-373
3 Xiang DD, Wei YL, Li QF. Molecular mechanism of trans-forming growth factor b1 on Ito cell. Shijie Huanren XiaohuaZazhi 1999; 7: 980-981
4 Morrow JD, Awad JA, Kato T, Takahashi K, Badr KF, RobertLJ 2nd, Burk KF. Formation of novel non-cyclooxygenase-derived prostanoids (F2-isoprostanes) in carbon tetrachlo-ride hepatotoxicity. An animal model of lipid peroxidation. JClin Invest 1992; 90: 2502-2507
5 Nelson DR, Lauwers GY, Lau JY, Davis GL. Interleukin 10treatment reduces fibrosis in patients with chronic hepatitisC: a pilot trial of interferon nonresponders. Gastroenterology2000; 118: 655-660
6 Zheng WD, Wang XZ, Zhang LJ, Shi MN. A simple and reli-able method of isolating rat hepatic stellate cells. FujianYikedaxue Xuebao 2002; 38: 71-73
7 Schuppan D, Strobel D, Hahn EG. Hepatic fibrosis therapeu-tic strategies. Digestion 1998; 59: 385-390
8 Pinzane M, Marra F, Carloni V. Signal transduction in he-patic stellate cells. Liver 1998; 18: 2-13
9 Gressner AM. The cell biology of liver fibrogenesis: an imbal-ance of proliferation, growth arrest and apoptosis ofmyofibroblasts. Cell Tissue Res 1998; 292: 447-452
10 Ledeboer A, Breve JJ, Poole S, Tilders FJ, Van Dam AM.Interleukin-10, interleukin-4, and transforming growth fac-tor-beta differentially regulate lipopolysaccharide-inducedproduction of pro-inflammatory cytokines and nitric oxide inco-cultures of rat astroglial and microglial cells. Glia 2000;30: 134-142
11 Marques CP, Hu S, Sheng W, Cheeran MC, Cox D, LokensgardJR. Interleukin-10 attenuates production of HSV-induced in-flammatory mediators by human microglia. Glia 2004; 47:358-366
12 Mitchell MD, Simpson KL, Keelan JA. Paradoxical proinfla-mmatory actions of interleukin-10 in human amnion: poten-tial roles in term and preterm labour. J Clin Endocrinol Metab2004; 89: 4149-4152
13 Xu XB, He ZP, Liang ZQ, Leng XS. Obstruction of TGF-b1signal transduction by anti-Smad4 gene can therapy experi-mental liver fibrosis in the rat[Article in Chinese. ZhonghuaGanzangbing Zazhi 2004; 12: 263-266
14 Wu XR, Lv MH, Wang Q, Shi SS, Guo WD. The plasma levelsof transforming growth factor beta1 and the protein expres-sions of alpha-SMA, urokinase plasminogen activator andplasminogen activator inhibitor-1 in liver of patients withdifferent grades of hepatic fibrosis. Zhonghua GanzangbingZazhi 2004; 12: 400-402
15 Ma C, Chegini N. Regulation of matrix metalloproteinases(MMPs) and their tissue inhibitors in human myometrialsmooth muscle cells by TGF-beta 1. Mol Hum Repod 1999; 5:950-954
16 Knittel T, Mehde M, Kobold D, Saile B, Dinter C, RamadoriG. Expression patterns of matrix metalloproteinases and theirinhibitors in parenchymal and non-parenchymal cells of ratliver: regulation by TNF-alpha and TGF-beta1. J Hepatol 1999;30: 48-60
17 Komuves LG, Feren A, Jones AL, Fodor E. Expression ofepidermal growth factor and its receptor in cirrhotic leverdisease. J Histochem Cytochem 2000; 48: 821-830
18 Liu X, Zhang J, Zhang Y. Effects of platelet-derived growthfactor on the proliferation of hepatic stellate cells and theirexpression of genes of collagens and platelet-derived growthfactor. Zhonghua Binglixue Zazhi 2000; 29: 27-29
19 Yang C, Zeisberg M, Mosterman B, Sudhakar A, Yerramalla U,Holthaus K, Xu L, Eng F, Afdhal N, Kalluri R. Liver fibrosis:insights into migration of hepatic stellate cells in reponse toextracellular matrix and growth factors. Gastroenterology 2003;12: 147-159
20 Mars WM, Zarnegar R, Michalopoulos GK. Activation of hepa-tocyte growth factor by the plasminogen activators uPA andtPA. Am J Pathol 1993; 143: 949-958
21 Kosai K, Matsumoto K, Nagata S, Tsujimoto Y, NakamuraT. Abrogation of Fas-induced fulminant hepatic failure inmice by hepatocyte growth factor. Biochem Biophys Res Commun1998; 244: 683-690
22 Sato M, Kakubari M, Kawamura M, Sugimoto J, MatsumotoK, Ishii T. The decrease in total collagen fibers in the liver byhepatocyte growth factor after formation of cirrhosis inducedby thioacetamide. Biochem Pharmacol 2000; 59: 681-690
23 Ueki T, Kaneda Y, Tsutsui H, Nakanishi K, Sawa Y, MorishitaR, Matsumoto K, Nakamura T, Takahashi H, Okamoto E,Fujimoto J. Hepatocyte growth factor gene therapy of livercirrhosis in rats. Nat Med 1999; 5: 226-230
24 Goda K, Fujisawa M, Shirakawa T, Dobashi M, Shiota G,Zhang ZJ, Gotoh A, Kamidono S. Adenoviral-mediated HGFexpression inhibits germ cell apoptosis in rats with cryptorchidism.J Gene Med 2004; 6: 869-876
25 Okada M, Sugita K, Inukai T, Goi K, Kagami K, Kawasaki K,Nakazawa S. Hepatocyte growth factor protects small airwayepithelial cells from apoptosis induced by tumor necrosisfactor-{alpha} or oxidative stress. Pediatr Res 2004; 56: 336-344
26 Liu Y. Hepatocyte growth factor in kidney fibrosis: therapeu-tic potential and mechanisms of action. Am J Physiol RenalPhysiol 2004; 287: F7-16
27 Kuter DJ. Future directions with platelet growth factors. SeminHematol 2000; 37(2 Suppl 4): 41-49
28 Pinzani M. Pdgf and signal transduction in hepatic stellatecells. Front Biosci 2002; 7: D1720-1726
29 Yuan N, Wang P, Wang Z. Expression and significance ofplatelet derived growth factor and its receptor in liver tissuesof patients with liver fibrosis. Zhonghua Ganzangbing Zazhi2002; 10: 58-60
Science Editor Zhu LH and Guo SY Language Editor Elsevier HK
Shi MN et al. Effect of IL-10 on hepatic fibrosis 4793
• BASIC RESEARCH •
Vitamin D receptor gene Tru9I polymorphism and risk for incidental
sporadic colorectal adenomas
You-Ling Gong, Da-Wen Xie, Zong-Lin Deng, Roberd M Bostick, Xi-Jiang Miao, Jin-Hui Zhang, Zhi-Hong Gong
ELSEVIER
PO Box 2345, Beijing 100023, China World J Gastroenterol 2005;11(31):4794-4799www.wjgnet.com World Journal of Gastroenterology ISSN [email protected] © 2005 The WJG Press and Elsevier Inc. All rights reserved.
You-Ling Gong, Tumor Center, West China Hospital, SichuanUniversity, Chengdu 610041, Sichuan Province, ChinaYou-Ling Gong, Da-Wen Xie, Zong-Lin Deng, Jin-Hui Zhang,Zhi-Hong Gong, Department of Epidemiology and Biostatistics,School of Public Health and South Carolina Cancer Center,University of South Carolina, Columbia, SC 29203, USARoberd M Bostick, Department of Epidemiology, Rollins Schoolof Public Health, Emory University, Atlanta, GA 30322, USAXi-Jiang Miao, Department of Computer Science and Engineering,University of South Carolina, Columbia, SC 29203, USASupported by the Public Health Service grants, No. R01CA-51932to RMB (National Cancer Institute), and Center for Colon CancerResearch grant, No. RR017698 to FGB from National Institutes ofHealth, Department of Health and Human ServicesCo-first-authors: You-Ling Gong and Da-Wen XieCorrespondence to: Dr. Da-Wen Xie, University of South Carolina,14 Richland Medical Park, Suite 500, Columbia, SC 29203,USA. [email protected]: +01-803-434-3707 Fax: +01-803-434-3795Received: 2005-12-03 Accepted: 2005-01-05
AbstractAbstractAbstractAbstractAbstract
AIM: Recent laboratory and epidemiological studiessuggest that vitamin D is a potential agent for colorectalcancer prevention. Its function is partially mediated bythe vitamin D receptor (VDR). The aim of this study wasto investigate whether a novel G (allele ‘U’)>A (allele ‘u’)polymorphism (Tru9I) in the VDR intron 8 region is associatedwith risk for colorectal adenoma in a colonoscopy-basedcase-control study.
METHODS: Genotyping for a total of 391 subjects wascarried out through PCR and restriction fragment lengthpolymorphism.
RESULTS: The frequencies of ‘U’ and ‘u’ alleles were89.3% and 10.7%, respectively. The ‘Uu’ and ‘uu’ genotypeswere associated with decreased risk for adenoma (OR,0.71; 95%CI, 0.40-1.25). The inverse association wasmore pronounced for multiple adenomas and adenomasthat were larger had moderate or greater dysplasia, orwere sessile: the odds ratios (ORs) were, 0.51 (95%CI,0.21-1.24), 0.37 (95%CI, 0.11-1.28), 0.68 (95%CI, 0.33-1.41), and 0.36 (95%CI, 0.13-0.97) respectively. In joint/combined analyses, inverse associations were more obviousamong those who had at least one ‘u’ allele and alsowere younger (OR, 0.60; 95%CI, 0.26-1.37), women (OR,0.38; 95%CI, 0.17-0.88), did not smoke (OR, 0.39; 95%CI,0.13-1.23), or took NSAID (OR, 0.38; 95%CI, 0.12-1.25),but no evidence existed for interactions with calcium orvitamin D intake.
CONCLUSION: Our findings suggest that the VDR Tru9Ipolymorphism may be associated with lower risk forcolorectal adenoma, particularly in interaction with variousrisk factors, but not with calcium or vitamin D.
© 2005 The WJG Press and Elsevier Inc. All rights reserved.
Key words: Case-control study; Colorectal adenoma;Colorectal neoplasia; Vitamin D receptor; Geneticpolymorphism
Gong YL, Xie DW, Deng ZL, Bostick RM, Miao XJ, Zhang JH,Gong ZH. Vitamin D receptor gene Tru9I polymorphism andrisk for incidental sporadic colorectal adenomas. World J
Gastroenterol 2005; 11(31): 4794-4799
http://www.wjgnet.com/1007-9327/11/4794.asp
INTRODUCTIONINTRODUCTIONINTRODUCTIONINTRODUCTIONINTRODUCTION
Colorectal cancer (CRC) is one of the most common cancersin the USA, with an annual incidence of 146 940 cases and56 730 deaths[1]. It has been reported that in USA, CRCmorbidity is greater in northern latitudes, which may in partbe due to lower sun exposure[2]. Several epidemiologicalstudies support the hypothesis that dermal vitamin Dsynthesis mediated by sunlight may protect against colorectalcancer; several found decreased risk for this disease withhigher serum levels of vitamin D or with increasing dietaryvitamin D intake[3-5]. The vitamin D receptor (VDR), amember of the steroid/thyroid receptor family, mediatesgenomic actions of the active metabolite of vitamin D [1,25(OH)2D3], and thus regulates cellular proliferation anddifferentiation[6-8] and induces apoptosis[9]. Recent studiesshow that VDR functions as a sensor of the colorectalcarcinogen, lithocholic acid (LCA), inducing in vivo expressionof the CYP3A family that detoxifies LCA in the liver andintestine[10]. Based on such findings, there has been increasedinterest in an interaction between vitamin D and the VDRgene and risk for colorectal cancer. Although contradictoryresults have been reported[11-13], evidence suggests that atleast some VDR gene polymorphisms are related to therisk of CRC or adenoma[14-17].
Recently, a novel G>A polymorphism in the 3’-UTRregion of the VDR gene was identified and designated asVDR Tru9I[18]. It is thought that the polymorphisms in thisregion of the VDR gene may affect its mRNA stability,possibly through linkage to other variants[19]. So far, noprevious study has been reported on investigating thefunction of this polymorphism. In a epidemiological
study, Gyorffy et al.[20], found that the presence of thevariant ‘u’ allele, combined with VDR ApaI ‘a’ and BsmI ‘b’alleles, is associated with increased risk for type I diabetesmellitus in girls. To our knowledge, there has been nopreviously published study on a potential associationbetween the VDR Tru9I polymorphism and colorectaladenoma risk. Previously, we found that different geneticpolymorphisms might affect risk for colorectal adenoma:the cyclinD1 A/G polymorphism was associated withincreased risk[21], and the p53-inducible ribonucleotidereductase small subunit 2 (p53R2) ‘AA’ genotype wasstrongly associated with increased risk in those with lowerdietary nutrients including vitamins and calcium intakes(paper submitted). Herein, we report data from this sameNorth Carolina case-control study on the association ofthe VDR Tru9I polymorphism and colorectal adenomarisk, alone and in interaction with various environmentalrisk factors for colorectal neoplasms.
MAMAMAMAMATERIALS AND METHODSTERIALS AND METHODSTERIALS AND METHODSTERIALS AND METHODSTERIALS AND METHODS
Study designFrom 1994 to 1997, the markers of adenomatous polyps(MAP) case-control study were conducted to assess thevalidity of colonic epithelial cell proliferation as a biomarkerof risk for incident sporadic colorectal adenomatous polyps.Prior to beginning the study, MAP was approved by theInstitutional Review Board of Wake Forest University,Bowman Gray School of Medicine in accordance with anassurance filed with and approved by the Department ofHealth and Human Services. Informed consent was obtainedfrom each participant. Eligibility criteria for study subjectsconsisted of English speaking adults from 30 to 74 yearsof age, either sex or any race who were scheduled for electiveoutpatient colonoscopy by four large gastro-enterologypractices in Winston-Salem and Charlotte, North Carolina.Patients were recruited for over 24 mo. Cases were identifiedas eligible colonoscopy patients who were determined tohave study index pathologist-confirmed incident adenomatouspolyps according to criteria adapted from the National PolypStudy[22]. Controls consisted of all eligible colonoscopypatients with no previous history of adenomatous polypsand who were found to be free of adenomatous polyps.Persons with familial polyposis, Gardner’s syndrome,ulcerative colitis, Crohn’s Disease, bowel resection, newlydiagnosed recurrent adenomatous polyps, and incident coloncancer were excluded, as they were patients with past orprevalent cancer other than non-melanoma skin cancer.
Patients completed mailed questionnaires prior to theircolonoscopies (to avoid bias) regarding family history ofpolyps or colon cancer, medical history, dietary information(via a semi-quantitative Willett 153-item Food FrequencyQuestionnaire), physical activity (via a modified Paffenbargerquestionnaire), reproductive variables, body fat distribution,and their reasons for and the sequence of events leading tocolonoscopy. Blood was drawn and stored at -70 forpossible later measurement of various genotypes.
Preparation for colonoscopy included a 12 h fast andbowel cleansing with polyethylene glycol (GoLYTELY).Subjects willing to undergo biopsies had four quadrant
biopsies taken from normal appearing mucosa in the rectum(10 cm above the anus), sigmoid colon, and cecum for atotal of 16 biopsies. Information recorded included numberof polyps, polyp size, polyp type (adenoma, hyperplastic, ormixed), adenoma subtype (tubular, villous, tubulo-villous),and the degree of dysplasia.
SubjectsAmong all four clinical sites, 2 246 colonoscopy patientswere identified. Of these, 669 were eligible on initialscreening (eligibility rate 29.8%), and of these 633 werewilling to discuss the study, 617 of these were contacted,and 417 of these signed consent and had study colonoscopies(consent rate 63.1%). Of the 417 participants, 259 hadsome type of polyp, and of these 179 had adenomatouspolyps. Nine of the 417 patients were subsequentlydetermined ineligible for the study, and an additional eightpatients had incident colon cancer and were not eligible forthe primary case-control analyses; thus, 400 possible patientswere available for genotypic analysis. Of these 400 patients,viable DNA was isolated from 391 (171 cases and 220controls) for genotyping.
GenotypingGenomic DNA was obtained from stored WBCs digestedin 500 µL of lysis buffer (50 mmol/L Tris-HCl, pH 8.5,1 mmol/L EDTA, 0.2% SDS, 200 g/mL proteinase K)over night at 55 with shaking. The digestion wasprecipitated directly with isopropanol and the pellets werewashed with 70% ethanol. The genomic DNA pellets(50-100 µg) were dissolved in 300-800 µL of TE buffer, ofwhich about 1 µL was used for each PCR reaction. DNAwas amplified following the primers designed for the exon8 region of the VDR gene following the published DNAsequence (GenBank number: AY342401). An isoschizomerof Tru9I, MseI, was used in this study. The PCR (50 µLvolume) was carried out in 20 mmol/L Tris-HCl, pH 8.4,50 mmol/L KCl, 1.5 mmol/L MgCl2, 0.2 mmol/L dNTP,0.5 mmol/L of each primer (5’-GCA GGG TAC AAAACT TTG GAG -3’ as forward and a 5’-CCT CAT CACCGA CAT CAT GTC -3’ as reverse), 80-120 ng of DNAtemplate, and 2.5 units Taq polymerase (Gibco-Invitrogen).The solution was heated to 94 for 2 min, followed by 35cycles of 30 s at 94 , 30 s at 69 , and 30 s at 72 .The final reaction was extended 7 min at 72 . The PCRproducts (5 µL) were loaded onto a 3% 2:1 NuSieve-SeaKemgel for confirmation. The PCR products (10 µL) were thensubjected to MseI restriction enzyme at 37 overnight.Bands for the wild-type (‘UU’) allele were not cut (177 bp);the ‘uu’ genotype was showed at 91 and 86 bp; and theheterozygote (‘Uu’) allele was cut into 177-, 91-, and 86-bpfragments.
Statistical analysisAllelic frequencies for polymorphic VDR Tru9I G>A alleleswere compared to those in previous study populations. VDRTru9I G>A genotype (UU, Uu, uu) distributions for casesand controls were tested for adherence to the Hardy-Weinberg equilibrium.
All statistical inquiries were conducted using R language
Gong YL et al. VDR gene polymorphism and colorectal adenoma risk 4795
version 1.9.0 from http://www.R-project.org. Descriptivecomparisons (i.e., mean±SD, frequencies as percents) ofcases and controls were conducted utilizing χ2 tests forcategorical variables, and t test for continuous variables.
Multiple logistic regressions were utilized to calculateodds ratios (ORs) and corresponding 95%CI, adjusted forpotential concluding factors, to estimate the strength of anassociation between VDR Tru9I genotype and risk forincident sporadic colorectal adenomas. The effect of VDRTru9I genotype was analyzed utilizing a priori hypothesizedlow risk, common ‘UU’ genotype as the referent group. A‘P’ test for trend was calculated across genotypes to detecta pattern of association.
Several risk factors were scrutinized as possible confo-unders or effect modifiers of the VDR Tru9I genotype-colorectal adenoma association. Among these were age, sex,race, body mass index, family history of colon cancer(FHCC), smoking, alcohol consumption, non-steroidalanti-inflammatory drug (NSAID) use, and total dietaryintake of calcium and vitamin D. Criteria for inclusion ofany covariate in the final model included: (1) biologicalplausibility; (2) whether it fits the model at P 0.1; and (3)whether it altered the OR for the primary exposure variableby 10% or more. Final models for genotype main effectsincluded age, sex, smoking status, drinking status, and FHCC.
Models involving in the assessment of possible interactionsbetween genotypes and various anti- and pro-proliferativeand other key risk factors included age, sex, FHCC, NSAIDs,smoking status, and total intake of calcium and alcohol.
To examine potential gene-environment interactions ofVDR Tru9I genotype and certain risk factors, stratifiedanalyses were conducted. Continuous variables weredichotomized on median values for controls; furthermore,continuous dietary variables were categorized as sex-specific.Criteria for assessing effect modifiers were based onprevious literature, biological plausibility, and whether ornot risk estimates differed substantially across strata.
RESULRESULRESULRESULRESULTSTSTSTSTS
Adenoma cases were similar to the controls in respect torace, education status, and most dietary intakes (Table 1).However, cases were more likely to be a little older, male,and current drinkers or smokers. Controls were more likelyto have histories of colon cancer in first-degree relatives.
There were significant differences in NSAID use anddietary calcium intake between cases and controls. Thepolymorphism distribution in present population was inHardy-Weinberg equilibrium (χ2 = 3.41, P = 0.07).
Table 2 presents the associations between VDR Tru9I
Table 1 Selected characteristics of cases and controls, MAP study, 1994-19971
Cases (n = 171) Controls (n = 220) P1
Demographic factorsAge (yr)2 58.4 (8.4) 55.8 (10.2) 0.006Male (%) 60 36 <0.001White (%) 89 89 0.98College education (%) 19 23 0.38Major risk factorsFamily history of colon cancer (%) 14 31 <0.001Currently smoke cigarettes (%) 30 20 0.02Currently drink alcohol (%) 75 55 <0.001NSAID3 use (%) 19 30 0.007Dietary intakesTotal energy (kcal/d) 2 010 (30) 2 169 (1 999) 0.27Total fat (g/d) 71.3 (39.9) 72.6 (65.9) 0.80Total meat (serve/wk) 4.4 (1.4) 4.5 (1.4) 0.57Total fruits and vegetables (serve/wk) 6.1 (3.6) 7.4 (10.2) 0.09Total calcium (mg/d) 736 (406.6) 871 (757) 0.02Total vitamin D (IU/d) 315 (258.2) 359 (374) 0.16Total folate (mg/d) 416.7 (241.6) 467 (402) 0.12Total alcohol (g/d) 7.4 (15.1) 4.8 (20.8) 0.14
1Adjusted for age, sex, total energy intake, history of colon cancer in a first degree relative, nonsteroidal anti-inflammatory drug use, current smoking status, and totalcalcium and alcohol intakes; 2mean±SD presented unless otherwise indicated, except for age, all other means are age adjusted; 3non-steroidal anti-inflammatory drug.
Table 2 Frequencies of VDR Tru9I genotypes and associations with incident sporadic colorectal adenomas (MAP study), 1994-1997
Cases (n = 171) Controls (n = 220)VDR Tru9I genotype Adjusted OR1 95%CI2
n % n %
UU 144 84.2 171 77.8 1.00Uu 23 13.5 45 20.4 0.88 (0.17-4.55)3
uu 4 2.3 4 1.8 0.69 (0.38-1.25)Uu+uu 27 15.8 49 22.2 0.71 (0.40-1.25)P-trend 0.24
1Odds ratio; 295% confidence interval; 3adjusted for age, sex, total energy intake, history of colon cancer in a first degree relative, nonsteroidal anti-inflammatory druguse, current smoking status, and total calcium and alcohol intake.
4796 ISSN 1007-9327 CN 14-1219/ R World J Gastroenterol August 21, 2005 Volume 11 Number 31
genotypes and colorectal adenoma risk. The frequenciesof VDR Tru9I ‘UU’, ‘Uu’, and ‘uu’ genotypes were 84.2%,13.5%, and 2.3% in cases, and 77.8%, 20.3%, and 1.9% incontrols, respectively. There were equivalent alleledistributions for cases (‘U’ = 90.9%, ‘u’ = 9.1%) and controls(‘U’ = 88%, ‘u’ = 12%). A 29% decreased multivariable-adjusted OR (0.71; 95%CI, 0.40-1.25) was observed in ‘Uu’and ‘uu’ carriers, compared to ‘UU’ carriers.
We investigated the association of the polymorphismwith colorectal adenoma risk according to characteristics
of adenomatous polyps (Table 3). The inverse associationof having at least one ‘u’ allele with risk for colorectaladenoma was more pronounced for adenoma that weremultiple (OR, 0.51; 95%CI, 0.21-1.24), larger (OR, 0.37;95%CI, 0.11-1.28), sessile (OR, 0.36; 95%CI, 0.13-0.97),and perhaps for adenomas with higher levels of dysplasia(OR, 0.68; 95%CI, 0.33-1.41).
Potential interactions of VDR Tru9I polymorphism andother risk factors for colorectal neoplasms and risk foradenomas are shown in Table 4. Compared to the ‘UU’
Table 3 Age-, sex-adjusted associations of VDR Tru9I genotypes and risk for incident sporadic colorectal adenomas according to adenomacharacteristics, MAP Study, 1994-1997
Tru9I genotypes
UU Uu+uuAdenoma characteristics
Cases/controls (n) OR1/95%CI2 Cases/controls (n) OR/95%CI
Multiplicity 1 85/171 1.00 20/49 0.88 (0.48-1.60) >1 59/171 1.00 7/49 0.51 (0.21-1.24)Shape Sessile 51/171 1.00 5/49 0.36 (0.13-0.97) Pedunculated 97/171 1.00 22/49 0.93 (0.51-1.68)Size (cm)3
<1.0 111/171 1.00 24/49 0.84 (0.47-1.49) 1.0 33/171 1.00 3/49 0.37 (0.11-1.28)Dysplasia4
Mild 73/171 1.00 15/49 0.79 (0.41-1.53) Moderate 71/171 1.00 12/49 0.68 (0.33-1.41)Morphology5
Tubular 131/171 1.00 27/49 0.80 (0.46-1.38) Any villous 13/171 1.00 0/49 NA6
1Odds ratio; 295% confidence interval; 3greatest diameter of largest adenoma; 4dysplasia in adenoma with greatest degree of dysplasia; 5if multiple adenomas, classifiedas “Any villous” if any adenoma villous or tubulovillous; 6not available.
Table 4 Multivariate-adjusted1 joint and combined associations of VDR Tru9I genotypes and various risk factors for colorectal neoplasms andrisk for incident sporadic colorectal adenomas, MAP study, 1994-1997
UU Uu+uu
Cases (n) Controls (n) OR2/95%CI3 Cases (n) Controls (n) OR/95%CI
Age (yr) 57 58 83 1.00 12 31 0.60 (0.26-1.37) >57 86 89 1.41 (0.86-2.31) 15 18 1.09 (0.46-2.56)Sex Male 85 60 1.00 15 16 0.65 (0.28-1.53) Female 59 112 0.51 (0.30-0.85) 12 33 0.38 (0.17-0.88)Current smoker No 35 77 1.00 6 25 0.39 (0.13-1.23) Yes 105 94 1.84 (1.07-3.17) 20 24 1.56 (0.69-3.53)Current drinker No 63 99 1.00 13 26 0.96 (0.44-2.08) Yes 77 71 1.65 (1.01-2.69) 12 22 0.90 (0.39-2.06)NSAID4 use No 118 117 1.00 21 38 0.64 (0.34-1.23) Yes 23 54 0.48 (0.26-0.86) 5 11 0.38 (0.12-1.25)Total calcium intake5
Lower 92 84 1.00 13 23 0.53 (0.23-1.20) Higher 49 86 0.53 (0.32-0.87) 14 26 0.52 (0.23-1.14)Total vitamin D intake6
Lower 76 83 1.00 14 25 0.59 (0.26-1.33) Higher 65 87 0.78 (0.48-1.27) 13 24 0.60 (0.27-1.38)
1Adjusted for age, sex, total energy intake, history of colon cancer in a first degree relative, nonsteroidal anti-inflammatory drug use, current smoking status, and totalcalcium and alcohol intakes; 2odds ratio; 395% confidence interval; 4nonsteroidal anti-inflammatory drug; 5sex-specific median calcium intakes for males 701.3 mg/d,for females 754.1 mg/d; 6sex-specific median vitamin D intakes for males 257.2 IU/d, for females 229.7 IU/d.
Gong YL et al. VDR gene polymorphism and colorectal adenoma risk 4797
genotype carriers, having a ‘u’ allele was inversely associatedwith risk for colorectal adenoma among those who wereyounger (OR, 0.60; 95%CI, 0.26-1.37), women (OR, 0.38;95%CI, 0.17-0.88), did not smoke (OR, 0.39; 95%CI,0.13-1.23), or took NSAID (OR, 0.38; 95%CI, 0.12-1.25).Dietary calcium and vitamin D intake were observed to berelated to decreased risk for adenoma; however, there wasno evidence suggesting an interaction with the VDR Tru9Ipolymorphism.
DISCUSSIONDISCUSSIONDISCUSSIONDISCUSSIONDISCUSSION
VDR polymorphisms have been evaluated as risk factorsfor CRC or adenoma; however, their impact remains unclear.In the present study, we assessed, for the first time, VDRTru9I variants as risk factor for colorectal adenoma. Ourdata suggest that the Tru9I mutant ‘u’ allele was associatedwith decreased risk for colorectal adenoma, particularly foradenomas that were larger, multiple, had moderate or greaterdysplasia, or were sessile. Also, the ‘u’ allele was related todecreased risk for adenoma, particularly among personswho were younger, female, NSAID users or did not smoke.
Vitamin D is obtained from the diet or sunlight-inducedsynthesis, and hydroxylated first in the liver [forming 25-(OH)D], then subsequently in the kidney [forming 1,25-(OH)2D]. The hypothesis that vitamin D may providereduced colorectal adenoma risk was first proposed in theearly 1980s in light of an inverse ecologic association betweenCRC morbidity and solar exposure[23]. In vivo and in vitro
studies found that vitamin D3 promotes differentiation ofcolon carcinoma cells by inducing E-cadherin and inhibitingβ-catenin signaling[7]. Experimental data also suggest thatthe active metabolite of vitamin D and its analogs can induceapoptosis in a colorectal adenoma cell line[9]. Vitamin Dinteracts with the VDR, which upregulates CYP3A expression,which in turn increases detoxification of secondary bile acids,including LCA[10]. Recent epidemiological studies havesuggested inverse associations among calcium, vitamin Dand CRC or adenoma risk; but results are mixed. In thepresent study, higher calcium and vitamin D intake wereassociated with lower risk for colorectal adenomas; however,there was no support for the hypothesis that the VDR Tru9Ipolymorphism may interact with these dietary micronutrients.
VDR is thought to mediate most vitamin D effects, andsix common polymorphisms of the VDR gene have beenidentified. It has been reported that the polymorphisms inthe 3’UTR-region (BsmI, TaqI, ApaI, Tru9I and Poly-A) mightalter transcriptional activity and mRNA degradation[19]; andFokI, located at the VDR start codon, affects the length ofthe N-terminal VDR transactivation domain, resulting in athree-amino acid longer protein[24]. Several epidemiologicalstudies have addressed associations between VDR polym-orphisms and different cancer types including colorectalcancers[11-15,25-31]. The FokI polymorphism, which is a potentialfunctional variant, has been extensively studied. Undervarious exposures, inconsistent results were obtained fromdifferent investigators: Wong et al.[14], reported, that the mutant‘f’ allele was associated with increased risk of colorectalcancer; while another study by Ingles et al., found that the‘f’ allele was related to decreased risk[13]; but null associations
also have been observed[12,17]. The association of VDR BsmIpolymorphism with cancer risk has also been investigated.Two previous studies found that the VDR BsmI ‘BB’genotype may reduce risk for colorectal adenoma; in one,the association was modified by NSAID use, and in theother, the association was associated with reduced riskamong those who had lower calcium intake and usedNSAIDs[11,16]. Also, we previously reported that the VDRBsmI variant ‘b’ allele was associated with colorectal adenomarisk in the same study population as the current study[32].The VDR Poly-A polymorphism has been associated withdecreased risk for colorectal adenoma, modified by NSAIDuse[11]. So far, there have been no previous reports ofinvestigations of an association of the Tru9I polymorphismwith any cancer.
Many studies have reported that the VDR polymorphismsare associated with susceptibility for and prognosis of differentcancers[13,33,34]. Hutchinson et al.[33], found that the VDR‘ttff ’ genotype (according to TaqI and FokI polymorphisms)was significantly associated with thicker malignant melanomatumors. It has also been reported that the FokI polymorphismwas more strongly related to large adenoma risk amongsubjects with lower dietary calcium intake[13].
Some limitations in this study should be considered ininterpreting our results. First, the small sample size andconsequent low power preclude drawing strong conclusions.Second, this study is colonoscopy-based, and the populationmay not be representative of the general population. Peoplewho worried about their positive family history were morelikely to seek colonoscopy examination, leading to a familyhistory bias that may have attenuated associations. Anotherpotential limitation is that ultraviolet radiation exposure wasnot assessed in the present study; therefore, the dietaryvitamin D intake may not reflect the true exposure to vitaminD. In light of the relationship between vitamin D andcalcium, this may also impact the estimated calcium-adenomaassociation.
In conclusion, this is the first study to investigate anassociation between the VDR Tru9I polymorphism and riskfor incident sporadic colorectal adenoma. Our data suggestthat the VDR Tru9I polymorphism may be more related toprogression than initiation of colorectal adenoma. Our studyalso focused on the interaction between the VDR genepolymorphism, Tru9I, and dietary calcium and vitamin Dintakes; however, no such interaction was found. On theother hand, our data suggest possible interactions of VDRTru9I genotypes with age, sex, smoking, drinking, andNSAID use. Further, larger studies are needed to verifythe present data, to understand the biological mechanismsof VDR gene/calcium/vitamin D interactions.
REFERENCESREFERENCESREFERENCESREFERENCESREFERENCES
1 Jemal A, Tiwari RC, Murray T, Ghafoor A, Samuels A, WardE, Feuer EJ, Thun MJ. American Cancer Society. Cancerstatistics, 2004. CA Cancer J Clin 2004; 54: 8-29
2 Garland CF, Garland FC, Gorham ED. Can colon cancer inci-dence and death rates be reduced with calcium and vitaminD? Am J Clin Nutr 1991; 54(1 Suppl): 193S-201S
3 Platz EA, Hankinson SE, Hollis BW, Colditz GA, HunterDJ, Speizer FE, Giovannucci E. Plasma 1,25-dihydroxy- and25-hydroxyvitamin D and adenomatous polyps of the dis-
4798 ISSN 1007-9327 CN 14-1219/ R World J Gastroenterol August 21, 2005 Volume 11 Number 31
tal colorectum. Cancer Epidemiol Biomarkers Prev 2000; 9:1059-1065
4 Garland CF, Comstock GW, Garland FC, Helsing KJ, ShawEK, Gorham ED. Serum 25-hydroxyvitamin D and colon cancer:eight-year prospective study. Lancet 1989; 2: 1176-1178
5 Braun MM, Helzlsouer KJ, Hollis BW, Comstock GW. Coloncancer and serum vitamin D metabolite levels 10-17 yearsprior to diagnosis. Am J Epidemiol 1995; 142: 608-611
6 Pence BC, Buddingh F. Inhibition of dietary fat-promotedcolon carcinogenesis in rats by supplemental calcium or vita-min D3. Carcinogenesis 1988; 9: 187-190
7 Palmer HG, Gonzalez-Sancho JM, Espada J, Berciano MT,Puig I, Baulida J, Quintanilla M, Cano A, de Herreros AG,Lafarga M, Munoz A. Vitamin D(3) promotes the differentia-tion of colon carcinoma cells by the induction of E-cadherinand the inhibition of beta-catenin signaling. J Cell Biol 2001;154: 369-387
8 Sadava D, Remer T, Petersen K. Hyperplasia, hyperproliferationand decreased migration rate of colonic epithelial cells in micefed a diet deficient in vitamin D. Biol Cell 1996; 15: 113-115
9 Diaz GD, Paraskeva C, Thomas MG, Binderup L, Hague A.Apoptosis is induced by the active metabolite of vitamin D3and its analogue EB1089 in colorectal adenoma and carci-noma cells: possible implications for prevention and therapy.Cancer Res 2000; 60: 2304-2312
10 Makishima M, Lu TT, Xie W, Whitfield GK, Domoto H, EvansRM, Haussler MR, Mangelsdorf DJ. Vitamin D receptor as anintestinal bile acid sensor. Science 2002; 296: 1313-1316
11 Peters U, Hayes RB, Chatterjee N, Shao W, Schoen RE, PinskyP, Hollis BW, McGlynn KA. Prostate, lung, colorectal andovarian cancer screening project team. Circulating vitamin Dmetabolites, polymorphism in vitamin D receptor, andcolorectal adenoma risk. Cancer Epidemiol Biomarkers Prev 2004;13: 546-552
12 Grau MV, Baron JA, Sandler RS, Haile RW, Beach ML, ChurchTR, Heber D. Vitamin D, calcium supplementation, andcolorectal adenomas: results of a randomized trial. J NatlCancer Inst 2003; 95: 1765-1771
13 Ingles SA, Wang J, Coetzee GA, Lee ER, Frankl HD, Haile RW.Vitamin D receptor polymorphisms and risk of colorectal ad-enomas (United States). Cancer Causes Control 2001; 12: 607-614
14 Wong HL, Seow A, Arakawa K, Lee HP, Yu MC, Ingles SA.Vitamin D receptor start codon polymorphism and colorectalcancer risk: effect modification by dietary calcium and fat inSingapore Chinese. Carcinogenesis 2003; 24: 1091-1095
15 Speer G, Cseh K, Fuszek P, Dworak O, Vargha P, Takacs I,Nagy Z, Lakatos P. The role of estrogen receptor, vitamin Dreceptor and calcium receptor genotypes in the pathogenesisof colorectal cancer. Orv Hetil 2001; 142: 947-951
16 Kim HS, Newcomb PA, Ulrich CM, Keener CL, Bigler J, FarinFM, Bostick RM, Potter JD. Vitamin D receptor polymor-phism and the risk of colorectal adenomas: evidence of inter-action with dietary vitamin D and calcium. Cancer EpidemiolBiomarkers Prev 2001; 10: 869-874
17 Peters U, McGlynn KA, Chatterjee N, Gunter E, Garcia-ClosasM, Rothman N, Sinha R. Vitamin D, calcium, and vitamin Dreceptor polymorphism in colorectal adenomas. CancerEpidemiol Biomarkers Prev 2001; 10: 1267-1274
18 Ye WZ, Reis AF, Velho G. Identification of a novel Tru9 Ipolymorphism in the human vitamin D receptor gene. J HumGenet 2000; 45: 56-57
19 Beelman CA, Parker R. Degradation of mRNA in eukaryotes.Cell 1995; 81: 179-183
20 Gyorffy B, Vasarhelyi B, Krikovszky D, Madacsy L, TordaiA, Tulassay T, Szabo A. Gender-specific association of vita-
min D receptor polymorphism combinations with type 1 dia-betes mellitus. Eur J Endocrinol 2002; 147: 803-808
21 Lewis RC, Bostick RM, Xie D, Deng Z, Wargovich MJ, FinaMF, Roufail WM, Geisinger KR. Polymorphism of the cyclinD1 gene, CCND1, and risk for incident sporadic colorectaladenomas. Cancer Res 2003; 63: 8549-8553
22 O’Brien MJ, Winawer SJ, Zauber AG, Gottlieb LS, SternbergSS, Diaz B, Dickersin GR, Ewing S, Geller S, Kasimian D. TheNational Polyp Study. Patient and polyp characteristics as-sociated with high-grade dysplasia in colorectal adenomas.Gastroenterology 1990; 98: 371-379
23 Garland C, Shekelle RB, Barrett-Connor E, Criqui MH, RossofAH, Paul O. Dietary vitamin D and calcium and risk ofcolorectal cancer: a 19-year prospective study in men. Lancet1985; 1: 307-309
24 Gross C, Eccleshall TR, Malloy PJ, Villa ML, Marcus R, FeldmanD. The presence of a polymorphism at the translation initia-tion site of the vitamin D receptor gene is associated with lowbone mineral density in postmenopausal Mexican-Americanwomen. J Bone Miner Res 1996; 11: 1850-1855
25 Tayeb MT, Clark C, Haites NE, Sharp L, Murray GI, McLeodHL. Vitamin D receptor, HER-2 polymorphisms and risk ofprostate cancer in men with benign prostate hyperplasia. SaudiMed J 2004; 25: 447-451
26 Cheteri MB, Stanford JL, Friedrichsen DM, Peters MA,Iwasaki L, Langlois MC, Feng Z, Ostrander EA. Vitamin Dreceptor gene polymorphisms and prostate cancer risk. Pros-tate 2004; 59: 409-418
27 Huang SP, Chou YH, Wayne Chang WS, Wu MT, Chen YY,Yu CC, Wu TT, Lee YH, Huang JK, Wu WJ, Huang CH.Association between vitamin D receptor polymorphisms andprostate cancer risk in a Taiwanese population. Cancer Lett2004; 207: 69-77
28 Ruza E, Sotillo E, Sierrasesumaga L, Azcona C, Patino-GarciaA. Analysis of polymorphisms of the vitamin D receptor,estrogen receptor, and collagen Ialpha1 genes and their rela-tionship with height in children with bone cancer. J PediatrHematol Oncol 2003; 25: 780-786
29 Guy M, Lowe LC, Bretherton-Watt D, Mansi JL, Colston KW.Approaches to evaluating the association of vitamin D recep-tor gene polymorphisms with breast cancer risk. Recent ResultsCancer Res 2003; 164: 43-54
30 Schondorf T, Eisberg C, Wassmer G, Warm M, Becker M,Rein DT, Gohring UJ. Association of the vitamin D receptorgenotype with bone metastases in breast cancer patients.Oncology 2003; 64: 154-159
31 Ikuyama T, Hamasaki T, Inatomi H, Katoh T, Muratani T,Matsumoto T. Association of vitamin D receptor gene poly-morphism with renal cell carcinoma in Japanese. Endocr J2002; 49: 433-438
32 Boyapati SM, Bostick RM, McGlynn KA, Fina MF, RoufailWM, Geisinger KR, Wargovich M, Coker A, Hebert JR. Calcium,vitamin D, and risk for colorectal adenoma: dependency onvitamin D receptor BsmI polymorphism and nonsteroidalanti-inflammatory drug use? Cancer Epidemiol Biomarkers Prev2003; 12: 631-637
33 Hutchinson PE, Osborne JE, Lear JT, Smith AG, Bowers PW,Morris PN, Jones PW, York C, Strange RC, Fryer AA. VitaminD receptor polymorphisms are associated with altered prog-nosis in patients with malignant melanoma. Clin Cancer Res2000; 6: 498-504
34 Xu Y, Shibata A, McNeal JE, Stamey TA, Feldman D, PeehlDM. Vitamin D receptor start codon polymorphism (FokI)and prostate cancer progression. Cancer Epidemiol BiomarkersPrev 2003; 12: 23-27
Science Editor Wang XL and Guo SY Language Editor Elsevier HK
Gong YL et al. VDR gene polymorphism and colorectal adenoma risk 4799
• BASIC RESEARCH •
Effects of four regulating-intestine prescriptions on pathology and
ultrastructure of colon tissue in rats with ulcerative colitis
Heng Fan, Ming-Yi Qiu, Jia-Jun Mei, Guan-Xin Shen, Song-Lin Liu, Rui Chen
ELSEVIER
PO Box 2345, Beijing 100023, China World J Gastroenterol 2005;11(31):4800-4806www.wjgnet.com World Journal of Gastroenterology ISSN [email protected] © 2005 The WJG Press and Elsevier Inc. All rights reserved.
Heng Fan, Rui Chen, Department of Integrated Traditional Chineseand Western Medicine, Union Hospital, Tongji Medical College,Huazhong University of Science and Technology, Wuhan 430022,Hubei Province, ChinaMing-Yi Qiu, Jia-Jun Mei, Song-Lin Liu, Hubei College ofTraditional Chinese Medicine, Wuhan 430061, Hubei Province,ChinaGuan-Xin Shen, Tongji Medical College, Huazhong University ofScience and Technology, Wuhan 430022, Hubei Province, ChinaSupported by the Hubei Provincial Department of Education, No.99Z014Correspondence to: Professor Heng Fan, Department of IntegratedTraditional Chinese and Western Medicine, Union Hospital, TongjiMedical College, Huazhong University of Science and Technology,Wuhan 430022, Hubei Province, China. [email protected]: +86-27-85726395Received: 2004-07-23 Accepted: 2004-10-11
AbstractAbstractAbstractAbstractAbstract
AIM: To observe different histomorphologic changes ofulcerative colitis (UC) rats that were treated with fourregulating-intestine prescriptions (FRIP), to investigate thecurative effects of FRIP and to analyze their treatmentmechanism.
METHODS: The UC rat model was made by the methodof 2,4-dinitro chloro benzene (DNCB) immunity and aceticacid local enema. Ninety-eight SD rats were randomlydivided into seven groups, namely, the normal controlgroup, model group, salicylazosulfapyridine (SASP) group,Wumeiwan (WMW) group, Baitouwengtang (BTWT) group,Senglingbaishusan (SLBSS) group, and Tongxieyaofang(TXYF) group. Each group had 14 rats (with equal ratioof male and female). The six animal model groups of UC-SASP, TXYF, WMW, BTWT, SLBSS, TXYF-were treatedby distilled water except the normal control group. Changesof the rat’s general conditions after treatment wererespectively observed, the colon tissue damage scoreswere given out, the pathology of colonic mucosa and changesof ultrastructure were analyzed.
RESULTS: Different pathological changes on histologywere shown after treatment by FRIP. The colon tissuedamage score in model group was higher than that of FRIPgroups and SASP group (q = 4.59, 4.77, P<0.05 or q = 5.48,6.25, 5.97, P<0.01). The scores of WMW group, BTWTgroup and SLBSS group were lower than that of SASP(q = 4.13, P<0.05 or q = 5.31, 5.12, P<0.01). There was noremarkable difference between the damage score of TXYFgroup and SASP group (q = 3.75, P>0.05). In addition, someapoptosis cells were found in the pathologic control group.
CONCLUSION: The model made with DNCB and acetic
acid was successful, and FRIP had better curative effect
and WMW was the best curative effect, BTW, SLBSS andTXYF were similar to SASP, and we discovered that
apoptosis was possibly related to UC.
© 2005 The WJG Press and Elsevier Inc. All rights reserved.
Key words: Ulcerative colitis; TCM therapy; Experimentalresearch; Pathology; Ultrastructure; Apoptosis
Fan H, Qiu MY, Mei JJ, Shen GX, Liu SL, Chen R. Effects of
four regulating-intestine prescriptions on pathology and
ultrastructure of colon tissue in rats with ulcerative colitis.
World J Gastroenterol 2005; 11(31): 4800-4806
http://www.wjgnet.com/1007-9327/11/4800.asp
INTRODUCTIONINTRODUCTIONINTRODUCTIONINTRODUCTIONINTRODUCTION
Ulcerative colitis (UC) is a non-specific inflammatory intestinaldisease. The pathogenesis of UC is affected by a variety offactors, but its pathogenesis is still unknown at present[1]. Arat model of UC was established by the methods of DNCBimmunity and acetic acid local enema. This subject is aboutthe treatment effect of four regulating-intestine prescriptions(FRIP) by making rat model of UC, especially they wereobserved by scoring the gross morphologic damage andthe change on the pathological section of colon tissue underlight and electron microscope by treating with traditionalChinese medicine (TCM), and compared the differentcurative effect of Wumeiwan (WMW) group, Baitouwengtang(BTWT) group, Senglingbaishusan (SLBSS) group andTongxieyaofang (TXYF) group.
MAMAMAMAMATERIALS AND METHODSTERIALS AND METHODSTERIALS AND METHODSTERIALS AND METHODSTERIALS AND METHODS
MaterialsHerbs in FRIP (WMW, BTWT, SLBSS, TXYF) and theirquantity are as follows: WMW: 16 g dark plum, 6 g asarumherb, 10 g dried ginger, 16 g Chinese goldthread, 4 g Chineseangelica root, 6 g aconite root, 4 g pricklyash peel, 6 g cassiatwig, 6 g sun-dried ginseng, 6 g bark of cork tree; BTWT:30 g Chinese pulsatilla root, 24 g bark of amur corktree,10 g Chinese goldthread, 24 g ash bark; SLBSS: 10 g pulpof lotus seed, 10 g coix seed, 10 g dried amomum fruit, 10 gballoon flower root, 15 g bean of white hyacinth, 20 g whiteTuckahoe, 20 g sun-dried ginseng, 20 g licorice root, 20 gbig head atractylodes rhizome, 20 g Chinese yam; TXYF:
30 g parched white atractylodes rhizome, 20 g white peonyroot, 15 g dried old orange peel, 20 g ledebouriella root.
Salicylazosulfapyridine (SASP) with batch no. 200111002is produced by Shanghai Sanwei Pharmaceutical Company(250 mg/tablet).
TNF-α ISH detection kit, ISH special cover glass, DBAchromogenic kit, poly-L-lysine, DEPC and 20% glycerinwere supplied by Wuhan Boster Biological Technology Co.,Ltd.
Transmission electron microscope (Hitachi H-600),photomicroscope (Japan), ultramicrotome (LKB-V),magnifier and microscope, etc., were used.
Ninety-eight SD rats (male rats and female rats separatelyaccount for 50% and a rat weighed 300±50 g) were suppliedby Test Animal Center of Tongji Medical School, HuazhongUniversity of Science and Technology. They were raised inthe SPF environment (constant temperature, humidity andsterilized water, food and padding) and acclimatized to thesurrounding for 7 d before the experiments.
MethodsAnimal groups Ninety-eight SD rats (male rats and femalerats separately account for 50%) were randomly dividedinto seven groups as males and females, and each groupcontained 14 rats (male rats and female rats separatelyaccount for 50%), of which group 7 was normal group.Groups 1-6 were modeled, which were respectively WMWgroup, BTWT group, SLBSS group, TXYF group, SASPgroup, and model group. Body weight of rats in each groupshowed no significant difference on statistics (P>0.05).Preparation of the animal model Model of UC rat wasestablished with 2,4-dinitro chloro benzene (DNCB)immunity and acetic acid local enema[1-5]. After hair on therats’ nape was removed with Na2S of 100 g/L, 0.25 mLacetone solution with DNCB content of 20 g/L (five drops)was dripped on the rats’ back once a day and continuouslydripped for 14 d. On the 15th d, a φ 3-mm urinary catheterwas put into at 8 mm of a rat’s colon via its anus to fill0.25 mL ethanol containing 0.1% DNCB. On the 16th d,2 mL 8% acetate solution was filled in the same position.After accurately timing for 10 s, this position was flushedwith 5 mL physiological saline. After that, they were fed for2 wk, to continue observing the rats’ stool characters,dietetics, hair and activity conditions, etc., every day. It couldbe seen from observation that the rats gradually producedtypical symptom of UC active period. After 30 d, themodeling was finished. After modeling was finished (afterthe 30th d), two rats were randomly taken in each group andtheir colons were examined after they were killed topathologically confirm a series of changes occurring in theircolons such as hyperemia, hydrops, inflamed cellularinfiltration, crypt abscess, fewer goblet cells, body of glanddestroyed and aphthous formed.Means for drugs For each rat in WMW group, BTWTgroup, SLBSS group, TXYF group, gastric lavage wasconducted respectively with 3 mL prepared WMW liquid(0.515 g/mL), BTWT liquid (0.562 g/mL), SLBSS liquid(0.987 g/mL) and TXYF liquid (0.216 g/mL) once a day.For each rat in SASP group, gastric lavage was conductedwith 3 mL SASP suspension (0.026 g/mL) liquid once a
week. For each rat in model control group and normal group,gastric lavage was conducted with 3 mL distilled water. Thedrug feeding period was 15 d.Collection and treatment of specimens After the feedingof drugs in all groups of rats ended, they were weighed andkilled by the mode of cutting off their heads. After that,they were immediately dissected to take 6-8 mm colonsupward at 2 mm of the anus. The intestine cavities wereopened along the longitudinal axis of the intestinal mucosaand cleaned thoroughly with 0.9% saline and pure water,and assigned a code number. Then they were spread on thewax plate with the intestinal mucosa pointing upward. Afterthey were fastened with the pins, occurring conditions ofinflammation and ulcer were observed with a dissectingmicroscope. The colon was immediately examined under astereomicroscope and any visible damage was scored on a0-5 scale (Table 1).
Table 1 Criteria for scoring the gross morphologic damage of colontissue[6-9]
Score Gross morphology
0 No damage1 Localized hyperemia with no ulcers2 Linear ulcers with no significant inflammation3 Linear ulcers with inflammation at one site4 More site of ulcers and inflammation, the size of ulcers <1 cm5 Multiple inflammation and ulcers, the size of ulcers 1 cm
After modeling was finished (30 d), two rats wererandomly selected from each group and killed by the modeof cutting off their heads to take part of the intestine tissues,which were immobilized with 40 g/L formaldehyde,embedded with paraffin, pathological section was taken andHE staining was performed. And then, colon conditionsafter modeling were observed and investigated.
After ending of the above tests (45 d), a small piece ofcolon tissue (3 mm) was taken from the colon of each rat.They were immobilized with 40 g/L formaldehyde (groupedand numbered with the penicillin bottles), embedded withparaffin, pathological section was taken and HE stainingwas performed. And then, pathological changes in each groupof colons were observed (the above work was finished withthe help of Pathology Department of Hubei Hospital ofTraditional Chinese Medicine).
A rat was randomly selected in each group and the aboveprocedures were executed until cleaning procedure. Thecolonic mucosa with ulcer was taken immediately and cut into1-mm bits, which was immobilized with 2.5% glutaraldehyde,washed with 1% paraformaldehyde and immobilized afterit was put in 1% osmic acid. Then, they were dehydrated insteps with ethanol and acetone, embedded with vegetablewax, cut into super-thin sections and doubly stained withuranium acetate and lead nitrate. After that, they wereobserved with a transmission electron microscope (finishedwith the help of Electron Microscope Department ofMedical School of Wuhan University).
Statistical analysisThe weights of rats and tissue damage scores were expressed
Fan H et al. FRIP on pathology and ultrastructure in rats with UC 4801
as mean±SD, and analyzed with the Student’s t-test or Ftest (q test).
RESULRESULRESULRESULRESULTSTSTSTSTS
Changes of symptoms and signsThe study of the rats in the model had symptoms of mucousthin stool after about 2 wk and worsened gradually. Afterabout 4 wk, the symptoms were more serious and somesymptoms such as pus and blood stool, thinner, less weight,hair having no gloss, significantly less appetite, intoleranceof cold and action and less movement occurred. Aftergastric lavage was conducted with FRIP and SASP, theirsymptoms were improved differently (no statistical analysisexcept for weights). Weight changes are shown in Table 2.
Table 2 Effect on weights in rats of FRIP (mean±SD)
Group Case (n) Weights (g)
Normal control group 12 352.5±20.7b
Model group 10 307.8±15.3d
SASP group 9 321.5±18.7a,d
WMW group 11 340.3±16.8b,c
BTWT group 10 331.4±13.8b,d
SLBSS group 9 325.6±18.4a,d
TXYF group 10 328.7±10.5a,d
aP<0.05, bP<0.01 vs model group; cP<0.05, dP<0.01 vs normal control group.
Visual observing results of colonic mucosal damageThe degree of colonic mucosal damage in rats of FRIPwas scored according to the criteria in Table 1. The colontissue damage score in model group was higher than thatof FRIP groups and SASP group (P<0.05 or P<0.01). Thescores of WMW group, BTWT group, and SLBSS groupwas lower than that of SASP (P<0.05 or P<0.01). Therewas no remarkable difference between the damage scoreof TXYF group and SASP group (P>0.05). The scoreswere roughly given out according to the inflammation andinjury level, observation results of which are shown in Table 3.
Table 3 Scoring the gross morphologic damage of colon tissue inrats of FRIP (mean±SD)
Group Case (n) Scoring the grossmorphologic damage
Normal control group 12 0b
Model group 10 5.5±0.45SASP group 9 3.8±0.39a
WMW group 11 1.8±0.34b,d
BTWT group 10 2.5±0.38b,d
SLBSS group 9 1.9±0.35b,c
TXYF group 10 3.7±0.47a
aP<0.05, bP<0.01 vs model group; cP<0.05, dP<0.01 vs SASP group.
Observation results of pathological sections (HE dye)Normal control group: The colonic mucosa of rats was ingood condition without inflammatory cell infiltration orulceration of mucosa; the epithelial mucosae was intact andcontinuous; the bodies of gland arranged regularly with clear
structure and active secreting function; the epithelialmucosae, the blood vessel in the membrana propria andfibers were normal; muscularis had no abnormal conditions.Model group: The colonic mucosa of the rats showederosion and ulcers; the most of mucosa produced colobomaand some produced deep and large erosions, mucous glandbodies were destroyed; remaining mucosa was hyperemicand dropsical and formed polyp-like appearance (false polyp)due to hyperplasia; a lot of inflammatory cells (lymphocytes,plasma cells, and macrophages) infiltrated; some cells werescattered and were in multiplication conditions (more plasma,large nucleus, and sparse chromatin); mucous layer becamethinner and the lamina propria beneath the mucosa showedlocal hyperemia, dropsy, and fiber hyperplasia. SASP group:The epithelial mucosae of the rat colon produced the localdefects; the bodies of gland arranged less regularly withslight hyperemia beneath the mucosa and more inflammatorycells infiltrated. WMW group: The epithelial mucosae ofthe rat was basically sound; the bodies of gland arrangedmore regularly without significant hyperemia beneath themucosa; a few inflammatory cells infiltrated. BTWT group:The epithelial mucosae of the rat was basically sound; thebodies of gland arranged more regularly without significanthyperemia beneath the mucosa; and inflammatory cellinfiltration could be seen. SLBSS group: The epithelialmucosae of the rat was basically sound; the bodies of glandarranged more regularly without significant hyperemiabeneath the mucosa; and a few inflammatory cell infiltrationcould be seen. TXYF group: The epithelial mucosae of therat was less sound; the bodies of gland arranged less regularlywith significant hyperemia beneath the mucosa; andinflammatory cell infiltration could be seen (Figures 1A-H).
Observation results of ultrastructureNormal control group: The microvilli on the surface ofthe mucosal epithelium of the rat colon was integral withneat arrangement, identical sizes, and regular mitochondrionshape and showed approximate roundness and ellipse, innermatrixes of which were of medium density; endoplasmicreticulum and nucleus were all up to snuff; epithelia linkedtightly; space between cells was found to be wider (normallinking); the intestine gland was composed of the gobletcells. Model group: The microvilli on the surface of themucosal epithelium of the rat colon were sparse, becameshorter and irregularly curled with visible vacuoles, evenepithelium cell membrane produced defects; organellesbecame fewer; cytoplasm liquefied and dissolved; innermatrixes in the mitochondria were clear with fewer innercristae and significant swelling; endoplasmic reticulumexpanded; chromatic agglutination and pyknosis could beseen; nucleoplasm proportion became less, some congregatedbeneath karyolemma and showed gobbet with clearboundaries, even apoptosis corpusculum, karyo-pyknosis,and lymphocyte infiltration could be seen. SASP group: Themicrovilli on the surface of the mucosal epithelium of therat colon partly dropped off and became less regular;mitochondria shape became less regular and some werewith slight swelling with destroyed cytoarchitecture; fatparticles and endoplasmic reticulum expanding could be seen.WMW group: The microvilli on the surface of the mucosal
4802 ISSN 1007-9327 CN 14-1219/ R World J Gastroenterol August 21, 2005 Volume 11 Number 31
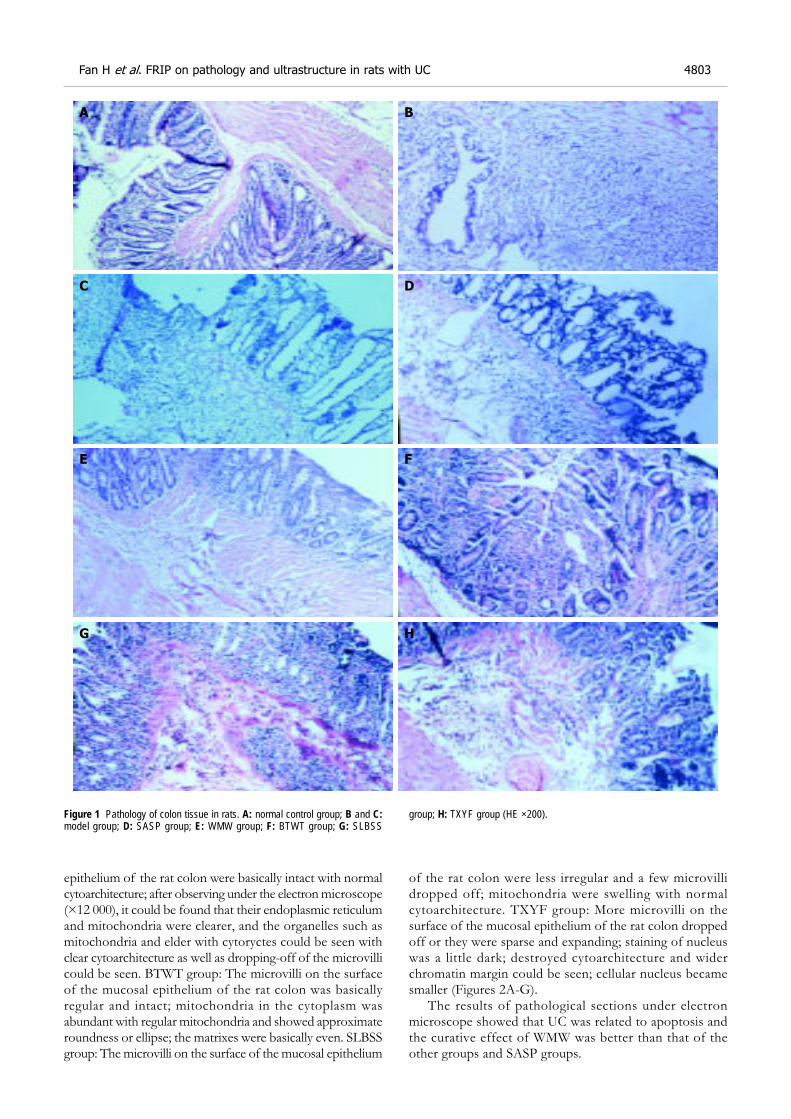
epithelium of the rat colon were basically intact with normalcytoarchitecture; after observing under the electron microscope(×12 000), it could be found that their endoplasmic reticulumand mitochondria were clearer, and the organelles such asmitochondria and elder with cytoryctes could be seen withclear cytoarchitecture as well as dropping-off of the microvillicould be seen. BTWT group: The microvilli on the surfaceof the mucosal epithelium of the rat colon was basicallyregular and intact; mitochondria in the cytoplasm wasabundant with regular mitochondria and showed approximateroundness or ellipse; the matrixes were basically even. SLBSSgroup: The microvilli on the surface of the mucosal epithelium
of the rat colon were less irregular and a few microvillidropped off; mitochondria were swelling with normalcytoarchitecture. TXYF group: More microvilli on thesurface of the mucosal epithelium of the rat colon droppedoff or they were sparse and expanding; staining of nucleuswas a little dark; destroyed cytoarchitecture and widerchromatin margin could be seen; cellular nucleus becamesmaller (Figures 2A-G).
The results of pathological sections under electronmicroscope showed that UC was related to apoptosis andthe curative effect of WMW was better than that of theother groups and SASP groups.
Figure 1 Pathology of colon tissue in rats. A: normal control group; B and C:model group; D: SASP group; E: WMW group; F: BTWT group; G: SLBSS
group; H: TXYF group (HE ×200).
Fan H et al. FRIP on pathology and ultrastructure in rats with UC 4803
A
D
E F
B
G H
C
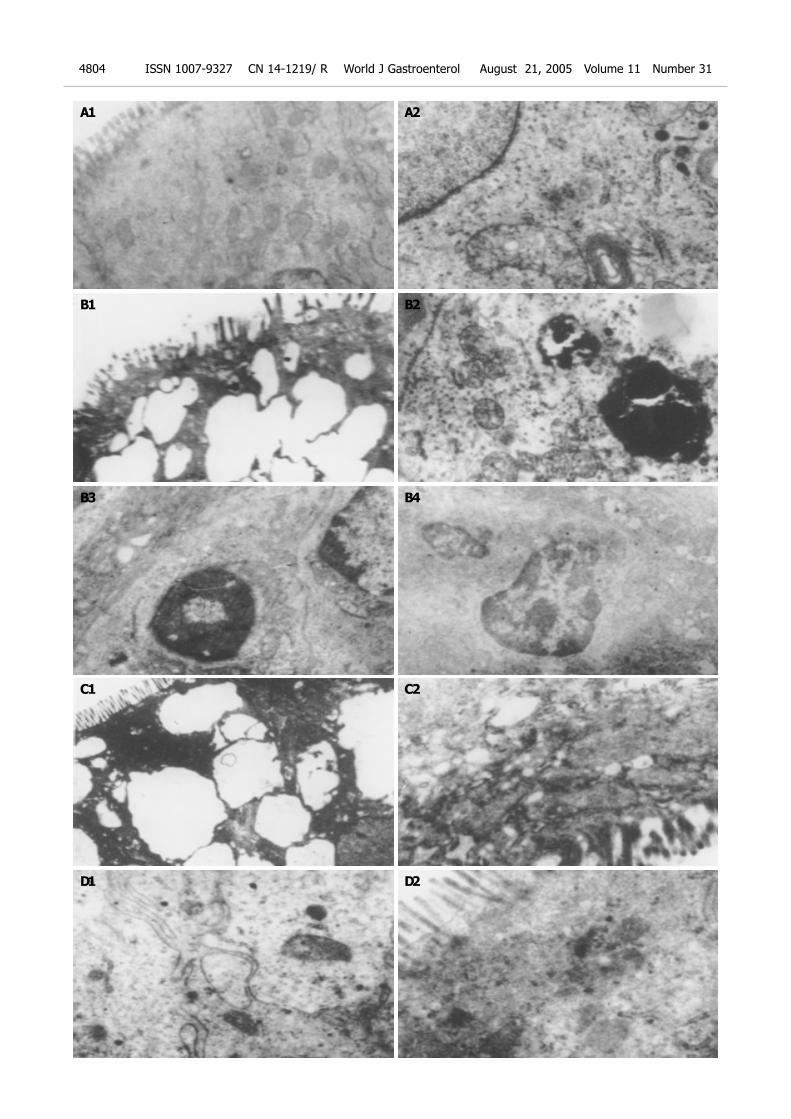
4804 ISSN 1007-9327 CN 14-1219/ R World J Gastroenterol August 21, 2005 Volume 11 Number 31
A1
B2
A2
B1
B3
C2C1
B4
D1 D2
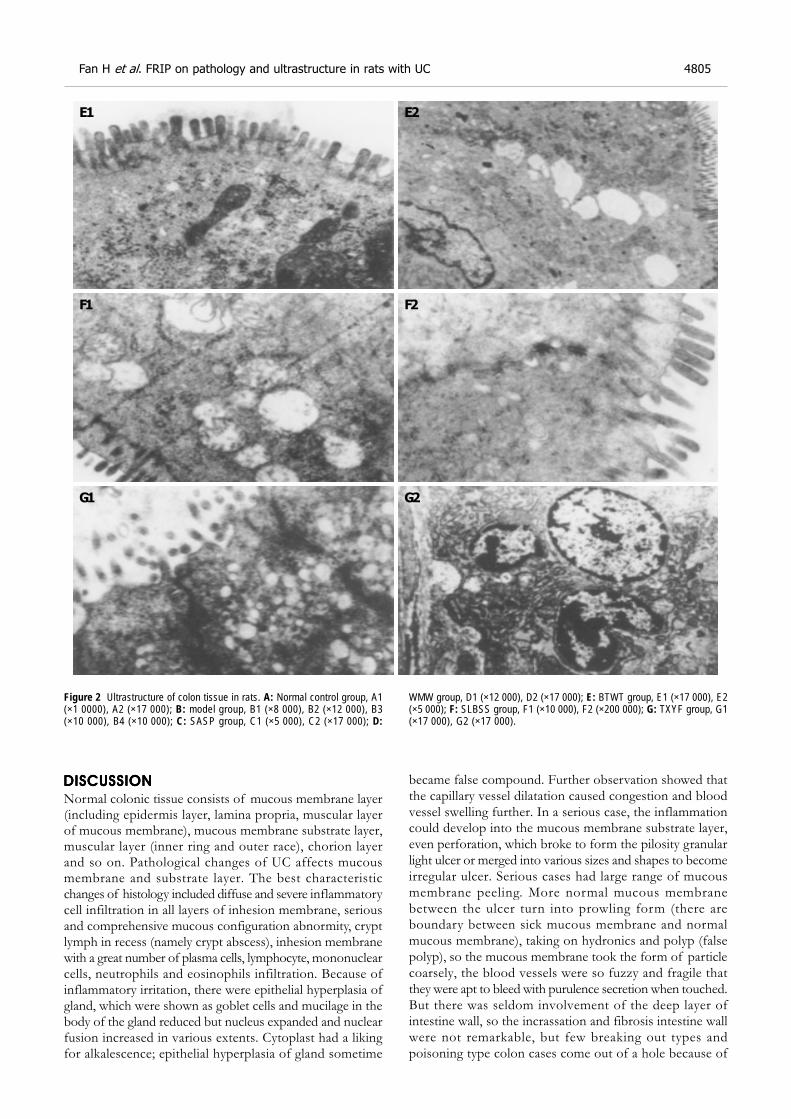
DISCUSSIONDISCUSSIONDISCUSSIONDISCUSSIONDISCUSSION
Normal colonic tissue consists of mucous membrane layer(including epidermis layer, lamina propria, muscular layerof mucous membrane), mucous membrane substrate layer,muscular layer (inner ring and outer race), chorion layerand so on. Pathological changes of UC affects mucousmembrane and substrate layer. The best characteristicchanges of histology included diffuse and severe inflammatorycell infiltration in all layers of inhesion membrane, seriousand comprehensive mucous configuration abnormity, cryptlymph in recess (namely crypt abscess), inhesion membranewith a great number of plasma cells, lymphocyte, mononuclearcells, neutrophils and eosinophils infiltration. Because ofinflammatory irritation, there were epithelial hyperplasia ofgland, which were shown as goblet cells and mucilage in thebody of the gland reduced but nucleus expanded and nuclearfusion increased in various extents. Cytoplast had a likingfor alkalescence; epithelial hyperplasia of gland sometime
became false compound. Further observation showed thatthe capillary vessel dilatation caused congestion and bloodvessel swelling further. In a serious case, the inflammationcould develop into the mucous membrane substrate layer,even perforation, which broke to form the pilosity granularlight ulcer or merged into various sizes and shapes to becomeirregular ulcer. Serious cases had large range of mucousmembrane peeling. More normal mucous membranebetween the ulcer turn into prowling form (there areboundary between sick mucous membrane and normalmucous membrane), taking on hydronics and polyp (falsepolyp), so the mucous membrane took the form of particlecoarsely, the blood vessels were so fuzzy and fragile thatthey were apt to bleed with purulence secretion when touched.But there was seldom involvement of the deep layer ofintestine wall, so the incrassation and fibrosis intestine wallwere not remarkable, but few breaking out types andpoisoning type colon cases come out of a hole because of
Figure 2 Ultrastructure of colon tissue in rats. A: Normal control group, A1(×1 0000), A2 (×17 000); B: model group, B1 (×8 000), B2 (×12 000), B3(×10 000), B4 (×10 000); C: SASP group, C1 (×5 000), C2 (×17 000); D:
WMW group, D1 (×12 000), D2 (×17 000); E: BTWT group, E1 (×17 000), E2(×5 000); F: SLBSS group, F1 (×10 000), F2 (×200 000); G: TXYF group, G1(×17 000), G2 (×17 000).
Fan H et al. FRIP on pathology and ultrastructure in rats with UC 4805
E2
F2
G2
F1
G1
E1
piercing through intestine wall.In recent years, many studies to the change of colonic
mucus were carried out. It was suggested that it might bethe prodromal change of carcinoma of large intestine. Aswe all know, UC is a pre-cancerous lesion of colon carcinoma.The mucosa in this region also showed certain histologiccharacteristics: the goblet cells in the glandular body decreasedremarkably or disappeared with appearance of simplecolumnar cells, which lack mucin secretion. The lumen ofsome mucosal glands became dilated, branched or irregularlyarranged. We found that the important characteristic ofUC was inflammation in this experiment and cell apoptosisunder electron microscope. We also found that the presentationwas hyperemia and edema with a great number of plasmacells, lymphocytes, mononuclear cells, neutrophils, andeosinophils infiltration[10-12], the characteristic that pathologychanges and ultrastructure was different in all groups wasassociated with the treatment.
This model made with DNCB and acetic acid wassuccessful by the changes of symptoms and signs, damagescores of the colonic mucosa and the pathology sectionsand ultrastructure of colon tissue. At the same time, theirsymptoms and signs and pathology differently improvedafter treatment (not statistically significant, P>0.05). In thisstudy, we discovered that FRIP had better curative effecton UC and WMWs was the best, BTWs and SLBSSs werethe second of best. TXYFs were worst (they were as sameas SASPs). At the same time, this implies, that we musthave BianzhengLunzhi in the treatment of UC[13]
. Accordingto TCM, UC belongs to the category of “Xiouxili”(diarrhea), the mucosal inflammatory lesions result fromnot only deficiency and hypofunction of spleen and stomach,but also accumulation of damp heat, the pathogenesis ofUC is similar with the prescription characteristic of WMW.Therefore, in this study, the best curative effect was achievedby the treatment of the WMW. The results showed thatthis WMW had the function of strengthening the spleenand reinforcing Qi and eliminating damp-heat pathogen,promoting flow of Qi and blood, improving luminal bloodcirculation, and was helpful for hemostasis and the absorptionof inflammatory products, eventually attained the goal ofthe neogenesis of granulated tissue in the region ofulceration, and the repair of mucosal epithelium. But BTWconcentrated on eliminating damp-heat pathogen, SLBSSwas good at strengthening the spleen and reinforcing Qi,the former had the function of reducing the excess, thelatter had the function of reinforcing the deficiency, so two
formulae of BTW and SLBSS had some therapeutic effects,and they were the second curative effect; the prescriptioncharacteristic of TXYF, which had the function of smoothingthe liver-Qi to normalize the stomach, was different withthe pathogenesis of UC and it had the worst curative effect.
In addition, we discovered that apoptosis was possiblyrelated to UC[13] and FRIP could decrease apoptosis, blockinflammation and induce remission.
REFERENCESREFERENCESREFERENCESREFERENCESREFERENCES
1 Bicks RO, Rosenberg EW. A chronic delayed hypersensitivityreaction in the guinea pig colon. Gastroenterology 1964; 46:543-549
2 Li Y. Methods on making rat experiment model of ulcerativecolitis. New Drugs TCM Clinical Pharmacol 1999; 10: 120-122
3 Jiang XL, Quan QZ, Wang D, Sun ZQ, Wang YJ. A newulcerative colitis model induced by compound method andthe change of immunity and ultrastructures. Shijie HuarenXiaohua Zazhi 1999; 7: 381
4 Jiang XL, Quan QZ, Wang D, Sun ZQ, Wang YJ, Qi F. Effectof heartleaf houttuynia herb on colonic pressure in rats withulcerative colitis. Shijie Huaren Xiaohua Zazhi 1999; 7: 786
5 Fan H, Qiu MY. Evaluating on making rat experiment modelof ulcerative colitis. Chinese Archives Traditional Chinese Med2004; 22: 865-866
6 Wallace JL, Keenan CM. An orally active inhibitor of Leukotrienesynthesis accelerates healing in a rat model of colitis. Am JPhysiol 1990; 258(4 Pt 1): G527-534
7 Zheng HB, Hu HY, Lu X, Ma GT. Morpholgical observa-tion of intestine-clearing suppository in preventing andtreating rats, ulcerative colitis. J Zhejiang College TCM 2001;25: 47-51
8 Morris GP, Beck PL, Herridge MS, Depew WT, SzewczukMR, Wallace JL. Hapten-induced model of chronic inflam-mation and ulceration in the rat colon. Gastroenterology 1989;96: 795-803
9 Padol I, Huang JQ, Hogaboam CM, Hunt RH. Therapeuticeffects of the endothelin receptor antagonist Ro 48-5695 in theTNBS/DNBS rat model of colitis. Eur J Gastroenterol Hepatol2001; 12: 257-265
10 Tjandra K, Le T, Swain MG. Exaperimental colitis attenu-ates development of toxin-induced cholangitis in rats. DigDis Sci 2002; 47: 1216-1223
11 Ji XL, Shen MS, Yin W. Key of Pathological Diagnosis onulcerative colitis and colon desease. J Diag Pathol 2002; 9:245-247
12 Nosalova V, Cerna S, Schunack W, Grandi D, Coruzzi G.Effects of (R) alpha-methylhistamine on experimental colitis.Inflamm Res 2001; 50(Suppl 2): S108-109
13 Fan H, Qiu MY, Mei JJ, Shen GX, Liu SL. Effect of Lichangsifangon cellular apoptosis and expression of the related regulatorygenes in rats with ulcerative colitis. Shijie Huaren Xiaohua Zazhi2004; 12: 1119-1124
4806 ISSN 1007-9327 CN 14-1219/ R World J Gastroenterol August 21, 2005 Volume 11 Number 31
Science Editor Zhu LH and Guo SY Language Editor Elsevier HK
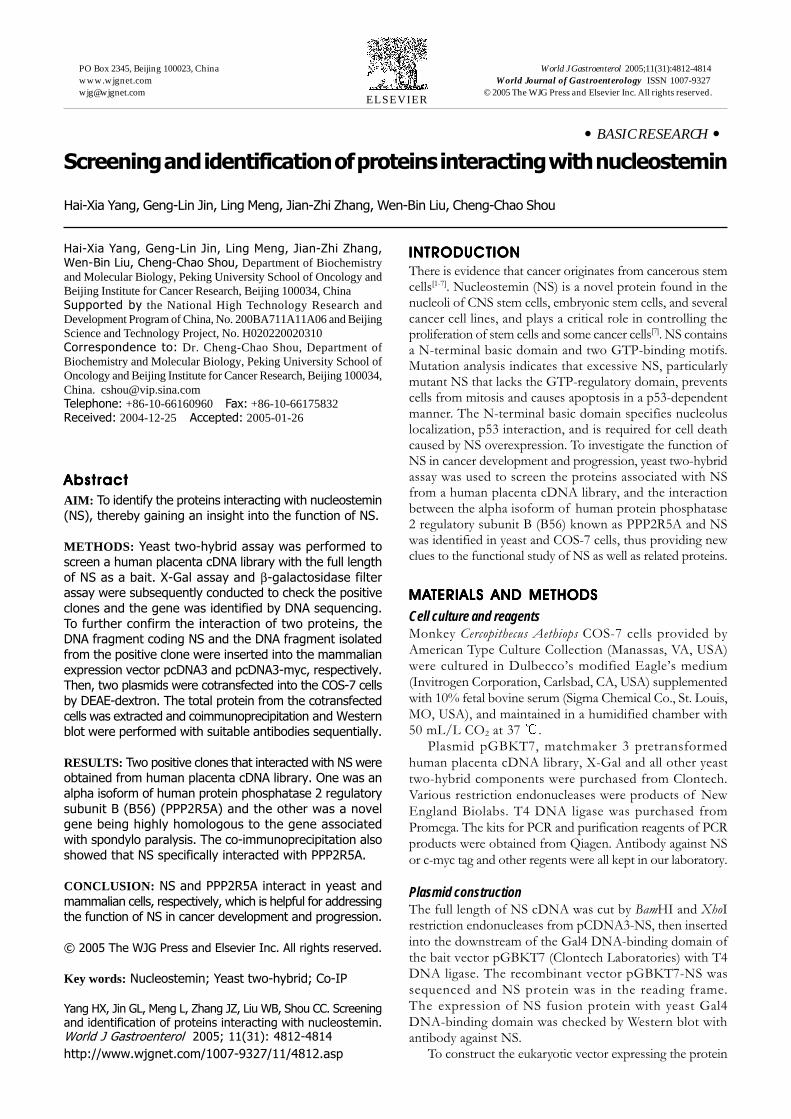
• BASIC RESEARCH •
Screening and identification of proteins interacting with nucleostemin
Hai-Xia Yang, Geng-Lin Jin, Ling Meng, Jian-Zhi Zhang, Wen-Bin Liu, Cheng-Chao Shou
ELSEVIER
PO Box 2345, Beijing 100023, China World J Gastroenterol 2005;11(31):4812-4814www.wjgnet.com World Journal of Gastroenterology ISSN [email protected] © 2005 The WJG Press and Elsevier Inc. All rights reserved.
Hai-Xia Yang, Geng-Lin Jin, Ling Meng, Jian-Zhi Zhang,Wen-Bin Liu, Cheng-Chao Shou, Department of Biochemistryand Molecular Biology, Peking University School of Oncology andBeijing Institute for Cancer Research, Beijing 100034, ChinaSupported by the National High Technology Research andDevelopment Program of China, No. 200BA711A11A06 and BeijingScience and Technology Project, No. H020220020310Correspondence to: Dr. Cheng-Chao Shou, Department ofBiochemistry and Molecular Biology, Peking University School ofOncology and Beijing Institute for Cancer Research, Beijing 100034,China. [email protected]: +86-10-66160960 Fax: +86-10-66175832Received: 2004-12-25 Accepted: 2005-01-26
AbstractAbstractAbstractAbstractAbstract
AIM: To identify the proteins interacting with nucleostemin
(NS), thereby gaining an insight into the function of NS.
METHODS: Yeast two-hybrid assay was performed to
screen a human placenta cDNA library with the full length
of NS as a bait. X-Gal assay and β-galactosidase filterassay were subsequently conducted to check the positive
clones and the gene was identified by DNA sequencing.
To further confirm the interaction of two proteins, theDNA fragment coding NS and the DNA fragment isolated
from the positive clone were inserted into the mammalian
expression vector pcDNA3 and pcDNA3-myc, respectively.Then, two plasmids were cotransfected into the COS-7 cells
by DEAE-dextron. The total protein from the cotransfected
cells was extracted and coimmunoprecipitation and Westernblot were performed with suitable antibodies sequentially.
RESULTS: Two positive clones that interacted with NS wereobtained from human placenta cDNA library. One was an
alpha isoform of human protein phosphatase 2 regulatory
subunit B (B56) (PPP2R5A) and the other was a novelgene being highly homologous to the gene associated
with spondylo paralysis. The co-immunoprecipitation also
showed that NS specifically interacted with PPP2R5A.
CONCLUSION: NS and PPP2R5A interact in yeast and
mammalian cells, respectively, which is helpful for addressingthe function of NS in cancer development and progression.
© 2005 The WJG Press and Elsevier Inc. All rights reserved.
Key words: Nucleostemin; Yeast two-hybrid; Co-IP
Yang HX, Jin GL, Meng L, Zhang JZ, Liu WB, Shou CC. Screeningand identification of proteins interacting with nucleostemin.World J Gastroenterol 2005; 11(31): 4812-4814
http://www.wjgnet.com/1007-9327/11/4812.asp
INTRODUCTIONINTRODUCTIONINTRODUCTIONINTRODUCTIONINTRODUCTION
There is evidence that cancer originates from cancerous stemcells[1-7]. Nucleostemin (NS) is a novel protein found in thenucleoli of CNS stem cells, embryonic stem cells, and severalcancer cell lines, and plays a critical role in controlling theproliferation of stem cells and some cancer cells[7]. NS containsa N-terminal basic domain and two GTP-binding motifs.Mutation analysis indicates that excessive NS, particularlymutant NS that lacks the GTP-regulatory domain, preventscells from mitosis and causes apoptosis in a p53-dependentmanner. The N-terminal basic domain specifies nucleoluslocalization, p53 interaction, and is required for cell deathcaused by NS overexpression. To investigate the function ofNS in cancer development and progression, yeast two-hybridassay was used to screen the proteins associated with NSfrom a human placenta cDNA library, and the interactionbetween the alpha isoform of human protein phosphatase2 regulatory subunit B (B56) known as PPP2R5A and NSwas identified in yeast and COS-7 cells, thus providing newclues to the functional study of NS as well as related proteins.
MAMAMAMAMATERIALS AND METHODSTERIALS AND METHODSTERIALS AND METHODSTERIALS AND METHODSTERIALS AND METHODS
Cell culture and reagentsMonkey Cercopithecus Aethiops COS-7 cells provided byAmerican Type Culture Collection (Manassas, VA, USA)were cultured in Dulbecco’s modified Eagle’s medium(Invitrogen Corporation, Carlsbad, CA, USA) supplementedwith 10% fetal bovine serum (Sigma Chemical Co., St. Louis,MO, USA), and maintained in a humidified chamber with50 mL/L CO2 at 37 .
Plasmid pGBKT7, matchmaker 3 pretransformedhuman placenta cDNA library, X-Gal and all other yeasttwo-hybrid components were purchased from Clontech.Various restriction endonucleases were products of NewEngland Biolabs. T4 DNA ligase was purchased fromPromega. The kits for PCR and purification reagents of PCRproducts were obtained from Qiagen. Antibody against NSor c-myc tag and other regents were all kept in our laboratory.
Plasmid constructionThe full length of NS cDNA was cut by BamHI and XhoIrestriction endonucleases from pCDNA3-NS, then insertedinto the downstream of the Gal4 DNA-binding domain ofthe bait vector pGBKT7 (Clontech Laboratories) with T4DNA ligase. The recombinant vector pGBKT7-NS wassequenced and NS protein was in the reading frame.The expression of NS fusion protein with yeast Gal4DNA-binding domain was checked by Western blot withantibody against NS.
To construct the eukaryotic vector expressing the protein
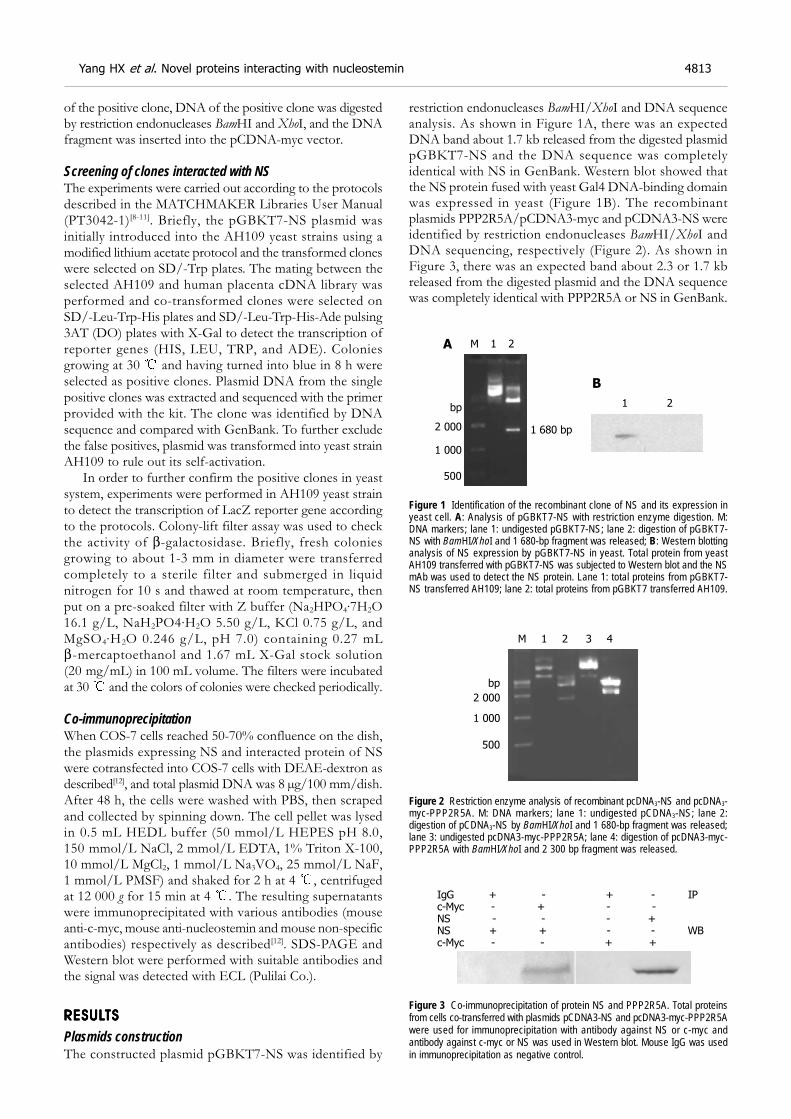
of the positive clone, DNA of the positive clone was digestedby restriction endonucleases BamHI and XhoI, and the DNAfragment was inserted into the pCDNA-myc vector.
Screening of clones interacted with NSThe experiments were carried out according to the protocolsdescribed in the MATCHMAKER Libraries User Manual(PT3042-1)[8-11]. Briefly, the pGBKT7-NS plasmid wasinitially introduced into the AH109 yeast strains using amodified lithium acetate protocol and the transformed cloneswere selected on SD/-Trp plates. The mating between theselected AH109 and human placenta cDNA library wasperformed and co-transformed clones were selected onSD/-Leu-Trp-His plates and SD/-Leu-Trp-His-Ade pulsing3AT (DO) plates with X-Gal to detect the transcription ofreporter genes (HIS, LEU, TRP, and ADE). Coloniesgrowing at 30 and having turned into blue in 8 h wereselected as positive clones. Plasmid DNA from the singlepositive clones was extracted and sequenced with the primerprovided with the kit. The clone was identified by DNAsequence and compared with GenBank. To further excludethe false positives, plasmid was transformed into yeast strainAH109 to rule out its self-activation.
In order to further confirm the positive clones in yeastsystem, experiments were performed in AH109 yeast strainto detect the transcription of LacZ reporter gene accordingto the protocols. Colony-lift filter assay was used to checkthe activity of β-galactosidase. Briefly, fresh coloniesgrowing to about 1-3 mm in diameter were transferredcompletely to a sterile filter and submerged in liquidnitrogen for 10 s and thawed at room temperature, thenput on a pre-soaked filter with Z buffer (Na2HPO4·7H2O16.1 g/L, NaH2PO4·H2O 5.50 g/L, KCl 0.75 g/L, andMgSO4·H2O 0.246 g/L, pH 7.0) containing 0.27 mLβ-mercaptoethanol and 1.67 mL X-Gal stock solution(20 mg/mL) in 100 mL volume. The filters were incubatedat 30 and the colors of colonies were checked periodically.
Co-immunoprecipitationWhen COS-7 cells reached 50-70% confluence on the dish,the plasmids expressing NS and interacted protein of NSwere cotransfected into COS-7 cells with DEAE-dextron asdescribed[12], and total plasmid DNA was 8 µg/100 mm/dish.After 48 h, the cells were washed with PBS, then scrapedand collected by spinning down. The cell pellet was lysedin 0.5 mL HEDL buffer (50 mmol/L HEPES pH 8.0,150 mmol/L NaCl, 2 mmol/L EDTA, 1% Triton X-100,10 mmol/L MgCl2, 1 mmol/L Na3VO4, 25 mmol/L NaF,1 mmol/L PMSF) and shaked for 2 h at 4 , centrifugedat 12 000 g for 15 min at 4 . The resulting supernatantswere immunoprecipitated with various antibodies (mouseanti-c-myc, mouse anti-nucleostemin and mouse non-specificantibodies) respectively as described[12]. SDS-PAGE andWestern blot were performed with suitable antibodies andthe signal was detected with ECL (Pulilai Co.).
RESULRESULRESULRESULRESULTSTSTSTSTS
Plasmids constructionThe constructed plasmid pGBKT7-NS was identified by
restriction endonucleases BamHI/XhoI and DNA sequenceanalysis. As shown in Figure 1A, there was an expectedDNA band about 1.7 kb released from the digested plasmidpGBKT7-NS and the DNA sequence was completelyidentical with NS in GenBank. Western blot showed thatthe NS protein fused with yeast Gal4 DNA-binding domainwas expressed in yeast (Figure 1B). The recombinantplasmids PPP2R5A/pCDNA3-myc and pCDNA3-NS wereidentified by restriction endonucleases BamHI/XhoI andDNA sequencing, respectively (Figure 2). As shown inFigure 3, there was an expected band about 2.3 or 1.7 kbreleased from the digested plasmid and the DNA sequencewas completely identical with PPP2R5A or NS in GenBank.
Figure 1 Identification of the recombinant clone of NS and its expression inyeast cell. A: Analysis of pGBKT7-NS with restriction enzyme digestion. M:DNA markers; lane 1: undigested pGBKT7-NS; lane 2: digestion of pGBKT7-NS with BamHI/XhoI and 1 680-bp fragment was released; B: Western blottinganalysis of NS expression by pGBKT7-NS in yeast. Total protein from yeastAH109 transferred with pGBKT7-NS was subjected to Western blot and the NSmAb was used to detect the NS protein. Lane 1: total proteins from pGBKT7-NS transferred AH109; lane 2: total proteins from pGBKT7 transferred AH109.
Figure 2 Restriction enzyme analysis of recombinant pcDNA3-NS and pcDNA3-myc-PPP2R5A. M: DNA markers; lane 1: undigested pCDNA3-NS; lane 2:digestion of pCDNA3-NS by BamHI/XhoI and 1 680-bp fragment was released;lane 3: undigested pcDNA3-myc-PPP2R5A; lane 4: digestion of pcDNA3-myc-PPP2R5A with BamHI/XhoI and 2 300 bp fragment was released.
Figure 3 Co-immunoprecipitation of protein NS and PPP2R5A. Total proteinsfrom cells co-transferred with plasmids pCDNA3-NS and pcDNA3-myc-PPP2R5Awere used for immunoprecipitation with antibody against NS or c-myc andantibody against c-myc or NS was used in Western blot. Mouse IgG was usedin immunoprecipitation as negative control.
IgG + - + - IPc-Myc - + - -NS - - - +NS + + - - WBc-Myc - - + +
2 000
1 000
500
bp
M 1 2
1 680 bp
1 2
A
B
2 000
1 000
500
bp
M 1 2 3 4
Yang HX et al. Novel proteins interacting with nucleostemin 4813
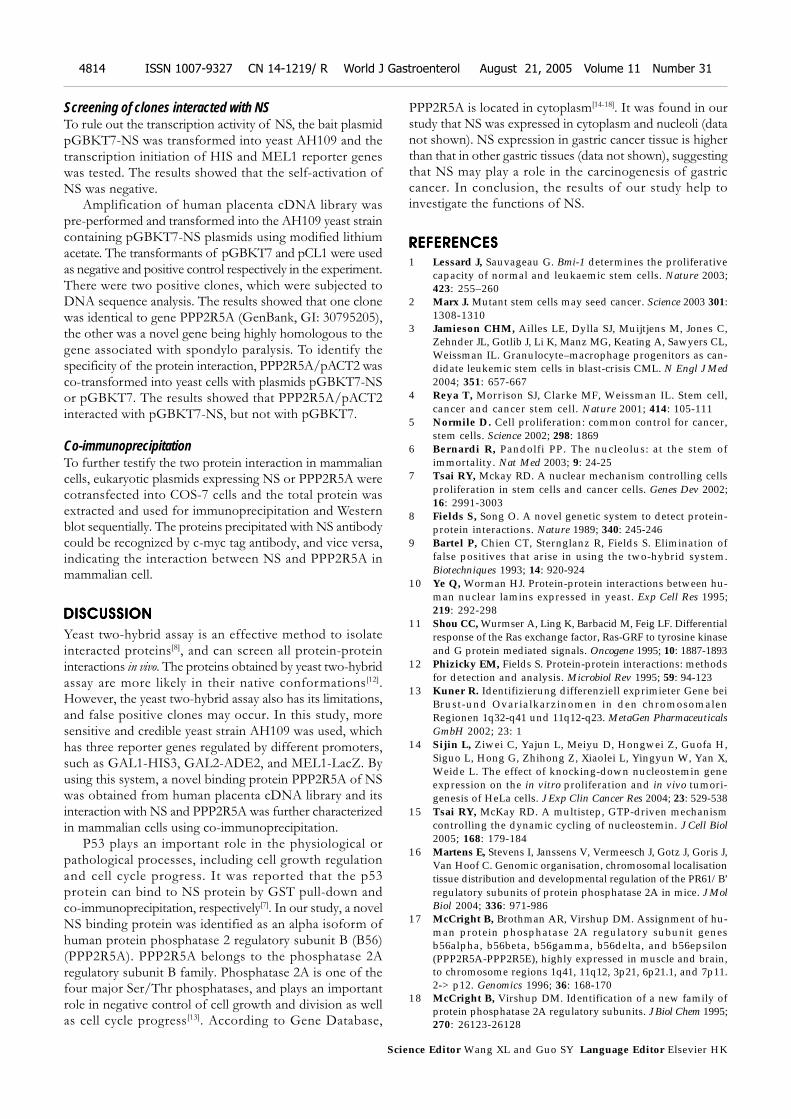
Screening of clones interacted with NSTo rule out the transcription activity of NS, the bait plasmidpGBKT7-NS was transformed into yeast AH109 and thetranscription initiation of HIS and MEL1 reporter geneswas tested. The results showed that the self-activation ofNS was negative.
Amplification of human placenta cDNA library waspre-performed and transformed into the AH109 yeast straincontaining pGBKT7-NS plasmids using modified lithiumacetate. The transformants of pGBKT7 and pCL1 were usedas negative and positive control respectively in the experiment.There were two positive clones, which were subjected toDNA sequence analysis. The results showed that one clonewas identical to gene PPP2R5A (GenBank, GI: 30795205),the other was a novel gene being highly homologous to thegene associated with spondylo paralysis. To identify thespecificity of the protein interaction, PPP2R5A/pACT2 wasco-transformed into yeast cells with plasmids pGBKT7-NSor pGBKT7. The results showed that PPP2R5A/pACT2interacted with pGBKT7-NS, but not with pGBKT7.
Co-immunoprecipitationTo further testify the two protein interaction in mammaliancells, eukaryotic plasmids expressing NS or PPP2R5A werecotransfected into COS-7 cells and the total protein wasextracted and used for immunoprecipitation and Westernblot sequentially. The proteins precipitated with NS antibodycould be recognized by c-myc tag antibody, and vice versa,indicating the interaction between NS and PPP2R5A inmammalian cell.
DISCUSSIONDISCUSSIONDISCUSSIONDISCUSSIONDISCUSSION
Yeast two-hybrid assay is an effective method to isolateinteracted proteins[8], and can screen all protein-proteininteractions in vivo. The proteins obtained by yeast two-hybridassay are more likely in their native conformations[12].However, the yeast two-hybrid assay also has its limitations,and false positive clones may occur. In this study, moresensitive and credible yeast strain AH109 was used, whichhas three reporter genes regulated by different promoters,such as GAL1-HIS3, GAL2-ADE2, and MEL1-LacZ. Byusing this system, a novel binding protein PPP2R5A of NSwas obtained from human placenta cDNA library and itsinteraction with NS and PPP2R5A was further characterizedin mammalian cells using co-immunoprecipitation.
P53 plays an important role in the physiological orpathological processes, including cell growth regulationand cell cycle progress. It was reported that the p53protein can bind to NS protein by GST pull-down andco-immunoprecipitation, respectively[7]. In our study, a novelNS binding protein was identified as an alpha isoform ofhuman protein phosphatase 2 regulatory subunit B (B56)(PPP2R5A). PPP2R5A belongs to the phosphatase 2Aregulatory subunit B family. Phosphatase 2A is one of thefour major Ser/Thr phosphatases, and plays an importantrole in negative control of cell growth and division as wellas cell cycle progress[13]. According to Gene Database,
PPP2R5A is located in cytoplasm[14-18]. It was found in ourstudy that NS was expressed in cytoplasm and nucleoli (datanot shown). NS expression in gastric cancer tissue is higherthan that in other gastric tissues (data not shown), suggestingthat NS may play a role in the carcinogenesis of gastriccancer. In conclusion, the results of our study help toinvestigate the functions of NS.
REFERENCESREFERENCESREFERENCESREFERENCESREFERENCES
1 Lessard J, Sauvageau G. Bmi-1 determines the proliferativecapacity of normal and leukaemic stem cells. Nature 2003;423: 255–260
2 Marx J. Mutant stem cells may seed cancer. Science 2003 301:1308-1310
3 Jamieson CHM, Ailles LE, Dylla SJ, Muijtjens M, Jones C,Zehnder JL, Gotlib J, Li K, Manz MG, Keating A, Sawyers CL,Weissman IL. Granulocyte–macrophage progenitors as can-didate leukemic stem cells in blast-crisis CML. N Engl J Med2004; 351: 657-667
4 Reya T, Morrison SJ, Clarke MF, Weissman IL. Stem cell,cancer and cancer stem cell. Nature 2001; 414: 105-111
5 Normile D. Cell proliferation: common control for cancer,stem cells. Science 2002; 298: 1869
6 Bernardi R, Pandolfi PP. The nucleolus: at the stem ofimmortality. Nat Med 2003; 9: 24-25
7 Tsai RY, Mckay RD. A nuclear mechanism controlling cellsproliferation in stem cells and cancer cells. Genes Dev 2002;16: 2991-3003
8 Fields S, Song O. A novel genetic system to detect protein-protein interactions. Nature 1989; 340: 245-246
9 Bartel P, Chien CT, Sternglanz R, Fields S. Elimination offalse positives that arise in using the two-hybrid system.Biotechniques 1993; 14: 920-924
10 Ye Q, Worman HJ. Protein-protein interactions between hu-man nuclear lamins expressed in yeast. Exp Cell Res 1995;219: 292-298
11 Shou CC, Wurmser A, Ling K, Barbacid M, Feig LF. Differentialresponse of the Ras exchange factor, Ras-GRF to tyrosine kinaseand G protein mediated signals. Oncogene 1995; 10: 1887-1893
12 Phizicky EM, Fields S. Protein-protein interactions: methodsfor detection and analysis. Microbiol Rev 1995; 59: 94-123
13 Kuner R. Identifizierung differenziell exprimieter Gene beiBrust-und Ovarialkarzinomen in den chromosomalenRegionen 1q32-q41 und 11q12-q23. MetaGen PharmaceuticalsGmbH 2002; 23: 1
14 Sijin L, Ziwei C, Yajun L, Meiyu D, Hongwei Z, Guofa H,Siguo L, Hong G, Zhihong Z, Xiaolei L, Yingyun W, Yan X,Weide L. The effect of knocking-down nucleostemin geneexpression on the in vitro proliferation and in vivo tumori-genesis of HeLa cells. J Exp Clin Cancer Res 2004; 23: 529-538
15 Tsai RY, McKay RD. A multistep, GTP-driven mechanismcontrolling the dynamic cycling of nucleostemin. J Cell Biol2005; 168: 179-184
16 Martens E, Stevens I, Janssens V, Vermeesch J, Gotz J, Goris J,Van Hoof C. Genomic organisation, chromosomal localisationtissue distribution and developmental regulation of the PR61/B’regulatory subunits of protein phosphatase 2A in mice. J MolBiol 2004; 336: 971-986
17 McCright B, Brothman AR, Virshup DM. Assignment of hu-man protein phosphatase 2A regulatory subunit genesb56alpha, b56beta, b56gamma, b56delta, and b56epsilon(PPP2R5A-PPP2R5E), highly expressed in muscle and brain,to chromosome regions 1q41, 11q12, 3p21, 6p21.1, and 7p11.2-> p12. Genomics 1996; 36: 168-170
18 McCright B, Virshup DM. Identification of a new family ofprotein phosphatase 2A regulatory subunits. J Biol Chem 1995;270: 26123-26128
Science Editor Wang XL and Guo SY Language Editor Elsevier HK
4814 ISSN 1007-9327 CN 14-1219/ R World J Gastroenterol August 21, 2005 Volume 11 Number 31
• BASIC RESEARCH •
Influence of continuous veno-venous hemofiltration on the course
of acute pancreatitis
Hong-Li Jiang, Wu-Jun Xue, Da-Qing Li, Ai-Ping Yin, Xia Xin, Chun-Mei Li, Ju-Lin Gao
ELSEVIER
PO Box 2345, Beijing 100023, China World J Gastroenterol 2005;11(31):4815-4821www.wjgnet.com World Journal of Gastroenterology ISSN [email protected] © 2005 The WJG Press and Elsevier Inc. All rights reserved.
Hong-Li Jiang, Wu-Jun Xue, Da-Qing Li, Ai-Ping Yin, Xia Xin,Chun-Mei Li, Ju-Lin Gao, Department of Hemodialysis Center,The First Hospital of Xi’an Jiaotong University, Xi’an 710061,Shaanxi Province, ChinaSupported by the Natural Science Foundation of Shaanxi Province,No. 2002C257Correspondence to: Dr. Hong-Li Jiang, Department of HemodialysisCenter, The First Hospital of Xi’an Jiaotong University, No.1 JiankangLu, Xi’an 710061, Shaanxi Province, China. [email protected]: +86-29-85323255Received: 2005-04-14 Accepted: 2005-06-06
AbstractAbstractAbstractAbstractAbstract
AIM: To investigate whether continuous veno-venoushemofiltration (CVVH) in different filtration rate to eliminate
cytokines would result in different efficiency in acute
pancreatitis, whether the saturation time of filter membranewas related to different filtration rate, and whether the
onset time of CVVH could influence the survival of acute
pancreatitis.
METHODS: Thirty-seven patients were classified into four
groups randomly. Group 1 underwent low-volume CVVHwithin 48 h of the onset of abdominal pain (early CVVH,
n = 9). Group 2 received low-volume CVVH after 96 h of
the onset of abdominal pain (late CVVH, n = 10). Group 3underwent high-volume CVVH within 48 h of the onset of
abdominal pain (early CVVH, n = 9). Group 4 received
high-volume CVVH after 96 h of the onset of abdominalpain (late CVVH, n = 9). CVVH was sustained for at
least 72 h. Blood was taken before hemofiltration, and
ultrafiltrate was collected at the start of CVVH and every12 h during CVVH period for the purpose of measuring the
concentrations of TNF-α, IL-1β and IL-6. The concentrations
of TNF-α, IL-1β and IL-6 were measured by swine-specificELISA. The Solartron 1 255 B frequency response analyzer
(British) was used to observe the resistance of filter
membrane.
RESULTS: The survival rate had a significant difference
(94.44% vs 68.42%, P<0.01) high-volume and low-volumeCVVH patients. The survival rate had also a significant
difference (88.89% vs 73.68%, P<0.05) between early
and late CVVH patients. The hemodynamic deterioration(MAP, HR, CVP) was less severe in groups 4 and 1 than that
in group 2, and in group 3 than in group 4. The adsorptivesaturation time of filters membranes was 120-180 minif the filtration rate was 1 000-4 000 mL/h. After thefirst, second and third new hemofilters were changed,serum TNF-α concentrations had a negative correlation
with resistance (r: -0.91, -0.89, and -0.86, respectively ingroup 1; -0.89, -0.85, and -0.76, respectively in group 2;-0.88, -0.92, and -0.82, respectively in group 3; -0.84,-0.87, and -0.79, respectively in group 4). The decreasingextent of TNF-α, IL-1β and IL-6 was significantly differentbetween group 3 and group 1 (TNF-α P<0.05, IL-1β P<0.05,IL-6 P<0.01), between group 4 and group 2 (TNF-α P<0.05,IL-1β P<0.05, IL-6 P<0.01), between group 1 and group 2(TNF-α P<0.05, IL-1β P<0.05, IL-6 P<0.05), and betweengroup 3 and group 4 (TNF-α P<0.01, IL-1β P<0.01, IL-6P<0.05), respectively during CVVH period. The decreasingextent of TNF-α and IL-1β was also significantly differentbetween survival patients and dead patients (TNF-αP<0.05, IL-1β P<0.05). In survival patients, serumconcentration of TNF-α and IL-1β decreased moresignificantly than that in dead patients.
CONCLUSION: High-volume and early CVVH improvehemodynamic deterioration and survival in acute pancreatitispatients. High-volume CVVH can eliminate cytokines moreefficiently than low-volume CVVH. The survival rate is relatedto the decrease extent of TNF-α and IL-1β. The adsorptivesaturation time of filter membranes are different underdifferent filtration rate condition. The filter should be changedtimely once filter membrane adsorption is saturated.
© 2005 The WJG Press and Elsevier Inc. All rights reserved.
Key words: Venovenous hemofiltration; Acute pancreatitis;TNF-α; IL-1β; IL-6
Jiang HL, Xue WJ, Li DQ, Yin AP, Xin X, Li CM, Gao JL.Influence of continuous veno-venous hemofiltration on thecourse of acute pancreatitis. World J Gastroenterol 2005;11(31): 4815-4821
http://www.wjgnet.com/1007-9327/11/4815.asp
INTRODUCTIONINTRODUCTIONINTRODUCTIONINTRODUCTIONINTRODUCTION
Excessive activation of inflammatory mediator cascadeduring severe acute pancreatitis is a major cause of multipleorgan dysfunction associated with a high mortality[1]. Non-selectiveelimination of pancreatitis-related mediators is a preventivemeasure against the systemic complications of the disease.Continuous veno-venous hemofiltration (CVVH) has beenshown to have considerable benefit for the treatment of multipleorgan dysfunction secondary to sepsis[2,3]. Clinical andexperimental studies indicate that CVVH is able to eliminatesmall and medium-sized inflammatory mediators such ascytokines[4-6]. These data suggest that the mechanisms of
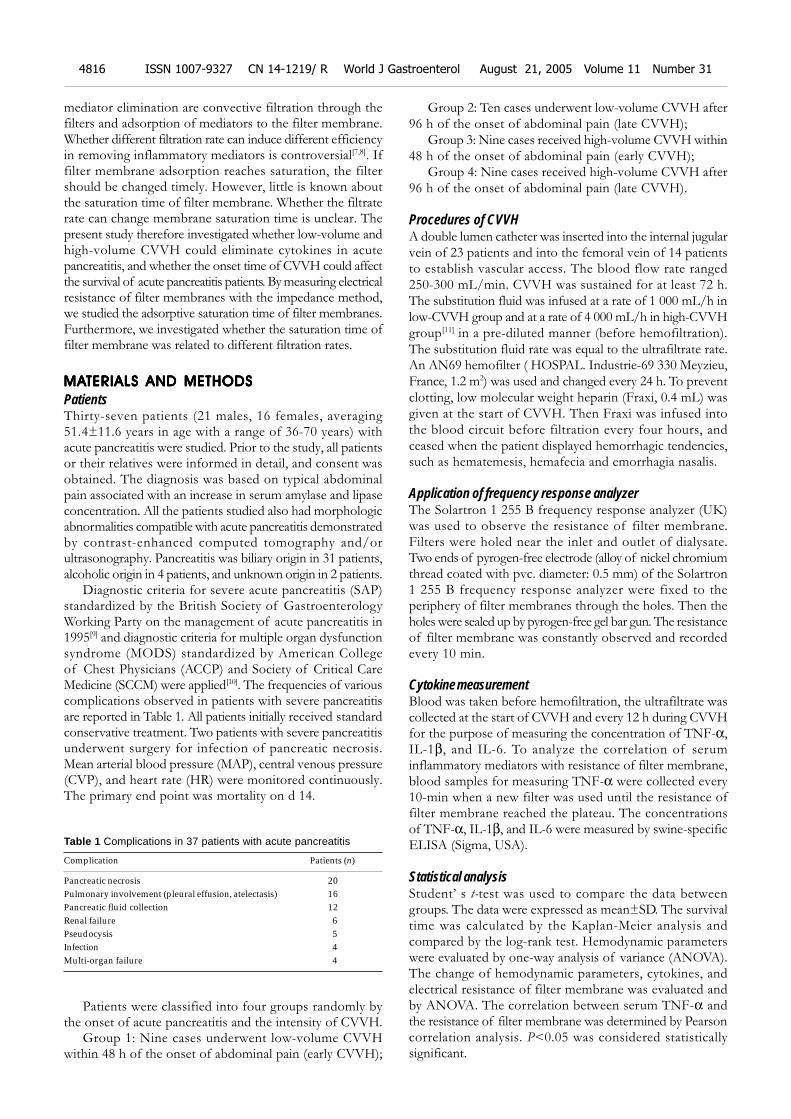
4816 ISSN 1007-9327 CN 14-1219/ R World J Gastroenterol August 21, 2005 Volume 11 Number 31
mediator elimination are convective filtration through thefilters and adsorption of mediators to the filter membrane.Whether different filtration rate can induce different efficiencyin removing inflammatory mediators is controversial[7,8]. Iffilter membrane adsorption reaches saturation, the filtershould be changed timely. However, little is known aboutthe saturation time of filter membrane. Whether the filtraterate can change membrane saturation time is unclear. Thepresent study therefore investigated whether low-volume andhigh-volume CVVH could eliminate cytokines in acutepancreatitis, and whether the onset time of CVVH could affectthe survival of acute pancreatitis patients. By measuring electricalresistance of filter membranes with the impedance method,we studied the adsorptive saturation time of filter membranes.Furthermore, we investigated whether the saturation time offilter membrane was related to different filtration rates.
MAMAMAMAMATERIALS AND METHODSTERIALS AND METHODSTERIALS AND METHODSTERIALS AND METHODSTERIALS AND METHODS
PatientsThirty-seven patients (21 males, 16 females, averaging51.4±11.6 years in age with a range of 36-70 years) withacute pancreatitis were studied. Prior to the study, all patientsor their relatives were informed in detail, and consent wasobtained. The diagnosis was based on typical abdominalpain associated with an increase in serum amylase and lipaseconcentration. All the patients studied also had morphologicabnormalities compatible with acute pancreatitis demonstratedby contrast-enhanced computed tomography and/orultrasonography. Pancreatitis was biliary origin in 31 patients,alcoholic origin in 4 patients, and unknown origin in 2 patients.
Diagnostic criteria for severe acute pancreatitis (SAP)standardized by the British Society of GastroenterologyWorking Party on the management of acute pancreatitis in1995[9] and diagnostic criteria for multiple organ dysfunctionsyndrome (MODS) standardized by American Collegeof Chest Physicians (ACCP) and Society of Critical CareMedicine (SCCM) were applied[10]. The frequencies of variouscomplications observed in patients with severe pancreatitisare reported in Table 1. All patients initially received standardconservative treatment. Two patients with severe pancreatitisunderwent surgery for infection of pancreatic necrosis.Mean arterial blood pressure (MAP), central venous pressure(CVP), and heart rate (HR) were monitored continuously.The primary end point was mortality on d 14.
Table 1 Complications in 37 patients with acute pancreatitis
Complication Patients (n)
Pancreatic necrosis 20Pulmonary involvement (pleural effusion, atelectasis) 16Pancreatic fluid collection 12Renal failure 6Pseudocysis 5Infection 4Multi-organ failure 4
Patients were classified into four groups randomly bythe onset of acute pancreatitis and the intensity of CVVH.
Group 1: Nine cases underwent low-volume CVVHwithin 48 h of the onset of abdominal pain (early CVVH);
Group 2: Ten cases underwent low-volume CVVH after96 h of the onset of abdominal pain (late CVVH);
Group 3: Nine cases received high-volume CVVH within48 h of the onset of abdominal pain (early CVVH);
Group 4: Nine cases received high-volume CVVH after96 h of the onset of abdominal pain (late CVVH).
Procedures of CVVHA double lumen catheter was inserted into the internal jugularvein of 23 patients and into the femoral vein of 14 patientsto establish vascular access. The blood flow rate ranged250-300 mL/min. CVVH was sustained for at least 72 h.The substitution fluid was infused at a rate of 1 000 mL/h inlow-CVVH group and at a rate of 4 000 mL/h in high-CVVHgroup[11] in a pre-diluted manner (before hemofiltration).The substitution fluid rate was equal to the ultrafiltrate rate.An AN69 hemofilter ( HOSPAL. Industrie-69 330 Meyzieu,France, 1.2 m2) was used and changed every 24 h. To preventclotting, low molecular weight heparin (Fraxi, 0.4 mL) wasgiven at the start of CVVH. Then Fraxi was infused intothe blood circuit before filtration every four hours, andceased when the patient displayed hemorrhagic tendencies,such as hematemesis, hemafecia and emorrhagia nasalis.
Application of frequency response analyzerThe Solartron 1 255 B frequency response analyzer (UK)was used to observe the resistance of filter membrane.Filters were holed near the inlet and outlet of dialysate.Two ends of pyrogen-free electrode (alloy of nickel chromiumthread coated with pvc. diameter: 0.5 mm) of the Solartron1 255 B frequency response analyzer were fixed to theperiphery of filter membranes through the holes. Then theholes were sealed up by pyrogen-free gel bar gun. The resistanceof filter membrane was constantly observed and recordedevery 10 min.
Cytokine measurementBlood was taken before hemofiltration, the ultrafiltrate wascollected at the start of CVVH and every 12 h during CVVHfor the purpose of measuring the concentration of TNF-α,IL-1β, and IL-6. To analyze the correlation of seruminflammatory mediators with resistance of filter membrane,blood samples for measuring TNF-α were collected every10-min when a new filter was used until the resistance offilter membrane reached the plateau. The concentrationsof TNF-α, IL-1β, and IL-6 were measured by swine-specificELISA (Sigma, USA).
Statistical analysisStudent’ s t-test was used to compare the data betweengroups. The data were expressed as mean±SD. The survivaltime was calculated by the Kaplan-Meier analysis andcompared by the log-rank test. Hemodynamic parameterswere evaluated by one-way analysis of variance (ANOVA).The change of hemodynamic parameters, cytokines, andelectrical resistance of filter membrane was evaluated andby ANOVA. The correlation between serum TNF-α andthe resistance of filter membrane was determined by Pearsoncorrelation analysis. P<0.05 was considered statisticallysignificant.
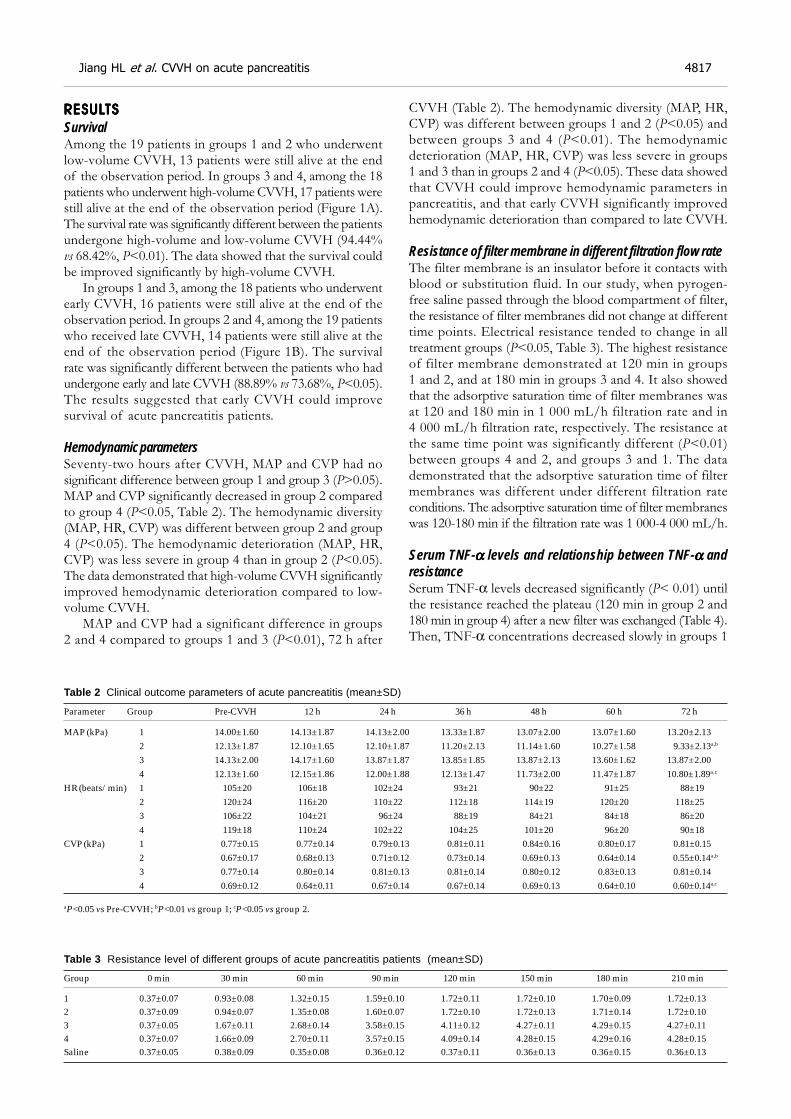
Jiang HL et al. CVVH on acute pancreatitis 4817
RESULRESULRESULRESULRESULTSTSTSTSTS
SurvivalAmong the 19 patients in groups 1 and 2 who underwentlow-volume CVVH, 13 patients were still alive at the endof the observation period. In groups 3 and 4, among the 18patients who underwent high-volume CVVH, 17 patients werestill alive at the end of the observation period (Figure 1A).The survival rate was significantly different between the patientsundergone high-volume and low-volume CVVH (94.44%vs 68.42%, P<0.01). The data showed that the survival couldbe improved significantly by high-volume CVVH.
In groups 1 and 3, among the 18 patients who underwentearly CVVH, 16 patients were still alive at the end of theobservation period. In groups 2 and 4, among the 19 patientswho received late CVVH, 14 patients were still alive at theend of the observation period (Figure 1B). The survivalrate was significantly different between the patients who hadundergone early and late CVVH (88.89% vs 73.68%, P<0.05).The results suggested that early CVVH could improvesurvival of acute pancreatitis patients.
Hemodynamic parametersSeventy-two hours after CVVH, MAP and CVP had nosignificant difference between group 1 and group 3 (P>0.05).MAP and CVP significantly decreased in group 2 comparedto group 4 (P<0.05, Table 2). The hemodynamic diversity(MAP, HR, CVP) was different between group 2 and group4 (P<0.05). The hemodynamic deterioration (MAP, HR,CVP) was less severe in group 4 than in group 2 (P<0.05).The data demonstrated that high-volume CVVH significantlyimproved hemodynamic deterioration compared to low-volume CVVH.
MAP and CVP had a significant difference in groups2 and 4 compared to groups 1 and 3 (P<0.01), 72 h after
CVVH (Table 2). The hemodynamic diversity (MAP, HR,CVP) was different between groups 1 and 2 (P<0.05) andbetween groups 3 and 4 (P<0.01). The hemodynamicdeterioration (MAP, HR, CVP) was less severe in groups1 and 3 than in groups 2 and 4 (P<0.05). These data showedthat CVVH could improve hemodynamic parameters inpancreatitis, and that early CVVH significantly improvedhemodynamic deterioration than compared to late CVVH.
Resistance of filter membrane in different filtration flow rateThe filter membrane is an insulator before it contacts withblood or substitution fluid. In our study, when pyrogen-free saline passed through the blood compartment of filter,the resistance of filter membranes did not change at differenttime points. Electrical resistance tended to change in alltreatment groups (P<0.05, Table 3). The highest resistanceof filter membrane demonstrated at 120 min in groups1 and 2, and at 180 min in groups 3 and 4. It also showedthat the adsorptive saturation time of filter membranes wasat 120 and 180 min in 1 000 mL/h filtration rate and in4 000 mL/h filtration rate, respectively. The resistance atthe same time point was significantly different (P<0.01)between groups 4 and 2, and groups 3 and 1. The datademonstrated that the adsorptive saturation time of filtermembranes was different under different filtration rateconditions. The adsorptive saturation time of filter membraneswas 120-180 min if the filtration rate was 1 000-4 000 mL/h.
Serum TNF-ααααα levels and relationship between TNF-ααααα andresistanceSerum TNF-α levels decreased significantly (P< 0.01) untilthe resistance reached the plateau (120 min in group 2 and180 min in group 4) after a new filter was exchanged (Table 4).Then, TNF-α concentrations decreased slowly in groups 1
Table 2 Clinical outcome parameters of acute pancreatitis (mean±SD)
Parameter Group Pre-CVVH 12 h 24 h 36 h 48 h 60 h 72 h
MAP (kPa) 1 14.00±1.60 14.13±1.87 14.13±2.00 13.33±1.87 13.07±2.00 13.07±1.60 13.20±2.132 12.13±1.87 12.10±1.65 12.10±1.87 11.20±2.13 11.14±1.60 10.27±1.58 9.33±2.13a,b
3 14.13±2.00 14.17±1.60 13.87±1.87 13.85±1.85 13.87±2.13 13.60±1.62 13.87±2.004 12.13±1.60 12.15±1.86 12.00±1.88 12.13±1.47 11.73±2.00 11.47±1.87 10.80±1.89a,c
HR (beats/min) 1 105±20 106±18 102±24 93±21 90±22 91±25 88±192 120±24 116±20 110±22 112±18 114±19 120±20 118±253 106±22 104±21 96±24 88±19 84±21 84±18 86±204 119±18 110±24 102±22 104±25 101±20 96±20 90±18
CVP (kPa) 1 0.77±0.15 0.77±0.14 0.79±0.13 0.81±0.11 0.84±0.16 0.80±0.17 0.81±0.152 0.67±0.17 0.68±0.13 0.71±0.12 0.73±0.14 0.69±0.13 0.64±0.14 0.55±0.14a,b
3 0.77±0.14 0.80±0.14 0.81±0.13 0.81±0.14 0.80±0.12 0.83±0.13 0.81±0.144 0.69±0.12 0.64±0.11 0.67±0.14 0.67±0.14 0.69±0.13 0.64±0.10 0.60±0.14a,c
aP<0.05 vs Pre-CVVH; bP<0.01 vs group 1; cP<0.05 vs group 2.
Table 3 Resistance level of different groups of acute pancreatitis patients (mean±SD)
Group 0 min 30 min 60 min 90 min 120 min 150 min 180 min 210 min
1 0.37±0.07 0.93±0.08 1.32±0.15 1.59±0.10 1.72±0.11 1.72±0.10 1.70±0.09 1.72±0.132 0.37±0.09 0.94±0.07 1.35±0.08 1.60±0.07 1.72±0.10 1.72±0.13 1.71±0.14 1.72±0.103 0.37±0.05 1.67±0.11 2.68±0.14 3.58±0.15 4.11±0.12 4.27±0.11 4.29±0.15 4.27±0.114 0.37±0.07 1.66±0.09 2.70±0.11 3.57±0.15 4.09±0.14 4.28±0.15 4.29±0.16 4.28±0.15Saline 0.37±0.05 0.38±0.09 0.35±0.08 0.36±0.12 0.37±0.11 0.36±0.13 0.36±0.15 0.36±0.13
and 3 compared to groups 2 and 4 (P< 0.05). When the firstfilter was used, TNF-α concentration decreased significantlyin groups 4 and 3 compared to groups 2 and 1 (P<0.05). Thedata suggested that there was a correlation between resistanceand serum TNF-α concentration. When the resistanceincreased, serum TNF-α concentration decreased significantlyin the same group after a new filter was installed. After thefirst, second, and third new hemofilters were exchanged, serumTNF-α concentration was negatively correlated with theresistance (r: -0.91, -0.89, and -0.86 in group 1; -0.89, -0.85,and -0.76 in group 2; -0.88, -0.92, and -0.82 in group 3; -0.84,-0.87, and -0.79 in group 4). The data showed that the timepoint at which the resistance reached plateau was the membraneadsorptive saturation time, and the resistance could reflectthe mass of inflammatory mediators for membrane adsorption.
Cytokine levels in different groupsBefore CVVH, serum concentrations of TNF-α, IL-1β,
and IL-6 had no significant difference between groups 3and 1, and between groups 4 and 2 (P>0.05). Serumconcentrations of TNF-α, IL-1β and IL-6 tended todecrease in all treatment groups during CVVH. The decreasingextent of TNF-α, IL-1β and IL-6 was different betweengroups 3 and 1 (TNF-α P<0.05, IL-1β P<0.05, IL-6 P<0.01),between groups 4 and 2 (TNF-α P<0.05, IL-1β P<0.05,IL-6 P<0.01), (Figure 2A-C).The data demonstrated thatthe diversity of TNF-α, IL-1β and IL-6 levels increased72 h after CVVH. The results showed that high-volumeCVVH could eliminate cytokines more effectively than low-volume CVVH.
The decreasing extent of TNF-α, IL-1β and IL-6was different between groups 1 and 2 (TNF-α P<0.05,IL-1β P<0.05, IL-6 P<0.05), between groups 3 and 4(TNF-α P<0.01, IL-1β P<0.01, IL-6 P<0.05) during CVVH(Figure 2A-C). Serum concentrations of TNF-α, IL-1β,and IL-6 decreased more significantly in groups 1 and 3
Table 4 TNFα concentration after changing filter of acute pancreatitis (mean±SD, ng/L)
Group Flter 0 min 30 min 60 min 90 min 120 min 150 min 180 min 210 min
2 1st 1 932±248 1 825±292 1 711±254 1 603±268 1 562±247 1 543±224 1 532±248 1 520±2282nd 1 449±237 1 362±215 1 295±239 1 221±281 1 208±272 1 201±268 1 197±274 1 191±2723rd 1 173±253 1 107±213 1 035±246 1 018±274 982±237 978±226 962±225 954±225
4 1st 1 893±248 1 786±292 1 676±254 1 592±268 1 501±247b 1 468±224 1 440±248 1 431±2472nd 1 365±237 1 280±215 1 205±239 1 136±281 1 093±272 1 082±268 1 067±274 1 060±2383rd 985±253 903±213 846±346 784±274 751±237 730±226 718±345 711±235
bP<0.01 vs group 2 1st.
Figure 2 Serum level of TNFα (A), IL-1β (B), and IL-6 (C) in different groups of acute pancreatitis patients.
Figure 1 Survival rate of different intensifying CVVH (A) and different start time of CVVH (B).
Surv
ival ra
te (
%)
2 4 6 8 10 12 14
Time (d)
1.0
0.9
0.8
0.7
0.6
Group 1+Group 2
Group 3+Group 4
Surv
ival ra
te (
%)
2 4 6 8 10 12 14
Time (d)
1.0
0.9
0.8
0.7
Group 1+Group 3
Group 2+Group 4
A B
TN
F levels
α (
ng/L
)
Group 12 000
1 600
1 200
800
400
0
IL-1
β levels
(ng/L
)
2 000
1 600
1 200
800
400
0Pre 12 24 36 48 60 72
Time (h)
Group 2Group 3Group 4
Group 1Group 2Group 3Group 4
Group 1Group 2Group 3Group 4
1 600
1 200
800
400
0
IL-6
levels
(ng/L
)
Pre 12 24 36 48 60 72
Time (h)
Pre 12 24 36 48 60 72
Time (h)
A CB
4818 ISSN 1007-9327 CN 14-1219/ R World J Gastroenterol August 21, 2005 Volume 11 Number 31
than in groups 2 and 4 (TNF-α P<0.05, IL-1β P<0.05, IL-6P<0.01). Early CVVH decreased serum concentrations ofTNF-α, IL-1β and IL-6 more efficiently than late CVVH.The data showed that early CVVH could decrease theexcessive activation of inflammatory mediator cascade byreducing TNF-α, IL-1β and IL-6.
The decreased extent of TNF-α and IL-1β had nosignificant difference (P>0.05) , but was significantlydifferent between IL-6 and TNF-α, and between IL-6 andIL-1β (P<0.01, Figure 3) in group 4. The data showed thatIL-6 decreased more significantly during high-volumeCVVH. TNF-α, IL-1β and IL-6 were detectable in theultrafiltrate.
Figure 3 Different cytokine levels in group 4 of acute pancreatitis patients.
Relationship between survival rate and cytokine levelsBefore CVVH, serum concentrations of TNF-α and IL-1βhad a difference between survival and dead patients (TNF-αP<0.05, IL-1β P<0.05, Figure 4). TNF-α and IL-1β levelswere higher in dead patients. Serum concentrations of TNF-αand IL-1β decreased in both survival and dead patientsduring CVVH. The decreasing extent of TNF-α and IL-1βwas different between survival and dead patients (TNF-αP<0.05, IL-1β P<0.05). In survival patients, serum concen-trations of TNF-α and IL-1β decreased more significantlythan that in dead patients (Figure 4). The data demonstratedthat survival patients had lower serum levels of TNF-αand IL-1β. Survival rate might be related to the decreasingextent of TNF-α and IL-1β.
Figure 4 Cytokine levels in survival and dead patients of acute pancreatitis.
DISCUSSIONDISCUSSIONDISCUSSIONDISCUSSIONDISCUSSION
There is evidence that secondary multiple organ failureresulting from septic complications, is the main cause ofmortality in severe pancreatitis. The final pathway ofpancreatitis-induced sepsis shares many characteristics withother septic diseases, including systemic histopathologicalabnormalities, excessive release of pro-and anti- inflammatorycytokines. It has been suggested that patients with severepancreatitis at the risk to develop septic complications mightbenefit from early application of CVVH irrespective ofthe presence of acute renal failure (ARF)[12,13].
Clinical studies have shown that cumulative ultrafiltratevolume is directly correlated with survival rate in patientswith sepsis-associated acute renal failure and acutepancreatitis[13,14]. In our study, high-volume CVVH couldsignificantly improve the survival compared to low-volumeCVVH. Joannes-Boyau et al.[15], evaluated the effect ofhigh volume CVVH on hemodynamic and outcome inpatients with septic shock, and found that the mortalityin the hemofiltration group decreases significantly. Yekebaset al.[16], examined the impact of CVVH on the course ofexperimental pancreatitis in pigs, and found that thesurvival time is significantly prolonged by high-volumeCVVH. Most likely, this is due to a more effective removalof sepsis mediators. Furthermore, our data show that earlyCVVH improves survival significantly compared to lateCVVH. In a non-randomized trial, it has been hypothesizedthat early CVVH prior to overt ARF might result inconsiderable reduction of morbidity in patients withnecrotizing pancreatitis[12]. Xie et al.[17], studied whetherinitial time of CVVH could influence survival in acutepancreatitis, and found that the average interval issignificantly longer in the mortality group than in thesurvival group from the onset of acute pancreatitis toCVVH. Yekebas et al.[18], reported that animals receivingprophylactic CVVH have a longer survival period, thanthose receiving CVVH after clinical impairment, suggestingthat the improved survival is also due to the fact that earlyCVVH improves hemodynamic deterioration better thanlate CVVH. Improved hemodynamic parameters may bedue to the application of high-volume CVVH as it wasshown in our study. The results are similar to those reportedby other studies[15,19]. As Ronco et al.[20], argued that it is thetime to move from the simple goal of achieving adequaterenal support, the proper goal of CVVH in ICU should bemulti-organ support therapy.
The resistance of filter membrane was constantlymeasured by means of the electrical impedance techniqueduring CVVH in the present study. The resistance levelreached the plateau at 120 min in 1 000 mL/h filtrationrate and at 180 min in 4 000 mL/h filtration rate, respectively.The results demonstrate that the adsorptive saturation timeof filter membranes is different in different filtration rate.The adsorptive saturation time of filter membranes is120 -180 min, if the filtration rate is 1 000-4 000 mL/h. DeVriese et al.[21], calculated the cytokine mass balance duringhemofiltration in septic patients with acute renal failure,and demonstrated that the adsorption is most prominantimmediately after the installation of a new hemofilter (att = 1 and t = 13) with a steady decrease thereafter. The
TNF-α
Pre 12 24 36 48 60 72
Time (h)
IL-1 β
IL-6
Cyto
kin
es
levels
(ng/L
)
2 000
1 600
1 200
800
400
0
Pre 12 24 36 48 60 72
Time (h)
2 000
1 600
1 200
800
400
0
Cyto
kin
es
levels
(ng/L
)
Survival TNF-α
Survival IL-1 β
Death TNF-α
Death IL-1 β
Jiang HL et al. CVVH on acute pancreatitis 4819
adsorption and the convective elimination increased in ahigher blood flow rate and filtration rate. Kellum et al.[22],performed CVVH in patients with severe systemic inflammatoryresponse syndrome, and deduced that the adsorptive saturationtime of filter membranes is at 6 h after exchanging a newhemofilter by measuring the decreasing extent of serumcytokines. By delivering a large amount of blood per a unitof time or higher transmembrane pressure to push themolecules deeper into the membrane, the adsorptive surfacearea increases. The higher convection driving force mayincrease the surface area accessible to adsorption, by pushingthe molecules deeper into the hydrogel. In this respect, onlyminimal adsorption occurs when the ultrafiltrate line isclamped[23]. Therefore, increasing filtration rate can increasethe adsorption mass and prolong adsorptive saturation timeof filter membranes. Our results showed that serum TNFαconcentration decreased significantly in the same group afternew filters were installed. After the first, second and thirdnew hemofilters were exchanged, serum TNF-α concentrationwas negatively correlated with the resistance, demonstratingthat the time point at which the resistance reached plateauwas the membrane adsorptive saturation time. The resistancecould reflect the mass of membrane adsorption of inflammatorymediators. To eliminate more inflammatory mediators, thefilter should be changed timely when the filter membraneadsorption is saturated. Compared to that reported by DeVriese et al.[21], the method we used to measure the adsorptivesaturation time of filter membranes by electrical impedancetechnique is convenient. The impedance technique has alsobeen used by Rapoza et al.[25], to evaluate the permeability ofdentin. Several studies have shown that proteins aredenatured and desorbed with increasing treatment time[21,24].Clark et al.[26], demonstrated that the desorption of denaturedproteins into the blood may be deleterious, indicating that itis very important to change filter timely once filter membraneadsorption is saturated.
In our study, we particularly focused on whether theremoval of cytokines, such as TNF-α, IL-1β and, IL-6was related to different filtration rate and the onset ofCVVH. The impact of CVVH on serum cytokine levels iscontroversial[18,19]. Some investigators have not detectedsignificant decreases of inflammatory mediators in thebloodstream, although relevant concentrations are measuredin ultrafiltrate[27,28]. This may be due to the fact that CVVHwas performed with low filtration rates. In contrast, DeVriese et al.[21], reported that in septic patients with ARF, plasmacytokine levels decrease significantly after hemofiltrationand found that there is a close relationship between thefiltration rate and the efficiency of CVVH in removingcytokines. Other studies have confirmed the benefits ofincreasing the filtration rate in terms of improved survivalor accelerated recovery from ARF[14,29]. In our study, thefiltration rate was 4 000 mL/h which is recommended byUchino et al.[11], as high-volume CVVH. Our data show thathigh-volume CVVH could eliminate more cytokines thanlow-volume CVVH. The results are similar to those of someprevious clinical studies[17,30]. Watanabe et al.[31], found thatextremely high interleukin-6 blood levels and bad outcomein critically ill patients are associated with tumor necrosisfactor-α and interleukin-1, suggesting that activation of
inflammatory mediator is a kind of excessive cascade effectduring acute pancreatitis. In the present study, early CVVHdecreased serum concentrations of TNF-α, IL-1β, andIL-6 more efficiently than late CVVH, demonstrating thatearly CVVH can decrease the excessive activation ofinflammatory mediator cascade through reduced TNF-α,IL-1β, and Il-6, especially in high CVVH patients. We foundthat IL-6 decreased more significantly than TNF-α andIL-1β during high-volume CVVH. This may be due to thefact that pro-inflammatory cytokines, such as TNF-α andIL-1β, are removed efficiently by high-volume CVVH andthe causative factors increasing the serum IL-6 level arereduced. Gomez-Cambronero et al.[1], reported that serumlevels of pro-inflammatory cytokines, such as TNF-alphaand IL-1beta, increase during acute pancreatitis and appearto be the driving force for the initiation and propagation ofthe systemic response. The excessive inflammatory responsecould be down regulated by removing cytokines and othermediators as Lonneman et al.[32], reported. Early CVVHcould prevent inflammatory mediators from increasing.
SAP mortality is associated with organ failure. In the earlycourse, organ failure results from inflammatory mediatorsreleased by systemic inflammatory response syndrome evenin the absence of infection. In the septic phase, since organfailure occurs because of sepsis, it is common in SAP.Inflammatory cytokines play an important role in the progressof acute pancreatitis. In our study, serum concentration ofTNF-α and IL-1β decreased more significantly in survivalpatients than in dead patients 72 h after CVVH, and similarstudies in MODS field are available[2,3,5], suggesting that thesurvival rate is related to the decreasing extent of TNF-αand IL-1β in acute pancreatitis. IL-1β and its mRNA donot exist in the normal pancreas, but are released immediatelyafter pancreatitis is induced. Blockage of the IL-1 receptorsignificantly decreases intrinsic pancreatic damage andmortality[1,33]. Elevated levels of TNFα may contribute to thepathophysiological sequelae of the disease, and pretreatmentwith anti-TNFα antibody before induction of the diseasecan prevent release of TNFα[34], lessen disease severity andincrease survival time[35]. Blocking the network of cytokinesand eliminating cytokines can improve the prognosis andsurvival rate of pancreatitis.
In summary, CVVH, especially high-volume CVVH,offers several therapeutic options for patients with acutepancreatitis experiencing multiple organ dysfunction. It canimprove the hemodynamic parameters and survival rateof pancreatitis patients by removing inflammatory mediators.CVVH can be performed at the early stage of acute pancreatitis.The adsorptive saturation time of filter membranes isdifferent in different filtration rate. The filter should bechanged timely once filter membrane adsorption is saturated.
REFERENCESREFERENCESREFERENCESREFERENCESREFERENCES
1 Gomez-Cambronero LG, Sabater L, Pereda J, Cassinello N,Camps B, Vina J, Sastre J. Role of cytokines and oxidativestress in the pathophysiology of acute pancreatitis: therapeu-tical implications. Curr Drug Targets Inflamm Allergy 2002; 1:393-403
2 Tetta C, Bellomo R, Ronco C. Artificial organ treatment formultiple organ failure, acute renal failure, and sepsis: recentnew trends. Artif Organs 2003; 27: 202-213
4820 ISSN 1007-9327 CN 14-1219/ R World J Gastroenterol August 21, 2005 Volume 11 Number 31
3 Schetz M. Non-renal indications for continuous renal replace-ment therapy. Kidney Int Suppl 1999: S88-94
4 Oda S, Hirasawa H, Shiga H, Nakanishi K, Matsuda K,Nakamura M. Continuous hemofiltration/hemodiafiltrationin critical care. Ther Apher 2002; 6: 193-198
5 Ronco C, Ricci Z, Bellomo R. Importance of increased ultrafil-tration volume and impact on mortality: sepsis and cytokinestory and the role for CVVH. Edtna Erca J 2002; (Suppl 2):13-18
6 Pupelis G, Austrums E, Snippe K. Blood purification meth-ods for treatment of organ failure in patients with severepancreatitis. Zentralbl Chir 2001; 126: 780-784
7 Rogiers P. Hemofiltration treatment for sepsis: is it time forcontrolled trials? Kidney Int Suppl 1999; 56: S99-103
8 Ronco C, Bellomo R, Kellum JA. Continuous renal replace-ment therapy: opinions and evidence. Adv Ren Replace Ther2002; 9: 229-244
9 Norton SA, Cheruvu CV, Collins J, Dix FP, Eyre-Brook IA.An assessment of clinical guidelines for the management ofacute pancreatitis. Ann R Coll Surg Engl 2001; 83: 399-405
10 Bone RC, Balk RA, Cerra FB, Dellinger RP, Fein AM, KnausWA, Schein RM, Sibbald WJ. Definitions for sepsis and organfailure and guidelines for the use of innovative therapies insepsis. The ACCP/SCCM consensus conference committee.american college of chest physicians/society of critical caremedicine. Chest 1992; 101: 1644-1655
11 Uchino S, Bellomo R, Goldsmith D, Davenport P, Cole L,Baldwin I, Panagiotopoulos S, Tipping P. Super high fluxhemofiltration: a new technique for cytokine removal. Inten-sive Care Med 2002; 28: 651-655
12 Gebhardt C, Bödeker H, Blinzler L, Kraus D, Hergdt G.Wandel in der Therapie der schweren akuten Pankreatitis.Chirurg 1994; 65: 33-40
13 Pupelis G. Renal failure in acute pancreatitis. Timing of di-alysis and surgery. Przegl Lek 2000; 57 (Suppl 5): 29-31
14 Kellum JA, Bellomo R, Mehta R, Ronco C. Blood purificationin non-renal critical illness. Blood Purif 2003; 21: 6-13
15 Joannes-Boyau O, Rapaport S, Bazin R, Fleureau C, JanvierG. Impact of high vlume hemofiltration on hemodynamicdisturbance and outcome during septic shock. ASAIO J 2004;50: 102-109
16 Yekebas EF, Eisenberger CF, Ohnesorge H, Saalmüller A,Elsner HA, Engelhardt M, Gillesen A, Meins J, The M, StrateT, Busch C, Knoefel WT, Bloechle C, Izbicki JR. Attenuationof sepsis-related immunoparalysis by continuous veno-venoushemofiltration in experimental porcine pancreatitis. Crit CareMed 2001; 29: 1423-1430
17 Xie H, Ji D, Gong D, Liu Y, Xu B, Zhou H, Liu Z, Li L, Li W,Quan Z, Li J. Continuous veno venous hemofiltration in treat-ment of acute necrotizing pancreatitis. Chin J Med 2003; 116:549-553
18 Yekebas EF, Strate T, Zolmajd S, Eisenberger CF, ErbersdoblerA, Saalmuller A, Steffani K, Busch C, Elsner HA, EngelhardtM, Gillesen A, Meins J, The M, Knoefel WT, Izbicki JR. Impactof different modalit ies of continuous veno-venoushemofiltration on sepsis-induced alterations in experimentalpancreatitis. Kidney Int 2002; 62: 1806-1818
19 Ullrich R, Roeder G, Lorber C, Quezado ZM, Kneifel W, Gas-ser H, Schlag G, Redl H, Germann P. Continuous veno-venoushemofiltration improves arterial oxygenation in endotoxin-induced lung injury in pigs. Anesthesiology 2001; 95: 428-436
20 Ronco C, Bellomo R. Acute renal failure and multiple organdysfunction in the ICU: from renal replacement therapy (RRT)
to multiple organ support therapy (MOST). Int J Artif Organs2002; 25: 733-747
21 De Vriese AS, Colardyn FA, Philippe JJ, Vanholder RC, DeSutter JH, Lameire NH. Cytokine removal during continuoushemofiltration in septic patients. J Am Soc Nephrol 1999; 10:846-853
22 Kellum JA, Johnson JP, Kramer D, Palevsky P, Brady JJ.Pinsky MR. Diffusive vs convective therapy: effects on me-diators of inflammation in patient with severe systemic in-flammatory response syndrome. Crit Care Med 1998; 26:1995-2000
23 Tetta C, Mariano F, Buades J, Ronco C, Wratten ML, CamussiG. Relevance of platelet-activating factor in inflammation andsepsis: mechanisms and kinetics of removal in extracorporealtreatments. Am J Kidney Dis 1997; 30 (5 Suppl 4): S57-65
24 Pradelle-Plasse N, Wenger F, Colon P. Effect of conditionerson dentin permeability using an impedance method. J Dent2002; 30: 251-257
25 Rapoza RJ, Horbett TA. Changes in the SDS elutability offibrinogen adsorbed from plasma to polymers. J Biomater SciPolym Ed 1989; 1: 99-110
26 Clark WR, Macias WL, Molitoris BA, Wang NH. Membraneadsorption of beta 2-microglobulin: equilibrium and kineticcharacterization. Kidney Int 1994; 46: 1140-1146
27 Rogiers P, Zhang H, Smail N, Pauwels D, Vincent JL. Con-tinuous veno-venous hemofiltration improves cardiac per-formance by mechanisms other than tumor necrosis factoralpha attenuation during endotoxic shock. Crit Care Med 1999;27: 1848-1855
28 van Bommel EF, Hesse CJ, Jutte NH, Zietse R, Bruining HA,Weimar W. Impact of continuous hemofiltration on cytokinesand cytokine inhibitors in oliguric patients suffering from sys-temic inflammatory response syndrome. Ren Fail 1997; 19:443-454
29 Ronco C, Bellomo R, Homel P, Brendolan A, Dan M, PiccinniP, La Greca G. Effects of different doses in continuous veno-venous heamofiltration on outcomes of acute renal failure: aprospective randomised trial. Lancet 2000; 356: 26-30
30 Ronco C, Tetta C, Lupi A, Galloni E, Bettini MC, Sereni L,Mariano F, DeMartino A, Montrucchio G, Camussi G. Re-moval of platelet-activating factor in experimental continu-ous arteriovenous hemofiltration. Crit Care Med 1995; 23:99-107
31 Watanabe E, Hirasawa H, Oda S, Matsuda K, Hatano M,Tokuhisa T. Extremely high interleukin-6 blood levels andoutcome in the critically ill are associated with tumor necrosisfactor- and interleukin-1-related gene polymorphisms. CritCare Med 2005 33: 89-97
32 Lonnemann G, Koch KM, Shaldon S, Dinarello CA. Studieson the ability of hemodialysis membranes to induce, bind,and clear human interleukin-1. J Lab Clin Med 1988; 112: 76-86
33 Norman JG, Franz MG, Fink GS, Messina J, Fabri PJ, GowerWR, Carey LC. Decreased mortality of severe acute pancre-atitis after proximal cytokine blockade. Ann Surg 1995; 221:625-631
34 Hughes CB, Gaber LW, Mohey el-Din AB, Grewal HP, KotbM, Mann L, Gaber AO. Inhibition of TNF alpha improvessurvival in an experimental model of acute pancreatitis. AmSurg 1996; 62: 8-13
35 Eubanks JW 3rd, Sabek O, Kotb M, Gaber LW, Henry J,Hijiya N, Britt LG, Gaber AO, Goyert SM. Acute pancreatitisinduces cytokine production in endotoxin-resistant mice. AnnSurg 1998; 227: 904-911
Science Editor Wang XL Language Editor Elsevier HK
Jiang HL et al. CVVH on acute pancreatitis 4821
• BASIC RESEARCH •
Leptin administration exacerbates thioacetamide-induced liver
fibrosis in mice
Kai Dai, Jun-Ying Qi, De-Ying Tian
ELSEVIER
PO Box 2345, Beijing 100023, China World J Gastroenterol 2005;11(31):4822-4826www.wjgnet.com World Journal of Gastroenterology ISSN [email protected] © 2005 The WJG Press and Elsevier Inc. All rights reserved.
Kai Dai, Jun-Ying Qi, De-Ying Tian, Department of InfectiousDiseases, Tongji Hospital, Tongji Medical College, HuazhongUniversity of Science and Technology, Wuhan 430030, HubeiProvince, ChinaCorrespondence to: Dr. Jun-Ying Qi, Department of InfectiousDiseases, Tongji Hospital, Tongji Medical College, HuazhongUniversity of Science and Technology, Jiefang Street 1 095, Wuhan430030, Hubei Province, China. [email protected]: +86-27-83662815Received: 2004-12-17 Accepted: 2005-02-14
AbstractAbstractAbstractAbstractAbstract
AIM: To investigate the effects of leptin administration onliver fibrosis induced by thioacetamide (TAA).
METHODS: Twenty-four male C57Bl/6 mice were randomlyallocated into four groups, which were intra-peritoneallygiven saline (2 mL/kg), leptin (1 mg/kg), TAA (200 mg/kg),TAA (200 mg/kg) plus leptin (1 mg/kg) respectively, thricea week. All mice were killed after 4 wk. The changes inbiochemical markers, such as the levels of alanine aminot-ransferase (ALT) and aspartate aminotransferase (AST)in serum and superoxide dismutase (SOD), malondialdehyde(MDA) in liver were determined. For histological analysis,liver tissues were fixed with 10% buffered formalin,embedded with paraffin. Hematoxylin-eosin (HE) stainingand picric acid-Sirius red dyeing were performed. Thelevel of α1(I) procollagen mRNA in liver tissues wasanalyzed by RT-PCR.
RESULTS: Apparent liver fibrosis was found in TAA groupand TAA plus leptin group. Compared to saline group, thelevels of ALT and AST in serum and MDA in liver increasedin TAA group (205.67±27.69 U/L vs 50.67±10.46 U/L,177.50±23.65 U/L vs 76.33±12.27 U/L, 2.60±0.18 nmol/mgpro vs 1.91±0.14 nmol/mg pro, P<0.01) and in TAA
plus leptin group (256.17±22.50 U/L vs 50.67±10.46 U/L,
234.17±27.37 U/L vs 76.33±12.27 U/L, 2.97±0.19 nmol/mgpro vs 1.91±0.14 nmol/mg pro, P<0.01). The level of
SOD in livers decreased (51.80±8.36 U/mg pro vs
81.52±11.40 U/mg pro, 35.78±6.11 U/mg pro vs 81.52±11.40 U/mg pro, P<0.01) and the level of α1(I) procollagen
mRNA in liver tissues also increased (0.28±0.04 vs 0.11±
0.02, 0.54±0.07 vs 0.11±0.02, P<0.01). But no significantchanges were found in leptin group and saline group.
Compared to TAA group, ALT, AST, MDA, and α1(I)
procollagen mRNA and grade of liver fibrosis in TAA plusleptin group increased (256.17±22.50 U/L vs 205.67±
27.69 U/L, P<0.05; 234.17±27.37 U/L vs 177.50±23.65 U/L,
P<0.05; 2.97±0.19 nmol/mg pro vs 2.60±0.18 nmol/mg
pro, P<0.05; 0.54±0.07 vs 0.28±0.04, P<0.01; 3.17 vs
2.00, P<0.05), and the level of SOD in liver decreased(35.78±6.11 U/mg pro vs 51.80±8.36 U/mg pro, P<0.05).There were similar changes in the degree of type I collagendeposition confirmed by picric acid–Sirius red dyeing.
CONCLUSION: Leptin can exacerbate the degree of TAA-induced liver fibrosis in mice. Leptin may be an importantfactor in the development of liver fibrosis.
© 2005 The WJG Press and Elsevier Inc. All rights reserved.
Key words: Liver fibrosis; Leptin; α1(I) procollagen
Dai K, Qi JY, Tian DY. Leptin administration exacerbatesthioacetamide-induced liver fibrosis in mice. World J
Gastroenterol 2005; 11(31): 4822-4826
http://www.wjgnet.com/1007-9327/11/4822.asp
INTRODUCTIONINTRODUCTIONINTRODUCTIONINTRODUCTIONINTRODUCTION
Leptin, an obese gene product, is a 16-ku peptide hormoneexpressed and secreted predominantly by adipose tissue[1],and plays an essential role in the regulation of body weightmainly by reducing food intake and increasing energyexpenditure[2]. In addition to the effect of controlling bodyfat mass, leptin has a variety of other biological functions,such as wound healing, angiogenesis, immune response, etc.[3-6],thus exerting its effects on many tissues or organs, includingthe liver. Potter et al.[7], found that isolated hepatic stellate cells(HSCs) also produce leptin during the in vitro transactivationprocess in 1998. Since then researchers have paid moreattention to the correlation between leptin and liver diseases.Recently, it was reported that the serum leptin levels are elevatedin patients with chronic viral hepatitis, alcohol-inducedcirrhosis, or non-alcoholic steatohepatitis (NASH)[8-11]. Theseobservations suggest that leptin may be involved in theprogression of liver fibrosis. Accordingly, in the presentstudy we investigated the effect of leptin administration onliver fibrosis caused by thioacetamide (TAA).
MAMAMAMAMATERIALS AND METHODSTERIALS AND METHODSTERIALS AND METHODSTERIALS AND METHODSTERIALS AND METHODS
Animals and treatmentTwenty-four, 6-wk-old male C57Bl/6 mice, weighing18.4-24.2 g, were obtained from Institute of Transplantation,Tongji Medical College, Huazhong University of Scienceand Technology. All mice were housed in a temperature-humidity-controlled environment in a 12 h light-dark cycle
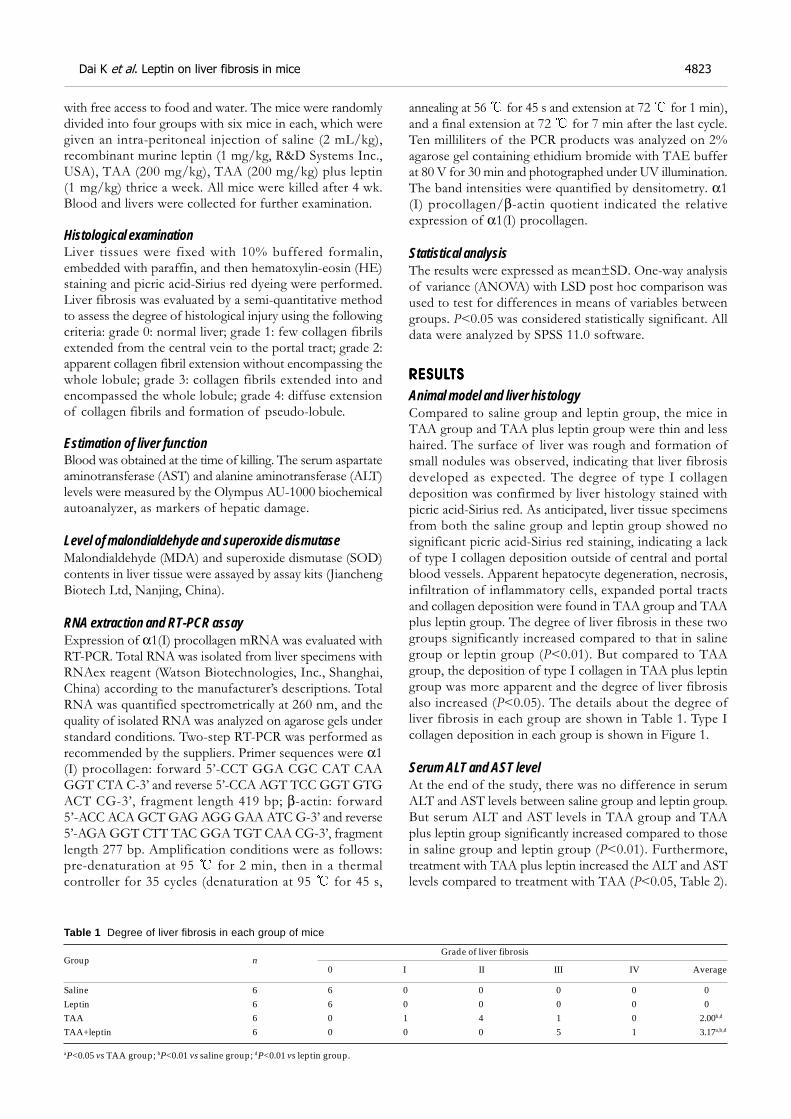
with free access to food and water. The mice were randomlydivided into four groups with six mice in each, which weregiven an intra-peritoneal injection of saline (2 mL/kg),recombinant murine leptin (1 mg/kg, R&D Systems Inc.,USA), TAA (200 mg/kg), TAA (200 mg/kg) plus leptin(1 mg/kg) thrice a week. All mice were killed after 4 wk.Blood and livers were collected for further examination.
Histological examinationLiver tissues were fixed with 10% buffered formalin,embedded with paraffin, and then hematoxylin-eosin (HE)staining and picric acid-Sirius red dyeing were performed.Liver fibrosis was evaluated by a semi-quantitative methodto assess the degree of histological injury using the followingcriteria: grade 0: normal liver; grade 1: few collagen fibrilsextended from the central vein to the portal tract; grade 2:apparent collagen fibril extension without encompassing thewhole lobule; grade 3: collagen fibrils extended into andencompassed the whole lobule; grade 4: diffuse extensionof collagen fibrils and formation of pseudo-lobule.
Estimation of liver functionBlood was obtained at the time of killing. The serum aspartateaminotransferase (AST) and alanine aminotransferase (ALT)levels were measured by the Olympus AU-1000 biochemicalautoanalyzer, as markers of hepatic damage.
Level of malondialdehyde and superoxide dismutaseMalondialdehyde (MDA) and superoxide dismutase (SOD)contents in liver tissue were assayed by assay kits (JianchengBiotech Ltd, Nanjing, China).
RNA extraction and RT-PCR assayExpression of α1(I) procollagen mRNA was evaluated withRT-PCR. Total RNA was isolated from liver specimens withRNAex reagent (Watson Biotechnologies, Inc., Shanghai,China) according to the manufacturer’s descriptions. TotalRNA was quantified spectrometrically at 260 nm, and thequality of isolated RNA was analyzed on agarose gels understandard conditions. Two-step RT-PCR was performed asrecommended by the suppliers. Primer sequences were α1(I) procollagen: forward 5’-CCT GGA CGC CAT CAAGGT CTA C-3’ and reverse 5’-CCA AGT TCC GGT GTGACT CG-3’, fragment length 419 bp; β-actin: forward5’-ACC ACA GCT GAG AGG GAA ATC G-3’ and reverse5’-AGA GGT CTT TAC GGA TGT CAA CG-3’, fragmentlength 277 bp. Amplification conditions were as follows:pre-denaturation at 95 for 2 min, then in a thermalcontroller for 35 cycles (denaturation at 95 for 45 s,
annealing at 56 for 45 s and extension at 72 for 1 min),and a final extension at 72 for 7 min after the last cycle.Ten milliliters of the PCR products was analyzed on 2%agarose gel containing ethidium bromide with TAE bufferat 80 V for 30 min and photographed under UV illumination.The band intensities were quantified by densitometry. α1(I) procollagen/β-actin quotient indicated the relativeexpression of α1(I) procollagen.
Statistical analysisThe results were expressed as mean±SD. One-way analysisof variance (ANOVA) with LSD post hoc comparison wasused to test for differences in means of variables betweengroups. P<0.05 was considered statistically significant. Alldata were analyzed by SPSS 11.0 software.
RESULRESULRESULRESULRESULTSTSTSTSTS
Animal model and liver histologyCompared to saline group and leptin group, the mice inTAA group and TAA plus leptin group were thin and lesshaired. The surface of liver was rough and formation ofsmall nodules was observed, indicating that liver fibrosisdeveloped as expected. The degree of type I collagendeposition was confirmed by liver histology stained withpicric acid-Sirius red. As anticipated, liver tissue specimensfrom both the saline group and leptin group showed nosignificant picric acid-Sirius red staining, indicating a lackof type I collagen deposition outside of central and portalblood vessels. Apparent hepatocyte degeneration, necrosis,infiltration of inflammatory cells, expanded portal tractsand collagen deposition were found in TAA group and TAAplus leptin group. The degree of liver fibrosis in these twogroups significantly increased compared to that in salinegroup or leptin group (P<0.01). But compared to TAAgroup, the deposition of type I collagen in TAA plus leptingroup was more apparent and the degree of liver fibrosisalso increased (P<0.05). The details about the degree ofliver fibrosis in each group are shown in Table 1. Type Icollagen deposition in each group is shown in Figure 1.
Serum ALT and AST levelAt the end of the study, there was no difference in serumALT and AST levels between saline group and leptin group.But serum ALT and AST levels in TAA group and TAAplus leptin group significantly increased compared to thosein saline group and leptin group (P<0.01). Furthermore,treatment with TAA plus leptin increased the ALT and ASTlevels compared to treatment with TAA (P<0.05, Table 2).
Table 1 Degree of liver fibrosis in each group of mice
Grade of liver fibrosisGroup n
0 I II III IV Average
Saline 6 6 0 0 0 0 0Leptin 6 6 0 0 0 0 0TAA 6 0 1 4 1 0 2.00b,d
TAA+leptin 6 0 0 0 5 1 3.17a,b,d
aP<0.05 vs TAA group; bP<0.01 vs saline group; dP<0.01 vs leptin group.
Dai K et al. Leptin on liver fibrosis in mice 4823
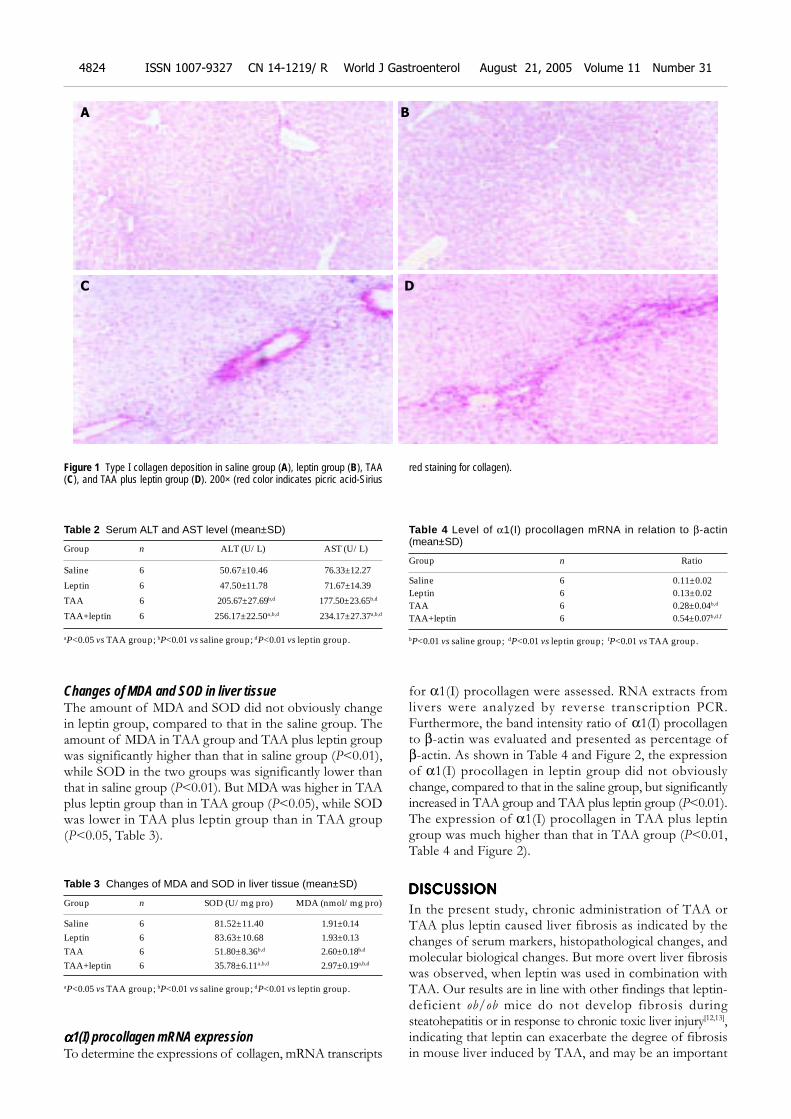
Changes of MDA and SOD in liver tissueThe amount of MDA and SOD did not obviously changein leptin group, compared to that in the saline group. Theamount of MDA in TAA group and TAA plus leptin groupwas significantly higher than that in saline group (P<0.01),while SOD in the two groups was significantly lower thanthat in saline group (P<0.01). But MDA was higher in TAAplus leptin group than in TAA group (P<0.05), while SODwas lower in TAA plus leptin group than in TAA group(P<0.05, Table 3).
Table 3 Changes of MDA and SOD in liver tissue (mean±SD)
Group n SOD (U/mg pro) MDA (nmol/mg pro)
Saline 6 81.52±11.40 1.91±0.14Leptin 6 83.63±10.68 1.93±0.13TAA 6 51.80±8.36b,d 2.60±0.18b,d
TAA+leptin 6 35.78±6.11a,b,d 2.97±0.19a,b,d
aP<0.05 vs TAA group; bP<0.01 vs saline group; dP<0.01 vs leptin group.
ααααα1(I) procollagen mRNA expressionTo determine the expressions of collagen, mRNA transcripts
for α1(I) procollagen were assessed. RNA extracts fromlivers were analyzed by reverse transcription PCR.Furthermore, the band intensity ratio of α1(I) procollagento β-actin was evaluated and presented as percentage ofβ-actin. As shown in Table 4 and Figure 2, the expressionof α1(I) procollagen in leptin group did not obviouslychange, compared to that in the saline group, but significantlyincreased in TAA group and TAA plus leptin group (P<0.01).The expression of α1(I) procollagen in TAA plus leptingroup was much higher than that in TAA group (P<0.01,Table 4 and Figure 2).
DISCUSSIONDISCUSSIONDISCUSSIONDISCUSSIONDISCUSSION
In the present study, chronic administration of TAA orTAA plus leptin caused liver fibrosis as indicated by thechanges of serum markers, histopathological changes, andmolecular biological changes. But more overt liver fibrosiswas observed, when leptin was used in combination withTAA. Our results are in line with other findings that leptin-deficient ob/ob mice do not develop fibrosis duringsteatohepatitis or in response to chronic toxic liver injury[12,13],indicating that leptin can exacerbate the degree of fibrosisin mouse liver induced by TAA, and may be an important
Figure 1 Type I collagen deposition in saline group (A), leptin group (B), TAA(C), and TAA plus leptin group (D). 200× (red color indicates picric acid-Sirius
red staining for collagen).
Table 2 Serum ALT and AST level (mean±SD)
Group n ALT (U/L) AST (U/L)
Saline 6 50.67±10.46 76.33±12.27
Leptin 6 47.50±11.78 71.67±14.39
TAA 6 205.67±27.69b,d 177.50±23.65b,d
TAA+leptin 6 256.17±22.50a,b,d 234.17±27.37a,b,d
aP<0.05 vs TAA group; bP<0.01 vs saline group; dP<0.01 vs leptin group.
Table 4 Level of α1(I) procollagen mRNA in relation to β-actin(mean±SD)
Group n Ratio
Saline 6 0.11±0.02Leptin 6 0.13±0.02TAA 6 0.28±0.04b,d
TAA+leptin 6 0.54±0.07b,d,f
bP<0.01 vs saline group; dP<0.01 vs leptin group; fP<0.01 vs TAA group.
A
C D
B
4824 ISSN 1007-9327 CN 14-1219/ R World J Gastroenterol August 21, 2005 Volume 11 Number 31
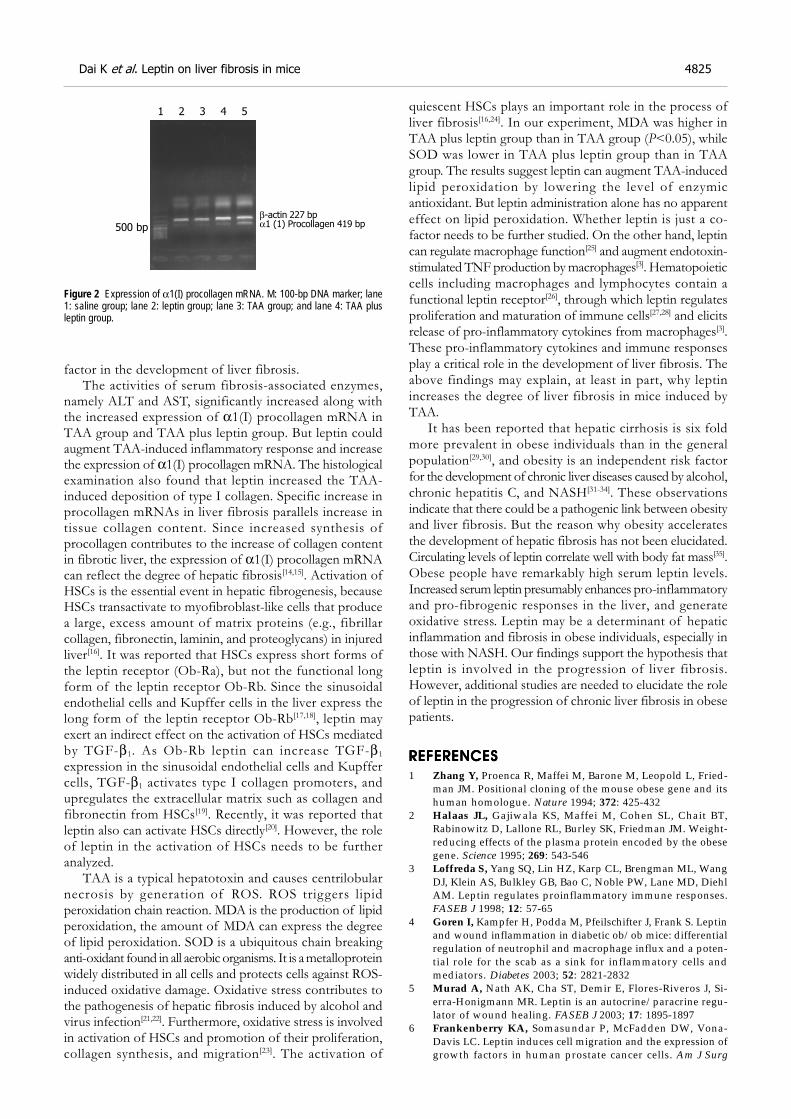
factor in the development of liver fibrosis.The activities of serum fibrosis-associated enzymes,
namely ALT and AST, significantly increased along withthe increased expression of α1(I) procollagen mRNA inTAA group and TAA plus leptin group. But leptin couldaugment TAA-induced inflammatory response and increasethe expression of α1(I) procollagen mRNA. The histologicalexamination also found that leptin increased the TAA-induced deposition of type I collagen. Specific increase inprocollagen mRNAs in liver fibrosis parallels increase intissue collagen content. Since increased synthesis ofprocollagen contributes to the increase of collagen contentin fibrotic liver, the expression of α1(I) procollagen mRNAcan reflect the degree of hepatic fibrosis[14,15]. Activation ofHSCs is the essential event in hepatic fibrogenesis, becauseHSCs transactivate to myofibroblast-like cells that producea large, excess amount of matrix proteins (e.g., fibrillarcollagen, fibronectin, laminin, and proteoglycans) in injuredliver[16]. It was reported that HSCs express short forms ofthe leptin receptor (Ob-Ra), but not the functional longform of the leptin receptor Ob-Rb. Since the sinusoidalendothelial cells and Kupffer cells in the liver express thelong form of the leptin receptor Ob-Rb[17,18], leptin mayexert an indirect effect on the activation of HSCs mediatedby TGF-β1. As Ob-Rb leptin can increase TGF-β1expression in the sinusoidal endothelial cells and Kupffercells, TGF-β1 activates type I collagen promoters, andupregulates the extracellular matrix such as collagen andfibronectin from HSCs[19]. Recently, it was reported thatleptin also can activate HSCs directly[20]. However, the roleof leptin in the activation of HSCs needs to be furtheranalyzed.
TAA is a typical hepatotoxin and causes centrilobularnecrosis by generation of ROS. ROS triggers lipidperoxidation chain reaction. MDA is the production of lipidperoxidation, the amount of MDA can express the degreeof lipid peroxidation. SOD is a ubiquitous chain breakinganti-oxidant found in all aerobic organisms. It is a metalloproteinwidely distributed in all cells and protects cells against ROS-induced oxidative damage. Oxidative stress contributes tothe pathogenesis of hepatic fibrosis induced by alcohol andvirus infection[21,22]. Furthermore, oxidative stress is involvedin activation of HSCs and promotion of their proliferation,collagen synthesis, and migration[23]. The activation of
quiescent HSCs plays an important role in the process ofliver fibrosis[16,24]. In our experiment, MDA was higher inTAA plus leptin group than in TAA group (P<0.05), whileSOD was lower in TAA plus leptin group than in TAAgroup. The results suggest leptin can augment TAA-inducedlipid peroxidation by lowering the level of enzymicantioxidant. But leptin administration alone has no apparenteffect on lipid peroxidation. Whether leptin is just a co-factor needs to be further studied. On the other hand, leptincan regulate macrophage function[25] and augment endotoxin-stimulated TNF production by macrophages[3]. Hematopoieticcells including macrophages and lymphocytes contain afunctional leptin receptor[26], through which leptin regulatesproliferation and maturation of immune cells[27,28] and elicitsrelease of pro-inflammatory cytokines from macrophages[3].These pro-inflammatory cytokines and immune responsesplay a critical role in the development of liver fibrosis. Theabove findings may explain, at least in part, why leptinincreases the degree of liver fibrosis in mice induced byTAA.
It has been reported that hepatic cirrhosis is six foldmore prevalent in obese individuals than in the generalpopulation[29,30], and obesity is an independent risk factorfor the development of chronic liver diseases caused by alcohol,chronic hepatitis C, and NASH[31-34]. These observationsindicate that there could be a pathogenic link between obesityand liver fibrosis. But the reason why obesity acceleratesthe development of hepatic fibrosis has not been elucidated.Circulating levels of leptin correlate well with body fat mass[35].Obese people have remarkably high serum leptin levels.Increased serum leptin presumably enhances pro-inflammatoryand pro-fibrogenic responses in the liver, and generateoxidative stress. Leptin may be a determinant of hepaticinflammation and fibrosis in obese individuals, especially inthose with NASH. Our findings support the hypothesis thatleptin is involved in the progression of liver fibrosis.However, additional studies are needed to elucidate the roleof leptin in the progression of chronic liver fibrosis in obesepatients.
REFERENCESREFERENCESREFERENCESREFERENCESREFERENCES
1 Zhang Y, Proenca R, Maffei M, Barone M, Leopold L, Fried-man JM. Positional cloning of the mouse obese gene and itshuman homologue. Nature 1994; 372: 425-432
2 Halaas JL, Gajiwala KS, Maffei M, Cohen SL, Chait BT,Rabinowitz D, Lallone RL, Burley SK, Friedman JM. Weight-reducing effects of the plasma protein encoded by the obesegene. Science 1995; 269: 543-546
3 Loffreda S, Yang SQ, Lin HZ, Karp CL, Brengman ML, WangDJ, Klein AS, Bulkley GB, Bao C, Noble PW, Lane MD, DiehlAM. Leptin regulates proinflammatory immune responses.FASEB J 1998; 12: 57-65
4 Goren I, Kampfer H, Podda M, Pfeilschifter J, Frank S. Leptinand wound inflammation in diabetic ob/ob mice: differentialregulation of neutrophil and macrophage influx and a poten-tial role for the scab as a sink for inflammatory cells andmediators. Diabetes 2003; 52: 2821-2832
5 Murad A, Nath AK, Cha ST, Demir E, Flores-Riveros J, Si-erra-Honigmann MR. Leptin is an autocrine/paracrine regu-lator of wound healing. FASEB J 2003; 17: 1895-1897
6 Frankenberry KA, Somasundar P, McFadden DW, Vona-Davis LC. Leptin induces cell migration and the expression ofgrowth factors in human prostate cancer cells. Am J Surg
Figure 2 Expression of α1(I) procollagen mRNA. M: 100-bp DNA marker; lane1: saline group; lane 2: leptin group; lane 3: TAA group; and lane 4: TAA plusleptin group.
1 2 3 4 5
500 bp
β-actin 227 bp
α1 (1) Procollagen 419 bp
Dai K et al. Leptin on liver fibrosis in mice 4825
2004; 188: 560-5657 Potter JJ, Womack L, Mezey E, Anania FA. Transdifferentiation
of rat hepatic stellate cells results in leptin expression. BiochemBiophys Res Commun 1998; 244: 178-182
8 Henriksen JH, Holst JJ, Moller S, Brinch K, Bendtsen F. In-creased circulating leptin in alcoholic cirrhosis: relation to re-lease and disposal. Hepatology 1999; 29: 1818-1824
9 Testa R, Franceschini R, Giannini E, Cataldi A, Botta F, FasoliA, Tenerelli P, Rolandi E, Barreca T. Serum leptin levels inpatients with viral chronic hepatitis or liver cirrhosis. J Hepatol2000; 33: 33-37
10 Wang XQ, Zhang WW, Li Y. Serum leptin levels in patients withliver cirrhosis. Shijie Huaren Xiaohua Zazhi 2002; 10: 1177-1179
11 Chalasani N, Crabb DW, Cummings OW, Kwo PY, AsgharA, Pandya PK, Considine RV. Does leptin play a role in thepathogenesis of human nonalcoholic steatohepatitis? Am JGastroenterol 2003; 98: 2771-2776
12 Leclercq IA, Farrell GC, Schriemer R, Robertson GR. Leptin isessential for the hepatic fibrogenic response to chronic liverinjury. J Hepatol 2002; 37: 206-213
13 Honda H, Ikejima K, Hirose M, Yoshikawa M, Lang T,Enomoto N, Kitamura T, Takei Y, Sato N. Leptin is requiredfor fibrogenic responses induced by thioacetamide in themurine liver. Hepatology 2002; 36: 12-21
14 Goddard CJ, Smith A, Hoyland JA, Baird P, McMahon RF,Freemont AJ, Shomaf M, Haboubi NY, Warnes TW. Localisationand semiquantitative assessment of hepatic procollagenmRNA in primary biliary cirrhosis. Gut 1998; 43: 433-440
15 Pierce RA, Glaug MR, Greco RS, Mackenzie JW, Boyd CD,Deak SB. Increased procollagen mRNA levels in carbon tetra-chloride-induced liver fibrosis in rats. J Biol Chem 1987; 262:1652-1658
16 Friedman SL. Seminars in medicine of the Beth Israel Hospital,Boston. The cellular basis of hepatic fibrosis. Mechanisms andtreatment strategies. N Engl J Med 1993; 328: 1828-1835
17 Ikejima K, Takei Y, Honda H, Hirose M, Yoshikawa M, ZhangYJ, Lang T, Fukuda T, Yamashina S, Kitamura T, Sato N.Leptin receptor-mediated signaling regulates hepaticfibrogenesis and remodeling of extracellular matrix in the rat.Gastroenterology 2002; 122: 1399-1410
18 Tang M, Potter JJ, Mezey E. Leptin enhances the effect oftransforming growth factor beta in increasing type I collagenformation. Biochem Biophys Res Commun 2002; 297: 906-911
19 Penttinen RP, Kobayashi S, Bornstein P. Transforminggrowth factor ß increases mRNA for matrix proteins both inthe presence and in the absence of changes in mRNA stability.Proc Natl Acad Sci USA 1988; 85: 1105-1108
20 Saxena NK, Saliba G, Floyd JJ, Anania FA. Leptin inducesincreased alpha2(I) collagen gene expression in cultured rathepatic stellate cells. J Cell Biochem 2003; 89: 311-320
21 Kurose I, Higuchi H, Miura S, Saito H, Watanabe N, Hokari
R, Hirokawa M, Takaishi M, Zeki S, Nakamura T, EbinumaH, Kato S, Ishii H. Oxidative stress-mediated apoptosis ofhepatocytes exposed to acute ethanol intoxication. Hepatology1997; 25: 368-378
22 Lieber CS. Alcohol and hepatitis C. Alcohol Res Health 2001;25: 245-254
23 Lee KS, Lee SJ, Park HJ, Chung JP, Han KH, Chon CY, Lee SI,Moon YM. Oxidative stress effect on the activation of hepaticstellate cells. Yonsei Med J 2001; 42: 1-8
24 Okuyama H, Shimahara Y, Kawada N. The hepatic stellate cellin the post-genomic era. Histol Histopathol 2002; 17: 487-495
25 Lee FY, Li Y, Yang EK, Yang SQ, Lin HZ, Trush MA,Dannenberg AJ, Diehl AM. Phenotypic abnormalities in mac-rophages from leptin-deficient, obese mice. Am J Physiol 1999;276: C386-394
26 Bennett BD, Solar GP, Yuan JQ, Mathias J, Thomas GR,Matthews W. A role for leptin and its cognate receptor inhematopoiesis. Curr Biol 1996; 6: 1170-1180
27 Gainsford T, Willson TA, Metcalf D, Handman E, McFarlaneC, Ng A, Nicola NA, Alexander WS, Hilton DJ. Leptin caninduce proliferation, differentiation, and functional activa-tion of hemopoietic cells. Proc Natl Acad Sci USA 1996; 93:14564-14568
28 Santos-Alvarez J, Goberna R, Sanchez-Margalet V. Humanleptin stimulates proliferation and activation of human cir-culating monocytes. Cell Immunol 1999; 194: 6-11
29 Ratziu V, Giral P, Charlotte F, Bruckert E, Thibault V,Theodorou I, Khalil L, Turpin G, Opolon P, Poynard T. Liverfibrosis in overweight patients. Gastroenterology 2000; 118:1117-1123
30 McCullough AJ, Falck-Ytter Y. Body composition and he-patic steatosis as precursors for fibrotic liver disease.Hepatology 1999; 29: 1328-1330
31 Chitturi S, Farrell GC. Etiopathogenesis of nonalcoholicsteatohepatitis. Semin Liver Dis 2001; 21: 27-41
32 Naveau S, Giraud V, Borotto E, Aubert A, Capron F, ChaputJC. Excess weight risk factor for alcoholic liver disease.Hepatology 1997; 25: 108-111
33 Hourigan LF, Macdonald GA, Purdie D, Whitehall VH,Shorthouse C, Clouston A, Powell EE. Fibrosis in chronic hepa-titis C correlates significantly with body mass index andsteatosis. Hepatology 1999; 29: 1215-1219
34 Adinolfi LE, Gambardella M, Andreana A, Tripodi MF, UtiliR, Ruggiero G. Steatosis accelerates the progression of liverdamage of chronic hepatitis C patients and correlates withspecific HCV genotype and visceral obesity. Hepatology 2001;33: 1358-1364
35 Frederich RC, Hamann A, Anderson S, Lollmann B, LowellBB, Flier JS. Leptin levels reflect body lipid content in mice:evidence for diet-induced resistance to leptin action. Nat Med1995; 1: 1311-1314
Science Editor Wang XL and Guo SY Language Editor Elsevier HK
4826 ISSN 1007-9327 CN 14-1219/ R World J Gastroenterol August 21, 2005 Volume 11 Number 31
• BASIC RESEARCH •
GFAP and Fos immunoreactivity in lumbo-sacral spinal cord and
medulla oblongata after chronic colonic inflammation in rats
Yi-Ning Sun, Jin-Yan Luo, Zhi-Ren Rao, Li Lan, Li Duan
ELSEVIER
PO Box 2345, Beijing 100023, China World J Gastroenterol 2005;11(31):4827-4832www.wjgnet.com World Journal of Gastroenterology ISSN [email protected] © 2005 The WJG Press and Elsevier Inc. All rights reserved.
Yi-Ning Sun, Jin-Yan Luo, Department of Gastroenterology, TheSecond Hospital of Xi’an Jiaotong University, Xi’an 710004, ShaanxiProvince, ChinaZhi-Ren Rao, Li Lan, Li Duan, Department of Neurosciences,the Fourth Military Medical University, Xi’an 710032, ShaanxiProvince, ChinaCorrespondence to: Professor Jin-Yan Luo, Department ofGastroenterology, The Second Hospital of Xi’an Jiaotong University,Xi’an 710004, Shaanxi Province, China. [email protected]: +86-29-87678758Received: 2004-08-26 Accepted: 2004-12-08
AbstractAbstractAbstractAbstractAbstract
AIM: To investigate the response of astrocytes and neuronsin rat lumbo-sacral spinal cord and medulla oblongatainduced by chronic colonic inflammation, and the relationshipbetween them.
METHODS: Thirty-three male Sprague-Dawley rats wererandomly divided into two groups: experimental group(n = 17), colonic inflammation was induced by intra-luminaladministration of trinitrobenzenesulfonic acid (TNBS);control group (n = 16), saline was administered intra-luminally.After 3, 7, 14, and 28 d of administration, the lumbo-sacralspinal cord and medulla oblongata were removed andprocessed for anti-glial fibrillary acidic protein (GFAP),Fos and GFAP/Fos immunohistochemistry.
RESULTS: Activated astrocytes positive for GFAP weremainly distributed in the superficial laminae (laminae I-II)of dorsal horn, intermediolateral nucleus (laminae V),posterior commissural nucleus (laminae X) and anterolateralnucleus (laminae IX). Fos-IR (Fos-immunoreactive)neurons were mainly distributed in the deeper laminaeof the spinal cord (laminae III-IV, V-VI). In the medullaoblongata, both GFAP-IR astrocytes and Fos-IR neuronswere mainly distributed in the medullary visceral zone(MVZ). The density of GFAP in the spinal cord of experimentalrats was significantly higher after 3, 7, and 14 d of TNBSadministration compared with the controls (50.4±16.8,29.2±6.5, 24.1±5.6, P<0.05). The density of GFAP in MVZwas significantly higher after 3 d of TNBS administration(34.3±2.5, P<0.05). After 28 d of TNBS administration,the density of GFAP in the spinal cord and MVZ decreasedand became comparable to that of the controls (18.0±4.9,14.6±6.4, P>0.05).
CONCLUSION: Astrocytes in spinal cord and medullaoblongata can be activated by colonic inflammation. Theactivated astrocytes are closely related to Fos-IR neurons.With the recovery of colonic inflammation, the activity of
astrocytes in the spinal cord and medulla oblongata isreduced.
© 2005 The WJG Press and Elsevier Inc. All rights reserved.
Key words: Astrocytes; Neurons; Glial fibrillary acidicprotein; Fos; Spinal cord; Medulla oblongata; Colonicinflammation
Sun YN, Luo JY, Rao ZR, Lan L, Duan L. GFAP and Fosimmunoreactivity in lumbo-sacral spinal cord and medullaoblongata after chronic colonic inflammation in rats. World J
Gastroenterol 2005; 11(31): 4827-4832
http://www.wjgnet.com/1007-9327/11/4827.asp
INTRODUCTIONINTRODUCTIONINTRODUCTIONINTRODUCTIONINTRODUCTION
Recent studies have shown that astrocytes, being in intimatecontact with neurons, may respond to various kinds ofstimulation. Both peripheral inflammation and nerve injuriesare able to induce astrocytic activation in the spinal cordand brain stem. Moreover, astrocytic activation was shownto be involved in central nervous system (CNS) responsesleading to hypersensitivity and persistent pain states[1-3]. Glialfibrillary acidic protein (GFAP) is an intermediate filamentcomponent in astrocytes of nervous tissue. The expressionof GFAP may increase with astrocytic activation[4]. By usingGFAP and Fos immunoreactivity (IR) as markers, we aimedto determine the response of astrocytes and neurons inrat lumbo-sacral spinal cord and medulla oblongata inducedby chronic colonic inflammation, and the relationshipbetween them.
MAMAMAMAMATERIALS AND METHODSTERIALS AND METHODSTERIALS AND METHODSTERIALS AND METHODSTERIALS AND METHODS
AnimalsThirty-three adult male Sprague-Dawley rats (The FourthMilitary Medical University) weighing 220-250 g were usedin this study. The animals were housed in a quiet room witha constant ambient temperature of 20 , and free accessto rat chow and water. They were divided randomly intoexperimental group (n = 17) and control group (n = 16).
Experimental protocolAfter 24 h fast, trinitrobenzenesulfonic acid (TNBS,100 mg/kg in 300 mL/L ethanol) was administered intra-luminally through a silicone rubber catheter introduced7 cm into the anus with light diethyl-ether anesthesia, aspreviously described[5]. To keep TNBS in the colon for alonger time and to avoid leakage, the tubing was slowly
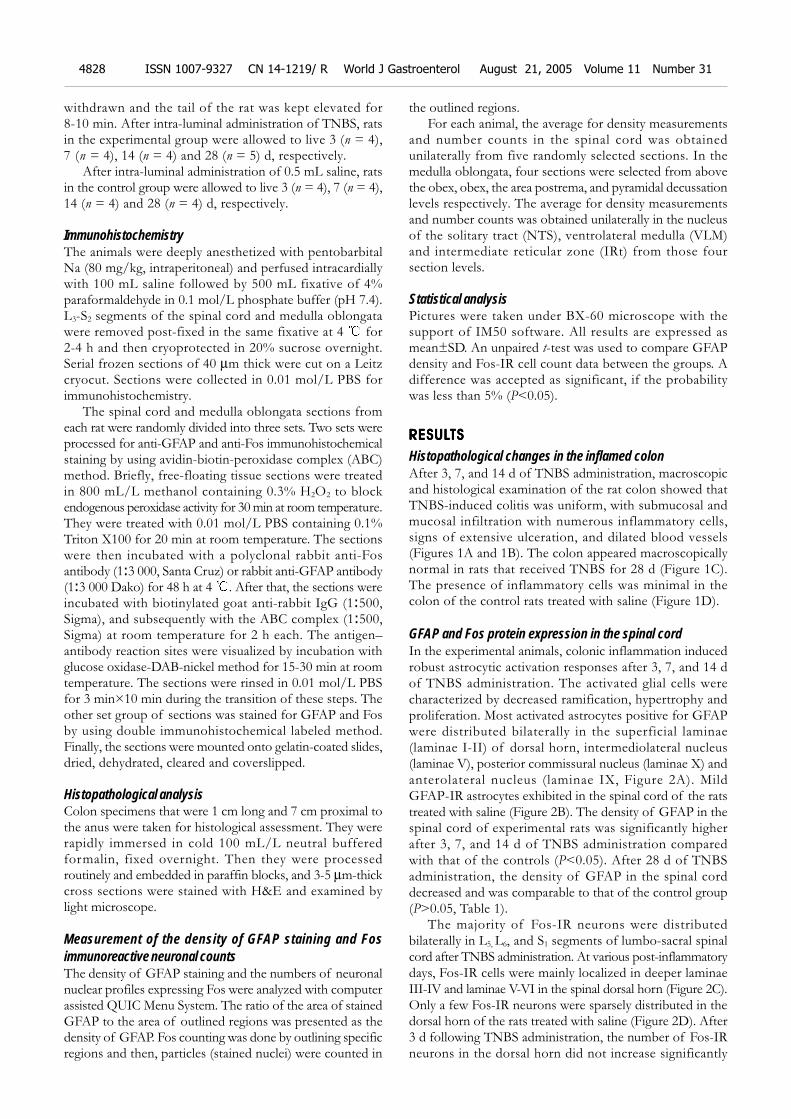
4828 ISSN 1007-9327 CN 14-1219/ R World J Gastroenterol August 21, 2005 Volume 11 Number 31
withdrawn and the tail of the rat was kept elevated for8-10 min. After intra-luminal administration of TNBS, ratsin the experimental group were allowed to live 3 (n = 4),7 (n = 4), 14 (n = 4) and 28 (n = 5) d, respectively.
After intra-luminal administration of 0.5 mL saline, ratsin the control group were allowed to live 3 (n = 4), 7 (n = 4),14 (n = 4) and 28 (n = 4) d, respectively.
ImmunohistochemistryThe animals were deeply anesthetized with pentobarbitalNa (80 mg/kg, intraperitoneal) and perfused intracardiallywith 100 mL saline followed by 500 mL fixative of 4%paraformaldehyde in 0.1 mol/L phosphate buffer (pH 7.4).L3-S2 segments of the spinal cord and medulla oblongatawere removed post-fixed in the same fixative at 4 for2-4 h and then cryoprotected in 20% sucrose overnight.Serial frozen sections of 40 µm thick were cut on a Leitzcryocut. Sections were collected in 0.01 mol/L PBS forimmunohistochemistry.
The spinal cord and medulla oblongata sections fromeach rat were randomly divided into three sets. Two sets wereprocessed for anti-GFAP and anti-Fos immunohistochemicalstaining by using avidin-biotin-peroxidase complex (ABC)method. Briefly, free-floating tissue sections were treatedin 800 mL/L methanol containing 0.3% H2O2 to blockendogenous peroxidase activity for 30 min at room temperature.They were treated with 0.01 mol/L PBS containing 0.1%Triton X100 for 20 min at room temperature. The sectionswere then incubated with a polyclonal rabbit anti-Fosantibody (1:3 000, Santa Cruz) or rabbit anti-GFAP antibody(1:3 000 Dako) for 48 h at 4 . After that, the sections wereincubated with biotinylated goat anti-rabbit IgG (1:500,Sigma), and subsequently with the ABC complex (1:500,Sigma) at room temperature for 2 h each. The antigen–antibody reaction sites were visualized by incubation withglucose oxidase-DAB-nickel method for 15-30 min at roomtemperature. The sections were rinsed in 0.01 mol/L PBSfor 3 min×10 min during the transition of these steps. Theother set group of sections was stained for GFAP and Fosby using double immunohistochemical labeled method.Finally, the sections were mounted onto gelatin-coated slides,dried, dehydrated, cleared and coverslipped.
Histopathological analysisColon specimens that were 1 cm long and 7 cm proximal tothe anus were taken for histological assessment. They wererapidly immersed in cold 100 mL/L neutral bufferedformalin, fixed overnight. Then they were processedroutinely and embedded in paraffin blocks, and 3-5 µm-thickcross sections were stained with H&E and examined bylight microscope.
Measurement of the density of GFAP staining and Fosimmunoreactive neuronal countsThe density of GFAP staining and the numbers of neuronalnuclear profiles expressing Fos were analyzed with computerassisted QUIC Menu System. The ratio of the area of stainedGFAP to the area of outlined regions was presented as thedensity of GFAP. Fos counting was done by outlining specificregions and then, particles (stained nuclei) were counted in
the outlined regions.For each animal, the average for density measurements
and number counts in the spinal cord was obtainedunilaterally from five randomly selected sections. In themedulla oblongata, four sections were selected from abovethe obex, obex, the area postrema, and pyramidal decussationlevels respectively. The average for density measurementsand number counts was obtained unilaterally in the nucleusof the solitary tract (NTS), ventrolateral medulla (VLM)and intermediate reticular zone (IRt) from those foursection levels.
Statistical analysisPictures were taken under BX-60 microscope with thesupport of IM50 software. All results are expressed asmean±SD. An unpaired t-test was used to compare GFAPdensity and Fos-IR cell count data between the groups. Adifference was accepted as significant, if the probabilitywas less than 5% (P<0.05).
RESULRESULRESULRESULRESULTSTSTSTSTS
Histopathological changes in the inflamed colonAfter 3, 7, and 14 d of TNBS administration, macroscopicand histological examination of the rat colon showed thatTNBS-induced colitis was uniform, with submucosal andmucosal infiltration with numerous inflammatory cells,signs of extensive ulceration, and dilated blood vessels(Figures 1A and 1B). The colon appeared macroscopicallynormal in rats that received TNBS for 28 d (Figure 1C).The presence of inflammatory cells was minimal in thecolon of the control rats treated with saline (Figure 1D).
GFAP and Fos protein expression in the spinal cordIn the experimental animals, colonic inflammation inducedrobust astrocytic activation responses after 3, 7, and 14 dof TNBS administration. The activated glial cells werecharacterized by decreased ramification, hypertrophy andproliferation. Most activated astrocytes positive for GFAPwere distributed bilaterally in the superficial laminae(laminae I-II) of dorsal horn, intermediolateral nucleus(laminae V), posterior commissural nucleus (laminae X) andanterolateral nucleus (laminae IX, Figure 2A). MildGFAP-IR astrocytes exhibited in the spinal cord of the ratstreated with saline (Figure 2B). The density of GFAP in thespinal cord of experimental rats was significantly higherafter 3, 7, and 14 d of TNBS administration comparedwith that of the controls (P<0.05). After 28 d of TNBSadministration, the density of GFAP in the spinal corddecreased and was comparable to that of the control group(P>0.05, Table 1).
The majority of Fos-IR neurons were distributedbilaterally in L5, L6, and S1 segments of lumbo-sacral spinalcord after TNBS administration. At various post-inflammatorydays, Fos-IR cells were mainly localized in deeper laminaeIII-IV and laminae V-VI in the spinal dorsal horn (Figure 2C).Only a few Fos-IR neurons were sparsely distributed in thedorsal horn of the rats treated with saline (Figure 2D). After3 d following TNBS administration, the number of Fos-IRneurons in the dorsal horn did not increase significantly
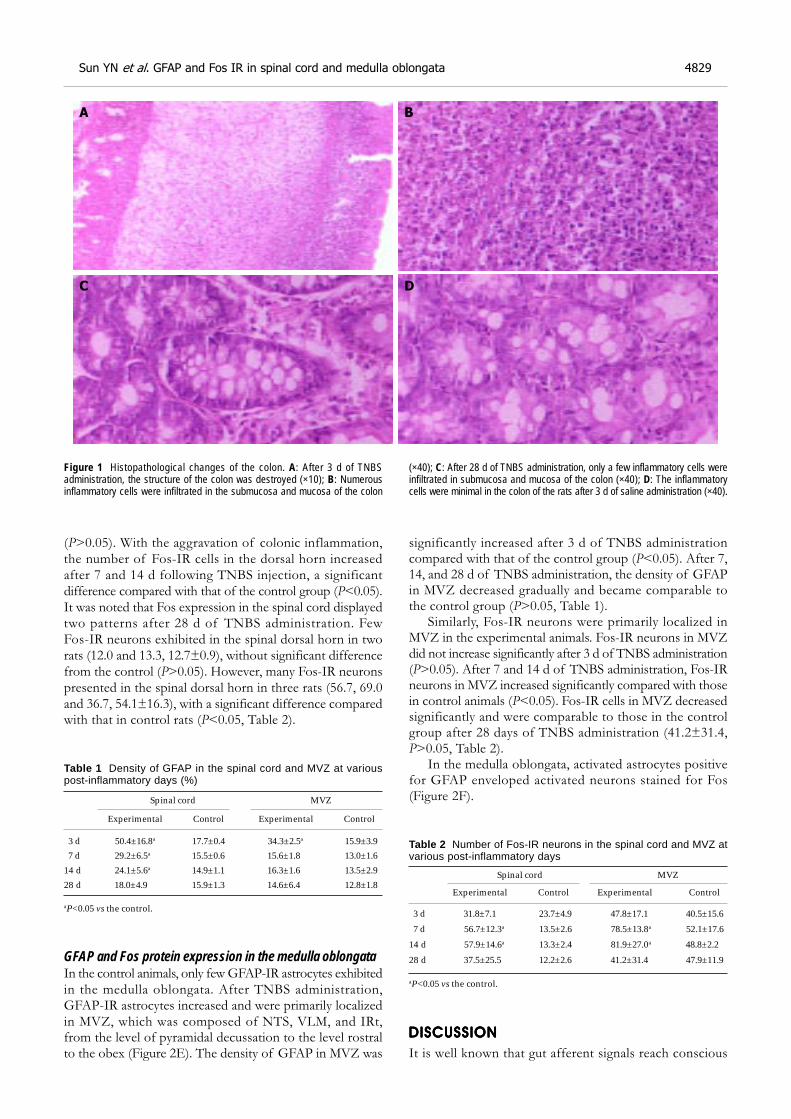
Sun YN et al. GFAP and Fos IR in spinal cord and medulla oblongata 4829
(P>0.05). With the aggravation of colonic inflammation,the number of Fos-IR cells in the dorsal horn increasedafter 7 and 14 d following TNBS injection, a significantdifference compared with that of the control group (P<0.05).It was noted that Fos expression in the spinal cord displayedtwo patterns after 28 d of TNBS administration. FewFos-IR neurons exhibited in the spinal dorsal horn in tworats (12.0 and 13.3, 12.7±0.9), without significant differencefrom the control (P>0.05). However, many Fos-IR neuronspresented in the spinal dorsal horn in three rats (56.7, 69.0and 36.7, 54.1±16.3), with a significant difference comparedwith that in control rats (P<0.05, Table 2).
Table 1 Density of GFAP in the spinal cord and MVZ at variouspost-inflammatory days (%)
Spinal cord MVZ
Experimental Control Experimental Control
3 d 50.4±16.8a 17.7±0.4 34.3±2.5a 15.9±3.9
7 d 29.2±6.5a 15.5±0.6 15.6±1.8 13.0±1.6
14 d 24.1±5.6a 14.9±1.1 16.3±1.6 13.5±2.9
28 d 18.0±4.9 15.9±1.3 14.6±6.4 12.8±1.8
aP<0.05 vs the control.
GFAP and Fos protein expression in the medulla oblongataIn the control animals, only few GFAP-IR astrocytes exhibitedin the medulla oblongata. After TNBS administration,GFAP-IR astrocytes increased and were primarily localizedin MVZ, which was composed of NTS, VLM, and IRt,from the level of pyramidal decussation to the level rostralto the obex (Figure 2E). The density of GFAP in MVZ was
significantly increased after 3 d of TNBS administrationcompared with that of the control group (P<0.05). After 7,14, and 28 d of TNBS administration, the density of GFAPin MVZ decreased gradually and became comparable tothe control group (P>0.05, Table 1).
Similarly, Fos-IR neurons were primarily localized inMVZ in the experimental animals. Fos-IR neurons in MVZdid not increase significantly after 3 d of TNBS administration(P>0.05). After 7 and 14 d of TNBS administration, Fos-IRneurons in MVZ increased significantly compared with thosein control animals (P<0.05). Fos-IR cells in MVZ decreasedsignificantly and were comparable to those in the controlgroup after 28 days of TNBS administration (41.2±31.4,P>0.05, Table 2).
In the medulla oblongata, activated astrocytes positivefor GFAP enveloped activated neurons stained for Fos(Figure 2F).
Table 2 Number of Fos-IR neurons in the spinal cord and MVZ atvarious post-inflammatory days
Spinal cord MVZ
Experimental Control Experimental Control
3 d 31.8±7.1 23.7±4.9 47.8±17.1 40.5±15.6
7 d 56.7±12.3a 13.5±2.6 78.5±13.8a 52.1±17.6
14 d 57.9±14.6a 13.3±2.4 81.9±27.0a 48.8±2.2
28 d 37.5±25.5 12.2±2.6 41.2±31.4 47.9±11.9
aP<0.05 vs the control.
DISCUSSIONDISCUSSIONDISCUSSIONDISCUSSIONDISCUSSION
It is well known that gut afferent signals reach conscious
Figure 1 Histopathological changes of the colon. A: After 3 d of TNBSadministration, the structure of the colon was destroyed (×10); B: Numerousinflammatory cells were infiltrated in the submucosa and mucosa of the colon
(×40); C: After 28 d of TNBS administration, only a few inflammatory cells wereinfiltrated in submucosa and mucosa of the colon (×40); D: The inflammatorycells were minimal in the colon of the rats after 3 d of saline administration (×40).
A
C D
B
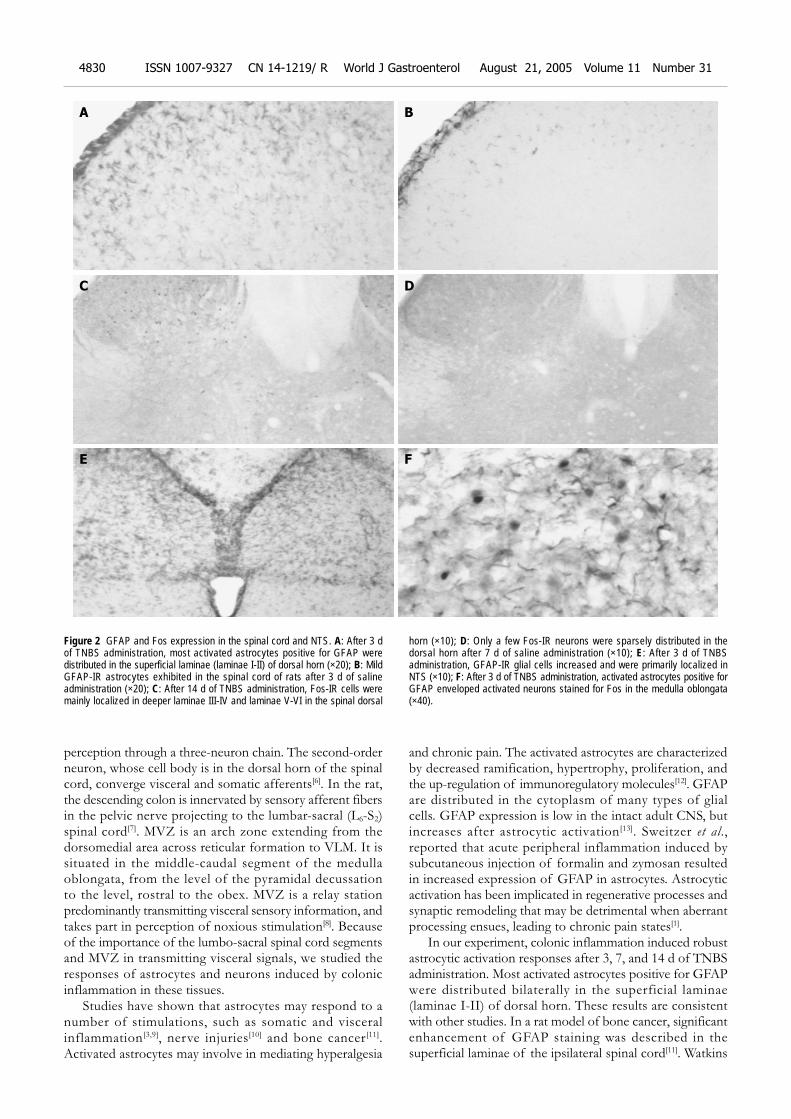
perception through a three-neuron chain. The second-orderneuron, whose cell body is in the dorsal horn of the spinalcord, converge visceral and somatic afferents[6]. In the rat,the descending colon is innervated by sensory afferent fibersin the pelvic nerve projecting to the lumbar-sacral (L6-S2)spinal cord[7]. MVZ is an arch zone extending from thedorsomedial area across reticular formation to VLM. It issituated in the middle-caudal segment of the medullaoblongata, from the level of the pyramidal decussationto the level, rostral to the obex. MVZ is a relay stationpredominantly transmitting visceral sensory information, andtakes part in perception of noxious stimulation[8]. Becauseof the importance of the lumbo-sacral spinal cord segmentsand MVZ in transmitting visceral signals, we studied theresponses of astrocytes and neurons induced by colonicinflammation in these tissues.
Studies have shown that astrocytes may respond to anumber of stimulations, such as somatic and visceralinflammation[3,9], nerve injuries[10] and bone cancer[11].Activated astrocytes may involve in mediating hyperalgesia
and chronic pain. The activated astrocytes are characterizedby decreased ramification, hypertrophy, proliferation, andthe up-regulation of immunoregulatory molecules[12]. GFAPare distributed in the cytoplasm of many types of glialcells. GFAP expression is low in the intact adult CNS, butincreases after astrocytic activation[13]. Sweitzer et al.,reported that acute peripheral inflammation induced bysubcutaneous injection of formalin and zymosan resultedin increased expression of GFAP in astrocytes. Astrocyticactivation has been implicated in regenerative processes andsynaptic remodeling that may be detrimental when aberrantprocessing ensues, leading to chronic pain states[1].
In our experiment, colonic inflammation induced robustastrocytic activation responses after 3, 7, and 14 d of TNBSadministration. Most activated astrocytes positive for GFAPwere distributed bilaterally in the superficial laminae(laminae I-II) of dorsal horn. These results are consistentwith other studies. In a rat model of bone cancer, significantenhancement of GFAP staining was described in thesuperficial laminae of the ipsilateral spinal cord[11]. Watkins
Figure 2 GFAP and Fos expression in the spinal cord and NTS. A: After 3 dof TNBS administration, most activated astrocytes positive for GFAP weredistributed in the superficial laminae (laminae I-II) of dorsal horn (×20); B: MildGFAP-IR astrocytes exhibited in the spinal cord of rats after 3 d of salineadministration (×20); C: After 14 d of TNBS administration, Fos-IR cells weremainly localized in deeper laminae III-IV and laminae V-VI in the spinal dorsal
horn (×10); D: Only a few Fos-IR neurons were sparsely distributed in thedorsal horn after 7 d of saline administration (×10); E: After 3 d of TNBSadministration, GFAP-IR glial cells increased and were primarily localized inNTS (×10); F: After 3 d of TNBS administration, activated astrocytes positive forGFAP enveloped activated neurons stained for Fos in the medulla oblongata(×40).
A
C D
E
B
F
4830 ISSN 1007-9327 CN 14-1219/ R World J Gastroenterol August 21, 2005 Volume 11 Number 31
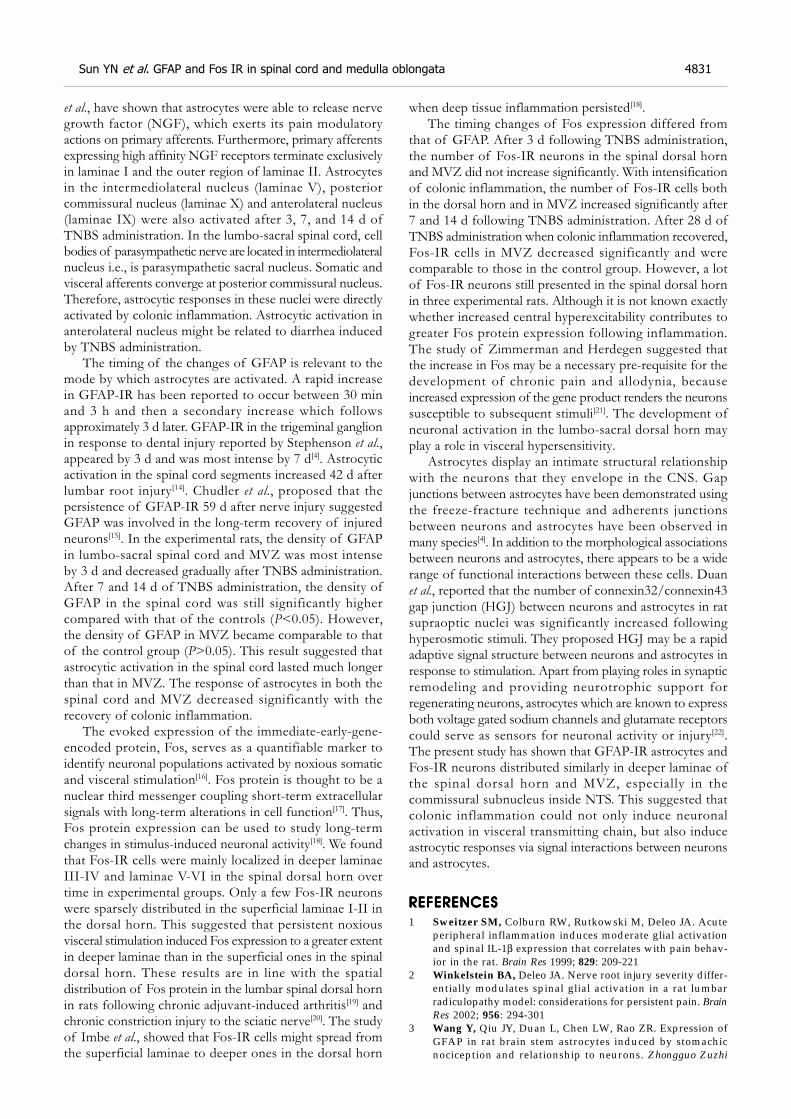
et al., have shown that astrocytes were able to release nervegrowth factor (NGF), which exerts its pain modulatoryactions on primary afferents. Furthermore, primary afferentsexpressing high affinity NGF receptors terminate exclusivelyin laminae I and the outer region of laminae II. Astrocytesin the intermediolateral nucleus (laminae V), posteriorcommissural nucleus (laminae X) and anterolateral nucleus(laminae IX) were also activated after 3, 7, and 14 d ofTNBS administration. In the lumbo-sacral spinal cord, cellbodies of parasympathetic nerve are located in intermediolateralnucleus i.e., is parasympathetic sacral nucleus. Somatic andvisceral afferents converge at posterior commissural nucleus.Therefore, astrocytic responses in these nuclei were directlyactivated by colonic inflammation. Astrocytic activation inanterolateral nucleus might be related to diarrhea inducedby TNBS administration.
The timing of the changes of GFAP is relevant to themode by which astrocytes are activated. A rapid increasein GFAP-IR has been reported to occur between 30 minand 3 h and then a secondary increase which followsapproximately 3 d later. GFAP-IR in the trigeminal ganglionin response to dental injury reported by Stephenson et al.,appeared by 3 d and was most intense by 7 d[4]. Astrocyticactivation in the spinal cord segments increased 42 d afterlumbar root injury[14]. Chudler et al., proposed that thepersistence of GFAP-IR 59 d after nerve injury suggestedGFAP was involved in the long-term recovery of injuredneurons[15]. In the experimental rats, the density of GFAPin lumbo-sacral spinal cord and MVZ was most intenseby 3 d and decreased gradually after TNBS administration.After 7 and 14 d of TNBS administration, the density ofGFAP in the spinal cord was still significantly highercompared with that of the controls (P<0.05). However,the density of GFAP in MVZ became comparable to thatof the control group (P>0.05). This result suggested thatastrocytic activation in the spinal cord lasted much longerthan that in MVZ. The response of astrocytes in both thespinal cord and MVZ decreased significantly with therecovery of colonic inflammation.
The evoked expression of the immediate-early-gene-encoded protein, Fos, serves as a quantifiable marker toidentify neuronal populations activated by noxious somaticand visceral stimulation[16]. Fos protein is thought to be anuclear third messenger coupling short-term extracellularsignals with long-term alterations in cell function[17]. Thus,Fos protein expression can be used to study long-termchanges in stimulus-induced neuronal activity[18]. We foundthat Fos-IR cells were mainly localized in deeper laminaeIII-IV and laminae V-VI in the spinal dorsal horn overtime in experimental groups. Only a few Fos-IR neuronswere sparsely distributed in the superficial laminae I-II inthe dorsal horn. This suggested that persistent noxiousvisceral stimulation induced Fos expression to a greater extentin deeper laminae than in the superficial ones in the spinaldorsal horn. These results are in line with the spatialdistribution of Fos protein in the lumbar spinal dorsal hornin rats following chronic adjuvant-induced arthritis[19] andchronic constriction injury to the sciatic nerve[20]. The studyof Imbe et al., showed that Fos-IR cells might spread fromthe superficial laminae to deeper ones in the dorsal horn
when deep tissue inflammation persisted[18].The timing changes of Fos expression differed from
that of GFAP. After 3 d following TNBS administration,the number of Fos-IR neurons in the spinal dorsal hornand MVZ did not increase significantly. With intensificationof colonic inflammation, the number of Fos-IR cells bothin the dorsal horn and in MVZ increased significantly after7 and 14 d following TNBS administration. After 28 d ofTNBS administration when colonic inflammation recovered,Fos-IR cells in MVZ decreased significantly and werecomparable to those in the control group. However, a lotof Fos-IR neurons still presented in the spinal dorsal hornin three experimental rats. Although it is not known exactlywhether increased central hyperexcitability contributes togreater Fos protein expression following inflammation.The study of Zimmerman and Herdegen suggested thatthe increase in Fos may be a necessary pre-requisite for thedevelopment of chronic pain and allodynia, becauseincreased expression of the gene product renders the neuronssusceptible to subsequent stimuli[21]. The development ofneuronal activation in the lumbo-sacral dorsal horn mayplay a role in visceral hypersensitivity.
Astrocytes display an intimate structural relationshipwith the neurons that they envelope in the CNS. Gapjunctions between astrocytes have been demonstrated usingthe freeze-fracture technique and adherents junctionsbetween neurons and astrocytes have been observed inmany species[4]. In addition to the morphological associationsbetween neurons and astrocytes, there appears to be a widerange of functional interactions between these cells. Duanet al., reported that the number of connexin32/connexin43gap junction (HGJ) between neurons and astrocytes in ratsupraoptic nuclei was significantly increased followinghyperosmotic stimuli. They proposed HGJ may be a rapidadaptive signal structure between neurons and astrocytes inresponse to stimulation. Apart from playing roles in synapticremodeling and providing neurotrophic support forregenerating neurons, astrocytes which are known to expressboth voltage gated sodium channels and glutamate receptorscould serve as sensors for neuronal activity or injury[22].The present study has shown that GFAP-IR astrocytes andFos-IR neurons distributed similarly in deeper laminae ofthe spinal dorsal horn and MVZ, especially in thecommissural subnucleus inside NTS. This suggested thatcolonic inflammation could not only induce neuronalactivation in visceral transmitting chain, but also induceastrocytic responses via signal interactions between neuronsand astrocytes.
REFERENCESREFERENCESREFERENCESREFERENCESREFERENCES
1 Sweitzer SM, Colburn RW, Rutkowski M, Deleo JA. Acuteperipheral inflammation induces moderate glial activationand spinal IL-1β expression that correlates with pain behav-ior in the rat. Brain Res 1999; 829: 209-221
2 Winkelstein BA, Deleo JA. Nerve root injury severity differ-entially modulates spinal glial activation in a rat lumbarradiculopathy model: considerations for persistent pain. BrainRes 2002; 956: 294-301
3 Wang Y, Qiu JY, Duan L, Chen LW, Rao ZR. Expression ofGFAP in rat brain stem astrocytes induced by stomachicnociception and relationship to neurons. Zhongguo Zuzhi
Sun YN et al. GFAP and Fos IR in spinal cord and medulla oblongata 4831
Huaxue He Xibao Huaxue Zazhi 2001; 10: 219-2234 Stephenson JL, Byers MR. GFAP immunoreactivity in trigemi-
nal ganglion satellite cells after tooth injury in rats. Exp Neurol1995; 131: 11-22
5 Zhou SY, Mei QB, Liu L, Guo X, Qiu BS, Zhao DH, Cho CH.Delivery of glucocorticoid conjugate in rat gastrointestinaltract and its treatment for ulcerative colitis. Acta PharmacolSin 2001; 22: 761-764
6 Camilleri M, Coulie B, Tack JF. Visceral hypersensitivity:facts, speculations, and challenges. Gut 2001; 48: 125-131
7 Traub RJ, Murphy A. Colonic inflammation induces fos ex-pression in the thoracolumbar spinal cord increasing activityin the spinoparabrachial pathway. Pain 2002; 95: 93-102
8 Rao ZR, Ju G. Morphology of the medullary visceral zone.Chinese Science Bulletin 1999; 44: 1-10
9 Watkins LR, Martin D, Ulrich P, Tracey KJ, Maier SF. Evidencefor the involvement of spinal cord glia in subcutaneous formalininduced hyperalgesia in the rat. Pain 1997; 71: 225-235
10 Colburn RW, Rickman AJ, Deleo JA. The effect of site andtype of nerve injury on spinal glial activation and neuropathicpain behavior. Exp Neurol 1999; 157: 289-304
11 Medhurst SJ, Walker K, Bowes M, Kidd BL, Glatt M, MullerM, Hattenberger M, Vaxelaire J, O’Reilly T, Wotherspoon G,Winter J, Green J, Urban L. A rat model of bone cancer pain.Pain 2002; 96: 129-140
12 Ma W, Quirion R. Partial sciatic nerve ligation induces in-crease in the phosphorylation of extracellular signal-regulatedkinase (ERK) and c-Jun N-terminal kinase (JNK) in astrocytesin the lumbar spinal dorsal horn and the gracile nucleus. Pain2002; 99: 175-184
13 Ramer MS, Kawaja MD, Henderson JT, Roder JC, Bisby MA.Glial overexpression of NGF enhances neuropathic pain andadrenergic sprouting into DRG following chronic sciatic con-
striction in mice. Neurosci Lett 1998; 251: 53-5614 Hashizume H, Deleo JA, Colburn RW, Weinstein JN. Spinal
glial activation and cytokine expression after lumbar rootinjury in the rat. Spine 2000; 25: 1206-1217
15 Chudler EH, Anderson LC, Byers MR. Trigeminal ganglionneuronal activity and glial fibrillary acidic protein immuonr-eactivity after inferior alveolar nerve crush in the adult rat.Pain 1997; 73: 141-149
16 Lu Y, Westlund KN. Effects of baclofen on colon inflamma-tion-induced Fos, CGRP and SP expresson in spinal cord andbrainstem. Brain Res 2001; 889: 118-130
17 Dai Y, Iwata K, Kondo E, Morimoto T, Noguchi K. A selec-tive increase in Fos expression in spinal dorsal horn neuronsfollowing graded thermal stimulation in rats with experimen-tal mononeuropathy. Pain 2001; 90: 287-296
18 Imbe H, Iwata K, Zhou QQ, Zou S, Dubner R, Ren K. Orofacialdeep and cutaneous tissue inflammation and trigeminal neu-ronal activation. Implications forpersis temporomandibulorpain. Cell Tis Org 2001; 169: 238-247
19 Abbadie C, Besson JM. C-fos expression in rat lumbar spinalcord following peripheral stimulation in adjuvant-inducedarthritic and normal rats. Brain Res 1993; 607: 195-204
20 Yamazaki Y, Maeda T, Someya G, Wakisaka S. Temporaland spatial distribution of Fos protein in the lumbar spinaldorsal horn neurons in the rat with chronic constriction injuryto the sciatic nerve. Brain Res 2001; 914: 106-114
21 Zimmerman M, Herdegen T. Plasticity of the nervous systemat the systemic, cellular and molecular levels: a mechanism ofchronic pain and hyperalgesia. Prog Brain Res 1996; 110: 233-259
22 Colburn RW, Deleo JA, Rickman AJ, Yeager MP, Kwon P,Hickey WF. Dissociation of microglial activation and neuro-pathic pain behaviors following peripheral nerve injury in therat. J Neuroimmunol 1997; 79: 163-175
Science Editor Zhu LH and Guo SY Language Editor Elsevier HK
4832 ISSN 1007-9327 CN 14-1219/ R World J Gastroenterol August 21, 2005 Volume 11 Number 31
• CLINICAL RESEARCH •
Crohn’s disease in Japanese is associated with a SNP-haplotype
of N-acetyltransferase 2 gene
Haruhisa Machida, Kazuhiro Tsukamoto, Chun-Yang Wen, Saburou Shikuwa, Hajime Isomoto, Yohei Mizuta, Fuminao
Takeshima, Kunihiko Murase, Naomichi Matsumoto, Ikuo Murata, Shigeru Kohno, Chen-Yang Wen
ELSEVIER
PO Box 2345, Beijing 100023, China World J Gastroenterol 2005;11(31):4833-4837www.wjgnet.com World Journal of Gastroenterology ISSN [email protected] © 2005 The WJG Press and Elsevier Inc. All rights reserved.
Haruhisa Machida, Hajime Isomoto, Yohei Mizuta, FuminaoTakeshima, Kunihiko Murase, Shigeru Kohno, Second Departmentof Internal Medicine, Nagasaki University School of Medicine, 1-7-1Sakamoto, Nagasaki 852-8501, JapanKazuhiro Tsukamoto, Ikuo Murata, Department of Pharmaco-therapeutics, Nagasaki University Graduate School of BiomedicalSciences, 1-14 Bunkyo-machi, Nagasaki 852-8521, JapanChun-Yang Wen, Department of Molecular Pathology, AtomicBomb Disease Institute, Nagasaki University Graduate School ofBiomedical Sciences, 1-12-4 Sakamoto, Nagasaki 852-8523, JapanChen-Yang Wen, Department of Digestive Disease, The AffiliatedDrum Tower Hospital of Nanjing University Medical School, Nanjing210008, Jiangsu Province, ChinaSaburou Shukuwa, Department of Gastroenterology, NationalHospital Organization Nagasaki Medical Center, 2-1001-1 Kubara,Omura 856-8562, JapanNaomichi Matsumoto, Department of Human Genetics, NagasakiUniversity Graduate School of Biomedical Sciences, 1-12-4 Sakamoto,Nagasaki 852-8523, JapanKazuhiro Tsukamoto, Naomichi Matsumoto, CREST, JST,Kawaguchi, JapanCorrespondence to: Kazuhiro Tsukamoto, MD, PhD, Departmentof Pharmacotherapeutics, Nagasaki University Graduate School ofBiomedical Sciences, 1-14 Bunkyo-machi, Nagasaki 852-8521,Japan. [email protected]: +81-95-819-2448 Fax: +81-95-819-2895Received: 2004-12-20 Accepted: 2004-12-30
AbstractAbstractAbstractAbstractAbstract
AIM: To investigate the frequency and distribution ofN-acetyltransferase 2 (NAT2) and uridine 5’-diphosphate(UDP)-glucuronosyltransferase 1A7 (UGT1A7) genes inpatients with ulcerative colitis (UC) and Crohn’s disease (CD).
METHODS: Frequencies and distributions of NAT2 andUGT1A7 SNPs as well as their haplotypes were investigatedin 95 patients with UC, 60 patients with CD, and 200gender-matched, unrelated, healthy, control volunteersby PCR-restriction fragment length polymorphism (RFLP),PCR-denaturing high-performance liquid chromatography(DHPLC), and direct DNA sequencing.
RESULTS: Multiple logistic regression analysis revealedthat the frequency of haplotype, NAT2*7B, significantlyincreased in CD patients, compared to that in controls(P = 0.0130, OR = 2.802, 95%CI = 1.243-6.316). However,there was no association between NAT2 haplotypes andUC, or between any UGT1A7 haplotypes and inflammatorybowel disease (IBD).
CONCLUSION: It is likely that the NAT2 gene is one of
the determinants for CD in Japanese. Alternatively, a newCD determinant may exist in the 8p22 region, where NAT2
is located.
© 2005 The WJG Press and Elsevier Inc. All rights reserved.
Key words: Crohn’s disease; N-acetyltransferase 2 gene;Polymorphism; Disease-susceptible gene; Associationstudy; Japanese population
Machida H, Tsukamoto K, Wen CY, Shikuwa S, Isomoto H,Mizuta Y, Takeshima F, Murase K, Matsumoto N, Murata I,Kohno S, Wen CY. Crohn’s disease in Japanese is associatedwith a SNP-haplotype of N-acetyltransferase 2 gene. World
J Gastroenterol 2005; 11(31): 4833-4837
http://www.wjgnet.com/1007-9327/11/4833.asp
INTRODUCTIONINTRODUCTIONINTRODUCTIONINTRODUCTIONINTRODUCTION
Chronic inflammatory bowel disease (IBD) is a multi-factorialdisorder characterized by non-specific inflammation of thegastrointestinal tract with an increase in the permeability toxenobiotics in the intestinal mucosa, finally resulting in intestinalmalabsorption and immune defense abnormalities[1,2].Ulcerative colitis (UC) and Crohn’s disease (CD) are themajor forms of IBD. Although the precise etiology of IBDremains unknown, not only several environmental factors,such as dietary components and microorganisms, but alsogenetic factors may contribute to the occurrence of thisdisorder[3,4]. Recently, extensive molecular genetic studieshave been launched to identify genes underlying the etiology[5].One of them is the caspase activating recruitment domain15/nucleotide oligomerization domain 2 gene (CARD15/
NOD2) located at 16q12. Although mutations in NOD2
are observed frequently in Caucasian patients with CD, butnot with UC[6,7], they have rarely been found in JapaneseCD patients[8,9], suggesting that NOD2 is not a majordeterminant for CD in Japanese.
We have particularly focused on genes for N-acetyltransferase 2 (NAT2) and uridine 5’-diphosphate(UDP)-glucuronosyltransferase 1A7 (UGT1A7) as candidatessusceptible to IBD, because they are expressed in thegastrointestinal tract and play a role in biochemical barriersagainst internal and external xenobiotics[10-12]. Diminutionor disturbance of these barriers might result in increasedpermeability to xenobiotics in the gastrointestinal tract, andsubsequently their accumulation in the body, probably leadingto the development of IBD. N-acetyltransferases (NATs)
4834 ISSN 1007-9327 CN 14-1219/ R World J Gastroenterol August 21, 2005 Volume 11 Number 31
are the enzymes catalyzing N-acetylation (deactivation) ofa variety of carbocyclic and heterocyclic arylamines bymeans of transferring acetyl-CoA to the amino or hydroxylside chain of arylamines in metabolism of the phase IIreaction[10]. NATs are encoded by two genes, NAT1 andNAT2, both are located at 8p22. NAT1 is ubiquitouslyexpressed, while the expression of NAT2 is confined tothe gastrointestinal tract and liver[10]. The UDP-glucuronosyl-transferase 1 family genes located at 2q37 consist of ninefunctional genes, UGT1A1, UGT1A3-10, which catalyzethe glucuronidation of small lipophilic agents by means ofconversion of hydrophobic substrates to inactive hydrophilicUDP-glucuronides, and are expressed in a tissue-specificfashion in the gastrointestinal tract and liver. In particular,UGT1A7 is expressed exclusively in the gastrointestinal tractand lung, but not in the liver[13-15]. The degree of metabolismwith regard to both NAT2 and UGT1A7 varies amongindividuals, suggesting the presence of genetic variationscontributing to the metabolic activation capacity. Currentstudies have shown an association between NAT2 orUGT1A7 polymorphisms and various diseases, i.e., systemicsclerosis and systemic lupus erythematosus [16], drugtoxicity[17,18], orolaryngeal cancer[19], esophageal cancer[20],colorectal cancer[21,22], pancreas cancer[23], hepatocellularcarcinoma[15,24], or bladder cancer[25].
Here we report the results of studies on associationbetween NAT2 or UGT1A7 and IBD in Japanese usingsix and three polymorphic haplotypes in the two genes,respectively.
MAMAMAMAMATERIALS AND METHODSTERIALS AND METHODSTERIALS AND METHODSTERIALS AND METHODSTERIALS AND METHODS
SubjectsThe subjects studied comprised 95 patients with UC, 60patients with CD, and 200 gender-matched, unrelated, healthyvolunteers, and were further characterized as listed inTable 1. All participants were Japanese, who were randomlyrecruited from eight general health clinics in the Nagasakiarea in Japan. The study protocol was approved by theCommittee for the Ethical Issue on Human Genome andGene Analysis in Nagasaki University, and written informedconsent was obtained from each participant. Diagnosis ofIBD was made according to endoscopic, radiological,histological, and clinical criteria provided by both the Councilfor International Organizations of Medical Sciences inWHO and the International Organization for the Study ofInflammatory Bowel Disease[26-28]. Patients with indeterminatecolitis, multiple sclerosis, systemic lupus erythematosus, orother recognized autoimmune diseases were excluded fromthe subjects studied.
Determination of NAT2 polymorphismsGenomic DNA was extracted from peripheral whole bloodof each individual using the DNA Extractor WB-rapid Kit(Wako, Osaka, Japan) according to the manufacturer’sprotocol. Single nucleotide polymorphisms (SNPs) of NAT2
deposited in SNP-database[29] were determined with thePCR-restriction fragment length polymorphism (RFLP)method using primer pairs and protocol described by Leffet al.[30]. The PCR-RFLP method was modified in order todistinguish among all known NAT2 SNPs[29]. In brief,polymorphic region in NAT2 was amplified by PCR with aGeneAmp PCR system 9700 thermal cycler (AppliedBiosystems, Foster City, CA, USA) using 250 ng of genomicDNA in a 50-µL reaction containing 10 mmol/L Tris-HCl,pH 8.3, 50 mmol/L KCl, 1.5 mmol/L MgCl2, 0.2 mmol/Leach dNTP, 500 ng of forward primer: 5’-GGCTATAA-GAACTCTAGGAAC-3’, 500 ng of reverse primer: 5’-AAGGGTTTATTTTGTTCCTTATTCTAAAT-3’, and2.0 U Taq DNA polymerase. The amplification protocolcomprised initial denaturation at 94 for 5 min; 35 cyclesof denaturation at 94 for 30 s, annealing at 55 for30 s, and extension at 72 for 30 s; and a final extensionat 72 for 5 min. PCR product of 896 bp was digestedby restriction enzymes (TaKaRa Biomedical, Shiga, Japan).Three SNPs, C190T, G191A, and A434C, were detectedby digestion with MspI. Likewise, C282T, C481T, or G857Awas detected by digestion with FokI, KpnI, or BamHI,respectively. T111C, G590A, and C759T were detected bydigestion with TaqI. These fragments were subjected toelectrophoresis on 2% agarose or 5% polyacrylamide gel,and visualized with UV transilluminator (Alpha Innotech,CA, USA) after ethidium bromide staining. Moreover,T341C, A803G, and A845C were detected by furthernested PCR. Amplified NAT2 product (1 µL) was used as atemplate in a 25-µL reaction containing 10 mmol/L Tris-HCl,pH 8.3, 50 mmol/L KCl, 1.5 mmol/L MgCl2, 0.2 mmol/Leach dNTP, 250 ng of forward primer: 5’-CACCTTCT-CCTGCAGGTGACCG-3’ and reverse primer: 5’-TGTCAAGCAGAAAATGCAAGGC-3’ for T341C andA803G, or 250 ng of forward primer: 5’-TGAGGAA-GAGGTTGAAGAAGTGCT-3’ and reverse primer: 5’-AAGGGTTTATTTTGTTCCTTATTCTAAAT-3’ forA845C, and 0.5 U Taq DNA polymerase. The amplificationprotocol comprised initial denaturation at 94 for 5 min;35 cycles of denaturation at 94 for 30 s, annealing at62 for 30 s, and extension at 72 for 30 s; and a finalextension at 72 for 5 min. The former nested PCRproducts were digested with AciI and DdeI (New EnglandBioLabs Inc., MA, USA) to detect T341C and A803G,respectively. The latter products were digested withDraIII (New England BioLabs Inc.) to detect A845C. Allthese products were subjected to electrophoresis on 6%polyacrylamide gel, and visualized as described above.
Determination of UGT1A7 polymorphismsFour SNPs have been known within UGT1A7-exon 1[15]. ASNP at codon 11 is a silent mutation. SNPs at codons 129and 131 lying in a linkage disequilibrium (LD) block weredetected by PCR-denaturing high-performance liquidchromatography (DHPLC) with an automated HPLC
Table 1 Clinical characteristics of study subjects
DiseaseCharacteristic Control
UC CD
Number of subjects 95 60 200Age range (yr) 14–83 17–75 20–60Age (mean±SD) 44.4±16.4b 35.0±12.6 32.5±11.1Male/female (%) 53 (55.8)/42 (44.2) 35 (58.3)/25 (41.7) 125 (62.5)/75 (37.5)
bP<0.01 vs control.
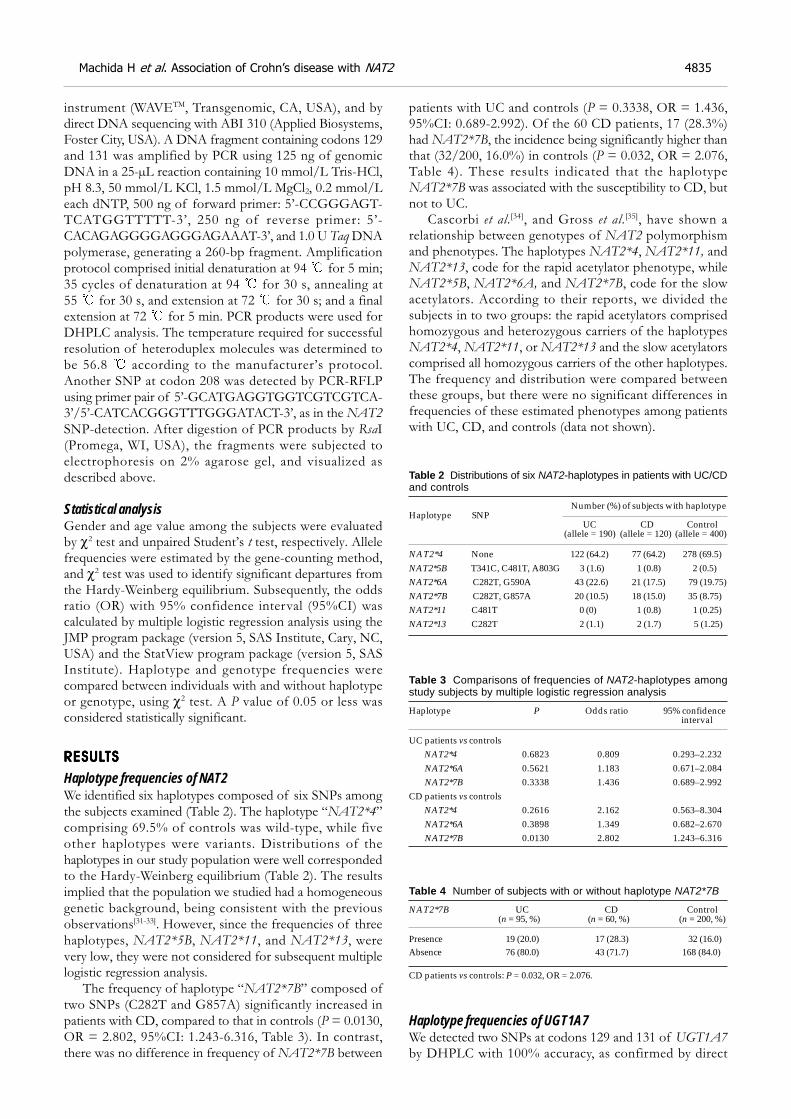
Machida H et al. Association of Crohn’s disease with NAT2 4835
instrument (WAVETM, Transgenomic, CA, USA), and bydirect DNA sequencing with ABI 310 (Applied Biosystems,Foster City, USA). A DNA fragment containing codons 129and 131 was amplified by PCR using 125 ng of genomicDNA in a 25-µL reaction containing 10 mmol/L Tris-HCl,pH 8.3, 50 mmol/L KCl, 1.5 mmol/L MgCl2, 0.2 mmol/Leach dNTP, 500 ng of forward primer: 5’-CCGGGAGT-TCATGGTTTTT-3’, 250 ng of reverse primer: 5’-CACAGAGGGGAGGGAGAAAT-3’, and 1.0 U Taq DNApolymerase, generating a 260-bp fragment. Amplificationprotocol comprised initial denaturation at 94 for 5 min;35 cycles of denaturation at 94 for 30 s, annealing at55 for 30 s, and extension at 72 for 30 s; and a finalextension at 72 for 5 min. PCR products were used forDHPLC analysis. The temperature required for successfulresolution of heteroduplex molecules was determined tobe 56.8 according to the manufacturer’s protocol.Another SNP at codon 208 was detected by PCR-RFLPusing primer pair of 5’-GCATGAGGTGGTCGTCGTCA-3’/5’-CATCACGGGTTTGGGATACT-3’, as in the NAT2
SNP-detection. After digestion of PCR products by RsaI(Promega, WI, USA), the fragments were subjected toelectrophoresis on 2% agarose gel, and visualized asdescribed above.
Statistical analysisGender and age value among the subjects were evaluatedby χ2 test and unpaired Student’s t test, respectively. Allelefrequencies were estimated by the gene-counting method,and χ2 test was used to identify significant departures fromthe Hardy-Weinberg equilibrium. Subsequently, the oddsratio (OR) with 95% confidence interval (95%CI) wascalculated by multiple logistic regression analysis using theJMP program package (version 5, SAS Institute, Cary, NC,USA) and the StatView program package (version 5, SASInstitute). Haplotype and genotype frequencies werecompared between individuals with and without haplotypeor genotype, using χ2 test. A P value of 0.05 or less wasconsidered statistically significant.
RESULRESULRESULRESULRESULTSTSTSTSTS
Haplotype frequencies of NAT2We identified six haplotypes composed of six SNPs amongthe subjects examined (Table 2). The haplotype “NAT2*4”comprising 69.5% of controls was wild-type, while fiveother haplotypes were variants. Distributions of thehaplotypes in our study population were well correspondedto the Hardy-Weinberg equilibrium (Table 2). The resultsimplied that the population we studied had a homogeneousgenetic background, being consistent with the previousobservations[31-33]. However, since the frequencies of threehaplotypes, NAT2*5B, NAT2*11, and NAT2*13, werevery low, they were not considered for subsequent multiplelogistic regression analysis.
The frequency of haplotype “NAT2*7B” composed oftwo SNPs (C282T and G857A) significantly increased inpatients with CD, compared to that in controls (P = 0.0130,OR = 2.802, 95%CI: 1.243-6.316, Table 3). In contrast,there was no difference in frequency of NAT2*7B between
patients with UC and controls (P = 0.3338, OR = 1.436,95%CI: 0.689-2.992). Of the 60 CD patients, 17 (28.3%)had NAT2*7B, the incidence being significantly higher thanthat (32/200, 16.0%) in controls (P = 0.032, OR = 2.076,Table 4). These results indicated that the haplotypeNAT2*7B was associated with the susceptibility to CD, butnot to UC.
Cascorbi et al.[34], and Gross et al.[35], have shown arelationship between genotypes of NAT2 polymorphismand phenotypes. The haplotypes NAT2*4, NAT2*11, andNAT2*13, code for the rapid acetylator phenotype, whileNAT2*5B, NAT2*6A, and NAT2*7B, code for the slowacetylators. According to their reports, we divided thesubjects in to two groups: the rapid acetylators comprisedhomozygous and heterozygous carriers of the haplotypesNAT2*4, NAT2*11, or NAT2*13 and the slow acetylatorscomprised all homozygous carriers of the other haplotypes.The frequency and distribution were compared betweenthese groups, but there were no significant differences infrequencies of these estimated phenotypes among patientswith UC, CD, and controls (data not shown).
Table 2 Distributions of six NAT2-haplotypes in patients with UC/CDand controls
Number (%) of subjects with haplotypeHaplotype SNP
UC CD Control (allele = 190) (allele = 120) (allele = 400)
NAT2*4 None 122 (64.2) 77 (64.2) 278 (69.5)NAT2*5B T341C, C481T, A803G 3 (1.6) 1 (0.8) 2 (0.5)NAT2*6A C282T, G590A 43 (22.6) 21 (17.5) 79 (19.75)NAT2*7B C282T, G857A 20 (10.5) 18 (15.0) 35 (8.75)NAT2*11 C481T 0 (0) 1 (0.8) 1 (0.25)NAT2*13 C282T 2 (1.1) 2 (1.7) 5 (1.25)
Table 3 Comparisons of frequencies of NAT2-haplotypes amongstudy subjects by multiple logistic regression analysis
Haplotype P Odds ratio 95% confidence interval
UC patients vs controls NAT2*4 0.6823 0.809 0.293–2.232 NAT2*6A 0.5621 1.183 0.671–2.084 NAT2*7B 0.3338 1.436 0.689–2.992CD patients vs controls NAT2*4 0.2616 2.162 0.563–8.304 NAT2*6A 0.3898 1.349 0.682–2.670 NAT2*7B 0.0130 2.802 1.243–6.316
Table 4 Number of subjects with or without haplotype NAT2*7B
NAT2*7B UC CD Control (n = 95, %) (n = 60, %) (n = 200, %)
Presence 19 (20.0) 17 (28.3) 32 (16.0)Absence 76 (80.0) 43 (71.7) 168 (84.0)
CD patients vs controls: P = 0.032, OR = 2.076.
Haplotype frequencies of UGT1A7We detected two SNPs at codons 129 and 131 of UGT1A7
by DHPLC with 100% accuracy, as confirmed by direct
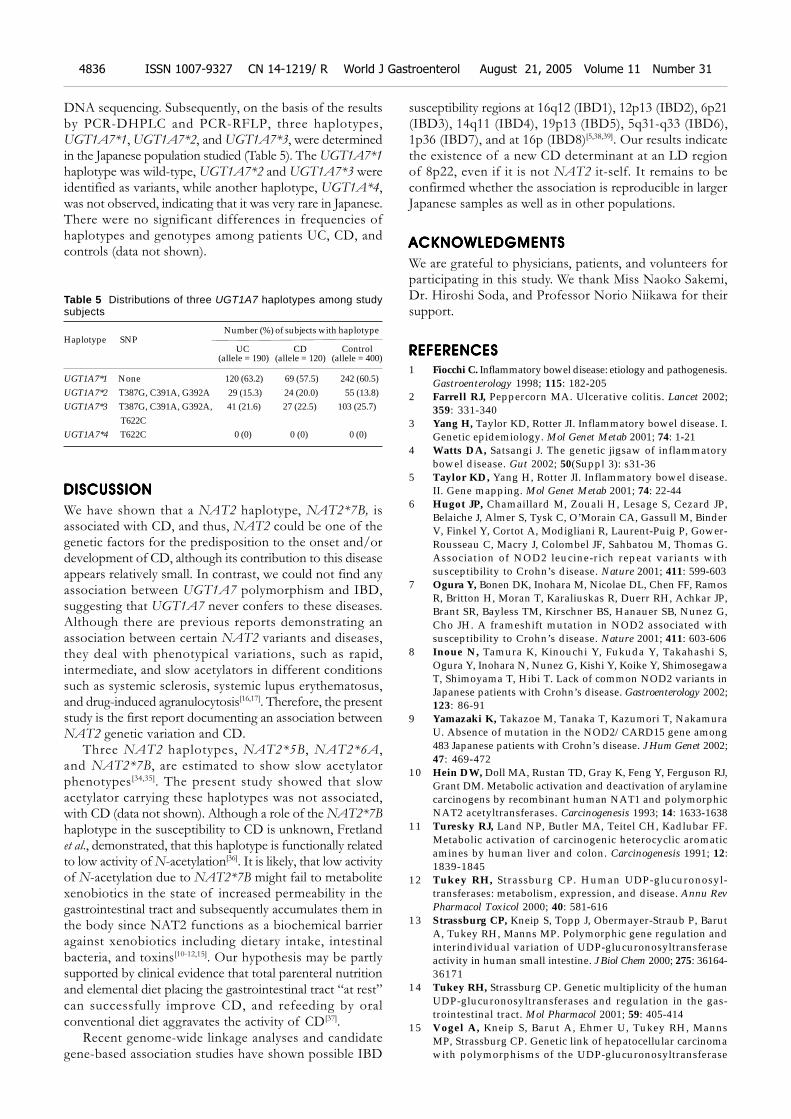
DNA sequencing. Subsequently, on the basis of the resultsby PCR-DHPLC and PCR-RFLP, three haplotypes,UGT1A7*1, UGT1A7*2, and UGT1A7*3, were determinedin the Japanese population studied (Table 5). The UGT1A7*1
haplotype was wild-type, UGT1A7*2 and UGT1A7*3 wereidentified as variants, while another haplotype, UGT1A*4,was not observed, indicating that it was very rare in Japanese.There were no significant differences in frequencies ofhaplotypes and genotypes among patients UC, CD, andcontrols (data not shown).
Table 5 Distributions of three UGT1A7 haplotypes among studysubjects
Number (%) of subjects with haplotypeHaplotype SNP
UC CD Control (allele = 190) (allele = 120) (allele = 400)
UGT1A7*1 None 120 (63.2) 69 (57.5) 242 (60.5)UGT1A7*2 T387G, C391A, G392A 29 (15.3) 24 (20.0) 55 (13.8)UGT1A7*3 T387G, C391A, G392A, 41 (21.6) 27 (22.5) 103 (25.7)
T622CUGT1A7*4 T622C 0 (0) 0 (0) 0 (0)
DISCUSSIONDISCUSSIONDISCUSSIONDISCUSSIONDISCUSSION
We have shown that a NAT2 haplotype, NAT2*7B, isassociated with CD, and thus, NAT2 could be one of thegenetic factors for the predisposition to the onset and/ordevelopment of CD, although its contribution to this diseaseappears relatively small. In contrast, we could not find anyassociation between UGT1A7 polymorphism and IBD,suggesting that UGT1A7 never confers to these diseases.Although there are previous reports demonstrating anassociation between certain NAT2 variants and diseases,they deal with phenotypical variations, such as rapid,intermediate, and slow acetylators in different conditionssuch as systemic sclerosis, systemic lupus erythematosus,and drug-induced agranulocytosis[16,17]. Therefore, the presentstudy is the first report documenting an association betweenNAT2 genetic variation and CD.
Three NAT2 haplotypes, NAT2*5B, NAT2*6A ,and NAT2*7B, are estimated to show slow acetylatorphenotypes[34,35]. The present study showed that slowacetylator carrying these haplotypes was not associated,with CD (data not shown). Although a role of the NAT2*7B
haplotype in the susceptibility to CD is unknown, Fretlandet al., demonstrated, that this haplotype is functionally relatedto low activity of N-acetylation[36]. It is likely, that low activityof N-acetylation due to NAT2*7B might fail to metabolitexenobiotics in the state of increased permeability in thegastrointestinal tract and subsequently accumulates them inthe body since NAT2 functions as a biochemical barrieragainst xenobiotics including dietary intake, intestinalbacteria, and toxins[10-12,15]. Our hypothesis may be partlysupported by clinical evidence that total parenteral nutritionand elemental diet placing the gastrointestinal tract “at rest”can successfully improve CD, and refeeding by oralconventional diet aggravates the activity of CD[37].
Recent genome-wide linkage analyses and candidategene-based association studies have shown possible IBD
susceptibility regions at 16q12 (IBD1), 12p13 (IBD2), 6p21(IBD3), 14q11 (IBD4), 19p13 (IBD5), 5q31-q33 (IBD6),1p36 (IBD7), and at 16p (IBD8)[5,38,39]. Our results indicatethe existence of a new CD determinant at an LD regionof 8p22, even if it is not NAT2 it-self. It remains to beconfirmed whether the association is reproducible in largerJapanese samples as well as in other populations.
ACKNOWLEDGMENTSACKNOWLEDGMENTSACKNOWLEDGMENTSACKNOWLEDGMENTSACKNOWLEDGMENTS
We are grateful to physicians, patients, and volunteers forparticipating in this study. We thank Miss Naoko Sakemi,Dr. Hiroshi Soda, and Professor Norio Niikawa for theirsupport.
REFERENCESREFERENCESREFERENCESREFERENCESREFERENCES
1 Fiocchi C. Inflammatory bowel disease: etiology and pathogenesis.Gastroenterology 1998; 115: 182-205
2 Farrell RJ, Peppercorn MA. Ulcerative colitis. Lancet 2002;359: 331-340
3 Yang H, Taylor KD, Rotter JI. Inflammatory bowel disease. I.Genetic epidemiology. Mol Genet Metab 2001; 74: 1-21
4 Watts DA, Satsangi J. The genetic jigsaw of inflammatorybowel disease. Gut 2002; 50(Suppl 3): s31-36
5 Taylor KD, Yang H, Rotter JI. Inflammatory bowel disease.II. Gene mapping. Mol Genet Metab 2001; 74: 22-44
6 Hugot JP, Chamaillard M, Zouali H, Lesage S, Cezard JP,Belaiche J, Almer S, Tysk C, O’Morain CA, Gassull M, BinderV, Finkel Y, Cortot A, Modigliani R, Laurent-Puig P, Gower-Rousseau C, Macry J, Colombel JF, Sahbatou M, Thomas G.Association of NOD2 leucine-rich repeat variants withsusceptibility to Crohn’s disease. Nature 2001; 411: 599-603
7 Ogura Y, Bonen DK, Inohara M, Nicolae DL, Chen FF, RamosR, Britton H, Moran T, Karaliuskas R, Duerr RH, Achkar JP,Brant SR, Bayless TM, Kirschner BS, Hanauer SB, Nunez G,Cho JH. A frameshift mutation in NOD2 associated withsusceptibility to Crohn’s disease. Nature 2001; 411: 603-606
8 Inoue N, Tamura K, Kinouchi Y, Fukuda Y, Takahashi S,Ogura Y, Inohara N, Nunez G, Kishi Y, Koike Y, ShimosegawaT, Shimoyama T, Hibi T. Lack of common NOD2 variants inJapanese patients with Crohn’s disease. Gastroenterology 2002;123: 86-91
9 Yamazaki K, Takazoe M, Tanaka T, Kazumori T, NakamuraU. Absence of mutation in the NOD2/CARD15 gene among483 Japanese patients with Crohn’s disease. J Hum Genet 2002;47: 469-472
10 Hein DW, Doll MA, Rustan TD, Gray K, Feng Y, Ferguson RJ,Grant DM. Metabolic activation and deactivation of arylaminecarcinogens by recombinant human NAT1 and polymorphicNAT2 acetyltransferases. Carcinogenesis 1993; 14: 1633-1638
11 Turesky RJ, Land NP, Butler MA, Teitel CH, Kadlubar FF.Metabolic activation of carcinogenic heterocyclic aromaticamines by human liver and colon. Carcinogenesis 1991; 12:1839-1845
12 Tukey RH, Strassburg CP. Human UDP-glucuronosyl-transferases: metabolism, expression, and disease. Annu RevPharmacol Toxicol 2000; 40: 581-616
13 Strassburg CP, Kneip S, Topp J, Obermayer-Straub P, BarutA, Tukey RH, Manns MP. Polymorphic gene regulation andinterindividual variation of UDP-glucuronosyltransferaseactivity in human small intestine. J Biol Chem 2000; 275: 36164-36171
14 Tukey RH, Strassburg CP. Genetic multiplicity of the humanUDP-glucuronosyltransferases and regulation in the gas-trointestinal tract. Mol Pharmacol 2001; 59: 405-414
15 Vogel A, Kneip S, Barut A, Ehmer U, Tukey RH, MannsMP, Strassburg CP. Genetic link of hepatocellular carcinomawith polymorphisms of the UDP-glucuronosyltransferase
4836 ISSN 1007-9327 CN 14-1219/ R World J Gastroenterol August 21, 2005 Volume 11 Number 31
UGT1A7 gene. Gastroenterology 2001; 121: 1136-114416 von Schmiedeberg S, Fritsche E, Rönnau AC, Specker C,
Golka K, Richter-Hintz D, Schuppe HC, Lehmann P, RuzickaT, Esser C, Abel J, Gleichmann E. Polymorphisms of thexenobiotic-metabolizing enzymes CYP1A1 and NAT-2 insystemic sclerosis and lupus erythematosus. Adv Exp MedBiol 1999; 455: 147-152
17 Wadelius M, Stjernberg E, Wiholm BE, Rane A. Polymor-phisms of NAT2 in relation to sulphasalazine-inducedagranulocytosis. Pharmacogenetics 2000; 10: 35-41
18 Huang YS, Chern HD, Su WJ, Wu JC, Lai SL, Yang SY, ChangFY, Lee SD. Polymorphism of the N-acetyltransferase 2 geneas a susceptibility risk factor for antituberculosis drug-in-duced hepatitis. Hepatology 2002; 35: 883-889
19 Zheng Z, Park JY, Guillemette C, Schantz SP, Lazarus P.Tobacco carcinogen-detoxifying enzyme UGT1A7 and its as-sociation with orolaryngeal cancer risk. J Natl Cancer Inst 2001;93: 1411-1418
20 Strassburg CP, Strassburg A, Nguyen N, Li Q, Manns MP,Tukey RH. Regulation and function of family 1 and family 2UDP-glucuronosyltransferase genes (UGT1A, UGT2B) inhuman oesophagus. Biochm J 1999: 338: 489-498
21 Brockton N, Little J, Sharp L, Cotton SC. N-acetyltransferasepolymorphisms and colorectal cancer: a HuGE review. Am JEpidemiol 2000; 151: 846-861
22 Strassburg CP, Vogel A, Kneip S, Tukey RH, Manns MP.Polymorphisms of the human UDP-glucuronosyltransferase(UGT) 1A7 gene in colorectal cancer. Gut 2002; 50: 851-856
23 Ockenga J, Vogel A, Teich N, Keim V, Manns MP, StrassburgCP. UDP glucuronosyltransferase (UGT1A7) gene polymor-phisms increase the risk of chronic pancreatitis and pancre-atic cancer. Gastroenterology 2003; 124: 1802-1808
24 Huang YS, Chern HD, Wu JC, Chao Y, Huang YH, Chang FY,Lee SD. Polymorphism of the N-acetyltransferase 2 gene, redmeat intake, and the susceptibility of hepatocellular carcinoma.Am J Gastroenterol 2003; 98: 1417-1422
25 Risch A, Wallace DM, Bathers S, Sim E. Slow N-acetylationgenotype is a susceptibility factor in occupational and smok-ing related bladder cancer. Hum Mol Genet 1995; 4: 231-236
26 Podolsky DK. Inflammatory bowel disease (1). N Eng J Med1991; 325: 928-937
27 Podolsky DK. Inflammatory bowel disease (2). N Eng J Med1991; 325: 1008-1016
28 Lennard-Jones JE. Classification of inflammatory boweldisease. Scand J Gastroenterol 1989; 170: 2-6
29 http://www.louisville.edu/medschool/pharmacology/
NAT2.html/30 Leff MA, Fretland AJ, Doll MA, Hein DW. Novel human N-
acetyltransferase 2 alleles that differ in mechanism for slowacetylator phenotype. J Biol Chem 1999; 274: 34519-34522
31 Sekine A, Saito S, Iida A, Mitsunobu Y, Higuchi S, HarigaeS, Nakamura Y. Identification of single-nucleotide polymor-phisms (SNPs) of human N-acetyltransferase genes NAT1,NAT2, AANAT, ARD1 and L1CAM in the Japanesepopulation. J Hum Genet 2001; 46: 314-319
32 Yokogawa K, Nakaharu T, Ishizaki J, Ozaki E, Takeda Y,Mabuchi H, Matsushita R, Kimura K, Nakashima E, IchimuraF, Miyamoto K. Kinetic phenotypic diagnosis of N-acetyla-tion polymorphism in patients based on ratio of urinary me-tabolites of salicylazosulfapyridine. Int J Pharm 2001; 229:183-191
33 Ando M, Ando Y, Sekido Y, Ando M, Shimokata K, HasegawaY. Genetic polymorphisms of the UDP-glucuronosyltransferase1A7 gene and irinotecan toxicity in Japanese cancer patients.Jpn J Canceer Res 2002; 93: 591-597
34 Cascorbi I, Drakoulis N, Bröckmoller J, Maurer A, SperlingK, Roots I. Arylamine N-acetyltransferase (NAT2) mutationsand their allelic linkage in unrelated Caucasian individuals:correlation with phenotypic activity. Am J Hum Genet 1995;57: 581-592
35 Gross M, Kruisselbrink T, Anderson K, Lang N, McGovern P,Delongchamp R, Kadlubar F. Distribution and concordanceof N-acetyltransferase genotype and phenotype in an Americanpopulation. Cancer Epidemiol Biomarkrs Prev 1999; 8: 683-692
36 Fretland AJ, Leff MA, Doll MA, Hein DW. Functional char-acterization of human N-acetyltransferase 2 (NAT2) singlenucleotide polymorphisms. Pharmacogenetics 2001; 11: 207-215
37 Glickman RM. Inflammatory bowel diseases: ulcerative coli-tis and Crohn’s disease. In: Isselbacher KJ, Braunwald E, WilsonJD, eds. Harrison’s principles of internal medicine, 13th ed.New York: McGraw-Hill, Inc 1994: 1403-1417
38 Cho JH, Nicolae DL, Ramos R, Fields CT, Rabenau K,Corradino S, Brant SR, Espinosa R, LeBeau M, Hanauer SB,Bodzin J, Bonen DK. Linkage and linkage disequilibrium inchromosome band 1p36 in American Chaldeans with inflam-matory bowel disease. Hum Mol Genet 2000; 9: 1425-1432
39 Hampe J, Frenzel H, Mirza MM, Croucher PJ, Cuthbert A,Mascheretti S, Huse K, Platzer M, Bridger S, Meyer B, NurnbergP, Stokkers P, Krawczak M, Mathew CG, Curran M, SchreiberS. Evidence for a NOD2-independent susceptibility locus forinflammatory bowel disease on chromosome 16p. Proc NatlAcad Sci USA 2002; 99: 321-326
Science Editor Wang XL and Guo SY Language Editor Elsevier HK
Machida H et al. Association of Crohn’s disease with NAT2 4837
• CLINICAL RESEARCH •
Sonographic fatty liver, overweight and ischemic heart disease
Yu-Cheng Lin, Huey-Ming Lo, Jong-Dar Chen
ELSEVIER
PO Box 2345, Beijing 100023, China World J Gastroenterol 2005;11(31):4838-4842www.wjgnet.com World Journal of Gastroenterology ISSN [email protected] © 2005 The WJG Press and Elsevier Inc. All rights reserved.
Yu-Cheng Lin, Jong-Dar Chen, Department of Family Medicineand Center for Environmental and Occupational Medicine, Shin KongWu Ho-Su Memorial Hospital, Taipei 111, Taiwan, ChinaHuey-Ming Lo, Department of Internal Medicine, Shin Kong WuHo-Su Memorial Hospital; School of Medicine, Fu Jen CatholicUniversity, Taipei 111, Taiwan, ChinaCorrespondence to: Dr. Jong-Dar Chen, Department of FamilyMedicine and Center for Environmental and Occupational Medicine,Shin Kong Wu Ho-Su Memorial Hospital, 95,Wen Chang Road,Shih Lin, Taipei 111, Taiwan, China. [email protected]: +886-2-2833-2211-2626 Fax: +886-2-2838-9420Received: 2004-12-01 Accepted: 2004-12-20
AbstractAbstractAbstractAbstractAbstract
AIM: To demonstrate the prevalence of sonographic fattyliver, overweight and ischemic heart disease (IHD) among
the male workers in Taiwan, and to investigate the possible
association of these three factors.
METHODS: From July to September 2003, a total of2 088 male aircraft-maintenance workers aged from 22
to 65 years (mean 40.5) underwent an annual health
examination, including anthropometrical evaluation, bloodpressure measurement, personal medical history assessment,
biochemical blood analysis, abdominal ultrasonographic
examination and digital electrocardiography (ECG). TheStudent’s t-test, χ2 test and multivariate logistic regression
analysis were utilized to evaluate the relationship between
IHD and salient risk factors.
RESULTS: The all-over prevalence of overweight was
41.4%, and that of fatty liver was 29.5% (mild, moderateand severe fatty liver being 14.5%, 11.3%, and 3.7%,
respectively); while the prevalence of ischemic changes
on ECG was 17.1% in this study. The abnormal rates forconventional IHD risk factors including hypertension,
dyslipidemia, hyperglycemia and overweight increased inaccordance with the severity of fatty liver. Overweightand severity of fatty liver were independently associatedwith increased risks for developing IHD. Overweightsubjects had a 1.32-fold (95%CI: 1.01-1.73) increasedIHD risk. Participants with mild, moderate, and severefatty liver had a 1.88-fold (95%CI: 1.37-2.6), 2.37-fold(95%CI: 1.66-3.37) and 2.76-fold (95%CI: 1.62-4.72)increased risk for developing IHD. The prevalence ofischemic ECG for the fatty liver-affected subjects with orwithout overweight was 30.1% and 19.1%, while that ofoverweight subjects free from fatty liver was 14.4%.Compared to the subjects without fatty liver nor overweight,IHD risk for the three subgroups above was as follows:OR: 2.95 (95%CI: 2.31-4.09), OR: 1.60 (95%CI: 1.07-2.39)and OR: 1.11 (95%CI: 0.78-1.56), respectively.
CONCLUSION: The presence of fatty liver and its severityshould be carefully considered as independent risk factorsfor IHD. Results of the study suggest the synergistic effectbetween fatty liver and overweight for developing IHD.Abdominal sonographic examination may provide valuableinformation for IHD risk assessment in addition to limitedreport about liver status, especially for overweight males.
© 2005 The WJG Press and Elsevier Inc. All rights reserved.
Key words: Fatty liver; Ischemic heart disease; Overweight;Male; Middle-aged
Lin YC, Lo HM, Chen JD. Sonographic fatty liver, overweightand ischemic heart disease. World J Gastroenterol 2005;11(31): 4838-4842
http://www.wjgnet.com/1007-9327/11/4838.asp
INTRODUCTIONINTRODUCTIONINTRODUCTIONINTRODUCTIONINTRODUCTION
Fatty change in the liver is closely associated with overweightstatus and metabolic impairments such as hyperglycemia,and dyslipidemia[1-3] which are also regarded as factors foratherosclerosis[1,4,5] and ischemic heart disease (IHD)[6-9].However, the association between fatty liver and IHD iswaiting for epidemiological investigation.
Since resting electrocardiogram (ECG) and abdominalsonographic examination are two routine, non-invasive healthexaminations used in medical check-ups in Taiwan[10-15], wehad the opportunity to examine the association betweenfatty liver and ischemic ECG changes, the hallmark of IHDand strong predictor for cardiac events[16-18].
The purpose of this study was to evaluate the relationshipsbetween fatty liver and IHD utilizing epidemic data. Dataanalyses were controlled for conventional risk factors,especially overweight.
MAMAMAMAMATERIALS AND METHODSTERIALS AND METHODSTERIALS AND METHODSTERIALS AND METHODSTERIALS AND METHODS
SubjectsRecords from a total of 2 088 male aircraft maintenanceworkers who underwent a periodic health examination fromJuly to September 2003.
MethodsThe health examinations included anthropometricalevaluation, measurement of weight and height, systolic anddiastolic blood pressure. Definition of overweight was BMI
25 kg/m2, based on WHO criteria[19]. A questionnaireabout personal medical history, including alcohol (usagemore than once a week: yes vs no) and tobacco (currentusage: yes vs no) consumption was filled by the examinees.
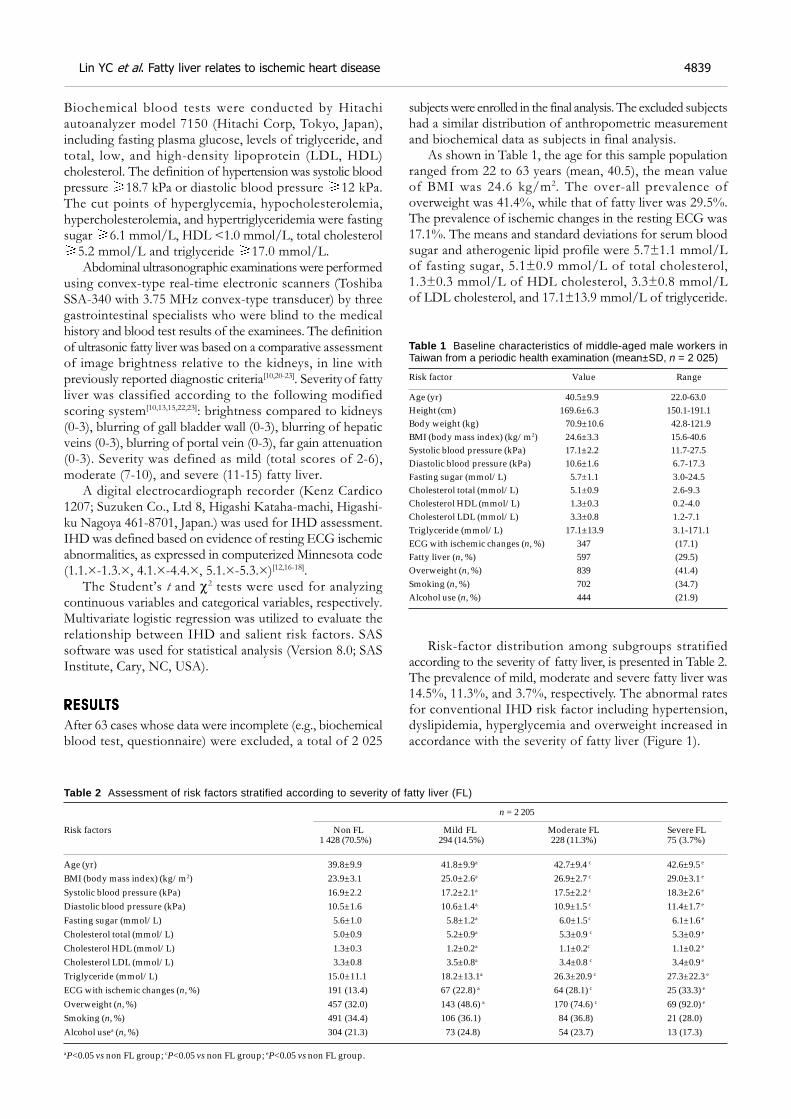
Biochemical blood tests were conducted by Hitachiautoanalyzer model 7150 (Hitachi Corp, Tokyo, Japan),including fasting plasma glucose, levels of triglyceride, andtotal, low, and high-density lipoprotein (LDL, HDL)cholesterol. The definition of hypertension was systolic bloodpressure 18.7 kPa or diastolic blood pressure 12 kPa.The cut points of hyperglycemia, hypocholesterolemia,hypercholesterolemia, and hypertriglyceridemia were fastingsugar 6.1 mmol/L, HDL <1.0 mmol/L, total cholesterol
5.2 mmol/L and triglyceride 17.0 mmol/L.Abdominal ultrasonographic examinations were performed
using convex-type real-time electronic scanners (ToshibaSSA-340 with 3.75 MHz convex-type transducer) by threegastrointestinal specialists who were blind to the medicalhistory and blood test results of the examinees. The definitionof ultrasonic fatty liver was based on a comparative assessmentof image brightness relative to the kidneys, in line withpreviously reported diagnostic criteria[10,20-23]. Severity of fattyliver was classified according to the following modifiedscoring system[10,13,15,22,23]: brightness compared to kidneys(0-3), blurring of gall bladder wall (0-3), blurring of hepaticveins (0-3), blurring of portal vein (0-3), far gain attenuation(0-3). Severity was defined as mild (total scores of 2-6),moderate (7-10), and severe (11-15) fatty liver.
A digital electrocardiograph recorder (Kenz Cardico1207; Suzuken Co., Ltd 8, Higashi Kataha-machi, Higashi-ku Nagoya 461-8701, Japan.) was used for IHD assessment.IHD was defined based on evidence of resting ECG ischemicabnormalities, as expressed in computerized Minnesota code(1.1.×-1.3.×, 4.1.×-4.4.×, 5.1.×-5.3.×)[12,16-18].
The Student’s t and χ2 tests were used for analyzingcontinuous variables and categorical variables, respectively.Multivariate logistic regression was utilized to evaluate therelationship between IHD and salient risk factors. SASsoftware was used for statistical analysis (Version 8.0; SASInstitute, Cary, NC, USA).
RESULRESULRESULRESULRESULTSTSTSTSTS
After 63 cases whose data were incomplete (e.g., biochemicalblood test, questionnaire) were excluded, a total of 2 025
subjects were enrolled in the final analysis. The excluded subjectshad a similar distribution of anthropometric measurementand biochemical data as subjects in final analysis.
As shown in Table 1, the age for this sample populationranged from 22 to 63 years (mean, 40.5), the mean valueof BMI was 24.6 kg/m2. The over-all prevalence ofoverweight was 41.4%, while that of fatty liver was 29.5%.The prevalence of ischemic changes in the resting ECG was17.1%. The means and standard deviations for serum bloodsugar and atherogenic lipid profile were 5.7±1.1 mmol/Lof fasting sugar, 5.1±0.9 mmol/L of total cholesterol,1.3±0.3 mmol/L of HDL cholesterol, 3.3±0.8 mmol/Lof LDL cholesterol, and 17.1±13.9 mmol/L of triglyceride.
Table 1 Baseline characteristics of middle-aged male workers inTaiwan from a periodic health examination (mean±SD, n = 2 025)
Risk factor Value Range
Age (yr) 40.5±9.9 22.0-63.0Height (cm) 169.6±6.3 150.1-191.1Body weight (kg) 70.9±10.6 42.8-121.9BMI (body mass index) (kg/m2) 24.6±3.3 15.6-40.6Systolic blood pressure (kPa) 17.1±2.2 11.7-27.5Diastolic blood pressure (kPa) 10.6±1.6 6.7-17.3Fasting sugar (mmol/L) 5.7±1.1 3.0-24.5Cholesterol total (mmol/L) 5.1±0.9 2.6-9.3Cholesterol HDL (mmol/L) 1.3±0.3 0.2-4.0Cholesterol LDL (mmol/L) 3.3±0.8 1.2-7.1Triglyceride (mmol/L) 17.1±13.9 3.1-171.1ECG with ischemic changes (n, %) 347 (17.1)Fatty liver (n, %) 597 (29.5)Overweight (n, %) 839 (41.4)Smoking (n, %) 702 (34.7)Alcohol use (n, %) 444 (21.9)
Risk-factor distribution among subgroups stratifiedaccording to the severity of fatty liver, is presented in Table 2.The prevalence of mild, moderate and severe fatty liver was14.5%, 11.3%, and 3.7%, respectively. The abnormal ratesfor conventional IHD risk factor including hypertension,dyslipidemia, hyperglycemia and overweight increased inaccordance with the severity of fatty liver (Figure 1).
Table 2 Assessment of risk factors stratified according to severity of fatty liver (FL)
n = 2 205
Risk factors Non FL Mild FL Moderate FL Severe FL 1 428 (70.5%) 294 (14.5%) 228 (11.3%) 75 (3.7%)
Age (yr) 39.8±9.9 41.8±9.9a 42.7±9.4 c 42.6±9.5 e
BMI (body mass index) (kg/m2) 23.9±3.1 25.0±2.6a 26.9±2.7 c 29.0±3.1 e
Systolic blood pressure (kPa) 16.9±2.2 17.2±2.1a 17.5±2.2 c 18.3±2.6 e
Diastolic blood pressure (kPa) 10.5±1.6 10.6±1.4a 10.9±1.5 c 11.4±1.7 e
Fasting sugar (mmol/L) 5.6±1.0 5.8±1.2a 6.0±1.5 c 6.1±1.6 e
Cholesterol total (mmol/L) 5.0±0.9 5.2±0.9a 5.3±0.9 c 5.3±0.9 e
Cholesterol HDL (mmol/L) 1.3±0.3 1.2±0.2a 1.1±0.2c 1.1±0.2 e
Cholesterol LDL (mmol/L) 3.3±0.8 3.5±0.8a 3.4±0.8 c 3.4±0.9 e
Triglyceride (mmol/L) 15.0±11.1 18.2±13.1a 26.3±20.9 c 27.3±22.3 e
ECG with ischemic changes (n, %) 191 (13.4) 67 (22.8) a 64 (28.1) c 25 (33.3) e
Overweight (n, %) 457 (32.0) 143 (48.6) a 170 (74.6) c 69 (92.0) e
Smoking (n, %) 491 (34.4) 106 (36.1) 84 (36.8) 21 (28.0)Alcohol usea (n, %) 304 (21.3) 73 (24.8) 54 (23.7) 13 (17.3)
aP<0.05 vs non FL group; cP<0.05 vs non FL group; eP<0.05 vs non FL group.
Lin YC et al. Fatty liver relates to ischemic heart disease 4839
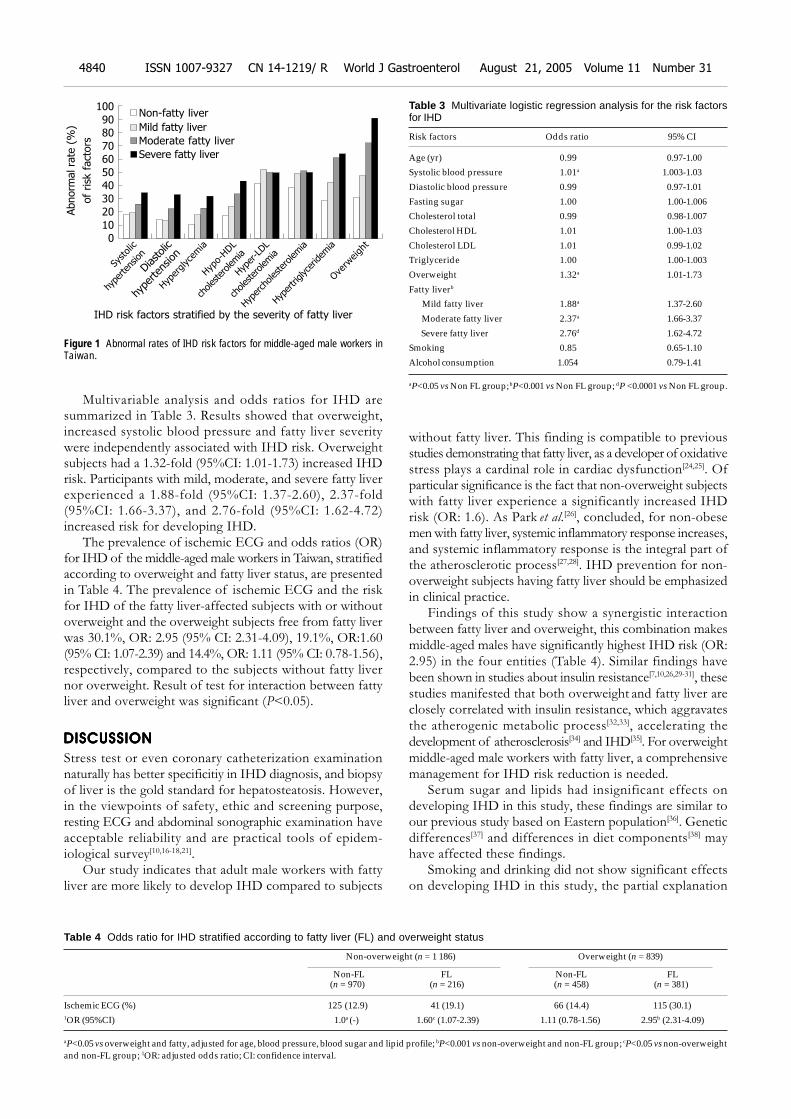
Multivariable analysis and odds ratios for IHD aresummarized in Table 3. Results showed that overweight,increased systolic blood pressure and fatty liver severitywere independently associated with IHD risk. Overweightsubjects had a 1.32-fold (95%CI: 1.01-1.73) increased IHDrisk. Participants with mild, moderate, and severe fatty liverexperienced a 1.88-fold (95%CI: 1.37-2.60), 2.37-fold(95%CI: 1.66-3.37), and 2.76-fold (95%CI: 1.62-4.72)increased risk for developing IHD.
The prevalence of ischemic ECG and odds ratios (OR)for IHD of the middle-aged male workers in Taiwan, stratifiedaccording to overweight and fatty liver status, are presentedin Table 4. The prevalence of ischemic ECG and the riskfor IHD of the fatty liver-affected subjects with or withoutoverweight and the overweight subjects free from fatty liverwas 30.1%, OR: 2.95 (95% CI: 2.31-4.09), 19.1%, OR:1.60(95% CI: 1.07-2.39) and 14.4%, OR: 1.11 (95% CI: 0.78-1.56),respectively, compared to the subjects without fatty livernor overweight. Result of test for interaction between fattyliver and overweight was significant (P<0.05).
DISCUSSIONDISCUSSIONDISCUSSIONDISCUSSIONDISCUSSION
Stress test or even coronary catheterization examinationnaturally has better specificitiy in IHD diagnosis, and biopsyof liver is the gold standard for hepatosteatosis. However,in the viewpoints of safety, ethic and screening purpose,resting ECG and abdominal sonographic examination haveacceptable reliability and are practical tools of epidem-iological survey[10,16-18,21].
Our study indicates that adult male workers with fattyliver are more likely to develop IHD compared to subjects
without fatty liver. This finding is compatible to previousstudies demonstrating that fatty liver, as a developer of oxidativestress plays a cardinal role in cardiac dysfunction[24,25]. Ofparticular significance is the fact that non-overweight subjectswith fatty liver experience a significantly increased IHDrisk (OR: 1.6). As Park et al.[26], concluded, for non-obesemen with fatty liver, systemic inflammatory response increases,and systemic inflammatory response is the integral part ofthe atherosclerotic process[27,28]. IHD prevention for non-overweight subjects having fatty liver should be emphasizedin clinical practice.
Findings of this study show a synergistic interactionbetween fatty liver and overweight, this combination makesmiddle-aged males have significantly highest IHD risk (OR:2.95) in the four entities (Table 4). Similar findings havebeen shown in studies about insulin resistance[7,10,26,29-31], thesestudies manifested that both overweight and fatty liver areclosely correlated with insulin resistance, which aggravatesthe atherogenic metabolic process[32,33], accelerating thedevelopment of atherosclerosis[34] and IHD[35]. For overweightmiddle-aged male workers with fatty liver, a comprehensivemanagement for IHD risk reduction is needed.
Serum sugar and lipids had insignificant effects ondeveloping IHD in this study, these findings are similar toour previous study based on Eastern population[36]. Geneticdifferences[37] and differences in diet components[38] mayhave affected these findings.
Smoking and drinking did not show significant effectson developing IHD in this study, the partial explanation
Table 4 Odds ratio for IHD stratified according to fatty liver (FL) and overweight status
Non-overweight (n = 1 186) Overweight (n = 839)
Non-FL FL Non-FL FL (n = 970) (n = 216) (n = 458) (n = 381)
Ischemic ECG (%) 125 (12.9) 41 (19.1) 66 (14.4) 115 (30.1)1OR (95%CI) 1.0a (-) 1.60c (1.07-2.39) 1.11 (0.78-1.56) 2.95b (2.31-4.09)
aP<0.05 vs overweight and fatty, adjusted for age, blood pressure, blood sugar and lipid profile; bP<0.001 vs non-overweight and non-FL group; cP<0.05 vs non-overweightand non-FL group; 1OR: adjusted odds ratio; CI: confidence interval.
Figure 1 Abnormal rates of IHD risk factors for middle-aged male workers inTaiwan.
Abnorm
al ra
te (
%)
of
risk
fact
ors
Non-fatty liver100
90
80
70
60
50
40
30
20
10
0
Mild fatty liver
Moderate fatty liver
Severe fatty liver
Systolic
hypertension
Diastolic
hype
rten
sion
Hyperglycemia
Hypo-HDL
cholesterolemia
Hyper-LDL
cholesterolemia
Hypercholesterolemia
Hypertriglyceridemia
Overweight
IHD risk factors stratified by the severity of fatty liver
4840 ISSN 1007-9327 CN 14-1219/ R World J Gastroenterol August 21, 2005 Volume 11 Number 31
Table 3 Multivariate logistic regression analysis for the risk factorsfor IHD
Risk factors Odds ratio 95% CI
Age (yr) 0.99 0.97-1.00
Systolic blood pressure 1.01a 1.003-1.03
Diastolic blood pressure 0.99 0.97-1.01
Fasting sugar 1.00 1.00-1.006
Cholesterol total 0.99 0.98-1.007
Cholesterol HDL 1.01 1.00-1.03
Cholesterol LDL 1.01 0.99-1.02
Triglyceride 1.00 1.00-1.003
Overweight 1.32a 1.01-1.73
Fatty liverb
Mild fatty liver 1.88a 1.37-2.60
Moderate fatty liver 2.37a 1.66-3.37
Severe fatty liver 2.76d 1.62-4.72
Smoking 0.85 0.65-1.10
Alcohol consumption 1.054 0.79-1.41
aP<0.05 vs Non FL group; bP<0.001 vs Non FL group; dP <0.0001 vs Non FL group.
might be that binary questionnaire could provide only limitedinformation about the dose-effect, which is important inthe development of IHD, and then leads to the unsteadyresults[36,39].
The findings of this study demonstrate that fatty liver isan independent risk factor for IHD. Abdominal sonographicexamination may not only provide limited report about theliver status, but also can provide valuable information forIHD risk assessment, especially for those who are over-weight.
ACKNOWLEDGMENTSACKNOWLEDGMENTSACKNOWLEDGMENTSACKNOWLEDGMENTSACKNOWLEDGMENTS
The authors would like to acknowledge the personnel ofthe Department of Family Medicine and Internal Medicine,Shin Kong Wu Ho-Su Memorial Hospital for their fullsupport and generous assistance.
REFERENCESREFERENCESREFERENCESREFERENCESREFERENCES
1 Akahoshi M, Amasaki Y, Soda M, Tominaga T, IchimaruS, Nakashima E, Seto S, Yano K. Correlation between fattyliver and coronary risk factors: a population study of eld-erly men and women in Nagasaki, Japan. Hypertens Res 2001;24: 337-343
2 Angelico F, Del Ben M, Conti R, Francioso S, Feole K, MaccioniD, Antonini TM, Alessandri C. Non-alcoholic fatty liver syndrome:a hepatic consequence of common metabolic diseases. J GastroenterolHepatol 2003;18: 588-594
3 Knobler H, Schattner A, Zhornicki T, Malnick SD, Keter D,Sokolovskaya N, Lurie Y, Bass DD. Fatty liver-an additionaland treatable feature of the insulin resistance syndrome. QJM1999; 92: 73-79
4 Chilton RJ. Recent discoveries in assessment of coronary heartdisease: impact of vascular mechanisms on development ofatherosclerosis. J Am Osteopath Assoc 2001; 101: S1-5
5 Ganz P, Creager MA, Fang JC, McConnell MV, Lee RT, LibbyP, Selwyn AP. Pathogenic mechanisms of atherosclerosis: ef-fect of lipid lowering on the biology of atherosclerosis. Am JMed 1996; 101(4A): 10S-16S
6 Bonora E, Kiechl S, Willeit J, Oberhollenzer F, Egger G,Bonadonna RC, Muggeo M. Bruneck study. Carotid athero-sclerosis and coronary heart disease in the metabolic syndrome:prospective data from the Bruneck study. Diabetes Care 2003;26: 1251-1257
7 Indulski JA, Lutz W. Ischaemic heart disease as an effect ofobesity-related metabolic disturbances. Cent Eur J Public Health1999; 7: 122-129
8 Jeppesen J, Hein HO, Suadicani P, Gyntelberg F. High trig-lycerides/low high-density lipoprotein cholesterol, ischemicelectrocardiogram changes, and risk of ischemic heart disease.Am Heart J 2003; 145: 103-108
9 Lamarche B, Despres JP, Moorjani S, Cantin B, Dagenais GR,Lupien PJ. Triglycerides and HDL-cholesterol as risk factorsfor ischemic heart disease. Results from the Quebec cardio-vascular study. Atherosclerosis 1996; 119: 235-245
10 Hsiao TJ, Chen JC, Wang JD. Insulin resistance and ferritinas major determinants of nonalcoholic fatty liver disease inapparently healthy obese patients. Int J Obesity 2004; 28:167-172
11 Lai SW, Tan CK, Ng KC. Epidemiology of fatty liver in ahospital-based study in Taiwan. Southern Med J 2002; 95:1288-1292
12 Chen CH, Chuang JH, Kuo HS, Chang MS, Wang SP, ChouP. Prevalence of coronary heart disease in Kin-Chen, Kinmen.Int J Cardiol 1996; 55: 87-95
13 Leung KW, Liu JD, Chen PH, Wang CS, Wang CK, HuangMJ, Siauw CP, Yuan CY, Chen TY. Clinical significance anddiagnosis of fatty liver in Taiwan. Taiwan i Hsueh Hui Tsa
Chih. J Formos Med Assoc 1986; 85: 149-1601 4 Lu SN, Wang LY, Chang WY, Chen CJ, Su WP, Chen SC,
Chuang WL, Hsieh MY. Abdominal sonographic screen-ing in a single community. Kaohsiung J Med Sci 1990; 6:643-646
15 Yang PM, Huang GT, Lin JT, Sheu JC, Lai MY, Su IJ, Hsu HC,Chen DS, Wang TH, Sung JL. Ultrasonography in the diagno-sis of benign diffuse parenchymal liver diseases: a prospec-tive study. J Formos Med Assoc 1988; 87: 966-977
16 Hampton JR. The importance of minor abnormalities inthe resting electrocardiogram. Eur Heart J 1984; 5 (Suppl A):61-63
17 Okin PM, Devereux RB, Kors JA, van Herpen G, Crow RS,Fabsitz RR, Howard BV. Computerized ST depression analy-sis improves prediction of all-cause and cardiovascularmortality: the strong heart study. Annals Noninvasive Electrocardiol2001; 6: 107-116
18 Kannel WB, Anderson K, McGee DL, Degatano LS, StampferMJ. Nonspecific electrocardiographic abnormality as a pre-dictor of coronary heart disease: the Framingham Study. AmHeart J 1987; 113: 370-376
19 Anonymous. Obesity: preventing and managing the globalepidemic. Report of a WHO consultation. WHO TechnicalReport Series 2000; 894: 1-253
20 Saadeh S, Younossi ZM, Remer EM, Gramlich T, Ong JP,Hurley M, Mullen KD, Cooper JN, Sheridan MJ. The utilityof radiological imaging in nonalcoholic fatty liver disease.Gastroenterology 2002; 123: 745-750
21 Steinmaurer HJ, Jirak P, Walchshofer J, Clodi PH. Accuracyof sonography in the diagnosis of diffuse liver parenchymaldiseases-comparison of sonography and liver histology.Ultraschall Der Medizin 1984; 5: 98-103
22 Tam KM, Wu JS. Ultrasonographic diagnosis of fatty liver. JFormos Med Assoc 1986; 85: 45-53
23 Yajima Y, Ohta K, Narui T, Abe R, Suzuki H, Ohtsuki M.Ultrasonographical diagnosis of fatty liver: significanceof the liver-kidney contrast. Tohoku J Exp Med 1983; 139:43-50
24 Videla LA, Rodrigo R, Orellana M, Fernandez V, Tapia G,Quinones L, Varela N, Contreras J, Lazarte R, Csendes A,Rojas J, Maluenda F, Burdiles P, Diaz JC, Smok G, ThielemannL, Poniachik J. Oxidative stress-related parameters in the liverof non-alcoholic fatty liver disease patients. Clin Sci 2004;106: 261-268
25 Koenig W. Heart disease and the inflammatory response.BMJ 2000: 321: 187-188
26 Park SH, Kim BI, Yun JW, Kim JW, Park DI, Cho YK, SungIK, Park CY, Sohn CI, Jeon WK, Kim H, Rhee EJ, Lee WY, KimSW. Insulin resistance and C-reactive protein as independentrisk factors for non-alcoholic fatty liver disease in non-obeseAsian men. J Gastroenterol Hepatol 2004; 19: 694-698
27 Bandyopadhyay D, Chattopadhyay A, Ghosh G, Datta AG.Oxidative stress-induced ischemic heart disease: protectionby antioxidants. Curr Med Chem 2004; 11: 369-387
28 Rothenbacher D, Hoffmeister A, Brenner H, Koenig W. Physi-cal activity, coronary heart disease, and inflammatory response.Arch Intern Med 2003; 163: 1200-1205
29 Goto T, Onuma T, Takebe K, Kral JG. The influence of fattyliver on insulin clearance and insulin resistance in non-dia-betic Japanese subjects. Int J Obesity 1995; 19: 841-845
30 Strang BD, Bertics SJ, Grummer RR, Armentano LE. Rela-tionship of triglyceride accumulation to insulin clearance andhormonal responsiveness in bovine hepatocytes. J Dairy Sci1998; 81: 740-747
31 Grundy SM. Metabolic complications of obesity. Endocrine2000; 13: 155-165
32 Cohn G, Valdes G, Capuzzi DM. Pathophysiology and treat-ment of the dyslipidemia of insulin resistance. Current CardiolRep 2001; 3: 416-423
33 Garg A. Insulin resistance in the pathogenesis of dyslipidemia.Diabetes Care 1996; 19: 387-389
34 Dandona P. Insulin resistance and endothelial dysfunction in
Lin YC et al. Fatty liver relates to ischemic heart disease 4841

atherosclerosis: implications and interventions. DiabetesTechnol Ther 2002; 4: 809-815
35 Lamarche B, Tchernof A, Mauriege P, Cantin B, DagenaisGR, Lupien PJ, Despres JP. Fasting insulin and apolipop-rotein B levels and low-density lipoprotein particle size asrisk factors for ischemic heart disease. JAMA 1998; 279:1955-1961
36 Lin YC, Chu FY, Fu CC, Chen JD. Prevalence and risk factorsfor angina in elderly Taiwanese. J Gerontol A Biol 2004; 59:161-165
37 Mitchell BD, Hazuda HP, Haffner SM, Patterson JK, SternMP. High prevalence of angina pectoris in Mexican-American
men. A population with reduced risk of myocardial infarction.Ann Epidemiol 1991; 1: 415-426
38 Burchfiel CM, Abbott RD, Sharp DS, Curb JD, RodriguezBL, Yano K. Distribution and correlates of lipids and li-poproteins in elderly Japanese-American men. The Hono-lulu Heart Program. Arterioscler Thromb Vasc Biol 1996;16 : 1356-1364
39 Gaziano JM, Buring JE, Breslow JL, Goldhaber SZ, Rosner B,Van Denburgh M, Willett W, Hennekens CH. Moderate alco-hol intake, increased levels of high-density lipoprotein and itssubfractions, and decreased risk of myocardial infarction.New Eng J Med 1993; 329: 1829-1834
Science Editor Wang XL and Guo SY Language Editor Elsevier HK
4842 ISSN 1007-9327 CN 14-1219/ R World J Gastroenterol August 21, 2005 Volume 11 Number 31
• CLINICAL RESEARCH •
Value of CT-guided core-needle biopsy in diagnosis and classification
of malignant lymphomas using automated biopsy gun
Li Li, Qiu-Liang Wu, Li-Zhi Liu, Yun-Xian Mo, Chuan-Miao Xie, Lie Zheng, Lin Chen, Pei-Hong Wu
ELSEVIER
PO Box 2345, Beijing 100023, China World J Gastroenterol 2005;11(31):4843-4847www.wjgnet.com World Journal of Gastroenterology ISSN [email protected] © 2005 The WJG Press and Elsevier Inc. All rights reserved.
Li Li, Li-Zhi Liu, Yun-Xian Mo, Chuan-Miao Xie, Lie Zheng, LinChen, Pei-Hong Wu, State Key Laboratory of Oncology in SouthernChina, Imaging Diagnosis and Interventional Center, Cancer Center, SunYat-Sen University, Guangzhou 510060, Guangdong Province, ChinaQiu-Liang Wu, State Key Laboratory of Oncology in SouthernChina, Department of Pathology, Cancer Center, Sun Yat-SenUniversity, Guangzhou 510060, Guangdong Province, ChinaCo-first-authors: Qiu-Liang WuCorrespondence to: Dr. Pei-Hong Wu, Imaging Diagnosis andInterventional Center, Cancer Center, Sun Yat-Sen University, 651Dongfeng Road East, Guangzhou 510060, Guangdong Province,China. [email protected]: +86-20-87343270 Fax: +86-20-87343392Received: 2004-12-02 Accepted: 2005-02-18
AbstractAbstractAbstractAbstractAbstract
AIM: To evaluate the value of CT-guided core-needle biopsyin diagnosis and classification of malignant lymphomas.
METHODS: From January 1999 to October 2004, CT-guidedcore-needle biopsies were performed in 80 patients with
suspected malignant lymphoma. Biopsies were performed
with an 18-20 G biopsy-cut (CR Bard, Inc., Covington, GA,USA) needle driven by a spring-loaded Bard biopsy gun.
RESULTS: A definite diagnosis and accurate histological
subtype were obtained in 61 patients with a success rateof 76.25% (61/80). Surgical sampling was performed in
19 patients (23.75%) with non-diagnostic core-needle
biopsies. The success rate of CT-guided core-needle biopsyvaried with the histopathologic subtypes in our group.
The relatively high success rates of core-needle biopsy
were noted in diffuse large B-cell non-Hodgkin’s lymphoma(NHL, 88.89%) and peripheral T-cell NHL (90%). However,
the success rates were relatively low in anaplastic large
cell (T/null cell) lymphoma (ALCL, 44.44%) and Hodgkin’sdisease (HD, 28.57%) in our group.
CONCLUSION: CT-guided core-needle biopsy is a reliable
means of diagnosing and classifying malignant lymphomas,and can be widely applied in the management of patients
with suspected malignant lymphoma.
© 2005 The WJG Press and Elsevier Inc. All rights reserved.
Key words: Malignant lymphoma; Biopsy; Computed
tomography
Li L, Wu QL, Liu LZ, Mo YX, Xie CM, Zheng L, Chen L, WuPH. Value of CT-guided core-needle biopsy in diagnosis and
classification of malignant lymphomas using automated biopsygun. World J Gastroenterol 2005; 11(31): 4843-4847
http://www.wjgnet.com/1007-9327/11/4843.asp
INTRODUCTIONINTRODUCTIONINTRODUCTIONINTRODUCTIONINTRODUCTION
CT-guided percutaneous needle biopsy has become animportant diagnostic tool and can minimize the need foropen biopsy[1,2]. However, satisfactory sampling is essential forthe diagnosis and classification of malignant lymphoma[3-5].Percutaneous core-needle biopsy under the guidance of CTor ultrasound in evaluation of malignant lymphomas has alimited value[6-8]. The advantage of CT guidance is that thewhole mediastinum or abdomen is visualized, allowingaccurate planning of biopsy for deep and small lesions andavoiding damage to important organs and greater vessels[9,10].In recent years, with the advance in new needle biopsysystems and technology of needle biopsy[11,12], CT-guidedcore-needle biopsy is widely used in the diagnosis andclassification of malignant lymphoma[13,14]. Since 1999,CT-guided core-needle biopsy has been used as one of theroutine sampling techniques for malignant lymphomas inour hospital. This study aimed to retrospectively evaluatethe reliability of CT-guided core-needle biopsy for thediagnosis and classification of malignant lymphoma usingan automated biopsy gun.
MAMAMAMAMATERIALS AND METHODSTERIALS AND METHODSTERIALS AND METHODSTERIALS AND METHODSTERIALS AND METHODS
PatientsFrom January 1999 to October 2004, 80 patients (51 men,29 women) with suspected malignant lymphomas underwentCT-guided core-needle biopsy. They aged from 2.8 to 72 years(mean age, 48.5 years). In our series, six patients (7.5%)had a history of malignant lymphoma including two diffuselarge B-cell non-Hodgkin’s lymphoma (NHLs), oneperipheral T-cell NHL, one anaplastic large cell (T/null cell)NHL, one follicular B-cell NHL and one nodular sclerosisHodgkin’s disease (HD). The sites of core-needle biopsyare shown in Table 1. Repeated core-needle biopsies wereperformed in five patients (6.25%). Nineteen patients (23.75%)with non-diagnostic core-needle biopsy underwent surgerydepending on the sites, dimensions, and clinical diagnosis(Table 2). The histological classification in our group wasaccording to 2001 World Health Organization classificationof malignant lymphoma[15].
CT scanningCT scanning was performed for all patients with incremental
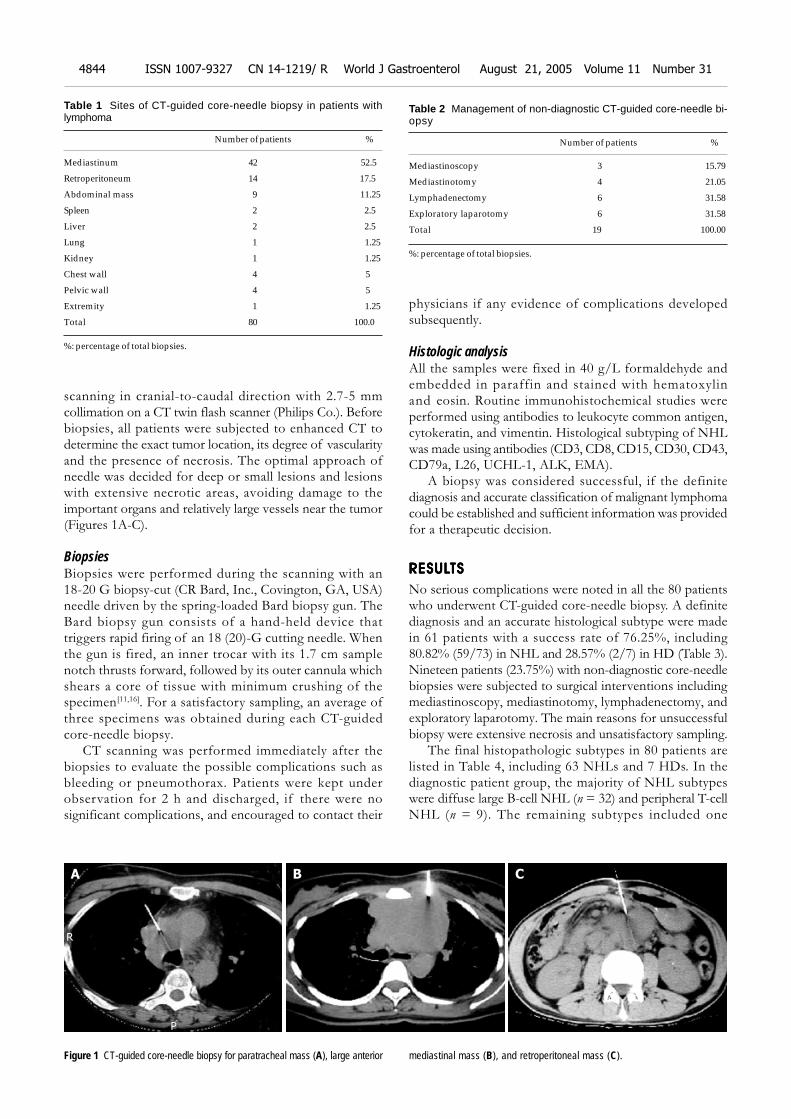
4844 ISSN 1007-9327 CN 14-1219/ R World J Gastroenterol August 21, 2005 Volume 11 Number 31
scanning in cranial-to-caudal direction with 2.7-5 mmcollimation on a CT twin flash scanner (Philips Co.). Beforebiopsies, all patients were subjected to enhanced CT todetermine the exact tumor location, its degree of vascularityand the presence of necrosis. The optimal approach ofneedle was decided for deep or small lesions and lesionswith extensive necrotic areas, avoiding damage to theimportant organs and relatively large vessels near the tumor(Figures 1A-C).
BiopsiesBiopsies were performed during the scanning with an18-20 G biopsy-cut (CR Bard, Inc., Covington, GA, USA)needle driven by the spring-loaded Bard biopsy gun. TheBard biopsy gun consists of a hand-held device thattriggers rapid firing of an 18 (20)-G cutting needle. Whenthe gun is fired, an inner trocar with its 1.7 cm samplenotch thrusts forward, followed by its outer cannula whichshears a core of tissue with minimum crushing of thespecimen[11,16]. For a satisfactory sampling, an average ofthree specimens was obtained during each CT-guidedcore-needle biopsy.
CT scanning was performed immediately after thebiopsies to evaluate the possible complications such asbleeding or pneumothorax. Patients were kept underobservation for 2 h and discharged, if there were nosignificant complications, and encouraged to contact their
physicians if any evidence of complications developedsubsequently.
Histologic analysisAll the samples were fixed in 40 g/L formaldehyde andembedded in paraffin and stained with hematoxylinand eosin. Routine immunohistochemical studies wereperformed using antibodies to leukocyte common antigen,cytokeratin, and vimentin. Histological subtyping of NHLwas made using antibodies (CD3, CD8, CD15, CD30, CD43,CD79a, L26, UCHL-1, ALK, EMA).
A biopsy was considered successful, if the definitediagnosis and accurate classification of malignant lymphomacould be established and sufficient information was providedfor a therapeutic decision.
RESULRESULRESULRESULRESULTSTSTSTSTS
No serious complications were noted in all the 80 patientswho underwent CT-guided core-needle biopsy. A definitediagnosis and an accurate histological subtype were madein 61 patients with a success rate of 76.25%, including80.82% (59/73) in NHL and 28.57% (2/7) in HD (Table 3).Nineteen patients (23.75%) with non-diagnostic core-needlebiopsies were subjected to surgical interventions includingmediastinoscopy, mediastinotomy, lymphadenectomy, andexploratory laparotomy. The main reasons for unsuccessfulbiopsy were extensive necrosis and unsatisfactory sampling.
The final histopathologic subtypes in 80 patients arelisted in Table 4, including 63 NHLs and 7 HDs. In thediagnostic patient group, the majority of NHL subtypeswere diffuse large B-cell NHL (n = 32) and peripheral T-cellNHL (n = 9). The remaining subtypes included one
Table 1 Sites of CT-guided core-needle biopsy in patients withlymphoma
Number of patients %
Mediastinum 42 52.5
Retroperitoneum 14 17.5
Abdominal mass 9 11.25
Spleen 2 2.5
Liver 2 2.5
Lung 1 1.25
Kidney 1 1.25
Chest wall 4 5
Pelvic wall 4 5
Extremity 1 1.25
Total 80 100.0
%: percentage of total biopsies.
Table 2 Management of non-diagnostic CT-guided core-needle bi-opsy
Number of patients %
Mediastinoscopy 3 15.79
Mediastinotomy 4 21.05
Lymphadenectomy 6 31.58
Exploratory laparotomy 6 31.58
Total 19 100.00
%: percentage of total biopsies.
Figure 1 CT-guided core-needle biopsy for paratracheal mass (A), large anterior mediastinal mass (B), and retroperitoneal mass (C).
A CB
R
P
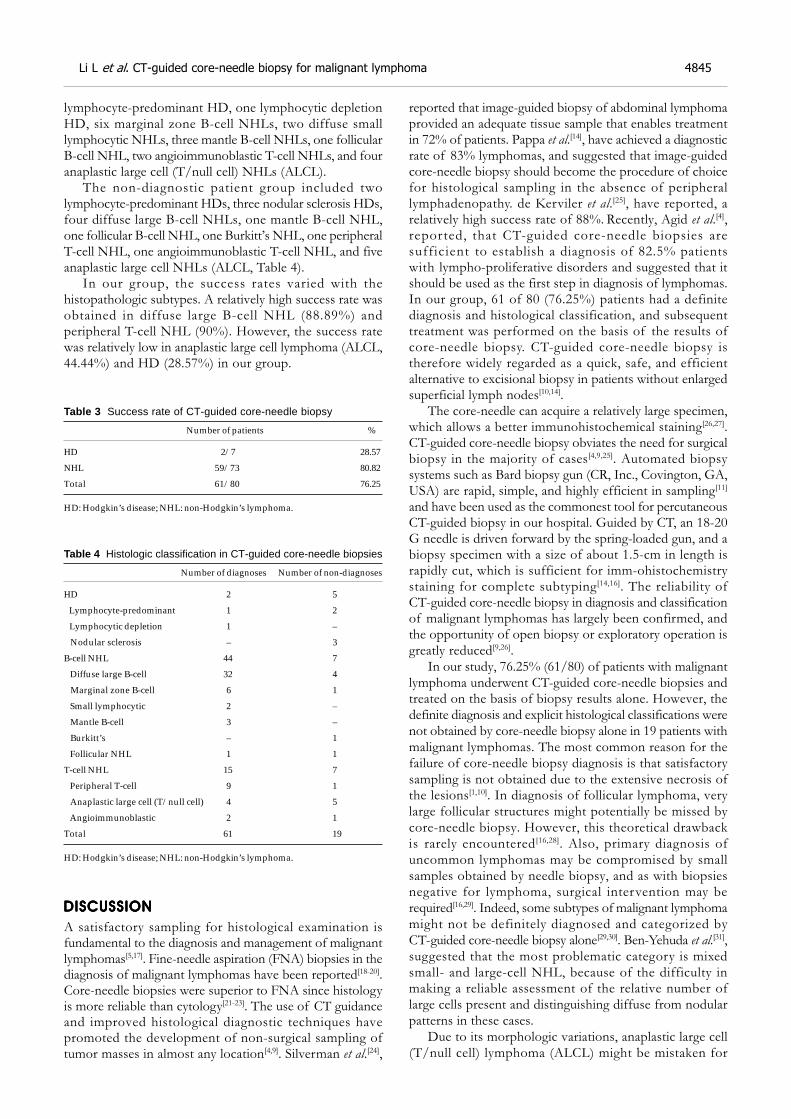
Li L et al. CT-guided core-needle biopsy for malignant lymphoma 4845
lymphocyte-predominant HD, one lymphocytic depletionHD, six marginal zone B-cell NHLs, two diffuse smalllymphocytic NHLs, three mantle B-cell NHLs, one follicularB-cell NHL, two angioimmunoblastic T-cell NHLs, and fouranaplastic large cell (T/null cell) NHLs (ALCL).
The non-diagnostic patient group included twolymphocyte-predominant HDs, three nodular sclerosis HDs,four diffuse large B-cell NHLs, one mantle B-cell NHL,one follicular B-cell NHL, one Burkitt’s NHL, one peripheralT-cell NHL, one angioimmunoblastic T-cell NHL, and fiveanaplastic large cell NHLs (ALCL, Table 4).
In our group, the success rates varied with thehistopathologic subtypes. A relatively high success rate wasobtained in diffuse large B-cell NHL (88.89%) andperipheral T-cell NHL (90%). However, the success ratewas relatively low in anaplastic large cell lymphoma (ALCL,44.44%) and HD (28.57%) in our group.
Table 3 Success rate of CT-guided core-needle biopsy
Number of patients %
HD 2/7 28.57
NHL 59/73 80.82
Total 61/80 76.25
HD: Hodgkin’s disease; NHL: non-Hodgkin’s lymphoma.
Table 4 Histologic classification in CT-guided core-needle biopsies
Number of diagnoses Number of non-diagnoses
HD 2 5
Lymphocyte-predominant 1 2
Lymphocytic depletion 1 –
Nodular sclerosis – 3
B-cell NHL 44 7
Diffuse large B-cell 32 4
Marginal zone B-cell 6 1
Small lymphocytic 2 –
Mantle B-cell 3 –
Burkitt’s – 1
Follicular NHL 1 1
T-cell NHL 15 7
Peripheral T-cell 9 1
Anaplastic large cell (T/null cell) 4 5
Angioimmunoblastic 2 1
Total 61 19
HD: Hodgkin’s disease; NHL: non-Hodgkin’s lymphoma.
DISCUSSIONDISCUSSIONDISCUSSIONDISCUSSIONDISCUSSION
A satisfactory sampling for histological examination isfundamental to the diagnosis and management of malignantlymphomas[5,17]. Fine-needle aspiration (FNA) biopsies in thediagnosis of malignant lymphomas have been reported[18-20].Core-needle biopsies were superior to FNA since histologyis more reliable than cytology[21-23]. The use of CT guidanceand improved histological diagnostic techniques havepromoted the development of non-surgical sampling oftumor masses in almost any location[4,9]. Silverman et al.[24],
reported that image-guided biopsy of abdominal lymphomaprovided an adequate tissue sample that enables treatmentin 72% of patients. Pappa et al.[14], have achieved a diagnosticrate of 83% lymphomas, and suggested that image-guidedcore-needle biopsy should become the procedure of choicefor histological sampling in the absence of peripherallymphadenopathy. de Kerviler et al.[25], have reported, arelatively high success rate of 88%. Recently, Agid et al.[4],reported, that CT-guided core-needle biopsies aresufficient to establish a diagnosis of 82.5% patientswith lympho-proliferative disorders and suggested that itshould be used as the first step in diagnosis of lymphomas.In our group, 61 of 80 (76.25%) patients had a definitediagnosis and histological classification, and subsequenttreatment was performed on the basis of the results ofcore-needle biopsy. CT-guided core-needle biopsy istherefore widely regarded as a quick, safe, and efficientalternative to excisional biopsy in patients without enlargedsuperficial lymph nodes[10,14].
The core-needle can acquire a relatively large specimen,which allows a better immunohistochemical staining[26,27].CT-guided core-needle biopsy obviates the need for surgicalbiopsy in the majority of cases[4,9,25]. Automated biopsysystems such as Bard biopsy gun (CR, Inc., Covington, GA,USA) are rapid, simple, and highly efficient in sampling[11]
and have been used as the commonest tool for percutaneousCT-guided biopsy in our hospital. Guided by CT, an 18-20G needle is driven forward by the spring-loaded gun, and abiopsy specimen with a size of about 1.5-cm in length israpidly cut, which is sufficient for imm-ohistochemistrystaining for complete subtyping[14,16]. The reliability ofCT-guided core-needle biopsy in diagnosis and classificationof malignant lymphomas has largely been confirmed, andthe opportunity of open biopsy or exploratory operation isgreatly reduced[9,26].
In our study, 76.25% (61/80) of patients with malignantlymphoma underwent CT-guided core-needle biopsies andtreated on the basis of biopsy results alone. However, thedefinite diagnosis and explicit histological classifications werenot obtained by core-needle biopsy alone in 19 patients withmalignant lymphomas. The most common reason for thefailure of core-needle biopsy diagnosis is that satisfactorysampling is not obtained due to the extensive necrosis ofthe lesions[1,10]. In diagnosis of follicular lymphoma, verylarge follicular structures might potentially be missed bycore-needle biopsy. However, this theoretical drawbackis rarely encountered[16,28]. Also, primary diagnosis ofuncommon lymphomas may be compromised by smallsamples obtained by needle biopsy, and as with biopsiesnegative for lymphoma, surgical intervention may berequired[16,29]. Indeed, some subtypes of malignant lymphomamight not be definitely diagnosed and categorized byCT-guided core-needle biopsy alone[29,30]. Ben-Yehuda et al.[31],suggested that the most problematic category is mixedsmall- and large-cell NHL, because of the difficulty inmaking a reliable assessment of the relative number oflarge cells present and distinguishing diffuse from nodularpatterns in these cases.
Due to its morphologic variations, anaplastic large cell(T/null cell) lymphoma (ALCL) might be mistaken for
other lymphoid or non-lymphoid malignancies[32]. In general,ALCL is of T-cell phenotype and characterized by the classic“anaplastic” morphology and a peculiar CD30 expression.Its diagnosis relies on recognition of distinctive morphologicclues, such as the presence of occasional “hallmark” cells,especially around small vessels, as well as immunopositivityfor CD30 and occasionally ALK protein. Therefore, adefinitive diagnosis of ALCL is possibly based on carefulinterpretation of immunohistochemical features[32,33]. If theexplicit diagnosis of ALCL cannot be made on the basis ofa small size of samples obtained by core-needle biopsy, therelatively larger specimen obtained by open biopsy may beneeded for definite diagnosis.
A common subtype of lymphomas such as diffuse largeB cell lymphoma often yields a predominant population oflarge lymphoid cells with a high mitotic activity and arelatively high rate of diagnosis[13,32]. The success rate wasas high as 88.89% (32/36) in our group. However, therewere nine patients (11.25%) with ALCL in our group, and adefinite diagnosis by core-needle biopsy alone was made inonly four (44.44%). The main reason for this failure is dueto the small size of samples obtained by core-needle biopsy.
Zinzani et al.[13], and Pappa et al.[14], have reported, relativelyhigh success rates in diagnosis of HD using core-needlebiopsy. However, there were a relatively small number ofpatients with HD in our group (8.75%), and only 28.57%(2/7) of patients with HD were definitely diagnosed bycore-needle biopsy. Except for unsatisfactory sampling[25],our low success rate may largely be due to lack of experienceof pathological diagnosis of HD on the basis of core-needlebiopsy in our hospital.
In conclusion, CT-guided core-needle biopsy is a reliablediagnostic procedure for malignant lymphoma, and can bewidely used in patients with suspected malignant lymphomain absence of palpable, enlarged superficial lymph nodes.
REFERENCESREFERENCESREFERENCESREFERENCESREFERENCES
1 Sklair-Levy M, Polliack A, Shaham D, Applbaum YH, GillisS, Ben-Yehuda D, Sherman Y, Libson E. CT-guided core-needlebiopsy in the diagnosis of mediastinal lymphoma. Eur Radiol2000; 10: 714-718
2 Mintzer DM, Mason BA. On the need for biopsy confirma-tion at suspected first recurrence of cancer. Am J Clin Oncol2003; 26: 192-196
3 Demharter J, Muller P, Wagner T, Schlimok G, Haude K,Bohndorf K. Percutaneous core-needle biopsy of enlargedlymph nodes in the diagnosis and subclassification of malig-nant lymphomas. Eur Radiol 2001; 11: 276-283
4 Agid R, Sklair-Levy M, Bloom AI, Lieberman S, Polliack A,Ben-Yehuda D, Sherman Y, Libson E. CT-guided biopsy withcutting-edge needle for the diagnosis of malignant lymphoma:experience of 267 biopsies. Clin Radiol 2003; 58: 143-147
5 Gupta RK, Naran S, Lallu S, Fauck R. The diagnostic valueof fine needle aspiration cytology (FNAC) in the assessmentof palpable supraclavicular lymph nodes: a study of 218cases. Cytopathology 2003; 14: 201-207
6 Zeppa P, Marino G, Troncone G, Fulciniti F, De Renzo A,Picardi M, Benincasa G, Rotoli B, Vetrani A, Palombini L.Fine-needle cytology and flow cytometry immunophenotypingand subclassification of non-Hodgkin lymphoma: a criticalreview of 307 cases with technical suggestions. Cancer 2004;102: 55-65
7 Jimenez-Heffernan JA, Vicandi B, Lopez-Ferrer P, HardissonD, Viguer JM. Value of fine needle aspiration cytology in the
initial diagnosis of Hodgkin’s disease. Analysis of 188 caseswith an emphasis on diagnostic pitfalls. Acta Cytol 2001; 45:300-306
8 Gong JZ, Williams DC Jr, Liu K, Jones C. Fine-needle aspira-tion in non-Hodgkin lymphoma: evaluation of cell size bycytomorphology and flow cytometry. Am J Clin Pathol 2002;117: 880-888
9 Libicher M, Noldge G, Radeleff B, Gholipur F, Richter GM.Value of CT-guided biopsy in malignant lymphoma. Radiologe2002; 42: 1009-1012
10 Goldschmidt N, Libson E, Bloom A, Amir G, Paltiel O.Clinical utility of computed tomography-guided core needlebiopsy in the diagnostic re-evaluation of patients withlymphoproliferative disorders and suspected diseaseprogression. Ann Oncol 2003; 14: 1438-1441
11 Haramati LB. CT-guided automated needle biopsy of thechest. Am J Roentgenol 1995; 165: 53-55
12 Hopper KD, Abendroth CS, Sturtz KW, Matthews YL, HartzelJS, Potok PS. CT percutaneous biopsy guns: comparison ofend-cut and side-notch devices in cadaveric specimens. Am JRoentgenol 1995; 164: 195-199
13 Zinzani PL, Corneli G, Cancellieri A, Magagnoli M, LacavaN, Gherlinzoni F, Bendandi M, Albertini P, Baruzzi G, TuraS, Boaron M. Core needle biopsy is effective in the initialdiagnosis of mediastinal lymphoma. Haematologica 1999; 84:600-603
14 Pappa VI, Hussain HK, Reznek RH, Whelan J, Norton AJ,Wilson AM, Love S, Lister TA, Rohatiner AZ. Role of image-guided core-needle biopsy in the management of patientswith lymphoma. J Clin Oncol 1996; 14: 2427-2430
15 Jaffe ES, Harris NL, Stein H, Vardiman JW. World healthorganization classification of tumours. Pathology and geneticsof tumours of haemopoietic and lymphoid tissues. Lyon: IARCPress 2001: 111-235
16 Whelan JS, Reznek RH, Daniell SJ, Norton AJ, Lister TA,Rohatiner AZ. Computed tomography (CT) and ultrasound(US) guided core biopsy in the management of non-Hodgkin’slymphoma. Br J Cancer 1991; 63: 460-462
17 Wakely P Jr, Frable WJ, Kneisl JS. Soft tissue aspiration cyto-pathology of malignant lymphoma and leukemia. Cancer 2001;93: 35-39
18 Landgren O, Porwit MacDonald A, Tani E, Czader M,Grimfors G, Skoog L, Ost A, Wedelin C, Axdorph U, SvedmyrE, Bjorkholm M. A prospective comparison of fine-needleaspiration cytology and histopathology in the diagnosis andclassification of lymphomas. Hematol J 2004; 5: 69-76
19 Civardi G, Vallisa D, Berte R, Giorgio A, Filice C, CaremaniM, Caturelli E, Pompili M, De Sio I, Buscarini E, Cavanna L.Ultrasound-guided fine needle biopsy of the spleen: high clini-cal efficacy and low risk in a multicenter Italian study. Am JHematol 2001; 67: 93-99
20 Singh NG, Kapila K, Dawar R, Verma K. Fine needle aspira-tion cytology diagnosis of lymphoproliferative disease of thebreast. Acta Cytol 2003; 47: 739-743
21 Varadarajulu S, Fraig M, Schmulewitz N, Roberts S, WildiS, Hawes RH, Hoffman BJ, Wallace MB. Comparison ofEUS-guided 19-gauge Trucut needle biopsy with EUS-guidedfine-needle aspiration. Endoscopy 2004; 36: 397-401
22 Wotherspoon AC, Norton AJ, Lees WR, Shaw P, IsaacsonPG. Diagnostic fine needle core biopsy of deep lymph nodesfor the diagnosis of lymphoma in patients unfit for surgery. JPathol 1989; 158: 115-121
23 Lieberman S, Libson E, Maly B, Lebensart P, Ben-Yehuda D,Bloom AI. Imaging-guided percutaneous splenic biopsy us-ing a 20- or 22-gauge cutting-edge core biopsy needle for thediagnosis of malignant lymphoma. Am J Roentgenol 2003;181: 1025-1027
24 Silverman SG, Lee BY, Mueller PR, Cibas ES, Seltzer SE.Impact of positive findings at image-guided biopsy of lymphomaon patient care: evaluation of clinical history, needle size, andpathologic findings on biopsy performance. Radiology 1994;190: 759-764
4846 ISSN 1007-9327 CN 14-1219/ R World J Gastroenterol August 21, 2005 Volume 11 Number 31
25 de Kerviler E, Guermazi A, Zagdanski AM, Meignin V,Gossot D, Oksenhendler E, Mariette X, Brice P, Frija J. Image-guided core-needle biopsy in patients with suspected or re-current lymphomas. Cancer 2000; 89: 647-652
26 Gong JZ, Snyder MJ, Lagoo AS, Vollmer RT, Dash RR, Mad-den JF, Buckley PJ, Jones CK. Diagnostic impact of core-needle biopsy on fine-needle aspiration of non-Hodgkinlymphoma. Diagn Cytopathol 2004; 31: 23-30
27 Quinn SF, Sheley RC, Nelson HA, Demlow TA, WiensteinRE, Dunkley BL. The role of percutaneous needle biopsies inthe original diagnosis of lymphoma: a prospective evaluation.J Vasc Interv Radiol 1995; 6: 947-952
28 West RB, Warnke RA, Natkunam Y. The usefulness of immu-nohistochemistry in the diagnosis of follicular lymphoma in bonemarrow biopsy specimens. Am J Clin Pathol 2002; 117: 636-643
29 Mayall F, Darlington A, Harrison B. Fine needle aspirationcytology in the diagnosis of uncommon types of lymphoma.
Science Editor Wang XL and Guo SY Language Editor Elsevier HK
J Clin Pathol 2003; 56: 821-82530 Jimenez-Heffernan JA, Gonzalez-Peramato P, Perna C,
Alvarez-Ferreira J, Lopez-Ferrer P, Viguer JM. Fine-needleaspiration cytology of extranodal natural killer/T-celllymphoma. Diagn Cytopathol 2002; 27: 371-374
31 Ben-Yehuda D, Polliack A, Okon E, Sherman Y, Fields S,Lebenshart P, Lotan H, Libson E. Image-guided core-needlebiopsy in malignant lymphoma: experience with 100 patientsthat suggests the technique is reliable. J Clin Oncol 1996; 14:2431-2434
32 Ng WK, Ip P, Choy C, Collins RJ. Cytologic and immunocy-tochemical findings of anaplastic large cell lymphoma: analysisof ten fine-needle aspiration specimens over a 9-year period.Cancer 2003; 99: 33-43
33 Creager AJ, Geisinger KR, Bergman S. Neutrophil-rich Ki-1-positive anaplastic large cell lymphoma: a study by fine-needle aspiration biopsy. Am J Clin Pathol 2002; 117: 709-715
Li L et al. CT-guided core-needle biopsy for malignant lymphoma 4847
• BRIEF REPORTS •
Modulation of gastric accommodation by duodenal nutrients
Mauricio Carrasco, Fernando Azpiroz, Juan-R. Malagelada
ELSEVIER
PO Box 2345, Beijing 100023, China World J Gastroenterol 2005;11(31):4848-4851www.wjgnet.com World Journal of Gastroenterology ISSN [email protected] © 2005 The WJG Press and Elsevier Inc. All rights reserved.
Mauricio Carrasco, Fernando Azpiroz, Juan-R. Malagelada,Digestive System Research Unit, Hospital General Vall d’Hebron,Autonomous University of Barcelona, Barcelona 08035, SpainSupported by the Spanish Ministry of Education (Dirección Generalde Enseñanza Superior del Ministerio de Educacióny Cultura, BFI2002-03413), the Instituto de Salud Carlos III, No. C03/02, and theNational Institutes of Health, USA, No. DK 57064Correspondence to: Fernando Azpiroz, MD, Digestive SystemResearch Unit, Hospital General Vall d’Hebron, Barcelona 08035,Spain. [email protected]: +34-93-274-62-59 Fax: +34-93-489-44-56Received: 2004-12-15 Accepted: 2005-01-05
AbstractAbstractAbstractAbstractAbstract
AIM: To determine the relative potency and contributionof intestinal nutrients to net gastric accommodativerelaxation and conscious perception.
METHODS: In 12 healthy subjects, we randomly testedduodenal loads of lipids and carbohydrates (12 mLadministered in 4 min) at various caloric concentrations(0.0125-0.8 kcal/mL) separated by 12-24 min wash-outperiods of saline infusion. Maximal gastric relaxation wasinduced at the end of each experiment by i.v glucagon
(5 µg/kg), as reference. The reflex gastric response wasmeasured by a barostat, and symptom perception by a
0-6 score questionnaire.
RESULTS: Lipids induced a dose-response gastric relaxation
with a steep and early rise. Maximal effect (179±42 mL
relaxation) reached at a relatively low concentration(0.2 kcal/mL), maximal lipid-induced relaxation was
61±6% of the glucagon effect. By contrast, duodenal
infusion of carbohydrates induced weaker relaxation thatbecame significant only at the high end of the physiological
concentration range (65±14 mL with 0.8 kcal/mL). Intestinal
nutrient loads, either of lipid or carbohydrates, did notinduce significant changes in perception (0.6±0.4 and
0.1±0.4 score increase for the highest concentrations,
respectively).
CONCLUSION: Chyme entering the small bowel induces
nutrient-specific gastric relaxatory reflexes by a physiologicallysaturable mechanism. Normally, neither the intestinal
nutrient load nor the gastric accommodative response is
perceived.
© 2005 The WJG Press and Elsevier Inc. All rights reserved.
Key words: Gastric accommodation; Enterogastric reflex;
Postprandial symptoms; Intestinal nutrients; Gastric
relaxation; Gastric barostat; Gut perception
Carrasco M, Azpiroz F, Malagelada JR. Modulation of gastricaccommodation by duodenal nutrients. World J Gastroenterol
2005; 11(31): 4848-4851
http://www.wjgnet.com/1007-9327/11/4848.asp
INTRODUCTIONINTRODUCTIONINTRODUCTIONINTRODUCTIONINTRODUCTION
The intestine exerts a feedback control on gastric emptying,and thereby regulates the rate of nutrient delivery into theintestine. The duodenum, in particular, plays a key role inthis process, by modulating the level of gastric tone viaentero-gastric reflexes. The mechanisms that control thegastric relaxatory response to intestinal nutrients have beenextensively studied in experimental animal models[1]. Humandata are relatively scarce. Although it has been shown thatduodenal nutrients induce a gastric relaxation, and that thiseffect depends on the type of nutrient[2-4], comparativedose-related responses to various nutrients are not available.Our aim was to compare the relative potency of duodeno-gastricrelaxatory reflexes induced physiologically by different typesof nutrients, namely, lipids vs carbohydrates in healthyhumans employing a combination of enteric nutrient infusionand measurement of gastric tone responses by the barostat.
MAMAMAMAMATERIALS AND METHODSTERIALS AND METHODSTERIALS AND METHODSTERIALS AND METHODSTERIALS AND METHODS
ParticipantsTwelve healthy subjects without gastrointestinal symptoms(seven women, five men; 20-26 years of age) participatedin the study after giving written informed consent. Theprotocol for the study was previously approved by theInstitutional Review Board of the University Hospital Valld’Hebron.
Duodenal nutrient infusionUsing an intra-luminal polyvinyl tube (2 mm outer diameter)located into the duodenum, either saline solution, carbohydrates(Maxijul®; Scientific Hospital Supplies, Barcelona, Spain)or lipids (Intralipid®, Pharmacia and Upjohn, St Cugat delValles, Spain) were continuously infused at 2 mL/min rateusing a perfusion pump (Asid Bonz PP50-300; Lubratronics,Unterschleisshein, Germany). Nutrients were diluted in salineto various caloric concentrations. All perfusates were adjustedto 300 mOsm/L and pH 7.
Gastric tone measurementGastric tone was continuously measured using a barostatconnected by a double lumen tube (127 Argyle; SherwoodMedical, St. Louis, MO, USA) to an intra-gastric bag (1 Lcapacity, 36 cm maximal diameter, made of ultrathin
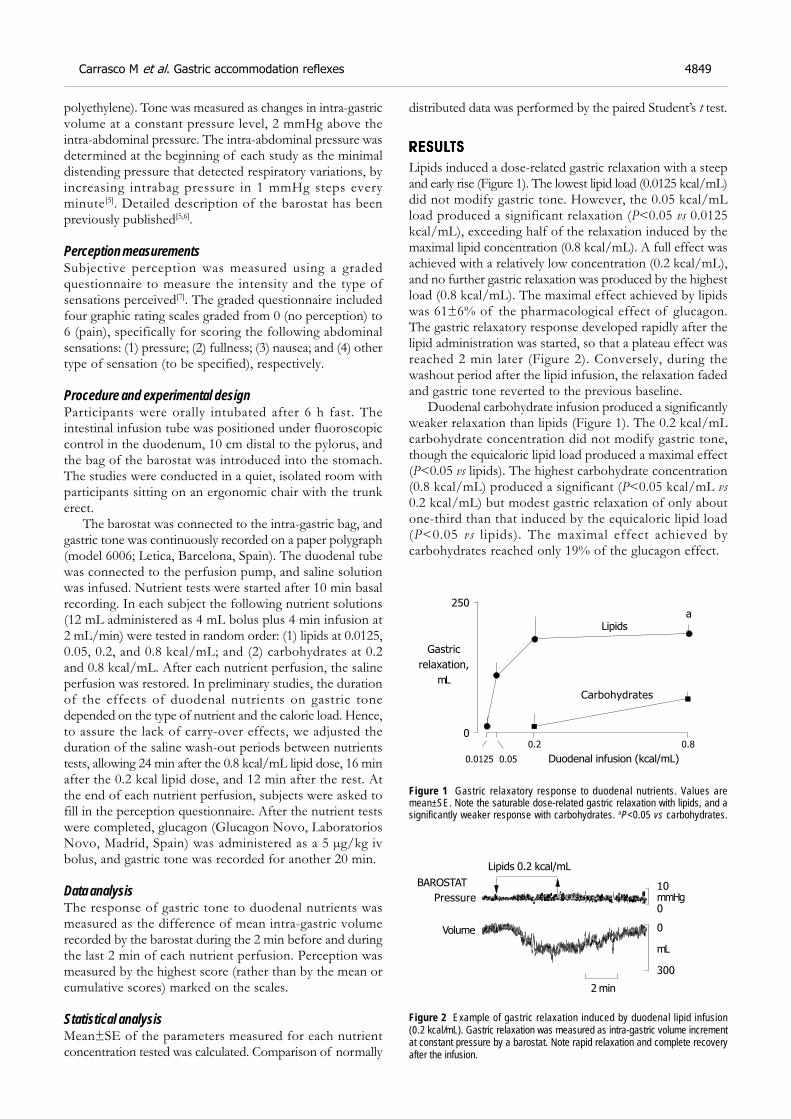
polyethylene). Tone was measured as changes in intra-gastricvolume at a constant pressure level, 2 mmHg above theintra-abdominal pressure. The intra-abdominal pressure wasdetermined at the beginning of each study as the minimaldistending pressure that detected respiratory variations, byincreasing intrabag pressure in 1 mmHg steps everyminute[5]. Detailed description of the barostat has beenpreviously published[5,6].
Perception measurementsSubjective perception was measured using a gradedquestionnaire to measure the intensity and the type ofsensations perceived[7]. The graded questionnaire includedfour graphic rating scales graded from 0 (no perception) to6 (pain), specifically for scoring the following abdominalsensations: (1) pressure; (2) fullness; (3) nausea; and (4) othertype of sensation (to be specified), respectively.
Procedure and experimental designParticipants were orally intubated after 6 h fast. Theintestinal infusion tube was positioned under fluoroscopiccontrol in the duodenum, 10 cm distal to the pylorus, andthe bag of the barostat was introduced into the stomach.The studies were conducted in a quiet, isolated room withparticipants sitting on an ergonomic chair with the trunkerect.
The barostat was connected to the intra-gastric bag, andgastric tone was continuously recorded on a paper polygraph(model 6006; Letica, Barcelona, Spain). The duodenal tubewas connected to the perfusion pump, and saline solutionwas infused. Nutrient tests were started after 10 min basalrecording. In each subject the following nutrient solutions(12 mL administered as 4 mL bolus plus 4 min infusion at2 mL/min) were tested in random order: (1) lipids at 0.0125,0.05, 0.2, and 0.8 kcal/mL; and (2) carbohydrates at 0.2and 0.8 kcal/mL. After each nutrient perfusion, the salineperfusion was restored. In preliminary studies, the durationof the effects of duodenal nutrients on gastric tonedepended on the type of nutrient and the caloric load. Hence,to assure the lack of carry-over effects, we adjusted theduration of the saline wash-out periods between nutrientstests, allowing 24 min after the 0.8 kcal/mL lipid dose, 16 minafter the 0.2 kcal lipid dose, and 12 min after the rest. Atthe end of each nutrient perfusion, subjects were asked tofill in the perception questionnaire. After the nutrient testswere completed, glucagon (Glucagon Novo, LaboratoriosNovo, Madrid, Spain) was administered as a 5 µg/kg ivbolus, and gastric tone was recorded for another 20 min.
Data analysisThe response of gastric tone to duodenal nutrients wasmeasured as the difference of mean intra-gastric volumerecorded by the barostat during the 2 min before and duringthe last 2 min of each nutrient perfusion. Perception wasmeasured by the highest score (rather than by the mean orcumulative scores) marked on the scales.
Statistical analysisMean±SE of the parameters measured for each nutrientconcentration tested was calculated. Comparison of normally
distributed data was performed by the paired Student’s t test.
RESULRESULRESULRESULRESULTSTSTSTSTS
Lipids induced a dose-related gastric relaxation with a steepand early rise (Figure 1). The lowest lipid load (0.0125 kcal/mL)did not modify gastric tone. However, the 0.05 kcal/mLload produced a significant relaxation (P<0.05 vs 0.0125kcal/mL), exceeding half of the relaxation induced by themaximal lipid concentration (0.8 kcal/mL). A full effect wasachieved with a relatively low concentration (0.2 kcal/mL),and no further gastric relaxation was produced by the highestload (0.8 kcal/mL). The maximal effect achieved by lipidswas 61±6% of the pharmacological effect of glucagon.The gastric relaxatory response developed rapidly after thelipid administration was started, so that a plateau effect wasreached 2 min later (Figure 2). Conversely, during thewashout period after the lipid infusion, the relaxation fadedand gastric tone reverted to the previous baseline.
Duodenal carbohydrate infusion produced a significantlyweaker relaxation than lipids (Figure 1). The 0.2 kcal/mLcarbohydrate concentration did not modify gastric tone,though the equicaloric lipid load produced a maximal effect(P<0.05 vs lipids). The highest carbohydrate concentration(0.8 kcal/mL) produced a significant (P<0.05 kcal/mL vs0.2 kcal/mL) but modest gastric relaxation of only aboutone-third than that induced by the equicaloric lipid load(P<0.05 vs lipids). The maximal effect achieved bycarbohydrates reached only 19% of the glucagon effect.
Figure 1 Gastric relaxatory response to duodenal nutrients. Values aremean±SE. Note the saturable dose-related gastric relaxation with lipids, and asignificantly weaker response with carbohydrates. aP<0.05 vs carbohydrates.
Figure 2 Example of gastric relaxation induced by duodenal lipid infusion(0.2 kcal/mL). Gastric relaxation was measured as intra-gastric volume incrementat constant pressure by a barostat. Note rapid relaxation and complete recoveryafter the infusion.
Gastric
relaxation,
mL
Lipids
250
0
Carbohydrates
Duodenal infusion (kcal/mL)
0.2 0.8
0.0125 0.05
Lipids 0.2 kcal/mL
Pressure
Volume
BAROSTAT
2 min
10mmHg0
0
mL
300
Carrasco M et al. Gastric accommodation reflexes 4849
a
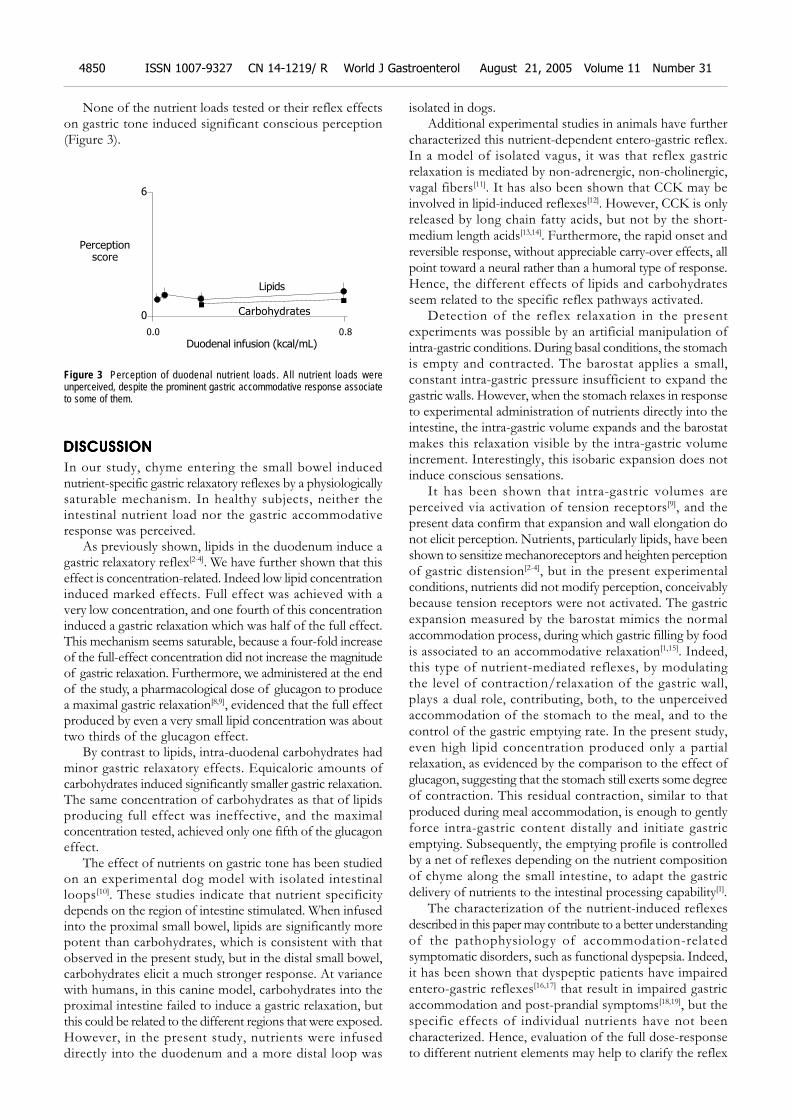
None of the nutrient loads tested or their reflex effectson gastric tone induced significant conscious perception(Figure 3).
Figure 3 Perception of duodenal nutrient loads. All nutrient loads wereunperceived, despite the prominent gastric accommodative response associateto some of them.
DISCUSSIONDISCUSSIONDISCUSSIONDISCUSSIONDISCUSSION
In our study, chyme entering the small bowel inducednutrient-specific gastric relaxatory reflexes by a physiologicallysaturable mechanism. In healthy subjects, neither theintestinal nutrient load nor the gastric accommodativeresponse was perceived.
As previously shown, lipids in the duodenum induce agastric relaxatory reflex[2-4]. We have further shown that thiseffect is concentration-related. Indeed low lipid concentrationinduced marked effects. Full effect was achieved with avery low concentration, and one fourth of this concentrationinduced a gastric relaxation which was half of the full effect.This mechanism seems saturable, because a four-fold increaseof the full-effect concentration did not increase the magnitudeof gastric relaxation. Furthermore, we administered at the endof the study, a pharmacological dose of glucagon to producea maximal gastric relaxation[8,9], evidenced that the full effectproduced by even a very small lipid concentration was abouttwo thirds of the glucagon effect.
By contrast to lipids, intra-duodenal carbohydrates hadminor gastric relaxatory effects. Equicaloric amounts ofcarbohydrates induced significantly smaller gastric relaxation.The same concentration of carbohydrates as that of lipidsproducing full effect was ineffective, and the maximalconcentration tested, achieved only one fifth of the glucagoneffect.
The effect of nutrients on gastric tone has been studiedon an experimental dog model with isolated intestinalloops[10]. These studies indicate that nutrient specificitydepends on the region of intestine stimulated. When infusedinto the proximal small bowel, lipids are significantly morepotent than carbohydrates, which is consistent with thatobserved in the present study, but in the distal small bowel,carbohydrates elicit a much stronger response. At variancewith humans, in this canine model, carbohydrates into theproximal intestine failed to induce a gastric relaxation, butthis could be related to the different regions that were exposed.However, in the present study, nutrients were infuseddirectly into the duodenum and a more distal loop was
isolated in dogs.Additional experimental studies in animals have further
characterized this nutrient-dependent entero-gastric reflex.In a model of isolated vagus, it was that reflex gastricrelaxation is mediated by non-adrenergic, non-cholinergic,vagal fibers[11]. It has also been shown that CCK may beinvolved in lipid-induced reflexes[12]. However, CCK is onlyreleased by long chain fatty acids, but not by the short-medium length acids[13,14]. Furthermore, the rapid onset andreversible response, without appreciable carry-over effects, allpoint toward a neural rather than a humoral type of response.Hence, the different effects of lipids and carbohydratesseem related to the specific reflex pathways activated.
Detection of the reflex relaxation in the presentexperiments was possible by an artificial manipulation ofintra-gastric conditions. During basal conditions, the stomachis empty and contracted. The barostat applies a small,constant intra-gastric pressure insufficient to expand thegastric walls. However, when the stomach relaxes in responseto experimental administration of nutrients directly into theintestine, the intra-gastric volume expands and the barostatmakes this relaxation visible by the intra-gastric volumeincrement. Interestingly, this isobaric expansion does notinduce conscious sensations.
It has been shown that intra-gastric volumes areperceived via activation of tension receptors[9], and thepresent data confirm that expansion and wall elongation donot elicit perception. Nutrients, particularly lipids, have beenshown to sensitize mechanoreceptors and heighten perceptionof gastric distension[2-4], but in the present experimentalconditions, nutrients did not modify perception, conceivablybecause tension receptors were not activated. The gastricexpansion measured by the barostat mimics the normalaccommodation process, during which gastric filling by foodis associated to an accommodative relaxation[1,15]. Indeed,this type of nutrient-mediated reflexes, by modulatingthe level of contraction/relaxation of the gastric wall,plays a dual role, contributing, both, to the unperceivedaccommodation of the stomach to the meal, and to thecontrol of the gastric emptying rate. In the present study,even high lipid concentration produced only a partialrelaxation, as evidenced by the comparison to the effect ofglucagon, suggesting that the stomach still exerts some degreeof contraction. This residual contraction, similar to thatproduced during meal accommodation, is enough to gentlyforce intra-gastric content distally and initiate gastricemptying. Subsequently, the emptying profile is controlledby a net of reflexes depending on the nutrient compositionof chyme along the small intestine, to adapt the gastricdelivery of nutrients to the intestinal processing capability[1].
The characterization of the nutrient-induced reflexesdescribed in this paper may contribute to a better understandingof the pathophysiology of accommodation-relatedsymptomatic disorders, such as functional dyspepsia. Indeed,it has been shown that dyspeptic patients have impairedentero-gastric reflexes[16,17] that result in impaired gastricaccommodation and post-prandial symptoms[18,19], but thespecific effects of individual nutrients have not beencharacterized. Hence, evaluation of the full dose-responseto different nutrient elements may help to clarify the reflex
Perceptionscore
Lipids
6
0 Carbohydrates
Duodenal infusion (kcal/mL)0.0 0.8
4850 ISSN 1007-9327 CN 14-1219/ R World J Gastroenterol August 21, 2005 Volume 11 Number 31
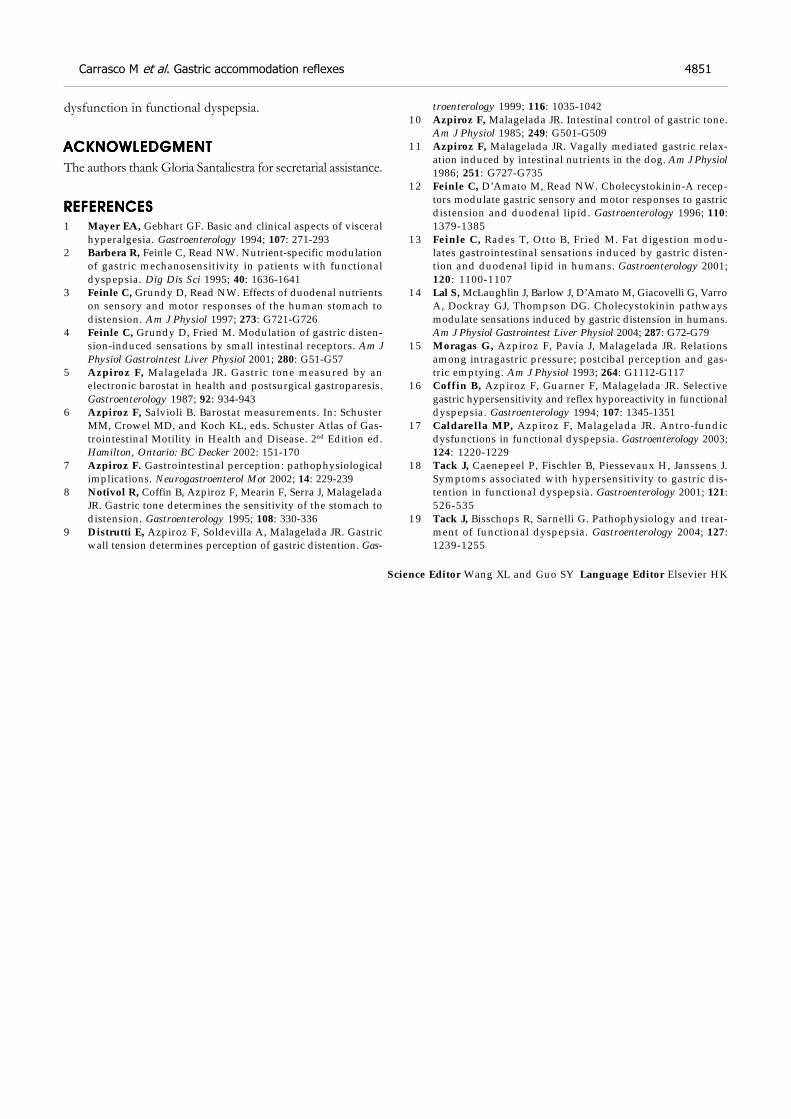
dysfunction in functional dyspepsia.
ACKNOWLEDGMENTACKNOWLEDGMENTACKNOWLEDGMENTACKNOWLEDGMENTACKNOWLEDGMENT
The authors thank Gloria Santaliestra for secretarial assistance.
REFERENCESREFERENCESREFERENCESREFERENCESREFERENCES
1 Mayer EA, Gebhart GF. Basic and clinical aspects of visceralhyperalgesia. Gastroenterology 1994; 107: 271-293
2 Barbera R, Feinle C, Read NW. Nutrient-specific modulationof gastric mechanosensitivity in patients with functionaldyspepsia. Dig Dis Sci 1995; 40: 1636-1641
3 Feinle C, Grundy D, Read NW. Effects of duodenal nutrientson sensory and motor responses of the human stomach todistension. Am J Physiol 1997; 273: G721-G726
4 Feinle C, Grundy D, Fried M. Modulation of gastric disten-sion-induced sensations by small intestinal receptors. Am JPhysiol Gastrointest Liver Physiol 2001; 280: G51-G57
5 Azpiroz F, Malagelada JR. Gastric tone measured by anelectronic barostat in health and postsurgical gastroparesis.Gastroenterology 1987; 92: 934-943
6 Azpiroz F, Salvioli B. Barostat measurements. In: SchusterMM, Crowel MD, and Koch KL, eds. Schuster Atlas of Gas-trointestinal Motility in Health and Disease. 2nd Edition ed.Hamilton, Ontario: BC Decker 2002: 151-170
7 Azpiroz F. Gastrointestinal perception: pathophysiologicalimplications. Neurogastroenterol Mot 2002; 14: 229-239
8 Notivol R, Coffin B, Azpiroz F, Mearin F, Serra J, MalageladaJR. Gastric tone determines the sensitivity of the stomach todistension. Gastroenterology 1995; 108: 330-336
9 Distrutti E, Azpiroz F, Soldevilla A, Malagelada JR. Gastricwall tension determines perception of gastric distention. Gas-
troenterology 1999; 116: 1035-104210 Azpiroz F, Malagelada JR. Intestinal control of gastric tone.
Am J Physiol 1985; 249: G501-G50911 Azpiroz F, Malagelada JR. Vagally mediated gastric relax-
ation induced by intestinal nutrients in the dog. Am J Physiol1986; 251: G727-G735
12 Feinle C, D’Amato M, Read NW. Cholecystokinin-A recep-tors modulate gastric sensory and motor responses to gastricdistension and duodenal lipid. Gastroenterology 1996; 110:1379-1385
13 Feinle C, Rades T, Otto B, Fried M. Fat digestion modu-lates gastrointestinal sensations induced by gastric disten-tion and duodenal lipid in humans. Gastroenterology 2001;120: 1100-1107
14 Lal S, McLaughlin J, Barlow J, D’Amato M, Giacovelli G, VarroA, Dockray GJ, Thompson DG. Cholecystokinin pathwaysmodulate sensations induced by gastric distension in humans.Am J Physiol Gastrointest Liver Physiol 2004; 287: G72-G79
15 Moragas G, Azpiroz F, Pavía J, Malagelada JR. Relationsamong intragastric pressure; postcibal perception and gas-tric emptying. Am J Physiol 1993; 264: G1112-G117
16 Coffin B, Azpiroz F, Guarner F, Malagelada JR. Selectivegastric hypersensitivity and reflex hyporeactivity in functionaldyspepsia. Gastroenterology 1994; 107: 1345-1351
17 Caldarella MP, Azpiroz F, Malagelada JR. Antro-fundicdysfunctions in functional dyspepsia. Gastroenterology 2003;124: 1220-1229
18 Tack J, Caenepeel P, Fischler B, Piessevaux H, Janssens J.Symptoms associated with hypersensitivity to gastric dis-tention in functional dyspepsia. Gastroenterology 2001; 121:526-535
19 Tack J, Bisschops R, Sarnelli G. Pathophysiology and treat-ment of functional dyspepsia. Gastroenterology 2004; 127:1239-1255
Science Editor Wang XL and Guo SY Language Editor Elsevier HK
Carrasco M et al. Gastric accommodation reflexes 4851
• BRIEF REPORTS •
Overexpression of S100A4 is closely associated with progression
of colorectal cancer
Yong-Gu Cho, Chang-Jae Kim, Suk-Woo Nam, Shin-Hee Yoon, Sug-Hyung Lee, Nam-Jin Yoo, Jung-Young Lee,
Won-Sang Park
ELSEVIER
PO Box 2345, Beijing 100023, China World J Gastroenterol 2005;11(31):4852-4856www.wjgnet.com World Journal of Gastroenterology ISSN [email protected] © 2005 The WJG Press and Elsevier Inc. All rights reserved.
Yong-Gu Cho, Chang-Jae Kim, Suk-Woo Nam, Sug-HyungLee, Nam-Jin Yoo, Jung-Young Lee, Won-Sang Park,Department of Pathology, College of Medicine, The CatholicUniversity of Korea, 505 Banpo-dong, Seocho-gu, Seoul 137-701,South KoreaShin-Hee Yoon, Department of Physiology, College of Medicine,The Catholic University of Korea, 505 Banpo-dong, Seocho-gu,Seoul 137-701, South KoreaSupported by the Korea Science and Engineering Foundation, No.R13-2002-005-01004-0Correspondence to: Dr. Won-Sang Park, Department of Pathology,College of Medicine, The Catholic University of Korea, 505 Banpo-dong,Seocho-gu, Seoul 137-701, South Korea. [email protected]: +82-2-590-1192 Fax: +82-2-537-6586Received: 2005-01-11 Accepted: 2005-01-26
AbstractAbstractAbstractAbstractAbstract
AIM: To investigate whether S100A4 played an important
role in the development or progression of colorectal
cancer.
METHODS: A total of 124 colorectal adenocarcinoma
tissue specimens were analyzed by immunohistochemistry
for the expression of S100A4 protein and subsequently
investigated for the gene mutations in the coding region
of S100A4 gene. The specimens were collected over a
3-year period in the laboratories at our large teaching
hospital in Seoul, Republic of Korea.
RESULTS: Normal colonic epithelium either failed to express
or showed focal weak expression of S100A4. Moderate to
strong cytoplasmic expression of S100A4 was seen in 69
(55.6%) of the 124 colorectal carcinoma tissue specimens.
S100A4 expression was detected in 43 (69.4%) of 62
specimens with lymph node metastasis. Statistically,
overexpression of S100A4 was significantly associated with
Dukes’ stage and lymph node metastasis. Nuclear staining
was also observed in 24 (19.4%) of 124 samples and closely
associated with Dukes’ stage. However, there was no
significant correlation between overexpression of S100A4
and other investigated clinico-pathologic parameters,
including tumor localization, tumor size, and survival period.
In mutational analysis, no gene mutation was found in the
analyzed genomic area of colorectal cancer.
CONCLUSION: Overexpression of S100A4 may be closely
related with the aggressiveness of colorectal carcinoma.
© 2005 The WJG Press and Elsevier Inc. All rights reserved.
Key words: S100A4; Mutation; Immunohistochemistry;Colorectal cancer; Tumor stage
Cho YG, Kim CJ, Nam SW, Yoon SH, Lee SH, Yoo NJ, LeeJY, Park WS. Overexpression of S100A4 is closely associatedwith progression of colorectal cancer. World J Gastroenterol
2005; 11(31): 4852-4856
http://www.wjgnet.com/1007-9327/11/4852.asp
INTRODUCTIONINTRODUCTIONINTRODUCTIONINTRODUCTIONINTRODUCTION
Colorectal cancer remains one of the most frequentmalignant neoplasms worldwide. In Korea, it accounts foran estimated 9.9% of all malignancies, with 9.7% in themale population and 10.2% in the female population[1]. Themajor cause of death is the metastatic spread of the diseasefrom the primary tumor to distant sites, especially to theliver[2]. Research into colorectal cancer has highlighted theprognostic significance of TNM tumor staging includingdepth of tumor invasion, involvement of regional lymphnodes, and infiltration to distant organs. Although there area lot of reports showing the significance of many otherprognostic parameters such as histological grade, serumcarcino-embryonic antigen levels and flow cytometric DNAanalysis, none of them has been widely used in the clinic[3-5].
The concept of multi-stage carcinogenesis has been widelyaccepted as a consequence of multiple genetic alterationsaccumulated in cancer cells[6]. Interestingly, stepwiseaccumulation of genetic alterations during progression hasobserved in several tumor types, particularly in tumors ofepithelial origin like colorectal cancer. It is also well knownthat highly metastatic cells often acquire more geneticalterations than non-metastatic cells. Therefore, it isindispensable to identify the genes, whose alterationsaccumulate during cancer progression as well as the genes,whose expression is responsible for the acquisition ofinvasive and/or metastatic potential in cancer cells.
The S100 family of calcium binding proteins has beenshown to be involved in a variety of physiological functions,such as cell proliferation, extracellular signal transduction,intercellular adhesion, and motility as well as cancermetastasis[7-9]. Of these, S100A4 (mts1, p9Ka, calvasculin)has been identified as a cytoplasmic protein in normal cells,which is associated with the actin/myosin cytoskeleton infixed cells[10]. Interestingly, elevated levels of S100A4 areclosely associated with the process of metastasis in severalhuman solid cancers including gastric cancer[11,12], colorectaladenocarcinoma[13-15], and breast cancer[16]. Recently,
Flatmark et al.[15], reported, that nuclear localization ofS100A4 is correlated with tumor stage in colorectal cancer.Furthermore, S100A4 secreted from tumor cells canincrease endothelial cell motility and hence induceangiogenesis[17]. All these findings suggest that S100A4may exert its effect on metastasis formation not only bystimulating the motility of tumor cells but also by affectingtheir invasive properties through deregulation of theextracellular matrix[18]. In the present study, to investigatewhether S100A4 played an important role in thedevelopment and/or progression of Korean colorectalcancers, the expression patterns of S100A4 in 124 colorectaladenocarcinoma tissues were examined. We also performedmutational analysis of the S100A4 gene, one of the possibleoverexpression mechanisms of oncogenic proteins.
MAMAMAMAMATERIALS AND METHODSTERIALS AND METHODSTERIALS AND METHODSTERIALS AND METHODSTERIALS AND METHODS
Tissue samplesOne hundred and twenty-four colorectal cancer patientsbetween 2001 and 2002 were enrolled in this study andtheir tissue samples were formalin-fixed and paraffin-embedded. No patient had a family history of colorectalcancer. Tumor stage was classified according to Dukes’criteria. Thirteen patients were classified as Dukes’ A, 47 asDukes’ B, 56 as Dukes’ C and 8 as Dukes’ D. Theobservation time was 14-38 mo for the survivors. Amongthe 113 patients who were followed up, 15 patients showedrelapse of cancer and 11 patients died of cancer duringthis time. Two pathologists screened histological sectionsand selected areas of the representative tumor cells. Threetissue cores (0.6 mm in diameter) were taken from eachtumor sample and placed in a new recipient paraffin blockusing a commercially available microarray instrument(Beecher Instruments, Micro-Array Technologies, SilverSpring, MD, USA), according to the established methods[19].One cylinder of normal colonic mucosa adjacent to eachtumor was also transferred to the recipient block.
MicrodissectionThe histological section were stained with hematoxylinand eosin (H and E) and reviewed. Malignant cells wereselectively procured from H and E stained slides withoutnormal cell contamination using a laser micro-dissectiondevice (ION LMD, Jungwoo International Co, Seoul, SouthKorea). Corresponding normal cells were obtained fromnon-metastatic lymph nodes. DNA was extracted by amodified single-step DNA extraction method, as describedpreviously[20].
Single strand conformation polymorphism (SSCP) analysisGenomic DNAs from tumor cells and correspondingnormal cells were amplified with 2 primer pairs coveringexons 2 and 3, the coding region of S100A4. The primersequences were as follows: 5’-CCAGATCCTGACTGCTGTC-3’ and 5’-GACTCACTCAGGCACTACCC-3’ forexon 2, and 5’-GGGCTTCTGTTTTCTATC TGT-3’ and5’-CCAACCACA TCAGAG GAG-3’ for exon 3. Each PCRwas performed under standard conditions in a 10 µL reactionmixture containing 1 µL of template DNA, 0.5 µmol/L
of each primer, 0.2 µmol/L of each deoxynucleotidetriphosphate, 1.5 mmol/L MgCl2, 0.4 unit of Ampli Taqgold polymerase (Perkin-Elmer, Foster City, CA, USA),0.5 µCi of [32P]dCTP (Amersham, Buckinghamshire, UK),and 1 µL of 10X buffer. The reaction mixture wasdenatured for 1 min at 94 and amplified for 35 cycles(denaturing for 40 s at 94 , annealing for 40 s at 56 ,and extending for 40 s at 72 ). Final extension wascontinued for 5 min at 72 . After amplification, PCRproducts were denatured for 5 min at 95 at a 1:1 dilutionof sample buffer containing 98% formamide/5 mmol/LNaOH and loaded onto a SSCP gel (FMC mutation detectionenhancement system; Intermountain Scientific, Kaysville,UT, USA) with 10% glycerol. After electrophoresis, the gelswere transferred to 3-mm Whatman paper and dried, andautoradiography was performed with Kodak X-OMAT film(Eastman Kodak, Rochester, NY, USA). We repeated theexperiment thice, including tissue micro-dissection, PCR,SSCP, and sequencing, and found that the data wereconsistent.
Immunohistochemistry for S100A4The primary polyclonal rabbit anti-S100A4 antibody(DAKO, Carpinteria, CA, USA, dilution 1/200) was used.Immunostaining was performed on microarray tissuesections with a tyramide signal amplification kit (NEN LifeScience, Boston, MA, USA) for signal intensification. Antigenretrieval was performed by microwave heating in a citratebuffer (pH 6.0). Other procedures were performed aspreviously described [21]. The reaction products weredeveloped with diaminobenzidine (Sigma, St Louis, MO,USA) and counterstained with hematoxylin. As a negativecontrol, we used non-immune rabbit serum instead of theS100A4 antibody. Three pathologists independentlyreviewed the results. For statistical analysis, the stainedsections were scored microscopically. The number of tumorcells stained in the cytoplasm was semi-quantitativelyestimated and classified into negative and positive: negative0 30% and positive 30% labeling in tumor cells.
RESULRESULRESULRESULRESULTSTSTSTSTS
Mutational analysisWe analyzed mutations of the S100A4 gene in 124 colorectalcarcinoma tissue specimens. There was no aberrant SSCPpattern in DNAs extracted from cancer cells, suggestingthat there were no somatic mutations in the coding regionsof the S100A4 gene in colorectal carcinoma. We found asingle nucleotide polymorphism, which was an A to Gtransition at nucleotide number 99 in both correspondingnormal and tumor DNAs of cases No. 10 and No. 67 (datanot shown). The variation was an identical single nucleotidepolymorphism found in our previous report[11] and showedno amino acid change at codon 33 (Glu Glu, GAAGAG). The data were consistent with triplicate experiments.
Expression of S100A4One hundred and twenty-four colorectal carcinoma tissuespecimens were screened for S100A4 protein expression.The expression was mainly faint or negative in normal colonic
Cho YG et al. Overexpression of S100A4 in colorectal cancer 4853
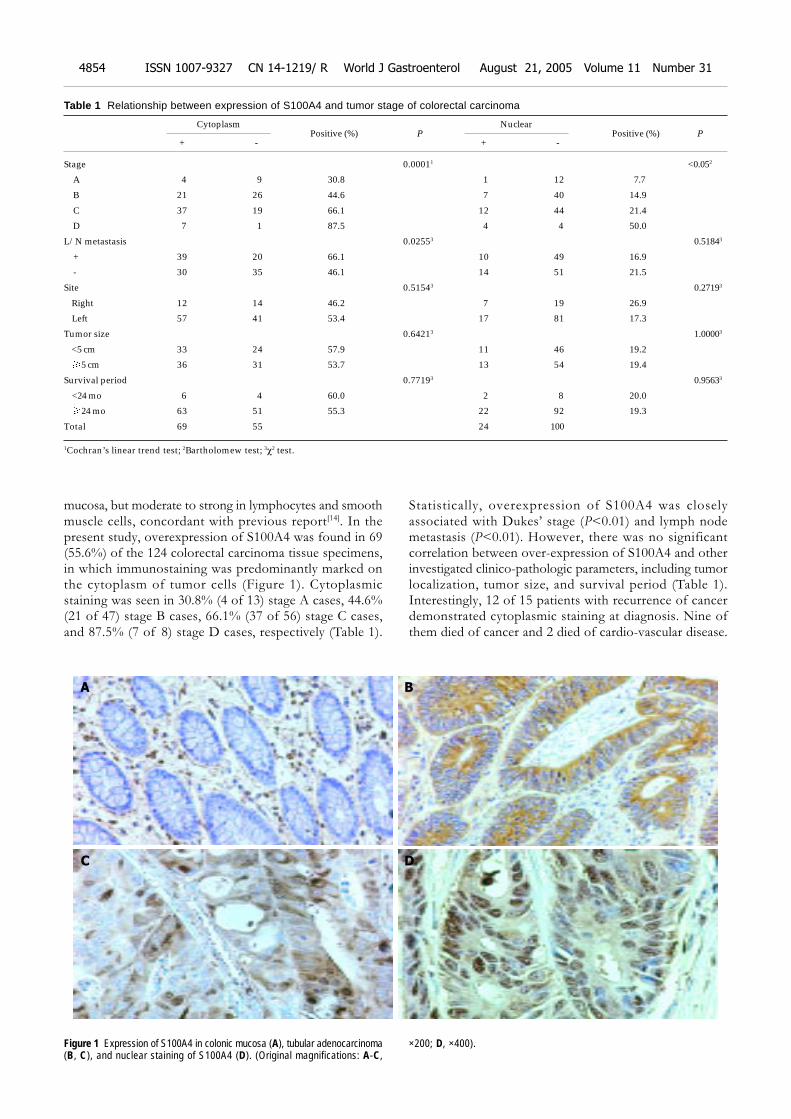
mucosa, but moderate to strong in lymphocytes and smoothmuscle cells, concordant with previous report[14]. In thepresent study, overexpression of S100A4 was found in 69(55.6%) of the 124 colorectal carcinoma tissue specimens,in which immunostaining was predominantly marked onthe cytoplasm of tumor cells (Figure 1). Cytoplasmicstaining was seen in 30.8% (4 of 13) stage A cases, 44.6%(21 of 47) stage B cases, 66.1% (37 of 56) stage C cases,and 87.5% (7 of 8) stage D cases, respectively (Table 1).
Statistically, overexpression of S100A4 was closelyassociated with Dukes’ stage (P<0.01) and lymph nodemetastasis (P<0.01). However, there was no significantcorrelation between over-expression of S100A4 and otherinvestigated clinico-pathologic parameters, including tumorlocalization, tumor size, and survival period (Table 1).Interestingly, 12 of 15 patients with recurrence of cancerdemonstrated cytoplasmic staining at diagnosis. Nine ofthem died of cancer and 2 died of cardio-vascular disease.
Table 1 Relationship between expression of S100A4 and tumor stage of colorectal carcinoma
Cytoplasm Nuclear Positive (%) P Positive (%) P
+ - + -
Stage 0.00011 <0.052
A 4 9 30.8 1 12 7.7
B 21 26 44.6 7 40 14.9
C 37 19 66.1 12 44 21.4
D 7 1 87.5 4 4 50.0
L/N metastasis 0.02553 0.51843
+ 39 20 66.1 10 49 16.9
- 30 35 46.1 14 51 21.5
Site 0.51543 0.27193
Right 12 14 46.2 7 19 26.9
Left 57 41 53.4 17 81 17.3
Tumor size 0.64213 1.00003
<5 cm 33 24 57.9 11 46 19.2
5 cm 36 31 53.7 13 54 19.4
Survival period 0.77193 0.95633
<24 mo 6 4 60.0 2 8 20.0
24 mo 63 51 55.3 22 92 19.3
Total 69 55 24 100
1Cochran’s linear trend test; 2Bartholomew test; 3χ2 test.
Figure 1 Expression of S100A4 in colonic mucosa (A), tubular adenocarcinoma(B, C), and nuclear staining of S100A4 (D). (Original magnifications: A-C,
×200; D, ×400).
A
C D
B
4854 ISSN 1007-9327 CN 14-1219/ R World J Gastroenterol August 21, 2005 Volume 11 Number 31
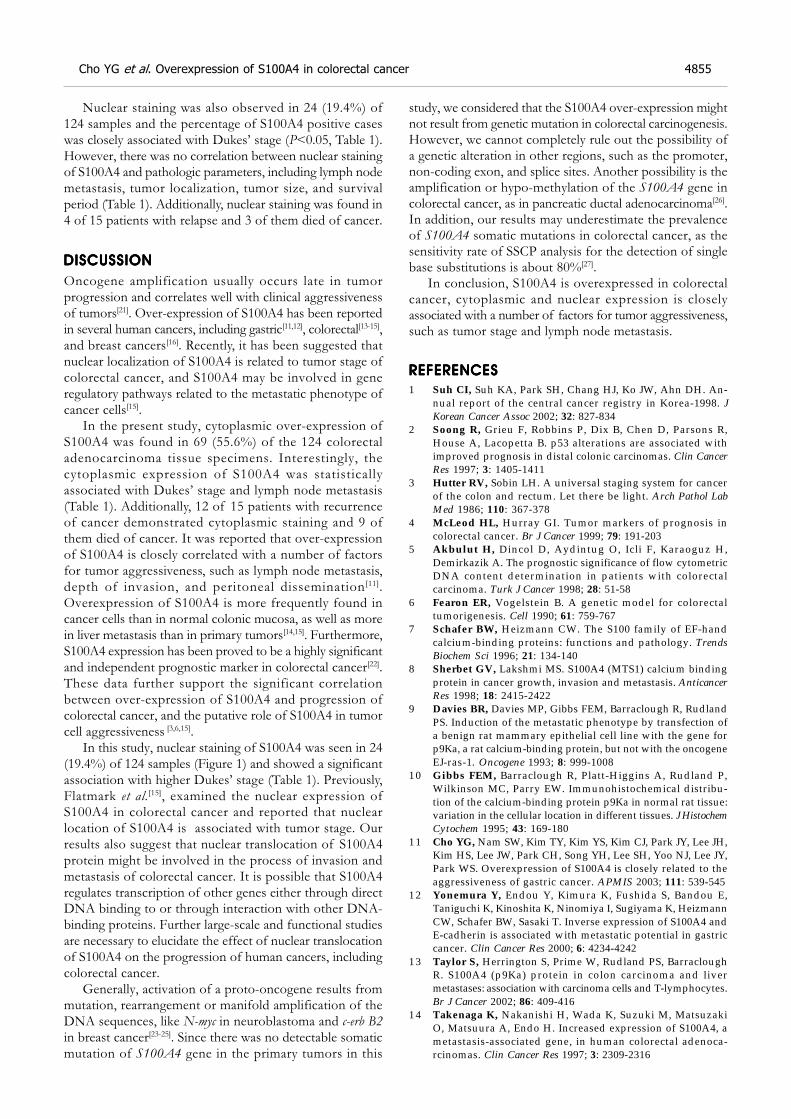
Nuclear staining was also observed in 24 (19.4%) of124 samples and the percentage of S100A4 positive caseswas closely associated with Dukes’ stage (P<0.05, Table 1).However, there was no correlation between nuclear stainingof S100A4 and pathologic parameters, including lymph nodemetastasis, tumor localization, tumor size, and survivalperiod (Table 1). Additionally, nuclear staining was found in4 of 15 patients with relapse and 3 of them died of cancer.
DISCUSSIONDISCUSSIONDISCUSSIONDISCUSSIONDISCUSSION
Oncogene amplification usually occurs late in tumorprogression and correlates well with clinical aggressivenessof tumors[21]. Over-expression of S100A4 has been reportedin several human cancers, including gastric[11,12], colorectal[13-15],and breast cancers[16]. Recently, it has been suggested thatnuclear localization of S100A4 is related to tumor stage ofcolorectal cancer, and S100A4 may be involved in generegulatory pathways related to the metastatic phenotype ofcancer cells[15].
In the present study, cytoplasmic over-expression ofS100A4 was found in 69 (55.6%) of the 124 colorectaladenocarcinoma tissue specimens. Interestingly, thecytoplasmic expression of S100A4 was statisticallyassociated with Dukes’ stage and lymph node metastasis(Table 1). Additionally, 12 of 15 patients with recurrenceof cancer demonstrated cytoplasmic staining and 9 ofthem died of cancer. It was reported that over-expressionof S100A4 is closely correlated with a number of factorsfor tumor aggressiveness, such as lymph node metastasis,depth of invasion, and peritoneal dissemination [11].Overexpression of S100A4 is more frequently found incancer cells than in normal colonic mucosa, as well as morein liver metastasis than in primary tumors[14,15]. Furthermore,S100A4 expression has been proved to be a highly significantand independent prognostic marker in colorectal cancer[22].These data further support the significant correlationbetween over-expression of S100A4 and progression ofcolorectal cancer, and the putative role of S100A4 in tumorcell aggressiveness [3,6,15].
In this study, nuclear staining of S100A4 was seen in 24(19.4%) of 124 samples (Figure 1) and showed a significantassociation with higher Dukes’ stage (Table 1). Previously,Flatmark et al.[15], examined the nuclear expression ofS100A4 in colorectal cancer and reported that nuclearlocation of S100A4 is associated with tumor stage. Ourresults also suggest that nuclear translocation of S100A4protein might be involved in the process of invasion andmetastasis of colorectal cancer. It is possible that S100A4regulates transcription of other genes either through directDNA binding to or through interaction with other DNA-binding proteins. Further large-scale and functional studiesare necessary to elucidate the effect of nuclear translocationof S100A4 on the progression of human cancers, includingcolorectal cancer.
Generally, activation of a proto-oncogene results frommutation, rearrangement or manifold amplification of theDNA sequences, like N-myc in neuroblastoma and c-erb B2
in breast cancer[23-25]. Since there was no detectable somaticmutation of S100A4 gene in the primary tumors in this
study, we considered that the S100A4 over-expression mightnot result from genetic mutation in colorectal carcinogenesis.However, we cannot completely rule out the possibility ofa genetic alteration in other regions, such as the promoter,non-coding exon, and splice sites. Another possibility is theamplification or hypo-methylation of the S100A4 gene incolorectal cancer, as in pancreatic ductal adenocarcinoma[26].In addition, our results may underestimate the prevalenceof S100A4 somatic mutations in colorectal cancer, as thesensitivity rate of SSCP analysis for the detection of singlebase substitutions is about 80%[27].
In conclusion, S100A4 is overexpressed in colorectalcancer, cytoplasmic and nuclear expression is closelyassociated with a number of factors for tumor aggressiveness,such as tumor stage and lymph node metastasis.
REFERENCESREFERENCESREFERENCESREFERENCESREFERENCES
1 Suh CI, Suh KA, Park SH, Chang HJ, Ko JW, Ahn DH. An-nual report of the central cancer registry in Korea-1998. JKorean Cancer Assoc 2002; 32: 827-834
2 Soong R, Grieu F, Robbins P, Dix B, Chen D, Parsons R,House A, Lacopetta B. p53 alterations are associated withimproved prognosis in distal colonic carcinomas. Clin CancerRes 1997; 3: 1405-1411
3 Hutter RV, Sobin LH. A universal staging system for cancerof the colon and rectum. Let there be light. Arch Pathol LabMed 1986; 110: 367-378
4 McLeod HL, Hurray GI. Tumor markers of prognosis incolorectal cancer. Br J Cancer 1999; 79: 191-203
5 Akbulut H, Dincol D, Aydintug O, Icli F, Karaoguz H,Demirkazik A. The prognostic significance of flow cytometricDNA content determination in patients with colorectalcarcinoma. Turk J Cancer 1998; 28: 51-58
6 Fearon ER, Vogelstein B. A genetic model for colorectaltumorigenesis. Cell 1990; 61: 759-767
7 Schafer BW, Heizmann CW. The S100 family of EF-handcalcium-binding proteins: functions and pathology. TrendsBiochem Sci 1996; 21: 134-140
8 Sherbet GV, Lakshmi MS. S100A4 (MTS1) calcium bindingprotein in cancer growth, invasion and metastasis. AnticancerRes 1998; 18: 2415-2422
9 Davies BR, Davies MP, Gibbs FEM, Barraclough R, RudlandPS. Induction of the metastatic phenotype by transfection ofa benign rat mammary epithelial cell line with the gene forp9Ka, a rat calcium-binding protein, but not with the oncogeneEJ-ras-1. Oncogene 1993; 8: 999-1008
10 Gibbs FEM, Barraclough R, Platt-Higgins A, Rudland P,Wilkinson MC, Parry EW. Immunohistochemical distribu-tion of the calcium-binding protein p9Ka in normal rat tissue:variation in the cellular location in different tissues. J HistochemCytochem 1995; 43: 169-180
11 Cho YG, Nam SW, Kim TY, Kim YS, Kim CJ, Park JY, Lee JH,Kim HS, Lee JW, Park CH, Song YH, Lee SH, Yoo NJ, Lee JY,Park WS. Overexpression of S100A4 is closely related to theaggressiveness of gastric cancer. APMIS 2003; 111: 539-545
12 Yonemura Y, Endou Y, Kimura K, Fushida S, Bandou E,Taniguchi K, Kinoshita K, Ninomiya I, Sugiyama K, HeizmannCW, Schafer BW, Sasaki T. Inverse expression of S100A4 andE-cadherin is associated with metastatic potential in gastriccancer. Clin Cancer Res 2000; 6: 4234-4242
13 Taylor S, Herrington S, Prime W, Rudland PS, BarracloughR. S100A4 (p9Ka) protein in colon carcinoma and livermetastases: association with carcinoma cells and T-lymphocytes.Br J Cancer 2002; 86: 409-416
14 Takenaga K, Nakanishi H, Wada K, Suzuki M, MatsuzakiO, Matsuura A, Endo H. Increased expression of S100A4, ametastasis-associated gene, in human colorectal adenoca-rcinomas. Clin Cancer Res 1997; 3: 2309-2316
Cho YG et al. Overexpression of S100A4 in colorectal cancer 4855
15 Flatmark K, Pedersen KB, Nesland JM, Rasmussen H, AamodtG, Mikalsen SO, Bjornland K, Fodstad O, Mælandsmo GM.Nuclear localization of the metastasis-related protein S100A4correlates with tumour stage in colorectal cancer. J Pathol2003; 200: 589-595
16 Rudland PS, Platt-Higgins A, Renshaw C, West CR,Winstanley JH, Robertson L, Barraclough R. Prognostic sig-nificance of the metastasis-inducing protein S100A4 (p9Ka)in human breast cancer. Cancer Res 2000; 60: 1595-1603
17 Ambartsumian N, Klingelhofer J, Grigorian M, ChristensenC, Kriajevska M, Tulchinsky E, Georgiev G, Berezin V, Bock E,Rygaard J, Cao R, Cao Y, Lukanidin E. The metastasis-asso-ciated Mts1 (S100A4) protein could act as an angiogenic factor.Oncogene 2001; 20: 4685-4695
18 Bjørnland K, Winberg JO, Odegaard OT, Hovig E, LoennechenT, Aasen AO, Fodstad O, Maelandsmo GM. S100A4 involve-ment in metastasis: deregulation of matrix metalloproteinasesand tissue inhibitors of matrix metalloproteinases in osteosa-rcoma cells transfected with an anti-S100A4 ribozyme. Can-cer Res 1999; 59: 4702-4708
19 Kononen J, Bubendorf L, Kallioniemi A, Barlund M, SchramlP, Leighton S, Torhorst J, Mihatsch MJ, Sauter G, KallioniemiOP. Tissue microarrays for high-throughput molecular pro-filing of tumor specimens. Nat Med 1998; 4: 844-847
20 Lee JY, Dong SM, Kim SY, Yoo NJ, Lee SH, Park WS. Asimple, precise and economical microdissection technique foranalysis of genomic DNA from archival tissue sections.Virchows Arch 1998; 433: 305-309
21 Park WS, Oh RR, Kim YS, Park JY, Shin MS, Lee HK, Lee SH,
Yoo NJ, Lee JY. Absence of mutations in the kinase domain ofthe Met gene and frequent expression of Met and HGF/SFprotein in primary gastric carcinomas. APMIS 2000; 108:195-200
22 Gongoll S, Peters G, Mengel M, Piso P, Klempnauer J, KreipeH, von Wasielewski RV. Prognostic significance of calcium-binding protein S100A4 in colorectal cancer. Gastroenterology2002; 123: 1478-1484
23 Yokota J, Tsunetsugu-Yokota Y, Battifora H, Le Fevre C,Cline MJ. Alterations of myc, myb and rasHa proto-oncogenesin cancers are frequent and show clinical correlation. Science1986; 231: 261-265
24 Brodeur GM, Seeger RC, Schwab M, Varmus HE, Bishop JM.Amplification of N-myc in untreated human neuroblasto-mas correlates with advanced disease stage. Science 1984;224: 1121-1124
25 Slamon DJ, Godolphin W, Jones LA, Holt JA, Wong SG,Keith DE, Levin WJ, Stuart SG, Udove J, Ullrich A, Press MF.Studies of the HER2/neu proto-oncogene in human breastand ovarian cancer. Science 1989; 244: 707-712
26 Rosty C, Ueki T, Argani P, Jansen M, Yeo CJ, Cameron JL,Hruban RH, Goggins M. Overexpresion of S100A4 in pancre-atic ductal adenocarcinomas is associated with poor differ-entiation and DNA hypomethylation. Am J Pathol 2002; 160:45-50
27 Sheffield VC, Beck JS, Kwitek AE, Sandstrom DW, StoneEM. The sensitivity of single-strand conformation polymor-phism analysis for the detection of single base substitutions.Genomics 1993; 16: 325-332
Science Editor Wang XL and Guo SY Language Editor Elsevier HK
4856 ISSN 1007-9327 CN 14-1219/ R World J Gastroenterol August 21, 2005 Volume 11 Number 31
• BRIEF REPORTS •
Intra-familial prevalence of hepatitis B virologic markers in HBsAg
positive family members in Nahavand, Iran
Amir Houshang Mohammad Alizadeh, Mitra Ranjbar, Shahin Ansari, Seyed Moayed Alavian, Hamid Mohaghegh Shalmani,
Leila Hekmat, Mohammad Reza Zali
ELSEVIER
PO Box 2345, Beijing 100023, China World J Gastroenterol 2005;11(31):4857-4860www.wjgnet.com World Journal of Gastroenterology ISSN [email protected] © 2005 The WJG Press and Elsevier Inc. All rights reserved.
Amir Houshang Mohammad Alizadeh, Shahin Ansari, HamidMohaghegh Shalmani, Mohammad Reza Zali, Research Centerfor Gastroenterology and Liver Disease, Shaheed Beheshti Universityof Medical Sciences, Tehran, IranMitra Ranjbar, Leila Hekmat, Hemedan University of MedicalSciences, IranSeyed Moayed Alavian, Baghiatallah University of MedicalSciences, Tehran, IranCorrespondence to: Amir Houshang, Mohammad Alizadeh, ResearchCenter for Gastroenterology and Liver Disease, Shaheed BeheshtiUniversity of Medical Sciences, 7th Floor, Taleghani Hospital, YamanStreet, Evin, Tehran 19857, Iran. [email protected]: +98-21-2418871 Fax: +98-21-2402639Received: 2004-12-20 Accepted: 2005-01-05
AbstractAbstractAbstractAbstractAbstract
AIM: To determine the prevalence of hepatitis B in
Nahavand and evaluate the HBsAg positive prevalence infamilies with a member who was confirmed to have HBV
infection.
METHODS: This study was performed in two phases. In
the first phase, 1 824 subjects in Nahavand city were
selected. The interviewers visited the houses of chosenfamilies to fill the questionnaire and take the blood samples.
All subjects signed an informed consent before interviews
and blood sampling. The samples were evaluated for HBVvirologic markers. In the second phase, 115 HBsAg-positive
cases were enrolled and evaluated for HBV virologic
markers.
RESULTS: The prevalence of positive HBsAg in Nahavand
was 2.3%. The most frequent relatives of index caseswere sons and daughters (32.2% and 23.5% respectively).
Twelve (11%) of all family members were HBsAg positive.
Fifty (56.2%) were isolated HBsAb positive and only oneperson (2.5%) was isolated HBcAb positive. The higher
rates of HBsAg marker were detected in the brothers
(1-25%) and fathers (1-12.5%). The infection rate inhusbands and wives of index cases was 10%. Only two
(16.7%) of all HBsAg-positive participants reportedprevious HBV vaccination.
CONCLUSION: The prevalence of intra-familial HBV infectionis lower in Nahavand of Iran compared to other studies.More attention should be paid to HBV vaccination andrisk-lowering activities.
© 2005 The WJG Press and Elsevier Inc. All rights reserved.
Key words: Intra-familial prevalence; Hepatitis B; Nahavand;
Iran
Alizadeh AHM, Ranjbar M, Ansari S, Alavian SM, Shalmani HM,Hekmat L, Zali MR. Intrafamilial prevalence of hepatitis B virologicmarkers in HBsAg positive family members in Nahavand, Iran.World J Gastroenterol 2005; 11(31): 4857-4860
http://www.wjgnet.com/1007-9327/11/4857.asp
INTRODUCTIONINTRODUCTIONINTRODUCTIONINTRODUCTIONINTRODUCTION
Middle East countries including Iran have an intermediateprevalence of hepatitis B. In Iran, hepatitis B prevalence islow as 1.07% in Shiraz and as high as 8.96% in Toiserkan[1].There are three main routes of HBV transmission includingblood, sexual contacts, and horizontal. In endemic regionsof the world such as Africa, Greece, and Hong Kong,vertical transmission from mother to newborn infant andhorizontal transmission among children play an importantrole in intra-familial transmission of HBV. In North Americaand Western Europe, however, the main route of transmissionis intimate sexual contacts[2-4].
A study of general population in Hamadan of Iran[5]
reported that HBV infection is low in unmarried men andwomen (18.26%) and high in widows and divorcees (51.59%),suggesting that horizontal transmission is likely to be theprimary mode of acquisition of HBV infection in childrenand young adults. Also, infection is partly transmitted beforeor soon after birth to babies of HBsAg-carrier mothers.Socio-economic and demographic variables have a greaterimpact on the prevalence of HBV infection than blood ormedical care variables in this population.
In a study in Spain, 848 of family members of 285HBsAg-positive patients were evaluated and reported that33.5% of them were positive for at least one HBV virologicmarker[6]. In the other study in Australia, family membersof 145 HBV patients were studied and the results showedthat 16% of them were HBsAg positive, and that HBVtransmission within families is greater, if the index case hasa HBsAg and HBeAg-positive mother rather than a HBeAg-negative one[7].
The city of Nahavand in Hamedan Province (in westof Iran) has always been considered to have high prevalenceof hepatitis B without any definitive study. This study aimedto determine the prevalence of hepatitis B in Nahavandand evaluate the HBsAg positive prevalence in families witha member who was confirmed to have HBV infection.
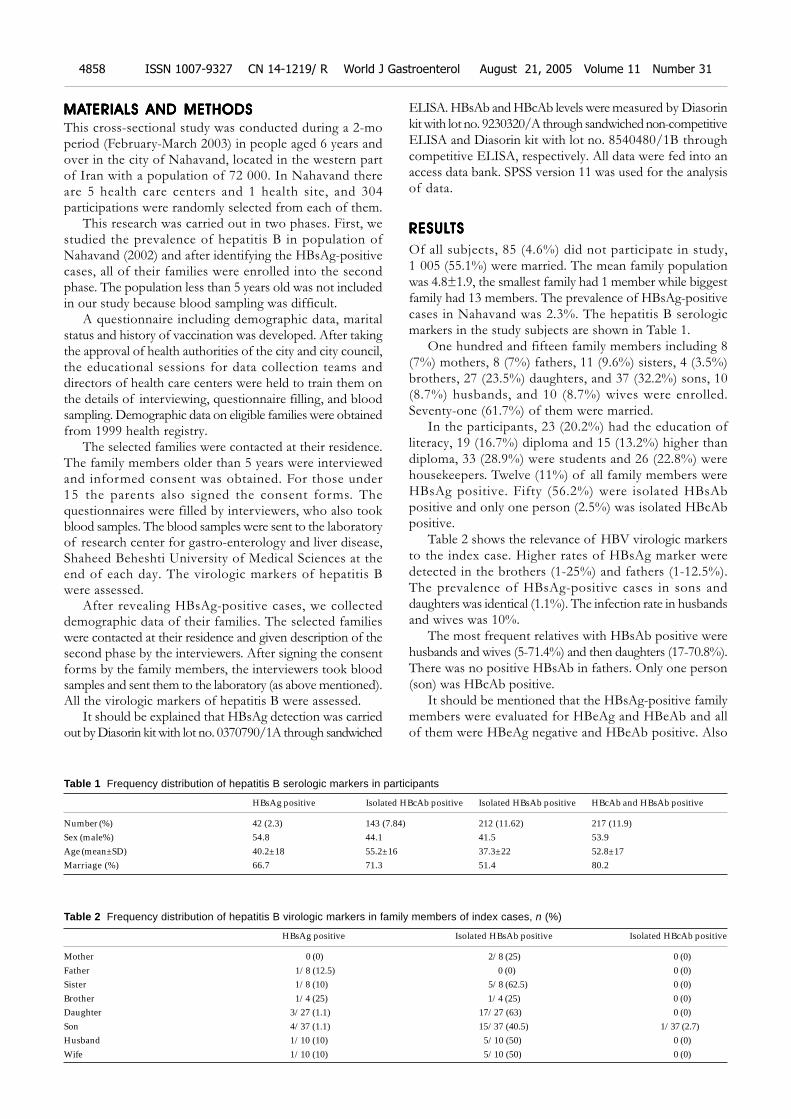
4858 ISSN 1007-9327 CN 14-1219/ R World J Gastroenterol August 21, 2005 Volume 11 Number 31
MAMAMAMAMATERIALS AND METHODSTERIALS AND METHODSTERIALS AND METHODSTERIALS AND METHODSTERIALS AND METHODS
This cross-sectional study was conducted during a 2-moperiod (February-March 2003) in people aged 6 years andover in the city of Nahavand, located in the western partof Iran with a population of 72 000. In Nahavand thereare 5 health care centers and 1 health site, and 304participations were randomly selected from each of them.
This research was carried out in two phases. First, westudied the prevalence of hepatitis B in population ofNahavand (2002) and after identifying the HBsAg-positivecases, all of their families were enrolled into the secondphase. The population less than 5 years old was not includedin our study because blood sampling was difficult.
A questionnaire including demographic data, maritalstatus and history of vaccination was developed. After takingthe approval of health authorities of the city and city council,the educational sessions for data collection teams anddirectors of health care centers were held to train them onthe details of interviewing, questionnaire filling, and bloodsampling. Demographic data on eligible families were obtainedfrom 1999 health registry.
The selected families were contacted at their residence.The family members older than 5 years were interviewedand informed consent was obtained. For those under15 the parents also signed the consent forms. Thequestionnaires were filled by interviewers, who also tookblood samples. The blood samples were sent to the laboratoryof research center for gastro-enterology and liver disease,Shaheed Beheshti University of Medical Sciences at theend of each day. The virologic markers of hepatitis Bwere assessed.
After revealing HBsAg-positive cases, we collecteddemographic data of their families. The selected familieswere contacted at their residence and given description of thesecond phase by the interviewers. After signing the consentforms by the family members, the interviewers took bloodsamples and sent them to the laboratory (as above mentioned).All the virologic markers of hepatitis B were assessed.
It should be explained that HBsAg detection was carriedout by Diasorin kit with lot no. 0370790/1A through sandwiched
ELISA. HBsAb and HBcAb levels were measured by Diasorinkit with lot no. 9230320/A through sandwiched non-competitiveELISA and Diasorin kit with lot no. 8540480/1B throughcompetitive ELISA, respectively. All data were fed into anaccess data bank. SPSS version 11 was used for the analysisof data.
RESULRESULRESULRESULRESULTSTSTSTSTS
Of all subjects, 85 (4.6%) did not participate in study,1 005 (55.1%) were married. The mean family populationwas 4.8±1.9, the smallest family had 1 member while biggestfamily had 13 members. The prevalence of HBsAg-positivecases in Nahavand was 2.3%. The hepatitis B serologicmarkers in the study subjects are shown in Table 1.
One hundred and fifteen family members including 8(7%) mothers, 8 (7%) fathers, 11 (9.6%) sisters, 4 (3.5%)brothers, 27 (23.5%) daughters, and 37 (32.2%) sons, 10(8.7%) husbands, and 10 (8.7%) wives were enrolled.Seventy-one (61.7%) of them were married.
In the participants, 23 (20.2%) had the education ofliteracy, 19 (16.7%) diploma and 15 (13.2%) higher thandiploma, 33 (28.9%) were students and 26 (22.8%) werehousekeepers. Twelve (11%) of all family members wereHBsAg positive. Fifty (56.2%) were isolated HBsAbpositive and only one person (2.5%) was isolated HBcAbpositive.
Table 2 shows the relevance of HBV virologic markersto the index case. Higher rates of HBsAg marker weredetected in the brothers (1-25%) and fathers (1-12.5%).The prevalence of HBsAg-positive cases in sons anddaughters was identical (1.1%). The infection rate in husbandsand wives was 10%.
The most frequent relatives with HBsAb positive werehusbands and wives (5-71.4%) and then daughters (17-70.8%).There was no positive HBsAb in fathers. Only one person(son) was HBcAb positive.
It should be mentioned that the HBsAg-positive familymembers were evaluated for HBeAg and HBeAb and allof them were HBeAg negative and HBeAb positive. Also
Table 1 Frequency distribution of hepatitis B serologic markers in participants
HBsAg positive Isolated HBcAb positive Isolated HBsAb positive HBcAb and HBsAb positive
Number (%) 42 (2.3) 143 (7.84) 212 (11.62) 217 (11.9)Sex (male%) 54.8 44.1 41.5 53.9Age (mean±SD) 40.2±18 55.2±16 37.3±22 52.8±17Marriage (%) 66.7 71.3 51.4 80.2
Table 2 Frequency distribution of hepatitis B virologic markers in family members of index cases, n (%)
HBsAg positive Isolated HBsAb positive Isolated HBcAb positive
Mother 0 (0) 2/8 (25) 0 (0)Father 1/8 (12.5) 0 (0) 0 (0)Sister 1/8 (10) 5/8 (62.5) 0 (0)Brother 1/4 (25) 1/4 (25) 0 (0)Daughter 3/27 (1.1) 17/27 (63) 0 (0)Son 4/37 (1.1) 15/37 (40.5) 1/37 (2.7)Husband 1/10 (10) 5/10 (50) 0 (0)Wife 1/10 (10) 5/10 (50) 0 (0)
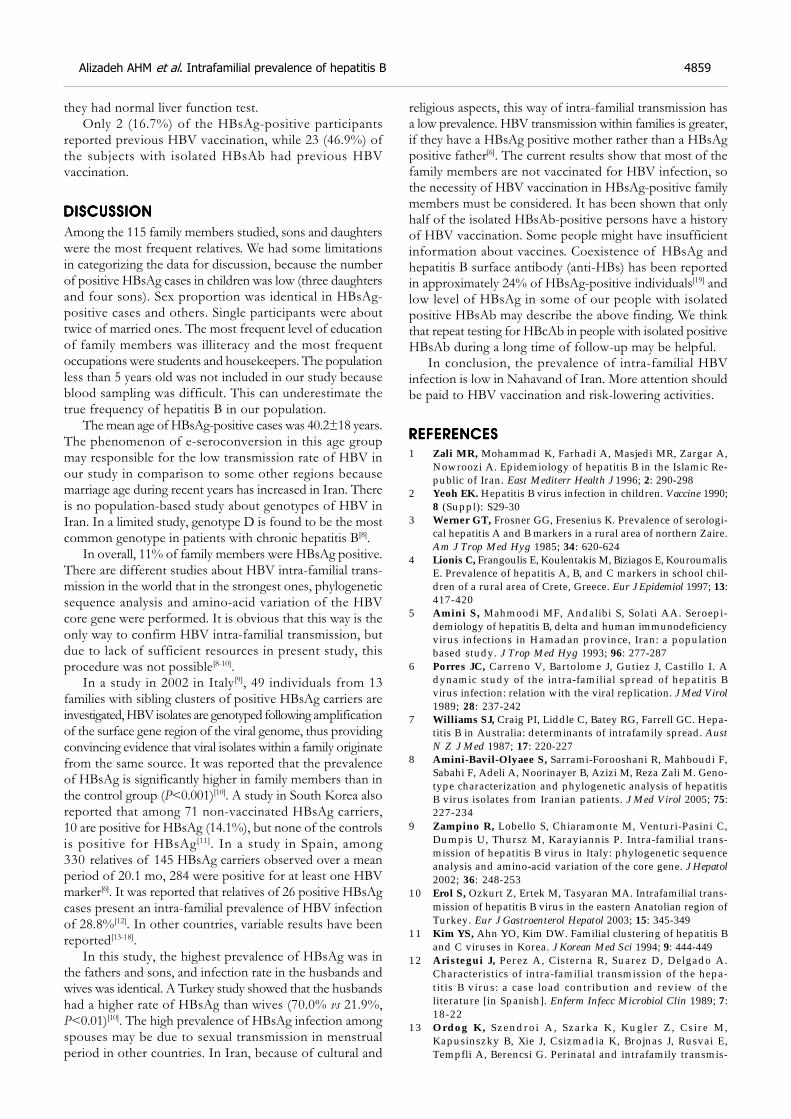
Alizadeh AHM et al. Intrafamilial prevalence of hepatitis B 4859
they had normal liver function test.Only 2 (16.7%) of the HBsAg-positive participants
reported previous HBV vaccination, while 23 (46.9%) ofthe subjects with isolated HBsAb had previous HBVvaccination.
DISCUSSIONDISCUSSIONDISCUSSIONDISCUSSIONDISCUSSION
Among the 115 family members studied, sons and daughterswere the most frequent relatives. We had some limitationsin categorizing the data for discussion, because the numberof positive HBsAg cases in children was low (three daughtersand four sons). Sex proportion was identical in HBsAg-positive cases and others. Single participants were abouttwice of married ones. The most frequent level of educationof family members was illiteracy and the most frequentoccupations were students and housekeepers. The populationless than 5 years old was not included in our study becauseblood sampling was difficult. This can underestimate thetrue frequency of hepatitis B in our population.
The mean age of HBsAg-positive cases was 40.2±18 years.The phenomenon of e-seroconversion in this age groupmay responsible for the low transmission rate of HBV inour study in comparison to some other regions becausemarriage age during recent years has increased in Iran. Thereis no population-based study about genotypes of HBV inIran. In a limited study, genotype D is found to be the mostcommon genotype in patients with chronic hepatitis B[8].
In overall, 11% of family members were HBsAg positive.There are different studies about HBV intra-familial trans-mission in the world that in the strongest ones, phylogeneticsequence analysis and amino-acid variation of the HBVcore gene were performed. It is obvious that this way is theonly way to confirm HBV intra-familial transmission, butdue to lack of sufficient resources in present study, thisprocedure was not possible[8-10].
In a study in 2002 in Italy[9], 49 individuals from 13families with sibling clusters of positive HBsAg carriers areinvestigated, HBV isolates are genotyped following amplificationof the surface gene region of the viral genome, thus providingconvincing evidence that viral isolates within a family originatefrom the same source. It was reported that the prevalenceof HBsAg is significantly higher in family members than inthe control group (P<0.001)[10]. A study in South Korea alsoreported that among 71 non-vaccinated HBsAg carriers,10 are positive for HBsAg (14.1%), but none of the controlsis positive for HBsAg[11]. In a study in Spain, among330 relatives of 145 HBsAg carriers observed over a meanperiod of 20.1 mo, 284 were positive for at least one HBVmarker[6]. It was reported that relatives of 26 positive HBsAgcases present an intra-familial prevalence of HBV infectionof 28.8%[12]. In other countries, variable results have beenreported[13-18].
In this study, the highest prevalence of HBsAg was inthe fathers and sons, and infection rate in the husbands andwives was identical. A Turkey study showed that the husbandshad a higher rate of HBsAg than wives (70.0% vs 21.9%,P<0.01)[10]. The high prevalence of HBsAg infection amongspouses may be due to sexual transmission in menstrualperiod in other countries. In Iran, because of cultural and
religious aspects, this way of intra-familial transmission hasa low prevalence. HBV transmission within families is greater,if they have a HBsAg positive mother rather than a HBsAgpositive father[6]. The current results show that most of thefamily members are not vaccinated for HBV infection, sothe necessity of HBV vaccination in HBsAg-positive familymembers must be considered. It has been shown that onlyhalf of the isolated HBsAb-positive persons have a historyof HBV vaccination. Some people might have insufficientinformation about vaccines. Coexistence of HBsAg andhepatitis B surface antibody (anti-HBs) has been reportedin approximately 24% of HBsAg-positive individuals[19] andlow level of HBsAg in some of our people with isolatedpositive HBsAb may describe the above finding. We thinkthat repeat testing for HBcAb in people with isolated positiveHBsAb during a long time of follow-up may be helpful.
In conclusion, the prevalence of intra-familial HBVinfection is low in Nahavand of Iran. More attention shouldbe paid to HBV vaccination and risk-lowering activities.
REFERENCESREFERENCESREFERENCESREFERENCESREFERENCES
1 Zali MR, Mohammad K, Farhadi A, Masjedi MR, Zargar A,Nowroozi A. Epidemiology of hepatitis B in the Islamic Re-public of Iran. East Mediterr Health J 1996; 2: 290-298
2 Yeoh EK. Hepatitis B virus infection in children. Vaccine 1990;8 (Suppl): S29-30
3 Werner GT, Frosner GG, Fresenius K. Prevalence of serologi-cal hepatitis A and B markers in a rural area of northern Zaire.Am J Trop Med Hyg 1985; 34: 620-624
4 Lionis C, Frangoulis E, Koulentakis M, Biziagos E, KouroumalisE. Prevalence of hepatitis A, B, and C markers in school chil-dren of a rural area of Crete, Greece. Eur J Epidemiol 1997; 13:417-420
5 Amini S, Mahmoodi MF, Andalibi S, Solati AA. Seroepi-demiology of hepatitis B, delta and human immunodeficiencyvirus infections in Hamadan province, Iran: a populationbased study. J Trop Med Hyg 1993; 96: 277-287
6 Porres JC, Carreno V, Bartolome J, Gutiez J, Castillo I. Adynamic study of the intra-familial spread of hepatitis Bvirus infection: relation with the viral replication. J Med Virol1989; 28: 237-242
7 Williams SJ, Craig PI, Liddle C, Batey RG, Farrell GC. Hepa-titis B in Australia: determinants of intrafamily spread. AustN Z J Med 1987; 17: 220-227
8 Amini-Bavil-Olyaee S, Sarrami-Forooshani R, Mahboudi F,Sabahi F, Adeli A, Noorinayer B, Azizi M, Reza Zali M. Geno-type characterization and phylogenetic analysis of hepatitisB virus isolates from Iranian patients. J Med Virol 2005; 75:227-234
9 Zampino R, Lobello S, Chiaramonte M, Venturi-Pasini C,Dumpis U, Thursz M, Karayiannis P. Intra-familial trans-mission of hepatitis B virus in Italy: phylogenetic sequenceanalysis and amino-acid variation of the core gene. J Hepatol2002; 36: 248-253
10 Erol S, Ozkurt Z, Ertek M, Tasyaran MA. Intrafamilial trans-mission of hepatitis B virus in the eastern Anatolian region ofTurkey. Eur J Gastroenterol Hepatol 2003; 15: 345-349
11 Kim YS, Ahn YO, Kim DW. Familial clustering of hepatitis Band C viruses in Korea. J Korean Med Sci 1994; 9: 444-449
12 Aristegui J, Perez A, Cisterna R, Suarez D, Delgado A.Characteristics of intra-familial transmission of the hepa-titis B virus: a case load contribution and review of theliterature [in Spanish]. Enferm Infecc Microbiol Clin 1989; 7:18-22
13 Ordog K, Szendroi A, Szarka K, Kugler Z, Csire M,Kapusinszky B, Xie J, Csizmadia K, Brojnas J, Rusvai E,Tempfli A, Berencsi G. Perinatal and intrafamily transmis-

sion of hepatitis B virus in three generations of a low-preva-lence population. J Med Virol 2003; 70: 194-204
14 Pastore G, Dentico P, Angarano G, Lapedota E, Schiraldi O.Infectivity markers in HBsAg chronic carriers and intra-fa-m i l i a l s p r e a d o f h e p a t i t i s B v i r u s i n f e c t i o n .Hepatogastroenterology 1981; 28: 20-22
15 Thakur V, Guptan RC, Malhotra V, Basir SF, Sarin SK. Preva-lence of hepatitis B infection within family contacts of chronicliver disease patients-does HBeAg positivity really matter? JAssoc Physicians India 2002; 50: 1386-1394
16 Craxi A, Tine F, Vinci M, Almasio P, Camma C, Garofalo G,Pagliaro L. Transmission of hepatitis B and hepatitis deltaviruses in the households of chronic hepatitis B surface anti-
gen carriers: a regression analysis of indicators of risk. Am JEpidemiol 1991; 134: 641-650
17 Dhorje SP, Pavri KM, Prasad SR, Sehgal A, Phule DM.Horizontal transmission of hepatitis B virus infection inhousehold contacts, Pune, India. J Med Virol 1985; 16:183-189
18 Abdool Karim SS, Thejpal R, Coovadia HM. Household clus-tering and intra-household transmission patterns of hepatitisB virus infection in South Africa. Int J Epidemiol 1991; 20:495-503
19 Tsang TK, Blei AT, O’Reilly DJ, Decker R. Clinical signifi-cance of concurrent hepatitis B surface antigen and antibodypositivity. Dig Dis Sci 1986; 31: 620-624
Science Editor Wang XL and Guo SY Language Editor Elsevier HK
4860 ISSN 1007-9327 CN 14-1219/ R World J Gastroenterol August 21, 2005 Volume 11 Number 31
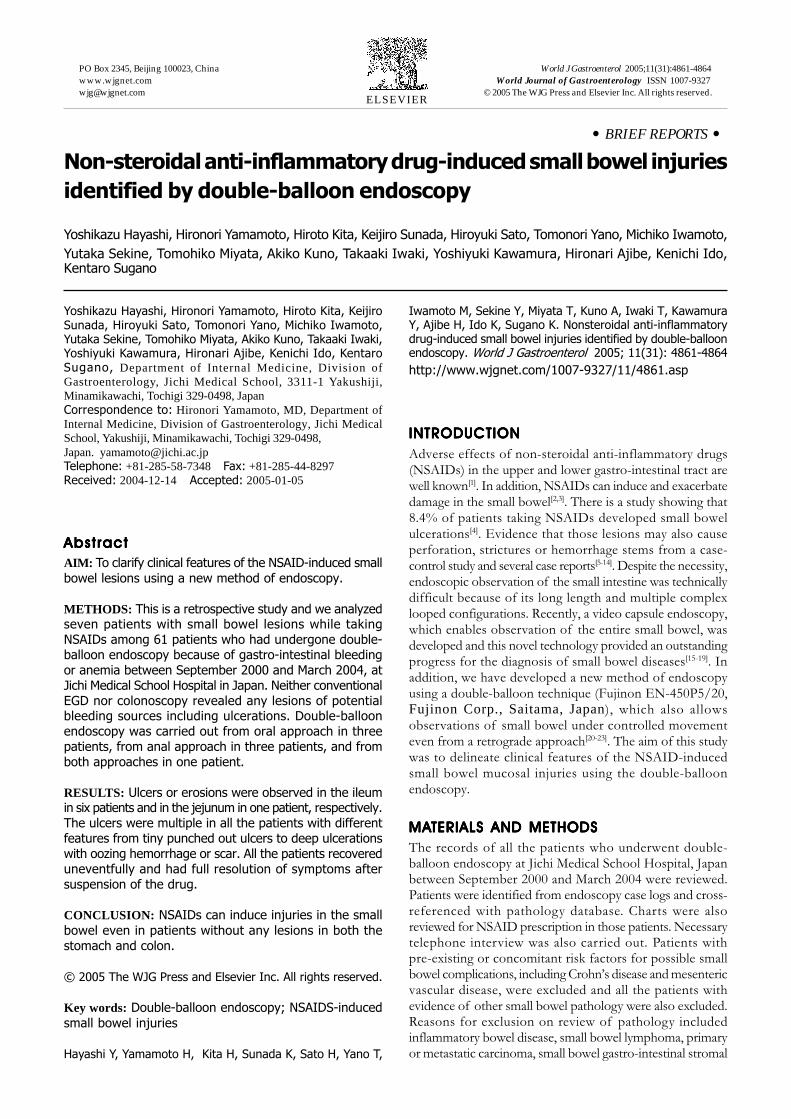
• BRIEF REPORTS •
Non-steroidal anti-inflammatory drug-induced small bowel injuries
identified by double-balloon endoscopy
Yoshikazu Hayashi, Hironori Yamamoto, Hiroto Kita, Keijiro Sunada, Hiroyuki Sato, Tomonori Yano, Michiko Iwamoto,
Yutaka Sekine, Tomohiko Miyata, Akiko Kuno, Takaaki Iwaki, Yoshiyuki Kawamura, Hironari Ajibe, Kenichi Ido,Kentaro Sugano
ELSEVIER
PO Box 2345, Beijing 100023, China World J Gastroenterol 2005;11(31):4861-4864www.wjgnet.com World Journal of Gastroenterology ISSN [email protected] © 2005 The WJG Press and Elsevier Inc. All rights reserved.
Yoshikazu Hayashi, Hironori Yamamoto, Hiroto Kita, KeijiroSunada, Hiroyuki Sato, Tomonori Yano, Michiko Iwamoto,Yutaka Sekine, Tomohiko Miyata, Akiko Kuno, Takaaki Iwaki,Yoshiyuki Kawamura, Hironari Ajibe, Kenichi Ido, KentaroSugano, Department of Internal Medicine, Division ofGastroenterology, Jichi Medical School, 3311-1 Yakushiji,Minamikawachi, Tochigi 329-0498, JapanCorrespondence to: Hironori Yamamoto, MD, Department ofInternal Medicine, Division of Gastroenterology, Jichi MedicalSchool, Yakushiji, Minamikawachi, Tochigi 329-0498,Japan. [email protected]: +81-285-58-7348 Fax: +81-285-44-8297Received: 2004-12-14 Accepted: 2005-01-05
AbstractAbstractAbstractAbstractAbstract
AIM: To clarify clinical features of the NSAID-induced small
bowel lesions using a new method of endoscopy.
METHODS: This is a retrospective study and we analyzedseven patients with small bowel lesions while takingNSAIDs among 61 patients who had undergone double-balloon endoscopy because of gastro-intestinal bleedingor anemia between September 2000 and March 2004, atJichi Medical School Hospital in Japan. Neither conventionalEGD nor colonoscopy revealed any lesions of potentialbleeding sources including ulcerations. Double-balloonendoscopy was carried out from oral approach in threepatients, from anal approach in three patients, and fromboth approaches in one patient.
RESULTS: Ulcers or erosions were observed in the ileumin six patients and in the jejunum in one patient, respectively.The ulcers were multiple in all the patients with differentfeatures from tiny punched out ulcers to deep ulcerationswith oozing hemorrhage or scar. All the patients recovereduneventfully and had full resolution of symptoms aftersuspension of the drug.
CONCLUSION: NSAIDs can induce injuries in the small
bowel even in patients without any lesions in both thestomach and colon.
© 2005 The WJG Press and Elsevier Inc. All rights reserved.
Key words: Double-balloon endoscopy; NSAIDS-induced
small bowel injuries
Hayashi Y, Yamamoto H, Kita H, Sunada K, Sato H, Yano T,
Iwamoto M, Sekine Y, Miyata T, Kuno A, Iwaki T, KawamuraY, Ajibe H, Ido K, Sugano K. Nonsteroidal anti-inflammatorydrug-induced small bowel injuries identified by double-balloonendoscopy. World J Gastroenterol 2005; 11(31): 4861-4864
http://www.wjgnet.com/1007-9327/11/4861.asp
INTRODUCTIONINTRODUCTIONINTRODUCTIONINTRODUCTIONINTRODUCTION
Adverse effects of non-steroidal anti-inflammatory drugs(NSAIDs) in the upper and lower gastro-intestinal tract arewell known[1]. In addition, NSAIDs can induce and exacerbatedamage in the small bowel[2,3]. There is a study showing that8.4% of patients taking NSAIDs developed small bowelulcerations[4]. Evidence that those lesions may also causeperforation, strictures or hemorrhage stems from a case-control study and several case reports[5-14]. Despite the necessity,endoscopic observation of the small intestine was technicallydifficult because of its long length and multiple complexlooped configurations. Recently, a video capsule endoscopy,which enables observation of the entire small bowel, wasdeveloped and this novel technology provided an outstandingprogress for the diagnosis of small bowel diseases[15-19]. Inaddition, we have developed a new method of endoscopyusing a double-balloon technique (Fujinon EN-450P5/20,Fujinon Corp., Saitama, Japan), which also allowsobservations of small bowel under controlled movementeven from a retrograde approach[20-23]. The aim of this studywas to delineate clinical features of the NSAID-inducedsmall bowel mucosal injuries using the double-balloonendoscopy.
MAMAMAMAMATERIALS AND METHODSTERIALS AND METHODSTERIALS AND METHODSTERIALS AND METHODSTERIALS AND METHODS
The records of all the patients who underwent double-balloon endoscopy at Jichi Medical School Hospital, Japanbetween September 2000 and March 2004 were reviewed.Patients were identified from endoscopy case logs and cross-referenced with pathology database. Charts were alsoreviewed for NSAID prescription in those patients. Necessarytelephone interview was also carried out. Patients withpre-existing or concomitant risk factors for possible smallbowel complications, including Crohn’s disease and mesentericvascular disease, were excluded and all the patients withevidence of other small bowel pathology were also excluded.Reasons for exclusion on review of pathology includedinflammatory bowel disease, small bowel lymphoma, primaryor metastatic carcinoma, small bowel gastro-intestinal stromal
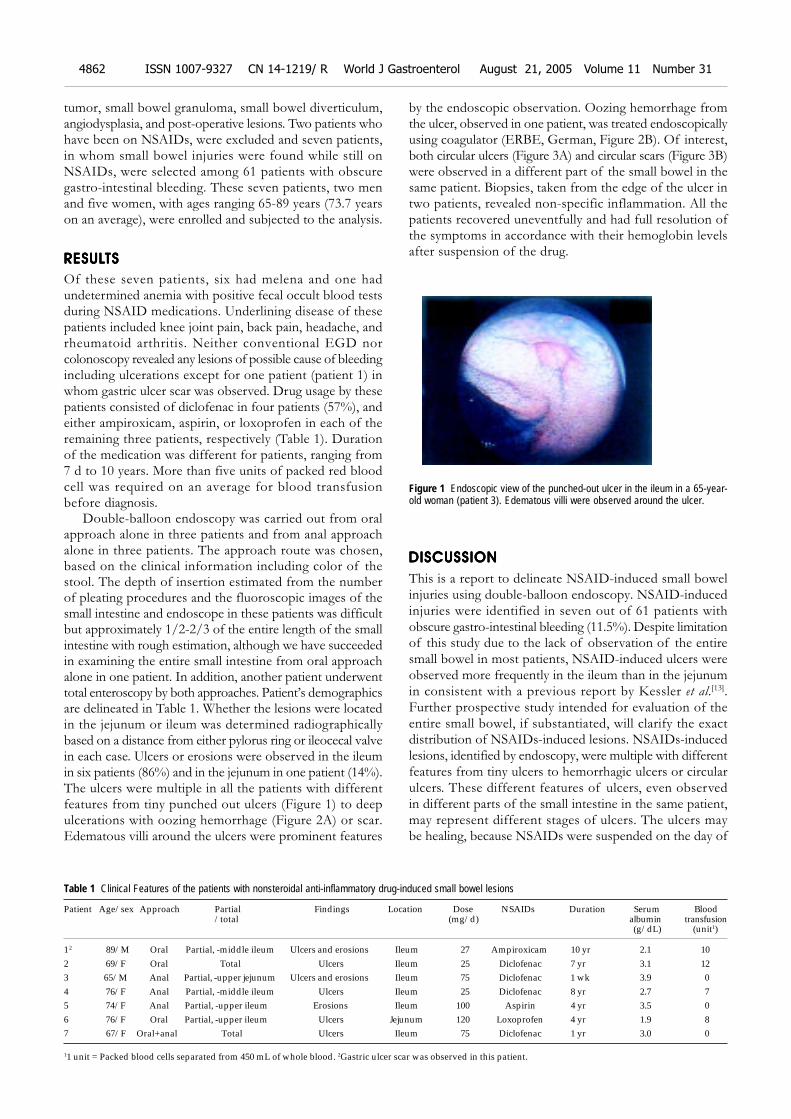
4862 ISSN 1007-9327 CN 14-1219/ R World J Gastroenterol August 21, 2005 Volume 11 Number 31
tumor, small bowel granuloma, small bowel diverticulum,angiodysplasia, and post-operative lesions. Two patients whohave been on NSAIDs, were excluded and seven patients,in whom small bowel injuries were found while still onNSAIDs, were selected among 61 patients with obscuregastro-intestinal bleeding. These seven patients, two menand five women, with ages ranging 65-89 years (73.7 yearson an average), were enrolled and subjected to the analysis.
RESULRESULRESULRESULRESULTSTSTSTSTS
Of these seven patients, six had melena and one hadundetermined anemia with positive fecal occult blood testsduring NSAID medications. Underlining disease of thesepatients included knee joint pain, back pain, headache, andrheumatoid arthritis. Neither conventional EGD norcolonoscopy revealed any lesions of possible cause of bleedingincluding ulcerations except for one patient (patient 1) inwhom gastric ulcer scar was observed. Drug usage by thesepatients consisted of diclofenac in four patients (57%), andeither ampiroxicam, aspirin, or loxoprofen in each of theremaining three patients, respectively (Table 1). Durationof the medication was different for patients, ranging from7 d to 10 years. More than five units of packed red bloodcell was required on an average for blood transfusionbefore diagnosis.
Double-balloon endoscopy was carried out from oralapproach alone in three patients and from anal approachalone in three patients. The approach route was chosen,based on the clinical information including color of thestool. The depth of insertion estimated from the numberof pleating procedures and the fluoroscopic images of thesmall intestine and endoscope in these patients was difficultbut approximately 1/2-2/3 of the entire length of the smallintestine with rough estimation, although we have succeededin examining the entire small intestine from oral approachalone in one patient. In addition, another patient underwenttotal enteroscopy by both approaches. Patient’s demographicsare delineated in Table 1. Whether the lesions were locatedin the jejunum or ileum was determined radiographicallybased on a distance from either pylorus ring or ileocecal valvein each case. Ulcers or erosions were observed in the ileumin six patients (86%) and in the jejunum in one patient (14%).The ulcers were multiple in all the patients with differentfeatures from tiny punched out ulcers (Figure 1) to deepulcerations with oozing hemorrhage (Figure 2A) or scar.Edematous villi around the ulcers were prominent features
by the endoscopic observation. Oozing hemorrhage fromthe ulcer, observed in one patient, was treated endoscopicallyusing coagulator (ERBE, German, Figure 2B). Of interest,both circular ulcers (Figure 3A) and circular scars (Figure 3B)were observed in a different part of the small bowel in thesame patient. Biopsies, taken from the edge of the ulcer intwo patients, revealed non-specific inflammation. All thepatients recovered uneventfully and had full resolution ofthe symptoms in accordance with their hemoglobin levelsafter suspension of the drug.
Figure 1 Endoscopic view of the punched-out ulcer in the ileum in a 65-year-old woman (patient 3). Edematous villi were observed around the ulcer.
DISCUSSIONDISCUSSIONDISCUSSIONDISCUSSIONDISCUSSION
This is a report to delineate NSAID-induced small bowelinjuries using double-balloon endoscopy. NSAID-inducedinjuries were identified in seven out of 61 patients withobscure gastro-intestinal bleeding (11.5%). Despite limitationof this study due to the lack of observation of the entiresmall bowel in most patients, NSAID-induced ulcers wereobserved more frequently in the ileum than in the jejunumin consistent with a previous report by Kessler et al.[13].Further prospective study intended for evaluation of theentire small bowel, if substantiated, will clarify the exactdistribution of NSAIDs-induced lesions. NSAIDs-inducedlesions, identified by endoscopy, were multiple with differentfeatures from tiny ulcers to hemorrhagic ulcers or circularulcers. These different features of ulcers, even observedin different parts of the small intestine in the same patient,may represent different stages of ulcers. The ulcers maybe healing, because NSAIDs were suspended on the day of
Table 1 Clinical Features of the patients with nonsteroidal anti-inflammatory drug-induced small bowel lesions
Patient Age/sex Approach Partial Findings Location Dose NSAIDs Duration Serum Blood/total (mg/d) albumin transfusion
(g/dL) (unit1)
12 89/M Oral Partial, -middle ileum Ulcers and erosions Ileum 27 Ampiroxicam 10 yr 2.1 102 69/F Oral Total Ulcers Ileum 25 Diclofenac 7 yr 3.1 123 65/M Anal Partial, -upper jejunum Ulcers and erosions Ileum 75 Diclofenac 1 wk 3.9 04 76/F Anal Partial, -middle ileum Ulcers Ileum 25 Diclofenac 8 yr 2.7 75 74/F Anal Partial, -upper ileum Erosions Ileum 100 Aspirin 4 yr 3.5 06 76/F Oral Partial, -upper ileum Ulcers Jejunum 120 Loxoprofen 4 yr 1.9 87 67/F Oral+anal Total Ulcers Ileum 75 Diclofenac 1 yr 3.0 0
11 unit = Packed blood cells separated from 450 mL of whole blood. 2Gastric ulcer scar was observed in this patient.
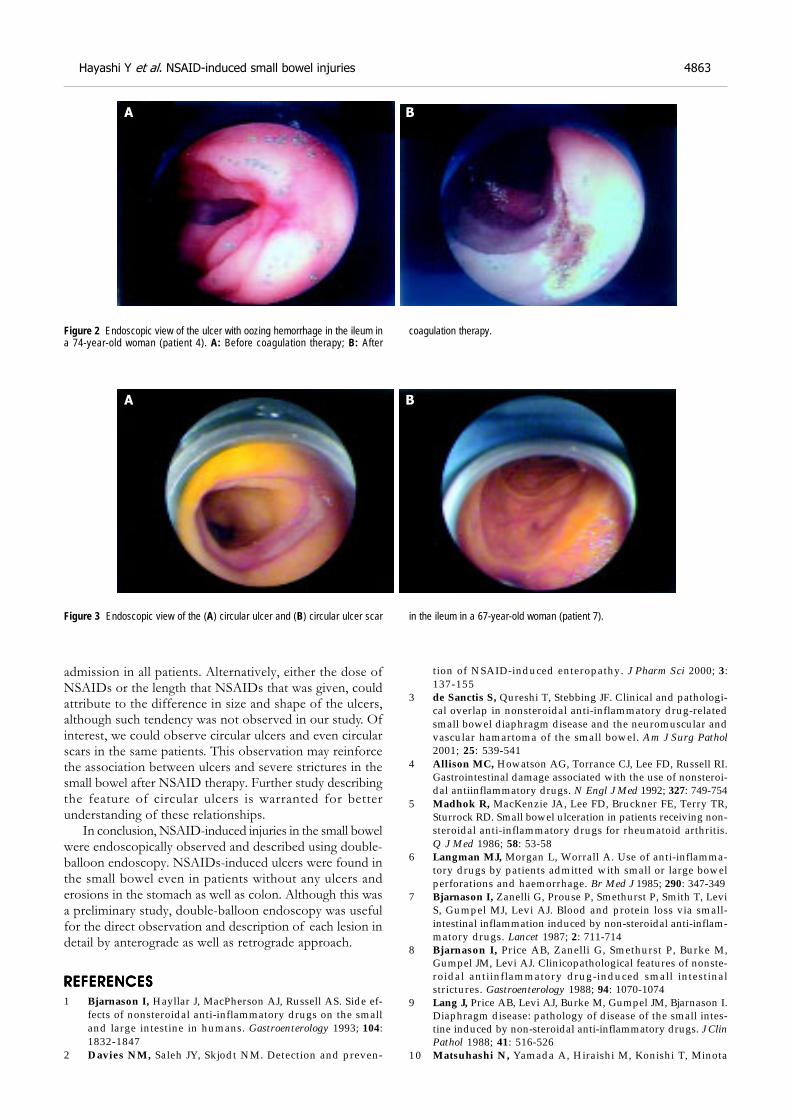
Hayashi Y et al. NSAID-induced small bowel injuries 4863
admission in all patients. Alternatively, either the dose ofNSAIDs or the length that NSAIDs that was given, couldattribute to the difference in size and shape of the ulcers,although such tendency was not observed in our study. Ofinterest, we could observe circular ulcers and even circularscars in the same patients. This observation may reinforcethe association between ulcers and severe strictures in thesmall bowel after NSAID therapy. Further study describingthe feature of circular ulcers is warranted for betterunderstanding of these relationships.
In conclusion, NSAID-induced injuries in the small bowelwere endoscopically observed and described using double-balloon endoscopy. NSAIDs-induced ulcers were found inthe small bowel even in patients without any ulcers anderosions in the stomach as well as colon. Although this wasa preliminary study, double-balloon endoscopy was usefulfor the direct observation and description of each lesion indetail by anterograde as well as retrograde approach.
REFERENCESREFERENCESREFERENCESREFERENCESREFERENCES
1 Bjarnason I, Hayllar J, MacPherson AJ, Russell AS. Side ef-fects of nonsteroidal anti-inflammatory drugs on the smalland large intestine in humans. Gastroenterology 1993; 104:1832-1847
2 Davies NM, Saleh JY, Skjodt NM. Detection and preven-
tion of NSAID-induced enteropathy. J Pharm Sci 2000; 3:137-155
3 de Sanctis S, Qureshi T, Stebbing JF. Clinical and pathologi-cal overlap in nonsteroidal anti-inflammatory drug-relatedsmall bowel diaphragm disease and the neuromuscular andvascular hamartoma of the small bowel. Am J Surg Pathol2001; 25: 539-541
4 Allison MC, Howatson AG, Torrance CJ, Lee FD, Russell RI.Gastrointestinal damage associated with the use of nonsteroi-dal antiinflammatory drugs. N Engl J Med 1992; 327: 749-754
5 Madhok R, MacKenzie JA, Lee FD, Bruckner FE, Terry TR,Sturrock RD. Small bowel ulceration in patients receiving non-steroidal anti-inflammatory drugs for rheumatoid arthritis.Q J Med 1986; 58: 53-58
6 Langman MJ, Morgan L, Worrall A. Use of anti-inflamma-tory drugs by patients admitted with small or large bowelperforations and haemorrhage. Br Med J 1985; 290: 347-349
7 Bjarnason I, Zanelli G, Prouse P, Smethurst P, Smith T, LeviS, Gumpel MJ, Levi AJ. Blood and protein loss via small-intestinal inflammation induced by non-steroidal anti-inflam-matory drugs. Lancet 1987; 2: 711-714
8 Bjarnason I, Price AB, Zanelli G, Smethurst P, Burke M,Gumpel JM, Levi AJ. Clinicopathological features of nonste-roidal antiinflammatory drug-induced small intestinalstrictures. Gastroenterology 1988; 94: 1070-1074
9 Lang J, Price AB, Levi AJ, Burke M, Gumpel JM, Bjarnason I.Diaphragm disease: pathology of disease of the small intes-tine induced by non-steroidal anti-inflammatory drugs. J ClinPathol 1988; 41: 516-526
10 Matsuhashi N, Yamada A, Hiraishi M, Konishi T, Minota
Figure 2 Endoscopic view of the ulcer with oozing hemorrhage in the ileum ina 74-year-old woman (patient 4). A: Before coagulation therapy; B: After
Figure 3 Endoscopic view of the (A) circular ulcer and (B) circular ulcer scar
coagulation therapy.
in the ileum in a 67-year-old woman (patient 7).
A B
A B
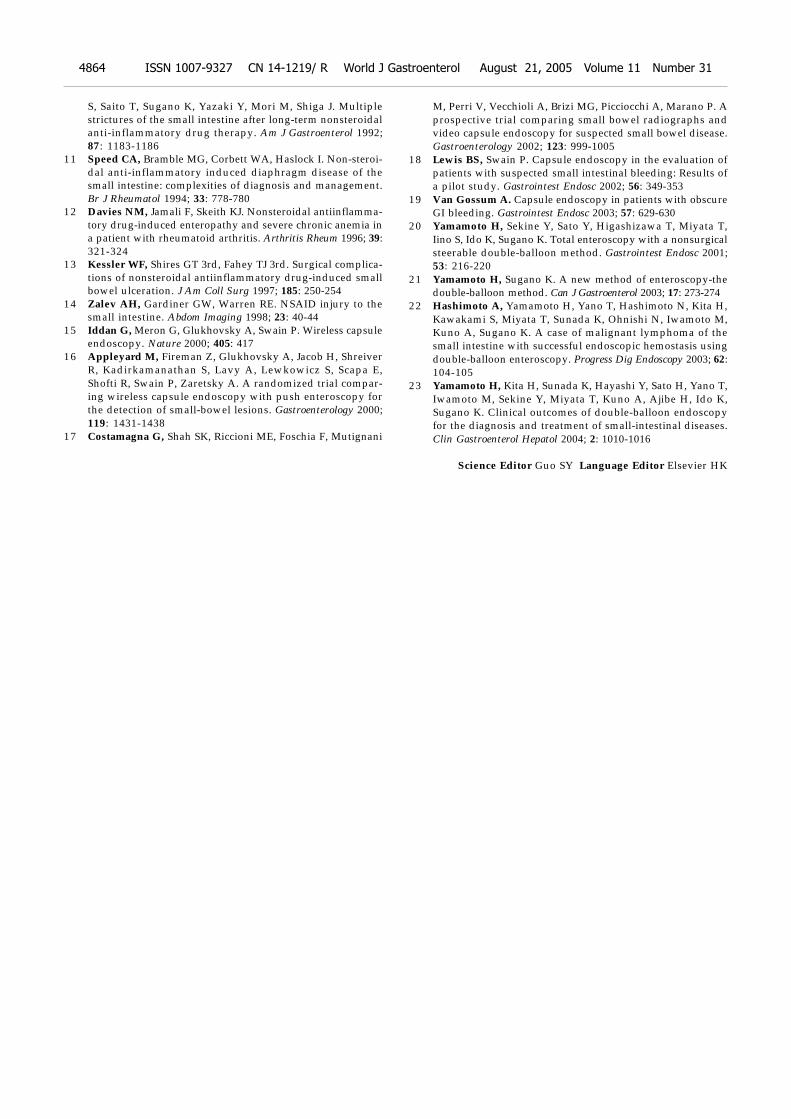
S, Saito T, Sugano K, Yazaki Y, Mori M, Shiga J. Multiplestrictures of the small intestine after long-term nonsteroidalanti-inflammatory drug therapy. Am J Gastroenterol 1992;87: 1183-1186
11 Speed CA, Bramble MG, Corbett WA, Haslock I. Non-steroi-dal anti-inflammatory induced diaphragm disease of thesmall intestine: complexities of diagnosis and management.Br J Rheumatol 1994; 33: 778-780
12 Davies NM, Jamali F, Skeith KJ. Nonsteroidal antiinflamma-tory drug-induced enteropathy and severe chronic anemia ina patient with rheumatoid arthritis. Arthritis Rheum 1996; 39:321-324
13 Kessler WF, Shires GT 3rd, Fahey TJ 3rd. Surgical complica-tions of nonsteroidal antiinflammatory drug-induced smallbowel ulceration. J Am Coll Surg 1997; 185: 250-254
14 Zalev AH, Gardiner GW, Warren RE. NSAID injury to thesmall intestine. Abdom Imaging 1998; 23: 40-44
15 Iddan G, Meron G, Glukhovsky A, Swain P. Wireless capsuleendoscopy. Nature 2000; 405: 417
16 Appleyard M, Fireman Z, Glukhovsky A, Jacob H, ShreiverR, Kadirkamanathan S, Lavy A, Lewkowicz S, Scapa E,Shofti R, Swain P, Zaretsky A. A randomized trial compar-ing wireless capsule endoscopy with push enteroscopy forthe detection of small-bowel lesions. Gastroenterology 2000;119: 1431-1438
17 Costamagna G, Shah SK, Riccioni ME, Foschia F, Mutignani
M, Perri V, Vecchioli A, Brizi MG, Picciocchi A, Marano P. Aprospective trial comparing small bowel radiographs andvideo capsule endoscopy for suspected small bowel disease.Gastroenterology 2002; 123: 999-1005
18 Lewis BS, Swain P. Capsule endoscopy in the evaluation ofpatients with suspected small intestinal bleeding: Results ofa pilot study. Gastrointest Endosc 2002; 56: 349-353
19 Van Gossum A. Capsule endoscopy in patients with obscureGI bleeding. Gastrointest Endosc 2003; 57: 629-630
20 Yamamoto H, Sekine Y, Sato Y, Higashizawa T, Miyata T,Iino S, Ido K, Sugano K. Total enteroscopy with a nonsurgicalsteerable double-balloon method. Gastrointest Endosc 2001;53: 216-220
21 Yamamoto H, Sugano K. A new method of enteroscopy-thedouble-balloon method. Can J Gastroenterol 2003; 17: 273-274
22 Hashimoto A, Yamamoto H, Yano T, Hashimoto N, Kita H,Kawakami S, Miyata T, Sunada K, Ohnishi N, Iwamoto M,Kuno A, Sugano K. A case of malignant lymphoma of thesmall intestine with successful endoscopic hemostasis usingdouble-balloon enteroscopy. Progress Dig Endoscopy 2003; 62:104-105
23 Yamamoto H, Kita H, Sunada K, Hayashi Y, Sato H, Yano T,Iwamoto M, Sekine Y, Miyata T, Kuno A, Ajibe H, Ido K,Sugano K. Clinical outcomes of double-balloon endoscopyfor the diagnosis and treatment of small-intestinal diseases.Clin Gastroenterol Hepatol 2004; 2: 1010-1016
Science Editor Guo SY Language Editor Elsevier HK
4864 ISSN 1007-9327 CN 14-1219/ R World J Gastroenterol August 21, 2005 Volume 11 Number 31
• BRIEF REPORTS •
Effect of oral erythromycin on gastric and small bowel transit
time of capsule endoscopy
Wai K Leung, Francis KL Chan, Sara SL Fung, Mei-Yin Wong, Joseph JY Sung
ELSEVIER
PO Box 2345, Beijing 100023, China World J Gastroenterol 2005;11(31):4865-4868www.wjgnet.com World Journal of Gastroenterology ISSN [email protected] © 2005 The WJG Press and Elsevier Inc. All rights reserved.
Wai K Leung, Francis KL Chan, Sara SL Fung, Mei-Yin Wong,Joseph JY Sung, Digestive Diseases Center, The Chinese Universityof Hong Kong, Prince of Wales Hospital, Shatin, Hong Kong, ChinaCorrespondence to: Dr. Wai K Leung, Department of Medicineand Therapeutics, Prince of Wales Hospital, 30-32 Ngan Shing Street,Shatin, Hong Kong, China. [email protected]: +852-2632-3140 Fax: +852-2637-3852Received: 2004-12-10 Accepted: 2005-01-05
AbstractAbstractAbstractAbstractAbstract
AIM: To determine the effect of oral erythromycin on gastricand small bowel transit time of capsule endoscopy.
METHODS: Consecutive patients who underwent capsuleendoscopy during the 16-mo study period were eithergiven 250 mg oral erythromycin, 1 h prior to swallowingthe capsule endoscope or nothing. The gastric and smallbowel transit time, and the small bowel image qualitywere compared.
RESULTS: Twenty-four patients received oral erythromycinwhereas 14 patients were not given any prokinetic agent.Patients who received erythromycin had a significantly lowergastric transit time than control (16 min vs 70 min, P = 0.005),whereas the small bowel transit time was comparablebetween the two groups (227 min vs 183 min, P = 0.18).Incomplete small bowel examination was found in threepatients of the control group and in one patient of theerythromycin group. There was no significant differencein the overall quality of small bowel images between thetwo groups. A marked reduction in gastric transit timewas noted in two patients who had repeat capsuleendoscopy after oral erythromycin.
CONCLUSION: Use of oral erythromycin significantlyreduces the gastric transit time of capsule endoscopy.
© 2005 The WJG Press and Elsevier Inc. All rights reserved.
Key words: Capsule endoscopy; Erythromycin; Prokinetic
Leung WK, Chan FKL, Fung SSL, Wong MY, Sung JJY. Effectof oral erythromycin on gastric and small bowel transit timeof capsule endoscopy. World J Gastroenterol 2005; 11(31):4865-4868
http://www.wjgnet.com/1007-9327/11/4865.asp
INTRODUCTIONINTRODUCTIONINTRODUCTIONINTRODUCTIONINTRODUCTION
The introduction of wireless capsule endoscopy, which
has made direct visualization of the small bowel possible,has opened up a new chapter on small bowel imaging. Initialcomparative studies showed that wireless capsule endoscopyis superior to push enteroscopy [1-4] or conventionalradiological imaging[5]. The wireless capsule endoscopy isapproved by the Food and Drug Administration of USAand is particularly useful for the diagnosis of obscuregastrointestinal bleeding.
With the limited battery life, the current capsuleendoscope could take images for up to 8 h. Any delay ingastric transit may inadvertently result in incomplete smallbowel examination. Whilst the capsule endoscope is passivelypropelled by peristalsis down the intestinal lumen, it isimpossible to predict the time required for the capsuleendoscope to navigate through the stomach. Although theuse of prokinetic agents may potentially speed up the gastricemptying time, the effect of prokinetic agents on the outcomeof wireless capsule endoscopy remains undetermined.Among various prokinetic agents, erythromycin, a motilinagonist, has been used to speed up gastric emptying inpatients with gastroparesis[6-8]. Moreover, the use ofintravenous erythromycin has been shown to improve thequality of upper gastro-intestinal endoscopy in patients withupper gastro-intestinal bleeding, possibly via emptying ofthe blood contents within the stomach [9]. Here, wedetermined the effects of oral erythromycin on the gastricand small bowel transit time of the capsule endoscope aswell as the quality of small bowel images in patientsundergoing capsule endoscopy.
MAMAMAMAMATERIALS AND METHODSTERIALS AND METHODSTERIALS AND METHODSTERIALS AND METHODSTERIALS AND METHODS
PatientsConsecutive patients who underwent capsule endoscopy inthe Prince of Wales Hospital of Hong Kong betweenDecember 2002 and March 2004 were included. The useof prokinetic agents in these patients was based on the dateof the procedure. All patients who had this examinationafter October 2003 received oral erythromycin (250 mg)1 h prior to swallowing the capsule endoscope. In contrast,patients who had capsule endoscopy before October 2003did not receive any prokinetic agent and were used ascontrols. Exclusion criteria included patients with swallowingdifficulties, previous gastric or small bowel surgery, allergicto erythromycin, use of other prokinetic agents, and knownor suspected bowel obstruction. All patients gave informedconsent for undergoing the procedure.
A total of 38 patients had capsule endoscopy during the16-mo study period. There were 17 males and 21 femaleswith a mean age of 60.3 (SD 18.1 years) years. Twenty-four
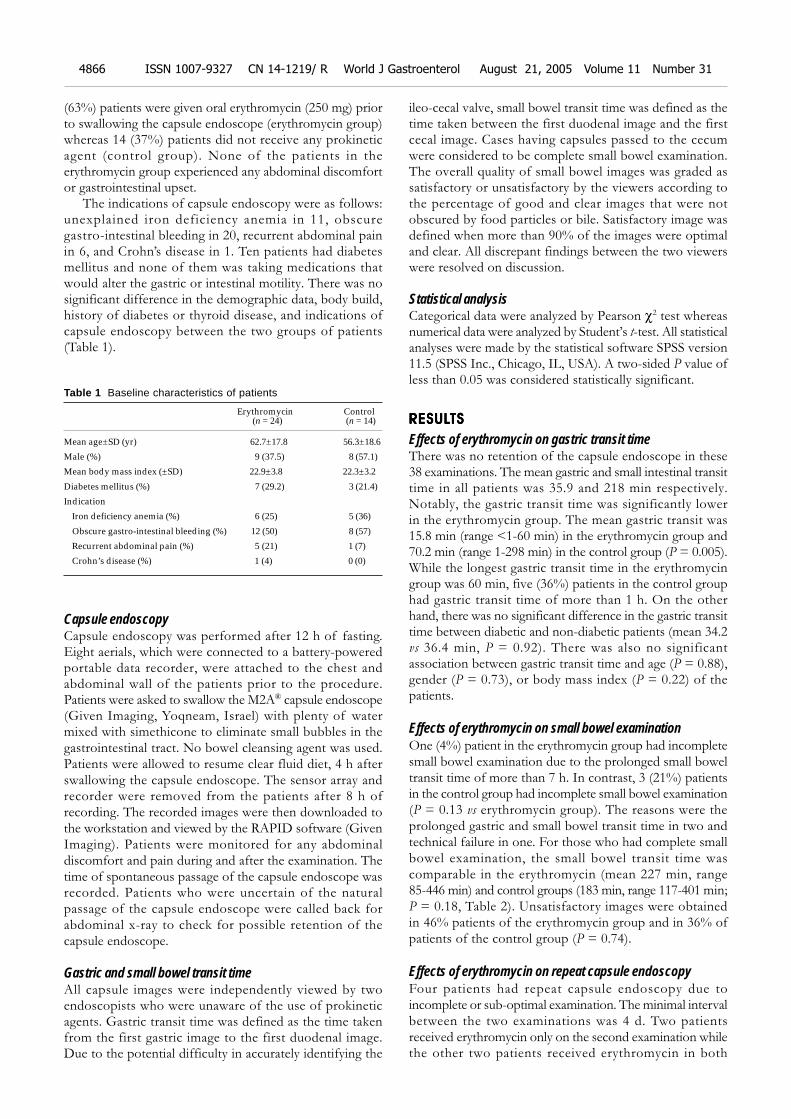
4866 ISSN 1007-9327 CN 14-1219/ R World J Gastroenterol August 21, 2005 Volume 11 Number 31
(63%) patients were given oral erythromycin (250 mg) priorto swallowing the capsule endoscope (erythromycin group)whereas 14 (37%) patients did not receive any prokineticagent (control group). None of the patients in theerythromycin group experienced any abdominal discomfortor gastrointestinal upset.
The indications of capsule endoscopy were as follows:unexplained iron deficiency anemia in 11, obscuregastro-intestinal bleeding in 20, recurrent abdominal painin 6, and Crohn’s disease in 1. Ten patients had diabetesmellitus and none of them was taking medications thatwould alter the gastric or intestinal motility. There was nosignificant difference in the demographic data, body build,history of diabetes or thyroid disease, and indications ofcapsule endoscopy between the two groups of patients(Table 1).
Table 1 Baseline characteristics of patients
Erythromycin Control(n = 24) (n = 14)
Mean age±SD (yr) 62.7±17.8 56.3±18.6
Male (%) 9 (37.5) 8 (57.1)
Mean body mass index (±SD) 22.9±3.8 22.3±3.2
Diabetes mellitus (%) 7 (29.2) 3 (21.4)
Indication
Iron deficiency anemia (%) 6 (25) 5 (36)
Obscure gastro-intestinal bleeding (%) 12 (50) 8 (57)
Recurrent abdominal pain (%) 5 (21) 1 (7)
Crohn’s disease (%) 1 (4) 0 (0)
Capsule endoscopyCapsule endoscopy was performed after 12 h of fasting.Eight aerials, which were connected to a battery-poweredportable data recorder, were attached to the chest andabdominal wall of the patients prior to the procedure.Patients were asked to swallow the M2A® capsule endoscope(Given Imaging, Yoqneam, Israel) with plenty of watermixed with simethicone to eliminate small bubbles in thegastrointestinal tract. No bowel cleansing agent was used.Patients were allowed to resume clear fluid diet, 4 h afterswallowing the capsule endoscope. The sensor array andrecorder were removed from the patients after 8 h ofrecording. The recorded images were then downloaded tothe workstation and viewed by the RAPID software (GivenImaging). Patients were monitored for any abdominaldiscomfort and pain during and after the examination. Thetime of spontaneous passage of the capsule endoscope wasrecorded. Patients who were uncertain of the naturalpassage of the capsule endoscope were called back forabdominal x-ray to check for possible retention of thecapsule endoscope.
Gastric and small bowel transit timeAll capsule images were independently viewed by twoendoscopists who were unaware of the use of prokineticagents. Gastric transit time was defined as the time takenfrom the first gastric image to the first duodenal image.Due to the potential difficulty in accurately identifying the
ileo-cecal valve, small bowel transit time was defined as thetime taken between the first duodenal image and the firstcecal image. Cases having capsules passed to the cecumwere considered to be complete small bowel examination.The overall quality of small bowel images was graded assatisfactory or unsatisfactory by the viewers according tothe percentage of good and clear images that were notobscured by food particles or bile. Satisfactory image wasdefined when more than 90% of the images were optimaland clear. All discrepant findings between the two viewerswere resolved on discussion.
Statistical analysisCategorical data were analyzed by Pearson χ2 test whereasnumerical data were analyzed by Student’s t-test. All statisticalanalyses were made by the statistical software SPSS version11.5 (SPSS Inc., Chicago, IL, USA). A two-sided P value ofless than 0.05 was considered statistically significant.
RESULRESULRESULRESULRESULTSTSTSTSTS
Effects of erythromycin on gastric transit timeThere was no retention of the capsule endoscope in these38 examinations. The mean gastric and small intestinal transittime in all patients was 35.9 and 218 min respectively.Notably, the gastric transit time was significantly lowerin the erythromycin group. The mean gastric transit was15.8 min (range <1-60 min) in the erythromycin group and70.2 min (range 1-298 min) in the control group (P = 0.005).While the longest gastric transit time in the erythromycingroup was 60 min, five (36%) patients in the control grouphad gastric transit time of more than 1 h. On the otherhand, there was no significant difference in the gastric transittime between diabetic and non-diabetic patients (mean 34.2vs 36.4 min, P = 0.92). There was also no significantassociation between gastric transit time and age (P = 0.88),gender (P = 0.73), or body mass index (P = 0.22) of thepatients.
Effects of erythromycin on small bowel examinationOne (4%) patient in the erythromycin group had incompletesmall bowel examination due to the prolonged small boweltransit time of more than 7 h. In contrast, 3 (21%) patientsin the control group had incomplete small bowel examination(P = 0.13 vs erythromycin group). The reasons were theprolonged gastric and small bowel transit time in two andtechnical failure in one. For those who had complete smallbowel examination, the small bowel transit time wascomparable in the erythromycin (mean 227 min, range85-446 min) and control groups (183 min, range 117-401 min;P = 0.18, Table 2). Unsatisfactory images were obtainedin 46% patients of the erythromycin group and in 36% ofpatients of the control group (P = 0.74).
Effects of erythromycin on repeat capsule endoscopyFour patients had repeat capsule endoscopy due toincomplete or sub-optimal examination. The minimal intervalbetween the two examinations was 4 d. Two patientsreceived erythromycin only on the second examination whilethe other two patients received erythromycin in both
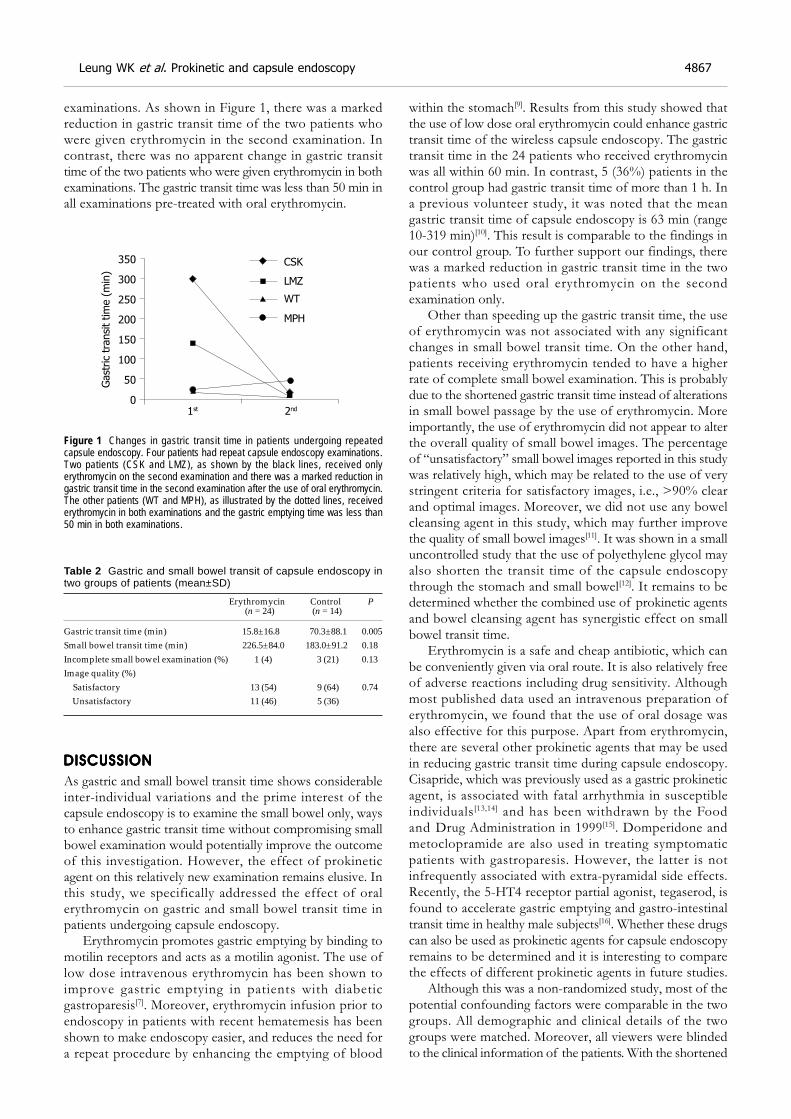
Leung WK et al. Prokinetic and capsule endoscopy 4867
examinations. As shown in Figure 1, there was a markedreduction in gastric transit time of the two patients whowere given erythromycin in the second examination. Incontrast, there was no apparent change in gastric transittime of the two patients who were given erythromycin in bothexaminations. The gastric transit time was less than 50 min inall examinations pre-treated with oral erythromycin.
Figure 1 Changes in gastric transit time in patients undergoing repeatedcapsule endoscopy. Four patients had repeat capsule endoscopy examinations.Two patients (CSK and LMZ), as shown by the black lines, received onlyerythromycin on the second examination and there was a marked reduction ingastric transit time in the second examination after the use of oral erythromycin.The other patients (WT and MPH), as illustrated by the dotted lines, receivederythromycin in both examinations and the gastric emptying time was less than50 min in both examinations.
Table 2 Gastric and small bowel transit of capsule endoscopy intwo groups of patients (mean±SD)
Erythromycin Control P (n = 24) (n = 14)
Gastric transit time (min) 15.8±16.8 70.3±88.1 0.005Small bowel transit time (min) 226.5±84.0 183.0±91.2 0.18Incomplete small bowel examination (%) 1 (4) 3 (21) 0.13Image quality (%) Satisfactory 13 (54) 9 (64) 0.74 Unsatisfactory 11 (46) 5 (36)
DISCUSSIONDISCUSSIONDISCUSSIONDISCUSSIONDISCUSSION
As gastric and small bowel transit time shows considerableinter-individual variations and the prime interest of thecapsule endoscopy is to examine the small bowel only, waysto enhance gastric transit time without compromising smallbowel examination would potentially improve the outcomeof this investigation. However, the effect of prokineticagent on this relatively new examination remains elusive. Inthis study, we specifically addressed the effect of oralerythromycin on gastric and small bowel transit time inpatients undergoing capsule endoscopy.
Erythromycin promotes gastric emptying by binding tomotilin receptors and acts as a motilin agonist. The use oflow dose intravenous erythromycin has been shown toimprove gastric emptying in patients with diabeticgastroparesis[7]. Moreover, erythromycin infusion prior toendoscopy in patients with recent hematemesis has beenshown to make endoscopy easier, and reduces the need fora repeat procedure by enhancing the emptying of blood
within the stomach[9]. Results from this study showed thatthe use of low dose oral erythromycin could enhance gastrictransit time of the wireless capsule endoscopy. The gastrictransit time in the 24 patients who received erythromycinwas all within 60 min. In contrast, 5 (36%) patients in thecontrol group had gastric transit time of more than 1 h. Ina previous volunteer study, it was noted that the meangastric transit time of capsule endoscopy is 63 min (range10-319 min)[10]. This result is comparable to the findings inour control group. To further support our findings, therewas a marked reduction in gastric transit time in the twopatients who used oral erythromycin on the secondexamination only.
Other than speeding up the gastric transit time, the useof erythromycin was not associated with any significantchanges in small bowel transit time. On the other hand,patients receiving erythromycin tended to have a higherrate of complete small bowel examination. This is probablydue to the shortened gastric transit time instead of alterationsin small bowel passage by the use of erythromycin. Moreimportantly, the use of erythromycin did not appear to alterthe overall quality of small bowel images. The percentageof “unsatisfactory” small bowel images reported in this studywas relatively high, which may be related to the use of verystringent criteria for satisfactory images, i.e., >90% clearand optimal images. Moreover, we did not use any bowelcleansing agent in this study, which may further improvethe quality of small bowel images[11]. It was shown in a smalluncontrolled study that the use of polyethylene glycol mayalso shorten the transit time of the capsule endoscopythrough the stomach and small bowel[12]. It remains to bedetermined whether the combined use of prokinetic agentsand bowel cleansing agent has synergistic effect on smallbowel transit time.
Erythromycin is a safe and cheap antibiotic, which canbe conveniently given via oral route. It is also relatively freeof adverse reactions including drug sensitivity. Althoughmost published data used an intravenous preparation oferythromycin, we found that the use of oral dosage wasalso effective for this purpose. Apart from erythromycin,there are several other prokinetic agents that may be usedin reducing gastric transit time during capsule endoscopy.Cisapride, which was previously used as a gastric prokineticagent, is associated with fatal arrhythmia in susceptibleindividuals[13,14] and has been withdrawn by the Foodand Drug Administration in 1999[15]. Domperidone andmetoclopramide are also used in treating symptomaticpatients with gastroparesis. However, the latter is notinfrequently associated with extra-pyramidal side effects.Recently, the 5-HT4 receptor partial agonist, tegaserod, isfound to accelerate gastric emptying and gastro-intestinaltransit time in healthy male subjects[16]. Whether these drugscan also be used as prokinetic agents for capsule endoscopyremains to be determined and it is interesting to comparethe effects of different prokinetic agents in future studies.
Although this was a non-randomized study, most of thepotential confounding factors were comparable in the twogroups. All demographic and clinical details of the twogroups were matched. Moreover, all viewers were blindedto the clinical information of the patients. With the shortened
Gast
ric
transi
t tim
e (
min
)
1st 2nd
350
300
250
200
150
100
50
0
CSK
LMZ
WT
MPH
gastric transit time, it is not difficult to anticipate that thetime spent by the examiners on reviewing the images wouldbe reduced accordingly. This may be another advantage ofusing prokinetic agents in this rather time-consumingexamination.
In summary, erythromycin given orally prior toswallowing capsule endoscope significantly reduces the gastricemptying time without compromising small bowel transittime and image quality. Further randomized study isnecessary to evaluate the role of various prokinetic agentsin the performance of capsule endoscopy.
REFERENCESREFERENCESREFERENCESREFERENCESREFERENCES
1 Ell C, Remke S, May A, Helou L, Henrich R, Mayer G. Thefirst prospective controlled trial comparing wireless capsuleendoscopy with push enteroscopy in chronic gastrointestinalbleeding. Endoscopy 2002; 34: 685-689
2 Costamagna G, Shah SK, Riccioni ME, Foschia F, MutignaniM, Perri V, Vecchioli A, Brizi MG, Picciocchi A, Marano P. Aprospective trial comparing small bowel radiographs andvideo capsule endoscopy for suspected small bowel disease.Gastroenterology 2002; 123: 999-1005
3 Mylonaki M, Fritscher-Ravens A, Swain P. Wireless capsuleendoscopy: a comparison with push enteroscopy in patientswith gastroscopy and colonoscopy negative gastrointestinalbleeding. Gut 2003; 52: 1122-1126
4 Pennazio M, Santucci R, Rondonotti E, Abbiati C, Beccari G,Rossini FP, De Franchis R. Outcome of patients with obscuregastrointestinal bleeding after capsule endoscopy: Report of100 consecutive cases. Gastroenterology 2004; 126: 643-653
5 Hara AK, Leighton JA, Sharma VK, Fleischer DE. Small Bowel:Preliminary Comparison of Capsule Endoscopy with BariumStudy and CT. Radiology 2004; 230: 260-265
6 Minocha A, Katragadda R, Rahal PS, Ries A. Erythromycinshortens orocaecal transit time in diabetic male subjects: adouble-blind placebo-controlled study. Aliment Pharmacol Ther
1995; 9: 529-5337 Janssens J, Peeters TL, Vantrappen G, Tack J, Urbain JL, De
Roo M, Muls E, Bouillon R. Improvement of gastric emptyingin diabetic gastroparesis by erythromycin. Preliminary studies.N Engl J Med 1990; 322: 1028-1031
8 Maganti K, Onyemere K, Jones MP. Oral erythromycin andsymptomatic relief of gastroparesis: a systematic review. AmJ Gastroenterol 2003; 98: 259-263
9 Frossard JL, Spahr L, Queneau PE, Giostra E, Burckhardt B,Ory G, De Saussure P, Armenian B, De Peyer R, Hadengue A.Erythromycin intravenous bolus infusion in acute upper gas-trointestinal bleeding: a randomized, controlled, double-blindtrial. Gastroenterology 2002; 123: 17-23
10 Appleyard MN, Glukhovsky A, Jacob J, Gat D, LewkowiczS, Swain P. Transit times of the wireless capsule endoscope.Gastrointest Endosc 2001; 53: AB122
11 Viazis N, Sgouros S, Papaxoinis K, Vlachogiannakos J, BergeleC, Sklavos P, Panani A, Avgerinos A. Bowel preparationincreases the diagnostic yield of capsule endoscopy: Aprospective, randomized, controlled study. Gastrointest Endosc2004; 60: 534-538
12 Fireman Z, Kopelman Y, Fish L, Sternberg A, Scapa E,Mahaina E. Effect of oral purgatives on gastric and smallbowel transit time in capsule endoscopy. Isr Med Assoc J 2004;6: 521-523
13 Bran S, Murray WA, Hirsch IB, Palmer JP. Long QT syn-drome during high-dose cisapride. Arch Intern Med 1995; 155:765-768
14 Wysowski DK, Bacsanyi J. Cisapride and fatal arrhythmia.N Engl J Med 1996; 335: 290-291
15 Wysowski DK, Corken A, Gallo-Torres H, Talarico L,Rodriguez EM. Postmarketing reports of QT prolongationand ventricular arrhythmia in association with cisapride andFood and Drug Administration regulatory actions. Am JGastroenterol 2001; 96: 1698-1703
16 Degen L, Matzinger D, Merz M, Appel-Dingemanse S,Osborne S, Luchinger S, Bertold R, Maecke H, Beglinger C.Tegaserod, a 5-HT4 receptor partial agonist, accelerates gas-tric emptying and gastrointestinal transit in healthy malesubjects. Aliment Pharmacol Ther 2001; 15: 1745-1751
Science Editor Wang XL and Guo SY Language Editor Elsevier HK
4868 ISSN 1007-9327 CN 14-1219/ R World J Gastroenterol August 21, 2005 Volume 11 Number 31
• BRIEF REPORTS •
Appendix is a priming site in the development of ulcerative colitis
Mitsunobu Matsushita, Hiroshi Takakuwa, Yuji Matsubayashi, Akiyoshi Nishio, Susumu Ikehara, Kazuichi Okazaki
ELSEVIER
PO Box 2345, Beijing 100023, China World J Gastroenterol 2005;11(31):4869-4874www.wjgnet.com World Journal of Gastroenterology ISSN [email protected] © 2005 The WJG Press and Elsevier Inc. All rights reserved.
Mitsunobu Matsushita, Kazuichi Okazaki, Third Department ofInternal Medicine, Kansai Medical University, Osaka, JapanSusumu Ikehara, First Department of Pathology, Kansai MedicalUniversity, Osaka, JapanHiroshi Takakuwa, Yuji Matsubayashi, Department of Gastroe-nterology, Tenri Hospital, Nara, JapanAkiyoshi Nishio, Department of Gastroenterology and EndoscopicMedicine, Faculty of Medicine, Kyoto University, Kyoto, JapanSupported by the Grant-in-Aid for Scientific Research (C) fromthe Ministry of Culture and Science of Japan No. 16560645; Grant-in-Aid for “Research for the Future” Program from The Japan Societyfor the Promotion of Science, No. JSPS-RFTF97I00201; Supportingin Research Funds from The Japanese Foundation for Research andPromotion of Endoscopy, No. JFE-1997; Shimidzu ImmunologyFoundation, 2000; Tenri Foundation for Medical Research, 1997-2000; Health and Labour Science Research Grants from the JapaneseMinistry of Health, Labour and Welfare, and Research on Measuresfor Intractable Disease (Inflammatory Bowel Disease); a Grant fromthe “The 21st Century Center of Excellence (COE)” Program of theMinistry of Education, Culture, Sports, Science and TechnologyCorrespondence to: Dr. Mitsunobu Matsushita, Third Departmentof Internal Medicine, Kansai Medical University, 10-15 Fumizono-cho,Moriguchi, Osaka 570-8506, Japan. [email protected]: +81-6-6992-1001 Fax: +81-6-6996-4874Received: 2004-12-13 Accepted: 2005-01-05
AbstractAbstractAbstractAbstractAbstract
AIM: The role of the appendix has been highlighted in the
pathogenesis of ulcerative colitis (UC). The aims of this
study were to elucidate the immuno-imbalances in theappendix of UC patients, and to clarify the role of the
appendix in the development of UC.
METHODS: Colonoscopic biopsy specimens of the
appendix, transverse colon, and rectum were obtained
from 86 patients with UC: active pancolitis (A-Pan; n = 15),active left-sided colitis (A-Lt; n = 25), A-Lt with appendiceal
involvement (A-Lt/Ap; n = 10), inactive pancolitis (I-Pan;
n = 14), and inactive left-sided colitis (I-Lt; n = 22),and from controls. In the isolated mucosal T cells, the
CD4/CD8 ratio and proportion of activated CD4+ T cells
were investigated, and compared with controls.
RESULTS: In the appendix, the CD4/CD8 ratio significantly
increased in A-Lt and A-Lt/Ap. The ratio in the appendixalso tended to increase in A-Pan. In the rectum, the ratiosignificantly increased in all UC groups. In the appendix,the proportion of CD4+CD69+ (early activation antigen)T cells significantly increased in all UC groups. In therectum, the proportion of CD4+CD69+ T cells significantlyincreased only in A-Pan. The proportion of CD4+HLA-DR+ (mature activation antigen) T cells significantlyincreased only in the rectum of A-Pan, but not in the other
areas of any groups.
CONCLUSION: The increased CD4/CD8 ratio andpredominant infiltration of CD4+CD69+ T cells in theappendix suggest that the appendix is a priming site inthe development of UC.
© 2005 The WJG Press and Elsevier Inc. All rights reserved.
Key words: Appendix; Appendectomy; Ulcerative colitis;Activated T cell; CD4+ T cell
Matsushita M, Takakuwa H, Matsubayashi Y, Nishio A, IkeharaS, Okazaki K. Appendix is a priming site in the developmentof ulcerative colitis. World J Gastroenterol 2005; 11(31):4869-4874
http://www.wjgnet.com/1007-9327/11/4869.asp
INTRODUCTIONINTRODUCTIONINTRODUCTIONINTRODUCTIONINTRODUCTION
Although the triggering factor for ulcerative colitis (UC) isstill unknown, cytokine imbalance and the production ofinflammatory mediators by activated CD4+ T cells play animportant role in the pathogenesis of UC. T helper type 2cells and their cytokines, particularly interleukin (IL)-4, havebeen suggested to enhance the development of UC[1].Recently, regulatory T cells, characterized by the expressionof cell surface markers CD4 and CD25, have been shownto actively suppress immune responses, and lack ofregulatory T cells leads to organ-specific autoimmunity[2].On the other hand, a sub-population of CD8+ T cells alsosuppresses the response of activated CD4+ T cells and Bcells through an interaction that depends on expression ofthe major histocompatibility complex class Ib molecule Qa-1,the mouse homolog of human leukocyte antigen (HLA)-E[3].However, the precise role of these regulatory T cells in UCremains unclear.
Although human appendix is considered as a vestigialremnant[4], recent observations have focused attention onthe role of the appendix in the pathogenesis of UC. Manycase-control studies suggest that previous appendectomy israre in UC patients[5-7], raising the possibility that appendectomyprotects against the subsequent development of UC[8-11].Patients with previous appendectomy also have a delayedonset of UC[8,9], a reduced need for immunosuppressiontherapy and proctocolectomy[8,10], and a reduced relapse rateand extent of UC[11]. Appendectomy in T-cell receptor(TCR)-α deficient mice suppresses the development ofexperimental colitis[12]. Moreover, we first reported a patientwith improvement of left-sided UC after appendectomy[13].Although these findings support that the appendix may be
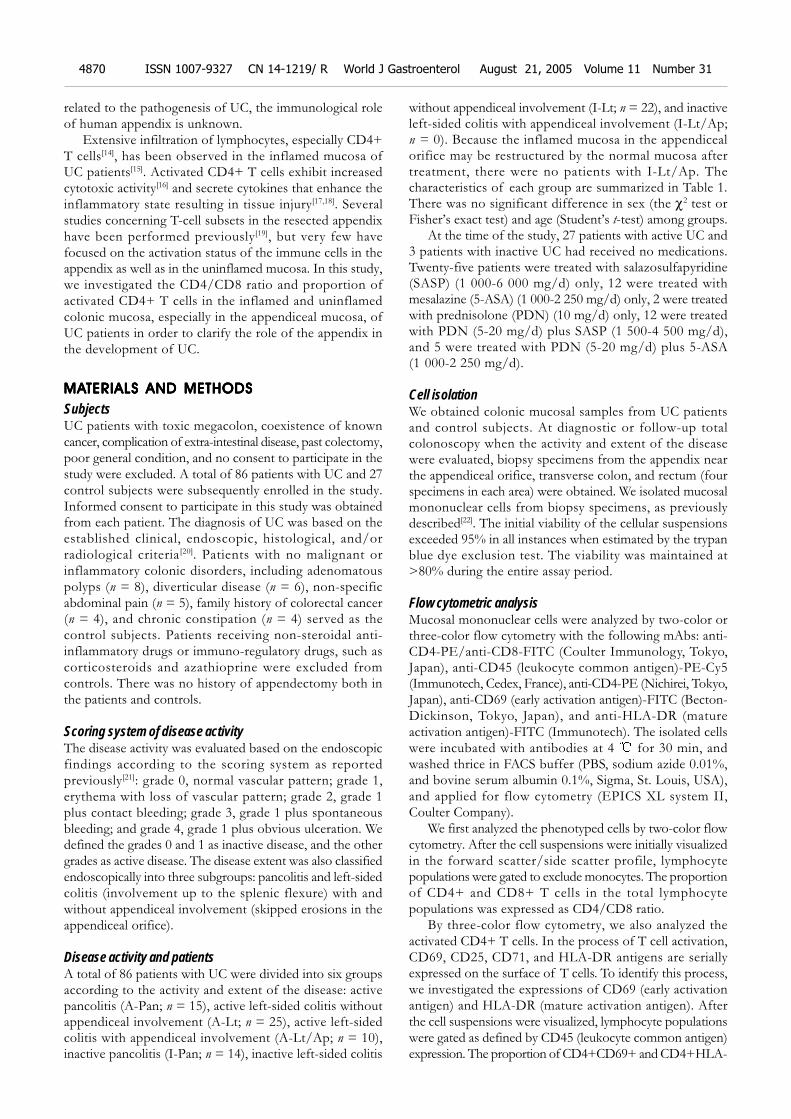
4870 ISSN 1007-9327 CN 14-1219/ R World J Gastroenterol August 21, 2005 Volume 11 Number 31
related to the pathogenesis of UC, the immunological roleof human appendix is unknown.
Extensive infiltration of lymphocytes, especially CD4+T cells[14], has been observed in the inflamed mucosa ofUC patients[15]. Activated CD4+ T cells exhibit increasedcytotoxic activity[16] and secrete cytokines that enhance theinflammatory state resulting in tissue injury[17,18]. Severalstudies concerning T-cell subsets in the resected appendixhave been performed previously[19], but very few havefocused on the activation status of the immune cells in theappendix as well as in the uninflamed mucosa. In this study,we investigated the CD4/CD8 ratio and proportion ofactivated CD4+ T cells in the inflamed and uninflamedcolonic mucosa, especially in the appendiceal mucosa, ofUC patients in order to clarify the role of the appendix inthe development of UC.
MAMAMAMAMATERIALS AND METHODSTERIALS AND METHODSTERIALS AND METHODSTERIALS AND METHODSTERIALS AND METHODS
SubjectsUC patients with toxic megacolon, coexistence of knowncancer, complication of extra-intestinal disease, past colectomy,poor general condition, and no consent to participate in thestudy were excluded. A total of 86 patients with UC and 27control subjects were subsequently enrolled in the study.Informed consent to participate in this study was obtainedfrom each patient. The diagnosis of UC was based on theestablished clinical, endoscopic, histological, and/orradiological criteria [20]. Patients with no malignant orinflammatory colonic disorders, including adenomatouspolyps (n = 8), diverticular disease (n = 6), non-specificabdominal pain (n = 5), family history of colorectal cancer(n = 4), and chronic constipation (n = 4) served as thecontrol subjects. Patients receiving non-steroidal anti-inflammatory drugs or immuno-regulatory drugs, such ascorticosteroids and azathioprine were excluded fromcontrols. There was no history of appendectomy both inthe patients and controls.
Scoring system of disease activityThe disease activity was evaluated based on the endoscopicfindings according to the scoring system as reportedpreviously[21]: grade 0, normal vascular pattern; grade 1,erythema with loss of vascular pattern; grade 2, grade 1plus contact bleeding; grade 3, grade 1 plus spontaneousbleeding; and grade 4, grade 1 plus obvious ulceration. Wedefined the grades 0 and 1 as inactive disease, and the othergrades as active disease. The disease extent was also classifiedendoscopically into three subgroups: pancolitis and left-sidedcolitis (involvement up to the splenic flexure) with andwithout appendiceal involvement (skipped erosions in theappendiceal orifice).
Disease activity and patientsA total of 86 patients with UC were divided into six groupsaccording to the activity and extent of the disease: activepancolitis (A-Pan; n = 15), active left-sided colitis withoutappendiceal involvement (A-Lt; n = 25), active left-sidedcolitis with appendiceal involvement (A-Lt/Ap; n = 10),inactive pancolitis (I-Pan; n = 14), inactive left-sided colitis
without appendiceal involvement (I-Lt; n = 22), and inactiveleft-sided colitis with appendiceal involvement (I-Lt/Ap;n = 0). Because the inflamed mucosa in the appendicealorifice may be restructured by the normal mucosa aftertreatment, there were no patients with I-Lt/Ap. Thecharacteristics of each group are summarized in Table 1.There was no significant difference in sex (the χ2 test orFisher’s exact test) and age (Student’s t-test) among groups.
At the time of the study, 27 patients with active UC and3 patients with inactive UC had received no medications.Twenty-five patients were treated with salazosulfapyridine(SASP) (1 000-6 000 mg/d) only, 12 were treated withmesalazine (5-ASA) (1 000-2 250 mg/d) only, 2 were treatedwith prednisolone (PDN) (10 mg/d) only, 12 were treatedwith PDN (5-20 mg/d) plus SASP (1 500-4 500 mg/d),and 5 were treated with PDN (5-20 mg/d) plus 5-ASA(1 000-2 250 mg/d).
Cell isolationWe obtained colonic mucosal samples from UC patientsand control subjects. At diagnostic or follow-up totalcolonoscopy when the activity and extent of the diseasewere evaluated, biopsy specimens from the appendix nearthe appendiceal orifice, transverse colon, and rectum (fourspecimens in each area) were obtained. We isolated mucosalmononuclear cells from biopsy specimens, as previouslydescribed[22]. The initial viability of the cellular suspensionsexceeded 95% in all instances when estimated by the trypanblue dye exclusion test. The viability was maintained at>80% during the entire assay period.
Flow cytometric analysisMucosal mononuclear cells were analyzed by two-color orthree-color flow cytometry with the following mAbs: anti-CD4-PE/anti-CD8-FITC (Coulter Immunology, Tokyo,Japan), anti-CD45 (leukocyte common antigen)-PE-Cy5(Immunotech, Cedex, France), anti-CD4-PE (Nichirei, Tokyo,Japan), anti-CD69 (early activation antigen)-FITC (Becton-Dickinson, Tokyo, Japan), and anti-HLA-DR (matureactivation antigen)-FITC (Immunotech). The isolated cellswere incubated with antibodies at 4 for 30 min, andwashed thrice in FACS buffer (PBS, sodium azide 0.01%,and bovine serum albumin 0.1%, Sigma, St. Louis, USA),and applied for flow cytometry (EPICS XL system II,Coulter Company).
We first analyzed the phenotyped cells by two-color flowcytometry. After the cell suspensions were initially visualizedin the forward scatter/side scatter profile, lymphocytepopulations were gated to exclude monocytes. The proportionof CD4+ and CD8+ T cells in the total lymphocytepopulations was expressed as CD4/CD8 ratio.
By three-color flow cytometry, we also analyzed theactivated CD4+ T cells. In the process of T cell activation,CD69, CD25, CD71, and HLA-DR antigens are seriallyexpressed on the surface of T cells. To identify this process,we investigated the expressions of CD69 (early activationantigen) and HLA-DR (mature activation antigen). Afterthe cell suspensions were visualized, lymphocyte populationswere gated as defined by CD45 (leukocyte common antigen)expression. The proportion of CD4+CD69+ and CD4+HLA-
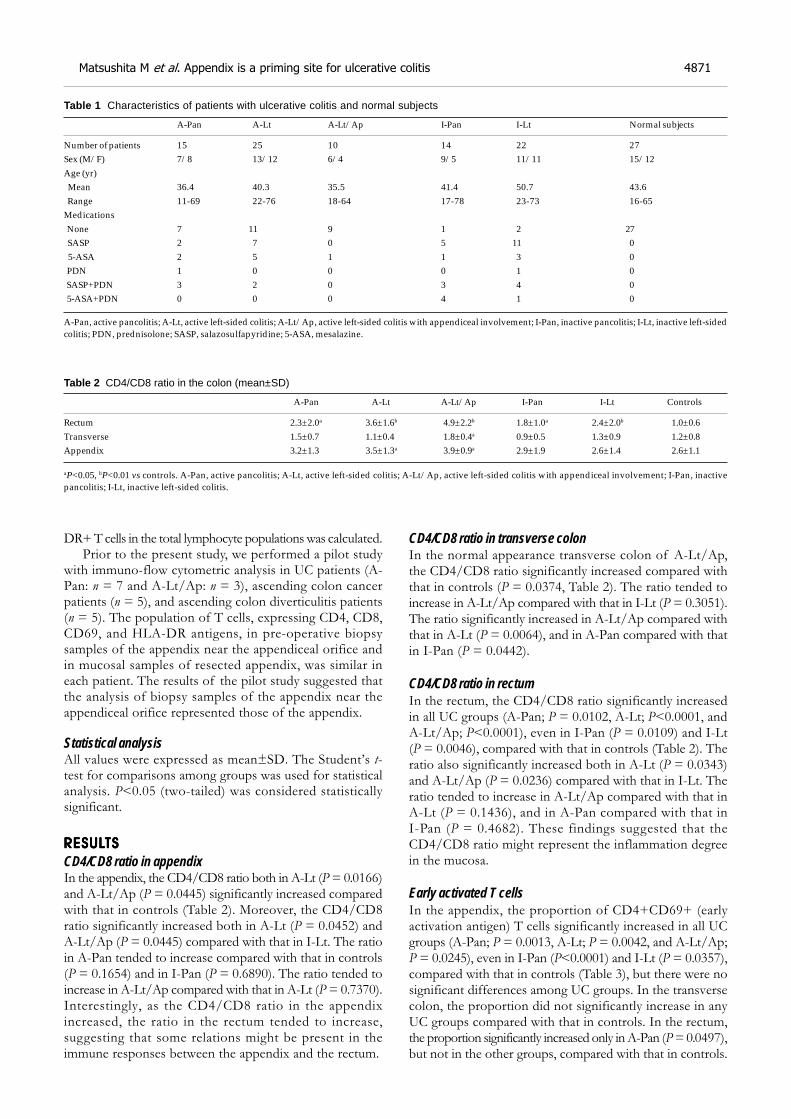
Matsushita M et al. Appendix is a priming site for ulcerative colitis 4871
DR+ T cells in the total lymphocyte populations was calculated.Prior to the present study, we performed a pilot study
with immuno-flow cytometric analysis in UC patients (A-Pan: n = 7 and A-Lt/Ap: n = 3), ascending colon cancerpatients (n = 5), and ascending colon diverticulitis patients(n = 5). The population of T cells, expressing CD4, CD8,CD69, and HLA-DR antigens, in pre-operative biopsysamples of the appendix near the appendiceal orifice andin mucosal samples of resected appendix, was similar ineach patient. The results of the pilot study suggested thatthe analysis of biopsy samples of the appendix near theappendiceal orifice represented those of the appendix.
Statistical analysisAll values were expressed as mean±SD. The Student’s t-test for comparisons among groups was used for statisticalanalysis. P<0.05 (two-tailed) was considered statisticallysignificant.
RESULRESULRESULRESULRESULTSTSTSTSTS
CD4/CD8 ratio in appendixIn the appendix, the CD4/CD8 ratio both in A-Lt (P = 0.0166)and A-Lt/Ap (P = 0.0445) significantly increased comparedwith that in controls (Table 2). Moreover, the CD4/CD8ratio significantly increased both in A-Lt (P = 0.0452) andA-Lt/Ap (P = 0.0445) compared with that in I-Lt. The ratioin A-Pan tended to increase compared with that in controls(P = 0.1654) and in I-Pan (P = 0.6890). The ratio tended toincrease in A-Lt/Ap compared with that in A-Lt (P = 0.7370).Interestingly, as the CD4/CD8 ratio in the appendixincreased, the ratio in the rectum tended to increase,suggesting that some relations might be present in theimmune responses between the appendix and the rectum.
CD4/CD8 ratio in transverse colonIn the normal appearance transverse colon of A-Lt/Ap,the CD4/CD8 ratio significantly increased compared withthat in controls (P = 0.0374, Table 2). The ratio tended toincrease in A-Lt/Ap compared with that in I-Lt (P = 0.3051).The ratio significantly increased in A-Lt/Ap compared withthat in A-Lt (P = 0.0064), and in A-Pan compared with thatin I-Pan (P = 0.0442).
CD4/CD8 ratio in rectumIn the rectum, the CD4/CD8 ratio significantly increasedin all UC groups (A-Pan; P = 0.0102, A-Lt; P<0.0001, andA-Lt/Ap; P<0.0001), even in I-Pan (P = 0.0109) and I-Lt(P = 0.0046), compared with that in controls (Table 2). Theratio also significantly increased both in A-Lt (P = 0.0343)and A-Lt/Ap (P = 0.0236) compared with that in I-Lt. Theratio tended to increase in A-Lt/Ap compared with that inA-Lt (P = 0.1436), and in A-Pan compared with that inI-Pan (P = 0.4682). These findings suggested that theCD4/CD8 ratio might represent the inflammation degreein the mucosa.
Early activated T cellsIn the appendix, the proportion of CD4+CD69+ (earlyactivation antigen) T cells significantly increased in all UCgroups (A-Pan; P = 0.0013, A-Lt; P = 0.0042, and A-Lt/Ap;P = 0.0245), even in I-Pan (P<0.0001) and I-Lt (P = 0.0357),compared with that in controls (Table 3), but there were nosignificant differences among UC groups. In the transversecolon, the proportion did not significantly increase in anyUC groups compared with that in controls. In the rectum,the proportion significantly increased only in A-Pan (P = 0.0497),but not in the other groups, compared with that in controls.
Table 1 Characteristics of patients with ulcerative colitis and normal subjects
A-Pan A-Lt A-Lt/Ap I-Pan I-Lt Normal subjects
Number of patients 15 25 10 14 22 27Sex (M/F) 7/8 13/12 6/4 9/5 11/11 15/12Age (yr) Mean 36.4 40.3 35.5 41.4 50.7 43.6 Range 11-69 22-76 18-64 17-78 23-73 16-65Medications None 7 11 9 1 2 27 SASP 2 7 0 5 11 0 5-ASA 2 5 1 1 3 0 PDN 1 0 0 0 1 0 SASP+PDN 3 2 0 3 4 0 5-ASA+PDN 0 0 0 4 1 0
A-Pan, active pancolitis; A-Lt, active left-sided colitis; A-Lt/Ap, active left-sided colitis with appendiceal involvement; I-Pan, inactive pancolitis; I-Lt, inactive left-sidedcolitis; PDN, prednisolone; SASP, salazosulfapyridine; 5-ASA, mesalazine.
Table 2 CD4/CD8 ratio in the colon (mean±SD)
A-Pan A-Lt A-Lt/Ap I-Pan I-Lt Controls
Rectum 2.3±2.0a 3.6±1.6b 4.9±2.2b 1.8±1.0a 2.4±2.0b 1.0±0.6Transverse 1.5±0.7 1.1±0.4 1.8±0.4a 0.9±0.5 1.3±0.9 1.2±0.8Appendix 3.2±1.3 3.5±1.3a 3.9±0.9a 2.9±1.9 2.6±1.4 2.6±1.1
aP<0.05, bP<0.01 vs controls. A-Pan, active pancolitis; A-Lt, active left-sided colitis; A-Lt/Ap, active left-sided colitis with appendiceal involvement; I-Pan, inactivepancolitis; I-Lt, inactive left-sided colitis.
Late activated T cellsThe proportion of CD4+HLA-DR+ (mature activationantigen) T cells in the rectum significantly increased only inA-Pan compared with that in controls (P = 0.0299), whilethe proportion of CD4+HLA-DR+ T cells in the appendixdid not significantly increase in any UC groups, comparedwith that in controls (Table 3). The proportion in thetransverse colon also did not significantly increase in anyUC groups compared with that in controls.
Effects of drugs on CD4/CD8 ratio and activated T cellsTo identify the effects of drug treatment on the profiles ofT cells, we analyzed the CD4/CD8 ratio and proportionsof CD4+CD69+ and CD4+HLA-DR+ T cells in activeUC patients with medication (A-Pan; n = 8, and A-Lt; n = 14)and those without medication (A-Pan; n = 7, and A-Lt; n = 11).Although the CD4/CD8 ratio in the transverse colon ofA-Pan significantly increased in the patients withoutmedication compared with those with medication (P = 0.0306),the other ratios and proportions were not significant betweenthe patients with medication and those without medication.Our results were therefore not so influenced with medicaltherapy.
DISCUSSIONDISCUSSIONDISCUSSIONDISCUSSIONDISCUSSION
Although the pathogenesis of UC has not been determined,an abnormal mucosal immune response plays a major rolein the development and pathophysiology of UC[23,24]. Thereare few studies investigating the immune-regulatory cells inthe appendix of patients with UC, especially with left-sidedUC. Most studies have used cells isolated from colectomyspecimens involving the disease to detect local immuneabnormality[23,24]. Because colectomy is usually performedin severe and refractory cases, mostly in pancolitis cases,but not in other active or inactive cases after a period ofmedical therapy, these studies may not cover the wholespectrum of disease activity[25]. We therefore used cellsisolated from colonoscopic biopsy specimens of UC patientswith a wide range of disease activity, but the appendicealmucosa is usually hard to obtain by biopsy. In this study,biopsy specimens of the appendix near the appendicealorifice were used, instead of specimens of the appendixitself, because our prior pilot study showed that the analysisof biopsy samples of the appendix near the appendicealorifice represented those of the appendix.
Although CD4+ and CD8+ T cells contain counterpartfunctions, such immuno-activation as helper/inducer T cellsand immuno-suppression as regulatory T cells, the CD4/CD8ratio is one of the most reflective markers for immuneactivation[14,26]. In the present study, the CD4/CD8 ratio inthe appendix significantly increased both in A-Lt and A-Lt/Apcompared with that in controls (Table 2). The ratio in theappendix also tended to increase in A-Pan compared withthat in controls. Interestingly, as the CD4/CD8 ratio in theappendix increased, the ratio in the rectum tended to increase,suggesting that some relationships might be present in theimmune responses between the appendix and the rectum.
In the normal appearance transverse colon of A-Lt/Ap,the CD4/CD8 ratio significantly increased compared withthat in controls (Table 2). In the entire colon, the CD4/CD8ratio tended to increase in A-Lt/Ap compared with that inA-Lt, but it was significant only in the transverse colon.Matsumoto et al.[27], also reported that the histologicalinflammation grade in the entire colon was higher in A-Lt/Apthan that in A-Lt. The grade was significant both in the inflamedappendiceal orifice (P<0.001) and in the uninflamed ascendingcolon (P<0.05). The CD4/CD8 ratio therefore may representthe inflammation degree in the mucosa.
Even in the inactive UC groups, the CD4/CD8 ratiosignificantly increased in the rectum compared with that incontrols. Most patients with inactive UC have low-gradeinflammation, and it is possible that symptomatic relapseoccurs only when the inflammatory process reaches a criticalintensity[28]. Also, because inflammation is a continuousprocess, direct assessment of the level of inflammatoryactivity may provide a quantitative pre-symptomatic measureof imminent clinical relapse of the disease[28]. In our study,the increased CD4/CD8 ratio suggested that the significantimmuno-imbalance was persistent in the inactive rectum.Because patients with inactive UC even receiving maintenancetherapy are easy to relapse[29], we suspect that the diseasecan relapse when the immuno-imbalance is persistent in therectum.
Recent investigations including TCR-α deficient micecolitis models suggest that non-pathogenic enteric bacterialflora may be involved in the induction of colitis[12,30].However, it is unclear which part of the colon is involvedin priming luminal antigens as the inductive site. To identifythe priming site, we compared early- and late-activatedCD4+ T cells with CD69 as an early activation antigen andHLA-DR as a late activation antigen, respectively. In the
Table 3 Activated T cells in the colon (mean±SD, %)
A-Pan A-Lt A-Lt/Ap I-Pan I-Lt Controls
CD4+CD69+ T cellsRectum 27.8±4.6a 23.2±5.0 24.0±7.6 24.5±6.2 28.2±8.6 23.1±4.1Transverse 25.0±5.7 20.4±7.8 23.4±4.3 21.5±7.3 22.1±6.2 21.0±9.1Appendix 26.6±3.0b 28.0±7.0b 26.0±4.0a 28.9±3.9b 25.4±7.3a 19.6±4.1CD4+HLA-DR+ T cellsRectum 15.2±6.2a 10.1±3.8 7.3±2.4 11.6±4.1 11.1±6.0 8.6±4.7Transverse 13.2±5.0 7.9±4.0 9.1±4.9 14.9±6.7 9.5±3.7 9.5±5.3Appendix 8.9±2.4 9.9±4.1 9.9±2.4 12.6±2.8 10.9±4.3 8.8±3.6
aP<0.05, bP<0.01 vs controls. A-Pan, active pancolitis; A-Lt, active left-sided colitis; A-Lt/Ap, active left-sided colitis with appendiceal involvement; I-Pan, inactivepancolitis; I-Lt, inactive left-sided colitis.
4872 ISSN 1007-9327 CN 14-1219/ R World J Gastroenterol August 21, 2005 Volume 11 Number 31
appendix, the proportion of CD4+CD69+ T cells significantlyincreased in all UC groups, even in the inactive UC groups,compared with that in controls (Table 3). In the transversecolon, the proportion did not significantly increase in anyUC groups compared with that in controls. In the rectum,the proportion significantly increased only in A-Pan, butnot in the other groups, compared with that in controls.The proportion of CD4+HLA-DR+ T cells significantlyincreased only in the rectum of A-Pan, but not in the otherareas of any groups compared with that in controls (Table 3).These findings suggest that the appendix may be a primingsite in the development of UC. In A-Pan, the CD4/CD8ratio tended to increase in all areas compared with that incontrols, but it was significant only in the rectum (Table 2),where the proportions of CD4+CD69+ and CD4+HLA-DR+ T cells significantly increased compared with those incontrols (Table 3). The findings suggest that the appendixmay not play a major role in extended colitis.
In TCR-α-deficient mice, the pathological T cells areinitially concentrated in the appendix[31]. Mucosal TCR-αβ+T cells, including CD4+ T cells, in IL-2-deficient mice appearin the colon prior to the manifestation of colitis[16]. An increaseof identical T cell clones involved in the development ofinflammation is detectable in the uninflamed appendix andthe inflamed colon of UC patients as well as in TCR-α-deficient mice[32,33]. Therefore, the increased CD4+CD69+T cells indicate that CD4+ T cells may be initially activatedin the appendix, and may re-circulate to the entire colonand rectum (increased CD4/CD8) prior to the manifestationof UC, and inflammation originating from the rectumextends to the entire colon. The reason why the inflammationbegins in the rectum is unknown.
We first reported the improvement of UC (A-Lt/Ap)without medication during the 3 years after appendectomyin a young patient (21-year-old), and proposed thatappendectomy may have a place as a therapeutic strategy inUC patients[13]. Ja”rnerot et al.[34], also performed laparoscopicappendectomy in six patients with refractory UC (two A-Pan and four A-Lt), and found that one young patient(26-years old) was in remission with continued maintenancetreatment, but five patients (mean age: 50.8 years, range:44-56 years) had relapse of the disease. Histological analysisof the resected appendix showed mucosal erosions andmoderate infiltrations of CD4+ T cells in our patient[13],but did not show any inflammation in all patients as reportedby Ja”rnerot et al.[34]. They concluded that appendectomydoes not influence the course of established UC in aconsistent way, which supports our results in this study. Eriet al.[35], also reported the clinical course of six patients (meanage: 30.5 years) with refractory UC (five A-Lt and one A-Lt/Ap) after laparoscopic appendectomy, and found thatfive patients were in complete clinical remission, and onepatient had improved. Histological analysis of the resectedappendix showed colitis-type inflammation (ulcerativeappendicitis), containing a highly activated lymphocytepopulation, in the five patients. Recently, Jo et al.[19], reportedthe clinical course of nine patients (mean age; 32.5 years,range; 13-48 years) with mildly activated UC (four A-Panand five A-Lt) after appendectomy, and found that two A-Lt patients with ulcerative appendicitis had improved, but
the disease remained active in the other patients (three A-Lt without ulcerative appendicitis and four A-Pan). Hallaset al.[36], reported the nationwide study with complete follow-up of 202 patients (mean age; 43.3 years) with UC whounderwent appendectomy after their onset of UC, andconcluded that appendectomy has no beneficial effect onadmission rates in UC patients. Although appendectomy isassociated with a low risk for subsequent UC only in youngpatients[13,19,34,35], especially before the age of 20 years[7], nostratification of data for any age had been performed[36].Later, Hallas et al.[37], supported that appendectomy wouldbe useful against UC in young subjects by analyzing thosewho underwent appendectomy before the age of 30 years.These findings and our results indicate that appendectomymay be performed in young UC patients with ulcerativeappendicitis.
In conclusion, our study suggests that the CD4/CD8ratio represents the inflammation degree in the mucosa.Appendectomy may be a benefit therapy in young UCpatients with ulcerative appendicitis. Apart from the rectum,the appendix is a priming site in the development of UC,and should no longer be considered as an evolutionaryredundancy. Further studies including analysis of CD4+and CD8+ T cells are necessary to clarify the role of theappendix in the pathogenesis of UC.
ACKNOWLEDGMENTACKNOWLEDGMENTACKNOWLEDGMENTACKNOWLEDGMENTACKNOWLEDGMENT
The authors thank Dr. Tsutomu Chiba (Department ofGastroenterology and Endoscopic Medicine, KyotoUniversity, Kyoto, Japan) for critically reading the manuscriptand his helpful advices.
REFERENCESREFERENCESREFERENCESREFERENCESREFERENCES
1 Rachmilewitz D, Karmeli F, Takabayashi K, Hayashi T,Leider-Trejo L, Lee J, Leoni LM, Raz E. ImmunostimulatoryDNA ameliorates experimental and spontaneous murinecolitis. Gastroenterology 2002; 122: 1428-1441
2 Walker MR, Kasprowicz DJ, Gersuk VH, Be’nard A, VanLandeghen M, Buckner JH, Ziegler SF. Induction of FoxP3and acquisition of T regulatory activity by stimulated humanCD4+CD25- T cells. J Clin Invest 2003; 112: 1437-1443
3 Hu D, Ikizawa K, Lu L, Sanchirico ME, Shinohara ML, Can-tor H. Analysis of regulatory CD8 T cells in Qa-1-dedicientmice. Nat Med 2004; 5: 516-523
4 Panaccione R, Sandborn WJ. The appendix in ulcerativecolitis: a not so innocent bystander. Gastroenterology 1999;117: 272-273
5 Rutgeerts P, D’haens G, Hiele M, Geboes K, Vantrappen G.Appendectomy protects against ulcerative colitis. Gastroen-terology 1994; 106: 1251-1253
6 Russel MG, Dorant E, Brummer RJM, Van De Kruus MA,Muris JW, Bergers JM, Goedhard J, Stockbru”gger RW. Ap-pendectomy and the risk of developing ulcerative colitis orCrohn’s disease: results of a large case-control study. Gastro-enterology 1997; 113: 377-382
7 Andersson RE, Olaison G, Tysk C, Ekbom A. Appendec-tomy and protection against ulcerative colitis. N Engl J Med2001; 344: 808-814
8 Radford-Smith GL, Edwards JE, Purdie DM, Pandeya N,Watson M, Martin NG, Green A, Newman B, Florin THJ. Pro-tective role of appendicectomy on onset and severity of ulcer-ative colitis and Crohn’s disease. Gut 2002; 51: 808-813
9 Selby WS, Griffin S, Abraham N, Solomon MJ. Appendec-tomy protects against the development of ulcerative colitis but
Matsushita M et al. Appendix is a priming site for ulcerative colitis 4873
not affect its course. Am J Gastroenterol 2002; 97: 2834-283810 Cosnes J, Carbonnel F, Beaugerie L, Blain A, Reijasse D,
Gendre JP. Effects of appendicectomy on the course of ulcer-ative colitis. Gut 2002; 51: 803-807
11 Naganuma M, Iizuka B, Torii A, Ogihara T, Kawamura Y,Ichinose M, Kojima Y, Hibi T. Appendectomy protects againstthe development of ulcerative colitis and reduces its recurrence:results of a multicenter case-controlled study in Japan. Am JGastroenterol 2001; 96: 1123-1126
12 Mizoguchi A, Mizoguchi E, Chiba C, Bhan AK. Role of ap-pendix in the development of inflammatory bowel disease inTCR-α mutant mice. J Exp Med 1996; 184: 707-715
13 Okazaki K, Onodera H, Watanabe N, Nakase H, Uose S,Matsushita M, Kawanami C, Imamura M, Chiba T. A patientwith improvement of ulcerative colitis after appendectomy.Gastroenterology 2000; 119: 502-506
14 Mu”ller S, Lory J, Corazza N, Griffiths GM, Z’graggen K,Mazzucchelli L, Kappeler A, Mueller C. Activated CD4+ andCD8+ cytotoxic cells are present in increased numbers in theintestinal mucosa from patients with active inflammatorybowel disease. Am J Pathol 1998; 152: 261-268
15 Ueyama H, Kiyohara T, Sawada N, Isozaki K, Kitamura S,Kondo S, Miyagawa J, Kanayama S, Shinomura Y, IshikawaH, Ohtani T, Nezu R, Nagata S, Matsuzawa Y. High Fasligand expression on lymphocytes in lesions of ulcerative colitis.Gut 1998; 43: 48-55
16 Simpson SJ, Mizoguchi E, Allen D, Bhan AK, Terhorst C.Evidence that CD4+, but not CD8+ T cells are responsible formurine interleukin-2-dificient colitis. Eur J Immunol 1995; 25:2618-2625
17 Fiocchi C. Inflammatory bowel disease: etiology andpathogenesis. Gastroenterology 1998; 115: 182-205
18 Bhan AK, Mizoguchi E, Smith RN, Mizoguchi A. Colitis intransgenic and knockout animals as models of human in-flammatory bowel disease. Immunol Rev 1999; 169: 195-207
19 Jo Y, Matsumoto T, Yada S, Nakamura S, Yao T, HotokezakaM, Mibu R, Iida M. Histological and immunological featuresof appendix in patients with ulcerative colitis. Dig Dis Sci2003; 48: 99-108
20 Schachter H, Kirsner JB. Definitions of inflammatory boweldisease of unknown etiology. Gastroenterology 1975; 68: 591-600
21 Riley SA, Mani V, Goodman MJ, Herd ME, Dutt S, TurnbergLA. Comparison of delayed-release 5-aminosalicylic acid(mesalazine) and sulfasalazine as maintenance treatmentfor patients with ulcerative colitis. Gastroenterology 1988;94: 1383-1389
22 Meenan J, Spaans J, Grool TA, Pals ST, Tytgat GNJ, vanDeventer SJH. Altered expression of α4β7, a gut homingintegrin, by circulating and mucosal T cells in colonic mu-cosal inflammation. Gut 1997; 40: 241-246
23 Scott IS, Sheaff M, Coumbe A, Feakins RM, Rampton DS.Appendiceal inflammation in ulcerative colitis. Histopathol-ogy 1998; 33: 168-173
24 Kroft SH, Stryker SJ, Rao MS. Appendiceal involvement as a
skip lesion in ulcerative colitis. Mod Pathol 1994; 7: 912-91425 Haruta J, Kusugami K, Kuroiwa A, Ina K, Shinoda M, Morise
K, Iokawa H, Morita M, Ishihara A, Sarai S. Phenotypic andfunctional analysis of lamina propria mononuclear cells fromcolonoscopic biopsy specimens in patients with ulcerativecolitis. Am J Gastroenterol 1992; 87: 448-454
26 Sasakawa T, Takizawa H, Bannai H, Narisawa R, AsakuraH. Activated CD4+ and CD8+ cells in the colonic mucosa ofulcerative colitis patients: their relationship to HLA-DR anti-gen expression on the colonic epithelium and serum solubleCD25 levels. Digestion 1995; 56: 516-522
27 Matsumoto T, Nakamura S, Shimizu M, Iida M. Significanceof appendiceal involvement in patients with ulcerative colitis.Gastrointest Endosc 2002; 55: 180-185
28 Tibble JA, Sigthorsson G, Bridger S, Fagerhol MK, BjarnasonI. Surrogate marker of intestinal inflammation are predictiveof relapse in patients with inflammatory bowel disease. Gas-troenterology 2000; 119: 15-22
29 Bitton A, Peppercorn MA, Antonioli DA, Niles JL, Shah S,Bousvaros A, Ransil B, Wild G, Cohen A, Edwardes MD,Stevens AC. Clinical, biological, and histologic parameters aspredictors of relapse in ulcerative colitis. Gastroenterology 2001;120: 13-20
30 Taurog JD, Richardson JA, Croft JT, Simmons WA, Zhou M,Ferna’ndez-Sueiro JL, Balish E, Hammer RE. The germfreestate prevents development of gut and joint inflammatorydisease in HLA-B27 transgenic rats. J Exp Med 1994; 180:2359-2364
31 Takahashi I, Kiyono H, Hamada S. CD4+ T-cell populationmediates development of inflammatory bowel disease in T-cell receptor α chain-deficient mice. Gastroenterology 1997; 112:1876-1886
32 Mizoguchi A, Mizoguchi E, Saubermann LJ, Higaki K,Blumberg RS, Bhan AK. Limited CD4 T-cell diversity associ-ated with colitis in T-cell receptor α mutant mice requires a Thelper 2 environment. Gastroenterology 2000; 119: 983-995
33 Probert CS, Chott A, Turner JR, Saubermann LJ, Stevens AC,Bodinaku K, Elson CO, Balk SP, Blumberg RS. Persistentclonal expansions of peripheral blood CD4+ lymphocytes inchronic inflammatory bowel disease. J Immunol 1996; 157:3183-3191
34 Ja”rnerot G, Andersson M, Franze’n L. Laparoscopic appen-dectomy in patients with refractory ulcerative colitis. Gastro-enterology 2001; 120: 1562-1563
35 Eri RD, Cross S, Misko I, Rickard M, Lumley J, Stitz R,Stevenson A, Lewindon P, Radford-Smith GL. Appendec-tomy for refractory ulcerative colitis: targeting the right patient.Gastroenterology 2002; 122: A61
36 Hallas J, Gaist D, Vach W, Sorensen HT. Appendicectomyhas no beneficial effect on admission rates in patients withulcerative colitis. Gut 2004; 53: 351-354
37 Hallas J, Gaist D, Vach W, Sorensen HT. The role of age in theprotection of appendicectomy against ulcerative colitis:author’s reply. Gut 2004; 53: 1719-1720
Science Editor Wang XL and Guo SY Language Editor Elsevier HK
4874 ISSN 1007-9327 CN 14-1219/ R World J Gastroenterol August 21, 2005 Volume 11 Number 31
• BRIEF REPORTS •
Ursodeoxycholic acid and superoxide anion
Predrag Ljubuncic, Omar Abu-Salach, Arieh Bomzon
ELSEVIER
PO Box 2345, Beijing 100023, China World J Gastroenterol 2005;11(31):4875-4878www.wjgnet.com World Journal of Gastroenterology ISSN [email protected] © 2005 The WJG Press and Elsevier Inc. All rights reserved.
Predrag Ljubuncic, Omar Abu-Salach, Arieh Bomzon,Department of Pharmacology, Ruth and Bruce Rappaport Facultyof Medicine, Technion-Israel Institute of Technology, Haifa, IsraelCorrespondence to: Arieh Bomzon, Department of Pharmacology,Ruth and Bruce Rappaport Faculty of Medicine, Technion-IsraelInstitute of Technology, Efron Street, Po Box 9649, Haifa 31096,Israel. [email protected]: +972-4-8295259 Fax: +972-4-8524978Received: 2004-12-24 Accepted: 2005-01-13
AbstractAbstractAbstractAbstractAbstract
AIM: To investigate the ability of ursodeoxycholic acid
(UDCA) to scavenge superoxide anion (O2–).
METHODS: We assessed the ability of UDCA to scavenge
(O2–) generated by xanthine-xanthine oxidase (X-XO) ina cell-free system and its effect on the rate of O2–-induced
ascorbic acid (AA) oxidation in hepatic post-mitochondrial
supernatants.
RESULTS: UDCA at a concentration as high as 1 mmol/L
did not impair the ability of the X-XO system to generateO2–, but could scavenge O2– at concentrations of 0.5 and
1 mmol/L, and decrease the rate of AA oxidation at a
concentration of 100 µmol/L.
CONCLUSION: UDCA can scavenge O2–, an action that
may be beneficial to patients with primary biliary cirrhosis.
© 2005 The WJG Press and Elsevier Inc. All rights reserved.
Key words: Ursodeoxycholic acid; Superoxide anion;
Antioxidant
Ljubuncic P, Abu-Salach O, Bomzon A. Ursodeoxycholic acidand superoxide anion. World J Gastroenterol 2005; 11(31):4875-4878
http://www.wjgnet.com/1007-9327/11/4875.asp
INTRODUCTIONINTRODUCTIONINTRODUCTIONINTRODUCTIONINTRODUCTION
Ursodeoxycholic acid (UDCA) is a naturally occurringtertiary dihydroxy hydrophilic bile acid used with considerablesuccess in the treatment of primary biliary cirrhosis (PBC)[1-5].Traditional mechanisms whereby UDCA is beneficial to thediseased liver center on its ability to block the deleteriousactions and encourage the choleresis of toxic bile acids[6].We have reported that UDCA has antioxidant properties.This finding is based on our observation that 100 µmol/L
UDCA could prevent oxidative activation of culturedmacrophages by the pro-oxidant hydrophobic bile acid,deoxycholic acid [7]. In a follow-up in vivo study, wedemonstrated that the therapeutic dose of 15 mg/kg UDCAadministered for 24 d, suppresses the augmented extent oflipid peroxidation in the diseased liver of bile duct-ligated(BDL) rats, a widely used animal model of cholestatic liverdisease[8]. Accordingly, we proposed the antioxidant actionof UDCA could contribute to its beneficial effect in patientswith PBC[7,8]. This proposal was recently confirmed byServiddio and his colleagues who reported UDCAadministered for 28 d minimized oxidative damage in thediseased liver of BDL rats[9]. Other studies have establishedthat UDCA can augment the biosynthesis of glutathione(GSH) and thiol-containing proteins in hepatocytes[10,11] andcould scavenge the hydroxyl radical (OH·) in a cell-freesystem[12]. Collectively, these findings have contributed toour current awareness that UDCA is a binary antioxidantpossessing direct and indirect antioxidant properties.
Superoxide anion (O2–) is a reactive oxygen species (ROS)
generated in microsomal and mitochondrial electrontransport systems when oxygen is reduced by a singleelectron. It can also be generated by numerous oxidativeenzymes including cytosolic xanthine oxidase (XO) duringoxidation of xanthine (X) to uric acid. The generation ofO2
– is important, because its biotransformation can lead toformation of hydrogen peroxide through the activity ofsuperoxide dismutase, generation of OH· radical in thepresence of transition metals such as Fe2+ or formation ofthe reactive peroxynitrite radical by interacting with nitricoxide. Any intervention reducing or preventing excessivegeneration of O2
– would result in decreased production ofreactive oxygen and nitroxy species thereby lowering theextent of oxidative stress.
Mitsuyoshi et al.[10], reported that UDCA increaseshepatocyte levels of GSH and thiol-containing proteins. Inthis experiment, they spectrophotometrically measured therate of oxidation of ascorbic acid (AA) by O2
– and reportedthat the difference of absorbance before and after theaddition of XO was lower in UDCA-treated hepatocytesthan in controls. Since bile acids are enzyme inhibitors[13,14],the difference in absorbance may be due to UDCA inhibitingthe ability of the X-XO system to generate O2
–. BecauseMitsuyoshi et al., did not assess the effect of UDCA on thegeneration of O2
– by X-XO system in their investigation,we evaluated the ability of UDCA to scavenge O2
– generatedin the X-XO system and its effect on the activity of XO.
MAMAMAMAMATERIALS AND METHODSTERIALS AND METHODSTERIALS AND METHODSTERIALS AND METHODSTERIALS AND METHODS
Chemicals and reagentsAll chemicals and reagents of the highest purity were
4876 ISSN 1007-9327 CN 14-1219/ R World J Gastroenterol August 21, 2005 Volume 11 Number 31
purchased from the Sigma Chemical Co. (St. Louis, MO,USA), except for UDCA that was purchased as its sodiumsalt from Megapharm Ltd, the Israeli agent of Calbiochem-Novabiochem Corporation.
Preparation of hepatic post-mitochondrial supernatantsThe livers were harvested from healthy rats used as “healthyuntreated controls” in institute-approved animal-basedinvestigations. The harvested livers were washed in normalice-cold saline, weighed and then cut into small pieces usingscissors before their homogenization in 100 mmol/L ice-coldphosphate buffer, pH 7.4 at 4 with a Potter-Elvehjemglass homogenizer. The crude liver homogenates werecentrifuged (1 000 r/min×10 min) at 4 . The resultantsupernatants were then centrifuged at 10 000 g×10 min at4 to pellet mitochondria and the supernatant wascollected. The protein content in the supernatants wasdetermined by the method of Lowry et al.[15].
Analytical proceduresAbility of UDCA to scavenge superoxide anion Using thexanthine-xanthine oxidase (X-XO) reaction to generate O2
–[16],we evaluated the ability of 0.01-1 mmol/L UDCA toscavenge O2
– by the nitroblue tetrazolium (NBT) reductionassay[17]. The reaction mixture contained 100 µmol/LNa2EDTA, 40 µmol/L X, and 40 µmol/L NBT in 10 mmol/Lphosphate buffer pH 7.4. The reaction was started by adding10 mU/mL XO and its rate was continuously monitoredspectrophotometrically at A560 nm for 15 min at 25 inthe absence and presence of different concentrations ofUDCA. The specificity of the reaction was confirmed by300 mU/mL superoxide dismutase. The ability of UDCAto scavenge O2
–, as expressed as percentage of inhibitionof NBT reduction in UDCA-present samples compared toNBT reduction in UDCA-absent samples. The experimentwas repeated between 9 and 11 times at each UDCAconcentration.
Effect of UDCA on activity of xanthine oxidaseCompounds interacting with XO could affect the kineticsof reaction of oxidation of xanthine to uric acid [18].Accordingly, we assessed the effect of 0.01-1 mmol/LUDCA on XO activity by spectrophotometrically monitoringthe rate of uric acid formation at A295 nm for 3 min at25 in the absence and presence of UDCA[19]. The rateof uric acid formation was compared in the absence andpresence of UDCA. The specificity of the reaction wasconfirmed by 100 µg/mL allopurinol. The experiment wasrepeated nine times at each UDCA concentration.
Effect of UDCA on hepatic antioxidant capacityThe effect of 100 µmol/L UDCA on hepatic antioxidantcapacity was determined by monitoring the rate of oxidationof AA by the O2
– generated by the X-XO according to theoriginal method of Nishikimi[20] with modifications describedby Mitsuyoshi et al.[10]. Liver supernatants were incubatedfor 120 min at 37 in shaking water bath in the absenceand presence of 100 µmol/L UDCA. Upon completion ofthe incubation, the change in the rate of oxidation of AAwas monitored in a quartz cuvette containing 1 mL reaction
mixture. The post-mitochondrial liver supernatant contained100 µmol/L X, 100 µmol/L EDTA, 22 µg/mL catalase,100 µmol/L AA and 0.1 mol/L phosphate buffer pH 7.4.The assay reaction was commenced by adding 10 mU/mLXO. The reaction was monitored spectrophotometricallyat A250 nm for 10 min at 25 . The differences inabsorbance between UDCA-absent and UDCA-addedsamples were compared. The results were expressed as thereaction rate of AA oxidation ( absorbance/mg protein).The experiment was repeated thrice.
Experimental design and statistical analysisThe data were analyzed using a two-tailed t-test. The samplesize for each experiment was determined by power analysisarbitrarily set between 80-90% in order to detect the effectat the 5% significance level using StatmateTM version 1(GraphPad Software Inc., San Diego, CA, USA). All figureswere prepared using PrismTM version 3.02 (GraphPadSoftware Inc., San Diego, CA, USA). All data were expressedas mean±SD.
RESULRESULRESULRESULRESULTSTSTSTSTS
Ability of UDCA to scavenge O2– and effect of UDCA on activity
of xanthine oxidaseFigure 1A summarizes the experiments to establish whetherUDCA could scavenge O2
– using the NBT reduction assay.UDCA (10 µmol/L and 100 µmol/L) had no effect onNBT reduction (Figures 1 A1 and A2). Higher concentrationsof UDCA (500 µmol/L and 1 mmol/L) slowed the rate ofNBT reduction by 11% and 16% respectively (Figure 1A3and A4). In order to eliminate the possibility that UDCAsuppressed the rate of conversion of X to uric acid toaccount for this O2
– scavenging ability, we also measuredthe effects of the identical concentrations of UDCA onXO activity. None of the UDCA concentrations affectedthe rate of formation of uric acid (Figure 1B). Overall,these experiments demonstrated UDCA could scavenge O2
–
without affecting the activity of XO.
Effect of UDCA on rate of oxidation of ascorbic acidUDCA (100 µmol/L) significantly (P<0.002) decreased therate of AA oxidation (Figure 2).
DISCUSSIONDISCUSSIONDISCUSSIONDISCUSSIONDISCUSSION
The aim of the present study was to assess the ability ofUDCA to scavenge O2
– and its effects on the activity of XOin a cell-free system and post-mitochondrial supernatantsprepared from rat livers. In the cell-free experiments, weused UDCA concentrations not greater than 1 mmol/L inorder to avoid the problems when extrapolating data tocell-containing systems in which millimolar concentrationsof bile acids solubilize membranes to form micellarpoly-aggregates (critical micellar concentration)[21-23]. On theother hand, we used 100 µmol/L UDCA in the experimentsconducted in post-mitochondrial supernatants because thisis the concentration used by Mitsuyoshi et al.[10], and thatfound in the plasma of patients treated with UDCA[24]. UsingNBT reduction in the cell-free X-XO system to evaluatethe ability of UDCA to scavenge O2
–, we found UDCA
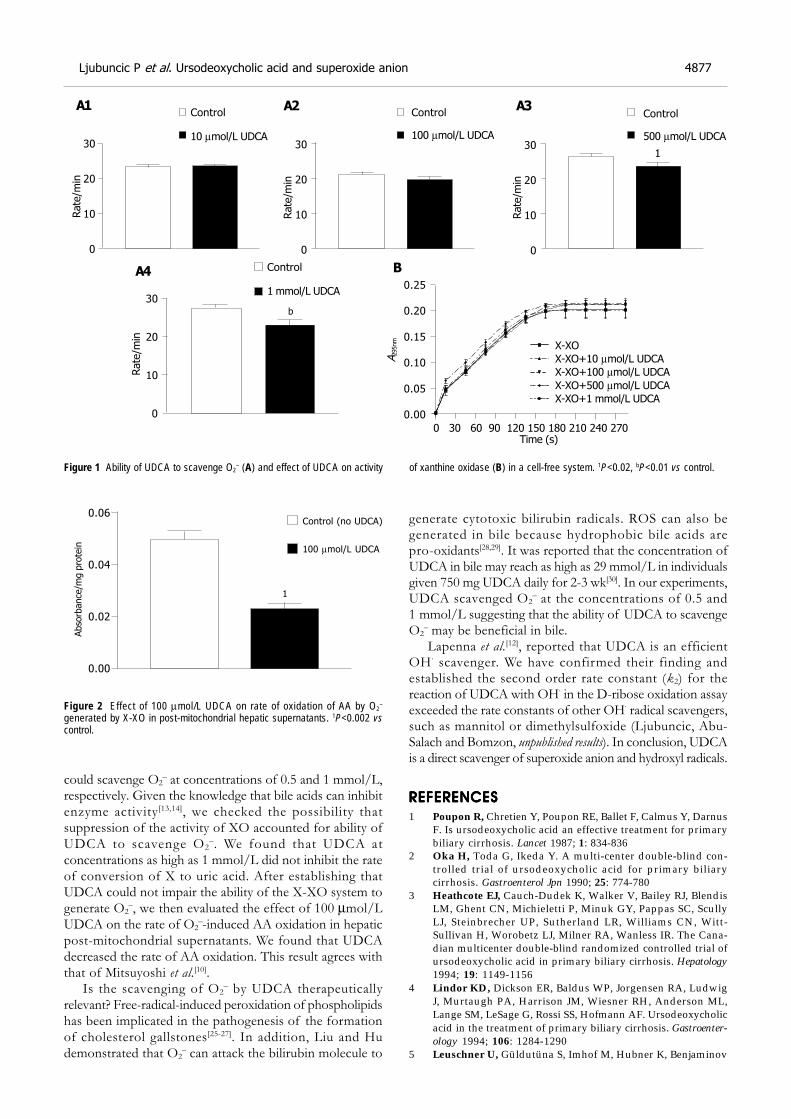
Ljubuncic P et al. Ursodeoxycholic acid and superoxide anion 4877
could scavenge O2– at concentrations of 0.5 and 1 mmol/L,
respectively. Given the knowledge that bile acids can inhibitenzyme activity[13,14], we checked the possibility thatsuppression of the activity of XO accounted for ability ofUDCA to scavenge O2
–. We found that UDCA atconcentrations as high as 1 mmol/L did not inhibit the rateof conversion of X to uric acid. After establishing thatUDCA could not impair the ability of the X-XO system togenerate O2
–, we then evaluated the effect of 100 µmol/LUDCA on the rate of O2
–-induced AA oxidation in hepaticpost-mitochondrial supernatants. We found that UDCAdecreased the rate of AA oxidation. This result agrees withthat of Mitsuyoshi et al.[10].
Is the scavenging of O2– by UDCA therapeutically
relevant? Free-radical-induced peroxidation of phospholipidshas been implicated in the pathogenesis of the formationof cholesterol gallstones[25-27]. In addition, Liu and Hudemonstrated that O2
– can attack the bilirubin molecule to
generate cytotoxic bilirubin radicals. ROS can also begenerated in bile because hydrophobic bile acids arepro-oxidants[28,29]. It was reported that the concentration ofUDCA in bile may reach as high as 29 mmol/L in individualsgiven 750 mg UDCA daily for 2-3 wk[30]. In our experiments,UDCA scavenged O2
– at the concentrations of 0.5 and1 mmol/L suggesting that the ability of UDCA to scavengeO2
– may be beneficial in bile.Lapenna et al.[12], reported that UDCA is an efficient
OH · scavenger. We have confirmed their finding andestablished the second order rate constant (k2) for thereaction of UDCA with OH· in the D-ribose oxidation assayexceeded the rate constants of other OH· radical scavengers,such as mannitol or dimethylsulfoxide (Ljubuncic, Abu-Salach and Bomzon, unpublished results). In conclusion, UDCAis a direct scavenger of superoxide anion and hydroxyl radicals.
REFERENCESREFERENCESREFERENCESREFERENCESREFERENCES
1 Poupon R, Chretien Y, Poupon RE, Ballet F, Calmus Y, DarnusF. Is ursodeoxycholic acid an effective treatment for primarybiliary cirrhosis. Lancet 1987; 1: 834-836
2 Oka H, Toda G, Ikeda Y. A multi-center double-blind con-trolled trial of ursodeoxycholic acid for primary biliarycirrhosis. Gastroenterol Jpn 1990; 25: 774-780
3 Heathcote EJ, Cauch-Dudek K, Walker V, Bailey RJ, BlendisLM, Ghent CN, Michieletti P, Minuk GY, Pappas SC, ScullyLJ, Steinbrecher UP, Sutherland LR, Williams CN, Witt-Sullivan H, Worobetz LJ, Milner RA, Wanless IR. The Cana-dian multicenter double-blind randomized controlled trial ofursodeoxycholic acid in primary biliary cirrhosis. Hepatology1994; 19: 1149-1156
4 Lindor KD, Dickson ER, Baldus WP, Jorgensen RA, LudwigJ, Murtaugh PA, Harrison JM, Wiesner RH, Anderson ML,Lange SM, LeSage G, Rossi SS, Hofmann AF. Ursodeoxycholicacid in the treatment of primary biliary cirrhosis. Gastroenter-ology 1994; 106: 1284-1290
5 Leuschner U, Güldutüna S, Imhof M, Hubner K, Benjaminov
Figure 2 Effect of 100 µmol/L UDCA on rate of oxidation of AA by O2–
generated by X-XO in post-mitochondrial hepatic supernatants. 1P<0.002 vscontrol.
Figure 1 Ability of UDCA to scavenge O2– (A) and effect of UDCA on activity of xanthine oxidase (B) in a cell-free system. 1P<0.02, bP<0.01 vs control.
Rate
/min
Control
10 µmol/L UDCA30
20
10
0
Rate
/min
Rate
/min
30
20
10
0
Rate
/min
A295nm
X-XO
X-XO+10 µmol/L UDCA
X-XO+100 µmol/L UDCA
X-XO+500 µmol/L UDCA
X-XO+1 mmol/L UDCA
0.25
0.20
0.15
0.10
0.05
0.00
0 30 60 90 120 150 180 210 240 270 Time (s)
Absorb
ance/m
g p
rote
in
Control (no UDCA)
100 µmol/L UDCA
30
20
10
0
30
20
10
0
Control
500 µmol/L UDCA
Control
100 µmol/L UDCA
Control
1 mmol/L UDCA
1
b
A1
B
A2 A3
A4
0.06
0.04
0.02
0.00
1
A, Leuschner M. Effects of ursodeoxycholic acid after 4 to 12years of therapy in early and late stages of primary biliarycirrhosis. J Hepatol 1994; 21: 624-633
6 Paumgartner G, Beuers U. Ursodeoxycholic acid in cholestaticliver disease. mechanisms of action and therapeutic userevisited. Hepatology 2002; 36: 525-531
7 Ljubuncic P, Fuhrman B, Oiknine J, Aviram M, Bomzon A.Effect of deoxycholic acid and ursodeoxycholic acid on lipidperoxidation in cultured macrophages. Gut 1996; 39: 475-478
8 Ljubuncic P, Tanne Z, Bomzon A. Ursodeoxycholic acid sup-presses extent of lipid peroxidation in diseased liver in experi-mental cholestatic liver disease. Dig Dis Sci 2000; 45: 1921-1928
9 Serviddio G, Pereda J, Pallardo FV, Carretero J, Borras C,Cutrin J, Vendemiale G, Poli G, Vina J, Sastre J. Ursodeoxycholicacid protects against secondary biliary cirrhosis in rats bypreventing mitochondrial oxidative stress. Hepatology 2004;39: 711-720
10 Mitsuyoshi H, Nakashima T, Sumida Y, Yoh T, Nakajima Y,Ishikawa H, Inaba K, Sakamoto Y, Okanoue T, Kashima K.Ursodeoxycholic acid protects hepatocytes against oxidativeinjury via induction of antioxidants. Biochem Biophys Res Comm1999; 263: 537-542
11 Rodriguez-Ortigosa CM, Cincu RN, Sanz S, Ruiz F, QuirogaJ, Prieto J. Effect of ursodeoxycholic acid on methionineadenosyltransferase activity and hepatic glutathione metabo-lism in rats. Gut 2002; 50: 701-706
12 Lapenna D, Ciofani G, Festi D, Neri M, Pierdomenico SD,Giamberardino MA, Cuccurullo F. Antioxidant properties ofursodeoxycholic acid. Biochem Pharmacol 2002; 64: 1661-1667
13 Parkinson TM, Olson JA. Inhibitory effects of bile acids onadenosine tryphosphatase, oxygen consumption, and thetransport and diffusion of water soluble substances in thesmall intestine of the rat. Life Sci 1964; 3: 107-112
14 Krahenbuhl S, Stucki J, Reichen J. Reduced activity of theelectron transport chain in liver mitochondria isolated fromrats with secondary biliary cirrhosis. Hepatology 1992; 15:1160-1166
15 Lowry OH, Rosebrough NJ, Farr AL, Randall RJ. Protein mea-surement with the Folin phenol reagent. J Biol Chem 1951; 193:265-275
16 McCord JM, Fridovich I. The reduction of cytochrome c bymilk xanthine oxidase. J Biol Chem 1968; 243: 5753-5760
17 Aruoma OI, Halliwell B, Hoey BM, Butler J. The antioxidantaction of N-acetylcysteine: its reaction with hydrogen peroxide,hydroxyl radical, superoxide, and hypochlorous acid. FreeRadic Biol Med 1989; 6: 593-597
18 Fridovich I. Quantitative aspects of the production of super-oxide anion radical by milk xanthine oxidase. J Biol Chem1970; 245: 4053-4057
19 Marcocci L, Suzuki YJ, Tsuchiya M, Packer L. Antioxidantactivity of nitecapone and its analog OR-1246: effect of struc-tural modification on antioxidant action. Methods Enzymol1994; 234: 525-541
20 Nishikimi M. Oxidation of ascorbic acid with superoxideanion generated by the xanthine-xanthine oxidase system.Biochem Biophys Res Comm 1975; 63: 463-468
21 Heaton KW. The importance of keeping bile salts in theirplace. Gut 1969; 10: 857-863
22 Heuman DM. Quantitative estimation of the hydrophilic-hydrophobic balance of mixed bile salt solutions. J Lipid Res1989; 30: 719-730
23 Roda A, Minutello A, Angellotti MA, Fini A. Bile acid struc-ture-activity relationship: evaluation of bile acid lipophilicityusing 1-octanol/water partition coefficient and reverse phaseHPLC. J Lipid Res 1990; 31: 1433-1444
24 Stiehl A, Rudolph G, Raedsch R, Moller B, Hopf U, LottererE, Bircher J, Folsch U, Klaus J, Endele R, Senn M. Ursodeoxycholicacid-induced changes of plasma and urinary bile acids inpatients with primary biliary cirrhosis. Hepatology 1990; 12:492-497
25 Lichtenberg D, Ragimova S, Peled Y, Halpern Z. Phospho-lipid peroxidation as a factor in gallstone pathogenesis. FEBSLett 1988; 228: 179-181
26 Eder MI, Miquel JF, Jungst D, Paumgartner G, Von Ritter C.Reactive oxygen metabolites promote cholesterol crystal for-mation in model bile: Role of lipid peroxidation. Free RadicBiol Med 1996; 20: 743-749
27 Leo MA, Aleynik SI, Siegel JH, Kasmin FE, Aleynik MK, LieberCS. F2-isoprostane and 4-hydroxynonenal excretion in humanbile of patients with biliary tract and pancreatic disorders.Am J Gastroenterol 1997; 92: 2069-2072
28 Sokol RJ, Devereaux M, Khandwala R, O’Brien K. Evidencefor involvement of oxygen free radicals in bile acid toxicity toisolated rat hepatocytes. Hepatology 1993; 17: 869-881
29 Sokol RJ, Winklhofer-Roob BM, Devereaux MW, McKim JM.Generation of hydroperoxides in isolated rat hepatocytes andhepatic mitochondria exposed to hydrophobic bile acids. Gas-troenterology 1995; 109: 1249-1256
30 Fischer S, Neubrand M, Paumgartner G. Biotransformationof orally administered ursodeoxycholic acid in man as ob-served in gallbladder bile, serum and urine. Eur J Clin Invest1993; 23: 28-36
Science Editor Wang XL and Guo SY Language Editor Elsevier HK
4878 ISSN 1007-9327 CN 14-1219/ R World J Gastroenterol August 21, 2005 Volume 11 Number 31
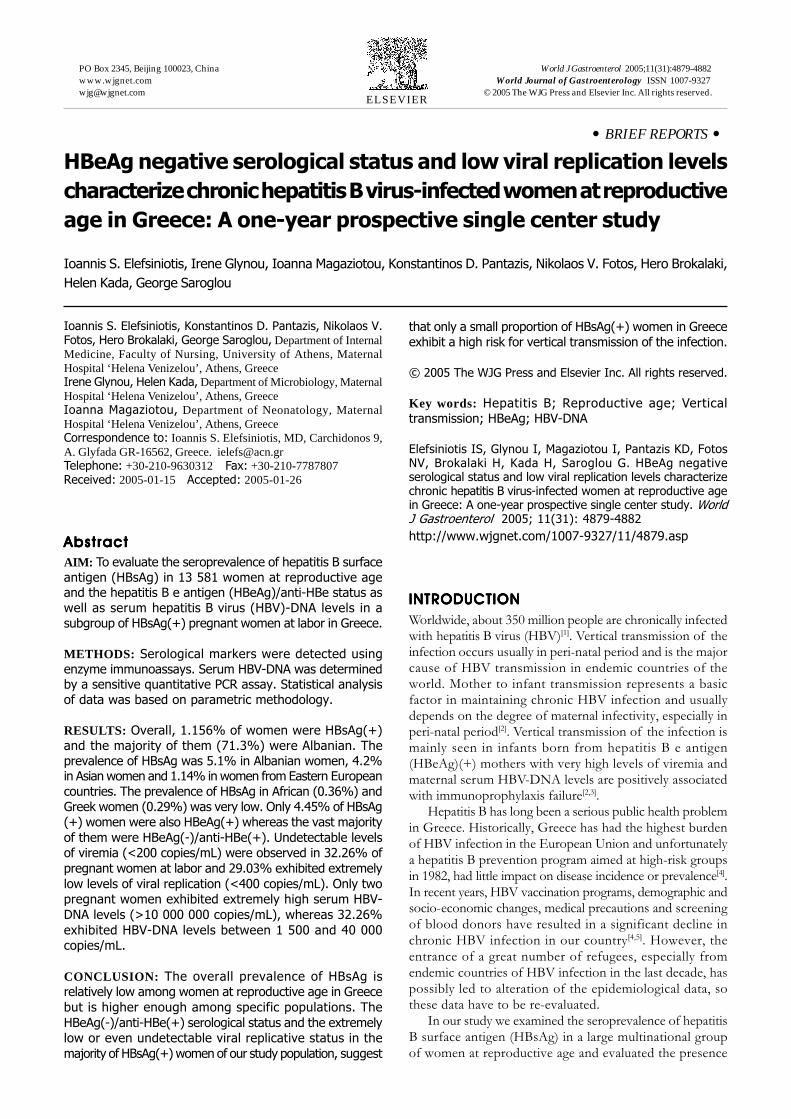
• BRIEF REPORTS •
HBeAg negative serological status and low viral replication levels
characterize chronic hepatitis B virus-infected women at reproductive
age in Greece: A one-year prospective single center study
Ioannis S. Elefsiniotis, Irene Glynou, Ioanna Magaziotou, Konstantinos D. Pantazis, Nikolaos V. Fotos, Hero Brokalaki,
Helen Kada, George Saroglou
ELSEVIER
PO Box 2345, Beijing 100023, China World J Gastroenterol 2005;11(31):4879-4882www.wjgnet.com World Journal of Gastroenterology ISSN [email protected] © 2005 The WJG Press and Elsevier Inc. All rights reserved.
Ioannis S. Elefsiniotis, Konstantinos D. Pantazis, Nikolaos V.Fotos, Hero Brokalaki, George Saroglou, Department of InternalMedicine, Faculty of Nursing, University of Athens, MaternalHospital ‘Helena Venizelou’, Athens, GreeceIrene Glynou, Helen Kada, Department of Microbiology, MaternalHospital ‘Helena Venizelou’, Athens, GreeceIoanna Magaziotou, Department of Neonatology, MaternalHospital ‘Helena Venizelou’, Athens, GreeceCorrespondence to: Ioannis S. Elefsiniotis, MD, Carchidonos 9,A. Glyfada GR-16562, Greece. [email protected]: +30-210-9630312 Fax: +30-210-7787807Received: 2005-01-15 Accepted: 2005-01-26
AbstractAbstractAbstractAbstractAbstract
AIM: To evaluate the seroprevalence of hepatitis B surfaceantigen (HBsAg) in 13 581 women at reproductive ageand the hepatitis B e antigen (HBeAg)/anti-HBe status aswell as serum hepatitis B virus (HBV)-DNA levels in asubgroup of HBsAg(+) pregnant women at labor in Greece.
METHODS: Serological markers were detected usingenzyme immunoassays. Serum HBV-DNA was determinedby a sensitive quantitative PCR assay. Statistical analysisof data was based on parametric methodology.
RESULTS: Overall, 1.156% of women were HBsAg(+)and the majority of them (71.3%) were Albanian. Theprevalence of HBsAg was 5.1% in Albanian women, 4.2%in Asian women and 1.14% in women from Eastern Europeancountries. The prevalence of HBsAg in African (0.36%) andGreek women (0.29%) was very low. Only 4.45% of HBsAg(+) women were also HBeAg(+) whereas the vast majority
of them were HBeAg(-)/anti-HBe(+). Undetectable levelsof viremia (<200 copies/mL) were observed in 32.26% of
pregnant women at labor and 29.03% exhibited extremely
low levels of viral replication (<400 copies/mL). Only twopregnant women exhibited extremely high serum HBV-
DNA levels (>10 000 000 copies/mL), whereas 32.26%
exhibited HBV-DNA levels between 1 500 and 40 000copies/mL.
CONCLUSION: The overall prevalence of HBsAg isrelatively low among women at reproductive age in Greece
but is higher enough among specific populations. The
HBeAg(-)/anti-HBe(+) serological status and the extremelylow or even undetectable viral replicative status in the
majority of HBsAg(+) women of our study population, suggest
that only a small proportion of HBsAg(+) women in Greeceexhibit a high risk for vertical transmission of the infection.
© 2005 The WJG Press and Elsevier Inc. All rights reserved.
Key words: Hepatitis B; Reproductive age; Verticaltransmission; HBeAg; HBV-DNA
Elefsiniotis IS, Glynou I, Magaziotou I, Pantazis KD, FotosNV, Brokalaki H, Kada H, Saroglou G. HBeAg negativeserological status and low viral replication levels characterizechronic hepatitis B virus-infected women at reproductive agein Greece: A one-year prospective single center study. World
J Gastroenterol 2005; 11(31): 4879-4882
http://www.wjgnet.com/1007-9327/11/4879.asp
INTRODUCTIONINTRODUCTIONINTRODUCTIONINTRODUCTIONINTRODUCTION
Worldwide, about 350 million people are chronically infectedwith hepatitis B virus (HBV)[1]. Vertical transmission of theinfection occurs usually in peri-natal period and is the majorcause of HBV transmission in endemic countries of theworld. Mother to infant transmission represents a basicfactor in maintaining chronic HBV infection and usuallydepends on the degree of maternal infectivity, especially inperi-natal period[2]. Vertical transmission of the infection ismainly seen in infants born from hepatitis B e antigen(HBeAg)(+) mothers with very high levels of viremia andmaternal serum HBV-DNA levels are positively associatedwith immunoprophylaxis failure[2,3].
Hepatitis B has long been a serious public health problemin Greece. Historically, Greece has had the highest burdenof HBV infection in the European Union and unfortunatelya hepatitis B prevention program aimed at high-risk groupsin 1982, had little impact on disease incidence or prevalence[4].In recent years, HBV vaccination programs, demographic andsocio-economic changes, medical precautions and screeningof blood donors have resulted in a significant decline inchronic HBV infection in our country[4,5]. However, theentrance of a great number of refugees, especially fromendemic countries of HBV infection in the last decade, haspossibly led to alteration of the epidemiological data, sothese data have to be re-evaluated.
In our study we examined the seroprevalence of hepatitisB surface antigen (HBsAg) in a large multinational groupof women at reproductive age and evaluated the presence
4880 ISSN 1007-9327 CN 14-1219/ R World J Gastroenterol August 21, 2005 Volume 11 Number 31
of HBeAg, antibody to HBeAg (anti-HBeAg) as well asantibody to hepatitis C virus (anti-HCV) in HBsAg(+)individuals. Moreover we measured the serum HBV-DNAlevels in a subgroup of HBsAg(+)/anti-HCV(-) pregnantwomen at labor, in order to gain information about maternalviral load at this important period, a factor positivelycorrelated with vertical transmission of the infection.
MAMAMAMAMATERIALS AND METHODSTERIALS AND METHODSTERIALS AND METHODSTERIALS AND METHODSTERIALS AND METHODS
Between August 2003 and August 2004, a total of 13 581women at reproductive age (range 16-45 years) wereprospectively evaluated at the Department of Obstetrics andGynecology of the Maternal Hospital ‘Helena Venizelou’ ofAthens, Greece. HBsAg, HBeAg, anti-HBeAg, and antibodyto hepatitis B core antigen (anti-HBcAg) as well as anti-HCVwere detected by routine commercially available enzymeimmunoassays (Abbott Laboratories, Abbott Park, IL, USA).All women of the study were screened for HBsAg whereasthe rest of the serological markers were evaluated only inHBsAg(+) ones. Antibody to hepatitis D virus (anti-HDV)and antibody to HIV (anti-HIV) were not detected. SerumHBV-DNA was determined by a sensitive, commerciallyavailable quantitative PCR assay (COBAS-Amplicor HBVMonitor, Version 2, Roche, Basel, Switzerland), with a lowerlimit of quantification of 200 copies/mL in a subgroup ofHBsAg(+)/anti-HCV(-) pregnant women of the studypopulation, with available serum samples, at labor.
Statistical analysis of data was based on parametricmethodology. Student’s t-test and χ2 test were used. P<0.05was statistically significant. The study was reviewed andapproved by the local ethics committee. The study protocolconforms to the ethical guidelines of the Declaration ofHelsinki.
RESULRESULRESULRESULRESULTSTSTSTSTS
The majority of the study population came from Greece(70.31%) whereas 15.96% came from Albania, 7.06% fromEastern European countries (Russia, Romania, and Bulgaria),4.09% from African countries, 0.69% from Asian countries,0.99% from countries of Northwestern Europe, 0.46%from Australia and 0.43% from North American countries.Overall, 157 of 13 581 females (1.156%) were HBsAg(+)and the vast majority of them (112/157, 71.3%) wereAlbanian. The participation of each national group in HBsAg(+) cases of the study population is presented in Figure 1.None of the females from countries of North America,Northwestern Europe, and Australia (countries of lowprevalence of HBV infection) was HBsAg(+).
The seroprevalence of HBsAg was 5.1% in women fromAlbania, representing the higher seroprevalence rate amongthe national groups of the study population, followed by4.2% in Asian women and 1.14% in women from EasternEuropean countries. The seroprevalence of HBsAg inAfrican (0.36%) and Greek women (0.29%) was very low,compared to the mean seroprevalence rate of the studypopulation (P<0.05). Overall, only 4.45% of HBsAg(+)women were also HBeAg(+) whereas the vast majority ofthem were HBeAg(-)/anti-HBeAg(+). HBeAg(+) casesrepresented 10.7% and 3.6% of Greek and Albanian HBsAg
(+) women respectively, whereas 92.9% of Greek andAlbanian HBsAg(+) women, 90.9% of Eastern Europeancountries HBsAg(+) women and all Asian/African HBsAg(+) women were HBeAg(-)/anti-HBeAg(+). Only 3 of 157women (1.91%) with chronic HBV infection were HBV/HCVcoinfected.
Serum HBV-DNA was quantified in 31 HBsAg(+)/anti-HCV(-) pregnant women of our study populationwith available serum samples at labor. Only one of themwas HBeAg(+) whereas the vast majority of them wereHBeAg(-)/anti-HBeAg(+), as it was the majority of HBsAg(+) cases of the study population. Twenty-two of themwere Albanian (22/31, 70.96%), six of them (6/31, 19.35%)were Greek and the rest three were from an EasternEuropean, an Asian and an African country, respectively.Undetectable levels of serum HBV-DNA (<200 copies/mL)were observed in 10 of 31 (32.26%) pregnant women atlabor and 9 of 31 (29.03%) pregnant women exhibitedextremely low levels of viral replication (lower than400 copies/mL) during this important period. Only two,one HBeAg(-) and one HBeAg(+), of 31 pregnantwomen (6.45%) evaluated for HBV viral load, exhibitedextremely high serum HBV-DNA levels (19 800 000 and85 500 000 copies/mL, respectively) whereas the restof the 10 women evaluated (32.26%) exhibited HBV-DNAlevels between 1 500 and 40 000 copies/mL. SerumHBV-DNA levels in this subgroup of our study populationare presented in Figure 2. As we can see from this figure,the majority (61.29%) of chronic HBV-infected pregnantwomen evaluated for serum HBV-DNA levels at laborby a very sensitive PCR assay, exhibited undetectable(<200 copies/mL) or extremely low (<400 copies/mL) levels.
DISCUSSIONDISCUSSIONDISCUSSIONDISCUSSIONDISCUSSION
Epidemiological data on the prevalence of serologicalmarkers of HBV infection in women at reproductive agein Greece are limited. It is estimated from previous studiesthat in Greece, the HBsAg carrier rate in pregnant womenis 2.8-3.0%[6]. In our study we found that the mean prevalenceof HBsAg in 13 581 women at reproductive age frommultinational origin, was relatively low (1.156%) and thevast majority of HBsAg-positive women (71.3%) came fromAlbania, representing the 5.1% of the Albanian women ofthe study population.
Figure 1 Participation of each national group in HBsAg (+) cases of the studypopulation.
EasternEurope
Africa
Asia
Albania
Greece
7.01%
1.27%
2.55%
71.34%
17.83%
Elefsiniotis IS et al. HBV-infected women at reproductive age in Greece 4881
Although the seroprevalence rate of HBsAg in Albanian(5.1%) and Asian (4.2%) women was significantly higherthan in Greek women (0.29%, P<0.001), which wassignificantly lower than the mean rate of the study population(1.156%, P<0.05), suggesting that there is a significant declinein seroprevalence of HBsAg in the refugees living in Greecein the last decade. In 1995 Malamitsi-Puchner et al.[7],reported that 13.4% of 500 Albanian pregnant womenevaluated in a Greek Maternal Hospital are HBsAg(+)and 7.5% of them are also HBeAg(+), representing anendemic and highly infective group of HBV infection.Significant socio-economic changes, specific precautionsdue to the knowledge of the modes of transmission ofthe infection and HBV vaccination programs may havepossibly led to this decline observed nowadays in thesespecific populations.
Maternal HBeAg-positivity in peri-natal period is of greatimportance for the vertical transmission of HBV infectionresulting in extremely higher rates of mother to infanttransmission compared to infant born from HBeAg(-)mothers[2,3,8]. In our study, the vast majority (>90%) ofHBsAg(+) women were HBeAg(-)/anti-HBeAg(+), resultingpossibly in the low rates of peri-natal transmission of HBVinfection and passive/active immunoprophylaxis failureobserved in our country, a finding that needs furtherinvestigation. Moreover, maternal serum HBV-DNA atlabor was undetectable or extremely low in the majority ofpregnant women of the study population evaluated, by asensitive PCR assay. The predominance of HBeAg(-)/anti-HBeAg(+) serological status in combination with the lowlevels of viremia observed in the majority of chronic HBV-infected women of our study population, suggests that chronicHBV-infected women at reproductive age in Greece representa group of low infectivity, resulting possibly in low verticaltransmission and passive/active immunoprophylaxis failurerates.
Intra-uterine/transplacental transmission of HBVinfection in infants born from HBsAg(+) mothers observedin endemic countries is positively correlated to HBeAg(+)maternal serological status and high levels of maternal serumHBV-DNA. It is believed that transplacental transmissionof HBV infection is a major cause of immunoprophylaxisfailure and this mode of transmission can be effectively
reduced by administration of hepatitis B immune globulin(HBIG) or lamivudine in the third trimester of HBsAg(+)pregnant women[9]. It seems that this problem is not ofclinical significance in our country, because of the relativelylow seroprevalence rates of HBsAg observed in our studypopulation, and the serological and virological data ofchronic HBV-infected women at reproductive age inGreece, as previously noted.
In Greece, both active (HBV vaccine) and passive(HBIG) immunoprophylaxis are the current clinical practicein newborns from HBsAg(+) mothers, irrespective ofmaternal serological (HBeAg(+) or HBeAg(-)) and/orvirological status. Studies from hyper-endemic countries ofHBV infection suggest that there is no clear benefit ofpassive-active vs active immunization alone for chronicHBV infection in infants born from HBsAg(+)/HBeAg(-)mothers[10]. The estimated efficacy of HBV vaccinationalone without HBIG is 84% in infants born from HBeAg(+)mothers and 100% in those born from HBeAg(-) ones,according to a study from endemic Vietnam[11]. The highcost of HBIG and the serological and virological data ofwomen at reproductive age in our study, may suggest thatpassive-active immunoprophylaxis of infants born fromchronic HBV-infected mothers in our country, possiblyrepresents an over-protection strategy, at least in a signif-icant proportion of them, especially from HBeAg(-)/anti-HBeAg(+) mothers with HBV-DNA <400 copies/mLat labor. This possibility needs further investigation inlarge-scale clinical trials. Moreover, more than one third(38.7%) of HBsAg(+)/anti-HBeAg(+) women of our studypopulation exhibited active viral replication at labor andsome of them exhibited extremely high viral load levels,representing possibly an infection with a mutant HBVvariant (precore mutant), a finding that needs furtherinvestigation.
In conclusion, the overall seroprevalence rate of HBsAgis relatively low in women at reproductive age in Greecebut is rather higher in specific populations (Albanian, Asian)who need screening, vaccination, and immunoprophylaxisprograms in order to decline further the rates of peri-natallyacquired HBV infection. The HBeAg(–)/anti-HBeAg(+)serological status and the extremely low or even undetectableviral replicative status in the majority of HBsAg(+) womensuggest that only a small proportion of HBsAg(+) womenin Greece exhibit an extremely high risk for verticaltransmission of the infection.
REFERENCESREFERENCESREFERENCESREFERENCESREFERENCES
1 The World Health Report. WHO 19982 Soderstrom A, Norkrans G, Lindh M. Hepatitis B virus DNA
during pregnancy and post partum: aspects on verticaltransmission. Scand J Infect Dis 2003; 35: 814-819
3 Wang Z, Zhang J, Yang H, Li X, Wen S, Guo Y, Sun J, Hou J.Quantitative analysis of HBV DNA level and HBeAg titer inhepatitis B surface antigen positive mothers and their babies:HBeAg passage through the placenta and the rate of decay inbabies. J Med Virol 2003; 71: 360-366
4 Papaevangelou G. Hepatitis B immunization programme:lessons learnt in Greece. Vaccine 1998; 16 (Suppl): S45-S47
5 Stamouli M, Gizaris V, Totos G, Papaevangelou G. Declineof hepatitis B infection in Greece. European J Epidemiol 1999;15: 447-449
Figure 2 Serum HBV-DNA levels in 31 HBsAg(+)/anti-HCV(-) pregnant womenat labor.
<200 200-400 1 500-40 000 >10 000 000 Copies/mL
70
60
50
40
30
20
10
0
%
(10/31)32.26
(9/31)
29.03(10/31)32.26
(2/31)
6.45

6 Papaevangelou G, Farmaki G, Kada H. Hepatitis B mater-nal-fetal transmission in Southern Europe. Intervirology 1998;41: 197-200
7 Malamitsi-Puchner A, Papacharitonos S, Sotos D, Tzala L,Psichogiou M, Hatzakis A, Evangelopoulou A, Michalas S.Prevalence study of different hepatitis markers among preg-nant Albanian refugees in Greece. Eur J Epidemiol 1996; 12:297-301
8 Stevens CE, Neurath RA, Beasley RP, Szmuness W. HBeAgand anti-HBs detection by radioimmunoassay: correlationwith vertical transmission of hepatitis B virus in Taiwan. JMed Virol 1979; 3: 237-241
9 van Zonneveld M, van Nunen AB, Niesters HG, de Man RA,Schalm SW, Janssen HL. Lamivudine treatment during preg-nancy to prevent perinatal transmission of hepatitis B virusinfection. J Viral Hepat 2003; 10: 294-297
10 Yang YJ, Liu CC, Chen TJ, Lee MF, Chen SH, Shih HH, ChangMH. Role of hepatitis B immunoglobulin in infants born tohepatitis B e antigen-negative carrier mothers in Taiwan. PediatrInfect Dis J 2003; 22: 584-588
11 Milne A, West DJ, Chinh DV, Moyes CD, Poerschke G. Fieldevaluation of the efficacy and immunogenicity of recombi-nant hepatitis B vaccine without HBIG in newborn Vietnam-ese infants. J Med Virol 2002; 67: 327-333
Science Editor Wang XL and Guo SY Language Editor Elsevier HK
4882 ISSN 1007-9327 CN 14-1219/ R World J Gastroenterol August 21, 2005 Volume 11 Number 31
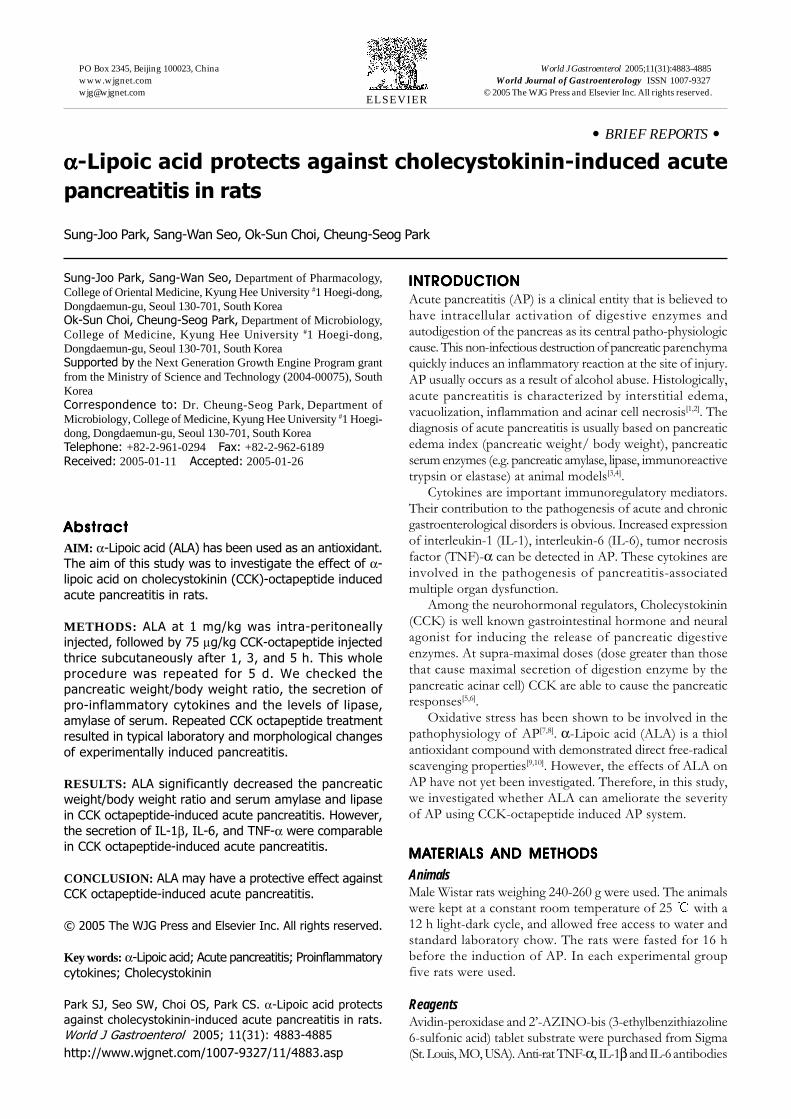
• BRIEF REPORTS •
ααααα-Lipoic acid protects against cholecystokinin-induced acute
pancreatitis in rats
Sung-Joo Park, Sang-Wan Seo, Ok-Sun Choi, Cheung-Seog Park
ELSEVIER
PO Box 2345, Beijing 100023, China World J Gastroenterol 2005;11(31):4883-4885www.wjgnet.com World Journal of Gastroenterology ISSN [email protected] © 2005 The WJG Press and Elsevier Inc. All rights reserved.
Sung-Joo Park, Sang-Wan Seo, Department of Pharmacology,College of Oriental Medicine, Kyung Hee University #1 Hoegi-dong,Dongdaemun-gu, Seoul 130-701, South KoreaOk-Sun Choi, Cheung-Seog Park, Department of Microbiology,College of Medicine, Kyung Hee University #1 Hoegi-dong,Dongdaemun-gu, Seoul 130-701, South KoreaSupported by the Next Generation Growth Engine Program grantfrom the Ministry of Science and Technology (2004-00075), SouthKoreaCorrespondence to: Dr. Cheung-Seog Park, Department ofMicrobiology, College of Medicine, Kyung Hee University #1 Hoegi-dong, Dongdaemun-gu, Seoul 130-701, South KoreaTelephone: +82-2-961-0294 Fax: +82-2-962-6189Received: 2005-01-11 Accepted: 2005-01-26
AbstractAbstractAbstractAbstractAbstract
AIM: α-Lipoic acid (ALA) has been used as an antioxidant.
The aim of this study was to investigate the effect of α-
lipoic acid on cholecystokinin (CCK)-octapeptide induced
acute pancreatitis in rats.
METHODS: ALA at 1 mg/kg was intra-peritoneally
injected, followed by 75 µg/kg CCK-octapeptide injected
thrice subcutaneously after 1, 3, and 5 h. This whole
procedure was repeated for 5 d. We checked the
pancreatic weight/body weight ratio, the secretion of
pro-inflammatory cytokines and the levels of lipase,
amylase of serum. Repeated CCK octapeptide treatment
resulted in typical laboratory and morphological changes
of experimentally induced pancreatitis.
RESULTS: ALA significantly decreased the pancreatic
weight/body weight ratio and serum amylase and lipase
in CCK octapeptide-induced acute pancreatitis. However,
the secretion of IL-1β, IL-6, and TNF-α were comparable
in CCK octapeptide-induced acute pancreatitis.
CONCLUSION: ALA may have a protective effect against
CCK octapeptide-induced acute pancreatitis.
© 2005 The WJG Press and Elsevier Inc. All rights reserved.
Key words: α-Lipoic acid; Acute pancreatitis; Proinflammatory
cytokines; Cholecystokinin
Park SJ, Seo SW, Choi OS, Park CS. α-Lipoic acid protects
against cholecystokinin-induced acute pancreatitis in rats.
World J Gastroenterol 2005; 11(31): 4883-4885
http://www.wjgnet.com/1007-9327/11/4883.asp
INTRODUCTIONINTRODUCTIONINTRODUCTIONINTRODUCTIONINTRODUCTION
Acute pancreatitis (AP) is a clinical entity that is believed tohave intracellular activation of digestive enzymes andautodigestion of the pancreas as its central patho-physiologiccause. This non-infectious destruction of pancreatic parenchymaquickly induces an inflammatory reaction at the site of injury.AP usually occurs as a result of alcohol abuse. Histologically,acute pancreatitis is characterized by interstitial edema,vacuolization, inflammation and acinar cell necrosis[1,2]. Thediagnosis of acute pancreatitis is usually based on pancreaticedema index (pancreatic weight/ body weight), pancreaticserum enzymes (e.g. pancreatic amylase, lipase, immunoreactivetrypsin or elastase) at animal models[3,4].
Cytokines are important immunoregulatory mediators.Their contribution to the pathogenesis of acute and chronicgastroenterological disorders is obvious. Increased expressionof interleukin-1 (IL-1), interleukin-6 (IL-6), tumor necrosisfactor (TNF)-α can be detected in AP. These cytokines areinvolved in the pathogenesis of pancreatitis-associatedmultiple organ dysfunction.
Among the neurohormonal regulators, Cholecystokinin(CCK) is well known gastrointestinal hormone and neuralagonist for inducing the release of pancreatic digestiveenzymes. At supra-maximal doses (dose greater than thosethat cause maximal secretion of digestion enzyme by thepancreatic acinar cell) CCK are able to cause the pancreaticresponses[5,6].
Oxidative stress has been shown to be involved in thepathophysiology of AP[7,8]. α-Lipoic acid (ALA) is a thiolantioxidant compound with demonstrated direct free-radicalscavenging properties[9,10]. However, the effects of ALA onAP have not yet been investigated. Therefore, in this study,we investigated whether ALA can ameliorate the severityof AP using CCK-octapeptide induced AP system.
MAMAMAMAMATERIALS AND METHODSTERIALS AND METHODSTERIALS AND METHODSTERIALS AND METHODSTERIALS AND METHODS
AnimalsMale Wistar rats weighing 240-260 g were used. The animalswere kept at a constant room temperature of 25 with a12 h light-dark cycle, and allowed free access to water andstandard laboratory chow. The rats were fasted for 16 hbefore the induction of AP. In each experimental groupfive rats were used.
ReagentsAvidin-peroxidase and 2’-AZINO-bis (3-ethylbenzithiazoline6-sulfonic acid) tablet substrate were purchased from Sigma(St. Louis, MO, USA). Anti-rat TNF-α, IL-1β and IL-6 antibodies
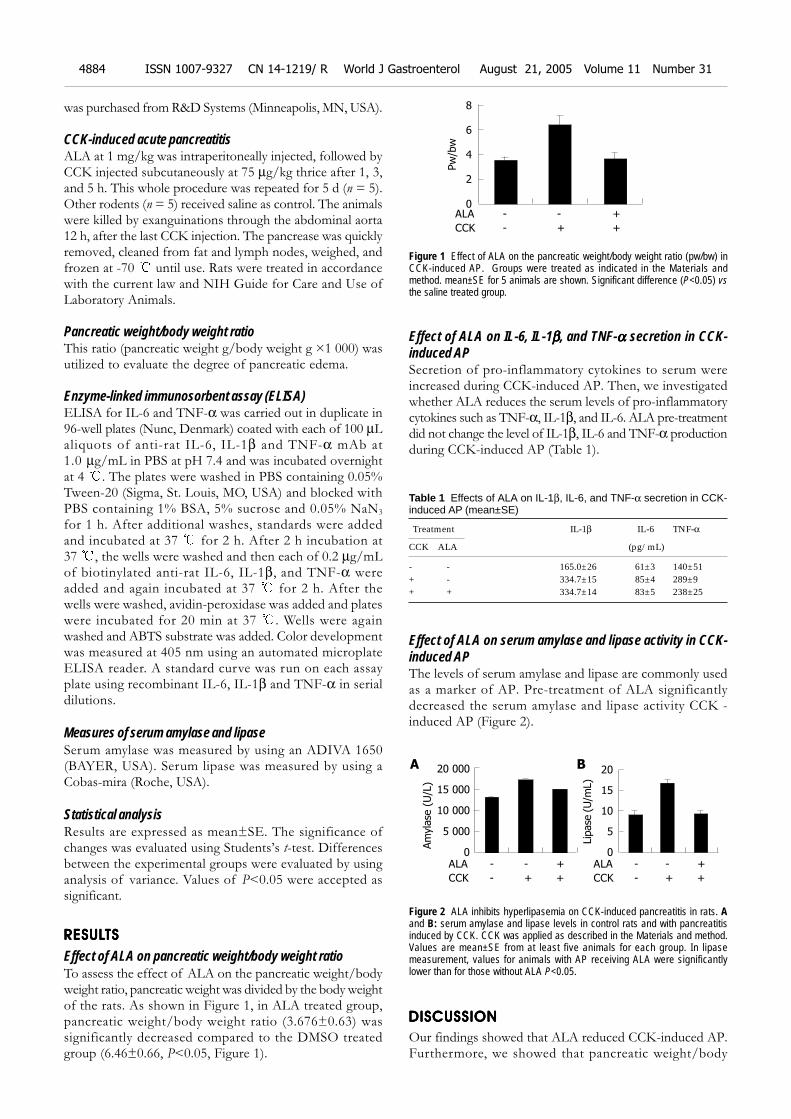
4884 ISSN 1007-9327 CN 14-1219/ R World J Gastroenterol August 21, 2005 Volume 11 Number 31
was purchased from R&D Systems (Minneapolis, MN, USA).
CCK-induced acute pancreatitisALA at 1 mg/kg was intraperitoneally injected, followed byCCK injected subcutaneously at 75 µg/kg thrice after 1, 3,and 5 h. This whole procedure was repeated for 5 d (n = 5).Other rodents (n = 5) received saline as control. The animalswere killed by exanguinations through the abdominal aorta12 h, after the last CCK injection. The pancrease was quicklyremoved, cleaned from fat and lymph nodes, weighed, andfrozen at -70 until use. Rats were treated in accordancewith the current law and NIH Guide for Care and Use ofLaboratory Animals.
Pancreatic weight/body weight ratioThis ratio (pancreatic weight g/body weight g ×1 000) wasutilized to evaluate the degree of pancreatic edema.
Enzyme-linked immunosorbent assay (ELISA)ELISA for IL-6 and TNF-α was carried out in duplicate in96-well plates (Nunc, Denmark) coated with each of 100 µLaliquots of anti-rat IL-6, IL-1β and TNF-α mAb at1.0 µg/mL in PBS at pH 7.4 and was incubated overnightat 4 . The plates were washed in PBS containing 0.05%Tween-20 (Sigma, St. Louis, MO, USA) and blocked withPBS containing 1% BSA, 5% sucrose and 0.05% NaN3
for 1 h. After additional washes, standards were addedand incubated at 37 for 2 h. After 2 h incubation at37 , the wells were washed and then each of 0.2 µg/mLof biotinylated anti-rat IL-6, IL-1β, and TNF-α wereadded and again incubated at 37 for 2 h. After thewells were washed, avidin-peroxidase was added and plateswere incubated for 20 min at 37 . Wells were againwashed and ABTS substrate was added. Color developmentwas measured at 405 nm using an automated microplateELISA reader. A standard curve was run on each assayplate using recombinant IL-6, IL-1β and TNF-α in serialdilutions.
Measures of serum amylase and lipaseSerum amylase was measured by using an ADIVA 1650(BAYER, USA). Serum lipase was measured by using aCobas-mira (Roche, USA).
Statistical analysisResults are expressed as mean±SE. The significance ofchanges was evaluated using Students’s t-test. Differencesbetween the experimental groups were evaluated by usinganalysis of variance. Values of P<0.05 were accepted assignificant.
RESULRESULRESULRESULRESULTSTSTSTSTS
Effect of ALA on pancreatic weight/body weight ratioTo assess the effect of ALA on the pancreatic weight/bodyweight ratio, pancreatic weight was divided by the body weightof the rats. As shown in Figure 1, in ALA treated group,pancreatic weight/body weight ratio (3.676±0.63) wassignificantly decreased compared to the DMSO treatedgroup (6.46±0.66, P<0.05, Figure 1).
Effect of ALA on IL-6, IL-1βββββ, and TNF-ααααα secretion in CCK-induced APSecretion of pro-inflammatory cytokines to serum wereincreased during CCK-induced AP. Then, we investigatedwhether ALA reduces the serum levels of pro-inflammatorycytokines such as TNF-α, IL-1β, and IL-6. ALA pre-treatmentdid not change the level of IL-1β, IL-6 and TNF-α productionduring CCK-induced AP (Table 1).
Table 1 Effects of ALA on IL-1β, IL-6, and TNF-α secretion in CCK-induced AP (mean±SE)
Treatment IL-1β IL-6 TNF-α
CCK ALA (pg/mL)
- - 165.0±26 61±3 140±51+ - 334.7±15 85±4 289±9+ + 334.7±14 83±5 238±25
Effect of ALA on serum amylase and lipase activity in CCK-induced APThe levels of serum amylase and lipase are commonly usedas a marker of AP. Pre-treatment of ALA significantlydecreased the serum amylase and lipase activity CCK -induced AP (Figure 2).
Figure 2 ALA inhibits hyperlipasemia on CCK-induced pancreatitis in rats. Aand B: serum amylase and lipase levels in control rats and with pancreatitisinduced by CCK. CCK was applied as described in the Materials and method.Values are mean±SE from at least five animals for each group. In lipasemeasurement, values for animals with AP receiving ALA were significantlylower than for those without ALA P<0.05.
DISCUSSIONDISCUSSIONDISCUSSIONDISCUSSIONDISCUSSION
Our findings showed that ALA reduced CCK-induced AP.Furthermore, we showed that pancreatic weight/body
Figure 1 Effect of ALA on the pancreatic weight/body weight ratio (pw/bw) inCCK-induced AP. Groups were treated as indicated in the Materials andmethod. mean±SE for 5 animals are shown. Significant difference (P<0.05) vsthe saline treated group.
Pw
/bw
ALA - - +
8
6
4
2
0
CCK - + +
ALA - - +
CCK - + +
Am
yla
se (
U/L
)
20 000
15 000
10 000
5 000
0ALA - - +
CCK - + +
Lip
ase
(U
/mL)
20
15
10
5
0
A B
Park SJ et al. ALA protects against CCK-induced acute pancreatitis 4885
weight ratio and serum amylase and lipase were notcorrelated with the level of cytokines in the rat model. Manyprevious reports have suggested that ROS may play animportant role in the initiation and development ofpancreatitis[11,12]. Anti-oxidant, N-acetyl cysteine (NAC)reduced the severity of AP[13,14]. ALA is also a potent anti-oxidant and has anti-inflammatory effect[9,10]. Therefore, inthis study, we investigated the effects of ALA on CCK-induced AP. ALA decreased pancreatic weight/body weightratio in CCK-induced AP. The levels of amylase and lipaseusually rise after the onset of symptoms of acute pancreatitis.Compared with serum amylase, serum lipase rises slightlylater and remains elevated longer [15]. We found ALAdecreased serum level of amylase, lipase in CCK-inducedAP (Figure 2). Furthermore, we also examined several kindsof cytokines. IL-1β, IL-6, and TNF-α levels are not attenuatedby ALA after CCK treatment (Table 1). Recent study suggestthat COX (Cyclooxygenase)-2 inhibition by selective inhibitor(SC-58125), induced alteration of serum amylase and lipaselevel but not IL-6 and IL-1 production on Caerulein (CAE)induced AP[16]. In the previous report, ALA markedlyinhibited radiation or H2O2-induced COX-2 upregulation[17].On the basis of this report, ALA maybe ameliorates AP viaCOX-2 inhibition. However, it is needed to investigate itsmechanism whether inhibition of COX-2 is involve in theALA-mediated decrease of AP. Despite of previous studieswhich link between IL-6 levels and increased severity ofAP, recent studies suggest that IL-6 may have an anti-inflammatory role during pancreatitis[18]. IL-6 KO miceexhibited a more severe pancreatitis after CAE injectionsthan wild type mice[18]. Our results indicate that pro-infl-ammatory cytokine levels are elevated in mice treated withor without ALA despite attenuated pancreatitis. This findingsuggests that the stimulus for pro-inflammatory cytokinessecretion remains intact; however, it is still unclear whetherpro-inflammatory cytokines are mechanistically linked tothe amelioration of pancreatitis.
In conclusion, this study showed that ALA pr-treatmentameliorated the severity of CCK induced pancreatitis in rats.
REFERENCESREFERENCESREFERENCESREFERENCESREFERENCES1 Baron TH, Morgan DE. Acute necrotizing pancreatitis. N
Engl J Med 1999; 340: 1412-14172 Berger HG, Rau B, Mayer J, Pralle U. Natural course of acute
pancreatitis. World J surg 1997; 21: 130-135
3 Koehler DF, Eckfeldt JH, Levitt MD. Diagnostic value ofroutine isoamylase assay of hyperamylasemic serum. Gastro-enterology 1982; 82(5 Pt 1): 887-890
4 Smotkin J, Tenner S. Laboratory diagnostic tests in acutepancreatitis. J Clin Gastroenterol 2002; 34: 459-462
5 Beglinger C. Potential role of cholecystokinin in the devel-opment of acute pancreatitis. Digestion 1999; 60(Suppl 1):61-63
6 Tachibana I, Shirohara H, Czako L, Akiyama T, Nakano S,Watanabe N, Hirohata Y, Otsuki M. Role of endogenous chole-cystokinin and cholecystokinin-A receptors in the develop-ment of acute pancreatitis in rats. Pancreas 1997; 14: 113-121
7 Rau B, Poch B, Gansauge F, Bauer A, Nussler AK, NevalainenT, Schoenberg MH, Beger HG. Pathophysiologic role of oxy-gen free radicals in acute pancreatitis: initiating event or me-diator of tissue damage? Ann Surg 2000; 231: 352-360
8 Weber CK, Adler G. From acinar cell damage to systemicinflammatory response: current concepts in pancreatitis.Pancreatology 2001; 1: 356-362
9 Park KG, Kim MJ, Kim HS, Lee SJ, Song DK, Lee IK. Preven-tion and treatment of macroangiopathy: focusing on oxida-tive stress. Diabetes Res Clin Pract 2004; 66(Suppl 1): S57-62
10 Atmaca G. Antioxidant effects of sulfur-containing aminoacids. Yonsei Med J 2004; 45: 776-788
11 Sanfey H, Bulkley GB, Cameron JL. The role of oxygen-de-rived free radicals in the pathogenesis of acute pancreatitis.Ann Surg 1984; 200: 405-413
12 Fu K, Sarras MP Jr, De Lisle RC, Andrews GK. Expression ofoxidative stress-responsive genes and cytokine genes duringcaerulein-induced acute pancreatitis. Am J Physiol 1997; 273(3 Pt 1): G696-705
13 Kim H, Seo JY, Roh KH, Lim JW, Kim KH. Suppression ofNF-kappaB activation and cytokine production by N-acetylcysteine in pancreatic acinar cells. Free Radic Biol Med2000; 29: 674-683
14 Sevillano S, de Dios I, de la Mano AM, Manso MA. N-acetylcysteine induces beneficial changes in the acinar cellcycle progression in the course of acute pancreatitis. Cell Prolif2003; 36: 279-289
15 Smotkin J, Tenner S. Laboratory diagnostic tests in acutepancreatitis. J Clin Gastroenterol 2002; 34: 459-462
16 Slogoff MI, Ethridge RT, Rajaraman S, Evers BM. COX-2inhibition results in alterations in nuclear factor (NF)-kappaBactivation but not cytokine production in acute pancreatitis.J Gastrointest Surg 2004; 8: 511-519
17 Li L, Steinauer KK, Dirks AJ, Husbeck B, Gibbs I, Knox SJ.Radiation-induced cyclooxygenase 2 up-regulation is depen-dent on redox status in prostate cancer cells. Radiat Res 2003;160: 617-621
18 Cuzzocrea S, Mazzon E, Dugo L, Centorrino T, Ciccolo A,McDonald MC, de Sarro A, Caputi AP, Thiemermann C.Absence of endogenous interleukin-6 enhances the inflamma-tory response during acute pancreatitis induced by ceruleinin mice. Cytokine 2002; 18: 274-285
Science Editor Wang XL Language Editor Elsevier HK
• BRIEF REPORTS •
There is no association between K469E ICAM-1 gene polymorphism
and biliary atresia
Paisarn Vejchapipat, Naruemol Jirapanakorn, Nutchanart Thawornsuk, Apiradee Theamboonlers, Voranush Chongsrisawat,
Soottiporn Chittmittrapap, Yong Poovorawan
ELSEVIER
PO Box 2345, Beijing 100023, China World J Gastroenterol 2005;11(31):4886-4890www.wjgnet.com World Journal of Gastroenterology ISSN [email protected] © 2005 The WJG Press and Elsevier Inc. All rights reserved.
Paisarn Vejchapipat, Soottiporn Chittmittrapap, PediatricSurgery Unit, Department of Surgery, Faculty of Medicine,Chulalongkorn University, Bangkok 10330, ThailandNaruemol Jirapanakorn, Nutchanart Thawornsuk, ApiradeeTheamboonlers, Voranush Chongsrisawat, Yong Poovorawan,Center of Excellence in Viral Hepatitis Research, Department ofPediatrics, Faculty of Medicine, Chulalongkorn University, Bangkok10330, ThailandSupported by the Thailand Research FundCorrespondence to: Professor Yong Poovorawan, MD, Center ofExcellence in Viral Hepatitis Research, Department of Pediatrics,Chulalongkorn Hospital, Rama IV Road, Patumwan, Bangkok 10330Thailand. [email protected]: +66-2-256-4909 Fax: +66-2-256-4929Received: 2005-01-11 Accepted: 2005-01-26
AbstractAbstractAbstractAbstractAbstract
AIM: To determine whether there was an associationbetween inter-cellular adhesion molecule-1 (ICAM-1) gene
polymorphism and biliary atresia (BA), and to investigate
the relationship between serum soluble ICAM-1 (sICAM-1)and clinical outcome in BA patients after surgical treatment.
METHODS: Eighty-three BA patients and 115 normalcontrols were genotyped. K469E ICAM-1 polymorphism was
analyzed using PCR assay. Serum sICAM-1 was determined
using ELISA method from 72 BA patients. In order to evaluatethe association between these variables and their clinical
outcome, the patients were categorized into two groups:
patients without jaundice and those with persistentjaundice.
RESULTS: There were no significant differences betweenBA patients and controls in terms of gender, K469E ICAM-1
genotypes, and alleles. The proportion of patients having
serum sICAM-1 3 500 ng/mL in persistent jaundice groupwas significantly higher than that in the other group. In
addition, there was no association between K469E ICAM-1
polymorphism and the status of jaundice in BA patientsafter Kasai operation.
CONCLUSION: ICAM-1 possibly plays an important andactive role in the disease progression. However, the
process is not associated with genetic variation of K469E
ICAM-1 polymorphism.
© 2005 The WJG Press and Elsevier Inc. All rights reserved.
Key words: Biliary atresia; Adhesion molecule; ICAM-1
Vejchapipat P, Jirapanakorn N, Thawornsuk N, TheamboonlersA, Chongsrisawat V, Chittmittrapap S, Poovorawan Y. Thereis no association between K469E ICAM-1 gene polymorphismand biliary atresia. World J Gastroenterol 2005; 11(31):4886-4890
http://www.wjgnet.com/1007-9327/11/4886.asp
INTRODUCTIONINTRODUCTIONINTRODUCTIONINTRODUCTIONINTRODUCTION
Biliary atresia (BA), the obliteration of extra- and intra-hepatic biliary system, remains one of the most intractableliver diseases in children. When patients with BA are leftuntreated, the majority of them will die of complicationsof biliary cirrhosis[1,2]. At present, it is accepted that hepaticporto-enterostomy or Kasai operation is the first choice oftreatment. Surgical correction at an early age is therefore thekey to a successful management of infants with BA[3], especiallyin countries where liver transplantation program is not widelyavailable. So far, liver transplantation is preserved for BApatients who have gross cirrhosis at diagnosis or who failedKasai operation[1]. Since BA is a serious liver disease withpoor long-term outcome, extensive research for its exact causein order to understand the disease has been carried out[4].Nevertheless, its etiology is still unclear. A number of hypotheseshave been proposed to explain the origin of the disease includingperi-natal infection[5], immune-mediated disorders[2], and defectof morphogenesis[6]. It has also been suggested by someresearch groups that susceptibility to BA is influenced bygenetic factors via pro-inflammatory cytokines[7-9].
Inter-cellular adhesion molecule-1 (ICAM-1) is atransmembrane glycoprotein involved in cell adhesion andacts as a cell surface ligand for members of the leukocyteintegrin family. The interaction of leukocyte integrins withendothelial ICAM-1 leads to leukocyte adherence,transendothelial migration and cell activation, which arefundamental to the recruitment of leukocytes to the tissueleading to inflammatory process[10]. A soluble form ofICAM-1 (sICAM-1) can release into the circulation duringthe course of an inflammatory reaction[11,12]. Recently, ithas been shown that the elevated serum sICAM-1 isassociated with primary biliary cirrhosis. The levels correlatewith the disease activity and the degree of cholestasis[13].
ICAM-1 gene is located on chromosome 19p13. Thegene encoding ICAM-1 is affected by a common, functionallyimportant, genetic polymorphism[14]. The K469E polymorphismof the ICAM-1 gene has already been described[15,16]. Thispolymorphism occurs in exon 6 of the ICAM-1 gene andresults in a change from lysine to glutamic acid in Ig-like
domain 5. The ICAM-1 gene polymorphism can affect theinteraction between ICAM-1 and its receptor, namelyleukocyte function-associated antigen-1, and influence B-cell activation[17]. ICAM-1 plays a pivotal role in the migrationof leukocytes to inflammatory sites. Therefore, it may beinvolved in various inflammatory diseases.
As far as we are concerned, there is no investigationregarding ICAM-1 gene polymorphism in BA. Sinceprogressive inflammatory process within the liver is animportant feature of BA[18,19], there may be some linksbetween the pathophysiology of BA and ICAM-1 genepolymorphism. Therefore, the study aimed to evaluate theICAM-1 gene polymorphism in BA patients and to investigatewhether there was an association between serum sICAM-1and clinical outcome in BA patients after surgical treatment.
MAMAMAMAMATERIALS AND METHODSTERIALS AND METHODSTERIALS AND METHODSTERIALS AND METHODSTERIALS AND METHODS
This study was approved by the Ethical Committee of theFaculty of Medicine, Chulalongkorn University, Thailand.All parents of the children with BA and healthy controlshad been informed of the purpose of the study. The writteninformed consents were obtained.
Study of ICAM-1 gene polymorphism in biliary atresiaBA patients were recruited into the study during annualfollow-ups between January 2002 and July 2003. All patientswere diagnosed as BA by exploratory laparotomy with intra-operative cholangiography during early infancy period. Thecontrol group, whose ethnicity is similar to the BA patients (Thai),comprised healthy teenagers among, those who participatedin an evaluation of hepatitis B vaccination during the sameperiod. Eighty-three BA patients participated in the study.Six out of eighty-three patients received liver transplantation.The healthy control group comprised 115 teenagers.
ICAM-1 DNA detectionPeripheral whole blood from BA patients and controls wascollected in tubes containing EDTA. Genomic DNA wasextracted from samples according to the manufacturer’sprotocol. Single base polymorphism at codon 469 (K469E)in exon 6 of ICAM-1 was determined using a method basedon polymerase chain reaction-restriction fragment lengthpolymorphism for the detection of K469E ICAM-1 gene,as previously described[14,17]. The ICAM-1 F 5’CCCCGAC-TGGACGAGAGG3’ is a sense primer and ICAM-1 R5’GGGGCTGTGGGGAGGATA3’ is an anti-sense primer.We combined 2 mL of DNA sample with a reaction mixturecontaining 20 mL of 2.5X Eppendorf MasterMix (Hamburg,Germany), 1 mmol/L P1, 1 mmol/L P2, and sterile water,in a final volume of 25 mL. PCR was performed under thefollowing conditions: after an initial 4 min denaturation stepat 95 , 37 cycles of amplification were performed, eachincluding 30 s denaturation at 95 , 30 s annealing at 60 and 30 s extension at 72 , followed by a final 4 min extensionat 72 . Each amplified DNA sample (10 mL) was addedto loading buffer and run on a 2% agarose gel (FMCBioproducts, Rockland, ME, USA) at 100 V for 60 min.The 331-bp product stained with ethidium bromide onpreparation was visualized on a UV transilluminator.
PCR-RFLP analysisPCR products were subjected to RFLP analysis, usingrestriction endonuclease BstU1 (New England Biolabs,Beverly, MA, USA) to determine the ICAM-1 polymorphism.Briefly, 10 mL of PCR product was mixed with 1.5 mLof 10× buffer, 3 mL of sterile water and 0.5 mL (5 U) ofBstUI incubated at 60 for 4 h. After incubation, thesamples were run on a composite gel containing 2%NuSieve agarose (FMC BioProducts, Rockland, ME, USA)and 1% standard agarose. The clusters of PCR productswere visible under UV light, as a result of prior ethidiumbromide staining.
Study of serum sICAM-1 in biliary atresiaSeventy-two serum samples of BA patients were availablefor the study of sICAM-1. All patients underwent hepaticporto-jejunostomy with Roux-en-Y (original Kasai operation)during infancy period. Patients who received liver transp-lantation were excluded from the study to avoid confoundingeffects of different therapeutic modalities. Briefly, peripheralvenous whole blood was drawn with a sterile syringe,transferred to a centrifuge tube, allowed to clot and thencentrifuged at 4 . The sera were stored at -70 until theycould be assayed. Serum sICAM-1 levels were determinedby a commercially available ELISA kit (Quantikine, R&DSystems, USA). This assay employs the quantitative sandwichenzyme immunoassay technique. The serum sICAM-1 levelswere expressed as nanogram per milliliter. In addition, liverfunction tests including serum albumin, total bilirubin (TB),direct bilirubin (DB), alkaline phosphatase (AP), aspartateaminotransferase (AST), alanine aminotransferase (ALT),and γ-glutamyl transpeptidase (GGT) were performed usingan automated chemical analyzer (Hitachi 911) at the centrallaboratory of the hospital.
Out of 72 BA patients, none in this study exhibitedsymptoms and signs of fever or ascending cholangitis at thetime of blood sampling. None received liver transplantation.In order to compare the outcome among the BA patients,they were subsequently divided into two groups accordingto the status of jaundice and levels of TB: patients with nojaundice (TB<2.0 mg%) and patients with persistent jaundice(TB 2.0 mg%). In addition, subgroup analysis betweenBA patients as per the presence of jaundice and ICAM-1gene polymorphism was carried out.
Statistical analysesDemographic data between groups were compared byFisher’s exact and unpaired t-tests. Genotype and allelefrequencies were compared by χ2 test. Significant differenceswere established at P<0.05. Odds ratios were also calculated.For all statistical analyses, either GraphPad Prism version3.02 (GraphPad Software Inc., CA, USA) or SPSS softwareversion 10.0 (SPSS Inc., Chicago, IL, USA) was used. Datawere expressed as mean±SD.
RESULRESULRESULRESULRESULTSTSTSTSTS
Study of ICAM-1 gene polymorphism in biliary atresiaThe distribution of ICAM-1 genotypes and alleles in 83BA patients and 115 controls is shown in Table 1. There
Vejchapipat P et al. Biliary atresia and ICAM-1 gene polymorphism 4887
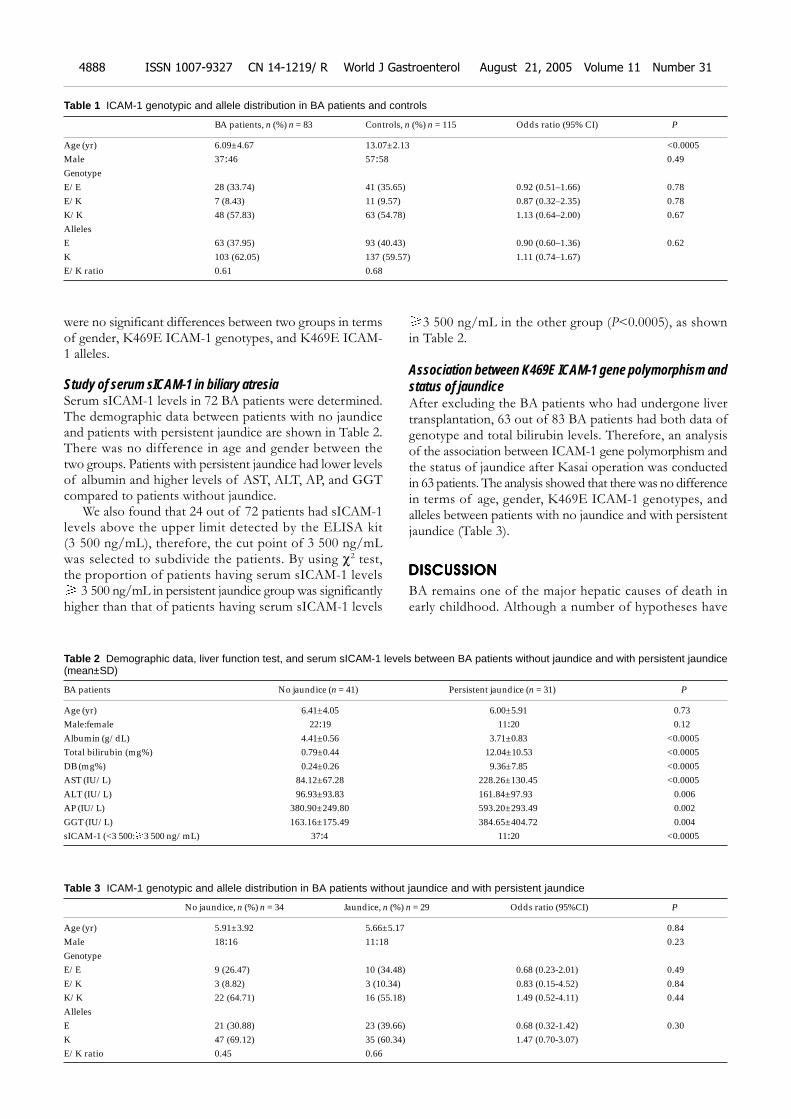
were no significant differences between two groups in termsof gender, K469E ICAM-1 genotypes, and K469E ICAM-1 alleles.
Study of serum sICAM-1 in biliary atresiaSerum sICAM-1 levels in 72 BA patients were determined.The demographic data between patients with no jaundiceand patients with persistent jaundice are shown in Table 2.There was no difference in age and gender between thetwo groups. Patients with persistent jaundice had lower levelsof albumin and higher levels of AST, ALT, AP, and GGTcompared to patients without jaundice.
We also found that 24 out of 72 patients had sICAM-1levels above the upper limit detected by the ELISA kit(3 500 ng/mL), therefore, the cut point of 3 500 ng/mLwas selected to subdivide the patients. By using χ2 test,the proportion of patients having serum sICAM-1 levels
3 500 ng/mL in persistent jaundice group was significantlyhigher than that of patients having serum sICAM-1 levels
3 500 ng/mL in the other group (P<0.0005), as shownin Table 2.
Association between K469E ICAM-1 gene polymorphism andstatus of jaundiceAfter excluding the BA patients who had undergone livertransplantation, 63 out of 83 BA patients had both data ofgenotype and total bilirubin levels. Therefore, an analysisof the association between ICAM-1 gene polymorphism andthe status of jaundice after Kasai operation was conductedin 63 patients. The analysis showed that there was no differencein terms of age, gender, K469E ICAM-1 genotypes, andalleles between patients with no jaundice and with persistentjaundice (Table 3).
DISCUSSIONDISCUSSIONDISCUSSIONDISCUSSIONDISCUSSION
BA remains one of the major hepatic causes of death inearly childhood. Although a number of hypotheses have
Table 1 ICAM-1 genotypic and allele distribution in BA patients and controls
BA patients, n (%) n = 83 Controls, n (%) n = 115 Odds ratio (95% CI) P
Age (yr) 6.09±4.67 13.07±2.13 <0.0005Male 37:46 57:58 0.49GenotypeE/E 28 (33.74) 41 (35.65) 0.92 (0.51–1.66) 0.78E/K 7 (8.43) 11 (9.57) 0.87 (0.32–2.35) 0.78K/K 48 (57.83) 63 (54.78) 1.13 (0.64–2.00) 0.67AllelesE 63 (37.95) 93 (40.43) 0.90 (0.60–1.36) 0.62K 103 (62.05) 137 (59.57) 1.11 (0.74–1.67)E/K ratio 0.61 0.68
Table 2 Demographic data, liver function test, and serum sICAM-1 levels between BA patients without jaundice and with persistent jaundice(mean±SD)
BA patients No jaundice (n = 41) Persistent jaundice (n = 31) P
Age (yr) 6.41±4.05 6.00±5.91 0.73Male:female 22:19 11:20 0.12Albumin (g/dL) 4.41±0.56 3.71±0.83 <0.0005Total bilirubin (mg%) 0.79±0.44 12.04±10.53 <0.0005DB (mg%) 0.24±0.26 9.36±7.85 <0.0005AST (IU/L) 84.12±67.28 228.26±130.45 <0.0005ALT (IU/L) 96.93±93.83 161.84±97.93 0.006AP (IU/L) 380.90±249.80 593.20±293.49 0.002GGT (IU/L) 163.16±175.49 384.65±404.72 0.004sICAM-1 (<3 500: 3 500 ng/mL) 37:4 11:20 <0.0005
Table 3 ICAM-1 genotypic and allele distribution in BA patients without jaundice and with persistent jaundice
No jaundice, n (%) n = 34 Jaundice, n (%) n = 29 Odds ratio (95%CI) P
Age (yr) 5.91±3.92 5.66±5.17 0.84Male 18:16 11:18 0.23GenotypeE/E 9 (26.47) 10 (34.48) 0.68 (0.23-2.01) 0.49E/K 3 (8.82) 3 (10.34) 0.83 (0.15-4.52) 0.84K/K 22 (64.71) 16 (55.18) 1.49 (0.52-4.11) 0.44AllelesE 21 (30.88) 23 (39.66) 0.68 (0.32-1.42) 0.30K 47 (69.12) 35 (60.34) 1.47 (0.70-3.07)E/K ratio 0.45 0.66
4888 ISSN 1007-9327 CN 14-1219/ R World J Gastroenterol August 21, 2005 Volume 11 Number 31
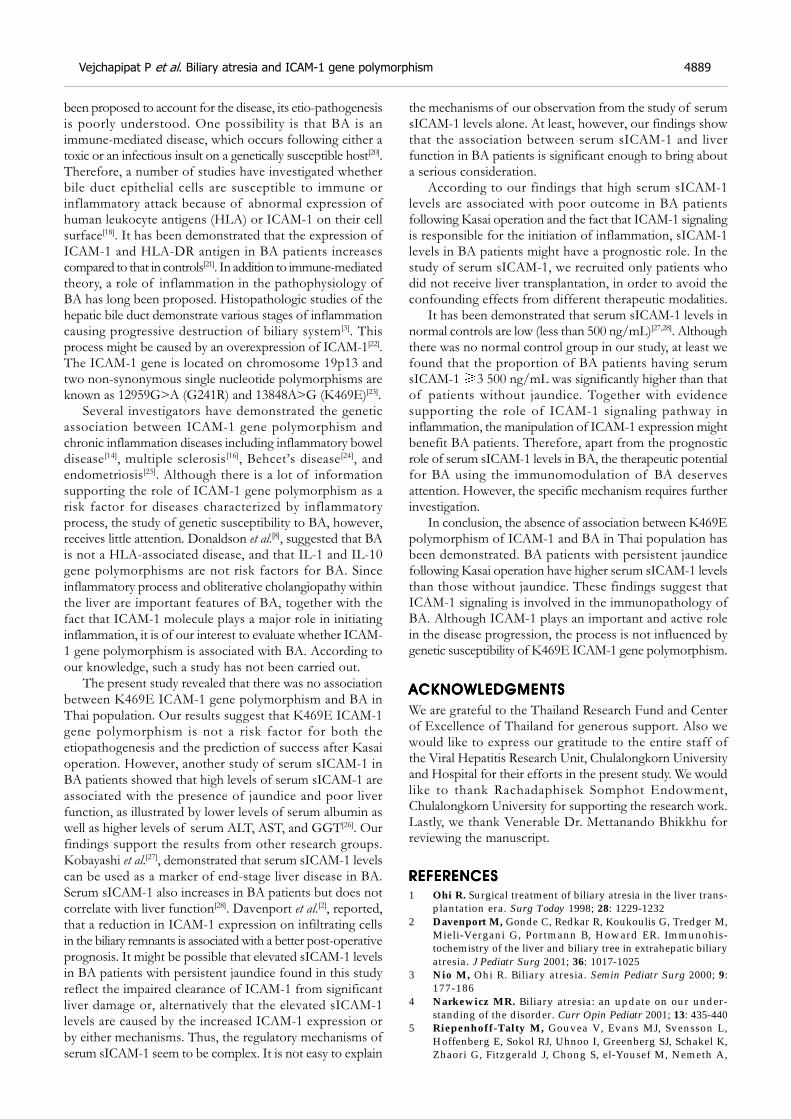
been proposed to account for the disease, its etio-pathogenesisis poorly understood. One possibility is that BA is animmune-mediated disease, which occurs following either atoxic or an infectious insult on a genetically susceptible host[20].Therefore, a number of studies have investigated whetherbile duct epithelial cells are susceptible to immune orinflammatory attack because of abnormal expression ofhuman leukocyte antigens (HLA) or ICAM-1 on their cellsurface[18]. It has been demonstrated that the expression ofICAM-1 and HLA-DR antigen in BA patients increasescompared to that in controls[21]. In addition to immune-mediatedtheory, a role of inflammation in the pathophysiology ofBA has long been proposed. Histopathologic studies of thehepatic bile duct demonstrate various stages of inflammationcausing progressive destruction of biliary system[3]. Thisprocess might be caused by an overexpression of ICAM-1[22].The ICAM-1 gene is located on chromosome 19p13 andtwo non-synonymous single nucleotide polymorphisms areknown as 12959G>A (G241R) and 13848A>G (K469E)[23].
Several investigators have demonstrated the geneticassociation between ICAM-1 gene polymorphism andchronic inflammation diseases including inflammatory boweldisease[14], multiple sclerosis[16], Behcet’s disease[24], andendometriosis[25]. Although there is a lot of informationsupporting the role of ICAM-1 gene polymorphism as arisk factor for diseases characterized by inflammatoryprocess, the study of genetic susceptibility to BA, however,receives little attention. Donaldson et al.[8], suggested that BAis not a HLA-associated disease, and that IL-1 and IL-10gene polymorphisms are not risk factors for BA. Sinceinflammatory process and obliterative cholangiopathy withinthe liver are important features of BA, together with thefact that ICAM-1 molecule plays a major role in initiatinginflammation, it is of our interest to evaluate whether ICAM-1 gene polymorphism is associated with BA. According toour knowledge, such a study has not been carried out.
The present study revealed that there was no associationbetween K469E ICAM-1 gene polymorphism and BA inThai population. Our results suggest that K469E ICAM-1gene polymorphism is not a risk factor for both theetiopathogenesis and the prediction of success after Kasaioperation. However, another study of serum sICAM-1 inBA patients showed that high levels of serum sICAM-1 areassociated with the presence of jaundice and poor liverfunction, as illustrated by lower levels of serum albumin aswell as higher levels of serum ALT, AST, and GGT[26]. Ourfindings support the results from other research groups.Kobayashi et al.[27], demonstrated that serum sICAM-1 levelscan be used as a marker of end-stage liver disease in BA.Serum sICAM-1 also increases in BA patients but does notcorrelate with liver function[28]. Davenport et al.[2], reported,that a reduction in ICAM-1 expression on infiltrating cellsin the biliary remnants is associated with a better post-operativeprognosis. It might be possible that elevated sICAM-1 levelsin BA patients with persistent jaundice found in this studyreflect the impaired clearance of ICAM-1 from significantliver damage or, alternatively that the elevated sICAM-1levels are caused by the increased ICAM-1 expression orby either mechanisms. Thus, the regulatory mechanisms ofserum sICAM-1 seem to be complex. It is not easy to explain
the mechanisms of our observation from the study of serumsICAM-1 levels alone. At least, however, our findings showthat the association between serum sICAM-1 and liverfunction in BA patients is significant enough to bring abouta serious consideration.
According to our findings that high serum sICAM-1levels are associated with poor outcome in BA patientsfollowing Kasai operation and the fact that ICAM-1 signalingis responsible for the initiation of inflammation, sICAM-1levels in BA patients might have a prognostic role. In thestudy of serum sICAM-1, we recruited only patients whodid not receive liver transplantation, in order to avoid theconfounding effects from different therapeutic modalities.
It has been demonstrated that serum sICAM-1 levels innormal controls are low (less than 500 ng/mL)[27,28]. Althoughthere was no normal control group in our study, at least wefound that the proportion of BA patients having serumsICAM-1 3 500 ng/mL was significantly higher than thatof patients without jaundice. Together with evidencesupporting the role of ICAM-1 signaling pathway ininflammation, the manipulation of ICAM-1 expression mightbenefit BA patients. Therefore, apart from the prognosticrole of serum sICAM-1 levels in BA, the therapeutic potentialfor BA using the immunomodulation of BA deservesattention. However, the specific mechanism requires furtherinvestigation.
In conclusion, the absence of association between K469Epolymorphism of ICAM-1 and BA in Thai population hasbeen demonstrated. BA patients with persistent jaundicefollowing Kasai operation have higher serum sICAM-1 levelsthan those without jaundice. These findings suggest thatICAM-1 signaling is involved in the immunopathology ofBA. Although ICAM-1 plays an important and active rolein the disease progression, the process is not influenced bygenetic susceptibility of K469E ICAM-1 gene polymorphism.
ACKNOWLEDGMENTSACKNOWLEDGMENTSACKNOWLEDGMENTSACKNOWLEDGMENTSACKNOWLEDGMENTS
We are grateful to the Thailand Research Fund and Centerof Excellence of Thailand for generous support. Also wewould like to express our gratitude to the entire staff ofthe Viral Hepatitis Research Unit, Chulalongkorn Universityand Hospital for their efforts in the present study. We wouldlike to thank Rachadaphisek Somphot Endowment,Chulalongkorn University for supporting the research work.Lastly, we thank Venerable Dr. Mettanando Bhikkhu forreviewing the manuscript.
REFERENCESREFERENCESREFERENCESREFERENCESREFERENCES
1 Ohi R. Surgical treatment of biliary atresia in the liver trans-plantation era. Surg Today 1998; 28: 1229-1232
2 Davenport M, Gonde C, Redkar R, Koukoulis G, Tredger M,Mieli-Vergani G, Portmann B, Howard ER. Immunohis-tochemistry of the liver and biliary tree in extrahepatic biliaryatresia. J Pediatr Surg 2001; 36: 1017-1025
3 Nio M, Ohi R. Biliary atresia. Semin Pediatr Surg 2000; 9:177-186
4 Narkewicz MR. Biliary atresia: an update on our under-standing of the disorder. Curr Opin Pediatr 2001; 13: 435-440
5 Riepenhoff-Talty M, Gouvea V, Evans MJ, Svensson L,Hoffenberg E, Sokol RJ, Uhnoo I, Greenberg SJ, Schakel K,Zhaori G, Fitzgerald J, Chong S, el-Yousef M, Nemeth A,
Vejchapipat P et al. Biliary atresia and ICAM-1 gene polymorphism 4889
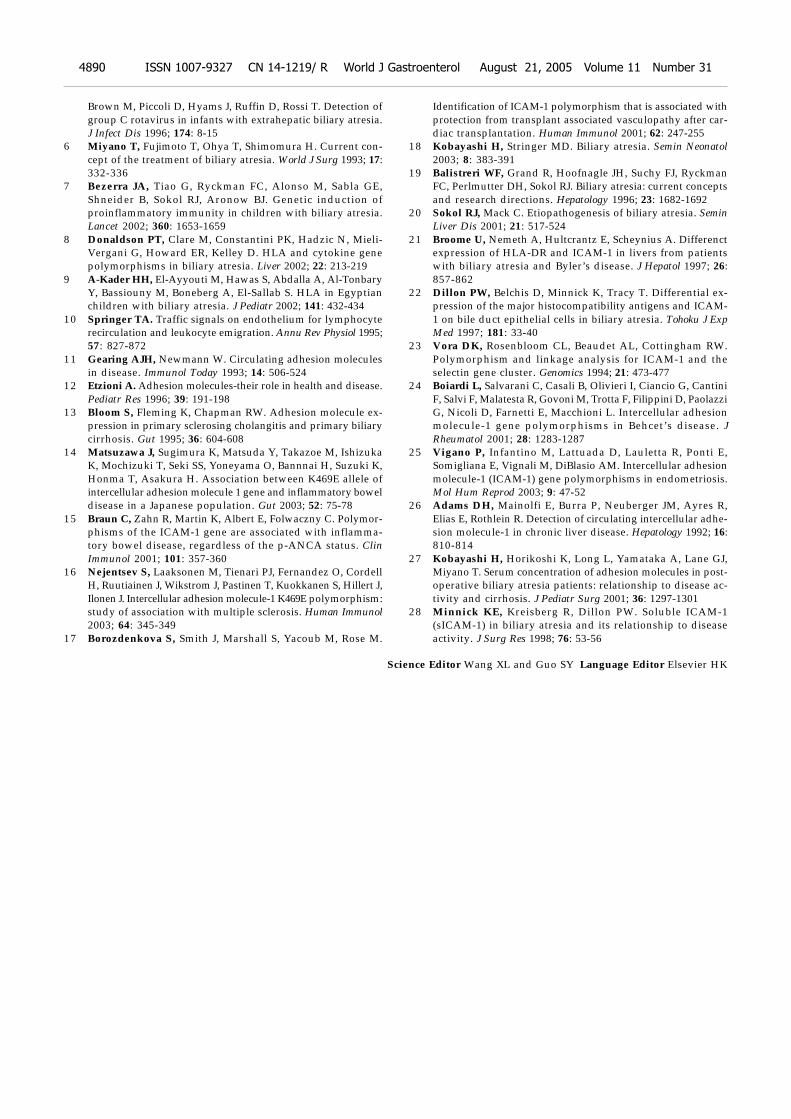
Brown M, Piccoli D, Hyams J, Ruffin D, Rossi T. Detection ofgroup C rotavirus in infants with extrahepatic biliary atresia.J Infect Dis 1996; 174: 8-15
6 Miyano T, Fujimoto T, Ohya T, Shimomura H. Current con-cept of the treatment of biliary atresia. World J Surg 1993; 17:332-336
7 Bezerra JA, Tiao G, Ryckman FC, Alonso M, Sabla GE,Shneider B, Sokol RJ, Aronow BJ. Genetic induction ofproinflammatory immunity in children with biliary atresia.Lancet 2002; 360: 1653-1659
8 Donaldson PT, Clare M, Constantini PK, Hadzic N, Mieli-Vergani G, Howard ER, Kelley D. HLA and cytokine genepolymorphisms in biliary atresia. Liver 2002; 22: 213-219
9 A-Kader HH, El-Ayyouti M, Hawas S, Abdalla A, Al-TonbaryY, Bassiouny M, Boneberg A, El-Sallab S. HLA in Egyptianchildren with biliary atresia. J Pediatr 2002; 141: 432-434
10 Springer TA. Traffic signals on endothelium for lymphocyterecirculation and leukocyte emigration. Annu Rev Physiol 1995;57: 827-872
11 Gearing AJH, Newmann W. Circulating adhesion moleculesin disease. Immunol Today 1993; 14: 506-524
12 Etzioni A. Adhesion molecules-their role in health and disease.Pediatr Res 1996; 39: 191-198
13 Bloom S, Fleming K, Chapman RW. Adhesion molecule ex-pression in primary sclerosing cholangitis and primary biliarycirrhosis. Gut 1995; 36: 604-608
14 Matsuzawa J, Sugimura K, Matsuda Y, Takazoe M, IshizukaK, Mochizuki T, Seki SS, Yoneyama O, Bannnai H, Suzuki K,Honma T, Asakura H. Association between K469E allele ofintercellular adhesion molecule 1 gene and inflammatory boweldisease in a Japanese population. Gut 2003; 52: 75-78
15 Braun C, Zahn R, Martin K, Albert E, Folwaczny C. Polymor-phisms of the ICAM-1 gene are associated with inflamma-tory bowel disease, regardless of the p-ANCA status. ClinImmunol 2001; 101: 357-360
16 Nejentsev S, Laaksonen M, Tienari PJ, Fernandez O, CordellH, Ruutiainen J, Wikstrom J, Pastinen T, Kuokkanen S, Hillert J,Ilonen J. Intercellular adhesion molecule-1 K469E polymorphism:study of association with multiple sclerosis. Human Immunol2003; 64: 345-349
17 Borozdenkova S, Smith J, Marshall S, Yacoub M, Rose M.
Identification of ICAM-1 polymorphism that is associated withprotection from transplant associated vasculopathy after car-diac transplantation. Human Immunol 2001; 62: 247-255
18 Kobayashi H, Stringer MD. Biliary atresia. Semin Neonatol2003; 8: 383-391
19 Balistreri WF, Grand R, Hoofnagle JH, Suchy FJ, RyckmanFC, Perlmutter DH, Sokol RJ. Biliary atresia: current conceptsand research directions. Hepatology 1996; 23: 1682-1692
20 Sokol RJ, Mack C. Etiopathogenesis of biliary atresia. SeminLiver Dis 2001; 21: 517-524
21 Broome U, Nemeth A, Hultcrantz E, Scheynius A. Differenctexpression of HLA-DR and ICAM-1 in livers from patientswith biliary atresia and Byler’s disease. J Hepatol 1997; 26:857-862
22 Dillon PW, Belchis D, Minnick K, Tracy T. Differential ex-pression of the major histocompatibility antigens and ICAM-1 on bile duct epithelial cells in biliary atresia. Tohoku J ExpMed 1997; 181: 33-40
23 Vora DK, Rosenbloom CL, Beaudet AL, Cottingham RW.Polymorphism and linkage analysis for ICAM-1 and theselectin gene cluster. Genomics 1994; 21: 473-477
24 Boiardi L, Salvarani C, Casali B, Olivieri I, Ciancio G, CantiniF, Salvi F, Malatesta R, Govoni M, Trotta F, Filippini D, PaolazziG, Nicoli D, Farnetti E, Macchioni L. Intercellular adhesionmolecule-1 gene polymorphisms in Behcet’s disease. JRheumatol 2001; 28: 1283-1287
25 Vigano P, Infantino M, Lattuada D, Lauletta R, Ponti E,Somigliana E, Vignali M, DiBlasio AM. Intercellular adhesionmolecule-1 (ICAM-1) gene polymorphisms in endometriosis.Mol Hum Reprod 2003; 9: 47-52
26 Adams DH, Mainolfi E, Burra P, Neuberger JM, Ayres R,Elias E, Rothlein R. Detection of circulating intercellular adhe-sion molecule-1 in chronic liver disease. Hepatology 1992; 16:810-814
27 Kobayashi H, Horikoshi K, Long L, Yamataka A, Lane GJ,Miyano T. Serum concentration of adhesion molecules in post-operative biliary atresia patients: relationship to disease ac-tivity and cirrhosis. J Pediatr Surg 2001; 36: 1297-1301
28 Minnick KE, Kreisberg R, Dillon PW. Soluble ICAM-1(sICAM-1) in biliary atresia and its relationship to diseaseactivity. J Surg Res 1998; 76: 53-56
Science Editor Wang XL and Guo SY Language Editor Elsevier HK
4890 ISSN 1007-9327 CN 14-1219/ R World J Gastroenterol August 21, 2005 Volume 11 Number 31
• BRIEF REPORTS •
Lewis blood genotypes of peptic ulcer and gastric cancer patients
in Taiwan
Chi-Jung Yei, Jan-Gowth Chang, Mu-Chin Shih, Sheng-Fung Lin, Chao-Sung Chang, Fu-Tsong Ko, Kuang-Yang Lin, Ta-Chih Liu
ELSEVIER
PO Box 2345, Beijing 100023, China World J Gastroenterol 2005;11(31):4891-4894www.wjgnet.com World Journal of Gastroenterology ISSN [email protected] © 2005 The WJG Press and Elsevier Inc. All rights reserved.
Chi-Jung Yei, Blood Bank, Kaohsiung Medical University Hospital,Kaohsiung, Taiwan, ChinaJan-Gowth Chang, Mu-Chin Shih, Department of Laboratory Medicine,China Medical University and Hospital, Taichung, Taiwan, ChinaSheng-Fung Lin, Chao-Sung Chang, Ta-Chih Liu, Division ofHematology/Oncology, Department of Internal Medicine, KaohsiungMedical University Hospital, Kaohsiung, Taiwan, ChinaFu-Tsong Ko, Kuang-Yang Lin, Department of Internal Medicine,Taipei Municipal Jen-Ai Hospital, Taipei, Taiwan, ChinaCorrespondence to: Ta-Chih Liu, MD, Division of Hematology/Oncology, Department of Internal Medicine, Kaohsiung MedicalUniversity Hospital, 100 Shih-Chuan 1st Road, Kaohsiung, Taiwan,China. [email protected]: +886-7-3121101-6113 Fax: +886-7-3162429Received: 2005-01-04 Accepted: 2005-01-26
AbstractAbstractAbstractAbstractAbstract
AIM: The Lewis b (Leb) antigen has been implicated as apossible binding site for attachment of Helicobacter pylori
(H pylori) to gastric mucosa. However, studies bothsupporting and denying this association have beenreported in the literature. Differences in secretor (Se)genotype have been suggested as a possible reason forprevious discrepancies. Therefore, we investigated therelationship between Le and Se genotypes and H pylori
infection rates in people with peptic ulcer or gastric cancer.
METHODS: Peripheral blood samples were obtained from347 patients with endoscopic evidence of peptic ulcerdisease (235 cases of duodenal ulcer, 62 of gastric ulcer,and 50 of combined duodenal ulcer/ gastric ulcer) and 51patients with gastric cancer on endoscopy. Peripheral bloodspecimens from 101 unrelated normal volunteers wereused as controls. Lewis phenotype was determined usingan antibody method, whereas Le and Se genotypes weredetermined by DNA amplification and restriction enzymeanalysis. Gastric or duodenal biopsies taken from patientswith endoscopic evidence of peptic ulcer or gastric cancerwere cultured for H pylori. Isolates were identified as H pylori
by morphology and production of urease and catalase. TheH pylori infection status was also evaluated by rapid ureasetest (CLO test), and urea breath test (13C-UBT). Resultsof studies were analyzed by chi-square test (taken assignificant).
RESULTS: H pylori was isolated from 83.7% (303/347)of patients with peptic ulcer disease. Statistical analysisdid not show any significant difference in Lewis phenotypeor genotype between patients with and without H pylori
infection. No significant association was found betweenLewis genotype and peptic ulcer or gastric cancer.
CONCLUSION: Lewis blood genotype or phenotype maynot play a role in the pathogenesis of H pylori infection.However, bacterial strain differences and the presenceof more than one attachment mechanism may limit thevalue of epidemiological studies in elucidating this matter.
© 2005 The WJG Press and Elsevier Inc. All rights reserved.
Key words: Lewis histoblood group; Helicobacter pylori;Peptic ulcer; Gastric cancer
Yei CJ, Chang JG, Shih MC, Lin SF, Chang CS, Ko FT, Lin KY,Liu TC. Lewis blood genotypes of peptic ulcer and gastriccancer patients in Taiwan. World J Gastroenterol 2005; 11(31): 4891-4894
http://www.wjgnet.com/1007-9327/11/4891.asp
INTRODUCTIONINTRODUCTIONINTRODUCTIONINTRODUCTIONINTRODUCTION
The Lewis blood group determinants are structurally related tothe antigens of the ABO and H/h blood group systems. Theyare made by sequential addition of specific monosaccharidesonto terminal saccharide precursor chains on glycolipids orglycoproteins. The glycolipids on which they reside on theerythrocyte surface are not synthesized in erythroid tissues,but are acquired by erythrocyte membranes from othertissues through circulating soluble forms that are bound tolipoproteins[1].
The synthesis of the epitopes is dependent on theinteraction of two different fucosyltransferases: alpha(1,2)fucosyltransferase encoded by the FUT2 or secretor (Se)locus of the H/h blood group system, and alpha(1,3;1,4)fucosyltransferase (FUT3) encoded by the FUT3 locus.Fucosylation by FUT3 gives rise to the Lea epitope, whereasthe action of both enzymes results in Leb.
If FUT3 is not expressed, the phenotype is Lea-b- regardlessof whether FUT2 (Se) is expressed or not. If FUT3 andFUT2 are both expressed, the phenotype is Lea-b+. If FUT3,
but not FUT2 is expressed, the phenotype is Lea+b-. A Lea+b+
phenotype may occur, if there is reduced expression ofFUT2.
The Leb glycan has been reported to mediate the attachmentof Helicobacter pylori (H pylori) to human gastric mucosa[2,3].However, the clinical significance of this reported associationremains a topic of debate. It has also been reported that peoplewho do not secrete soluble Lewis b antigen are more susceptibleto H pylori infection than people with secretor phenotypes[4].
This study aimed to explore the association among Lewisantigen phenotypes and genotypes, infection with H pylori,
4892 ISSN 1007-9327 CN 14-1219/ R World J Gastroenterol August 21, 2005 Volume 11 Number 31
and consequent development of peptic ulcer or gastriccancer.
MAMAMAMAMATERIALS AND METHODSTERIALS AND METHODSTERIALS AND METHODSTERIALS AND METHODSTERIALS AND METHODS
Peripheral blood samples were collected as previouslydescribed[4] from 347 patients with endoscopic evidence ofpeptic ulcer disease (235 cases of duodenal ulcer, 62 casesof gastric ulcer, 50 cases of duodenal ulcer and gastriculcer) and 51 patients diagnosed with gastric cancer onendoscopy. Peripheral blood specimens from 101 unrelatedhealthy volunteers were used as normal controls. Subjectswere enrolled from the Division of Gastroenterology,Department of Internal Medicine, Taipei Municipal Jen-AiHospital from August 1998 to December 2002.
The erythrocyte Lewis phenotype was determined by atube method using monoclonal antibody (Gamma-CloneR,anti-Lea, anti-Leb Gamma Biologicals, Inc. Houston, TX,USA) at Taipei Municipal Jen-Ai Hospital.
Total genomic DNA was isolated from peripheral bloodleukocytes as described previously[5], and Le and Se genotypeswere determined by DNA amplification (polymerase chainreaction, PCR) and restriction enzyme analysis[6,7]. Oligon-ucleotide primer design and restriction enzyme analysis werecarried out as previously described[5]. The primer sequencesand restriction enzymes used in this study are shown inTable 1. The amplified products were digested with appropriaterestriction enzymes, followed by electrophoresis on 1.5-4%agarose gels. Direct sequencing of the PCR products inselected cases provided a check on the validity of the procedure.
Gastric or duodenal biopsies were taken from all patientswith endoscopic evidence of peptic ulcer or gastric cancerand cultured for H pylori. Bacterial isolates were identifiedas H pylori by morphology and production of urease and
catalase[8]. The H pylori infection status was also evaluatedby rapid urease test (CLO test), and urea breath test (13C-UBT). H pylori infection was defined as positive results byculture or two positive test results on histology, rapid ureasetest, and 13C-urea breath test[9].
Results were analyzed by the chi-square test, P<0.05was considered statistically significant.
RESULRESULRESULRESULRESULTSTSTSTSTS
H pylori was isolated from 83.7% (303/347) of patientswith peptic ulcer disease. Statistical analysis did not show asignificant difference in Lewis phenotype (Table 2) or Lewisgenotype (Table 3) between peptic ulcer patients withH pylori infection and those without infection. Among the 51gastric cancer patients, H pylori infection prevalence in thedifferent Lewis phenotypes was Lea-b+, 30/33 (90.9%); Lea-b-,7/8 (87.5%); Lea+b-, 3/3 (100%); and Lea+b+, 6/7 (85.7%).
H pylori was detected in 109/124 (87.9%) of pepticulcer patients with Se/Se genotype, 148/174 (85%) of thosewith Se/se genotype, and 53/58 (91.3%) of those with se/segenotype. The difference in proportion of infected patientswas not significant (P = 0.436).
Similarly, no significant difference (P = 0.440) was foundfor presence of H pylori infection in peptic ulcer patientswith Le/Le (86/97, 88.6%), Le/le (182/215, 84.6%) orle/le (31/34, 91.3%) genotypes.
No significant association was found between Lewisgenotype and presence of peptic ulcer disease or gastriccancer (Table 4). Again, an analysis by Se genotype showedno significant difference between patients with peptic ulcerdisease and normal controls (P = 0.915) or between patientswith gastric cancer and normal controls (P = 0.741), whereasanalysis by Le genotype gave similar, non-significant results
Table 1 Primer sequences and restriction enzymes of mutation in Se and Le genes
Mutation Primer sequence Enzyme
Se gene
A385T UP1: GATGGAGGAGGAATACCGCCTC Ear I
DP2: GATCTCCTGGCGGAGGTGGTGGTAGAAGATC
G428A Identical to A358T primer pairs Bgl II
C571T UP: AGGAGATCCTCCAGGAGTTCA Dde I
DP: AGAAGGAGAAAAGGTCTCAAAGG
G849A Identical to C571T primer pairs Dde I
C628T UP: AGTGTGGAAGGGGGTGGTGCCC Bgl I
DP: CCACTCTGGCAGGAAGGC
Fusion gene UP: CTGCCTCCTGACCATGTCC Pst I
DP: identical to reverse primer of C628T
Le genes
T202C and C314T UP: CCACCCTCCTGATCCTGCTC Msp I (T202C)
DP: GATATCCCAGTGGTGCACGATGATGATC Bcl I (C314T)
C445A UP: identical to UP of T202 C and C314 T BstN I
DP: GAGATTGAAGTATCTGTCCAAGGC
G508A UP: TCAACTTGGAGCCACACCCT Alu I
DP: AGTTGGACACCGCCCAGGCCACCAG
A1007C UP: GCTCCTTCCGCTGGGCACTAG Alu I
DP: TGGCCACAAAGGACTCCAGC
T1067A UP: GTACCAGACGGTGCGATGCA Nsi I
DP: identical to DP of A1007 C
1UP: upstream primer; 2DP: downstream primer; The mutated base is underlined.
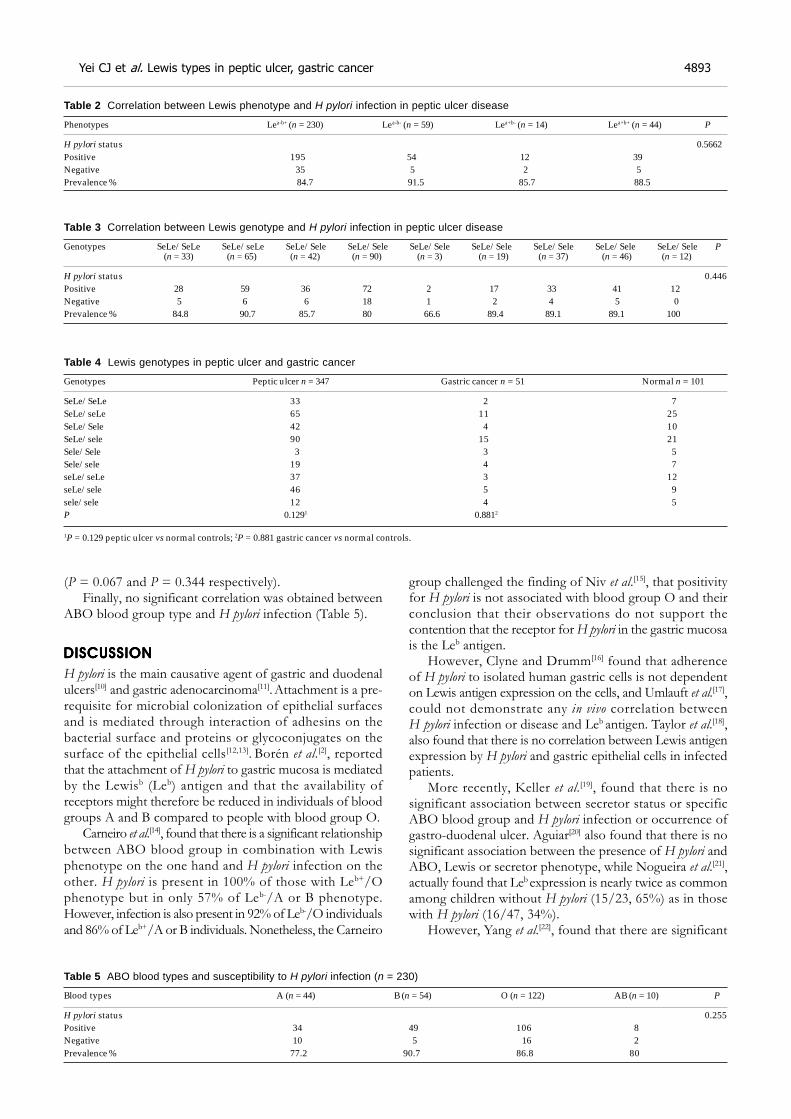
Yei CJ et al. Lewis types in peptic ulcer, gastric cancer 4893
(P = 0.067 and P = 0.344 respectively).Finally, no significant correlation was obtained between
ABO blood group type and H pylori infection (Table 5).
DISCUSSIONDISCUSSIONDISCUSSIONDISCUSSIONDISCUSSION
H pylori is the main causative agent of gastric and duodenalulcers[10] and gastric adenocarcinoma[11]. Attachment is a pre-requisite for microbial colonization of epithelial surfacesand is mediated through interaction of adhesins on thebacterial surface and proteins or glycoconjugates on thesurface of the epithelial cells[12,13]. Borén et al.[2], reportedthat the attachment of H pylori to gastric mucosa is mediatedby the Lewisb (Leb) antigen and that the availability ofreceptors might therefore be reduced in individuals of bloodgroups A and B compared to people with blood group O.
Carneiro et al.[14], found that there is a significant relationshipbetween ABO blood group in combination with Lewisphenotype on the one hand and H pylori infection on theother. H pylori is present in 100% of those with Leb+/Ophenotype but in only 57% of Leb-/A or B phenotype.However, infection is also present in 92% of Leb-/O individualsand 86% of Leb+/A or B individuals. Nonetheless, the Carneiro
group challenged the finding of Niv et al.[15], that positivityfor H pylori is not associated with blood group O and theirconclusion that their observations do not support thecontention that the receptor for H pylori in the gastric mucosais the Leb antigen.
However, Clyne and Drumm[16] found that adherenceof H pylori to isolated human gastric cells is not dependenton Lewis antigen expression on the cells, and Umlauft et al.[17],could not demonstrate any in vivo correlation betweenH pylori infection or disease and Leb antigen. Taylor et al.[18],also found that there is no correlation between Lewis antigenexpression by H pylori and gastric epithelial cells in infectedpatients.
More recently, Keller et al.[19], found that there is nosignificant association between secretor status or specificABO blood group and H pylori infection or occurrence ofgastro-duodenal ulcer. Aguiar[20] also found that there is nosignificant association between the presence of H pylori andABO, Lewis or secretor phenotype, while Nogueira et al.[21],actually found that Leb expression is nearly twice as commonamong children without H pylori (15/23, 65%) as in thosewith H pylori (16/47, 34%).
However, Yang et al.[22], found that there are significant
Table 2 Correlation between Lewis phenotype and H pylori infection in peptic ulcer disease
Phenotypes Lea-b+ (n = 230) Lea-b- (n = 59) Lea+b- (n = 14) Lea+b+ (n = 44) P
H pylori status 0.5662Positive 195 54 12 39Negative 35 5 2 5Prevalence % 84.7 91.5 85.7 88.5
Table 3 Correlation between Lewis genotype and H pylori infection in peptic ulcer disease
Genotypes SeLe/SeLe SeLe/seLe SeLe/Sele SeLe/Sele SeLe/Sele SeLe/Sele SeLe/Sele SeLe/Sele SeLe/Sele P (n = 33) (n = 65) (n = 42) (n = 90) (n = 3) (n = 19) (n = 37) (n = 46) (n = 12)
H pylori status 0.446Positive 28 59 36 72 2 17 33 41 12Negative 5 6 6 18 1 2 4 5 0Prevalence % 84.8 90.7 85.7 80 66.6 89.4 89.1 89.1 100
Table 4 Lewis genotypes in peptic ulcer and gastric cancer
Genotypes Peptic ulcer n = 347 Gastric cancer n = 51 Normal n = 101
SeLe/SeLe 33 2 7SeLe/seLe 65 11 25SeLe/Sele 42 4 10SeLe/sele 90 15 21Sele/Sele 3 3 5Sele/sele 19 4 7seLe/seLe 37 3 12seLe/sele 46 5 9sele/sele 12 4 5P 0.1291 0.8812
1P = 0.129 peptic ulcer vs normal controls; 2P = 0.881 gastric cancer vs normal controls.
Table 5 ABO blood types and susceptibility to H pylori infection (n = 230)
Blood types A (n = 44) B (n = 54) O (n = 122) AB (n = 10) P
H pylori status 0.255Positive 34 49 106 8Negative 10 5 16 2Prevalence % 77.2 90.7 86.8 80
relationships between Lewis phenotype and H pylori infection.Expression of Lea antigen (whether Lea+b- or Lea+b+) isassociated with a higher infection rate but a lower bacterialdensity, a lower severity of chronic inflammation, and alower frequency of lymphoid follicles in the gastric cardia.To complicate things even further, H pylori-infected patientsexpressing the Leb antigen have a lower rate of gastro-duodenalulcers but a higher bacterial density and inflammationseverity in the gastric cardia. It is difficult to know how tointerpret these results.
In vitro studies by Lindén et al.[23], and Van de Bovenkampet al.[24], showed that binding of H pylori to human gastricMUC5AC mucin is blood group antigen-binding adhesindependent and mediated by the Leb structure in the mucin.However, it has also been shown that H pylori bacteria thatdo not express Lewis antigens but do express other complexcarbohydrates that may still have the ability to form long-term colonies in the stomach[25,26].
It may be that differences in reported results are due tostrain differences in H pylori. Hennig et al.[27], found thatthere is considerable heterogeneity among H pylori isolatesin expression of the BabA adhesion, which is thought tobind to Leb antigen present on the surface of gastric epithelialcells. Sheu et al.[28], in a study of 188 dyspeptic patients withH pylori infection in Taiwan, found that all isolates have apositive babA2 genotype and that, among 139 patients withLeb expression, H pylori density increases with Leb intensity.In the 49 patients without gastric Leb expression, H pylori
density is positively correlated with Lex and Lea expression.In conclusion, Lewis blood genotype or phenotype may not
play a role in the pathogenesis of H pylori infection. However,bacterial strain differences and the presence of more thanone attachment mechanism may limit the contribution ofepidemiological studies toward elucidating this matter.
REFERENCESREFERENCESREFERENCESREFERENCESREFERENCES
1 Marcus DM, Cass L. Glycosphingolipids with Lewis blood groupactivity: uptake by human erythrocytes. Science 1969; 164: 553–555
2 Borén T, Falk P, Roth KA, Larson G, Normark S. Attachmentof Helicobacter pylori to human gastric epithelium mediatedby blood group antigens. Science 1993; 262: 1892-1895
3 Ilver D, Arnqvist A, Ogren J, Frick IM, Kersulyte D, IncecikET, Berg DE, Covacci A, Engstrand L, Borén T. Helicobacterpylori adhesion binding fucosylated histo-blood group an-tigens revealed by retagging. Science 1998; 279: 373-377
4 Borén T, Normark S, Falk P. Helicobacter pylori: molecularbasis for host recognition and bacterial adherence. TrendsMicrobiol 1994; 2: 221-228
5 Chang JG, Chiou SS, Perng LI, Chen TC, Liu TC, Lee LS, ChenPH, Tang TK. Molecular characterization of glucose-6-phosphatedehydrogenase (G6PD) deficiency by naturally and amplificationcreated restriction sites: five mutations account for most G6PDdeficiency cases in Taiwan. Blood 1992; 80: 1079-1082
6 Chang JG, Yang TY, Liu TC, Lin TP, Hu CJ, Kao MC, WangNM, Tsai FJ, Peng CT, Tsai CH. Molecular analysis of secre-tor type a (1,2)-fucosyltransferase gene mutations in the Chi-nese and Thai populations. Transfusion 1999; 39: 1013-1017
7 Liu TC, Chang JG, Lin SF, Chang WC, Yang TY, Lin CL,Wang NM. Lewis (FUT3) genotypes in Taiwanese, Thai, andFilipino populations. Ann Hematol 2000; 79: 599-603
8 Hazell SL, Evans DJ, Graham DY. Helicobacter pylori catalase.J Gen Microbiol 1991; 137: 57-61
9 Wang WM, Lee SC, Wu DC, Chen LT, Liu CS, Peng CF, Ding HJ,Chen CY, Jan CM. Simplified 13C-urea breath test for the diagnosisof Helicobacter pylori infection-the availability of without fastingand without test meal. Kaohsiung J Med Sci 2000; 16: 607-613
10 Graham DY. Helicobacter pylori: its epidemiology and its rolein gastroduodenal ulcer disease. J Gastroenterol Hepatol 1991;6: 105-113
11 Eurogast Study Group. An international association betweenHelicobacter pylori infection and gastric cancer. Lancet 1993;341: 1359-1362
12 Ofek I, Sharon N. Adhesins as lectins: specificity and role ininfection. Curr Top Microbiol Immunol 1990; 151: 91-113
13 Karlsson KA. Animal glycosphingolipids as membrane attach-ment sites for bacteria. Annu Rev Biochem 1989; 58: 309-350
14 Carneiro F, Amado M, Lago P, Taveira-Gomes A, Amil M,Barreira R, Soares J, Pinho C. Helicobacter pylori infection andblood groups. Am J Gastroenterol 1996; 91: 2646-2647
15 Niv Y, Fraser G, Delpre G, Neeman A, Leiser A, Samra Z,Scapa E, Gilon E, Bar-Shany S. Helicobacter pylori infectionand blood groups. Am J Gastroenterol 1996; 91: 101-104
16 Clyne M, Drumm B. Absence of effect of Lewis A and LewisB expression on adherence of helicobacter pylori to human gas-tric cells. Gastroenterology 1997; 113: 72-80
17 Umlauft F, Keeffe EB, Offner F, Weiss G, Feichtinger H, LehmannE, Kilga-Nogler S, Schwab G, Propst A, Grünewald K, JudmaierG. Helicobacter pylori infection and blood group antigens: lackof clinical association. Am J Gastroenterol 1996; 91: 2135-2138
18 Taylor DE, Rasko DA, Sherburne R, Ho C, Jewell LD. Lack ofcorrelation between Lewis antigen expression by Helicobacterpylori and gastric epithelial cells in infected patients. Gastro-enterology 1998; 115: 1113-1122
19 Keller R, Dinkel KC, Christl SU, Fischbach W. Interrelationbetween ABH blood group O, Lewis (B) blood group antigen,Helicobacter pylori infection, and occurrence of peptic ulcer. ZGastroenterol 2002; 40: 273-276
20 Aguiar DC, Corvelo TC, Arajo M, Cruz EM, Daibes S,Assumpcao MB. Expression of ABH and Lewis antigens inchronic gastritis and pre-neoplastic alterations in gastricmucosa. Arq Gastroenterol 2002; 39: 222-232
21 Nogueira AM, Marques T, Soares PC, David L, Reis CA, SerpaJ, Queiroz DM, Rocha GA, Rocha AC. Lewis antigen expressionin gastric mucosa in children: relationship with Helicobacter pyloriinfection. J Pediatr Gastroenterol Nutr 2004; 38: 85-91
22 Yang HB, Sheu BS, Chen RC, Wu JJ, Lin XZ. ErythrocyteLewis antigen phenotypes of dyspeptic patients in Taiwan-correlation of host factor with Helicobacter pylori infection. JFormos Med Assoc 2001; 100: 227-232
23 Lindén S, Nordman H, Hedenbro J, Hurtig M, Borén T,Carlstedt I. Strain- and blood group-dependent binding ofHelicobacter pylori to human gastric MUC5AC glycoforms.Gastroenterology 2002; 123: 1923-1930
24 Van de Bovenkamp JH, Mahdavi J, Korteland-Van Male AM,Buller HA, Einerhand AW, Boren T, Dekker J. The MUC5ACglycoprotein is the primary receptor for Helicobacter pylori inthe human stomach. Helicobacter 2003; 8: 521-532
25 Rasko DA, Wilson TJ, Zopf D, Taylor DE. Lewis antigenexpression and stability in Helicobacter pylori isolated fromserial gastric biopsies. J Infect Dis 2000; 181: 1089-1095
26 Altman E, Smironova N, Li H, Aubry A, Logan SM. Occur-rence of a nontypable Helicobacter pylori strain lacking Lewisblood group O antigens and DD-heptoglycan: evidence forthe role of the core alpha-1,6-glucan chain in colonization.Glycobiology 2003; 13: 777-783
27 Hennig EE, Mernaugh R, Edl J, Cao P, Cover TL. Heterogene-ity among Helicobacter pylori strains in expression of the outermembrane protein BabA. Infect Immun 2004; 72: 3429-3435
28 Sheu BS, Sheu SM, Yang HB, Huang AH, Wu JJ. Host gastricLewis expression determines the bacterial density of Helicobacterpylori in babA2 genopositive infection. Gut 2003; 52: 927-932
Science Editor Wang XL and Guo SY Language Editor Elsevier HK
4894 ISSN 1007-9327 CN 14-1219/ R World J Gastroenterol August 21, 2005 Volume 11 Number 31
• BRIEF REPORTS •
Etoposide sensitizes CT26 colorectal adenocarcinoma to radiation
therapy in BALB/c mice
Chia-Yuan Liu, Hui-Fen Liao, Tsang-En Wang, Shee-Chan Lin, Shou-Chuan Shih, Wen-Hsuing Chang, Yuh-Cheng Yang,
Ching-Chung Lin, Yu-Jen Chen
ELSEVIER
PO Box 2345, Beijing 100023, China World J Gastroenterol 2005;11(31):4895-4898www.wjgnet.com World Journal of Gastroenterology ISSN [email protected] © 2005 The WJG Press and Elsevier Inc. All rights reserved.
Chia-Yuan Liu, Tsang-En Wang, Shee-Chan Lin, Shou-ChuanShih, Wen-Hsuing Chang, Ching-Chung Lin, Division ofGastroenterology, Department of Internal Medicine, MackayMemorial Hospital, Taipei, Taiwan, ChinaChia-Yuan Liu, Hui-Fen Liao, Yuh-Cheng Yang, Yu-Jen Chen,Department of Medical Research, Mackay Memorial Hospital,Taipei, Taiwan, ChinaHui-Fen Liao, Department of Molecular Biology and Biochemistry,National Chiayi University, Chiayi, 300 Taiwan, ChinaShou-Chuan Shih, Yuh-Cheng Yang, Mackay Medicine, Nursingand Management College, Taipei, Taiwan, ChinaYu-Jen Chen, Department of Radiation Oncology, Mackay MemorialHospital, Taipei, Taiwan, ChinaSupported by the Grant, No. MMH 9352 from Mackay MemorialHospital, Taipei, Taiwan, ChinaCorrespondence to: Yu-Jen Chen, Department of RadiationOncology, Mackay Memorial Hospital, No. 92, Section 2, Chung SanNorth Road, Taipei 104, Taiwan, China. [email protected]: +886-2-28094661 Fax: +886-2-28096180Received: 2004-12-13 Accepted: 2005-01-26
AbstractAbstractAbstractAbstractAbstract
AIM: To investigate the combined effect of etoposide andradiation on CT26 colorectal adenocarcinoma implantedinto BALB/c mice.
METHODS: We evaluated the radiosensitizing effect ofetoposide on CT26 colorectal adenocarcinoma in asyngeneic animal model. BALB/c mice were subcutaneouslyimplanted with CT26 cells and divided into four groups:control (intra-peritoneal saline×2) group, etoposide (5 mg/kgintra-peritoneally×2) group, radiation therapy (RT 5 Gy×2fractions) group, and combination therapy with etoposide(5 mg/kg intra-peritoneally 1 h before radiation) group.
RESULTS: Tumor growth was significantly inhibited byRT and combination therapy. The effect of combinationtherapy was better than that of RT. No significant changeswere noted in body weight, plasma alanine aminotransferase,or creatinine in any group. The leukocyte count significantlybut transiently decreased in the RT and combinationtherapy groups, but not in the etoposide and controlgroups. There was no skin change or hair loss in the RTand combination therapy groups.
CONCLUSION: Etoposide can sensitize CT26 colorectaladenocarcinoma in BALB/c mice to RT without significanttoxicity.
© 2005 The WJG Press and Elsevier Inc. All rights reserved.
Key words: Etoposide (VP-16); Colorectal adenocarcinoma;CT26; BALB/c mice; Radiosensitization
Liu CY, Liao HF, Wang TE, Lin SC, Shih SC, Chang WH, YangYC, Lin CC, Chen YJ. Etoposide sensitizes CT26 colorectaladenocarcinoma to radiation therapy in BALB/c mice. World
J Gastroenterol 2005; 11(31): 4895-4898
http://www.wjgnet.com/1007-9327/11/4895.asp
INTRODUCTIONINTRODUCTIONINTRODUCTIONINTRODUCTIONINTRODUCTION
Colorectal cancer (CRC) is one of the most commonmalignancies worldwide, accounting for a significantpercentage of cancer mortality. The incidence in bothdeveloping and developed countries has been increasing overthe past few decades. Concurrent chemo-radiation therapy(CCRT) plays an important role in controlling CRC andpalliating symptoms. This is particularly true when aimingfor anal preservation in locally advanced disease, and ittherefore offers an attractive alternative to surgery, thecurrent mainstay of treatment[1].
Radiation therapy (RT), either as a definitive treatmentalong with chemotherapy for unresectable disease or as apost-operative adjuvant for resectable disease, plays animportant role in the management of CRC[2,3]. However,large portions of the colorectum, small intestine, and urinarybladder are inevitably included within the radiation fieldin order to treat the areas of pelvic lymphatic drainage.Therefore, radiation-induced toxicity limits the use of RTin treating this malignancy, either alone or as part of a CCRTprotocol. Moreover, some tumor clones are resistant to RTor chemotherapy. Currently, CCRT using a 5-fluorouracil(5-FU)-based regimen is the mainstay of CRC therapy. 5-FUis known to be a radiosensitizer, but some cancer cell clonesare resistant to it[4,5]. Given these limitations, it is desirableto look for radiosensitizers that augment the efficacy of RT,thus allowing a lower RT dose, and have acceptably low toxicity.
Etoposide (VP-16) is a semi-synthetic derivative of thenaturally occurring antibiotic podophyllotoxin, whichpoisons type II topoisomerase without binding to DNA[6].Etoposide has been widely used in the treatment of lungand ovarian cancer, given either intravenously or orally[7-9].The combination of etoposide and cisplatin given concurrentlywith RT for lung cancer has yielded promising results[10].Etoposide-based CCRT also appears to be effective in newlydiagnosed malignant glioma[11]. Chemotherapy with etoposideas a single agent, however, is not very successful in a phaseII trial for colorectal cancer[12], which may explain why there
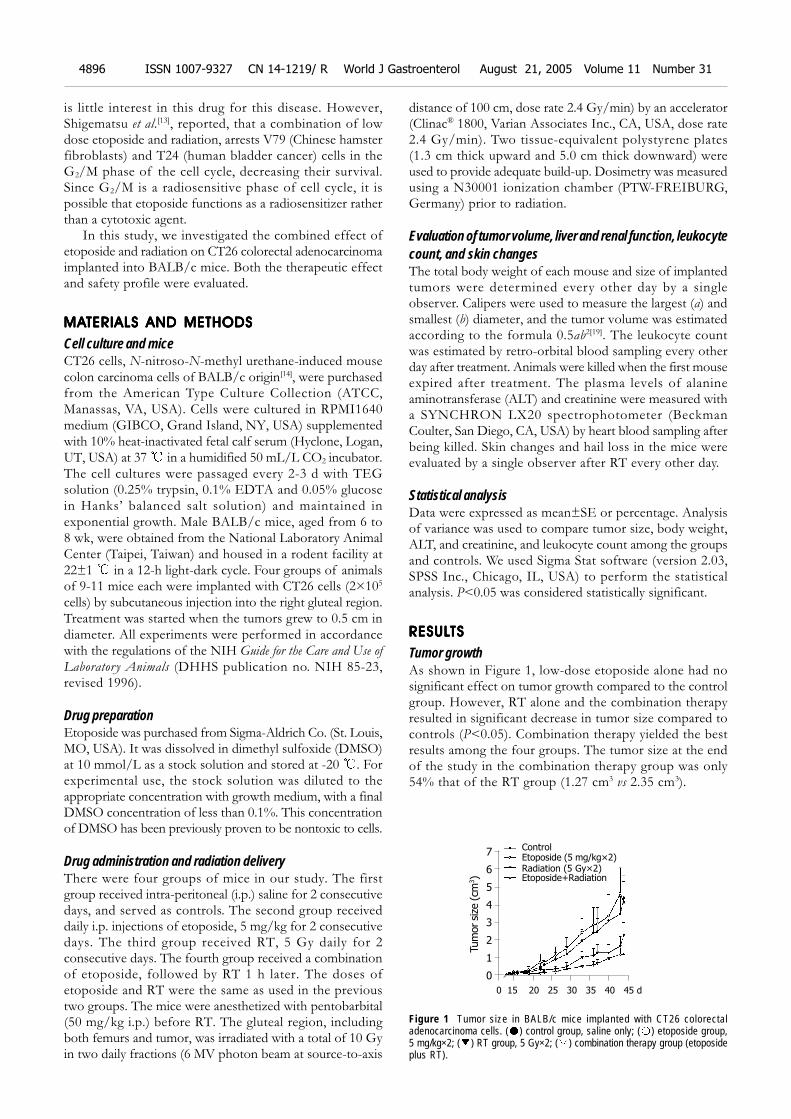
4896 ISSN 1007-9327 CN 14-1219/ R World J Gastroenterol August 21, 2005 Volume 11 Number 31
is little interest in this drug for this disease. However,Shigematsu et al.[13], reported, that a combination of lowdose etoposide and radiation, arrests V79 (Chinese hamsterfibroblasts) and T24 (human bladder cancer) cells in theG2/M phase of the cell cycle, decreasing their survival.Since G2/M is a radiosensitive phase of cell cycle, it ispossible that etoposide functions as a radiosensitizer ratherthan a cytotoxic agent.
In this study, we investigated the combined effect ofetoposide and radiation on CT26 colorectal adenocarcinomaimplanted into BALB/c mice. Both the therapeutic effectand safety profile were evaluated.
MAMAMAMAMATERIALS AND METHODSTERIALS AND METHODSTERIALS AND METHODSTERIALS AND METHODSTERIALS AND METHODS
Cell culture and miceCT26 cells, N-nitroso-N-methyl urethane-induced mousecolon carcinoma cells of BALB/c origin[14], were purchasedfrom the American Type Culture Collection (ATCC,Manassas, VA, USA). Cells were cultured in RPMI1640medium (GIBCO, Grand Island, NY, USA) supplementedwith 10% heat-inactivated fetal calf serum (Hyclone, Logan,UT, USA) at 37 in a humidified 50 mL/L CO2 incubator.The cell cultures were passaged every 2-3 d with TEGsolution (0.25% trypsin, 0.1% EDTA and 0.05% glucosein Hanks’ balanced salt solution) and maintained inexponential growth. Male BALB/c mice, aged from 6 to8 wk, were obtained from the National Laboratory AnimalCenter (Taipei, Taiwan) and housed in a rodent facility at22±1 in a 12-h light-dark cycle. Four groups of animalsof 9-11 mice each were implanted with CT26 cells (2×10⁵
cells) by subcutaneous injection into the right gluteal region.Treatment was started when the tumors grew to 0.5 cm indiameter. All experiments were performed in accordancewith the regulations of the NIH Guide for the Care and Use of
Laboratory Animals (DHHS publication no. NIH 85-23,revised 1996).
Drug preparationEtoposide was purchased from Sigma-Aldrich Co. (St. Louis,MO, USA). It was dissolved in dimethyl sulfoxide (DMSO)at 10 mmol/L as a stock solution and stored at -20 . Forexperimental use, the stock solution was diluted to theappropriate concentration with growth medium, with a finalDMSO concentration of less than 0.1%. This concentrationof DMSO has been previously proven to be nontoxic to cells.
Drug administration and radiation deliveryThere were four groups of mice in our study. The firstgroup received intra-peritoneal (i.p.) saline for 2 consecutivedays, and served as controls. The second group receiveddaily i.p. injections of etoposide, 5 mg/kg for 2 consecutivedays. The third group received RT, 5 Gy daily for 2consecutive days. The fourth group received a combinationof etoposide, followed by RT 1 h later. The doses ofetoposide and RT were the same as used in the previoustwo groups. The mice were anesthetized with pentobarbital(50 mg/kg i.p.) before RT. The gluteal region, includingboth femurs and tumor, was irradiated with a total of 10 Gyin two daily fractions (6 MV photon beam at source-to-axis
distance of 100 cm, dose rate 2.4 Gy/min) by an accelerator(Clinac® 1800, Varian Associates Inc., CA, USA, dose rate2.4 Gy/min). Two tissue-equivalent polystyrene plates(1.3 cm thick upward and 5.0 cm thick downward) wereused to provide adequate build-up. Dosimetry was measuredusing a N30001 ionization chamber (PTW-FREIBURG,Germany) prior to radiation.
Evaluation of tumor volume, liver and renal function, leukocytecount, and skin changesThe total body weight of each mouse and size of implantedtumors were determined every other day by a singleobserver. Calipers were used to measure the largest (a) andsmallest (b) diameter, and the tumor volume was estimatedaccording to the formula 0.5ab2[19]. The leukocyte countwas estimated by retro-orbital blood sampling every otherday after treatment. Animals were killed when the first mouseexpired after treatment. The plasma levels of alanineaminotransferase (ALT) and creatinine were measured witha SYNCHRON LX20 spectrophotometer (BeckmanCoulter, San Diego, CA, USA) by heart blood sampling afterbeing killed. Skin changes and hail loss in the mice wereevaluated by a single observer after RT every other day.
Statistical analysisData were expressed as mean±SE or percentage. Analysisof variance was used to compare tumor size, body weight,ALT, and creatinine, and leukocyte count among the groupsand controls. We used Sigma Stat software (version 2.03,SPSS Inc., Chicago, IL, USA) to perform the statisticalanalysis. P<0.05 was considered statistically significant.
RESULRESULRESULRESULRESULTSTSTSTSTS
Tumor growthAs shown in Figure 1, low-dose etoposide alone had nosignificant effect on tumor growth compared to the controlgroup. However, RT alone and the combination therapyresulted in significant decrease in tumor size compared tocontrols (P<0.05). Combination therapy yielded the bestresults among the four groups. The tumor size at the endof the study in the combination therapy group was only54% that of the RT group (1.27 cm3 vs 2.35 cm3).
Figure 1 Tumor size in BALB/c mice implanted with CT26 colorectaladenocarcinoma cells. ( ) control group, saline only; ( ) etoposide group,5 mg/kg×2; ( ) RT group, 5 Gy×2; ( ) combination therapy group (etoposideplus RT).
Tum
or si
ze (cm
3)
7
6
5
4
3
2
1
0
0 15 20 25 30 35 40 45 d
Control
Etoposide (5 mg/kg×2)
Radiation (5 Gy×2)
Etoposide+Radiation
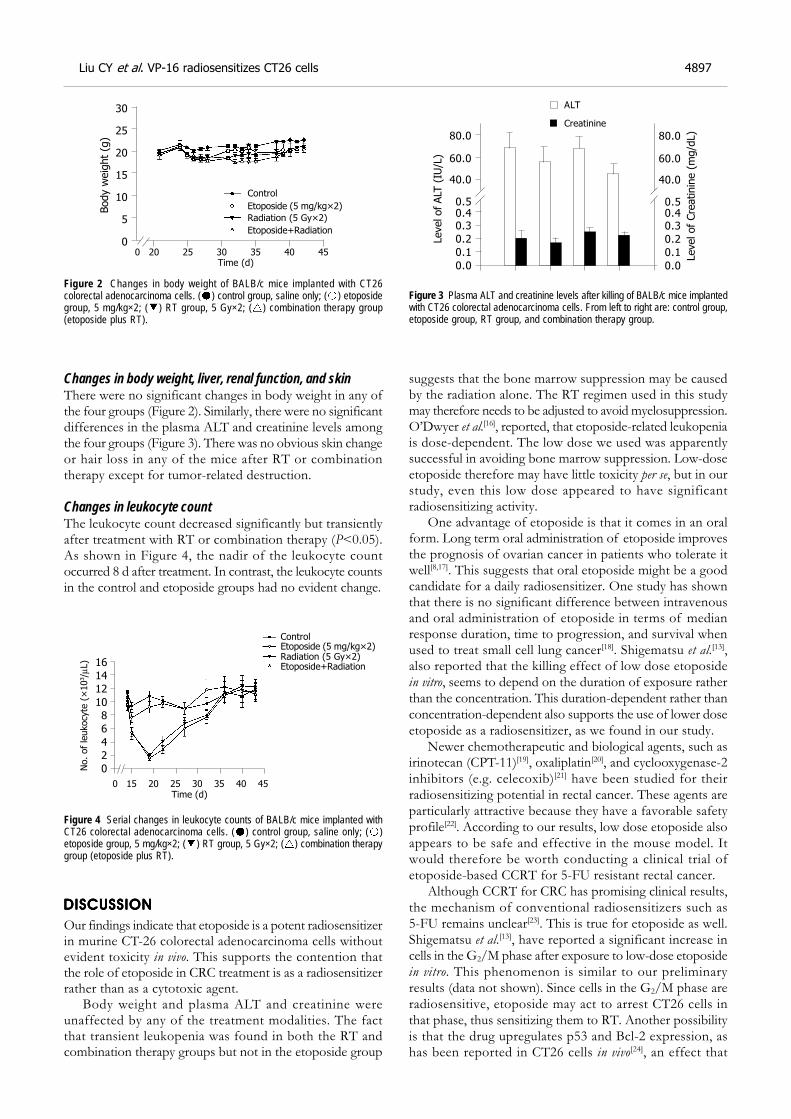
Liu CY et al. VP-16 radiosensitizes CT26 cells 4897
Changes in body weight, liver, renal function, and skinThere were no significant changes in body weight in any ofthe four groups (Figure 2). Similarly, there were no significantdifferences in the plasma ALT and creatinine levels amongthe four groups (Figure 3). There was no obvious skin changeor hair loss in any of the mice after RT or combinationtherapy except for tumor-related destruction.
Changes in leukocyte countThe leukocyte count decreased significantly but transientlyafter treatment with RT or combination therapy (P<0.05).As shown in Figure 4, the nadir of the leukocyte countoccurred 8 d after treatment. In contrast, the leukocyte countsin the control and etoposide groups had no evident change.
DISCUSSIONDISCUSSIONDISCUSSIONDISCUSSIONDISCUSSION
Our findings indicate that etoposide is a potent radiosensitizerin murine CT-26 colorectal adenocarcinoma cells withoutevident toxicity in vivo. This supports the contention thatthe role of etoposide in CRC treatment is as a radiosensitizerrather than as a cytotoxic agent.
Body weight and plasma ALT and creatinine wereunaffected by any of the treatment modalities. The factthat transient leukopenia was found in both the RT andcombination therapy groups but not in the etoposide group
suggests that the bone marrow suppression may be causedby the radiation alone. The RT regimen used in this studymay therefore needs to be adjusted to avoid myelosuppression.O’Dwyer et al.[16], reported, that etoposide-related leukopeniais dose-dependent. The low dose we used was apparentlysuccessful in avoiding bone marrow suppression. Low-doseetoposide therefore may have little toxicity per se, but in ourstudy, even this low dose appeared to have significantradiosensitizing activity.
One advantage of etoposide is that it comes in an oralform. Long term oral administration of etoposide improvesthe prognosis of ovarian cancer in patients who tolerate itwell[8,17]. This suggests that oral etoposide might be a goodcandidate for a daily radiosensitizer. One study has shownthat there is no significant difference between intravenousand oral administration of etoposide in terms of medianresponse duration, time to progression, and survival whenused to treat small cell lung cancer[18]. Shigematsu et al.[13],also reported that the killing effect of low dose etoposidein vitro, seems to depend on the duration of exposure ratherthan the concentration. This duration-dependent rather thanconcentration-dependent also supports the use of lower doseetoposide as a radiosensitizer, as we found in our study.
Newer chemotherapeutic and biological agents, such asirinotecan (CPT-11)[19], oxaliplatin[20], and cyclooxygenase-2inhibitors (e.g. celecoxib)[21] have been studied for theirradiosensitizing potential in rectal cancer. These agents areparticularly attractive because they have a favorable safetyprofile[22]. According to our results, low dose etoposide alsoappears to be safe and effective in the mouse model. Itwould therefore be worth conducting a clinical trial ofetoposide-based CCRT for 5-FU resistant rectal cancer.
Although CCRT for CRC has promising clinical results,the mechanism of conventional radiosensitizers such as5-FU remains unclear[23]. This is true for etoposide as well.Shigematsu et al.[13], have reported a significant increase incells in the G2/M phase after exposure to low-dose etoposidein vitro. This phenomenon is similar to our preliminaryresults (data not shown). Since cells in the G2/M phase areradiosensitive, etoposide may act to arrest CT26 cells inthat phase, thus sensitizing them to RT. Another possibilityis that the drug upregulates p53 and Bcl-2 expression, ashas been reported in CT26 cells in vivo[24], an effect that
0 20 25 30 35 40 45
Time (d)
Control
Etoposide (5 mg/kg×2)
Radiation (5 Gy×2)
Etoposide+Radiation
Body w
eig
ht
(g)
30
25
20
15
10
5
0
Figure 2 Changes in body weight of BALB/c mice implanted with CT26colorectal adenocarcinoma cells. ( ) control group, saline only; ( ) etoposidegroup, 5 mg/kg×2; ( ) RT group, 5 Gy×2; ( ) combination therapy group(etoposide plus RT).
Level of ALT
(IU
/L)
80.0
60.0
40.0
0.50.40.3
0.2
0.1
0.0
ALT
Creatinine
80.0
60.0
40.0
0.50.40.3
0.2
0.1
0.0
Level of
Cre
atinin
e (
mg/d
L)
Figure 3 Plasma ALT and creatinine levels after killing of BALB/c mice implantedwith CT26 colorectal adenocarcinoma cells. From left to right are: control group,etoposide group, RT group, and combination therapy group.
0 15 20 25 30 35 40 45
Time (d)
Control
Etoposide (5 mg/kg×2)
Radiation (5 Gy×2)
Etoposide+Radiation
No. of
leukocyte
(×
103/µ
L) 16
14
12
10
8
6
4
2
0
Figure 4 Serial changes in leukocyte counts of BALB/c mice implanted withCT26 colorectal adenocarcinoma cells. ( ) control group, saline only; ( )etoposide group, 5 mg/kg×2; ( ) RT group, 5 Gy×2; ( ) combination therapygroup (etoposide plus RT).
may induce apoptosis. Apoptosis may play an importantrole in the mechanism of radiosensitization. In the future,we are planning to assess apoptosis in tumors by annexinV/propidium iodide or the TUNEL test.
In conclusion, the results of this study indicate thatlow-dose etoposide can sensitize CT26 cells to RT in vivo
without evident toxicity. Further studies to identify themechanism of etoposide-related radiosensitization areneeded.
ACKNOWLEDGMENTACKNOWLEDGMENTACKNOWLEDGMENTACKNOWLEDGMENTACKNOWLEDGMENT
The authors wish to thank Dr. Mary Jeanne Buttrey forcritical reading and correction of the manuscript.
REFERENCESREFERENCESREFERENCESREFERENCESREFERENCES
1 Midgley R, Kerr D. Colorectal cancer. Lancet 1999; 353:391-399
2 Fisher B, Wolmark N, Rockette H, Redmond C, Deutsch, M,Wickerham DL, Fisher ER, Caplan R, Jones J, Lerner H. Post-operative adjuvant chemotherapy or radiation therapy forrectal cancer: results from NSABP protocol R-01. J Nat CancerInst 1988; 80: 21-29
3 O’Connell MJ, Martenson JA, Wieand HS, Krook JE,Macdonald JS, Haller DG, Mayer RJ, Gunderson LL, Rich TA.Improving adjuvant therapy for rectal cancer by combiningprotracted-infusion fluorouracil with radiation therapy aftercurative surgery. N Engl J Med 1994; 331: 502-507
4 Garufi C, Brienza S, Pugliese P, Aschelter AM, Bensmaine,Bertheault-Cvitkovic F, Nistico C, Giunta S, Caterino M,Giannarelli D, Cosimelli M, Levi F, Terzoli E. Overcomingresistance to chronomodulated 5-fluorouracil and folinic acidby the addition of chronomodulated oxaliplatin in advancedcolorectal cancer patients. Anticancer Drugs 2000; 11: 495-501
5 Hughes LL, Luengas J, Rich TA, Murray D. Radiosensitizationof cultured human colon adenocarcinoma cells by 5-fluorouracil: effects on cell survival, DNA repair, and cellrecovery. Int J Radiat Oncol Biol Phys 1992; 23: 983-991
6 Ross W, Rowe T, Glisson B, Yalowich J, Liu L. Role oftopoisomerase II in mediating epipodophyllotoxin-inducedDNA cleavage. Cancer Res 1984; 44(12 Pt 1): 5857-5860
7 Johnson DH, Greco FA, Strupp J, Hande KR, Hainsworth JD.Prolonged administration of oral etoposide in patients withrelapsed or refractory small-cell lung cancer: a phase II trial.J Clin Oncol 1990; 8: 1613-1617
8 Takeda S, Takada S, Kojima T, Kinoshita K, Sakamoto S.Oral etoposide therapy in stage III-IV ovarian carcinoma.Nippon Gan Chiryo Gakkai Shi 1990; 25: 2562-2566
9 Tucker RD, Ferguson A, Van WC, Sealy R, Hewitson R, LevinW. Chemotherapy of small cell carcinoma of the lung with V.P. 16-213. Cancer 1978; 41: 1710-1714
10 Lee JS, Komaki R, Fossella FV, Glisson BS, Hong WK, CoxJD. A pilot trial of hyperfractionated thoracic radiation therapy
with concurrent cisplatin and oral etoposide for locally ad-vanced inoperable non-small-cell lung cancer: a 5-year fol-low-up report. Int J Radiat Oncol Biol Phys 1998; 42: 479-486
11 Beauchesne P, Soler C, Boniol M, Schmitt T. Response to aphase II study of concomitant-to-sequential use of etoposideand radiation therapy in newly diagnosed malignant gliomas.Am J Clin Oncol 2003; 26: e22-27
12 Perry MC, Moertel CG, Schutt AJ, Reitemeier RJ, Hahn RG.Phase II studies of dianhydrogalactitol and VP-16-213 incolorectal cancer. Cancer Treat Rep 1976; 60: 1247-1250
13 Shigematsu N, Kawata T, Ihara N, Kawaguchi O, KutsukiS, Ishibashi R, Kubo A, Ito H. Effect of combined treatmentwith radiation and low dose etoposide on cell survival. Anti-cancer Res 2001; 21: 325-328
14 Brattain MG, Strobel-Stevens J, Fine D, Webb M, Sarrif AM.Establishment of mouse colonic carcinoma cell lines withdifferent metastatic properties. Cancer Res 1980; 40: 2142-2146
15 Yang EB, Tang WY, Zhang K, Cheng LY, Mack PO. Norcant-haridin inhibits growth of human HepG2 cell-transplantedtumor in nude mice and prolongs host survival. Cancer Lett1997; 117: 93-98
16 O’Dwyer PJ, LaCreta FP, Daugherty JP, Hogan M, RosenblumNG, O’Dwyer JL, Comis RL. Phase I pharmacokinetic studyof intraperitoneal etoposide. Cancer Res 1991; 51: 2041-2046
17 Yasumizu T, Kato J. Clinical trial of daily low-dose oraletoposide for patients with residual or recurrent cancer of theovary or uterus. J Obstet Gynaecol 1995; 21: 569-576
18 Johnson DH, Ruckdeschel JC, Keller JH, Lyman GH, KallasGJ, Macdonald J, DeConti RC, Lee J, Ringenberg QS, PattersonWP. A randomized trial to compare intravenous and oraletoposide in combination with cisplatin for the treatment ofsmall cell lung cancer. Cancer 1991; 67(1 Suppl): 245-249
19 Wang DS, Ueno Y, Oyamada H, Kojima S. Enhancement ofthe antitumor effect of gamma-ray irradiation in combina-tion with camptothecin against human colorectal adenoc-arcinoma. Biol Pharm Bull 1996; 19: 354-359
20 Gerard JP, Chapet O, Nemoz C, Romestaing P, Mornex F,Coquard R, Barbet N, Atlan D, Adeleine P, Freyer G. Preop-erative concurrent chemoradiotherapy in locally advancedrectal cancer with high-dose radiation and oxaliplatin-con-taining regimen: the Lyon R0-04 phase II trial. J Clin Oncol2003; 21: 1119-1124.
21 Kishi K, Petersen S, Petersen C, Hunter N, Mason K, MasferrerJL, Tofilon PJ, Milas L. Preferential enhancement of tumorradioresponse by a cyclooxygenase-2 inhibitor. Cancer Res 2000;60: 1326-1331
22 Zhu AX, Willett CG. Chemotherapeutic and biologic agentsas radiosensitizers in rectal cancer. Semin Radiat Oncol 2003;13: 454-468
23 Lawrence TS, Blackstock AW, McGinn C. The mechanism ofaction of radiosensitization of conventional chemotherapeu-tic agents. Semin Radiat Oncol 2003; 13: 13-21
24 Wang C, Yang YG, Wang XL. Expressions of HTERT, P53, C-ErbB-2 and Bcl-2 in colonic adenocarcinoma mouse modelswith liver metastases: effects of classical traditional chinesemedicine prescriptions for promoting circulation and remov-ing blood stasis. Diyi Junyi Daxue Xuebao 2004; 24: 758-760
Science Editor Wang XL and Guo SY Language Editor Elsevier HK
4898 ISSN 1007-9327 CN 14-1219/ R World J Gastroenterol August 21, 2005 Volume 11 Number 31
• BRIEF REPORTS •
Disulfide-stabilized single-chain antibody-targeted superantigen:
Construction of a prokaryotic expression system and its functional
analysis
Jian-Li Wang, Yu-Ling Zheng, Ru Ma, Bao-Li Wang, Ai-Guang Guo, Yong-Qiang Jiang
ELSEVIER
PO Box 2345, Beijing 100023, China World J Gastroenterol 2005;11(31):4899-4903www.wjgnet.com World Journal of Gastroenterology ISSN [email protected] © 2005 The WJG Press and Elsevier Inc. All rights reserved.
Jian-Li Wang, Bao-Li Wang, Ai-Guang Guo, Department of LifeScience, Northwest Sci-Tech University of Agriculture and Forestry,No. 22 Xi nong Road, Yangling 712100, Shaanxi Province, ChinaYong-Qiang Jiang, Yu-Ling Zheng, Ru Ma, Institute ofMicrobiology and Epidemiology, Academy of Military MedicalSciences, No. 20 Dongda Street, Fengtai District, Beijing 100071,ChinaSupported by the National Natural Science Foundation of China,No. 30271478Correspondence to: Yong-Qiang Jiang, Institute of Microbiologyand Epidemiology, Academy of Military Medical Sciences, No. 20Dongda Street, Fengtai District, Beijing 100071,China. [email protected]: +86-10-6694-8487Received: 2004-12-22 Accepted: 2005-02-18
AbstractAbstractAbstractAbstractAbstract
AIM: To construct the expression vector of B3 (scdsFv)-SEA (D227A) and to identify its binding and cytotoxic abilityto B3 antigen positive carcinoma cell lines.
METHODS: This fusion protein was produced by abacterial expression system in this study. It was expressedmainly in the inclusion body. The gene product was solubilizedby guanidine hydrochloride, refolded by conventionaldilution method, and purified using SP-sepharose cationchromatography.
RESULTS: The expression vector B3 (scdsFv)-SEA-PETwas constructed, the expression product existed mainlyin the inclusion body, the refolding product retained thebinding ability of the single-chain antibody and hadcytotoxic effect on HT-29 colon carcinoma cells. Thestability assay showed that the resulting protein was stableat 37 .
CONCLUSION: This genetically engineered B3 (scdsFv)-SEA fusion protein has bifunction of tumor targeting andtumor cell killing and shows its promises as an effectivereagent for tumor-targeted immunotherapy.
© 2005 The WJG Press and Elsevier Inc. All rights reserved.
Key words: B3 monoclonal antibody; Single-chain disulfide-stabilized Fv; Superantigen
Wang JL, Zheng YL, Ma R, Wang BL, Guo AG, Jiang YQ.Disulfide-stabil ized single-chain antibody-targetedsuperantigen: Construction of a prokaryotic expression
system and its functional analysis. World J Gastroenterol
2005; 11(31): 4899-4903
http://www.wjgnet.com/1007-9327/11/4899.asp
INTRODUCTIONINTRODUCTIONINTRODUCTIONINTRODUCTIONINTRODUCTION
Bacterial superantigen Staphylococcal enterotoxin A (SEA) isan efficient activator of cytotoxic T cells when presentedon MHCII antigens and shows a potential ability in cancerimmunotherapy[1-3]. But SEA also has cytotoxicity againstthe normal cells when used to kill carcinoma cells and hasno effect on MHCII– carcinoma cells. The monoclonalantibody (mAb) preparation technique has brought about anew method for cancer therapy known as tumor-targetingtherapy. Which therapy can solve the two problemsmentioned above? The mAb B3 is a murine antibodydirected against a carbohydrate antigen in the LeY family,that is found on the surface of many mucinous carcinomasof the colon, stomach, ovaries, breast, and lung as well assome epidermal carcinomas. Because mAbB3 reacts with alimited number of normal tissues, it is an ideal candidatefor the treatment and diagnosis of cancer[4]. Immunotoxinsmade from mAb B3 are cytotoxic to various human cancercell lines that express B3 antigen on their surface, and someof them have been evaluated in clinical or preclinical trials[5].
Antibodies penetrate tumors slowly and take several daysto mix completely within a tumor because of their largesize[6]. Fv fragments of antibodies are heterodimers of theheavy chain variable domain (VH) and the light chainvariable domain (VL), and the smallest functional modulesof antibodies required for high affinity antigen binding.The polypeptide chains of whole IgG or Fab fragmentsare joined by a disulfide bond, but Fv fragments have nosuch inter-chain disulfide bridge and are thereforeunstable[7]. Stable Fv fragments can be produced by makingrecombinant molecules in which the VH and VL domainsare connected by a peptide linker (ScFv) or a disulfide bond(DsFv), so that the antigen binding site is regenerated in asingle protein. However, many single-chain Fvs are unstable.When they are fused to toxins, the resulting recombinantimmunotoxins are also unstable, presumably owing toaggregation during the transient separation of VH fromVL by the peptide linker. DsFv is more stable than ScFv,but the low yield after renaturation limits its application[8]. Anew type of engineered antibody, known as scdsFv has alinker and a disulfide bond between VH and VL, and ismore stable than dsFv[8].
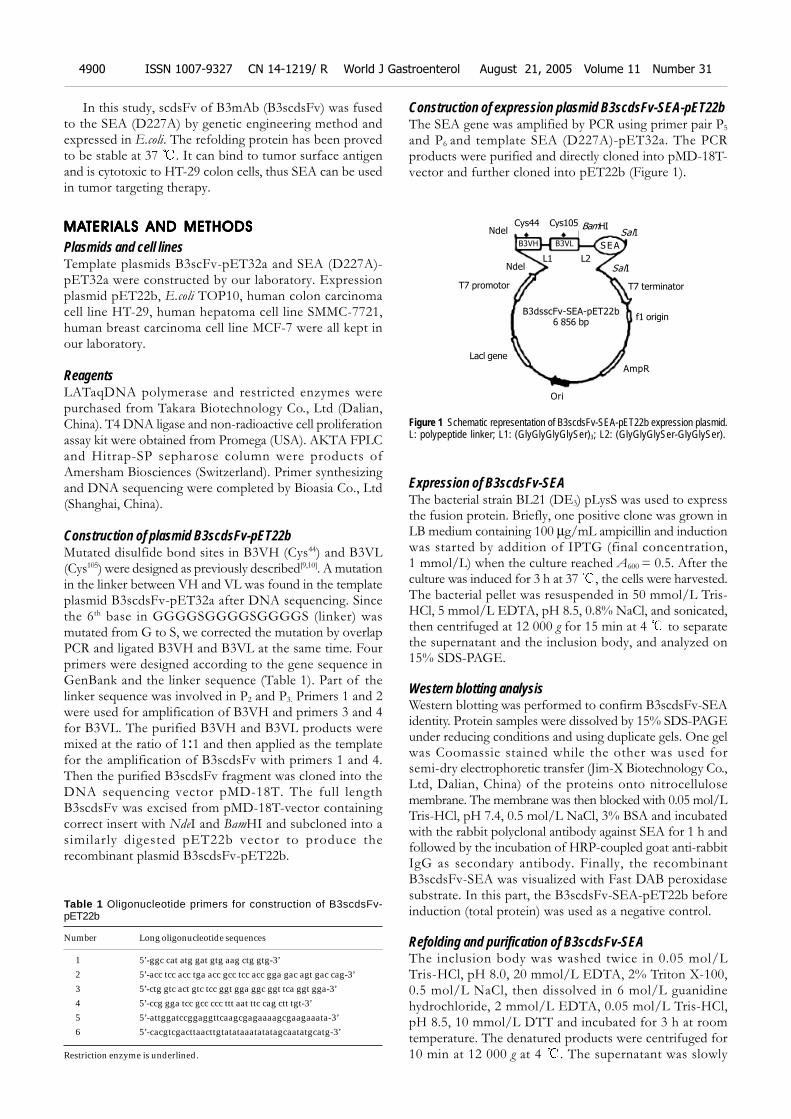
4900 ISSN 1007-9327 CN 14-1219/ R World J Gastroenterol August 21, 2005 Volume 11 Number 31
In this study, scdsFv of B3mAb (B3scdsFv) was fusedto the SEA (D227A) by genetic engineering method andexpressed in E.coli. The refolding protein has been provedto be stable at 37 . It can bind to tumor surface antigenand is cytotoxic to HT-29 colon cells, thus SEA can be usedin tumor targeting therapy.
MAMAMAMAMATERIALS AND METHODSTERIALS AND METHODSTERIALS AND METHODSTERIALS AND METHODSTERIALS AND METHODS
Plasmids and cell linesTemplate plasmids B3scFv-pET32a and SEA (D227A)-pET32a were constructed by our laboratory. Expressionplasmid pET22b, E.coli TOP10, human colon carcinomacell line HT-29, human hepatoma cell line SMMC-7721,human breast carcinoma cell line MCF-7 were all kept inour laboratory.
ReagentsLATaqDNA polymerase and restricted enzymes werepurchased from Takara Biotechnology Co., Ltd (Dalian,China). T4 DNA ligase and non-radioactive cell proliferationassay kit were obtained from Promega (USA). AKTA FPLCand Hitrap-SP sepharose column were products ofAmersham Biosciences (Switzerland). Primer synthesizingand DNA sequencing were completed by Bioasia Co., Ltd(Shanghai, China).
Construction of plasmid B3scdsFv-pET22bMutated disulfide bond sites in B3VH (Cys44) and B3VL(Cys105) were designed as previously described[9,10]. A mutationin the linker between VH and VL was found in the templateplasmid B3scdsFv-pET32a after DNA sequencing. Sincethe 6th base in GGGGSGGGGSGGGGS (linker) wasmutated from G to S, we corrected the mutation by overlapPCR and ligated B3VH and B3VL at the same time. Fourprimers were designed according to the gene sequence inGenBank and the linker sequence (Table 1). Part of thelinker sequence was involved in P2 and P3. Primers 1 and 2were used for amplification of B3VH and primers 3 and 4for B3VL. The purified B3VH and B3VL products weremixed at the ratio of 1:1 and then applied as the templatefor the amplification of B3scdsFv with primers 1 and 4.Then the purified B3scdsFv fragment was cloned into theDNA sequencing vector pMD-18T. The full lengthB3scdsFv was excised from pMD-18T-vector containingcorrect insert with NdeI and BamHI and subcloned into asimilarly digested pET22b vector to produce therecombinant plasmid B3scdsFv-pET22b.
Table 1 Oligonucleotide primers for construction of B3scdsFv-pET22b
Number Long oligonucleotide sequences
1 5’-ggc cat atg gat gtg aag ctg gtg-3’
2 5’-acc tcc acc tga acc gcc tcc acc gga gac agt gac cag-3’
3 5’-ctg gtc act gtc tcc ggt gga ggc ggt tca ggt gga-3’
4 5’-ccg gga tcc gcc ccc ttt aat ttc cag ctt tgt-3’
5 5’-attggatccggaggttcaagcgagaaaagcgaagaaata-3’
6 5’-cacgtcgacttaacttgtatataaatatatagcaatatgcatg-3’
Restriction enzyme is underlined.
Construction of expression plasmid B3scdsFv-SEA-pET22bThe SEA gene was amplified by PCR using primer pair P5
and P6 and template SEA (D227A)-pET32a. The PCRproducts were purified and directly cloned into pMD-18T-vector and further cloned into pET22b (Figure 1).
Figure 1 Schematic representation of B3scdsFv-SEA-pET22b expression plasmid.L: polypeptide linker; L1: (GlyGlyGlyGlySer)3; L2: (GlyGlyGlySer-GlyGlySer).
Expression of B3scdsFv-SEAThe bacterial strain BL21 (DE3) pLysS was used to expressthe fusion protein. Briefly, one positive clone was grown inLB medium containing 100 µg/mL ampicillin and inductionwas started by addition of IPTG (final concentration,1 mmol/L) when the culture reached A600 = 0.5. After theculture was induced for 3 h at 37 , the cells were harvested.The bacterial pellet was resuspended in 50 mmol/L Tris-HCl, 5 mmol/L EDTA, pH 8.5, 0.8% NaCl, and sonicated,then centrifuged at 12 000 g for 15 min at 4 to separatethe supernatant and the inclusion body, and analyzed on15% SDS-PAGE.
Western blotting analysisWestern blotting was performed to confirm B3scdsFv-SEAidentity. Protein samples were dissolved by 15% SDS-PAGEunder reducing conditions and using duplicate gels. One gelwas Coomassie stained while the other was used forsemi-dry electrophoretic transfer (Jim-X Biotechnology Co.,Ltd, Dalian, China) of the proteins onto nitrocellulosemembrane. The membrane was then blocked with 0.05 mol/LTris-HCl, pH 7.4, 0.5 mol/L NaCl, 3% BSA and incubatedwith the rabbit polyclonal antibody against SEA for 1 h andfollowed by the incubation of HRP-coupled goat anti-rabbitIgG as secondary antibody. Finally, the recombinantB3scdsFv-SEA was visualized with Fast DAB peroxidasesubstrate. In this part, the B3scdsFv-SEA-pET22b beforeinduction (total protein) was used as a negative control.
Refolding and purification of B3scdsFv-SEAThe inclusion body was washed twice in 0.05 mol/LTris-HCl, pH 8.0, 20 mmol/L EDTA, 2% Triton X-100,0.5 mol/L NaCl, then dissolved in 6 mol/L guanidinehydrochloride, 2 mmol/L EDTA, 0.05 mol/L Tris-HCl,pH 8.5, 10 mmol/L DTT and incubated for 3 h at roomtemperature. The denatured products were centrifuged for10 min at 12 000 g at 4 . The supernatant was slowly
B3VH B3VL
Cys44 Cys105Ndel
BamHISalI
SEA
L1 L2
B3dsscFv-SEA-pET22b
6 856 bp
T7 promotor
SalINdel
T7 terminator
Lacl gene
f1 origin
AmpR
Ori
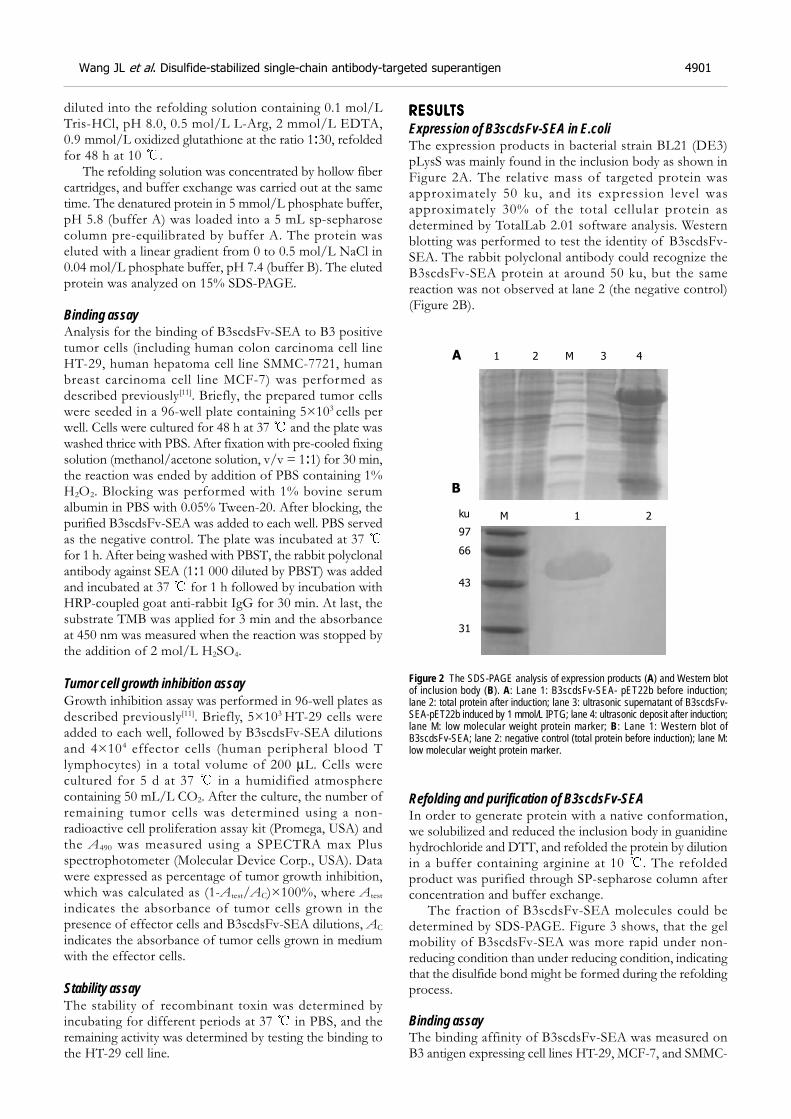
Wang JL et al. Disulfide-stabilized single-chain antibody-targeted superantigen 4901
diluted into the refolding solution containing 0.1 mol/LTris-HCl, pH 8.0, 0.5 mol/L L-Arg, 2 mmol/L EDTA,0.9 mmol/L oxidized glutathione at the ratio 1:30, refoldedfor 48 h at 10 .
The refolding solution was concentrated by hollow fibercartridges, and buffer exchange was carried out at the sametime. The denatured protein in 5 mmol/L phosphate buffer,pH 5.8 (buffer A) was loaded into a 5 mL sp-sepharosecolumn pre-equilibrated by buffer A. The protein waseluted with a linear gradient from 0 to 0.5 mol/L NaCl in0.04 mol/L phosphate buffer, pH 7.4 (buffer B). The elutedprotein was analyzed on 15% SDS-PAGE.
Binding assayAnalysis for the binding of B3scdsFv-SEA to B3 positivetumor cells (including human colon carcinoma cell lineHT-29, human hepatoma cell line SMMC-7721, humanbreast carcinoma cell line MCF-7) was performed asdescribed previously[11]. Briefly, the prepared tumor cellswere seeded in a 96-well plate containing 5×10³ cells perwell. Cells were cultured for 48 h at 37 and the plate waswashed thrice with PBS. After fixation with pre-cooled fixingsolution (methanol/acetone solution, v/v = 1:1) for 30 min,the reaction was ended by addition of PBS containing 1%H2O2. Blocking was performed with 1% bovine serumalbumin in PBS with 0.05% Tween-20. After blocking, thepurified B3scdsFv-SEA was added to each well. PBS servedas the negative control. The plate was incubated at 37 for 1 h. After being washed with PBST, the rabbit polyclonalantibody against SEA (1:1 000 diluted by PBST) was addedand incubated at 37 for 1 h followed by incubation withHRP-coupled goat anti-rabbit IgG for 30 min. At last, thesubstrate TMB was applied for 3 min and the absorbanceat 450 nm was measured when the reaction was stopped bythe addition of 2 mol/L H2SO4.
Tumor cell growth inhibition assayGrowth inhibition assay was performed in 96-well plates asdescribed previously[11]. Briefly, 5×10³ HT-29 cells wereadded to each well, followed by B3scdsFv-SEA dilutionsand 4×10⁴ effector cells (human peripheral blood Tlymphocytes) in a total volume of 200 µL. Cells werecultured for 5 d at 37 in a humidified atmospherecontaining 50 mL/L CO2. After the culture, the number ofremaining tumor cells was determined using a non-radioactive cell proliferation assay kit (Promega, USA) andthe A490 was measured using a SPECTRA max Plusspectrophotometer (Molecular Device Corp., USA). Datawere expressed as percentage of tumor growth inhibition,which was calculated as (1-Atest/AC)×100%, where Atest
indicates the absorbance of tumor cells grown in thepresence of effector cells and B3scdsFv-SEA dilutions, AC
indicates the absorbance of tumor cells grown in mediumwith the effector cells.
Stability assayThe stability of recombinant toxin was determined byincubating for different periods at 37 in PBS, and theremaining activity was determined by testing the binding tothe HT-29 cell line.
RESULRESULRESULRESULRESULTSTSTSTSTS
Expression of B3scdsFv-SEA in E.coliThe expression products in bacterial strain BL21 (DE3)pLysS was mainly found in the inclusion body as shown inFigure 2A. The relative mass of targeted protein wasapproximately 50 ku, and its expression level wasapproximately 30% of the total cellular protein asdetermined by TotalLab 2.01 software analysis. Westernblotting was performed to test the identity of B3scdsFv-SEA. The rabbit polyclonal antibody could recognize theB3scdsFv-SEA protein at around 50 ku, but the samereaction was not observed at lane 2 (the negative control)(Figure 2B).
Figure 2 The SDS-PAGE analysis of expression products (A) and Western blotof inclusion body (B). A: Lane 1: B3scdsFv-SEA- pET22b before induction;lane 2: total protein after induction; lane 3: ultrasonic supernatant of B3scdsFv-SEA-pET22b induced by 1 mmol/L IPTG; lane 4: ultrasonic deposit after induction;lane M: low molecular weight protein marker; B: Lane 1: Western blot ofB3scdsFv-SEA; lane 2: negative control (total protein before induction); lane M:low molecular weight protein marker.
Refolding and purification of B3scdsFv-SEAIn order to generate protein with a native conformation,we solubilized and reduced the inclusion body in guanidinehydrochloride and DTT, and refolded the protein by dilutionin a buffer containing arginine at 10 . The refoldedproduct was purified through SP-sepharose column afterconcentration and buffer exchange.
The fraction of B3scdsFv-SEA molecules could bedetermined by SDS-PAGE. Figure 3 shows, that the gelmobility of B3scdsFv-SEA was more rapid under non-reducing condition than under reducing condition, indicatingthat the disulfide bond might be formed during the refoldingprocess.
Binding assayThe binding affinity of B3scdsFv-SEA was measured onB3 antigen expressing cell lines HT-29, MCF-7, and SMMC-
1 2 M 3 4
M 1 2
97
ku
66
43
31
A
B
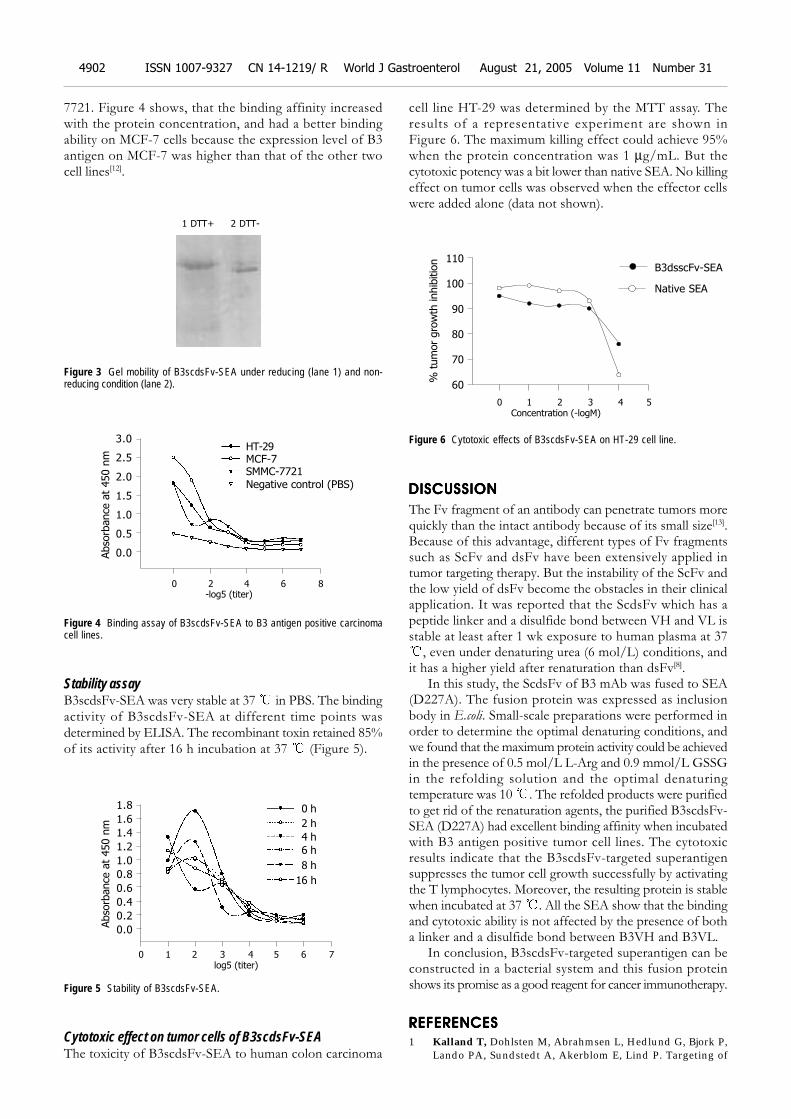
7721. Figure 4 shows, that the binding affinity increasedwith the protein concentration, and had a better bindingability on MCF-7 cells because the expression level of B3antigen on MCF-7 was higher than that of the other twocell lines[12].
Figure 3 Gel mobility of B3scdsFv-SEA under reducing (lane 1) and non-reducing condition (lane 2).
Figure 4 Binding assay of B3scdsFv-SEA to B3 antigen positive carcinomacell lines.
Stability assayB3scdsFv-SEA was very stable at 37 in PBS. The bindingactivity of B3scdsFv-SEA at different time points wasdetermined by ELISA. The recombinant toxin retained 85%of its activity after 16 h incubation at 37 (Figure 5).
Figure 5 Stability of B3scdsFv-SEA.
Cytotoxic effect on tumor cells of B3scdsFv-SEAThe toxicity of B3scdsFv-SEA to human colon carcinoma
cell line HT-29 was determined by the MTT assay. Theresults of a representative experiment are shown inFigure 6. The maximum killing effect could achieve 95%when the protein concentration was 1 µg/mL. But thecytotoxic potency was a bit lower than native SEA. No killingeffect on tumor cells was observed when the effector cellswere added alone (data not shown).
Figure 6 Cytotoxic effects of B3scdsFv-SEA on HT-29 cell line.
DISCUSSIONDISCUSSIONDISCUSSIONDISCUSSIONDISCUSSION
The Fv fragment of an antibody can penetrate tumors morequickly than the intact antibody because of its small size[13].Because of this advantage, different types of Fv fragmentssuch as ScFv and dsFv have been extensively applied intumor targeting therapy. But the instability of the ScFv andthe low yield of dsFv become the obstacles in their clinicalapplication. It was reported that the ScdsFv which has apeptide linker and a disulfide bond between VH and VL isstable at least after 1 wk exposure to human plasma at 37
, even under denaturing urea (6 mol/L) conditions, andit has a higher yield after renaturation than dsFv[8].
In this study, the ScdsFv of B3 mAb was fused to SEA(D227A). The fusion protein was expressed as inclusionbody in E.coli. Small-scale preparations were performed inorder to determine the optimal denaturing conditions, andwe found that the maximum protein activity could be achievedin the presence of 0.5 mol/L L-Arg and 0.9 mmol/L GSSGin the refolding solution and the optimal denaturingtemperature was 10 . The refolded products were purifiedto get rid of the renaturation agents, the purified B3scdsFv-SEA (D227A) had excellent binding affinity when incubatedwith B3 antigen positive tumor cell lines. The cytotoxicresults indicate that the B3scdsFv-targeted superantigensuppresses the tumor cell growth successfully by activatingthe T lymphocytes. Moreover, the resulting protein is stablewhen incubated at 37 . All the SEA show that the bindingand cytotoxic ability is not affected by the presence of botha linker and a disulfide bond between B3VH and B3VL.
In conclusion, B3scdsFv-targeted superantigen can beconstructed in a bacterial system and this fusion proteinshows its promise as a good reagent for cancer immunotherapy.
REFERENCESREFERENCESREFERENCESREFERENCESREFERENCES
1 Kalland T, Dohlsten M, Abrahmsen L, Hedlund G, Bjork P,Lando PA, Sundstedt A, Akerblom E, Lind P. Targeting of
1 DTT+ 2 DTT-
Abso
rbance
at
450 n
m
3.0
2.5
2.0
1.5
1.0
0.5
0.0
0 2 4 6 8
-log5 (titer)
HT-29MCF-7SMMC-7721
Negative control (PBS)
Abso
rbance
at
450 n
m
1.8
1.6
1.4
1.2
1.0
0.8
0.6
0.4
0.2
0.0
0 1 2 3 4 5 6 7
log5 (titer)
0 h
2 h
4 h
6 h
8 h
16 h
4902 ISSN 1007-9327 CN 14-1219/ R World J Gastroenterol August 21, 2005 Volume 11 Number 31
0 1 2 3 4 5
Concentration (-logM)
% tum
or
gro
wth
inhib
itio
n 110
100
90
80
70
60
B3dsscFv-SEA
Native SEA
superantigens. Cell Biophys 1993; 22: 147-1642 Hansson J, Ohlsson L, Persson R, Andersson G, Ilback NG,
Litton MJ, Kalland T, Dohlsten M. Genetically engineeredsuperantigens as tolerable antitumor agents. Proc Natl AcadSci USA 1997; 94: 2489-2494
3 Dohlsten M, Hedlund G, Akerblom E, Lando PA, Kalland T.Monoclonal antibody-targeted superantigens: a different class ofanti-tumor agents. Proc Natl Acad Sci USA 1991; 88: 9287–9291
4 Brinkmann U, Pai LH, FitzGerald DJ, Willingham M, PastanI. B3(Fv)-PE38KDEL, a single-chain immunotoxin that causescomplete regression of a human carcinoma in mice. Proc NatlAcad Sci USA 1991; 88: 8616-8620
5 Pai LH, Batra JK, FitzGerald DJ, Willingham MC, Pastan I.Antitumor effects of B3-PE and B3-LysPE40 in a nude mousemodel of human breast cancer and the evaluation of B3-PEtoxicity in monkeys. Cancer Res 1992; 52: 3189-3193
6 Rajagopal V, Pastan I, Kreitman RJ. A form of anti-Tac(Fv)which is both single-chain and disulfide stabilized: compari-son with its single-chain and disulfide-stabilized homologs.Protein Eng 1997; 10: 1453-1459
7 Reiter Y, Brinkmann U, Jung SH, Lee B, Kasprzyk PG, KingCR, Pastan I. Improved binding and antitumor activity of a
recombinant anti-erbB2 immunotoxin by disulfide stabiliza-tion of the Fv fragment. J Biol Chem 1994; 269: 18327-18331
8 Bera TK, Onda M, Brinkmann U, Pastan I. A bivalent disul-fide-stabilized Fv with improved antigen binding to erbB2. JMol Biol 1998; 281: 475-483
9 Jung SH, Pastan I, Lee B. Design of interchain disulfide bondsin the framework region of the Fv fragment of the monoclonalantibody B3. Proteins 1994; 19: 35-47
10 Brinkmann U, Reiter Y, Jung SH, Lee B, Pastan I. A recombi-nant immunotoxin containing a disulfide-stabilized Fvfragment. Proc Natl Acad Sci USA 1993; 90: 7538-7542
11 Dohlsten M, Lando PA, Bjork P, Abrahmsen L, Ohlsson L,Lind P, Kalland T. Immunotherapy of human colon cancer byantibody-targeted superantigens. Cancer Immunol Immunother1995; 41: 162-168
12 Pastan I, Lovelace ET, Gallo MG, Rutherford AV, MagnaniJL, Willingham MC. Characterization of monoclonal antibod-ies B1 and B3 that react with mucinous adenocarcinomas.Cancer Res 1991; 51: 3781-3787
13 Kuan CT, Pastan I. Improved antitumor activity of a recom-binant anti-Lewis(y) immunotoxin not requiring proteolyticactivation. Proc Natl Acad Sci USA 1996; 93: 974-978
Science Editor Wang XL and Guo SY Language Editor Elsevier HK
Wang JL et al. Disulfide-stabilized single-chain antibody-targeted superantigen 4903
• BRIEF REPORTS •
Microsatellite instability in gastric cancer and pre-cancerous
lesions
Ping Liu, Xiao-Yong Zhang, Yun Shao, Dao-Fu Zhang
ELSEVIER
PO Box 2345, Beijing 100023, China World J Gastroenterol 2005;11(31):4904-4907www.wjgnet.com World Journal of Gastroenterology ISSN [email protected] © 2005 The WJG Press and Elsevier Inc. All rights reserved.
Ping Liu, Department of Oncology, the First Affiliated Hospital ofNanjing Medical University, Nanjing 210029, Jiangsu Province,ChinaXiao-Yong Zhang, Yun Shao, Dao-Fu Zhang, Department ofGastroenterology, the First Affiliated Hospital of Nanjing MedicalUniversity, Nanjing 210029, Jiangsu Province, ChinaSupported by the Science and Technology Committee Foundationof Jiangsu Province, No. BS98028Correspondence to: Dr. Ping Liu, Department of Oncology, theFirst Affiliated Hospital of Nanjing Medical University, 300Guangshou Road, Nanjing 210029, Jiangsu Province,China. [email protected]: +86-25-83718836-6415 Fax: +86-25-83724440Received: 2004-12-24 Accepted: 2005-01-12
AbstractAbstractAbstractAbstractAbstract
AIM: To investigate the microsatellite instability (MSI) in
cancer and pre-cancerous lesions of the stomach and itsmechanisms underlying the development of gastric cancer.
METHODS: Thirty-six gastric cancer samples wereobtained from patients undergoing surgery. Forty-one
gastric mucosa samples with dysplasia and 51 with
intestinal metaplasia (IM) were obtained from patientswith chronic gastritis undergoing gastro-endoscopy. Genomic
DNA was extracted from the samples. Silver staining
single strand conformation polymorphis-polymerize chainreaction (SSCP-PCR) was used to screen MSI markers at
5 loci (Bat-25, Bat-26, D5S346, D17S250, and D2S123)
in fresh tissues and formalin-fixed, paraffin-embeddedsamples and their corresponding normal gastric mucosa.
RESULTS: The abnormal shifting of the single-strand DNA(MSI) was identified in 21 out of 36 (58.3%) gastric cancers.
Seven cases showed high-level MSI (two or more loci
altered) and 14 showed low-level MSI (one locus altered).Gastric cancer with MSI had a tendency to be located in
the distal stomach. MSI was also detected in 11 out of 41
(26.8%) dysplasia samples and in 9 of 51 (17.6%) IMsamples respectively. Three cases of dysplasia and one
case of IM showed high-level MSI. Eight cases of dysplasia
and 8 cases of IM displayed low-level MSI. MIS in IM wasfound only in moderate or severe-grade IM. No association
was detected between MSI and dysplasia grade.
CONCLUSION: Accumulation of MSI in dysplasia and
intestinal metaplasia of gastric mucosa may be an early
molecular event during gastric carcinogenesis and maycontribute to the acquisition of transformed cell phenotype
and the development of gastric cancer.
© 2005 The WJG Press and Elsevier Inc. All rights reserved.
Key words: Stomach neoplasms; Gastric dysplasia; Intestinalmetaplasia; Microsatellite instability; PCR-SSCP
Liu P, Zhang XY, Shao Y, Zhang DF. Microsatellite instabilityin gastric cancer and pre-cancerous lesions. World J
Gastroenterol 2005; 11(31): 4904-4907
http://www.wjgnet.com/1007-9327/11/4904.asp
INTRODUCTIONINTRODUCTIONINTRODUCTIONINTRODUCTIONINTRODUCTION
There is evidence that gastric carcinogenesis is a long-term,multistep process associated with abnormal alterations incellular oncogenes, tumor suppressor genes and other genesor factors necessary for cell malignant transformation[1-4].Genetic instability is strongly involved in neoplastictransformation and progression[5-9]. Microsatellite instability(MSI), an important form of genetic instability associatedwith defective DNA mismatch repair in tumors, was firstdescribed in hereditary non-polyposis colorectal cancer(HNPCC) in 1993[6]. Since then, the presence of MSI hasbeen reported in a variety of sporadic cancers including gastriccancer[5,10-14], suggesting that MSI may play an important rolein the development of gastric cancer[15]. Intestinal metaplasiaand dysplasia predisposed in gastric mucosa have beenregarded as pre-cancerous lesions of the stomach and areclosely related to the gastric carcinogenesis[16-19]. However,there are few reports concerning the changeable patternsof MSI in the two pre-cancerous lesions. In this study, weinvestigated MSI alterations by use of SSCP-PCR techniquein gastric mucosa with intestinal metaplasia and dysplasia,and gastric cancer samples to explore the potential role ofMSI in gastric carcinogenesis.
MAMAMAMAMATERIALS AND METHODSTERIALS AND METHODSTERIALS AND METHODSTERIALS AND METHODSTERIALS AND METHODS
Stomach specimensThirty-six gastric cancer samples were obtained from patientsundergoing surgery. Forty-one gastric mucosa samples withdysplasia and 51 with intestinal metaplasia were obtainedfrom patients with chronic gastritis undergoing gastro-endoscopy in Jiangsu Provincial Hospital, Nanjing, China.The tumors were graded as well, moderately and poorlydifferentiated. Lesions of intestinal metaplasia and dysplasiawere graded as mild, moderate and severe according tothe WHO criteria. Tissues from non-tumor or non-inflamatory gastric mucosa were used as a control inanalysis of MSI.
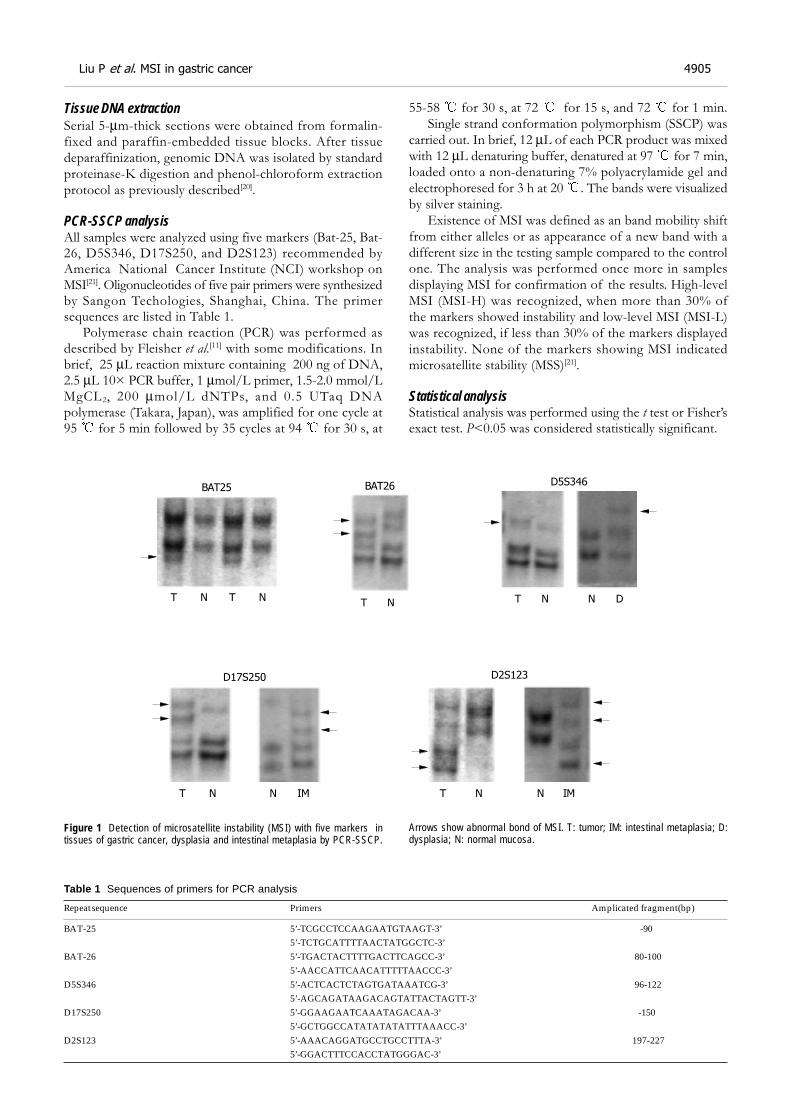
Tissue DNA extractionSerial 5-µm-thick sections were obtained from formalin-fixed and paraffin-embedded tissue blocks. After tissuedeparaffinization, genomic DNA was isolated by standardproteinase-K digestion and phenol-chloroform extractionprotocol as previously described[20].
PCR-SSCP analysisAll samples were analyzed using five markers (Bat-25, Bat-26, D5S346, D17S250, and D2S123) recommended byAmerica National Cancer Institute (NCI) workshop onMSI[21]. Oligonucleotides of five pair primers were synthesizedby Sangon Techologies, Shanghai, China. The primersequences are listed in Table 1.
Polymerase chain reaction (PCR) was performed asdescribed by Fleisher et al.[11] with some modifications. Inbrief, 25 µL reaction mixture containing 200 ng of DNA,2.5 µL 10× PCR buffer, 1 µmol/L primer, 1.5-2.0 mmol/LMgCL2, 200 µmol/L dNTPs, and 0.5 UTaq DNApolymerase (Takara, Japan), was amplified for one cycle at95 for 5 min followed by 35 cycles at 94 for 30 s, at
55-58 for 30 s, at 72 for 15 s, and 72 for 1 min.Single strand conformation polymorphism (SSCP) was
carried out. In brief, 12 µL of each PCR product was mixedwith 12 µL denaturing buffer, denatured at 97 for 7 min,loaded onto a non-denaturing 7% polyacrylamide gel andelectrophoresed for 3 h at 20 . The bands were visualizedby silver staining.
Existence of MSI was defined as an band mobility shiftfrom either alleles or as appearance of a new band with adifferent size in the testing sample compared to the controlone. The analysis was performed once more in samplesdisplaying MSI for confirmation of the results. High-levelMSI (MSI-H) was recognized, when more than 30% ofthe markers showed instability and low-level MSI (MSI-L)was recognized, if less than 30% of the markers displayedinstability. None of the markers showing MSI indicatedmicrosatellite stability (MSS)[21].
Statistical analysisStatistical analysis was performed using the t test or Fisher’sexact test. P<0.05 was considered statistically significant.
Table 1 Sequences of primers for PCR analysis
Repeat sequence Primers Amplicated fragment(bp)
BAT-25 5’-TCGCCTCCAAGAATGTAAGT-3’ -905’-TCTGCATTTTAACTATGGCTC-3’
BAT-26 5’-TGACTACTTTTGACTTCAGCC-3’ 80-1005’-AACCATTCAACATTTTTAACCC-3’
D5S346 5’-ACTCACTCTAGTGATAAATCG-3’ 96-1225’-AGCAGATAAGACAGTATTACTAGTT-3’
D17S250 5’-GGAAGAATCAAATAGACAA-3’ -1505’-GCTGGCCATATATATATTTAAACC-3’
D2S123 5’-AAACAGGATGCCTGCCTTTA-3’ 197-2275’-GGACTTTCCACCTATGGGAC-3’
Figure 1 Detection of microsatellite instability (MSI) with five markers intissues of gastric cancer, dysplasia and intestinal metaplasia by PCR-SSCP.
Arrows show abnormal bond of MSI. T: tumor; IM: intestinal metaplasia; D:dysplasia; N: normal mucosa.
BAT25 BAT26 D5S346
D17S250 D2S123
T N T NT N T N N D
T N N IM T N N IM
Liu P et al. MSI in gastric cancer 4905
RESULRESULRESULRESULRESULTSTSTSTSTS
MSI in gastric cancerNone of the 36 gastric cancer patients had a family historyof gastric cancer. MSI was observed in 21 out of 36 (58.3%)gastric cancers. Among the 21 MSI+ cases, 7 showed MSI-H and 14 showed MSI-L. Figure 1 displays a representativeMSI band compared to control counterpart. No associationwas observed between MSI status and age, gender, tumorgrade, tumor location or lymph node spread. Gastric cancerwith MSI had a tendency to be located in the distal stomachcompared to gastric cancer with MSS (Table 2).
Table 2 Characteristics of 36 gastric cancer patients
Characteristic MSS (n = 15) MSI-L (n = 14) MSI-H (n = 7)
Average age 58 62 58Sex Male 10 11 4 Female 5 3 3Differentiation grade well-moderate 7 9 6 poor 8 5 1Tumor location Distal 8 8 5 Proximal 7 6 2Lymph node spread Absent 9 7 4 Present 6 8 3
MSI in dysplasiaMSI was detected in 11 out of 41 (26.8%) dysplasia samples.Among the 11 MSI+ samples, three showed MSI-H and 8displayed MSI-L. The frequency of MSI in moderate tosevere dysplasia was higher (33.3%) than that in milddysplasia (20%), but the difference was not significant.Notably, four out of five severe dysplasia samples presentedMSI, suggesting MSI tended to develop frequently inmucosa with severe dysplasia (Table 3).
Table 3 Characteristics of 41 patients with dysplasia
Characteristic MSS (n = 30) MSI-L (n = 8) MSI-H (n = 3)
Histological grade Mild 16 3 1 Moderate 13 2 1 Poor 1 3 1
MSI in intestinal metaplasiaMSI was detected in 9 of 51 (17.6%) intestinal metaplasiasamples. Among the nine samples, one showed MSI-H andthe other eight showed MSI-L. Notably, MSI was foundonly in moderate or severe-grade IM (9/14) other than inmild-grade IM (0/28, Z = 3.630, P = 0.001). Moreover, IMsamples from female patients had a higher frequency ofMSI compared to IM tissues from males (29.2% vs 7.4%),but the P value was more than 0.05 (Table 4).
DISCUSSIONDISCUSSIONDISCUSSIONDISCUSSIONDISCUSSION
The mechanisms of carcinogenesis in gastric mucosa remain
unclear, and may involve multiple genetic and epigeneticchanges in susceptible cells of the stomach. Geneticinstability including chromosomal instability and microsatelliteinstability is an important factor for the accumulation ofthese genetic changes.
Microsatellites are ubiquitous, short, repetitive DNAsequences widely and randomly distributed throughout thehuman genome, with unknown function. MSI is a form ofgenetic instability characterized by expansions and contractionsof simple sequence repeats in DNA. It represents an importantform of genomic instability associated with defective DNAmismatch repair in tumors. MSI can be identified in tumorswhen alleles of novel sizes are detected in microsatellitesequences derived from cancer DNA that are not presentin normal tissues of the same individual. MSI has beenobserved in a subset of gastric carcinoma ranging from13% to 44%, even more than 70% in some individualreports[10-14]. The discrepancy in different researches isprobably due to different types and numbers of microsatellitemarkers used in different studies.
In the present study, we have screened three groups ofpatients with the reference set of five markers (two mono-and three di-nucleotide repeats) recommended by AmericaNational Cancer Institute (NCI) and the criteria for identificationof MSI. In our study, the incidence of MSI in gastric cancerwas 58.3%. Leung et al.[12], reported, that MSI in gastric canceris 76.7%, while Halling et al.[14], reported, that MSI in gastriccancer is 19% with 32 makers, and Wang et al.[13], reported,that MSI is 33.9% with 42 markers in Chinese. We thereforepostulate that different MSI rates in gastric cancer may beassociated with the markers used in study, the criteria chosenfor definition of MSI, the number of samples, race anddifferent geographic regions.
The association between MSI and clinicopathologiccharacteristics of gastric cancer remains unknown. Wuet al.[22], reported, that MSI-H gastric tumors are statisticallyassociated with location of the tumor (distal area of thestomach), fewer lymph node metastases and better prognosis.Wirtz et al.[23], reported, that no association is observedbetween MSI and gender, tumor invasion, pathologicalgrade, lymph node metastases, Lauren’s classification andprognosis, which is similar to our results.
IM and dysplasia are considered as early phenotypicchanges in cascade of events leading to gastric cancer.Development of some gastric cancer may be the result ofan accumulation of abnormal gene change in these pre-cancerous lesions[12, 16-19]. In our study, the MSI incidenceof IM was 17.6%, lower than that previously reported (30-44.5%)[15,19]. The discrepancy might be due to the IM samples
Table 4 Characteristics of 51 patients with intestinal metaplasia
Characteristic MSS (n = 42) MSI-L (n = 8) MSI-H (n = 1)
Sex Male 25 2 0 Female 17 6 1Histological grade Mild 28 0 0 Moderate 13 7 0
Poor 1 0 1
4906 ISSN 1007-9327 CN 14-1219/ R World J Gastroenterol August 21, 2005 Volume 11 Number 31
collected from the patients with chronic gastritis, other thangastric cancer and the histological grade of IM. Differentmarkers used in different studies may be another explanationfor the discrepancy. MSI is connected with moderate-grade,which is of importance in grading of IM. We detectedMSI in 26.8% samples with dysplasia in the present study.Lee et al.[24], reported, that there is no significant associationbetween MSI and histological grade of dysplasia.
Investigating the occurrence of MSI in gastric cancer andpre-cancerous lesions may help us to explore the mechanismsof gastric carcinogenesis. Being detected in gastric cancer,IM and dysplastic mucosa, MSI might play a role in the multistepprocess of carcinogenesis of the stomach. It was reportedthat a well-differentiated adenocarcinoma develops 3 yearslater at the IM mucosa displaying MSI[25]. In conclusion, earlyinvolvement and continuous accumulation of MSI insusceptible cells of the stomach may trigger the multi-stepcarcinogenesis pathway. Detection of MSI in pre-cancerouslesions may help us to investigate the stomach carcinogenesisand to identify patients at risk of developing gastric malignancies.
REFERENCESREFERENCESREFERENCESREFERENCESREFERENCES
1 Fang DC. Role of genetic instability in development of gwatriccancer. Shijie Huaren Xiaohua Zazhi 2003; 11: 1-5
2 Yasui W, Yokozaki H, Fujimoto J, Naka K, Kuniyasu H,Tahara E. Genetic and epigenetic alterations in multistep car-cinogenesis of the stomach. J Gastroenterol 2000; 35 (Suppl12): 111-115
3 Tamura G. Genetic and epigenetic alterations of tumor sup-pressor and tumor-related genes in gastric cancer. HistolHistopathol 2002; 17: 323-329
4 Wang RQ, Fang DC, Liu WW. MUC2 gene expression ingastric cancer and preneoplastic lesion tissues. Shijie HuarenXiaohua Zazhi 2000; 8: 285-288
5 Fearon ER, Vogelstein B. A genetic model for colorectaltumorigenesis. Cell 1990; 61: 759-767
6 Aaltonen LA, Peltomaki P, Leach PS, Sistonen P, PylkkanenL, Mecklin JP, Jarvinen H, Powell SM, Jen J, Hamilton SR.Clues to the pathogenesis of familial colorectal cancer. Sience1993; 260: 812-816
7 Thibodeau SN, Bren G, Schaid D. Microsatellite instability incancer of the proximal colon. Sience 1993; 260: 816-819
8 Ionov Y, Peinado MA, Malkhosyan S, Shibata D, Perucho M.Ubiquitous somatic mutations in simple repeated sequencesreveal a new mechanism for colonic carcinogenesis. Nature1993; 363: 558-561
9 Lengauer C, Kinzler KW, Vogelstein B. Genetic instability incolorectal cancers. Nature 1997; 368: 623-627
10 Fang DC, Jass JR, Wang DX, Zhou XD, Luo TH, Young J.Infrequent loss of heterozygosity of APC/MCC and DCCgenes in gastric cancer showing DNA microsatellite instability.J Clin Pathol 1999; 52: 504-508
11 Fleisher AS, Esteller M, Tamura G, Rashid A, Stine OC, Yin J,Zou TT, Abraham JM, Kong D, Nishizuka S, James SP, WilsonKT, Herman JG, Meltzer SJ. Hypermethylation of the hMLH1
gene promoter is associated with microsatellite instability inearly human gastric neoplasia. Oncogene 2001; 20: 329-335
12 Leung WK, Kim JJ, Kim JG, Graham DY, Sepulveda AR.Microsatellite instability in gastric intestinal metaplasia inpatients with and without gastric cancer. Am J Pathol 2000;56: 537-543
13 Wang YX, Ke Y, Ning T, Feng LY, Lu GR, Liu WL. Studies ofmicrosatellite instability in Chinese gastric cancer tissues.Chinese J Med Genetics 1998; 15: 155-157
14 Halling KC, Harper H, Moskaluk CA, Thibodeau SN, PetroniGR, Yustein AS, Tosi P, Minacci C, Roviello F, Piva P,Hamilton SR, Jackson CE, Powell SM. Origin of microsatelliteinstability in gastric cancer. Am J Pathol 1999; 155: 205-211
15 Semba S, Yokozaki H,Yamamoto S, Yasui W, Tahara E.Microsatellite instability in pre-cancerous lesions and adenocar-cinomas of the stomach. Cancer 1996; 77(Suppl 8): 1620-1627
16 Hao DM, Sun XJ, Zheng ZH, He G, Ma MC, Xu HM, WangMX, Sun KL. Screening and expression of associated genes ingastric dysplasia. Shijie Huaren Xiaohua Zazhi 2003; 11: 6-9
17 Chen SY, Wang JY, Ji Y, Zhang XD, Zhu CW. Effects ofHelicobacter pylori and protein kinase C on gene mutation ingastric cancer and pre-cancerous lesions. Shijie Huaren XiaohuaZazhi 2001; 9: 302-307
18 Ruol A, Parenti A, Zaninotto G, Merigliano S, Costantini M,Cagol M, Alfieri R, Bonavina L, Peracchia A, Ancona E. Intes-tinal metaplasia is the probable common precursor of adeno-carcinoma in barrett esophagus and adenocarcinoma of thegastric cardia. Cancer 2000; 88: 2520-2528
19 Kobayashi K, Okamoto T, Takayama S, Akiyama M, OhnoT, Yamada H. Genetic instability in intestinal metaplasia is afrequent event leading to well-differentiated early adenocar-cinoma of the stomach. Er J Cancer 2000; 36: 1113-1119
20 Burton MP, Schneider BG, Brown R, Escamilla-Ponce N,Gulley ML. Comparison of histologic stains of use in PCRanalysis of microdissected paraffin-embedded tissues.Biotechniques 1998; 24: 86-92
21 Boland CR, Thibodeau SN, Hamilton SR, Sidransky D,Eshleman JR, Burt RW, Meltzer SJ, Rodriguez-Bigas MA,Fodde R, Ranzani GN, Srivastava S. A national cancer insti-tute workshop on microsatellite instability for cancer detec-tion and familial predisposition: development of internationalcriteria for the determination of microsatellite instability incolorectal cancer. Cancer Res 1998; 58: 5248-5257
22 Wu MS, Lee CW, Chun CT, Wang HP, Lee WJ, Chang MC,Shen JC, Lin JT. Distinct clinicopathologic and genetic pro-files in sporadic gastric cancer with different mutatorphenotypes. Genes Chromosomes Cancer 2000; 27: 403-411
23 Wirtz HC, Muller W, Noguchi T, Scheven M, Ruschoff J,Hommel G, Gabbert HE. Prognostic value and clinicopatho-logical profile of microsatellite instability in gastric cancer.Clin Cancer Res 1998; 4: 1749-1754
24 Lee JH, Abraham SC, Kim HS, Nam JH, Choi C, Lee MC,Park CS, Juhng SW, Rachid A, Hamilton SR, WU TT. Inverserelationship between APC gene mutatio in gastric adenomasand development of adenocarcinoma. Am J Pathol 2002; 161:611-618
25 Kashiwagi K, Watanabe M, Ezaki T, Kanai T, Ishii H, MukaiM, Hibi T. Clinical usefulness of microsatellite instability forthe prediction of gastric adenoma or adenocarcinoma in pa-tients with chronic gastritis. Br J Cancer 2000; 82: 1814-1818
Science Editor Wang XL and Guo SY Language Editor Elsevier HK
Liu P et al. MSI in gastric cancer 4907
• BRIEF REPORTS •
Expression of cyclooxygenase-2 in gastric cancer and its relation
to liver metastasis and long-term prognosis
Ji-Ren Yu, Yi-Jun Wu, Qi Qin, Ke-Zheng Lu, Sheng Yan, Xiao-Sun Liu, Shu-Sen Zheng
ELSEVIER
PO Box 2345, Beijing 100023, China World J Gastroenterol 2005;11(31):4908-4911www.wjgnet.com World Journal of Gastroenterology ISSN [email protected] © 2005 The WJG Press and Elsevier Inc. All rights reserved.
Ji-Ren Yu, Yi-Jun Wu, Ke-Zheng Lu, Sheng Yan, Xiao-SunLiu, Shu-Sen Zheng, Department of Gastrointestinal Surgery,First Affiliated Hospital, Medical School, Zhejiang University,Hangzhou 310003, Zhejiang Province, ChinaQi Qin, Department of General Surgery, Children Hospital, MedicalSchool, Zhejiang University, Hangzhou 310003, Zhejiang Province,ChinaSupported by the Natural Science Foundation of Zhejiang Province,No. 302048Correspondence to: Dr. Ji-Ren Yu, Department of GastrointestinalSurgery, First Affiliated Hospital, Medical School, Zhejiang University,Hangzhou 310003, Zhejiang Province, China. [email protected]: +86-571-87236852Received: 2004-10-09 Accepted: 2004-11-24
AbstractAbstractAbstractAbstractAbstract
AIM: To investigate the expression of cyclooxygenase-2(COX-2) in gastric cancer and its relation with the liver
metastasis and prognosis.
METHODS: Expression of COX-2 mRNA and protein was
examined in gastric cancer and its paired substantial
normal tissue by semi-quantitative reverse transcription-polymerase chain reaction and immunohistochemistry.
The relation between COX-2 expression and prognosis
was investigated in 195 cases.
RESULTS: The expression of COX-2 mRNA in gastric
cancer tissue was significantly higher than that in normal
tissue in 47 cases (w = 792, P<0.01). The COX-2 mRNAin pT3-4 tissue expressed higher than that in pT1-2
tissue (w = 204, P<0.05). The positive expression rate
of COX-2 protein was 57.9% (113/195). The COX-2expression was significantly related to histological type,
lymphnode metastasis, venous invasion and liver
metastasis (P<0.05). No relation was found betweenCOX-2 expression and invasion depth, peritoneal
metastasis and International Union against Cancer TNM
stage. The multiple regression analysis showed that theCOX-2 expression and venous invasion were obviously
associated with liver metastasis (P<0.05). However,
there was no significant correlation between COX-2immunoreactivity and prognosis.
CONCLUSION: COX-2 may play an important role in the
development of gastric cancer, and the over-expressionof COX-2 protein may be a high risk factor for liver
metastasis.
© 2005 The WJG Press and Elsevier Inc. All rights reserved.
Key words: Gastric cancer; Cyclooxygenase-2; Neoplasmmetastasis; Long-term prognosis
Yu JR, Wu YJ, Qin Q, Lu KZ, Yan S, Liu XS, Zheng SS.Expression of cyclooxygenase-2 in gastric cancer and itsrelation to liver metastasis and long-term prognosis. World J
Gastroenterol 2005; 11(31): 4908-4911
http://www.wjgnet.com/1007-9327/11/4908.asp
INTRODUCTIONINTRODUCTIONINTRODUCTIONINTRODUCTIONINTRODUCTION
Gastric cancer is one of the most common malignanciesworldwide, and yet little is known about its molecular processof development and progression. Epidemiological studiesshowed that non-steroidal anti-inflammatory drugs (NSAID)can reduce the incidence of cancer of digestive tract[1-4].Although the mechanism of NSAID remains unclear, itmay inhibit COX[5]. COX, a key enzyme in conversion ofarachidonic acid to prostaglandin, has two isoforms,namely COX-1 and cyclooxygenase-2 (COX-2). COX-1 isconstitutively expressed in various tissues and involved invarious physiological processes, whereas COX-2 is inducedby pathological stimuli, such as inflammation, growthfactors and cytokines produced by tumor cells[6,7]. Abnormalexpression of COX-2 has been supposed to be related tothe pathogenesis of human cancers[6,8,9].
We attempted to determine the expression of COX-2in gastric cancer, and the relation between COX-2 and thepathological features of gastric cancer. In addition, the roleof COX-2 in liver metastasis of gastric cancer and itsprognostic value were explored.
MAMAMAMAMATERIALS AND METHODSTERIALS AND METHODSTERIALS AND METHODSTERIALS AND METHODSTERIALS AND METHODS
Patients and tissue samples for RT-PCRTissue specimens were taken from 47 gastric cancer patientswho underwent resection (15 women and 32 men, aged29-82 years). Paired samples of cancer tissue and normalgastric mucosa were obtained from each patient duringsurgery. Resected specimens were snap frozen in liquidnitrogen and stored at -80 . All patients were treated atDepartment of General Surgery, First Affiliated Hospital,Medical College of Zhejiang University, in 2001-2002.According to the criteria of International Union againstCancer (UICC), the depth of invasion was divided into pT1,pT2, pT3, and pT4.
Patients and tissue samples for immunohistochemistryOne hundred and ninety-five patients undergoing resection
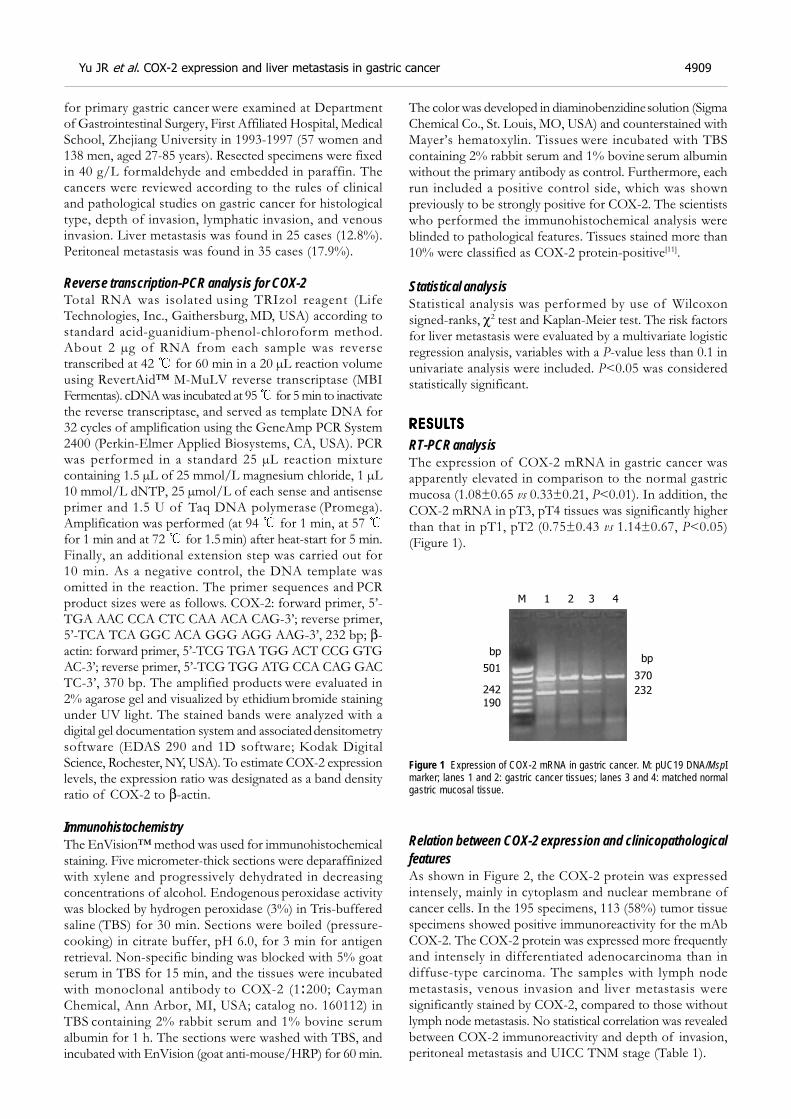
for primary gastric cancer were examined at Departmentof Gastrointestinal Surgery, First Affiliated Hospital, MedicalSchool, Zhejiang University in 1993-1997 (57 women and138 men, aged 27-85 years). Resected specimens were fixedin 40 g/L formaldehyde and embedded in paraffin. Thecancers were reviewed according to the rules of clinicaland pathological studies on gastric cancer for histologicaltype, depth of invasion, lymphatic invasion, and venousinvasion. Liver metastasis was found in 25 cases (12.8%).Peritoneal metastasis was found in 35 cases (17.9%).
Reverse transcription-PCR analysis for COX-2Total RNA was isolated using TRIzol reagent (LifeTechnologies, Inc., Gaithersburg, MD, USA) according tostandard acid-guanidium-phenol-chloroform method.About 2 µg of RNA from each sample was reversetranscribed at 42 for 60 min in a 20 µL reaction volumeusing RevertAid™ M-MuLV reverse transcriptase (MBIFermentas). cDNA was incubated at 95 for 5 min to inactivatethe reverse transcriptase, and served as template DNA for32 cycles of amplification using the GeneAmp PCR System2400 (Perkin-Elmer Applied Biosystems, CA, USA). PCRwas performed in a standard 25 µL reaction mixturecontaining 1.5 µL of 25 mmol/L magnesium chloride, 1 µL10 mmol/L dNTP, 25 µmol/L of each sense and antisenseprimer and 1.5 U of Taq DNA polymerase (Promega).Amplification was performed (at 94 for 1 min, at 57 for 1 min and at 72 for 1.5 min) after heat-start for 5 min.Finally, an additional extension step was carried out for10 min. As a negative control, the DNA template wasomitted in the reaction. The primer sequences and PCRproduct sizes were as follows. COX-2: forward primer, 5’-TGA AAC CCA CTC CAA ACA CAG-3’; reverse primer,5’-TCA TCA GGC ACA GGG AGG AAG-3’, 232 bp; β-actin: forward primer, 5’-TCG TGA TGG ACT CCG GTGAC-3’; reverse primer, 5’-TCG TGG ATG CCA CAG GACTC-3’, 370 bp. The amplified products were evaluated in2% agarose gel and visualized by ethidium bromide stainingunder UV light. The stained bands were analyzed with adigital gel documentation system and associated densitometrysoftware (EDAS 290 and 1D software; Kodak DigitalScience, Rochester, NY, USA). To estimate COX-2 expressionlevels, the expression ratio was designated as a band densityratio of COX-2 to β-actin.
ImmunohistochemistryThe EnVision™ method was used for immunohistochemicalstaining. Five micrometer-thick sections were deparaffinizedwith xylene and progressively dehydrated in decreasingconcentrations of alcohol. Endogenous peroxidase activitywas blocked by hydrogen peroxidase (3%) in Tris-bufferedsaline (TBS) for 30 min. Sections were boiled (pressure-cooking) in citrate buffer, pH 6.0, for 3 min for antigenretrieval. Non-specific binding was blocked with 5% goatserum in TBS for 15 min, and the tissues were incubatedwith monoclonal antibody to COX-2 (1:200; CaymanChemical, Ann Arbor, MI, USA; catalog no. 160112) inTBS containing 2% rabbit serum and 1% bovine serumalbumin for 1 h. The sections were washed with TBS, andincubated with EnVision (goat anti-mouse/HRP) for 60 min.
The color was developed in diaminobenzidine solution (SigmaChemical Co., St. Louis, MO, USA) and counterstained withMayer’s hematoxylin. Tissues were incubated with TBScontaining 2% rabbit serum and 1% bovine serum albuminwithout the primary antibody as control. Furthermore, eachrun included a positive control side, which was shownpreviously to be strongly positive for COX-2. The scientistswho performed the immunohistochemical analysis wereblinded to pathological features. Tissues stained more than10% were classified as COX-2 protein-positive[11].
Statistical analysisStatistical analysis was performed by use of Wilcoxonsigned-ranks, χ2 test and Kaplan-Meier test. The risk factorsfor liver metastasis were evaluated by a multivariate logisticregression analysis, variables with a P-value less than 0.1 inunivariate analysis were included. P<0.05 was consideredstatistically significant.
RESULRESULRESULRESULRESULTSTSTSTSTS
RT-PCR analysisThe expression of COX-2 mRNA in gastric cancer wasapparently elevated in comparison to the normal gastricmucosa (1.08±0.65 vs 0.33±0.21, P<0.01). In addition, theCOX-2 mRNA in pT3, pT4 tissues was significantly higherthan that in pT1, pT2 (0.75±0.43 vs 1.14±0.67, P<0.05)(Figure 1).
Figure 1 Expression of COX-2 mRNA in gastric cancer. M: pUC19 DNA/MspImarker; lanes 1 and 2: gastric cancer tissues; lanes 3 and 4: matched normalgastric mucosal tissue.
Relation between COX-2 expression and clinicopathologicalfeaturesAs shown in Figure 2, the COX-2 protein was expressedintensely, mainly in cytoplasm and nuclear membrane ofcancer cells. In the 195 specimens, 113 (58%) tumor tissuespecimens showed positive immunoreactivity for the mAbCOX-2. The COX-2 protein was expressed more frequentlyand intensely in differentiated adenocarcinoma than indiffuse-type carcinoma. The samples with lymph nodemetastasis, venous invasion and liver metastasis weresignificantly stained by COX-2, compared to those withoutlymph node metastasis. No statistical correlation was revealedbetween COX-2 immunoreactivity and depth of invasion,peritoneal metastasis and UICC TNM stage (Table 1).
501
242
190
bp
M 1 2 3 4
232
bp
370
Yu JR et al. COX-2 expression and liver metastasis in gastric cancer 4909
Risk factors for liver metastasis of gastric cancerBased on the results of the univariate analysis, histologicaltype (P = 0.066), depth of invasion (P = 0.601), venousinvasion (P = 0.011), lymph node metastasis (P = 0.810),COX-2 immunoreactivity (P = 0.008), and venous invasionwere included as covariables in the multivariate regressionanalysis. The result revealed that COX-2 immunoreactivityand venous invasion were the significant risk factors forliver metastasis (Table 2).
Figure 2 Immunostaining of COX-2 in gastric cancer.
Table 1 Correlation between clinicopathologic features of gastriccancer and COX-2 expression
Variable n COX-2 positive cases (%) P (χ²)
Histologic type Differentiated 84 59 (70.2) 0.002 (9.15) Diffuse 111 54 (48.6)Depth of invasion T2 84 47 (60.0) 0.483 (1.46) T3 88 50 (56.8) T4 23 16 (69.6)UICC stage I 14 6 (42.8) II 23 11 (47.8) 0.410 (2.88) III 61 38 (62.3) IV 97 58 (59.8)Venous invasion Negative 80 39 (48.8) 0.030 (4.71) Positive 115 74 (64.3)Lymph node metastasis Negative 20 7 (35.0) 0.028 (4.82) Positive 175 106 (60.6)Liver metastasis Negative 170 93 (54.7) 0.017 (5.72) Positive 25 20 (80.0)Peritoneal metastasis Negative 160 95 (59.4) 0.388 (0.74) Positive 35 18 (51.4)
Table 2 Multivariate logistic regression analysis of independent riskfactors for liver metastasis in 195 gastric cancer patients
Independent risk factor Relative risk 95%CI P
Venous invasion Negative 1 Positive 2.698 1.093–6.660 0.031COX-2 immunoreactivity Negative 1 Positive 2.857 1.159–7.041 0.023
Expression of COX-2 and prognosisAccording to the expression of COX-2, the Kaplan-Meiersurvival curves showed no significant correlation betweenCOX-2 immunoreactivity and prognosis of gastric cancer(Figure 3).
Figure 3 Overall survival curves of patients with gastric cancer.
DISCUSSIONDISCUSSIONDISCUSSIONDISCUSSIONDISCUSSION
In the current study, we demonstrated that both COX-2mRNA and protein were expressed in gastric cancer tissue.The COX-2 mRNA level was associated with the depth oftumor invasion. Ristimaki et al.[8], initially reported, thatCOX-2 mRNA level is elevated in gastric cancer. Uefujiet al.[11], found that the level of COX-2 protein is higher ingastric cancer than in paired normal gastric mucosa byWestern blot analysis. Furthermore, Ohno et al.[12], revealed,that COX-2 mRNA level increases gradually with the depthof gastric cancer invasion. But the exact mechanism isstill unknown. The COX-2 specific antibody identified thatCOX-2 protein is located in cytoplasm and nuclearmembrane of gastric cancer cells, but not in stromasurrounding cancerous tissues, the COX-2 protein is alsoobserved in smooth muscle cells, fibroblasts, and inflammatorymononuclear cells[12-14]. Additionally, epithelial cells showingintestinal metaplasia and adenoma are also stronglyimmunoreactive to anti-COX-2 Ab. The above datademonstrate that COX-2 is upregulated in gastric cancer,and high COX-2 expression may be an early event in thecarcinogenesis of stomach.
In our study, the COX-2 protein was expressed higherin differentiated adenocarcinoma than in diffuse-typecarcinoma. Yamagata et al.[15], reported, that COX-2 expressionincreases in early intestinal-type gastric cancer, and issignificantly higher than that in diffuse-type carcinoma.However, no correlation is found between the histologictype of gastric cancer and COX-2 protein in other reports[12].
Recent studies have shown that COX-2 expression iscorrelated with lymph node metastasis and lymphaticinvasion in gastric carcinoma. Murata et al.[17], showed thatCOX-2 overexpression is associated significantly withtumor invasion of gastric wall lymphatic vessels andlymph node metastasis. The same results are also disclosedin other reports[13,17]. Taken together, these results suggestthat COX-2 may influence lymphatic involvement andpromote tumor invasion.
Surv
ival
1.1
1.0
0.9
0.8
0.7
0.6
0.5
-2 0 2 4 6 8 10 12 14 (yr)
COX-2 negative
COX-2 positive
P = 0.27
4910 ISSN 1007-9327 CN 14-1219/ R World J Gastroenterol August 21, 2005 Volume 11 Number 31
Our study showed that COX-2 expression was associatedwith venous invasion and liver metastasis of gastric cancer.The multivariate analysis revealed that the COX-2immunoreactivity was an independent risk factor for livermetastasis of gastric carcinoma. COX-2 can enhance theadhesive ability of endothelial cells in colonic carcinomacells, and fortify liver metastatic potential via secretion ofsialyl Lewis antigens[18,19]. Nagatsuka et al.[16], also discoveredthat the selective COX-2 inhibitor (JTE 522) has inhibitoryeffects on liver metastasis of colon cancer. On the contrary,some reports showed that COX-2 does not play a major rolein the process of distant metastasis of gastric cancer[11,12,17].The reason why there is such a discrepancy is not clear, butthe differences in methods (antibody, results evaluation)might be an important reason.
It was reported that COX-2 protein overexpression issignificantly associated with the UICC TNM stage and theprognosis of gastric cancer patients[16,17]. Ristimaki et al.[20], haveconnected COX-2 overexpression to an unfavorable distantdisease-free survival in breast cancer patients (n = 1 576).However, no significant correlation was found betweenCOX-2 immunoreactivity and peritoneal metastasis, UICCTNM stage and prognosis in our study. Joo et al.[21], alsohave not found any significant correlation between them. Alarge group and long term follow-up are necessary to assessthe prognostic value of COX-2 in gastric cancer.
Our results suggest that COX-2 is overexpressed ingastric cancer, and COX-2 may play an important role inliver and lymphatic metastasis of gastric cancer. Inhibitingthe activity of COX-2 may provide therapeutic benefit togastric cancer.
REFERENCESREFERENCESREFERENCESREFERENCESREFERENCES
1 Farrow DC, Vaughan TL, Hansten PD, Stanford JL, RischHA, Gammon MD, Chow WH, Dubrow R, Ahsan H, MayneST, Schoenberg JB, West AB, Rotterdam H, Fraumeni JF Jr,Blot WJ. Use of aspirin and other nonsteroidal anti-inflam-matory drugs and risk of esophageal and gastric cancer. Can-cer Epidemiol Biomarkers Prev 1998; 7: 97-102
2 Garcia-Rodriguez LA, Huerta-Alvarez C. Reduced risk ofcolorectal cancer among long-term users of aspirin and non-steroidal antiinflammatory drugs. Epidemiology 2001; 12:88-93
3 Morgan G. Beneficial effects of NSAIDs in the gastrointesti-nal tract. Eur J Gastroenterol Hepatol 1999; 11: 393-400
4 Funkhouser EM, Sharp GB. Aspirin and reduced risk ofesophageal carcinoma. Cancer 1995; 76: 1116-1119
5 Taketo MM. Cyclooxygenase-2 inhibitors in tumorigenesis(Part II). J Natl Cancer Inst 1998; 90: 1609-1620
6 Sano H, Kawahito Y, Wilder RL, Hashiramoto A, Mukai S,Asai K, Kimura S, Kato H, Kondo M, Hla T. Expression ofcyclooxygenase-1 and -2 in human colorectal cancer. CancerRes 1995; 55: 3785-3789
7 Williams CS, DuBois RN. Prostaglandin endoperoxidesynthase: why two isoforms? Am J Physiol 1996; 270(3 Pt 1):G393-G400
8 Ristimaki A, Honkanen N, Jankala H, Sipponen P, HarkonenM. Expression of cyclooxygenase-2 in human gastriccarcinoma. Cancer Res 1997; 57: 1276-1280
9 Tucker ON, Dannenberg AJ, Yang EK, Zhang F, Teng L, DalyJM, Soslow RA, Masferrer JL, Woerner BM, Koki AT, Fahey TJ3rd. Cyclooxygenase-2 expression is up-regulated in humanpancreatic cancer. Cancer Res 1999; 59: 987-990
10 Saukkonen K, Nieminen O, van Rees B, Vilkki S, HarkonenM, Juhola M, Mecklin JP, Sipponen P, Ristimaki A. Expres-sion of cyclooxygenase-2 in dysplasia of the stomach and inintestinal-type gastric adenocarcinoma. Clin Cancer Res 2001;7: 1923-1931
11 Uefuji K, Ichikura T, Mochizuki H, Shinomiya N. Expressionof cyclooxygenase-2 protein in gastric adenocarcinoma. J SurgOncol 1998; 69: 168-172
12 Ohno R, Yoshinaga K, Fujita T, Hasegawa K, Iseki H,Tsunozaki H, Ichikawa W, Nihei Z, Sugihara K. Depth ofinvasion parallels increased cyclooxygenase-2 levels in pa-tients with gastric carcinoma. Cancer 2001; 91: 1876-1881
13 Lim HY, Joo HJ, Choi JH, Yi JW, Yang MS, Cho DY, Kim H,Nam DK, Lee KB, Kim HC. Increased expression ofcyclooxygenase-2 protein human gastric carcinoma. Clin CancerRes 2000; 6: 519-525
14 van Rees BP, Saukkonen K, Ristimaki A, Polkowski W, TytgatGN, Drillenburg P, Offerhaus GJ. Cyclooxygenase-2 expres-sion during carcinogenesis in the human stomach. J Pathol2002; 196: 171-179
15 Yamagata R, Shimoyama T, Fukuda S, Yoshimura T, TanakaM, Munakata A. Cyclooxygenase-2 expression is increased inearly intestinal-type gastric cancer and gastric mucosa withintestinal metaplasia. Eur J Gastroenterol Hepatol 2002; 14:359-363
16 Nagatsuka I, Yamada N, Shimizu S, Ohira M, NishinoH, Seki S, Hirakawa K. Inhibitory effect of a selectivecyclooxygenase-2 inhibitor on liver metastasis of colon cancer.Int J Cancer 2002; 100: 515-519
17 Murata H, Kawano S, Tsuji S, Tsuji M, Sawaoka H, KimuraY, Shiozaki H, Hori M. Cyclooxygenase-2 overexpression en-hances lymphatic invasion and metastasis in human gastriccarcinoma. Am J Gastroenterol 1999; 94: 451-455
18 Yamamoto H, Itoh F, Fukushima H, Hinoda Y, Imai K.Overexpression of cyclooxygenase-2 protein is less frequentin gastric cancers with microsatellite instability. Int J Cancer1999; 84: 400-403
19 Kakiuchi Y, Tsuji S, Tsujii M, Murata H, Kawai N, YasumaruM, Kimura A, Komori M, Irie T, Miyoshi E, Sasaki Y, HayashiN, Kawano S, Hori M. Cyclooxygenase-2 activity altered thecell-surface carbohydrate antigens on colon cancer cells andenhanced liver metastasis. Cancer Res 2002; 62: 1567-1572
20 Ristimaki A, Sivula A, Lundin J, Lundin M, Salminen T,Haglund C, Joensuu H, Isola J. Prognostic significance ofelevated cyclooxygenase-2 expression in breast cancer. CancerRes 2002; 62: 632-635
21 Joo YE, Oh WT, Rew JS, Park CS, Choi SK, Kim SJ.Cyclooxygenase-2 expression is associated with well-differ-entiated and intestinal-type pathways in gastric carcinogenesis.Digestion 2002; 66: 222-229
Science Editor Wang XL and Guo SY Language Editor Elsevier HK
Yu JR et al. COX-2 expression and liver metastasis in gastric cancer 4911
• BRIEF REPORTS •
Anti-inflammatory mechanism of oxymatrine in dextran sulfate
sodium-induced colitis of rats
Ping Zheng, Feng-Li Niu, Wen-Zhong Liu, Yao Shi, Lun-Gen Lu
ELSEVIER
PO Box 2345, Beijing 100023, China World J Gastroenterol 2005;11(31):4912-4915www.wjgnet.com World Journal of Gastroenterology ISSN [email protected] © 2005 The WJG Press and Elsevier Inc. All rights reserved.
Ping Zheng, Feng-Li Niu, Wen-Zhong Liu, Yao Shi, Lun-GenLu, Shanghai Institute of Digestive Disease, Renji Hospital, ShanghaiSecond Medical University, Shanghai 200127, ChinaSupported by the University Science and Technology DevelopmentFoundation of Shanghai, No. 00B07Correspondence to: Professor Ping Zheng, Shanghai Instituteof Digestive Disease, Renji Hospital, Shanghai Second MedicalUniversity, Shanghai 200127, China. [email protected]: +86-21-63364118 Fax: +86-21-63364118Received: 2004-03-06 Accepted: 2004-07-15
AbstractAbstractAbstractAbstractAbstract
AIM: To investigate the anti-inflammatory mechanism ofoxymatrine in dextran sulfate sodium (DSS)-induced colitisof rats.
METHODS: Acute colitis was induced by giving 2% DSSorally in drinking water for 8 d. Twenty-six male rats wererandomized into oxymatrine-treated group (group A, 10rats), DSS control (group B, 10 rats) and normal control(group C, 6 rats). The rats in group A were injectedmuscularly with oxymatrine at the dosage of 63 mg/(kg·d)from d 1 to 11 and drank 2% DSS solution from d 4 to 11.The rats in group B were treated with 0.9% saline in anequal volume as group A and drank 2% DSS solutionfrom d 4 to 11. The rats in group C were treated with0.9% saline as group B from d 1 to 11 and drank waternormally. Diarrhea and bloody stool as well as colonichistology were observed. The levels of serum tumornecrosis factor-α (TNF-α) and interleukin-6 (IL-6) weredetermined by ELISA, and nuclear factor-κB (NF-κB)activity and the expression of inter-cellular adhesionmolecule-1 (ICAM-1) in colonic mucosa were detectedby immunohistochemistry method.
RESULTS: Compared with DSS control group, the
inflammatory symptoms and histological damages of colonic
mucosa in oxymatrine-treated group were significantlyimproved, the serum levels of TNF-α, IL-6, and the
expression of NF-κB, ICAM-1 in colonic mucosa were
significantly reduced.
CONCLUSION: The fact that oxymatrine can reduce
the serum levels of TNF-α, IL-6, and the expression ofNF-κB and ICAM-1 in colonic mucosa in DSS-induced
colitis of rats indicates that oxymatrine may ameliorate
the colonic inflammation and thus alleviate diarrhea andbloody stool.
© 2005 The WJG Press and Elsevier Inc. All rights reserved.
Key words: Oxymatrine; Colitis; Colonic mucosa
Zheng P, Niu FL, Liu WZ, Shi Y, Lu LG. Anti-inflammatorymechanism of oxymatrine in dextran sulfate sodium-inducedcolitis of rats. World J Gastroenterol 2005; 11(31): 4912-4915
http://www.wjgnet.com/1007-9327/11/4912.asp
INTRODUCTIONINTRODUCTIONINTRODUCTIONINTRODUCTIONINTRODUCTION
The symptoms and colonic histopathology of rodent colitismodel induced by dextran sulfate sodium salt (DSS) resemblemore the human ulcerative colitis (UC) than other chemicallyinduced colitis, which has become a research tool for thepathogenesis of UC and the development of new drugs inour country and abroad. Sophora flavescens Ait has distinctanti-inflammatory effect and, several mixture formulas withSophora flavescens Ait are effectively used to treat UC inthe clinic[1]. Oxymatrine, as the main efficacy componentof light yellow sophora root, has been reported to be effectivein the treatment of viral hepatitis and bronchial asthma.Our previous experiments suggested that oxymatrine mightsignificantly improve the colonic inflamed damage in ratcolitis induced by DSS, but its exact mechanism is unclear[2].The present experiment aimed to elicit the anti-inflammatorymechanism of oxymatrine in terms of the regulation ofnuclear factor-κB (NF-κB) to tumor necrosis factor-α(TNF-α), interleukin-6 (IL-6), and inter-cellular adhesionmolecule-1 (ICAM-1)[3-5]. The inflamed damage of DSScolitis in rats appears early, so many researches reported toadminister studied drugs along with or ahead of DSSadministration to obtain predicated efficacy[6-10]. As diarrheaand bloody stool alleviate rapidly after the withdrawal ofDSS, which may affect the observation of drug effect, thepresent study administered oxymatrine 3 d earlier than DSSand terminated oxymatrine and DSS at the same timeaccording to the literature mentioned above and preliminaryexperiments.
MAMAMAMAMATERIALS AND METHODSTERIALS AND METHODSTERIALS AND METHODSTERIALS AND METHODSTERIALS AND METHODS
MaterialsHealthy male SD rats (n = 26, 4-5 wk) were obtained fromShanghai Experiment Center of Chinese Academy ofScience, Shanghai, China. DSS (Sigma) was prepared as 2%solution with distilled water. Injection oxymatrine (kurorinone)was obtained from Ningxia Pharmaceutical Factory, Ningxia,China, with purity of more than 98%. TNF-α and IL-6ELISA kits were purchased from R&D Corporation (Cat.R6000 and RTA00). NF-κBp65 (F-6) monoclonal antibody
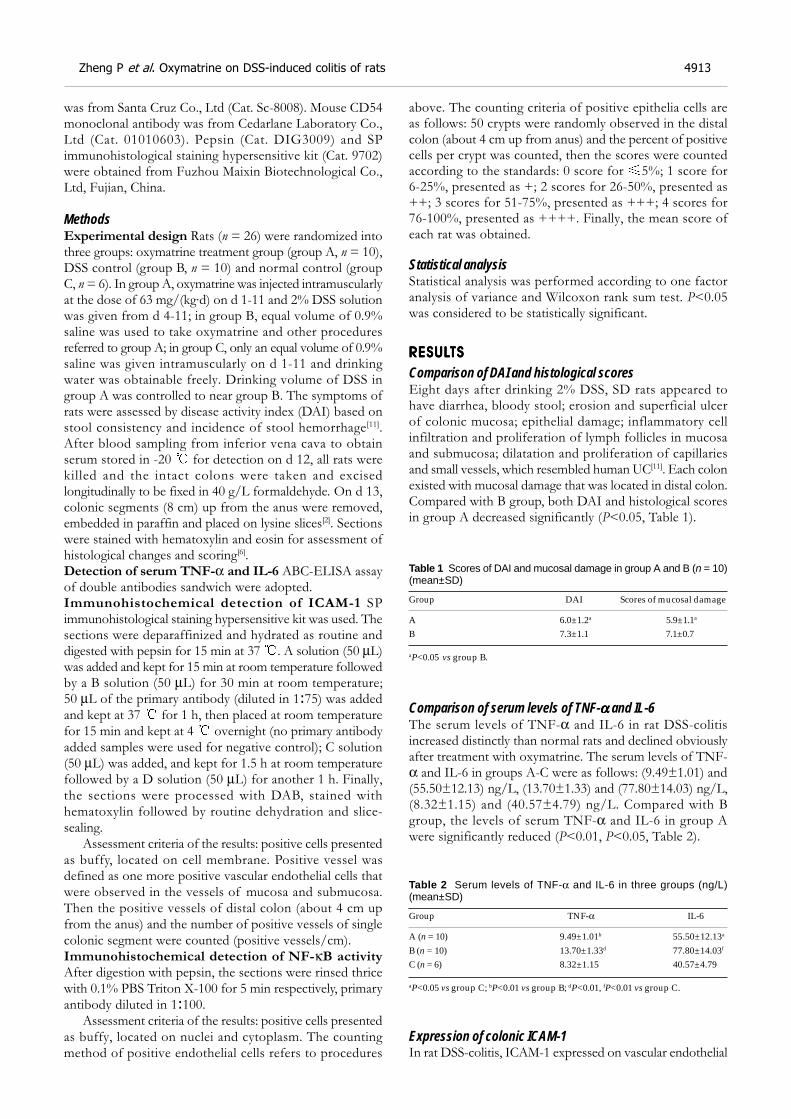
was from Santa Cruz Co., Ltd (Cat. Sc-8008). Mouse CD54monoclonal antibody was from Cedarlane Laboratory Co.,Ltd (Cat. 01010603). Pepsin (Cat. DIG3009) and SPimmunohistological staining hypersensitive kit (Cat. 9702)were obtained from Fuzhou Maixin Biotechnological Co.,Ltd, Fujian, China.
MethodsExperimental design Rats (n = 26) were randomized intothree groups: oxymatrine treatment group (group A, n = 10),DSS control (group B, n = 10) and normal control (groupC, n = 6). In group A, oxymatrine was injected intramuscularlyat the dose of 63 mg/(kg·d) on d 1-11 and 2% DSS solutionwas given from d 4-11; in group B, equal volume of 0.9%saline was used to take oxymatrine and other proceduresreferred to group A; in group C, only an equal volume of 0.9%saline was given intramuscularly on d 1-11 and drinkingwater was obtainable freely. Drinking volume of DSS ingroup A was controlled to near group B. The symptoms ofrats were assessed by disease activity index (DAI) based onstool consistency and incidence of stool hemorrhage[11].After blood sampling from inferior vena cava to obtainserum stored in -20 for detection on d 12, all rats werekilled and the intact colons were taken and excisedlongitudinally to be fixed in 40 g/L formaldehyde. On d 13,colonic segments (8 cm) up from the anus were removed,embedded in paraffin and placed on lysine slices[2]. Sectionswere stained with hematoxylin and eosin for assessment ofhistological changes and scoring[6].Detection of serum TNF-α and IL-6 ABC-ELISA assayof double antibodies sandwich were adopted.Immunohistochemical detection of ICAM-1 SPimmunohistological staining hypersensitive kit was used. Thesections were deparaffinized and hydrated as routine anddigested with pepsin for 15 min at 37 . A solution (50 µL)was added and kept for 15 min at room temperature followedby a B solution (50 µL) for 30 min at room temperature;50 µL of the primary antibody (diluted in 1:75) was addedand kept at 37 for 1 h, then placed at room temperaturefor 15 min and kept at 4 overnight (no primary antibodyadded samples were used for negative control); C solution(50 µL) was added, and kept for 1.5 h at room temperaturefollowed by a D solution (50 µL) for another 1 h. Finally,the sections were processed with DAB, stained withhematoxylin followed by routine dehydration and slice-sealing.
Assessment criteria of the results: positive cells presentedas buffy, located on cell membrane. Positive vessel wasdefined as one more positive vascular endothelial cells thatwere observed in the vessels of mucosa and submucosa.Then the positive vessels of distal colon (about 4 cm upfrom the anus) and the number of positive vessels of singlecolonic segment were counted (positive vessels/cm).Immunohistochemical detection of NF-κB activity
After digestion with pepsin, the sections were rinsed thricewith 0.1% PBS Triton X-100 for 5 min respectively, primaryantibody diluted in 1:100.
Assessment criteria of the results: positive cells presentedas buffy, located on nuclei and cytoplasm. The countingmethod of positive endothelial cells refers to procedures
above. The counting criteria of positive epithelia cells areas follows: 50 crypts were randomly observed in the distalcolon (about 4 cm up from anus) and the percent of positivecells per crypt was counted, then the scores were countedaccording to the standards: 0 score for 5%; 1 score for6-25%, presented as +; 2 scores for 26-50%, presented as++; 3 scores for 51-75%, presented as +++; 4 scores for76-100%, presented as ++++. Finally, the mean score ofeach rat was obtained.
Statistical analysisStatistical analysis was performed according to one factoranalysis of variance and Wilcoxon rank sum test. P<0.05was considered to be statistically significant.
RESULRESULRESULRESULRESULTSTSTSTSTS
Comparison of DAI and histological scoresEight days after drinking 2% DSS, SD rats appeared tohave diarrhea, bloody stool; erosion and superficial ulcerof colonic mucosa; epithelial damage; inflammatory cellinfiltration and proliferation of lymph follicles in mucosaand submucosa; dilatation and proliferation of capillariesand small vessels, which resembled human UC[11]. Each colonexisted with mucosal damage that was located in distal colon.Compared with B group, both DAI and histological scoresin group A decreased significantly (P<0.05, Table 1).
Table 1 Scores of DAI and mucosal damage in group A and B (n = 10)(mean±SD)
Group DAI Scores of mucosal damage
A 6.0±1.2a 5.9±1.1a
B 7.3±1.1 7.1±0.7
aP<0.05 vs group B.
Comparison of serum levels of TNF-ααααα and IL-6The serum levels of TNF-α and IL-6 in rat DSS-colitisincreased distinctly than normal rats and declined obviouslyafter treatment with oxymatrine. The serum levels of TNF-α and IL-6 in groups A-C were as follows: (9.49±1.01) and(55.50±12.13) ng/L, (13.70±1.33) and (77.80±14.03) ng/L,(8.32±1.15) and (40.57±4.79) ng/L. Compared with Bgroup, the levels of serum TNF-α and IL-6 in group Awere significantly reduced (P<0.01, P<0.05, Table 2).
Table 2 Serum levels of TNF-α and IL-6 in three groups (ng/L)(mean±SD)
Group TNF-α IL-6
A (n = 10) 9.49±1.01b 55.50±12.13a
B (n = 10) 13.70±1.33d 77.80±14.03f
C (n = 6) 8.32±1.15 40.57±4.79
aP<0.05 vs group C; bP<0.01 vs group B; dP<0.01, fP<0.01 vs group C.
Expression of colonic ICAM-1In rat DSS-colitis, ICAM-1 expressed on vascular endothelial
Zheng P et al. Oxymatrine on DSS-induced colitis of rats 4913
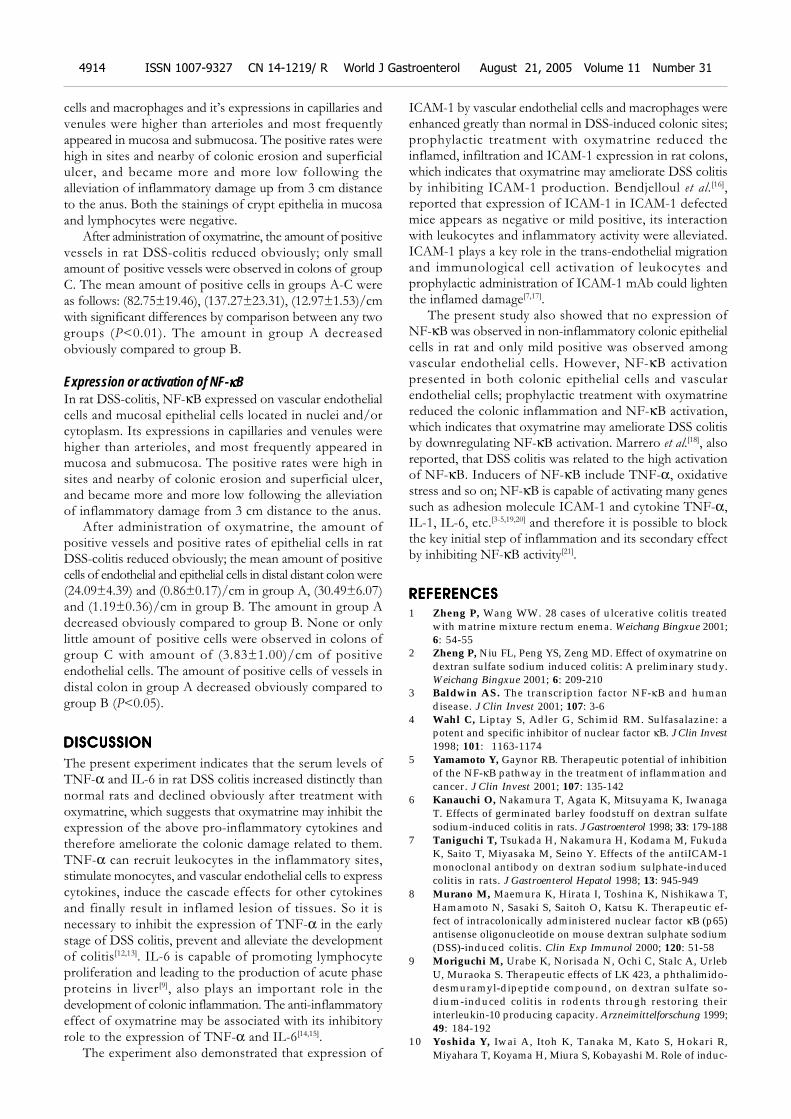
cells and macrophages and it’s expressions in capillaries andvenules were higher than arterioles and most frequentlyappeared in mucosa and submucosa. The positive rates werehigh in sites and nearby of colonic erosion and superficialulcer, and became more and more low following thealleviation of inflammatory damage up from 3 cm distanceto the anus. Both the stainings of crypt epithelia in mucosaand lymphocytes were negative.
After administration of oxymatrine, the amount of positivevessels in rat DSS-colitis reduced obviously; only smallamount of positive vessels were observed in colons of groupC. The mean amount of positive cells in groups A-C wereas follows: (82.75±19.46), (137.27±23.31), (12.97±1.53)/cmwith significant differences by comparison between any twogroups (P<0.01). The amount in group A decreasedobviously compared to group B.
Expression or activation of NF-κκκκκBIn rat DSS-colitis, NF-κB expressed on vascular endothelialcells and mucosal epithelial cells located in nuclei and/orcytoplasm. Its expressions in capillaries and venules werehigher than arterioles, and most frequently appeared inmucosa and submucosa. The positive rates were high insites and nearby of colonic erosion and superficial ulcer,and became more and more low following the alleviationof inflammatory damage from 3 cm distance to the anus.
After administration of oxymatrine, the amount ofpositive vessels and positive rates of epithelial cells in ratDSS-colitis reduced obviously; the mean amount of positivecells of endothelial and epithelial cells in distal distant colon were(24.09±4.39) and (0.86±0.17)/cm in group A, (30.49±6.07)and (1.19±0.36)/cm in group B. The amount in group Adecreased obviously compared to group B. None or onlylittle amount of positive cells were observed in colons ofgroup C with amount of (3.83±1.00)/cm of positiveendothelial cells. The amount of positive cells of vessels indistal colon in group A decreased obviously compared togroup B (P<0.05).
DISCUSSIONDISCUSSIONDISCUSSIONDISCUSSIONDISCUSSION
The present experiment indicates that the serum levels ofTNF-α and IL-6 in rat DSS colitis increased distinctly thannormal rats and declined obviously after treatment withoxymatrine, which suggests that oxymatrine may inhibit theexpression of the above pro-inflammatory cytokines andtherefore ameliorate the colonic damage related to them.TNF-α can recruit leukocytes in the inflammatory sites,stimulate monocytes, and vascular endothelial cells to expresscytokines, induce the cascade effects for other cytokinesand finally result in inflamed lesion of tissues. So it isnecessary to inhibit the expression of TNF-α in the earlystage of DSS colitis, prevent and alleviate the developmentof colitis[12,13]. IL-6 is capable of promoting lymphocyteproliferation and leading to the production of acute phaseproteins in liver[9], also plays an important role in thedevelopment of colonic inflammation. The anti-inflammatoryeffect of oxymatrine may be associated with its inhibitoryrole to the expression of TNF-α and IL-6[14,15].
The experiment also demonstrated that expression of
ICAM-1 by vascular endothelial cells and macrophages wereenhanced greatly than normal in DSS-induced colonic sites;prophylactic treatment with oxymatrine reduced theinflamed, infiltration and ICAM-1 expression in rat colons,which indicates that oxymatrine may ameliorate DSS colitisby inhibiting ICAM-1 production. Bendjelloul et al.[16],reported that expression of ICAM-1 in ICAM-1 defectedmice appears as negative or mild positive, its interactionwith leukocytes and inflammatory activity were alleviated.ICAM-1 plays a key role in the trans-endothelial migrationand immunological cell activation of leukocytes andprophylactic administration of ICAM-1 mAb could lightenthe inflamed damage[7,17].
The present study also showed that no expression ofNF-κB was observed in non-inflammatory colonic epithelialcells in rat and only mild positive was observed amongvascular endothelial cells. However, NF-κB activationpresented in both colonic epithelial cells and vascularendothelial cells; prophylactic treatment with oxymatrinereduced the colonic inflammation and NF-κB activation,which indicates that oxymatrine may ameliorate DSS colitisby downregulating NF-κB activation. Marrero et al.[18], alsoreported, that DSS colitis was related to the high activationof NF-κB. Inducers of NF-κB include TNF-α, oxidativestress and so on; NF-κB is capable of activating many genessuch as adhesion molecule ICAM-1 and cytokine TNF-α,IL-1, IL-6, etc.[3-5,19,20] and therefore it is possible to blockthe key initial step of inflammation and its secondary effectby inhibiting NF-κB activity[21].
REFERENCESREFERENCESREFERENCESREFERENCESREFERENCES
1 Zheng P, Wang WW. 28 cases of ulcerative colitis treatedwith matrine mixture rectum enema. Weichang Bingxue 2001;6: 54-55
2 Zheng P, Niu FL, Peng YS, Zeng MD. Effect of oxymatrine ondextran sulfate sodium induced colitis: A preliminary study.Weichang Bingxue 2001; 6: 209-210
3 Baldwin AS. The transcription factor NF-κB and humandisease. J Clin Invest 2001; 107: 3-6
4 Wahl C, Liptay S, Adler G, Schimid RM. Sulfasalazine: apotent and specific inhibitor of nuclear factor κB. J Clin Invest1998; 101: 1163-1174
5 Yamamoto Y, Gaynor RB. Therapeutic potential of inhibitionof the NF-κB pathway in the treatment of inflammation andcancer. J Clin Invest 2001; 107: 135-142
6 Kanauchi O, Nakamura T, Agata K, Mitsuyama K, IwanagaT. Effects of germinated barley foodstuff on dextran sulfatesodium-induced colitis in rats. J Gastroenterol 1998; 33: 179-188
7 Taniguchi T, Tsukada H, Nakamura H, Kodama M, FukudaK, Saito T, Miyasaka M, Seino Y. Effects of the antiICAM-1monoclonal antibody on dextran sodium sulphate-inducedcolitis in rats. J Gastroenterol Hepatol 1998; 13: 945-949
8 Murano M, Maemura K, Hirata I, Toshina K, Nishikawa T,Hamamoto N, Sasaki S, Saitoh O, Katsu K. Therapeutic ef-fect of intracolonically administered nuclear factor κB (p65)antisense oligonucleotide on mouse dextran sulphate sodium(DSS)-induced colitis. Clin Exp Immunol 2000; 120: 51-58
9 Moriguchi M, Urabe K, Norisada N, Ochi C, Stalc A, UrlebU, Muraoka S. Therapeutic effects of LK 423, a phthalimido-desmuramyl-dipeptide compound, on dextran sulfate so-dium-induced colitis in rodents through restoring theirinterleukin-10 producing capacity. Arzneimittelforschung 1999;49: 184-192
10 Yoshida Y, Iwai A, Itoh K, Tanaka M, Kato S, Hokari R,Miyahara T, Koyama H, Miura S, Kobayashi M. Role of induc-
4914 ISSN 1007-9327 CN 14-1219/ R World J Gastroenterol August 21, 2005 Volume 11 Number 31
ible nitric oxide synthase in dextran sulphate sodium-inducedcolitis. Aliment Pharmacol Ther 2000; 14 (Suppl): 126-132
11 Porter SN, Howarth GS, Butler RN. An orally administeredgrowth factor extract derived from bovine when suppressesbreath ethane in colitic rats. Scand J Gastroenterol 1998; 33:967-974
12 Myers KJ, Murthy S, Flanigan A, Witchell DR, Butler M,Murray S, Siwkowski A, Goodfellow D, Madsen K, Baker B.Antisense oligonucleotide blockade of tumor necrosis factor-alpha in two murine models of colitis. J Pharmacol Exp Ther2003; 304: 411-424
13 Murthy S, Flanigan A, Coppola D, Buelow R. RDP58, a lo-cally active TNF inhibitor, is effective in the dextran sulphatemouse model of chronic colitis. Inflamm Res 2002; 51: 522-531
14 Lin W, Zhang JP, Hu ZL, Qian DH. Inhibitory effect ofmatrine on lipopolysacchride-induced tumor necrosis factorand interleukin-6 production from rat Kupffer cells. YaoxueXuebao 1997; 32: 93-96
15 Hu ZL, Zhang JP, Qian DH, Lin W, Xie WF, Zhang XR, ChenWZ. Effects of matrine on mouse splenocyte proliferationand release of interleukin-1 and -6 from peritoneal macroph-ages in vitro. Zhongguo Yaoli Xuebao 1996; 17: 259-261
16 Bendjelloul F, Rossmann P, Maly P, Mandys V, Jirkovska M,Prokesova L, Tuckova L, Tlaskalova-Hogenova H. Detectionof ICAM-1 in experimentally induced colitis of ICAM-1-defi-
cient and wild-type mice: an immunohistochemical study.Histochem J 2000; 32: 703-709
17 Farkas S, Herfarth H, Rossle M, Schroeder J, Steinbauer M,Guba M, Beham A, Scholmerich J, Jauch KW, Anthuber M.Quantification of mucosal leucocyte endothelial cell interac-tion by in vivo fluorescence microscopy in experimental colitisin mice. Clin Exp Immunol 2001; 126: 250-258
18 Marrero JA, Matkowskyj KA, Yung K, Hecht G, Benya RV.Dextran sulfate sodium-induced murine colitis activates NF-κB and increases galanin-1 receptor expression. Am J PhysiolGastrointest Liver Physiol 2000; 278: G797-804
19 Herfarth H, Brand K, Rath HC, Rogler G, Scholmerich J, FalkW. Nuclear factor-κB activity and intestinal inflammation indextran sulphate sodium (DSS)-induced colitis in mice issuppressed by gliotoxin. Clin Exp Immunol 2000; 120: 59-65
20 Jobin C, Hellerbrand C, Licato LL, Brenner DA, Sartor RB.Mediation by NF-κB of cytokine induced expression of inter-cellular adhesion molecule 1 (ICAM-1) in an intestinal epithe-lial cell line, a process blocked by proteasome inhibitors. Gut1998; 42: 779-787
21 Spiik AK, Ridderstad A, Axelsson LG, Midtvedt T, Bjork L,Pettersson S. Abrogated lymphocyte infiltration and loweredCD14 in dextran sulfate induced colitis in mice treated withp65 antisense oligonucleotides. Int J Colorectal Dis 2002; 17:223-232
Science Editor Zhu LH and Guo SY Language Editor Elsevier HK
Zheng P et al. Oxymatrine on DSS-induced colitis of rats 4915
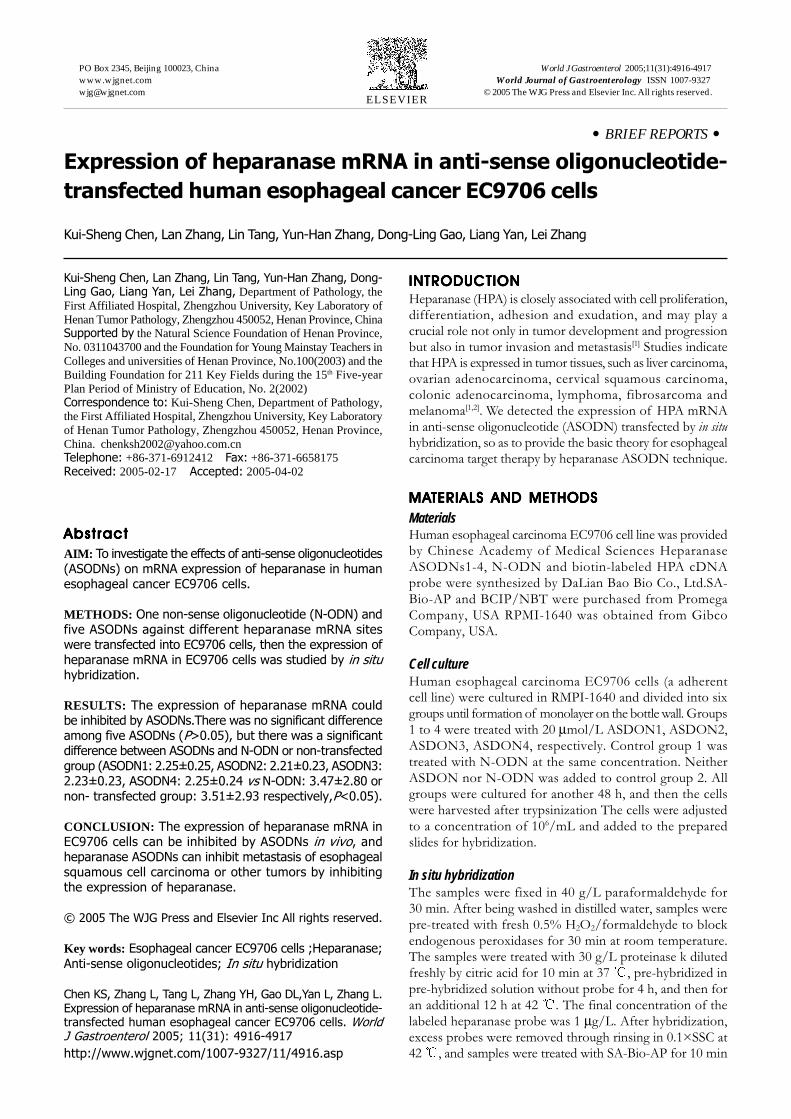
• BRIEF REPORTS •
Expression of heparanase mRNA in anti-sense oligonucleotide-
transfected human esophageal cancer EC9706 cells
Kui-Sheng Chen, Lan Zhang, Lin Tang, Yun-Han Zhang, Dong-Ling Gao, Liang Yan, Lei Zhang
ELSEVIER
Kui-Sheng Chen, Lan Zhang, Lin Tang, Yun-Han Zhang, Dong-Ling Gao, Liang Yan, Lei Zhang, Department of Pathology, theFirst Affiliated Hospital, Zhengzhou University, Key Laboratory ofHenan Tumor Pathology, Zhengzhou 450052, Henan Province, ChinaSupported by the Natural Science Foundation of Henan Province,No. 0311043700 and the Foundation for Young Mainstay Teachers inColleges and universities of Henan Province, No.100(2003) and theBuilding Foundation for 211 Key Fields during the 15th Five-yearPlan Period of Ministry of Education, No. 2(2002)Correspondence to: Kui-Sheng Chen, Department of Pathology,the First Affiliated Hospital, Zhengzhou University, Key Laboratoryof Henan Tumor Pathology, Zhengzhou 450052, Henan Province,China. [email protected]: +86-371-6912412 Fax: +86-371-6658175Received: 2005-02-17 Accepted: 2005-04-02
AbstractAbstractAbstractAbstractAbstract
AIM: To investigate the effects of anti-sense oligonucleotides(ASODNs) on mRNA expression of heparanase in humanesophageal cancer EC9706 cells.
METHODS: One non-sense oligonucleotide (N-ODN) andfive ASODNs against different heparanase mRNA siteswere transfected into EC9706 cells, then the expression ofheparanase mRNA in EC9706 cells was studied by in situ
hybridization.
RESULTS: The expression of heparanase mRNA couldbe inhibited by ASODNs.There was no significant differenceamong five ASODNs (P>0.05), but there was a significantdifference between ASODNs and N-ODN or non-transfectedgroup (ASODN1: 2.25±0.25, ASODN2: 2.21±0.23, ASODN3:2.23±0.23, ASODN4: 2.25±0.24 vs N-ODN: 3.47±2.80 ornon- transfected group: 3.51±2.93 respectively,P<0.05).
CONCLUSION: The expression of heparanase mRNA inEC9706 cells can be inhibited by ASODNs in vivo, andheparanase ASODNs can inhibit metastasis of esophagealsquamous cell carcinoma or other tumors by inhibitingthe expression of heparanase.
© 2005 The WJG Press and Elsevier Inc All rights reserved.
Key words: Esophageal cancer EC9706 cells ;Heparanase;Anti-sense oligonucleotides; In situ hybridization
Chen KS, Zhang L, Tang L, Zhang YH, Gao DL,Yan L, Zhang L.Expression of heparanase mRNA in anti-sense oligonucleotide-transfected human esophageal cancer EC9706 cells. World
J Gastroenterol 2005; 11(31): 4916-4917
http://www.wjgnet.com/1007-9327/11/4916.asp
INTRODUCTIONINTRODUCTIONINTRODUCTIONINTRODUCTIONINTRODUCTION
Heparanase (HPA) is closely associated with cell proliferation,differentiation, adhesion and exudation, and may play acrucial role not only in tumor development and progressionbut also in tumor invasion and metastasis[1] Studies indicatethat HPA is expressed in tumor tissues, such as liver carcinoma,ovarian adenocarcinoma, cervical squamous carcinoma,colonic adenocarcinoma, lymphoma, fibrosarcoma andmelanoma[1,2]. We detected the expression of HPA mRNAin anti-sense oligonucleotide (ASODN) transfected by in situ
hybridization, so as to provide the basic theory for esophagealcarcinoma target therapy by heparanase ASODN technique.
MAMAMAMAMATERIALS AND METHODSTERIALS AND METHODSTERIALS AND METHODSTERIALS AND METHODSTERIALS AND METHODS
MaterialsHuman esophageal carcinoma EC9706 cell line was providedby Chinese Academy of Medical Sciences HeparanaseASODNs1-4, N-ODN and biotin-labeled HPA cDNAprobe were synthesized by DaLian Bao Bio Co., Ltd.SA-Bio-AP and BCIP/NBT were purchased from PromegaCompany, USA RPMI-1640 was obtained from GibcoCompany, USA.
Cell cultureHuman esophageal carcinoma EC9706 cells (a adherentcell line) were cultured in RMPI-1640 and divided into sixgroups until formation of monolayer on the bottle wall. Groups1 to 4 were treated with 20 µmol/L ASDON1, ASDON2,ASDON3, ASDON4, respectively. Control group 1 wastreated with N-ODN at the same concentration. NeitherASDON nor N-ODN was added to control group 2. Allgroups were cultured for another 48 h, and then the cellswere harvested after trypsinization The cells were adjustedto a concentration of 106/mL and added to the preparedslides for hybridization.
In situ hybridizationThe samples were fixed in 40 g/L paraformaldehyde for30 min. After being washed in distilled water, samples werepre-treated with fresh 0.5% H2O2/formaldehyde to blockendogenous peroxidases for 30 min at room temperature.The samples were treated with 30 g/L proteinase k dilutedfreshly by citric acid for 10 min at 37 , pre-hybridized inpre-hybridized solution without probe for 4 h, and then foran additional 12 h at 42 . The final concentration of thelabeled heparanase probe was 1 µg/L. After hybridization,excess probes were removed through rinsing in 0.1×SSC at42 , and samples were treated with SA-Bio-AP for 10 min
PO Box 2345, Beijing 100023, China World J Gastroenterol 2005;11(31):4916-4917www.wjgnet.com World Journal of Gastroenterology ISSN [email protected] © 2005 The WJG Press and Elsevier Inc. All rights reserved.
at 37 , and rinsed again. Color reaction was performedwith new BCIP/NBT in dark for 2-4 h. The samples withoutprobe were used as negative control.
Result assessmentTen fields of each section were observed under oil microscopeand 100 cells of each field were counted. Scores wereobtained according to the staining intensity and count degreeof in situ hybridization [3].
Statistical analysisThe SPSS 10.0 statistical package was used for all analyses.Data were expressed as mean±SD, and analyzed by ANOVAP<0.05 was considered statistically significant.
RESULRESULRESULRESULRESULTSTSTSTSTS
Expression of heparanase mRNA in EC9706 cellsHeparanase mRNA (blue-purple granule) was located incytoplasm. There was no positive signal in the cell samplewithout probe (Figure 1).
Figure 1 Expression of heparanase mRNA in human esophageal cancerEC9706 cells. A: non- transfected group; B: ASODNs-transfected group; C:control group without probe.
Influence of ASODN on expression of heparanase mRNA inEC9706 cellsThe level of heparanase mRNA expression in ASODNs1-4-transfected EC9706 cells was 2.25±0.25, 2.21±0.23,2.23±0.23, 2.25±0.24, respectively There was a significantdifference between experimental group and control group1 (3.47±2.80, P<0.05). But there was no significant differencebetween control groups 1 and 2 (3.51±2.93). There was nosignificant difference in different ASODNs.
DISCUSSIONDISCUSSIONDISCUSSIONDISCUSSIONDISCUSSION
Heparanase is a kind of endoglycosidase. It can degrade haparansulfate glyoprotein, damage the basement membrane and
promote invasion and metastasis of tumors. It expresses intissues of spleen, lymph nodes, peripheral blood, bone marrowand infant liver, but not in tissues of heart, encephalon,lung, liver, kidney and pancreas of normal adults[1.4]. Studiesindicate that the level of heparanase expression in livercarcinoma, ovarian adenocarcinoma, colonic adenocarcinomaand melanoma is high[4.5]. Its activity correlates with themetastatic potential of mouse lymphoma, fibrosarcoma andmelanoma cells. The level of heparanase expression in tumorcells with high metastatic potential is higher than that intumor cells with little or no metastatic potential[6-9], suggestingthat heparanase gene expression is closely associated withmetastasis of tumors.
To explore new methods of inhibiting the metastasis oftumor we transfected human esophageal carcinoma EC9706cells with four heparanase anti-sense oligodeoxynucleotides(ASODNs1-4) and observed the effect of ASODN on theexpression of HPA gene in EC9706 cells. The results indicatethat heparanase can express in human esophageal carcinomaEC9706 cell line and the expression of heparanase mRNAin EC9706 cells were effectively depressed by transfectedASODNs1-4 suggesting that ASODNs may inhibit theinvasion and expression of heparanase gene. These resultsmay provide the basic theory for preventing the invasionand metastasis of esophageal carcinoma.
REFERENCESREFERENCESREFERENCESREFERENCESREFERENCES
1 Vlodavsky I, Friemann Y, Elkin M, Aingorn H, Atzmon R,Ishai-Michaeli R, Bitan M, Pappo O, Peretz T, Michal I, SpectorL, Pecker I. Mammalian heparanase: gene cloning, expressionand function in tumor progression and metastasis. Nat Med1999; 5: 793-802
2 Nakajima M, Irimura T, Di Ferrante D, Di Ferrante N,Nicolson GL. Heparan sulfate degradation: relation to tumorinvasion and metastatic propertyes of mouse B16 melanomasublines. Science 1983; 220: 611-613
3 Chen KS, Zheng NG, Wu JL, Ding Y, Wang YL. Effects of8-Br-cAMP on growth related gene expression of humanesophageal cancer cell line Eca-109. Jiepou Xuebao 1999;30 : 227-229
4 Vaday GG, Lider O. Extracellular matrix moietyes, cytokines,and enzymes: dynamic effects on immune cell behavior andinflammation. J Leukoe Biol 2000; 67: 149-159
5 Graham LD, Underwood PA. Comparison of the heparanaseenzymes from mouse melanoma cells, mouse macrophagesand human platelets. Biochem Mol Biol 1996; 39: 563-571
6 Miao HQ, Ornitz DM, Aingorn E, Ben-Sasson SA,VlodavskyI. Modulation of fibroblast growth factor-2 receptor binding,dimerization, signaling, and angiogenic activity by synthetichearinmimicling polyanionic comound. J Clin Invest 1997; 99:1565-1575
7 Vlodavsky I, fuks Z, Bar-Ner M, Ariav Y, Schirrmacher V.Lymphoma cell mediated degradation of sulfated proteoglycansinthe subendothelial extracellular matrix: relationship to tumorcell metastasis. Cancer Res 1983; 43: 2704-2711
8 Vlodavsky I, Elkin M, Pappo O, Aingorn H, Atzmon R,Ishai-Michaeli R, Aviv A, Pecker I, Friedmann Y. Mammalianheparanase as mediator of tumor metastasis and angiogenesis.Isr Med Assoc J 2000; 2(Suppl): 37-45
9 Walch ET, Marchetti D. Role of neurotrophins and neurotrophinsreceptors in the in vitro invasion and heparanase productionof human prostate cancer cells. Clin Exp Metastasis 1999; 17:307-314
Science Editor Wang XL and Guo SY Language Editor Elsevier HK
A
C
B
Chen KS et al. ASODNs effects on mRNA expression 4917
• BRIEF REPORTS •
Increased expression of cyclooxygenase-2 in first-degree relatives
of gastric cancer patients
Jin-Ting Zhang, Ming-Wei Wang, Zhen-Long Zhu, Xiao-Hui Huo, Jian-Kun Chu, Dong-Sheng Cui, Liang Qiao, Jun Yu
ELSEVIER
PO Box 2345, Beijing 100023, China World J Gastroenterol 2005;11(31):4918-4922www.wjgnet.com World Journal of Gastroenterology ISSN [email protected] © 2005 The WJG Press and Elsevier Inc. All rights reserved.
Jin-Ting Zhang, Ming-Wei Wang, Zhen-Long Zhu, Xiao-HuiHuo, Jian-Kun Chu, Dong-Sheng Cui, Jun Yu, Department ofMedicine, the First Affiliated Hospital of Hebei Medical University,Shijiazhuang 050017, Hebei Province, ChinaLiang Qiao, Jun Yu, Storr Liver Unit, Westmead MillenniumInstitute, University of Sydney at Westmead Hospital, NSW 2145,Sydney, AustraliaSupported by the National Natural Science Foundation of China,No. 30370637Co-first-authors: Jin-Ting Zhang and Ming-Wei WangCorrespondence to: Dr. Jun Yu, Storr Liver Unit, WestmeadMillennium Institute, University of Sydney at Westmead Hospital,NSW 2145, Sydney, Australia. [email protected]: +61-2-98459142 Fax: +61-2-98459103Received: 2005-01-04 Accepted: 2005-01-26
AbstractAbstractAbstractAbstractAbstract
AIM: To study the expression of cyclooxygenase-2 (COX-2)in human gastric cancer tissues and their paired adjacentmucosa, as well as mucosa from gastric antrum and corpusof the first-degree relatives of the recruited cancer patients.
METHODS: The expression of COX-2 mRNA in 38 patientswith gastric cancer and their 29 first-degree relatives and18 healthy controls was assessed by the real time RT-PCR.The expression of COX-2 protein was determined byWestern blot.
RESULTS: A marked increase in COX-2 mRNA expressionwas found in 20 of 37 (54%) cancerous tissues comparedto their respective paired normal mucosa (P<0.001).Interestingly, increased COX-2 mRNA expression was alsofound in mucosa of the corpus (6/29) and antrum (13/29)of their first-degree relatives. Increased COX-2 mRNAexpression was more frequently observed in the antrumbiopsies from cancer patients than in the antrum biopsiesfrom healthy controls (P<0.05). In addition, 3 of 23 (13%)patients with atrophic mucosa and 6 of 35 (17%) patientswith intestinal metaplasia showed increased COX-2 mRNAexpression. Furthermore, COX-2 expression increased inH pylori-positive tissues, especially in antrum mucosa.
CONCLUSION: Increased COX-2 expression is involvedin gastric carcinogenesis, and may be necessary formaintenance of the malignant phenotype and contributeto Helicobacter pylori-associated malignant transformation.
© 2005 The WJG Press and Elsevier Inc. All rights reserved.
Key words: Gastric cancer; First-degree relatives; COX-2;H pylori
Zhang JT, Wang MW, Zhu ZL, Huo XH, Chu JK, Cui DS, Qiao L,Yu J. Increased expression of cyclooxygenase-2 in first-degreerelatives of gastric cancer patients. World J Gastroenterol
2005; 11(31): 4918-4922
http://www.wjgnet.com/1007-9327/11/4918.asp
INTRODUCTIONINTRODUCTIONINTRODUCTIONINTRODUCTIONINTRODUCTION
Gastric cancer is one of the most common malignancies inChina and the most frequent cause of cancer-related death[1].Although its incidence is increasing, it is still the secondmost commonly diagnosed fatal cancer worldwide [2].Unfortunately, gastric tumors are usually diagnosed attheir advanced stage and the current 5-year survival rate isonly 17%. Development of gastric cancer, like many othermalignancies, is a multi-step process involving the accumulationof genetic alterations. However, much remains to be learnedabout the molecular pathogenesis of gastric cancer progressionand new molecular targets are needed for the preventionand treatment of gastric cancer, especially in its early stage.
Previous studies showed that about 10% of gastric cancerpatients exhibit familial clustering[3,4], and a high prevalenceof intestinal metaplasia has been found to be in the first-degree relatives of patients with gastric cancer in contrastto age-matched controls. Thus, the first-degree relatives areconsidered to be in pre-malignant state[5]. Therefore,identification of genes predisposing to familial cancer is anessential step towards understanding the molecular eventsunderlying tumorigenesis and is critical for the clinicalmanagement of affected families.
Prostaglandins play an important role in the protectionof the upper gastrointestinal tract mucosa against injuriousagents. Prostaglandin production in the gastro-duodenalmucosa is due to a single isoform of cyclooxygenase (COX)[6].Two COX isoforms, COX-1 and -2, have been identified[7].COX-1 is a housekeeping gene that is constantly expressedin a number of cell types, whereas COX-2 is an earlyresponsive gene that is rapidly induced by growth factors,tumor promoters, oncogenes, and carcinogens[8]. COX-2products have also been shown to be mutagenic[9] andtumorigenic[10]. Multiple lines of evidence suggest thatCOX-2 plays an important role in the malignant transformationof cells[11] including various cancer cells[12]. In contrast, levelsof COX-1 are relatively constant. Recently, the importanceof COX-2 in gastro-intestinal carcinogenesis has beenrecognized. In humans, COX-2 is frequently detected inthe majority of colon tumor samples and is involved inearly events of colon carcinogenesis[13,14]. Indeed, increasedCOX-2 expression has been observed in gastric carcinoma
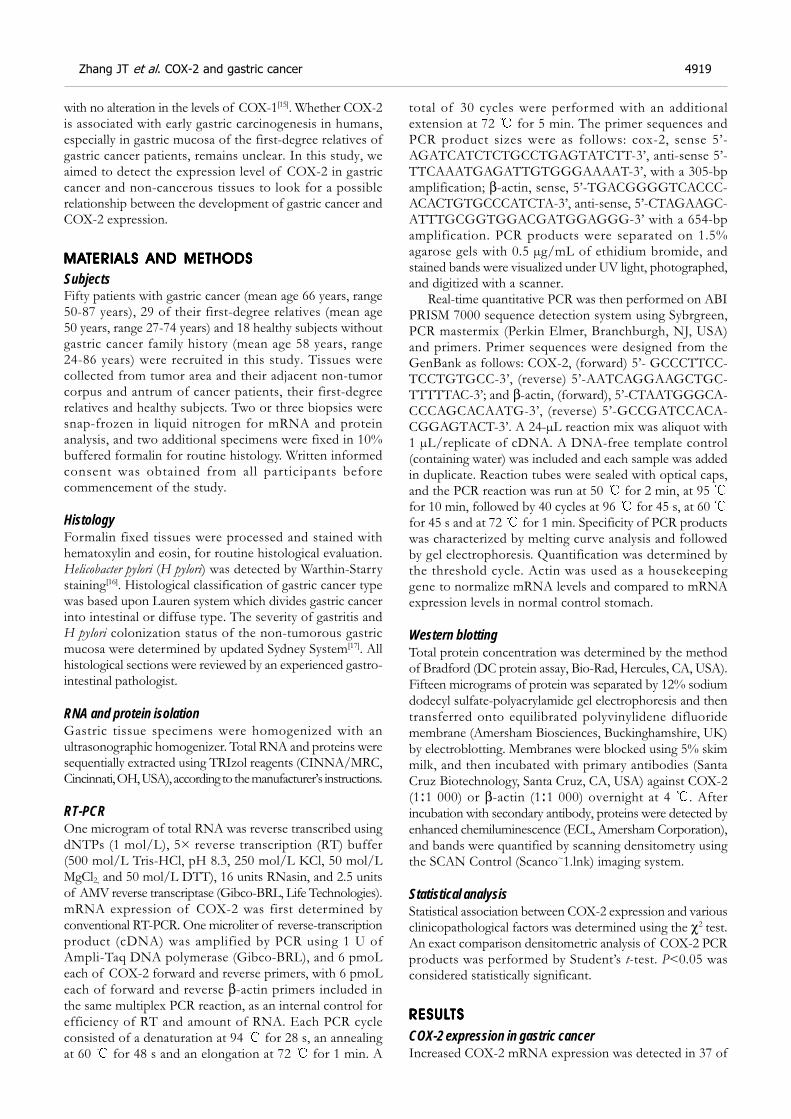
with no alteration in the levels of COX-1[15]. Whether COX-2is associated with early gastric carcinogenesis in humans,especially in gastric mucosa of the first-degree relatives ofgastric cancer patients, remains unclear. In this study, weaimed to detect the expression level of COX-2 in gastriccancer and non-cancerous tissues to look for a possiblerelationship between the development of gastric cancer andCOX-2 expression.
MAMAMAMAMATERIALS AND METHODSTERIALS AND METHODSTERIALS AND METHODSTERIALS AND METHODSTERIALS AND METHODS
SubjectsFifty patients with gastric cancer (mean age 66 years, range50-87 years), 29 of their first-degree relatives (mean age50 years, range 27-74 years) and 18 healthy subjects withoutgastric cancer family history (mean age 58 years, range24-86 years) were recruited in this study. Tissues werecollected from tumor area and their adjacent non-tumorcorpus and antrum of cancer patients, their first-degreerelatives and healthy subjects. Two or three biopsies weresnap-frozen in liquid nitrogen for mRNA and proteinanalysis, and two additional specimens were fixed in 10%buffered formalin for routine histology. Written informedconsent was obtained from all participants beforecommencement of the study.
HistologyFormalin fixed tissues were processed and stained withhematoxylin and eosin, for routine histological evaluation.Helicobacter pylori (H pylori) was detected by Warthin-Starrystaining[16]. Histological classification of gastric cancer typewas based upon Lauren system which divides gastric cancerinto intestinal or diffuse type. The severity of gastritis andH pylori colonization status of the non-tumorous gastricmucosa were determined by updated Sydney System[17]. Allhistological sections were reviewed by an experienced gastro-intestinal pathologist.
RNA and protein isolationGastric tissue specimens were homogenized with anultrasonographic homogenizer. Total RNA and proteins weresequentially extracted using TRIzol reagents (CINNA/MRC,Cincinnati, OH, USA), according to the manufacturer’s instructions.
RT-PCROne microgram of total RNA was reverse transcribed usingdNTPs (1 mol/L), 5× reverse transcription (RT) buffer(500 mol/L Tris-HCl, pH 8.3, 250 mol/L KCl, 50 mol/LMgCl2, and 50 mol/L DTT), 16 units RNasin, and 2.5 unitsof AMV reverse transcriptase (Gibco-BRL, Life Technologies).mRNA expression of COX-2 was first determined byconventional RT-PCR. One microliter of reverse-transcriptionproduct (cDNA) was amplified by PCR using 1 U ofAmpli-Taq DNA polymerase (Gibco-BRL), and 6 pmoLeach of COX-2 forward and reverse primers, with 6 pmoLeach of forward and reverse β-actin primers included inthe same multiplex PCR reaction, as an internal control forefficiency of RT and amount of RNA. Each PCR cycleconsisted of a denaturation at 94 for 28 s, an annealingat 60 for 48 s and an elongation at 72 for 1 min. A
total of 30 cycles were performed with an additionalextension at 72 for 5 min. The primer sequences andPCR product sizes were as follows: cox-2, sense 5’-AGATCATCTCTGCCTGAGTATCTT-3’, anti-sense 5’-TTCAAATGAGATTGTGGGAAAAT-3’, with a 305-bpamplification; β-actin, sense, 5’-TGACGGGGTCACCC-ACACTGTGCCCATCTA-3’, anti-sense, 5’-CTAGAAGC-ATTTGCGGTGGACGATGGAGGG-3’ with a 654-bpamplification. PCR products were separated on 1.5%agarose gels with 0.5 µg/mL of ethidium bromide, andstained bands were visualized under UV light, photographed,and digitized with a scanner.
Real-time quantitative PCR was then performed on ABIPRISM 7000 sequence detection system using Sybrgreen,PCR mastermix (Perkin Elmer, Branchburgh, NJ, USA)and primers. Primer sequences were designed from theGenBank as follows: COX-2, (forward) 5’- GCCCTTCC-TCCTGTGCC-3’, (reverse) 5’-AATCAGGAAGCTGC-TTTTTAC-3’; and β-actin, (forward), 5’-CTAATGGGCA-CCCAGCACAATG-3’, (reverse) 5’-GCCGATCCACA-CGGAGTACT-3’. A 24-µL reaction mix was aliquot with1 µL/replicate of cDNA. A DNA-free template control(containing water) was included and each sample was addedin duplicate. Reaction tubes were sealed with optical caps,and the PCR reaction was run at 50 for 2 min, at 95 for 10 min, followed by 40 cycles at 96 for 45 s, at 60 for 45 s and at 72 for 1 min. Specificity of PCR productswas characterized by melting curve analysis and followedby gel electrophoresis. Quantification was determined bythe threshold cycle. Actin was used as a housekeepinggene to normalize mRNA levels and compared to mRNAexpression levels in normal control stomach.
Western blottingTotal protein concentration was determined by the methodof Bradford (DC protein assay, Bio-Rad, Hercules, CA, USA).Fifteen micrograms of protein was separated by 12% sodiumdodecyl sulfate-polyacrylamide gel electrophoresis and thentransferred onto equilibrated polyvinylidene difluoridemembrane (Amersham Biosciences, Buckinghamshire, UK)by electroblotting. Membranes were blocked using 5% skimmilk, and then incubated with primary antibodies (SantaCruz Biotechnology, Santa Cruz, CA, USA) against COX-2(1:1 000) or β-actin (1:1 000) overnight at 4 . Afterincubation with secondary antibody, proteins were detected byenhanced chemiluminescence (ECL, Amersham Corporation),and bands were quantified by scanning densitometry usingthe SCAN Control (Scanco~1.lnk) imaging system.
Statistical analysisStatistical association between COX-2 expression and variousclinicopathological factors was determined using the χ2 test.An exact comparison densitometric analysis of COX-2 PCRproducts was performed by Student’s t-test. P<0.05 wasconsidered statistically significant.
RESULRESULRESULRESULRESULTSTSTSTSTS
COX-2 expression in gastric cancerIncreased COX-2 mRNA expression was detected in 37 of
Zhang JT et al. COX-2 and gastric cancer 4919
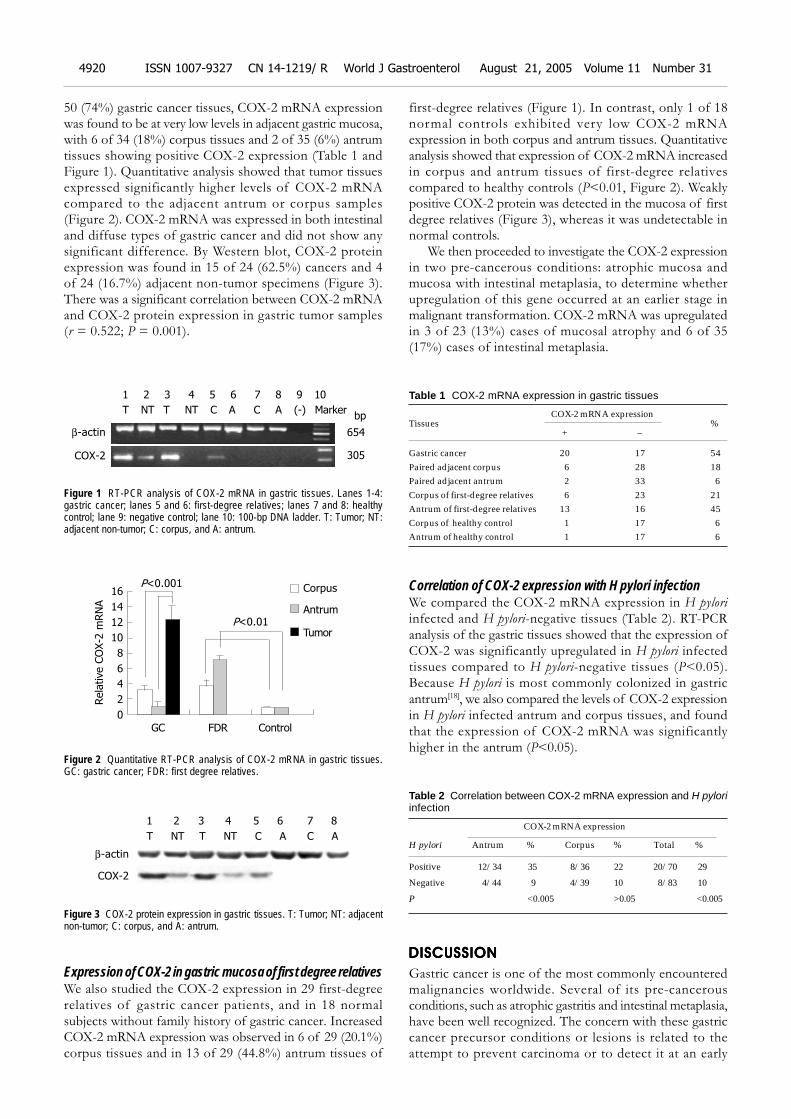
50 (74%) gastric cancer tissues, COX-2 mRNA expressionwas found to be at very low levels in adjacent gastric mucosa,with 6 of 34 (18%) corpus tissues and 2 of 35 (6%) antrumtissues showing positive COX-2 expression (Table 1 andFigure 1). Quantitative analysis showed that tumor tissuesexpressed significantly higher levels of COX-2 mRNAcompared to the adjacent antrum or corpus samples(Figure 2). COX-2 mRNA was expressed in both intestinaland diffuse types of gastric cancer and did not show anysignificant difference. By Western blot, COX-2 proteinexpression was found in 15 of 24 (62.5%) cancers and 4of 24 (16.7%) adjacent non-tumor specimens (Figure 3).There was a significant correlation between COX-2 mRNAand COX-2 protein expression in gastric tumor samples(r = 0.522; P = 0.001).
Figure 1 RT-PCR analysis of COX-2 mRNA in gastric tissues. Lanes 1-4:gastric cancer; lanes 5 and 6: first-degree relatives; lanes 7 and 8: healthycontrol; lane 9: negative control; lane 10: 100-bp DNA ladder. T: Tumor; NT:adjacent non-tumor; C: corpus, and A: antrum.
Figure 2 Quantitative RT-PCR analysis of COX-2 mRNA in gastric tissues.GC: gastric cancer; FDR: first degree relatives.
Figure 3 COX-2 protein expression in gastric tissues. T: Tumor; NT: adjacentnon-tumor; C: corpus, and A: antrum.
Expression of COX-2 in gastric mucosa of first degree relativesWe also studied the COX-2 expression in 29 first-degreerelatives of gastric cancer patients, and in 18 normalsubjects without family history of gastric cancer. IncreasedCOX-2 mRNA expression was observed in 6 of 29 (20.1%)corpus tissues and in 13 of 29 (44.8%) antrum tissues of
first-degree relatives (Figure 1). In contrast, only 1 of 18normal controls exhibited very low COX-2 mRNAexpression in both corpus and antrum tissues. Quantitativeanalysis showed that expression of COX-2 mRNA increasedin corpus and antrum tissues of first-degree relativescompared to healthy controls (P<0.01, Figure 2). Weaklypositive COX-2 protein was detected in the mucosa of firstdegree relatives (Figure 3), whereas it was undetectable innormal controls.
We then proceeded to investigate the COX-2 expressionin two pre-cancerous conditions: atrophic mucosa andmucosa with intestinal metaplasia, to determine whetherupregulation of this gene occurred at an earlier stage inmalignant transformation. COX-2 mRNA was upregulatedin 3 of 23 (13%) cases of mucosal atrophy and 6 of 35(17%) cases of intestinal metaplasia.
Table 1 COX-2 mRNA expression in gastric tissues
COX-2 mRNA expressionTissues %
+ –
Gastric cancer 20 17 54Paired adjacent corpus 6 28 18Paired adjacent antrum 2 33 6Corpus of first-degree relatives 6 23 21Antrum of first-degree relatives 13 16 45Corpus of healthy control 1 17 6Antrum of healthy control 1 17 6
Correlation of COX-2 expression with H pylori infectionWe compared the COX-2 mRNA expression in H pylori
infected and H pylori-negative tissues (Table 2). RT-PCRanalysis of the gastric tissues showed that the expression ofCOX-2 was significantly upregulated in H pylori infectedtissues compared to H pylori-negative tissues (P<0.05).Because H pylori is most commonly colonized in gastricantrum[18], we also compared the levels of COX-2 expressionin H pylori infected antrum and corpus tissues, and foundthat the expression of COX-2 mRNA was significantlyhigher in the antrum (P<0.05).
Table 2 Correlation between COX-2 mRNA expression and H pyloriinfection
COX-2 mRNA expression
H pylori Antrum % Corpus % Total %
Positive 12/34 35 8/36 22 20/70 29
Negative 4/44 9 4/39 10 8/83 10
P <0.005 >0.05 <0.005
DISCUSSIONDISCUSSIONDISCUSSIONDISCUSSIONDISCUSSION
Gastric cancer is one of the most commonly encounteredmalignancies worldwide. Several of its pre-cancerousconditions, such as atrophic gastritis and intestinal metaplasia,have been well recognized. The concern with these gastriccancer precursor conditions or lesions is related to theattempt to prevent carcinoma or to detect it at an early
β-actin
1 2 3 4 5 6 7 8 9 10
T NT T NT C A C A (-) Marker
COX-2
654
bp
305
Rela
tive C
OX-2
mRN
A
GC FDR Control
16
14
12
10
8
6
4
2
0
Corpus
Antrum
TumorP<0.01
P<0.001
β-actin
1 2 3 4 5 6 7 8
T NT T NT C A C A
COX-2
4920 ISSN 1007-9327 CN 14-1219/ R World J Gastroenterol August 21, 2005 Volume 11 Number 31
stage. Atrophic gastritis is defined as the loss of gastric glands,which can occur either in antrum or in corpus. Increasedprevalence of this type of gastritis has been found in subjectswho are at high risk for gastric cancer[19]. Intestinal metaplasiais defined as the replacement of gastric mucosa by glandsthat have the characteristics of the small intestine[20], andthis condition has been strongly associated with developmentof gastric cancer. Atrophic gastritis and intestinal metaplasiahave been accepted as pre-cancerous conditions for someyears. Generalized genetic instability has been shown to occurearly in this process[21,22]. In contrast, the relative contributionsof inherited susceptibility and environmental effects tofamilial gastric cancer are poorly understood, because littleis known about the genetic events that predispose to gastriccancer. The first-degree relatives of gastric cancer patientshave a three-fold risk for developing gastric carcinoma[3,9].Therefore, the identification of genes predisposing to familialcancer is an essential step towards understanding themolecular events underlying tumorigenesis and critical forthe clinical management of affected families.
In our study, COX-2 gene expression was undetectablein normal control gastric mucosa. In the majority ofgastric carcinomas studied, COX-2 expression was clearlyupregulated compared to the levels of expression inaccompanying antrum and corpus mucosa devoid of cancercells. A similar pattern of COX-2 mRNA expression haspreviously been found in human gastric carcinoma[23]. Moreimportantly in this study, upregulation of COX-2 mRNAand protein was found in first-degree relatives. Furthermore,we detected COX-2 expression in atrophic mucosa and inintestinal metaplasia. These results suggest that COX-2overexpression constitutes an early event in the gastricneoplastic transformation process which occurs at thepre-cancerous stage. Similarly, expression of COX-2 is foundin some non-malignant hyperplastic gastric glands that mayrepresent pre-malignant lesions stained for the COX-2protein[23]. Expression of COX-2 is also found in ratepidermis during hyperplastic transformation[24]. In addition,colonic epithelium expresses only low levels of COX-2mRNA and elevated levels are found in more than 40% ofpre-malignant colonic adenomas. COX-2 expression isdetected in hyperplastic bronchial epithelium and atypicalalveolar epithelium in lung specimens[25]. COX-2 is involvedin Barrett’s-associated metaplastic and dysplastic specimens[17].All these findings strongly suggest that COX-2 may play arole in early carcinogenesis.
H pylori has been epidemiologically linked to gastriccancer and classified as a class I carcinogen by the WorldHealth Organization[26]. In the present study, expression ofCOX-2 mRNA was upregulated in gastric mucosa fromH pylori-positive tissues compared to H pylori-negative tissues,suggesting that induction of COX-2 may be a specificresponse to H pylori infection. COX-2 mRNA expressionwas significantly correlated with H pylori infected antrumtissues, but not with H pylori infected corpus tissues. A moreimportant factor may be the consistent finding that H pylori
infection density is greater in gastric antrum than incorpus[27,28]. Therefore, the overexpression of COX-2 maybe a direct effect of H pylori.
In conclusion, gastric cancer and pre-cancerous lesions
express COX-2. COX-2 mRNA is detectable in gastricmucosa of first-degree relatives of cancer patients. COX-2may contribute to H pylori associated neoplastic transformation.Further investigation is necessary to determine the putativerole of this gene in gastric carcinogenesis.
REFERENCESREFERENCESREFERENCESREFERENCESREFERENCES
1 Parkin DM, Laara E, Muir CS. Estimates of the worldwidefrequency of sixteen major cancers in 1980. Int J Cancer 1988;41: 184-197
2 Dixon MF. Histological responses to Helicobacter pyloriinfection: gastritis, atrophy and preneoplasia. Baillieres ClinGastroenterol 1995; 9: 467-486
3 Zanghieri G, Di Gregorio C, Sacchetti C, Fante R, SassatelliR, Cannizzo G, Carriero A, Ponz de Leon M. Familial occur-rence of gastric cancer in the 2-year experience of a popula-tion-based registry. Cancer 1990; 66: 2047-2051
4 La Vecchia C, Negri E, Franceschi S, Gentile A. Family his-tory and the risk of stomach and colorectal cancer. Cancer1992; 70: 50-55
5 Sipponen P, Seppala K, Varis K, Hjelt L, Ihamaki T, KekkiM, Siurala M. Intestinal metaplasia with colonic-typesulphomucins in the gastric mucosa; its association with gas-tric carcinoma. Acta Pathol Microbiol Scand 1980; 88: 217-224
6 Scheiman JM. NSAIDs, gastrointestinal injury, andcytoprotection. Gastroenterol Clin North Am 1996; 25: 279-298
7 Hla T, Neilson K. Human cyclooxygenase-2 cDNA. Proc NatlAcad Sci USA 1992; 89: 7384-7388
8 Herschman HR. Prostaglandin synthase 2. Biochim BiophysActa 1996; 1299: 125-140
9 Plummer SM, Hall M, Faux SP. Oxidation and genotoxicityof fecapentaene-12 are potentiated by prostaglandin Hsynthase. Carcinogenesis 1995; 16: 1023-1028
10 Boolbol SK, Dannenberg AJ, Chadburn A, Martucci C, GuoXJ, Ramonetti JT, Abreu-Goris M, Newmark HL, Lipkin ML,De Cosse JJ, Bertagnolli MM. Cyclooxygenase-2 overexpressionand tumor formation are blocked by sulindac in a murinemodel of familial adenomatous polyposis. Cancer Res 1996;56: 2556-2560
11 Subbaramaiah K, Telang N, Ramonetti JT, Araki R, De VitoB, Weksler BB, Dannenberg AJ. Transcription of cyclooxygenase-2 is enhanced in transformed mammary epithelial cells. Can-cer Res 1996; 56: 4424-4429
12 Tucker ON, Dannenberg AJ, Yang EK, Zhang F, Teng L, DalyJM, Soslow RA, Masferrer JL, Woerner BM, Koki AT, Fahey TJ3rd. Cyclooxygenase-2 expression is up-regulated in humanpancreatic cancer. Cancer Res 1999; 59: 987-990
13 Eberhart CE, Coffey RJ, Radhika A, Giardiello FM, FerrenbachS, DuBois RN. Up-regulation of cyclooxygenase 2 gene ex-pression in human colorectal adenomas and adenocarcinomas.Gastroenterology 1994; 107: 1183-1188
14 Oshima M, Dinchuk JE, Kargman SL, Oshima H, Hancock B,Kwong E, Trzaskos JM, Evans JF, Taketo MM. Suppressionof intestinal polyposis in Apc delta716 knockout mice byinhibition of cyclooxygenase 2 (COX-2). Cell 1996; 87: 803-809
15 Soydan AS, Gaffen JD, Weech PK, Tremblay NM, KargmanS, O’Neill G, Bennett A, Tavares IA. Cytosolic phospholipaseA2, cyclo-oxygenases and arachidonate in human stomachtumours. Eur J Cancer 1997; 33: 1508-1512
16 Brown KE, Peura DA. Diagnosis of Helicobacter pylori infection.Gastroenterol Clin North Am 1993; 22: 105-115
17 Dixon MF, Genta RM, Yardley JH, Correa P. Classificationand grading of gastritis: the updated Sydney System. Am JSurg Pathol 1996; 20: 1161-1181
18 Peng HB, Rajavashisth TB, Libby P, Liao JK. Nitric oxideinhibits macrophage-colony stimulating factor gene transcrip-tion in vascular endothelial cells. J Biol Chem 1995; 270: 17050-17055
19 Nomura A, Stemmermann GN. Helicobacter pylori and gastriccancer. J Gastroenterol Hepatol 1993; 8: 294-303
Zhang JT et al. COX-2 and gastric cancer 4921
20 Stemmermann GN, Ishidate T, Samloff IM, Masuda H,Walsh JH, Nomura A, Yamakawa H, Glober G. Intestinalmetplasia of the stomach in Hawaii and Japan. A study of itsrelation to serum pepsinogen I, gastrin, and parietal cellantibodies. Am J Dig Dis 1978; 23: 815-820
21 Yu J, Miehlke S, Ebert MP, Hoffmann J, Breidert M, Alpen B,Starzynska T, Stolte Prof M, Malfertheiner P, BayerdorfferE. Frequency of TPR-MET rearrangement in patients withgastric carcinoma and in first-degree relatives. Cancer 2000;88: 1801-1806
22 Yu J, Ebert MP, Miehlke S, Rost H, Lendeckel U, LeodolterA, Stolte M, Bayerdorffer E, Malfertheiner P. alpha-cateninexpression is decreased in human gastric cancers and inthe gastric mucosa of first degree relatives. Gut 2000; 46:639-644
23 Murata H, Kawano S, Tsuji S, Tsuji M, Sawaoka H, KimuraY, Shiozaki H, Hori M. Cyclooxygenase-2 overexpression en-hances lymphatic invasion and metastasis in human gastriccarcinoma. Am J Gastroenterol 1999; 94: 451-455
24 Wolff H, Saukkonen K, Anttila S, Karjalainen A, Vainio H,Ristimaki A. Expression of cyclooxygenase-2 in human lungcarcinoma. Cancer Res 1998; 58: 4997-5001
25 Wilson KT, Fu S, Ramanujam KS, Meltzer SJ. Increased ex-pression of inducible nitric oxide synthase and cyclooxygenase-2 in Barrett’s esophagus and associated adenocarcinomas.Cancer Res 1998; 58: 2929-2934
26 Parsonnet J, Friedman GD, Vandersteen DP, Chang Y,Vogelman JH, Orentreich N, Sibley RK. Helicobacter pylori in-fection and the risk of gastric carcinoma. N Engl J Med 1991;325: 1127-1131
27 Khulusi S, Mendall MA, Patel P, Levy J, Badve S, NorthfieldTC. Helicobacter pylori infection density and gastric inflamma-tion in duodenal ulcer and non-ulcer subjects. Gut 1995; 37:319-324
28 Genta RM, Graham DY. Comparison of biopsy sites for thehistopathologic diagnosis of Helicobacter pylori: a topographicstudy of H pylori density and distribution. Gastrointest Endosc1994; 40: 342-345
Science Editor Wang XL and Guo SY Language Editor Elsevier HK
4922 ISSN 1007-9327 CN 14-1219/ R World J Gastroenterol August 21, 2005 Volume 11 Number 31
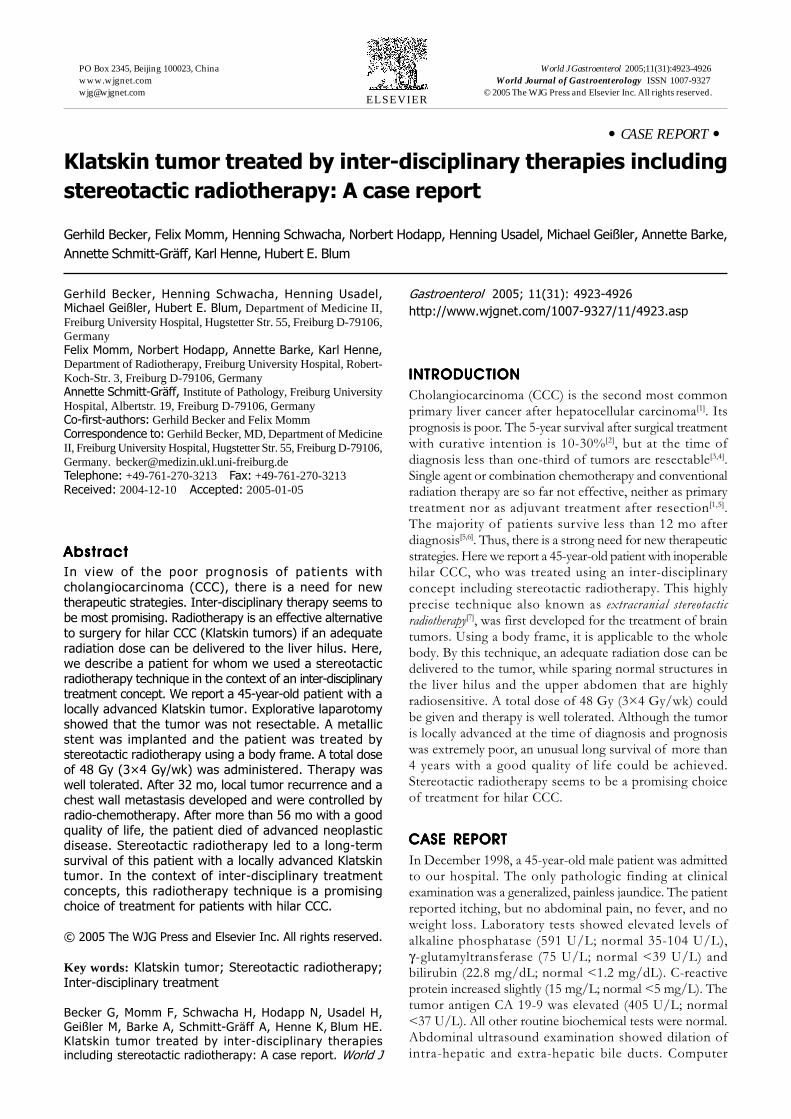
• CASE REPORT •
Klatskin tumor treated by inter-disciplinary therapies including
stereotactic radiotherapy: A case report
Gerhild Becker, Felix Momm, Henning Schwacha, Norbert Hodapp, Henning Usadel, Michael Geißler, Annette Barke,
Annette Schmitt-Gräff, Karl Henne, Hubert E. Blum
ELSEVIER
PO Box 2345, Beijing 100023, China World J Gastroenterol 2005;11(31):4923-4926www.wjgnet.com World Journal of Gastroenterology ISSN [email protected] © 2005 The WJG Press and Elsevier Inc. All rights reserved.
Gerhild Becker, Henning Schwacha, Henning Usadel,Michael Geißler, Hubert E. Blum, Department of Medicine II,Freiburg University Hospital, Hugstetter Str. 55, Freiburg D-79106,GermanyFelix Momm, Norbert Hodapp, Annette Barke, Karl Henne,Department of Radiotherapy, Freiburg University Hospital, Robert-Koch-Str. 3, Freiburg D-79106, GermanyAnnette Schmitt-Gräff, Institute of Pathology, Freiburg UniversityHospital, Albertstr. 19, Freiburg D-79106, GermanyCo-first-authors: Gerhild Becker and Felix MommCorrespondence to: Gerhild Becker, MD, Department of MedicineII, Freiburg University Hospital, Hugstetter Str. 55, Freiburg D-79106,Germany. [email protected]: +49-761-270-3213 Fax: +49-761-270-3213Received: 2004-12-10 Accepted: 2005-01-05
AbstractAbstractAbstractAbstractAbstract
In view of the poor prognosis of patients withcholangiocarcinoma (CCC), there is a need for newtherapeutic strategies. Inter-disciplinary therapy seems tobe most promising. Radiotherapy is an effective alternativeto surgery for hilar CCC (Klatskin tumors) if an adequateradiation dose can be delivered to the liver hilus. Here,we describe a patient for whom we used a stereotacticradiotherapy technique in the context of an inter-disciplinarytreatment concept. We report a 45-year-old patient with alocally advanced Klatskin tumor. Explorative laparotomyshowed that the tumor was not resectable. A metallicstent was implanted and the patient was treated bystereotactic radiotherapy using a body frame. A total doseof 48 Gy (3×4 Gy/wk) was administered. Therapy waswell tolerated. After 32 mo, local tumor recurrence and achest wall metastasis developed and were controlled byradio-chemotherapy. After more than 56 mo with a goodquality of life, the patient died of advanced neoplasticdisease. Stereotactic radiotherapy led to a long-termsurvival of this patient with a locally advanced Klatskintumor. In the context of inter-disciplinary treatmentconcepts, this radiotherapy technique is a promisingchoice of treatment for patients with hilar CCC.
© 2005 The WJG Press and Elsevier Inc. All rights reserved.
Key words: Klatskin tumor; Stereotactic radiotherapy;Inter-disciplinary treatment
Becker G, Momm F, Schwacha H, Hodapp N, Usadel H,Geißler M, Barke A, Schmitt-Gräff A, Henne K, Blum HE.Klatskin tumor treated by inter-disciplinary therapiesincluding stereotactic radiotherapy: A case report. World J
Gastroenterol 2005; 11(31): 4923-4926
http://www.wjgnet.com/1007-9327/11/4923.asp
INTRODUCTIONINTRODUCTIONINTRODUCTIONINTRODUCTIONINTRODUCTION
Cholangiocarcinoma (CCC) is the second most commonprimary liver cancer after hepatocellular carcinoma[1]. Itsprognosis is poor. The 5-year survival after surgical treatmentwith curative intention is 10-30%[2], but at the time ofdiagnosis less than one-third of tumors are resectable[3,4].Single agent or combination chemotherapy and conventionalradiation therapy are so far not effective, neither as primarytreatment nor as adjuvant treatment after resection[1,5].The majority of patients survive less than 12 mo afterdiagnosis[5,6]. Thus, there is a strong need for new therapeuticstrategies. Here we report a 45-year-old patient with inoperablehilar CCC, who was treated using an inter-disciplinaryconcept including stereotactic radiotherapy. This highlyprecise technique also known as extracranial stereotactic
radiotherapy[7], was first developed for the treatment of braintumors. Using a body frame, it is applicable to the wholebody. By this technique, an adequate radiation dose can bedelivered to the tumor, while sparing normal structures inthe liver hilus and the upper abdomen that are highlyradiosensitive. A total dose of 48 Gy (3×4 Gy/wk) couldbe given and therapy is well tolerated. Although the tumoris locally advanced at the time of diagnosis and prognosiswas extremely poor, an unusual long survival of more than4 years with a good quality of life could be achieved.Stereotactic radiotherapy seems to be a promising choiceof treatment for hilar CCC.
CASE REPORTCASE REPORTCASE REPORTCASE REPORTCASE REPORT
In December 1998, a 45-year-old male patient was admittedto our hospital. The only pathologic finding at clinicalexamination was a generalized, painless jaundice. The patientreported itching, but no abdominal pain, no fever, and noweight loss. Laboratory tests showed elevated levels ofalkaline phosphatase (591 U/L; normal 35-104 U/L),γ-glutamyltransferase (75 U/L; normal <39 U/L) andbilirubin (22.8 mg/dL; normal <1.2 mg/dL). C-reactiveprotein increased slightly (15 mg/L; normal <5 mg/L). Thetumor antigen CA 19-9 was elevated (405 U/L; normal<37 U/L). All other routine biochemical tests were normal.Abdominal ultrasound examination showed dilation ofintra-hepatic and extra-hepatic bile ducts. Computer
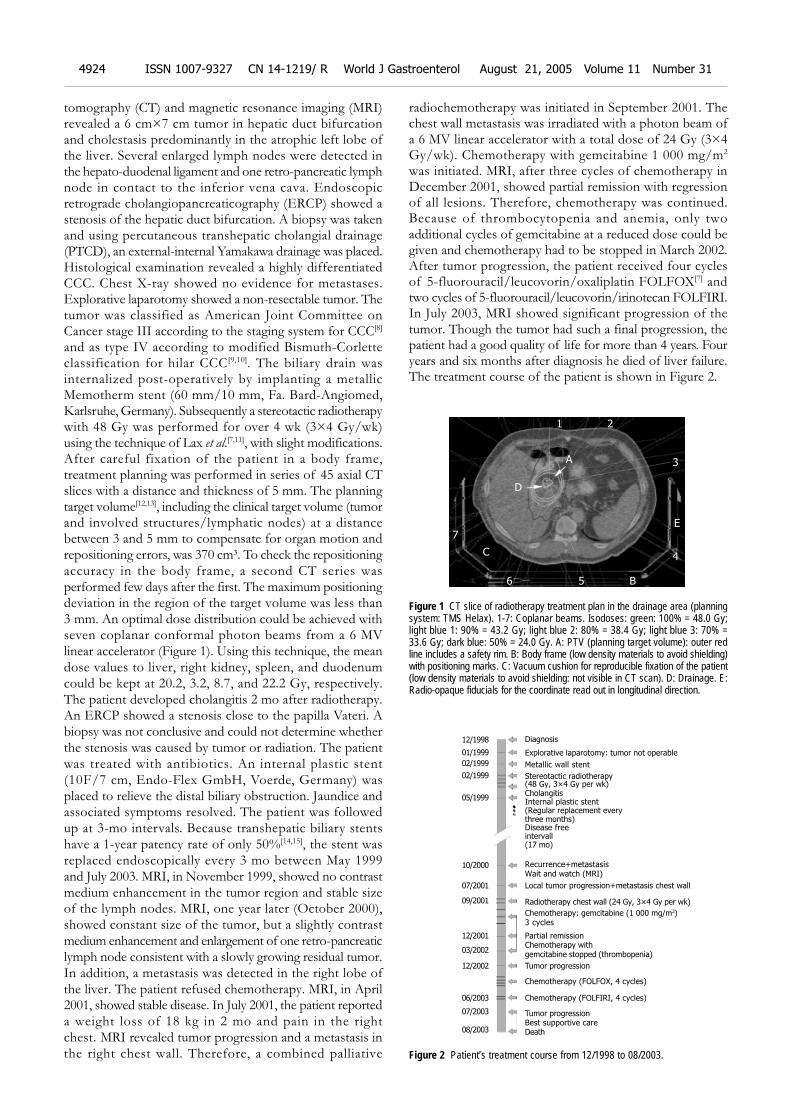
4924 ISSN 1007-9327 CN 14-1219/ R World J Gastroenterol August 21, 2005 Volume 11 Number 31
tomography (CT) and magnetic resonance imaging (MRI)revealed a 6 cm×7 cm tumor in hepatic duct bifurcationand cholestasis predominantly in the atrophic left lobe ofthe liver. Several enlarged lymph nodes were detected inthe hepato-duodenal ligament and one retro-pancreatic lymphnode in contact to the inferior vena cava. Endoscopicretrograde cholangiopancreaticography (ERCP) showed astenosis of the hepatic duct bifurcation. A biopsy was takenand using percutaneous transhepatic cholangial drainage(PTCD), an external-internal Yamakawa drainage was placed.Histological examination revealed a highly differentiatedCCC. Chest X-ray showed no evidence for metastases.Explorative laparotomy showed a non-resectable tumor. Thetumor was classified as American Joint Committee onCancer stage III according to the staging system for CCC[8]
and as type IV according to modified Bismuth-Corletteclassification for hilar CCC[9,10]. The biliary drain wasinternalized post-operatively by implanting a metallicMemotherm stent (60 mm/10 mm, Fa. Bard-Angiomed,Karlsruhe, Germany). Subsequently a stereotactic radiotherapywith 48 Gy was performed for over 4 wk (3×4 Gy/wk)using the technique of Lax et al.[7,11], with slight modifications.After careful fixation of the patient in a body frame,treatment planning was performed in series of 45 axial CTslices with a distance and thickness of 5 mm. The planningtarget volume[12,13], including the clinical target volume (tumorand involved structures/lymphatic nodes) at a distancebetween 3 and 5 mm to compensate for organ motion andrepositioning errors, was 370 cm³. To check the repositioningaccuracy in the body frame, a second CT series wasperformed few days after the first. The maximum positioningdeviation in the region of the target volume was less than3 mm. An optimal dose distribution could be achieved withseven coplanar conformal photon beams from a 6 MVlinear accelerator (Figure 1). Using this technique, the meandose values to liver, right kidney, spleen, and duodenumcould be kept at 20.2, 3.2, 8.7, and 22.2 Gy, respectively.The patient developed cholangitis 2 mo after radiotherapy.An ERCP showed a stenosis close to the papilla Vateri. Abiopsy was not conclusive and could not determine whetherthe stenosis was caused by tumor or radiation. The patientwas treated with antibiotics. An internal plastic stent(10F/7 cm, Endo-Flex GmbH, Voerde, Germany) wasplaced to relieve the distal biliary obstruction. Jaundice andassociated symptoms resolved. The patient was followedup at 3-mo intervals. Because transhepatic biliary stentshave a 1-year patency rate of only 50%[14,15], the stent wasreplaced endoscopically every 3 mo between May 1999and July 2003. MRI, in November 1999, showed no contrastmedium enhancement in the tumor region and stable sizeof the lymph nodes. MRI, one year later (October 2000),showed constant size of the tumor, but a slightly contrastmedium enhancement and enlargement of one retro-pancreaticlymph node consistent with a slowly growing residual tumor.In addition, a metastasis was detected in the right lobe ofthe liver. The patient refused chemotherapy. MRI, in April2001, showed stable disease. In July 2001, the patient reporteda weight loss of 18 kg in 2 mo and pain in the rightchest. MRI revealed tumor progression and a metastasis inthe right chest wall. Therefore, a combined palliative
radiochemotherapy was initiated in September 2001. Thechest wall metastasis was irradiated with a photon beam ofa 6 MV linear accelerator with a total dose of 24 Gy (3×4Gy/wk). Chemotherapy with gemcitabine 1 000 mg/m2
was initiated. MRI, after three cycles of chemotherapy inDecember 2001, showed partial remission with regressionof all lesions. Therefore, chemotherapy was continued.Because of thrombocytopenia and anemia, only twoadditional cycles of gemcitabine at a reduced dose could begiven and chemotherapy had to be stopped in March 2002.After tumor progression, the patient received four cyclesof 5-fluorouracil/leucovorin/oxaliplatin FOLFOX[7] andtwo cycles of 5-fluorouracil/leucovorin/irinotecan FOLFIRI.In July 2003, MRI showed significant progression of thetumor. Though the tumor had such a final progression, thepatient had a good quality of life for more than 4 years. Fouryears and six months after diagnosis he died of liver failure.The treatment course of the patient is shown in Figure 2.
Figure 1 CT slice of radiotherapy treatment plan in the drainage area (planningsystem: TMS Helax). 1-7: Coplanar beams. Isodoses: green: 100% = 48.0 Gy;light blue 1: 90% = 43.2 Gy; light blue 2: 80% = 38.4 Gy; light blue 3: 70% =33.6 Gy; dark blue: 50% = 24.0 Gy. A: PTV (planning target volume): outer redline includes a safety rim. B: Body frame (low density materials to avoid shielding)with positioning marks. C: Vacuum cushion for reproducible fixation of the patient(low density materials to avoid shielding: not visible in CT scan). D: Drainage. E:Radio-opaque fiducials for the coordinate read out in longitudinal direction.
Figure 2 Patient’s treatment course from 12/1998 to 08/2003.
Diagnosis
Explorative laparotomy: tumor not operable
Metallic wall stent
Stereotactic radiotherapy(48 Gy, 3×4 Gy per wk)CholangitisInternal plastic stent(Regular replacement everythree months)Disease freeintervall(17 mo)
Recurrence+metastasisWait and watch (MRI)
Local tumor progression+metastasis chest wall
Radiotherapy chest wall (24 Gy, 3×4 Gy per wk)
Chemotherapy: gemcitabine (1 000 mg/m2)3 cycles
Partial remissionChemotherapy withgemcitabine stopped (thrombopenia)
Chemotherapy (FOLFOX, 4 cycles)
Chemotherapy (FOLFIRI, 4 cycles)
Tumor progressionBest supportive careDeath
12/1998
01/1999
02/1999
02/1999
05/1999
10/2000
07/2001
09/2001
12/2001
03/2002
12/2002
06/2003
07/2003
08/2003
1 2
A
D
C
B6 5
7
3
4
E
Tumor progression
Becker G et al. Stereotactic radiotherapy of Klatskin tumor 4925
DISCUSSIONDISCUSSIONDISCUSSIONDISCUSSIONDISCUSSION
Patients with CCC have an extremely poor prognosis.Because of the high recurrence rate of CCC, there is noindication for liver transplantation[14,16,17]. Thus, surgicalresection remains the only potentially curative treatmentwith a 5-year survival rate of 0-22% (mean 14%) for hilarCCC and 0-39% (mean 25%) for distal CCC[18]. At the timeof diagnosis, however, resection is possible in less thana third of the patients[3]. If the tumor is unresectable,therapeutic interventions are directed toward the relief ofbiliary obstruction and its associated symptoms. Palliativeoptions include ERC, PTCD, or a bilio-digestive anastomosis.Endoscopic biliary drainage with self-expandable metal stentshas become the favored palliative drainage procedure andcan be successfully performed on most patients with hilarCCC[5]. Metallic wall stents are preferred over plastic stentsbecause of their longer patency[19-21]. In a small number ofpatients with unresectable CCC and failed endoscopic stents,photodynamic therapy (PDT) has been used. This techniqueinvolves the intravenous application of a photosensitizerfollowed by intra-luminal cholangioscopic photoactivationand generation of oxygen free radicals that harm cancercells preferentially. Therapy decreases bilirubin levels andleads to a slightly better survival rate[22,23]. It was reportedthat bilary stenting with and without PDT shows a survivalbenefit for patients receiving PDT[24]. However, a puzzlingaspect of the study is the failure to relieve bile ductobstruction with stenting alone. Therefore the observedsurvival benefit is probably caused by relief of cholestasisrather than by a reduction of tumor and it remains unclear,if PDT prolongs survival in patients responding toconventional bilary stenting procedures. Although this newtechnique appears promising, further studies are needed.Chemotherapy has not been shown to have a significantimpact on survival[25]. The majority of reports use 5-FUalone or in combination with leucovorin, methotrexate,cisplatin, mitomycin C, or interferon alpha[5]. In some phaseII studies, a response rate of about 20% is reported forgemcitabine[26,27]. The majority of reports concerningchemotherapy in patients with CCC are retrospective andinclude only few patients. In intra-hepatic CCC, transarterialchemoperfusion in combination with temporary embolizationof the feeding artery can be performed. But randomizedcontrolled trials demonstrating an impact on survival arelacking. Few studies have reported benefits of primary oradjuvant standard radiation therapy[28,29]. There are norandomized controlled trials demonstrating a therapeuticeffect of brachytherapy or external beam radiotherapy[5].The main problem of radiation therapy of the upperabdomen is to deliver an adequate dose to the tumor withoutserious side effects. Using a conforming, stereotacticradiation technique, a steep dose gradient can be obtained[30].This means that a high radiation dose reaches the tumorwhile the normal tissue around the target volume is irradiatedwith comparatively low doses. Such a highly precise dosedistribution is a need in radiotherapy of the liver hilus. Apartfrom the dose distribution the repositioning accuracy ofthe target volume is central to a successful radiation therapy.The high repositioning accuracy by a body frame[7,11] canexplain the differences between our patient and published
series with respect to side effects and tumor regression.Thus, stereotactic radiotherapy using a body frame is avaluable option for non-invasive treatment of inoperabletumors in critical regions as the liver hilus. Furthertechnical developments as image guided radiotherapy orbreath-triggered radiotherapy should further increase therepositioning accuracy and may make this technique availablefor routine use.
In conclusion, considering the generally poor prognosisof patients with Klatskin tumor, the long-term survival ofour patient treated by stereotactic radiotherapy shouldencourage a systematic evaluation of this therapeutic strategyby prospective and randomized protocols.
REFERENCESREFERENCESREFERENCESREFERENCESREFERENCES
1 Martin R, Jarnagin W. Intrahepatic cholangiocarcinoma. Cur-rent management. Minerva Chir 2003; 58: 469-478
2 Klempnauer J, Ridder GJ, Werner M, Weimann A, PichlmayrR. What constitutes long-term survival after surgery for hilarcholangiocarcinoma? Cancer 1997; 79: 26-34
3 Burke E, Jarnigan WR, Hochwald SN, Pisters PW, Fong Y,Blumgart LH. Hilar cholangiocarcinoma: patterns of spread,the importance of hepatic resection for curative operation,and a presurgical clinical staging system. Ann Surg 1998;228: 385-394
4 Reding R, Buard JL, Lebeau G, Launois B. Surgical manage-ment of 552 carcinomas of the bile duct (gall bladder andperiampullary excluded). Ann Surg 1991; 213: 236-241
5 Anderson CD, Pinson CW, Berlin J, Chari RS. Diagnosis andtreatment of cholangiocarcinoma. Oncologist 2004; 9: 43-57
6 Chamberlain RS, Blumgart LH. Hilar cholangiocarcinoma:a review and commentary. Ann Surg Oncol 2000; 7: 55-66
7 Lax I, Blomgren H, Naslund I, Svanstrom R. Stereotactic ra-diotherapy of malignancies in the abdomen. Methodologicalaspects. Acta Oncol 1994; 33: 677-683
8 American Joint Committee on Cancer, eds. AJCC Cancer Stag-ing Manual. 5th ed. Philadelphia: Lippincott-Raven 1997
9 Bismuth H, Corlette MB. Intraepatic cholangioenteric anas-tomosis in carcinoma of the hilus of the liver. Surg GynecolObstet 1975; 140: 170-178
10 Bismuth H, Nakache R, Diamond T. Management strategiesin resection for hilar cholangiocarcinoma. Ann Surg 1992; 215:31-38
11 Blomgren H, Lax I, Naslund I, Svanstrom R. Stereotactichigh dose fraction radiation therapy of extracranial tumorsusing an accelerator. Clinical experience of the first thirty-onepatients. Acta Oncol 1995; 34: 861-870
12 ICRU Report No. 50: Prescribing, Recording and ReportingPhoton Beam Therapy, 1993
13 ICRU Report No. 62: Prescribing, Recording and ReportingPhoton Beam Therapy (Supplement to ICRU Report 50), 1999
14 Jeyarajah DH, Klintmalm GB. Is liver transpantation indi-cated for cholangiocarcinoma? J Hepatobil Pancreat Surg 1998;5: 48-51
15 Shapiro MJ. Management of malignant biliary obstruction:nonoperative and palliative techniques. Oncology 1995; 9:493-496
16 Goldstein RM, Stone M, Tillery GW, Senzer N, Levy M,Husberg BS, Gonwa T, Klintmalm G. Is liver transplantationindicated for cholangiocarcinoma? Am J Surg 1993; 166:768-771
17 Meyer CG, Penn I, James L. Liver transplantation forcholangiocarcinoma: results in 207 patients. Transplantation2000; 69: 1633-1637
18 Thuluvath PJ, Rai R,Venbrux AC, Yeo CJ. Cholangiocarcinoma:a review. Gastroenterologist 1997; 5: 306-315
19 Davids PH, Groen AK, Rauws EA, Tytgat GN, Huibregtse K.Randomised trial of self-expanding metal stents versus
polyethylene stents for distal malignant bilary obstruction.Lancet 1992; 340: 1488-1492
20 Kaassis M, Boyer J, Dumas R, Ponchon T, Coumaros D,Delcenserie R, Canard JM, Fritsch J, Rey JF, Burtin P. Plasticor metal stents for malignant stricture of the common bileduct? Results of a randomized prospective study. GastrointestEndosc 2003; 57: 178-182
21 Prat F, Chapat O, Ducot B, Ponchon T, Pelletier G, Fritsch J,Choury AD, Buffet C. A randomized trial of endoscopic drain-age methods for inoperable malignant strictures of the com-mon bile duct. Gastrointest Endos 1998; 47: 1-7
22 Ortner MA, Liebetruth J, Schreiber S, Hanft M, Wruck U,Fusco V, Muller JM, Hortnagl H, Lochs H. Photodynamiktherapy of non resectable cholangiocarcinoma. Gastroenterol-ogy 1998; 114: 536-542
23 Dumoulin FL, Gerhardt T, Furchs S, Scheurlen C, NeubrandM, Layer G, Sauerbruch T. Phase II study of photodynamictherapy and metal stent as palliative treatment for nonresectablehilar cholangiocarcinoma. Gastrointest Endos 2003; 57: 860-867
24 Ortner ME, Caca K, Berr F, Liebetruth J, Mansmann U,Huster D, Voderholzer W, Schachschal G, Mössner J, LochsH. Sucessful Photodynamic Therapy for NonresectableCholangiocarcinoma: A Randomized Prospective Study. Gas-
troenterology 2003; 125: 1355-136325 Gores GJ. A spotlight on cholangiocarcinoma. Gastroenterol-
ogy 2003; 125: 1536-153826 Penz M, Kornek GV, Raderer M, Ulrich-Pur H, Fiebiger W,
Lenauer A, Depisch D, Krauss G, Schneeweiss B, ScheithauerW. Phase II trial of two-weekly gemcitabine in patients withadvanced biliary tract cancer. Ann Oncol 2001; 12: 183-186
27 Raderer M, Hejna MH, Valencak JB, Kornek GV, WeinlanderGS, Bareck E, Lenauer J, Brodowicz T, Lang F, Scheithauer W.Two consecutive phase II studies of 5-fluorouracil/leucov-orin/mitomycin C and of gemcitabine in patients with ad-vanced bilary cancer. Oncology 1999; 56: 177-180
28 Schleicher UM, Staatz G, Alzen G, Andreopoulos D. Com-bined external beam and intraluminal radiotherapy forirresectable Klatskin tumors. Strahlenther Onkol 2002; 178:682-687
29 Todoroki T, Ohara K, Kawamoto T, Koike N, Yoshida S,Kashiwagi H, Otsuka M, Fukao K. Benefits of adjuvant radio-therapy after radical resection of locally advanced main hepaticduct carcinoma. Int J Radiat Oncol Biol Phys 2000; 46: 581-587
30 Haedinger U, Thiele W, Wulf J. Extracranial stereotacticradiotherapy: Evaluation of PTV coverage and doseconformity. Z Med Phys 2002; 12: 221-229
Science Editor Wang XL and Guo SY Language Editor Elsevier HK
4926 ISSN 1007-9327 CN 14-1219/ R World J Gastroenterol August 21, 2005 Volume 11 Number 31
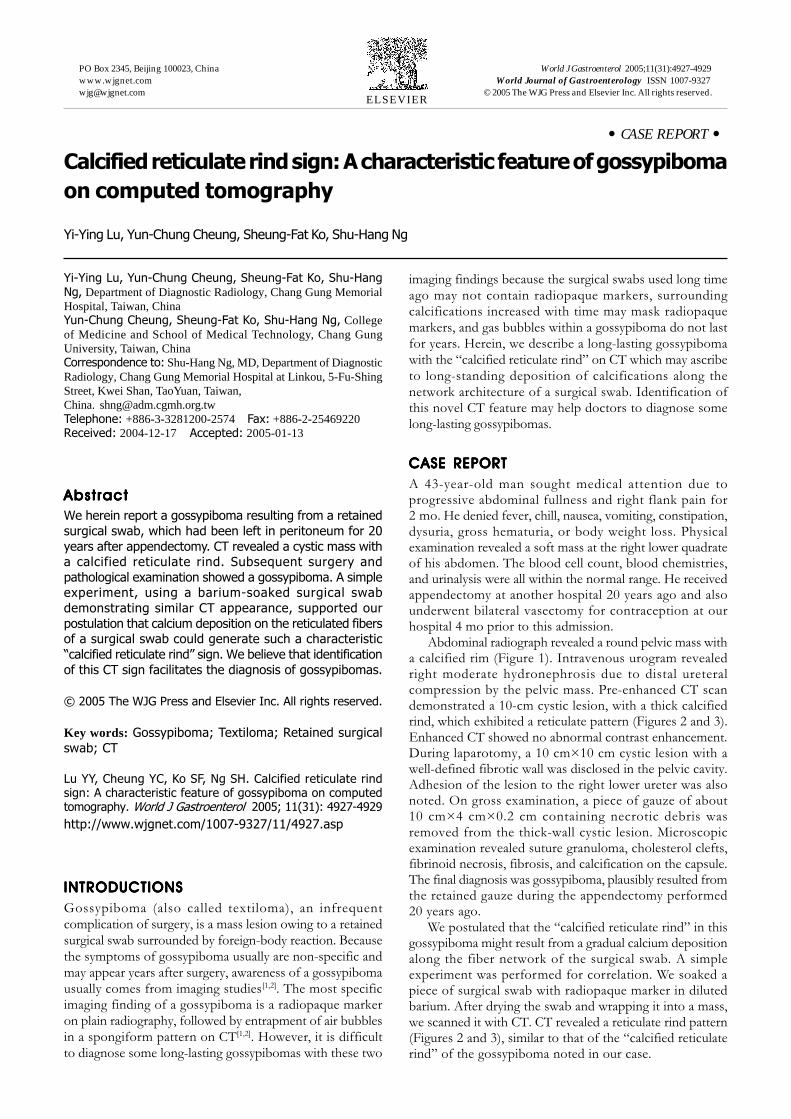
• CASE REPORT •
Calcified reticulate rind sign: A characteristic feature of gossypiboma
on computed tomography
Yi-Ying Lu, Yun-Chung Cheung, Sheung-Fat Ko, Shu-Hang Ng
ELSEVIER
PO Box 2345, Beijing 100023, China World J Gastroenterol 2005;11(31):4927-4929www.wjgnet.com World Journal of Gastroenterology ISSN [email protected] © 2005 The WJG Press and Elsevier Inc. All rights reserved.
Yi-Ying Lu, Yun-Chung Cheung, Sheung-Fat Ko, Shu-HangNg, Department of Diagnostic Radiology, Chang Gung MemorialHospital, Taiwan, ChinaYun-Chung Cheung, Sheung-Fat Ko, Shu-Hang Ng, Collegeof Medicine and School of Medical Technology, Chang GungUniversity, Taiwan, ChinaCorrespondence to: Shu-Hang Ng, MD, Department of DiagnosticRadiology, Chang Gung Memorial Hospital at Linkou, 5-Fu-ShingStreet, Kwei Shan, TaoYuan, Taiwan,China. [email protected]: +886-3-3281200-2574 Fax: +886-2-25469220Received: 2004-12-17 Accepted: 2005-01-13
AbstractAbstractAbstractAbstractAbstract
We herein report a gossypiboma resulting from a retained
surgical swab, which had been left in peritoneum for 20
years after appendectomy. CT revealed a cystic mass witha calcified reticulate rind. Subsequent surgery and
pathological examination showed a gossypiboma. A simpleexperiment, using a barium-soaked surgical swab
demonstrating similar CT appearance, supported our
postulation that calcium deposition on the reticulated fibersof a surgical swab could generate such a characteristic
“calcified reticulate rind” sign. We believe that identification
of this CT sign facilitates the diagnosis of gossypibomas.
© 2005 The WJG Press and Elsevier Inc. All rights reserved.
Key words: Gossypiboma; Textiloma; Retained surgical
swab; CT
Lu YY, Cheung YC, Ko SF, Ng SH. Calcified reticulate rindsign: A characteristic feature of gossypiboma on computedtomography. World J Gastroenterol 2005; 11(31): 4927-4929
http://www.wjgnet.com/1007-9327/11/4927.asp
INTRODUCTIONSINTRODUCTIONSINTRODUCTIONSINTRODUCTIONSINTRODUCTIONS
Gossypiboma (also called textiloma), an infrequentcomplication of surgery, is a mass lesion owing to a retainedsurgical swab surrounded by foreign-body reaction. Becausethe symptoms of gossypiboma usually are non-specific andmay appear years after surgery, awareness of a gossypibomausually comes from imaging studies[1,2]. The most specificimaging finding of a gossypiboma is a radiopaque markeron plain radiography, followed by entrapment of air bubblesin a spongiform pattern on CT[1,2]. However, it is difficultto diagnose some long-lasting gossypibomas with these two
imaging findings because the surgical swabs used long timeago may not contain radiopaque markers, surroundingcalcifications increased with time may mask radiopaquemarkers, and gas bubbles within a gossypiboma do not lastfor years. Herein, we describe a long-lasting gossypibomawith the “calcified reticulate rind” on CT which may ascribeto long-standing deposition of calcifications along thenetwork architecture of a surgical swab. Identification ofthis novel CT feature may help doctors to diagnose somelong-lasting gossypibomas.
CASE REPORTCASE REPORTCASE REPORTCASE REPORTCASE REPORT
A 43-year-old man sought medical attention due toprogressive abdominal fullness and right flank pain for2 mo. He denied fever, chill, nausea, vomiting, constipation,dysuria, gross hematuria, or body weight loss. Physicalexamination revealed a soft mass at the right lower quadrateof his abdomen. The blood cell count, blood chemistries,and urinalysis were all within the normal range. He receivedappendectomy at another hospital 20 years ago and alsounderwent bilateral vasectomy for contraception at ourhospital 4 mo prior to this admission.
Abdominal radiograph revealed a round pelvic mass witha calcified rim (Figure 1). Intravenous urogram revealedright moderate hydronephrosis due to distal ureteralcompression by the pelvic mass. Pre-enhanced CT scandemonstrated a 10-cm cystic lesion, with a thick calcifiedrind, which exhibited a reticulate pattern (Figures 2 and 3).Enhanced CT showed no abnormal contrast enhancement.During laparotomy, a 10 cm×10 cm cystic lesion with awell-defined fibrotic wall was disclosed in the pelvic cavity.Adhesion of the lesion to the right lower ureter was alsonoted. On gross examination, a piece of gauze of about10 cm×4 cm×0.2 cm containing necrotic debris wasremoved from the thick-wall cystic lesion. Microscopicexamination revealed suture granuloma, cholesterol clefts,fibrinoid necrosis, fibrosis, and calcification on the capsule.The final diagnosis was gossypiboma, plausibly resulted fromthe retained gauze during the appendectomy performed20 years ago.
We postulated that the “calcified reticulate rind” in thisgossypiboma might result from a gradual calcium depositionalong the fiber network of the surgical swab. A simpleexperiment was performed for correlation. We soaked apiece of surgical swab with radiopaque marker in dilutedbarium. After drying the swab and wrapping it into a mass,we scanned it with CT. CT revealed a reticulate rind pattern(Figures 2 and 3), similar to that of the “calcified reticulaterind” of the gossypiboma noted in our case.
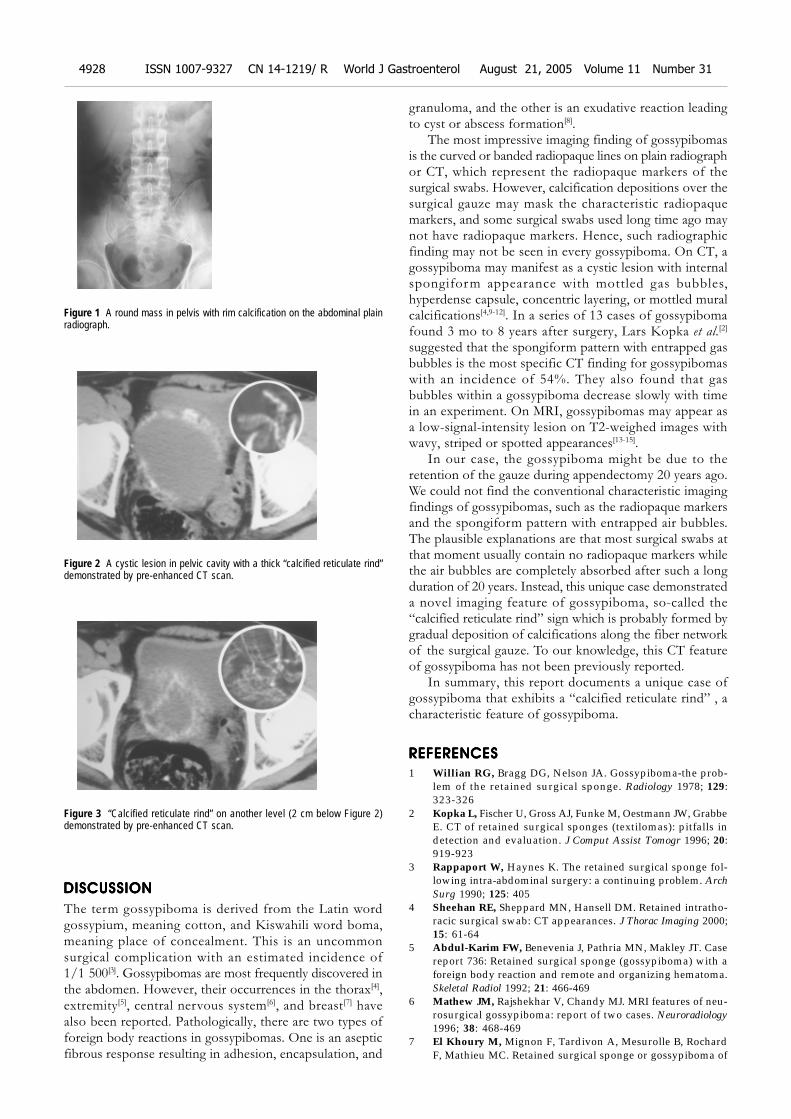
4928 ISSN 1007-9327 CN 14-1219/ R World J Gastroenterol August 21, 2005 Volume 11 Number 31
DISCUSSIONDISCUSSIONDISCUSSIONDISCUSSIONDISCUSSION
The term gossypiboma is derived from the Latin wordgossypium, meaning cotton, and Kiswahili word boma,meaning place of concealment. This is an uncommonsurgical complication with an estimated incidence of1/1 500[3]. Gossypibomas are most frequently discovered inthe abdomen. However, their occurrences in the thorax[4],extremity[5], central nervous system[6], and breast[7] havealso been reported. Pathologically, there are two types offoreign body reactions in gossypibomas. One is an asepticfibrous response resulting in adhesion, encapsulation, and
granuloma, and the other is an exudative reaction leadingto cyst or abscess formation[8].
The most impressive imaging finding of gossypibomasis the curved or banded radiopaque lines on plain radiographor CT, which represent the radiopaque markers of thesurgical swabs. However, calcification depositions over thesurgical gauze may mask the characteristic radiopaquemarkers, and some surgical swabs used long time ago maynot have radiopaque markers. Hence, such radiographicfinding may not be seen in every gossypiboma. On CT, agossypiboma may manifest as a cystic lesion with internalspongiform appearance with mottled gas bubbles,hyperdense capsule, concentric layering, or mottled muralcalcifications[4,9-12]. In a series of 13 cases of gossypibomafound 3 mo to 8 years after surgery, Lars Kopka et al.[2]
suggested that the spongiform pattern with entrapped gasbubbles is the most specific CT finding for gossypibomaswith an incidence of 54%. They also found that gasbubbles within a gossypiboma decrease slowly with timein an experiment. On MRI, gossypibomas may appear asa low-signal-intensity lesion on T2-weighed images withwavy, striped or spotted appearances[13-15].
In our case, the gossypiboma might be due to theretention of the gauze during appendectomy 20 years ago.We could not find the conventional characteristic imagingfindings of gossypibomas, such as the radiopaque markersand the spongiform pattern with entrapped air bubbles.The plausible explanations are that most surgical swabs atthat moment usually contain no radiopaque markers whilethe air bubbles are completely absorbed after such a longduration of 20 years. Instead, this unique case demonstrateda novel imaging feature of gossypiboma, so-called the“calcified reticulate rind” sign which is probably formed bygradual deposition of calcifications along the fiber networkof the surgical gauze. To our knowledge, this CT featureof gossypiboma has not been previously reported.
In summary, this report documents a unique case ofgossypiboma that exhibits a “calcified reticulate rind” , acharacteristic feature of gossypiboma.
REFERENCESREFERENCESREFERENCESREFERENCESREFERENCES
1 Willian RG, Bragg DG, Nelson JA. Gossypiboma-the prob-lem of the retained surgical sponge. Radiology 1978; 129:323-326
2 Kopka L, Fischer U, Gross AJ, Funke M, Oestmann JW, GrabbeE. CT of retained surgical sponges (textilomas): pitfalls indetection and evaluation. J Comput Assist Tomogr 1996; 20:919-923
3 Rappaport W, Haynes K. The retained surgical sponge fol-lowing intra-abdominal surgery: a continuing problem. ArchSurg 1990; 125: 405
4 Sheehan RE, Sheppard MN, Hansell DM. Retained intratho-racic surgical swab: CT appearances. J Thorac Imaging 2000;15: 61-64
5 Abdul-Karim FW, Benevenia J, Pathria MN, Makley JT. Casereport 736: Retained surgical sponge (gossypiboma) with aforeign body reaction and remote and organizing hematoma.Skeletal Radiol 1992; 21: 466-469
6 Mathew JM, Rajshekhar V, Chandy MJ. MRI features of neu-rosurgical gossypiboma: report of two cases. Neuroradiology1996; 38: 468-469
7 El Khoury M, Mignon F, Tardivon A, Mesurolle B, RochardF, Mathieu MC. Retained surgical sponge or gossypiboma of
Figure 1 A round mass in pelvis with rim calcification on the abdominal plainradiograph.
Figure 2 A cystic lesion in pelvic cavity with a thick “calcified reticulate rind”demonstrated by pre-enhanced CT scan.
Figure 3 “Calcified reticulate rind” on another level (2 cm below Figure 2)demonstrated by pre-enhanced CT scan.

Lu YY et al. Calcified reticulate rind sign of a gossypiboma 4929
the breast. Eur J Radiol 2002; 42: 58-618 Olnick HM, Weens HS, Robers JV Jr. Radiological diagnosis
of retained surgical sponges. JAMA 1955; 159: 1525-15279 Buy JN, Hubert C, Ghossain MA, Malbec L, Bethoux JP,
Ecoiffier J. Computed tomography of retained abdominalsponges and towels. Gastrointest Radiol 1989; 14: 41-45
10 Kokubo T, Itai Y, Ohtomo K, Yoshikawa K, Ilio M, Atomi Y.Retained surgical sponges: CT and US appearance. Radiology1987; 165: 415-418
11 Choi BI, Kim SH, Yu ES, Chung HS, Han MC, Kim CW.Retained surgical sponge: diagnosis with CT and sonography.Am J Roentgenol 1988; 150: 1047-1050
12 Parienty RA, Pradel J, Lepreux JF, Nicodeme CH, Dologa M.
Computed tomography of sponges retained after laparotomy.J Comput Assist Tomogr 1981; 5: 187-189
13 Kuwashima S, Yamato M, Fuj ioka M, Ishibashi M,Kogure H, Tajima Y. MR findings of surgically retainedsponges and towels: report of two cases. Radiat Med 1993;11 : 98-101
14 Sugimura H, Tamura S, Kakitsubata Y, Kakitsubata S,Uwada O, Kihara Y, Nagatomo M, Watanabe K. Magneticresonance imaging of retained surgical sponges. Case report.Clin Imaging 1992; 16: 259-262
15 Roumen RM, Weerdenburg HP. MR features of a 24-year-old gossypiboma, a case report. Acta Radiol 1998;39 : 176-178
Science Editor Wang XL and Guo SY Language Editor Elsevier HK
• ACKNOWLEDGMENTS •
Acknowledgments to Reviewers of World Journal of
Gastroenterology
ELSEVIER
PO Box 2345, Beijing 100023, China World J Gastroenterol 2005;11(31):4930www.wjgnet.com World Journal of Gastroenterology ISSN [email protected] © 2005 The WJG Press and Elsevier Inc. All rights reserved.
Many reviewers have contributed their expertise and time tothe peer review, a critical process to ensure the quality of World
Journal of Gastroenterology. The editors and authors of thearticles submitted to the journal are grateful to the followingreviewers for evaluating the articles (including those werepublished and those were rejected in this issue) during the lastediting period of time.
Takafumi Ando, M.D.
Nagoya University Graduate School of Medicine, Therapeutic
Medicine, 65 Tsurumai-cho, Showa-ku, Nagoya 466-8550, Japan
Gabrio Bassotti, M.D.
Department of Clinical and Experimental Medicine, University
of Perugia, Via Enrico dal Pozzo, Padiglione W, Perugia 06100,
Italy
Ramon Bataller, M.D.
Liver Unit, Hospital Clinic,Villarroel 170, Barcelona 08036, Spain
Josep M Bordas, M.D.
Department of Gastroenterology IMD, Hospital Clinic”, Llusanes
11-13 at, Barcelona 08022, Spain
Pierre Brissot, Professor
Liver Disease Unit And Inserm U-522, University Hospital
Pontchaillou, 2, Rue Henri Le Guilloux, Rennes 35033, France
Vincent Coghlan, Professor
Neurological Sciences Institute, 505 NW 185th Avenue, Beaverton,
Oregon 97006, United States
Jacques Cosnes, Professor
Department of Gastroenterology, Hospital St. Antoine, Hospital
St. Antoine, 184 rue du Faubourg St-Antoine, PARIS 75012,
France
Radha K Dhiman, Associate Professor
Department of Hepatology, Postgraduate Institute of Medical
Education and Research, Chandigarh 160012, India
Alfred Gangl, Professor
Department of Medicine 4, Medical University of Vienna,
Allgemeines Krankenhaus, Waehringer Guertel 18-20, Vienna
A-1090, Austria
Toru Ishikawa, M.D.
Department of Gastroenterology, Saiseikai Niigata Second
Hospital, Teraji 280-7, Niigata, Niigata 950-1104, Japan
Michael A Kamm, Professor
Department of Gastroenterology, St Mark’s Hospital, St Mark’s
Hospital, Watford Road, Harrow HA1 3UJ, United Kingdom
Seigo Kitano, Professor
Department of Surgery I, Oita University Faculty of Medicine, 1-
1 Idaigaoka Hasama-machi, Oita 879-5593, Japan
Chris Jacob Johan Mulder, Professor
VUMC, PO Box 7057, Amsterdam 1007, Netherlands
Hiroki Nakamura, M.D.
Department of Gastroenterology and Hepatology, 1-1-1, Minami
Kogushi, Ube, Yamaguchi 755-8505, Japan
Curtis T Okamoto, Associate Professor
Department of Pharmaceutical Sciences, University of Southern
California, 1985 Zonal Ave. PSC 404A, Los Angeles CA 90089-
9121, United States
Piero Portincasa, Professor
Internal Medicine - DIMIMP, University of Bari Medical School,
Hospital Policlinico Piazza G. Cesare 11, Bari 70124, Italy
Bruno Stieger, Professor
Department of Medicine, Division of Clinical Pharmacology and
Toxicology, University Hospital, Zurich 8091, Switzerland
Qin Su, Professor
Department of Pathology, Cancer Hospital and Cancer Institute,
Chinese Academy of Medical Sciences and Peking Medical College,
PO Box 2258, Beijing 100021, China
Koji Takeuchi, Professor
Department of Pharmacology and Experimental Therapeutics,
Kyoto Pharmaceutical University, Misasagi, Yamashina, Kyoto
607-8414, Japan
Kam-Meng Tchou-Wong, Assistant Professor
Departments of Environmental Medicine and Medicine, NYU
School of Medicine, 57 Old Forge Road, Tuxedo, New York
10987, United States
Anton Vavrecka, M.D.
Clinic Of Gastroenterology, SZU, NSP SV.CAM, Antolska 11,
Bratislava 85107, Slovakia
Shinichi Wada, M.D.
Department of Gastroenterology, Jichi Medical School,
Minamikawachi-machi, Kwachi-gun, Tochigi-ken, Tochigi 329-
0498, Japan
Jia-Yu Xu, Professor
Shanghai Second Medical University, Rui Jin Hospital, 197 Rui
Jin Er Road, Shanghai 200025, China
Related Documents