Water Research 185 (2020) 116223 Contents lists available at ScienceDirect Water Research journal homepage: www.elsevier.com/locate/watres Bio-electrochemical COD removal for energy-efficient, maximum and robust nitrogen recovery from urine through membrane aerated nitrification Jolien De Paepe a,b,c , Kim De Paepe a , Francesc Gòdia b , Korneel Rabaey a,c,∗ , Siegfried E. Vlaeminck c,d , Peter Clauwaert a,c a Center for Microbial Ecology and Technology (CMET), Department of Biotechnology, Faculty of Bioscience Engineering, Ghent University, Coupure Links 653, 9000 Gent, Belgium b Departament d’Enginyeria Química, Biològica I Ambiental, Escola d’Enginyeria, Universitat Autònoma de Barcelona, Bellaterra 08193 Barcelona, Spain c Center for Advanced Process Technology and Urban Resource Efficiency (CAPTURE), Belgium d Research Group of Sustainable Energy, Air and Water Technology, Department of Bioscience Engineering, University of Antwerp, Groenenborgerlaan 171, 2020 Antwerpen, Belgium a r t i c l e i n f o Article history: Received 12 May 2020 Revised 17 July 2020 Accepted 23 July 2020 Available online 23 July 2020 Keywords: Resource recovery Regenerative life support system Nitrogen recovery Yellow water Source separation Membrane biofilm reactor a b s t r a c t Resource recovery from source-separated urine can shorten nutrient cycles on Earth and is essential in regenerative life support systems for deep-space exploration. In this study, a robust two-stage, energy- efficient, gravity-independent urine treatment system was developed to transform fresh real human urine into a stable nutrient solution. In the first stage, up to 85% of the COD was removed in a microbial elec- trolysis cell (MEC), converting part of the energy in organic compounds (27–46%) into hydrogen gas and enabling full nitrogen recovery by preventing nitrogen losses through denitrification in the second stage. Besides COD removal, all urea was hydrolysed in the MEC, resulting in a stream rich in ammoniacal ni- trogen and alkalinity, and low in COD. This stream was fed into a membrane-aerated biofilm reactor (MABR) in order to convert the volatile and toxic ammoniacal nitrogen to non-volatile nitrate by nitri- fication. Bio-electrochemical pre-treatment allowed to recover all nitrogen as nitrate in the MABR at a bulk-phase dissolved oxygen level below 0.1 mg O 2 L −1 . In contrast, feeding the MABR directly with raw urine (omitting the first stage), at the same nitrogen loading rate, resulted in nitrogen loss (18%) due to denitrification. The MEC and MABR were characterised by very distinct and diverse microbial com- munities. While (strictly) anaerobic genera, such as Geobacter (electroactive bacteria), Thiopseudomonas, a Lentimicrobiaceae member, Alcaligenes and Proteiniphilum prevailed in the MEC, the MABR was dominated by aerobic genera, including Nitrosomonas (a known ammonium oxidiser), Moheibacter and Gordonia. The two-stage approach yielded a stable nitrate-rich, COD-low nutrient solution, suitable for plant and mi- croalgae cultivation. © 2020 Elsevier Ltd. All rights reserved. 1. Introduction In recent years, source-separated urine has gained great in- terest as an alternative nutrient resource, reducing the need to mine (e.g., phosphorus and potassium) or to chemically synthesize nutrients consuming fossil fuels (e.g., natural gas for ammonia), while at the same time facilitating wastewater management and reducing environmental pollution (Maurer et al., 2006; Randall and Naidoo 2018). Urine is also an essential resource in regenerative life support systems for long-duration human Space missions, as ∗ Corresponding author. E-mail address: [email protected] (K. Rabaey). it presents the major flux of nitrogen in a regenerative life sup- port system and contains additional macro- (i.e., phosphorus and potassium) and micro-nutrients (Clauwaert et al., 2017). Without stabilization of urine, urea, the main nitrogen com- pound in urine, quickly hydrolyses into ammonia, ammonium and (bi)carbonate, causing nutrient losses, scaling and clogging by un- controlled precipitation, ammonia volatilisation into the environ- ment/Space cabin and odor nuisance (Udert et al., 2003b). Urine also contains organics (~10 g COD L −1 (Udert et al., 2006) of which about 90% is biodegradable), fueling bacterial growth. Nitrifica- tion has been reported as a suitable method to stabilize urine, while preserving the nutrient content, and plays a pivotal role in the Micro-Ecological Life Support System Alternative (MELiSSA), https://doi.org/10.1016/j.watres.2020.116223 0043-1354/© 2020 Elsevier Ltd. All rights reserved.

Welcome message from author
This document is posted to help you gain knowledge. Please leave a comment to let me know what you think about it! Share it to your friends and learn new things together.
Transcript
Water Research 185 (2020) 116223
Contents lists available at ScienceDirect
Water Research
journal homepage: www.elsevier.com/locate/watres
Bio-electrochemical COD removal for energy-efficient, maximum and
robust nitrogen recovery from urine through membrane aerated
nitrification
Jolien De Paepe
a , b , c , Kim De Paepe
a , Francesc Gòdia
b , Korneel Rabaey
a , c , ∗, Siegfried E. Vlaeminck
c , d , Peter Clauwaert a , c
a Center for Microbial Ecology and Technology (CMET), Department of Biotechnology, Faculty of Bioscience Engineering, Ghent University, Coupure Links 653,
90 0 0 Gent, Belgium
b Departament d’Enginyeria Química, Biològica I Ambiental, Escola d’Enginyeria, Universitat Autònoma de Barcelona, Bellaterra 08193 Barcelona, Spain c Center for Advanced Process Technology and Urban Resource Efficiency (CAPTURE), Belgium
d Research Group of Sustainable Energy, Air and Water Technology, Department of Bioscience Engineering, University of Antwerp, Groenenborgerlaan 171,
2020 Antwerpen, Belgium
a r t i c l e i n f o
Article history:
Received 12 May 2020
Revised 17 July 2020
Accepted 23 July 2020
Available online 23 July 2020
Keywords:
Resource recovery
Regenerative life support system
Nitrogen recovery
Yellow water
Source separation
Membrane biofilm reactor
a b s t r a c t
Resource recovery from source-separated urine can shorten nutrient cycles on Earth and is essential in
regenerative life support systems for deep-space exploration. In this study, a robust two-stage, energy-
efficient, gravity-independent urine treatment system was developed to transform fresh real human urine
into a stable nutrient solution. In the first stage, up to 85% of the COD was removed in a microbial elec-
trolysis cell (MEC), converting part of the energy in organic compounds (27–46%) into hydrogen gas and
enabling full nitrogen recovery by preventing nitrogen losses through denitrification in the second stage.
Besides COD removal, all urea was hydrolysed in the MEC, resulting in a stream rich in ammoniacal ni-
trogen and alkalinity, and low in COD. This stream was fed into a membrane-aerated biofilm reactor
(MABR) in order to convert the volatile and toxic ammoniacal nitrogen to non-volatile nitrate by nitri-
fication. Bio-electrochemical pre-treatment allowed to recover all nitrogen as nitrate in the MABR at a
bulk-phase dissolved oxygen level below 0.1 mg O 2 L −1 . In contrast, feeding the MABR directly with raw
urine (omitting the first stage), at the same nitrogen loading rate, resulted in nitrogen loss (18%) due
to denitrification. The MEC and MABR were characterised by very distinct and diverse microbial com-
munities. While (strictly) anaerobic genera, such as Geobacter (electroactive bacteria), Thiopseudomonas , a
Lentimicrobiaceae member, Alcaligenes and Proteiniphilum prevailed in the MEC, the MABR was dominated
by aerobic genera, including Nitrosomonas (a known ammonium oxidiser), Moheibacter and Gordonia . The
two-stage approach yielded a stable nitrate-rich, COD-low nutrient solution, suitable for plant and mi-
croalgae cultivation.
© 2020 Elsevier Ltd. All rights reserved.
1
t
m
n
w
r
N
l
i
p
p
p
(
c
m
a
a
h
0
. Introduction
In recent years, source-separated urine has gained great in-
erest as an alternative nutrient resource, reducing the need to
ine (e.g., phosphorus and potassium) or to chemically synthesize
utrients consuming fossil fuels (e.g., natural gas for ammonia),
hile at the same time facilitating wastewater management and
educing environmental pollution ( Maurer et al., 2006 ; Randall and
aidoo 2018 ). Urine is also an essential resource in regenerative
ife support systems for long-duration human Space missions, as
∗ Corresponding author.
E-mail address: [email protected] (K. Rabaey).
t
w
t
ttps://doi.org/10.1016/j.watres.2020.116223
043-1354/© 2020 Elsevier Ltd. All rights reserved.
t presents the major flux of nitrogen in a regenerative life sup-
ort system and contains additional macro- (i.e., phosphorus and
otassium) and micro-nutrients ( Clauwaert et al., 2017 ).
Without stabilization of urine, urea, the main nitrogen com-
ound in urine, quickly hydrolyses into ammonia, ammonium and
bi)carbonate, causing nutrient losses, scaling and clogging by un-
ontrolled precipitation, ammonia volatilisation into the environ-
ent/Space cabin and odor nuisance ( Udert et al., 2003b ). Urine
lso contains organics (~10 g COD L −1 ( Udert et al., 2006 ) of which
bout 90% is biodegradable), fueling bacterial growth. Nitrifica-
ion has been reported as a suitable method to stabilize urine,
hile preserving the nutrient content, and plays a pivotal role in
he Micro-Ecological Life Support System Alternative (MELiSSA),
2 J. De Paepe, K. De Paepe and F. Gòdia et al. / Water Research 185 (2020) 116223
2
l
p
c
t
v
e
g
C
f
n
c
c
w
e
g
b
w
w
a
2
2
2
a
2
c
U
g
w
d
l
t
t
(
(
p
t
c
l
c
c
o
(
2
o
w
a
M
r
s
4
2
(
s
d
M
t
the regenerative life support system program from the European
Space Agency (ESA) ( Coppens et al., 2016 ; De Paepe et al. 2018 ;
Gòdia et al., 2002 ; Udert et al., 2003a ; Udert and Wachter 2012 ).
First, ammonium oxidizing bacteria (AOB) oxidize TAN (total am-
monia nitrogen, i.e., sum of ammonia-N and ammonium-N) into
nitrite (nitritation), which is subsequently oxidized into non-
volatile and nontoxic nitrate (nitratation) by nitrite oxidizing bac-
teria (NOB). Simultaneously, biodegradable organics are oxidized to
CO 2 by heterotrophic bacteria, decreasing the biofouling potential
of urine.
Different reactor systems have been used for partial or full
urine nitrification: continuous stirred tank reactors ( Oosterhuis and
van Loosdrecht, 2009 , Udert et al., 2003 ), sequencing batch re-
actors Chen et al., 2017 , ( Jiang et al., 2011 , Mackey et al., 2010 ,
Sun et al., 2012 , Udert et al., 2003 ), moving bed biofilm reactors
( De Paepe et al. 2018 ; Udert et al., 2003 ) and membrane biore-
actors ( Coppens et al., 2016 ; Fumasoli et al., 2016 ). In this study,
urine nitrification was performed in a membrane-aerated biofilm
reactor (MABR), given its high oxygen utilization efficiency, com-
pact design and compatibility with the reduced gravity conditions
in Space ( Côté et al., 1988 ; Jackson et al., 2009 ; Martin and Neren-
berg 2012 ; Nerenberg 2016 ). In an MABR, oxygen is transferred
by diffusion through gas permeable membranes to the biofilm at-
tached to the membrane outer surface. About 30–45 g O 2 L −1 urine
are required to oxidize all TAN and COD (chemical oxygen demand)
in urine (assuming 6–9 g of N and COD L −1 , and 4.33 g O 2 g −1 N
and 0.8 g O 2 g −1 COD). MABR systems have been validated for ni-
trification, and for the removal of organics and/or nitrogen from
numerous types of waste streams, including waste streams rele-
vant for Space such as mixtures of urine, humidity condensate and
surfactants ( Chen et al., 2008 ; Christenson et al., 2018 ; Gong et al.,
20 07 ; Jackson et al., 20 09 ; Pellicer-Nàcher et al., 2010 ). Due to
their counter-diffusional biofilm, MABR systems are often used
for simultaneous nitrification-denitrification ( Casey et al., 1999 ).
Over time, the biofilm thickness increases, and due to the oxy-
gen consumption by nitrifiers and aerobic heterotrophs, residing
deep in the biofilm close to the membrane surface, the outer lay-
ers of the biofilm (at the biofilm-liquid interface) become anoxic.
In these layers, heterotrophic denitrifiers can convert the nitrate
into nitrogen gas using COD as an electron donor. Nitrogen re-
moval via nitrification-denitrification in an MABR has been in-
vestigated for water recycling from a Space-based waste stream,
consisting of urine (10%), grey water and humidity condensate
( Christenson et al., 2018 ; Jackson et al., 2009 ; Meyer et al., 2015 ).
Thus far, only one study reported the use of an MABR for nitro-
gen recovery from urine. Udert and Wachter (2012) obtained par-
tial nitrification and COD removal in an MABR operated on stored
urine. Despite additional oxygen supply via bubble aeration to pre-
vent anoxic zones, up to 24% of the nitrogen was lost by denitri-
fication and nitrite accumulation occurred because of oxygen limi-
tation ( Udert and Wachter 2012 ).
Hence, avoiding the presence of anoxic zones in combination
with bioavailable organics is critical in preventing a loss of ni-
trogen through denitrification. Therefore, a microbial electrolysis
cell (MEC) was used in this study in order to remove the rapidly
biodegradable COD prior to membrane-aerated nitrification. In the
MEC, electrochemically active bacteria oxidize COD and use the an-
ode as an electron acceptor ( Logan et al., 2006 ). This way, chem-
ical energy is converted into electrical energy, generating hydro-
gen gas at the cathode by applying a small potential with an
external power supply ( Logan et al., 2006 ). In recent years, a
large number of studies on bio-electrochemical treatment (MEC
and MFC) of (synthetic) urine were published. Since the main fo-
cus of most of these studies is energy recovery ( Ieropoulos et al.,
2012 ; Ieropoulos et al., 2016 ; Merino-Jimenez et al., 2017 ; Salar-
García et al., 2017 ) or TAN recovery ( Gao et al., 2018 ; Kuntke et al.,
014 ; Kuntke et al., 2012 ; Kuntke et al., 2016 ; Ledezma et al., 2017 ),
ow COD removal efficiencies ( < 50%) are generally reported (Sup-
lementary information (SI), Section J).
In this study, the goal was to achieve maximum nitrogen re-
overy at minimum energy expenditure. The aim for the MEC was
herefore to achieve high COD removal efficiencies in order to pre-
ent denitrification in the MABR. Two MEC configurations were
valuated in terms of COD removal, current production and nitro-
en recovery, at a range of hydraulic residence times (HRT) and
OD loadings. The MEC effluent was fed into a hollow fiber MABR
or full nitrification (i.e., with base addition to convert all TAN into
itrate). Full nitrification was preferred over partial nitrification be-
ause of the higher process stability (optimal pH and no TAN ac-
umulation) and safety (ammonium nitrate is thermally instable
hich limits further concentration and it can be misused as an
xplosive) ( Udert and Wachter 2012 ). The load of the MABR was
radually increased to evaluate the reactor performance at a low
ulk dissolved oxygen (DO) concentration. Subsequently, raw urine
as fed into the MABR to study the effect of the pre-treatment
ith the MEC. The microbial communities in both reactors were
nalysed using amplicon 16S rRNA gene Illumina sequencing.
. Materials and methods
.1. Experimental setup
.1.1. MEC1
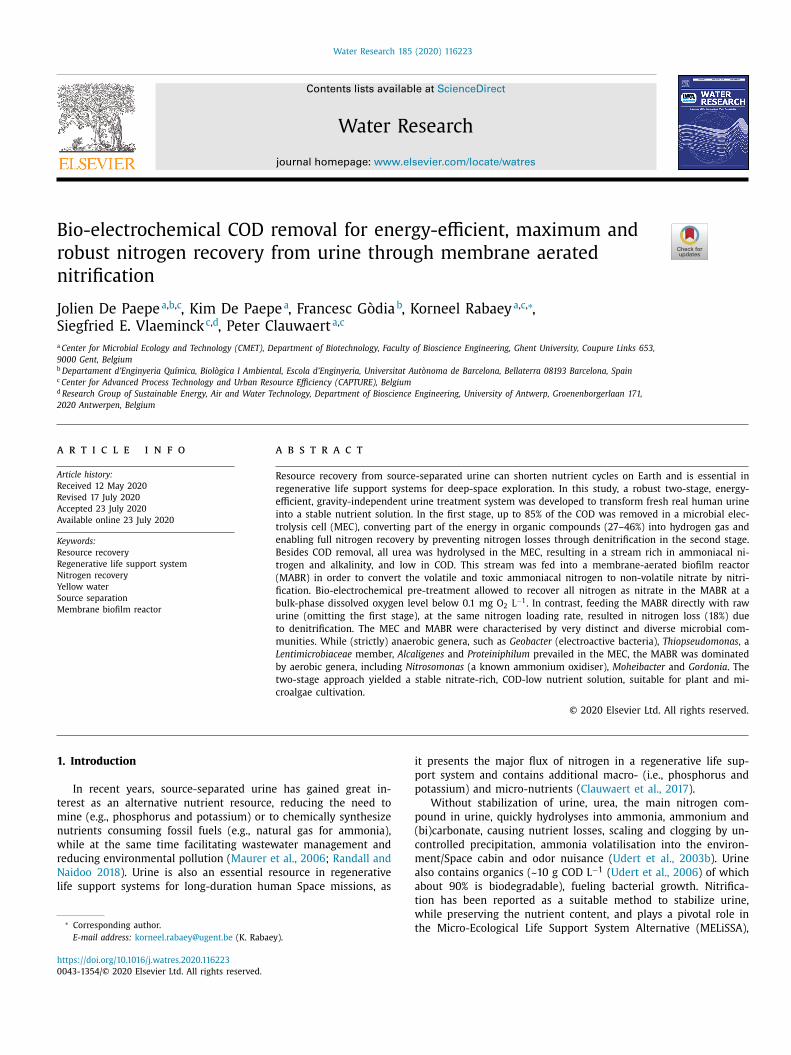
MEC1 ( Fig. 1 A) was constructed of two Perspex® plates
nd frames with an internal volume of 200 mL (dimension of
0 × 5 × 2 cm ³) separated by an ion exchange membrane (100
m ², Ultrex CMI-70 0 0 s or AMI-70 01, Membranes International Inc.,
SA). The anodic compartment was filled with 200 g of graphite
ranules (Le Carbone, Belgium). Prior to use, the granules were
ashed with NaOH and HCl, rinsed with demineralised water and
ried at 105 °C. A graphite felt (Alfa Aesar, Germany) and a stain-
ess steel frame were used for electrical connection to a poten-
iostat (VSP, Biologic, France), which controlled the anode poten-
ial at −250 or −350 mV versus an Ag/AgCl reference electrode
ALS, Japan). The cathode consisted of a stainless steel wire mesh
564 μm mesh width, 20 × 5 cm ², Solana, Belgium). A peristaltic
ump was used to recirculate the anolyte and catholyte between
he recirculation vessels (glass bottles) and the anodic or cathodic
ompartment of the MEC. Urine was fed into the anode recircu-
ation vessel with a peristaltic pump and a timer. The catholyte
onsisted of a phosphate buffer solution and was operated in a
losed loop (i.e., without influent and effluent). The total volume
f anolyte and catholyte were 740 or 490 mL and 1 L, respectively
Table 1 ).
.1.2. MEC2
MEC2 ( Fig. 1 B) was similar to MEC1 but the anode consisted
f a graphite felt (100 cm ²) (without granules) and a stainless steel
ire mesh to collect the current. The two compartments were sep-
rated by a cation exchange membrane (CEM, Ultrex CMI-70 0 0 s,
embranes International Inc., NJ, USA). The effluent of the anode
ecirculation vessel was directed into the cathode recirculation ves-
el. The total volume of anolyte and catholyte were 615 mL and
30 mL, respectively.
.1.3. MABR
The MABR was composed of three hollow fiber (HF) modules
SI Figure S1), consisting of 180 flow-through dense (non-porous)
ilicone rubber hollow fibers with a length of 25 cm, an inner
iameter of 0.3 mm and an outer diameter of 0.5 mm (Nagasep
100, Nagayanagi Co., Japan). Each module was made from a plas-
ic housing and had a total membrane surface area of 0.06 m ² and
J. De Paepe, K. De Paepe and F. Gòdia et al. / Water Research 185 (2020) 116223 3
Fig. 1. Schematic overview of the microbial electrolysis cells MEC1 (A) and MEC2 (B).
Table 1
Overview of the different operational phases of MEC1 and MEC2. For MEC2, the HRT in the anodic compartment and total HRT (in anodic and cathodic com-
partment, value between brackets) are displayed. The average influent and effluent composition is reported in SI, Section B.
Phase MEC IEM Anolyte volume [mL] Anode potential [mV] Influent flow rate [mL d −1 ] HRT [d] Duration [d] number of HRT
MEC1-CEM 1 CEM 740 −350 111 6.6 21 3.2
MEC1-AEM1 1 AEM 740 −350 110 6.7 27 4.0
MEC1-AEM2 1 AEM 490 −250 120 4.1 53 13.0
MEC1-AEM3 1 AEM 490 −250 133 3.7 20 5.4
MEC2-CEM1 2 CEM 615 −250 144 4.3 (7.3) 52 12.2 (7.2)
MEC2-CEM2 2 CEM 615 −250 241 2.5 (4.3) 25 9.8 (5.8)
MEC2-CEM3 2 CEM 615 −250 112 5.5 (9.4) 75 13.7 (8.0)
l
h
a
s
h
t
t
a
o
t
a
p
R
p
t
o
a
fi
m
2
2
w
i
B
w
(
fl
t
h
i
m
a
m
p
t
2
e
n
(
g
c
i
M
w
m
e
o
m
t
U
b
t
t
c
C
2
t
b
l
K
t
i
9
a
o
H
M
M
i
L
t
v
d
r
iquid volume of 90 mL. The liquid volume in the modules was
ence 270 mL. The liquid was recirculated between the modules
nd two recirculation vessels (100 mL glass bottles) with a peri-
taltic pump at a flow rate of 11 L h
−1 (17 reactor volumes per
our). Including vessels, tubing and modules, the reactor had a to-
al liquid volume of 650 mL. Humidified air was supplied through
he lumen of the fibers in opposite direction of the liquid flow with
quarium pumps (air pump 400, EHEIM, Germany) at a flow rate
f 0.65–0.75 L min
−1 . The bulk liquid DO concentration was moni-
ored with a luminescent DO probe (LDO10103, Hach, Belgium) and
HQ40d meter (Hach, Belgium) and logged every five minutes. The
H was controlled at 6.85 by dosing 0.25 M NaOH with a Consort
3610 controller (Consort, Belgium) to obtain full nitrification. A
H setpoint of 6.85 was chosen to minimize the NaOH consump-
ion and to reduce the risk for free ammonia (FA) inhibition in case
f TAN accumulation. Influent was dosed with a peristaltic pump
nd a timer. After 168 days, one module was removed and sacri-
ed for sequencing, after which the MABR was operated with two
odules (total liquid volume of 500 mL).
.2. Reactor operation
.2.1. Urine collection and alkalinisation
Fresh urine from healthy male donors, not taking medication,
as collected using a nonwater urinal with approval from the Eth-
cal Committee of Ghent University Hospital (registration number
670201731862). Immediately after collection, batches of 2–4 L
ere prepared. The urine was diluted with demineralised water
33.3vol% urine; 66.6vol% water), simulating the diluting effect of
ush water in urine diverting toilets ( Wohlsager et al., 2010 ), and
he pH was increased to above 11 with 2 M NaOH to prevent urea
ydrolysis during storage (max. 2–3 weeks) at 4 °C prior to feeding
nto the MEC. The alkalinisation step was included to avoid am-
onia volatilisation (which can pose a hazard in Space), scaling
nd clogging due to uncontrolled precipitation, nutrient losses and
alodour during storage. The pH increase also triggered controlled
recipitation of calcium and magnesium salts, thereby minimizing
he risk for scaling in the following treatment steps.
.2.2. MEC operation
The anodic compartment of MEC1 was inoculated with efflu-
nt originating from an active MEC (fed with fermenter super-
atant) and operated in fed-batch mode on modified M9 medium
Guo et al., 2013 ) to establish an electroactive biofilm on the
raphite granules. Subsequently, urine was fed into the anode re-
irculation vessel at 111 mL d
−1 . After 21 days, the CEM separat-
ng the electrode compartments was replaced by an AEM and the
EC was tested at different HRT ( Table 1 ). MEC2 was inoculated
ith effluent from MEC1 (phase AEM2) and was operated for one
onth in fed-batch mode on modified M9 medium to establish an
lectroactive biofilm on the felt before feeding urine. MEC2 was
perated at three different HRT to study the effect on the COD re-
oval efficiency and coulombic efficiency ( Table 1 ).
Influent and effluent samples were taken every 2–4 days, fil-
ered over a 0.22 μm Chromafil® Xtra filter (Macherey-Nagel, PA,
SA) and stored in the fridge (4 °C) prior to analysis. The coulom-
ic efficiency (CE; in this manuscript defined as the ratio between
he real current that was monitored with the potentiostat and the
heoretical current calculated based on the COD removal) was cal-
ulated with the following equation ( Logan et al., 2006 ).
E [ % ] =
100 × current [ A ]
( C O D in − C O D out ) [
g COD L
]× f low rat e
[L d
]× 4 mol e −
mol O 2 ×96 , 485 C
mol e −
32 g O 2
mol O 2 ×( 24 ×60 ×60 ) s d
.2.3. MABR operation
The MABR was inoculated with sludge from a urine nitrifica-
ion reactor (Eawag, Switzerland) and was operated for 10 days in
atch mode and for 35 days in continuous mode on a synthetic so-
ution containing (NH 4 ) 2 SO 4 as N source (1 g N L −1 ), NaHCO 3 and
2 HPO 4 . Subsequently, diluted MEC effluent (16% urine) was dosed
o the reactor and the loading was gradually increased by increas-
ng the influent flow rate (phase MEC I) ( Table 2 ). On day 66 and
2, the urine concentration was increased to 25% urine (MEC II)
nd 33% urine (MEC III), respectively, by decreasing the dilution
f the MEC effluent. At the end of phase MEC III (day 168), one
F bundle was removed for microbial community analysis and the
ABR was fed with a synthetic solution until the start of phase
EC IV. To evaluate the effect of the MEC pre-treatment, the load-
ng was increased until a bulk DO concentration below 0.1 mg O 2
−1 was reached in phase MEC IV. Next, the MABR was operated at
he same N loading but on raw urine (stabilised with NaOH to pre-
ent urea hydrolysis in the influent) instead of MEC effluent for 56
ays (RAW I). In phase RAW II, the air flow rate and recirculation
ate were increased to 1.5 L min
−1 and 16.3 L h
−1 , respectively, to
4 J. De Paepe, K. De Paepe and F. Gòdia et al. / Water Research 185 (2020) 116223
Table 2
Overview of different operational phases of the membrane-aerated biofilm reactor (MABR). Averages and standard deviations are presented. Average influent and effluent
compositions are reported in SI, Section E.
Phase MEC I a MEC II MEC III b MEC IV b RAW I b RAW II MEC V b MEC VI
Number of HF bundles 3 3 3 2 2 2 2 2
Influent MEC1 effluent MEC2 effluent MEC2 effluent MEC2 effluent stabilised urine stabilised urine MEC2 effluent MEC2 effluent
16.7% 25% 33.3% 33.3% 33.3% 33.3% 33.3% 33.3%
Day 1 c - 65 66 - 91 92 - 168 205 - 266 267 - 322 323 - 339 340 - 381 382 - 392
Duration [d] 65 26 77 62 56 17 42 11
Duration (number of HRT) 7.2 4.5 13.4 6.5 6.3 1.8 5.5 1.8
HRT [d] 5.5 ± 0.3 5.8 ± 0.3 5.6 ± 0.2 8.8 ± 0.5 8.8 ± 0.3 9.4 ± 0.3 8.2 ± 0.6 6.2 ± 0.0
N load [mg N d −1 ] 84 ± 6 109 ± 3 151 ± 18 100 ± 8 102 ± 2 101 ± 3 93 ± 4 125 ± 5
N loading rate d [mg N L −1
d −1 ]
129 ± 9 168 ± 5 232 ± 28 198 ± 16 202 ± 4 199 ± 5 183 ± 9 247 ± 9
COD load [mg COD d −1 ] 18 ± 2 22 ± 2 25 ± 5 18 ± 1 101 ± 2 99 ± 2 21 ± 1 27 ± 1
COD loading rate d [mg
COD L −1 d −1 ]
27 ± 3 33 ± 3 38 ± 8 35 ± 3 200 ± 3 196 ± 5 41 ± 2 54 ± 2
NOD
e [mg O 2 /d −1 ] 362 ± 25 472 ± 13 653 ± 78 434 ± 35 443 ± 8 434 ± 11 401 ± 19 542 ± 21
BOD for COD oxidation f
[mg O 2 d −1 ]
0 ± 0 3 ± 2 3 ± 3 8 ± 1 72 ± 1 g 72 ± 2 g 9 ± 1 12 ± 1
Total biological oxygen
demand (NOD + BOD) [mg
O 2 d −1 ]
362 ± 25 475 ± 16 656 ± 81 442 ± 36 514 ± 9 506 ± 13 409 ± 20 554 ± 21
Average DO [mg O 2 L −1 ] 4.82 ± 0.40 4.57 ± 0.72 2.65 ± 0.42 0.10 ± 0.12 0.02 ± 0.01 0.03 ± 0.01 0.04 ± 0.14 0.03 ± 0.01
Temperature [ °C] 27.1 ± 1.3 25.9 ± 1.5 30.4 ± 1.1 22.5 ± 1.0 22.1 ± 1.0 20.0 ± 0.9 22.7 ± 0.9 23.1 ± 0.8
pH influent 9.1 ± 0.1 9.2 ± 0.1 9.1 ± 0.0 9.2 ± 0.1 11.3 ± 0.1 10.8 ± 0.1 9.1 ± 0.0 9.2 ± 0.0
a HRT, N/COD load & loading, oxygen demand and DO are calculated based on data after reaching steady state with a fixed influent flow rate (days 49–65). b HRT, N/COD load & loading and oxygen demand are calculated based on data after the first 3 HRT (steady state). c Day 1 corresponds to the first day that the reactor was operated on MEC effluent (45 days after start-up of the reactor). d The loading was calculated taking into account the total reactor volume (MEC I-III = 650 mL, MEC IV-VI and RAW I-II = 500 mL). e The Nitrogenous Oxygen Demand (NOD) was estimated assuming 4.33 g O 2 g −1 N for nitrification. f The Biological Oxygen Demand (BOD) for COD oxidation is estimated assuming that all COD is removed aerobically, consuming 0.8 g O 2 g −1 COD removed (i.e., cell yield
of 0.2). g The BOD for COD oxidation is overestimated in RAW I and RAW II since a part of the COD was removed using nitrate as an electron-acceptor instead of oxygen.
w
t
i
s
a
b
a
a
o
t
a
l
a
a
d
c
2
T
a
b
t
2
2
(
O
3
H
s
i
g
G
s
t
w
enhance the oxygen mass transfer. Afterwards, the MABR was op-
erated again on MEC effluent at the same N loading and initial air
flow rate and recirculation rate (0.65–0.75 L min
−1 and 11 L h
−1 ,
respectively) (phase MEC V). Between phase RAW II and MEC V, no
influent was dosed for two days to allow oxidation of the TAN that
accumulated during RAW II. In phase MEC VI, the N loading was
further increased.
Influent and effluent samples were taken every 2–4 days, fil-
tered over a 0.22 μm Chromafil® Xtra filter (Macherey-Nagel, PA,
USA) and stored in the fridge (4 °C) prior to analysis.
2.3. Analytical methods
Ions were analysed on a compact ion chromatograph equipped
with a conductivity detector (Metrohm 930 with Metrosep A
supp 5-150/4.0 column for anions and Metrohm 761 with Met-
rosep A supp 5-150/4.0 column for cations, Metrohm, Switzer-
land). The TAN concentration in the MABR effluent (low concen-
tration) was determined according to the Montgomerey reaction
( Montgomery and Dymock 1961 ) with a Tecan infinite plate reader
(Infinite® F50 Absorbance Microplate Reader, Tecan Trading AG,
Switzerland). Nanocolor tube test kits (Nanocolor® TN220 and
Nanocolor® COD160/1500, Macherey-Nagel, PA, USA) were used to
measure the total nitrogen (TN) and COD concentration. The elec-
trical conductivity was measured with a conductivity meter (Con-
sort C6010 with a Metrohm 6.0912.110 conductivity probe) and pH
measurements were performed with a portable pH meter (C5010,
Consort bvba, Belgium).
2.4. Microbial community analysis
Samples from both reactors were collected throughout the ex-
periments for microbial community analysis. The different MEC
microenvironments (MEC anolyte, graphite granules and/or felt)
ere sampled at the end of each experiment ( Table 1 ). One of
he MABR bundles (MABR bundle 1) was sacrificed for sequenc-
ng after phase MEC III and another bundle (MABR bundle 2) was
ampled after MEC VI ( Table 2 ). Biomass from the flocs, fibers,
nd firmly attached biomass (after scraping off loosely attached
iomass from the fibers) were collected. The samples were stored
t −20 °C prior to DNA extraction and quality control, performed
s described by De Paepe et al. (2017) . DNA extracts were sent
ut to BaseClear BV (Leiden,The Netherlands) for library prepara-
ion and sequencing of the V3-V4 region of the 16S rRNA gene on
n Illumina Miseq platform (Illumina, Hayward, CA, US) with Il-
umina MiSeq v3 chemistry and using the 341F-785R primerpair
dopted from Klindworth et al. (2013) . The sequence data are avail-
ble at the NCBI (National Center for Biotechnology Information)
atabase under accession number PRJNA572564. The data was pro-
essed with the mothur software package (v.1.40.5) ( Schloss et al.,
009 ) as outlined by De Paepe et al. (2017) . OTUs (Operational
axonomic Units) were defined as a collection of sequences with
length between 393 and 429 nucleotides that were found to
e more than 97% similar to one another in the V3-V4 region of
heir 16S rRNA gene after applying OptiClust clustering ( Chen et al.,
013 ; Schloss and Westcott 2011 ; Schloss et al., 2009 ; Wang et al.,
012 ). Taxonomy was assigned using the silva.nr_v132 database
Cole et al., 2014 ; Quast et al., 2013 ; Wang et al., 2007 ). The
TU table with taxonomy assignment was loaded into R, version
.6.1 (2019-07-05), and singletons were removed ( McMurdie and
olmes 2014 ; R Core Team 2016 ). A Principle Coordinate Analy-
is (PCoA; package stats 4.3.6.1) was used to explore differences
n microbial community composition, which were visualised with
gplot2 version 3.2.1 ( Becker et al., 1988 ; Cailliez 1983 ; Cox 2001 ;
ower 1966 ; Ramette 2007 ; Wickham 2009 ). For this purpose, the
hared file (including the duplicate samples) was filtered based on
he arbitrary cut-offs described by McMurdie and Holmes (2014) ,
hereby OTUs observed in less than 5% of the samples and with

J. De Paepe, K. De Paepe and F. Gòdia et al. / Water Research 185 (2020) 116223 5
Fig. 2. COD removal (A-B), current density (C-D), electron balance (E-F) and nitrogen balance (G-H) of MEC1 operated with an AEM at a HRT of 4.1 days (MEC1-AEM2)
and MEC2 operated with a CEM at a HRT of 4.3 days (MEC2-CEM1). Different batches of urine were fed to the MECs, as indicated by the dashed lines on the graphs. The
equations used to calculate the electron balance are given in SI Section D.
r
T
j
(
2
o
p
3
3
h
i
i
e
p
t
c
t
a
c
j
p
c
C
T
T
e
a
o
c
4
r
ead counts below 0.5 times the number of samples were removed.
he data was rescaled to proportions and the abundance based
accard dissimilarity matrix was calculated (package vegan 2.4–3)
Anderson et al., 2006 ; Borcard et al., 2011 ; McMurdie and Holmes
014 ; Oksanen et al., 2016 ). On the genus level, weighted averages
f genera abundances were a posteriori added to the ordination
lot, using the wascores function in vegan ( Oksanen et al., 2016 ).
. Results
.1. COD removal, current production, coulombic efficiency and urea
ydrolysis in the MEC
The primary goal of the MEC was to remove organics from urine
n an energy-efficient way, as to prevent N loss via denitrification
n the MABR. Due to the use of different batches of urine, the influ-
nt COD concentration and load were varying over time, as exem-
lified in Fig. 2 A and B for MEC1-AEM2 and MEC2-CEM1, respec-
ively. Despite the fluctuating influent COD concentration, the COD
oncentration in the effluent remained stable. Electroactive bac-
eria transferred the electrons obtained by COD oxidation to the
node, generating an electric current from anode to cathode. The
urrent density ranged between 0.5 and 2 A m
−2 (membrane pro-
ected surface) in all experiments ( Table 3 ), and followed the same
attern as the influent COD concentration, i.e., a high influent COD
oncentration resulted in a higher current ( Fig. 2 C-D). Apart from
OD removal, urea hydrolysis took place in the MEC, increasing the
AN/TN ratio from < 10% (influent) to ~100% (effluent) ( Fig. 2 G-H,
able 3 ).
MEC1 was initially operated with a CEM separating the two
lectrode compartments and achieved COD removal efficiencies
round 80% at an HRT of 6.6 days and an average COD loading
f 22.4 ± 5.3 g COD m
−2 d
−1 ( Table 3 , MEC1-CEM). The average
urrent density was 1.0 ± 0.3 A m
−2 ( Table 3 ), which was about
2% of the current that was expected based on the observed COD
emoval (i.e., coulombic efficiency). Because of the electron flow
6 J. De Paepe, K. De Paepe and F. Gòdia et al. / Water Research 185 (2020) 116223
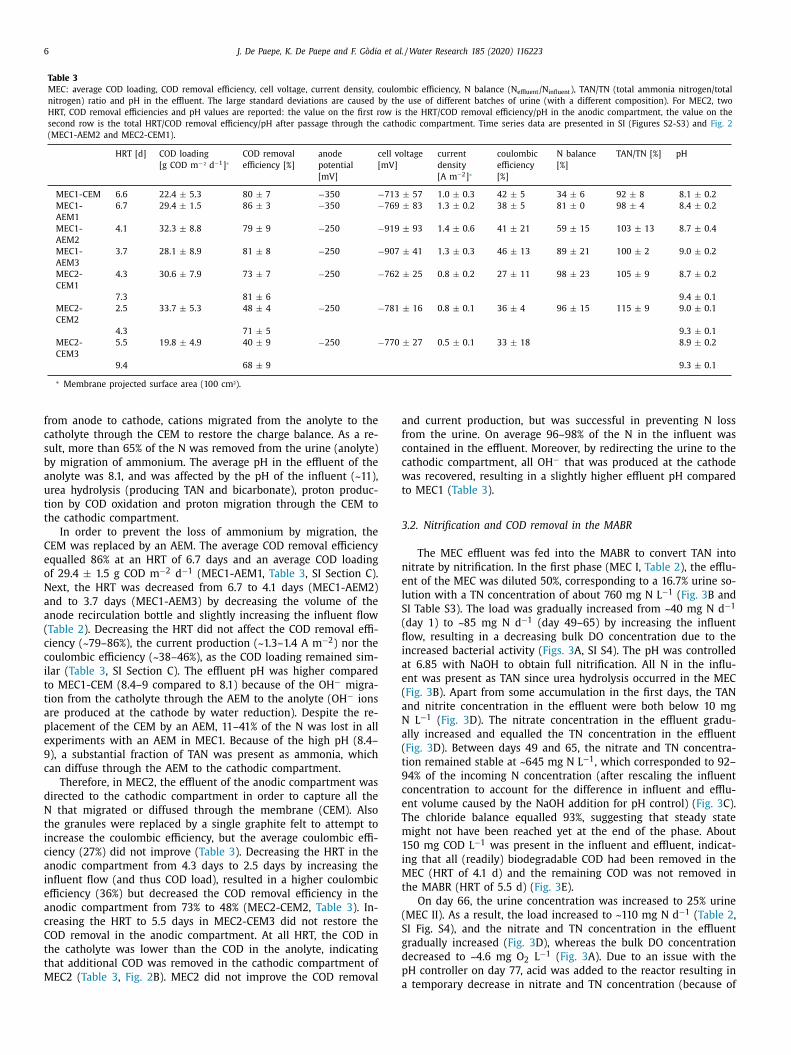
Table 3
MEC: average COD loading, COD removal efficiency, cell voltage, current density, coulombic efficiency, N balance (N effluent /N influent ), TAN/TN (total ammonia nitrogen/total
nitrogen) ratio and pH in the effluent. The large standard deviations are caused by the use of different batches of urine (with a different composition). For MEC2, two
HRT, COD removal efficiencies and pH values are reported: the value on the first row is the HRT/COD removal efficiency/pH in the anodic compartment, the value on the
second row is the total HRT/COD removal efficiency/pH after passage through the cathodic compartment. Time series data are presented in SI (Figures S2-S3) and Fig. 2
(MEC1-AEM2 and MEC2-CEM1).
HRT [d] COD loading
[g COD m
−² d −1 ] ∗COD removal
efficiency [%]
anode
potential
[mV]
cell voltage
[mV]
current
density
[A m
−2 ] ∗
coulombic
efficiency
[%]
N balance
[%]
TAN/TN [%] pH
MEC1-CEM 6.6 22.4 ± 5.3 80 ± 7 −350 −713 ± 57 1.0 ± 0.3 42 ± 5 34 ± 6 92 ± 8 8.1 ± 0.2
MEC1-
AEM1
6.7 29.4 ± 1.5 86 ± 3 −350 −769 ± 83 1.3 ± 0.2 38 ± 5 81 ± 0 98 ± 4 8.4 ± 0.2
MEC1-
AEM2
4.1 32.3 ± 8.8 79 ± 9 −250 −919 ± 93 1.4 ± 0.6 41 ± 21 59 ± 15 103 ± 13 8.7 ± 0.4
MEC1-
AEM3
3.7 28.1 ± 8.9 81 ± 8 −250 −907 ± 41 1.3 ± 0.3 46 ± 13 89 ± 21 100 ± 2 9.0 ± 0.2
MEC2-
CEM1
4.3 30.6 ± 7.9 73 ± 7 −250 −762 ± 25 0.8 ± 0.2 27 ± 11 98 ± 23 105 ± 9 8.7 ± 0.2
7.3 81 ± 6 9.4 ± 0.1
MEC2-
CEM2
2.5 33.7 ± 5.3 48 ± 4 −250 −781 ± 16 0.8 ± 0.1 36 ± 4 96 ± 15 115 ± 9 9.0 ± 0.1
4.3 71 ± 5 9.3 ± 0.1
MEC2-
CEM3
5.5 19.8 ± 4.9 40 ± 9 −250 −770 ± 27 0.5 ± 0.1 33 ± 18 8.9 ± 0.2
9.4 68 ± 9 9.3 ± 0.1
∗ Membrane projected surface area (100 cm ²).
a
f
c
c
w
t
3
n
e
l
S
(
fl
i
a
e
(
a
N
a
(
t
9
c
e
T
m
1
i
M
t
(
S
g
d
p
from anode to cathode, cations migrated from the anolyte to the
catholyte through the CEM to restore the charge balance. As a re-
sult, more than 65% of the N was removed from the urine (anolyte)
by migration of ammonium. The average pH in the effluent of the
anolyte was 8.1, and was affected by the pH of the influent (~11),
urea hydrolysis (producing TAN and bicarbonate), proton produc-
tion by COD oxidation and proton migration through the CEM to
the cathodic compartment.
In order to prevent the loss of ammonium by migration, the
CEM was replaced by an AEM. The average COD removal efficiency
equalled 86% at an HRT of 6.7 days and an average COD loading
of 29.4 ± 1.5 g COD m
−2 d
−1 (MEC1-AEM1, Table 3 , SI Section C).
Next, the HRT was decreased from 6.7 to 4.1 days (MEC1-AEM2)
and to 3.7 days (MEC1-AEM3) by decreasing the volume of the
anode recirculation bottle and slightly increasing the influent flow
( Table 2 ). Decreasing the HRT did not affect the COD removal effi-
ciency (~79–86%), the current production (~1.3–1.4 A m
−2 ) nor the
coulombic efficiency (~38–46%), as the COD loading remained sim-
ilar ( Table 3 , SI Section C). The effluent pH was higher compared
to MEC1-CEM (8.4–9 compared to 8.1) because of the OH
− migra-
tion from the catholyte through the AEM to the anolyte (OH
− ions
are produced at the cathode by water reduction). Despite the re-
placement of the CEM by an AEM, 11–41% of the N was lost in all
experiments with an AEM in MEC1. Because of the high pH (8.4–
9), a substantial fraction of TAN was present as ammonia, which
can diffuse through the AEM to the cathodic compartment.
Therefore, in MEC2, the effluent of the anodic compartment was
directed to the cathodic compartment in order to capture all the
N that migrated or diffused through the membrane (CEM). Also
the granules were replaced by a single graphite felt to attempt to
increase the coulombic efficiency, but the average coulombic effi-
ciency (27%) did not improve ( Table 3 ). Decreasing the HRT in the
anodic compartment from 4.3 days to 2.5 days by increasing the
influent flow (and thus COD load), resulted in a higher coulombic
efficiency (36%) but decreased the COD removal efficiency in the
anodic compartment from 73% to 48% (MEC2-CEM2, Table 3 ). In-
creasing the HRT to 5.5 days in MEC2-CEM3 did not restore the
COD removal in the anodic compartment. At all HRT, the COD in
the catholyte was lower than the COD in the anolyte, indicating
that additional COD was removed in the cathodic compartment of
MEC2 ( Table 3 , Fig. 2 B). MEC2 did not improve the COD removal
and current production, but was successful in preventing N loss
rom the urine. On average 96–98% of the N in the influent was
ontained in the effluent. Moreover, by redirecting the urine to the
athodic compartment, all OH
− that was produced at the cathode
as recovered, resulting in a slightly higher effluent pH compared
o MEC1 ( Table 3 ).
.2. Nitrification and COD removal in the MABR
The MEC effluent was fed into the MABR to convert TAN into
itrate by nitrification. In the first phase (MEC I, Table 2 ), the efflu-
nt of the MEC was diluted 50%, corresponding to a 16.7% urine so-
ution with a TN concentration of about 760 mg N L −1 ( Fig. 3 B and
I Table S3). The load was gradually increased from ~40 mg N d
−1
day 1) to ~85 mg N d
−1 (day 49–65) by increasing the influent
ow, resulting in a decreasing bulk DO concentration due to the
ncreased bacterial activity ( Figs. 3 A, SI S4). The pH was controlled
t 6.85 with NaOH to obtain full nitrification. All N in the influ-
nt was present as TAN since urea hydrolysis occurred in the MEC
Fig. 3 B). Apart from some accumulation in the first days, the TAN
nd nitrite concentration in the effluent were both below 10 mg
L −1 ( Fig. 3 D). The nitrate concentration in the effluent gradu-
lly increased and equalled the TN concentration in the effluent
Fig. 3 D). Between days 49 and 65, the nitrate and TN concentra-
ion remained stable at ~645 mg N L −1 , which corresponded to 92–
4% of the incoming N concentration (after rescaling the influent
oncentration to account for the difference in influent and efflu-
nt volume caused by the NaOH addition for pH control) ( Fig. 3 C).
he chloride balance equalled 93%, suggesting that steady state
ight not have been reached yet at the end of the phase. About
50 mg COD L −1 was present in the influent and effluent, indicat-
ng that all (readily) biodegradable COD had been removed in the
EC (HRT of 4.1 d) and the remaining COD was not removed in
he MABR (HRT of 5.5 d) ( Fig. 3 E).
On day 66, the urine concentration was increased to 25% urine
MEC II). As a result, the load increased to ~110 mg N d
−1 ( Table 2 ,
I Fig. S4), and the nitrate and TN concentration in the effluent
radually increased ( Fig. 3 D), whereas the bulk DO concentration
ecreased to ~4.6 mg O 2 L −1 ( Fig. 3 A). Due to an issue with the
H controller on day 77, acid was added to the reactor resulting in
temporary decrease in nitrate and TN concentration (because of
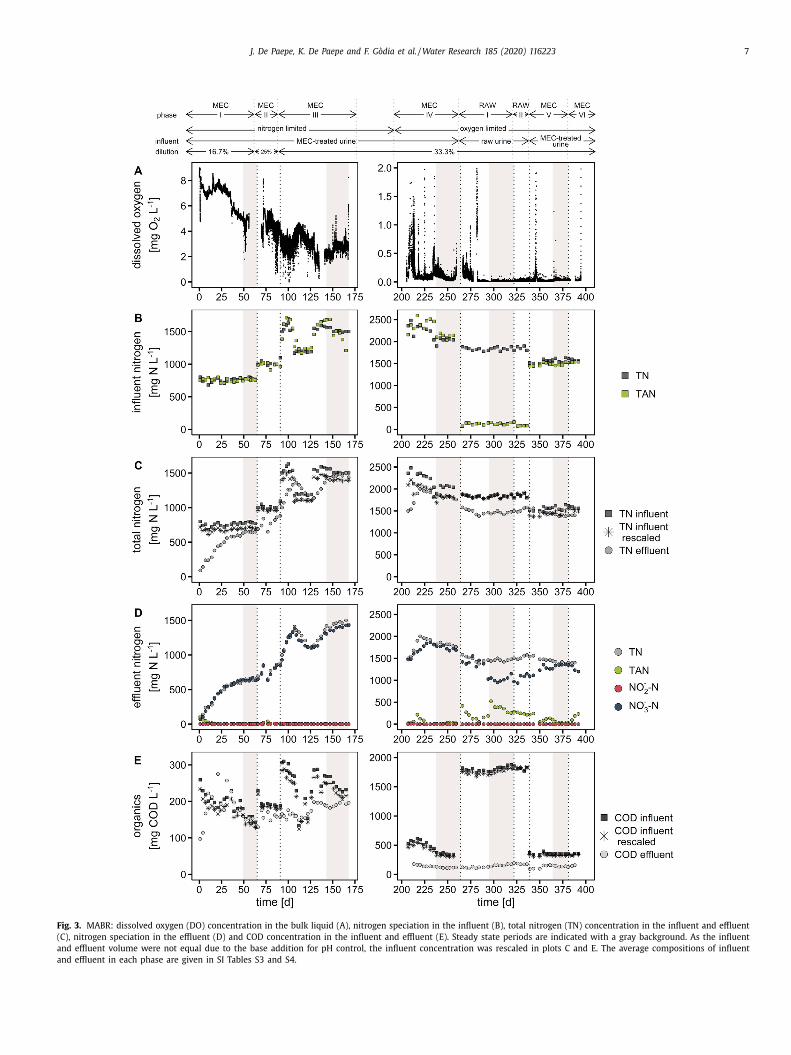
J. De Paepe, K. De Paepe and F. Gòdia et al. / Water Research 185 (2020) 116223 7
Fig. 3. MABR: dissolved oxygen (DO) concentration in the bulk liquid (A), nitrogen speciation in the influent (B), total nitrogen (TN) concentration in the influent and effluent
(C), nitrogen speciation in the effluent (D) and COD concentration in the influent and effluent (E). Steady state periods are indicated with a gray background. As the influent
and effluent volume were not equal due to the base addition for pH control, the influent concentration was rescaled in plots C and E. The average compositions of influent
and effluent in each phase are given in SI Tables S3 and S4.
8 J. De Paepe, K. De Paepe and F. Gòdia et al. / Water Research 185 (2020) 116223
a
m
t
d
fl
n
M
o
s
s
s
p
M
t
r
a
g
a
i
a
a
d
t
c
2
S
T
w
t
c
c
m
1
p
t
t
d
C
t
f
(
t
C
s
c
a
c
M
M
i
t
a
o
t
i
a
1
t
m
a
u
(
the dilution with acid) and some TAN accumulation (41 mg TAN
L −1 ).
On day 92, the urine concentration was further increased
to 33.3% urine (MEC III). The load fluctuated between 130 and
160 mg N d
−1 , due to the use of different batches of MEC effluent
with a different N concentration (~1500 mg N L −1 (day 92–106),
~1200 mg N L −1 (day 107–128) and ~1500 mg N L −1 (day 129–
168), Fig. 3 B, SI Fig. S4). Also the nitrate and TN concentration in
the effluent and the bulk DO concentration varied between 1100
and 1500 mg N L −1 and 2–4 mg O 2 L −1 , respectively ( Fig. 3 A,D).
The TN concentration in the effluent coincided with the (rescaled)
influent, when steady state was reached (day 143–168), whereas
the COD concentration in the effluent was ~16% lower than the
(rescaled) influent concentration, indicating some COD removal by
heterotrophic bacteria in the MABR.
From MEC I to III, the bulk DO concentration dropped because
of the increasing influent flow rate (in MEC I) or increased urine
concentration (MEC II & III), but was still higher than 2 mg O 2 L −1 .
Therefore, in MEC IV, the load was further increased until a DO
below 0.2 mg O 2 L −1 was reached, at a load of ~100 mg N d
−1 .
This load was lower compared to the load during MEC II-III, since
the MABR, after sacrifying one HF bundle for microbial commu-
nity analysis, only consisted of two HF bundles. Apart from some
TAN accumulation at the start (day 207–224), full nitrification was
obtained and no N losses were observed (rescaled TN influent co-
incided with TN effluent, Fig. 3 C-D) at an average bulk DO con-
centration of 0.1 mg O 2 L −1 . The COD concentration in the effluent
(116 ± 7 mg COD L −1 ) was 63% lower than the (rescaled) concen-
tration in the influent (355 ± 13 mg COD L −1 ).
In the next phase (RAW I), the MABR was operated at the same
N load (~100 mg N d
−1 ) but on diluted raw urine (33.3%), which
was stabilised (i.e., NaOH was added to obtain a pH > 11, in order
to inhibit urea hydrolysis in the influent) but not treated in a MEC.
Unlike the MEC effluent in which all N was present as TAN, organic
N was the predominant N species in the raw urine ( Fig. 3 B). Only
~7% of the TN in the influent (~1850 mg N L −1 ) was TAN (~135 mg
N L −1 ), requiring urea hydrolysis in the MABR. Furthermore, with-
out pre-treatment in the MEC, the COD concentration in the influ-
ent was substantially higher (1850 mg COD L −1 compared to only
355 mg COD L −1 in MEC IV) ( Fig. 3 E). The COD concentration in
the effluent did not increase ( Fig. 3 E), thus the MABR was able to
remove all (readily) biodegradable COD (91% of the incoming COD).
However, the higher COD load and oxygen demand hampered ni-
trification, with oxygen becoming a limiting substrate, resulting in
partial nitrification. The effluent contained 20–25% TAN and 70–
75% nitrate from day 297 onwards ( Fig. 3 D). The oxygen limitation
furthermore gave rise to denitrification, with a TN concentration in
the effluent ~18% lower than the (rescaled) TN concentration in the
influent.
On day 323, the air flow rate and recirculation rate were in-
creased to enhance the oxygen mass transfer through the hollow
fiber membranes (RAW II). As a result, the TAN concentration in
the effluent decreased (14% of the TN concentration), while the
TN concentration in the effluent slightly increased (83.4% of the
rescaled TN concentration) ( Fig. 3 C-D).
Subsequently, the MABR was operated again on MEC effluent at
the same N load of 100 mg N d
−1 (MEC V), reverting successfully
to full nitrification without N loss ( Fig. 3 C-D).
In a last phase (MEC VI), the MABR was operated on MEC efflu-
ent but at a load of 125 mg N d
−1 , resulting in DO limitation and
TAN accumulation, but without N loss, showing robustness against
variable N loading ( Fig. 3 C-D).
3.3. Microbial community composition of MEC and MABR
Amplicon 16S rRNA gene Illumina sequencing and principle co-
ordinate analyses (SI Figs. S11, S16 and S17) revealed that the MEC
nd MABR units were characterised by very distinct and diverse
icrobial communities ( Fig. 4 -SI Figs. S7-S17). This divergence in
he first place stems from the different inocula that were intro-
uced into the MEC and MABR. MEC1 was inoculated with ef-
uent originating from an active MEC (fed with fermenter super-
atant) and effluent from MEC1 was used to inoculate MEC2. The
ABR was inoculated with sludge from a urine nitrification reactor
perated at Eawag (Switzerland). The communities were further
haped by the different conditions (anoxic versus oxic, high ver-
us low COD loading, different pH and conductivity) resulting in
table communities adapted to carry out the particular biological
rocesses (i.e., anodic COD oxidation versus nitrification) in both
EC and MABR, even despite the influx of MEC effluent in the lat-
er.
At phylum and family level, the MEC was rich in Proteobacte-
ia (~50%, mainly Burkholderiaceae, Geobacteraceae and Pseudomon-
daceae ), Bacteroidetes (~25%, including Lentimicrobiaceae and Dys-
onomonadaceae ) and Firmicutes (~25%, mainly Carnobacteriaceae
nd Clostridiaceae ) (SI Figs. S7-S8), whereas the MABR was dom-
nated by Bacteroidetes (~40%, amongst others Chitinophagaceae
nd Saprospiraceae ), Proteobacteria (~30%, including Burkholderi-
ceae and Nitrosomonadaceae ) and Actinobacteria (~15%, e.g., Nocar-
iaceae ) (SI Figs. S12-S13).
At genus level, the MEC community was dominated by Geobac-
er, Pseudomonas, Arcobacter and Comamonas , genera known to
omprise electroactive bacteria ( Bond et al., 2002 ; Logan et al.,
019 ; Rabaey et al., 2004 ; Xing et al., 2010 ) (SI Figs. S9-
10). Furthermore, alkaliphilic genera (Alcaligenes and Alkalibacter),
hiopseudomonas, Lentimicrobiaceae, Proteiniphilum, and Tissierella
ere abundant (pH was ~9 in MEC). Interestingly, a member of
he Tissierella genus (Tissierella creatinophila) is able to grow on
reatinine (one of the main COD compounds in urine) as sole
arbon and energy source and degrades creatinine to acetate,
onomethylamine, ammonia and carbon dioxide ( Harms et al.,
998 ).
Although their relative abundance varied strongly across sam-
les, this core set of genera dominated the microbial community
hroughout time regardless of modifications in reactor configura-
ion and operation, except for Synergisteaceae which were abun-
ant in the inoculum (~15%) and initially also in the MEC (MEC1-
EM), but almost disappeared afterwards (SI Figure S8). Besides
he absence of a temporal effect, there were no consistent dif-
erences in microbial community between the microenvironments
i.e., anolyte, felt or granules) ( Fig. 4 , SI Figs. S7-S11). Even samples
aken at the same moment from the graphite felt used in MEC2-
EM3 were different. This indicates that stochastic effects are re-
ponsible for the observed differences between samples and mi-
roenvironments and that there is no niche preference (no specific
ssociation of certain community members with the different mi-
roenvironments).
While (strictly) anaerobic genera prevailed in the MEC, the
ABR was dominated by aerobic genera, including Nitrosomonas,
oheibacter and Gordonia ( Fig. 4 ). About 5–10% of the community
n the MABR was a member of the ammonium oxidizing genus Ni-
rosomonas. Nitrosospira , another AOB genus, was also present but
t lower relative abundances ( < 0.5%). Members of known nitrite
xidizing genera ( Nitrobacter, Nitrospira ) were not retrieved, even
hough nitratation occurred in the MABR.
Samples originating from bundles 1 and 2 clustered separately
n a principle coordinate analysis (PCoA) analysis at genus level
nd were clearly different from the inoculum (SI Fig. S16). Bundle
was harvested after MEC III (operation without oxygen limita-
ion), whereas bundle 2 was harvested at the end of the experi-
ent (after MEC VI), including the period with oxygen limitation
nd operation on raw urine with a high COD concentration and
rea as main N source. Bundle 2 was more enriched in PHOS-HE36
member of Ignavibacteria ) and UTCFX1 (belonging to the Anaero-
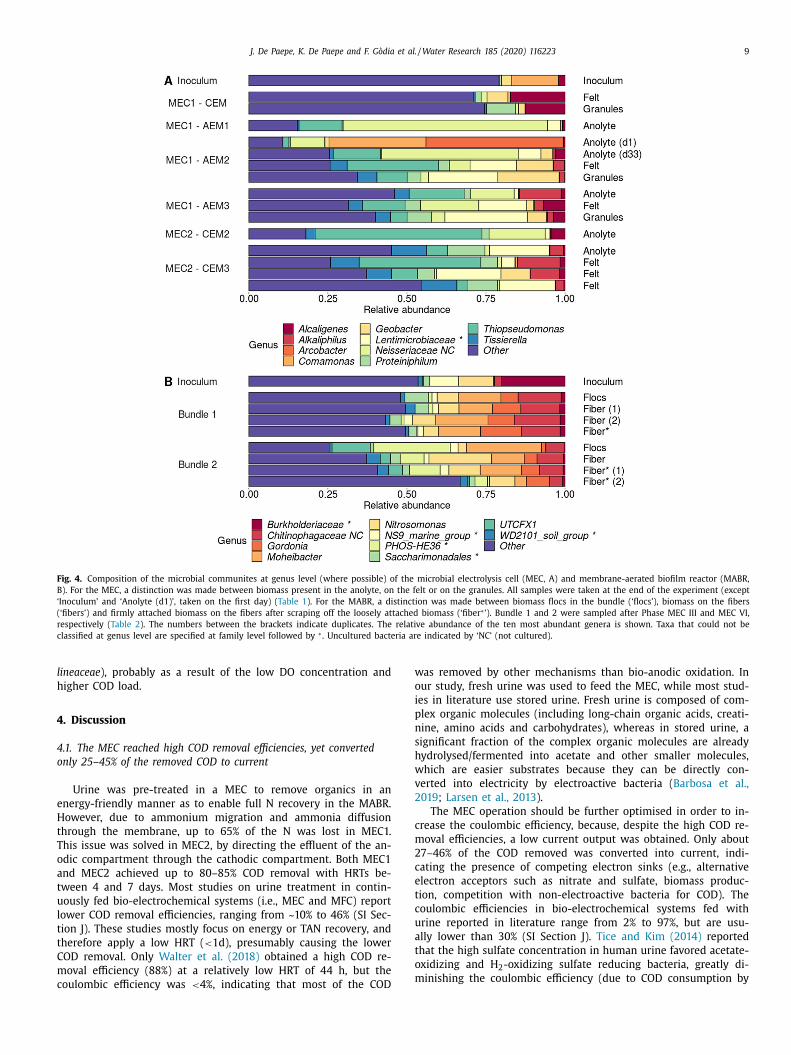
J. De Paepe, K. De Paepe and F. Gòdia et al. / Water Research 185 (2020) 116223 9
Fig. 4. Composition of the microbial communites at genus level (where possible) of the microbial electrolysis cell (MEC, A) and membrane-aerated biofilm reactor (MABR,
B). For the MEC, a distinction was made between biomass present in the anolyte, on the felt or on the granules. All samples were taken at the end of the experiment (except
‘Inoculum’ and ‘Anolyte (d1)’, taken on the first day) ( Table 1 ). For the MABR, a distinction was made between biomass flocs in the bundle (‘flocs’), biomass on the fibers
(‘fibers’) and firmly attached biomass on the fibers after scraping off the loosely attached biomass (‘fiber ∗ ’). Bundle 1 and 2 were sampled after Phase MEC III and MEC VI,
respectively ( Table 2 ). The numbers between the brackets indicate duplicates. The relative abundance of the ten most abundant genera is shown. Taxa that could not be
classified at genus level are specified at family level followed by ∗ . Uncultured bacteria are indicated by ‘NC’ (not cultured).
l
h
4
4
o
e
H
t
T
o
a
t
u
l
t
t
C
m
c
w
o
i
p
n
s
h
w
v
2
c
m
2
c
e
t
c
u
a
t
o
m
ineaceae ), probably as a result of the low DO concentration and
igher COD load.
. Discussion
.1. The MEC reached high COD removal efficiencies, yet converted
nly 25–45% of the removed COD to current
Urine was pre-treated in a MEC to remove organics in an
nergy-friendly manner as to enable full N recovery in the MABR.
owever, due to ammonium migration and ammonia diffusion
hrough the membrane, up to 65% of the N was lost in MEC1.
his issue was solved in MEC2, by directing the effluent of the an-
dic compartment through the cathodic compartment. Both MEC1
nd MEC2 achieved up to 80–85% COD removal with HRTs be-
ween 4 and 7 days. Most studies on urine treatment in contin-
ously fed bio-electrochemical systems (i.e., MEC and MFC) report
ower COD removal efficiencies, ranging from ~10% to 46% (SI Sec-
ion J). These studies mostly focus on energy or TAN recovery, and
herefore apply a low HRT ( < 1d), presumably causing the lower
OD removal. Only Walter et al. (2018) obtained a high COD re-
oval efficiency (88%) at a relatively low HRT of 44 h, but the
oulombic efficiency was < 4%, indicating that most of the COD
as removed by other mechanisms than bio-anodic oxidation. In
ur study, fresh urine was used to feed the MEC, while most stud-
es in literature use stored urine. Fresh urine is composed of com-
lex organic molecules (including long-chain organic acids, creati-
ine, amino acids and carbohydrates), whereas in stored urine, a
ignificant fraction of the complex organic molecules are already
ydrolysed/fermented into acetate and other smaller molecules,
hich are easier substrates because they can be directly con-
erted into electricity by electroactive bacteria ( Barbosa et al.,
019 ; Larsen et al., 2013 ).
The MEC operation should be further optimised in order to in-
rease the coulombic efficiency, because, despite the high COD re-
oval efficiencies, a low current output was obtained. Only about
7–46% of the COD removed was converted into current, indi-
ating the presence of competing electron sinks (e.g., alternative
lectron acceptors such as nitrate and sulfate, biomass produc-
ion, competition with non-electroactive bacteria for COD). The
oulombic efficiencies in bio-electrochemical systems fed with
rine reported in literature range from 2% to 97%, but are usu-
lly lower than 30% (SI Section J). Tice and Kim (2014) reported
hat the high sulfate concentration in human urine favored acetate-
xidizing and H 2 -oxidizing sulfate reducing bacteria, greatly di-
inishing the coulombic efficiency (due to COD consumption by
10 J. De Paepe, K. De Paepe and F. Gòdia et al. / Water Research 185 (2020) 116223
w
w
g
d
U
o
l
4
l
i
h
(
w
l
s
c
s
t
l
u
t
i
o
s
t
1
t
t
2
c
e
N
v
s
4
r
e
p
a
t
t
h
c
a
r
r
o
(
m
c
b
4
t
w
c
p
acetate-oxidizing sulfate reducers) and energy recovery (due to H 2
consumption by H 2 -oxidizing sulfate reducers) in a MEC coupled
with an IEM stack. In an attempt to identify the reason for the
low coulombic efficiency in our experiments, an electron balance
was made in Fig. 2 E-F and SI Section D. About 20% of the incom-
ing COD (and electrons) was not converted and was still present
in the effluent. A part of the electrons generated by COD oxidation
was incorporated into biomass. This fraction was estimated at ~10%
based on the volatile suspended solids concentration in the MEC.
The fraction of electrons going to alternative electron acceptors
was minimal, since the nitrate and oxygen concentration were neg-
ligible and only a small amount of sulfate disappeared (15–33 mg
SO 4 L −1 in MEC1 and 57–177 mg SO 4 L −1 in MEC2, compared to
1–2.3 g COD L −1 ). As demonstrated in Fig. 2 E-F, the electron bal-
ance could not be closed by adding up all the abovementioned
electron sinks. Fermentation and methanogenesis are also known
to decrease the coulombic efficiencies in bio-electrochemical sys-
tems because of substrate consumption via these metabolic path-
ways ( Logan et al., 2006 ). In general, methanogens are highly sen-
sitive to free ammonia (FA) ( Kuntke et al., 2018 ; Sprott and Pa-
tel 1986 ; Yenigün and Demirel 2013 ), which makes methanogenis
unlikely in our MEC, because of the high pH and high N concen-
tration ( > 750 mg FA L −1 ). The headspace of the anolyte recircula-
tion vessel was sampled two times and no methane was detected
with gas chromatography. Fermentation is more likely because of
the presence of fermentable compounds in urine (e.g., lactate and
glucose) ( Barbosa et al., 2019 ). When complex organic molecules
are fermented into simpler organic molecules (e.g., acetate), part
of the COD is converted into hydrogen gas, which is a poor sub-
strate for electroactive bacteria but a good electron donor for hy-
drogenotrophic methanogens, using bicarbonate as a terminal elec-
tron acceptor ( Lee and Rittmann 2010 ; Lee et al., 2008 ). Further de-
creasing the HRT or adapting the anode potential could potentially
favor electrogens compared to fermentative or methanogenic bac-
teria and thereby increase the coulombic efficiency. Analysing the
different COD compounds in the influent and effluent could also
gain new insights.
4.2. Upstream bio-anodic COD oxidation effectively prevented
denitrification in the MABR
The MEC effluent was fed into a nitrification MABR to convert
all TAN into nitrate. Overall, full nitrification (effluent TAN and
NO 2 −- N < 5 mg N L −1 ) without N loss was obtained when the
MABR was operated on MEC effluent at N loads up to 100 mg N
d
−1 and bulk DO levels as low as 0.1 mg O 2 L −1 . The COD concen-
tration in the MABR effluent was slightly lower than the influent
concentration, indicating some COD removal. Yet, the oxygen de-
mand for COD oxidation was less than 2% of the total oxygen de-
mand ( Table 2 ). In MEC IV, about ~160 mg O 2 L −1 was consumed
for COD oxidation (assuming that all COD was aerobically removed
consuming 0.8 g O 2 g −1 COD removed), while more than 7800 mg
O 2 L −1 was required for nitrification (assuming that 4.33 g of oxy-
gen is consumed per g of nitrate-N produced). Only in case of over-
loading (in MEC VI), TAN accumulated, but no N losses were ob-
served.
In contrast, feeding the MABR directly with raw urine yielded
TAN accumulation and N loss at a N load of 100 mg N d
−1 due
to the high COD influx in the MABR. The nitrification oxygen de-
mand (NOD) was in line with MEC IV, whereas the oxygen demand
for COD oxidation was significantly higher (72 mg O 2 d
−1 com-
pared to < 10 mg O 2 d
−1 ) ( Table 2 ). Although the oxygen demand
for COD oxidation was less than 15% of the total oxygen demand,
the increase in oxygen demand for COD oxidation led to oxygen
limitation, resulting in TAN accumulation and N loss due to den-
itrification. It was estimated that about 70% of the COD removed
as removed via denitrification, based on the amount of N that
as lost and assuming a COD/N ratio of 3.6 (cell yield of 0.2).
Interestingly, TAN (and not nitrite) accumulated in case of oxy-
en limitation, whereas many studies report nitrite build-up un-
er DO limited conditions ( Feng et al., 2008 ; Udert et al., 2003a ;
dert and Wachter 2012 ). Generally, NOB have a lower affinity to
xygen than AOB ( Udert et al., 2003a ), resulting in nitrite accumu-
ation at low DO concentrations.
.3. Both MEC and MABR showed robustness against fluctuating
oading rates and operational conditions
Both the MEC and MABR were challenged with various load-
ng rates and operational scenarios. The COD loading in the MEC
ighly fluctuated because of the use of different urine batches
with a different COD concentration) and because different HRT
ere tested. Despite these fluctuations in influent composition and
oading, the influent COD concentration in the effluent remained
table, demonstating the robustness of the MEC. Also the MABR
ould handle different N and COD concentrations and loads. After
tart-up, the N load was gradually increased from ~40 mg N d
−1
o ~150 mg N d
−1 ( Table 2 , Fig. S4), corresponding with volumetric
oading rates of 60–230 mg N L −1 d
−1 when the total MABR vol-
me is taken into account or 150–560 mg N L −1 d
−1 when only
he active volume (i.e., total volume of the hollow fiber modules)
s considered. A nitrification activity test (presented in Section G
f SI) demonstrated that the mixed liquor in the recirculation ves-
els and loop was not active. In MEC IV and VI, the load was fur-
her increased to 10 0 mg N d
−1 (20 0 or 560 mg N L −1 d
−1 ) and
25 mg N d
−1 (250 or 700 mg N L −1 d
−1 ), respectively. By shifting
he influent from MEC effluent to raw urine, the COD concentra-
ion and load increased from 350 to 1850 mg COD L −1 and from
0 to 100 mg COD d
−1 , respectively. More than 90% of the COD
ould be removed, maintaining the COD concentration in the efflu-
nt < 200 mg COD L −1 . Also, after the period on raw urine with
loss and TAN accumulation, the MABR performance could be re-
erted successfully to full nitrification without N loss. All these ob-
ervations illustrate the robustness of the MABR.
.4. MEC-MABR integration not only prevents N losses but also
educes the overall oxygen demand, increases the alkalinity and
nables energy efficient COD removal
Removing the COD prior to membrane-aerated nitrification
roved to be key in preventing N losses through denitrification
nd allowed MABR operation at a high urine loading rate, reducing
he required reactor volume. It also minimized biomass produc-
ion in the MABR since less substrate (COD) was available to the
eterotrophs. Bio-anodic COD removal has some clear advantages
ompared to other biological COD removal processes, for example
erobic COD removal in another MABR. Firstly, there is no oxygen
equirement for bio-anodic COD oxidation, whereas aerobic COD
emoval from urine would consume ~4–8 mg O 2 L −1 of urine. Sec-
ndly, energy can be recovered from the organics, as hydrogen gas
MEC) or electricity (MFC), although this should be further opti-
ized as discussed in Section 4.1 . Thirdly, OH
− production at the
athode increases the alkalinity of the urine, thereby reducing the
ase demand for full nitrification in the MABR.
.5. Closing the nitrogen cycle on Earth and in Space
By treatment in the MEC and MABR, fresh real human urine is
ransformed into a stable nitrate-rich, COD-low nutrient solution,
hich was demonstrated to be suitable for plant and microalgae
ultivation by Coppens et al. (2016) and Feng et al. (2007) . Using
rocessed urine as a nutrient source for protein production could
J. De Paepe, K. De Paepe and F. Gòdia et al. / Water Research 185 (2020) 116223 11
r
m
E
w
t
d
i
t
s
h
d
r
g
(
p
(
r
g
t
t
(
i
s
t
t
p
t
p
f
5
D
A
v
s
d
p
t
t
a
f
e
t
t
S
f
R
A
B
B
B
B
C
C
C
C
C
C
C
C
C
C
C
F
F
F
G
G
G
G
educe the need for synthetic fertilizers and the related environ-
ental pollution, resulting in a more sustainable nitrogen cycle on
arth. Separate collection and treatment of urine also facilitates
astewater treatment ( Wilsenach and van Loosdrecht 2003 ). Due
o the NaOH addition for alkalinisation (to prevent urea hydrolysis
uring storage) and for full nitrification, the sodium concentration
n the urine increased by a factor of ~3, which might cause sodium
oxicity in plants. To prevent sodium addition, NaOH could be sub-
tituted by KOH or an electrochemical cell could be used to supply
ydroxide ions as demonstrated by De Paepe et al. (2020) .
As the oxidation of COD and N is not based on bubble-
ependent gas/liquid mass transfer, the concept is compatible with
educed gravity conditions and can therefore be integrated in re-
enerative life support systems. On long-term deep-Space missions
e.g., to Mars) and Space habitation, resupply from Earth becomes
ractically impossible because of the long distance and duration
Clauwaert et al., 2017 ). Therefore, these missions will rely on a
egenerative life support system to produce water, food and oxy-
en from waste streams, such as urine. In MELiSSA, the regenera-
ive life support system program from ESA, urine is treated by ni-
rification, followed by cyanobacteria and higher plant cultivation
Gòdia et al., 2002 ). With the survival of nitrifiers demonstrated
n low Earth orbit ( Lindeboom et al., 2018 ), the next development
tep would be to test a urine nitrification MABR in such condi-
ions. As a compact, robust, highly nitrogen- and energy-efficient
echnology train, the MEC-MABR system could be of interest. Ap-
lication in a reduced gravity environment would, however, require
he use of a gas diffusion air cathode in the MEC (to prevent the
roduction of hydrogen gas, which would be difficult to separate
rom the liquid in reduced gravity).
. Conclusions
• Upstream bio-anodic COD oxidation effectively prevented den-
itrification in the MABR. Full nitrification without TAN and ni-
trite accumulation and without N loss was obtained when the
MABR was operated on MEC effluent, whereas denitrification
and partial nitrification occurred when the MABR was operated
on raw urine at the same N loading rate. • The MEC allows to operate the MABR at a high loading rate,
reduces the oxygen demand for COD oxidation, limits biomass
production in the MABR, increases the urine alkalinity and can
recover some energy from the organics. • MEC operation should be further optimized in order to increase
the coulombic efficiency, as only about 25–45% of the COD re-
moved was converted into current. Other electron sinks should
be identified in order to identify the COD gap and improve the
conversion of chemical energy into electrical energy. • This two-stage process yields a stable nitrate-rich nutrient so-
lution, suitable for plant and microalgae cultivation. As gravity-
independent, highly nitrogen- and energy-efficient technology
train, the concept can be useful for MELiSSA and other regener-
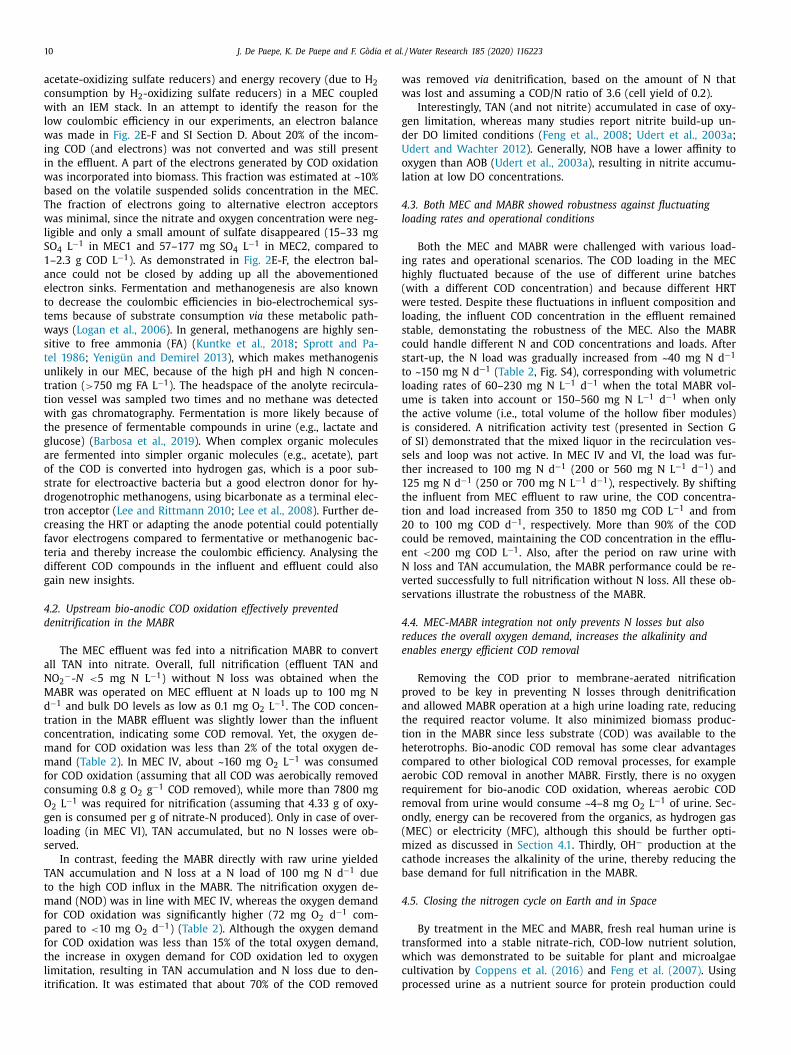
ative life support systems.
eclaration of Competing Interest
None.
cknowledgments
This article has been made possible through the authors’ in-
olvement in the MELiSSA project, ESA’s life support system re-
earch program ( https://www.melissafoundation.org/ ).
The authors would like to acknowledge i) the MELiSSA foun-
ation to support J.DP. via the POMP1 (Pool Of MELiSSA PhD)
rogram, ii) the Research Foundation Flanders (FWO Vlaanderen)
o support K.DP. (EOS Research project nr. 30770923 , project ti-
le: Quantitative profiling in applied gut microbiome research,
cronym: MiQuant), iii) Ghent University Bijzonder Onderzoeks-
onds to support K.R. (GOA grant BOF2019/GOA/026/L), iv) Kai Ud-
rt from Eawag (Switzerland) for providing urine nitrification cul-
ure, v) Celine Bauwens and Arne Govaert for their help with reac-
or operation and sample analyses.
upplementary material
Supplementary material associated with this article can be
ound, in the online version, at doi: 10.1016/j.watres.2020.116223 .
eferences
nderson, M.J. , Ellingsen, K.E. , McArdle, B.H. , 2006. Multivariate dispersion as ameasure of beta diversity. Ecol. Lett. 9 (6), 683–693 .
arbosa, S.G. , Rodrigues, T. , Peixoto, L. , Kuntke, P. , Alves, M.M. , Pereira, M.A. , Ter Hei-jne, A. , 2019. Anaerobic biological fermentation of urine as a strategy to en-
hance the performance of a microbial electrolysis cell (MEC). Renew. Energy139, 936–943 .
ecker, R.A. , Chambers, J.M. , Wilks, A.R. , 1988. The New S Language: a Program-
ming Environment for Data Analysis and Graphics. Wadsworth and Brooks/ColeAdvanced Books & Software .
ond, D.R. , Holmes, D.E. , Tender, L.M. , Lovley, D.R. , 2002. Electrode-reducing mi-croorganisms that harvest energy from marine sediments. Science 295 (5554),
4 83–4 85 . orcard, D. , Gillet, F. , Legendre, P. , 2011. Numerical Ecology with R. Springer Sciece .
ailliez, F. , 1983. The analytical solution of the additive constant problem. Psy-chometrika 48 (2), 305–308 .
asey, E. , Glennon, B. , Hamer, G. , 1999. Review of membrane aerated biofilm reac-
tors. Resour. Conserv. Recycl. 27 (1), 203–215 . hen, R.D. , Semmens, M.J. , LaPara, T.M. , 2008. Biological treatment of a syn-
thetic space mission wastewater using a membrane-aerated, membrane-cou-pled bioreactor (M2BR). J. Ind. Microbiol. Biotechnol. 35 (6), 465–473 .
hen, W. , Zhang, C.K. , Cheng, Y. , Zhang, S. , Zhao, H. , 2013. A comparison of methodsfor clustering 16S rRNA sequences into OTUs. PLoS ONE 8 (8), e70837 .
hen, L.P. , Yang, X.X. , Tian, X.J. , Yao, S. , Li, J.Y. , Wang, A.M. , Yao, Q.A. , Peng, D.C. , 2017.
Partial nitritation of stored source-separated urine by granular activated sludgein a sequencing batch reactor. AMB Express 7, 1–10 .
hristenson, D. , Sevanthi, R. , Morse, A. , Jackson, A. , 2018. Assessment of Mem-brane-Aerated Biological Reactors (MABRs) for integration into space-based wa-
ter recycling system architectures. Gravitational Space Res. 6, 12–27 . lauwaert, P. , Muys, M. , Alloul, A. , De Paepe, J. , Luther, A. , Sun, X.Y. , Ilgrande, C. ,
Christiaens, M.E.R. , Hu, X.N. , Zhang, D.D. , Lindeboom, R.E.F. , Sas, B. , Rabaey, K. ,
Boon, N. , Ronsse, F. , Geelen, D. , Vlaeminck, S.E. , 2017. Nitrogen cycling in Biore-generative Life Support Systems: challenges for waste refinery and food produc-
tion processes. Progr. Aerosp. Sci. 91, 87–98 . ole, J.R. , Wang, Q. , Fish, J.A. , Chai, B.L. , McGarrell, D.M. , Sun, Y.N. , Brown, C.T. ,
Porras-Alfaro, A. , Kuske, C.R. , Tiedje, J.M. , 2014. Ribosomal database project:data and tools for high throughput rRNA analysis. Nucl. Acids Res. 42 (D1),
D633–D642 .
oppens, J. , Lindeboom, R. , Muys, M. , Coessens, W. , Alloul, A. , Meerbergen, K. ,Lievens, B. , Clauwaert, P. , Boon, N. , Vlaeminck, S.E. , 2016. Nitrification and mi-
croalgae cultivation for two-stage biological nutrient valorization from sourceseparated urine. Bioresour. Technol. 211, 41–50 .
ôté, P. , Bersillon, J.-.L. , Huyard, A. , Faup, G. , 1988. Bubble-free aeration using mem-branes: process analysis. J. (Water Pollut. Control Federat.) 60 (11), 1986–1992 .
ox, T.F. , 2001. Multidimensional scaling used in multivariate statistical process con-
trol. J. Appl. Stat. 28 (3–4), 365–378 . eng, D.L. , Wu, Z.C. , Wang, D.H. , 2007. Effects of N source and nitrification pretreat-
ment on growth of Arthrospira platensis in human urine. J. Zhejiang Univ.-Sci.A 8 (11), 1846–1852 .
eng, D.L. , Wu, Z.C. , Xu, S.H. , 2008. Nitrification of human urine for its stabilizationand nutrient recycling. Bioresour. Technol. 99 (14), 6299–6304 .
umasoli, A. , Etter, B. , Skerkele, B. , Morgenroth, E. , Udert, K.M. , 2016. Operating a
pilot-scale nitrification/distillation plant for complete nutrient recovery fromurine. Water Sci. Technol. 73 (1), 215–222 .
ao, Y. , Sun, D. , Wang, H. , Lu, L. , Ma, H. , Wang, L. , Ren, Z.J. , Liang, P. , Zhang, X. ,Chen, X. , Huang, X. , 2018. Urine-powered synergy of nutrient recovery and
urine purification in a microbial electrochemical system. Environ. Sci. 4 (10),1427–1438 .
òdia, F. , Albiol, J. , Montesinos, J.L. , Pérez, J. , Creus, N. , Cabello, F. , Mengual, X. , Mon-tras, A. , Lasseur, C. , 2002. MELISSA: a loop of interconnected bioreactors to de-
velop life support in Space. J. Biotechnol. 99 (3), 319–330 .
ong, Z. , Yang, F. , Liu, S. , Bao, H. , Hu, S. , Furukawa, K. , 2007. Feasibility of a mem-brane-aerated biofilm reactor to achieve single-stage autotrophic nitrogen re-
moval based on Anammox. Chemosphere 69 (5), 776–784 . ower, J.C. , 1966. Some distance properties of latent root and vector methods used
in multivariate analysis. Biometrika 53 325-& .

12 J. De Paepe, K. De Paepe and F. Gòdia et al. / Water Research 185 (2020) 116223
O
P
D
D
D
Q
R
R
R
S
S
S
T
U
U
U
W
W
W
W
X
Y
Guo, K. , Freguia, S. , Dennis, P.G. , Chen, X. , Donose, B.C. , Keller, J. , Gooding, J.J. ,Rabaey, K. , 2013. Effects of surface charge and hydrophobicity on anodic biofilm
formation, community composition, and current generation in bioelectrochemi-cal systems. Environ. Sci. Technol. 47 (13), 7563–7570 .
Harms, C. , Schleicher, A. , Collins, M.D. , Andreesen, J.R. , 1998. Tissierella creatinophilasp. nov., a gram-positive, anaerobic, non-spore-forming, creatinine-fermenting
organism. Int. J. Syst. Bacteriol. 48 (Pt 3), 983–993 . Ieropoulos, I. , Greenman, J. , Melhuish, C. , 2012. Urine utilisation by microbial fuel
cells; energy fuel for the future. Phys. Chem. Chem. Phys. 14 (1), 94–98 .
Ieropoulos, I.A. , Stinchcombe, A. , Gajda, I. , Forbes, S. , Merino-Jimenez, I. , Paster-nak, G. , Sanchez-Herranz, D. , Greenman, J. , 2016. Pee power urinal – microbial
fuel cell technology field trials in the context of sanitation. Environ. Sci. 2 (2),336–343 .
Jackson, W.A . , Morse, A . , McLamore, E. , Wiesner, T. , Xia, S. , 2009. Nitrification-deni-trification biological treatment of a high-nitrogen waste stream for water-reuse
applications. Water Environ. Res. 81 (4), 423–431 .
Jiang, F. , Chen, Y. , Mackey, H.R. , Chen, G.H. , van Loosdrecht, M.C.M. , 2011. Urine ni-trification and sewer discharge to realize in-sewer denitrification to simplify
sewage treatment in Hong Kong. Water Sci. Technol. 64 (3), 618–626 . Klindworth, A. , Pruesse, E. , Schweer, T. , Peplies, J. , Quast, C. , Horn, M. , Glockner, F.O. ,
2013. Evaluation of general 16S ribosomal RNA gene PCR primers for classicaland next-generation sequencing-based diversity studies. Nucl. Acids Res. 41 (1) .
Kuntke, P. , Sleutels, T.H.J.A. , Rodríguez Arredondo, M. , Georg, S. , Barbosa, S.G. , ter
Heijne, A. , Hamelers, H.V.M. , Buisman, C.J.N. , 2018. (Bio)electrochemical ammo-nia recovery: progress and perspectives. Appl. Microbiol. Biotechnol. 102 (9),
3865–3878 . Kuntke, P. , Sleutels, T.H.J.A. , Saakes, M. , Buisman, C.J.N. , 2014. Hydrogen production
and ammonium recovery from urine by a Microbial Electrolysis Cell. Int. J. Hy-drogen Energy 39 (10), 4771–4778 .
Kuntke, P. , Smiech, K.M. , Bruning, H. , Zeeman, G. , Saakes, M. , Sleutels, T.H.J.A. ,
Hamelers, H.V.M. , Buisman, C.J.N. , 2012. Ammonium recovery and energy pro-duction from urine by a microbial fuel cell. Water Res. 46 (8), 2627–2636 .
Kuntke, P. , Zamora, P. , Saakes, M. , Buisman, C.J.N. , Hamelers, H.V.M. , 2016. Gas-per-meable hydrophobic tubular membranes for ammonia recovery in bio-electro-
chemical systems. Environ. Sci. 2 (2), 261–265 . Larsen, T.A. , Udert, K.M. , Lienert, J. , 2013. Source Separation and Decentralization for
Wastewater Management. IWA Publishing .
Ledezma, P. , Jermakka, J. , Keller, J. , Freguia, S. , 2017. Recovering nitrogen as a solidwithout chemical dosing: bio-electroconcentration for recovery of nutrients
from urine. Environ. Sci. Technol. Lett. 4 (3), 119–124 . Lee, H.-.S. , Rittmann, B.E. , 2010. Significance of biological hydrogen oxidation in a
continuous single-chamber microbial electrolysis cell. Environ. Sci. Technol. 44(3), 948–954 .
Lee, H.S. , Parameswaran, P. , Kato-Marcus, A. , Torres, C.I. , Rittmann, B.E. , 2008. Eval-
uation of energy-conversion efficiencies in microbial fuel cells (MFCs) utilizingfermentable and non-fermentable substrates. Water Res. 42 (6–7), 1501–1510 .
Lindeboom, R.E.F. , Ilgrande, C. , Carvajal-Arroyo, J.M. , Coninx, I. , Van Hoey, O. ,Roume, H. , Morozova, J. , Udert, K.M. , Sas, B. , Paille, C. , Lasseur, C. , Ilyin, V. ,
Clauwaert, P. , Leys, N. , Vlaeminck, S.E. , 2018. Nitrogen cycle microorganisms canbe reactivated after Space exposure. Sci. Rep. 8 (1), 13783 .
Logan, B.E. , Hamelers, B. , Rozendal, R. , Schröder, U. , Keller, J. , Freguia, S. , Aelter-man, P. , Verstraete, W. , Rabaey, K. , 2006. Microbial Fuel Cells: Methodology and
Technology. Environ. Sci. Technol. 40 (17), 5181–5192 .
Logan, B.E. , Rossi, R. , Ragab, A. , Saikaly, P.E. , 2019. Electroactive microorganisms inbioelectrochemical systems. Nat. Rev. Microbiol. 17 (5), 307–319 .
Mackey, H.R. , Chen, Y. , Chen, G.H. , van Loosdrecht, M.M.C. , 2010. Nitrification ofSource Separated Urine in a Sequencing Batch Reactor. Iwa Publishing, London .
Martin, K.J. , Nerenberg, R. , 2012. The membrane biofilm reactor (MBfR) for waterand wastewater treatment: principles, applications, and recent developments.
Bioresour. Technol. 122, 83–94 .
Maurer, M. , Pronk, W. , Larsen, T.A. , 2006. Treatment processes for source-separatedurine. Water Res. 40 (17), 3151–3166 .
McMurdie, P.J. , Holmes, S. , 2014. Waste not, want not: why rarefying microbiomedata is inadmissible. PLoS Comput. Biol. 10 (4), e1003531 .
Merino-Jimenez, I. , Celorrio, V. , Fermin, D.J. , Greenman, J. , Ieropoulos, I. , 2017. En-hanced MFC power production and struvite recovery by the addition of sea salts
to urine. Water Res. 109, 46–53 .
Meyer, C.E., Pensinger, S., Pickering, K.D., Barta, D., Shull, S.A., Vega, L.M., Christen-son, D. and Jackson, W.A. (2015) Rapid Start-up and Loading of an Attached
Growth, Simultaneous Nitrification/Denitrification Membrane Aerated Bioreac-tor, Washington.
Montgomery, H.A.C. , Dymock, J.F. , 1961. The determination of nitrite in water. Ana-lyst 86, 414–416 .
Nerenberg, R. , 2016. The membrane-biofilm reactor (MBfR) as a counter-diffusional
biofilm process. Curr. Opin. Biotechnol. 38, 131–136 . Oksanen, J., Blanchet, G., Friendly, M., Kindt, R., Legendre, P., McGlinn, D., Minchin,
P.R., O’Hara, R.B., Simpson, G.L., Solymos, P., Stevens, H., Szoecs, E. and Wagner,H. (2016) vegan: Community Ecology Package. R package version 2.4-0. https:
//CRAN.R-project.org/package=vegan .
osterhuis, M. , van Loosdrecht, M.C.M. , 2009. Nitrification of urine for H 2 S controlin pressure sewers. Water Pract. Technol. 4 (3) .
ellicer-Nàcher, C. , Sun, S. , Lackner, S. , Terada, A. , Schreiber, F. , Zhou, Q. , Smets, B.F. ,2010. Sequential aeration of membrane-aerated biofilm reactors for high-rate
autotrophic nitrogen removal: experimental demonstration. Environ. Sci. Tech-nol. 44 (19), 7628–7634 .
e Paepe, J. , De Pryck, L. , Verliefde, A.R.D. , Rabaey, K. , Clauwaert, P. , 2020. Electro-chemically induced precipitation enables fresh urine stabilization and facilitates
source separation. Environ. Sci. Technol .
e Paepe, J. , Lindeboom, R.E.F. , Vanoppen, M. , De Paepe, K. , Demey, D. , Coessens, W. ,Lamaze, B. , Verliefde, A.R.D. , Clauwaert, P. , Vlaeminck, S.E. , 2018. Refinery and
concentration of nutrients from urine with electrodialysis enabled by upstreamprecipitation and nitrification. Water Res. 144, 76–86 .
e Paepe, K. , Kerckhof, F.-.M. , Verspreet, J. , Courtin, C.M. , Van de Wiele, T. , 2017.Inter-individual differences determine the outcome of wheat bran colonization
by the human gut microbiome. Environ. Microbiol. 19 (8), 3251–3267 .
uast, C. , Pruesse, E. , Yilmaz, P. , Gerken, J. , Schweer, T. , Yarza, P. , Peplies, J. , Glock-ner, F.O. , 2013. The SILVA ribosomal RNA gene database project: improved data
processing and web-based tools. Nucleic Acids Res. 41 (D1), D590–D596 . Core Team, 2016. R: A language and Environment for Statistical Computing. R
Foundation for Statistical Computing, Vienna, Austria https://www.R-project.org/ .
Rabaey, K. , Boon, N. , Siciliano, S.D. , Verhaege, M. , Verstraete, W. , 2004. Biofuel cells
select for microbial consortia that self-mediate electron transfer. Appl. Environ.Microbiol. 70 (9), 5373–5382 .
amette, A. , 2007. Multivariate analyses in microbial ecology. FEMS Microbiol. Ecol.62 (2), 142–160 .
andall, D.G. , Naidoo, V. , 2018. Urine: the liquid gold of wastewater. J. Environ.Chem. Eng. 6 (2), 2627–2635 .
Salar-García, M.J. , Ortiz-Martínez, V.M. , Gajda, I. , Greenman, J. , Hernández-Fernán-
dez, F.J. , Ieropoulos, I.A. , 2017. Electricity production from human urine in ce-ramic microbial fuel cells with alternative non-fluorinated polymer binders for
cathode construction. Sep. Purif. Technol. 187, 436–442 . chloss, P.D. , Westcott, S.L. , 2011. Assessing and improving methods used in oper-
ational taxonomic unit-based approaches for 16S rRNA gene sequence analysis.Appl. Environ. Microbiol. 77 (10), 3219–3226 .
Schloss, P.D. , Westcott, S.L. , Ryabin, T. , Hall, J.R. , Hartmann, M. , Hollister, E.B. ,
Lesniewski, R.A. , Oakley, B.B. , Parks, D.H. , Robinson, C.J. , Sahl, J.W. , Stres, B. ,Thallinger, G.G. , Van Horn, D.J. , Weber, C.F. , 2009. Introducing mothur: open–
source, platform-independent, community-supported software for describingand comparing microbial communities. Appl. Environ. Microbiol. 75 (23),
7537–7541 . prott, G.D. , Patel, G.B. , 1986. Ammonia toxicity in pure cultures of methanogenic
bacteria. Syst. Appl. Microbiol. 7 (2), 358–363 .
un, F.Y. , Dong, W.Y. , Shao, M.F. , Li, J. , Peng, L.Y. , 2012. Stabilization of source-sep-arated urine by biological nitrification process: treatment performance and ni-
trite accumulation. Water Sci. Technol. 66 (7), 1491–1497 . ice, R.C. , Kim, Y. , 2014. Energy efficient reconcentration of diluted human urine
using ion exchange membranes in bioelectrochemical systems. Water Res. 64,61–72 .
dert, K.M. , Fux, C. , Munster, M. , Larsen, T.A. , Siegrist, H. , Gujer, W. , 2003a. Nitrifica-tion and autotrophic denitrification of source-separated urine. Water Sci. Tech-
nol. 48 (1), 119–130 .
dert, K.M. , Larsen, T.A. , Biebow, M. , Gujer, W. , 2003b. Urea hydrolysis and precipi-tation dynamics in a urine-collecting system. Water Res. 37 (11), 2571–2582 .
dert, K.M. , Larsen, T.A. , Gujer, W. , 2006. Fate of major compounds in source-sepa-rated urine. Water Sci. Technol. 54 (11–12), 413–420 .
Udert, K.M. , Wachter, M. , 2012. Complete nutrient recovery from source-separatedurine by nitrification and distillation. Water Res. 46 (2), 453–464 .
alter, X.A. , Merino-Jiménez, I. , Greenman, J. , Ieropoulos, I. , 2018. PEE POWER® uri-
nal II – urinal scale-up with microbial fuel cell scale-down for improved light-ing. J. Power Sources 392, 150–158 .
ang, Q. , Garrity, G.M. , Tiedje, J.M. , Cole, J.R. , 2007. Naive Bayesian classifier forrapid assignment of rRNA sequences into the new bacterial taxonomy. Appl. En-
viron. Microbiol. 73 (16), 5261–5267 . ang, X.Y. , Cai, Y.P. , Sun, Y.J. , Knight, R. , Mai, V. , 2012. Secondary structure informa-
tion does not improve OTU assignment for partial 16s rRNA sequences. Isme J.
6 (7), 1277–1280 . ickham, H. (2009) ggplot2: Elegant Graphics for Data Analysis.
Wilsenach, J. , van Loosdrecht, M. , 2003. Impact of separate urine collection onwastewater treatment systems. Water Sci. Technol. 48 (1), 103–110 .
Wohlsager, S. , Clemens, J. , Nguyet, P.T. , Rechenburg, A. , Arnold, U. , 2010. Urine–avaluable fertilizer with low risk after storage in the tropics. Water Environ. Res.
82 (9), 840–847 .
ing, D. , Cheng, S. , Logan, B.E. , Regan, J.M. , 2010. Isolation of the exoelectrogenicdenitrifying bacterium Comamonas denitrificans based on dilution to extinction.
Appl. Microbiol. Biotechnol. 85 (5), 1575–1587 . enigün, O. , Demirel, B. , 2013. Ammonia inhibition in anaerobic digestion: a review.
Process Biochem. 48 (5), 901–911 .
Related Documents


