Top Banner
Bio Bootcamp Evolution Review
35

Bio Bootcamp Evolution Review. Sample Question This graph illustrates changes in two different lizard populations over time. Which process MOST LIKELY.

Dec 22, 2015

Download

Documents

Britton Greer
Welcome message from author
This document is posted to help you gain knowledge. Please leave a comment to let me know what you think about it! Share it to your friends and learn new things together.
Transcript
Page 1: Bio Bootcamp Evolution Review. Sample Question This graph illustrates changes in two different lizard populations over time. Which process MOST LIKELY.

Bio Bootcamp

Evolution Review

Page 2: Bio Bootcamp Evolution Review. Sample Question This graph illustrates changes in two different lizard populations over time. Which process MOST LIKELY.

Sample Question

This graph illustrates changes in two different lizard populations over time. Which process MOST LIKELY led to the change in the allele frequency for population B?

A. Natural selection acting on a harmful traitB. Natural selection acting on a beneficial traitC. Natural selection acting on a dominant traitD. Natural selection acting on a recessive trait

Population B

Population A

Page 3: Bio Bootcamp Evolution Review. Sample Question This graph illustrates changes in two different lizard populations over time. Which process MOST LIKELY.

Sample Question

A mutation occurs in the genes that code for coat color in caribou. Which change will most likely result from this mutation?

A. A change in the selection pressures acting on coat color.

B. A change in the coat-color genes of deer predator species

C. An increase in coat-color diversity in the populationD. An increase in the number of genes for coat color in

the population.

Page 4: Bio Bootcamp Evolution Review. Sample Question This graph illustrates changes in two different lizard populations over time. Which process MOST LIKELY.

Sample Question

The skeletons of vertebrate forelimbs contain variations of structures that were present in their common ancestor. What has MOST LIKELY cause the variation in forelimbs?

A. Changes in muscle structureB. Changes in genetic codeC. Changes in vestigial structuresD. Changes in artificial selection

Page 5: Bio Bootcamp Evolution Review. Sample Question This graph illustrates changes in two different lizard populations over time. Which process MOST LIKELY.

Misconception: “Evolution is ‘just’ a theory.”Response: Scientific theories

are explanations that are based on lines of evidence, enable valid predictions, and have been tested in many ways. In contrast, there is also a popular definition of theory—a “guess” or “hunch.” These conflicting definitions often cause unnecessary confusion about evolution.

Page 6: Bio Bootcamp Evolution Review. Sample Question This graph illustrates changes in two different lizard populations over time. Which process MOST LIKELY.

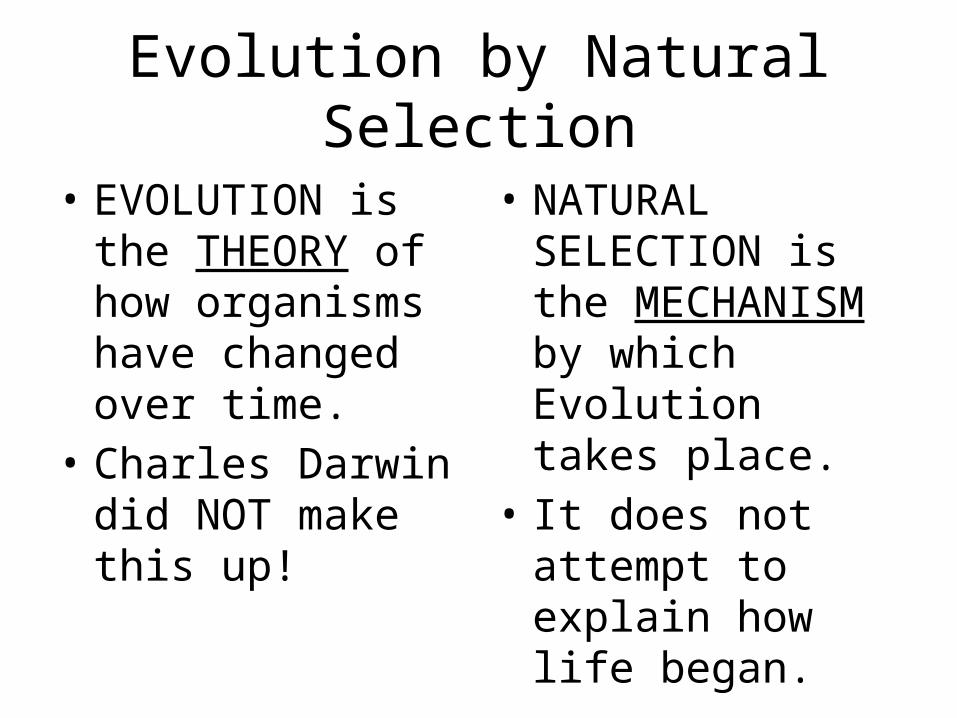
Evolution by Natural Selection

• EVOLUTION is the THEORY of how organisms have changed over time.

• Charles Darwin did NOT make this up!

• NATURAL SELECTION is the MECHANISM by which Evolution takes place.

• It does not attempt to explain how life began.

Page 7: Bio Bootcamp Evolution Review. Sample Question This graph illustrates changes in two different lizard populations over time. Which process MOST LIKELY.

Natural Selection

Page 8: Bio Bootcamp Evolution Review. Sample Question This graph illustrates changes in two different lizard populations over time. Which process MOST LIKELY.
Page 9: Bio Bootcamp Evolution Review. Sample Question This graph illustrates changes in two different lizard populations over time. Which process MOST LIKELY.

Kettlewell – England – Peppered Moths

Page 10: Bio Bootcamp Evolution Review. Sample Question This graph illustrates changes in two different lizard populations over time. Which process MOST LIKELY.
Page 11: Bio Bootcamp Evolution Review. Sample Question This graph illustrates changes in two different lizard populations over time. Which process MOST LIKELY.

Allelic Frequency

Page 12: Bio Bootcamp Evolution Review. Sample Question This graph illustrates changes in two different lizard populations over time. Which process MOST LIKELY.

Speciation

Page 13: Bio Bootcamp Evolution Review. Sample Question This graph illustrates changes in two different lizard populations over time. Which process MOST LIKELY.

Founder Effect/Bottleneck

Page 14: Bio Bootcamp Evolution Review. Sample Question This graph illustrates changes in two different lizard populations over time. Which process MOST LIKELY.

Geographic Isolation

Page 15: Bio Bootcamp Evolution Review. Sample Question This graph illustrates changes in two different lizard populations over time. Which process MOST LIKELY.

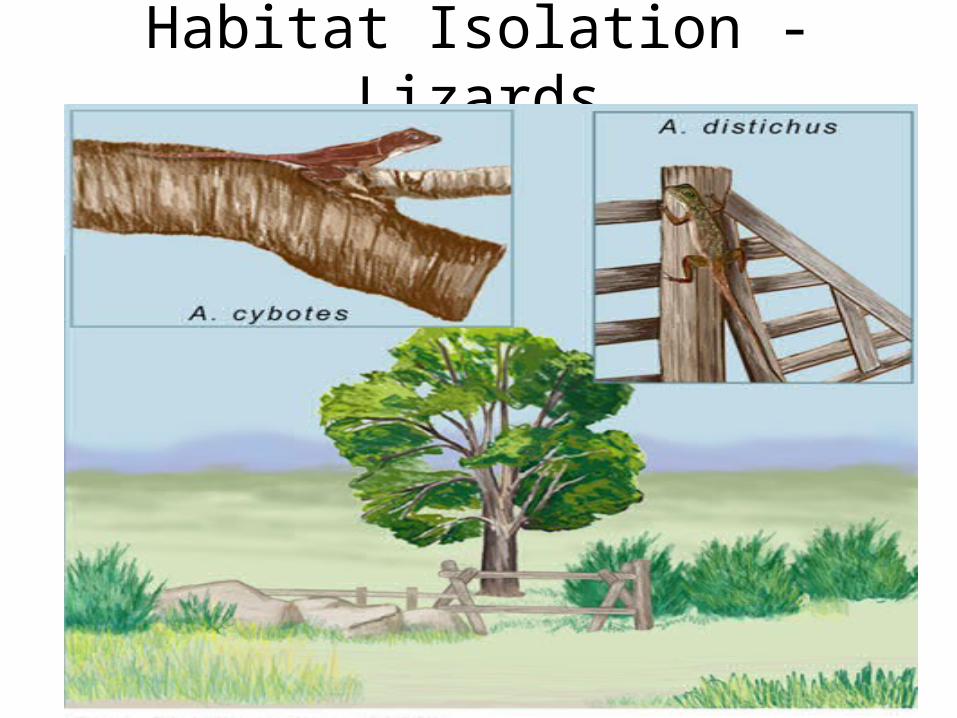
Habitat Isolation - Lizards

Page 16: Bio Bootcamp Evolution Review. Sample Question This graph illustrates changes in two different lizard populations over time. Which process MOST LIKELY.

Mechanical Isolation

Page 17: Bio Bootcamp Evolution Review. Sample Question This graph illustrates changes in two different lizard populations over time. Which process MOST LIKELY.

Mechanical Isolation

Page 18: Bio Bootcamp Evolution Review. Sample Question This graph illustrates changes in two different lizard populations over time. Which process MOST LIKELY.

Behavioral Isolation

Page 19: Bio Bootcamp Evolution Review. Sample Question This graph illustrates changes in two different lizard populations over time. Which process MOST LIKELY.

Temporal Isolation

Page 20: Bio Bootcamp Evolution Review. Sample Question This graph illustrates changes in two different lizard populations over time. Which process MOST LIKELY.

Reproductive Isolation

Page 21: Bio Bootcamp Evolution Review. Sample Question This graph illustrates changes in two different lizard populations over time. Which process MOST LIKELY.

Types of Evolution

Page 22: Bio Bootcamp Evolution Review. Sample Question This graph illustrates changes in two different lizard populations over time. Which process MOST LIKELY.

Convergent Evolution

Page 23: Bio Bootcamp Evolution Review. Sample Question This graph illustrates changes in two different lizard populations over time. Which process MOST LIKELY.

Divergent Evolution

Page 24: Bio Bootcamp Evolution Review. Sample Question This graph illustrates changes in two different lizard populations over time. Which process MOST LIKELY.

Artificial Selection

Page 25: Bio Bootcamp Evolution Review. Sample Question This graph illustrates changes in two different lizard populations over time. Which process MOST LIKELY.

Coevolution

Page 26: Bio Bootcamp Evolution Review. Sample Question This graph illustrates changes in two different lizard populations over time. Which process MOST LIKELY.

Fossils

Page 27: Bio Bootcamp Evolution Review. Sample Question This graph illustrates changes in two different lizard populations over time. Which process MOST LIKELY.

Biogeography

Page 28: Bio Bootcamp Evolution Review. Sample Question This graph illustrates changes in two different lizard populations over time. Which process MOST LIKELY.

Chapter 15Section 2 Evidence of Evolution

Hemoglobin Comparison

Biochemical

Page 29: Bio Bootcamp Evolution Review. Sample Question This graph illustrates changes in two different lizard populations over time. Which process MOST LIKELY.

Chapter 17

Similarities in Amino Acid Sequences

Section 2 Systematics

Biochemical

Page 30: Bio Bootcamp Evolution Review. Sample Question This graph illustrates changes in two different lizard populations over time. Which process MOST LIKELY.

Universal Genetic Code

Page 31: Bio Bootcamp Evolution Review. Sample Question This graph illustrates changes in two different lizard populations over time. Which process MOST LIKELY.

Homologous Structures

• Forelimbs of vertebrates

Page 32: Bio Bootcamp Evolution Review. Sample Question This graph illustrates changes in two different lizard populations over time. Which process MOST LIKELY.

Analogous Structures

Page 33: Bio Bootcamp Evolution Review. Sample Question This graph illustrates changes in two different lizard populations over time. Which process MOST LIKELY.

Vestigial Structures

Page 34: Bio Bootcamp Evolution Review. Sample Question This graph illustrates changes in two different lizard populations over time. Which process MOST LIKELY.

Evidence of Whale Evolution

Section 2 Evidence of EvolutionChapter 15

Page 35: Bio Bootcamp Evolution Review. Sample Question This graph illustrates changes in two different lizard populations over time. Which process MOST LIKELY.

Embryology