Binding Affinity prediction with Property Encoded Shape Distribution signatures Sourav Das, Department of Chemistry & Chemical Biology, Rensselaer Polytechnic Institute, 110-8th Street, Troy, NY 12180 Michael P. Krein, and Department of Chemistry & Chemical Biology, Rensselaer Polytechnic Institute, 110-8th Street, Troy, NY 12180 Curt M. Breneman Department of Chemistry & Chemical Biology / RECCR Center Rensselaer Polytechnic Institute, 110-8th Street, Center for Biotechnology and Interdisciplinary Studies, Troy, NY 12180, Phone Number: 518-276-2678, Fax Number: 518-276-4887, [email protected] Abstract We report the use of the molecular signatures known as “Property-Encoded Shape Distributions” (PESD) together with standard Support Vector Machine (SVM) techniques to produce validated models that can predict the binding affinity of a large number of protein ligand complexes. This “PESD-SVM” method uses PESD signatures that encode molecular shapes and property distributions on protein and ligand surfaces as features to build SVM models that require no subjective feature selection. A simple protocol was employed for tuning the SVM models during their development, and the results were compared to SFCscore – a regression-based method that was previously shown to perform better than 14 other scoring functions. Although the PESD-SVM method is based on only two surface property maps, the overall results were comparable. For most complexes with a dominant enthalpic contribution to binding (ΔH/-TΔS > 3), a good correlation between true and predicted affinities was observed. Entropy and solvent were not considered in the present approach and further improvement in accuracy would require accounting for these components rigorously. Introduction Accurate prediction of protein-ligand binding affinity is a key component of computer-aided drug discovery. There are many techniques for affinity prediction1 -15 , with notable accuracy (1 kcal/mol) being seen with combination of molecular dynamics and free energy perturbation techniques12 , 16 , 17. In drug discovery applications, fast computation of affinity is highly desirable to enable rapid virtual screening for potency, which is currently attempted using scoring functions based on the static structures of protein-ligand complexes. In spite of the progress made over several years, the applicability of the scoring functions for affinity Correspondence to: Curt M. Breneman. Supporting Information Available: PDB codes of training and test sets. This material is available free of charge via the Internet at http://pubs.acs.org. Work was done at Department of Chemistry & Chemical Biology / RECCR Center, Center for Biotechnology and Interdisciplinary Studies, Rensselaer Polytechnic Institute, Troy, NY, USA Availability: Source code for generating PESD signatures can be downloaded from http://breneman.chem.rpi.edu/PESDSVM NIH Public Access Author Manuscript J Chem Inf Model. Author manuscript; available in PMC 2011 February 22. Published in final edited form as: J Chem Inf Model. 2010 February 22; 50(2): 298–308. doi:10.1021/ci9004139. NIH-PA Author Manuscript NIH-PA Author Manuscript NIH-PA Author Manuscript

Welcome message from author
This document is posted to help you gain knowledge. Please leave a comment to let me know what you think about it! Share it to your friends and learn new things together.
Transcript

Binding Affinity prediction with Property Encoded ShapeDistribution signatures
Sourav Das,Department of Chemistry & Chemical Biology, Rensselaer Polytechnic Institute, 110-8th Street,Troy, NY 12180
Michael P. Krein, andDepartment of Chemistry & Chemical Biology, Rensselaer Polytechnic Institute, 110-8th Street,Troy, NY 12180
Curt M. BrenemanDepartment of Chemistry & Chemical Biology / RECCR Center Rensselaer Polytechnic Institute,110-8th Street, Center for Biotechnology and Interdisciplinary Studies, Troy, NY 12180, PhoneNumber: 518-276-2678, Fax Number: 518-276-4887, [email protected]
AbstractWe report the use of the molecular signatures known as “Property-Encoded ShapeDistributions” (PESD) together with standard Support Vector Machine (SVM) techniques to producevalidated models that can predict the binding affinity of a large number of protein ligand complexes.This “PESD-SVM” method uses PESD signatures that encode molecular shapes and propertydistributions on protein and ligand surfaces as features to build SVM models that require no subjectivefeature selection. A simple protocol was employed for tuning the SVM models during theirdevelopment, and the results were compared to SFCscore – a regression-based method that waspreviously shown to perform better than 14 other scoring functions. Although the PESD-SVMmethod is based on only two surface property maps, the overall results were comparable. For mostcomplexes with a dominant enthalpic contribution to binding (ΔH/-TΔS > 3), a good correlationbetween true and predicted affinities was observed. Entropy and solvent were not considered in thepresent approach and further improvement in accuracy would require accounting for thesecomponents rigorously.
IntroductionAccurate prediction of protein-ligand binding affinity is a key component of computer-aideddrug discovery. There are many techniques for affinity prediction1-15, with notable accuracy(1 kcal/mol) being seen with combination of molecular dynamics and free energy perturbationtechniques12,16,17. In drug discovery applications, fast computation of affinity is highlydesirable to enable rapid virtual screening for potency, which is currently attempted usingscoring functions based on the static structures of protein-ligand complexes. In spite of theprogress made over several years, the applicability of the scoring functions for affinity
Correspondence to: Curt M. Breneman.Supporting Information Available: PDB codes of training and test sets. This material is available free of charge via the Internet athttp://pubs.acs.org.Work was done at Department of Chemistry & Chemical Biology / RECCR Center, Center for Biotechnology and InterdisciplinaryStudies, Rensselaer Polytechnic Institute, Troy, NY, USAAvailability: Source code for generating PESD signatures can be downloaded from http://breneman.chem.rpi.edu/PESDSVM
NIH Public AccessAuthor ManuscriptJ Chem Inf Model. Author manuscript; available in PMC 2011 February 22.
Published in final edited form as:J Chem Inf Model. 2010 February 22; 50(2): 298–308. doi:10.1021/ci9004139.
NIH
-PA Author Manuscript
NIH
-PA Author Manuscript
NIH
-PA Author Manuscript

prediction across different proteins remains limited as demonstrated by recent benchmarkingstudies18. Binding affinity is a thermodynamic process that involves both enthalpic andentropic contributions to ligand pose stability. Unfortunately, accounting for entropy from astatic model is difficult, and most scoring functions provide only minimal treatment (generallyas a “rotor” term) for this important contribution. Ladbury and Williams19 pointed out that“specific attribution of thermodynamic parameters to the formation/breaking of particular localnon-covalent interactions, to conformational or dynamic change, or to solvent reorganisationis not easy to achieve”. However, good correlation between change in buried apolar surfacearea on complex formation and free energy (though not necessarily with entropy) 20, andimproved performance of empirical scoring functions on enrichment of the training set11 havealso been previously noted. These could be contributors to the modest to good correlationsbetween true affinity and predicted affinity observed in some protein-ligand systems. Untilsuch time that entropic contributions to binding affinity can be accurately assessed in high-throughput virtual screening applications, the development of new generalized scoringfunctions needs to be coupled with an increased awareness of the applicability domains of thosenew scoring functions. Such an analysis appears later in this report.
Recently, we developed the “Property-Encoded Shape Distributions” (PESD) concept thatenabled us to determine similarities between many functionally related binding sites byanalyzing structural similarity at the level of molecular surface21. PESD signatures accountfor distribution of polar and apolar regions as well as electrostatic potential on the molecularsurface. In this study, we investigate to what extent the encoding of surface propertydistributions within PESD signatures can explain observed variance in binding affinity in theabsence of any explicit treatment for solvent and entropy given the observed correlationbetween change in buried apolar surface area and free energy. Surface property distributionshave also been encoded by methods such as the MaP approach22 by Stiefl and Baumann, theautocorrelation descriptors of surfaces23 by Wagener, Sadowski and Gasteiger, Surfcatsdescriptors24 by Renner and Schneider, PEST descriptors by Breneman and coworkers25 andshape signatures of Zauhar and coworkers26. However, unlike others, the PESD algorithm isa novel approach that is based on a fixed number of randomly sampled point pairs on themolecular surface that does not require ray-tracing or the equal spacing of ligand or proteinsurface points. In the current study, PESD signatures calculated from both protein and ligandinteraction surfaces are utilized as features for creating Support Vector Machine27 (SVM)models for binding affinity prediction. Therefore, the binding affinity prediction approach isproteochemometric, a term coined by Wikberg and coworkers28. Proteochemometricapproaches use both the protein (usually in and around the binding site) and the ligand structuralfeatures to build predictive models11, 28-36. We chose a recently publishedproteochemometric method called SFCscore for comparison with the PESD-SVM method.SFCscore is an empirical scoring function that is trained on descriptors (including surfacebased) derived from the ligand as well as the protein component of each complex.
Following a description of our approach, we discuss the results of applying PESD-SVM modelsto complexes in the PDBbind37, 38 data set for affinity prediction. We next compare PESD-SVM results with those of SFCscore that was previously benchmarked against 14 other scoringfunctions39 for affinity prediction. Finally, we analyze the results and discuss the strengths andshortcomings of the present method.
MethodsProtein structure preparation
Protein structures obtained from the PDBbind database version 200537, 38 were appropriatelyprotonated with the Protonate3D routine40 in MOE41 at the pH at which the complexes werecrystallized42, 43. The pH values were extracted directly from the PDB44 files of the respective
Das et al. Page 2
J Chem Inf Model. Author manuscript; available in PMC 2011 February 22.
NIH
-PA Author Manuscript
NIH
-PA Author Manuscript
NIH
-PA Author Manuscript

complexes. For structures not having a specified pH, a default pH of 7.0 was used. Theelectrostatics cutoff was set at 12 Å. To reduce the computational time used in preprocessingprotein structures, the following “sliding scale” was used to determine whether to includespecific waters during structure optimization: If the protein structure was of significantly highresolution (less than 2.2 Å resolution and an r-factor of less than 0.29) and was small enough(less than 6000 daltons), all waters were included in subsequent optimization. For all otherstructures, waters were included only if they were located less than 3.8 Å from the ligand.
Generation of molecular interaction surfacesProperty mapped interaction surfaces were generated using the MOE41 package. The proteininteraction surface was defined as the Gauss-Connolly surface of the protein at 4.5 Å or lessfrom any ligand atom; the ligand interaction surface was defined as the Gauss-Connollysurface of the ligand at 3 Å or less from any protein atom. A 4.5 Å cutoff (default) is typicallyused for defining an active site in MOE, whereas the 3 Å cutoff for the ligand was chosen toeliminate solvent exposed ligand surfaces further away from the interfacial region. Ligand andprotein interaction surfaces were encoded with EP and Active LP (ALP) surface maps45. TheEP map was a Ewald-type screened molecular electrostatic potential that covered a range of-35 to 35 kcal/mol 46. Potential values occurring outside the range were clamped to lie insidethe range. Gasteiger-Huckel partial charges from PDBbind ligand structures were used forcomputing the ligand EP surface map, whereas partial charges assigned to the protein from thestructure optimization step with Protonate3D were used for computing the EP map for theprotein interaction surface. The ALP surface map displays different colors that representhydrogen-bonding regions, mildly polar regions and hydrophobic regions.
PESD signature generationThe Property Encoded Shape Distributions (PESD) method was originally developed to findsimilarities between binding site shape and surface properties by comparing protein interactionsurface PESD signatures. PESD signatures are invariant to rotation and translation, exploitingthe concept of Shape Distributions47 and extending it by adding the capability of capturingthree dimensional distributions of mapped properties on a molecular surface. Triangulatedmolecular surfaces are commonly generated by molecular graphics programs, including MOE,for visualization purposes - thus, PESD was designed to work directly from such surface files.Each vertex of a property mapped MOE-generated surface mesh is represented by its Cartesiancoordinates and a 24-bit RGB color code representing the mapped property magnitude. ThePESD routine samples pairs of points from random locations on the triangulated molecularsurface mesh. Collections of point pairs are then binned in a two-dimensional binning grid bythe distance between the point pairs as well as the property magnitudes or “color combinations”on both endpoints (Figure 1). A coarse-grained binning scheme is employed that utilizestwenty-four uniform distance bins 1 Å wide (recording distances from 0 to 24 Å). For buildingpredictive models all 24 bins were used. For determining chi-squared distances between proteintargets for assessing the domain of applicability for a model, an extended signature of 25 binswas used. The 25th bin records all distances greater than 24 Å in the signature and its inclusionenhanced the performance of the applicability domain assessment routine.
The entire range of colors on the EP map was coarse-grained into 9 colors, and that of ALPmap into 14 colors. These numbers come from down-sampling the 24 bit color scheme to a 6bit color scheme. The final number of elements was thus 24 × 81 and 24 × 196 for EP and ALPsurfaces, respectively. A representative EP mapped protein interaction surface of the PDBcomplex 1fbp and the corresponding PESD signature are shown in Figure 1. Each circle in thegraphical representation of the PESD signature is a bin. Darker circles indicate greater binpopulations. Each row is for a color combination, and each column represents a point-pairdistance that increases from left to right. For each surface, a total of 100,000 pairs of points
Das et al. Page 3
J Chem Inf Model. Author manuscript; available in PMC 2011 February 22.
NIH
-PA Author Manuscript
NIH
-PA Author Manuscript
NIH
-PA Author Manuscript

were selected. The population of each bin is thus proportional to the probability of a color (orproperty magnitude) being present at a certain distance from another color on the surface.
To eliminate bias in surface point selection, the procedure of Osada was utilized47. Within thisscheme, the area of each triangle of the surface mesh was calculated and stored as an array ofcumulative areas. A number between 0 and the total area was then randomly chosen, and thetriangle corresponding to the cumulative area containing that value was selected. The use of alookup table that segments the array of cumulative areas greatly increased the computationalefficiency of the procedure. A co-planar point within this triangle was then selected from arandom location within the part of the plane enclosed by the edges of the triangle as shown ineq 1, where r1 and r2 are random numbers and A, B and C are vertices of the selected triangle:
(1)
The color of the selected point was then set equal to the color of the nearest vertex of thetriangle. Typical signature computation time of a Visual Basic program on a 2.66 GHz IntelXeon running Windows XP with a look-up table is 8 to 33 seconds per surface out of which 5to 20 seconds are for parsing a surface file. Running four jobs of signature computation inparallel, the maximum computation time for each complex is typically 33 seconds.
DatasetsProtein-ligand complexes from the publicly-available database PDBbind37,38 (version 2005)were used in this study. The ‘refined set’ of the PDBbind has 1296 good quality complexes.After the Protonate3D run, a total of 1255 complexes from the refined set were available forPESD signature generation. Experimental binding affinity for each complex was extractedfrom the PDBbind database. The binding affinities were either inhibition constants (Ki) ordissociation constants (Kd) which were used equivalently in this study, in keeping with whatwas done in earlier works11,39. The refined set of PDBbind complexes also has a subset calleda ‘core set’ of 288 complexes. The core set is a non-redundant set of protein-ligand complexesseparated from the refined set48 and includs three complexes per non-redundant protein. Outof 1255 complexes with adjusted protonation state, 278 are part of this core set (reduced from288) and 977 are part of the core’ set (all remaining complexes of the refined set, reduced from1008). The affinity values (pKd or pKi) ranged from 1.49 to 13.96 in the core set and 0.49 to13 in the core’ set. The overlap between the two sets in terms of protein and/or ligandcomponents is shown in Table 5. The core set was used as the training set, and the core’ set asthe test set for Model I. To reduce the possibility of bias in choice of complexes for the trainingand test sets, three other training and test sets of the same size (training: 278, test: 977) werecreated from the 1255 complexes by random sampling without replacement. These formedtraining and test sets for models II, III and IV. Finally for Model V, the core’ set was used asthe training and the core set as the test set.
Data for enthalpy and entropy analysis were obtained from the SCORPIO database20.
ModelingSupport Vector Machine (SVM) regression and classification models were built with the e1071SVM package49 in R50 using PESD signatures of protein and ligand interaction surfaces asfeatures (Figure 2). No subjective feature selection was employed for any of the models exceptfor the removal of invariant columns prior to model building. Negative logarithms (base 10)of experimental Kd and Ki values were used as dependent variables (pKd and pKi respectively).For classification, individual pKd / pKi values were converted to class numbers (1 for weak
Das et al. Page 4
J Chem Inf Model. Author manuscript; available in PMC 2011 February 22.
NIH
-PA Author Manuscript
NIH
-PA Author Manuscript
NIH
-PA Author Manuscript

binders (pKi/pKd < 5), 2 for medium binders (5 ≤ pKi/pKd ≤ 8) and 3 for strong binders (pKi/pKd > 8)). Only the “gamma” parameter of the default radial kernel and the “cost” (cost ofconstraints violation) parameter were tuned by a simple 5-fold cross-validation withreplacement from within the training set, where 20% of the training set was randomly selectedand held out for cross-validation. For each combination of parameter values in Table 1 a modelwas built from the remaining 80% and applied on the validation set. The sum of residuals andcross-validated correlation coefficients were then recorded for each iteration. For eachparameter combination, ten such runs were made. For SVM classification, the parametercombination having the lowest sum of residuals was chosen to build the final tuned model. ForSVM regression, the parameter combination with the highest average cross-validatedcorrelation coefficient was chosen to build the final tuned model. In both cases, all otherparameters were kept at their default values. In R, the default for SVM regression is “eps-regression” and the default for SVM classification is “C-classification”49.
Chi-squared distanceWe have shown earlier that the chi-squared distance between protein interaction surface PESDsignatures is a good metric for assessing the similarity between pairs of protein active sites21,suggesting that this approach would provide a reasonable model applicability domain metric.Chi-squared distances were therefore computed for each pair of test and training proteininteraction surfaces using the procedure shown in eq 2 where the dissimilarity distance d isassessed between two PESD signatures H and K. As shown below in eq 3, EP and ALPdistances were combined using an ALP scaling factor of 0.7 since this weighting scheme gavethe best set of clusters in a classification experiment of 40 active sites and was found toapplicable to other active site comparisons as well21.
(2)
(3)
Quality metricsWhile a number of metrics are available for comparing the performance of scoring functions,PESD-SVM predictions of pKd/pKi values were assessed against experimental data usingPearson’s correlation coefficient (RP), Spearman’s correlation coefficient (RS), standarddeviation (SD) and mean error (ME). In eq 4 to 6, y represents the experimental value and xthe predicted value. The predicted values were not scaled for SD and ME calculations (unlikein Wang et al.39) and instead the definitions in eq 5 and 6 were used. In addition to the statisticalmetrics above, the slope and the intercept, a and b, of the best-fit line for true and predictedaffinities provide additional insight into model performance. In this case, a values close to 1.0and b values close to 0.0 are considered favorable.
Das et al. Page 5
J Chem Inf Model. Author manuscript; available in PMC 2011 February 22.
NIH
-PA Author Manuscript
NIH
-PA Author Manuscript
NIH
-PA Author Manuscript

(4)
(5)
(6)
(7)
The ability of the models to correctly classify complexes into weak (pKi/pKd < 5), medium (5≤ pKi/pKd ≤ 8) and strong binders (pKi/pKd > 8) was judged by calculating the recoveryrate and percentage true positive. The recovery rate is defined below.
(8)
Percentage true positive (% TP) defined below quantifies the reliability of a particular scoringfunction.
(9)
Scoring of docked posesGiven that the protein-ligand complex structures for affinity prediction were derived fromcrystal structures, it was of interest to determine how well the PESD-SVM approach wouldwork to score poses obtained by docking simulation. In contrast to the usual PESD-SVMapproach that separately encodes ligand and protein surface signatures, point pairs for PESD-DOCK signature generation were pooled in such a way that one endpoint was taken from theprotein interaction surface and the other from the ligand interaction surface. Poses that aroseduring a docking experiment based on 1cbx (a complex of carboxypeptidase A and L-Benzylsuccinate) were scored using a SVM regression model derived from PESD-DOCK signatures.This complex has previously been used in numerous benchmarking exercises in the literature,51, 52 providing us with a reasonable benchmark for evaluating the scoring efficacy of PESD-DOCK. To perform this evaluation, 50 docked poses were generated in MOE with dockingsite set to “Ligand” and rescoring set to “None”, with all other parameters being set to their
Das et al. Page 6
J Chem Inf Model. Author manuscript; available in PMC 2011 February 22.
NIH
-PA Author Manuscript
NIH
-PA Author Manuscript
NIH
-PA Author Manuscript

default values. A SVM regression model was then trained on the PESD-DOCK signatures of1253 complexes (1cbx and 1wht were excluded from the training data as these are complexesof L-benzyl succinate). The gamma and cost parameters were chosen from Table 1 to build aPESD-DOCK SVM model with the best cross-validated correlation coefficient (rTrain = 0.997,rCross-validated = 0.670; final model parameters: gamma = 1/Dimension of feature vector,cost=20).
ResultsRegression statistics of training complexes
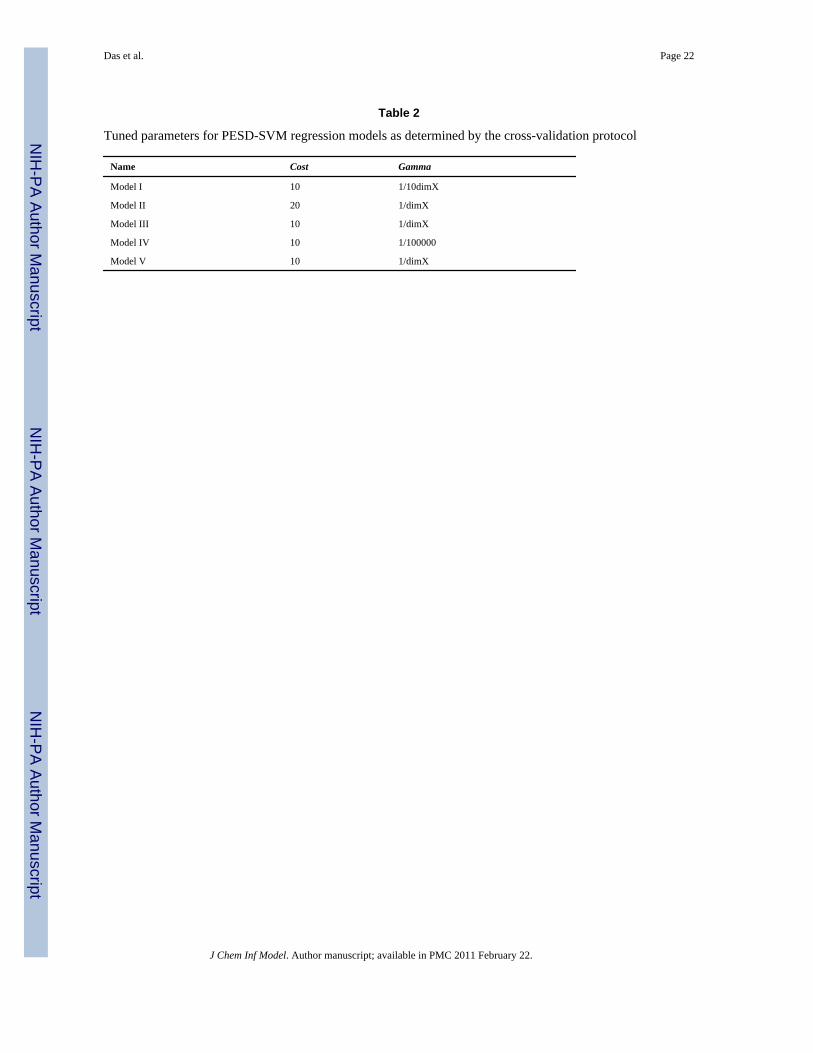
The tuned parameters chosen for the various PESD-SVM regression models I-V are shown inTable 2. The training set statistics for the models appear in Table 3. The correlation coefficientsrTrain between actual and predicted affinities of the training complexes ranged between 0.879and 0.997, indicating a significant level of overtraining. While usually not indicative ofexpected performance on test data, it is interesting to note that over-trained Models II and IIIwith their 0.997 correlation coefficients were, in fact, found to perform better than Models Iand IV on test data.
Regression statistics of test complexesWhen applied to the respective test sets, PESD-SVM regression Models I-IV had Pearson’scorrelation coefficients (RP) ranging from 0.517 to 0.574, and Spearman’s rank correlationcoefficients (RS) from 0.535 to 0.597 (Table 4). The prediction accuracy for Model V washigher at RP = 0.638 and RS = 0.628. Plots of experimental binding affinities of test complexesversus predicted binding affinities from PESD-SVM regression models I, II and V are shownin Figure 3.
For Model I, there were at least 263 complexes (Table 5) in the test set (core’) that had neithertheir protein component nor their ligand component common to complexes in the training set(core). Similarity search for ligands was done by three letter ligand identifiers which did notinclude peptides. Actual number of unique ligands is therefore slightly higher if peptides aretaken into account. The unique 263 complexes gave an RP of 0.496 which is close to 0.517observed when all complexes of the test set were considered. Interestingly, for Model V, animprovement in the value of RP was observed for complexes that had neither the ligandcomponent nor the protein component common between test and training sets. This could bedue to the relatively small number of complexes (only 17) that belonged to this category and/or due to a dominant enthalpic contribution (see Discussion). Overall, some transferability ofthe models is noted. Such a behavior is advantageous since the model need not be fitted withthe same protein for which prediction is to be made.
Further analysis of the predictive performance of PESD-SVM regression models was done bybreaking out prediction accuracies for several specific protein targets as shown in Table 6. ForModel I, no significant correlations between predicted and true affinities were observed forcarbonic anhydrase, HIV-1 protease and oligo-peptide binding protein. Moderate to goodcorrelations were observed for trypsin, retinoic acid receptor, tyrosine phosphatase, andurokinase–type plasminogen activator. Overall prediction accuracy improved for thesereceptors in the case of Model II, with predictions for oligo-peptide binding protein and retinoicacid receptors showing large improvements in accuracy. Possible reasons for the improvementsare provided in the Discussion section.
Domain of applicability53-56
Consistently higher prediction accuracy for complexes within the domain of applicability ofthe model in question was observed. The domain of applicability was determined by a common
Das et al. Page 7
J Chem Inf Model. Author manuscript; available in PMC 2011 February 22.
NIH
-PA Author Manuscript
NIH
-PA Author Manuscript
NIH
-PA Author Manuscript

similarity metric – chi squared distance between pairs of protein interaction surface signatures.Although both the protein and ligand interaction surface PESD signatures could be used formore accurately determining the difference between protein-ligand complexes, consideringonly the protein interaction surface PESD signature was found to be sufficient fordemonstrating the trend. The domain of applicability was determined from the lowest value ofthe chi-squared distance of signatures between a test complex and the training complexes. AllPESD-SVM regression models showed improvement in accuracy with decreasing chi-squareddistance cutoffs (Table 7). A plot of RP and RS against cutoff distances for PESD-SVMregression Model II is shown in Figure 4.
ClassificationDifferentiating weak and strong complexes from a set of weak, medium and strong complexesis a difficult task11, 39. The recovery rates (eq 8) of PESD-SVM classification models rangedfrom 30.0% to 62.1% for weak complexes and 18.9% to 47.6% for strong complexes (Table8). We note that the recovery rate is not a complete indicator of true reliability of a classifierin a classification task. The reliability of a classifier is tied to its ability to report true positivevalues and this is shown in Table 9 for the PESD-SVM classification models. True positivepercentages (eq 9) for PESD-SVM models ranged from 52.7% to 67% for weak binders and40% to 78.8% for strong binders.
Comparison with SFCscoreSFCScore11 is a recently developed empirical scoring function that includes a number ofdescriptors including those accounting for polar and apolar surface areas and was previouslyshown to perform better than 14 other empirical , knowledge-based or force-field based scoringfunctions 39. Rigorous quantitative comparison between two empirical scoring functionsrequires that not only the test set but also the training set to be identical. This is because thechoice of training sets can have a great impact on the performance of empirical scoringfunctions. Therefore the following comparison can only be considered semi-quantitative withcomparably sized non-enriched training sets (models sfc_290m, sfc_229m, sfc_290p andsfc_229p and PESD-SVM models I-IV) unless otherwise noted. The reported correlationcoefficients of predicted and experimental affinities with SFCscore are RP = 0.492 to 0.520,and RS = 0.547 to 0.565 on 919 test complexes in contrast to RP = 0.517 to 0.574, and RS =0.535 to 0.595 on 977 test complexes with PESD-SVM models I-IV. There is considerableoverlap between the two test sets. In version 2005 of PDBbind (used in this study), 209 newcomplexes were added and 4 older complexes were removed from the previous year’s version(used in SFCscore) resulting in an overlap of nearly 700 complexes. The PESD-SVMregression models I-IV gave RP = 0.491 to 0.551 and RS = 0.508 to 0.575 for the overlappingtest complexes. The lower bound of RS was slightly lower and the upper bound of RP wasslightly higher than SFCscore values. The ME and SD of PESD-SVM models I-IV (ME=1.33to 1.42, SD=1.74 to 1.84) were comparable to slightly better than the four SFCscore modelsobtained on a different test set (ME=1.39 to 1.45, SD = 1.83 to 1.89). Although SFCscoreshowed an apparently higher accuracy for carbonic anhydrase (CA), the test and training setsof SFCscore had common complexes in this case: for example, 32 out of 37 test molecules inthe CA data set and 14 out of 74 test HIV-1 protease molecules also belonged to the 290complex SFCscore training set. In the present study no model had any overlapping complexbetween its test and training set. Two residual (|experimental affinity - predicted affinity|) cutoffvalues have been reported in the literature11, and for comparison, we utilize the same twocriteria here: the percentage of complexes with residuals under 2.0 and 1.5 log units,respectively. For SFCscore, the best percentages under those residual cutoffs for the 919 testmolecules were 72.4% and 60.8%. In contrast, for the model with the lowest RP in this study,
Das et al. Page 8
J Chem Inf Model. Author manuscript; available in PMC 2011 February 22.
NIH
-PA Author Manuscript
NIH
-PA Author Manuscript
NIH
-PA Author Manuscript

PESD-SVM regression Model I, the percentages were higher at 75.5% and 62.2%. For PESD-SVM regression Model II, the percentages were 76.8% and 62.4%.
The highest recovery rate of weak complexes using PESD-SVM classifiers was 62.1%(classification model I) which is higher than the reported recovery rate for any other scoringfunctions 11, 39. However, given the recovery rate of strong binders for the Model I was notvery high (only 34.5%), this could be due to a tendency to under-estimate affinities. The truepositive percent of Model I for weak complexes was indeed the lowest among the four modelsat 52.7%. In contrast, Model III had good recovery rates for weak and strong complexes andits true positive rates were also relatively higher. The recovery rate of weak complexes byModel III at 52.0% was also higher than all SFCscore functions applied to the 919 unbiasedtest set. The highest recovery rate of strong complexes was 47.6% with PESD-SVM classifierswhich is also significantly high compared to other reported values11,39. We note that thisrecovery rate is only exceeded by sfc_frag, which the authors had noted overestimatedaffinities11. The important point of difference between the SFCscore approach and the PESD-SVM approach is that SFCscore includes descriptors such as number of rotatable bonds, ring-metal interaction scores and ring-ring interaction scores (in addition to surface-based ones)that were absent in the PESD-SVM method although, in general, comparable results with wereobtained with the PESD-SVM method.
Scoring of docked posesOut of 50 poses generated for the complex 1cbx, the ligand pose with the highest PESD-DOCKSVM score had a root mean squared deviation (rmsd) of 1.46 Å with respect to the nativecrystal pose. It is significant to note that only one pose with rmsd > 2.0 Å (rmsd = 2.09 Å) hada PESD-DOCK SVM score higher than that obtained for the native crystal structure pose. Aplot of the correlation between ligand pose (rmsd) and PESD-DOCK SVM score is shown inFigure 5. The Spearman’s correlation coefficient for this data was -0.524 (PESD-DOCK SVMmodel was trained on positive affinity values: pKd/pKi). Further study on several diverseprotein targets needs to be made to assess the reliability of the PEST-DOCK SVM scoringmethod, and this is part of an ongoing effort which will be reported elsewhere.
DiscussionChange in buried apolar surface area of protein and ligand together has been previouslyobserved to have a good correlation with affinity20 and many approaches9,11,22,23,34 to bindingaffinity prediction have utilized surface area based descriptors and equations. PESD-SVMapproach with only surface based signatures was able to achieve accuracy comparable toSFCscore that used a number of non-surface based descriptors in addition to surface-basedones. The population of different property combination bins in the PESD signatures areproportional not only to the surface area under different properties but also represent the relativelocations of a surface under one property with respect to others under different properties. Asnoted by Golhke and Klebe57, “the burial of a part of a hydrophobic molecular surface at abinding site can induce a simultaneous cooperative enhancement of neighboring electrostaticinteractions” 58, 59. Therefore the relative location of the areas under different magnitudes ofproperty values is an important factor in binding that is captured by the PESD signatures andnot by traditional sum of area descriptors.
In the present study however, a good correlation between ΔH/-TΔS and prediction accuracywas also noted. With Isothermal Titration Calorimetry (ITC) it is possible to determine theenthalpy value and hence determine the enthalpy/entropy contribution19,20. A database ofenergy values obtained from ITC experiments has also been set up20. Although limited in size,analysis of the data by Olsson and coworkers20 showed significant amount of the so-called
Das et al. Page 9
J Chem Inf Model. Author manuscript; available in PMC 2011 February 22.
NIH
-PA Author Manuscript
NIH
-PA Author Manuscript
NIH
-PA Author Manuscript

“enthalpy-entropy compensation” 60 that resulted in a relatively small energy range for free-energy and large ranges for entropy and enthalpy. A plot of enthalpy versus free-energy of thedata comprising of 322 entries (Figure 6a) showed no correlation between enthalpy and free-energy similar to earlier observations57. However, for about one-third of the entries (111 of332) the ΔH/-TΔS was greater than 3, and this is where good correlation between free energyand enthalpy was observed (Figure 6b). Therefore, if the temperature at which the ITC datawas obtained is assumed to be room temperature (298 K) under identical experimentalconditions, a scoring function having poor treatment for entropy and trained on pKd/pKiobtained under those conditions, should achieve higher accuracy in predicting affinityconstants for such entries at that temperature. The following analysis is not exhaustive due tothe very small number of sample points, but some important trends are noted from the availabledata. Where energy values for a complex were available at multiple temperatures in SCORPIO,only the one closest to room temperature was used (such a procedure was also adopted inPDBbind38). Trypsin is a receptor where enthalpy on an average was found to be more than4 times the magnitude of -TΔS based on entries in the SCORPIO database (1k1i, 1k1j, 1k1l,1k1m, 1k1n, 1ce5 at ~298 K) and this is possibly a reason why most scoring functions includingPESD-SVM perform well in this receptor. We also note a similar trend in prediction accuracyof complexes in the test set of Model I for which ITC data was available from SCORPIO andwhose ΔH/-TΔS was greater than 3. The ten complexes (1a1c, 1k1j, 1k1l, 1k1m, 1kzn, 1swg,1fdq, 1qy1, 1qy2, 1adl) had an RP of 0.685. Out of the ten complexes, 1qy1 and 1qy2 ITCvalues were obtained at 308 K and the rest were obtained within ± 5 K of room temperature.The range of chi-squared distances of these complexes with respect to training was 8643 to15684, with an average of 12090, indicating their protein interaction surfaces were not verysimilar to those in the training. Complex 1adl was an outlier having a residual greater thanthree times the standard deviation of the residuals of the ten complexes (Figure 6d). On removalof this complex, the RP increased further to 0.865 while the average chi-squared distancedecreased only slightly to 12074. The primary reference61 of 1adl indicated solventparticipation in binding, and this could be a reason for the inaccuracy with the current PESD-SVM method. Similarly ITC data for HIV-1 protease (1hsg, 1ohr, 1a30, 1t7j, 1t7i; 1t7j and1t7i at ~293 K, rest at ~298K) showed that entropy is a significant component with the averageΔH/-TΔS being 1.14 in the 5 complexes. Although polarization effects are important62,63,poor prediction accuracy with most scoring functions for HIV-1 protease could be because ofinadequate treatment of entropy18. In fact taking into account entropy was shown to result ingood prediction of affinity64. Entropic factors are also dominant in oligopeptide bindingprotein and solvent plays a significant role in binding57 which possibly explains the lack ofcorrelation between predicted and experimental affinities for Model I. These trends supportthe hypothesis. Therefore, accounting for both entropy and solvent is necessary to improve theaccuracy of the PESD-SVM method. Other possible sources of error are experimentalconditions (such as temperature and pH) and techniques used for determining pKd/pKi
65 andthese can be reduced by ensuring consistency in the data.
Interestingly, performance improved significantly for Model II in some receptors includingoligo-peptide binding protein. The training set of Model II had 8 oligopepetide binding proteinsin the training set as opposed to 3 in Model I. Recall that the protonated core set did not havemore than 3 complexes per non-redundant protein. The improvement in accuracy could be dueto the inclusion of more oligopeptide binding proteins in the training set of Model II resultingin enrichment. Similar trends with varying degrees of improvement are observed for otherreceptors. Enrichment and larger sized training sets were previously observed to improveaccuracy of scoring functions10, 11, 66, 67. The domain of applicability filter applied to test setis complementary to training set enrichment, where we also see improved prediction accuracywith decreasing chi-squared distance cut-offs between test and train complexes.
Das et al. Page 10
J Chem Inf Model. Author manuscript; available in PMC 2011 February 22.
NIH
-PA Author Manuscript
NIH
-PA Author Manuscript
NIH
-PA Author Manuscript

ConclusionsThe utility of the PESD signatures in affinity prediction has been demonstrated by itsapplication to a large number of different proteins. A simple model building process wasemployed that generated models based on PESD signatures of two surface maps. The modelshad only modest accuracy but was comparable in general and slightly improved in some caseswith respect to SFCscore. We have compared the results to those of SFCscore since the latteris a recently developed regression based scoring function, and included both surface and non-surface based descriptors.
However, the present results of the PESD-SVM approach show that only two surface maps arenot adequate to achieve a higher degree of accuracy. Although enriching a training set orincreasing its size had a positive effect of varying degrees on accuracy, factors such as entropyand solvent cannot be neglected. These terms need to be added in the future to improve thecurrent models although this can be a difficult challenge68,69. Addition of specific interactionterms such as ring-ring and ring-metal descriptors11 can also be potentially beneficial. We alsonote that in certain receptors such as trypsin, tyrosine phosphatase and urokinase-typeplasminogen activator, PESD-SVM performed consistently well and for most complexes witha dominant enthalpic contribution (ΔH/-TΔS > 3), a good correlation between true andpredicted affinities was observed.
Supplementary MaterialRefer to Web version on PubMed Central for supplementary material.
AcknowledgmentsThe authors would also like to acknowledge Dr. N. Sukumar and Dr. Dominic Ryan for valuable discussions. Thiswork was supported by the National Institutes of Health, Grant number 1P20 HG003899 “Establishment of theRensselaer Exploratory Center for Cheminformatics Research – RECCR” and was conducted in the RPI Center forBiotechnology and Interdisciplinary Studies (CBIS).
References1. Gehlhaar DK, Verkhivker GM, Rejto PA, Sherman CJ, Fogel DR, Fogel LJ, Freer ST. Molecular
Recognition of the Inhibitor AG-1343 by HIV-1 Protease: Conformationally Flexible Docking byEvolutionary Programming. Chem Biol 1995;2:317–324. [PubMed: 9383433]
2. Muegge I, Martin YC. A General and Fast Scoring Function for Protein-Ligand Interactions: ASimplified Potential Approach. J Med Chem 1999;42:791–804. [PubMed: 10072678]
3. Böhm H-J. The development of a simple empirical scoring function to estimate the binding constantfor a protein-ligand complex of known three-dimensional structure. J Comput-Aided Mol Des1994;8:243–256. [PubMed: 7964925]
4. Rarey M, Kramer B, Lengauer T, Klebe G. A Fast Flexible Docking Method using an IncrementalConstruction Algorithm. J Mol Biol 1996;261:470–489. [PubMed: 8780787]
5. Jones G, Willett P, Glen RC, Leach AR, Taylor R. Development and validation of a genetic algorithmfor flexible docking. J Mol Biol 1997;267:727–748. [PubMed: 9126849]
6. Ewing TJA, Makino S, Skillman AG, Kuntz ID. DOCK 4.0: Search strategies for automated moleculardocking of flexible molecule databases. J Comput-Aided Mol Des 2001;15:411–428. [PubMed:11394736]
7. Eldridge MD, Murray CW, Auton TR, Paolini GV, Mee RP. Empirical scoring functions: I. Thedevelopment of a fast empirical scoring function to estimate the binding affinity of ligands in receptorcomplexes. J Comput-Aided Mol Des 1997;11:425–445. [PubMed: 9385547]
8. Morris GM, Goodsell DS, Halliday RS, Huey R, Hart WE, Belew RK, Olson AJ. Automated dockingusing a Lamarckian genetic algorithm and an empirical binding free energy function. J Comput Chem1998;19:1639–1662.
Das et al. Page 11
J Chem Inf Model. Author manuscript; available in PMC 2011 February 22.
NIH
-PA Author Manuscript
NIH
-PA Author Manuscript
NIH
-PA Author Manuscript

9. Gohlke H, Hendlich M, Klebe G. Knowledge-based scoring function to predict protein-ligandinteractions. J Mol Biol 2000;295:337–356. [PubMed: 10623530]
10. Wang R, Lai L, Wang S. Further development and validation of empirical scoring functions forstructure-based binding affinity prediction. J Comput-Aided Mol Des 2002;16:11–26. [PubMed:12197663]
11. Sotriffer CA, Sanschagrin P, Matter H, Klebe G. SFCscore: Scoring functions for affinity predictionof protein-ligand complexes. Proteins: Struct Funct Bioinf 2008;73:395–419.
12. Yin S, Biedermannova L, Vondrasek J, Dokholyan NV. MedusaScore: An Accurate Force Field-Based Scoring Function for Virtual Drug Screening. J Chem Inf Model 2008;48:1656–1662.[PubMed: 18672869]
13. Zhang S, Golbraikh A, Tropsha A. Development of Quantitative Structure-Binding AffinityRelationship Models Based on Novel Geometrical Chemical Descriptors of the Protein-LigandInterfaces. J Med Chem 2006;49:2713–2724. [PubMed: 16640331]
14. Beveridge DL, Dicapua FM. Free Energy Via Molecular Simulation: Applications to Chemical andBiomolecular Systems. Annu Rev Biophys Biophys Chem 1989;18:431–492. [PubMed: 2660832]
15. Kollman P. Free energy calculations: Applications to chemical and biochemical phenomena. ChemRev 1993;93:2395–2417.
16. Bash PA, Singh UC, Langridge R, Kollman PA. Free energy calculations by computer simulation.Science 1987;236:564–568. [PubMed: 3576184]
17. Dang LX, Merz KM, Kollman PA. Free energy calculations on protein stability: Thr-157 .fwdarw.Val-157 mutation of T4 lysozyme. J Am Chem Soc 1989;111:8505–8508.
18. Cheng T, Li X, Li Y, Liu Z, Wang R. Comparative Assessment of Scoring Functions on a DiverseTest Set. J Chem Inf Model 2009;49:1079–1093. [PubMed: 19358517]
19. Ladbury JE, Williams MA. The extended interface: measuring non-local effects in biomolecularinteractions. Curr Opin Struct Biol 2004;14:562–569. [PubMed: 15465316]
20. Olsson TSG, Williams MA, Pitt WR, Ladbury JE. The Thermodynamics of Protein-Ligand Interactionand Solvation: Insights for Ligand Design. J Mol Biol 2008;384:1002–1017. [PubMed: 18930735]
21. Das S, Kokardekar A, Breneman CM. Rapid Comparison of Protein Binding Site Surfaces withProperty Encoded Shape Distributions. J Chem Inf Model. [Article ASAP], Published online: Nov18 2009. 10.1021/ci900317x
22. Stiefl N, Baumann K. Structure-Based Validation of the 3D-QSAR Technique MaP. J Chem InfModel 2005;45:739–749. [PubMed: 15921463]
23. Wagener M, Sadowski J, Gasteiger J. Autocorrelation of Molecular Surface Properties for ModelingCorticosteroid Binding Globulin and Cytosolic Ah Receptor Activity by Neural Networks. J AmChem Soc 2002;117:7769–7775.
24. Renner S, Schneider G. Scaffold-Hopping Potential of Ligand-Based Similarity Concepts.ChemMedChem 2006;1:181–185. [PubMed: 16892349]
25. Breneman CM, Sundling CM, Sukumar N, Shen L, Katt WP, Embrechts MJ. New developments inPEST shape/property hybrid descriptors. J Comput-Aided Mol Des 2003;17:231–240. [PubMed:13677489]
26. Zauhar RJ, Moyna G, Tian L, Li Z, Welsh WJ. Shape Signatures: A New Approach to Computer-Aided Ligand- and Receptor-Based Drug Design. J Med Chem 2003;46:5674–5690. [PubMed:14667221]
27. Noble WS. What is a support vector machine? Nat Biotechnol 2006;24:1565–1567. [PubMed:17160063]
28. Lapinsh M, Prusis P, Gutcaits A, Lundstedt T, Wikberg JES. Development of proteo-chemometrics:a novel technology for the analysis of drug-receptor interactions. Biochim Biophys Acta Gen Subj2001;1525:180–190.
29. Strömbergsson H, Daniluk P, Kryshtafovych A, Fidelis K, Wikberg JES, Kleywegt GJ, Hvidsten TR.Interaction Model Based on Local Protein Substructures Generalizes to the Entire Structural Enzyme-Ligand Space. J Chem Inf Model 2008;48:2278–2288. [PubMed: 18937438]
30. Ortiz AR, Pisabarro MT, Gago F, Wade RC. Prediction of Drug Binding Affinities by ComparativeBinding Energy Analysis. J Med Chem 1995;38:2681–2691. [PubMed: 7629807]
Das et al. Page 12
J Chem Inf Model. Author manuscript; available in PMC 2011 February 22.
NIH
-PA Author Manuscript
NIH
-PA Author Manuscript
NIH
-PA Author Manuscript

31. Datar PA, Khedkar SA, Malde AK, Coutinho EC. Comparative residue interaction analysis (CoRIA):a 3D-QSAR approach to explore the binding contributions of active site residues with ligands. JComput-Aided Mol Des 2006;20:343–360. [PubMed: 17009094]
32. Gohlke H, Klebe G. DrugScore meets CoMFA: adaptation of fields for molecular comparison(AFMoC) or how to tailor knowledge-based pair-potentials to a particular protein. J Med Chem2002;45:4153–4170. [PubMed: 12213058]
33. Vijayan RSK, Bera I, Prabu M, Saha S, Ghoshal N. Combinatorial Library Enumeration and LeadHopping using Comparative Interaction Fingerprint Analysis and Classical 2D QSAR Methods forSeeking Novel GABAA α3 Modulators. J Chem Inf Model 2009;49:2498–2511. [PubMed:19891421]
34. Lindström A, Pettersson F, Almquist F, Berglund A, Kihlberg J, Linusson A. Hierarchical PLSmodeling for predicting the binding of a comprehensive set of structurally diverse protein-ligandcomplexes. J Chem Inf Model 2006;46:1154–1167. [PubMed: 16711735]
35. Head R, Smythe ML, Oprea TI, Waller CL, Green SM, Marshall GR. VALIDATE: A New Methodfor the Receptor-Based Prediction of Binding Affinities of Novel Ligands. J Am Chem Soc1996;118:3959–3969.
36. Deng W, Breneman C, Embrechts MJ. Predicting Protein–Ligand Binding Affinities Using NovelGeometrical Descriptors and Machine-Learning Methods. J Chem Inf Comput Sci 2004;44:699–703.[PubMed: 15032552]
37. Wang R, Fang X, Lu Y, Yang CY, Wang S. The PDBbind Database: Methodologies and updates. JMed Chem 2005;48:4111–4119. [PubMed: 15943484]
38. Wang R, Fang X, Lu Y, Wang S. The PDBbind Database: Collection of Binding Affinities for Protein-Ligand Complexes with Known Three-Dimensional Structures. J Med Chem 2004;47:2977–2980.[PubMed: 15163179]
39. Wang R, Lu Y, Fang X, Wang S. An Extensive Test of 14 Scoring Functions Using the PDBbindRefined Set of 800 Protein–Ligand Complexes. J Chem Inf Comput Sci 2004;44:2114–2125.[PubMed: 15554682]
40. Labute P. Protonate3D: Assignment of ionization states and hydrogen coordinates to macromolecularstructures. Proteins: Struct Funct Bioinf 2009;75:187–205.
41. Molecular Operating Environment, Version 2007.09. Chemical Computing Group, Inc.; Montreal,QC: 2007.
42. Ryan, MD.; Hepburn, T.; Sukumar, N.; Das, S.; Breneman, CM. TAE Augmented scoring functions:Two approaches, atom and surface based. Abstracts of Papers, 234th ACS National Meeting; Boston,MA, United States. August 19-23, 2007; 2007. COMP-42
43. Das, S.; Breneman, CM.; Ryan, MD. TAE Augmented Scoring Functions: Application to Enzymaticand Non-enzymatic proteins. Abstracts of Papers, 235th ACS National Meeting; New Orleans, LA.April 6-10, 2008; 2008. COMP-121
44. Berman HM, Battistuz T, Bhat TN, Bluhm WF, Bourne PE, Burkhardt K, Feng Z, Gilliland GL, IypeL, Jain S, Fagan P, Marvin J, Padilla D, Ravichandran V, Schneider B, Thanki N, Weissig H,Westbrook JD, Zardecki C. The Protein Data Bank. Nucleic Acids Res 2000;28:235–242. [PubMed:10592235]
45. Labute, P. An Integrated Application in MOE for the Visualization and Analysis of Protein ActiveSites with Molecular Surfaces, Contact Statistics and Electrostatic Maps. J Chem Comput Group.2006 [Dec 18, 2009]. [Online] http://www.chemcomp.com/journal/f_surfmap.htm
46. Santavy, M.; Labute, P. Electrostatic Fields and Surfaces in MOE. J Chem Comput Group. 1998 [Dec18, 2009]. [Online] http://www.chemcomp.com/journal/grid.htm
47. Osada R, Funkhouser T, Chazelle B, Dobkin D. Shape Distributions. ACM Trans Graph 2002;21:807–832.
48. A Brief Introduction to the PDBbind bind Database v.2007. [Dec 18, 2009].http://sw16.im.med.umich.edu/databases/PDBbind/pdfs/PDBbind_2007_intro.pdf
49. Dimitriadou, E.; Hornik, K.; Leisch, F.; Meyer, D.; Weingessel, A. Package ‘e1071’. [Dec 18, 2009].http://cran.r-project.org/web/packages/e1071/e1071.pdf
50. Ripley BD. The {R} project in statistical computing. MSOR Connections Newsletter of the LTSNMaths, Stats & OR Network 2001;1:23–25.
Das et al. Page 13
J Chem Inf Model. Author manuscript; available in PMC 2011 February 22.
NIH
-PA Author Manuscript
NIH
-PA Author Manuscript
NIH
-PA Author Manuscript

51. Bursulaya B, Totrov M, Abagyan R, Brooks C. Comparative study of several algorithms for flexibleligand docking. J Comput-Aided Mol Des 2003;17:755–763. [PubMed: 15072435]
52. Wang R, Lu Y, Wang S. Comparative Evaluation of 11 Scoring Functions for Molecular Docking. JMed Chem 2003;46:2287–2303. [PubMed: 12773034]
53. Dragos H, Gilles M, Alexandre V. Predicting the Predictability: A Unified Approach to theApplicability Domain Problem of QSAR Models. J Chem Inf Model 2009;49:1762–1776. [PubMed:19530661]
54. Weaver S, Gleeson MP. The importance of the domain of applicability in QSAR modeling. J MolGraph Model 2008;26:1315–1326. [PubMed: 18328754]
55. Guha R, Schurer S. Utilizing high throughput screening data for predictive toxicology models:protocols and application to MLSCN assays. J Comput-Aided Mol Des 2008;22:367–384. [PubMed:18283419]
56. Guha R. On the interpretation and interpretability of quantitative structure–activity relationshipmodels. J Comput-Aided Mol Des 2008;22:857–871. [PubMed: 18784976]
57. Gohlke H, Klebe G. Approaches to the Description and Prediction of the Binding Affinity of Small-Molecule Ligands to Macromolecular Receptors. Angew Chem Int Ed 2002;41:2644–2676.
58. Sharman GJ, Searle MS, Benhamu B, Groves P, Williams DH. Burial of Hydrocarbon CausesCooperative Enhancement of Electrostatic Binding. Angew Chem Int Ed 1995;34:1483–1485.
59. Williams DH, Maguire AJ, Tsuzuki W, Westwell MS. An Analysis of the Origins of a CooperativeBinding Energy of Dimerization. Science 1998;280:711–714. [PubMed: 9563941]
60. Gilli P, Ferretti V, Gilli G, Borea PA. Enthalpy-entropy compensation in drug-receptor binding. JPhys Chem 1994;98:1515–1518.
61. LaLonde JM, Levenson MA, Roe JJ, Bernlohr DA, Banaszak LJ. Adipocyte lipid-binding proteincomplexed with arachidonic acid. Titration calorimetry and X-ray crystallographic studies. J BiolChem 1994;269:25339–25347. [PubMed: 7929228]
62. Hensen C, Hermann JC, Nam K, Ma S, Gao J, Höltje HD. A combined QM/MM Approach to Protein-Ligand Interactions: Polarization Effects of the HIV-1 Protease on Selected High Affinity Inhibitors.J Med Chem 2004;47:6673–6680. [PubMed: 15615516]
63. Das D, Koh Y, Tojo Y, Ghosh AK, Mitsuya H. Prediction of Potency of Protease Inhibitors UsingFree Energy Simulations with Polarizable Quantum Mechanics-Based Ligand Charges and a HybridWater Model. J Chem Inf Model. [Article ASAP], Published online: Nov 24, 2009. 10.1021/ci900320p
64. Verkhivker G, Appelt K, Freer ST, Villafranca JE. Empirical free energy calculations of ligand-protein crystallographic complexes. I. Knowledge-based ligand-protein interaction potentials appliedto the prediction of human immunodeficiency virus 1 protease binding affinity. Protein Eng Des Sel1995;8:677–691.
65. Tame JR. Scoring functions - the first 100 years. J Comput-Aided Mol Des 2005;19:445–451.[PubMed: 16231202]
66. Ajay, Murcko MA. Computational Methods to Predict Binding Free Energy in Ligand-ReceptorComplexes. J Med Chem 1995;38:4953–4967. [PubMed: 8544170]
67. Sales AP, Tomaras G, Kepler T. Improving peptide-MHC class I binding prediction for unbalanceddatasets. BMC Bioinformatics 2008;9:385. [PubMed: 18803836]
68. Leach AR, Shoichet BK, Peishoff CE. Prediction of Protein-Ligand interactions. Docking andScoring: Successes and Gaps. J Med Chem 2006;49:5851–5855. [PubMed: 17004700]
69. Tirado-Rives J, Jorgensen WL. Contribution of Conformer Focusing to the Uncertainty in PredictingFree Energies for Protein-Ligand Binding. J Med Chem 2006;49:5880–5884. [PubMed: 17004703]
Das et al. Page 14
J Chem Inf Model. Author manuscript; available in PMC 2011 February 22.
NIH
-PA Author Manuscript
NIH
-PA Author Manuscript
NIH
-PA Author Manuscript

Figure 1.(Left) Side view of EP mapped protein interaction surface of complex 1fbp. P1 and P2 are twopoints chosen from random locations on the surface. The properties of these two points andthe Euclidean distance d between them determine which PESD signature bin they will occupy.The graphical representation of the PESD signature of 1fbp is shown as a two dimensional gridof bins (Right). Darker circles indicate greater bin populations. Each row corresponds tospecific endpoint color combinations while each column represents point-pair distances thatincrease from left to right.
Das et al. Page 15
J Chem Inf Model. Author manuscript; available in PMC 2011 February 22.
NIH
-PA Author Manuscript
NIH
-PA Author Manuscript
NIH
-PA Author Manuscript
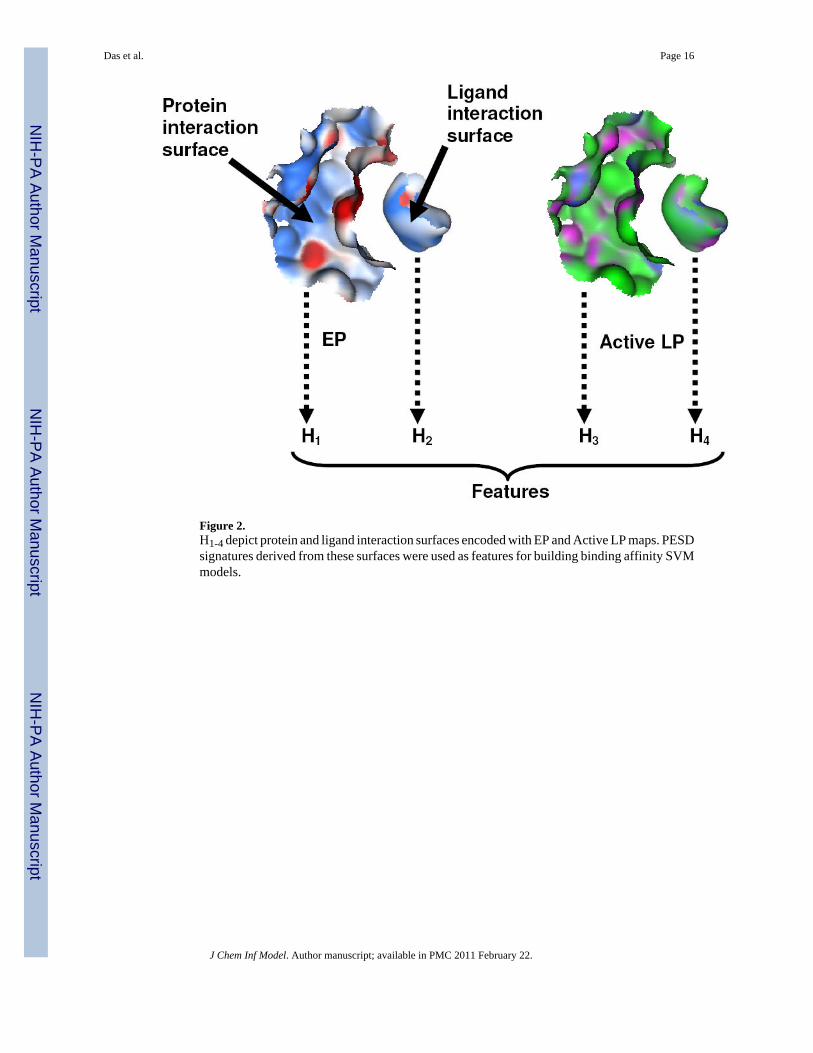
Figure 2.H1-4 depict protein and ligand interaction surfaces encoded with EP and Active LP maps. PESDsignatures derived from these surfaces were used as features for building binding affinity SVMmodels.
Das et al. Page 16
J Chem Inf Model. Author manuscript; available in PMC 2011 February 22.
NIH
-PA Author Manuscript
NIH
-PA Author Manuscript
NIH
-PA Author Manuscript

Figure 3.Plot of experimental affinities versus predicted affinities for PESD-SVM regression models I,II and V applied to their respective test sets.
Das et al. Page 17
J Chem Inf Model. Author manuscript; available in PMC 2011 February 22.
NIH
-PA Author Manuscript
NIH
-PA Author Manuscript
NIH
-PA Author Manuscript

Figure 4.Plot of RP, RS and number of test cases against chi-squared cutoff distances for PESD-SVMregression Model II.
Das et al. Page 18
J Chem Inf Model. Author manuscript; available in PMC 2011 February 22.
NIH
-PA Author Manuscript
NIH
-PA Author Manuscript
NIH
-PA Author Manuscript

Figure 5.Correlation between ligand pose (rmsd from native pose) and PESD-DOCK SVM Score fordocked conformations of L-Benzyl succinate in 1cbx. The score of the native pose (rmsd = 0)is shown as a dashed line. Since PESD-DOCK SVM models were trained on positive affinityvalues (pKd/pKi), higher scores indicate favorable interactions.
Das et al. Page 19
J Chem Inf Model. Author manuscript; available in PMC 2011 February 22.
NIH
-PA Author Manuscript
NIH
-PA Author Manuscript
NIH
-PA Author Manuscript

Figure 6.(a) Plot of free energy versus enthalpy for 322 entries from the SCORPIO database. (b) Plotof free energy versus enthalpy for 111 out of 322 entries from the SCORPIO database. TheΔH/-TΔS was greater than 3 for these complexes. (c) Difference plot of 6a and 6b (d) Plot ofexperimental versus predicted affinities of all entries in the core set for which ΔH/-TΔS wasgreater than 3 and could be obtained from the SCORPIO database. The complex 1adl is circledin red.
Das et al. Page 20
J Chem Inf Model. Author manuscript; available in PMC 2011 February 22.
NIH
-PA Author Manuscript
NIH
-PA Author Manuscript
NIH
-PA Author Manuscript

NIH
-PA Author Manuscript
NIH
-PA Author Manuscript
NIH
-PA Author Manuscript
Das et al. Page 21
Table 1
Choice of parameter values for model parameter tuning
Parameter Values
Cost 1, 10, 20, 30, 40, 50, 60, 70, 80, 90, 100
Gamma 1, 1/dimXa, 10/dimX a, 1/10dimXa. 1/100000
adimX = dimension of feature vector. Default values in R are cost=1 and gamma=1/dimX.
J Chem Inf Model. Author manuscript; available in PMC 2011 February 22.
NIH
-PA Author Manuscript
NIH
-PA Author Manuscript
NIH
-PA Author Manuscript
Das et al. Page 22
Table 2
Tuned parameters for PESD-SVM regression models as determined by the cross-validation protocol
Name Cost Gamma
Model I 10 1/10dimX
Model II 20 1/dimX
Model III 10 1/dimX
Model IV 10 1/100000
Model V 10 1/dimX
J Chem Inf Model. Author manuscript; available in PMC 2011 February 22.

NIH
-PA Author Manuscript
NIH
-PA Author Manuscript
NIH
-PA Author Manuscript
Das et al. Page 23
Table 3
Regression statistics of PESD-SVM regression models applied to respective training sets
Name NTrain rTrain rCross-validated
Model I 278 0.879 0.588
Model II 278 0.997 0.482
Model III 278 0.997 0.565
Model IV 278 0.923 0.574
Model V 977 0.997 0.633
J Chem Inf Model. Author manuscript; available in PMC 2011 February 22.

NIH
-PA Author Manuscript
NIH
-PA Author Manuscript
NIH
-PA Author Manuscript
Das et al. Page 24
Tabl
e 4
Reg
ress
ion
stat
istic
s of p
erfo
rman
ce o
f PES
D-S
VM
regr
essi
on m
odel
s on
resp
ectiv
e te
st se
ts.
Nam
eN
Trai
nN
Test
Rp
Rs
ME
SDa
b
Mod
el I
278
977
0.51
70.
535
1.42
1.84
0.74
1.97
Mod
el II
278
977
0.57
40.
597
1.36
1.76
1.11
-0.8
4
Mod
el II
I27
897
70.
572
0.59
51.
331.
740.
930.
47
Mod
el IV
278
977
0.53
10.
550
1.39
1.84
0.75
1.76
Mod
el V
977
278
0.63
80.
628
1.45
1.86
1.23
-1.5
2
SFC
scor
e(sf
c_29
0m)a
290
919
0.49
20.
555
SFC
scor
e(sf
c_m
et)a
341
919
0.54
00.
582
a SFC
scor
e m
odel
s with
hig
hest
and
low
est R
P va
lues
11 a
re p
rovi
ded
for c
ompa
rison
. Not
e th
at sf
c_m
et w
as tr
aine
d on
an
enric
hed
train
ing
set.
J Chem Inf Model. Author manuscript; available in PMC 2011 February 22.

NIH
-PA Author Manuscript
NIH
-PA Author Manuscript
NIH
-PA Author Manuscript
Das et al. Page 25
Table 5
Overlap between protonated core and core’ sets in terms of protein and ligand components of the complexes.
Type Number of complexes RP
protein component in core’ not occurring in core 343 0.492
ligand component in core’ not occurring in core 739a 0.519
Protein and ligand component in core’ not occurring in core 263a 0.496
Protein and ligand component in core’ also occurring in core 0
protein component in core not occurring in core’ 37 0.710
ligand component in core not occurring in core’ 163 a 0.632
protein and ligand component in core not occurring in core’ 17 a 0.736
aSimilarity search was done by three letter ligand identifiers which did not include peptides. Actual numbers are therefore higher if peptides are taken
into account.
J Chem Inf Model. Author manuscript; available in PMC 2011 February 22.

NIH
-PA Author Manuscript
NIH
-PA Author Manuscript
NIH
-PA Author Manuscript
Das et al. Page 26
Table 6
Prediction accuracy of PESD-SVM regression models I and II on different protein targets compiled from therespective test sets.
Target Name NTest RP RS
Model I
Trypsin 91 0.737 0.687
Carbonic anhydrase 39 0.225 0.1
HIV-1 protease 71 0.02 0.022
Oligo-peptide binding protein 20 0.01 -0.171
Retinoic acid receptor (α, β and γ) 6 0.470 0.657
Retinoic acid receptor (α and γ) 5 0.753 1.0
Tyrosine phosphatase 22 0.747 0.767
Urokinase-type plasminogen activator 23 0.714 0.738
Model II
Trypsin 74 0.746 0.636
Carbonic anhydrase 36 0.407 0.429
HIV-1 protease 60 0.298 0.132
Oligo-peptide binding protein 15 0.747 0.725
Retinoic acid receptor (α, β and γ) 7 0.874 0.929
Retinoic acid receptor (α and γ) 6 0.912 0.943
Tyrosine phosphatase 20 0.662 0.546
Urokinase-type plasminogen activator 20 0.844 0.767
J Chem Inf Model. Author manuscript; available in PMC 2011 February 22.

NIH
-PA Author Manuscript
NIH
-PA Author Manuscript
NIH
-PA Author Manuscript
Das et al. Page 27
Tabl
e 7
Cha
nge
in c
orre
latio
n co
effic
ient
s with
cha
nge
in c
hi-s
quar
ed c
utof
fs
Nam
e (R
egre
ssio
n m
odel
s)C
hi-s
quar
ed c
utof
fN
Trai
nN
Test
RP
RS
Res
idua
l <1.
5 pK
d/pK
i (%
of N
Test)
Mod
el I
6000
278
223
0.68
90.
677
71.7
Mod
el II
6000
278
266
0.76
20.
727
75.9
Mod
el II
I60
0027
826
60.
699
0.66
871
.4
Mod
el IV
6000
278
270
0.68
10.
678
74.4
Mod
el I
3000
278
330.
792
0.85
378
.8
Mod
el II
3000
278
570.
859
0.86
282
.5
Mod
el II
I30
0027
851
0.71
50.
630
76.5
Mod
el IV
3000
278
410.
778
0.69
785
.3
J Chem Inf Model. Author manuscript; available in PMC 2011 February 22.

NIH
-PA Author Manuscript
NIH
-PA Author Manuscript
NIH
-PA Author Manuscript
Das et al. Page 28
Table 8
Recovery rates in classification with PESD-SVM classification models
Name (Classification models) Recovery rate
Weak (pKi/pKd < 5.0) Medium (5 ≤ pKi/pKd ≤8)
Strong (pKi/pKd > 8)
Model I 139/224=62.1% 319/527=60.5% 78/226%=34.5%
Model II 75/250=30.0% 407/509=80.0% 92/218=42.2%
Model III 131/252=52.0% 374/519=72.1% 98/206=47.6%
Model IV 128/248=51.6% 421/512=82.2% 41/217=18.9%
J Chem Inf Model. Author manuscript; available in PMC 2011 February 22.

NIH
-PA Author Manuscript
NIH
-PA Author Manuscript
NIH
-PA Author Manuscript
Das et al. Page 29
Table 9
True positive percentages in classification with PESD-SVM classification models
Name (Classification models) Percent True Positive
Weak (pKi/pKd < 5.0) Medium (5 ≤ pKi/pKd ≤8)
Strong (pKi/pKd > 8)
Model I 139/264=52.7% 319/518=61.2% 78/195=40.0%
Model II 75/112=67.0% 407/693=58.7% 92/172=53.5%
Model III 131/213=61.5% 374/578=64.7% 98/186=52.7%
Model IV 128/221=57.9% 421/704=59.8% 41/52=78.8%
J Chem Inf Model. Author manuscript; available in PMC 2011 February 22.
Related Documents