Baird 2010 Industrials Conference 2010 Industrials Conference November 9 th , 2010 © 2010 Graphic Packaging International, Inc. This information is confidential and proprietary to Graphic Packaging International, Inc. Any reproduction or distribution to any third party is prohibited.

Bill Stankiewicz Copy Graphic Packaging 2011 External
May 20, 2015
Shippers Warehouse, Inc. is a provider of supply chain services (3rd party logistics or 3PL). The Company operates over 4.5 million square feet in 8 facilities in the Dallas/Ft. Worth area and 500,000 square feet in Atlanta, Georgia.
The Georgia facility packaging operations ships out over 3 billion bags per year. Shippers Warehouse is one of the largest co-packers in the Southeast. Shippers operate 9 packaging lines with a ready room that is a showcase for reducing any type of foreign matter. The facility handles a variety of food products, is a leader in recycling, & distribution of products.
Shippers Warehouse, Inc. also has the distinction of having all of its locations ISO 9001:2008 certified. (ISO 9001:2008 certified by Management Certification of North America, an ANAB-accredited certification body.)
Regards,
Bill Stankiewicz
Vice President & General Manager
Shippers Warehouse
Office: 678.364.3475
[email protected]
www.shipperswarehouse.com
Welcome message from author
This document is posted to help you gain knowledge. Please leave a comment to let me know what you think about it! Share it to your friends and learn new things together.
Transcript

Baird2010 Industrials Conference2010 Industrials Conference
November 9th, 2010
© 2010 Graphic Packaging International, Inc.
This information is confidential and proprietary to Graphic Packaging International, Inc. Any reproduction or distribution to any third party is prohibited.

Forward Looking StatementsForward Looking Statements
Any statements of the Company’s expectations in this presentation constitute "forward-looking statements" as defined in the Private
Securities Litigation Reform Act of 1995. Such statements, including but not limited to, market trends and debt reduction, are based on
tl il bl i f ti d bj t t i i k d t i ti th t ld t l lt t diff t i ll fcurrently available information and are subject to various risks and uncertainties that could cause actual results to differ materially from
the Company's present expectations. These risks and uncertainties include, but are not limited to, the Company’s substantial amount
of debt, inflation of and volatility in raw material and energy costs, volatility in the credit and securities markets, cutbacks in consumer
spending that could affect demand for the Company’s products or actions taken by our customers in response to the difficult economic
environment, continuing pressure for lower cost products, the Company’s ability to implement its business strategies, including
productivity initiatives and cost reduction plans, currency movements and other risks of conducting business internationally, and the
impact of regulatory and litigation matters, including the continued availability of the Company’s net operating loss offset to taxable
income, and those that impact the Company’s ability to protect and use its intellectual property. Undue reliance should not be placed
on such forward-looking statements, as such statements speak only as of the date on which they are made and the Company
undertakes no obligation to update such statements. Additional information regarding these and other risks is contained in the
Company's periodic filings with the SEC.
© 2010 Graphic Packaging International, Inc. 2
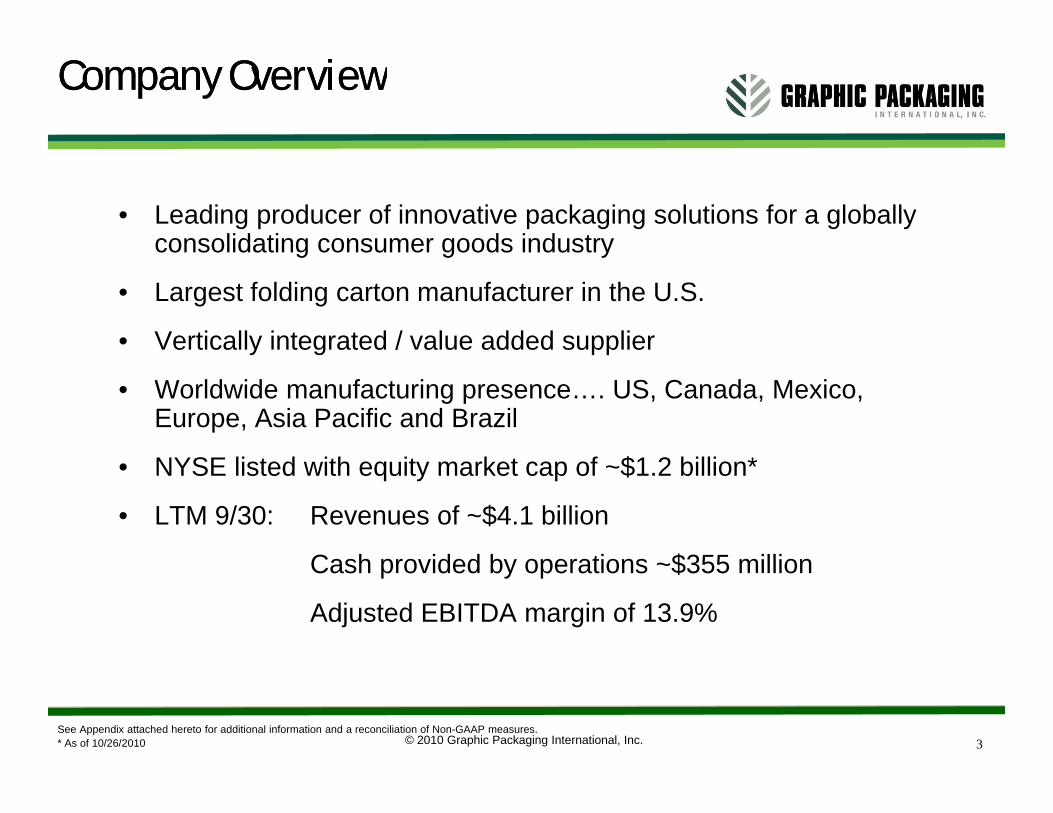
Company OverviewCompany Overview
• Leading producer of innovative packaging solutions for a globally consolidating consumer goods industryg g y
• Largest folding carton manufacturer in the U.S.
• Vertically integrated / value added supplier
• Worldwide manufacturing presence…. US, Canada, Mexico, Europe, Asia Pacific and Brazil
NYSE li t d ith it k t f $1 2 billi *• NYSE listed with equity market cap of ~$1.2 billion*
• LTM 9/30: Revenues of ~$4.1 billion
Cash provided by operations $355 millionCash provided by operations ~$355 million
Adjusted EBITDA margin of 13.9%
© 2010 Graphic Packaging International, Inc.* As of 10/26/2010See Appendix attached hereto for additional information and a reconciliation of Non-GAAP measures.
3

Two Primary Business AreasTwo Primary Business Areas
Paperboard Packaging
• 84% of total salesC t ti i f d & b d
Beverage Carriers
33%Food Services
Health & Beauty
2%
Soap/Laundry2%
Other8%
Industry Paperboard Packaging End Use
• Concentration in food & beverage end markets
• Vertically integrated network of 38 converting facilities and 7 mills (over 80% integrated)
Food Services5%
facilities and 7 mills (over 80% integrated)
M lti W ll B & S i lt P k i
Dry Foods29%
Frozen Foods21%
Industry Multi-Wall & Specialty End UseMulti‐Wall Bag & Specialty Packaging
• 16% of total sales• #1 US market share position of ~34%
Agriculture and Foods
41%Chemicals
10%
Minerals10%
Other11%
• Concentration in agriculture, pet and building supply end markets
• 18 manufacturing facilities (17% integrated)Pet & Pet
Care11%
© 2010 Graphic Packaging International, Inc.–Source: Company filings, presentations and Mgmt estimate.
Building Materials
17%
–Source: RISI, PSSMA, and Mgmt estimate. 4

Key Products and CustomersKey Products and Customers
FoodFoodHousehold and Household and Personal CarePersonal Care
BeverageBeverageMultiwallMultiwall BeverageBeverageMultiwallMultiwall
LabelsLabels Specialty PlasticsSpecialty Plastics
MicrowaveMicrowave
MachineryMachinery
© 2010 Graphic Packaging International, Inc.
ac e yac e y
5

Core Strategic InitiativesCore Strategic Initiatives
Optimize Our Core Business
Optimize Our Core Business
BuildThe Right Execution Culture
GrowBy Leveraging Our Strengths
11 22 33
• Industry Consolidation
• Focus on Food & Beverage
• Productivity/Execution
• Positive Momentum
• Macro Economic Factors
• Recycling an Important ConcernBeverage
• Low Cost Supply Chain• EBITDA & Margins
• Cash Flow
• Net Debt Reduction
Concern
• New Product Innovations
• Geographic ExpansionNet Debt Reduction
• Improve Leverage Ratios
Utili All A t t E d O S f C titi Ad tUtili All A t t E d O S f C titi Ad t
© 2010 Graphic Packaging International, Inc.
Utilize All Assets to Expand Our Sources of Competitive AdvantageUtilize All Assets to Expand Our Sources of Competitive Advantage
6

Industry ConsolidationIndustry Consolidation
Top 5 Market Share Increased to 68% in 2008 from 44% in 2001
North American Folding Carton Market
MeadWestvaco Rock-TennMeadWestvaco
11% Rock-TennOther51%
Riverwood5%
MeadWestvaco9% IP
7%7% Other
32%IP8%
Rock Tenn12%
Graphic13%
Cascades5%Graphic
20082001
Smurfit Stone8%
pPackaging
32%
© 2010 Graphic Packaging International, Inc.Source: Goldman Sachs, Paperboard Packaging Council, and management estimates7

Focus on Historically Stable Food & Focus on Historically Stable Food & Beverage MarketsBeverage Markets
- 0.6%
+ 0.6%
SportingGeneral
Merchandise
Food Services &
Drinking
Grocery & Liquor- 0.3%
+ 0.3%2009 vs. 2008 Year-Over-Year Change in Spending + 0.6%
- 8.0%
- 3.4%
Total Retail
Clothing
Sporting Goods,
Hobbies,Books &Music
Merchandise
- 6.2%
- 12.1%
%Total Retail & Food.Services
Auto
Furnishings
Electronics,Appliances- 11.1%
• Buying less
• Buying more basic/necessity items
Consumer Trends
• Dry dinner mixes up 6%
• Frozen pizza up 3%
Shift to “Take-Home” Products
• Buying more basic/necessity items
• Trading down to private label
• Making fewer shopping trips
Frozen pizza up 3%
• Refrigerated products up 4%
• Domestic beer up 1%
© 2010 Graphic Packaging International, Inc. 8Source: A.C. Nielsen and US Bureau of Labor Statistics

Supports Building a Low Supports Building a Low Cost Supply Cost Supply Chain for National AccountsChain for National Accounts
Consumer Products: CerealLow Cost Mills
Industry Average
h C
ost
Cas
h
Beverage: BeerBeverage: Beer
Combined operations yields board from the lowest-cost mills in the U.S. to low
t ti l t
© 2010 Graphic Packaging International, Inc.
cost converting plants
Source: Bain Consulting 9

And a Responsive Supply Chain for And a Responsive Supply Chain for Regional Food and Consumer AccountsRegional Food and Consumer Accounts
Midwest Region/Private Label• Meat• Facial tissue• Frozen Foods• Dairy/Ice Cream
East Region/Private Label• Confectionary• Bakery• Meat• QSR/Food Service
West Coast Region/Private Label• Facial tissue
Raisins• Raisins• Frozen Foods• Soap & Detergent
GPI Facilities
Regional
Centrally Managed Support Functions• Overall demand/capacity balance• Raw Material Planning & Procurement
Locally Managed Support Functions• Customer Service• Sales
© 2010 Graphic Packaging International, Inc.
Regional
Paperboard Mill
g• Graphics/Prepress Support
Sales• Manufacturing• Field Technical Service
10

Core Strategic InitiativesCore Strategic Initiatives
Optimize Our Core Business
BuildThe Right Execution Culture
GrowBy Leveraging Our Strengths
GrowBy Leveraging Our Strengths
11 22 33
• Industry Consolidation
• Focus on Food & Beverage
• Productivity/Execution
• Positive Momentum
• Macro Economic Factors
• Recycling an Important ConcernBeverage
• Low Cost Supply Chain• EBITDA & Margins
• Cash Flow
• Net Debt Reduction
Concern
• New Product Innovations
• Geographic Expansion Net Debt Reduction
• Improve Leverage Ratios
T ti th Ri ht T d d M k t t E h M k t ShT ti th Ri ht T d d M k t t E h M k t Sh
© 2010 Graphic Packaging International, Inc.
Targeting the Right Trends and Markets to Enhance Market ShareTargeting the Right Trends and Markets to Enhance Market Share
11

Macro Economic Factors have Impacted Macro Economic Factors have Impacted Consumer Purchasing Trends Consumer Purchasing Trends ……
High UnemploymentDeclining GDP per Household
Blue Collar: 14%
White Collar: 4.5%
“I am looking closely at every spending category to see where I can save”
84%Customers are
spending cautiously d e fo ed o
“I am eating at home more often”65%and are focused on
savings
“I expect to continue spending cautiously 93%
Customers are gravitating toward 84% “I am more open to trying private store brands
p od cts that I as t o ea s ago”
even when the economy improves”93%
© 2010 Graphic Packaging International, Inc.
private label products in order to save
products that I was two years ago”
12

Recycling is Also an Important Concern Recycling is Also an Important Concern for Packaged Beverages Companies…for Packaged Beverages Companies…
…Followed by the Use of Renewable Resources! Source: BeveragePulse.com, July 2010
© 2010 Graphic Packaging International, Inc.
g , y
13

New Product Technology Focused on New Product Technology Focused on These Consumer These Consumer TrendsTrends
Consumer Convenience: Active consumer, grab and goMicrowave +10%
• Fills fast convenient meal option needs of consumers• Fills fast convenient meal option needs of consumers• Major solutions launched at Nestle, Heinz and Kraft
Multipack experience double digit growth• US energy drink multipack share has reached 70%• Successful international launches in Poland, Mexico, China and Brazil
Value and Cost Reduction: Cost reduction; substitution
Z fl te replacing corr gated and plastics + 20% • Z-flute replacing corrugated and plastics + 20% • Significant growth in Club Store channel
B d B ildi Diff ti ti i d d Brand Building: Differentiating in a crowded space
Labels• Patented HTL technology
© 2010 Graphic Packaging International, Inc. 14
Sustainability…newest key trend

International Presence is GrowingInternational Presence is Growing
Strategic Presence In All Key Geographies
MexicoChi
USA / Canada• Opportunity to leverage Altivity
carton plant with local accountsChina• Established office in 2006• Structured a joint venture in 2008
• Dominant market share• Low cost producer
Europe• Refocused strategy to focus on
higher margin applicationsJapan
BrazilA t li
p• 90% share of beer market
• Beverage and folding carton applications
Australia• Continued expansion with
beverage folding carton applications
© 2010 Graphic Packaging International, Inc. 15

With New Products Around the World…With New Products Around the World…
Asia Pacific:Asia Pacific:Glass remains important but has markedly weakened by PET and Beverage Cans; Liquid Carton posted significant unit gains
Western Europe:
posted significant unit gains
Western Europe:Beverage Can gains at the expense of Glass; Environment concerns are favorable to paperboard vs. plastic
16
16

Core Strategic InitiativesCore Strategic Initiatives
Optimize Our Core Business
Build The Right Execution Culture
Build The Right Execution Culture
GrowBy Leveraging Our Strengths
11 22 33
• Industry Consolidation
• Focus on Food & Beverage
• Productivity/Execution
• Positive Momentum
• Macro economic Factors
• Recycling an Important ConcernBeverage
• Low Cost Supply Chain• EBITDA & Margins
• Cash Flow
• Net Debt Reduction
Concern
• New Product Innovations
• Geographic Expansion Net Debt Reduction
• Improve Leverage Ratios
C lt D i O ti d C h t R d C t f B iC lt D i O ti d C h t R d C t f B i
© 2010 Graphic Packaging International, Inc.
Culture Drives Operations and Cash to Reduce Cost of BusinessCulture Drives Operations and Cash to Reduce Cost of Business
17

Driving Productivity Through Better “Execution”Driving Productivity Through Better “Execution”
C ti I t C t R d ti
GPK Built Strong Continuous Improvement Culture via Six Sigma……Lean Sigma and Policy Deployment Enhance Continuous Improvement Culture
$70
$64
$60‐$80
Continuous Improvement Cost Reductions
$47 $46
$64
$ Millions
2006 2007 2008 2009 2010 Target
“Why Lean”? - Improves Working Capital - Tools to Optimize Value Streams
© 2010 Graphic Packaging International, Inc. 18
Why Lean ? - Improves Working Capital - Tools to Optimize Value Streams- Increase Shop Floor Involvement - Increases “Horizontal” Culture

Positive Momentum in 2010 ResultsPositive Momentum in 2010 Results
$1,125
$1,200
Q3 Net Sales (YoY)
$3,300
$3,500
YTD Q3 Net Sales (YoY)
$975
$1,050
$2,900
$3,100$1,054.2$3,117.2
$1,042.8
$3,083.4$13.6
($11.7)
$0.2($13.5)
($19.1) ($5.9) ($4.7) ($4.1)
$900Q3 09 Price Volume Mix Other Q3 10 $2,500
$2,700
Q3 YTD 09 Price Volume Mix Other Q3 YTD 10
Q3 Adjusted EBITDA (YoY) YTD Q3 Adjusted EBITDA (YoY)
$160
$180
$400
$430
$460
$490
($19.1) ($1.7)
($4.5)($3.6)
$155.1$151.3
$13.6
$36.4 $1.8$432.7
$441.2$109.3
$120
$140
$310
$340
$370
$400 ( )
($75.5)
($52.0)
© 2010 Graphic Packaging International, Inc.
$100Q3 2009 Price Volume/Mix Inflation Perform Other Q3 2010
$280YTD 2009 Price Volume/Mix Inflation Perform Other YTD 2010
19
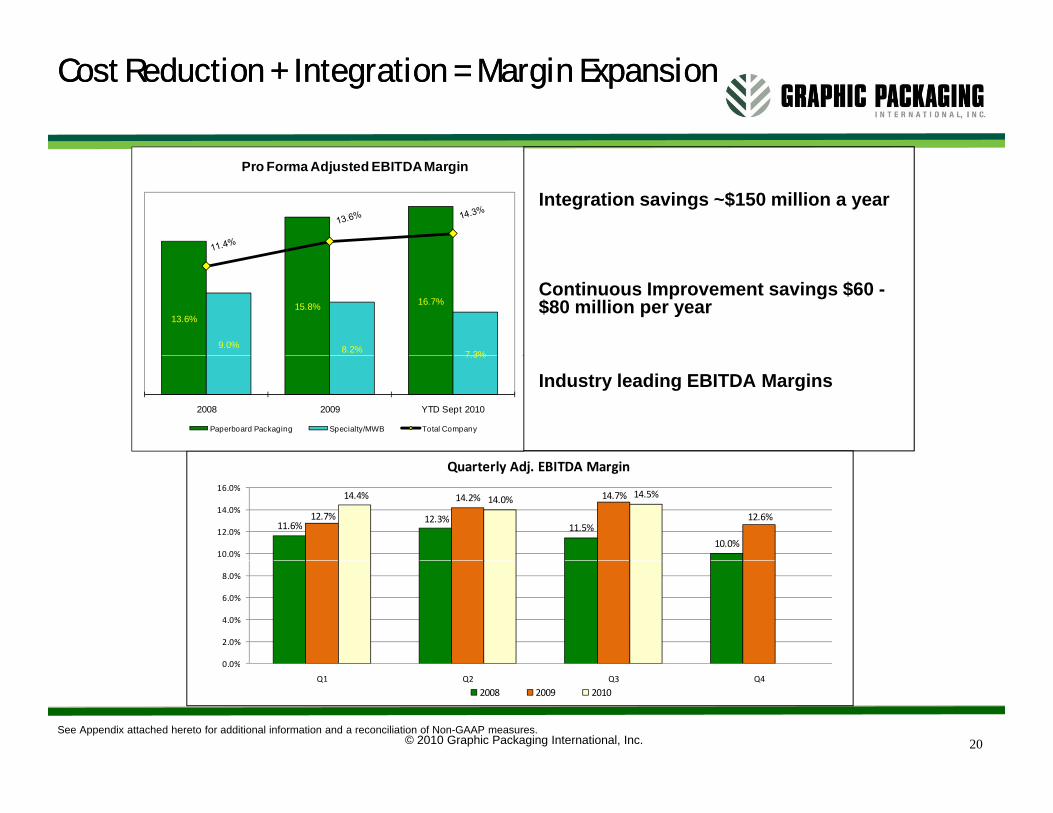
Cost Reduction + Integration = Margin ExpansionCost Reduction + Integration = Margin Expansion
Integration savings ~$150 million a year
Pro Forma Adjusted EBITDA Margin
Continuous Improvement savings $60 -$80 million per year
13.6%15.8% 16.7%
9.0% 8.2% 7 3%
Industry leading EBITDA Margins7.3%
2008 2009 YTD Sept 2010
Paperboard Packaging Specialty/MWB Total Company
11.6%12.3%
11.5%
10.0%
12.7%
14.2% 14.7%
12.6%
14.4% 14.0% 14.5%
10.0%
12.0%
14.0%
16.0%
Quarterly Adj. EBITDA Margin
0 0%
2.0%
4.0%
6.0%
8.0%
© 2010 Graphic Packaging International, Inc. 20See Appendix attached hereto for additional information and a reconciliation of Non-GAAP measures.
0.0%
Q1 Q2 Q3 Q4
2008 2009 2010

Improving Financial PerformanceImproving Financial Performance($ millions)($ millions)
$4,500
$5,000
Historical Pro Forma Revenue
$4,323$4 096
$4,4152.1% -7.2%
3 4% $4 062
$3,502 $3,566 $3,424 $3,393
$821 $849$672 $669
$2 500
$3,000
$3,500
$4,000$4,0963.4% -20.8%
1.8% -4.0%
$4,062
$2,5002007 2008 2009 Sept 10 LTM
Paperboard Multi-Wall Bag & Specialty Packaging
$565$580Historical Pro Forma Adj. EBITDA
$556$565
$535
$550
$565
$580
10.8%
$505 $502
$475
$490
$505
$520 -0.6%
© 2010 Graphic Packaging International, Inc.See Appendix attached hereto for additional information and a reconciliation of Non-GAAP measures.
21
$4752007 2008 2009 Sept 10 LTM

Strong Cash Flow Generation Strong Cash Flow Generation ($millions)($millions)[Adjusted for Capital Structure][Adjusted for Capital Structure]
12.6%14.0% $450
Cash Flow as a % of Sales(CF = Pro Forma Adj EBITDA ‐ Cap Ex ‐ ΔW/C ‐ Cash Tax)
Net Debt Reduction
11.7%
8 0%
10.0%
12.0%
$135 $300
$375 $363
5.8%
4.0%
6.0%
8.0%
$228 ≈$200
$150
$225
0.0%
2.0%
2008 2009 Sept 2010 LTM
$119
≈$200
$0
$75
2008 2009 2010 Target1
Operations Alt. Fuel Tax Credit
• Working capital velocity• Disciplined Capex decision making
© 2010 Graphic Packaging International, Inc.Source: 2008 management estimate for 1/1/2008 – 3/10/2008; and GPK audited financial statements
22
• EBITDA growth
1.) From Altivity Transaction date March 11, 2008 forward

Low Cost / Flexible Debt ProfileLow Cost / Flexible Debt Profile
Debt Profile as of 09/30/10
$1,500
$1,750
$2,000 Long-term debt (in millions): PF Q3'10**
9.5% matures in 2013 73$ Revolver matures in 2013 -
Debt Maturities
$500
$750
$1,000
$1,250 Revolver matures in 2013 Term B matures in 2014 891 Term C matures in 2014 1,052 9.5% matures in 2017 425 7.875% matures in 2018 250 Other 4
$0
$250
2013 2014 2015 2016 2017 2018+
Revolver 9.5% in 2013 Term B Term C 9.5% in 2017 7.875% in 2018
Other 4 Total 2,695$ Total cash and short term investments: 136
Net Debt 2,559$
• Reduced debt by $573 million since Altivity transaction in March 2008
• Low cost debt structure
Liquidity Position as of 9/30/10Amount
R l Li * 400 0$ • Low cost debt structure
• S&P Credit Rating upgraded to BB- from B+ in July 2010
• 9.5% Notes due 2013 recently addressed
Revolver Line* 400.0$ Borrowings* + LOCs (32.0) Cash 166.3 Total Liquidity 534.3$
* Excludes international credit facilities
© 2010 Graphic Packaging International, Inc.
9.5% Notes due 2013 recently addressed
• Substantial covenant cushion in bank debt
23** Pro forma Q3’10 assumes ~$30M related to call of 9.5% Notes due 2013 occurred by 9/30/2010
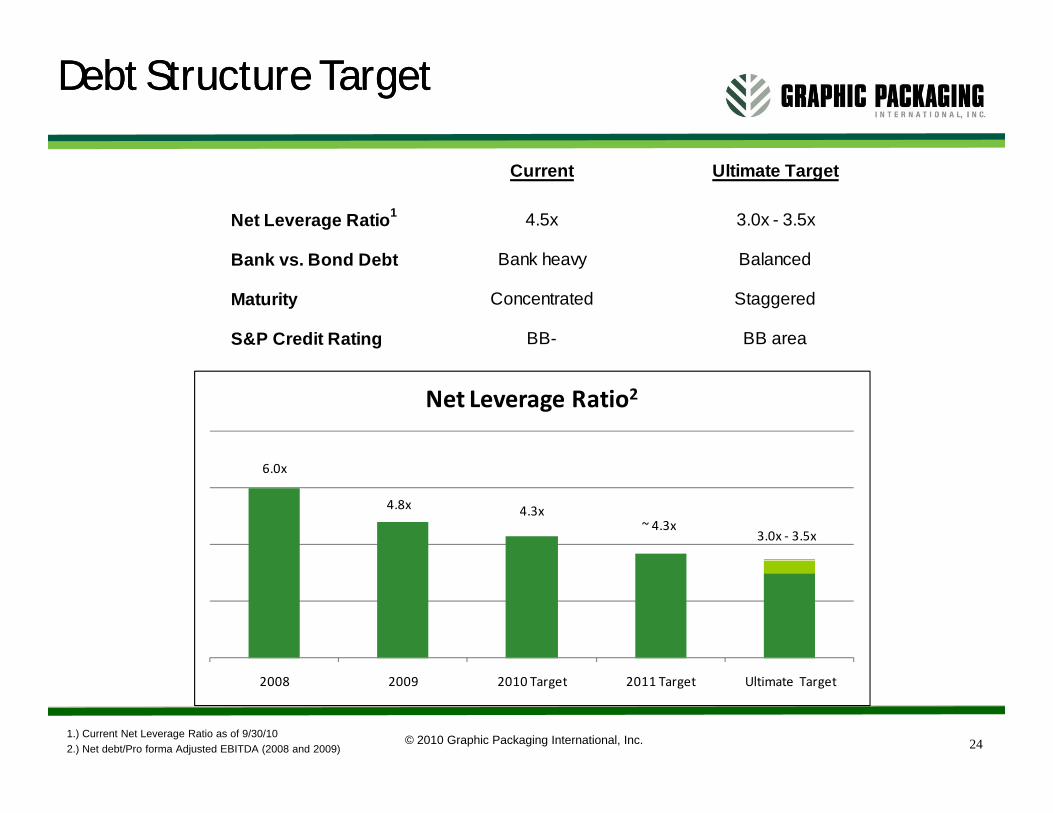
Debt Structure TargetDebt Structure Target
Current Ultimate Target
Net Leverage Ratio1 4.5x 3.0x - 3.5x
B k h B l dBank vs. Bond Debt Bank heavy Balanced
Maturity Concentrated Staggered
S&P Credit Rating BB- BB area
Net Leverage Ratio2
6.0x
4.8x 4.3x~ 4.3x
3.0x ‐ 3.5x
© 2010 Graphic Packaging International, Inc.1.) Current Net Leverage Ratio as of 9/30/102.) Net debt/Pro forma Adjusted EBITDA (2008 and 2009) 24
2008 2009 2010 Target 2011 Target Ultimate Target
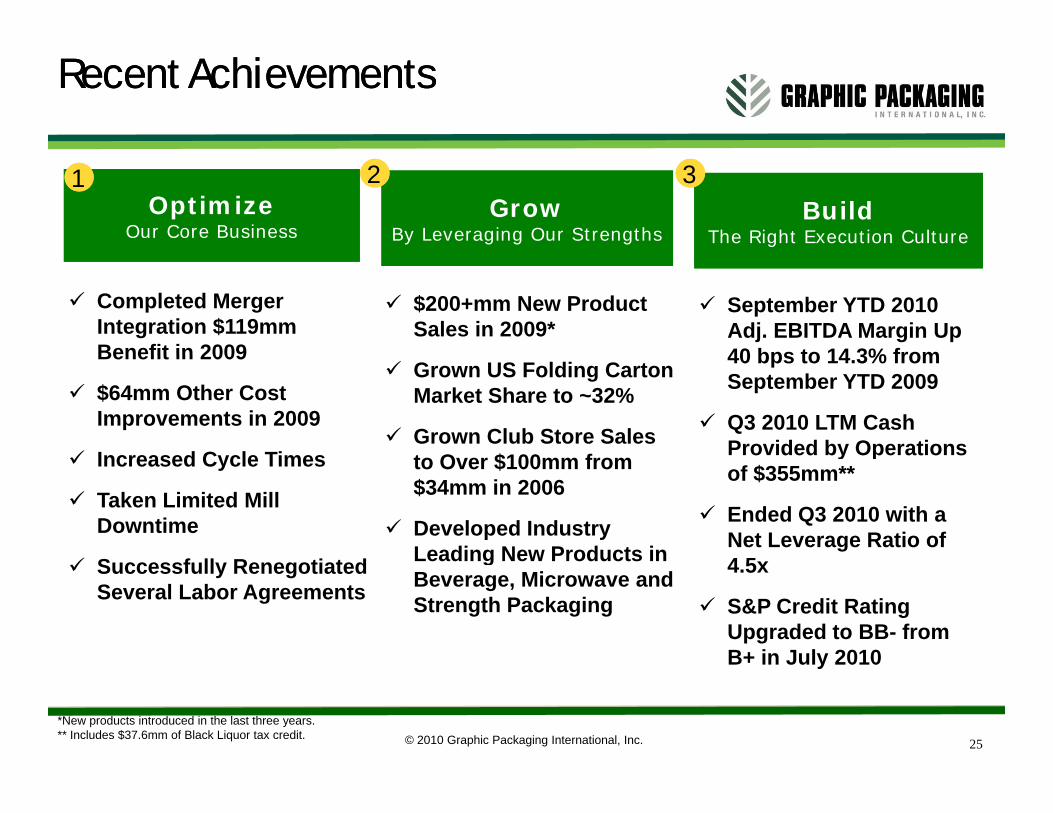
Recent AchievementsRecent Achievements
Optimize Our Core Business
Optimize Our Core Business
BuildThe Right Execution Culture
BuildThe Right Execution Culture
GrowBy Leveraging Our Strengths
GrowBy Leveraging Our Strengths
11 22 33
Completed Merger Integration $119mm Benefit in 2009
September YTD 2010 Adj. EBITDA Margin Up 40 bps to 14 3% from
$200+mm New Product Sales in 2009*
Benefit in 2009
$64mm Other Cost Improvements in 2009
Increased Cycle Times
40 bps to 14.3% from September YTD 2009
Q3 2010 LTM Cash Provided by Operations
Grown US Folding Carton Market Share to ~32%
Grown Club Store Sales to O er $100mm fromIncreased Cycle Times
Taken Limited Mill Downtime
S f ll R ti t d
y pof $355mm**
Ended Q3 2010 with a Net Leverage Ratio of 4 5
to Over $100mm from $34mm in 2006
Developed Industry Leading New Products inSuccessfully Renegotiated
Several Labor Agreements4.5x
S&P Credit Rating Upgraded to BB- from B+ in July 2010
Leading New Products in Beverage, Microwave and Strength Packaging
© 2010 Graphic Packaging International, Inc.
B in July 2010
25
*New products introduced in the last three years.** Includes $37.6mm of Black Liquor tax credit.

Strong Investment ThesisStrong Investment Thesis
• Leading market share in further consolidated market
• Strong and improving EBITDA margins
• Rapid deleveraging through substantial cash generation
• Positioned for growth• Positioned for growth– Expanded product portfolio– Global presence– Market exposure will allow Graphic to lead upon economic
recovery
© 2010 Graphic Packaging International, Inc. 26

Appendix Appendix Appendix Appendix
© 2010 Graphic Packaging International, Inc. 27

ReconciliationReconciliation
Reconciliation of Non-GAAP Financial Measures
The tables below set forth the calculation of the Company's earnings before interest expense, income tax expense, equity in the net earnings of the Company's affiliates, depreciation and amortization ("EBITDA") and Adjusted EBITDA. Adjusted EBITDA excludes charges associated with the Company's combination with Altivity Packaging, LLC and other Restructuring and Other Special Charges. The Company's management believes that the presentation of EBITDA and Adjusted EBITDA provides useful information to investors becauseCompany s management believes that the presentation of EBITDA and Adjusted EBITDA provides useful information to investors because these measures are regularly used by management in assessing the Company's performance. EBITDA and Adjusted EBITDA are financial measures not calculated in accordance with generally accepted accounting principles in the United States ("GAAP"), and are not measures of net income, operating income, operating performance or liquidity presented in accordance with GAAP.
EBITDA and Adjusted EBITDA should be considered in addition to results prepared in accordance with GAAP, but should not be considered substitutes for or superior to GAAP results. In addition, our EBITDA, and Adjusted EBITDA may not be comparable to Adj d EBITDA i il l i l d ili d b h i i h h i l l h
In millions 2010 2009 2010 2009
Nine Months EndedSeptember 30,
Twelve Months EndedSeptember 30,
Adjusted EBITDA or similarly titled measures utilized by other companies since such other companies may not calculate such measures in the same manner as we do.
In millions 2010 2009 2010 2009
Net Sales 3,083.4$ 3,117.2$ 4,062.0$ 4,164.9$
Net (Loss) Income (8.9)$ 24.6$ 22.9$ (33.1)$ Add (Subtract):
Income Tax Expense 29.8 29.7 24.2 39.1 Equity in Net Earnings of Affiliates (1 4) (0 8) (1 9) (0 7)Equity in Net Earnings of Affiliates (1.4) (0.8) (1.9) (0.7) Interest Expense, Net 134.0 158.0 172.4 216.2 Depreciation and Amortization 225.2 244.0 308.0 319.7
EBITDA 378.7 455.5 525.6 541.2 Charges Associated with Combination with Altivity 55.1 61.6 65.2 64.9 Asset Impairment and Shutdown Charges - 2.3 10.7 17.8 Loss on Modification or Extinguishment of Debt 7 4 7 1 7 4 7 1
© 2010 Graphic Packaging International, Inc. 28
Loss on Modification or Extinguishment of Debt 7.4 7.1 7.4 7.1 Alternative Fuel Tax Credits Net of Expenses - (93.8) (44.0) (93.8) Adjusted EBITDA 441.2$ 432.7$ 564.9$ 537.2$

ReconciliationReconciliation
Twelve Months EndedIn millions September 30, 2010 2010 2009 2009 2008 2007Net Sales 4,062.0$ 3,083.4$ 3,117.2$ 4,095.8$ 4,079.4$ 2,421.2$ Altivity Net Sales - - - - 335.6 1,902.1 Consolidated Pro Forma Net Sales 4,062.0$ 3,083.4$ 3,117.2$ 4,095.8$ 4,415.0$ 4,323.3$
Year EndedDecember 31,
Nine Months EndedSeptember 30,
Pro Forma Net Income (Loss) 22.9$ (8.9)$ 24.6$ 56.4$ (124.2)$ (89.6) Add (Subtract):
Income Tax Expense 24.2 29.8 29.7 24.1 35.1 26.9 Equity in Net Earnings of Affiliates (1.9) (1.4) (0.8) (1.3) (1.1) (0.9) Interest Expense, Net 172.4 134.0 158.0 196.4 246.9 244.9 Depreciation and Amortization 308.0 225.2 244.0 326.8 287.7 295.6
P F EBITDA 2 6 378 7 4 602 4 444 4 476 9Pro Forma EBITDA 525.6 378.7 455.5 602.4 444.4 476.9 Charges Associated with Combination with Altivity 65.2 55.1 61.6 71.7 17.7 - Asset Impairment and Shutdown Charges 10.7 - 2.3 13.0 15.5 18.6 Inventory Step Up Related to Altivity - - - - 24.4 - Loss on Modification or Extinguishment of Debt 7.4 7.4 7.1 7.1 - 9.5 Alternative Fuel Tax Credits Net of Expenses (44.0) - (93.8) (137.8) - - Consolidated Pro Forma Adjusted EBITDA 564.9$ 441.2$ 432.7$ 556.4$ 502.0$ 505.0
Pro Forma Net Sales by Segments:Paperboard Packaging 3,393.3$ 2,575.7$ 2,605.9$ 3,423.5$ 3,565.7$ Multi-wall Bag and Specialty Packaging 668.7 507.7 511.3 672.3 849.3 Total Pro Forma Net Sales 4,062.0$ 3,083.4$ 3,117.2$ 4,095.8$ 4,415.0$
Pro Forma Adjusted EBITDA by Segments:Pro Forma Adjusted EBITDA by Segments:Paperboard Packaging 541.0$ 430.8$ 432.3$ 542.5$ 484.0$ Multi-wall Bag and Specialty Packaging 52.6 36.9 39.2 54.9 76.1 Corporate (28.7) (26.5) (38.8) (41.0) (58.1) Total Pro Forma Adjusted EBITDA 564.9$ 441.2$ 432.7$ 556.4$ 502.0$
Pro Forma Adjusted EBITDA Margin by Segment:Paperboard Packaging 15 9% 16 7% 16 6% 15 8% 13 6%
© 2010 Graphic Packaging International, Inc. 29
Paperboard Packaging 15.9% 16.7% 16.6% 15.8% 13.6%Multi-wall Bag and Specialty Packaging 7.9% 7.3% 7.7% 8.2% 9.0%Total Pro Forma Adjusted EBITDA Margin 13.9% 14.3% 13.9% 13.6% 11.4%

ReconciliationReconciliation
The table below sets forth the calculation of the Company's Total Net Debt and Net Leverage Ratio. The Company's management believes that the presentation of Total Net Debt and Net Debt Leverage provides useful information to investors because these measures are regularlythat the presentation of Total Net Debt and Net Debt Leverage provides useful information to investors because these measures are regularly used by management in assessing the Company's performance. Total Net Debt is a financial measure not calculated in accordance with generally accepted accounting principles in the United States ("GAAP"). Total Net Debt and Net Leverage Ratio should be considered in addition to results prepared in accordance with GAAP, but should not be considered superior to GAAP results. In addition, our Total Net Debt and Net Leverage Ratio may not be comparable to similarly titled measures utilized by other companies since other companies may not calculate such a measure in the same manner as we do.
September 30, December 31, December 31, March 31,Calculation of Net Debt: 2010 2009 2008 2008Short-Term Debt and Current Portion of Long-Term Debt 28.8$ 17.6$ 18.6$ 20.3$ Long-Term Debt 2 696 9 2 782 6 3 165 2 3 134 4Long-Term Debt 2,696.9 2,782.6 3,165.2 3,134.4 Less: Cash and Cash Equivalents (166.3) (149.8) (170.1) (21.9) Total Net Debt 2,559.4$ 2,650.4$ 3,013.7$ 3,132.8$
LTM Proforma Adjusted EBITDA 564.9$ 556.4 502.0
Net Leverage Ratio 4.5 4.8 6.0
© 2010 Graphic Packaging International, Inc. 30
Related Documents