Boston Predictive Analytics Big Data Workshop Microsoft New England Research & Development Center, Cambridge, MA Saturday, March 10, 2012 by Jeffrey Breen President and Co-Founder Atmosphere Research Group email: [email protected] Twitter: @JeffreyBreen Big Data Step-by-Step http://atms.gr/bigdata0310 Saturday, March 10, 2012

Welcome message from author
This document is posted to help you gain knowledge. Please leave a comment to let me know what you think about it! Share it to your friends and learn new things together.
Transcript

Boston Predictive AnalyticsBig Data Workshop
Microsoft New England Research &Development Center, Cambridge, MA
Saturday, March 10, 2012
by Jeffrey Breen
President and Co-FounderAtmosphere Research Groupemail: [email protected]
Twitter: @JeffreyBreen
Big Data Step-by-Step
http://atms.gr/bigdata0310
Saturday, March 10, 2012

Using R & Hadoopwith an emphasis on RHadoop’s rmr package
https://github.com/jeffreybreen/tutorial-201203-big-data
Code & more on github:
Saturday, March 10, 2012

Introduction• Hadoop streaming enables the creation of mappers,
reducers, combiners, etc. in languages other than Java
• Any language which can handle standard, text-based input & output will do
• Increasingly viewed as a lingua franca of statistics and analytics, R is a natural match for Big Data-driven analytics
• As a result, a number of R packages to work with Hadoop
• We’ll take a quick look at some of them and then dive into the details of the RHadoop package
Saturday, March 10, 2012

There’s never just one R package to do anything...
Package Latest Release Comments
hive 2012-03-06misleading name: stands for "Hadoop interactIVE" & has nothing to do with Hadoop hive. On CRAN.
HadoopStreaming 2010-04-22focused on utility functions: I/O parsing, data conversions, etc. Available on CRAN.
RHIPE “a month ago”comprehensive: code & submit jobs, access HDFS, etc.Most links to it are broken. Look on github instead: http://saptarshiguha.github.com/RHIPE/
segue 0.02 in DecemberVery clever way to use Amazon EMR with small or no data. http://code.google.com/p/segue/
RHadoop(rmr, rhdfs, rhbase)
last week for rmrlast month for rhdfslast fall for rhbase
Divided into separate packages by purpose:• rmr - MapReduce• rhdfs - file management w/HDFS• rhbase - database management for HBaseSponsored by Revolution Analytics & on github: https://github.com/RevolutionAnalytics/RHadoop
Saturday, March 10, 2012

Any more? • Yeah, probably. My apologies to the authors of any
relevant packages I may have overlooked.
• R is nothing if it’s not flexible when it comes to consuming data from other systems
• You could just use R to analyze the output of any MapReduce workflows
• R can connect via ODBC and/or JDBC, you could connect to Hive as if it were just another database
• So... how to pick?
Saturday, March 10, 2012

Photo credit: http://en.wikipedia.org/wiki/File:Darts_in_a_dartboard.jpg
Saturday, March 10, 2012

Thanks, Jonathan Seidman
•While Big Data big wig at Orbitz, Jonathan (now at Cloudera) published sample code to perform the same analysis of the airline on-time data set using Hadoop streaming, RHIPE, hive, and RHadoop’s rmr
https://github.com/jseidman/hadoop-R
• To be honest, I only had to glance at each sample to make my decision, but let’s take a look at each package he demonstrates
Saturday, March 10, 2012

About the data & Jonathan’s analysis
• Each month, the US DOT publishes details of the on-time performance (or lack thereof) for every domestic flight in the country
• The ASA’s 2009 Data Expo poster session was based on a cleaned version spanning 1987-2008, and thus was born the famous “airline” data set:
Year,Month,DayofMonth,DayOfWeek,DepTime,CRSDepTime,ArrTime,CRSArrTime,UniqueCarrier,FlightNum,TailNum,ActualElapsedTime,CRSElapsedTime,AirTime,ArrDelay,DepDelay,Origin,Dest,Distance,TaxiIn,TaxiOut,Cancelled,CancellationCode,Diverted,CarrierDelay,WeatherDelay,NASDelay,SecurityDelay,LateAircraftDelay
2004,1,12,1,623,630,901,915,UA,462,N805UA,98,105,80,-14,-7,ORD,CLT,599,7,11,0,,0,0,0,0,0,0
2004,1,13,2,621,630,911,915,UA,462,N851UA,110,105,78,-4,-9,ORD,CLT,599,16,16,0,,0,0,0,0,0,0
2004,1,14,3,633,630,920,915,UA,462,N436UA,107,105,88,5,3,ORD,CLT,599,4,15,0,,0,0,0,0,0,0
2004,1,15,4,627,630,859,915,UA,462,N828UA,92,105,78,-16,-3,ORD,CLT,599,4,10,0,,0,0,0,0,0,0
2004,1,16,5,635,630,918,915,UA,462,N831UA,103,105,87,3,5,ORD,CLT,599,3,13,0,,0,0,0,0,0,0
[...]
http://stat-computing.org/dataexpo/2009/the-data.html
• Jonathan’s analysis determines the mean departure delay (“DepDelay”) for each airline for each month
Saturday, March 10, 2012

“naked” streaminghadoop-R/airline/src/deptdelay_by_month/R/streaming/map.R
#! /usr/bin/env Rscript
# For each record in airline dataset, output a new record consisting of# "CARRIER|YEAR|MONTH \t DEPARTURE_DELAY"
con <- file("stdin", open = "r")while (length(line <- readLines(con, n = 1, warn = FALSE)) > 0) { fields <- unlist(strsplit(line, "\\,")) # Skip header lines and bad records: if (!(identical(fields[[1]], "Year")) & length(fields) == 29) { deptDelay <- fields[[16]] # Skip records where departure dalay is "NA": if (!(identical(deptDelay, "NA"))) { # field[9] is carrier, field[1] is year, field[2] is month: cat(paste(fields[[9]], "|", fields[[1]], "|", fields[[2]], sep=""), "\t", deptDelay, "\n") } }}close(con)
Saturday, March 10, 2012

“naked” streaming 2/2hadoop-R/airline/src/deptdelay_by_month/R/streaming/reduce.R#!/usr/bin/env Rscript
# For each input key, output a record composed of # YEAR \t MONTH \t RECORD_COUNT \t AIRLINE \t AVG_DEPT_DELAY
con <- file("stdin", open = "r")delays <- numeric(0) # vector of departure delayslastKey <- ""while (length(line <- readLines(con, n = 1, warn = FALSE)) > 0) { split <- unlist(strsplit(line, "\t")) key <- split[[1]] deptDelay <- as.numeric(split[[2]])
# Start of a new key, so output results for previous key: if (!(identical(lastKey, "")) & (!(identical(lastKey, key)))) { keySplit <- unlist(strsplit(lastKey, "\\|")) cat(keySplit[[2]], "\t", keySplit[[3]], "\t", length(delays), "\t", keySplit[[1]], "\t", (mean(delays)), "\n") lastKey <- key delays <- c(deptDelay) } else { # Still working on same key so append dept delay value to vector: lastKey <- key delays <- c(delays, deptDelay) }}
# We're done, output last record:keySplit <- unlist(strsplit(lastKey, "\\|"))cat(keySplit[[2]], "\t", keySplit[[3]], "\t", length(delays), "\t", keySplit[[1]], "\t", (mean(delays)), "\n")
Saturday, March 10, 2012

hivehadoop-R/airline/src/deptdelay_by_month/R/hive/hive.R#! /usr/bin/env Rscript
mapper <- function() { # For each record in airline dataset, output a new record consisting of # "CARRIER|YEAR|MONTH \t DEPARTURE_DELAY"
con <- file("stdin", open = "r") while (length(line <- readLines(con, n = 1, warn = FALSE)) > 0) { fields <- unlist(strsplit(line, "\\,")) # Skip header lines and bad records: if (!(identical(fields[[1]], "Year")) & length(fields) == 29) { deptDelay <- fields[[16]] # Skip records where departure dalay is "NA": if (!(identical(deptDelay, "NA"))) { # field[9] is carrier, field[1] is year, field[2] is month: cat(paste(fields[[9]], "|", fields[[1]], "|", fields[[2]], sep=""), "\t", deptDelay, "\n") } } } close(con)}
reducer <- function() { con <- file("stdin", open = "r") delays <- numeric(0) # vector of departure delays lastKey <- "" while (length(line <- readLines(con, n = 1, warn = FALSE)) > 0) { split <- unlist(strsplit(line, "\t")) key <- split[[1]] deptDelay <- as.numeric(split[[2]])
# Start of a new key, so output results for previous key: if (!(identical(lastKey, "")) & (!(identical(lastKey, key)))) { keySplit <- unlist(strsplit(lastKey, "\\|")) cat(keySplit[[2]], "\t", keySplit[[3]], "\t", length(delays), "\t", keySplit[[1]], "\t", (mean(delays)), "\n") lastKey <- key delays <- c(deptDelay) } else { # Still working on same key so append dept delay value to vector: lastKey <- key delays <- c(delays, deptDelay) } }
# We're done, output last record: keySplit <- unlist(strsplit(lastKey, "\\|")) cat(keySplit[[2]], "\t", keySplit[[3]], "\t", length(delays), "\t", keySplit[[1]], "\t", (mean(delays)), "\n")}
library(hive)DFS_dir_remove("/dept-delay-month", recursive = TRUE, henv = hive())hive_stream(mapper = mapper, reducer = reducer, input="/data/airline/", output="/dept-delay-month")results <- DFS_read_lines("/dept-delay-month/part-r-00000", henv = hive())
Saturday, March 10, 2012

hadoop-R/airline/src/deptdelay_by_month/R/rhipe/rhipe.R#! /usr/bin/env Rscript
# Calculate average departure delays by year and month for each airline in the# airline data set (http://stat-computing.org/dataexpo/2009/the-data.html)
library(Rhipe)rhinit(TRUE, TRUE)
# Output from map is:# "CARRIER|YEAR|MONTH \t DEPARTURE_DELAY"map <- expression({ # For each input record, parse out required fields and output new record: extractDeptDelays = function(line) { fields <- unlist(strsplit(line, "\\,")) # Skip header lines and bad records: if (!(identical(fields[[1]], "Year")) & length(fields) == 29) { deptDelay <- fields[[16]] # Skip records where departure dalay is "NA": if (!(identical(deptDelay, "NA"))) { # field[9] is carrier, field[1] is year, field[2] is month: rhcollect(paste(fields[[9]], "|", fields[[1]], "|", fields[[2]], sep=""), deptDelay) } } } # Process each record in map input: lapply(map.values, extractDeptDelays)})
# Output from reduce is:# YEAR \t MONTH \t RECORD_COUNT \t AIRLINE \t AVG_DEPT_DELAYreduce <- expression( pre = { delays <- numeric(0) }, reduce = { # Depending on size of input, reduce will get called multiple times # for each key, so accumulate intermediate values in delays vector: delays <- c(delays, as.numeric(reduce.values)) }, post = { # Process all the intermediate values for key: keySplit <- unlist(strsplit(reduce.key, "\\|")) count <- length(delays) avg <- mean(delays) rhcollect(keySplit[[2]], paste(keySplit[[3]], count, keySplit[[1]], avg, sep="\t")) })
inputPath <- "/data/airline/"outputPath <- "/dept-delay-month"
# Create job object:z <- rhmr(map=map, reduce=reduce, ifolder=inputPath, ofolder=outputPath, inout=c('text', 'text'), jobname='Avg Departure Delay By Month', mapred=list(mapred.reduce.tasks=2))# Run it:rhex(z)
RHIPE
Saturday, March 10, 2012

rmrhadoop-R/airline/src/deptdelay_by_month/R/rmr/deptdelay-rmr.R#!/usr/bin/env Rscript
# Calculate average departure delays by year and month for each airline in the# airline data set (http://stat-computing.org/dataexpo/2009/the-data.html).# Requires rmr package (https://github.com/RevolutionAnalytics/RHadoop/wiki).
library(rmr)
csvtextinputformat = function(line) keyval(NULL, unlist(strsplit(line, "\\,")))
deptdelay = function (input, output) { mapreduce(input = input, output = output, textinputformat = csvtextinputformat, map = function(k, fields) { # Skip header lines and bad records: if (!(identical(fields[[1]], "Year")) & length(fields) == 29) { deptDelay <- fields[[16]] # Skip records where departure dalay is "NA": if (!(identical(deptDelay, "NA"))) { # field[9] is carrier, field[1] is year, field[2] is month: keyval(c(fields[[9]], fields[[1]], fields[[2]]), deptDelay) } } }, reduce = function(keySplit, vv) { keyval(keySplit[[2]], c(keySplit[[3]], length(vv), keySplit[[1]], mean(as.numeric(vv)))) })}
from.dfs(deptdelay("/data/airline/1987.csv", "/dept-delay-month"))
Saturday, March 10, 2012

shorter is better
Saturday, March 10, 2012

rmr notes• You have control over the input parsing, but without having
to interact with stdin/stdout directly
• Your code only needs to deal with R objects: strings, lists, vectors & data.frames
• The result of the main mapreduce() function is simply the HDFS path of the job’s output
• Since one job’s output can be the next job’s input, mapreduce() calls can be daisy-chained to build complex workflows
• Warning: Recently-released v1.2 has a new I/O model which breaks compatibility with existing code, but adds flexibility and binary formats. 1.3 will focus on speed enhancements.
Saturday, March 10, 2012

Using rmr: airline enroute time
• Since Hadoop keys and values needn’t be single-valued, let’s pull out a few fields from the data: scheduled and actual gate-to-gate times and actual time in the air keyed on year and airport pair
• For a given day (3/25/2004) and airport pair (BOS & MIA), here’s what the data might look like:2004,3,25,4,1445,1437,1820,1812,AA,399,N275AA,215,215,197,8,8,BOS,MIA,1258,6,12,0,,0,0,0,0,0,0
2004,3,25,4,728,730,1043,1037,AA,596,N066AA,195,187,170,6,-2,MIA,BOS,1258,7,18,0,,0,0,0,0,0,0
2004,3,25,4,1333,1335,1651,1653,AA,680,N075AA,198,198,168,-2,-2,MIA,BOS,1258,9,21,0,,0,0,0,0,0,0
2004,3,25,4,1051,1055,1410,1414,AA,836,N494AA,199,199,165,-4,-4,MIA,BOS,1258,4,30,0,,0,0,0,0,0,0
2004,3,25,4,558,600,900,924,AA,989,N073AA,182,204,157,-24,-2,BOS,MIA,1258,11,14,0,,0,0,0,0,0,0
2004,3,25,4,1514,1505,1901,1844,AA,1359,N538AA,227,219,176,17,9,BOS,MIA,1258,15,36,0,,0,0,0,15,0,2
2004,3,25,4,1754,1755,2052,2121,AA,1367,N075AA,178,206,158,-29,-1,BOS,MIA,1258,5,15,0,,0,0,0,0,0,0
2004,3,25,4,810,815,1132,1151,AA,1381,N216AA,202,216,180,-19,-5,BOS,MIA,1258,7,15,0,,0,0,0,0,0,0
2004,3,25,4,1708,1710,2031,2033,AA,1636,N523AA,203,203,173,-2,-2,MIA,BOS,1258,4,26,0,,0,0,0,0,0,0
2004,3,25,4,1150,1157,1445,1524,AA,1901,N066AA,175,207,161,-39,-7,BOS,MIA,1258,4,10,0,,0,0,0,0,0,0
2004,3,25,4,2011,1950,2324,2257,AA,1908,N071AA,193,187,163,27,21,MIA,BOS,1258,4,26,0,,0,0,21,6,0,0
2004,3,25,4,1600,1605,1941,1919,AA,2010,N549AA,221,194,196,22,-5,MIA,BOS,1258,10,15,0,,0,0,0,22,0,0
Saturday, March 10, 2012

rmr 1.2 input formatter• The input formatter is called to parse each input line.
• Jonathan’s code splits CSV file just fine, but we’re going to get fancy and name the fields of the resulting vector.
• rmr 1.2’s new make.input.format() can wrap your own function:asa.csvtextinputformat = make.input.format( format = function(line) {
values = unlist( strsplit(line, "\\,") )
names(values) = c('Year','Month','DayofMonth','DayOfWeek','DepTime',
'CRSDepTime','ArrTime','CRSArrTime','UniqueCarrier',
'FlightNum','TailNum','ActualElapsedTime','CRSElapsedTime',
'AirTime','ArrDelay','DepDelay','Origin','Dest','Distance',
'TaxiIn','TaxiOut','Cancelled','CancellationCode',
'Diverted','CarrierDelay','WeatherDelay','NASDelay',
'SecurityDelay','LateAircraftDelay')
return( keyval(NULL, values) )
} )
https://raw.github.com/jeffreybreen/tutorial-201203-big-data/master/R/functions.R
Saturday, March 10, 2012

data view: input formatter
Sample input (string):2004,3,25,4,1445,1437,1820,1812,AA,399,N275AA,215,215,197,8,8,BOS,MIA,1258,6,12,0,,0,0,0,0,0,0
Sample output (key-value pair):structure(list(key = NULL, val = c("2004", "3", "25", "4", "1445",
"1437", "1820", "1812", "AA", "399", "N275AA", "215", "215",
"197", "8", "8", "BOS", "MIA", "1258", "6", "12", "0", "", "0",
"0", "0", "0", "0", "0")), .Names = c("key", "val"),
rmr.keyval = TRUE)
(For clarity, column names have been omitted on these slides)
Saturday, March 10, 2012

mapperNote the improved readability due to named fields and the compound key-value output:## the mapper gets a key and a value vector generated by the formatter# in our case, the key is NULL and all the field values come in as a vector#mapper.year.market.enroute_time = function(key, val) {
# Skip header lines, cancellations, and diversions: if ( !identical(as.character(val['Year']), 'Year') & identical(as.numeric(val['Cancelled']), 0) & identical(as.numeric(val['Diverted']), 0) ) { # We don't care about direction of travel, so construct 'market' # with airports ordered alphabetically # (e.g, LAX to JFK becomes 'JFK-LAX' if (val['Origin'] < val['Dest']) market = paste(val['Origin'], val['Dest'], sep='-') else market = paste(val['Dest'], val['Origin'], sep='-') # key consists of year, market output.key = c(val['Year'], market)
# output gate-to-gate elapsed times (CRS and actual) + time in air output.val = c(val['CRSElapsedTime'], val['ActualElapsedTime'], val['AirTime'])
return( keyval(output.key, output.val) ) }}
https://raw.github.com/jeffreybreen/tutorial-201203-big-data/master/R/functions.R
Saturday, March 10, 2012

data view: mapperSample input (key-value pair):structure(list(key = NULL, val = c("2004", "3", "25", "4", "1445",
"1437", "1820", "1812", "AA", "399", "N275AA", "215", "215",
"197", "8", "8", "BOS", "MIA", "1258", "6", "12", "0", "", "0",
"0", "0", "0", "0", "0")), .Names = c("key", "val"),
rmr.keyval = TRUE)
Sample output (key-value pair):structure(list(key = c("2004", "BOS-MIA"),
val = c("215", "215", "197")),
.Names = c("key", "val"), rmr.keyval = TRUE)
Saturday, March 10, 2012

reducerFor each key, our reducer is called with a list containing all of its values:## the reducer gets all the values for a given key# the values (which may be multi-valued as here) come in the form of a list()#reducer.year.market.enroute_time = function(key, val.list) {
# val.list is a list of row vectors # a data.frame is a list of column vectors # plyr's ldply() is the easiest way to convert IMHO if ( require(plyr) ) val.df = ldply(val.list, as.numeric) else { # this is as close as my deficient *apply skills can come w/o plyr val.list = lapply(val.list, as.numeric) val.df = data.frame( do.call(rbind, val.list) ) } colnames(val.df) = c('actual','crs','air') output.key = key output.val = c( nrow(val.df), mean(val.df$actual, na.rm=T), mean(val.df$crs, na.rm=T), mean(val.df$air, na.rm=T) )
return( keyval(output.key, output.val) )}
https://raw.github.com/jeffreybreen/tutorial-201203-big-data/master/R/functions.R
Saturday, March 10, 2012
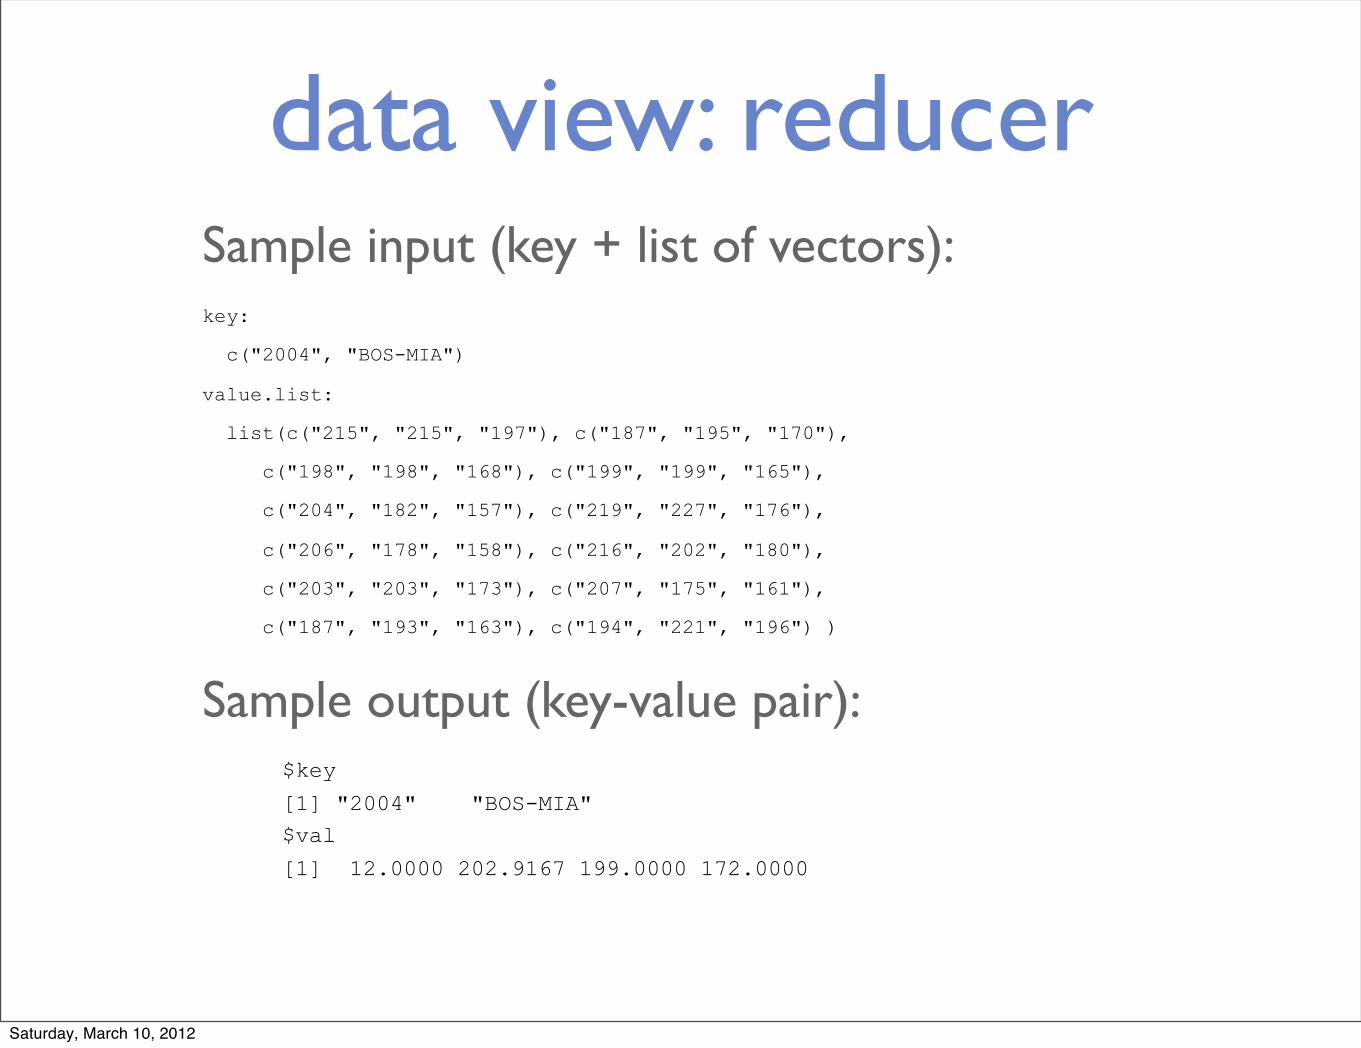
data view: reducerSample input (key + list of vectors):key:
c("2004", "BOS-MIA")
value.list:
list(c("215", "215", "197"), c("187", "195", "170"),
c("198", "198", "168"), c("199", "199", "165"),
c("204", "182", "157"), c("219", "227", "176"),
c("206", "178", "158"), c("216", "202", "180"),
c("203", "203", "173"), c("207", "175", "161"),
c("187", "193", "163"), c("194", "221", "196") )
Sample output (key-value pair):$key
[1] "2004" "BOS-MIA"$val
[1] 12.0000 202.9167 199.0000 172.0000
Saturday, March 10, 2012

submit the job and get the resultsmr.year.market.enroute_time = function (input, output) {
mapreduce(input = input,
output = output,
input.format = asa.csvtextinputformat,
map = mapper.year.market.enroute_time,
reduce = reducer.year.market.enroute_time,
backend.parameters = list(
hadoop = list(D = "mapred.reduce.tasks=10")
),
verbose=T)
}
hdfs.output.path = file.path(hdfs.output.root, 'enroute-time')
results = mr.year.market.enroute_time(hdfs.input.path, hdfs.output.path)
results.df = from.dfs(results, to.data.frame=T)
colnames(results.df) = c('year', 'market', 'flights', 'scheduled', 'actual', 'in.air')
save(results.df, file="out/enroute.time.RData")
Saturday, March 10, 2012

R can handle the rest itself> nrow(results.df)[1] 42612> yearly.mean = ddply(results.df, c('year'), summarise, scheduled = weighted.mean(scheduled, flights), actual = weighted.mean(actual, flights), in.air = weighted.mean(in.air, flights))> ggplot(yearly.mean) + geom_line(aes(x=year, y=scheduled), color='#CCCC33') + geom_line(aes(x=year, y=actual), color='#FF9900') + geom_line(aes(x=year, y=in.air), color='#4689cc') + theme_bw() + ylim(c(60, 130)) + ylab('minutes')
Saturday, March 10, 2012
Related Documents