BIG DATA FOR LABOUR MARKET INTELLIGENCE AN INTRODUCTORY GUIDE

Welcome message from author
This document is posted to help you gain knowledge. Please leave a comment to let me know what you think about it! Share it to your friends and learn new things together.
Transcript
BIG DATA FOR LABOUR MARKET INTELLIGENCE AN INTRODUCTORY GUIDE

BIG DATA FOR LABOUR MARKET INTELLIGENCE | 2
Paper written by Mario Mezzanzanica and Fabio Mercorio for the European Training Foundation. The contents of this paper are the sole responsibility of the authors and do not necessarily reflect the views of the ETF or the EU institutions.
© European Training Foundation, 2019 Reproduction is authorised, provided the source is acknowledged.
BIG DATA FOR LABOUR MARKET INTELLIGENCE | 3
PREFACE This introductory guide addresses key conceptual, methodological and organisational aspects in using Big Data for labour market intelligence (LMI). The target readers and users are statisticians, researchers, policy analysts and decision-makers in the European Training Foundation’s (ETF) partner countries who are confronted with the challenges of anticipation and dissemination of insights on the dynamics of demand for jobs, skills and qualifications.
Big Data is all around us, but its potential and the ways it can be used in social research remain a novelty for many state institutions and stakeholders in ETF partner countries and beyond.
This introductory guide clarifies how Big Data can be used to go beyond the frontiers of conventional approaches to labour market information systems (LMIS) and add value to established statistics. Traditional approaches to providing LMI, based essentially on surveys, have important caveats: cost, timeliness, accuracy, usage, integration and coverage. These challenges are addressable but this will need the attention of governments, stakeholders and their donor partners to resolve them.
Big Data sources and analysis supplement and enrich established statistics. Big Data analytics can be used to map skills by occupation, to identify discrepancies in skills, to identify obsolete skills, to do predictive analysis of demand for new occupations and new skills – in quasi real time. Big Data analytics allow more refined (granular), space-related insights in real time, as well as predictive analysis.
The volume, variety and velocity of Big Data will continue to increase. Vast amounts of digital data are generated by people, organisations, smart sensors, satellites, surveillance cameras, the internet and countless other devices. The endeavour to make sense out of that data brings about exciting opportunities. Creating knowledge out of the data is the major goal of Big Data analysis. In other words: it is about value.
Big Data is associated with non-negligible challenges and issues, in particular veracity. This refers to the quality of the data, which can vary greatly and requires adequate approaches, rules and techniques. There are also issues related to data protection and privacy requiring safeguards.
But before diving into the techniques of Big Data analytics, an interested organisation or group of stakeholders needs to start by asking: What is the problem at large in our domain? How do we see ourselves solving it? Who needs and who will use the insights we will deliver? What will be the scope, granularity and visualisation of the insights? Who will make sense of the data-driven insights?
The application domains of Big Data analysis are wide; fortunately, the phenomena and dynamics of the jobs and skills markets can be screened and analysed using Big Data. However, a number of important themes might not be captured as yet through Big Data analytics, for example the features and trends of informal employment, which in many countries is very large.
Big Data for LMIS combines a range of specific elements of the digital transformation, including machine learning algorithms, use of large volumes of internet data and specific computing architecture. These novel techniques and data sources will continue to evolve. And so should our skills and understanding in this domain. This guide is a first step.

BIG DATA FOR LABOUR MARKET INTELLIGENCE | 4
The ETF thanks the team of experts who authored this introductory guide – Mario Mezzanzanica and Fabio Mercorio – for demonstrating flexibility throughout the drafting process to adapt the information to the needs of the target users and for sharing their experience and insights, taking account of their own research (CRISP, University of Milano-Bicocca) and other relevant projects across the world used as examples in this guide.
The ETF is grateful to all organisations that contributed to this paper with examples and cases helpful to illustrate the key messages. ETF expert Eduarda Castel-Branco coordinated the work and discussions with the experts and led the review process, which included valuable comments from ETF experts Michael Reiner and Martiño Rubal Maseda.
BIG DATA FOR LABOUR MARKET INTELLIGENCE | 5
CONTENTS PREFACE ............................................................................................................................. 3
EXECUTIVE SUMMARY ....................................................................................................... 6
1. BIG DATA AND LABOUR MARKET INFORMATION: HOW TO ENHANCE LMI IN THE DIGITAL ERA – OVERVIEW, STATE OF PLAY, POTENTIAL AND LIMITATIONS................................................................................................................ 8
1.1 Background and definitions .......................................................................................... 8 1.2 Big Data meets LMI ..................................................................................................... 13 1.3 Literature on Big Data for LMI .................................................................................... 21 1.4 Big Data for LMI in operation ....................................................................................... 22
2. INCORPORATING BIG DATA ANALYTICS IN LMI: SYSTEMATIC STEPS................ 28 2.1 Big Data architecture components ............................................................................... 28 2.2 State-of-the-art architectures, technologies and tools .................................................. 32 2.3 The role of AI for LMI: algorithms and frameworks to reason with LM data ................. 36
3. USE OF BIG DATA ANALYTICS FOR LMIS: A SELECTION OF CASES TO BE USED AS PRACTICAL REFERENCE ............................................................. 42
3.1 CyberSeek.org – United States of America ................................................................. 42 3.2 WheretheWorkIs.org – United Kingdom ...................................................................... 43 3.3 Bizkaia Basque Talent Observatory – Spain ............................................................... 44 3.4 The data-driven skills taxonomy – United Kingdom .................................................... 45 3.5 Technical, entrepreneurial and vocational education and training – Malawi ................. 46 3.6 Transfer Occupations and Tensions Indicators projects – The Netherlands ................ 47 3.7 Real-time labour market information on skill requirements – All EU Member States .... 48
4. CONCLUSIONS AND RECOMMENDATIONS ........................................................... 51 4.1 Summary of recommendations and steps for the ETF and its partner countries ......... 51 4.2 Ideas for pilot projects ................................................................................................ 52
ACRONYMS ........................................................................................................................ 54
REFERENCES .................................................................................................................... 56
BIG DATA FOR LABOUR MARKET INTELLIGENCE | 6
EXECUTIVE SUMMARY In the past few decades, significant forces and factors have dramatically changed the nature and characteristics of the labour market in both advanced and developing countries. On the one side, technical progress, globalisation and the re-organisation of the production process – with outsourcing and offshoring – have radically altered the demand for certain skills: several jobs are disappearing while new jobs are emerging. Of these, some are simply a variant of existing jobs while others are genuinely new jobs that were non-existent until a few years ago. Notably, population ageing in advanced economies intensifies the need for continued training, and is likely to affect the structural demand for certain competences: the quantity and quality of the demand for skills and qualifications associated with the new labour market has changed substantially. Not only are new skills needed to perform new jobs but also the skills requirements of existing jobs have changed considerably.
On the other side, in recent years, the amount of labour market information (LMI) conveyed through specialised internet portals and services has grown exponentially, encouraging and supporting the realisation of many internet services and tools related to the labour market, such as job matching services, advertising of job positions, services for sharing curricula, and the creation of a network of professionals who share and exchange labour market opportunities freely.
In such a dynamic scenario, some questions arise relating to observing, understanding and analysing the internet-based labour market phenomenon and its dynamics properly, such as: Which occupations will grow in the future and where? What skills will be most in demand for companies and firms in the next few years? What skills should one acquire during their lifelong learning path? Which jobs are really new, and which ones are just an evolution of old existing jobs that require new or technological skills? What is the impact of digitalisation within professions? What is the role that soft skills play within existing jobs and which are the most significant soft skills to gain?
Those are just a few of the questions at the forefront of the policy debate among economists, policymakers, and labour market experts in general. Nowadays, these questions need to be addressed focusing on data-driven paradigms that allow us to observe and monitor a phenomenon in a (i) timely, (ii) inductive way, i.e. data are used to draw and confirm hypotheses instead of the other way round, and (iii) at a very fine-grained level.
Indeed, internet LMI provides a great opportunity for real-time labour market monitoring, to better understand labour market dynamics, capturing skills needs and trends focusing on different dimensions (e.g. territory, sectors) at a detailed level, i.e. Big Data related to LM intelligence (Big Data 4 LMI). Not surprisingly, there has been a growing interest in designing and implementing real LMI applications for internet labour market data to support the policy design and evaluation activities through evidence-based decision-making, and that represents the aim of LMI, a field that is becoming increasingly relevant to European Union (EU) labour market policy design and evaluation.
In 2016, the European Commission highlighted the importance of vocational and educational activities, as they are ‘valued for fostering job-specific and transversal skills, facilitating the transition into employment and maintaining and updating the skills of the workforce according to sectorial, regional, and local needs’. In 2016, the EU and Eurostat launched the ESSnet Big Data project, involving 22 EU Member States with the aim of ‘integrating Big Data in the regular production of official statistics, through pilots exploring the potential of selected Big Data sources and building concrete applications’. In the same year, the European Centre for the Development of Vocational Training (Cedefop) launched a call for tenders to build a system for analysis of online vacancies and to develop a system
BIG DATA FOR LABOUR MARKET INTELLIGENCE | 7
or tool to analyse vacancies and emerging skills requirements across all EU Member States, realising a fully-fledged multilanguage (32 languages) system that collects vacancies, extracts skills, and performs real-time monitoring across all 28 EU Member States to support decision-making.
Though these initiatives differ, the common baseline relies on recognising the huge informative power behind internet LMI. This informative power can be exploited by putting together computer scientists, statisticians, economists and labour market experts to derive useful labour market knowledge from raw data to understand internet labour market dynamics and trends moving towards a data-driven decision-making process through LMI.
This paper discusses the benefits, potential, limitations, methodological and technical challenges, and research issues as well as real-life projects and case studies related to the use of Big Data for LMI. We introduce the matter by discussing the role of Big Data in the labour market context, and surveying the recent state of the art of LMI. Then, we discuss some technical aspects needed to incorporate Big Data analytics into LMI. Examples along with recent applications and projects (both within and outside the EU) are provided, discussing goals, data and sources used, results achieved, and open and challenging issues for each project reported. Finally, we summarise a set of recommendations and steps for the European Training Foundation (ETF) and its partner countries, and provide some ideas for projects that emerged from the ETF conference ‘Skills for the future: Managing transition’ held in Turin in November 2018.
BIG DATA FOR LABOUR MARKET INTELLIGENCE | 8
1. BIG DATA AND LABOUR MARKET INFORMATION: HOW TO ENHANCE LMI IN THE DIGITAL ERA OVERVIEW, STATE OF PLAY, POTENTIAL AND LIMITATIONS
1.1 Background and definitions This section briefly introduces some terms and background notions related to labour market (LM) data to help the reading of this document.
Labour market information/intelligence
These two terms – often used interchangeably – refer to data related to LM phenomena and dynamics that are useful for supporting decision-making, policy design and evaluation. However, it is not clear from the use of LMI whether I stands for Information or Intelligence.
Specifically, I as Information describes all kinds of data and information used to support operational activities related to the LM (no analytics) as well as any information related to LM demand and supply. Examples include job vacancy postings, skills, occupations and job applicants’ CVs.
By contrast, I as Intelligence is an emerging concept in the whole LM community, especially in the European Union (EU). Although there is no unified definition of LM intelligence, it can be described as the design and use of Artificial Intelligence (AI) algorithms and frameworks to analyse data related to the LM (aka Labour Market Information) for supporting policy and decision-making (see, e.g. [1], [2], [3]).
Q&A
When does I as Information become Intelligence?
Roughly, we would say that the use of raw or aggregated data, including data monitored over time, to support operational activities is still Information. It becomes Intelligence when an automated algorithm (today mainly exploiting AI) processes the data to generate insights useful for the purposes of analytics (e.g. forecasting for decision-making activities, machine learning for classification, or information extraction for skills on CVs). Notably, the ability to handle and analyse masses of data in real time enables the knowledge obtained from the Intelligence process to be employed in systems usually devoted to supporting operational activities.
In such a scenario, LM intelligence should be considered as an activity that – as expected – produces an output, called LM knowledge. Here, the general definition of knowledge applies, in other words, insights and additional information extracted from the experience (LM information in this case), which can increase the awareness and understanding of the phenomenon observed. This knowledge, in turn, enables its users to perform predictions and analytics (as we discuss later).
BIG DATA FOR LABOUR MARKET INTELLIGENCE | 9
Q&A
Can information and intelligence work together within a system (or a framework) to support decision-making activities?
Yes, this is the way LM information and intelligence should interact, namely within a system (back-end) that collects LM information and uses AI to create LM intelligence. The result, LM knowledge, is then provided to a set of stakeholders according to their needs and abilities in understanding labour market dynamics. This process describes how a labour market information system (LMIS) should work.
Labour market information system
In the previous section, we clarified the difference between LM information (i.e. raw data normally used to exchange information inside operative service processes relating to the LM), and LM intelligence (tools, algorithms and procedures to manipulate LM information). These two concepts participate in the realisation of an LMIS, where an information system is commonly defined as a set of interconnected components (technological and architectural) that work together to collect, retrieve, process, store and distribute information to facilitate activities such as planning, control, coordination, analysis and decision-making in business organisations. Hence, the value of information accessed through an information system is twofold: one, it supports operational processes, and two, it helps decision-makers achieve their analysis objectives.
LMIS (intuition)
An LMIS can be seen as an instance of a classical information system that employs LM information and intelligence to support both operational and decision-making activities.
In essence, the LMIS concept can be described as a set of tools able to extract, analyse and disseminate LM-related information. Nevertheless, there is no unified definition of what an LMIS should be, and no one-size-fits-all practical advice on developing an LMIS, as its architecture, data and methods depend on analysis needs, which are context-dependent (e.g. country, institution, important issues, policy priorities and data infrastructure). Practical and different examples of LMIS appear in [4], [5], [6], [2], to cite just a few recent works. Some of these will be discussed later in the document. In this respect, the availability of data on the internet (see Chapter 2) sheds light on the importance of upgrading and evolving LMIS in order to include internet data and to exploit AI algorithms to derive useful insights and formulate predictions on LM dynamics and trends (as recently argued by Johnson in [7] and shown by Frey and Osborne [8] to predict the risk of robotisation). These reasons led analysts and LM experts to include the internet as an additional source of LM data and information in their own work, to better describe and understand the LM as a whole.
Data sources for LMI
Administrative, statistical and internet data are three main categories of data that can work together to explain a phenomenon. This very brief overview of the three main types of data highlights their distinctive features and similarities.
BIG DATA FOR LABOUR MARKET INTELLIGENCE | 10
Administrative data. In essence, a reliable definition of administrative data is ‘data sets collected by government institutions or agencies for tax, benefit or public administration purposes’[9]. This means that these data also refer to information collected from (or about) individuals, who may need to take action to become part of a system that uses administrative data (e.g. registration of farmers in the tax and social security system) or not (e.g. Italian labour law states that a system has to automatically monitor the start/end of every employment contract (see [10]).
Statistical data. Statistical data (also known as survey data) are collected to fit a specific and predefined statistical purpose to ensure a given coverage of population, definitions, methodology, quality and time in order to meet the stakeholder’s analytical needs (see, e.g. [11]). Clearly, the use of administrative data for statistical purposes is far from straightforward, as it involves challenging issues such as identification of the population, the target population and the size of the sample, and the difficulty of selecting the model variable to sample the population.
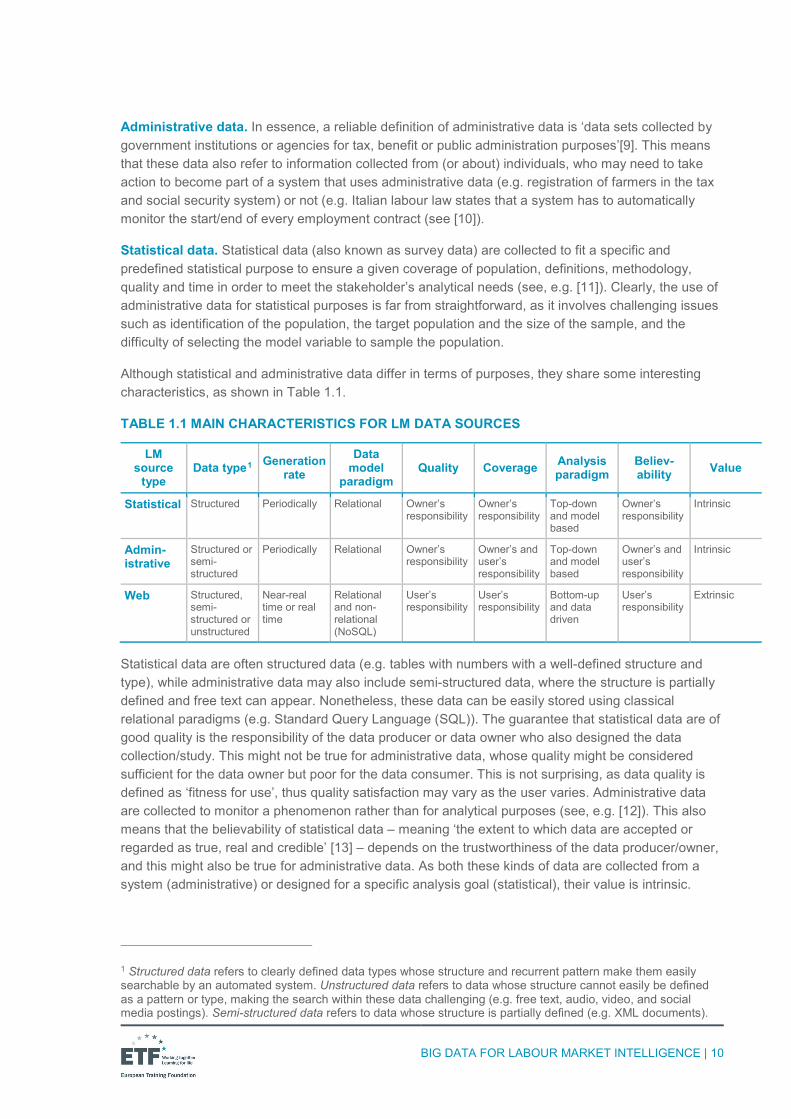
Although statistical and administrative data differ in terms of purposes, they share some interesting characteristics, as shown in Table 1.1.
TABLE 1.1 MAIN CHARACTERISTICS FOR LM DATA SOURCES
LM source
type Data type1 Generation
rate Data
model paradigm
Quality Coverage Analysis paradigm
Believ-ability Value
Statistical Structured Periodically Relational Owner’s responsibility
Owner’s responsibility
Top-down and model based
Owner’s responsibility
Intrinsic
Admin-istrative
Structured or semi-structured
Periodically Relational Owner’s responsibility
Owner’s and user’s responsibility
Top-down and model based
Owner’s and user’s responsibility
Intrinsic
Web Structured, semi-structured or unstructured
Near-real time or real time
Relational and non-relational (NoSQL)
User’s responsibility
User’s responsibility
Bottom-up and data driven
User’s responsibility
Extrinsic
Statistical data are often structured data (e.g. tables with numbers with a well-defined structure and type), while administrative data may also include semi-structured data, where the structure is partially defined and free text can appear. Nonetheless, these data can be easily stored using classical relational paradigms (e.g. Standard Query Language (SQL)). The guarantee that statistical data are of good quality is the responsibility of the data producer or data owner who also designed the data collection/study. This might not be true for administrative data, whose quality might be considered sufficient for the data owner but poor for the data consumer. This is not surprising, as data quality is defined as ‘fitness for use’, thus quality satisfaction may vary as the user varies. Administrative data are collected to monitor a phenomenon rather than for analytical purposes (see, e.g. [12]). This also means that the believability of statistical data – meaning ‘the extent to which data are accepted or regarded as true, real and credible’ [13] – depends on the trustworthiness of the data producer/owner, and this might also be true for administrative data. As both these kinds of data are collected from a system (administrative) or designed for a specific analysis goal (statistical), their value is intrinsic.
1 Structured data refers to clearly defined data types whose structure and recurrent pattern make them easily searchable by an automated system. Unstructured data refers to data whose structure cannot easily be defined as a pattern or type, making the search within these data challenging (e.g. free text, audio, video, and social media postings). Semi-structured data refers to data whose structure is partially defined (e.g. XML documents).
BIG DATA FOR LABOUR MARKET INTELLIGENCE | 11
In other words, the data are inherently of value. Clearly, this value can be improved by analysing and linking data, but it still remains.
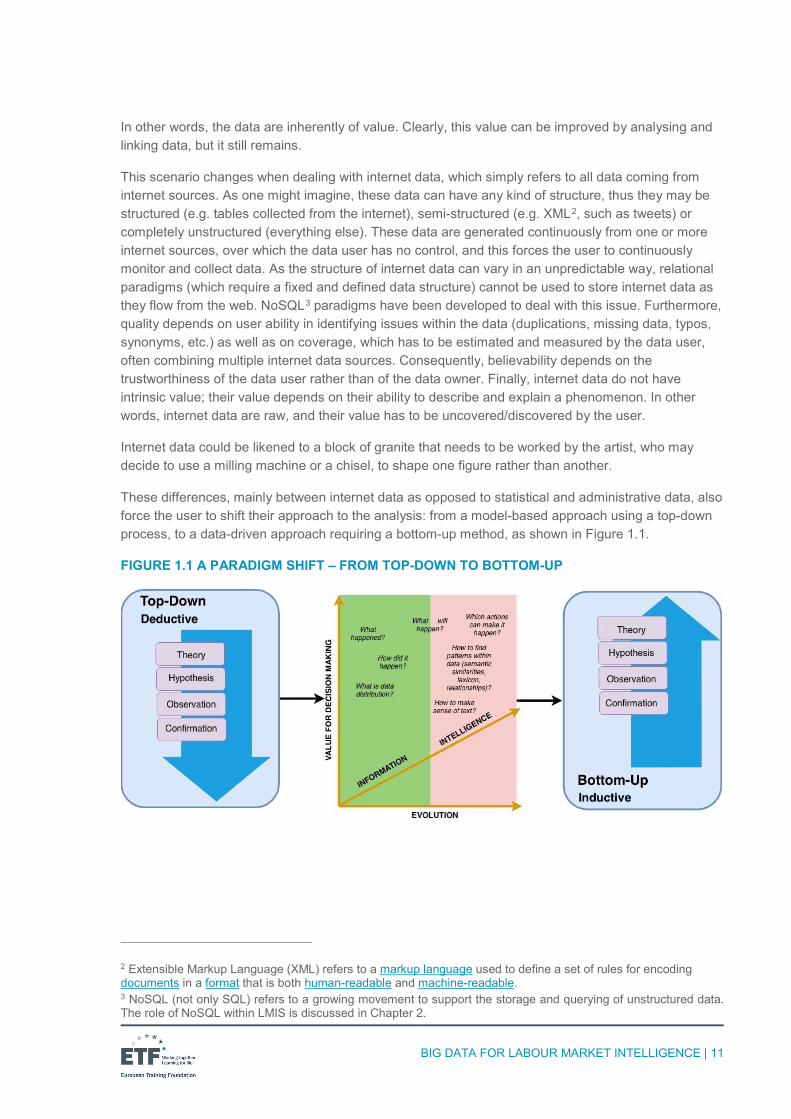
This scenario changes when dealing with internet data, which simply refers to all data coming from internet sources. As one might imagine, these data can have any kind of structure, thus they may be structured (e.g. tables collected from the internet), semi-structured (e.g. XML2, such as tweets) or completely unstructured (everything else). These data are generated continuously from one or more internet sources, over which the data user has no control, and this forces the user to continuously monitor and collect data. As the structure of internet data can vary in an unpredictable way, relational paradigms (which require a fixed and defined data structure) cannot be used to store internet data as they flow from the web. NoSQL3 paradigms have been developed to deal with this issue. Furthermore, quality depends on user ability in identifying issues within the data (duplications, missing data, typos, synonyms, etc.) as well as on coverage, which has to be estimated and measured by the data user, often combining multiple internet data sources. Consequently, believability depends on the trustworthiness of the data user rather than of the data owner. Finally, internet data do not have intrinsic value; their value depends on their ability to describe and explain a phenomenon. In other words, internet data are raw, and their value has to be uncovered/discovered by the user.
Internet data could be likened to a block of granite that needs to be worked by the artist, who may decide to use a milling machine or a chisel, to shape one figure rather than another.
These differences, mainly between internet data as opposed to statistical and administrative data, also force the user to shift their approach to the analysis: from a model-based approach using a top-down process, to a data-driven approach requiring a bottom-up method, as shown in Figure 1.1.
FIGURE 1.1 A PARADIGM SHIFT – FROM TOP-DOWN TO BOTTOM-UP
2 Extensible Markup Language (XML) refers to a markup language used to define a set of rules for encoding documents in a format that is both human-readable and machine-readable. 3 NoSQL (not only SQL) refers to a growing movement to support the storage and querying of unstructured data. The role of NoSQL within LMIS is discussed in Chapter 2.
BIG DATA FOR LABOUR MARKET INTELLIGENCE | 12
Q&A
Due to the massive presence of unstructured data/texts, it seems that the use of Big Data makes it impossible to perform data quality tasks, which are well defined for structured data. Is this the case?
The application of data quality (and cleaning) tasks on internet data is still an open debate. Some people think internet data should be managed like classical structured data, while others say that the ‘garbage in, garbage out’ principle does not apply to Big Data, since the volume will act as a denoising factor. In our experience, the quality of Big Data depends primarily on the reliability of the sources used to collect the data. Thus, ranking internet sources is crucial. Any data quality techniques can be applied: rule-based (if a data model can be identified) or statistical (to identify outliers and denoise data).
General Data Protection Regulation issues related to the LM
The General Data Protection Regulation (GDPR) came into effect in May 2018 in all EU Member States. It represents a first step towards regulation of personal data manipulation and processing. If data do not contain personal information, the GDPR does not apply. Otherwise, if data contain personal information related to a subject (e.g. CV data, personal preferences, historical career paths or personal skills), then the LMIS that uses the data must be compliant with the GDPR.
In essence, the GDPR aims to guarantee the data subject’s fundamental rights, and to increase the accountability of companies that control and process personal data. The GDPR establishes a number of restrictions and constraints on personal data usage.
■ First, the data subject’s right to access information collected about him/her places restrictions on automated decision-making by companies and organisations using these data.
■ Second, entities designated to process personal data (i.e. data processors) must notify the data subjects about the data collected (Articles 13–15).
■ Third, transparency assumes a key role, forcing the data processor to handle data in a transparent manner (Article 5, §1a), through transparent data processing (Article 13, §2 and 14, §2), and to notify the data subject if an automated decision-making process is applied to their personal data (Article 22). Furthermore, Articles 13 and 14 state that, when profiling takes place, a data subject has the right to ‘meaningful information about the logic involved’.
From a technical perspective, this also applies to all extraction, transformation and loading (ETL)4 processes and routines, which extract data, transform them from one format into another, and finally load processed and aggregated data into data warehouses for analytical purposes. In this way, when a key performance indicator or a general business indicator is computed, it is not possible to identify the information source or which data related to a data subject have been used. This also applies to (personal) data related to the LM. Roughly, this means that the data processor is responsible for guaranteeing, among other things: (i) that the subject to whom data refer cannot be identified either directly or indirectly, where the subject’s identifiers are their name, an identification number, location data, an online identifier or one or more characteristic elements of their physical, physiological,
4 ETL is an approach supporting data pre-processing and transformation tasks in the knowledge discovery in databases (KDD) process. Data extracted from a source system undergo a series of transformations that analyse, manipulate and then clean the data before loading them into a data warehouse.
BIG DATA FOR LABOUR MARKET INTELLIGENCE | 13
genetic, psychological, economic, cultural or social identity (Article 4); (ii) that data are processed lawfully, fairly and in a transparent manner in relation to the data subject (Article 5); and (iii) that data are collected for specified, explicit and legitimate purposes and not further processed in a manner that is incompatible with those purposes (Article 5).
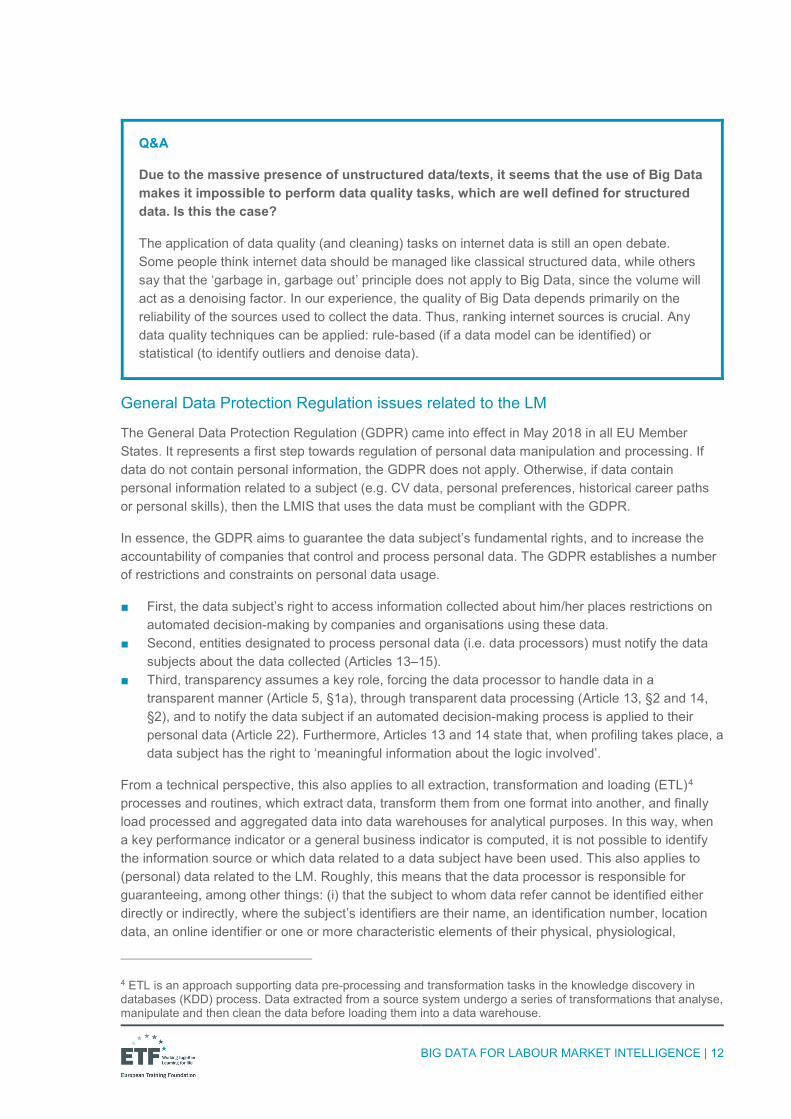
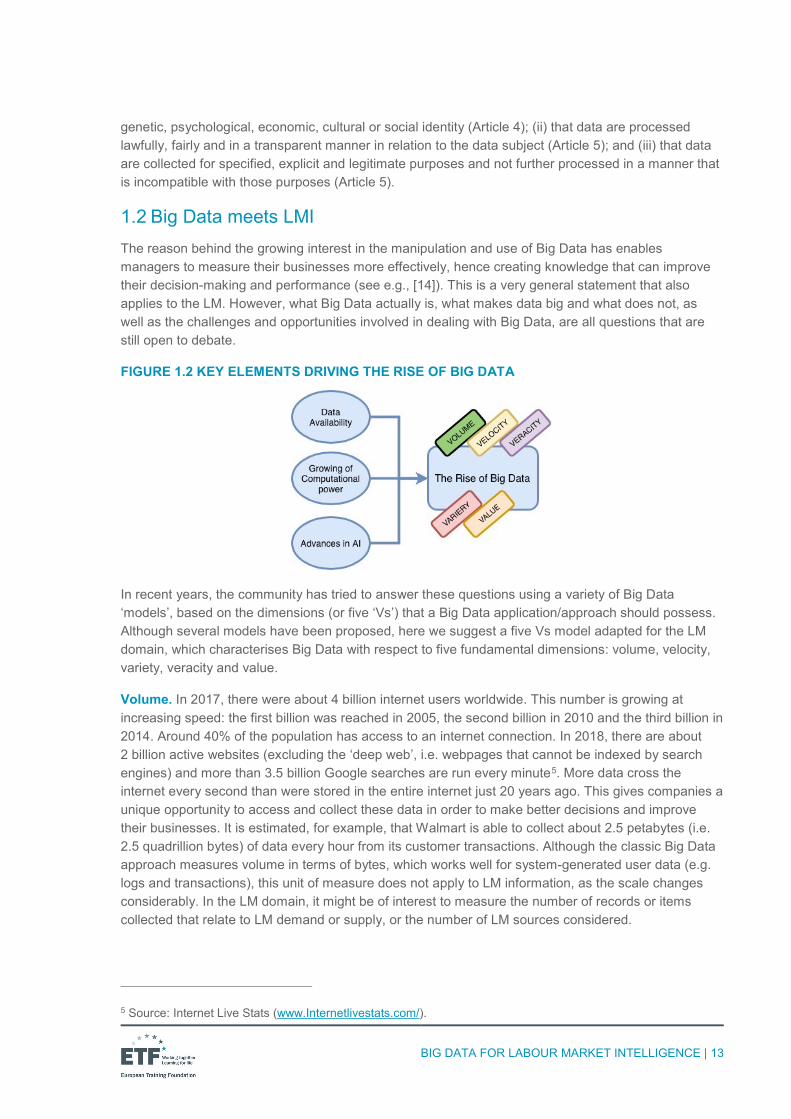
1.2 Big Data meets LMI The reason behind the growing interest in the manipulation and use of Big Data has enables managers to measure their businesses more effectively, hence creating knowledge that can improve their decision-making and performance (see e.g., [14]). This is a very general statement that also applies to the LM. However, what Big Data actually is, what makes data big and what does not, as well as the challenges and opportunities involved in dealing with Big Data, are all questions that are still open to debate.
FIGURE 1.2 KEY ELEMENTS DRIVING THE RISE OF BIG DATA
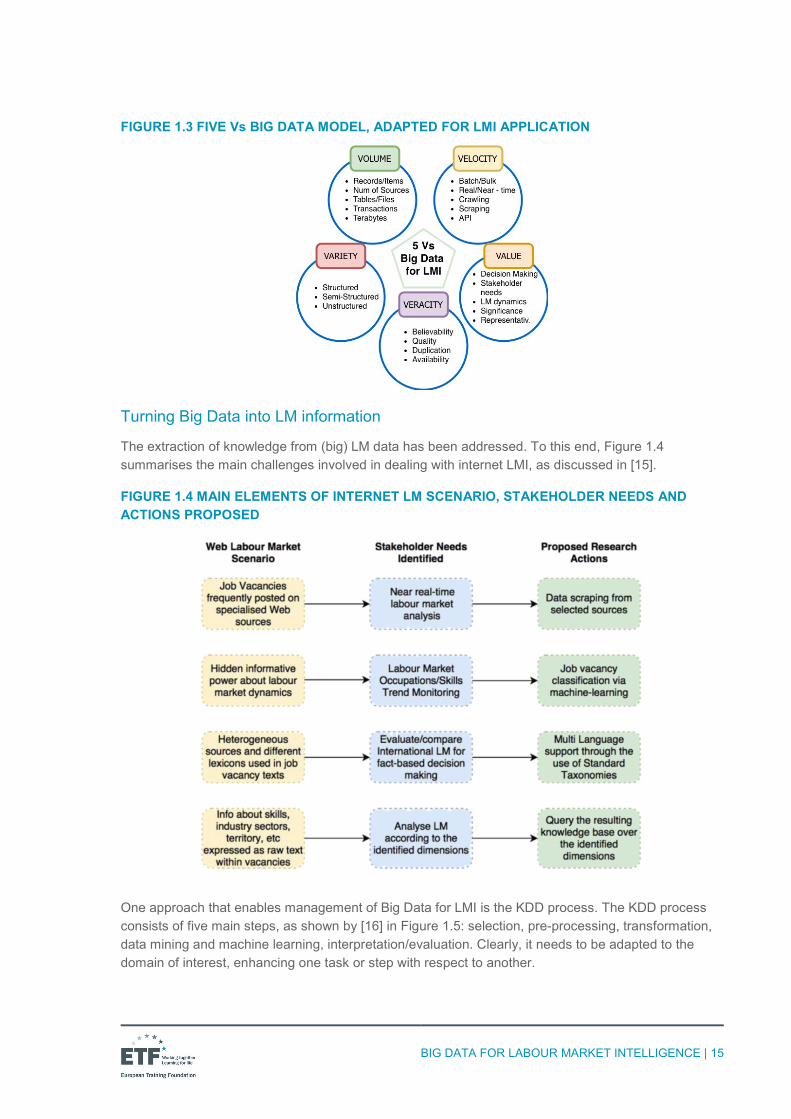
In recent years, the community has tried to answer these questions using a variety of Big Data ‘models’, based on the dimensions (or five ‘Vs’) that a Big Data application/approach should possess. Although several models have been proposed, here we suggest a five Vs model adapted for the LM domain, which characterises Big Data with respect to five fundamental dimensions: volume, velocity, variety, veracity and value.
Volume. In 2017, there were about 4 billion internet users worldwide. This number is growing at increasing speed: the first billion was reached in 2005, the second billion in 2010 and the third billion in 2014. Around 40% of the population has access to an internet connection. In 2018, there are about 2 billion active websites (excluding the ‘deep web’, i.e. webpages that cannot be indexed by search engines) and more than 3.5 billion Google searches are run every minute5. More data cross the internet every second than were stored in the entire internet just 20 years ago. This gives companies a unique opportunity to access and collect these data in order to make better decisions and improve their businesses. It is estimated, for example, that Walmart is able to collect about 2.5 petabytes (i.e. 2.5 quadrillion bytes) of data every hour from its customer transactions. Although the classic Big Data approach measures volume in terms of bytes, which works well for system-generated user data (e.g. logs and transactions), this unit of measure does not apply to LM information, as the scale changes considerably. In the LM domain, it might be of interest to measure the number of records or items collected that relate to LM demand or supply, or the number of LM sources considered.
5 Source: Internet Live Stats (www.Internetlivestats.com/).
BIG DATA FOR LABOUR MARKET INTELLIGENCE | 14
Velocity. This dimension refers to the rate at which data are generated, or collected in the case of LMI. These data are collected from third-party sources who may decide to allow data to be collected autonomously through (i) application programming interfaces (APIs)6, (ii) batch procedures executed periodically or (iii) near real-time crawling or scraping7 of the source and obtaining data at close, fixed intervals. Clearly, the lower the frequency of data collection, the higher the volume of data collected, and the greater the need for higher computing and large storage resources.
Variety. This dimension refers to the variety of data types within Big Data sources, as discussed in Table 1.1. The source may be structured, semi-structured or completely unstructured. As a consequence of using large volumes of unstructured content, the lexicons employed within each source vary, and large-scale use of natural language means the heterogeneity of the data is considerable.
Veracity. Data veracity indicates how accurate or truthful a data set may be. As discussed above, the quality of internet data cannot be manipulated at the source, but has to be assessed when data are collected and stored, through ad hoc analyses, procedures and tools. Bias, abnormalities or inconsistencies, duplication and volatility are some of the aspects that need to be removed to improve the accuracy of Big Data. As one might imagine, for a given data source, the higher the variety, the higher the veracity. Indeed, the use of natural language brings a great deal of noise containing no information into a text (e.g. prepositions, terms not related to the topic of interest, conjunctions and acronyms that have to be expanded). All these issues have to be properly addressed to enable unstructured data to produce knowledge in the knowledge discovery in databases (KDD) steps.
Value. Finally, data have to be of value to a specific domain or purpose. In other words, as discussed above, internet data have no intrinsic value. Their value is the knowledge the user extracts from the data to explain a phenomenon, or to support decision-making through analyses and recommendations. It is worth mentioning the importance of analysis of stakeholder needs, which should identify which portion of knowledge is of interest to a given stakeholder and which is not. In the case of job vacancies advertised on the internet, a user looking for a new job would be interested in performing a gap analysis with respect to his/her skills, while an LM analyst might be interested in observing the internet LM as a whole at a specific regional level. The same knowledge might have different points of access depending on stakeholder needs.
6 In the web context, API refers to a set of procedures that a user employs to communicate with the server (e.g. for collection of data). Consequently, communication between user and server is regulated, well defined and monitored. 7 Crawling collects data from websites as they are, while scraping identifies certain parts of a website to be collected. In essence, scraping parses and identifies the data that the user wants to collect, while crawling simply collects all web content.
BIG DATA FOR LABOUR MARKET INTELLIGENCE | 15
FIGURE 1.3 FIVE Vs BIG DATA MODEL, ADAPTED FOR LMI APPLICATION
Turning Big Data into LM information
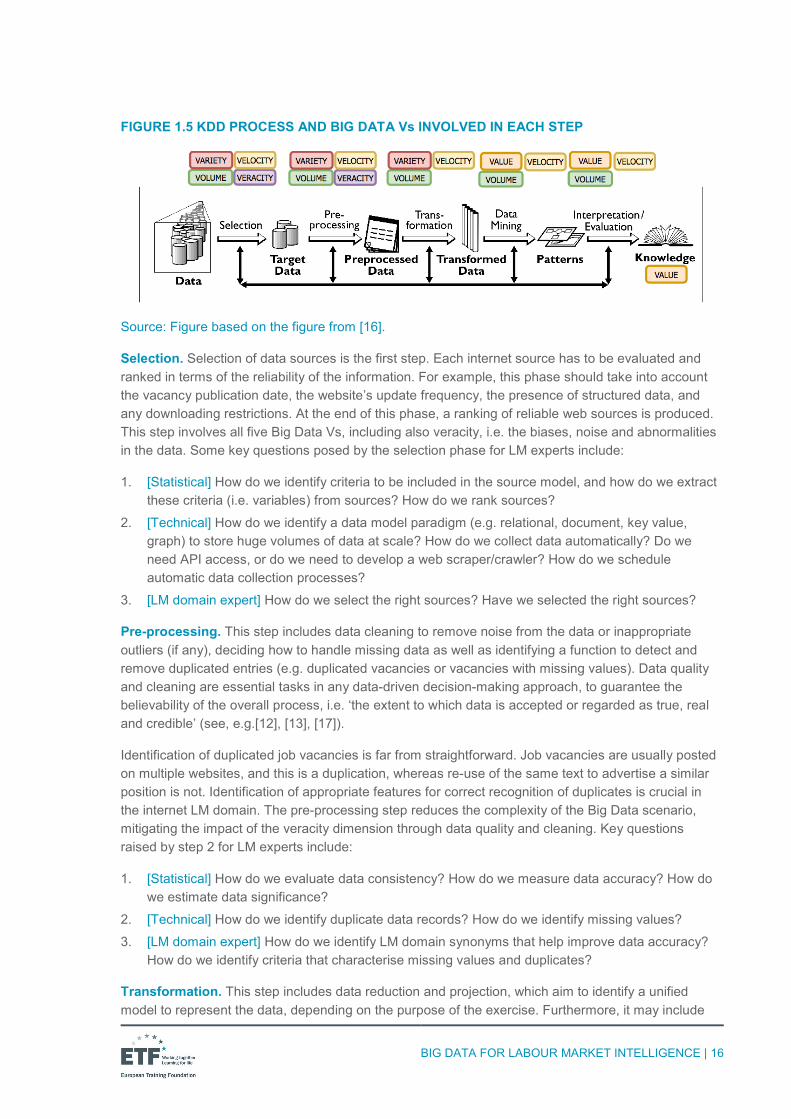
The extraction of knowledge from (big) LM data has been addressed. To this end, Figure 1.4 summarises the main challenges involved in dealing with internet LMI, as discussed in [15].
FIGURE 1.4 MAIN ELEMENTS OF INTERNET LM SCENARIO, STAKEHOLDER NEEDS AND ACTIONS PROPOSED
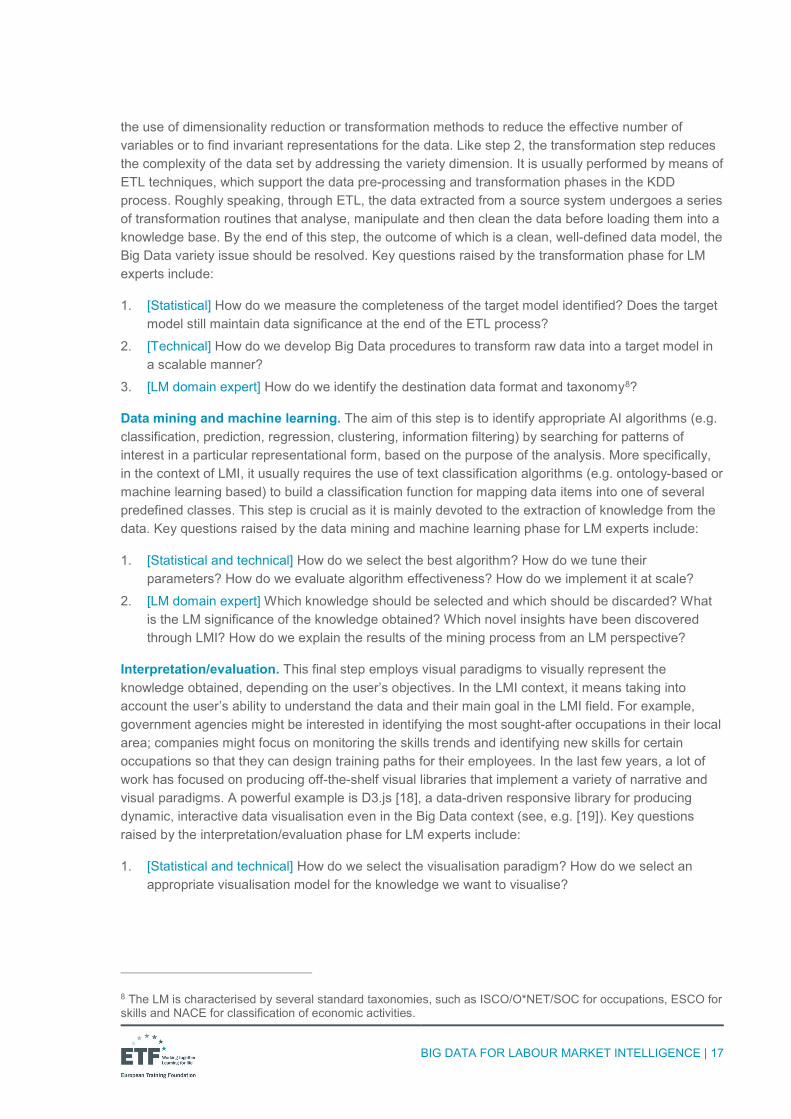
One approach that enables management of Big Data for LMI is the KDD process. The KDD process consists of five main steps, as shown by [16] in Figure 1.5: selection, pre-processing, transformation, data mining and machine learning, interpretation/evaluation. Clearly, it needs to be adapted to the domain of interest, enhancing one task or step with respect to another.
BIG DATA FOR LABOUR MARKET INTELLIGENCE | 16
FIGURE 1.5 KDD PROCESS AND BIG DATA Vs INVOLVED IN EACH STEP
Source: Figure based on the figure from [16].
Selection. Selection of data sources is the first step. Each internet source has to be evaluated and ranked in terms of the reliability of the information. For example, this phase should take into account the vacancy publication date, the website’s update frequency, the presence of structured data, and any downloading restrictions. At the end of this phase, a ranking of reliable web sources is produced. This step involves all five Big Data Vs, including also veracity, i.e. the biases, noise and abnormalities in the data. Some key questions posed by the selection phase for LM experts include:
1. [Statistical] How do we identify criteria to be included in the source model, and how do we extract these criteria (i.e. variables) from sources? How do we rank sources?
2. [Technical] How do we identify a data model paradigm (e.g. relational, document, key value, graph) to store huge volumes of data at scale? How do we collect data automatically? Do we need API access, or do we need to develop a web scraper/crawler? How do we schedule automatic data collection processes?
3. [LM domain expert] How do we select the right sources? Have we selected the right sources?
Pre-processing. This step includes data cleaning to remove noise from the data or inappropriate outliers (if any), deciding how to handle missing data as well as identifying a function to detect and remove duplicated entries (e.g. duplicated vacancies or vacancies with missing values). Data quality and cleaning are essential tasks in any data-driven decision-making approach, to guarantee the believability of the overall process, i.e. ‘the extent to which data is accepted or regarded as true, real and credible’ (see, e.g.[12], [13], [17]).
Identification of duplicated job vacancies is far from straightforward. Job vacancies are usually posted on multiple websites, and this is a duplication, whereas re-use of the same text to advertise a similar position is not. Identification of appropriate features for correct recognition of duplicates is crucial in the internet LM domain. The pre-processing step reduces the complexity of the Big Data scenario, mitigating the impact of the veracity dimension through data quality and cleaning. Key questions raised by step 2 for LM experts include:
1. [Statistical] How do we evaluate data consistency? How do we measure data accuracy? How do we estimate data significance?
2. [Technical] How do we identify duplicate data records? How do we identify missing values? 3. [LM domain expert] How do we identify LM domain synonyms that help improve data accuracy?
How do we identify criteria that characterise missing values and duplicates?
Transformation. This step includes data reduction and projection, which aim to identify a unified model to represent the data, depending on the purpose of the exercise. Furthermore, it may include
BIG DATA FOR LABOUR MARKET INTELLIGENCE | 17
the use of dimensionality reduction or transformation methods to reduce the effective number of variables or to find invariant representations for the data. Like step 2, the transformation step reduces the complexity of the data set by addressing the variety dimension. It is usually performed by means of ETL techniques, which support the data pre-processing and transformation phases in the KDD process. Roughly speaking, through ETL, the data extracted from a source system undergoes a series of transformation routines that analyse, manipulate and then clean the data before loading them into a knowledge base. By the end of this step, the outcome of which is a clean, well-defined data model, the Big Data variety issue should be resolved. Key questions raised by the transformation phase for LM experts include:
1. [Statistical] How do we measure the completeness of the target model identified? Does the target model still maintain data significance at the end of the ETL process?
2. [Technical] How do we develop Big Data procedures to transform raw data into a target model in a scalable manner?
3. [LM domain expert] How do we identify the destination data format and taxonomy8?
Data mining and machine learning. The aim of this step is to identify appropriate AI algorithms (e.g. classification, prediction, regression, clustering, information filtering) by searching for patterns of interest in a particular representational form, based on the purpose of the analysis. More specifically, in the context of LMI, it usually requires the use of text classification algorithms (e.g. ontology-based or machine learning based) to build a classification function for mapping data items into one of several predefined classes. This step is crucial as it is mainly devoted to the extraction of knowledge from the data. Key questions raised by the data mining and machine learning phase for LM experts include:
1. [Statistical and technical] How do we select the best algorithm? How do we tune their parameters? How do we evaluate algorithm effectiveness? How do we implement it at scale?
2. [LM domain expert] Which knowledge should be selected and which should be discarded? What is the LM significance of the knowledge obtained? Which novel insights have been discovered through LMI? How do we explain the results of the mining process from an LM perspective?
Interpretation/evaluation. This final step employs visual paradigms to visually represent the knowledge obtained, depending on the user’s objectives. In the LMI context, it means taking into account the user’s ability to understand the data and their main goal in the LMI field. For example, government agencies might be interested in identifying the most sought-after occupations in their local area; companies might focus on monitoring the skills trends and identifying new skills for certain occupations so that they can design training paths for their employees. In the last few years, a lot of work has focused on producing off-the-shelf visual libraries that implement a variety of narrative and visual paradigms. A powerful example is D3.js [18], a data-driven responsive library for producing dynamic, interactive data visualisation even in the Big Data context (see, e.g. [19]). Key questions raised by the interpretation/evaluation phase for LM experts include:
1. [Statistical and technical] How do we select the visualisation paradigm? How do we select an appropriate visualisation model for the knowledge we want to visualise?
8 The LM is characterised by several standard taxonomies, such as ISCO/O*NET/SOC for occupations, ESCO for skills and NACE for classification of economic activities.
BIG DATA FOR LABOUR MARKET INTELLIGENCE | 18
2. [LM domain expert] How do we deliver appropriate knowledge according to stakeholder needs? How do we identify visual navigation paths for each stakeholder? How do we retrieve feedback (if any) from LM users? How do we put LM knowledge into business?
As one might observe, the number of technical and statistical issues decreases as the KDD process advances, while the number of issues and challenges facing the LM expert increases. In fact, while technical specialists have the main responsibility for dealing with four of the Big Data Vs, it is up to the LM expert to address the fifth Big Data V, Value.
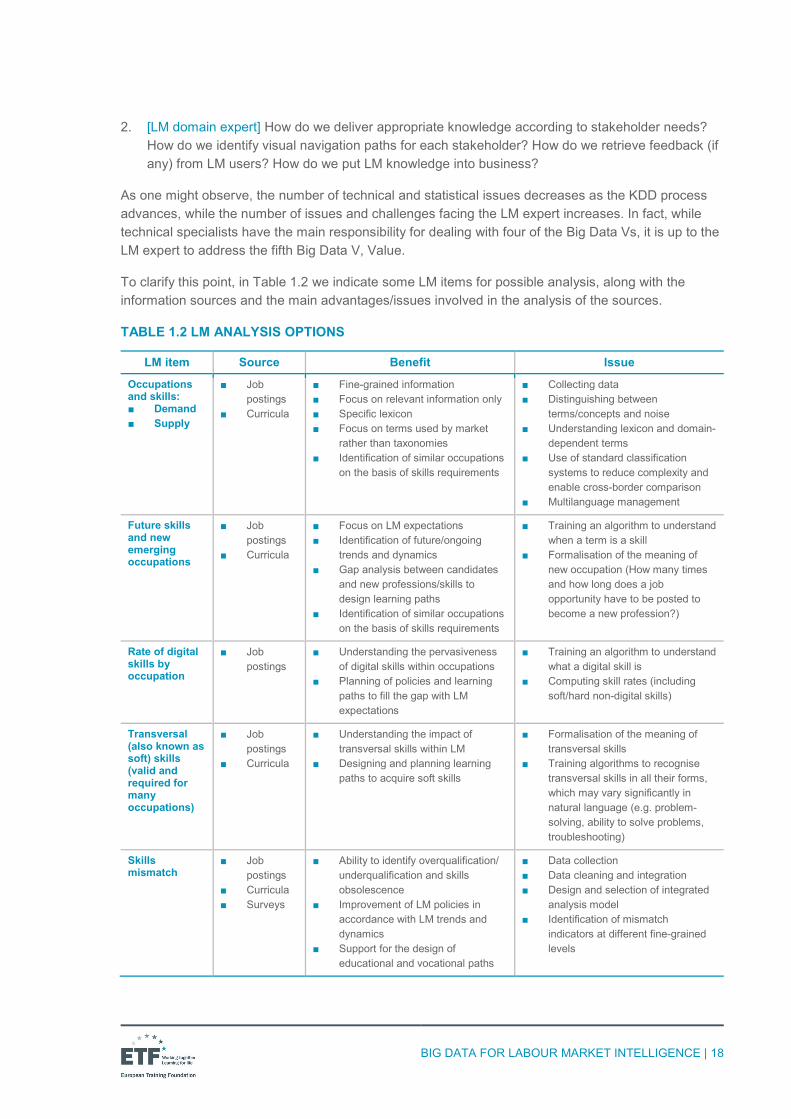
To clarify this point, in Table 1.2 we indicate some LM items for possible analysis, along with the information sources and the main advantages/issues involved in the analysis of the sources.
TABLE 1.2 LM ANALYSIS OPTIONS
LM item Source Benefit Issue
Occupations and skills: ■ Demand ■ Supply
■ Job postings
■ Curricula
■ Fine-grained information ■ Focus on relevant information only ■ Specific lexicon ■ Focus on terms used by market
rather than taxonomies ■ Identification of similar occupations
on the basis of skills requirements
■ Collecting data ■ Distinguishing between
terms/concepts and noise ■ Understanding lexicon and domain-
dependent terms ■ Use of standard classification
systems to reduce complexity and enable cross-border comparison
■ Multilanguage management
Future skills and new emerging occupations
■ Job postings
■ Curricula
■ Focus on LM expectations ■ Identification of future/ongoing
trends and dynamics ■ Gap analysis between candidates
and new professions/skills to design learning paths
■ Identification of similar occupations on the basis of skills requirements
■ Training an algorithm to understand when a term is a skill
■ Formalisation of the meaning of new occupation (How many times and how long does a job opportunity have to be posted to become a new profession?)
Rate of digital skills by occupation
■ Job postings
■ Understanding the pervasiveness of digital skills within occupations
■ Planning of policies and learning paths to fill the gap with LM expectations
■ Training an algorithm to understand what a digital skill is
■ Computing skill rates (including soft/hard non-digital skills)
Transversal (also known as soft) skills (valid and required for many occupations)
■ Job postings
■ Curricula
■ Understanding the impact of transversal skills within LM
■ Designing and planning learning paths to acquire soft skills
■ Formalisation of the meaning of transversal skills
■ Training algorithms to recognise transversal skills in all their forms, which may vary significantly in natural language (e.g. problem-solving, ability to solve problems, troubleshooting)
Skills mismatch
■ Job postings
■ Curricula ■ Surveys
■ Ability to identify overqualification/ underqualification and skills obsolescence
■ Improvement of LM policies in accordance with LM trends and dynamics
■ Support for the design of educational and vocational paths
■ Data collection ■ Data cleaning and integration ■ Design and selection of integrated
analysis model ■ Identification of mismatch
indicators at different fine-grained levels
BIG DATA FOR LABOUR MARKET INTELLIGENCE | 19
Q&A – Predictive power of Big Data
How can Big Data contribute to skills anticipation (in the short and medium term)? Which methodological aspects need to be considered, and what should be the scope and depth of analysis? Any examples of how skills anticipation has been improved by adding insights from Big Data?
Big Data is crucial for skills anticipation for two reasons. First, Big Data, such as that deriving from vacancies advertised on the internet, is the only source of detailed information about skills as an alternative tool to skills surveys, which contain only a limited set of skills that can be assessed. Second, the demand for skills may vary across occupations, sector and region. In order to track these variations, it is necessary to have very granular and detailed data that can only be obtained through Big Data.
Methodologically there are several challenges that need to be addressed. First, the data have to be linked to the occupation/sector/region. Second, the skills need to be classified into a meaningful taxonomy that can be used for the analysis. Third, a consistent time series is required to project skills changes over time.
There are several examples of the use of Big Data for skills anticipation. In the United States (US), skills extracted from vacancies advertised on the internet are used by universities to anticipate LM trends and tailor educational programmes to the needs of the LM.
Q&A
How can one successfully cooperate with statistical and state bodies that own data/registers? How can people overcome their scepticism and concerns regarding the novelties of Big Data? Are there any good examples of such cooperation?
According to our experience, the use of Big Data does not prevent the relevance nor the importance of using official statistics and surveys in analysing LM dynamics and trends for decision-making. To give an example, one of the major criticisms related to the use of Big Data is that it relies on statistical significance as Big Data should be jointly used and matched with external statistical sources (e.g. labour force surveys) with the goal to improve the ability to observe LM dynamics across a wider spectrum.
Furthermore, one should consider that the population of the internet is variable and partially observable by construction, and this makes it difficult to identify a stable sample as representative of the whole internet population. Hence, one might use official statistics to estimate the relevance of each class on the internet data collected so that classes overrepresented (or underrepresented) can be weighted accordingly.
It is worth noting that the use of internet data cannot be neglected, as these will grow in the near future; thus, the informative power that these data can provide in analysing, observing and measuring a phenomenon can provide a competitive advantage to take prompt and data-driven decisions. A recent paper discussing some initiatives related to the use of Big Data in many real-life projects has been published by Bergamaschi et al. (2016).
BIG DATA FOR LABOUR MARKET INTELLIGENCE | 20
Q&A – Data quality
We know data quality is a large and important part of data science. However, what are the main aspects and dimensions that need to be considered and taken into serious account for a Big Data project? What are the fundamental features of data quality in Big Data?
As discussed in Chapter 1, data quality evaluation and cleaning are crucial and mandatory tasks for guaranteeing the believability of any data-driven decision-making process. Not surprisingly, the veracity dimension of Big Data clearly refers to the quality issues that remain significant even in the presence of a huge amount of data. A formal and reliable list of data quality issues that are most relevant for a Big Data application does not exist yet, and this is still an open debate in academia. Indeed, some researchers think the high volume of data is enough to stem the effects (if any) of poor data quality. Others think that a strict and formal data quality approach (that estimates dimensions such as consistency, completeness, accuracy and soundness) has to be applied even in cases of huge data. The former approach ignores the fact that poor-quality data are prevalent in both large databases and on the web; the latter does not take into account the costs (in terms of both computational time and power) to evaluate quality and cleanse the data in huge data sets. That said, we think both approaches should be applied for analysis purposes.
To give an example, focusing on the collection of vacancies from internet sources, a strict and rigorous approach should be used to rank sources on the basis of source features or variables, thus evaluating consistency, accuracy and completeness (at least) for web source variables. This might include, but is not limited to:
■ typology: refers to the typology of the source, which might be recruitment agencies, national newspapers, specialised websites, or public, sectoral or company websites;
■ size: refers to the number of vacancies published on the website at the moment of the analysis; ■ update time: refers to the frequency with which the web source owner provides fresh and
updated data, along with the presence of timestamps to mark exactly when a job vacancy has been published;
■ quality of description: identifies how standardised and complete the detailed vacancies page is.
By contrast, the identification of ‘active’ job vacancies also refers to a data quality dimension (accuracy, in this case). However, given a vacancy published weeks or months ago, there is no field within a vacancy that guarantees that the vacancy is still valid (i.e. the job has not been filled yet). In such a case, a classic approach would not work as this information cannot be accessed in an automated and scalable manner (million items to be processed at a time). On the contrary, including a vacancy in the analysis regardless of its validity might have unpredictable effects on the believability of the analyses. For these reasons, one should build up a statistical model to infer the validity date for such a vacancy on the basis of the historical data related to similar vacancies (e.g. taking into account similar sources, similar positions advertised, the company that is advertising the vacancies). Such a model would guarantee that the validity dates have been evaluated according to the data set characteristics.
We refer the reader to Saha, Barna and Divesh Srivastava, ‘Data quality: The other face of big data’, 2014 IEEE 30th International Conference on Data Engineering, IEEE, 2014; and to Sadiq, Shazia and Paolo Papotti, ‘Big data quality: Whose problem is it?’, 2016 IEEE 32nd International Conference on Data Engineering (ICDE), IEEE, 2016 – two recent papers that discuss and propose a guideline to deal with data quality in Big Data applications from a methodological point of view.
BIG DATA FOR LABOUR MARKET INTELLIGENCE | 21
1.3 Literature on Big Data for LMI In the last few years, several forces and factors have dramatically changed the nature and characteristics of the LM, in both advanced and developing countries. Technical progress, globalisation and the re-organisation of production processes have radically modified demand for certain skills, intensifying the need for continuous training, especially in jobs that are highly specialised or heavily affected by digitalisation. At the same time, the availability of data is growing thanks to digitalisation, the spread of web services (including services related to the LM) and the availability of a huge number of technical solutions for dealing with Big Data. In this scenario, the number of calls for projects related to the LM is growing apace. Below we report on some examples of initiatives (European and non-European) related to Big Data and LM information/intelligence.
The EU panorama
There is growing interest in designing and implementing real LMI applications for internet LM data in order to support policy design and evaluation through evidence-based decision-making. In 2010 the European Commission published A new impetus for European cooperation in vocational education and training to support the Europe 2020 strategy [20] aimed at promoting education systems in general, and vocational education and training in particular. In 2016, the European Commission highlighted the importance of vocational and educational activities, as they are ‘valued for fostering job-specific and transversal skills, facilitating the transition into employment and maintaining and updating the skills of the workforce according to sectorial, regional, and local needs’ [21]. In 2016, the EU and Eurostat launched the ESSnet Big Data project [22], involving 22 EU Member States, with the aim of ‘integrating Big Data in the regular production of official statistics, through pilots exploring the potential of selected Big Data sources and building concrete applications’. Furthermore, in 2014 the European Centre for the Development of Vocational Training (Cedefop) agency – set up to support the development of European vocational education and training – launched a call for tenders for a feasibility study and development of a working prototype able to collect and classify job vacancies on the internet from five EU countries [23]. The rationale behind the project is to turn data extracted from job vacancies on the internet into knowledge (and thus value) for policy development and evaluation through fact-based decision-making. Given the success of the prototype, a further call for tenders has been launched for the creation of an internet-based LM monitor for the whole EU, including 28 EU Member States and all 24 languages of the Union [24].
Also worthy of mention is the LMI4All project [25], an online data portal that connects and standardises existing sources of high-quality, reliable LMI, for the purpose of informing careers decisions. The data are made freely available via APIs for use in websites and third-party applications.
Beyond the EU: non-European projects
A critical LM issue is the possibility of people losing their jobs due to the spread of automation and AI in all industrial sectors. A well-known study by [8] used machine learning trained over a sample of occupations annotated by LM experts to estimate the probability of automation for each occupation in the US, using the Standard Occupational Classification (SOC) taxonomy as a classification system.
This work laid the basis for a discussion on the risk of job losses due to automation. Several other studies followed Frey and Osborne, such as the work by [26], which studied skills to estimate the risk of automation across the 21 Organisation for Economic Cooperation and Development (OECD) countries. The Brookfield Institute for Innovation + Entrepreneurship (BII+E), with the support of the Government of Ontario, Canada, studied the real impact of AI on jobs (risk of job losses due to automation and AI) in manufacturing and in finance/insurance, using LM data, existing literature, interviews with over 50 stakeholders from the two sectors, and engagement with more than
BIG DATA FOR LABOUR MARKET INTELLIGENCE | 22
300 Ontarians through interviews, public consultations and an online survey [27]. The study by [28] for the World Economic Forum estimated the impact on the LM of automation and technological advances, using both occupations and jobs as data.
By contrast, companies need to automate human resource department activities; therefore, a growing number of commercial skill-matching products have been developed in the last few years in the EU and beyond, such as Burning Glass, Workday, Pluralsight, EmployInsight, Textkernel and Janzz. Worthy of mention is Google Job Search API, a pay-as-you-go service announced in 2016, which classifies job vacancies through the Google Machine Learning service over O*NET, the US standard occupation taxonomy.
Project/feature matrix – A comparative model to clarify which projects addressed a specific concern/challenge related to Big Data for LMI
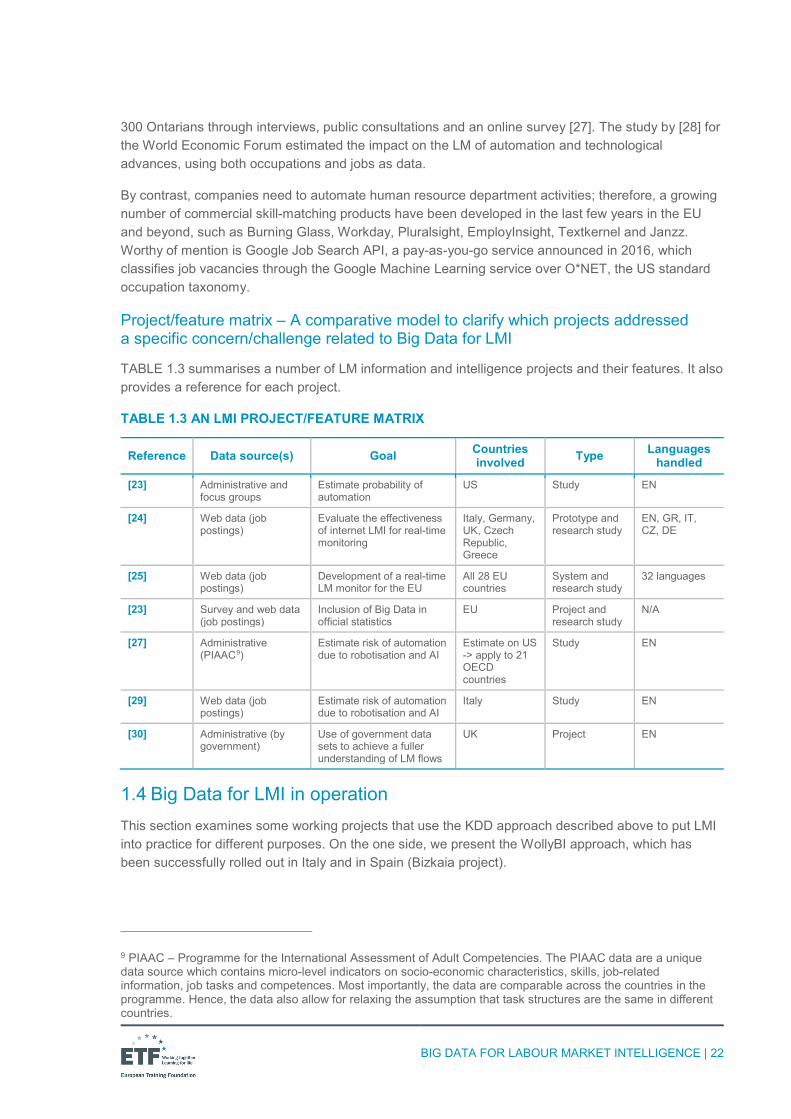
TABLE 1.3 summarises a number of LM information and intelligence projects and their features. It also provides a reference for each project.
TABLE 1.3 AN LMI PROJECT/FEATURE MATRIX
Reference Data source(s) Goal Countries involved Type Languages
handled
[23] Administrative and focus groups
Estimate probability of automation
US Study EN
[24] Web data (job postings)
Evaluate the effectiveness of internet LMI for real-time monitoring
Italy, Germany, UK, Czech Republic, Greece
Prototype and research study
EN, GR, IT, CZ, DE
[25] Web data (job postings)
Development of a real-time LM monitor for the EU
All 28 EU countries
System and research study
32 languages
[23] Survey and web data (job postings)
Inclusion of Big Data in official statistics
EU Project and research study
N/A
[27] Administrative (PIAAC9)
Estimate risk of automation due to robotisation and AI
Estimate on US -> apply to 21 OECD countries
Study EN
[29] Web data (job postings)
Estimate risk of automation due to robotisation and AI
Italy Study EN
[30] Administrative (by government)
Use of government data sets to achieve a fuller understanding of LM flows
UK Project EN
1.4 Big Data for LMI in operation This section examines some working projects that use the KDD approach described above to put LMI into practice for different purposes. On the one side, we present the WollyBI approach, which has been successfully rolled out in Italy and in Spain (Bizkaia project).
9 PIAAC – Programme for the International Assessment of Adult Competencies. The PIAAC data are a unique data source which contains micro-level indicators on socio-economic characteristics, skills, job-related information, job tasks and competences. Most importantly, the data are comparable across the countries in the programme. Hence, the data also allow for relaxing the assumption that task structures are the same in different countries.
BIG DATA FOR LABOUR MARKET INTELLIGENCE | 23
On the other side, we present the ESSnet Big Data project, an EU initiative to include LM Big Data in official LM statistics. These two applications shed light on the importance of exploiting Big Data to analyse LM dynamics and trends for a large range of stakeholders.
Other projects and initiatives will be discussed in greater depth in Chapter 3.
Real-time LM monitor: the cases of Italy and Spain
The WollyBI10 project started in early 2013 as a Software as a service (SaaS) tool11 for collecting and classifying job vacancies advertised on the internet on the International Standard Classification of Occupations/European Skills, Competences, Qualifications and Occupations (ISCO/ESCO) standard taxonomies, and extracting the most requested skills from job descriptions. It was designed to provide five distinct entry points for the user depending on their analysis purposes, namely:
■ geographical area – to find the most frequently searched occupations on the web and related skills, at a very detailed geographical level;
■ skill – to input a selection of skills and to find the most frequently searched occupations that include those skills (i.e. profile gap analysis);
■ firm – to obtain a ranking of occupations that specify a particular industry sector in the vacancy; ■ occupation – to navigate through the ISCO/ESCO classifications and to exploit the details related
to each occupation; ■ free queries (i.e. customised) – for free classic, drill-down and roll-up operations over the OLAP
cubes12.
The implementation of WollyBI closely follows the KDD approach, as illustrated in [15]. Here, we focus on the navigation paths. These vary for each stakeholder, but each entry point has been designed on the basis of the three-click rule so that results are available to the user with no more than three ‘next’ clicks.
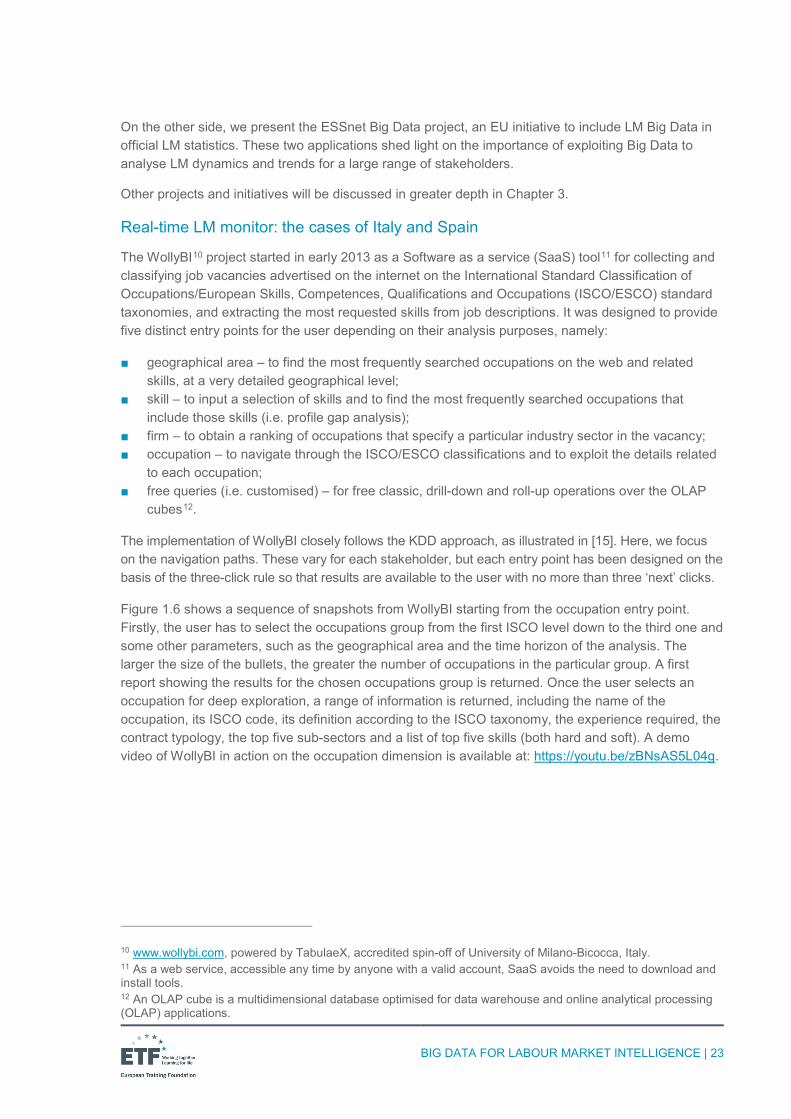
Figure 1.6 shows a sequence of snapshots from WollyBI starting from the occupation entry point. Firstly, the user has to select the occupations group from the first ISCO level down to the third one and some other parameters, such as the geographical area and the time horizon of the analysis. The larger the size of the bullets, the greater the number of occupations in the particular group. A first report showing the results for the chosen occupations group is returned. Once the user selects an occupation for deep exploration, a range of information is returned, including the name of the occupation, its ISCO code, its definition according to the ISCO taxonomy, the experience required, the contract typology, the top five sub-sectors and a list of top five skills (both hard and soft). A demo video of WollyBI in action on the occupation dimension is available at: https://youtu.be/zBNsAS5L04g.
10 www.wollybi.com, powered by TabulaeX, accredited spin-off of University of Milano-Bicocca, Italy. 11 As a web service, accessible any time by anyone with a valid account, SaaS avoids the need to download and install tools. 12 An OLAP cube is a multidimensional database optimised for data warehouse and online analytical processing (OLAP) applications.
BIG DATA FOR LABOUR MARKET INTELLIGENCE | 24
FIGURE 1.6 WOLLYBI – A SEQUENCE OF SNAPSHOTS FROM A THREE-STEP ANALYSIS OF THE OCCUPATION DIMENSION
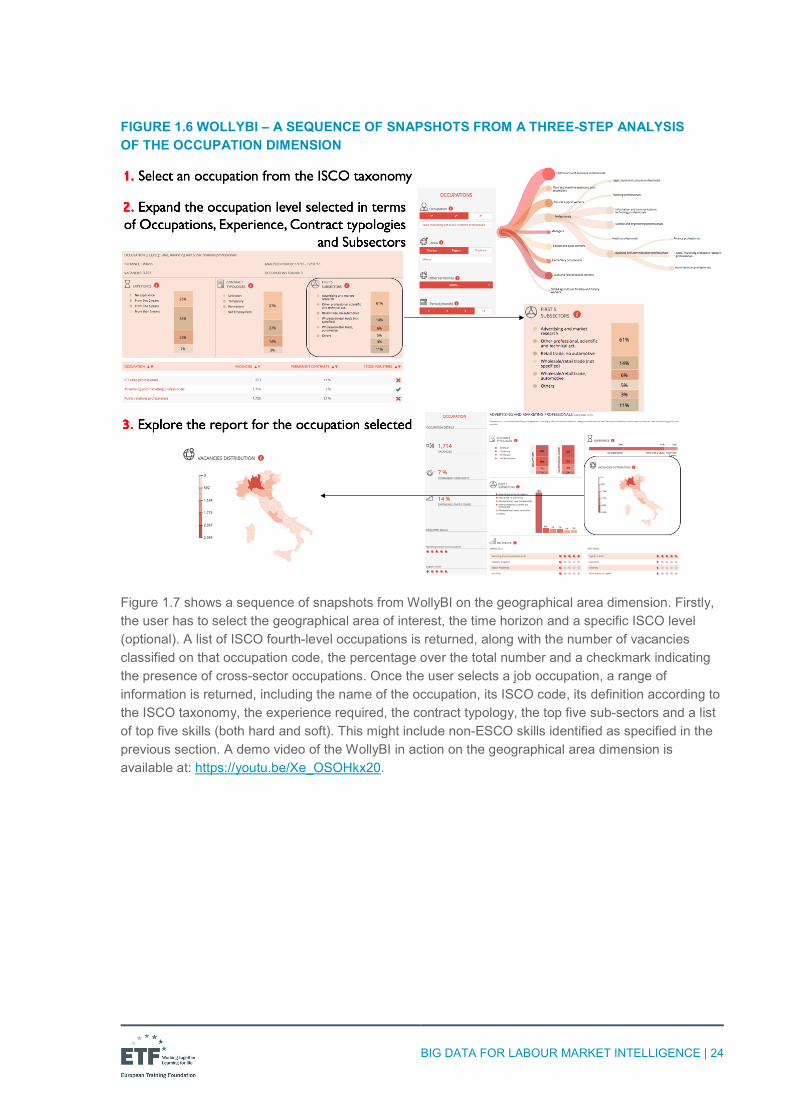
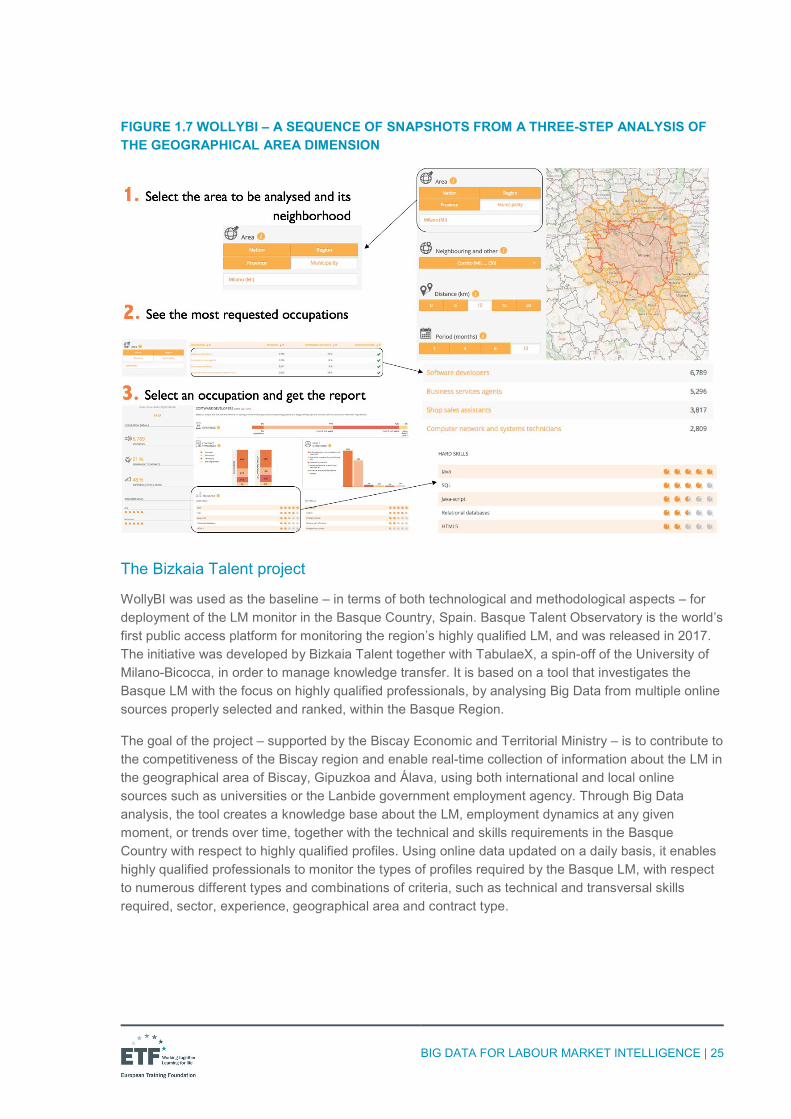
Figure 1.7 shows a sequence of snapshots from WollyBI on the geographical area dimension. Firstly, the user has to select the geographical area of interest, the time horizon and a specific ISCO level (optional). A list of ISCO fourth-level occupations is returned, along with the number of vacancies classified on that occupation code, the percentage over the total number and a checkmark indicating the presence of cross-sector occupations. Once the user selects a job occupation, a range of information is returned, including the name of the occupation, its ISCO code, its definition according to the ISCO taxonomy, the experience required, the contract typology, the top five sub-sectors and a list of top five skills (both hard and soft). This might include non-ESCO skills identified as specified in the previous section. A demo video of the WollyBI in action on the geographical area dimension is available at: https://youtu.be/Xe_OSOHkx20.
BIG DATA FOR LABOUR MARKET INTELLIGENCE | 25
FIGURE 1.7 WOLLYBI – A SEQUENCE OF SNAPSHOTS FROM A THREE-STEP ANALYSIS OF THE GEOGRAPHICAL AREA DIMENSION
The Bizkaia Talent project
WollyBI was used as the baseline – in terms of both technological and methodological aspects – for deployment of the LM monitor in the Basque Country, Spain. Basque Talent Observatory is the world’s first public access platform for monitoring the region’s highly qualified LM, and was released in 2017. The initiative was developed by Bizkaia Talent together with TabulaeX, a spin-off of the University of Milano-Bicocca, in order to manage knowledge transfer. It is based on a tool that investigates the Basque LM with the focus on highly qualified professionals, by analysing Big Data from multiple online sources properly selected and ranked, within the Basque Region.
The goal of the project – supported by the Biscay Economic and Territorial Ministry – is to contribute to the competitiveness of the Biscay region and enable real-time collection of information about the LM in the geographical area of Biscay, Gipuzkoa and Álava, using both international and local online sources such as universities or the Lanbide government employment agency. Through Big Data analysis, the tool creates a knowledge base about the LM, employment dynamics at any given moment, or trends over time, together with the technical and skills requirements in the Basque Country with respect to highly qualified profiles. Using online data updated on a daily basis, it enables highly qualified professionals to monitor the types of profiles required by the Basque LM, with respect to numerous different types and combinations of criteria, such as technical and transversal skills required, sector, experience, geographical area and contract type.
BIG DATA FOR LABOUR MARKET INTELLIGENCE | 26
The LM knowledge base has been organised over two distinct entry points, namely:
1. for citizens: a dashboard to analyse and browse information on the internet LM based on the vacancies active in the last 12 months;
2. for analysts: a dashboard that visualises data from the last 12 months, with selection of the period of interest: last month, last three months, last six months, last year. Data are collected daily and updated monthly.
The tool has been made publicly available and can be browsed by anyone at the following web address: https://basquetalentobservatory.bizkaiatalent.eus/visual/public/index#.
Further details about this project can be found in Chapter 3.
The ESSnet Big Data project
Focusing on the statistical perspective of Big Data analysis for LMI, Eurostat – the official statistics office of the EU – has launched a project named ESSnet Big Data aimed at integrating Big Data about LM information in the regular production of official statistics, using pilots to explore the potential of selected Big Data sources and build concrete applications [23].
The project – launched in late 2016 – is composed of 22 EU partners and closely follows the KDD approach to collect data from previously ranked web portals, and clean and transform the data for classification according to standard taxonomies. Worthy of note here is the important role played by the representativeness of Big Data, as the participants intend to evaluate the ability of Big Data to be representative of the whole population (or a stratified sample) for inclusion in official EU statistics. As far as we know, this is the first public initiative that aims to include LM Big Data (job vacancies for example) in official statistics, as this will shed light on the underlying information disclosed by web sources, which needs to be properly extracted and processed to produce LM knowledge of use to decision-makers and LM specialists.

BIG DATA FOR LABOUR MARKET INTELLIGENCE | 27
Q&A
Who are the users of these platforms?
The users have to be correctly identified at the beginning of the system design so that the knowledge can be organised according to user needs and ability to understand the data. For example, WollyBI uses the same knowledge for separate types of stakeholders: employment agencies, business associations and unions, government employment agencies, schools and training organisations. Bizkaia Talent is designed for both citizens and analysts, while the ESSnet project is intended for LM specialists and analysts as a whole.
What is the update frequency of these LM tools?
Update frequency should be decided in relation to three elements: (i) updating of sources, (ii) the cost in terms of the computing power needed to perform the update, and (iii) stakeholder needs. Usually, weekly updates are appropriate for analysis purposes.
To what extent is the KDD process deployed by these platforms automated (AI 100%, AI 70%, AI 40% ...)?
Human effort decreases as the KDD process proceeds. Significant effort is required in source identification and ranking, as well as in identification of business needs and selection of good AI algorithms and the corresponding tuning parameters. Once these activities have been completed, the system runs autonomously, with periodical maintenance activities. For example, data scraping requires greater maintenance as the website might change in an unpredictable way, whereas having an agreement with the data owner prevents this issue and simplifies scraping. Also, the use of cloud computing to realise a Big Data solution drastically reduces the risks and costs associated with breakdowns, but it could prove costly if the workload (e.g. users or processing per unit of time) grows significantly. In this respect, the realisation of a Big Data LMIS is a human-in-the-loop approach, especially in the early stages. Experience is a crucial skill that can reduce both cost and human effort.
BIG DATA FOR LABOUR MARKET INTELLIGENCE | 28
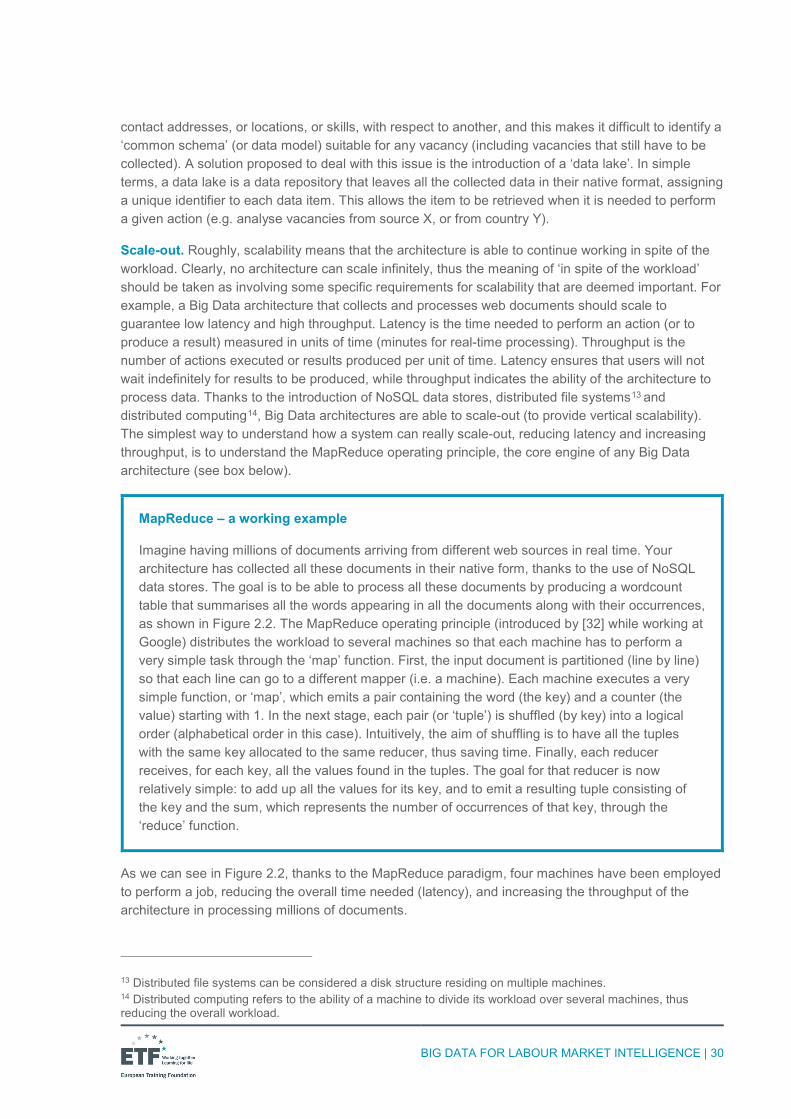
2. INCORPORATING BIG DATA ANALYTICS IN LMI: SYSTEMATIC STEPS
In this chapter we introduce the main building blocks needed to develop a Big Data architecture for LMI, and examine some important necessary (pre-)conditions: where to start, what to consider, phases and main steps using the KDD approach discussed earlier as a guideline.
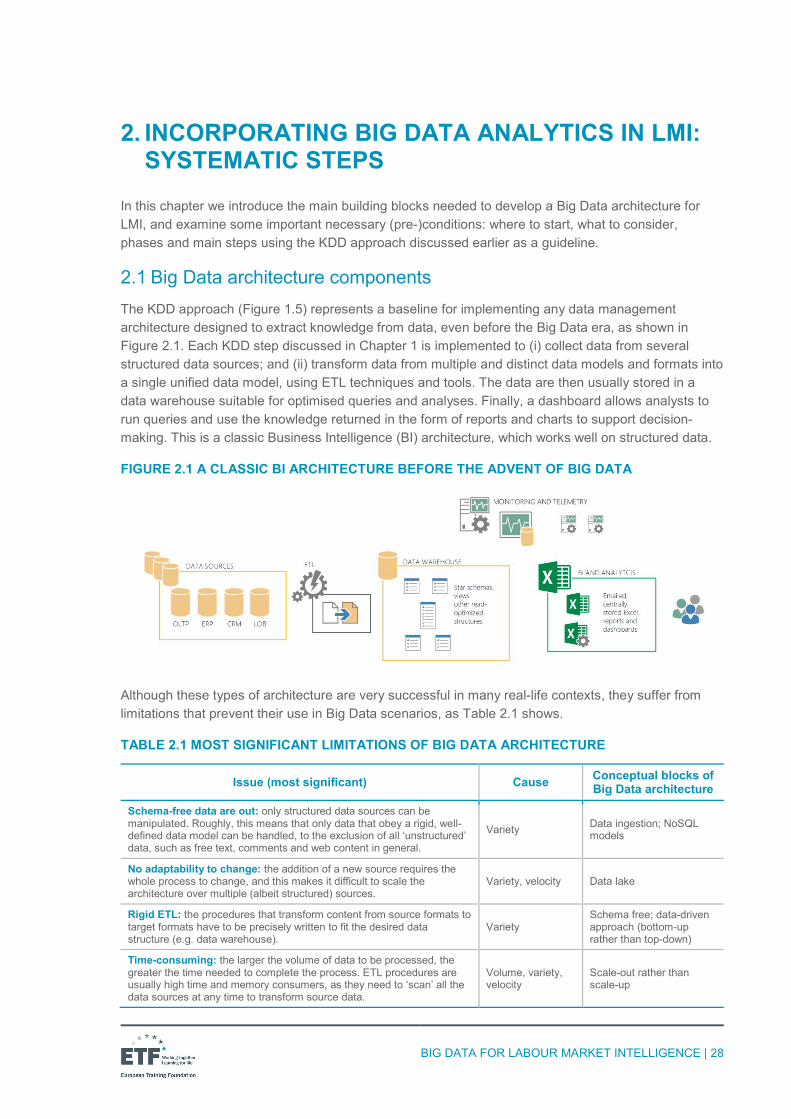
2.1 Big Data architecture components The KDD approach (Figure 1.5) represents a baseline for implementing any data management architecture designed to extract knowledge from data, even before the Big Data era, as shown in Figure 2.1. Each KDD step discussed in Chapter 1 is implemented to (i) collect data from several structured data sources; and (ii) transform data from multiple and distinct data models and formats into a single unified data model, using ETL techniques and tools. The data are then usually stored in a data warehouse suitable for optimised queries and analyses. Finally, a dashboard allows analysts to run queries and use the knowledge returned in the form of reports and charts to support decision-making. This is a classic Business Intelligence (BI) architecture, which works well on structured data.
FIGURE 2.1 A CLASSIC BI ARCHITECTURE BEFORE THE ADVENT OF BIG DATA
Although these types of architecture are very successful in many real-life contexts, they suffer from limitations that prevent their use in Big Data scenarios, as Table 2.1 shows.
TABLE 2.1 MOST SIGNIFICANT LIMITATIONS OF BIG DATA ARCHITECTURE
Issue (most significant) Cause Conceptual blocks of Big Data architecture
Schema-free data are out: only structured data sources can be manipulated. Roughly, this means that only data that obey a rigid, well-defined data model can be handled, to the exclusion of all ‘unstructured’ data, such as free text, comments and web content in general.
Variety Data ingestion; NoSQL models
No adaptability to change: the addition of a new source requires the whole process to change, and this makes it difficult to scale the architecture over multiple (albeit structured) sources.
Variety, velocity Data lake
Rigid ETL: the procedures that transform content from source formats to target formats have to be precisely written to fit the desired data structure (e.g. data warehouse).
Variety Schema free; data-driven approach (bottom-up rather than top-down)
Time-consuming: the larger the volume of data to be processed, the greater the time needed to complete the process. ETL procedures are usually high time and memory consumers, as they need to ‘scan’ all the data sources at any time to transform source data.
Volume, variety, velocity
Scale-out rather than scale-up
BIG DATA FOR LABOUR MARKET INTELLIGENCE | 29
Table 2.1 shows some of the key issues that prevent use of classic BI architectures in the Big Data scenario, mainly relating to one or more Big Data dimensions (the Vs of the Big Data model discussed in Chapter 1). Great efforts have been made in recent years by both academia and practitioners to identify paradigms, models and tools suitable for a Big Data scenario.
Here, we introduce some conceptual blocks that the reader should know for a better understanding of how a Big Data architecture works: data ingestion, NoSQL models, data lake, and scale-out. Then, we discuss how these blocks could work together to realise a Big Data architecture for LMI. Clearly, there are a plethora of solutions and tools, as the Big Data ecosystem continues to expand and evolve.
Data ingestion. This term refers to the process of collecting data from several sources in an automated way. It can be run in real time (each data item is collected as it is emitted by the source) or through a batch process (data items are collected in discrete chunks at regular intervals). Furthermore, data from a single source may be collected using three distinct approaches: API, crawling or scraping.
■ API – as noted in Chapter 1 – stands for application programming interface, a software component exposed by the source owner to any programmer to enable data collection (e.g. Twitter, Facebook). The collection process is controlled by the data owner, who also decides what data can be emitted, as well as the data structure.
■ Crawling is a software activity that automatically indexes all the contents of a web page and adds them to a database. It iteratively follows all the hyperlinks included in the page and also indexes that data to the database (including images, tables and style sheets). A classic example of crawling is the search activity performed by Google.
■ Scraping is a two-step software activity. First, it automatically requests a web page, then it collects only a limited amount of information from the page, leaving out the remaining data. This means that a scraper (partially) knows the website structure so that it can identify only the content of interest for the analysis. For example, a web crawler might download all the products listed on an e-commerce website, while a scraper might collect only the product names and prices, leaving out links to banners, comments and metadata related to the page layout.
NoSQL models. In recent years the NoSQL movement has brought to the fore new data model paradigms that differ significantly with respect to the classic relational model at the basis of any BI architecture. Four NoSQL data store paradigms have ultimately emerged (i.e. key values, document databases, column-oriented databases and graph databases). All these new paradigms share some interesting features compared with the classic relational model (see, e.g. [31]), such as a flexible schema that can always evolve to fit the data, the ability to horizontally scale with ease, and native support for sharing. For these reasons, these paradigms have become a common backbone of any Big Data architecture, as they allow data to be stored in their native form. Intuitively, a relational database can be considered as a set of tables that can be navigated by identifiers (aka IDs). Clearly, the number of columns in a given table is fixed and defined a priori. In NoSQL data stores, by contrast, the number of columns can vary for each row of each table, enabling any kind of data item to be stored, irrespective of its structure, as the schema is free to evolve with the data.
Data lake. The storing of unstructured data, such as free text or web content in general, prevents the design of a unified schema model. More precisely, the schema of unstructured data is free to change and evolve over time. For example, imagine a processing task where one million job advertisements written as free text are to be organised over the columns of a common spreadsheet. The challenge here is to identify a ‘model’ that fits all the information that can be extracted from the vacancies. Clearly, the schema can vary as the vacancy schema varies. One vacancy might contain multiple
BIG DATA FOR LABOUR MARKET INTELLIGENCE | 30
contact addresses, or locations, or skills, with respect to another, and this makes it difficult to identify a ‘common schema’ (or data model) suitable for any vacancy (including vacancies that still have to be collected). A solution proposed to deal with this issue is the introduction of a ‘data lake’. In simple terms, a data lake is a data repository that leaves all the collected data in their native format, assigning a unique identifier to each data item. This allows the item to be retrieved when it is needed to perform a given action (e.g. analyse vacancies from source X, or from country Y).
Scale-out. Roughly, scalability means that the architecture is able to continue working in spite of the workload. Clearly, no architecture can scale infinitely, thus the meaning of ‘in spite of the workload’ should be taken as involving some specific requirements for scalability that are deemed important. For example, a Big Data architecture that collects and processes web documents should scale to guarantee low latency and high throughput. Latency is the time needed to perform an action (or to produce a result) measured in units of time (minutes for real-time processing). Throughput is the number of actions executed or results produced per unit of time. Latency ensures that users will not wait indefinitely for results to be produced, while throughput indicates the ability of the architecture to process data. Thanks to the introduction of NoSQL data stores, distributed file systems13 and distributed computing14, Big Data architectures are able to scale-out (to provide vertical scalability). The simplest way to understand how a system can really scale-out, reducing latency and increasing throughput, is to understand the MapReduce operating principle, the core engine of any Big Data architecture (see box below).
MapReduce – a working example
Imagine having millions of documents arriving from different web sources in real time. Your architecture has collected all these documents in their native form, thanks to the use of NoSQL data stores. The goal is to be able to process all these documents by producing a wordcount table that summarises all the words appearing in all the documents along with their occurrences, as shown in Figure 2.2. The MapReduce operating principle (introduced by [32] while working at Google) distributes the workload to several machines so that each machine has to perform a very simple task through the ‘map’ function. First, the input document is partitioned (line by line) so that each line can go to a different mapper (i.e. a machine). Each machine executes a very simple function, or ‘map’, which emits a pair containing the word (the key) and a counter (the value) starting with 1. In the next stage, each pair (or ‘tuple’) is shuffled (by key) into a logical order (alphabetical order in this case). Intuitively, the aim of shuffling is to have all the tuples with the same key allocated to the same reducer, thus saving time. Finally, each reducer receives, for each key, all the values found in the tuples. The goal for that reducer is now relatively simple: to add up all the values for its key, and to emit a resulting tuple consisting of the key and the sum, which represents the number of occurrences of that key, through the ‘reduce’ function.
As we can see in Figure 2.2, thanks to the MapReduce paradigm, four machines have been employed to perform a job, reducing the overall time needed (latency), and increasing the throughput of the architecture in processing millions of documents.
13 Distributed file systems can be considered a disk structure residing on multiple machines. 14 Distributed computing refers to the ability of a machine to divide its workload over several machines, thus reducing the overall workload.
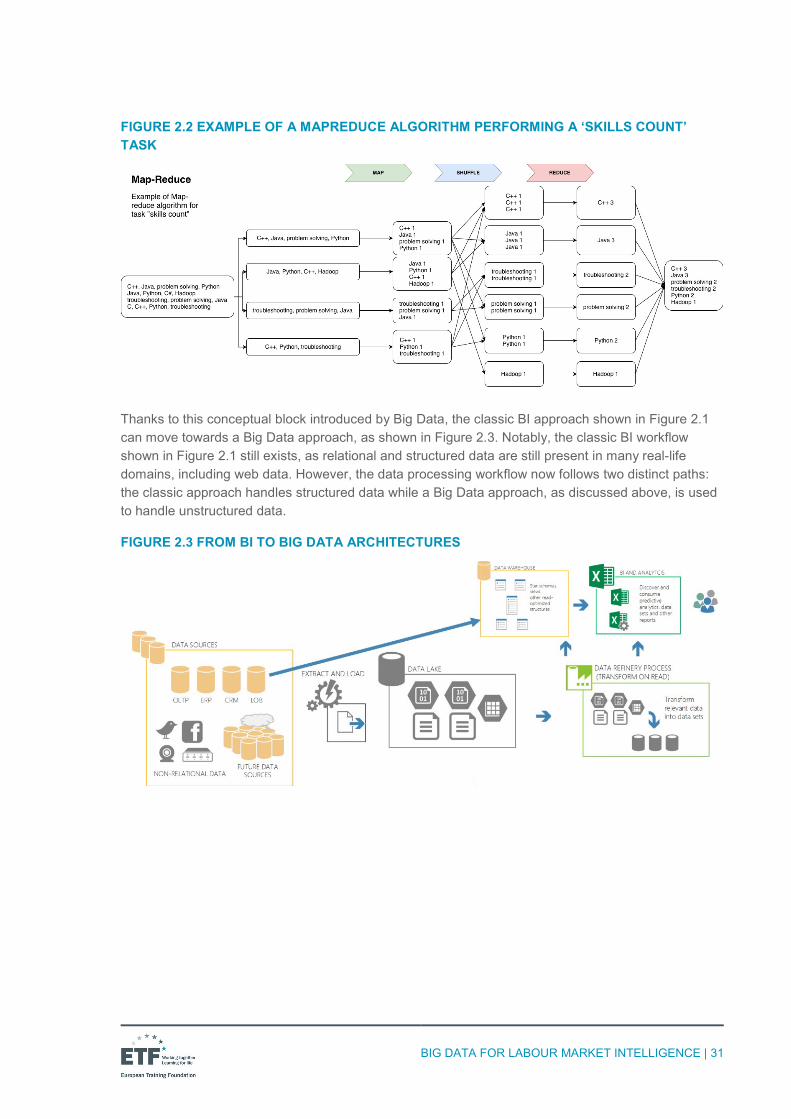
BIG DATA FOR LABOUR MARKET INTELLIGENCE | 31
FIGURE 2.2 EXAMPLE OF A MAPREDUCE ALGORITHM PERFORMING A ‘SKILLS COUNT’ TASK
Thanks to this conceptual block introduced by Big Data, the classic BI approach shown in Figure 2.1 can move towards a Big Data approach, as shown in Figure 2.3. Notably, the classic BI workflow shown in Figure 2.1 still exists, as relational and structured data are still present in many real-life domains, including web data. However, the data processing workflow now follows two distinct paths: the classic approach handles structured data while a Big Data approach, as discussed above, is used to handle unstructured data.
FIGURE 2.3 FROM BI TO BIG DATA ARCHITECTURES
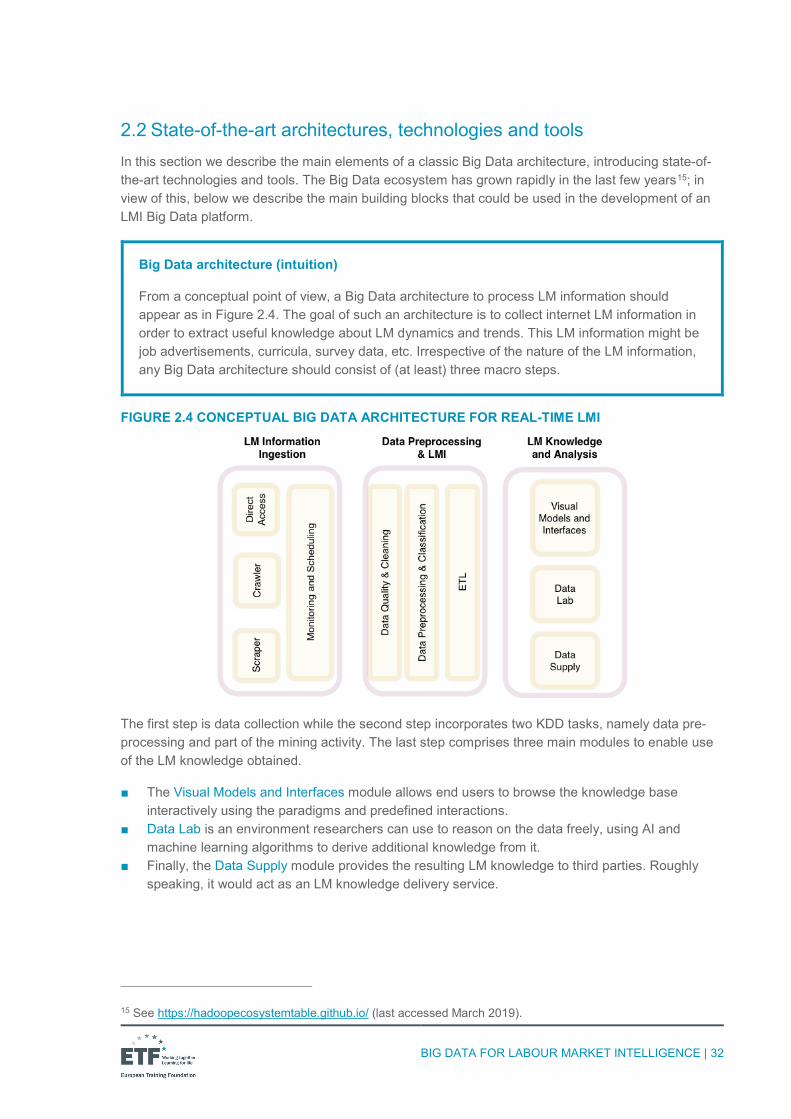
BIG DATA FOR LABOUR MARKET INTELLIGENCE | 32
2.2 State-of-the-art architectures, technologies and tools In this section we describe the main elements of a classic Big Data architecture, introducing state-of-the-art technologies and tools. The Big Data ecosystem has grown rapidly in the last few years15; in view of this, below we describe the main building blocks that could be used in the development of an LMI Big Data platform.
Big Data architecture (intuition)
From a conceptual point of view, a Big Data architecture to process LM information should appear as in Figure 2.4. The goal of such an architecture is to collect internet LM information in order to extract useful knowledge about LM dynamics and trends. This LM information might be job advertisements, curricula, survey data, etc. Irrespective of the nature of the LM information, any Big Data architecture should consist of (at least) three macro steps.
FIGURE 2.4 CONCEPTUAL BIG DATA ARCHITECTURE FOR REAL-TIME LMI
The first step is data collection while the second step incorporates two KDD tasks, namely data pre-processing and part of the mining activity. The last step comprises three main modules to enable use of the LM knowledge obtained.
■ The Visual Models and Interfaces module allows end users to browse the knowledge base interactively using the paradigms and predefined interactions.
■ Data Lab is an environment researchers can use to reason on the data freely, using AI and machine learning algorithms to derive additional knowledge from it.
■ Finally, the Data Supply module provides the resulting LM knowledge to third parties. Roughly speaking, it would act as an LM knowledge delivery service.
15 See https://hadoopecosystemtable.github.io/ (last accessed March 2019).
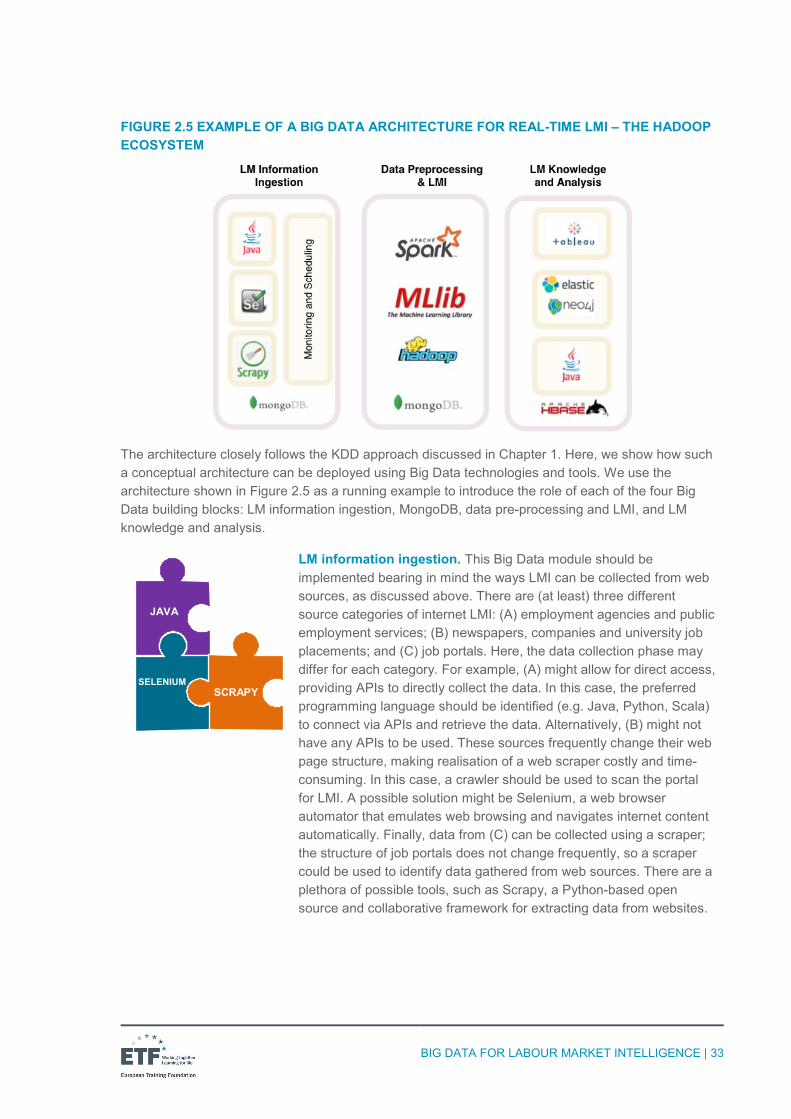
BIG DATA FOR LABOUR MARKET INTELLIGENCE | 33
FIGURE 2.5 EXAMPLE OF A BIG DATA ARCHITECTURE FOR REAL-TIME LMI – THE HADOOP ECOSYSTEM
The architecture closely follows the KDD approach discussed in Chapter 1. Here, we show how such a conceptual architecture can be deployed using Big Data technologies and tools. We use the architecture shown in Figure 2.5 as a running example to introduce the role of each of the four Big Data building blocks: LM information ingestion, MongoDB, data pre-processing and LMI, and LM knowledge and analysis.
LM information ingestion. This Big Data module should be implemented bearing in mind the ways LMI can be collected from web sources, as discussed above. There are (at least) three different source categories of internet LMI: (A) employment agencies and public employment services; (B) newspapers, companies and university job placements; and (C) job portals. Here, the data collection phase may differ for each category. For example, (A) might allow for direct access, providing APIs to directly collect the data. In this case, the preferred programming language should be identified (e.g. Java, Python, Scala) to connect via APIs and retrieve the data. Alternatively, (B) might not have any APIs to be used. These sources frequently change their web page structure, making realisation of a web scraper costly and time-consuming. In this case, a crawler should be used to scan the portal for LMI. A possible solution might be Selenium, a web browser automator that emulates web browsing and navigates internet content automatically. Finally, data from (C) can be collected using a scraper; the structure of job portals does not change frequently, so a scraper could be used to identify data gathered from web sources. There are a plethora of possible tools, such as Scrapy, a Python-based open source and collaborative framework for extracting data from websites.
JAVA
SELENIUM SCRAPY
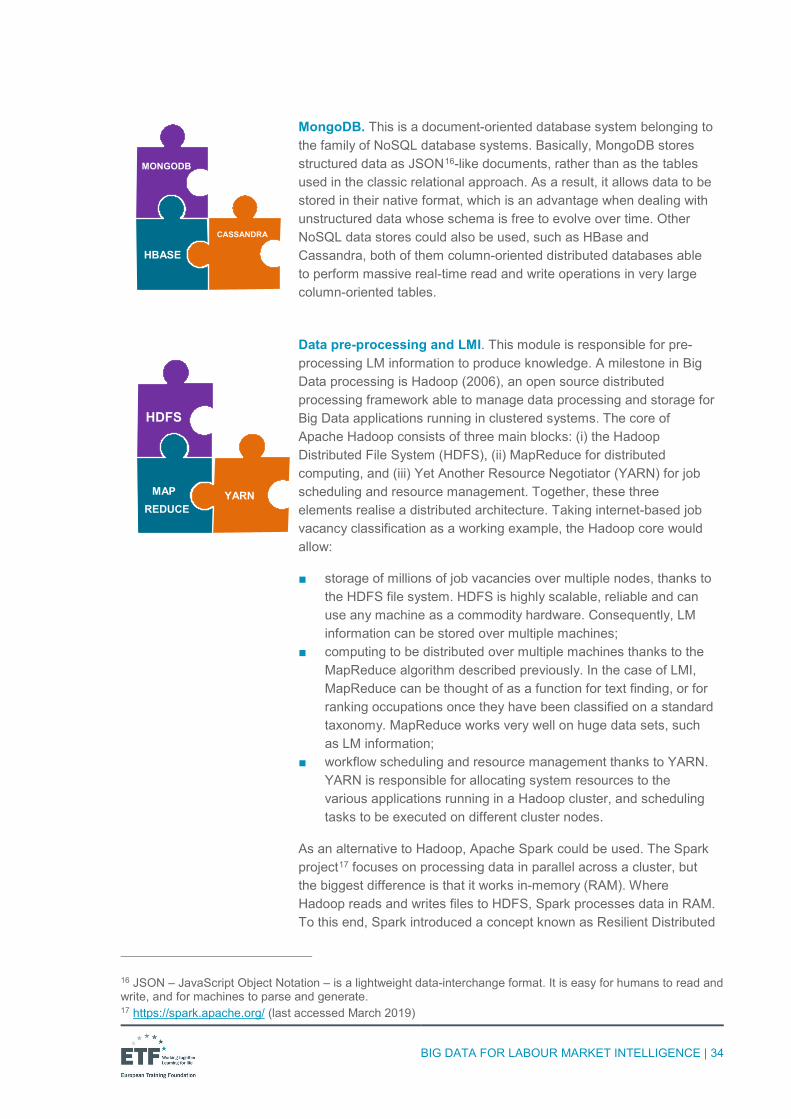
BIG DATA FOR LABOUR MARKET INTELLIGENCE | 34
MongoDB. This is a document-oriented database system belonging to the family of NoSQL database systems. Basically, MongoDB stores structured data as JSON16-like documents, rather than as the tables used in the classic relational approach. As a result, it allows data to be stored in their native format, which is an advantage when dealing with unstructured data whose schema is free to evolve over time. Other NoSQL data stores could also be used, such as HBase and Cassandra, both of them column-oriented distributed databases able to perform massive real-time read and write operations in very large column-oriented tables.
Data pre-processing and LMI. This module is responsible for pre-processing LM information to produce knowledge. A milestone in Big Data processing is Hadoop (2006), an open source distributed processing framework able to manage data processing and storage for Big Data applications running in clustered systems. The core of Apache Hadoop consists of three main blocks: (i) the Hadoop Distributed File System (HDFS), (ii) MapReduce for distributed computing, and (iii) Yet Another Resource Negotiator (YARN) for job scheduling and resource management. Together, these three elements realise a distributed architecture. Taking internet-based job vacancy classification as a working example, the Hadoop core would allow:
■ storage of millions of job vacancies over multiple nodes, thanks to the HDFS file system. HDFS is highly scalable, reliable and can use any machine as a commodity hardware. Consequently, LM information can be stored over multiple machines;
■ computing to be distributed over multiple machines thanks to the MapReduce algorithm described previously. In the case of LMI, MapReduce can be thought of as a function for text finding, or for ranking occupations once they have been classified on a standard taxonomy. MapReduce works very well on huge data sets, such as LM information;
■ workflow scheduling and resource management thanks to YARN. YARN is responsible for allocating system resources to the various applications running in a Hadoop cluster, and scheduling tasks to be executed on different cluster nodes.
As an alternative to Hadoop, Apache Spark could be used. The Spark project17 focuses on processing data in parallel across a cluster, but the biggest difference is that it works in-memory (RAM). Where Hadoop reads and writes files to HDFS, Spark processes data in RAM. To this end, Spark introduced a concept known as Resilient Distributed
16 JSON – JavaScript Object Notation – is a lightweight data-interchange format. It is easy for humans to read and write, and for machines to parse and generate. 17 https://spark.apache.org/ (last accessed March 2019)
MONGODB
HBASE
CASSANDRA
HDFS
MAP REDUCE
YARN
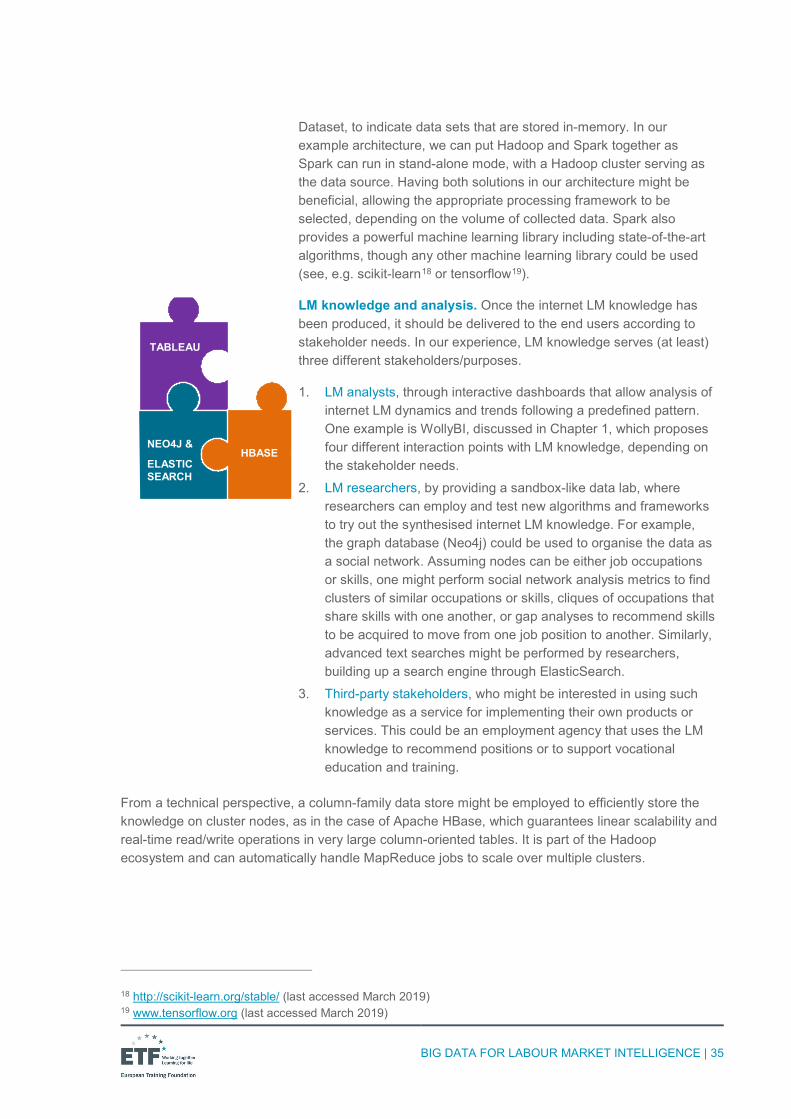
BIG DATA FOR LABOUR MARKET INTELLIGENCE | 35
Dataset, to indicate data sets that are stored in-memory. In our example architecture, we can put Hadoop and Spark together as Spark can run in stand-alone mode, with a Hadoop cluster serving as the data source. Having both solutions in our architecture might be beneficial, allowing the appropriate processing framework to be selected, depending on the volume of collected data. Spark also provides a powerful machine learning library including state-of-the-art algorithms, though any other machine learning library could be used (see, e.g. scikit-learn18 or tensorflow19).
LM knowledge and analysis. Once the internet LM knowledge has been produced, it should be delivered to the end users according to stakeholder needs. In our experience, LM knowledge serves (at least) three different stakeholders/purposes.
1. LM analysts, through interactive dashboards that allow analysis of internet LM dynamics and trends following a predefined pattern. One example is WollyBI, discussed in Chapter 1, which proposes four different interaction points with LM knowledge, depending on the stakeholder needs.
2. LM researchers, by providing a sandbox-like data lab, where researchers can employ and test new algorithms and frameworks to try out the synthesised internet LM knowledge. For example, the graph database (Neo4j) could be used to organise the data as a social network. Assuming nodes can be either job occupations or skills, one might perform social network analysis metrics to find clusters of similar occupations or skills, cliques of occupations that share skills with one another, or gap analyses to recommend skills to be acquired to move from one job position to another. Similarly, advanced text searches might be performed by researchers, building up a search engine through ElasticSearch.
3. Third-party stakeholders, who might be interested in using such knowledge as a service for implementing their own products or services. This could be an employment agency that uses the LM knowledge to recommend positions or to support vocational education and training.
From a technical perspective, a column-family data store might be employed to efficiently store the knowledge on cluster nodes, as in the case of Apache HBase, which guarantees linear scalability and real-time read/write operations in very large column-oriented tables. It is part of the Hadoop ecosystem and can automatically handle MapReduce jobs to scale over multiple clusters.
18 http://scikit-learn.org/stable/ (last accessed March 2019) 19 www.tensorflow.org (last accessed March 2019)
TABLEAU
NEO4J &
ELASTIC SEARCH
HBASE
BIG DATA FOR LABOUR MARKET INTELLIGENCE | 36
2.3 The role of AI for LMI: algorithms and frameworks to reason with LM data
AI is a term referring to simulated intelligence in machines. Although the definition of AI has been changing over time, a good explanation was recently provided by the European Commission, which defined AI as ‘systems that display intelligent behaviour by analysing their environment and taking actions – with some degree of autonomy – to achieve specific goals20. This definition also applies to LMI, as AI algorithms (e.g. classification, prediction, regression and clustering) can be employed to search for patterns of interest in a particular representational form, depending on the purpose of the analysis. More specifically, as LM information is frequently characterised by text, AI algorithms that work on texts to derive knowledge are quite useful for this purpose.
Supervised vs unsupervised learning
In the context of machine learning, it is useful here to distinguish between supervised and unsupervised learning. Informally speaking, supervised learning refers to algorithms that learn to approximate a generic function Y=f(x1,…,xn) through a training process so that when a new input data item (x1,…,xn) arrives, the system can predict the corresponding output variables Y. Clearly, the training phase has to let the system know the Y for each input data item (x1,…,xn). This means that supervised learning can only be applied when such a target function is available within the data.
Unsupervised learning refers to algorithms where there is no information about the corresponding Y value for each input data item (x1,…,xn). Hence, the goal for unsupervised learning is to find the underlying structure or distribution in the data in order to learn more about the data.
An extended review of AI algorithms falls outside the scope of this paper (the reader is referred to [33] for an introduction to machine learning models). For this reason, here we show how customised AI algorithms and pipelines can be used on LM information to derive further knowledge through a two-step real-life example. In the first step, AI algorithms (supervised learning) are used to classify job vacancies advertised on the internet on SOC systems (as shown in [29]). In the second step, AI algorithms (topic modelling) are employed in a human-in-the-loop framework to extract new emerging occupations and to derive the job occupation profile accordingly (see [34]).
Text categorisation via machine learning [supervised]. A representative AI task for LMI relies on the classification of job vacancies over a standard taxonomy of occupations and skills. Although there are several LM taxonomies (e.g. ISCO, O*NET, SOC), in this example we show how the classification of job vacancies can be expressed in terms of text classification. More specifically, in the context of LMI, it usually requires the use of text classification algorithms (ontology-based, machine learning-based, etc.) to build a classification function that maps a data item into one of several predefined classes. Notably, items are represented by job offers posted on the internet, while the predefined classes are taken from a taxonomy (e.g. a proprietary taxonomy or a public taxonomy, such as ESCO or O*NET, as shown in the box). Therefore, the task of job vacancy classification can be formally described in terms of text categorisation.
20 European Commission, Artificial Intelligence for Europe, COM(2018) 237. Last accessed March 2019 at: https://eur-lex.europa.eu/legal-content/EN/TXT/?uri=COM%3A2018%3A237%3AFIN
BIG DATA FOR LABOUR MARKET INTELLIGENCE | 37
ESCO taxonomy
ESCO is a multilingual classification system for European skills, competences, qualifications and occupations, developed by the European Commission. The ESCO occupation classification corresponds to the International Standard Classification of Occupations (ISCO-08) up to the fourth-digit level. It then extends ISCO through an additional level of occupations and skills, organised as a graph rather than a tree (i.e. a skill may belong to multiple occupations).
Text categorisation aims at assigning a Boolean value to each pair (dj,ci) ∈ D×C, where D is a set of documents and C a set of predefined categories. A true value assigned to (dj,ci) indicates document dj to be set under category ci, while a false value indicates dj cannot be assigned under ci. In the LMI scenario, a set of job vacancies J can be seen as a collection of documents, each of which has to be assigned to one (and only one) occupation code in the taxonomy. Hence, classifying a job vacancy over a classification system means assigning one occupation code to a job vacancy. This text categorisation task can be solved through machine learning, as specified in [35]. Formally speaking, let J = {J1,...,Jn} be a set of job vacancies, the classification of J under the taxonomy consists of |O| independent problems of classifying each job vacancy under a given taxonomy occupation code oi for i = 1,...,|O|. Then, a classifier is a function ψ : J ×O → {0,1} that approximates an unknown target function ψ’ : J × O → {0,1}. Clearly, as this case requires dealing with a single-label classifier ∀ j ∈ J, the following constraint must hold: ∑ o∈O ψ(j,o) = 1.
Once the internet-based job vacancy classification task has been modelled in terms of text categorisation, any machine learning algorithm can be used to train the classifier, whose effectiveness can be assessed using a variety of metrics. Clearly, the classifier may work more effectively on some classes rather than others.
This is the case shown in Figure 2.6, where a machine learning classifier (a support vector machine in this case) was trained over a set of more than 60 000 job vacancies. The F1-score21 is reported for each ISCO first level. The box-plot22 shows the distribution of the accuracy value for the best machine learning algorithm (i.e. SVM linear) over the nine ISCO groups. In this way, the effectiveness of each classification algorithm can be investigated over a specific group of occupations. Although the SVM linear classifier reached an overall accuracy of 0.9, its performance varies as the first ISCO digit varies. These characteristics of machine learning algorithms should be carefully considered and evaluated during assessment of any applications that use or employ automated learning to support decision-making.
21 The F1-score (also F-score or F-measure) is one of the most widely used measures to evaluate the accuracy of a classifier on a test data set. 22 Box-plot is a well-known statistical technique used in exploratory data analysis to visually identify patterns that may otherwise be hidden in a data set, by measuring variation changes between different groups of data. The box indicates the positions of the upper and lower quartiles respectively; the box content indicates the median value, which is the area between the upper and lower quartiles and consists of 50% of the distribution. The vertical lines (also known as whiskers) extend beyond the extremes of the distribution indicating either minimum or maximum values in the data set. Finally, dots are used to represent upper and lower outliers, namely data items that lie more (less) than 3/2 times the upper (lower) quartile respectively.
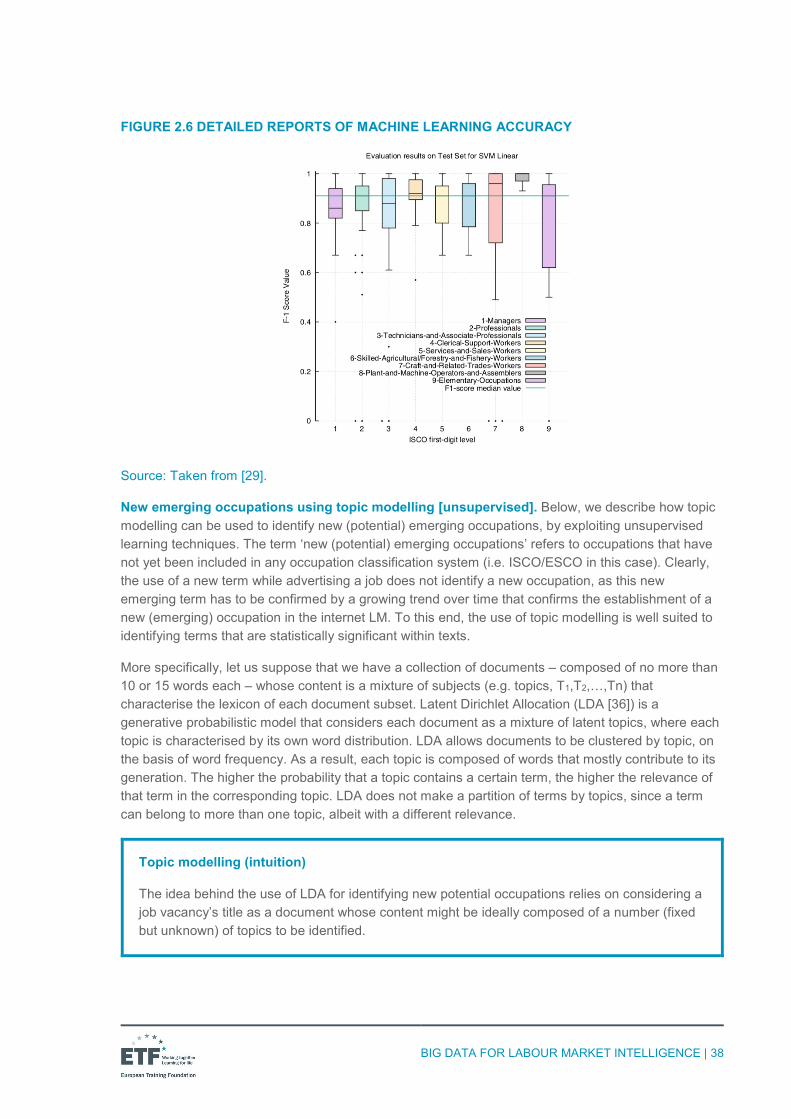
BIG DATA FOR LABOUR MARKET INTELLIGENCE | 38
FIGURE 2.6 DETAILED REPORTS OF MACHINE LEARNING ACCURACY
Source: Taken from [29].
New emerging occupations using topic modelling [unsupervised]. Below, we describe how topic modelling can be used to identify new (potential) emerging occupations, by exploiting unsupervised learning techniques. The term ‘new (potential) emerging occupations’ refers to occupations that have not yet been included in any occupation classification system (i.e. ISCO/ESCO in this case). Clearly, the use of a new term while advertising a job does not identify a new occupation, as this new emerging term has to be confirmed by a growing trend over time that confirms the establishment of a new (emerging) occupation in the internet LM. To this end, the use of topic modelling is well suited to identifying terms that are statistically significant within texts.
More specifically, let us suppose that we have a collection of documents – composed of no more than 10 or 15 words each – whose content is a mixture of subjects (e.g. topics, T1,T2,…,Tn) that characterise the lexicon of each document subset. Latent Dirichlet Allocation (LDA [36]) is a generative probabilistic model that considers each document as a mixture of latent topics, where each topic is characterised by its own word distribution. LDA allows documents to be clustered by topic, on the basis of word frequency. As a result, each topic is composed of words that mostly contribute to its generation. The higher the probability that a topic contains a certain term, the higher the relevance of that term in the corresponding topic. LDA does not make a partition of terms by topics, since a term can belong to more than one topic, albeit with a different relevance.
Topic modelling (intuition)
The idea behind the use of LDA for identifying new potential occupations relies on considering a job vacancy’s title as a document whose content might be ideally composed of a number (fixed but unknown) of topics to be identified.
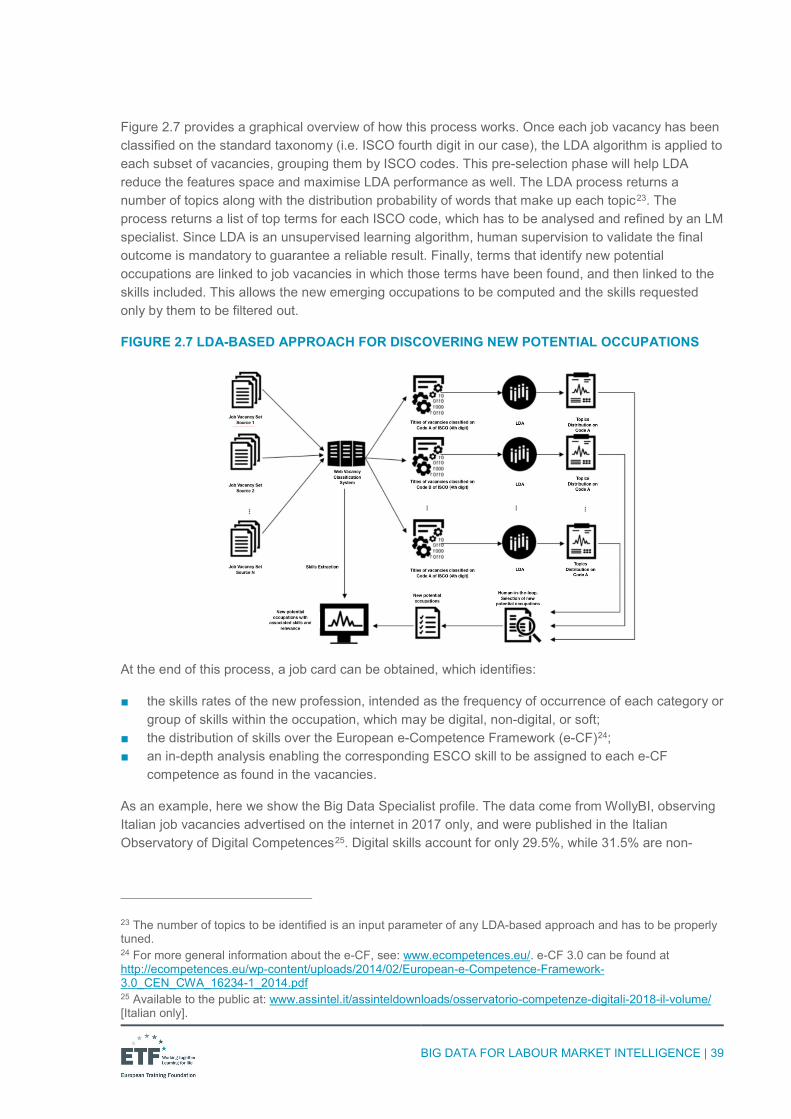
BIG DATA FOR LABOUR MARKET INTELLIGENCE | 39
Figure 2.7 provides a graphical overview of how this process works. Once each job vacancy has been classified on the standard taxonomy (i.e. ISCO fourth digit in our case), the LDA algorithm is applied to each subset of vacancies, grouping them by ISCO codes. This pre-selection phase will help LDA reduce the features space and maximise LDA performance as well. The LDA process returns a number of topics along with the distribution probability of words that make up each topic23. The process returns a list of top terms for each ISCO code, which has to be analysed and refined by an LM specialist. Since LDA is an unsupervised learning algorithm, human supervision to validate the final outcome is mandatory to guarantee a reliable result. Finally, terms that identify new potential occupations are linked to job vacancies in which those terms have been found, and then linked to the skills included. This allows the new emerging occupations to be computed and the skills requested only by them to be filtered out.
FIGURE 2.7 LDA-BASED APPROACH FOR DISCOVERING NEW POTENTIAL OCCUPATIONS
At the end of this process, a job card can be obtained, which identifies:
■ the skills rates of the new profession, intended as the frequency of occurrence of each category or group of skills within the occupation, which may be digital, non-digital, or soft;
■ the distribution of skills over the European e-Competence Framework (e-CF)24; ■ an in-depth analysis enabling the corresponding ESCO skill to be assigned to each e-CF
competence as found in the vacancies.
As an example, here we show the Big Data Specialist profile. The data come from WollyBI, observing Italian job vacancies advertised on the internet in 2017 only, and were published in the Italian Observatory of Digital Competences25. Digital skills account for only 29.5%, while 31.5% are non-
23 The number of topics to be identified is an input parameter of any LDA-based approach and has to be properly tuned. 24 For more general information about the e-CF, see: www.ecompetences.eu/. e-CF 3.0 can be found at http://ecompetences.eu/wp-content/uploads/2014/02/European-e-Competence-Framework-3.0_CEN_CWA_16234-1_2014.pdf 25 Available to the public at: www.assintel.it/assinteldownloads/osservatorio-competenze-digitali-2018-il-volume/ [Italian only].
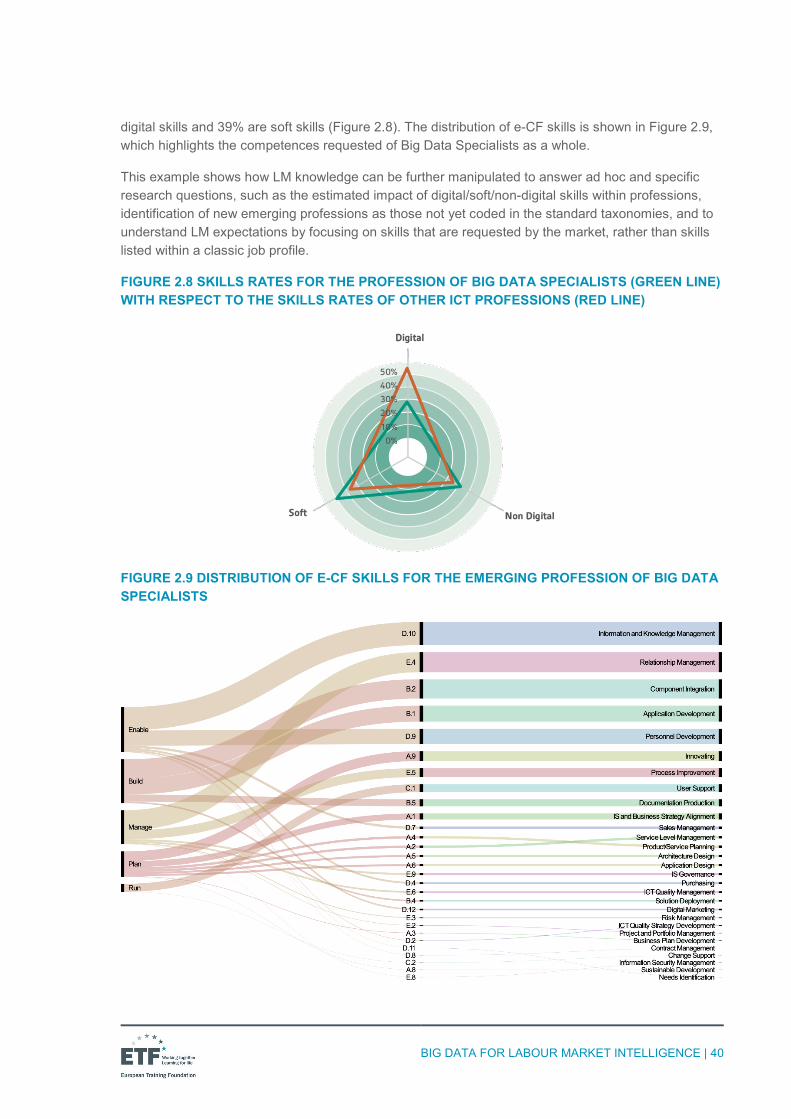
BIG DATA FOR LABOUR MARKET INTELLIGENCE | 40
digital skills and 39% are soft skills (Figure 2.8). The distribution of e-CF skills is shown in Figure 2.9, which highlights the competences requested of Big Data Specialists as a whole.
This example shows how LM knowledge can be further manipulated to answer ad hoc and specific research questions, such as the estimated impact of digital/soft/non-digital skills within professions, identification of new emerging professions as those not yet coded in the standard taxonomies, and to understand LM expectations by focusing on skills that are requested by the market, rather than skills listed within a classic job profile.
FIGURE 2.8 SKILLS RATES FOR THE PROFESSION OF BIG DATA SPECIALISTS (GREEN LINE) WITH RESPECT TO THE SKILLS RATES OF OTHER ICT PROFESSIONS (RED LINE)
FIGURE 2.9 DISTRIBUTION OF E-CF SKILLS FOR THE EMERGING PROFESSION OF BIG DATA SPECIALISTS

BIG DATA FOR LABOUR MARKET INTELLIGENCE | 41
Q&A
Who writes AI algorithms?
To date, AI algorithms are still written by human beings. However, the underlying idea of machine learning is to have systems that automatically learn from the data. In this sense, there is no human handwritten code to guide the training process. Humans can only try to understand what the system actually learned by observing and querying the system as a black box.
Who quality assures that AI does what it is supposed to do?
Many researchers are working on this. One current topic concerns Explainable AI, to allow user understanding of what AI machines/algorithms learn. To date, there are few tools to explain the criteria – and corresponding features – that guide an AI system in predicting or suggesting a specific outcome.
Is there legislation or codes of ethics to support ‘good’ AI?
Not at the moment, but in May 2018 the European Commission published Artificial intelligence for Europe, which also examines some ethical guidelines (last accessed March 2019 at: https://ec.europa.eu/digital-single-market/en/news/communication-artificial-intelligence-europe)
BIG DATA FOR LABOUR MARKET INTELLIGENCE | 42
3. USE OF BIG DATA ANALYTICS FOR LMIS A SELECTION OF CASES TO BE USED AS PRACTICAL REFERENCE
In this chapter we review some recent important projects using LM information – including information from Big Data applications – to support real-time LMI, developed outside the EU (US and Malawi) and within the EU (United Kingdom (UK), the Netherlands, Spain, and an EU project involving all EU countries).
The information set out here has been agreed and shared with the projects’ respective Principa Investigators (PIs) to ensure comprehensive description of each initiative. To this end, each project is described on the basis of: (i) goals; (ii) data/sources used; (iii) results (or expected outcomes); (iv) achievements; and (v) open/challenging issues.
3.1 CyberSeek.org – United States of America CyberSeek.org is an interactive supply and demand heatmap and career pathway for cybersecurity jobs in the US. It is a joint project between Burning Glass, CompTIA, and the National Initiative for Cybersecurity Education (NICE). It is funded by a grant from the National Institute of Standards and Technology and was released in 2016.
Goals. CyberSeek aims to provide granular and actionable data on the cybersecurity workforce in the US in order to help educators, employers, policymakers and jobseekers make better-informed decisions and support efforts to close the cybersecurity skills gap.
Data and sources used. CyberSeek provides detailed supply and demand data for cybersecurity jobs in the public and private sectors in states and metro areas across the US. This includes the following metrics:
■ total job openings; ■ total workers currently employed in workforce; ■ supply/demand ratio; ■ location quotient; ■ top cybersecurity job titles; ■ openings by NICE Cybersecurity Workforce Framework category; ■ demand and supply of in-demand cybersecurity certifications; ■ total vacancies; average salary; skills, credential, and experience requirements; and transition
opportunities between 10 core cybersecurity jobs and five cybersecurity feeder jobs.
CyberSeek draws these data from three primary data sources:
■ Burning Glass’s database of hundreds of millions of online job postings collected since 2007. This database uses advanced natural language analytics to turn the information in each job posting into structured, usable data. It allows Burning Glass to describe employer demand for specific roles or skills at a level of detail not available from traditional survey methodologies;
■ government data from the Bureau of Labour Statistics on the currently employed workforce; ■ certification holder data from five different certifying organisations: CompTIA, IAPP, ISC^2, ISACA
and GIAC.
BIG DATA FOR LABOUR MARKET INTELLIGENCE | 43
Results (or expected outcomes26). CyberSeek has achieved three main results:
1. quantification of the severity of the cybersecurity skills gap across the country; 2. identification of transition opportunities into and within cybersecurity; 3. identification of key skills and credentials necessary in the field.
Achievements. CyberSeek has been used by hundreds of thousands of users – including educators, policymakers, employers, students and jobseekers – since its release. It has been cited by dozens of media outlets as the go-to source of data on the cybersecurity job market. It was also a finalist for PR Newswire’s non-profit website of the year.
Open/challenging issues. Current issues relate to challenges in incorporating additional components of supply beyond the existing workforce (e.g. students or unemployed workers); breaking data down by industry; incorporating training provider data; and expanding the tool to new geographies.
3.2 WheretheWorkIs.org – United Kingdom WheretheWorkIs.org is a demand/supply model for mid-skill jobs, which identifies jobs and regions where skills gaps or worker surpluses exist so that training providers may adapt their offerings accordingly. This is a project by Burning Glass Technologies and the Institute for Public Policy Research, funded by JPMorgan Chase & Co in 2016 and 2017 as part of the New Skills at Work programme, which aims to identify strategies and support solutions that help improve LM infrastructure and develop the skilled workforce globally.
Goals. WheretheWorkIs aims to provide a unique, free-to-use tool to enable training providers, researchers, employers and policymakers to look at how supply and demand for different types of jobs vary in different local areas of the UK.
Data and sources used. WheretheWorkIs makes use of two distinct kinds of data provided by Burning Glass.
Demand data: 50 million unique jobs have been posted online in the UK since 2012, using advanced natural language analytics to turn the information in each job posting into structured, usable data. This allows Burning Glass to describe employer demand for specific roles or skills at a level of detail not available from traditional survey methodologies.
The demand for entry-level (less than two years of experience) talent is compared with the available supply of new graduates or trainees. Burning Glass postings data are normalised against employment data published by the Office for National Statistics (ONS). The data are further validated against the Annual Survey of Hours and Earnings from the ONS.
Supply data: Burning Glass uses the numbers of learners leaving higher and further education (programme finishers by subject area) as a proxy for the ‘supply’ of entry-level talent. Supply data are sourced from the following agencies:
■ Higher Education Statistics Agency (UK wide); ■ Skills Funding Agency (England); ■ Scottish Funding Council;
26 For additional information, see: www.comptia.org/about-us/newsroom/press-releases/2018/06/06/us-cybersecurity-worker-shortage-expanding-new-cyberseek-data-reveals
BIG DATA FOR LABOUR MARKET INTELLIGENCE | 44
■ Skills Development Scotland; ■ Department for Employment and Learning of Northern Ireland; ■ StatsWales.
Results. The online portal has revealed that huge mismatches exist between the mid-skilled workers UK employers need for entry-level roles and the qualifications that new jobseekers possess – i.e. demand for further education finishers and higher education graduates outweighs the number of candidates.
For further education finishers, the occupations that most outweigh candidate numbers are:
■ personal care services with 203 758 vacancies; ■ sales assistants and retail cashiers with 89 898 vacancies; ■ sales supervisors with 20 139 vacancies; ■ health associate professionals with 16 108 vacancies; ■ textiles and garments trades with 2 905 vacancies.
For higher education graduates, the occupations that most outweigh candidate numbers are:
■ teaching and educational professionals with 150 763 vacancies; ■ public services and other associate professionals with 71 873 vacancies; ■ childcare and related services with 29 846 vacancies; ■ welfare and housing associate professionals with 20 624 vacancies; ■ health associate professionals with 14 390 vacancies.
The tool allows training providers and others to drill down into the data to understand the opportunities that exist in particular local areas.
Achievements. The tool was funded to be refreshed with updated ‘supply’ data in 2017. Feedback from employers, educators and policymakers was positive. The data behind the tool form the basis of talks between Burning Glass and a supplier of career information to schools across England.
Open/challenging issues. While Burning Glass ‘demand’ data are available in real time and granular enough to look at individual occupations at a local level, the ‘supply’ data are not: the most recent data available is always two years old when published, and low numbers frequently prevent interrogation at a local level.
Matching supply and demand is frequently challenging. Some occupations do not have specific qualifications or subject-specific requirements (such as sales, marketing and related associate professionals). As a result, and despite the fact that many people with a broad range of qualifications can apply for these occupations, they frequently appear ‘undersupplied’ in the tool, i.e. when ‘job opportunity’ is low.
3.3 Bizkaia Basque Talent Observatory – Spain Using Big Data, the Basque Talent Observatory analyses 13 different online and offline public and private job-posting platforms focused on positions for people with a university degree, in the Basque Country only, to provide knowledge about requested profiles with soft and hard skills on the Basque LM.
Goals. To provide professionals, public agents, the private sector and universities with information on the kinds of profiles, degrees and skills requested by the LM, by sector, territorial area, etc.
BIG DATA FOR LABOUR MARKET INTELLIGENCE | 45
Data and sources used. The system analysed 126 000 job vacancies in the Basque Country in the last 12 months, filtering them to ensure a 100% match with two criteria: for people with a university degree, for work in the Basque Country. The following web sources were used: Adecco, Bizkaia Talent, University of the Basque Country, Indeed, Infoempleo, Jobydoo, Infojobs, Lanbide (the Basque public employment service), Mondragon People, Mondragon University, Monster, Randstad and Studentjob.
Results. Once universities and public agents understood the professional profiles required, they were able to adapt their training to current reality and trends, using the data to develop a system to predict the lack of talent for each kind of profile in the Basque Country, and match the job offers (500 per year) and the professionals on the platform (11 000), in order to offer the right vacancy to the right candidate and vice versa.
Achievements. The platform is a free-access system, only requiring registration on www.bizkaiatalent.eus or www.bebasquetalentnetwork.eus. Registered professionals and companies also have access through the Bizkaia Talent app. For the many professionals who live abroad (55% of those 11 000), knowledge about demand on the Basque LM gives them greater possibilities to return to work in the region.
Open/challenging issues. It remains to be seen how the data and different time/skills/occupation combinations can be used to predict demand for talent in the coming years and work ahead of time to contact the right professionals.
3.4 The data-driven skills taxonomy – United Kingdom Nesta27 developed the first data-driven skills taxonomy to be made publicly available in the UK.
The taxonomy was created from research that Nesta carried out as a partner in the Economic Statistics Centre of Excellence (ESCoE28). ESCoE was funded by the UK’s ONS and its purpose is to provide analysis of emerging and future issues in measuring the modern economy. The ESCoE research explored the potential for using naturally occurring Big Data in the form of online job advertising to improve understanding of the LM.
Goals. Skills shortages are a major issue in the UK and can significantly hamper growth. According to OECD research29, the UK could boost its productivity by 5% if it reduced the level of skills mismatch to OECD best practice levels.
Despite the importance of skills shortages, they are not currently measured in a detailed and timely way. The best available estimates come from the Employer Skills Survey30. While the survey is able to shed light on the various causes of skills shortages, it is only conducted once every two years and it focuses on broad rather than detailed groups of skills.
Looking ahead, skills mismatches may worsen because the skills needed for work are changing, owing both to short-term factors such as Brexit, and to longer-term trends such as automation. Nesta’s
27 www.nesta.org.uk/ and more specifically www.nesta.org.uk/data-visualisation-and-interactive/making-sense-skills/ 28 www.escoe.ac.uk/ 29 www.oecd.org/eco/growth/Labour-Market-Mismatch-and-Labour-Productivity-Evidence-from-PIAAC-Data.pdf 30 www.gov.uk/government/publications/employer-skills-survey-2017-uk-report
BIG DATA FOR LABOUR MARKET INTELLIGENCE | 46
research found that one-fifth of workers are in occupations that will likely shrink over the next 10 to 15 years31.
The first step to measuring shortages is to build a skills taxonomy, which shows the skills groups needed by workers in the UK today. The taxonomy can then be used as a framework to measure the demand for the skills among employers, the current supply of those skills from workers, and the potential supply based on courses offered by education providers and employers.
Data and sources used. The construction of the taxonomy started with a list of just over 10 500 unique skills mentioned in the descriptions of 41 million jobs advertised in the UK, collected between 2012 and 2017 and provided by Burning Glass Technologies. These skills included specific tasks (such as insurance underwriting), knowledge (biology), software programs (Microsoft Excel) and even personal attributes (positive disposition). Machine learning was used to hierarchically cluster the skills. The more frequently two skills appeared in the same advert, the more likely they were to end up in the same branch of the taxonomy. The taxonomy therefore captures the clusters of skills that are needed for different jobs.
Results. The final taxonomy has a tree-like structure with three layers. The first layer contains six broad clusters of skills; these split into 35 groups, and then split once more to give 143 clusters of specific skills. Each of the approximately 10 500 skills lives within one of these 143 groups. The same methodology could be used to create further layers.
The skills taxonomy was enriched to provide estimates of the demand for each skill cluster (based on the number of mentions in the job advertisements), the change in demand over recent years and the value of each skill cluster (based on advertised salaries). The estimates of demand provide one half of the picture on skills shortages. Most importantly, a user can search on the taxonomy by job title, and discover the skills needed for a wide range of jobs.
Achievements. The taxonomy was only published in August 2018. Over the next year, a range of cases using the skills taxonomy will be provided. This will include estimating skills shortages at regional level, automatically detecting new and redundant sets of skills, and estimating the potential supply of skills based on available courses and training. The taxonomy itself will also continue to evolve, as the system adds a fourth layer and tries to capture the lateral relationships between clusters.
Open/challenging issues. No taxonomy will be truly comprehensive, whether it is derived from experts or created from job advertising. Moreover, there is no single ‘right way’ to group skills. In this research, the most important limitation was that not all work is advertised online. As a result, the demand for skills used predominantly by freelancers or by casual workers may be underestimated in the taxonomy. Despite this risk, the data-driven approach still creates the most detailed taxonomy of UK skills available to the public today, and it is more easily updated than expert-derived taxonomies.
3.5 Technical, entrepreneurial and vocational education and training – Malawi
The United Nations Educational, Scientific and Cultural Organisation (UNESCO) and the Government of Malawi conducted a review of technical, entrepreneurial and vocational education and training in 2018. As part of the investigation into the status of the LM, demand for jobs and employment in
31 www.nesta.org.uk/report/the-future-of-skills-employment-in-2030/
BIG DATA FOR LABOUR MARKET INTELLIGENCE | 47
Malawi was analysed using Big Data science and AI in order to demonstrate the power of the new media and enable Malawi to leapfrog into a new system minimising friction in the LM through near-real-time information on available jobs and people seeking jobs. The biggest jobsite in Malawi, myJobo.com, has seen its user numbers double every 10 months, and continues to expand rapidly.
Data and sources used. Data on job vacancies between 1 January 2016 and 30 April 2018 were obtained from the biggest online job search portal in Malawi: myJobo.com.
Results. Aggregating Big Data from 360 000 data points on myJobo.com shows a variety of trending job functions, with the biggest in administration, accounting, management, engineering, public relations, education and healthcare. Drilling down to job titles finds that the jobs most in demand in urban Malawi in 2016 to 2018 are accountants, accounts assistants, administrative assistants, finance officers, technical officers, project managers and project coordinators. The top 100 jobs are also listed, providing a granular picture of the prevailing jobs market for all jobseekers and for government planners, education providers, trainers and others. As an example, for the job title of accountant, knowledge of tax, financial reporting, financial analysis, corporate tax, auditing, budgets and forecasting are the top skills. The top skills required for an accountant are accounting, financial reporting, budgets, account reconciliation, Microsoft Excel, general ledger, accounts payables, internal controls, management and analysis.
Achievements. The analysis of the data sourced from myJobo.com provides important insights into the trending jobs available on the Malawi market in a large percentage of Malawi’s urban areas. These trends provide new information about occupations, which can be quantified in a granular way to help training providers customise courses and inform jobseekers about the kinds of skills sought by employers. In this way, jobseekers and learners can personalise their learning path to address potential skills gaps, and opportunities for upskilling can be offered.
Open/challenging issues. The opportunities offered by new methods using jobsites provide a useful supplement to current systems like the LMIS, and fill gaps in LM knowledge for the years between large-scale surveys like the Malawi Labour Force Survey, which was last conducted in 2013. The new methods allow for near-real-time information, which will help jobseekers as well as education and course planners keep up to date on LM trends.
3.6 Transfer Occupations (A) and Tensions Indicators (B) projects – The Netherlands
These projects were developed by the Department of Labour Market Intelligence (UWV) (A and B) and Panteia (B) in the Netherlands.
Transfer Occupations project
Goals. To give jobseekers affected by surplus occupations32 a set of alternative occupations and therefore a better chance of finding a job (transfer occupations).
Data and sources used33. The project is based on real mobility steps of jobseekers in the past. The project uses the CVs of jobseekers on werk.nl in the period 2013 to 2017. Unemployed or partly disabled people who receive a UWV benefit are required to register on werk.nl and post their CV on
32 Examples of surplus occupation: the supply of labour exceeds demand or the number of short-term unemployed people is more than 1.5 times larger than the number of open vacancies. 33 Data might be (semi-)structured/unstructured; sources might be administrative/statistical/survey/web.
BIG DATA FOR LABOUR MARKET INTELLIGENCE | 48
the site. People who receive social assistance from the municipalities are also required to register on werk.nl; jobseekers register on a voluntary basis. The system examines the CVs to determine the frequency of transfers from one occupation to another. Because of a possible selection bias, the database only calculates transfer frequency for surplus occupations (e.g. administrative clerks, secretaries, bookkeepers). For these occupations, the project selects target transfer occupations when:
■ the transfer occupation has better job opportunities than the surplus occupation; ■ the level of the transfer occupation is similar or almost similar to the surplus occupation.
Results. For surplus occupations, the system periodically publishes several transfer occupations. The information is used by job coaches and directly by jobseekers. It is also used in presentations, workshops and webinars.
Tensions Indicators project
Goals. To give a robust indicator of LM tensions per region and per occupation group.
Data and sources used. The project uses a combination of Big Data, survey data and administrative data.
■ Big Data uses online vacancies such as those on the Jobfeed database from Textkernel, after eliminating duplications and running reliability checks.
■ Survey data include results from the National Vacancy Survey of the Central Bureau of Statistics to ensure consistency and to take account of selection bias per sector and educational attainment.
■ Administrative data cover people receiving a UWV unemployment benefit for less than six months.
Results. Every three months, the system publishes the tension indicator for 35 regions in 114 occupation groups and indicates the following types: very large shortage, shortage, on average, surplus, large surplus.
The system is used for policymakers, press, presentations, workshops, input for several publications and additional research objectives.
3.7 Real-time labour market information on skill requirements – All EU Member States
After a successful pilot study, in 2017 Cedefop34 began development of a system to collect data from online vacancies in all EU Member States, with the launch of the tender ‘Real-time labour market information on skill requirements: Setting up the EU system for online vacancy analysis’. The system will be fully developed and operational by 2020.
On development of the project, Cedefop cooperates with:
■ CRISP – University of Milano-Bicocca (Leader): CRISP (Interuniversity Research Centre for Public Services) is a research centre based at the University of Milano-Bicocca (Italy);
34 Cedefop is one of the EU’s decentralised agencies. Founded in 1975, Cedefop supports the development of European vocational education and training policies and contributes to their implementation, working particularly with the European Commission, EU Member States and social partners.
BIG DATA FOR LABOUR MARKET INTELLIGENCE | 49
■ TabulaeX s.r.l.: an accredited spin-off of the University of Milano-Bicocca (Italy); ■ IWAK (Institute for Economics, Labour and Culture): an institute for applied research associated
with the Goethe University Frankfurt am Main (Germany).
Since the project involves the development of a multilanguage classification system, the consortium also collaborates with international country experts, representing all 28 EU Member States.
Goals. The primary objective of this project is to develop a fully scaled system to enable Cedefop to carry out analysis of online vacancies and emerging skills requirements across all 28 EU Member States. The real-time data collection system will collect the relevant background details of jobs, firms and the type of employee wanted (skills, qualifications and other attributes) to enable future exploration and analysis of skills demand.
The real-time data system will be created using online data ingestion tools that systematically visit sites and components engaged in the programmatic analysis of web pages to harvest specific forms of information. The final result will be a knowledge base that provides information about labour demand, with a particular focus on the skills required. This knowledge base could be used to perform many different kinds of analysis to support stakeholders and decision-makers.
The process includes cleaning job vacancies advertised on the internet and classification of the variables extracted. The results of the statistical analysis will be made accessible through visualisation tools.
Data and sources used35. The first phase of the project, ‘Landscaping activity’, investigated the available data sources across the EU. The objective was to understand the use of online vacancies by employers and jobseekers, and to assess the representativeness of the data for proper interpretation of results. This phase also generated a list of suitable web portals for data ingestion activities.
The list of relevant sources for all 28 EU Member States indicated 530 sources, divided into:
■ job search engines; ■ employment agencies; ■ employment websites; ■ classified ads portals; ■ companies; ■ public employment service websites; ■ online newspapers; ■ education; ■ employment organisations.
The data ingestion methods vary, depending on the websites: scraping (24%), crawling (18%) and API access (57%), performed with the biggest websites under data licensing agreements.
After the first six months of ingestion, the project estimated the number of unique vacancies for all EU countries per year at about 60 million.
35 Data might be (semi-)structured or unstructured; sources might be administrative, statistical, survey or web.
BIG DATA FOR LABOUR MARKET INTELLIGENCE | 50
The ingestion of online job vacancies (OJVs) aimed to extract the following variables, classified as indicated:
■ occupation --> ESCO v.1 down to level 4; ■ educational level --> International Standard Classification of Education (ISCED) level 1; ■ territory --> NUT36 down to level 3; ■ working hours --> custom taxonomy (‘part-time’ and ‘full-time’); ■ type of contract --> custom taxonomy (‘temporary’, ‘permanent’, ‘self-employed’, ‘internship’); ■ industry --> NACE37 level down to level 2; ■ salary --> custom taxonomy based on numerical classes; ■ skill --> ESCO v.1.
Results. The results of the project are threefold:
1. performance of the landscaping exercise in every Member State; 2. realisation of a fully-fledged system for online vacancy gathering and analysis across all 28 EU
Member States; 3. contribution to the production of an analytical report based on the results and to further
dissemination.
Achievements. The project is still ongoing; an early release of results covering seven countries will be delivered in the first quarter of 2019.
Open/challenging issues. Difficulties have been encountered when aiming to support new analysis models derived from Big Data – OJVs need to encourage a data-driven decision-making approach among policymakers and stakeholders. There is a need to develop visualisation dashboards customised by types of users (policymakers, statisticians, etc.), and scalable architecture is required to support growing volumes of data. Challenges remain in relation to breaking skills data down by specific classifications (ICT skills, soft skills, etc.), and more needs to be done to support new studies and research on the future of jobs based on OJV data.
.
36 Nomenclature of territorial units for statistics, see: https://ec.europa.eu/eurostat/web/nuts/background 37 Statistical classification of economic activities in the European Community, see: https://ec.europa.eu/eurostat/statistics-explained/index.php/Glossary:Statistical_classification_of_economic_activities_in_the_European_Community_(NACE)
BIG DATA FOR LABOUR MARKET INTELLIGENCE | 51
4. CONCLUSIONS AND RECOMMENDATIONS
4.1 Summary of recommendations and steps for the ETF and its partner countries
The possible development of a system for the analysis of internet-based labour demand requires examination of a number of macro-topics.
General information. The goals and the characteristics of the system can be described as follows:
1. Territory of interest: Which LM are we interested in investigating? Is it a single country, a group of countries or a continent? Are we interested in the whole LM or is the focus on just one segment/sector? The choice will affect the taxonomies used in the project, since it is necessary to have common ground in order to compare results.
2. Variables of interest: What kind of variables do we want to investigate? Assuming that we are interested in creating a knowledge base focused on labour demand, i.e. using OJVs as data, we need to decide whether a focus on occupation demand is sufficient, whether we want to enlarge the analysis to include skills (linking requested skills to the related occupations) or whether we want to exploit the OJV data to extract the most informative power from them, analysing education levels, territorial levels, working hours, type of contract, industry and salary. This decision will of course affect the budget in terms of storage space needed and time dedicated to the methodological approach.
Source selection process. Assuming use of OJVs, the main question is which websites to collect OJVs from. This phase could be subdivided as follows:
1. Overall website pre-investigation: This covers many key issues, such as the use of online vacancies by employers and jobseekers (this is important to assess data representativeness and believability) and the general local scenario. These questions need to be answered by experts who know the context and the most popular practices.
2. Methodology for selection of sources: As mentioned above, there are numerous sources available. After the pre-investigation, we need to decide if we want to take into consideration every kind of source or if there are exclusion criteria.
3. Ranking calculation and selection of sources based on that: The ranking calculation could be a very sophisticated statistical model or a simple model considering the necessary variables so that websites without these attributes are automatically excluded. For instance, given the goal of real-time analysis, a fundamental attribute of the source could be updating: websites not updated for a long time (e.g. more than six months) could be excluded. The result of the ranking should be a list of the most significant sources: at this point, the decision about whether to consider them all or to make a selection should be taken on the basis of performance capacity.
Ethical and legal issues. Legislation about the use of data and, more specifically, OJVs publicly posted online is not always clear. Research should be done to identify the boundaries of action and activities that are expressly forbidden.
Database approach and data model. Before starting ingestion of OJVs from the selected websites, we need to decide how to handle all the data collected during the project and establish a robust technical methodology:
BIG DATA FOR LABOUR MARKET INTELLIGENCE | 52
1. Database approach: in the world of database technology, there are two main types of databases: SQL and NoSQL (or relational databases and non-relational databases). The difference lies in how they are built, the type of information they store, and how they store it. Relational databases are structured, like phone books that store phone numbers and addresses. Non-relational databases are document-oriented and distributed, like file folders containing all the data for a person, from the address and phone number to Facebook likes and online shopping preferences. We need to choose the type of database to be used for OJV storage.
2. Data model: the data model is shaped depending on vacancy content and on the dimensions to be considered. The source data model includes the structures populated by the ingestion processes and the results of the pre-processing phase. The staging data model includes the structures used to store the results of the categorisation phase. The metadata includes all the structures used to store ontologies, taxonomies and service collections. The presentation data model includes all the structures available to users for analytical purposes.
Data ingestion process. Having identified the OJV sources, we have to decide how to collect the data. The most common ingestion techniques are scraping, crawling and direct access to data given by the provider, who may offer an API connection or directly deliver the data in an agreed format. API access would greatly facilitate the setting up of the system, accelerating and making the whole technical process more efficient. In any case, it would be advisable to contact the webmasters of the selected sources to inform them about the project and decide the most suitable approach for downloading the data.
Pre-processing. This is a critically important step, after collection of the OJVs. In this phase, the data is cleaned of noise and prepared for the information extraction stage. It also includes several steps to achieve data quality goals. One issue that arises during this phase is deduplication, i.e. when is an OJV to be treated as a duplicate of another OJV?
Information extraction and classification 1. Taxonomies: Taxonomies must be chosen to classify the variables. There are various options: for
the majority of the variables, there are standard classifications adopted in the countries and developed over the years (e.g. ESCO for occupations and for skills, NUT for the territorial level, NACE for industries). If the LM of interest involves more than one country, it is important to ensure common taxonomies for all the variables.
2. Information extraction techniques and assignment to taxonomies: When deciding which information extraction techniques to adopt, a study of the state of the art is needed to make a choice between ontology-based or machine learning (supervised or not) systems.
ETL and presentation area. The final stage is deciding how information will be displayed and visualised. It will then be necessary to design the data presentation model, navigation paths and dashboards, and evaluate types of use.
4.2 Ideas for pilot projects In this section we summarise the main outcomes from the working group activities that discussed the use of Big Data for LMI within the ‘Skills needs uncovered: Dealing with uncertainty’ workshop, part of the ‘Skills for the future: Managing transition’ conference organised by the ETF in Turin on 21 and 22 November 2018.
The workshop, along with the activities performed by working groups, represented a great opportunity for discussing what can be shared in terms of ideas, experience, techniques, challenging issues and
BIG DATA FOR LABOUR MARKET INTELLIGENCE | 53
real-life problems, as well as offering the chance to foster cross-fertilisation among researchers and specialists working on LM and Big Data to identify new directions, actions and ideas for projects on this topic. Specifically, the discussions between participants focused mainly on four distinct topics: (i) benefits for citizens in terms of career paths; (ii) the role of Big Data for LMI; (iii) enhancing the use of Big Data in developing and transition countries; and (iv) actions for projects. Below we report the main aspects related to each topic as they emerged from the working group activity and that we have taken into account while creating ideas for pilot schemes.
Benefits for citizens in terms of career paths. Using Big Data to support career paths is one of the most interesting (and disruptive) applications of LMI. This would enable some benefits for citizens, such as:
■ ability to perform gap analyses between skills owned by citizens and skills requested by the LM; ■ possibility to classify occupations over a standard taxonomy (such as ESCO, O*NET or SOC) that
allows comparison of the same job across different countries, thus supporting mobility between EU Member States;
■ creation of a tool for a career service; ■ raising awareness that the LM is changing fast, along with the importance of lifelong learning; ■ enabling citizens to link their own learning path to a career path and emerging skills.
Role of Big Data in LMI. In order to exploit Big Data for LMI, the following issues have to be considered:
■ need for in-depth and fine-grained information about LM demand and supply within each country; ■ need for cooperation between institutions to exchange data, as well as signed agreements
between data owners to allow for a reliable and scalable data collection process; ■ need for a joint use of data sources, such as the internet for collecting job vacancies, surveys
focusing on the informal/grey economy and labour force surveys.
Enhancing the use of Big Data in developing and transition countries. The use of Big Data for LMI would be especially beneficial for developing and transition countries to facilitate matching between LM demand and supply, to design career paths to better fit LM expectations, and to compare internal LM against cross-border countries to facilitate mobility. In these countries, the following issues should be carefully considered:
■ lack of access to administrative data and statistical data; ■ insufficient statistics about the education system in those countries; ■ need for a review of web sources to evaluate the penetration of the use of the internet for LM-
related activities; ■ need for improved awareness about the importance of data-driven decisions for both government
and statistical offices.
Actions for projects. Given the feedback collected during the ‘Skills needs uncovered: Dealing with uncertainty’ workshop and our experience in Big Data for LMI, we identify three distinct actions for projects that might help developing and transition countries in exploiting Big Data for LM intelligence, namely:
1. feasibility study for country X to identify, validate, and rank internet sources; 2. build up the system for collecting real-time LM information; 3. define data analytics models to support decision-makers in policy design and evaluation.
BIG DATA FOR LABOUR MARKET INTELLIGENCE | 54
ACRONYMS AI Artificial intelligence
API Application programming interface
BI Business Intelligence
Cedefop European Centre for the Development of Vocational Training
e-CF European e-Competence Framework
ESCO European Skills, Competences, Qualifications and Occupations
ESCoE Economic Statistics Centre of Excellence
ESS European statistical system
ETF European Training Foundation
ETL Extraction, transformation and loading
EU European Union
HDFS Hadoop Distributed File System
ICT Information and communications technology
IS Information system
ISCO International Standard Classification of Occupations
KDD Knowledge discovery in databases
LDA Latent Dirichlet Allocation
LM Labour market
LMI Labour market intelligence/information
LMIS Labour market information system
NACE Statistical classification of economic activities in the European Community
NICE National Initiative for Cybersecurity Education
NoSQL Not only SQL
NUT Nomenclature of territorial units for statistics
OECD Organisation for Economic Cooperation and Development
OJV Online job vacancy
ONS Office for National Statistics
SQL Standard Query Language
SOC Standard Occupational Classification

BIG DATA FOR LABOUR MARKET INTELLIGENCE | 55
UK United Kingdom
US United States
XML Extensible Markup Language
YARN Yet Another Resource Negotiator
BIG DATA FOR LABOUR MARKET INTELLIGENCE | 56
REFERENCES [1] UK Department for Education and Skills, LMI Matters!, 2004.
[2] UK Commission for Employment and Skills, The Importance of LMI, 2015. Last accessed March 2019 at: https://goo.gl/TtRwvS
[3] Mezzanzanica, M. and Mercorio, F., ‘Big Data Enables Labor Market Intelligence’, in Encyclopedia of Big Data Technologies, Springer International Publishing, 2018, pp. 1–11.
[4] ETF (European Training Foundation), Labour Market Information Systems, 2017.
[6] UK Office for National Statistics, NOMIS: UK National Online Manpower Information System, 2014.
[7] Johnson, E., Can big data save labor market information systems?, RTI Press policy brief No PB-0010-1608, RTI Press, Research Triangle Park, NC, viewed, 2017.
[8] Frey, C.B. and Osborne, M.A., ‘The future of employment: How susceptible are jobs to computerisation?’, Technol. Forecast. Soc. Change, Vol. 114, Supplement C, pp. 254–280, 2017.
[9] UNECE (United Nations Economic Commission for Europe), Using Administrative and Secondary Sources for Official Statistics: A Handbook of Principles and Practices, 2015.
[10] Italian Ministry of Labour and Welfare, Annual Report about the CO System, 2012. Last accessed March 2019 at: http://goo.gl/XdALYd
[11] Penneck, S. et al., ‘Using administrative data for statistical purposes’, Econ. LABOUR Mark. Rev., Vol. 1, No 10, 2007, p. 19.
[12] Boselli, R., Cesarini, M., Mercorio, F. and Mezzanzanica, M., ‘A model-based evaluation of Data quality activities in KDD’, Inf. Process. Manag., Vol. 51, No 2, 2015, pp. 144–166.
[13] Wang, R.Y. and Strong, D.M., ‘Beyond Accuracy: What Data Quality Means to Data Consumers’, J. Manag. Inf. Syst., Vol. 12, No 4, 1996, pp. 5–33.
[14] McAfee, A., Brynjolfsson, E., Davenport, T.H., Patil, D. and Barton, D., ‘Big data: the management revolution’, Harv. Bus. Rev., Vol. 90, No 10, 2012, pp. 60–68.
[15] Boselli, R., Cesarini, M., Mercorio, F. and Mezzanzanica, M., ‘Classifying online Job Advertisements through Machine Learning’, Future Gener. Comput. Syst., Vol. 86, 2018, pp. 319–328.
[16] Fayyad, U., Piatetsky-Shapiro, G. and Smyth, P., ‘The KDD process for extracting useful knowledge from volumes of data’, Commun. ACM, Vol. 39, No 11, 1996, pp. 27–34.
[17] Redman, T.C., ‘The impact of poor data quality on the typical enterprise’, Commun. ACM, Vol. 41, No 2, 1998, pp. 79–82.
[18] Bostock, M., Ogievetsky, V. and Heer, J., ‘D$^3$ data-driven documents’, IEEE Trans. Vis. Comput. Graph., Vol. 17, No 12, 2011, pp. 2301–2309.
[19] Bao, F. and Chen, J., ‘Visual framework for big data in d3. js’, in Electronics, Computer and Applications, 2014 IEEE Workshop, 2014, pp. 47–50.
BIG DATA FOR LABOUR MARKET INTELLIGENCE | 57
[20] European Commission, A new impetus for European cooperation in Vocational Education and Training to support the Europe 2020 strategy, COM(2010) 296, Brussels, 2010. Last accessed March 2019 at: https://goo.gl/Goluxo
[21] European Commission, A New Skills Agenda for Europe, COM(2016) 381/2, 2016.
[22] Eurostat, The ESSNet Big Data Project, European Commission, Strasbourg, 2016. Last accessed March 2019 at: https://goo.gl/EF6GtU
[23] Cedefop, Real-time Labour Market information on skill requirements: feasibility study and working prototype, Cedefop Reference number AO/RPA/VKVET-NSOFRO/Real-time LMI/010/14, Contract notice 2014/S 141-252026 of 15/07/2014, 2014. Last accessed March 2019 at: https://goo.gl/qNjmrn
[24] Cedefop, Real-time Labour Market information on Skill Requirements: Setting up the EU system for online vacancy analysis AO/DSL/VKVET-GRUSSO/Real-time LMI 2/009/16. Contract notice - 2016/S 134-240996 of 14/07/2016, 2016. Last accessed March 2019 at: https://goo.gl/5FZS3E
[25] UK Commission for Employment and Skills, LMI4All, 2015. Last accessed March 2019 at: www.lmiforall.org.uk/
[26] Arntz, M., Gregory, T. and Zierahn, U., ‘The risk of automation for jobs in OECD countries’, 2016.
[27] The Brookfield Institute for Innovation, Better, Faster, Stronger: Maximizing the benefits of automation for Ontario’s firms and people, 2018. Last accessed March 2019 at: https://brookfieldinstitute.ca/report/better-faster-stronger/
[28] Leopold, T.A., Ratcheva, V. and Sahiri, S., ‘The future of jobs: Employment, skills and workforce strategy for the fourth industrial revolution, global challenge insight report’, in World Economic Forum, Geneva, 2016.
[29] Mezzanzanica, M., Mercorio, F. and Colombo, E., ‘Digitalisation and Automation: Insights from the’, Dev. Ski. Chang. World Work Concepts Meas. Data Appl. Reg. Local Labour Mark. Monit. Eur., 2018, p. 259.
[30] ESCoE (Economic Statistic Centre of Excellence), Using administrative and big data to improve labour market statistics, 2019. Last accessed March 2019 at: www.escoe.ac.uk/projects/using-administrative-big-data-improve-labour-market-statistics/
[31] Stonebraker, M., ‘SQL databases v. NoSQL databases’, Commun. ACM, Vol. 53, No 4, 2010, pp. 10–11.
[32] Dean, J. and Ghemawat, S., ‘MapReduce: simplified data processing on large clusters’, Commun. ACM, Vol. 51, No 1, 2008, pp. 107–113.
[33] Alpaydin, E., Introduction to machine learning, MIT press, 2009.
[34] Colombo, E., Mercorio, F. and Mezzanzanica, M., ‘Applying machine learning tools on web vacancies for labour market and skill analysis’, in Terminator or the Jetsons? The Economics and Policy Implications of Artificial Intelligence, 2018.
[35] Sebastiani, F., ‘Machine learning in automated text categorization’, ACM Comput. Surv. CSUR, Vol. 34, No 1, 2002, pp. 1–47.

BIG DATA FOR LABOUR MARKET INTELLIGENCE | 58
[36] Blei, D.M., Ng, A.Y. and Jordan, M.I., ‘Latent dirichlet allocation’, J. Mach. Learn. Res., Vol. 3, No Jan, 2003, pp. 993–1022.
[37] Boselli, R. et al., ‘WoLMIS: a labor market intelligence system for classifying web job vacancies’, J. Intell. Inf. Syst., Vol. 51, No 3, 2018, pp. 477–502.


www.etf.europa.eu
Related Documents