HAL Id: tel-03584234 https://tel.archives-ouvertes.fr/tel-03584234v2 Submitted on 23 Feb 2022 HAL is a multi-disciplinary open access archive for the deposit and dissemination of sci- entific research documents, whether they are pub- lished or not. The documents may come from teaching and research institutions in France or abroad, or from public or private research centers. L’archive ouverte pluridisciplinaire HAL, est destinée au dépôt et à la diffusion de documents scientifiques de niveau recherche, publiés ou non, émanant des établissements d’enseignement et de recherche français ou étrangers, des laboratoires publics ou privés. Bias and Reasoning in Visual Question Answering Corentin Kervadec To cite this version: Corentin Kervadec. Bias and Reasoning in Visual Question Answering. Artificial Intelligence [cs.AI]. INSA Lyon - Ecole doctorale d’Informatique et Mathématique de Lyon, 2021. English. tel- 03584234v2

Welcome message from author
This document is posted to help you gain knowledge. Please leave a comment to let me know what you think about it! Share it to your friends and learn new things together.
Transcript
HAL Id: tel-03584234https://tel.archives-ouvertes.fr/tel-03584234v2
Submitted on 23 Feb 2022
HAL is a multi-disciplinary open accessarchive for the deposit and dissemination of sci-entific research documents, whether they are pub-lished or not. The documents may come fromteaching and research institutions in France orabroad, or from public or private research centers.
L’archive ouverte pluridisciplinaire HAL, estdestinée au dépôt et à la diffusion de documentsscientifiques de niveau recherche, publiés ou non,émanant des établissements d’enseignement et derecherche français ou étrangers, des laboratoirespublics ou privés.
Bias and Reasoning in Visual Question AnsweringCorentin Kervadec
To cite this version:Corentin Kervadec. Bias and Reasoning in Visual Question Answering. Artificial Intelligence[cs.AI]. INSA Lyon - Ecole doctorale d’Informatique et Mathématique de Lyon, 2021. English. �tel-03584234v2�
N°d’ordre NNT : xxx
THESE de DOCTORAT DE L’UNIVERSITE DE LYON
opérée au sein de
(Nom Etablissement)
Ecole Doctorale N° accréditation
(Nom complet Ecole Doctorale)
Spécialité/ discipline de doctorat :
Soutenue publiquement/à huis clos le jj/mm/aaaa, par :
(Prénoms Nom)
THÈSE DE DOCTORAT DE L’UNIVERSITÉ DE LYONopérée au sein de
INSA LYON
École Doctorale 512
Informatique et Mathématique de Lyon(INFOMATHS)
SpécialitéInformatique
Présentée par
Corentin Kervadec
Pour obtenir le grade deDOCTEUR de L’UNIVERSITÉ DE LYON
Sujet de la thèse :
Bias and Reasoning in Visual Question Answering
Biais et raisonnement dans les systèmes de questions réponses visuelles
Soutenue publiquement le 9 Décembre 2021, devant le jury composé de :
M. David Picard École des Ponts ParisTech Rapporteur – PrésidentM. Nicolas Thome CNAM RapporteurMme. Cordelia Schmid INRIA - Google ExaminatriceM. Damien Teney IDIAP ExaminateurMme. Akata Zeynep University of Tübingen ExaminatriceM. Christian Wolf INSA Lyon - LIRIS Directeur de thèseM. Grigory Antipov Orange Innovation Co-encadrant de thèseM. Moez Baccouche Orange Innovation Co-encadrant de thèse
N° d’ordre NNT : 2021LYSEI101

Corentin Kervadec: Bias and Reasoning in Visual Question Answering, © 2021
Département FEDORA – INSA Lyon - Ecoles Doctorales
SIGLE ECOLE DOCTORALE NOM ET COORDONNEES DU RESPONSABLE
CHIMIE CHIMIE DE LYON
https://www.edchimie-lyon.fr
Sec. : Renée EL MELHEM
Bât. Blaise PASCAL, 3e étage
M. Stéphane DANIELE
C2P2-CPE LYON-UMR 5265
Bâtiment F308, BP 2077
43 Boulevard du 11 novembre 1918
69616 Villeurbanne
E.E.A. ÉLECTRONIQUE, ÉLECTROTECHNIQUE,
AUTOMATIQUE
https://edeea.universite-lyon.fr
Sec. : Stéphanie CAUVIN
Bâtiment Direction INSA Lyon
Tél : 04.72.43.71.70
M. Philippe DELACHARTRE
INSA LYON
Laboratoire CREATIS
Bâtiment Blaise Pascal, 7 avenue Jean Capelle
69621 Villeurbanne CEDEX
Tél : 04.72.43.88.63 [email protected]
E2M2 ÉVOLUTION, ÉCOSYSTÈME,
MICROBIOLOGIE, MODÉLISATION
http://e2m2.universite-lyon.fr
Sec. : Sylvie ROBERJOT
Bât. Atrium, UCB Lyon 1
Tél : 04.72.44.83.62
M. Philippe NORMAND
Université Claude Bernard Lyon 1
UMR 5557 Lab. d’Ecologie Microbienne
Bâtiment Mendel
43, boulevard du 11 Novembre 1918
69 622 Villeurbanne CEDEX [email protected]
EDISS INTERDISCIPLINAIRE SCIENCES-SANTÉ
http://ediss.universite-lyon.fr
Sec. : Sylvie ROBERJOT
Bât. Atrium, UCB Lyon 1
Tél : 04.72.44.83.62
Mme Sylvie RICARD-BLUM
Institut de Chimie et Biochimie Moléculaires et Supramoléculaires
(ICBMS) - UMR 5246 CNRS - Université Lyon 1
Bâtiment Raulin - 2ème étage Nord
43 Boulevard du 11 novembre 1918
69622 Villeurbanne Cedex
Tél : +33(0)4 72 44 82 32 [email protected]
INFOMATHS INFORMATIQUE ET MATHÉMATIQUES
http://edinfomaths.universite-lyon.fr
Sec. : Renée EL MELHEM
Bât. Blaise PASCAL, 3e étage
Tél : 04.72.43.80.46
M. Hamamache KHEDDOUCI
Université Claude Bernard Lyon 1
Bât. Nautibus 43, Boulevard du 11 novembre 1918 69 622 Villeurbanne Cedex France Tél : 04.72.44.83.69 [email protected]
Matériaux
MATÉRIAUX DE LYON
http://ed34.universite-lyon.fr
Sec. : Yann DE ORDENANA
Tél : 04.72.18.62.44
M. Stéphane BENAYOUN
Ecole Centrale de Lyon
Laboratoire LTDS
36 avenue Guy de Collongue
69134 Ecully CEDEX
Tél : 04.72.18.64.37 [email protected]
MEGA MÉCANIQUE, ÉNERGÉTIQUE,
GÉNIE CIVIL, ACOUSTIQUE
http://edmega.universite-lyon.fr
Sec. : Stéphanie CAUVIN
Tél : 04.72.43.71.70
Bâtiment Direction INSA Lyon
M. Jocelyn BONJOUR
INSA Lyon
Laboratoire CETHIL
Bâtiment Sadi-Carnot
9, rue de la Physique
69621 Villeurbanne CEDEX [email protected]
ScSo ScSo
https://edsciencessociales.universite-lyon.fr
Sec. : Mélina FAVETON
INSA : J.Y. TOUSSAINT
Tél : 04.78.69.77.79 [email protected]
M. Christian MONTES
Université Lumière Lyon 2
86 Rue Pasteur
69365 Lyon CEDEX 07 [email protected]


Roses are red,Violets are blue...
But should VQA expect them to?

A B S T R A C T
This thesis addresses the Visual Question Answering (VQA) task through the prismof biases and reasoning. VQA is a visual reasoning task where a model is asked toautomatically answer questions posed over images. Despite impressive improvementmade by deep learning approaches, VQA models are notorious for their tendency to relyon dataset biases. The large and unbalanced diversity of questions and concepts involvedin the task, and the lack of well-annotated data, tend to prevent deep learning modelsfrom learning to “reason”. Instead, it leads them to perform “shortcuts”, relying on specifictraining set statistics, which is not helpful for generalizing to real-world scenarios.
Because the root of this generalization curse is first and foremost a task definitionproblem, our first objective is to rethink the evaluation of VQA models. Questions andconcepts being unequally distributed, the standard VQA evaluation metric, consisting inmeasuring the overall in-domain accuracy, tends to favour models which exploit subtletraining set statistics. If the model predicts the correct answer of a question, is it necessarilyreasoning? Can we detect when the model prediction is right for the right reason? And, atthe opposite, can we identify when the model is “cheating” by using statistical shortcuts?We overcome these concerns by introducing the gqa-ood benchmark: we measure andcompare accuracy over both rare and frequent question-answer pairs, and argue that theformer is better suited to evaluate the reasoning abilities. We experimentally demonstratethat VQA models, including bias reduction methods, dramatically fail in this setting.
Evaluating models on benchmarks is important but not sufficient, it only gives anincomplete understanding of their capabilities. We conduct a deep analysis of a state-of-the-art Transformer VQA architecture, by studying its internal attention mechanisms.Our experiments provide evidence of the existence of operating reasoning patterns, atwork in the model’s attention layers, when the training conditions are favourable enough.More precisely, they appear when the visual representation is perfect, suggesting thatuncertainty in vision is a dominating factor preventing the learning of reasoning. Bycollaborating with the data visualization experts, we have participated in the design ofVisQA, a visual analytics tool exploring the question of reasoning vs shortcuts in VQA.
Finally, drawing conclusion from our evaluations and analyses, we come up withmethods for improving VQA model performances. First, we propose to directly supervisethe reasoning through a proxy loss measuring the fine-grained word-object alignment.We demonstrate, both experimentally and theoretically, the benefit of such reasoningsupervision. Second, we explore the transfer of reasoning patterns learned by a visualoracle, trained with perfect visual input, to a standard VQA model with imperfect vi-sual representation. Experiments show the transfer improves generalization and allowsdecreasing the dependency on dataset biases. Furthermore, we demonstrate that thereasoning supervision can be used as a catalyst for transferring the reasoning patterns.
vii

R É S U M É
“De quelle couleur est le terrain de tennis ? Quelle est la taille du chien ? Y a-t-il une voitureà droite du vélo sous le cocotier ?” Répondre à ces questions fondamentales est le sujet dela tâche appelée question-réponses visuelle (VQA, en anglais), dans laquelle un agent doitrépondre à des questions posées sur des images.
contexte et motivations
Plus précisément, le VQA requiert de mettre au point un agent capable de maitriser unegrande variété de compétences : reconnaître des objets, reconnaitre des attributs (couleur,taille, matériaux, etc.), identifier des relations (e.g. spatiales), déduire des enchainementslogiques, etc. C’est pourquoi, le VQA est parfois désigné comme un test de Turing vi-suel (Geman et al. 2015), dont le but est d’évaluer la capacité d’un agent à raisonner surdes images. Cette tâche a récemment connu d’important progrès grâce à l’utilisation desréseaux de neurones et de l’apprentissage profond (Goodfellow et al. 2016).
Après une revue détaillée de l’État de l’Art sur le VQA, ainsi qu’une définition de notreutilisation du terme raisonnement (Partie I), nous nous intéressons à la question suivante(Partie II) : les modèles de VQA actuels raisonnent-ils vraiment ? La mise en œuvre d’unenouvelle méthode d’évaluation (GQA-OOD) nous permettra de répondre négativementà cette question. En particulier, nous mettrons en évidence la tendance des modèles àapprendre des raccourcis (Geirhos et al. 2020), autrement appelés biais, présent dans lesdonnées d’entrainement, mais heurtant les capacités de généralisation. Nous proposeronsalors, dans une troisième partie (Partie III) une analyse approfondie des mécanismesd’attention appris par les réseaux de neurones artificiels. Nous étudierons quels sont lesenchainements aboutissant à un raisonnement, ou, au contraire, à une prédiction biaiséepar un raccourci frauduleux. La dernière et quatrième partie (Partie IV) tire conclusionde nos évaluations et analyses, afin de développer de nouvelles méthodes améliorant lesperformances des modèles de VQA.
résumé des contributions
Les contributions sont divisées en trois grandes parties “Évaluer, Analyser, Améliorer” :
évaluer (Partie II) Nous proposons une nouvelle méthode d’évaluation – appeléegqa-ood – permettant de mieux appréhender les capacités de raisonnement des systèmesde VQA. En particulier, nous mesurons le taux de bonnes réponses prédites par l’agenten fonction de la rareté de la réponse dans les données d’entrainement. Notre étudeexpérimentale montre que les systèmes de l’État-de-l’Art, incluant les méthodes spécifi-quement conçues pour réduire l’impact des biais, échouent à répondre aux questions dont
ix
la réponse est rare. Ce résultat mets en exergue la tendance des modèles à apprendre desbiais dans les données d’entrainement, au lieu de raisonner.
analyser (Partie III) Dans le but de compléter notre évaluation du biais et duraisonnement dans les systèmes de VQA, nous conduisons une analyse poussée desmécanismes d’attention appris par les modèles. Plus précisément, nous dressons uneétude détaillée des cartes d’attention apprises par des modèles basés sur une architectureTransformers (Vaswani et al. 2017). Dans ce contexte, nous présentons VisQA, un outil devisualisation interactif, dont nous avons participé à la conception, en collaboration avecThéo Jaunet. De plus, nous mettons en œuvre une analyse statistique de ces mêmes cartesd’attention, afin de mettre en évidence l’existence de patterns de raisonnement émergeantdurant l’apprentissage, lorsque les données visuelles sont parfaites.
améliorer (Partie IV) Enfin, nous exploitons les résultats de nos analyses et évalua-tions et mettons au point plusieurs méthodes améliorant les performances des systèmes deVQA. Dans un premier temps, nous montrons qu’il est possible de directement superviserle raisonnement durant l’apprentissage, au moyen d’une utilisation judicieuse des annota-tions de nos jeux de données, et que cela permets d’améliorer le taux de bonne prédictionde nos modèles. Dans un second temps, nous concevons une méthode permettant detransférer les patterns de raisonnement appris lorsque les conditions d’entrainement sontfavorables (données visuelles parfaites), vers un modèle traitant des données réalistes,mais bruitées. Nous montrons que ce transfert améliore les performances sur le VQA, etqu’il est complémentaire avec la méthode de supervision précédemment présentée.
** *
En conclusion, cette thèse a pour objet l’étude du raisonnement visuel dans des réseauxde neurones artificiels entrainés par apprentissage profond, dans le cadre du VQA. Maissurtout, ce qui nous intéressera en premier lieu, c’est l’évaluation et l’analyse de l’influencequ’ont les biais, présents dans les données d’apprentissage, sur les prédictions de nosmodèles. Ce sujet de recherche pourra se résumer par ces quelques vers détournés d’unecomptine anglaise :
Roses are red,Violets are blue...
But should VQA expect them to ?
x
R E M E R C I E M E N T S
Maintenant, il paraît que je suis Docteur en IA ! Mais, ce que je vais retenir de mathèse, c’est avant tout toutes les personnes que j’ai pu rencontrer et apprécier, et qui
m’ont accompagné durant ce périple. Cette page ne suffira pas à leur rendre hommage,mais elle contribuera, je l’espère, à exprimer la gratitude que je ressens à leur égard.
Evidemment, je commence par remercier mes encadrants. Merci Christian. À chaquefois, je m’émerveille de voir ton engagement et ta passion pour la recherche. Mais
surtout, c’est ta bienveillance sans faille que je retiendrais. Merci Moez. Ta capacité àvoir le positif, même quand on est au fond du trou, m’étonnera toujours. Et pourtant, laplupart du temps, tu as raison. Merci Grigory. Je fus ton premier doctorant, mais j’espèreque je ne serai pas le dernier, pour que tu puisses faire profiter à d’autres ton encadrementexceptionnel. Je sais que je peux toujours compter sur toi, aussi bien pour savoir commentchanger des couches de réseau de neurones que pour changer des couches de bébés.
Réussir une thèse requiert d’être bien entouré : par chance, je l’ai été. Merci à l’équipeMAS d’Orange Innovation qui m’a accueillie en son sein. Merci Khaoula, Olivier
L., Stéphane, Olivier Z., Nicolas, Michel. Claudia, Benoît, Patrice, Pierrick, Emmanuel,et tous les autres. Un merci spécial à Valentin, tu as été un modèle pour moi, depuismes premiers pas de stagiaire jusqu’au jour de ma soutenance. Je pense également auxdoctorants, ex-doctorants et jeunes chercheurs du LIRIS avec qui j’ai partagé le quotidiendurant de (trop) courts séjours dans leurs magnifiques préfabriqués de l’INSA Lyon.Merci Edward, Fabien, Quentin D., Quentin P., Assem, Eric, Guillaume et Steeven. Enparticulier, merci Pierre et Théo J. avec qui j’ai eu l’immense plaisir de collaborer. Enfin,merci aux GPUs qui ont parfois été mes seuls amis durant ses trois années : les cafardsdu Liris (Oggy, Joey, Deedee, Marky et Bob), le DGX et ses camarades GTX, RTX, etc.
Car ce sont eux qui, par leurs critiques et remarques exigeantes, m’ont permis d’avan-cer dans ma thèse, je remercie toutes les personnes ayant usé de leur expertise pour
évaluer mes travaux. Je pense à Nicolas Thome et Eric Guérin, merci d’avoir participé auxcomités de suivi annuel. Je remercie également les rapporteurs et examinateurs de monjury, David Picard, Nicolas Thome, Cordelia Schmid, Damien Teney and Akata Zeynep.Avec un remerciement spécial pour Damien Teney, dont j’ai croisé la route à plusieursreprises durant ma thèse, et qui a été un modèle et une source d’inspiration.
Il me reste à remercier ma famille, qui a pris soin d’injecter l’amour de la science dansmon réseau de neurones non-artificiels. Merci à mes amis, et en particulier à Amaury
et Théo L. pour tous les bons moments partagés. Merci Adèle, pour ton soutien sans faille,mais aussi pour m’avoir montré que la vie est belle, même quand rien ne marche dans lathèse. Merci d’avoir collaboré à la fabrication d’Élie, venu au monde le dernier jour de mathèse, et qui est surement le modèle de VQA le plus évolué que j’ai conçu à ce jour.
xi

C O N T E N T S
Abstract viiRésumé ixRemerciements xicontents xiiilist of figures xvlist of tables xixAcronyms xxi
1 general introduction 3
1.1 Context and motivation . . . . . . . . . . . . . . . . . . . . . . . . . . . . . . 3
1.2 Contributions of the thesis . . . . . . . . . . . . . . . . . . . . . . . . . . . . . 6
1.3 Industrial context . . . . . . . . . . . . . . . . . . . . . . . . . . . . . . . . . . 8
I background : vqa & reasoning
2 reasoning vs . shortcut learning 11
2.1 An attempt to define “reasoning” . . . . . . . . . . . . . . . . . . . . . . . . . 11
2.2 Reasoning, induction and intelligence . . . . . . . . . . . . . . . . . . . . . . 11
2.3 The many faces of “reasoning” . . . . . . . . . . . . . . . . . . . . . . . . . . 12
2.4 Reasoning as the opposite of shortcut learning . . . . . . . . . . . . . . . . . 14
2.5 VQA: a visual reasoning task? . . . . . . . . . . . . . . . . . . . . . . . . . . 16
3 visual question answering 17
3.1 Context: vision-and-language understanding . . . . . . . . . . . . . . . . . . 17
3.2 VQA Datasets . . . . . . . . . . . . . . . . . . . . . . . . . . . . . . . . . . . . 18
3.3 Dissecting the VQA pipeline . . . . . . . . . . . . . . . . . . . . . . . . . . . 19
3.4 Attempts to reduce the bias-dependency . . . . . . . . . . . . . . . . . . . . 26
3.5 Case study: LXMERT . . . . . . . . . . . . . . . . . . . . . . . . . . . . . . . . 27
II evaluate
Introduction 35
4 pitfalls of vqa evaluation 37
4.1 Introduction . . . . . . . . . . . . . . . . . . . . . . . . . . . . . . . . . . . . . 37
4.2 VQA datasets . . . . . . . . . . . . . . . . . . . . . . . . . . . . . . . . . . . . 37
4.3 Measuring robustness in VQA . . . . . . . . . . . . . . . . . . . . . . . . . . 45
4.4 Pitfalls of VQA evaluation . . . . . . . . . . . . . . . . . . . . . . . . . . . . . 49
4.5 Conclusion . . . . . . . . . . . . . . . . . . . . . . . . . . . . . . . . . . . . . . 51
5 gqa-ood : evaluating vqa in ood settings 53
5.1 Introduction . . . . . . . . . . . . . . . . . . . . . . . . . . . . . . . . . . . . . 53
5.2 gqa-ood: a benchmark for OOD settings . . . . . . . . . . . . . . . . . . . . 54
5.3 Experiments . . . . . . . . . . . . . . . . . . . . . . . . . . . . . . . . . . . . . 58
5.4 Visualising predictions . . . . . . . . . . . . . . . . . . . . . . . . . . . . . . . 67
xiii
5.5 Discussion and conclusions . . . . . . . . . . . . . . . . . . . . . . . . . . . . 67
III analyse
Introduction 73
6 investigating attention in transformers 75
6.1 Introduction . . . . . . . . . . . . . . . . . . . . . . . . . . . . . . . . . . . . . 75
6.2 A short introduction to VisQA . . . . . . . . . . . . . . . . . . . . . . . . . . 77
6.3 Motivating case study . . . . . . . . . . . . . . . . . . . . . . . . . . . . . . . 80
6.4 Evaluation with Domain Experts . . . . . . . . . . . . . . . . . . . . . . . . . 81
6.5 Conclusion . . . . . . . . . . . . . . . . . . . . . . . . . . . . . . . . . . . . . . 85
7 on the emergence of reasoning patterns in vqa 87
7.1 Introduction . . . . . . . . . . . . . . . . . . . . . . . . . . . . . . . . . . . . . 87
7.2 Vision is the bottleneck . . . . . . . . . . . . . . . . . . . . . . . . . . . . . . . 88
7.3 Visual noise vs. models with perfect-sight . . . . . . . . . . . . . . . . . . . . 90
7.4 Attention modes in VL-Transformers . . . . . . . . . . . . . . . . . . . . . . 91
7.5 Attention modes and task functions . . . . . . . . . . . . . . . . . . . . . . . 93
7.6 Attention pruning . . . . . . . . . . . . . . . . . . . . . . . . . . . . . . . . . . 96
7.7 Conclusion . . . . . . . . . . . . . . . . . . . . . . . . . . . . . . . . . . . . . . 97
IV improve
Introduction 103
8 a proxy loss for supervising reasoning 105
8.1 Introduction . . . . . . . . . . . . . . . . . . . . . . . . . . . . . . . . . . . . . 105
8.2 Supervising word-object alignment . . . . . . . . . . . . . . . . . . . . . . . . 106
8.3 Sample complexity of reasoning supervision . . . . . . . . . . . . . . . . . . 114
8.4 Conclusion . . . . . . . . . . . . . . . . . . . . . . . . . . . . . . . . . . . . . . 119
9 transferring reasoning patterns 121
9.1 Introduction . . . . . . . . . . . . . . . . . . . . . . . . . . . . . . . . . . . . . 121
9.2 Transferring reasoning patterns from Oracle . . . . . . . . . . . . . . . . . . 123
9.3 Guiding the oracle transfer . . . . . . . . . . . . . . . . . . . . . . . . . . . . 126
9.4 Conclusion . . . . . . . . . . . . . . . . . . . . . . . . . . . . . . . . . . . . . . 135
10 general conclusion 139
10.1 Summary of contributions . . . . . . . . . . . . . . . . . . . . . . . . . . . . . 139
10.2 Perspectives for future work . . . . . . . . . . . . . . . . . . . . . . . . . . . . 140
a proofs : sample complexity of reasoning supervision 147
a.1 Proof of Theorem 8.3.3 . . . . . . . . . . . . . . . . . . . . . . . . . . . . . . . 147
a.2 Proof of the inequality in Equation 8.18 . . . . . . . . . . . . . . . . . . . . . 149
bibliography 151
index 162
xiv
L I S T O F F I G U R E S
Chapter 1: 3
Figure 1.1 Samples of questions addressed by the VQA task. . . . . . . . . . . . 4
Figure 1.2 VQA models are notorious for exploiting biases. . . . . . . . . . . . 5
Figure 1.3 Organization of the manuscript . . . . . . . . . . . . . . . . . . . . . 7
Chapter 2: 11
Figure 2.1 Illustration of shortcut learning in an image recognition algorithm. 14
Figure 2.2 Taxonomy of decision rules. . . . . . . . . . . . . . . . . . . . . . . . 15
Chapter 3: 17
Figure 3.1 Example of two other reasoning tasks. . . . . . . . . . . . . . . . . . 18
Figure 3.2 Schematic illustration of the standard VQA pipeline. . . . . . . . . 19
Figure 3.3 Grid vs object-level features. . . . . . . . . . . . . . . . . . . . . . . . 20
Figure 3.4 The Bottom-Up Top-Down (UpDn) architecture. . . . . . . . . . . . 21
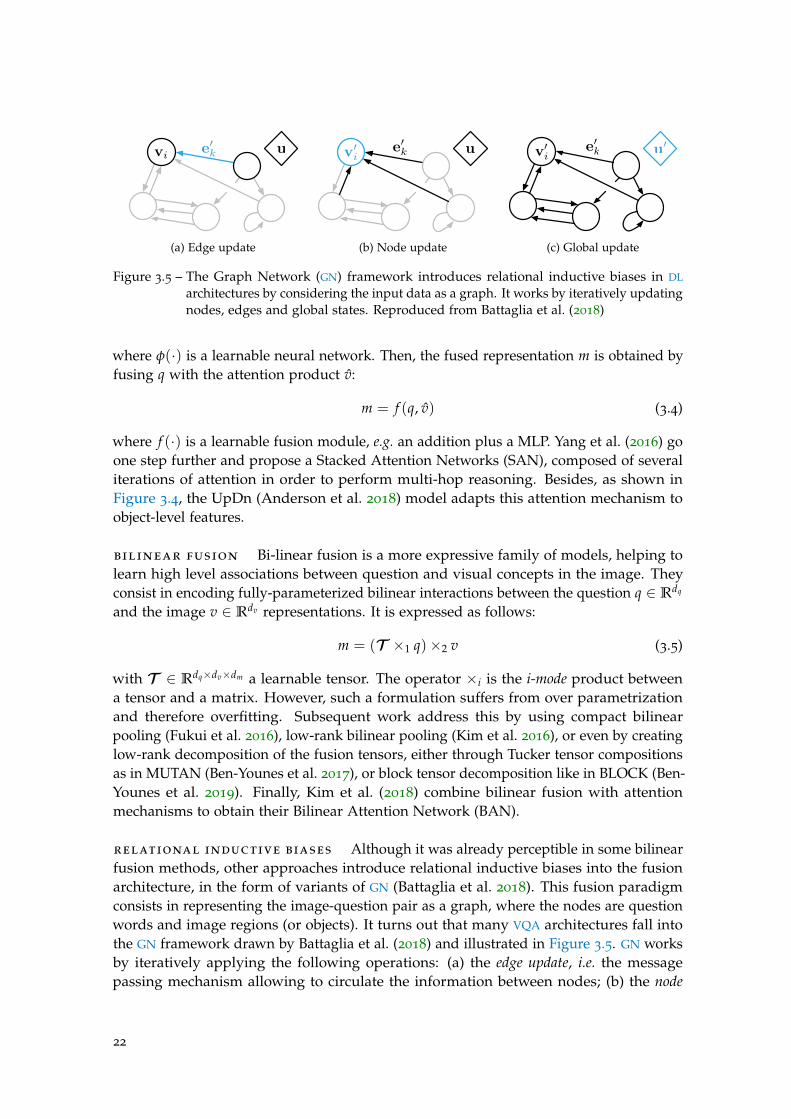
Figure 3.5 The Graph Network (GN) framework. . . . . . . . . . . . . . . . . . 22
Figure 3.6 Illustration of Graph VQA and LCGN. . . . . . . . . . . . . . . . . . 23
Figure 3.7 Multimodal self-attention. . . . . . . . . . . . . . . . . . . . . . . . . 24
Figure 3.8 The LXMERT pre-training. . . . . . . . . . . . . . . . . . . . . . . . . 25
Figure 3.9 Holistic architectures. . . . . . . . . . . . . . . . . . . . . . . . . . . . 25
Figure 3.10 RUBi: mitigating question biases in VQA. . . . . . . . . . . . . . . . 26
Figure 3.11 Schematic illustration of the VL-Transformer architecture. . . . . . 28
Chapter 3: 35
Figure 3.12 VQA models achieve near human performance on VQAv2. . . . . . 36
Chapter 4: 37
Figure 4.1 Illustration of a balanced pair in VQAv2. . . . . . . . . . . . . . . . 38
Figure 4.2 Annotators’ directives for the VQA dataset. . . . . . . . . . . . . . . 39
Figure 4.3 Tricky questions from VQAv1 and VQAv2. . . . . . . . . . . . . . . 39
Figure 4.4 Question requiring common-sense knowledge in VQAv2. . . . . . . 40
Figure 4.5 VizWiz samples. . . . . . . . . . . . . . . . . . . . . . . . . . . . . . . 41
Figure 4.6 CLEVR samples. . . . . . . . . . . . . . . . . . . . . . . . . . . . . . . 41
Figure 4.7 GQA samples. . . . . . . . . . . . . . . . . . . . . . . . . . . . . . . . 43
Figure 4.8 GQA samples . . . . . . . . . . . . . . . . . . . . . . . . . . . . . . . 43
Figure 4.9 GQA samples. . . . . . . . . . . . . . . . . . . . . . . . . . . . . . . . 43
Figure 4.10 Issues in GQA annotation. . . . . . . . . . . . . . . . . . . . . . . . . 44
Figure 4.11 Robustness against visual variations. . . . . . . . . . . . . . . . . . . 46
Figure 4.12 VQA-Introspect. . . . . . . . . . . . . . . . . . . . . . . . . . . . . . . 46
Figure 4.13 The VQA-CP benchmark. . . . . . . . . . . . . . . . . . . . . . . . . 48
Figure 4.14 VQA Counterexample (CE). . . . . . . . . . . . . . . . . . . . . . . . 48
xv
Chapter 5: 53
Figure 5.1 gqa-ood teaser. . . . . . . . . . . . . . . . . . . . . . . . . . . . . . . 54
Figure 5.2 gqa-ood protocol. . . . . . . . . . . . . . . . . . . . . . . . . . . . . . 55
Figure 5.3 Distribution of the semantic types as defined in GQA. . . . . . . . . 57
Figure 5.4 Distribution of the structural types as defined in GQA. . . . . . . . 57
Figure 5.5 Acc-tail performance for differents models. . . . . . . . . . . . . . . 61
Figure 5.6 Head/tail confusion for different models. . . . . . . . . . . . . . . . 62
Figure 5.7 Estimation of the reasoning label. . . . . . . . . . . . . . . . . . . . . 63
Figure 5.8 Acc-tail performance for de-bias methods. . . . . . . . . . . . . . . . 65
Figure 5.9 Head/tail confusion for de-bias methods. . . . . . . . . . . . . . . . 65
Figure 5.10 What is the man on? . . . . . . . . . . . . . . . . . . . . . . . . . . . 68
Figure 5.11 Is the shirt brown or blue? . . . . . . . . . . . . . . . . . . . . . . . . 68
Figure 5.12 Which kind of clothing is white? . . . . . . . . . . . . . . . . . . . . 69
Figure 5.13 What is the brown animal in the picture? . . . . . . . . . . . . . . . 69
Chapter 5: 73
Chapter 6: 75
Figure 6.1 VisQA teaser. . . . . . . . . . . . . . . . . . . . . . . . . . . . . . . . 76
Figure 6.2 Is the knife in the top part of the photo? . . . . . . . . . . . . . . . . 77
Figure 6.3 Visualization of an attention map for two baselines. . . . . . . . . . 81
Figure 6.4 Is the person wearing shorts? . . . . . . . . . . . . . . . . . . . . . . 83
Figure 6.5 Are there both knives and pizzas in this image? . . . . . . . . . . . 84
Figure 6.6 What is the woman holding? . . . . . . . . . . . . . . . . . . . . . . 85
Chapter 7: 87
Figure 7.1 Oracle vs standard model: gqa-ood. . . . . . . . . . . . . . . . . . . 91
Figure 7.2 Attention modes learned by the oracle model. . . . . . . . . . . . . 92
Figure 7.3 Oracle vs standard model: k-distribution. . . . . . . . . . . . . . . . 93
Figure 7.4 Oracle: attention vs function. . . . . . . . . . . . . . . . . . . . . . . 94
Figure 7.5 nfluence of the question on oracle’s bimorph attention heads. . . . 95
Figure 7.6 Oracle vs standard model: t-SNE of the attention mode space. . . . 96
Figure 7.7 Oracle vs standard model: pruning . . . . . . . . . . . . . . . . . . . 98
Figure 7.8 Oracle vs standard model: choose color. . . . . . . . . . . . . . . . . 99
Figure 7.9 Oracle vs standard model: pruning (full). . . . . . . . . . . . . . . . 100
Chapter 7: 103
Figure 7.10 What is the woman holding? . . . . . . . . . . . . . . . . . . . . . . 104
Chapter 8: 105
Figure 8.1 Fine-grained word-object alignment. . . . . . . . . . . . . . . . . . . 106
Figure 8.2 The word-object alignment module in VL-Transformer. . . . . . . . 107
Figure 8.3 The vision-language alignment decoder. . . . . . . . . . . . . . . . . 108
Figure 8.4 Visualization of the learned attention maps. . . . . . . . . . . . . . . 113
Figure 8.5 Reasoning supervision reduces sample complexity. . . . . . . . . . 115
xvi
Chapter 9: 121
Figure 9.1 Oracle transfer teaser. . . . . . . . . . . . . . . . . . . . . . . . . . . . 122
Figure 9.2 Oracle transfer: choose color. . . . . . . . . . . . . . . . . . . . . . . 124
Figure 9.3 Oracle transfer: VisQA. . . . . . . . . . . . . . . . . . . . . . . . . . . 126
Figure 9.4 Supervising programs. . . . . . . . . . . . . . . . . . . . . . . . . . . 128
Figure 9.5 A vision+language transformer with an attached program decoder. 129
Figure 9.6 Program supervision leads to a decreased sample complexity. . . . 132
Figure 9.7 Does the boat to the left of the flag looks small or large? . . . . . . 135
Figure 9.8 Who is wearing goggles? . . . . . . . . . . . . . . . . . . . . . . . . . 136
Chapter 10: 139
xvii

L I S T O F TA B L E S
Chapter 1: 3
Chapter 2: 11
Chapter 3: 17
Chapter 4: 37
Table 4.1 Overview of the most popular VQA datasets. . . . . . . . . . . . . . 38
Table 4.2 Comparison of robustness evaluations. . . . . . . . . . . . . . . . . . 49
Chapter 5: 53
Table 5.1 Dataset statistics . . . . . . . . . . . . . . . . . . . . . . . . . . . . . . 55
Table 5.2 Evaluation of the proposed metric. . . . . . . . . . . . . . . . . . . . 59
Table 5.3 Comparison of VQA models on gqa-ood. . . . . . . . . . . . . . . . 60
Table 5.4 Comparison of VQA bias reduction techniques on gqa-ood. . . . . 64
Table 5.5 Comparison of acc-tail metric with other benchmarks. . . . . . . . . 66
Chapter 6: 75
Chapter 7: 87
Table 7.1 Are important objects correctly detected? . . . . . . . . . . . . . . . 89
Table 7.2 Impact of object detection quality . . . . . . . . . . . . . . . . . . . . 89
Table 7.3 Oracle: impact of pruning different types of attention heads. . . . . 97
Chapter 8: 105
Table 8.1 Evaluation of the object-word alignment weak supervision on GQA.110
Table 8.2 Abblation of the object-word alignment weak supervision on VQA. 111
Table 8.3 Evaluation of the object-word alignment weak supervision on NLVR2112
Table 8.4 Abblation of the object-word alignment weak supervision on NLVR2112
Chapter 9: 121
Table 9.1 Quantitative evaluation of the oracle transfer. . . . . . . . . . . . . . 125
Table 9.2 Impact of different types of transfer. . . . . . . . . . . . . . . . . . . 125
Table 9.3 Oracle transfer vs State-Of-The-Art (SOTA) on GQA and gqa-ood. . 127
Table 9.4 Training and execution time for one run. . . . . . . . . . . . . . . . 131
Table 9.5 Impact of program supervision on Oracle transfer. . . . . . . . . . . 131
Table 9.6 Abblations of program supervision. . . . . . . . . . . . . . . . . . . 133
Table 9.7 Impact of improved visual inputs on the guided oracle transfer. . . 134
Table 9.8 Guided oracle transfer vs SOTA on GQA. . . . . . . . . . . . . . . . 134
Chapter 10: 139
xix

A C R O N Y M S
NLP Natural Language Processing
VQA Visual Question Answering
OOD Out-Of-Distribution
SOTA State-Of-The-Art
GT Ground Truth
AGI Artificial General Intelligence
DL Deep Learning
ML Machine Learning
CV Computer Vision
CNN Convolutional Neural Network
GN Graph Network
SGD Stochastic Gradient Descent
xxi


1

C h a p t e r 1
G E N E R A L I N T R O D U C T I O N
1.1 context and motivation
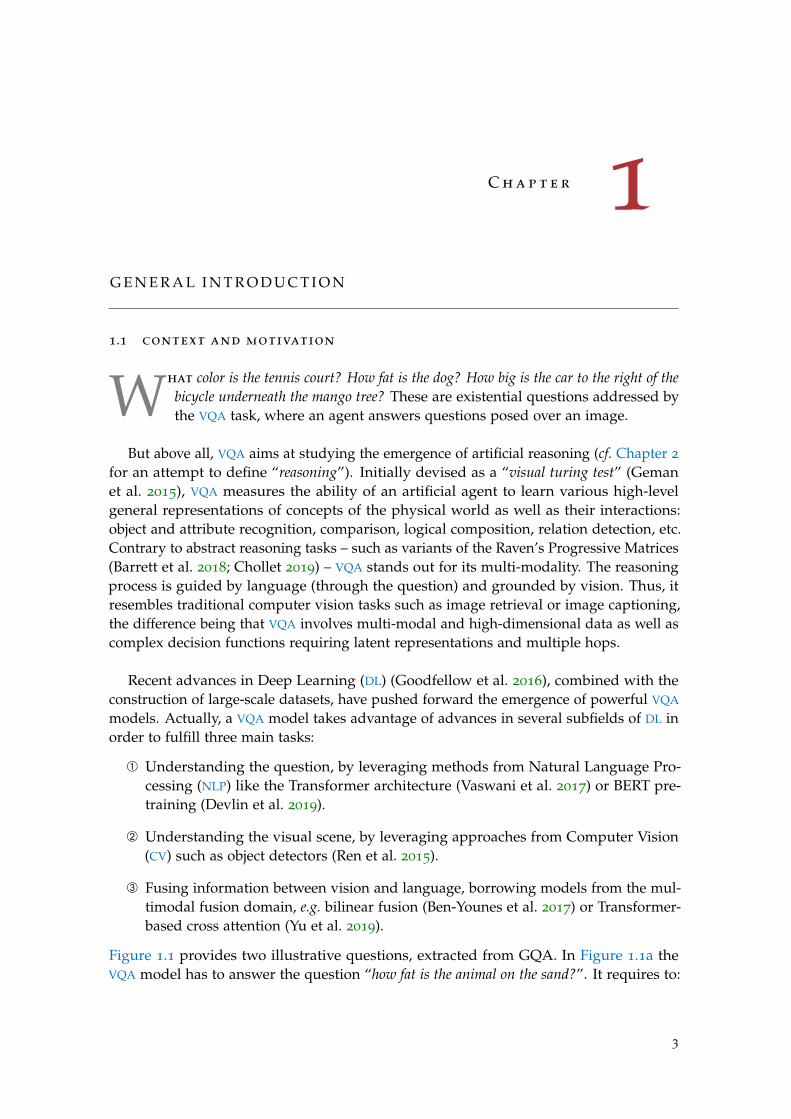
What color is the tennis court? How fat is the dog? How big is the car to the right of thebicycle underneath the mango tree? These are existential questions addressed bythe VQA task, where an agent answers questions posed over an image.
But above all, VQA aims at studying the emergence of artificial reasoning (cf. Chapter 2
for an attempt to define “reasoning”). Initially devised as a “visual turing test” (Gemanet al. 2015), VQA measures the ability of an artificial agent to learn various high-levelgeneral representations of concepts of the physical world as well as their interactions:object and attribute recognition, comparison, logical composition, relation detection, etc.Contrary to abstract reasoning tasks – such as variants of the Raven’s Progressive Matrices(Barrett et al. 2018; Chollet 2019) – VQA stands out for its multi-modality. The reasoningprocess is guided by language (through the question) and grounded by vision. Thus, itresembles traditional computer vision tasks such as image retrieval or image captioning,the difference being that VQA involves multi-modal and high-dimensional data as well ascomplex decision functions requiring latent representations and multiple hops.
Recent advances in Deep Learning (DL) (Goodfellow et al. 2016), combined with theconstruction of large-scale datasets, have pushed forward the emergence of powerful VQA
models. Actually, a VQA model takes advantage of advances in several subfields of DL inorder to fulfill three main tasks:
À Understanding the question, by leveraging methods from Natural Language Pro-cessing (NLP) like the Transformer architecture (Vaswani et al. 2017) or BERT pre-training (Devlin et al. 2019).
Á Understanding the visual scene, by leveraging approaches from Computer Vision(CV) such as object detectors (Ren et al. 2015).
 Fusing information between vision and language, borrowing models from the mul-timodal fusion domain, e.g. bilinear fusion (Ben-Younes et al. 2017) or Transformer-based cross attention (Yu et al. 2019).
Figure 1.1 provides two illustrative questions, extracted from GQA. In Figure 1.1a theVQA model has to answer the question “how fat is the animal on the sand?”. It requires to:
3
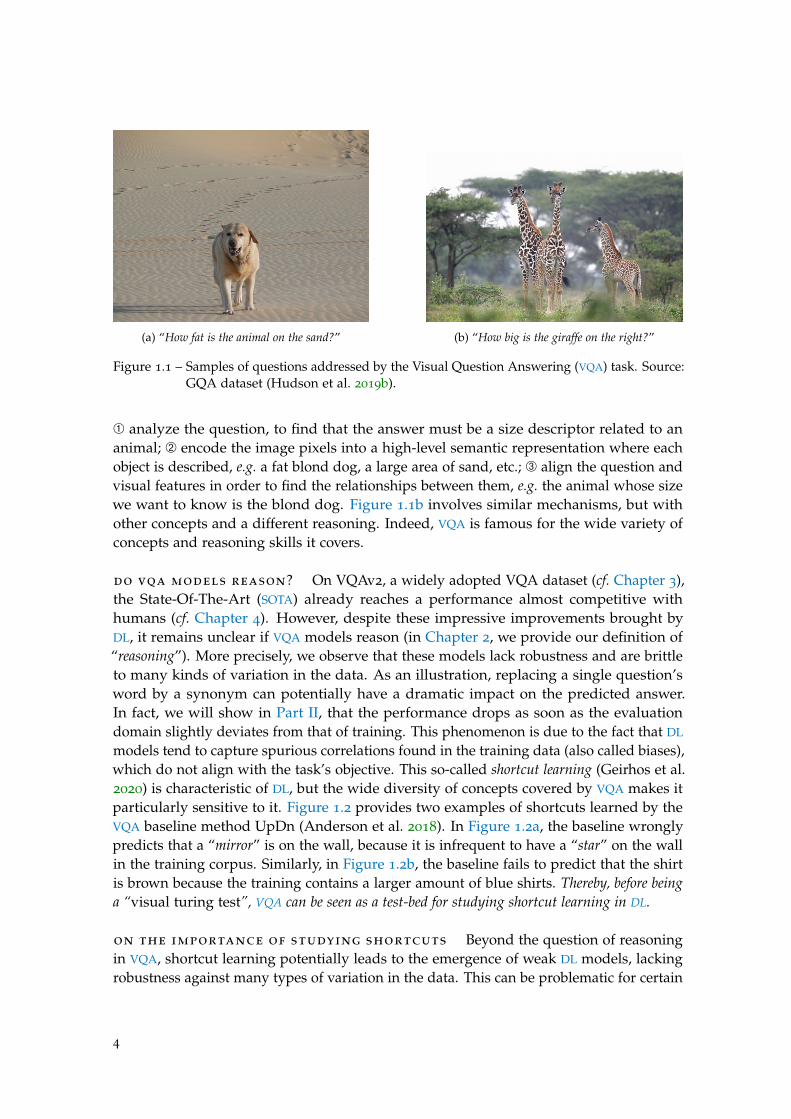
(a) “How fat is the animal on the sand?” (b) “How big is the giraffe on the right?”
Figure 1.1 – Samples of questions addressed by the Visual Question Answering (VQA) task. Source:GQA dataset (Hudson et al. 2019b).
À analyze the question, to find that the answer must be a size descriptor related to ananimal; Á encode the image pixels into a high-level semantic representation where eachobject is described, e.g. a fat blond dog, a large area of sand, etc.; Â align the question andvisual features in order to find the relationships between them, e.g. the animal whose sizewe want to know is the blond dog. Figure 1.1b involves similar mechanisms, but withother concepts and a different reasoning. Indeed, VQA is famous for the wide variety ofconcepts and reasoning skills it covers.
do vqa models reason? On VQAv2, a widely adopted VQA dataset (cf. Chapter 3),the State-Of-The-Art (SOTA) already reaches a performance almost competitive withhumans (cf. Chapter 4). However, despite these impressive improvements brought byDL, it remains unclear if VQA models reason (in Chapter 2, we provide our definition of“reasoning”). More precisely, we observe that these models lack robustness and are brittleto many kinds of variation in the data. As an illustration, replacing a single question’sword by a synonym can potentially have a dramatic impact on the predicted answer.In fact, we will show in Part II, that the performance drops as soon as the evaluationdomain slightly deviates from that of training. This phenomenon is due to the fact that DL
models tend to capture spurious correlations found in the training data (also called biases),which do not align with the task’s objective. This so-called shortcut learning (Geirhos et al.2020) is characteristic of DL, but the wide diversity of concepts covered by VQA makes itparticularly sensitive to it. Figure 1.2 provides two examples of shortcuts learned by theVQA baseline method UpDn (Anderson et al. 2018). In Figure 1.2a, the baseline wronglypredicts that a “mirror” is on the wall, because it is infrequent to have a “star” on the wallin the training corpus. Similarly, in Figure 1.2b, the baseline fails to predict that the shirtis brown because the training contains a larger amount of blue shirts. Thereby, before beinga “visual turing test”, VQA can be seen as a test-bed for studying shortcut learning in DL.
on the importance of studying shortcuts Beyond the question of reasoningin VQA, shortcut learning potentially leads to the emergence of weak DL models, lackingrobustness against many types of variation in the data. This can be problematic for certain
4
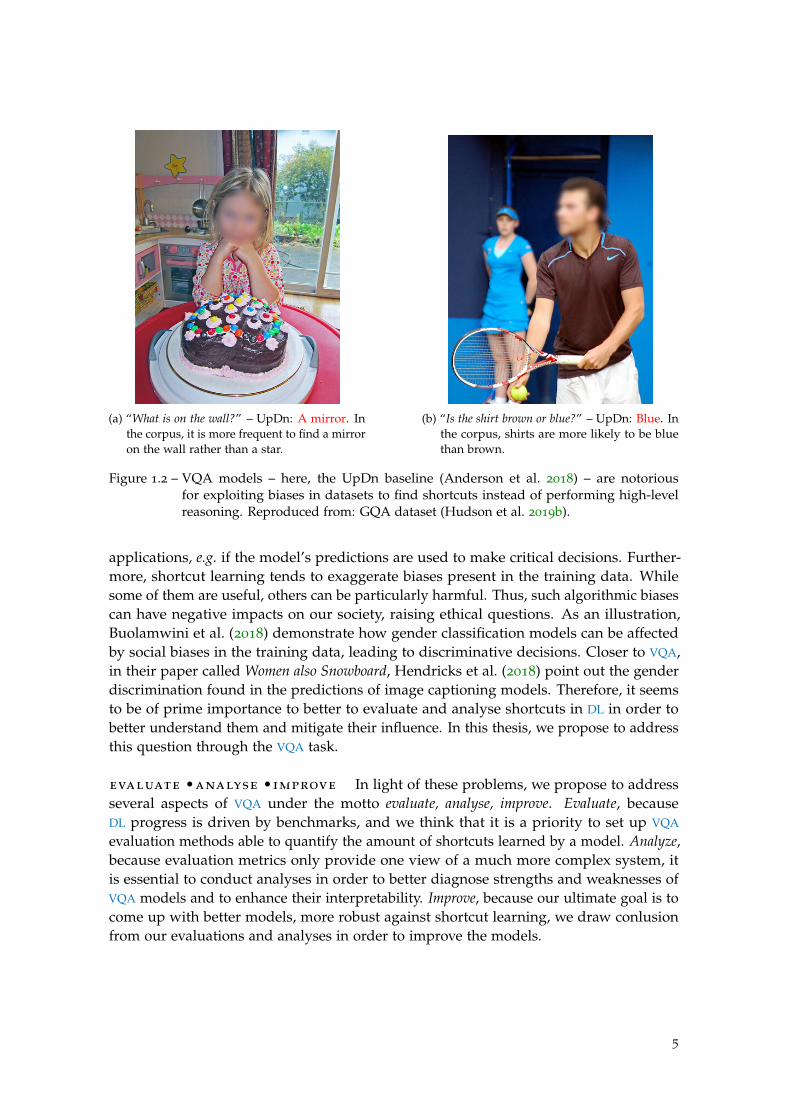
(a) “What is on the wall?” – UpDn: A mirror. Inthe corpus, it is more frequent to find a mirroron the wall rather than a star.
(b) “Is the shirt brown or blue?” – UpDn: Blue. Inthe corpus, shirts are more likely to be bluethan brown.
Figure 1.2 – VQA models – here, the UpDn baseline (Anderson et al. 2018) – are notoriousfor exploiting biases in datasets to find shortcuts instead of performing high-levelreasoning. Reproduced from: GQA dataset (Hudson et al. 2019b).
applications, e.g. if the model’s predictions are used to make critical decisions. Further-more, shortcut learning tends to exaggerate biases present in the training data. Whilesome of them are useful, others can be particularly harmful. Thus, such algorithmic biasescan have negative impacts on our society, raising ethical questions. As an illustration,Buolamwini et al. (2018) demonstrate how gender classification models can be affectedby social biases in the training data, leading to discriminative decisions. Closer to VQA,in their paper called Women also Snowboard, Hendricks et al. (2018) point out the genderdiscrimination found in the predictions of image captioning models. Therefore, it seemsto be of prime importance to better to evaluate and analyse shortcuts in DL in order tobetter understand them and mitigate their influence. In this thesis, we propose to addressthis question through the VQA task.
evaluate •analyse •improve In light of these problems, we propose to addressseveral aspects of VQA under the motto evaluate, analyse, improve. Evaluate, becauseDL progress is driven by benchmarks, and we think that it is a priority to set up VQA
evaluation methods able to quantify the amount of shortcuts learned by a model. Analyze,because evaluation metrics only provide one view of a much more complex system, itis essential to conduct analyses in order to better diagnose strengths and weaknesses ofVQA models and to enhance their interpretability. Improve, because our ultimate goal is tocome up with better models, more robust against shortcut learning, we draw conlusionfrom our evaluations and analyses in order to improve the models.
5
1.2 contributions of the thesis
1.2.1 Organization of the manuscript
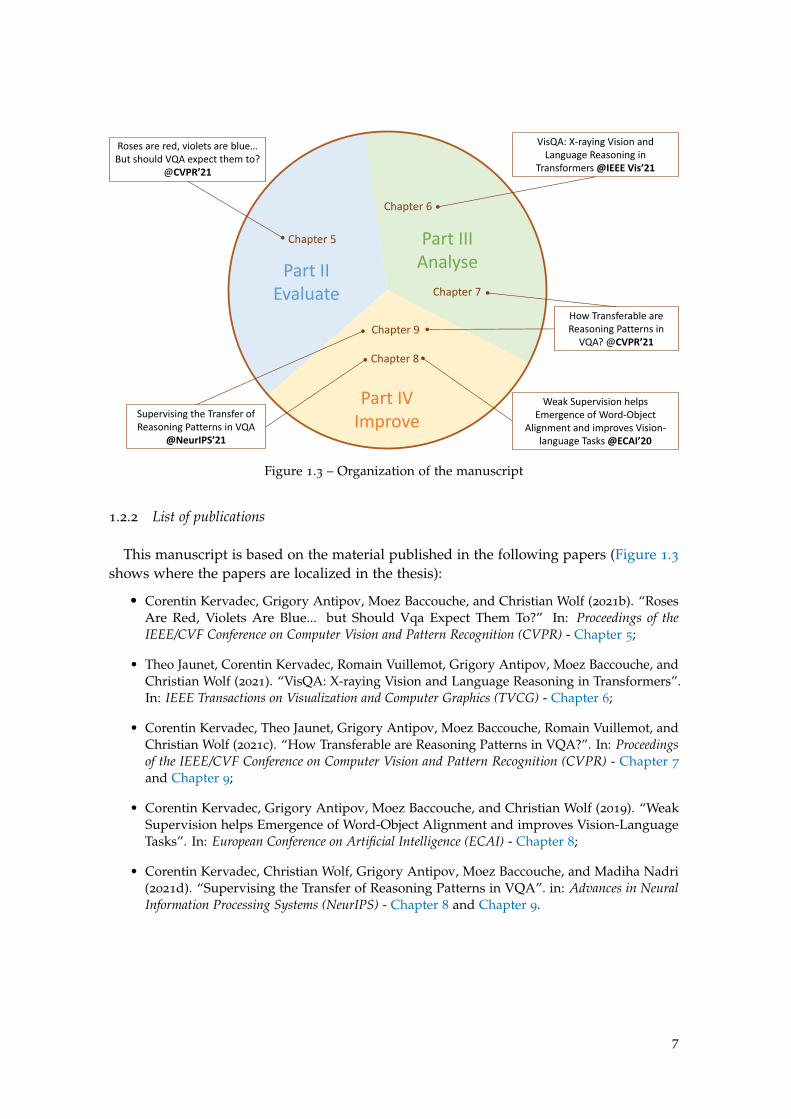
The manuscript is organized as follows. Part I provides the background necessary forthe reader to understand our work. Then, Part II, Part III, and Part IV, introduce thecontributions of this thesis.
Part I (background) provides the background knowledge required to understandthe contributions introduced in the thesis. It includes an overview of the DL approachesfor VQA, and a discussion on the notion of reasoning and shortcut learning in DL. Weassume that the reader is already familiar with DL and neural networks (cf. Goodfellowet al. (2016)). – Chapter 2 and Chapter 3.
Part II (evaluate) focuses on the evaluation of VQA models. More precisely, wewonder: can we measure the reasoning ability of VQA models? This part begins with a compre-hensive study of popular datasets and benchmarks used in VQA, with a critical reviewof their strengths and weaknesses. We show that the standard evaluation metric (i.e. theoverall accuracy) is not sufficient to measure the robustness against many kinds of varia-tions (linguistic reformulations, visual editions, distribution shift, etc.), which is related tothe reasoning capacity. Hence, we introduce gqa-ood, a benchmark devised to evaluateVQA models in Out-Of-Distribution (OOD) setting. We experimentally demonstrate thatSOTA VQA models – even those specifically designed for bias reduction – fail in our OOD
setting. – Chapter 4 and Chapter 5
Part III (analyze) complements the evaluation with an extensive analysis of rea-soning and bias exploitation in VQA. Resulting from a collaboration with Théo Jaunet – aPhD candidate working on explainable AI with data visualization – we develop VisQA,an interactive tool targeting the instance-based analysis of the attention mechanismslearned by a SOTA Transformer-based VQA model. In addition, we extend VisQA witha dataset-level analysis. In particular, we propose to study the emergence of reasoningpatterns in the attention maps learned by a perfect sighted model (fed with ground truthvisual input) and compare it with the standard setting. We experimentally demonstratethat the oracle model more easily learns to relate attention to the task at hand, suggestinga better reasoning. – Chapter 6 and Chapter 7.
Part IV (improve) draws conclusions from the evaluate and analyze parts and pro-poses to improve the VQA model performances. Two directions are explored: (1) supervis-ing the reasoning trough additional objective losses, and (2) transferring the knowledgelearned by an oracle with perfect sight to a deployable model. We provide experimentaland theoretical evidences demonstrating the effectiveness of these approaches, as well astheir complementary. – Chapter 8 and Chapter 9.
6
Part II Evaluate
Part IVImprove
Part III Analyse
Supervising the Transfer of Reasoning Patterns in VQA
@NeurIPS’21
How Transferable are Reasoning Patterns in
VQA? @CVPR’21
Weak Supervision helps Emergence of Word-Object
Alignment and improves Vision-language Tasks @ECAI’20
VisQA: X-raying Vision and Language Reasoning in
Transformers @IEEE Vis’21
Roses are red, violets are blue… But should VQA expect them to?
@CVPR’21
Chapter 5
Chapter 6
Chapter 7
Chapter 9
Chapter 8
Figure 1.3 – Organization of the manuscript
1.2.2 List of publications
This manuscript is based on the material published in the following papers (Figure 1.3shows where the papers are localized in the thesis):
• Corentin Kervadec, Grigory Antipov, Moez Baccouche, and Christian Wolf (2021b). “RosesAre Red, Violets Are Blue... but Should Vqa Expect Them To?” In: Proceedings of theIEEE/CVF Conference on Computer Vision and Pattern Recognition (CVPR) - Chapter 5;
• Theo Jaunet, Corentin Kervadec, Romain Vuillemot, Grigory Antipov, Moez Baccouche, andChristian Wolf (2021). “VisQA: X-raying Vision and Language Reasoning in Transformers”.In: IEEE Transactions on Visualization and Computer Graphics (TVCG) - Chapter 6;
• Corentin Kervadec, Theo Jaunet, Grigory Antipov, Moez Baccouche, Romain Vuillemot, andChristian Wolf (2021c). “How Transferable are Reasoning Patterns in VQA?”. In: Proceedingsof the IEEE/CVF Conference on Computer Vision and Pattern Recognition (CVPR) - Chapter 7
and Chapter 9;
• Corentin Kervadec, Grigory Antipov, Moez Baccouche, and Christian Wolf (2019). “WeakSupervision helps Emergence of Word-Object Alignment and improves Vision-LanguageTasks”. In: European Conference on Artificial Intelligence (ECAI) - Chapter 8;
• Corentin Kervadec, Christian Wolf, Grigory Antipov, Moez Baccouche, and Madiha Nadri(2021d). “Supervising the Transfer of Reasoning Patterns in VQA”. in: Advances in NeuralInformation Processing Systems (NeurIPS) - Chapter 8 and Chapter 9.
7
1.2.2.1 Software and dataset contributions
The work conducted in this thesis has contributed to the following list of software andreleased dataset:
• gqa-ood: a benchmark devised to evaluate VQA in OOD setting and introduced inChapter 5. It is publicly available at https://github.com/gqa-ood/GQA-OOD.
• VisQA: a visual analytic tool that explores the question of reasoning vs biasexploitation in VQA models, introduced in Chapter 6 and publicly available athttps://visqa.liris.cnrs.fr. It is the fruit of a collaboration with Théo Jaunet, aPhD candidate working on explainable AI with data visualization.
1.3 industrial context
This thesis is part of an academia-industry collaboration between INSA Lyon andOrange Innovation (the R&D division of the telecommunication company Orange). As atelecommunication operator handling tons of data every day, Orange is highly interestedin the automatic understanding methods based on Machine Learning (ML). In particular,this thesis was initiated by the Multimedia contents Analysis technologieS (MAS) researchteam of Orange, conducting research on various ML-related topics, such as face recognition(identity, gender, age, etc.), and speech analysis (e.g. automatic speech recognition, speakerrecognition and diarization). In this context, conducting research on VQA allows to buildan expertise on the automated processing of multimodal content – here, image and text– which can be used for various purposes, such as language-based image indexation ormultimodal chatbots to improve the customer experience. Furthermore, Orange is alsosensitive to the ethical issues of the use of AI. With the intention of building algorithmsrespectful towards individuals – e.g. without social biases – it is essential for Orange tobetter understand how DL is impacted by shortcut learning.
** *
8

Part I
B A C K G R O U N D : V Q A & R E A S O N I N G

C h a p t e r 2
R E A S O N I N G V S . S H O RT C U T L E A R N I N G
2.1 an attempt to define “reasoning”
In this thesis, we want to address the problem of automated reasoning. More precisely, wetarget the VQA task where an agent has to predict answers to questions posed over images.In order to fulfill the task, the agent is required to master several skills. Among them,there are perception skills, e.g. recognizing an object and its attributes, or recognizingwords. But this is not sufficient to solve VQA. In addition to that, the agent is also requiredto compare, relate, solve logical entailment, etc. Naturally, the first word coming to ourmind to describe this set of skills is the ability to “reason”.
What does it mean to “reason”? While it is common to say that a neural network reasons,we rarely take the time to think about what it really means. At the risk of deceiving thereader, this chapter is not intended to provide an exact definition of “reasoning”. Thiswould require knowledge and expertise going far beyond the scope of this thesis. Atthe same time, it would be dishonest to dismiss the question and continue to use a termwhose lack of definition leaves too much room for interpretation. That is why, this chapteris our modest attempt to define – or, at least, provide cues on what is – “reasoning”. Inorder to narrow the question, we propose to focus on DL, and in particular we try toexplain what we mean by “reasoning” in the context of VQA.
2.2 reasoning , induction and intelligence
Reasoning is the deduction of inferences or interpretations from premises.
— Wiktionary (2021)
A plausible definition of "reasoning" could be "algebraically manipulating previously acquiredknowledge in order to answer a new question".
— Bottou (2014)
While elegant and concise, these definitions do not provide much information on what“reasoning” means. What should be the nature of the inferences and interpretations? Whatare the conditions such that a knowledge manipulation causes “reasoning”? It seemsrealistic to think that “reasoning” only appears under certain conditions.
11
induction and intelligence In DL, we conjecture that “reasoning” is related to“induction” and “intelligence”. Beforehand, let us define a close friend of the “induction”,namely “deduction”:
“Flowers have petals, a rose is a flower, so every rose has petals”The statement above is a “deductive reasoning”, where a conclusion (“every rose has petals”)is inferred from premises (“flowers have petals” and “a rose is a flower”). It is a top-downlogic, then the validity of the reasoning depends on the quality of the premises. However,it is generally not possible to learn those premises in DL. Neural networks only haveaccess to a restricted set of i.i.d. data samples, which is only partially representative ofthe infinite variations of the real world. In that context, instead of performing top-down“deduction”, DL leverages bottom-up “induction”. Let us take a new example:
“This rose has thorns, the next rose has thorns, another rose has thorns. So all roseshave thorns” 1
This does correspond to the main steps of reasoning involved in “induction”. Unlike“deduction”, the conclusion of an “inductive” reasoning is probable rather than certain. Isthat a problem? We think it is not, because it corresponds to the mechanism involvedin experimental sciences, as shown by Popper (1934). This line of thought has led todiscoveries like Newton’s second law, relativity, and the standard model of physics.However, as seen in the example below, it can lead to wrong theories:
“This rose is red, the next rose is red, another rose is red. So all roses are red”This type of spurious induction is called a “shortcut” (Geirhos et al. 2020) (see Section 2.4).As a consequence, Induction as a principle of finding truth does not consistently lead toeither all false or all true statements; The quality of the result depends on various factors,including the data from which the conclusions are derived, and the algorithm itself.
Therefore, it might be relevant to relate “inductive reasoning” to the faculty of intelligence.Legg et al. (2007) survey numerous definition of “intelligence” and propose their ownversion:
Intelligence measures an agent’s ability to achieve goals in a wide range of environments.
— Legg et al. (2007)
In that context, “intelligent reasoning” denotes the process of organizing inference andinterpretations in a way that it generalizes to multiple settings and across various envi-ronments. Thereby, it appears that “reasoning” requires “scaling to ever-larger search spacesand understanding the world broadly” (Bommasani et al. 2021), hence implying propertiessuch as consistency, causality, or compositionality.
2.3 the many faces of “reasoning”
The previous definitions remain vague, and are hardly usable in practice. Bottou (2014)tells us that rather than searching for a unique definition of “reasoning”, it might be morefruitful to consider the many faces of “reasoning”. It defines different types of reasoning,from which we find: first order logic reasoning, probabilistic reasoning, causal reasoning,or even social reasoning.
1. Because we are not botanist, we still believe that all roses do have thorns ,.
12
first order logic reasoning is probably the first facet of reasoning which comesto mind. In few words, first order logic is a powerful mathematical tool allowing to derivelogical inference between subjects and predicates. However, there is strong evidence thatthe human brains do not perform only that type of reasoning. For instance, first orderlogic is not expressive enough to describe all the nuance of natural language (Bottou 2014).Moreover, the discrete nature of first order logic leads to an expensive computation costbecause it generally involves large combinatorial searches.
probabilistic reasoning treats the problem by manipulating conditional probabil-ity distributions. This is the type of reasoning which is typically used in ML. Contraryto first order logic, the continuous nature of probability distributions allows to reducethe computation cost, by using probability theory tools such as Bayesian inference. Inaddition, it makes possible to reason under uncertainty, which is inevitable when dealingwith real-world data.
causal reasoning highlights one of the major limitation of probabilistic reasoning.Let us consider the correlation between “it is raining” and “people are carrying umbrellas”. Inthe context of probabilistic reasoning, this correlation is predictive: if “people are carryingumbrellas”, it is highly probable that “it is raining”. However, the probabilistic frameworkdoes not tell us about the effect of an intervention: if “it is raining” but “people throwaway their umbrellas”, is it still raining? Answering this question requires to model therelation of causality between premises. Here, it is the rain which causes people to carryan umbrella, and not the inverse. Pearl et al. (2000) propose to counteract this issue withcausal inference. More precisely, it defines a three-level abstraction called the ladder ofcausation. The first step, “association”, consists in modelling correlations between events,this is what is done in probabilistic reasoning. The second step, “intervention”, requiresmodeling the conditional probability distribution of the effect of an intervention (cf. theprevious example involving umbrellas). Finally, the third step, “counterfactual”, indicatesa full comprehension of the causal relationships, such that it is possible to predict whatwould have been the present state considering an alternate version of a past event (e.g. “ifit was snowing instead of raining, what people would have done?”). Recently, DL approachestry to adopt insights from causal inference, e.g. in vision-language understanding (Teneyet al. 2020a) or in counterfactual learning of physics (Baradel et al. 2019).
From a human point of view, “reasoning” might not always be rational. Thereby, wecan also cite other forms of reasoning, which move away from a mathematical point ofview but, in a way, come closer to human reasoning. Even if it is out of the scope of thisthesis, commonsense and social reasoning are essential when designing an agent able toreason in the real world.
commonsense reasoning is a form of reasoning allowing to make presumptionsabout the type and essence of ordinary situations humans encounter every day (Wikipedia2021). This implies the ability to make intuitive judgments about the nature of physicalobjects (e.g. a dropped object falls straight down, a solid object cannot pass throughanother solid object, etc.), taxonomic properties, and peoples’ intentions. Therefore,
13
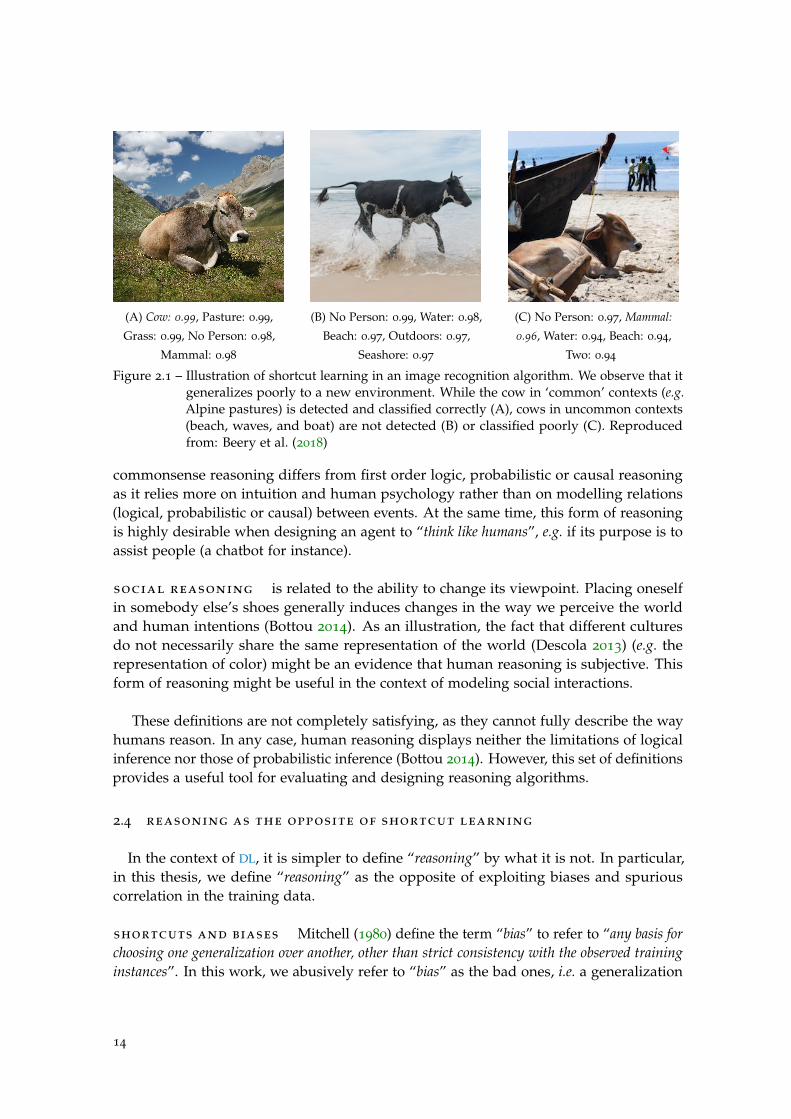
(A) Cow: 0.99, Pasture: 0.99,
Grass: 0.99, No Person: 0.98,
Mammal: 0.98
(B) No Person: 0.99, Water: 0.98,
Beach: 0.97, Outdoors: 0.97,
Seashore: 0.97
(C) No Person: 0.97, Mammal:
0.96, Water: 0.94, Beach: 0.94,
Two: 0.94
Figure 2.1 – Illustration of shortcut learning in an image recognition algorithm. We observe that itgeneralizes poorly to a new environment. While the cow in ‘common’ contexts (e.g.Alpine pastures) is detected and classified correctly (A), cows in uncommon contexts(beach, waves, and boat) are not detected (B) or classified poorly (C). Reproducedfrom: Beery et al. (2018)
commonsense reasoning differs from first order logic, probabilistic or causal reasoningas it relies more on intuition and human psychology rather than on modelling relations(logical, probabilistic or causal) between events. At the same time, this form of reasoningis highly desirable when designing an agent to “think like humans”, e.g. if its purpose is toassist people (a chatbot for instance).
social reasoning is related to the ability to change its viewpoint. Placing oneselfin somebody else’s shoes generally induces changes in the way we perceive the worldand human intentions (Bottou 2014). As an illustration, the fact that different culturesdo not necessarily share the same representation of the world (Descola 2013) (e.g. therepresentation of color) might be an evidence that human reasoning is subjective. Thisform of reasoning might be useful in the context of modeling social interactions.
These definitions are not completely satisfying, as they cannot fully describe the wayhumans reason. In any case, human reasoning displays neither the limitations of logicalinference nor those of probabilistic inference (Bottou 2014). However, this set of definitionsprovides a useful tool for evaluating and designing reasoning algorithms.
2.4 reasoning as the opposite of shortcut learning
In the context of DL, it is simpler to define “reasoning” by what it is not. In particular,in this thesis, we define “reasoning” as the opposite of exploiting biases and spuriouscorrelation in the training data.
shortcuts and biases Mitchell (1980) define the term “bias” to refer to “any basis forchoosing one generalization over another, other than strict consistency with the observed traininginstances”. In this work, we abusively refer to “bias” as the bad ones, i.e. a generalization
14
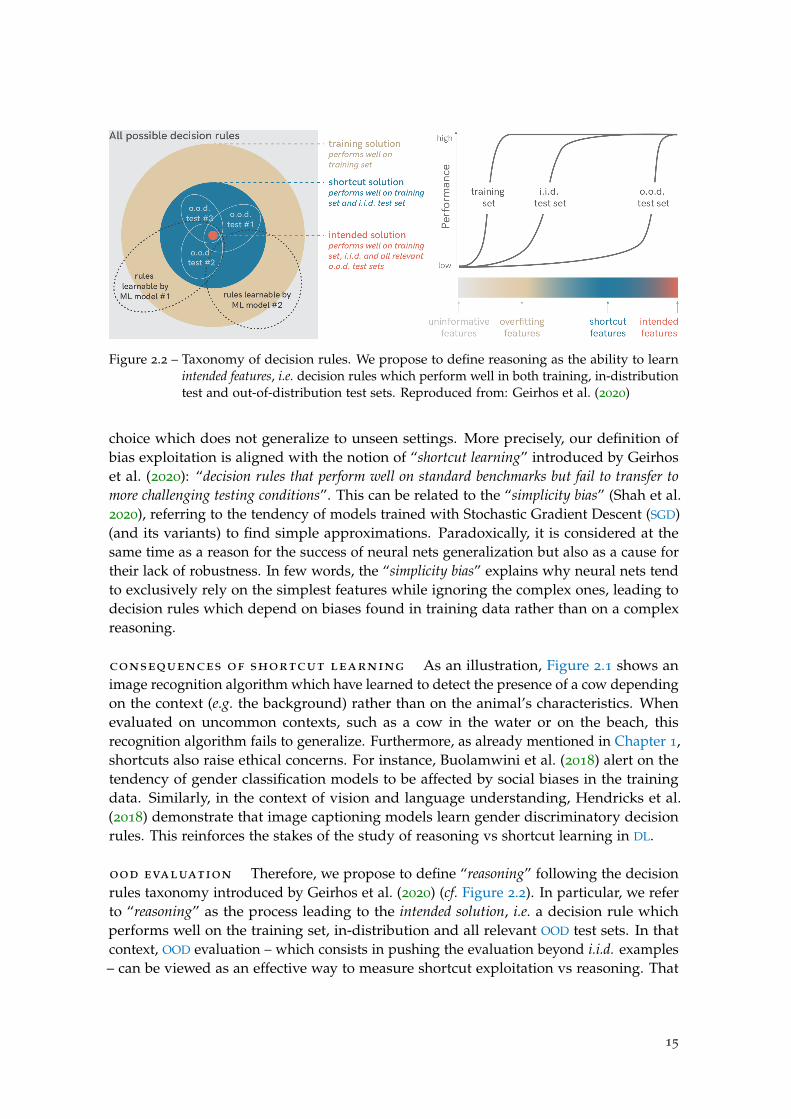
Figure 2.2 – Taxonomy of decision rules. We propose to define reasoning as the ability to learnintended features, i.e. decision rules which perform well in both training, in-distributiontest and out-of-distribution test sets. Reproduced from: Geirhos et al. (2020)
choice which does not generalize to unseen settings. More precisely, our definition ofbias exploitation is aligned with the notion of “shortcut learning” introduced by Geirhoset al. (2020): “decision rules that perform well on standard benchmarks but fail to transfer tomore challenging testing conditions”. This can be related to the “simplicity bias” (Shah et al.2020), referring to the tendency of models trained with Stochastic Gradient Descent (SGD)(and its variants) to find simple approximations. Paradoxically, it is considered at thesame time as a reason for the success of neural nets generalization but also as a cause fortheir lack of robustness. In few words, the “simplicity bias” explains why neural nets tendto exclusively rely on the simplest features while ignoring the complex ones, leading todecision rules which depend on biases found in training data rather than on a complexreasoning.
consequences of shortcut learning As an illustration, Figure 2.1 shows animage recognition algorithm which have learned to detect the presence of a cow dependingon the context (e.g. the background) rather than on the animal’s characteristics. Whenevaluated on uncommon contexts, such as a cow in the water or on the beach, thisrecognition algorithm fails to generalize. Furthermore, as already mentioned in Chapter 1,shortcuts also raise ethical concerns. For instance, Buolamwini et al. (2018) alert on thetendency of gender classification models to be affected by social biases in the trainingdata. Similarly, in the context of vision and language understanding, Hendricks et al.(2018) demonstrate that image captioning models learn gender discriminatory decisionrules. This reinforces the stakes of the study of reasoning vs shortcut learning in DL.
ood evaluation Therefore, we propose to define “reasoning” following the decisionrules taxonomy introduced by Geirhos et al. (2020) (cf. Figure 2.2). In particular, we referto “reasoning” as the process leading to the intended solution, i.e. a decision rule whichperforms well on the training set, in-distribution and all relevant OOD test sets. In thatcontext, OOD evaluation – which consists in pushing the evaluation beyond i.i.d. examples– can be viewed as an effective way to measure shortcut exploitation vs reasoning. That
15
is why, we propose in Chapter 5 the gqa-ood benchmark, devised to evaluate the OOD
performance of VQA models.However, we have to keep in mind that defining “reasoning” as the opposite of “shortcut
learning” is also not completely satisfying. It is quite possible that, at some point, aDL model performs something which is neither “reasoning” nor exploiting shortcuts.Nevertheless, as we will show in Part II and Part III, detecting shortcut exploitation is aneffective way to evaluate reasoning.
2.5 vqa : a visual reasoning task?
VQA is often understood as a proxy task for evaluating the “reasoning” ability of artificialagents on vision and language inputs (Geman et al. 2015). Indeed, this task requires tounderstand a visual scene at both general and fine-grained levels. Moreover, it involvesskills such as object and attribute recognition, transitive relation tracking, spatial reasoning,logical inference and comparisons, counting or memorizing (Hudson et al. 2019b). Moreimportantly, VQA stands out from other visual understanding tasks because the questionto be answered is not determined until run time: VQA models have to adapt the reasoningto the task at hand, by reading the question. Thus, solving VQA might require a generalreasoning model able to process a wide variety of questions. This recalls one of thereasoning properties we gave, namely the fact that “reasoning” implies to “generalizes tomultiple settings and across various environments”.
limitations The popularity of VQA is probably due to practical reasons. As thequestions’ answers generally contain a few words only, it is easy to automatically evaluatemodels on million of examples. However, VQA also suffers from several limitations,hindering its ability to evaluate “reasoning”. First, VQA evaluation is actually not as easyas it seems: naively measuring the prediction accuracy tends to favor models relyingon shortcuts instead of reasoning (in Part II we propose a new evaluation method tocounter this issue). Second, the variant of “reasoning” addressed in VQA is limited, andnot comparable with human capacities. Indeed, it mostly involves probabilistic andcommon-sense reasoning. Causal reasoning has only been recently introduced (Shahet al. 2019; Agarwal et al. 2020), and is still at an exploration stage. Social reasoning isabsent: VQA databases are mostly representative of the occidental culture and based onthe English language. Nevertheless, we do think that VQA is a preliminary and necessarystep paving the way for the emergence of intelligent reasoning systems.
16
C h a p t e r 3
V I S UA L Q U E S T I O N A N S W E R I N G
3.1 context : vision-and-language understanding
VQA (Antol et al. 2015) consists in predicting the answer to questions asked about aninput image. Answering the questions requires a wide variety of skills: finding relations,counting, comparing colors or other visual features, materials, sizes, shapes, etc. Thereby,VQA lies in vision and language understanding, a broad area that can take several forms atmany levels of granularity. At the same time, it is also a reasoning task (cf. Chapter 2).
3.1.1 Vision and language tasks
Some vision and language tasks focus on matching problems, as for instance ImageRetrieval, which requires finding the most relevant image given a query sentence (Karpathyet al. 2015a; Lee et al. 2018). The inverse problem — namely Sentence Retrieval — hasalso been explored (Karpathy et al. 2015a). A similar task with finer granularity isVisual Grounding, where the model must associate image regions to words or sentences(Kazemzadeh et al. 2014; Plummer et al. 2015). Other tasks require more high-levelreasoning over images and sentences, which, in general, requires multi-modal interactionsbut also the ability to compare, count or find relations between objects in the image. Wecan cite VQA, but also the binary task of Language-driven Comparison of Images, which takesas input triplets (img1, img2, sentence) and requires predicting whether the sentence trulydescribes the image pair (Suhr et al. 2019), or the visual entailment task (Xie et al. 2019),where the goal is to predict whether the image semantically entails the text.
Finally, some tasks involve the generation of one modality from the other. Imagecaptioning consists in translating an image into text (Lin et al. 2014). Other tasks aim togenerate questions about an image (Li et al. 2018). Inversely, it is also possible to generatean image from a caption (Mansimov et al. 2016; Ramesh et al. 2021).
3.1.2 Reasoning tasks
VQA is also a reasoning task (cf. Chapter 2). As such, it can be compared to the taskdefined by the Stanford Question Answering Dataset (SQuAD) (Rajpurkar et al. 2016),which contains 100K questions posed by crowd workers on a set of Wikipedia articles, as
17
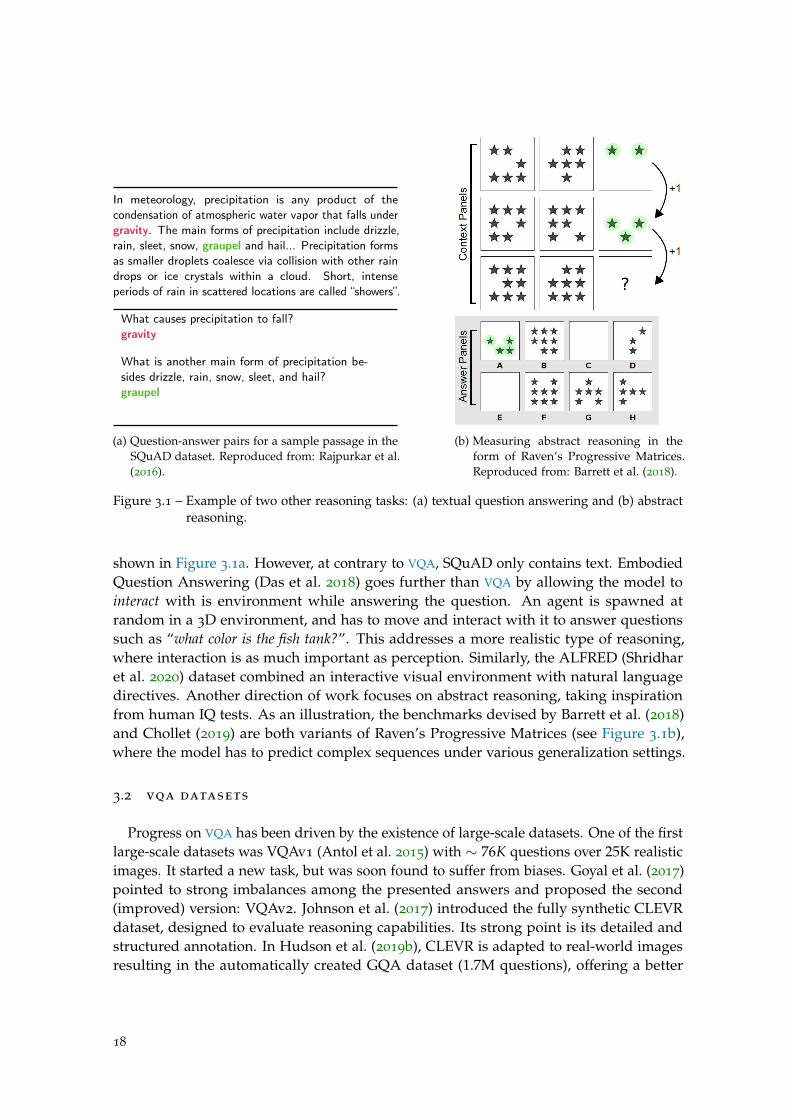
In meteorology, precipitation is any product of thecondensation of atmospheric water vapor that falls undergravity. The main forms of precipitation include drizzle,rain, sleet, snow, graupel and hail... Precipitation formsas smaller droplets coalesce via collision with other raindrops or ice crystals within a cloud. Short, intenseperiods of rain in scattered locations are called “showers”.
What causes precipitation to fall?gravity
What is another main form of precipitation be-sides drizzle, rain, snow, sleet, and hail?graupel
(a) Question-answer pairs for a sample passage in theSQuAD dataset. Reproduced from: Rajpurkar et al.(2016).
(b) Measuring abstract reasoning in theform of Raven’s Progressive Matrices.Reproduced from: Barrett et al. (2018).
Figure 3.1 – Example of two other reasoning tasks: (a) textual question answering and (b) abstractreasoning.
shown in Figure 3.1a. However, at contrary to VQA, SQuAD only contains text. EmbodiedQuestion Answering (Das et al. 2018) goes further than VQA by allowing the model tointeract with is environment while answering the question. An agent is spawned atrandom in a 3D environment, and has to move and interact with it to answer questionssuch as “what color is the fish tank?”. This addresses a more realistic type of reasoning,where interaction is as much important as perception. Similarly, the ALFRED (Shridharet al. 2020) dataset combined an interactive visual environment with natural languagedirectives. Another direction of work focuses on abstract reasoning, taking inspirationfrom human IQ tests. As an illustration, the benchmarks devised by Barrett et al. (2018)and Chollet (2019) are both variants of Raven’s Progressive Matrices (see Figure 3.1b),where the model has to predict complex sequences under various generalization settings.
3.2 vqa datasets
Progress on VQA has been driven by the existence of large-scale datasets. One of the firstlarge-scale datasets was VQAv1 (Antol et al. 2015) with ∼ 76K questions over 25K realisticimages. It started a new task, but was soon found to suffer from biases. Goyal et al. (2017)pointed to strong imbalances among the presented answers and proposed the second(improved) version: VQAv2. Johnson et al. (2017) introduced the fully synthetic CLEVRdataset, designed to evaluate reasoning capabilities. Its strong point is its detailed andstructured annotation. In Hudson et al. (2019b), CLEVR is adapted to real-world imagesresulting in the automatically created GQA dataset (1.7M questions), offering a better
18
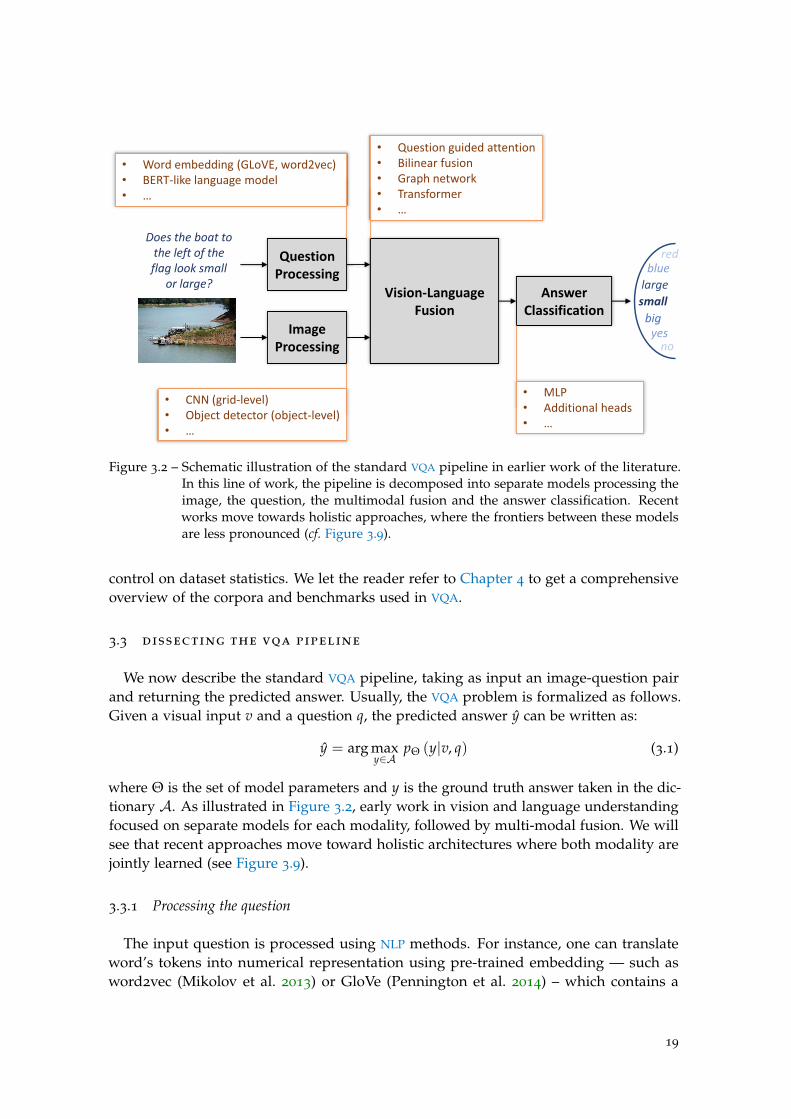
Figure 3.2 – Schematic illustration of the standard VQA pipeline in earlier work of the literature.In this line of work, the pipeline is decomposed into separate models processing theimage, the question, the multimodal fusion and the answer classification. Recentworks move towards holistic approaches, where the frontiers between these modelsare less pronounced (cf. Figure 3.9).
control on dataset statistics. We let the reader refer to Chapter 4 to get a comprehensiveoverview of the corpora and benchmarks used in VQA.
3.3 dissecting the vqa pipeline
We now describe the standard VQA pipeline, taking as input an image-question pairand returning the predicted answer. Usually, the VQA problem is formalized as follows.Given a visual input v and a question q, the predicted answer y can be written as:
y = arg maxy∈A
pΘ (y|v, q) (3.1)
where Θ is the set of model parameters and y is the ground truth answer taken in the dic-tionary A. As illustrated in Figure 3.2, early work in vision and language understandingfocused on separate models for each modality, followed by multi-modal fusion. We willsee that recent approaches move toward holistic architectures where both modality arejointly learned (see Figure 3.9).
3.3.1 Processing the question
The input question is processed using NLP methods. For instance, one can translateword’s tokens into numerical representation using pre-trained embedding — such asword2vec (Mikolov et al. 2013) or GloVe (Pennington et al. 2014) – which contains a
19
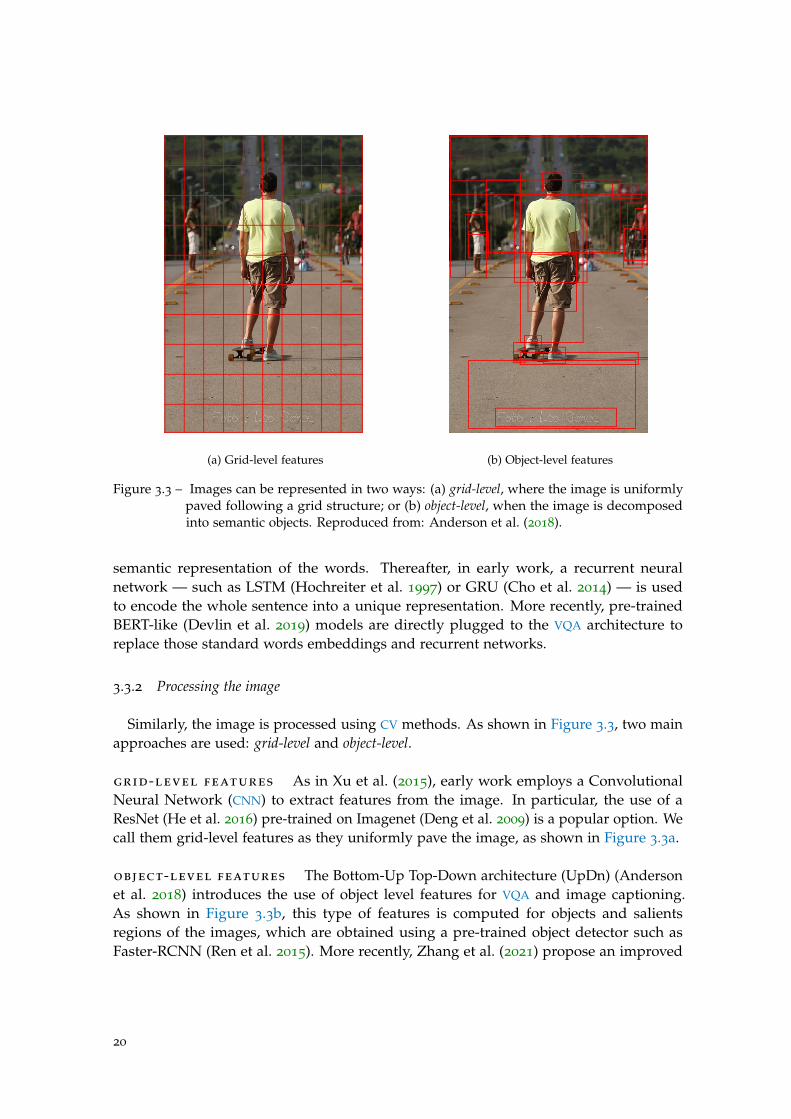
(a) Grid-level features (b) Object-level features
Figure 3.3 – Images can be represented in two ways: (a) grid-level, where the image is uniformlypaved following a grid structure; or (b) object-level, when the image is decomposedinto semantic objects. Reproduced from: Anderson et al. (2018).
semantic representation of the words. Thereafter, in early work, a recurrent neuralnetwork — such as LSTM (Hochreiter et al. 1997) or GRU (Cho et al. 2014) — is usedto encode the whole sentence into a unique representation. More recently, pre-trainedBERT-like (Devlin et al. 2019) models are directly plugged to the VQA architecture toreplace those standard words embeddings and recurrent networks.
3.3.2 Processing the image
Similarly, the image is processed using CV methods. As shown in Figure 3.3, two mainapproaches are used: grid-level and object-level.
grid-level features As in Xu et al. (2015), early work employs a ConvolutionalNeural Network (CNN) to extract features from the image. In particular, the use of aResNet (He et al. 2016) pre-trained on Imagenet (Deng et al. 2009) is a popular option. Wecall them grid-level features as they uniformly pave the image, as shown in Figure 3.3a.
object-level features The Bottom-Up Top-Down architecture (UpDn) (Andersonet al. 2018) introduces the use of object level features for VQA and image captioning.As shown in Figure 3.3b, this type of features is computed for objects and salientsregions of the images, which are obtained using a pre-trained object detector such asFaster-RCNN (Ren et al. 2015). More recently, Zhang et al. (2021) propose an improved
20
Question
Image features
σ
Σ Σ
w
GRUWord embedding
Concatenation
ww
ww
ww
www
Weighted sum overimage locations
Top-down attention weights
Element-wiseproduct
Predicted scores ofcandidate answers
softmax
kx2048
512
512
512
N
14x300
k
2048
512
14
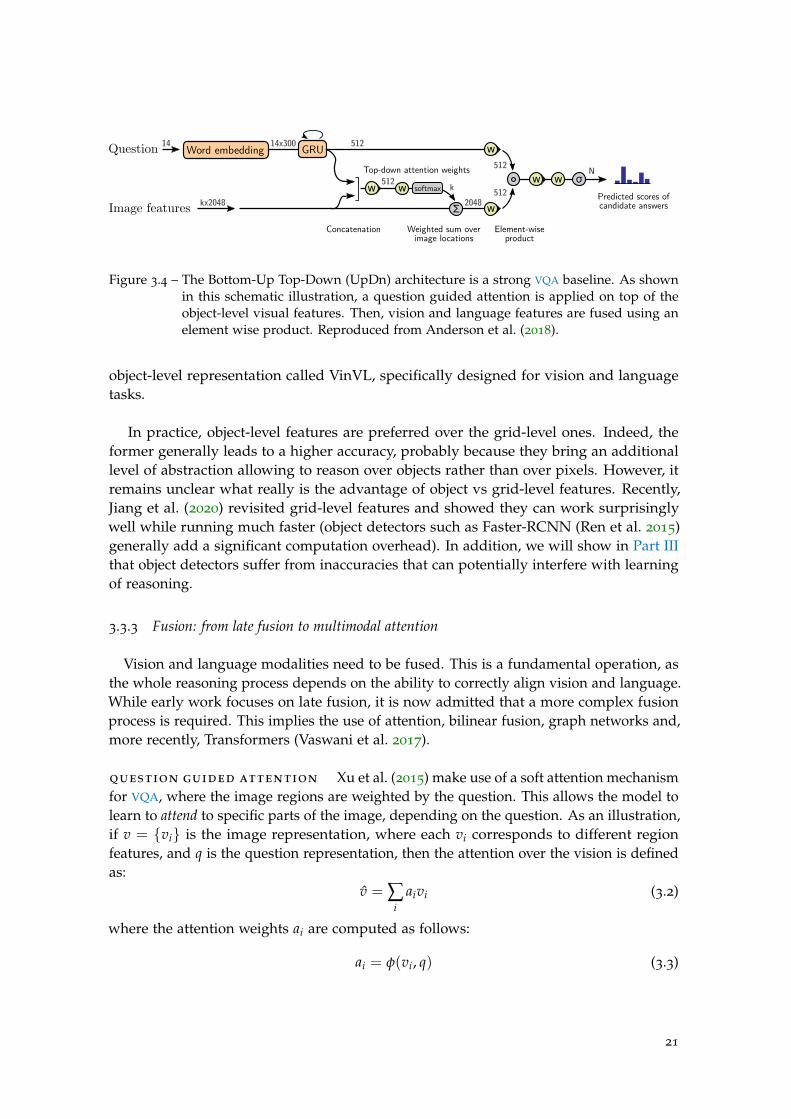
Figure 3.4 – The Bottom-Up Top-Down (UpDn) architecture is a strong VQA baseline. As shownin this schematic illustration, a question guided attention is applied on top of theobject-level visual features. Then, vision and language features are fused using anelement wise product. Reproduced from Anderson et al. (2018).
object-level representation called VinVL, specifically designed for vision and languagetasks.
In practice, object-level features are preferred over the grid-level ones. Indeed, theformer generally leads to a higher accuracy, probably because they bring an additionallevel of abstraction allowing to reason over objects rather than over pixels. However, itremains unclear what really is the advantage of object vs grid-level features. Recently,Jiang et al. (2020) revisited grid-level features and showed they can work surprisinglywell while running much faster (object detectors such as Faster-RCNN (Ren et al. 2015)generally add a significant computation overhead). In addition, we will show in Part IIIthat object detectors suffer from inaccuracies that can potentially interfere with learningof reasoning.
3.3.3 Fusion: from late fusion to multimodal attention
Vision and language modalities need to be fused. This is a fundamental operation, asthe whole reasoning process depends on the ability to correctly align vision and language.While early work focuses on late fusion, it is now admitted that a more complex fusionprocess is required. This implies the use of attention, bilinear fusion, graph networks and,more recently, Transformers (Vaswani et al. 2017).
question guided attention Xu et al. (2015) make use of a soft attention mechanismfor VQA, where the image regions are weighted by the question. This allows the model tolearn to attend to specific parts of the image, depending on the question. As an illustration,if v = {vi} is the image representation, where each vi corresponds to different regionfeatures, and q is the question representation, then the attention over the vision is definedas:
v = ∑i
aivi (3.2)
where the attention weights ai are computed as follows:
ai = φ(vi, q) (3.3)
21
vi<latexit sha1_base64="UuhsKP3lpHlY+K0A8uvGImQtNkI=">AAAB83icbVDLSsNAFL2pr1pfVZduBovQVUlE0GXBjcsK9gFNKJPppB06mYSZm0IJ/Q03LhRx68+482+ctllo64GBwzn3cs+cMJXCoOt+O6Wt7Z3dvfJ+5eDw6PikenrWMUmmGW+zRCa6F1LDpVC8jQIl76Wa0ziUvBtO7hd+d8q1EYl6wlnKg5iOlIgEo2gl348pjsMon84HYlCtuQ13CbJJvILUoEBrUP3yhwnLYq6QSWpM33NTDHKqUTDJ5xU/MzylbEJHvG+pojE3Qb7MPCdXVhmSKNH2KSRL9fdGTmNjZnFoJxcZzbq3EP/z+hlGd0EuVJohV2x1KMokwYQsCiBDoTlDObOEMi1sVsLGVFOGtqaKLcFb//Im6Vw3PLfhPd7UmvWijjJcwCXUwYNbaMIDtKANDFJ4hld4czLnxXl3PlajJafYOYc/cD5/AHRgkdw=</latexit><latexit sha1_base64="UuhsKP3lpHlY+K0A8uvGImQtNkI=">AAAB83icbVDLSsNAFL2pr1pfVZduBovQVUlE0GXBjcsK9gFNKJPppB06mYSZm0IJ/Q03LhRx68+482+ctllo64GBwzn3cs+cMJXCoOt+O6Wt7Z3dvfJ+5eDw6PikenrWMUmmGW+zRCa6F1LDpVC8jQIl76Wa0ziUvBtO7hd+d8q1EYl6wlnKg5iOlIgEo2gl348pjsMon84HYlCtuQ13CbJJvILUoEBrUP3yhwnLYq6QSWpM33NTDHKqUTDJ5xU/MzylbEJHvG+pojE3Qb7MPCdXVhmSKNH2KSRL9fdGTmNjZnFoJxcZzbq3EP/z+hlGd0EuVJohV2x1KMokwYQsCiBDoTlDObOEMi1sVsLGVFOGtqaKLcFb//Im6Vw3PLfhPd7UmvWijjJcwCXUwYNbaMIDtKANDFJ4hld4czLnxXl3PlajJafYOYc/cD5/AHRgkdw=</latexit><latexit sha1_base64="UuhsKP3lpHlY+K0A8uvGImQtNkI=">AAAB83icbVDLSsNAFL2pr1pfVZduBovQVUlE0GXBjcsK9gFNKJPppB06mYSZm0IJ/Q03LhRx68+482+ctllo64GBwzn3cs+cMJXCoOt+O6Wt7Z3dvfJ+5eDw6PikenrWMUmmGW+zRCa6F1LDpVC8jQIl76Wa0ziUvBtO7hd+d8q1EYl6wlnKg5iOlIgEo2gl348pjsMon84HYlCtuQ13CbJJvILUoEBrUP3yhwnLYq6QSWpM33NTDHKqUTDJ5xU/MzylbEJHvG+pojE3Qb7MPCdXVhmSKNH2KSRL9fdGTmNjZnFoJxcZzbq3EP/z+hlGd0EuVJohV2x1KMokwYQsCiBDoTlDObOEMi1sVsLGVFOGtqaKLcFb//Im6Vw3PLfhPd7UmvWijjJcwCXUwYNbaMIDtKANDFJ4hld4czLnxXl3PlajJafYOYc/cD5/AHRgkdw=</latexit><latexit sha1_base64="UuhsKP3lpHlY+K0A8uvGImQtNkI=">AAAB83icbVDLSsNAFL2pr1pfVZduBovQVUlE0GXBjcsK9gFNKJPppB06mYSZm0IJ/Q03LhRx68+482+ctllo64GBwzn3cs+cMJXCoOt+O6Wt7Z3dvfJ+5eDw6PikenrWMUmmGW+zRCa6F1LDpVC8jQIl76Wa0ziUvBtO7hd+d8q1EYl6wlnKg5iOlIgEo2gl348pjsMon84HYlCtuQ13CbJJvILUoEBrUP3yhwnLYq6QSWpM33NTDHKqUTDJ5xU/MzylbEJHvG+pojE3Qb7MPCdXVhmSKNH2KSRL9fdGTmNjZnFoJxcZzbq3EP/z+hlGd0EuVJohV2x1KMokwYQsCiBDoTlDObOEMi1sVsLGVFOGtqaKLcFb//Im6Vw3PLfhPd7UmvWijjJcwCXUwYNbaMIDtKANDFJ4hld4czLnxXl3PlajJafYOYc/cD5/AHRgkdw=</latexit>
u<latexit sha1_base64="Wl/NKcf+4FQq41kPZqpr8GSpKP8=">AAAB8XicbVDLSsNAFL2pr1pfVZduBovQVUlE0GXBjcsK9oFtKJPpTTt0MgkzE6GE/oUbF4q49W/c+TdO2iy09cDA4Zx7mXNPkAiujet+O6WNza3tnfJuZW//4PCoenzS0XGqGLZZLGLVC6hGwSW2DTcCe4lCGgUCu8H0Nve7T6g0j+WDmSXoR3QsecgZNVZ6HETUTIIwS+fDas1tuAuQdeIVpAYFWsPq12AUszRCaZigWvc9NzF+RpXhTOC8Mkg1JpRN6Rj7lkoaofazReI5ubDKiISxsk8aslB/b2Q00noWBXYyT6hXvVz8z+unJrzxMy6T1KBky4/CVBATk/x8MuIKmREzSyhT3GYlbEIVZcaWVLEleKsnr5POZcNzG979Va1ZL+oowxmcQx08uIYm3EEL2sBAwjO8wpujnRfn3flYjpacYucU/sD5/AHw2JD/</latexit><latexit sha1_base64="Wl/NKcf+4FQq41kPZqpr8GSpKP8=">AAAB8XicbVDLSsNAFL2pr1pfVZduBovQVUlE0GXBjcsK9oFtKJPpTTt0MgkzE6GE/oUbF4q49W/c+TdO2iy09cDA4Zx7mXNPkAiujet+O6WNza3tnfJuZW//4PCoenzS0XGqGLZZLGLVC6hGwSW2DTcCe4lCGgUCu8H0Nve7T6g0j+WDmSXoR3QsecgZNVZ6HETUTIIwS+fDas1tuAuQdeIVpAYFWsPq12AUszRCaZigWvc9NzF+RpXhTOC8Mkg1JpRN6Rj7lkoaofazReI5ubDKiISxsk8aslB/b2Q00noWBXYyT6hXvVz8z+unJrzxMy6T1KBky4/CVBATk/x8MuIKmREzSyhT3GYlbEIVZcaWVLEleKsnr5POZcNzG979Va1ZL+oowxmcQx08uIYm3EEL2sBAwjO8wpujnRfn3flYjpacYucU/sD5/AHw2JD/</latexit><latexit sha1_base64="Wl/NKcf+4FQq41kPZqpr8GSpKP8=">AAAB8XicbVDLSsNAFL2pr1pfVZduBovQVUlE0GXBjcsK9oFtKJPpTTt0MgkzE6GE/oUbF4q49W/c+TdO2iy09cDA4Zx7mXNPkAiujet+O6WNza3tnfJuZW//4PCoenzS0XGqGLZZLGLVC6hGwSW2DTcCe4lCGgUCu8H0Nve7T6g0j+WDmSXoR3QsecgZNVZ6HETUTIIwS+fDas1tuAuQdeIVpAYFWsPq12AUszRCaZigWvc9NzF+RpXhTOC8Mkg1JpRN6Rj7lkoaofazReI5ubDKiISxsk8aslB/b2Q00noWBXYyT6hXvVz8z+unJrzxMy6T1KBky4/CVBATk/x8MuIKmREzSyhT3GYlbEIVZcaWVLEleKsnr5POZcNzG979Va1ZL+oowxmcQx08uIYm3EEL2sBAwjO8wpujnRfn3flYjpacYucU/sD5/AHw2JD/</latexit><latexit sha1_base64="Wl/NKcf+4FQq41kPZqpr8GSpKP8=">AAAB8XicbVDLSsNAFL2pr1pfVZduBovQVUlE0GXBjcsK9oFtKJPpTTt0MgkzE6GE/oUbF4q49W/c+TdO2iy09cDA4Zx7mXNPkAiujet+O6WNza3tnfJuZW//4PCoenzS0XGqGLZZLGLVC6hGwSW2DTcCe4lCGgUCu8H0Nve7T6g0j+WDmSXoR3QsecgZNVZ6HETUTIIwS+fDas1tuAuQdeIVpAYFWsPq12AUszRCaZigWvc9NzF+RpXhTOC8Mkg1JpRN6Rj7lkoaofazReI5ubDKiISxsk8aslB/b2Q00noWBXYyT6hXvVz8z+unJrzxMy6T1KBky4/CVBATk/x8MuIKmREzSyhT3GYlbEIVZcaWVLEleKsnr5POZcNzG979Va1ZL+oowxmcQx08uIYm3EEL2sBAwjO8wpujnRfn3flYjpacYucU/sD5/AHw2JD/</latexit>
e0k<latexit sha1_base64="a1hco1MShws4KpmpFnenOcfEqyc=">AAAB9HicdVDLSgMxFM34rPVVdekmWMSuhkxtsd0V3LisYB/QDiWT3mlDMw+TTKEM/Q43LhRx68e482/MtBVU9EDgcM693JPjxYIrTciHtba+sbm1ndvJ7+7tHxwWjo7bKkokgxaLRCS7HlUgeAgtzbWAbiyBBp6Ajje5zvzOFKTiUXinZzG4AR2F3OeMaiO5/YDqseenML8YTAaFIrGdCilXy5jY1XqdVOqG1KqXpEywY5MFimiF5qDw3h9GLAkg1ExQpXoOibWbUqk5EzDP9xMFMWUTOoKeoSENQLnpIvQcnxtliP1ImhdqvFC/b6Q0UGoWeGYyC6l+e5n4l9dLtF9zUx7GiYaQLQ/5icA6wlkDeMglMC1mhlAmucmK2ZhKyrTpKW9K+Pop/p+0y7ZjurqtFBulVR05dIrOUAk56Ao10A1qohZi6B49oCf0bE2tR+vFel2OrlmrnRP0A9bbJyRskkI=</latexit><latexit sha1_base64="a1hco1MShws4KpmpFnenOcfEqyc=">AAAB9HicdVDLSgMxFM34rPVVdekmWMSuhkxtsd0V3LisYB/QDiWT3mlDMw+TTKEM/Q43LhRx68e482/MtBVU9EDgcM693JPjxYIrTciHtba+sbm1ndvJ7+7tHxwWjo7bKkokgxaLRCS7HlUgeAgtzbWAbiyBBp6Ajje5zvzOFKTiUXinZzG4AR2F3OeMaiO5/YDqseenML8YTAaFIrGdCilXy5jY1XqdVOqG1KqXpEywY5MFimiF5qDw3h9GLAkg1ExQpXoOibWbUqk5EzDP9xMFMWUTOoKeoSENQLnpIvQcnxtliP1ImhdqvFC/b6Q0UGoWeGYyC6l+e5n4l9dLtF9zUx7GiYaQLQ/5icA6wlkDeMglMC1mhlAmucmK2ZhKyrTpKW9K+Pop/p+0y7ZjurqtFBulVR05dIrOUAk56Ao10A1qohZi6B49oCf0bE2tR+vFel2OrlmrnRP0A9bbJyRskkI=</latexit><latexit sha1_base64="a1hco1MShws4KpmpFnenOcfEqyc=">AAAB9HicdVDLSgMxFM34rPVVdekmWMSuhkxtsd0V3LisYB/QDiWT3mlDMw+TTKEM/Q43LhRx68e482/MtBVU9EDgcM693JPjxYIrTciHtba+sbm1ndvJ7+7tHxwWjo7bKkokgxaLRCS7HlUgeAgtzbWAbiyBBp6Ajje5zvzOFKTiUXinZzG4AR2F3OeMaiO5/YDqseenML8YTAaFIrGdCilXy5jY1XqdVOqG1KqXpEywY5MFimiF5qDw3h9GLAkg1ExQpXoOibWbUqk5EzDP9xMFMWUTOoKeoSENQLnpIvQcnxtliP1ImhdqvFC/b6Q0UGoWeGYyC6l+e5n4l9dLtF9zUx7GiYaQLQ/5icA6wlkDeMglMC1mhlAmucmK2ZhKyrTpKW9K+Pop/p+0y7ZjurqtFBulVR05dIrOUAk56Ao10A1qohZi6B49oCf0bE2tR+vFel2OrlmrnRP0A9bbJyRskkI=</latexit><latexit sha1_base64="a1hco1MShws4KpmpFnenOcfEqyc=">AAAB9HicdVDLSgMxFM34rPVVdekmWMSuhkxtsd0V3LisYB/QDiWT3mlDMw+TTKEM/Q43LhRx68e482/MtBVU9EDgcM693JPjxYIrTciHtba+sbm1ndvJ7+7tHxwWjo7bKkokgxaLRCS7HlUgeAgtzbWAbiyBBp6Ajje5zvzOFKTiUXinZzG4AR2F3OeMaiO5/YDqseenML8YTAaFIrGdCilXy5jY1XqdVOqG1KqXpEywY5MFimiF5qDw3h9GLAkg1ExQpXoOibWbUqk5EzDP9xMFMWUTOoKeoSENQLnpIvQcnxtliP1ImhdqvFC/b6Q0UGoWeGYyC6l+e5n4l9dLtF9zUx7GiYaQLQ/5icA6wlkDeMglMC1mhlAmucmK2ZhKyrTpKW9K+Pop/p+0y7ZjurqtFBulVR05dIrOUAk56Ao10A1qohZi6B49oCf0bE2tR+vFel2OrlmrnRP0A9bbJyRskkI=</latexit>
(a) Edge update
u<latexit sha1_base64="Wl/NKcf+4FQq41kPZqpr8GSpKP8=">AAAB8XicbVDLSsNAFL2pr1pfVZduBovQVUlE0GXBjcsK9oFtKJPpTTt0MgkzE6GE/oUbF4q49W/c+TdO2iy09cDA4Zx7mXNPkAiujet+O6WNza3tnfJuZW//4PCoenzS0XGqGLZZLGLVC6hGwSW2DTcCe4lCGgUCu8H0Nve7T6g0j+WDmSXoR3QsecgZNVZ6HETUTIIwS+fDas1tuAuQdeIVpAYFWsPq12AUszRCaZigWvc9NzF+RpXhTOC8Mkg1JpRN6Rj7lkoaofazReI5ubDKiISxsk8aslB/b2Q00noWBXYyT6hXvVz8z+unJrzxMy6T1KBky4/CVBATk/x8MuIKmREzSyhT3GYlbEIVZcaWVLEleKsnr5POZcNzG979Va1ZL+oowxmcQx08uIYm3EEL2sBAwjO8wpujnRfn3flYjpacYucU/sD5/AHw2JD/</latexit><latexit sha1_base64="Wl/NKcf+4FQq41kPZqpr8GSpKP8=">AAAB8XicbVDLSsNAFL2pr1pfVZduBovQVUlE0GXBjcsK9oFtKJPpTTt0MgkzE6GE/oUbF4q49W/c+TdO2iy09cDA4Zx7mXNPkAiujet+O6WNza3tnfJuZW//4PCoenzS0XGqGLZZLGLVC6hGwSW2DTcCe4lCGgUCu8H0Nve7T6g0j+WDmSXoR3QsecgZNVZ6HETUTIIwS+fDas1tuAuQdeIVpAYFWsPq12AUszRCaZigWvc9NzF+RpXhTOC8Mkg1JpRN6Rj7lkoaofazReI5ubDKiISxsk8aslB/b2Q00noWBXYyT6hXvVz8z+unJrzxMy6T1KBky4/CVBATk/x8MuIKmREzSyhT3GYlbEIVZcaWVLEleKsnr5POZcNzG979Va1ZL+oowxmcQx08uIYm3EEL2sBAwjO8wpujnRfn3flYjpacYucU/sD5/AHw2JD/</latexit><latexit sha1_base64="Wl/NKcf+4FQq41kPZqpr8GSpKP8=">AAAB8XicbVDLSsNAFL2pr1pfVZduBovQVUlE0GXBjcsK9oFtKJPpTTt0MgkzE6GE/oUbF4q49W/c+TdO2iy09cDA4Zx7mXNPkAiujet+O6WNza3tnfJuZW//4PCoenzS0XGqGLZZLGLVC6hGwSW2DTcCe4lCGgUCu8H0Nve7T6g0j+WDmSXoR3QsecgZNVZ6HETUTIIwS+fDas1tuAuQdeIVpAYFWsPq12AUszRCaZigWvc9NzF+RpXhTOC8Mkg1JpRN6Rj7lkoaofazReI5ubDKiISxsk8aslB/b2Q00noWBXYyT6hXvVz8z+unJrzxMy6T1KBky4/CVBATk/x8MuIKmREzSyhT3GYlbEIVZcaWVLEleKsnr5POZcNzG979Va1ZL+oowxmcQx08uIYm3EEL2sBAwjO8wpujnRfn3flYjpacYucU/sD5/AHw2JD/</latexit><latexit sha1_base64="Wl/NKcf+4FQq41kPZqpr8GSpKP8=">AAAB8XicbVDLSsNAFL2pr1pfVZduBovQVUlE0GXBjcsK9oFtKJPpTTt0MgkzE6GE/oUbF4q49W/c+TdO2iy09cDA4Zx7mXNPkAiujet+O6WNza3tnfJuZW//4PCoenzS0XGqGLZZLGLVC6hGwSW2DTcCe4lCGgUCu8H0Nve7T6g0j+WDmSXoR3QsecgZNVZ6HETUTIIwS+fDas1tuAuQdeIVpAYFWsPq12AUszRCaZigWvc9NzF+RpXhTOC8Mkg1JpRN6Rj7lkoaofazReI5ubDKiISxsk8aslB/b2Q00noWBXYyT6hXvVz8z+unJrzxMy6T1KBky4/CVBATk/x8MuIKmREzSyhT3GYlbEIVZcaWVLEleKsnr5POZcNzG979Va1ZL+oowxmcQx08uIYm3EEL2sBAwjO8wpujnRfn3flYjpacYucU/sD5/AHw2JD/</latexit>
e0k<latexit sha1_base64="TmBm7ikN3ChoJpDcsfwhm1T5rLk=">AAAB9HicbVDLSgMxFL1TX7W+qi7dBIvYVZkRQZcFNy4r2Ae0Q8mkd9rQTGZMMoUy9DvcuFDErR/jzr8x03ahrQcCh3Pu5Z6cIBFcG9f9dgobm1vbO8Xd0t7+weFR+fikpeNUMWyyWMSqE1CNgktsGm4EdhKFNAoEtoPxXe63J6g0j+WjmSboR3QoecgZNVbyexE1oyDMcHbZH/fLFbfmzkHWibckFVii0S9/9QYxSyOUhgmqdddzE+NnVBnOBM5KvVRjQtmYDrFrqaQRaj+bh56RC6sMSBgr+6Qhc/X3RkYjradRYCfzkHrVy8X/vG5qwls/4zJJDUq2OBSmgpiY5A2QAVfIjJhaQpniNithI6ooM7anki3BW/3yOmld1Ty35j1cV+rVZR1FOINzqIIHN1CHe2hAExg8wTO8wpszcV6cd+djMVpwljun8AfO5w/CAJH+</latexit><latexit sha1_base64="TmBm7ikN3ChoJpDcsfwhm1T5rLk=">AAAB9HicbVDLSgMxFL1TX7W+qi7dBIvYVZkRQZcFNy4r2Ae0Q8mkd9rQTGZMMoUy9DvcuFDErR/jzr8x03ahrQcCh3Pu5Z6cIBFcG9f9dgobm1vbO8Xd0t7+weFR+fikpeNUMWyyWMSqE1CNgktsGm4EdhKFNAoEtoPxXe63J6g0j+WjmSboR3QoecgZNVbyexE1oyDMcHbZH/fLFbfmzkHWibckFVii0S9/9QYxSyOUhgmqdddzE+NnVBnOBM5KvVRjQtmYDrFrqaQRaj+bh56RC6sMSBgr+6Qhc/X3RkYjradRYCfzkHrVy8X/vG5qwls/4zJJDUq2OBSmgpiY5A2QAVfIjJhaQpniNithI6ooM7anki3BW/3yOmld1Ty35j1cV+rVZR1FOINzqIIHN1CHe2hAExg8wTO8wpszcV6cd+djMVpwljun8AfO5w/CAJH+</latexit><latexit sha1_base64="TmBm7ikN3ChoJpDcsfwhm1T5rLk=">AAAB9HicbVDLSgMxFL1TX7W+qi7dBIvYVZkRQZcFNy4r2Ae0Q8mkd9rQTGZMMoUy9DvcuFDErR/jzr8x03ahrQcCh3Pu5Z6cIBFcG9f9dgobm1vbO8Xd0t7+weFR+fikpeNUMWyyWMSqE1CNgktsGm4EdhKFNAoEtoPxXe63J6g0j+WjmSboR3QoecgZNVbyexE1oyDMcHbZH/fLFbfmzkHWibckFVii0S9/9QYxSyOUhgmqdddzE+NnVBnOBM5KvVRjQtmYDrFrqaQRaj+bh56RC6sMSBgr+6Qhc/X3RkYjradRYCfzkHrVy8X/vG5qwls/4zJJDUq2OBSmgpiY5A2QAVfIjJhaQpniNithI6ooM7anki3BW/3yOmld1Ty35j1cV+rVZR1FOINzqIIHN1CHe2hAExg8wTO8wpszcV6cd+djMVpwljun8AfO5w/CAJH+</latexit><latexit sha1_base64="TmBm7ikN3ChoJpDcsfwhm1T5rLk=">AAAB9HicbVDLSgMxFL1TX7W+qi7dBIvYVZkRQZcFNy4r2Ae0Q8mkd9rQTGZMMoUy9DvcuFDErR/jzr8x03ahrQcCh3Pu5Z6cIBFcG9f9dgobm1vbO8Xd0t7+weFR+fikpeNUMWyyWMSqE1CNgktsGm4EdhKFNAoEtoPxXe63J6g0j+WjmSboR3QoecgZNVbyexE1oyDMcHbZH/fLFbfmzkHWibckFVii0S9/9QYxSyOUhgmqdddzE+NnVBnOBM5KvVRjQtmYDrFrqaQRaj+bh56RC6sMSBgr+6Qhc/X3RkYjradRYCfzkHrVy8X/vG5qwls/4zJJDUq2OBSmgpiY5A2QAVfIjJhaQpniNithI6ooM7anki3BW/3yOmld1Ty35j1cV+rVZR1FOINzqIIHN1CHe2hAExg8wTO8wpszcV6cd+djMVpwljun8AfO5w/CAJH+</latexit>v0
i<latexit sha1_base64="eeLXdOBZMDToGpT2JKCAlGanLL8=">AAAB9HicdVDLSgMxFL3js9ZX1aWbYBG7GjK1xXZXcOOygn1AO5RMmmlDMw+TTKEM/Q43LhRx68e482/MtBVU9EDgcM693JPjxYIrjfGHtba+sbm1ndvJ7+7tHxwWjo7bKkokZS0aiUh2PaKY4CFraa4F68aSkcATrONNrjO/M2VS8Si807OYuQEZhdznlGgjuf2A6LHnp9P5xYAPCkVsOxVcrpYRtqv1Oq7UDalVL3EZI8fGCxRhheag8N4fRjQJWKipIEr1HBxrNyVScyrYPN9PFIsJnZAR6xkakoApN12EnqNzowyRH0nzQo0W6veNlARKzQLPTGYh1W8vE//yeon2a27KwzjRLKTLQ34ikI5Q1gAacsmoFjNDCJXcZEV0TCSh2vSUNyV8/RT9T9pl2zFd3VaKjdKqjhycwhmUwIEraMANNKEFFO7hAZ7g2Zpaj9aL9bocXbNWOyfwA9bbJztsklE=</latexit><latexit sha1_base64="eeLXdOBZMDToGpT2JKCAlGanLL8=">AAAB9HicdVDLSgMxFL3js9ZX1aWbYBG7GjK1xXZXcOOygn1AO5RMmmlDMw+TTKEM/Q43LhRx68e482/MtBVU9EDgcM693JPjxYIrjfGHtba+sbm1ndvJ7+7tHxwWjo7bKkokZS0aiUh2PaKY4CFraa4F68aSkcATrONNrjO/M2VS8Si807OYuQEZhdznlGgjuf2A6LHnp9P5xYAPCkVsOxVcrpYRtqv1Oq7UDalVL3EZI8fGCxRhheag8N4fRjQJWKipIEr1HBxrNyVScyrYPN9PFIsJnZAR6xkakoApN12EnqNzowyRH0nzQo0W6veNlARKzQLPTGYh1W8vE//yeon2a27KwzjRLKTLQ34ikI5Q1gAacsmoFjNDCJXcZEV0TCSh2vSUNyV8/RT9T9pl2zFd3VaKjdKqjhycwhmUwIEraMANNKEFFO7hAZ7g2Zpaj9aL9bocXbNWOyfwA9bbJztsklE=</latexit><latexit sha1_base64="eeLXdOBZMDToGpT2JKCAlGanLL8=">AAAB9HicdVDLSgMxFL3js9ZX1aWbYBG7GjK1xXZXcOOygn1AO5RMmmlDMw+TTKEM/Q43LhRx68e482/MtBVU9EDgcM693JPjxYIrjfGHtba+sbm1ndvJ7+7tHxwWjo7bKkokZS0aiUh2PaKY4CFraa4F68aSkcATrONNrjO/M2VS8Si807OYuQEZhdznlGgjuf2A6LHnp9P5xYAPCkVsOxVcrpYRtqv1Oq7UDalVL3EZI8fGCxRhheag8N4fRjQJWKipIEr1HBxrNyVScyrYPN9PFIsJnZAR6xkakoApN12EnqNzowyRH0nzQo0W6veNlARKzQLPTGYh1W8vE//yeon2a27KwzjRLKTLQ34ikI5Q1gAacsmoFjNDCJXcZEV0TCSh2vSUNyV8/RT9T9pl2zFd3VaKjdKqjhycwhmUwIEraMANNKEFFO7hAZ7g2Zpaj9aL9bocXbNWOyfwA9bbJztsklE=</latexit><latexit sha1_base64="eeLXdOBZMDToGpT2JKCAlGanLL8=">AAAB9HicdVDLSgMxFL3js9ZX1aWbYBG7GjK1xXZXcOOygn1AO5RMmmlDMw+TTKEM/Q43LhRx68e482/MtBVU9EDgcM693JPjxYIrjfGHtba+sbm1ndvJ7+7tHxwWjo7bKkokZS0aiUh2PaKY4CFraa4F68aSkcATrONNrjO/M2VS8Si807OYuQEZhdznlGgjuf2A6LHnp9P5xYAPCkVsOxVcrpYRtqv1Oq7UDalVL3EZI8fGCxRhheag8N4fRjQJWKipIEr1HBxrNyVScyrYPN9PFIsJnZAR6xkakoApN12EnqNzowyRH0nzQo0W6veNlARKzQLPTGYh1W8vE//yeon2a27KwzjRLKTLQ34ikI5Q1gAacsmoFjNDCJXcZEV0TCSh2vSUNyV8/RT9T9pl2zFd3VaKjdKqjhycwhmUwIEraMANNKEFFO7hAZ7g2Zpaj9aL9bocXbNWOyfwA9bbJztsklE=</latexit>
(b) Node update
u0<latexit sha1_base64="RuJ/WOWmv0qWsx0aAsZGj4qvbr4=">AAAB8nicdVDJSgNBEO2JW4xb1KOXxiDmNMxk0cwt4MVjBLPAZAg9nZ6kSc9Cd40YhnyGFw+KePVrvPk3dhZBRR8UPN6roqqenwiuwLI+jNza+sbmVn67sLO7t39QPDzqqDiVlLVpLGLZ84ligkesDRwE6yWSkdAXrOtPruZ+945JxePoFqYJ80IyinjAKQEtuX1g9+AHWTo7HxRLllm5aFTqFrbMulOrNmqaNCpO1XGwbVoLlNAKrUHxvT+MaRqyCKggSrm2lYCXEQmcCjYr9FPFEkInZMRcTSMSMuVli5Nn+EwrQxzEUlcEeKF+n8hIqNQ09HVnSGCsfntz8S/PTSFoeBmPkhRYRJeLglRgiPH8fzzkklEQU00IlVzfiumYSEJBp1TQIXx9iv8nnYppW6Z9Uys1y6s48ugEnaIystElaqJr1EJtRFGMHtATejbAeDRejNdla85YzRyjHzDePgEJTZGr</latexit><latexit sha1_base64="RuJ/WOWmv0qWsx0aAsZGj4qvbr4=">AAAB8nicdVDJSgNBEO2JW4xb1KOXxiDmNMxk0cwt4MVjBLPAZAg9nZ6kSc9Cd40YhnyGFw+KePVrvPk3dhZBRR8UPN6roqqenwiuwLI+jNza+sbmVn67sLO7t39QPDzqqDiVlLVpLGLZ84ligkesDRwE6yWSkdAXrOtPruZ+945JxePoFqYJ80IyinjAKQEtuX1g9+AHWTo7HxRLllm5aFTqFrbMulOrNmqaNCpO1XGwbVoLlNAKrUHxvT+MaRqyCKggSrm2lYCXEQmcCjYr9FPFEkInZMRcTSMSMuVli5Nn+EwrQxzEUlcEeKF+n8hIqNQ09HVnSGCsfntz8S/PTSFoeBmPkhRYRJeLglRgiPH8fzzkklEQU00IlVzfiumYSEJBp1TQIXx9iv8nnYppW6Z9Uys1y6s48ugEnaIystElaqJr1EJtRFGMHtATejbAeDRejNdla85YzRyjHzDePgEJTZGr</latexit><latexit sha1_base64="RuJ/WOWmv0qWsx0aAsZGj4qvbr4=">AAAB8nicdVDJSgNBEO2JW4xb1KOXxiDmNMxk0cwt4MVjBLPAZAg9nZ6kSc9Cd40YhnyGFw+KePVrvPk3dhZBRR8UPN6roqqenwiuwLI+jNza+sbmVn67sLO7t39QPDzqqDiVlLVpLGLZ84ligkesDRwE6yWSkdAXrOtPruZ+945JxePoFqYJ80IyinjAKQEtuX1g9+AHWTo7HxRLllm5aFTqFrbMulOrNmqaNCpO1XGwbVoLlNAKrUHxvT+MaRqyCKggSrm2lYCXEQmcCjYr9FPFEkInZMRcTSMSMuVli5Nn+EwrQxzEUlcEeKF+n8hIqNQ09HVnSGCsfntz8S/PTSFoeBmPkhRYRJeLglRgiPH8fzzkklEQU00IlVzfiumYSEJBp1TQIXx9iv8nnYppW6Z9Uys1y6s48ugEnaIystElaqJr1EJtRFGMHtATejbAeDRejNdla85YzRyjHzDePgEJTZGr</latexit><latexit sha1_base64="RuJ/WOWmv0qWsx0aAsZGj4qvbr4=">AAAB8nicdVDJSgNBEO2JW4xb1KOXxiDmNMxk0cwt4MVjBLPAZAg9nZ6kSc9Cd40YhnyGFw+KePVrvPk3dhZBRR8UPN6roqqenwiuwLI+jNza+sbmVn67sLO7t39QPDzqqDiVlLVpLGLZ84ligkesDRwE6yWSkdAXrOtPruZ+945JxePoFqYJ80IyinjAKQEtuX1g9+AHWTo7HxRLllm5aFTqFrbMulOrNmqaNCpO1XGwbVoLlNAKrUHxvT+MaRqyCKggSrm2lYCXEQmcCjYr9FPFEkInZMRcTSMSMuVli5Nn+EwrQxzEUlcEeKF+n8hIqNQ09HVnSGCsfntz8S/PTSFoeBmPkhRYRJeLglRgiPH8fzzkklEQU00IlVzfiumYSEJBp1TQIXx9iv8nnYppW6Z9Uys1y6s48ugEnaIystElaqJr1EJtRFGMHtATejbAeDRejNdla85YzRyjHzDePgEJTZGr</latexit>
e0k<latexit sha1_base64="Iztn6Umi7rLG5lNF0JpW0x6J+s0=">AAAB9HicbVBNS8NAEN34WetX1aOXxSL2VBIR9Fjw4rGC/YA2lM120i7dbOLupFhCf4cXD4p49cd489+4bXPQ1gcDj/dmmJkXJFIYdN1vZ219Y3Nru7BT3N3bPzgsHR03TZxqDg0ey1i3A2ZACgUNFCihnWhgUSChFYxuZ35rDNqIWD3gJAE/YgMlQsEZWsnvIjxhEGYwveiNeqWyW3XnoKvEy0mZ5Kj3Sl/dfszTCBRyyYzpeG6CfsY0Ci5hWuymBhLGR2wAHUsVi8D42fzoKT23Sp+GsbalkM7V3xMZi4yZRIHtjBgOzbI3E//zOimGN34mVJIiKL5YFKaSYkxnCdC+0MBRTixhXAt7K+VDphlHm1PRhuAtv7xKmpdVz61691flWiWPo0BOyRmpEI9ckxq5I3XSIJw8kmfySt6csfPivDsfi9Y1J585IX/gfP4A6+WSGQ==</latexit><latexit sha1_base64="Iztn6Umi7rLG5lNF0JpW0x6J+s0=">AAAB9HicbVBNS8NAEN34WetX1aOXxSL2VBIR9Fjw4rGC/YA2lM120i7dbOLupFhCf4cXD4p49cd489+4bXPQ1gcDj/dmmJkXJFIYdN1vZ219Y3Nru7BT3N3bPzgsHR03TZxqDg0ey1i3A2ZACgUNFCihnWhgUSChFYxuZ35rDNqIWD3gJAE/YgMlQsEZWsnvIjxhEGYwveiNeqWyW3XnoKvEy0mZ5Kj3Sl/dfszTCBRyyYzpeG6CfsY0Ci5hWuymBhLGR2wAHUsVi8D42fzoKT23Sp+GsbalkM7V3xMZi4yZRIHtjBgOzbI3E//zOimGN34mVJIiKL5YFKaSYkxnCdC+0MBRTixhXAt7K+VDphlHm1PRhuAtv7xKmpdVz61691flWiWPo0BOyRmpEI9ckxq5I3XSIJw8kmfySt6csfPivDsfi9Y1J585IX/gfP4A6+WSGQ==</latexit><latexit sha1_base64="Iztn6Umi7rLG5lNF0JpW0x6J+s0=">AAAB9HicbVBNS8NAEN34WetX1aOXxSL2VBIR9Fjw4rGC/YA2lM120i7dbOLupFhCf4cXD4p49cd489+4bXPQ1gcDj/dmmJkXJFIYdN1vZ219Y3Nru7BT3N3bPzgsHR03TZxqDg0ey1i3A2ZACgUNFCihnWhgUSChFYxuZ35rDNqIWD3gJAE/YgMlQsEZWsnvIjxhEGYwveiNeqWyW3XnoKvEy0mZ5Kj3Sl/dfszTCBRyyYzpeG6CfsY0Ci5hWuymBhLGR2wAHUsVi8D42fzoKT23Sp+GsbalkM7V3xMZi4yZRIHtjBgOzbI3E//zOimGN34mVJIiKL5YFKaSYkxnCdC+0MBRTixhXAt7K+VDphlHm1PRhuAtv7xKmpdVz61691flWiWPo0BOyRmpEI9ckxq5I3XSIJw8kmfySt6csfPivDsfi9Y1J585IX/gfP4A6+WSGQ==</latexit><latexit sha1_base64="hP+6LrUf2d3tZaldqaQQvEKMXyw=">AAAB2XicbZDNSgMxFIXv1L86Vq1rN8EiuCozbnQpuHFZwbZCO5RM5k4bmskMyR2hDH0BF25EfC93vo3pz0JbDwQ+zknIvSculLQUBN9ebWd3b/+gfugfNfzjk9Nmo2fz0gjsilzl5jnmFpXU2CVJCp8LgzyLFfbj6f0i77+gsTLXTzQrMMr4WMtUCk7O6oyaraAdLMW2IVxDC9YaNb+GSS7KDDUJxa0dhEFBUcUNSaFw7g9LiwUXUz7GgUPNM7RRtRxzzi6dk7A0N+5oYkv394uKZ9bOstjdzDhN7Ga2MP/LBiWlt1EldVESarH6KC0Vo5wtdmaJNChIzRxwYaSblYkJN1yQa8Z3HYSbG29D77odBu3wMYA6nMMFXEEIN3AHD9CBLghI4BXevYn35n2suqp569LO4I+8zx84xIo4</latexit><latexit sha1_base64="ywz7v1q7Yrl4nBX/+QcnkaM0kGo=">AAAB6XicbZBLSwMxFIXv+Kz1Vd26CRbRVZlxo0vBjcsK9gHtUDLpnRqayYzJnWIZ+jvcuFDEP+TOf2P6WGjrgcDHOQn35kSZkpZ8/9tbW9/Y3Nou7ZR39/YPDitHe02b5kZgQ6QqNe2IW1RSY4MkKWxnBnkSKWxFw9tp3hqhsTLVDzTOMEz4QMtYCk7OCruEzxTFBU7Oe8NeperX/JnYKgQLqMJC9V7lq9tPRZ6gJqG4tZ3AzygsuCEpFE7K3dxixsWQD7DjUPMEbVjMlp6wM+f0WZwadzSxmfv7RcETa8dJ5G4mnB7tcjY1/8s6OcXXYSF1lhNqMR8U54pRyqYNsL40KEiNHXBhpNuViUduuCDXU9mVECx/eRWal7XArwX3PpTgBE7hAgK4ghu4gzo0QMATvMAbvHsj79X7mNe15i16O4Y/8j5/AKfckNQ=</latexit><latexit sha1_base64="ywz7v1q7Yrl4nBX/+QcnkaM0kGo=">AAAB6XicbZBLSwMxFIXv+Kz1Vd26CRbRVZlxo0vBjcsK9gHtUDLpnRqayYzJnWIZ+jvcuFDEP+TOf2P6WGjrgcDHOQn35kSZkpZ8/9tbW9/Y3Nou7ZR39/YPDitHe02b5kZgQ6QqNe2IW1RSY4MkKWxnBnkSKWxFw9tp3hqhsTLVDzTOMEz4QMtYCk7OCruEzxTFBU7Oe8NeperX/JnYKgQLqMJC9V7lq9tPRZ6gJqG4tZ3AzygsuCEpFE7K3dxixsWQD7DjUPMEbVjMlp6wM+f0WZwadzSxmfv7RcETa8dJ5G4mnB7tcjY1/8s6OcXXYSF1lhNqMR8U54pRyqYNsL40KEiNHXBhpNuViUduuCDXU9mVECx/eRWal7XArwX3PpTgBE7hAgK4ghu4gzo0QMATvMAbvHsj79X7mNe15i16O4Y/8j5/AKfckNQ=</latexit><latexit sha1_base64="Wxt2EGaSkqmyg6rX9KQvpR9rldE=">AAAB9HicbVA9TwJBEN3DL8Qv1NJmIzFSkTsbLUlsLDGRjwQuZG+Zgw17e+fuHJFc+B02Fhpj64+x89+4wBUKvmSSl/dmMjMvSKQw6LrfTmFjc2t7p7hb2ts/ODwqH5+0TJxqDk0ey1h3AmZACgVNFCihk2hgUSChHYxv5357AtqIWD3gNAE/YkMlQsEZWsnvITxhEGYwu+yP++WKW3MXoOvEy0mF5Gj0y1+9QczTCBRyyYzpem6CfsY0Ci5hVuqlBhLGx2wIXUsVi8D42eLoGb2wyoCGsbalkC7U3xMZi4yZRoHtjBiOzKo3F//zuimGN34mVJIiKL5cFKaSYkznCdCB0MBRTi1hXAt7K+UjphlHm1PJhuCtvrxOWlc1z615926lXs3jKJIzck6qxCPXpE7uSIM0CSeP5Jm8kjdn4rw4787HsrXg5DOn5A+czx/qpZIV</latexit><latexit sha1_base64="Iztn6Umi7rLG5lNF0JpW0x6J+s0=">AAAB9HicbVBNS8NAEN34WetX1aOXxSL2VBIR9Fjw4rGC/YA2lM120i7dbOLupFhCf4cXD4p49cd489+4bXPQ1gcDj/dmmJkXJFIYdN1vZ219Y3Nru7BT3N3bPzgsHR03TZxqDg0ey1i3A2ZACgUNFCihnWhgUSChFYxuZ35rDNqIWD3gJAE/YgMlQsEZWsnvIjxhEGYwveiNeqWyW3XnoKvEy0mZ5Kj3Sl/dfszTCBRyyYzpeG6CfsY0Ci5hWuymBhLGR2wAHUsVi8D42fzoKT23Sp+GsbalkM7V3xMZi4yZRIHtjBgOzbI3E//zOimGN34mVJIiKL5YFKaSYkxnCdC+0MBRTixhXAt7K+VDphlHm1PRhuAtv7xKmpdVz61691flWiWPo0BOyRmpEI9ckxq5I3XSIJw8kmfySt6csfPivDsfi9Y1J585IX/gfP4A6+WSGQ==</latexit><latexit sha1_base64="Iztn6Umi7rLG5lNF0JpW0x6J+s0=">AAAB9HicbVBNS8NAEN34WetX1aOXxSL2VBIR9Fjw4rGC/YA2lM120i7dbOLupFhCf4cXD4p49cd489+4bXPQ1gcDj/dmmJkXJFIYdN1vZ219Y3Nru7BT3N3bPzgsHR03TZxqDg0ey1i3A2ZACgUNFCihnWhgUSChFYxuZ35rDNqIWD3gJAE/YgMlQsEZWsnvIjxhEGYwveiNeqWyW3XnoKvEy0mZ5Kj3Sl/dfszTCBRyyYzpeG6CfsY0Ci5hWuymBhLGR2wAHUsVi8D42fzoKT23Sp+GsbalkM7V3xMZi4yZRIHtjBgOzbI3E//zOimGN34mVJIiKL5YFKaSYkxnCdC+0MBRTixhXAt7K+VDphlHm1PRhuAtv7xKmpdVz61691flWiWPo0BOyRmpEI9ckxq5I3XSIJw8kmfySt6csfPivDsfi9Y1J585IX/gfP4A6+WSGQ==</latexit><latexit sha1_base64="Iztn6Umi7rLG5lNF0JpW0x6J+s0=">AAAB9HicbVBNS8NAEN34WetX1aOXxSL2VBIR9Fjw4rGC/YA2lM120i7dbOLupFhCf4cXD4p49cd489+4bXPQ1gcDj/dmmJkXJFIYdN1vZ219Y3Nru7BT3N3bPzgsHR03TZxqDg0ey1i3A2ZACgUNFCihnWhgUSChFYxuZ35rDNqIWD3gJAE/YgMlQsEZWsnvIjxhEGYwveiNeqWyW3XnoKvEy0mZ5Kj3Sl/dfszTCBRyyYzpeG6CfsY0Ci5hWuymBhLGR2wAHUsVi8D42fzoKT23Sp+GsbalkM7V3xMZi4yZRIHtjBgOzbI3E//zOimGN34mVJIiKL5YFKaSYkxnCdC+0MBRTixhXAt7K+VDphlHm1PRhuAtv7xKmpdVz61691flWiWPo0BOyRmpEI9ckxq5I3XSIJw8kmfySt6csfPivDsfi9Y1J585IX/gfP4A6+WSGQ==</latexit><latexit sha1_base64="Iztn6Umi7rLG5lNF0JpW0x6J+s0=">AAAB9HicbVBNS8NAEN34WetX1aOXxSL2VBIR9Fjw4rGC/YA2lM120i7dbOLupFhCf4cXD4p49cd489+4bXPQ1gcDj/dmmJkXJFIYdN1vZ219Y3Nru7BT3N3bPzgsHR03TZxqDg0ey1i3A2ZACgUNFCihnWhgUSChFYxuZ35rDNqIWD3gJAE/YgMlQsEZWsnvIjxhEGYwveiNeqWyW3XnoKvEy0mZ5Kj3Sl/dfszTCBRyyYzpeG6CfsY0Ci5hWuymBhLGR2wAHUsVi8D42fzoKT23Sp+GsbalkM7V3xMZi4yZRIHtjBgOzbI3E//zOimGN34mVJIiKL5YFKaSYkxnCdC+0MBRTixhXAt7K+VDphlHm1PRhuAtv7xKmpdVz61691flWiWPo0BOyRmpEI9ckxq5I3XSIJw8kmfySt6csfPivDsfi9Y1J585IX/gfP4A6+WSGQ==</latexit><latexit sha1_base64="Iztn6Umi7rLG5lNF0JpW0x6J+s0=">AAAB9HicbVBNS8NAEN34WetX1aOXxSL2VBIR9Fjw4rGC/YA2lM120i7dbOLupFhCf4cXD4p49cd489+4bXPQ1gcDj/dmmJkXJFIYdN1vZ219Y3Nru7BT3N3bPzgsHR03TZxqDg0ey1i3A2ZACgUNFCihnWhgUSChFYxuZ35rDNqIWD3gJAE/YgMlQsEZWsnvIjxhEGYwveiNeqWyW3XnoKvEy0mZ5Kj3Sl/dfszTCBRyyYzpeG6CfsY0Ci5hWuymBhLGR2wAHUsVi8D42fzoKT23Sp+GsbalkM7V3xMZi4yZRIHtjBgOzbI3E//zOimGN34mVJIiKL5YFKaSYkxnCdC+0MBRTixhXAt7K+VDphlHm1PRhuAtv7xKmpdVz61691flWiWPo0BOyRmpEI9ckxq5I3XSIJw8kmfySt6csfPivDsfi9Y1J585IX/gfP4A6+WSGQ==</latexit><latexit sha1_base64="Iztn6Umi7rLG5lNF0JpW0x6J+s0=">AAAB9HicbVBNS8NAEN34WetX1aOXxSL2VBIR9Fjw4rGC/YA2lM120i7dbOLupFhCf4cXD4p49cd489+4bXPQ1gcDj/dmmJkXJFIYdN1vZ219Y3Nru7BT3N3bPzgsHR03TZxqDg0ey1i3A2ZACgUNFCihnWhgUSChFYxuZ35rDNqIWD3gJAE/YgMlQsEZWsnvIjxhEGYwveiNeqWyW3XnoKvEy0mZ5Kj3Sl/dfszTCBRyyYzpeG6CfsY0Ci5hWuymBhLGR2wAHUsVi8D42fzoKT23Sp+GsbalkM7V3xMZi4yZRIHtjBgOzbI3E//zOimGN34mVJIiKL5YFKaSYkxnCdC+0MBRTixhXAt7K+VDphlHm1PRhuAtv7xKmpdVz61691flWiWPo0BOyRmpEI9ckxq5I3XSIJw8kmfySt6csfPivDsfi9Y1J585IX/gfP4A6+WSGQ==</latexit>v0
i<latexit sha1_base64="PT7VlVtIO1b4RdkSG9z8jpkhSqk=">AAAB9HicbVBNS8NAEJ34WetX1aOXxSL2VBIR9Fjw4rGC/YA2lM120y7dbOLupFhCf4cXD4p49cd489+4bXPQ1gcDj/dmmJkXJFIYdN1vZ219Y3Nru7BT3N3bPzgsHR03TZxqxhsslrFuB9RwKRRvoEDJ24nmNAokbwWj25nfGnNtRKwecJJwP6IDJULBKFrJ7yJ/wiDMxtOLnuiVym7VnYOsEi8nZchR75W+uv2YpRFXyCQ1puO5CfoZ1SiY5NNiNzU8oWxEB7xjqaIRN342P3pKzq3SJ2GsbSkkc/X3REYjYyZRYDsjikOz7M3E/7xOiuGNnwmVpMgVWywKU0kwJrMESF9ozlBOLKFMC3srYUOqKUObU9GG4C2/vEqal1XPrXr3V+VaJY+jAKdwBhXw4BpqcAd1aACDR3iGV3hzxs6L8+58LFrXnHzmBP7A+fwBAvSSKA==</latexit><latexit sha1_base64="PT7VlVtIO1b4RdkSG9z8jpkhSqk=">AAAB9HicbVBNS8NAEJ34WetX1aOXxSL2VBIR9Fjw4rGC/YA2lM120y7dbOLupFhCf4cXD4p49cd489+4bXPQ1gcDj/dmmJkXJFIYdN1vZ219Y3Nru7BT3N3bPzgsHR03TZxqxhsslrFuB9RwKRRvoEDJ24nmNAokbwWj25nfGnNtRKwecJJwP6IDJULBKFrJ7yJ/wiDMxtOLnuiVym7VnYOsEi8nZchR75W+uv2YpRFXyCQ1puO5CfoZ1SiY5NNiNzU8oWxEB7xjqaIRN342P3pKzq3SJ2GsbSkkc/X3REYjYyZRYDsjikOz7M3E/7xOiuGNnwmVpMgVWywKU0kwJrMESF9ozlBOLKFMC3srYUOqKUObU9GG4C2/vEqal1XPrXr3V+VaJY+jAKdwBhXw4BpqcAd1aACDR3iGV3hzxs6L8+58LFrXnHzmBP7A+fwBAvSSKA==</latexit><latexit sha1_base64="6WjtAQy1eEki3DeLmUkkI9Sk/Os=">AAAB53icbVDLSsNAFL2pr1pfVZduBovQVUlE0GXBjcsK9gFtkMnkph06mYSZiVBCf8CNC0Xc+kvu/BunaRbaemDgcM65zL0nSAXXxnW/ncrG5tb2TnW3trd/cHhUPz7p6SRTDLssEYkaBFSj4BK7hhuBg1QhjQOB/WB6u/D7T6g0T+SDmaXox3QsecQZNVbqPNYbbsstQNaJV5IGlLD5r1GYsCxGaZigWg89NzV+TpXhTOC8Nso0ppRN6RiHlkoao/bzYs85ubBKSKJE2ScNKdTfEzmNtZ7FgU3G1Ez0qrcQ//OGmYlu/JzLNDMo2fKjKBPEJGRxNAm5QmbEzBLKFLe7EjahijJjq6nZErzVk9dJ77LluS3v/qrRbpZ1VOEMzqEJHlxDG+6gA11gEMIzvMKbw50X5935WEYrTjlzCn/gfP4AA6WMYA==</latexit><latexit sha1_base64="6WjtAQy1eEki3DeLmUkkI9Sk/Os=">AAAB53icbVDLSsNAFL2pr1pfVZduBovQVUlE0GXBjcsK9gFtkMnkph06mYSZiVBCf8CNC0Xc+kvu/BunaRbaemDgcM65zL0nSAXXxnW/ncrG5tb2TnW3trd/cHhUPz7p6SRTDLssEYkaBFSj4BK7hhuBg1QhjQOB/WB6u/D7T6g0T+SDmaXox3QsecQZNVbqPNYbbsstQNaJV5IGlLD5r1GYsCxGaZigWg89NzV+TpXhTOC8Nso0ppRN6RiHlkoao/bzYs85ubBKSKJE2ScNKdTfEzmNtZ7FgU3G1Ez0qrcQ//OGmYlu/JzLNDMo2fKjKBPEJGRxNAm5QmbEzBLKFLe7EjahijJjq6nZErzVk9dJ77LluS3v/qrRbpZ1VOEMzqEJHlxDG+6gA11gEMIzvMKbw50X5935WEYrTjlzCn/gfP4AA6WMYA==</latexit><latexit sha1_base64="hP+6LrUf2d3tZaldqaQQvEKMXyw=">AAAB2XicbZDNSgMxFIXv1L86Vq1rN8EiuCozbnQpuHFZwbZCO5RM5k4bmskMyR2hDH0BF25EfC93vo3pz0JbDwQ+zknIvSculLQUBN9ebWd3b/+gfugfNfzjk9Nmo2fz0gjsilzl5jnmFpXU2CVJCp8LgzyLFfbj6f0i77+gsTLXTzQrMMr4WMtUCk7O6oyaraAdLMW2IVxDC9YaNb+GSS7KDDUJxa0dhEFBUcUNSaFw7g9LiwUXUz7GgUPNM7RRtRxzzi6dk7A0N+5oYkv394uKZ9bOstjdzDhN7Ga2MP/LBiWlt1EldVESarH6KC0Vo5wtdmaJNChIzRxwYaSblYkJN1yQa8Z3HYSbG29D77odBu3wMYA6nMMFXEEIN3AHD9CBLghI4BXevYn35n2suqp569LO4I+8zx84xIo4</latexit><latexit sha1_base64="OfCCjkcIiyDbxmNKxve032U7QH4=">AAAB3HicbVBNS8NAEJ3Ur1qrVq9eFovgqSRe9Ch48VjBfkAbZLOZtEs3m7A7EUroH/DiQRF/lzf/jduPg7Y+GHi8N8PMvChX0pLvf3uVre2d3b3qfu2gfnh03Dipd21WGIEdkanM9CNuUUmNHZKksJ8b5GmksBdN7uZ+7xmNlZl+pGmOYcpHWiZScHJS+6nR9Fv+AmyTBCvShBVc/9cwzkSRoiahuLWDwM8pLLkhKRTOasPCYs7FhI9w4KjmKdqwXNw5YxdOiVmSGVea2EL9PVHy1NppGrnOlNPYrntz8T9vUFByE5ZS5wWhFstFSaEYZWz+NIulQUFq6ggXRrpbmRhzwwW5aGouhGD95U3SvWoFfit48KEKZ3AOlxDANdzCPbShAwJieIE3ePek9+p9LOOqeKvcTuEPvM8f/CqLKA==</latexit><latexit sha1_base64="OfCCjkcIiyDbxmNKxve032U7QH4=">AAAB3HicbVBNS8NAEJ3Ur1qrVq9eFovgqSRe9Ch48VjBfkAbZLOZtEs3m7A7EUroH/DiQRF/lzf/jduPg7Y+GHi8N8PMvChX0pLvf3uVre2d3b3qfu2gfnh03Dipd21WGIEdkanM9CNuUUmNHZKksJ8b5GmksBdN7uZ+7xmNlZl+pGmOYcpHWiZScHJS+6nR9Fv+AmyTBCvShBVc/9cwzkSRoiahuLWDwM8pLLkhKRTOasPCYs7FhI9w4KjmKdqwXNw5YxdOiVmSGVea2EL9PVHy1NppGrnOlNPYrntz8T9vUFByE5ZS5wWhFstFSaEYZWz+NIulQUFq6ggXRrpbmRhzwwW5aGouhGD95U3SvWoFfit48KEKZ3AOlxDANdzCPbShAwJieIE3ePek9+p9LOOqeKvcTuEPvM8f/CqLKA==</latexit><latexit sha1_base64="PwZ8GjhNs4EFPNOrNCQnWexiUCQ=">AAAB53icbVDLSgMxFL1TX7W+qi7dBIvQVZlxo8uCG5cV7APaQTKZTBuaZIbkjlCG/oAbF4q49Zfc+Tem7Sy0eiBwOOdccu+JMiks+v6XV9nY3Nreqe7W9vYPDo/qxyc9m+aG8S5LZWoGEbVcCs27KFDyQWY4VZHk/Wh6s/D7j9xYkep7nGU8VHSsRSIYRSd1HuoNv+UvQf6SoCQNKOHyn6M4ZbniGpmk1g4DP8OwoAYFk3xeG+WWZ5RN6ZgPHdVUcRsWyz3n5MIpMUlS455GslR/ThRUWTtTkUsqihO77i3E/7xhjsl1WAid5cg1W32U5JJgShZHk1gYzlDOHKHMCLcrYRNqKENXTc2VEKyf/Jf0LluB3wru/Ea7WdZRhTM4hyYEcAVtuIUOdIFBDE/wAq+e8J69N+99Fa145cwp/IL38Q0CZYxc</latexit><latexit sha1_base64="6WjtAQy1eEki3DeLmUkkI9Sk/Os=">AAAB53icbVDLSsNAFL2pr1pfVZduBovQVUlE0GXBjcsK9gFtkMnkph06mYSZiVBCf8CNC0Xc+kvu/BunaRbaemDgcM65zL0nSAXXxnW/ncrG5tb2TnW3trd/cHhUPz7p6SRTDLssEYkaBFSj4BK7hhuBg1QhjQOB/WB6u/D7T6g0T+SDmaXox3QsecQZNVbqPNYbbsstQNaJV5IGlLD5r1GYsCxGaZigWg89NzV+TpXhTOC8Nso0ppRN6RiHlkoao/bzYs85ubBKSKJE2ScNKdTfEzmNtZ7FgU3G1Ez0qrcQ//OGmYlu/JzLNDMo2fKjKBPEJGRxNAm5QmbEzBLKFLe7EjahijJjq6nZErzVk9dJ77LluS3v/qrRbpZ1VOEMzqEJHlxDG+6gA11gEMIzvMKbw50X5935WEYrTjlzCn/gfP4AA6WMYA==</latexit><latexit sha1_base64="6WjtAQy1eEki3DeLmUkkI9Sk/Os=">AAAB53icbVDLSsNAFL2pr1pfVZduBovQVUlE0GXBjcsK9gFtkMnkph06mYSZiVBCf8CNC0Xc+kvu/BunaRbaemDgcM65zL0nSAXXxnW/ncrG5tb2TnW3trd/cHhUPz7p6SRTDLssEYkaBFSj4BK7hhuBg1QhjQOB/WB6u/D7T6g0T+SDmaXox3QsecQZNVbqPNYbbsstQNaJV5IGlLD5r1GYsCxGaZigWg89NzV+TpXhTOC8Nso0ppRN6RiHlkoao/bzYs85ubBKSKJE2ScNKdTfEzmNtZ7FgU3G1Ez0qrcQ//OGmYlu/JzLNDMo2fKjKBPEJGRxNAm5QmbEzBLKFLe7EjahijJjq6nZErzVk9dJ77LluS3v/qrRbpZ1VOEMzqEJHlxDG+6gA11gEMIzvMKbw50X5935WEYrTjlzCn/gfP4AA6WMYA==</latexit><latexit sha1_base64="6WjtAQy1eEki3DeLmUkkI9Sk/Os=">AAAB53icbVDLSsNAFL2pr1pfVZduBovQVUlE0GXBjcsK9gFtkMnkph06mYSZiVBCf8CNC0Xc+kvu/BunaRbaemDgcM65zL0nSAXXxnW/ncrG5tb2TnW3trd/cHhUPz7p6SRTDLssEYkaBFSj4BK7hhuBg1QhjQOB/WB6u/D7T6g0T+SDmaXox3QsecQZNVbqPNYbbsstQNaJV5IGlLD5r1GYsCxGaZigWg89NzV+TpXhTOC8Nso0ppRN6RiHlkoao/bzYs85ubBKSKJE2ScNKdTfEzmNtZ7FgU3G1Ez0qrcQ//OGmYlu/JzLNDMo2fKjKBPEJGRxNAm5QmbEzBLKFLe7EjahijJjq6nZErzVk9dJ77LluS3v/qrRbpZ1VOEMzqEJHlxDG+6gA11gEMIzvMKbw50X5935WEYrTjlzCn/gfP4AA6WMYA==</latexit><latexit sha1_base64="6WjtAQy1eEki3DeLmUkkI9Sk/Os=">AAAB53icbVDLSsNAFL2pr1pfVZduBovQVUlE0GXBjcsK9gFtkMnkph06mYSZiVBCf8CNC0Xc+kvu/BunaRbaemDgcM65zL0nSAXXxnW/ncrG5tb2TnW3trd/cHhUPz7p6SRTDLssEYkaBFSj4BK7hhuBg1QhjQOB/WB6u/D7T6g0T+SDmaXox3QsecQZNVbqPNYbbsstQNaJV5IGlLD5r1GYsCxGaZigWg89NzV+TpXhTOC8Nso0ppRN6RiHlkoao/bzYs85ubBKSKJE2ScNKdTfEzmNtZ7FgU3G1Ez0qrcQ//OGmYlu/JzLNDMo2fKjKBPEJGRxNAm5QmbEzBLKFLe7EjahijJjq6nZErzVk9dJ77LluS3v/qrRbpZ1VOEMzqEJHlxDG+6gA11gEMIzvMKbw50X5935WEYrTjlzCn/gfP4AA6WMYA==</latexit><latexit sha1_base64="6WjtAQy1eEki3DeLmUkkI9Sk/Os=">AAAB53icbVDLSsNAFL2pr1pfVZduBovQVUlE0GXBjcsK9gFtkMnkph06mYSZiVBCf8CNC0Xc+kvu/BunaRbaemDgcM65zL0nSAXXxnW/ncrG5tb2TnW3trd/cHhUPz7p6SRTDLssEYkaBFSj4BK7hhuBg1QhjQOB/WB6u/D7T6g0T+SDmaXox3QsecQZNVbqPNYbbsstQNaJV5IGlLD5r1GYsCxGaZigWg89NzV+TpXhTOC8Nso0ppRN6RiHlkoao/bzYs85ubBKSKJE2ScNKdTfEzmNtZ7FgU3G1Ez0qrcQ//OGmYlu/JzLNDMo2fKjKBPEJGRxNAm5QmbEzBLKFLe7EjahijJjq6nZErzVk9dJ77LluS3v/qrRbpZ1VOEMzqEJHlxDG+6gA11gEMIzvMKbw50X5935WEYrTjlzCn/gfP4AA6WMYA==</latexit><latexit sha1_base64="6WjtAQy1eEki3DeLmUkkI9Sk/Os=">AAAB53icbVDLSsNAFL2pr1pfVZduBovQVUlE0GXBjcsK9gFtkMnkph06mYSZiVBCf8CNC0Xc+kvu/BunaRbaemDgcM65zL0nSAXXxnW/ncrG5tb2TnW3trd/cHhUPz7p6SRTDLssEYkaBFSj4BK7hhuBg1QhjQOB/WB6u/D7T6g0T+SDmaXox3QsecQZNVbqPNYbbsstQNaJV5IGlLD5r1GYsCxGaZigWg89NzV+TpXhTOC8Nso0ppRN6RiHlkoao/bzYs85ubBKSKJE2ScNKdTfEzmNtZ7FgU3G1Ez0qrcQ//OGmYlu/JzLNDMo2fKjKBPEJGRxNAm5QmbEzBLKFLe7EjahijJjq6nZErzVk9dJ77LluS3v/qrRbpZ1VOEMzqEJHlxDG+6gA11gEMIzvMKbw50X5935WEYrTjlzCn/gfP4AA6WMYA==</latexit>
(c) Global update
Figure 3.5 – The Graph Network (GN) framework introduces relational inductive biases in DL
architectures by considering the input data as a graph. It works by iteratively updatingnodes, edges and global states. Reproduced from Battaglia et al. (2018)
where φ(·) is a learnable neural network. Then, the fused representation m is obtained byfusing q with the attention product v:
m = f (q, v) (3.4)
where f (·) is a learnable fusion module, e.g. an addition plus a MLP. Yang et al. (2016) goone step further and propose a Stacked Attention Networks (SAN), composed of severaliterations of attention in order to perform multi-hop reasoning. Besides, as shown inFigure 3.4, the UpDn (Anderson et al. 2018) model adapts this attention mechanism toobject-level features.
bilinear fusion Bi-linear fusion is a more expressive family of models, helping tolearn high level associations between question and visual concepts in the image. Theyconsist in encoding fully-parameterized bilinear interactions between the question q ∈ Rdq
and the image v ∈ Rdv representations. It is expressed as follows:
m = (T ×1 q)×2 v (3.5)
with T ∈ Rdq×dv×dm a learnable tensor. The operator ×i is the i-mode product betweena tensor and a matrix. However, such a formulation suffers from over parametrizationand therefore overfitting. Subsequent work address this by using compact bilinearpooling (Fukui et al. 2016), low-rank bilinear pooling (Kim et al. 2016), or even by creatinglow-rank decomposition of the fusion tensors, either through Tucker tensor compositionsas in MUTAN (Ben-Younes et al. 2017), or block tensor decomposition like in BLOCK (Ben-Younes et al. 2019). Finally, Kim et al. (2018) combine bilinear fusion with attentionmechanisms to obtain their Bilinear Attention Network (BAN).
relational inductive biases Although it was already perceptible in some bilinearfusion methods, other approaches introduce relational inductive biases into the fusionarchitecture, in the form of variants of GN (Battaglia et al. 2018). This fusion paradigmconsists in representing the image-question pair as a graph, where the nodes are questionwords and image regions (or objects). It turns out that many VQA architectures fall intothe GN framework drawn by Battaglia et al. (2018) and illustrated in Figure 3.5. GN worksby iteratively applying the following operations: (a) the edge update, i.e. the messagepassing mechanism allowing to circulate the information between nodes; (b) the node
22
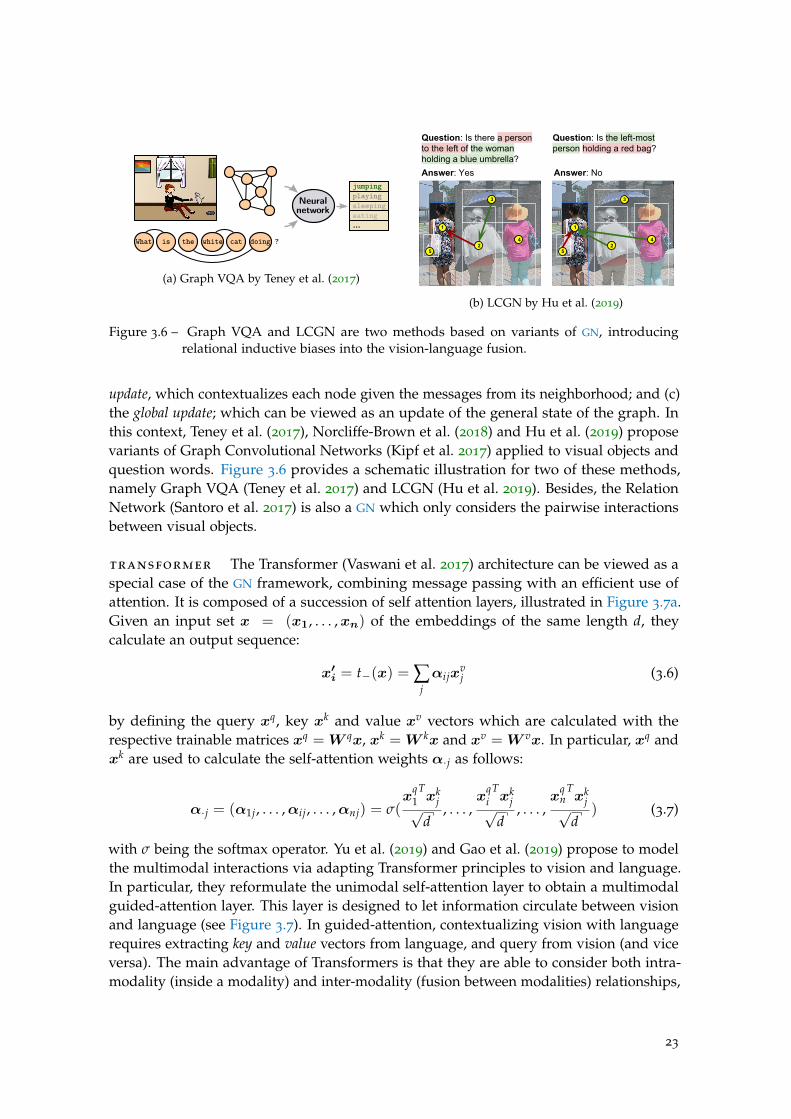
...
jumpingplayingsleepingeating
Neuralnetwork
?the whiteWhat cat doingis
(a) Graph VQA by Teney et al. (2017)
Question: Is there a person to the left of the woman holding a blue umbrella?Answer: Yes Answer: No
Question: Is the left-most person holding a red bag?
4
5
3
1
24
25
3
1
(b) LCGN by Hu et al. (2019)
Figure 3.6 – Graph VQA and LCGN are two methods based on variants of GN, introducingrelational inductive biases into the vision-language fusion.
update, which contextualizes each node given the messages from its neighborhood; and (c)the global update; which can be viewed as an update of the general state of the graph. Inthis context, Teney et al. (2017), Norcliffe-Brown et al. (2018) and Hu et al. (2019) proposevariants of Graph Convolutional Networks (Kipf et al. 2017) applied to visual objects andquestion words. Figure 3.6 provides a schematic illustration for two of these methods,namely Graph VQA (Teney et al. 2017) and LCGN (Hu et al. 2019). Besides, the RelationNetwork (Santoro et al. 2017) is also a GN which only considers the pairwise interactionsbetween visual objects.
transformer The Transformer (Vaswani et al. 2017) architecture can be viewed as aspecial case of the GN framework, combining message passing with an efficient use ofattention. It is composed of a succession of self attention layers, illustrated in Figure 3.7a.Given an input set x = (x1, . . . ,xn) of the embeddings of the same length d, theycalculate an output sequence:
x′i = t−(x) = ∑
jαijx
vj (3.6)
by defining the query xq, key xk and value xv vectors which are calculated with therespective trainable matrices xq =W qx, xk =W kx and xv =W vx. In particular, xq andxk are used to calculate the self-attention weights α·j as follows:
α·j = (α1j, . . . ,αij, . . . ,αnj) = σ(x
q1
Txk
j√d
, . . . ,x
qi
Txk
j√d
, . . . ,x
qn
Txk
j√d
) (3.7)
with σ being the softmax operator. Yu et al. (2019) and Gao et al. (2019) propose to modelthe multimodal interactions via adapting Transformer principles to vision and language.In particular, they reformulate the unimodal self-attention layer to obtain a multimodalguided-attention layer. This layer is designed to let information circulate between visionand language (see Figure 3.7). In guided-attention, contextualizing vision with languagerequires extracting key and value vectors from language, and query from vision (and viceversa). The main advantage of Transformers is that they are able to consider both intra-modality (inside a modality) and inter-modality (fusion between modalities) relationships,
23
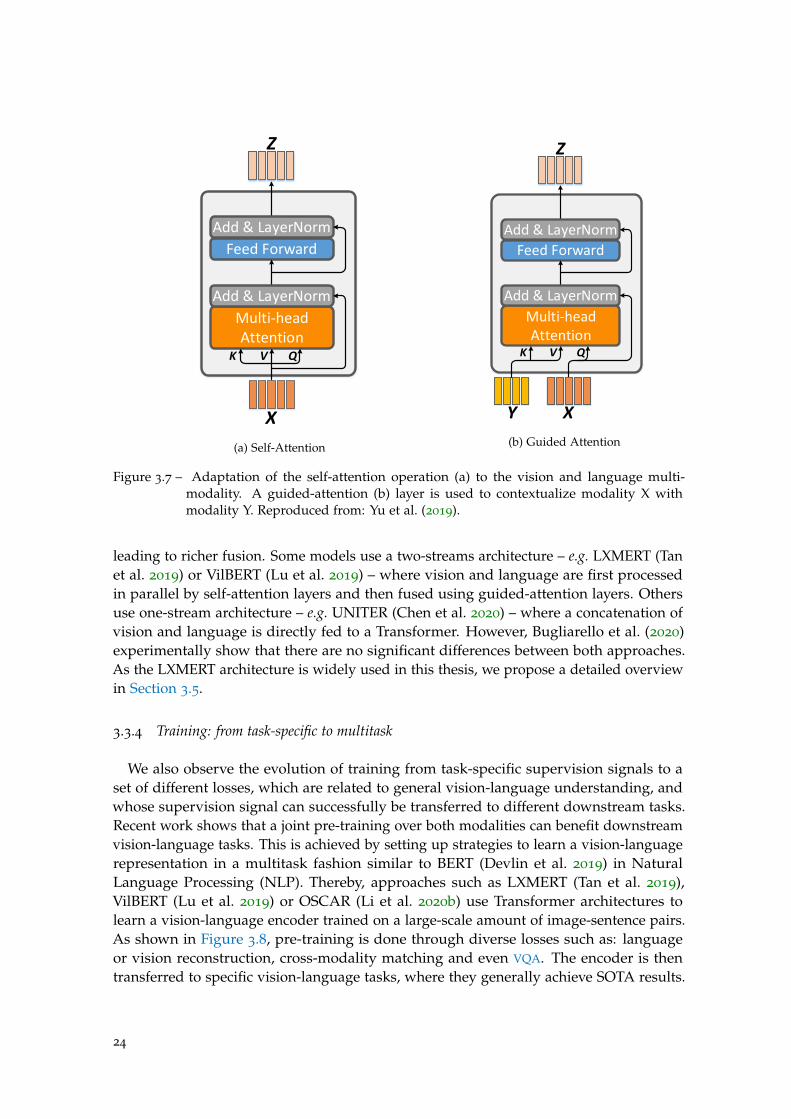
Feed Forward
Multi-head Attention
Add & LayerNorm
Add & LayerNorm
K V Q
X
Z
(a) Self-Attention
Feed Forward
Multi-head Attention
Add & LayerNorm
Add & LayerNorm
K V Q
XY
Z
(b) Guided Attention
Figure 3.7 – Adaptation of the self-attention operation (a) to the vision and language multi-modality. A guided-attention (b) layer is used to contextualize modality X withmodality Y. Reproduced from: Yu et al. (2019).
leading to richer fusion. Some models use a two-streams architecture – e.g. LXMERT (Tanet al. 2019) or VilBERT (Lu et al. 2019) – where vision and language are first processedin parallel by self-attention layers and then fused using guided-attention layers. Othersuse one-stream architecture – e.g. UNITER (Chen et al. 2020) – where a concatenation ofvision and language is directly fed to a Transformer. However, Bugliarello et al. (2020)experimentally show that there are no significant differences between both approaches.As the LXMERT architecture is widely used in this thesis, we propose a detailed overviewin Section 3.5.
3.3.4 Training: from task-specific to multitask
We also observe the evolution of training from task-specific supervision signals to aset of different losses, which are related to general vision-language understanding, andwhose supervision signal can successfully be transferred to different downstream tasks.Recent work shows that a joint pre-training over both modalities can benefit downstreamvision-language tasks. This is achieved by setting up strategies to learn a vision-languagerepresentation in a multitask fashion similar to BERT (Devlin et al. 2019) in NaturalLanguage Processing (NLP). Thereby, approaches such as LXMERT (Tan et al. 2019),VilBERT (Lu et al. 2019) or OSCAR (Li et al. 2020b) use Transformer architectures tolearn a vision-language encoder trained on a large-scale amount of image-sentence pairs.As shown in Figure 3.8, pre-training is done through diverse losses such as: languageor vision reconstruction, cross-modality matching and even VQA. The encoder is thentransferred to specific vision-language tasks, where they generally achieve SOTA results.
24
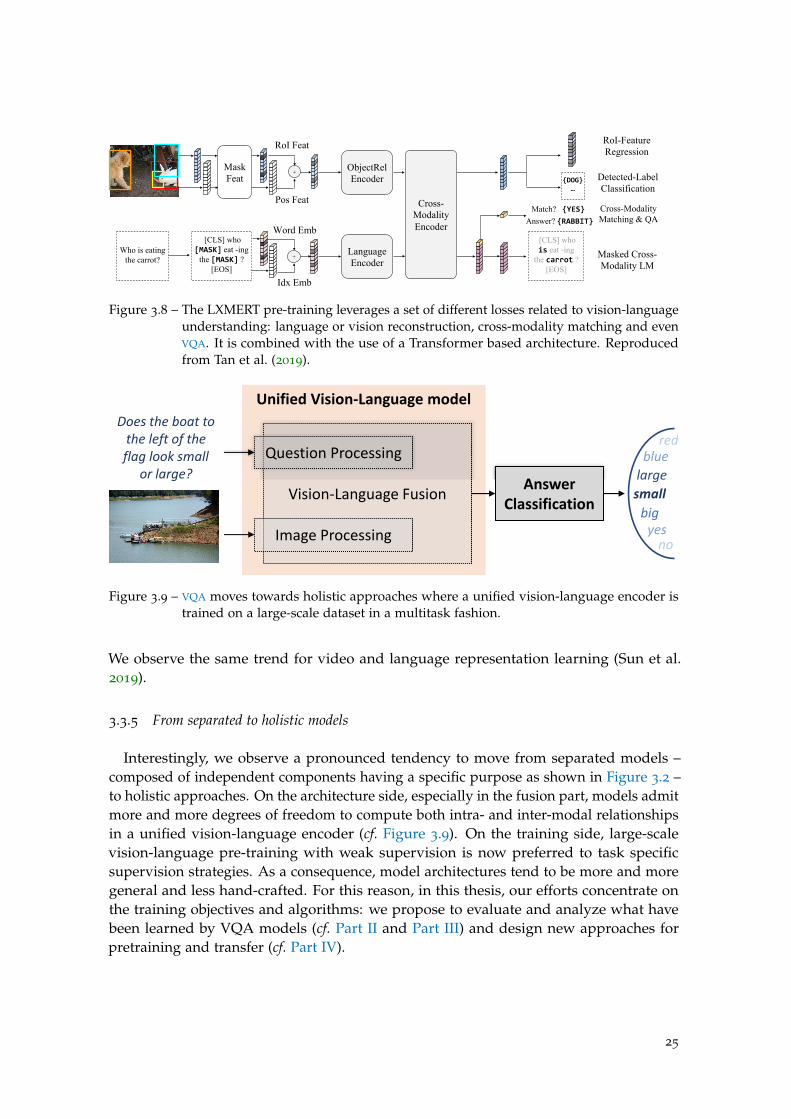
+
RoI Feat RoI-Feature Regression
Pos Feat
Who is eating
the carrot? +
Word Emb
Idx Emb
Mask Feat
[CLS] who [MASK] eat -ing
the [MASK] ? [EOS]
Detected-Label Classification
Masked Cross- Modality LM
Answer? {RABBIT} Match? {YES}
{DOG}…
ObjectRel Encoder
Language Encoder
Cross- Modality Encoder
[CLS] who is eat -ing
the carrot ? [EOS]
Cross-Modality Matching & QA
Figure 3.8 – The LXMERT pre-training leverages a set of different losses related to vision-languageunderstanding: language or vision reconstruction, cross-modality matching and evenVQA. It is combined with the use of a Transformer based architecture. Reproducedfrom Tan et al. (2019).
Figure 3.9 – VQA moves towards holistic approaches where a unified vision-language encoder istrained on a large-scale dataset in a multitask fashion.
We observe the same trend for video and language representation learning (Sun et al.2019).
3.3.5 From separated to holistic models
Interestingly, we observe a pronounced tendency to move from separated models –composed of independent components having a specific purpose as shown in Figure 3.2 –to holistic approaches. On the architecture side, especially in the fusion part, models admitmore and more degrees of freedom to compute both intra- and inter-modal relationshipsin a unified vision-language encoder (cf. Figure 3.9). On the training side, large-scalevision-language pre-training with weak supervision is now preferred to task specificsupervision strategies. As a consequence, model architectures tend to be more and moregeneral and less hand-crafted. For this reason, in this thesis, our efforts concentrate onthe training objectives and algorithms: we propose to evaluate and analyze what havebeen learned by VQA models (cf. Part II and Part III) and design new approaches forpretraining and transfer (cf. Part IV).
25
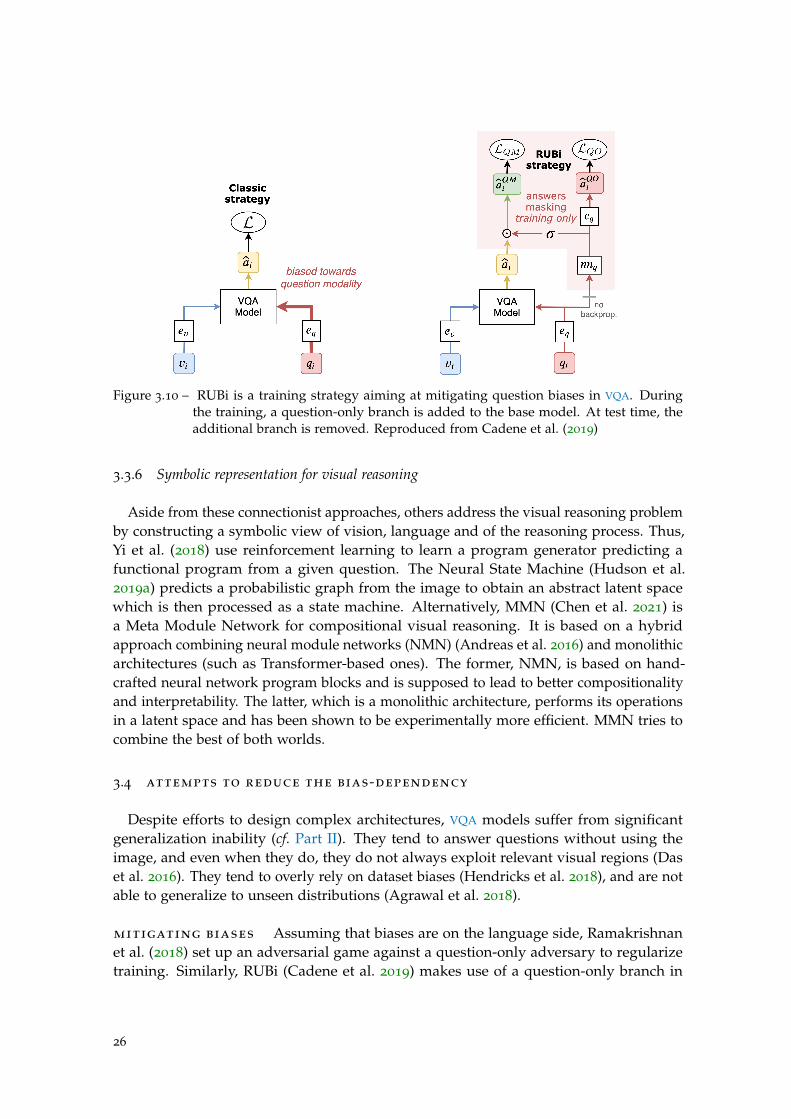
Figure 3.10 – RUBi is a training strategy aiming at mitigating question biases in VQA. Duringthe training, a question-only branch is added to the base model. At test time, theadditional branch is removed. Reproduced from Cadene et al. (2019)
3.3.6 Symbolic representation for visual reasoning
Aside from these connectionist approaches, others address the visual reasoning problemby constructing a symbolic view of vision, language and of the reasoning process. Thus,Yi et al. (2018) use reinforcement learning to learn a program generator predicting afunctional program from a given question. The Neural State Machine (Hudson et al.2019a) predicts a probabilistic graph from the image to obtain an abstract latent spacewhich is then processed as a state machine. Alternatively, MMN (Chen et al. 2021) isa Meta Module Network for compositional visual reasoning. It is based on a hybridapproach combining neural module networks (NMN) (Andreas et al. 2016) and monolithicarchitectures (such as Transformer-based ones). The former, NMN, is based on hand-crafted neural network program blocks and is supposed to lead to better compositionalityand interpretability. The latter, which is a monolithic architecture, performs its operationsin a latent space and has been shown to be experimentally more efficient. MMN tries tocombine the best of both worlds.
3.4 attempts to reduce the bias-dependency
Despite efforts to design complex architectures, VQA models suffer from significantgeneralization inability (cf. Part II). They tend to answer questions without using theimage, and even when they do, they do not always exploit relevant visual regions (Daset al. 2016). They tend to overly rely on dataset biases (Hendricks et al. 2018), and are notable to generalize to unseen distributions (Agrawal et al. 2018).
mitigating biases Assuming that biases are on the language side, Ramakrishnanet al. (2018) set up an adversarial game against a question-only adversary to regularizetraining. Similarly, RUBi (Cadene et al. 2019) makes use of a question-only branch in
26
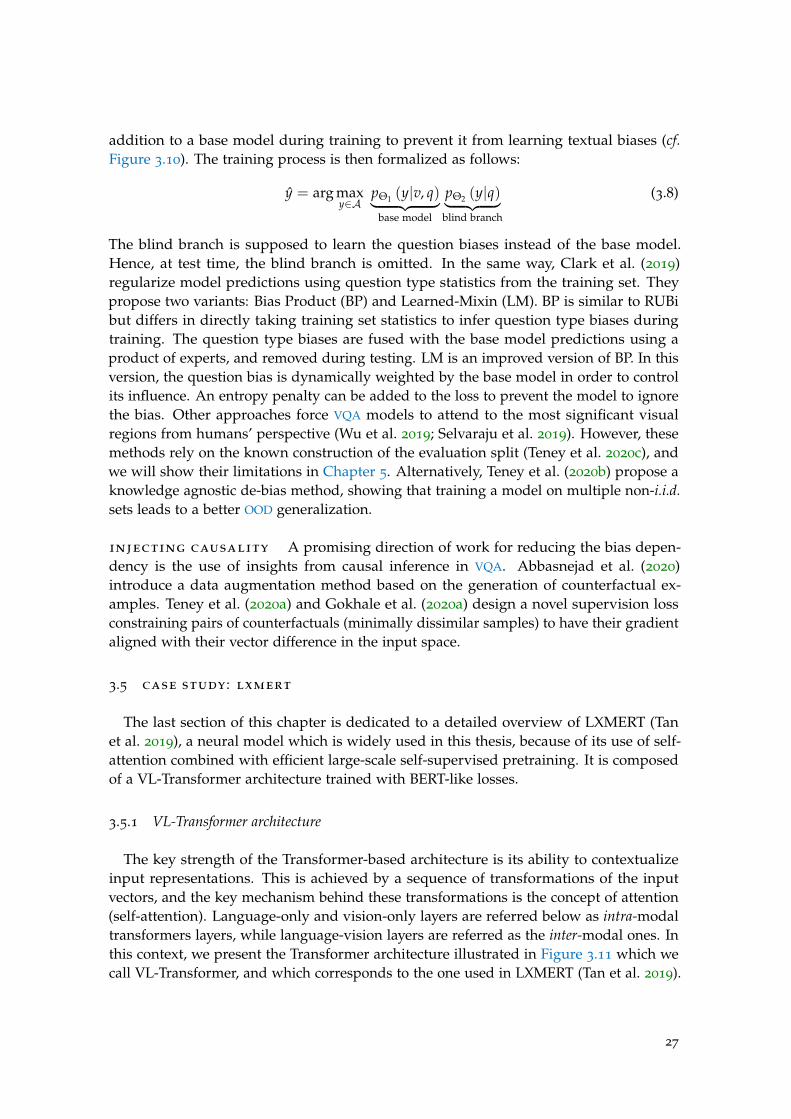
addition to a base model during training to prevent it from learning textual biases (cf.Figure 3.10). The training process is then formalized as follows:
y = arg maxy∈A
pΘ1 (y|v, q)︸ ︷︷ ︸base model
pΘ2 (y|q)︸ ︷︷ ︸blind branch
(3.8)
The blind branch is supposed to learn the question biases instead of the base model.Hence, at test time, the blind branch is omitted. In the same way, Clark et al. (2019)regularize model predictions using question type statistics from the training set. Theypropose two variants: Bias Product (BP) and Learned-Mixin (LM). BP is similar to RUBibut differs in directly taking training set statistics to infer question type biases duringtraining. The question type biases are fused with the base model predictions using aproduct of experts, and removed during testing. LM is an improved version of BP. In thisversion, the question bias is dynamically weighted by the base model in order to controlits influence. An entropy penalty can be added to the loss to prevent the model to ignorethe bias. Other approaches force VQA models to attend to the most significant visualregions from humans’ perspective (Wu et al. 2019; Selvaraju et al. 2019). However, thesemethods rely on the known construction of the evaluation split (Teney et al. 2020c), andwe will show their limitations in Chapter 5. Alternatively, Teney et al. (2020b) propose aknowledge agnostic de-bias method, showing that training a model on multiple non-i.i.d.sets leads to a better OOD generalization.
injecting causality A promising direction of work for reducing the bias depen-dency is the use of insights from causal inference in VQA. Abbasnejad et al. (2020)introduce a data augmentation method based on the generation of counterfactual ex-amples. Teney et al. (2020a) and Gokhale et al. (2020a) design a novel supervision lossconstraining pairs of counterfactuals (minimally dissimilar samples) to have their gradientaligned with their vector difference in the input space.
3.5 case study : lxmert
The last section of this chapter is dedicated to a detailed overview of LXMERT (Tanet al. 2019), a neural model which is widely used in this thesis, because of its use of self-attention combined with efficient large-scale self-supervised pretraining. It is composedof a VL-Transformer architecture trained with BERT-like losses.
3.5.1 VL-Transformer architecture
The key strength of the Transformer-based architecture is its ability to contextualizeinput representations. This is achieved by a sequence of transformations of the inputvectors, and the key mechanism behind these transformations is the concept of attention(self-attention). Language-only and vision-only layers are referred below as intra-modaltransformers layers, while language-vision layers are referred as the inter-modal ones. Inthis context, we present the Transformer architecture illustrated in Figure 3.11 which wecall VL-Transformer, and which corresponds to the one used in LXMERT (Tan et al. 2019).
27
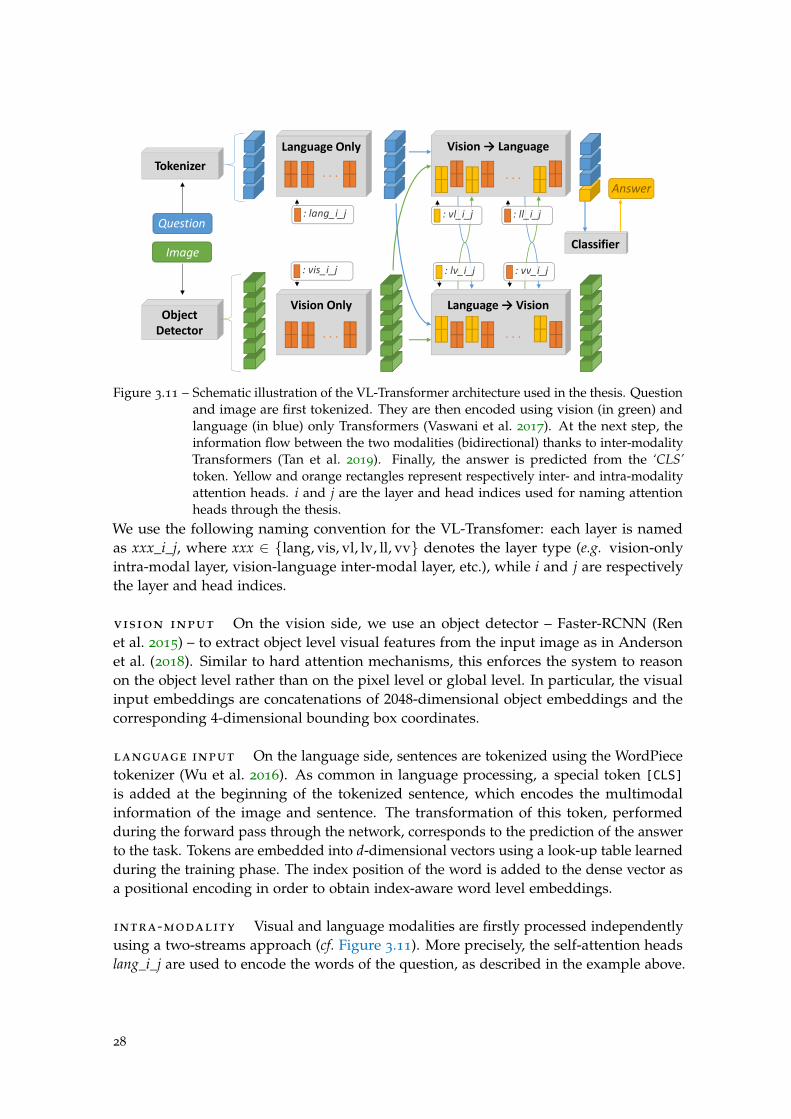
Figure 3.11 – Schematic illustration of the VL-Transformer architecture used in the thesis. Questionand image are first tokenized. They are then encoded using vision (in green) andlanguage (in blue) only Transformers (Vaswani et al. 2017). At the next step, theinformation flow between the two modalities (bidirectional) thanks to inter-modalityTransformers (Tan et al. 2019). Finally, the answer is predicted from the ‘CLS’token. Yellow and orange rectangles represent respectively inter- and intra-modalityattention heads. i and j are the layer and head indices used for naming attentionheads through the thesis.
We use the following naming convention for the VL-Transfomer: each layer is namedas xxx_i_j, where xxx ∈ {lang, vis, vl, lv, ll, vv} denotes the layer type (e.g. vision-onlyintra-modal layer, vision-language inter-modal layer, etc.), while i and j are respectivelythe layer and head indices.
vision input On the vision side, we use an object detector – Faster-RCNN (Renet al. 2015) – to extract object level visual features from the input image as in Andersonet al. (2018). Similar to hard attention mechanisms, this enforces the system to reasonon the object level rather than on the pixel level or global level. In particular, the visualinput embeddings are concatenations of 2048-dimensional object embeddings and thecorresponding 4-dimensional bounding box coordinates.
language input On the language side, sentences are tokenized using the WordPiecetokenizer (Wu et al. 2016). As common in language processing, a special token [CLS]
is added at the beginning of the tokenized sentence, which encodes the multimodalinformation of the image and sentence. The transformation of this token, performedduring the forward pass through the network, corresponds to the prediction of the answerto the task. Tokens are embedded into d-dimensional vectors using a look-up table learnedduring the training phase. The index position of the word is added to the dense vector asa positional encoding in order to obtain index-aware word level embeddings.
intra-modality Visual and language modalities are firstly processed independentlyusing a two-streams approach (cf. Figure 3.11). More precisely, the self-attention headslang_i_j are used to encode the words of the question, as described in the example above.
28
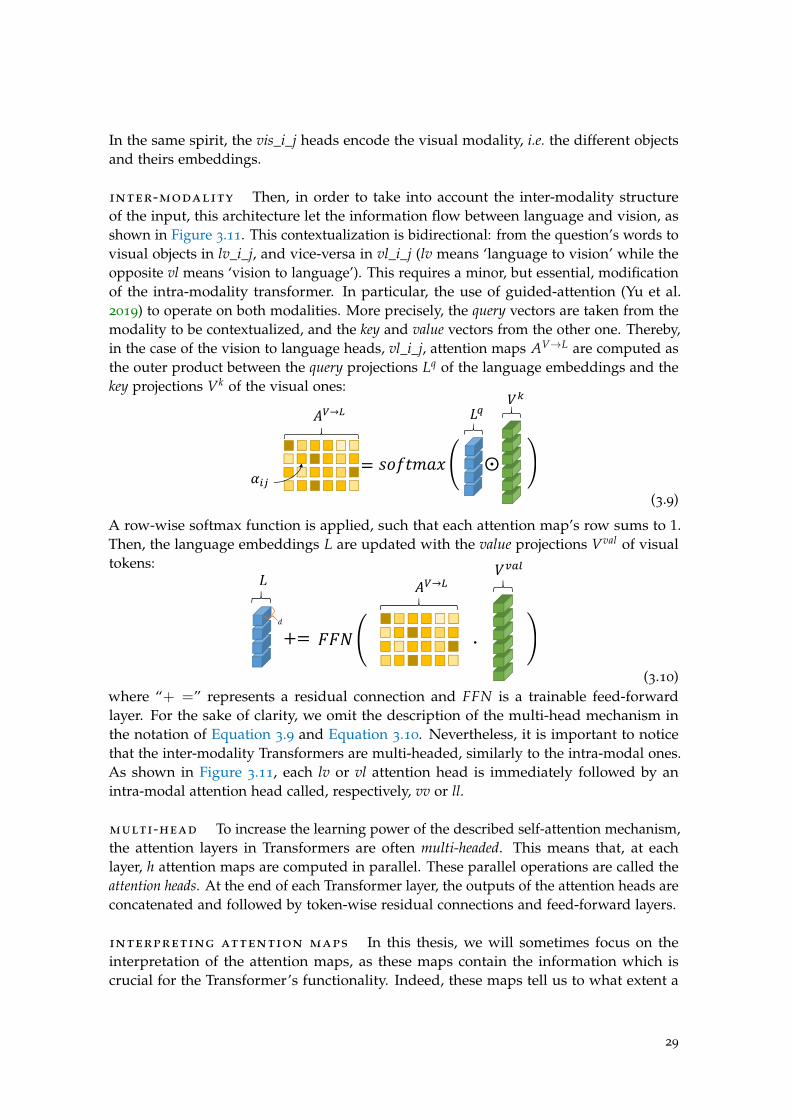
In the same spirit, the vis_i_j heads encode the visual modality, i.e. the different objectsand theirs embeddings.
inter-modality Then, in order to take into account the inter-modality structureof the input, this architecture let the information flow between language and vision, asshown in Figure 3.11. This contextualization is bidirectional: from the question’s words tovisual objects in lv_i_j, and vice-versa in vl_i_j (lv means ‘language to vision’ while theopposite vl means ‘vision to language’). This requires a minor, but essential, modificationof the intra-modality transformer. In particular, the use of guided-attention (Yu et al.2019) to operate on both modalities. More precisely, the query vectors are taken from themodality to be contextualized, and the key and value vectors from the other one. Thereby,in the case of the vision to language heads, vl_i_j, attention maps AV→L are computed asthe outer product between the query projections Lq of the language embeddings and thekey projections Vk of the visual ones:
(3.9)
A row-wise softmax function is applied, such that each attention map’s row sums to 1.Then, the language embeddings L are updated with the value projections Vval of visualtokens:
(3.10)where “+ =” represents a residual connection and FFN is a trainable feed-forwardlayer. For the sake of clarity, we omit the description of the multi-head mechanism inthe notation of Equation 3.9 and Equation 3.10. Nevertheless, it is important to noticethat the inter-modality Transformers are multi-headed, similarly to the intra-modal ones.As shown in Figure 3.11, each lv or vl attention head is immediately followed by anintra-modal attention head called, respectively, vv or ll.
multi-head To increase the learning power of the described self-attention mechanism,the attention layers in Transformers are often multi-headed. This means that, at eachlayer, h attention maps are computed in parallel. These parallel operations are called theattention heads. At the end of each Transformer layer, the outputs of the attention heads areconcatenated and followed by token-wise residual connections and feed-forward layers.
interpreting attention maps In this thesis, we will sometimes focus on theinterpretation of the attention maps, as these maps contain the information which iscrucial for the Transformer’s functionality. Indeed, these maps tell us to what extent a
29
given token has been contextualized by its neighbors. A low attention value αij indicatesa weak interaction between tokens i and j. Inversely, a high value is an indicator of thestrong information flow from j to i. Therefore, attention maps provide strong insights onhow our VL-Transformer has modeled the question, the image, and, more importantly,the relationships between both modalities.
answer predictions The VQA task is finally achieved by decoding the final repre-sentation of the textual [CLS] token using a 2-layered neural network. In particular, ourmodel outputs a probability vector over the set of the most frequent answers found in thetraining set. The final predicted answer is then the one with the highest score.
hyperparameters In the following chapters of this thesis, we use two versions of theVL-Transformer architecture. The original version, similar to the one used in LXMERT (Tanet al. 2019), is composed of 9 language only layers, 5 vision only layers, and 5 cross modallayers. Its hidden size is set to d=768 and the number of per-layer heads to h=12. Thus, itis composed of 212M parameters. The compact version has the same number of layers, but asmaller hidden size d=128 and only h=4 heads per layers. It allows reducing computationtime and memory overhead as it has only 26M trainable parameters. Following Andersonet al. (2018), we use 36 objects per-images.
3.5.2 LXMERT pre-training
The so-defined vision-language encoder is trained following the recently widely-adopted strategy of combining BERT-like (Devlin et al. 2019) self-supervised signalswith task-specific supervision signals, which has been applied to various problems in vi-sion and language — e.g. in Tan et al. (2019) or Lu et al. (2019). Following Tan et al. (2019),it combines four supervision signals: vision masking, language masking, image-sentencematching and VQA, which are briefly described below. This pre-training allows to learna general vision-language understanding. Thereafter, a fine-tuning can be necessary toadapt to the downstream task.
vision/language masking This signal aims to supervise the encoder’s ability toreconstruct missing information in language and vision. More precisely, it randomly maskeach language token (resp. visual object) with a probability of 0.15 and ask the model topredict the missing words (resp. objects). Therefore, two classifiers are added – for visionmasking 1 and language masking – on top of the vision language encoder and supervisedvia a cross-entropy loss. Tan et al. (2019) proposes to take the object detector predictionas ground truth in order to get over the disparity of visual annotation. Additionally, themodel is also supervised to regress the masked objects’ features via L2 loss.
image-sentence matching BERT (Devlin et al. 2019) proposes next sentence pre-diction supervision by asking to predict if two sentences are consecutive in a given text,or randomly sampled from a corpus. Its vision-language equivalent is image-sentence
1. It is worth noticing that vision masking requires to predict both the object classes and their attributes(e.g. color, materials, etc.)
30
matching, where the model has to predict whether a given sentence matches a givenimage or not. Thus, in each sentence-image pair, the image is randomly replaced with aprobability of 0.5. A feed-forward layer is added on top of the [CLS] output embeddingto predict whether the pair matches or not. This global matching is supervised using abinary cross-entropy loss.
visual question answering The VL-Transformer is applicable to a wide range ofvision-language problems. At the same time, independently of the target vision-languagetask, pretraining on VQA helps reasoning, as shown by Tan et al. (2019). The VQA task isdefined as a classification problem over a set of most frequent answers. This classificationis performed from a prediction head attached to the [CLS] token and supervised using across-entropy loss.
** *
31

Part II
E VA L UAT E : W H E R E W E L E A R N T H AT V Q A M O D E L S A R E( S T I L L ) N O T R E A S O N I N G

I N T R O D U C T I O N
In the year 2021 AD, deep learning based VQA models already achieve close-to-human perfor-mance on VQAv2.
– Sir, does it mean that we solved Artificial General Intelligence (AGI)?– Of course, not. Try to ask your own questions to a SOTA VQA model, and you will be
convinced: it is so easy to fool them!
– But Figure 3.12 is clear, only few years to wait before reaching super-human accuracy!– Not really. Actually, I am not sure that we are correctly evaluating the reasoning
ability of VQA models. But let me explain all from the beginning!
Evaluating reasoning in VQA is a difficult task. In part because it is hard to definewhat “reasoning” is, but also because evaluation can be fooled by many confounders. Asexplained in Chapter 2, we can define reasoning as “algebraically manipulating previouslyacquired knowledge in order to answer a new question” (Bottou 2014). In practice, we chooseto define reasoning by opposition to biased prediction, when the model leverage statisticalshortcuts (often present in the training data) in order to infer predictions. While beingeffective on the popular benchmarks, shortcut learning leads to the emergence of modelsbrittle to many kinds of variations in the data: linguistic reformulations, visual editions,distribution shift, etc. Thus, several works (e.g. Agrawal et al. (2016)) have alerted onthe urgent need to define new evaluation methods, taking into account this shortcutdependency. These methods can take the form of OOD benchmarks, measuring to whatextent the models generalize to unseen settings. However, as we will see in this part, mostof the OOD benchmarks are subject to many issues related to the presence of unwantedconfounder, potentially hindering the performance measures. Therefore, we propose thegqa-ood benchmark, our contribution to the evaluation of reasoning in VQA. Part II isorganized as follows:
Chapter 4 is an extension of the related work (Chapter 3), including a comprehensivestudy of the most popular databases and benchmarks used in VQA. This chapter will bean opportunity for the reader to familiarize himself with the stakes and limitations ofthe VQA task. In particular, we provide a critical review of the benchmarks dedicatedto the evaluation of models’ robustness, showing that they are not sufficient to properlymeasure the VQA reasoning ability.
Chapter 5 introduces our gqa-ood benchmark, dedicated to the OOD evaluationof VQA models. We argue that it answers to most of the concerns raised in Chapter 4,leading to a better estimation of the reasoning capability. This benchmark allows usto experimentally demonstrate that current SOTA VQA models are prone to the usage ofshortcut in the data, and are highly ineffective in the OOD setting.
35
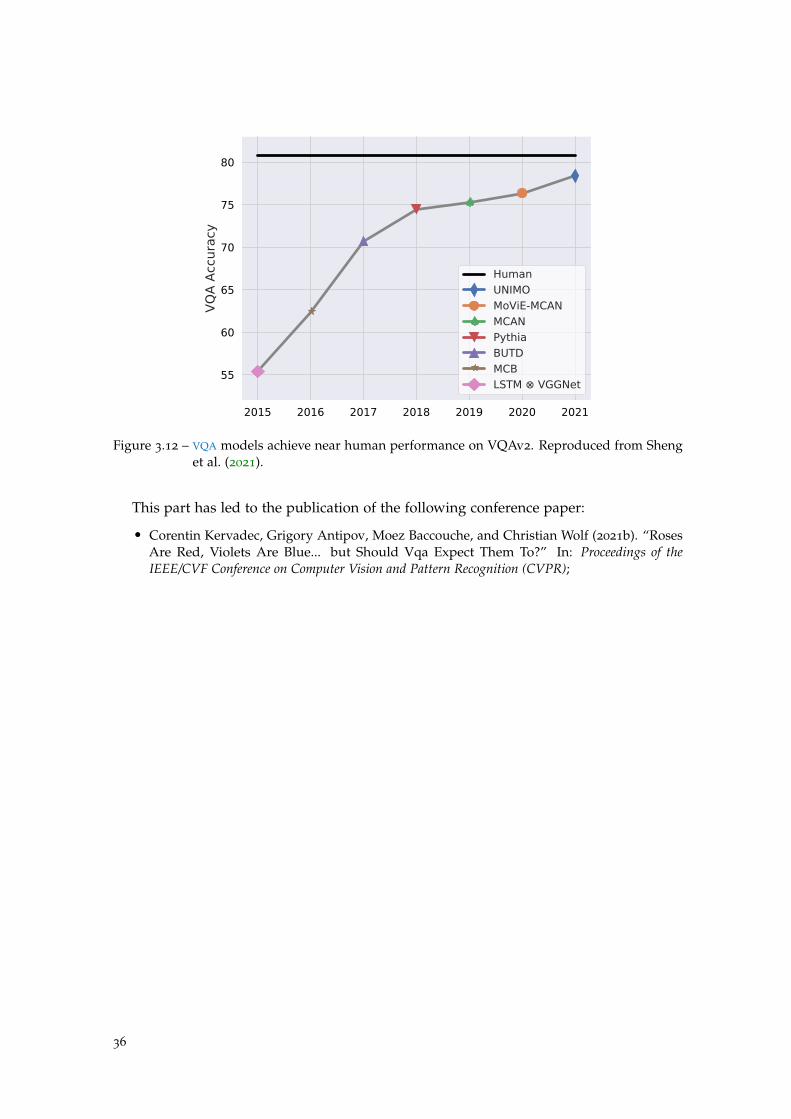
2015 2016 2017 2018 2019 2020 2021
55
60
65
70
75
80
VQA
Accu
racy
HumanUNIMOMoViE-MCANMCANPythiaBUTDMCBLSTM VGGNet
Figure 3.12 – VQA models achieve near human performance on VQAv2. Reproduced from Shenget al. (2021).
This part has led to the publication of the following conference paper:
• Corentin Kervadec, Grigory Antipov, Moez Baccouche, and Christian Wolf (2021b). “RosesAre Red, Violets Are Blue... but Should Vqa Expect Them To?” In: Proceedings of theIEEE/CVF Conference on Computer Vision and Pattern Recognition (CVPR);
36
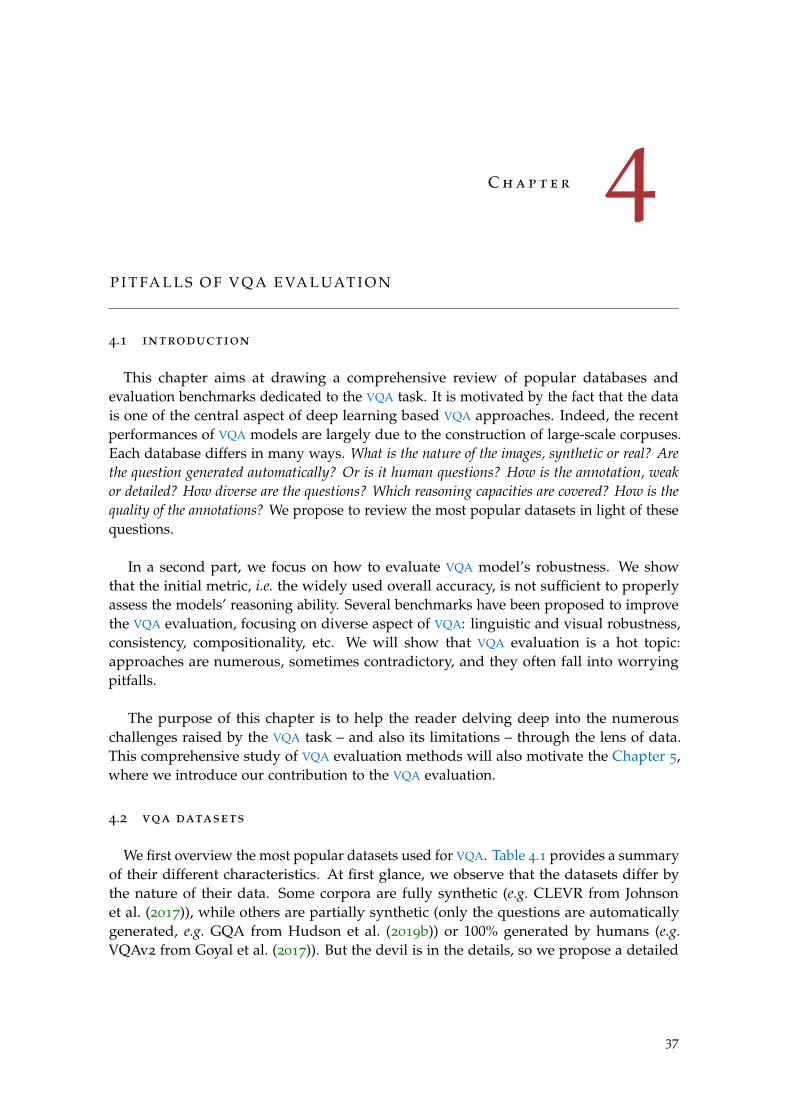
C h a p t e r 4
P I T FA L L S O F V Q A E VA L UAT I O N
4.1 introduction
This chapter aims at drawing a comprehensive review of popular databases andevaluation benchmarks dedicated to the VQA task. It is motivated by the fact that the datais one of the central aspect of deep learning based VQA approaches. Indeed, the recentperformances of VQA models are largely due to the construction of large-scale corpuses.Each database differs in many ways. What is the nature of the images, synthetic or real? Arethe question generated automatically? Or is it human questions? How is the annotation, weakor detailed? How diverse are the questions? Which reasoning capacities are covered? How is thequality of the annotations? We propose to review the most popular datasets in light of thesequestions.
In a second part, we focus on how to evaluate VQA model’s robustness. We showthat the initial metric, i.e. the widely used overall accuracy, is not sufficient to properlyassess the models’ reasoning ability. Several benchmarks have been proposed to improvethe VQA evaluation, focusing on diverse aspect of VQA: linguistic and visual robustness,consistency, compositionality, etc. We will show that VQA evaluation is a hot topic:approaches are numerous, sometimes contradictory, and they often fall into worryingpitfalls.
The purpose of this chapter is to help the reader delving deep into the numerouschallenges raised by the VQA task – and also its limitations – through the lens of data.This comprehensive study of VQA evaluation methods will also motivate the Chapter 5,where we introduce our contribution to the VQA evaluation.
4.2 vqa datasets
We first overview the most popular datasets used for VQA. Table 4.1 provides a summaryof their different characteristics. At first glance, we observe that the datasets differ bythe nature of their data. Some corpora are fully synthetic (e.g. CLEVR from Johnsonet al. (2017)), while others are partially synthetic (only the questions are automaticallygenerated, e.g. GQA from Hudson et al. (2019b)) or 100% generated by humans (e.g.VQAv2 from Goyal et al. (2017)). But the devil is in the details, so we propose a detailed
37
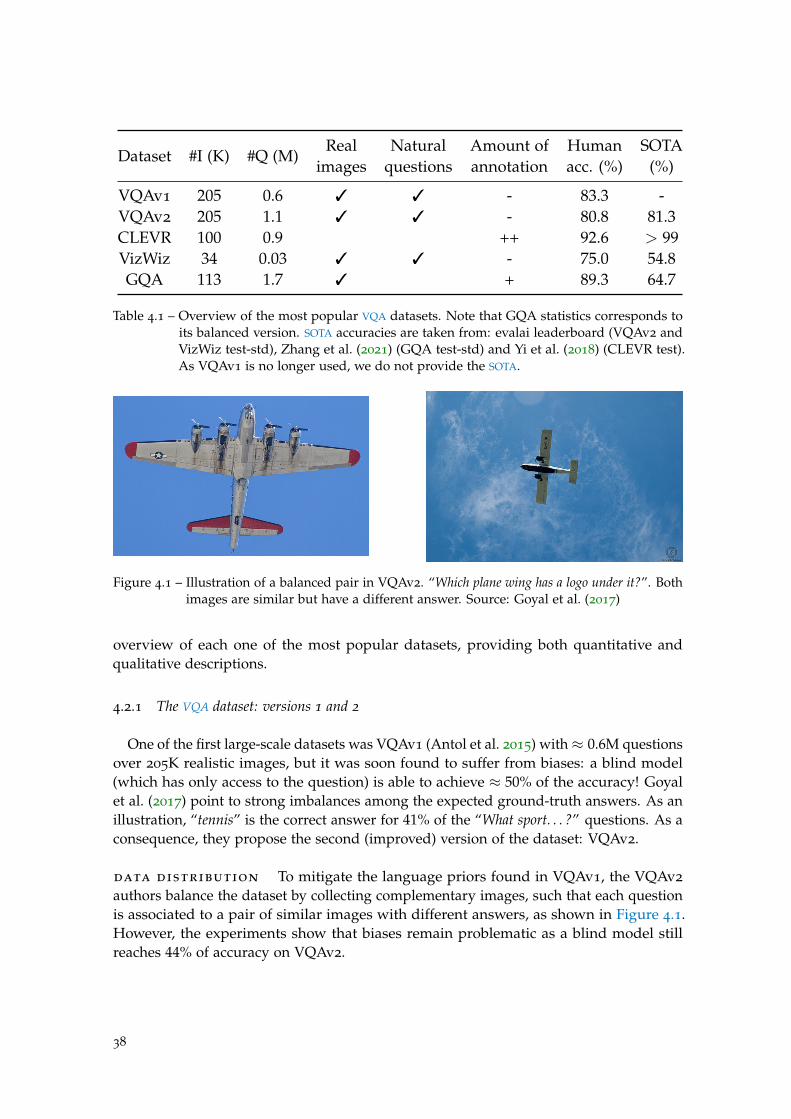
Dataset #I (K) #Q (M)Real Natural Amount of Human SOTA
images questions annotation acc. (%) (%)
VQAv1 205 0.6 3 3 - 83.3 -VQAv2 205 1.1 3 3 - 80.8 81.3CLEVR 100 0.9 ++ 92.6 > 99VizWiz 34 0.03 3 3 - 75.0 54.8GQA 113 1.7 3 + 89.3 64.7
Table 4.1 – Overview of the most popular VQA datasets. Note that GQA statistics corresponds toits balanced version. SOTA accuracies are taken from: evalai leaderboard (VQAv2 andVizWiz test-std), Zhang et al. (2021) (GQA test-std) and Yi et al. (2018) (CLEVR test).As VQAv1 is no longer used, we do not provide the SOTA.
Figure 4.1 – Illustration of a balanced pair in VQAv2. “Which plane wing has a logo under it?”. Bothimages are similar but have a different answer. Source: Goyal et al. (2017)
overview of each one of the most popular datasets, providing both quantitative andqualitative descriptions.
4.2.1 The VQA dataset: versions 1 and 2
One of the first large-scale datasets was VQAv1 (Antol et al. 2015) with≈ 0.6M questionsover 205K realistic images, but it was soon found to suffer from biases: a blind model(which has only access to the question) is able to achieve ≈ 50% of the accuracy! Goyalet al. (2017) point to strong imbalances among the expected ground-truth answers. As anillustration, “tennis” is the correct answer for 41% of the “What sport. . . ?” questions. As aconsequence, they propose the second (improved) version of the dataset: VQAv2.
data distribution To mitigate the language priors found in VQAv1, the VQAv2
authors balance the dataset by collecting complementary images, such that each questionis associated to a pair of similar images with different answers, as shown in Figure 4.1.However, the experiments show that biases remain problematic as a blind model stillreaches 44% of accuracy on VQAv2.
38
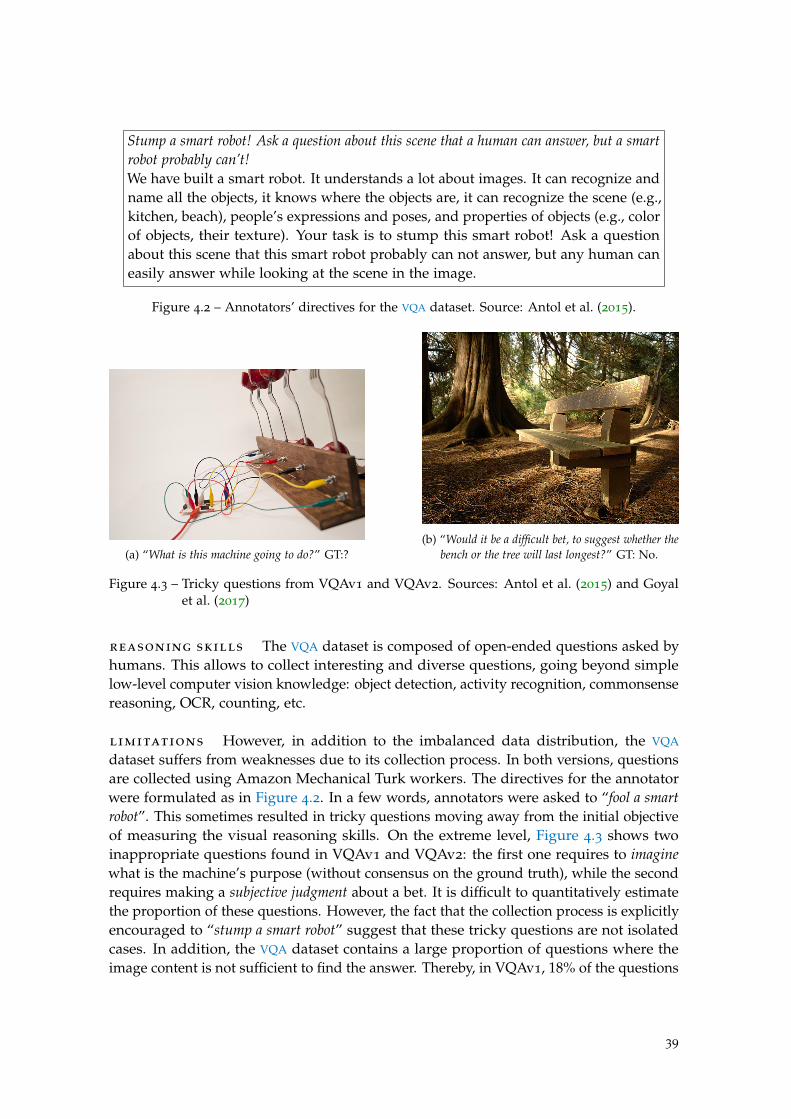
Stump a smart robot! Ask a question about this scene that a human can answer, but a smartrobot probably can’t!We have built a smart robot. It understands a lot about images. It can recognize andname all the objects, it knows where the objects are, it can recognize the scene (e.g.,kitchen, beach), people’s expressions and poses, and properties of objects (e.g., colorof objects, their texture). Your task is to stump this smart robot! Ask a questionabout this scene that this smart robot probably can not answer, but any human caneasily answer while looking at the scene in the image.
Figure 4.2 – Annotators’ directives for the VQA dataset. Source: Antol et al. (2015).
(a) “What is this machine going to do?” GT:?(b) “Would it be a difficult bet, to suggest whether the
bench or the tree will last longest?” GT: No.
Figure 4.3 – Tricky questions from VQAv1 and VQAv2. Sources: Antol et al. (2015) and Goyalet al. (2017)
reasoning skills The VQA dataset is composed of open-ended questions asked byhumans. This allows to collect interesting and diverse questions, going beyond simplelow-level computer vision knowledge: object detection, activity recognition, commonsensereasoning, OCR, counting, etc.
limitations However, in addition to the imbalanced data distribution, the VQA
dataset suffers from weaknesses due to its collection process. In both versions, questionsare collected using Amazon Mechanical Turk workers. The directives for the annotatorwere formulated as in Figure 4.2. In a few words, annotators were asked to “fool a smartrobot”. This sometimes resulted in tricky questions moving away from the initial objectiveof measuring the visual reasoning skills. On the extreme level, Figure 4.3 shows twoinappropriate questions found in VQAv1 and VQAv2: the first one requires to imaginewhat is the machine’s purpose (without consensus on the ground truth), while the secondrequires making a subjective judgment about a bet. It is difficult to quantitatively estimatethe proportion of these questions. However, the fact that the collection process is explicitlyencouraged to “stump a smart robot” suggest that these tricky questions are not isolatedcases. In addition, the VQA dataset contains a large proportion of questions where theimage content is not sufficient to find the answer. Thereby, in VQAv1, 18% of the questions
39
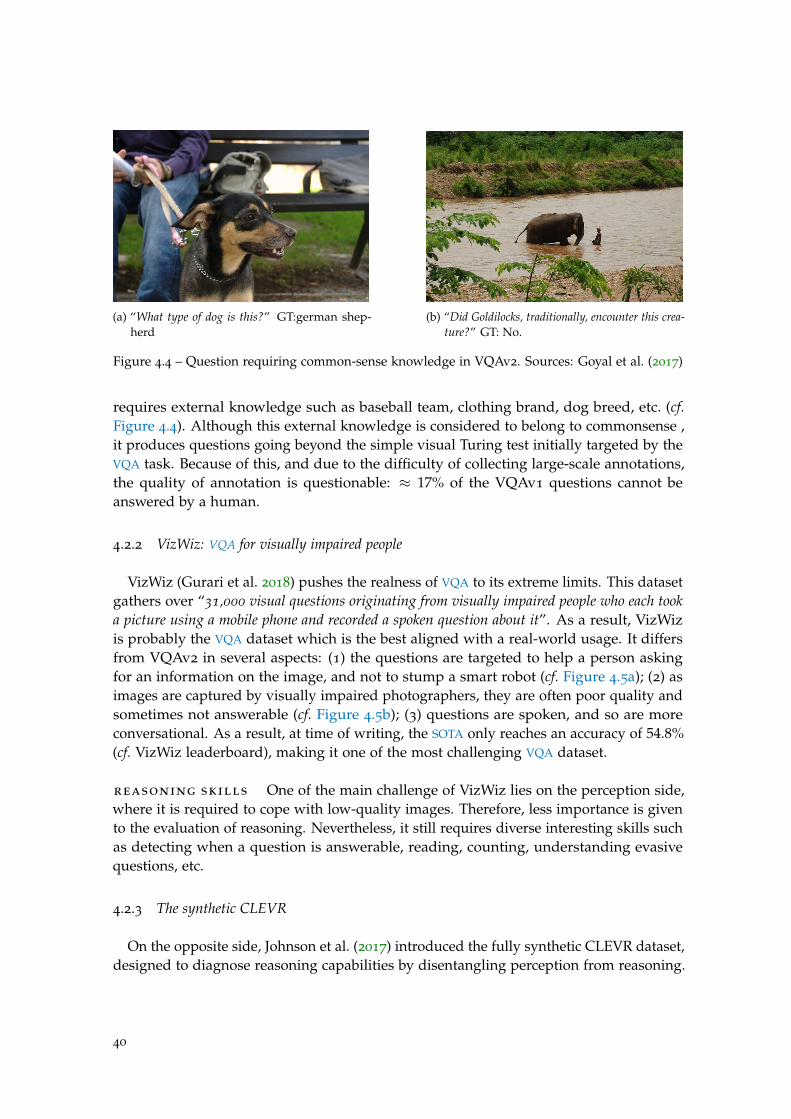
(a) “What type of dog is this?” GT:german shep-herd
(b) “Did Goldilocks, traditionally, encounter this crea-ture?” GT: No.
Figure 4.4 – Question requiring common-sense knowledge in VQAv2. Sources: Goyal et al. (2017)
requires external knowledge such as baseball team, clothing brand, dog breed, etc. (cf.Figure 4.4). Although this external knowledge is considered to belong to commonsense ,it produces questions going beyond the simple visual Turing test initially targeted by theVQA task. Because of this, and due to the difficulty of collecting large-scale annotations,the quality of annotation is questionable: ≈ 17% of the VQAv1 questions cannot beanswered by a human.
4.2.2 VizWiz: VQA for visually impaired people
VizWiz (Gurari et al. 2018) pushes the realness of VQA to its extreme limits. This datasetgathers over “31,000 visual questions originating from visually impaired people who each tooka picture using a mobile phone and recorded a spoken question about it”. As a result, VizWizis probably the VQA dataset which is the best aligned with a real-world usage. It differsfrom VQAv2 in several aspects: (1) the questions are targeted to help a person askingfor an information on the image, and not to stump a smart robot (cf. Figure 4.5a); (2) asimages are captured by visually impaired photographers, they are often poor quality andsometimes not answerable (cf. Figure 4.5b); (3) questions are spoken, and so are moreconversational. As a result, at time of writing, the SOTA only reaches an accuracy of 54.8%(cf. VizWiz leaderboard), making it one of the most challenging VQA dataset.
reasoning skills One of the main challenge of VizWiz lies on the perception side,where it is required to cope with low-quality images. Therefore, less importance is givento the evaluation of reasoning. Nevertheless, it still requires diverse interesting skills suchas detecting when a question is answerable, reading, counting, understanding evasivequestions, etc.
4.2.3 The synthetic CLEVR
On the opposite side, Johnson et al. (2017) introduced the fully synthetic CLEVR dataset,designed to diagnose reasoning capabilities by disentangling perception from reasoning.
40
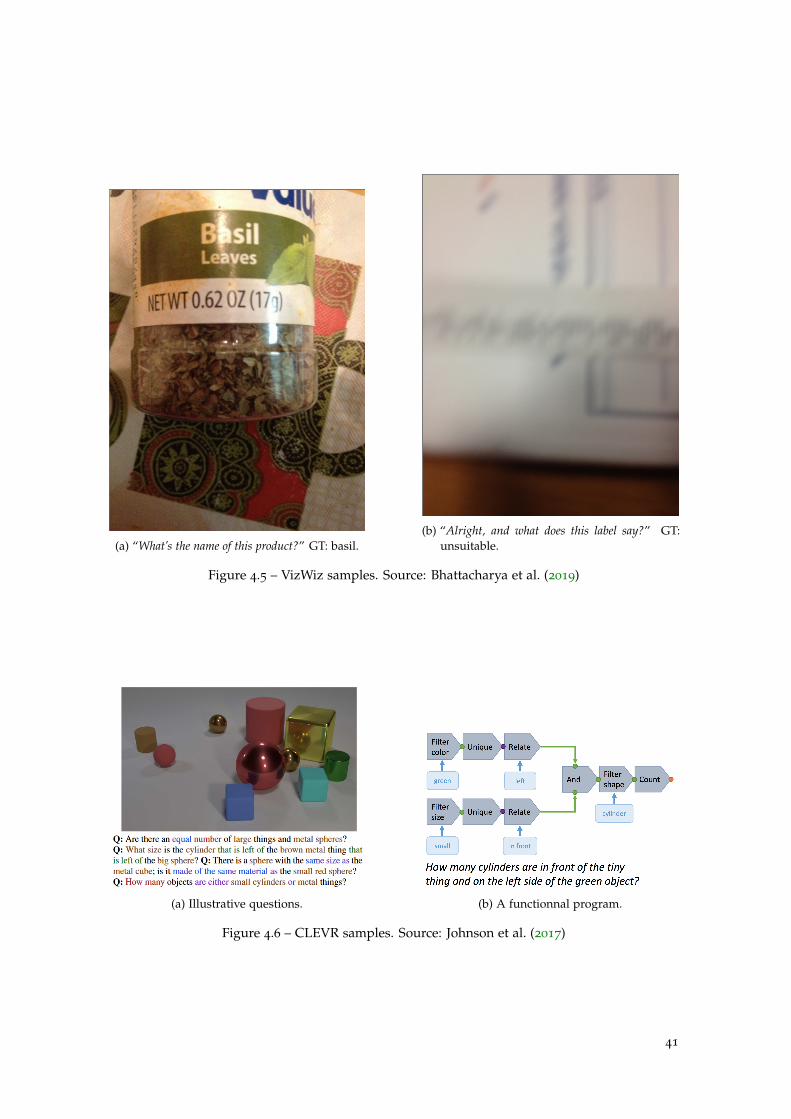
(a) “What’s the name of this product?” GT: basil.(b) “Alright, and what does this label say?” GT:
unsuitable.
Figure 4.5 – VizWiz samples. Source: Bhattacharya et al. (2019)
(a) Illustrative questions. (b) A functionnal program.
Figure 4.6 – CLEVR samples. Source: Johnson et al. (2017)
41
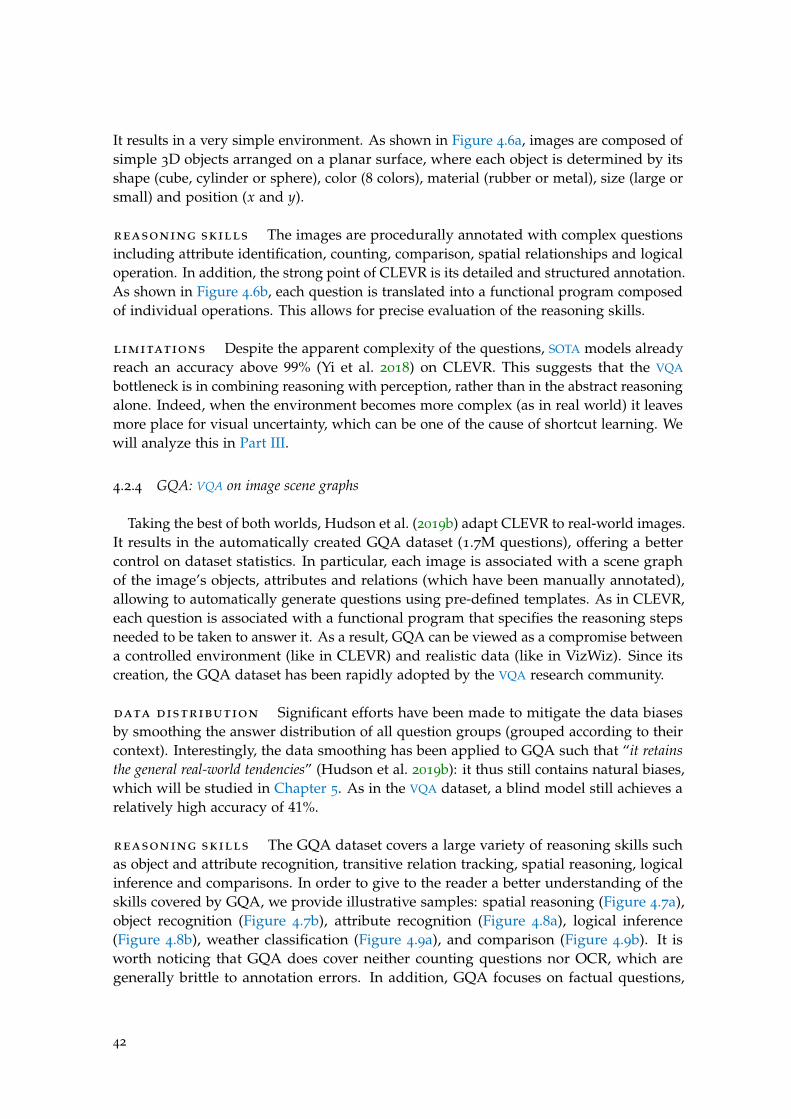
It results in a very simple environment. As shown in Figure 4.6a, images are composed ofsimple 3D objects arranged on a planar surface, where each object is determined by itsshape (cube, cylinder or sphere), color (8 colors), material (rubber or metal), size (large orsmall) and position (x and y).
reasoning skills The images are procedurally annotated with complex questionsincluding attribute identification, counting, comparison, spatial relationships and logicaloperation. In addition, the strong point of CLEVR is its detailed and structured annotation.As shown in Figure 4.6b, each question is translated into a functional program composedof individual operations. This allows for precise evaluation of the reasoning skills.
limitations Despite the apparent complexity of the questions, SOTA models alreadyreach an accuracy above 99% (Yi et al. 2018) on CLEVR. This suggests that the VQA
bottleneck is in combining reasoning with perception, rather than in the abstract reasoningalone. Indeed, when the environment becomes more complex (as in real world) it leavesmore place for visual uncertainty, which can be one of the cause of shortcut learning. Wewill analyze this in Part III.
4.2.4 GQA: VQA on image scene graphs
Taking the best of both worlds, Hudson et al. (2019b) adapt CLEVR to real-world images.It results in the automatically created GQA dataset (1.7M questions), offering a bettercontrol on dataset statistics. In particular, each image is associated with a scene graphof the image’s objects, attributes and relations (which have been manually annotated),allowing to automatically generate questions using pre-defined templates. As in CLEVR,each question is associated with a functional program that specifies the reasoning stepsneeded to be taken to answer it. As a result, GQA can be viewed as a compromise betweena controlled environment (like in CLEVR) and realistic data (like in VizWiz). Since itscreation, the GQA dataset has been rapidly adopted by the VQA research community.
data distribution Significant efforts have been made to mitigate the data biasesby smoothing the answer distribution of all question groups (grouped according to theircontext). Interestingly, the data smoothing has been applied to GQA such that “it retainsthe general real-world tendencies” (Hudson et al. 2019b): it thus still contains natural biases,which will be studied in Chapter 5. As in the VQA dataset, a blind model still achieves arelatively high accuracy of 41%.
reasoning skills The GQA dataset covers a large variety of reasoning skills suchas object and attribute recognition, transitive relation tracking, spatial reasoning, logicalinference and comparisons. In order to give to the reader a better understanding of theskills covered by GQA, we provide illustrative samples: spatial reasoning (Figure 4.7a),object recognition (Figure 4.7b), attribute recognition (Figure 4.8a), logical inference(Figure 4.8b), weather classification (Figure 4.9a), and comparison (Figure 4.9b). It isworth noticing that GQA does cover neither counting questions nor OCR, which aregenerally brittle to annotation errors. In addition, GQA focuses on factual questions,
42
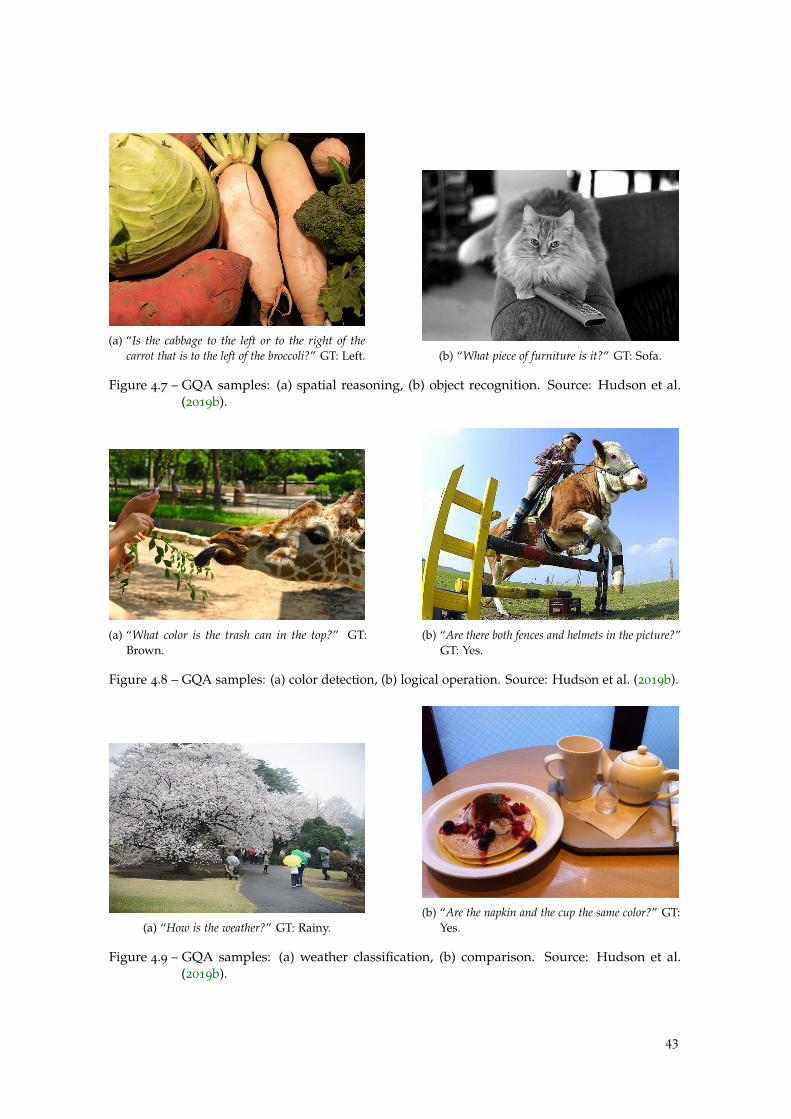
(a) “Is the cabbage to the left or to the right of thecarrot that is to the left of the broccoli?” GT: Left. (b) “What piece of furniture is it?” GT: Sofa.
Figure 4.7 – GQA samples: (a) spatial reasoning, (b) object recognition. Source: Hudson et al.(2019b).
(a) “What color is the trash can in the top?” GT:Brown.
(b) “Are there both fences and helmets in the picture?”GT: Yes.
Figure 4.8 – GQA samples: (a) color detection, (b) logical operation. Source: Hudson et al. (2019b).
(a) “How is the weather?” GT: Rainy.(b) “Are the napkin and the cup the same color?” GT:
Yes.
Figure 4.9 – GQA samples: (a) weather classification, (b) comparison. Source: Hudson et al.(2019b).
43
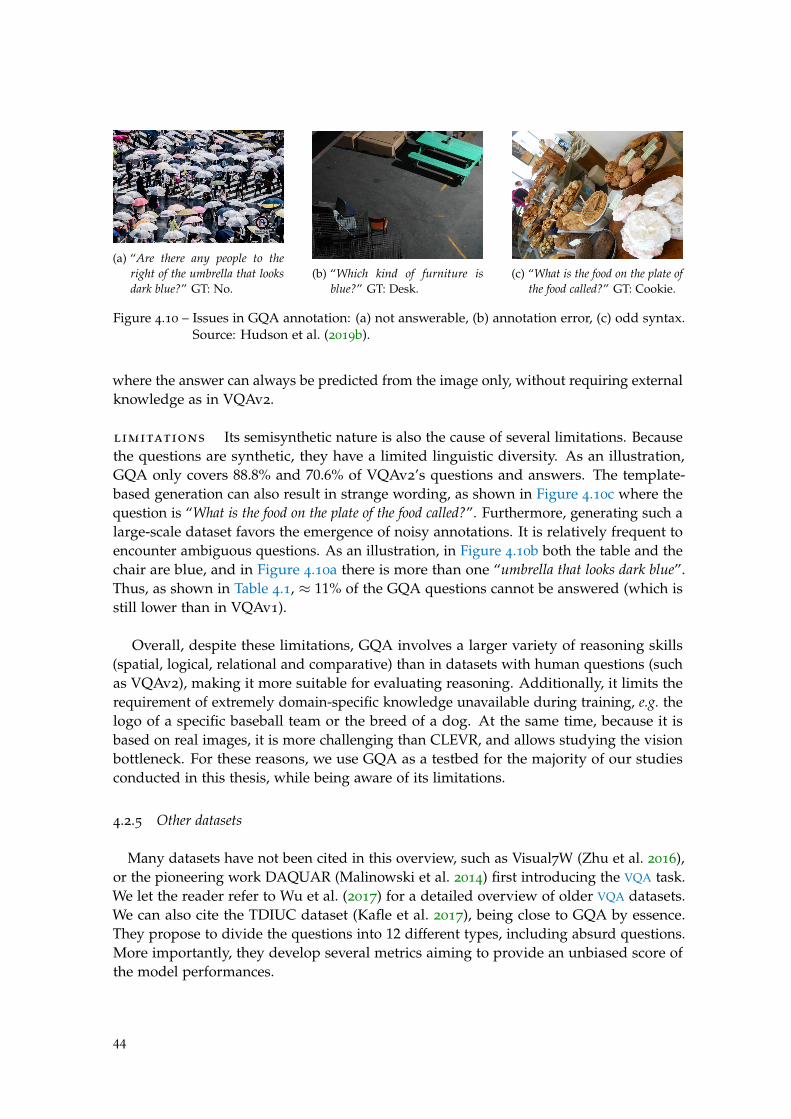
(a) “Are there any people to theright of the umbrella that looksdark blue?” GT: No.
(b) “Which kind of furniture isblue?” GT: Desk.
(c) “What is the food on the plate ofthe food called?” GT: Cookie.
Figure 4.10 – Issues in GQA annotation: (a) not answerable, (b) annotation error, (c) odd syntax.Source: Hudson et al. (2019b).
where the answer can always be predicted from the image only, without requiring externalknowledge as in VQAv2.
limitations Its semisynthetic nature is also the cause of several limitations. Becausethe questions are synthetic, they have a limited linguistic diversity. As an illustration,GQA only covers 88.8% and 70.6% of VQAv2’s questions and answers. The template-based generation can also result in strange wording, as shown in Figure 4.10c where thequestion is “What is the food on the plate of the food called?”. Furthermore, generating such alarge-scale dataset favors the emergence of noisy annotations. It is relatively frequent toencounter ambiguous questions. As an illustration, in Figure 4.10b both the table and thechair are blue, and in Figure 4.10a there is more than one “umbrella that looks dark blue”.Thus, as shown in Table 4.1, ≈ 11% of the GQA questions cannot be answered (which isstill lower than in VQAv1).
Overall, despite these limitations, GQA involves a larger variety of reasoning skills(spatial, logical, relational and comparative) than in datasets with human questions (suchas VQAv2), making it more suitable for evaluating reasoning. Additionally, it limits therequirement of extremely domain-specific knowledge unavailable during training, e.g. thelogo of a specific baseball team or the breed of a dog. At the same time, because it isbased on real images, it is more challenging than CLEVR, and allows studying the visionbottleneck. For these reasons, we use GQA as a testbed for the majority of our studiesconducted in this thesis, while being aware of its limitations.
4.2.5 Other datasets
Many datasets have not been cited in this overview, such as Visual7W (Zhu et al. 2016),or the pioneering work DAQUAR (Malinowski et al. 2014) first introducing the VQA task.We let the reader refer to Wu et al. (2017) for a detailed overview of older VQA datasets.We can also cite the TDIUC dataset (Kafle et al. 2017), being close to GQA by essence.They propose to divide the questions into 12 different types, including absurd questions.More importantly, they develop several metrics aiming to provide an unbiased score ofthe model performances.
44
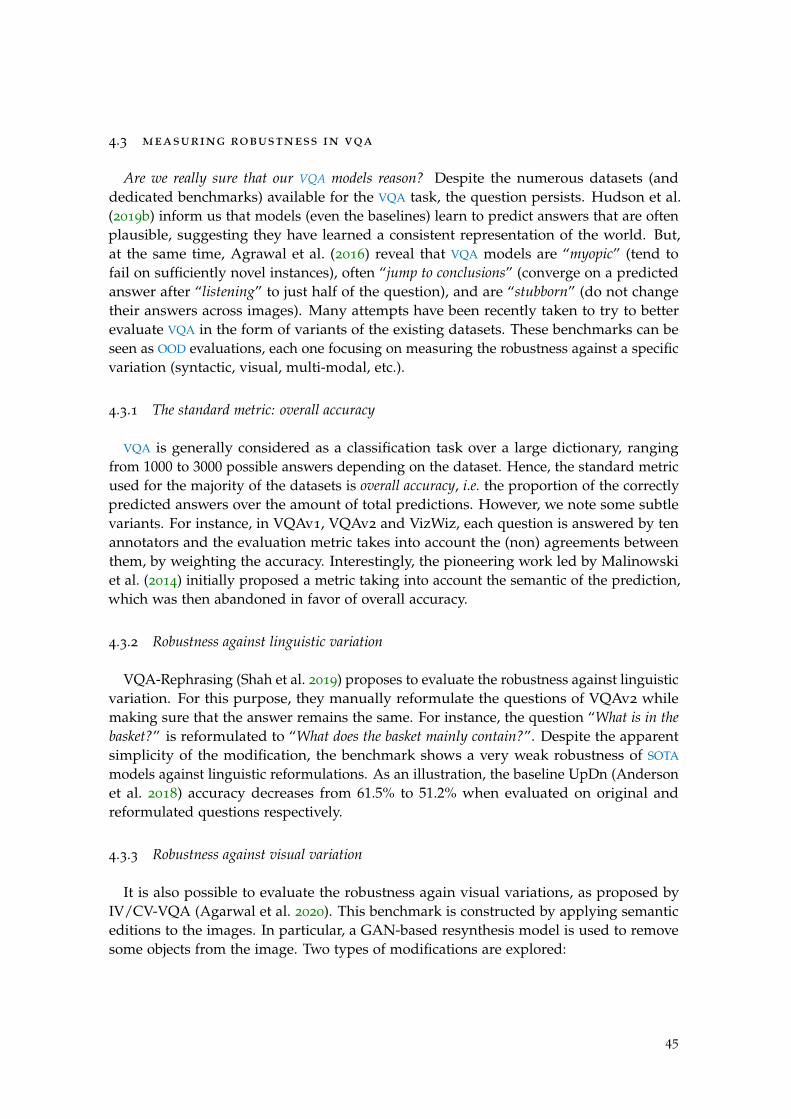
4.3 measuring robustness in vqa
Are we really sure that our VQA models reason? Despite the numerous datasets (anddedicated benchmarks) available for the VQA task, the question persists. Hudson et al.(2019b) inform us that models (even the baselines) learn to predict answers that are oftenplausible, suggesting they have learned a consistent representation of the world. But,at the same time, Agrawal et al. (2016) reveal that VQA models are “myopic” (tend tofail on sufficiently novel instances), often “jump to conclusions” (converge on a predictedanswer after “listening” to just half of the question), and are “stubborn” (do not changetheir answers across images). Many attempts have been recently taken to try to betterevaluate VQA in the form of variants of the existing datasets. These benchmarks can beseen as OOD evaluations, each one focusing on measuring the robustness against a specificvariation (syntactic, visual, multi-modal, etc.).
4.3.1 The standard metric: overall accuracy
VQA is generally considered as a classification task over a large dictionary, rangingfrom 1000 to 3000 possible answers depending on the dataset. Hence, the standard metricused for the majority of the datasets is overall accuracy, i.e. the proportion of the correctlypredicted answers over the amount of total predictions. However, we note some subtlevariants. For instance, in VQAv1, VQAv2 and VizWiz, each question is answered by tenannotators and the evaluation metric takes into account the (non) agreements betweenthem, by weighting the accuracy. Interestingly, the pioneering work led by Malinowskiet al. (2014) initially proposed a metric taking into account the semantic of the prediction,which was then abandoned in favor of overall accuracy.
4.3.2 Robustness against linguistic variation
VQA-Rephrasing (Shah et al. 2019) proposes to evaluate the robustness against linguisticvariation. For this purpose, they manually reformulate the questions of VQAv2 whilemaking sure that the answer remains the same. For instance, the question “What is in thebasket?” is reformulated to “What does the basket mainly contain?”. Despite the apparentsimplicity of the modification, the benchmark shows a very weak robustness of SOTA
models against linguistic reformulations. As an illustration, the baseline UpDn (Andersonet al. 2018) accuracy decreases from 61.5% to 51.2% when evaluated on original andreformulated questions respectively.
4.3.3 Robustness against visual variation
It is also possible to evaluate the robustness again visual variations, as proposed byIV/CV-VQA (Agarwal et al. 2020). This benchmark is constructed by applying semanticeditions to the images. In particular, a GAN-based resynthesis model is used to removesome objects from the image. Two types of modifications are explored:
45
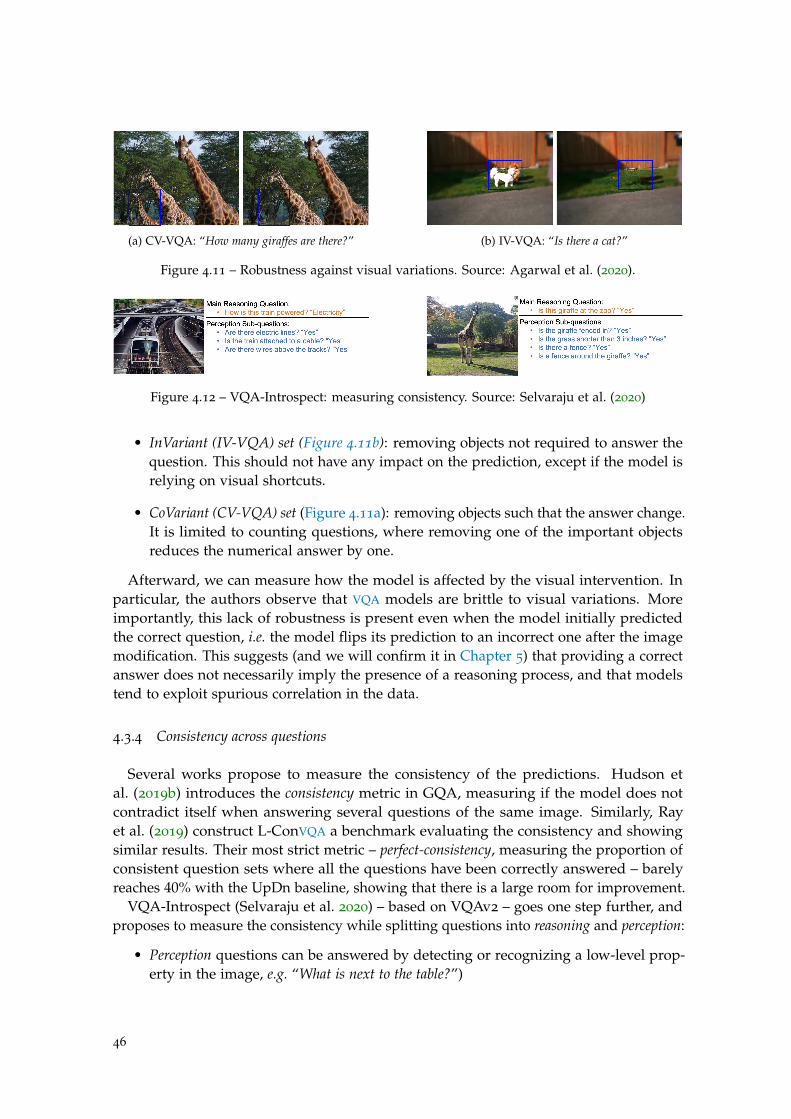
(a) CV-VQA: “How many giraffes are there?” (b) IV-VQA: “Is there a cat?”
Figure 4.11 – Robustness against visual variations. Source: Agarwal et al. (2020).
Figure 4.12 – VQA-Introspect: measuring consistency. Source: Selvaraju et al. (2020)
• InVariant (IV-VQA) set (Figure 4.11b): removing objects not required to answer thequestion. This should not have any impact on the prediction, except if the model isrelying on visual shortcuts.
• CoVariant (CV-VQA) set (Figure 4.11a): removing objects such that the answer change.It is limited to counting questions, where removing one of the important objectsreduces the numerical answer by one.
Afterward, we can measure how the model is affected by the visual intervention. Inparticular, the authors observe that VQA models are brittle to visual variations. Moreimportantly, this lack of robustness is present even when the model initially predictedthe correct question, i.e. the model flips its prediction to an incorrect one after the imagemodification. This suggests (and we will confirm it in Chapter 5) that providing a correctanswer does not necessarily imply the presence of a reasoning process, and that modelstend to exploit spurious correlation in the data.
4.3.4 Consistency across questions
Several works propose to measure the consistency of the predictions. Hudson etal. (2019b) introduces the consistency metric in GQA, measuring if the model does notcontradict itself when answering several questions of the same image. Similarly, Rayet al. (2019) construct L-ConVQA a benchmark evaluating the consistency and showingsimilar results. Their most strict metric – perfect-consistency, measuring the proportion ofconsistent question sets where all the questions have been correctly answered – barelyreaches 40% with the UpDn baseline, showing that there is a large room for improvement.
VQA-Introspect (Selvaraju et al. 2020) – based on VQAv2 – goes one step further, andproposes to measure the consistency while splitting questions into reasoning and perception:
• Perception questions can be answered by detecting or recognizing a low-level prop-erty in the image, e.g. “What is next to the table?”)
46
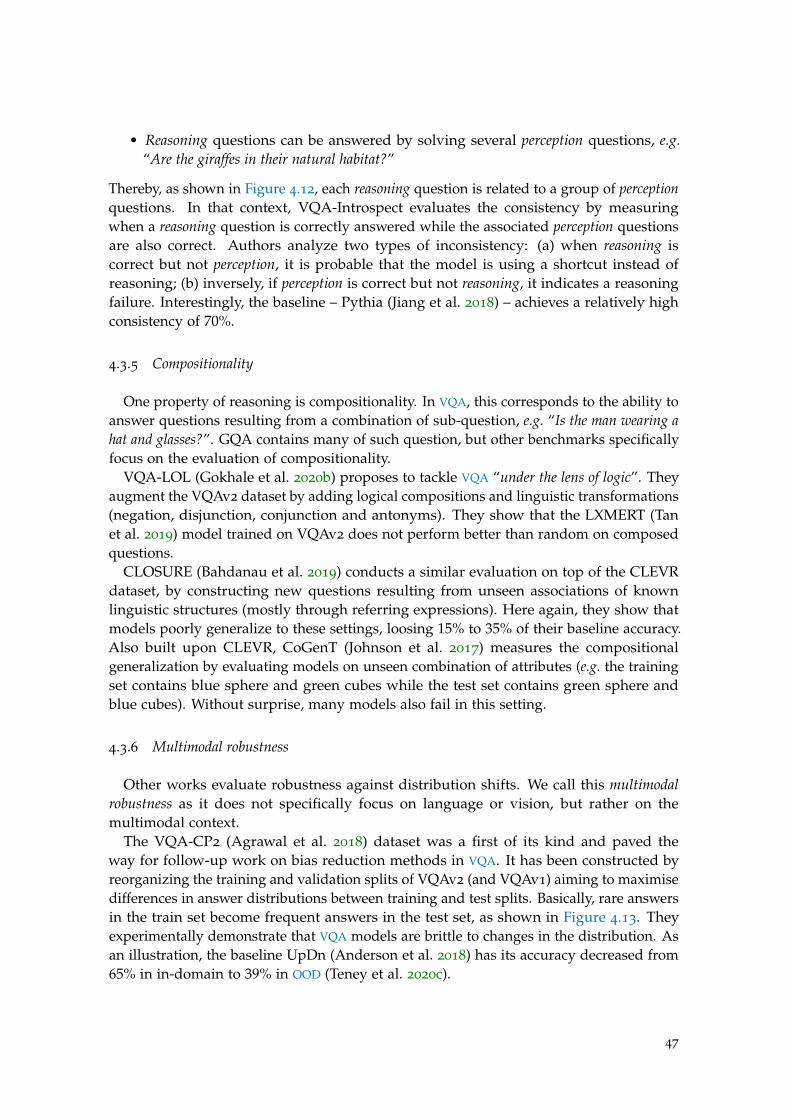
• Reasoning questions can be answered by solving several perception questions, e.g.“Are the giraffes in their natural habitat?”
Thereby, as shown in Figure 4.12, each reasoning question is related to a group of perceptionquestions. In that context, VQA-Introspect evaluates the consistency by measuringwhen a reasoning question is correctly answered while the associated perception questionsare also correct. Authors analyze two types of inconsistency: (a) when reasoning iscorrect but not perception, it is probable that the model is using a shortcut instead ofreasoning; (b) inversely, if perception is correct but not reasoning, it indicates a reasoningfailure. Interestingly, the baseline – Pythia (Jiang et al. 2018) – achieves a relatively highconsistency of 70%.
4.3.5 Compositionality
One property of reasoning is compositionality. In VQA, this corresponds to the ability toanswer questions resulting from a combination of sub-question, e.g. “Is the man wearing ahat and glasses?”. GQA contains many of such question, but other benchmarks specificallyfocus on the evaluation of compositionality.
VQA-LOL (Gokhale et al. 2020b) proposes to tackle VQA “under the lens of logic”. Theyaugment the VQAv2 dataset by adding logical compositions and linguistic transformations(negation, disjunction, conjunction and antonyms). They show that the LXMERT (Tanet al. 2019) model trained on VQAv2 does not perform better than random on composedquestions.
CLOSURE (Bahdanau et al. 2019) conducts a similar evaluation on top of the CLEVRdataset, by constructing new questions resulting from unseen associations of knownlinguistic structures (mostly through referring expressions). Here again, they show thatmodels poorly generalize to these settings, loosing 15% to 35% of their baseline accuracy.Also built upon CLEVR, CoGenT (Johnson et al. 2017) measures the compositionalgeneralization by evaluating models on unseen combination of attributes (e.g. the trainingset contains blue sphere and green cubes while the test set contains green sphere andblue cubes). Without surprise, many models also fail in this setting.
4.3.6 Multimodal robustness
Other works evaluate robustness against distribution shifts. We call this multimodalrobustness as it does not specifically focus on language or vision, but rather on themultimodal context.
The VQA-CP2 (Agrawal et al. 2018) dataset was a first of its kind and paved theway for follow-up work on bias reduction methods in VQA. It has been constructed byreorganizing the training and validation splits of VQAv2 (and VQAv1) aiming to maximisedifferences in answer distributions between training and test splits. Basically, rare answersin the train set become frequent answers in the test set, as shown in Figure 4.13. Theyexperimentally demonstrate that VQA models are brittle to changes in the distribution. Asan illustration, the baseline UpDn (Anderson et al. 2018) has its accuracy decreased from65% in in-domain to 39% in OOD (Teney et al. 2020c).
47
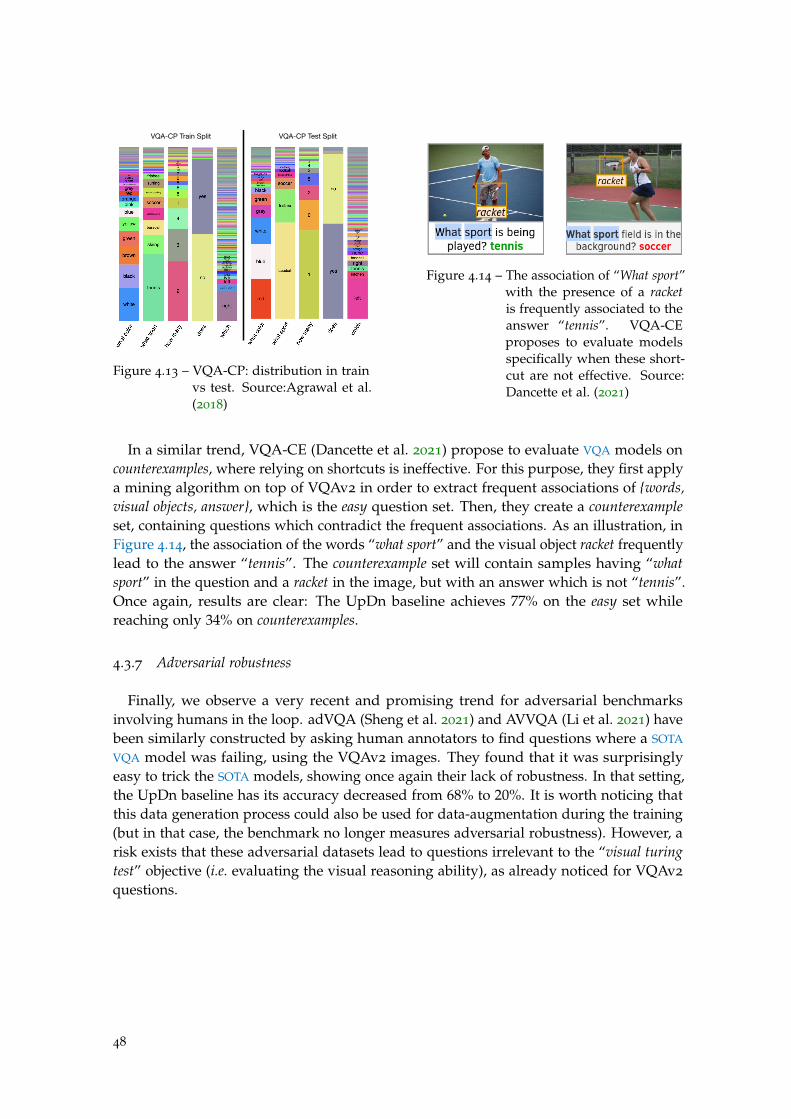
VQA-CP Train Split VQA-CP Test Split
Figure 4.13 – VQA-CP: distribution in trainvs test. Source:Agrawal et al.(2018)
Figure 4.14 – The association of “What sport”with the presence of a racketis frequently associated to theanswer “tennis”. VQA-CEproposes to evaluate modelsspecifically when these short-cut are not effective. Source:Dancette et al. (2021)
In a similar trend, VQA-CE (Dancette et al. 2021) propose to evaluate VQA models oncounterexamples, where relying on shortcuts is ineffective. For this purpose, they first applya mining algorithm on top of VQAv2 in order to extract frequent associations of {words,visual objects, answer}, which is the easy question set. Then, they create a counterexampleset, containing questions which contradict the frequent associations. As an illustration, inFigure 4.14, the association of the words “what sport” and the visual object racket frequentlylead to the answer “tennis”. The counterexample set will contain samples having “whatsport” in the question and a racket in the image, but with an answer which is not “tennis”.Once again, results are clear: The UpDn baseline achieves 77% on the easy set whilereaching only 34% on counterexamples.
4.3.7 Adversarial robustness
Finally, we observe a very recent and promising trend for adversarial benchmarksinvolving humans in the loop. adVQA (Sheng et al. 2021) and AVVQA (Li et al. 2021) havebeen similarly constructed by asking human annotators to find questions where a SOTA
VQA model was failing, using the VQAv2 images. They found that it was surprisinglyeasy to trick the SOTA models, showing once again their lack of robustness. In that setting,the UpDn baseline has its accuracy decreased from 68% to 20%. It is worth noticing thatthis data generation process could also be used for data-augmentation during the training(but in that case, the benchmark no longer measures adversarial robustness). However, arisk exists that these adversarial datasets lead to questions irrelevant to the “visual turingtest” objective (i.e. evaluating the visual reasoning ability), as already noticed for VQAv2
questions.
48
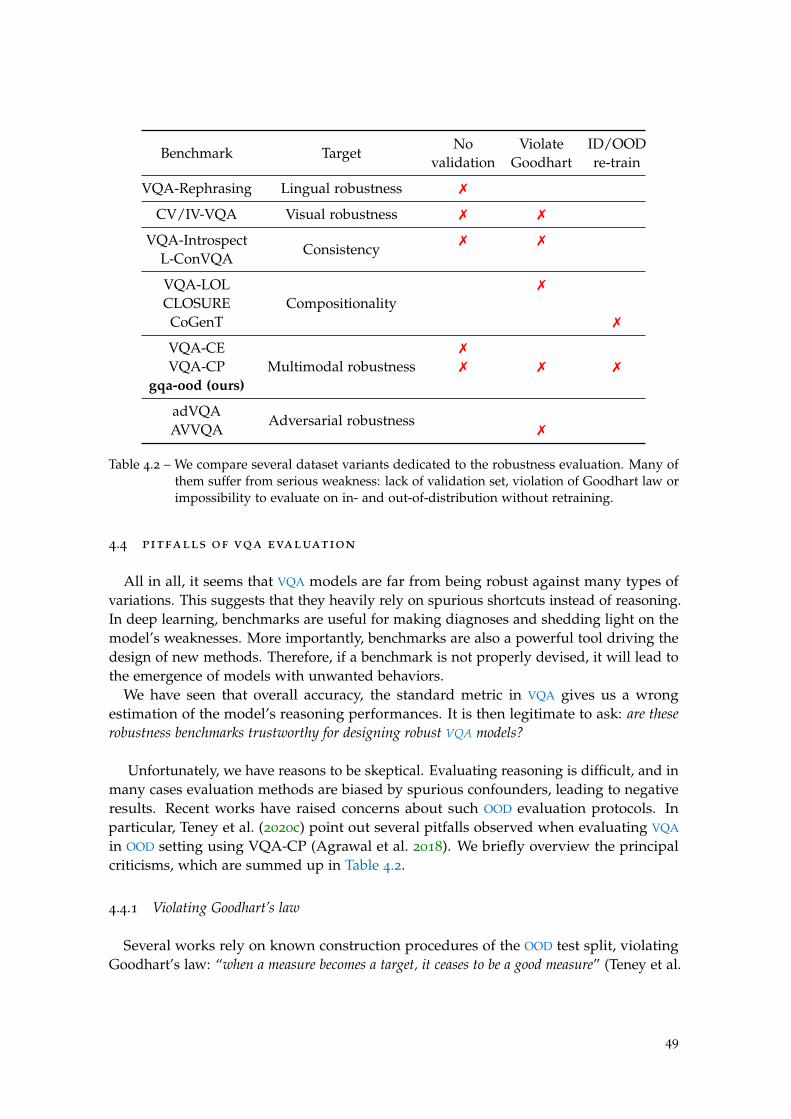
Benchmark TargetNo Violate ID/OOD
validation Goodhart re-train
VQA-Rephrasing Lingual robustness 7
CV/IV-VQA Visual robustness 7 7
VQA-IntrospectConsistency
7 7
L-ConVQA
VQA-LOLCompositionality
7
CLOSURECoGenT 7
VQA-CEMultimodal robustness
7
VQA-CP 7 7 7
gqa-ood (ours)
adVQAAdversarial robustness
AVVQA 7
Table 4.2 – We compare several dataset variants dedicated to the robustness evaluation. Many ofthem suffer from serious weakness: lack of validation set, violation of Goodhart law orimpossibility to evaluate on in- and out-of-distribution without retraining.
4.4 pitfalls of vqa evaluation
All in all, it seems that VQA models are far from being robust against many types ofvariations. This suggests that they heavily rely on spurious shortcuts instead of reasoning.In deep learning, benchmarks are useful for making diagnoses and shedding light on themodel’s weaknesses. More importantly, benchmarks are also a powerful tool driving thedesign of new methods. Therefore, if a benchmark is not properly devised, it will lead tothe emergence of models with unwanted behaviors.
We have seen that overall accuracy, the standard metric in VQA gives us a wrongestimation of the model’s reasoning performances. It is then legitimate to ask: are theserobustness benchmarks trustworthy for designing robust VQA models?
Unfortunately, we have reasons to be skeptical. Evaluating reasoning is difficult, and inmany cases evaluation methods are biased by spurious confounders, leading to negativeresults. Recent works have raised concerns about such OOD evaluation protocols. Inparticular, Teney et al. (2020c) point out several pitfalls observed when evaluating VQA
in OOD setting using VQA-CP (Agrawal et al. 2018). We briefly overview the principalcriticisms, which are summed up in Table 4.2.
4.4.1 Violating Goodhart’s law
Several works rely on known construction procedures of the OOD test split, violatingGoodhart’s law: “when a measure becomes a target, it ceases to be a good measure” (Teney et al.
49
2020c). The most eloquent illustration is VQA-CP where knowing that the test answerdistribution is the inverse of the train distribution allows a model to significantly boostaccuracy. Paradoxically, it results in models overfitting this particular OOD setting, withoutincreasing the generalization on unseen distributions. Similarly, in VQA-Introspect,CV/IV-VQA and VQA-LOL, the proposed baselines rely on data augmentation employingthe same generation process as the one used to construct the benchmark, without anycareful analysis of potential confounders hidden in the generation process.
4.4.2 Issue in in- and out-of-distribution comparison
Some benchmarks (such as VQA-CP or CoGenT) do not allow for the possibility toevaluate the performance in both in- and out-of-distribution settings without having toretrain the model on a different set of data. This results in evaluating two copies of thesame model, but optimized on different training sets, with different label distributions.However, as demonstrated by Teney et al. (2020c), a method can behave differentlydepending on the distribution of its training examples. Hence, it ensues in a biasedcomparison of the in- vs out-of-distribution performance.
4.4.3 Validating on the test set
As surprising as it may seem, a majority of the dataset variants does not provideany validation set. Most bias-reduction techniques therefore seem to optimize theirhyperparameters on the test split (Cadene et al. 2019; Clark et al. 2019; Ramakrishnan et al.2018; Wu et al. 2019; Selvaraju et al. 2019), which should be frowned upon, or, alternatively,validate on a subset of train which does not include a shift (Teney et al. 2020b), which issuboptimal. Obviously, selecting hyperparameters on the test split automatically leads toan overestimation of the performances. At the same time, it is worth noticing that havingstatically separated validation and test splits is not ideal either. Indeed, it is still possibleto (slowly) overfit on the test because of multiple evaluations and model comparisons.An interesting direction would be dynamic benchmarks, which evolve through time inorder to avoid any potential spurious confounder during the evaluation. Adversarialbenchmarks with humans in the loop, such as adVQA or AVVQA are good potentialcandidates.
4.4.4 Impact on VQA methods
These pitfalls of OOD evaluation have a negative impact on the design of new VQA
methods. As an illustration, Shrestha et al. (2020) come up with an interesting negativeresult while analyzing bias-reduction methods based on visual grounding designed on topof the VQA-CP dataset. These methods (Wu et al. 2019; Selvaraju et al. 2019), attemptingto supervise a VQA model to attend to visual regions which are relevant to a humanconsidering the question, are very efficient on VQA-CP. Surprisingly, Shrestha et al. (2020)found that simply enforcing the model to attend to random visual regions was at least asmuch efficient on out- and in-distribution settings. Why was this negative result not observed
50
before? We think that a more profound empirical evaluation of models’ behavior wouldhelp to better judge and compare the efficiency of new VQA methods.
4.5 conclusion
This chapter draws a comprehensive study of the popular datasets and benchmarksdedicated to the VQA task. We show that several large-scale databases are available, withdifferent settings: synthetic vs natural data, strong annotation, realness, etc. However,we also shed light on potential issues – related to data distribution, linguistic diversity,poor annotation quality, presence of tricky questions, etc.– which could hurt VQA training.Without falling into pessimism (these databases have led to the emergence of powerfulmodels), we think that it is important to be aware of the databases’ limitations as it is theroot of every deep learning based model.
We then review numerous benchmarks, pointing out the lack of robustness of currentVQA models. They confirm the databases’ weaknesses, and in particular their inability toaccurately evaluate the VQA models. However, we argue that many robustness benchmarksare not trustworthy, preventing them from helping VQA model designers to build morerobust models. Most of the criticism introduced is related to wrong practices, in part tothe responsibility of the model designers. But it is also a broader issue related to flawstaking root in the current machine learning scientific method, e.g. see Forde et al. (2019)or Gorman et al. (2019).
Drawing conclusion from it, we construct (in Chapter 5) our own benchmark – gqa-ood–dedicated to the evaluation of robustness against distribution shift. We will show thatmany of the previously designed bias-reduction methods are ineffective in our setting.
51

C h a p t e r 5
G Q A - O O D : E VA L UAT I N G V Q A I N O O D S E T T I N G S
5.1 introduction
Efforts to learn high-level reasoning from large-scale datasets depend on the absenceof harmful biases in the data, which could provide unwanted shortcuts to learning inthe form of “Clever Hans” effects. Unfortunately, and in spite of recent efforts (Goyalet al. 2017; Hudson et al. 2019b), most VQA datasets remain very imbalanced. Commonconcepts are significantly more frequent, e.g. the presence of a “red rose”, compared to outof context concepts like the presence of a “zebra in a city”. This causes the tendency ofmodels to overly rely on biases, hindering generalization (Cadene et al. 2019; Clark et al.2019). Despite a consensus on this diagnostic, systemic evaluations of error distributionsare rare. In particular, overall accuracy is still the major, and often unique, metric used toevaluate models and methods, although it is clearly insufficient. Several questions remainopen. How is error distributed? Are true positives due to reasoning or to exploitation of bias?What is the prediction accuracy on infrequent vs. frequent concepts? How can we validate modelsin OOD-settings?
In this chapter we propose a new benchmark and a study of SOTA VQA models, whichallows to precisely answer these questions. The proposed new evaluation protocol iscomplementary to existing ones, but allows a better diagnostic of current VQA performance.In particular, our benchmark can be viewed as an alternative to the VQA-CP (Agrawalet al. 2018) dataset, which has lead to mixed results (see Chapter 4). Our benchmarkcomprises (i) a new fine-grained reorganization of GQA introducing distribution shiftsin both validation and test sets (see Figure 5.1-a); (ii) a set of evaluation metrics; (iii)new evaluation plots illustrating the generalization behavior of VQA models on differentoperating points. The choice of GQA is motivated by its useful structuring into questiongroups, which allows capturing biases precisely, to select groups with strong biases andto create distribution shifts tailored to the exact nature of each question (see Figure 5.1-b).It also makes it possible to analyze how errors are distributed over different associationsof concepts according to their frequency in the dataset.
contributions of the chapter
(i) We propose and make public 1 a new fine-grained re-organization of GQA and aset of the respective evaluation metrics allowing to precisely evaluate the reasoning
1. https://github.com/gqa-ood/GQA-OOD
53
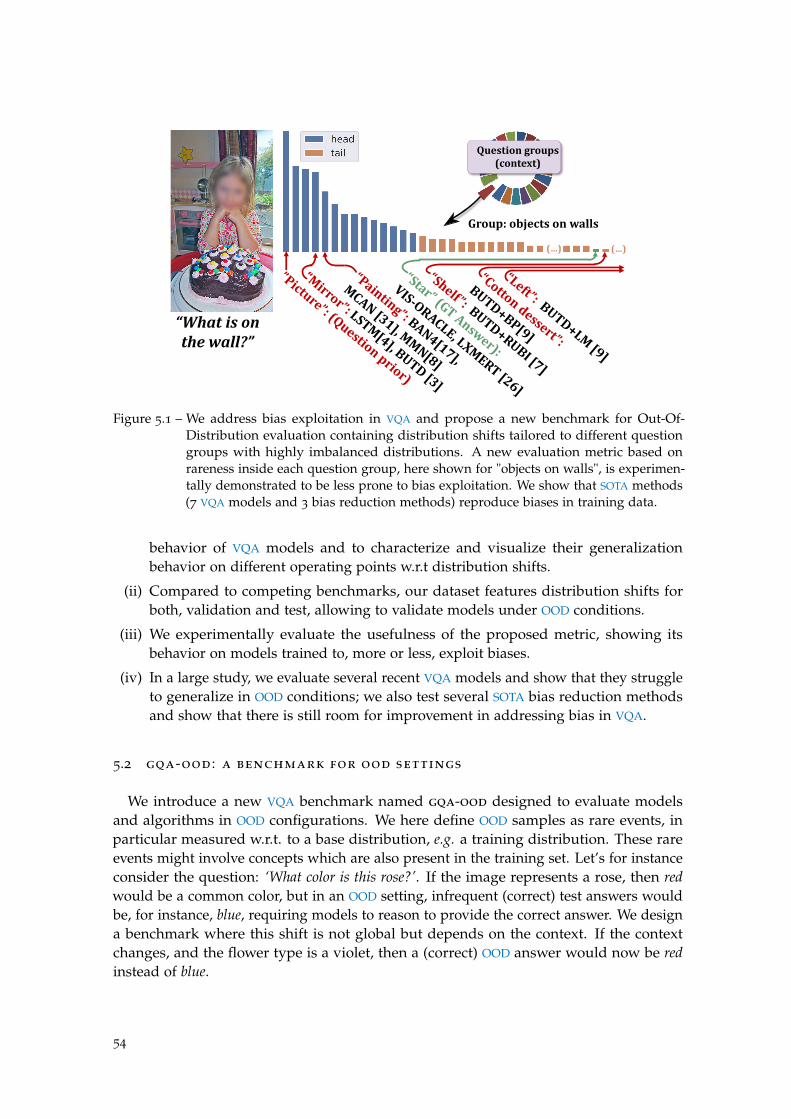
”Picture”:(Questionprior)
“Mirror”: LSTM[4],BUTD[3]
“Star” (GTAnswer):
VIS-ORACLE,LXMERT[26]
“Painting”: BAN4[17],
MCAN[31],MMN[8]
Questiongroups(context)
Group:objectsonwalls
“Whatisonthewall?”
“Shelf”: BUTD+RUBI[7]
“Left”: BUTD+LM[9]
(…)(…)
“Cottondessert”:
BUTD+BP[9]
Figure 5.1 – We address bias exploitation in VQA and propose a new benchmark for Out-Of-Distribution evaluation containing distribution shifts tailored to different questiongroups with highly imbalanced distributions. A new evaluation metric based onrareness inside each question group, here shown for "objects on walls", is experimen-tally demonstrated to be less prone to bias exploitation. We show that SOTA methods(7 VQA models and 3 bias reduction methods) reproduce biases in training data.
behavior of VQA models and to characterize and visualize their generalizationbehavior on different operating points w.r.t distribution shifts.
(ii) Compared to competing benchmarks, our dataset features distribution shifts forboth, validation and test, allowing to validate models under OOD conditions.
(iii) We experimentally evaluate the usefulness of the proposed metric, showing itsbehavior on models trained to, more or less, exploit biases.
(iv) In a large study, we evaluate several recent VQA models and show that they struggleto generalize in OOD conditions; we also test several SOTA bias reduction methodsand show that there is still room for improvement in addressing bias in VQA.
5.2 gqa-ood : a benchmark for ood settings
We introduce a new VQA benchmark named gqa-ood designed to evaluate modelsand algorithms in OOD configurations. We here define OOD samples as rare events, inparticular measured w.r.t. to a base distribution, e.g. a training distribution. These rareevents might involve concepts which are also present in the training set. Let’s for instanceconsider the question: ‘What color is this rose?’. If the image represents a rose, then redwould be a common color, but in an OOD setting, infrequent (correct) test answers wouldbe, for instance, blue, requiring models to reason to provide the correct answer. We designa benchmark where this shift is not global but depends on the context. If the contextchanges, and the flower type is a violet, then a (correct) OOD answer would now be redinstead of blue.
54
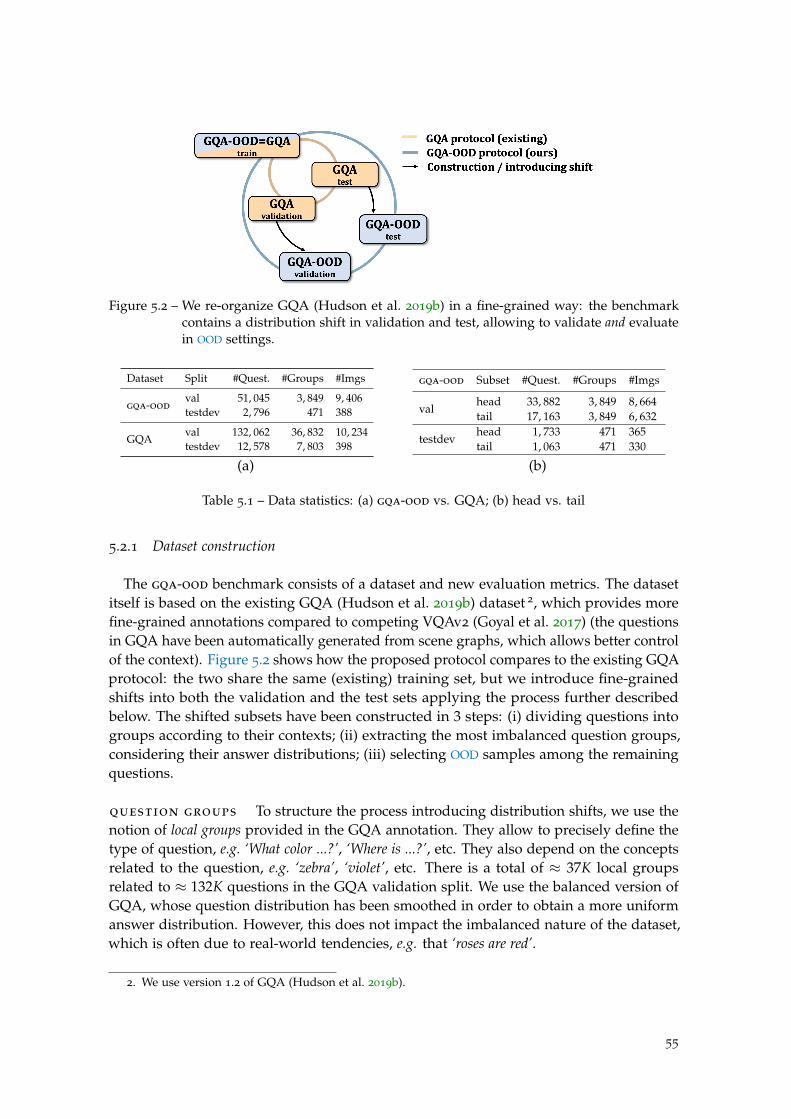
Figure 5.2 – We re-organize GQA (Hudson et al. 2019b) in a fine-grained way: the benchmarkcontains a distribution shift in validation and test, allowing to validate and evaluatein OOD settings.
Dataset Split #Quest. #Groups #Imgs
gqa-ood
val 51, 045 3, 849 9, 406testdev 2, 796 471 388
GQAval 132, 062 36, 832 10, 234testdev 12, 578 7, 803 398
gqa-ood Subset #Quest. #Groups #Imgs
valhead 33, 882 3, 849 8, 664tail 17, 163 3, 849 6, 632
testdevhead 1, 733 471 365tail 1, 063 471 330
(a) (b)
Table 5.1 – Data statistics: (a) gqa-ood vs. GQA; (b) head vs. tail
5.2.1 Dataset construction
The gqa-ood benchmark consists of a dataset and new evaluation metrics. The datasetitself is based on the existing GQA (Hudson et al. 2019b) dataset 2, which provides morefine-grained annotations compared to competing VQAv2 (Goyal et al. 2017) (the questionsin GQA have been automatically generated from scene graphs, which allows better controlof the context). Figure 5.2 shows how the proposed protocol compares to the existing GQAprotocol: the two share the same (existing) training set, but we introduce fine-grainedshifts into both the validation and the test sets applying the process further describedbelow. The shifted subsets have been constructed in 3 steps: (i) dividing questions intogroups according to their contexts; (ii) extracting the most imbalanced question groups,considering their answer distributions; (iii) selecting OOD samples among the remainingquestions.
question groups To structure the process introducing distribution shifts, we use thenotion of local groups provided in the GQA annotation. They allow to precisely define thetype of question, e.g. ‘What color ...?’, ‘Where is ...?’, etc. They also depend on the conceptsrelated to the question, e.g. ‘zebra’, ‘violet’, etc. There is a total of ≈ 37K local groupsrelated to ≈ 132K questions in the GQA validation split. We use the balanced version ofGQA, whose question distribution has been smoothed in order to obtain a more uniformanswer distribution. However, this does not impact the imbalanced nature of the dataset,which is often due to real-world tendencies, e.g. that ‘roses are red’.
2. We use version 1.2 of GQA (Hudson et al. 2019b).
55
measuring group imbalance We extract a subset of the most imbalanced questiongroups, as we are interested in evaluating the prediction error specifically in the context,where shifts in distribution are meaningful and strong. We measure balance throughShannon entropy, given as:
e(x) = −d
∑i=0
p(xi) log p(xi)
where p(xi) is the estimated probability of the class i. As entropy depends on thenumber of answer classes, which is highly variable between different question groups, wenormalize entropy w.r.t. the number d of possible answers in the group:
e(x) =e(x)
log(d)
where log(d) is equal to the entropy of a uniform distribution of size d. Normalizedentropy e(x) thus measures how close the distribution p(x) is to a uniform distribution ofthe same dimension. Finally, we keep groups with a normalized entropy smaller than athreshold empirically set to T=0.9. This selects all benchmark’s questions, but furtherwork is done in order to select specific answer classes for each group.
5.2.2 Out-of-distribution setting
metrics We introduce a shift in distribution by selecting a subset of answer classes foreach question group according to their frequencies, and introduce three different metricsaccording to which classes are used for evaluation. All these metrics are defined overthe aforementioned imbalanced local groups. Figure 5.1 illustrates how the subsets areselected using the example answer histogram of question group objects on walls.
• Acc-tail: the accuracy on OOD samples, which are the samples of the tail of theanswer class distribution, i.e. the rarest answers given the context. We define the tailclasses as classes i with |ai| ≤ αµ(a), where |ai| is the number of samples belongingto the class i and µ(a) is the average sample count for the group. We empirically setthe parameter α=1.2, and in Section 5.3.2 we analyze and illustrate the impact ofthe choice of α on Acc-tail. Figure 5.1 provides an example of such a tail question —we can see that the answer Star is rare in this group, therefore it belongs to the tailset like the other answers shown in orange.
• Acc-head: the accuracy on the distribution head for each local group, given as thedifference between the whole group and its tail (blue answers in Figure 5.1).
• Acc-all: the overall (classical) accuracy over all gqa-ood samples, i.e. the in-domainaccuracy. In Figure 5.1, this corresponds to the blue and orange answers.
dataset statistics Table 5.1 provides statistics of the proposed benchmark. Wealso analyzed the nature, distribution and diversity of the questions w.r.t to GQA, anddemonstrate that it preserves the original question diversity. Figure 5.4a and Figure 5.4bshow the distribution of question structure type as defined in GQA on the validationsplit. As one can observe, the process implemented to construct gqa-ood does not alter
56
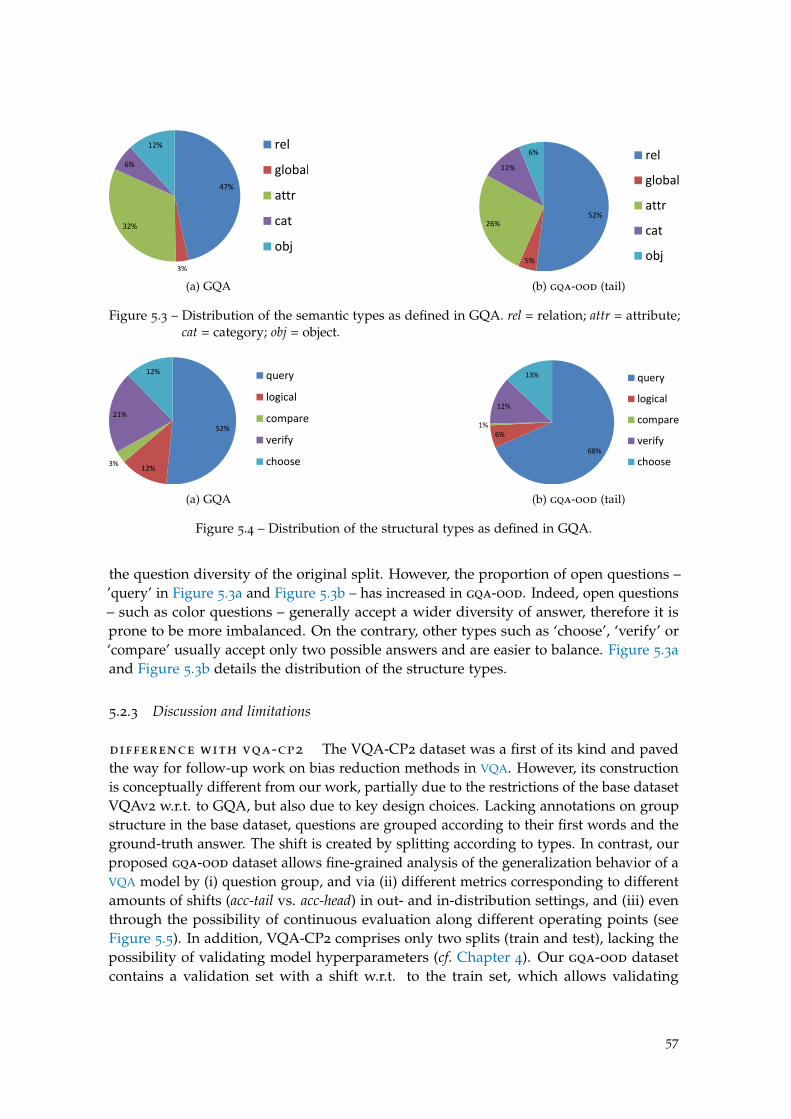
47%
3%
32%
6%
12% rel
global
attr
cat
obj
(a) GQA
52%
5%
26%
11%
6% rel
global
attr
cat
obj
(b) gqa-ood (tail)
Figure 5.3 – Distribution of the semantic types as defined in GQA. rel = relation; attr = attribute;cat = category; obj = object.
52%
12%3%
21%
12% query
logical
compare
verify
choose
(a) GQA
68%
6%1%
12%
13% query
logical
compare
verify
choose
(b) gqa-ood (tail)
Figure 5.4 – Distribution of the structural types as defined in GQA.
the question diversity of the original split. However, the proportion of open questions –’query’ in Figure 5.3a and Figure 5.3b – has increased in gqa-ood. Indeed, open questions– such as color questions – generally accept a wider diversity of answer, therefore it isprone to be more imbalanced. On the contrary, other types such as ‘choose’, ‘verify’ or‘compare’ usually accept only two possible answers and are easier to balance. Figure 5.3aand Figure 5.3b details the distribution of the structure types.
5.2.3 Discussion and limitations
difference with vqa-cp2 The VQA-CP2 dataset was a first of its kind and pavedthe way for follow-up work on bias reduction methods in VQA. However, its constructionis conceptually different from our work, partially due to the restrictions of the base datasetVQAv2 w.r.t. to GQA, but also due to key design choices. Lacking annotations on groupstructure in the base dataset, questions are grouped according to their first words and theground-truth answer. The shift is created by splitting according to types. In contrast, ourproposed gqa-ood dataset allows fine-grained analysis of the generalization behavior of aVQA model by (i) question group, and via (ii) different metrics corresponding to differentamounts of shifts (acc-tail vs. acc-head) in out- and in-distribution settings, and (iii) eventhrough the possibility of continuous evaluation along different operating points (seeFigure 5.5). In addition, VQA-CP2 comprises only two splits (train and test), lacking thepossibility of validating model hyperparameters (cf. Chapter 4). Our gqa-ood datasetcontains a validation set with a shift w.r.t. to the train set, which allows validating
57
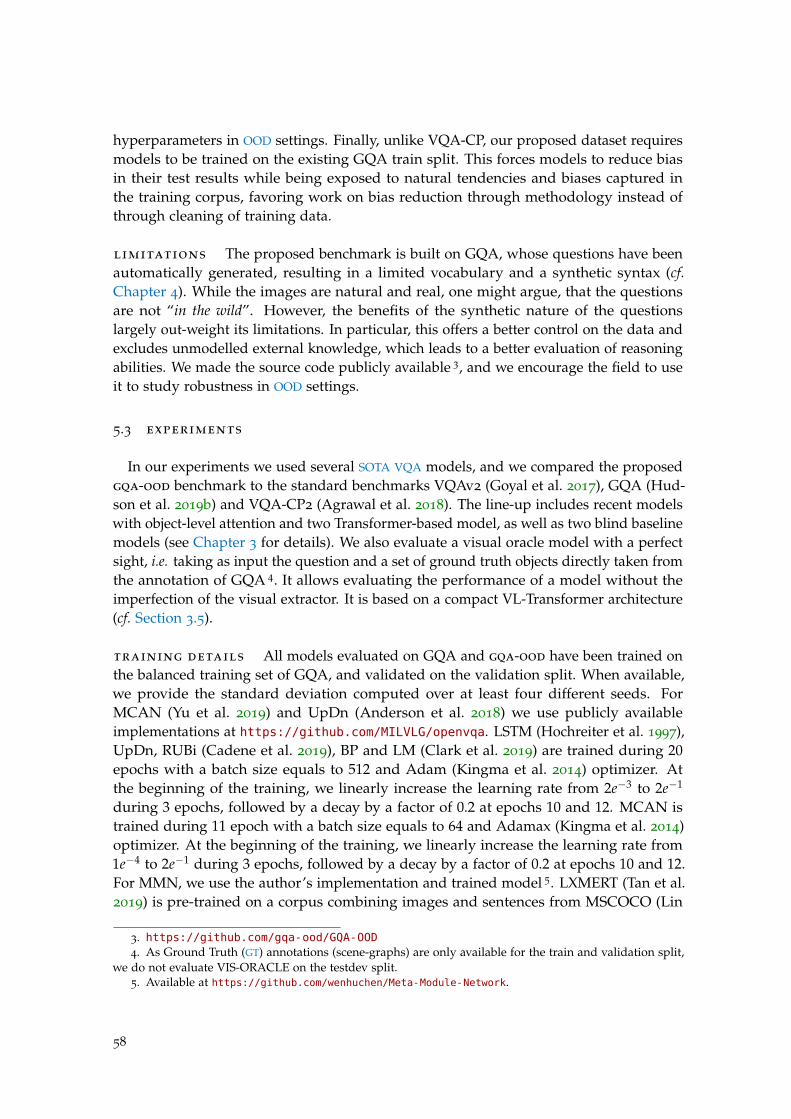
hyperparameters in OOD settings. Finally, unlike VQA-CP, our proposed dataset requiresmodels to be trained on the existing GQA train split. This forces models to reduce biasin their test results while being exposed to natural tendencies and biases captured inthe training corpus, favoring work on bias reduction through methodology instead ofthrough cleaning of training data.
limitations The proposed benchmark is built on GQA, whose questions have beenautomatically generated, resulting in a limited vocabulary and a synthetic syntax (cf.Chapter 4). While the images are natural and real, one might argue, that the questionsare not “in the wild”. However, the benefits of the synthetic nature of the questionslargely out-weight its limitations. In particular, this offers a better control on the data andexcludes unmodelled external knowledge, which leads to a better evaluation of reasoningabilities. We made the source code publicly available 3, and we encourage the field to useit to study robustness in OOD settings.
5.3 experiments
In our experiments we used several SOTA VQA models, and we compared the proposedgqa-ood benchmark to the standard benchmarks VQAv2 (Goyal et al. 2017), GQA (Hud-son et al. 2019b) and VQA-CP2 (Agrawal et al. 2018). The line-up includes recent modelswith object-level attention and two Transformer-based model, as well as two blind baselinemodels (see Chapter 3 for details). We also evaluate a visual oracle model with a perfectsight, i.e. taking as input the question and a set of ground truth objects directly taken fromthe annotation of GQA 4. It allows evaluating the performance of a model without theimperfection of the visual extractor. It is based on a compact VL-Transformer architecture(cf. Section 3.5).
training details All models evaluated on GQA and gqa-ood have been trained onthe balanced training set of GQA, and validated on the validation split. When available,we provide the standard deviation computed over at least four different seeds. ForMCAN (Yu et al. 2019) and UpDn (Anderson et al. 2018) we use publicly availableimplementations at https://github.com/MILVLG/openvqa. LSTM (Hochreiter et al. 1997),UpDn, RUBi (Cadene et al. 2019), BP and LM (Clark et al. 2019) are trained during 20epochs with a batch size equals to 512 and Adam (Kingma et al. 2014) optimizer. Atthe beginning of the training, we linearly increase the learning rate from 2e−3 to 2e−1
during 3 epochs, followed by a decay by a factor of 0.2 at epochs 10 and 12. MCAN istrained during 11 epoch with a batch size equals to 64 and Adamax (Kingma et al. 2014)optimizer. At the beginning of the training, we linearly increase the learning rate from1e−4 to 2e−1 during 3 epochs, followed by a decay by a factor of 0.2 at epochs 10 and 12.For MMN, we use the author’s implementation and trained model 5. LXMERT (Tan et al.2019) is pre-trained on a corpus combining images and sentences from MSCOCO (Lin
3. https://github.com/gqa-ood/GQA-OOD4. As Ground Truth (GT) annotations (scene-graphs) are only available for the train and validation split,
we do not evaluate VIS-ORACLE on the testdev split.5. Available at https://github.com/wenhuchen/Meta-Module-Network.
58
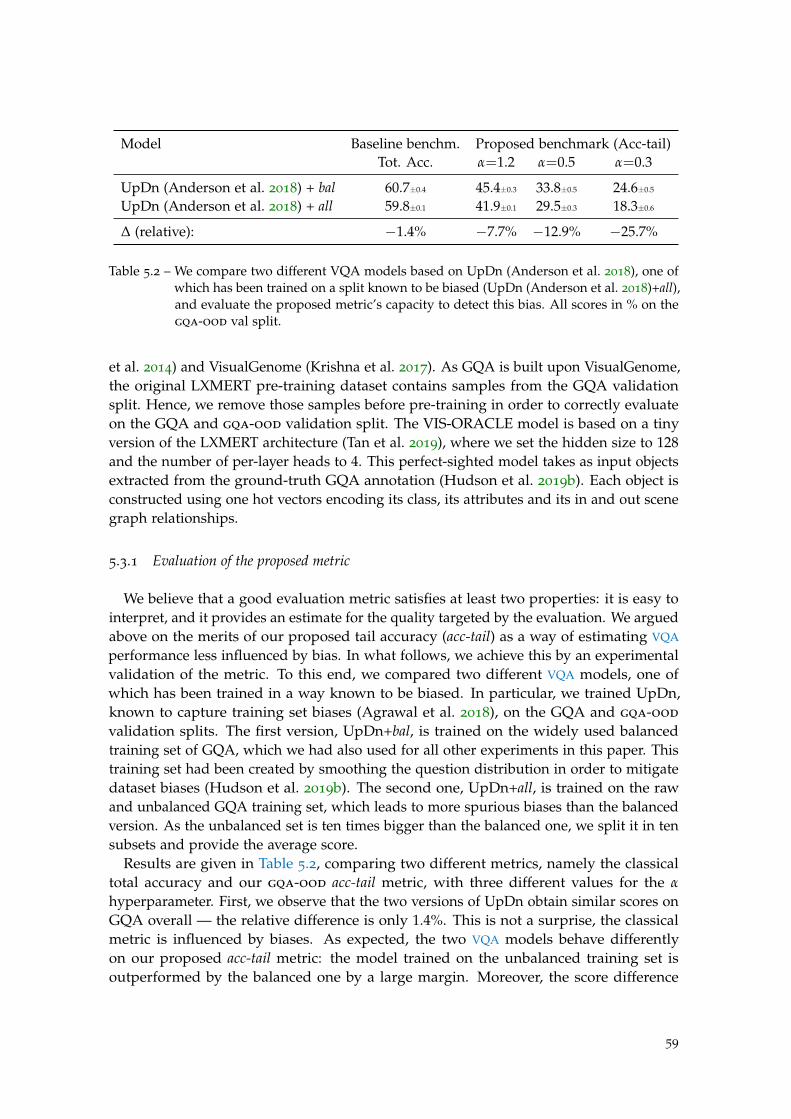
Model Baseline benchm. Proposed benchmark (Acc-tail)Tot. Acc. α=1.2 α=0.5 α=0.3
UpDn (Anderson et al. 2018) + bal 60.7±0.4 45.4±0.3 33.8±0.5 24.6±0.5
UpDn (Anderson et al. 2018) + all 59.8±0.1 41.9±0.1 29.5±0.3 18.3±0.6
∆ (relative): −1.4% −7.7% −12.9% −25.7%
Table 5.2 – We compare two different VQA models based on UpDn (Anderson et al. 2018), one ofwhich has been trained on a split known to be biased (UpDn (Anderson et al. 2018)+all),and evaluate the proposed metric’s capacity to detect this bias. All scores in % on thegqa-ood val split.
et al. 2014) and VisualGenome (Krishna et al. 2017). As GQA is built upon VisualGenome,the original LXMERT pre-training dataset contains samples from the GQA validationsplit. Hence, we remove those samples before pre-training in order to correctly evaluateon the GQA and gqa-ood validation split. The VIS-ORACLE model is based on a tinyversion of the LXMERT architecture (Tan et al. 2019), where we set the hidden size to 128and the number of per-layer heads to 4. This perfect-sighted model takes as input objectsextracted from the ground-truth GQA annotation (Hudson et al. 2019b). Each object isconstructed using one hot vectors encoding its class, its attributes and its in and out scenegraph relationships.
5.3.1 Evaluation of the proposed metric
We believe that a good evaluation metric satisfies at least two properties: it is easy tointerpret, and it provides an estimate for the quality targeted by the evaluation. We arguedabove on the merits of our proposed tail accuracy (acc-tail) as a way of estimating VQA
performance less influenced by bias. In what follows, we achieve this by an experimentalvalidation of the metric. To this end, we compared two different VQA models, one ofwhich has been trained in a way known to be biased. In particular, we trained UpDn,known to capture training set biases (Agrawal et al. 2018), on the GQA and gqa-ood
validation splits. The first version, UpDn+bal, is trained on the widely used balancedtraining set of GQA, which we had also used for all other experiments in this paper. Thistraining set had been created by smoothing the question distribution in order to mitigatedataset biases (Hudson et al. 2019b). The second one, UpDn+all, is trained on the rawand unbalanced GQA training set, which leads to more spurious biases than the balancedversion. As the unbalanced set is ten times bigger than the balanced one, we split it in tensubsets and provide the average score.
Results are given in Table 5.2, comparing two different metrics, namely the classicaltotal accuracy and our gqa-ood acc-tail metric, with three different values for the α
hyperparameter. First, we observe that the two versions of UpDn obtain similar scores onGQA overall — the relative difference is only 1.4%. This is not a surprise, the classicalmetric is influenced by biases. As expected, the two VQA models behave differentlyon our proposed acc-tail metric: the model trained on the unbalanced training set isoutperformed by the balanced one by a large margin. Moreover, the score difference
59
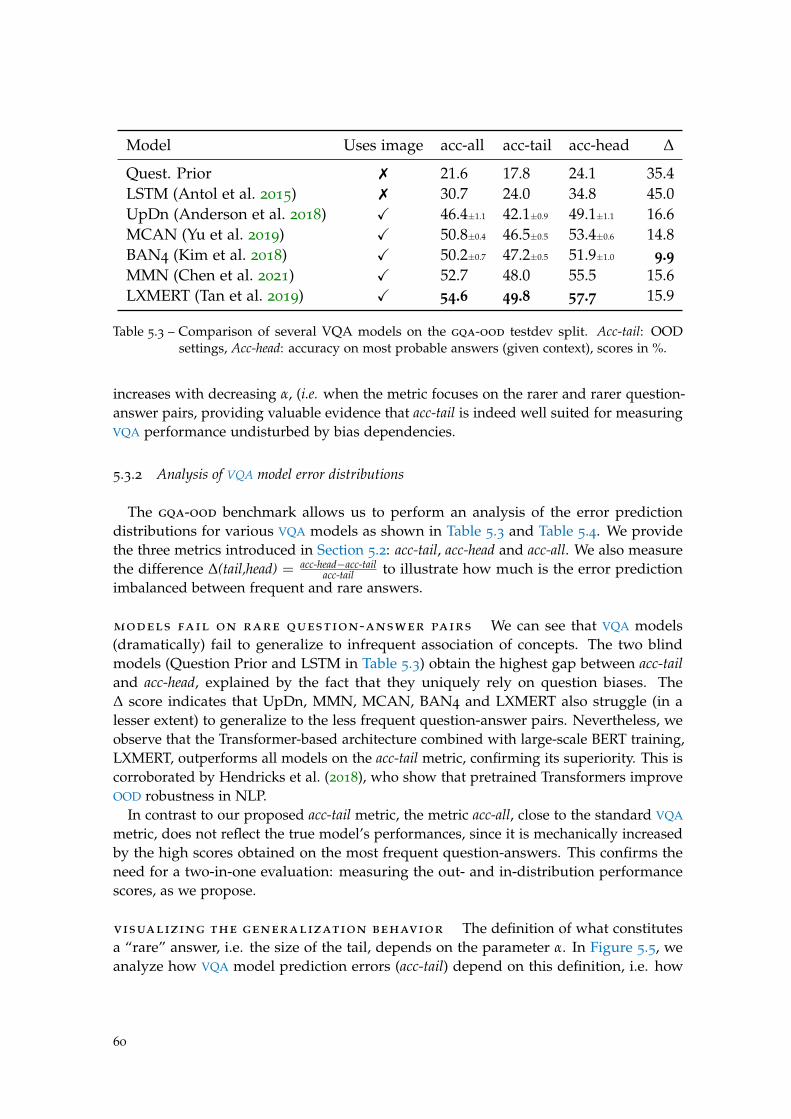
Model Uses image acc-all acc-tail acc-head ∆
Quest. Prior 7 21.6 17.8 24.1 35.4LSTM (Antol et al. 2015) 7 30.7 24.0 34.8 45.0UpDn (Anderson et al. 2018) X 46.4±1.1 42.1±0.9 49.1±1.1 16.6MCAN (Yu et al. 2019) X 50.8±0.4 46.5±0.5 53.4±0.6 14.8BAN4 (Kim et al. 2018) X 50.2±0.7 47.2±0.5 51.9±1.0 9.9MMN (Chen et al. 2021) X 52.7 48.0 55.5 15.6LXMERT (Tan et al. 2019) X 54.6 49.8 57.7 15.9
Table 5.3 – Comparison of several VQA models on the gqa-ood testdev split. Acc-tail: OODsettings, Acc-head: accuracy on most probable answers (given context), scores in %.
increases with decreasing α, (i.e. when the metric focuses on the rarer and rarer question-answer pairs, providing valuable evidence that acc-tail is indeed well suited for measuringVQA performance undisturbed by bias dependencies.
5.3.2 Analysis of VQA model error distributions
The gqa-ood benchmark allows us to perform an analysis of the error predictiondistributions for various VQA models as shown in Table 5.3 and Table 5.4. We providethe three metrics introduced in Section 5.2: acc-tail, acc-head and acc-all. We also measurethe difference ∆(tail,head) = acc-head−acc-tail
acc-tail to illustrate how much is the error predictionimbalanced between frequent and rare answers.
models fail on rare question-answer pairs We can see that VQA models(dramatically) fail to generalize to infrequent association of concepts. The two blindmodels (Question Prior and LSTM in Table 5.3) obtain the highest gap between acc-tailand acc-head, explained by the fact that they uniquely rely on question biases. The∆ score indicates that UpDn, MMN, MCAN, BAN4 and LXMERT also struggle (in alesser extent) to generalize to the less frequent question-answer pairs. Nevertheless, weobserve that the Transformer-based architecture combined with large-scale BERT training,LXMERT, outperforms all models on the acc-tail metric, confirming its superiority. This iscorroborated by Hendricks et al. (2018), who show that pretrained Transformers improveOOD robustness in NLP.
In contrast to our proposed acc-tail metric, the metric acc-all, close to the standard VQA
metric, does not reflect the true model’s performances, since it is mechanically increasedby the high scores obtained on the most frequent question-answers. This confirms theneed for a two-in-one evaluation: measuring the out- and in-distribution performancescores, as we propose.
visualizing the generalization behavior The definition of what constitutesa “rare” answer, i.e. the size of the tail, depends on the parameter α. In Figure 5.5, weanalyze how VQA model prediction errors (acc-tail) depend on this definition, i.e. how
60
Models
BUTD
MCAN
LSTM
BAN
LXMERT
VIS-ORACLE
MMN
100 101
Tail size
0
20
40
60
80
100
acc
-tail
Figure 5.5 – Performance (higher is better) for different definitions of the tail distribution (αparameter values) on the gqa-ood benchmark. We compare several VQA models. Thex-axis is in log-scale.
models behave w.r.t. to questions whose answers are more and more rare. Increasing α
increases the tail — in the extreme case it is equal to the whole distribution (right sideof the plot). With small α, only the most infrequent question-answer pairs are evaluated(left side of the plot). All models follow the same dynamic: starting from a tail sizewhich represents roughly half of the question-answer pairs, tail accuracy starts to linearlydecrease until reaching a dramatically low score (about 30 pts lower than the overallaccuracy). An exception is VIS-ORACLE: its dynamics is nearly flat, prediction error isalmost decorrelated from answer rareness. This provides evidence that a model usingperfect visual input is able to learn reasoning with significantly decreased dependency ondataset biases.
We complement this analysis by measuring the confusion between head and tail asa function of α, shown in Figure 5.6, which provides insights on the causes of thegeneralization failure observed in Figure 5.5. The confusion corresponds to the proportionof questions where the model predicts a head answer with a tail GT answer. When plottingthe confusion versus α, we decrease the size of the tail set (i.e. we keep only the rarestquestion-answer pairs) while keeping the head set unchanged. For α=1.2, LXMERTconfuses answers for 25% of questions, which increases up to 42% for α=0.3. Similarbehavior is observed for the other models, but interestingly not for VIS-ORACLE, wherethe curve is nearly flat, again providing evidence for a low dependency on statisticalbiases in the training set. As a side note, we will show in Chapter 9 that initializingLXMERT weights with VIS-ORACLE allows boosting the accuracy on acc-tail.
61
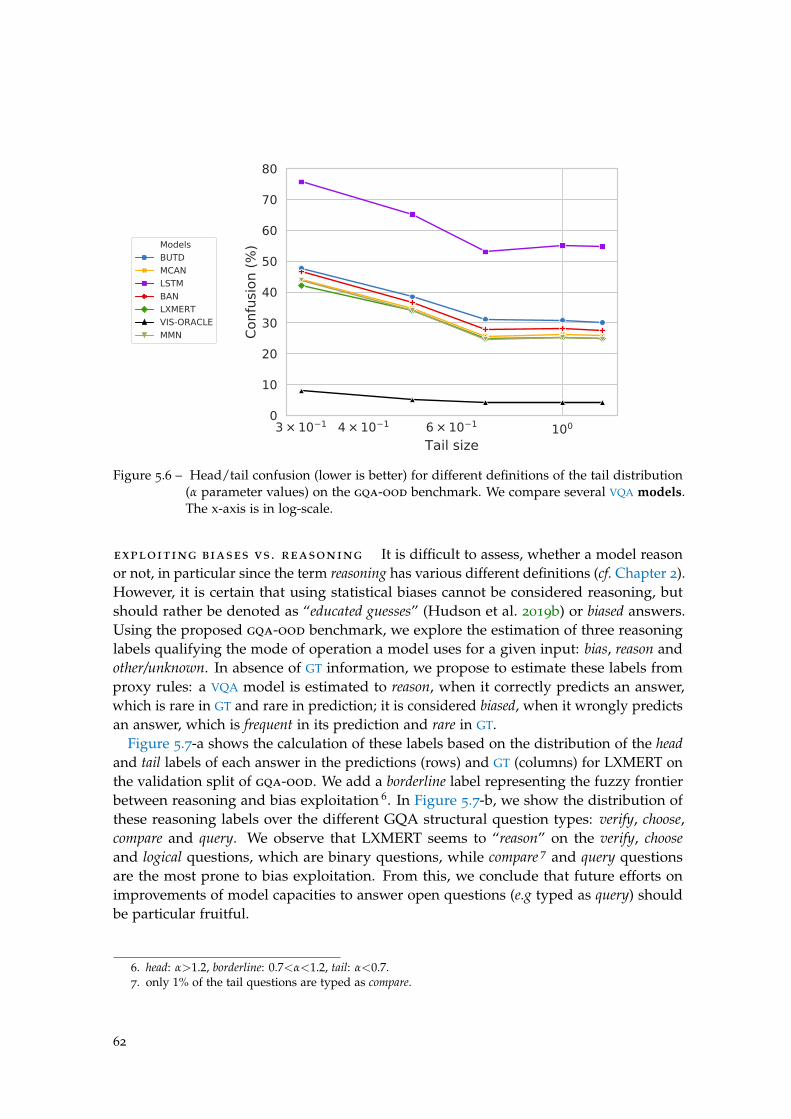
Models
BUTD
MCAN
LSTM
BAN
LXMERT
VIS-ORACLE
MMN
1003 × 10 1 4 × 10 1 6 × 10 1
Tail size
0
10
20
30
40
50
60
70
80
Confu
sion (
%)
Figure 5.6 – Head/tail confusion (lower is better) for different definitions of the tail distribution(α parameter values) on the gqa-ood benchmark. We compare several VQA models.The x-axis is in log-scale.
exploiting biases vs . reasoning It is difficult to assess, whether a model reasonor not, in particular since the term reasoning has various different definitions (cf. Chapter 2).However, it is certain that using statistical biases cannot be considered reasoning, butshould rather be denoted as “educated guesses” (Hudson et al. 2019b) or biased answers.Using the proposed gqa-ood benchmark, we explore the estimation of three reasoninglabels qualifying the mode of operation a model uses for a given input: bias, reason andother/unknown. In absence of GT information, we propose to estimate these labels fromproxy rules: a VQA model is estimated to reason, when it correctly predicts an answer,which is rare in GT and rare in prediction; it is considered biased, when it wrongly predictsan answer, which is frequent in its prediction and rare in GT.
Figure 5.7-a shows the calculation of these labels based on the distribution of the headand tail labels of each answer in the predictions (rows) and GT (columns) for LXMERT onthe validation split of gqa-ood. We add a borderline label representing the fuzzy frontierbetween reasoning and bias exploitation 6. In Figure 5.7-b, we show the distribution ofthese reasoning labels over the different GQA structural question types: verify, choose,compare and query. We observe that LXMERT seems to “reason” on the verify, chooseand logical questions, which are binary questions, while compare 7 and query questionsare the most prone to bias exploitation. From this, we conclude that future efforts onimprovements of model capacities to answer open questions (e.g typed as query) shouldbe particular fruitful.
6. head: α>1.2, borderline: 0.7<α<1.2, tail: α<0.7.7. only 1% of the tail questions are typed as compare.
62
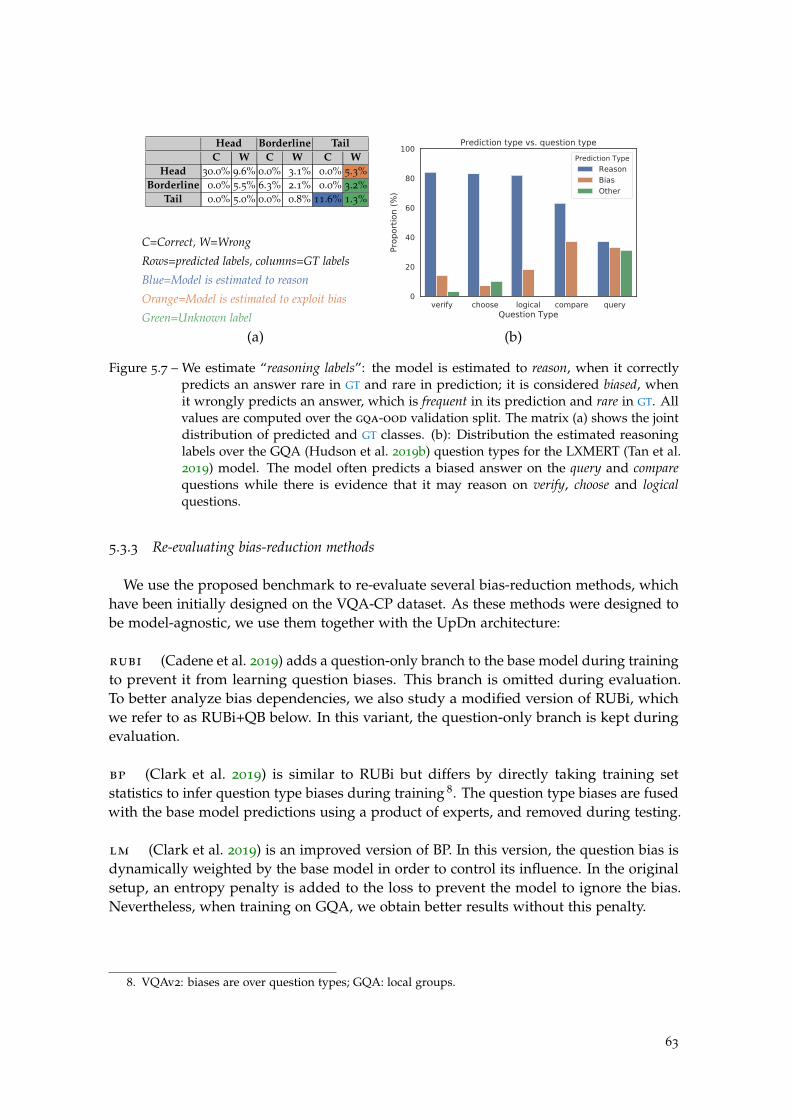
Head Borderline TailC W C W C W
Head 30.0% 9.6% 0.0% 3.1% 0.0% 5.3%Borderline 0.0% 5.5% 6.3% 2.1% 0.0% 3.2%
Tail 0.0% 5.0% 0.0% 0.8% 11.6% 1.3%
C=Correct, W=Wrong
Rows=predicted labels, columns=GT labels
Blue=Model is estimated to reason
Orange=Model is estimated to exploit bias
Green=Unknown labelverify choose logical compare query
Question Type
0
20
40
60
80
100
Prop
ortio
n (%
)
Prediction type vs. question typePrediction Type
ReasonBiasOther
(a) (b)
Figure 5.7 – We estimate “reasoning labels”: the model is estimated to reason, when it correctlypredicts an answer rare in GT and rare in prediction; it is considered biased, whenit wrongly predicts an answer, which is frequent in its prediction and rare in GT. Allvalues are computed over the gqa-ood validation split. The matrix (a) shows the jointdistribution of predicted and GT classes. (b): Distribution the estimated reasoninglabels over the GQA (Hudson et al. 2019b) question types for the LXMERT (Tan et al.2019) model. The model often predicts a biased answer on the query and comparequestions while there is evidence that it may reason on verify, choose and logicalquestions.
5.3.3 Re-evaluating bias-reduction methods
We use the proposed benchmark to re-evaluate several bias-reduction methods, whichhave been initially designed on the VQA-CP dataset. As these methods were designed tobe model-agnostic, we use them together with the UpDn architecture:
rubi (Cadene et al. 2019) adds a question-only branch to the base model during trainingto prevent it from learning question biases. This branch is omitted during evaluation.To better analyze bias dependencies, we also study a modified version of RUBi, whichwe refer to as RUBi+QB below. In this variant, the question-only branch is kept duringevaluation.
bp (Clark et al. 2019) is similar to RUBi but differs by directly taking training setstatistics to infer question type biases during training 8. The question type biases are fusedwith the base model predictions using a product of experts, and removed during testing.
lm (Clark et al. 2019) is an improved version of BP. In this version, the question bias isdynamically weighted by the base model in order to control its influence. In the originalsetup, an entropy penalty is added to the loss to prevent the model to ignore the bias.Nevertheless, when training on GQA, we obtain better results without this penalty.
8. VQAv2: biases are over question types; GQA: local groups.
63
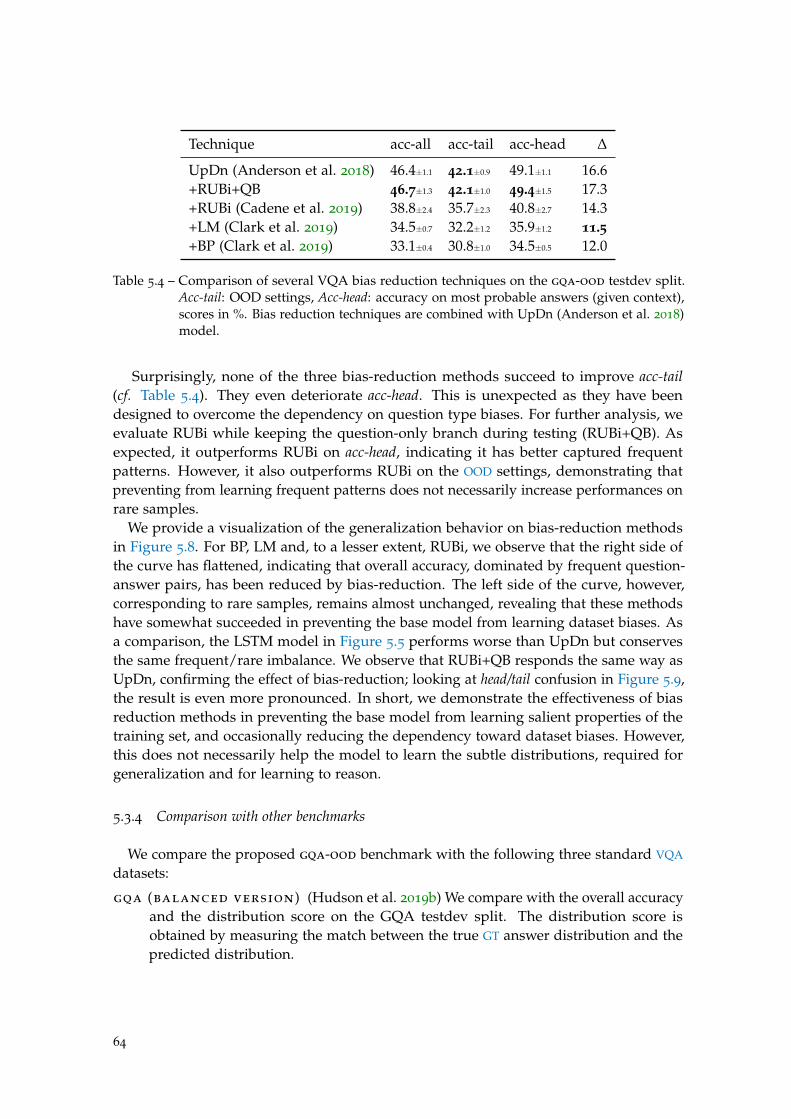
Technique acc-all acc-tail acc-head ∆
UpDn (Anderson et al. 2018) 46.4±1.1 42.1±0.9 49.1±1.1 16.6+RUBi+QB 46.7±1.3 42.1±1.0 49.4±1.5 17.3+RUBi (Cadene et al. 2019) 38.8±2.4 35.7±2.3 40.8±2.7 14.3+LM (Clark et al. 2019) 34.5±0.7 32.2±1.2 35.9±1.2 11.5+BP (Clark et al. 2019) 33.1±0.4 30.8±1.0 34.5±0.5 12.0
Table 5.4 – Comparison of several VQA bias reduction techniques on the gqa-ood testdev split.Acc-tail: OOD settings, Acc-head: accuracy on most probable answers (given context),scores in %. Bias reduction techniques are combined with UpDn (Anderson et al. 2018)model.
Surprisingly, none of the three bias-reduction methods succeed to improve acc-tail(cf. Table 5.4). They even deteriorate acc-head. This is unexpected as they have beendesigned to overcome the dependency on question type biases. For further analysis, weevaluate RUBi while keeping the question-only branch during testing (RUBi+QB). Asexpected, it outperforms RUBi on acc-head, indicating it has better captured frequentpatterns. However, it also outperforms RUBi on the OOD settings, demonstrating thatpreventing from learning frequent patterns does not necessarily increase performances onrare samples.
We provide a visualization of the generalization behavior on bias-reduction methodsin Figure 5.8. For BP, LM and, to a lesser extent, RUBi, we observe that the right side ofthe curve has flattened, indicating that overall accuracy, dominated by frequent question-answer pairs, has been reduced by bias-reduction. The left side of the curve, however,corresponding to rare samples, remains almost unchanged, revealing that these methodshave somewhat succeeded in preventing the base model from learning dataset biases. Asa comparison, the LSTM model in Figure 5.5 performs worse than UpDn but conservesthe same frequent/rare imbalance. We observe that RUBi+QB responds the same way asUpDn, confirming the effect of bias-reduction; looking at head/tail confusion in Figure 5.9,the result is even more pronounced. In short, we demonstrate the effectiveness of biasreduction methods in preventing the base model from learning salient properties of thetraining set, and occasionally reducing the dependency toward dataset biases. However,this does not necessarily help the model to learn the subtle distributions, required forgeneralization and for learning to reason.
5.3.4 Comparison with other benchmarks
We compare the proposed gqa-ood benchmark with the following three standard VQA
datasets:
gqa (balanced version) (Hudson et al. 2019b) We compare with the overall accuracyand the distribution score on the GQA testdev split. The distribution score isobtained by measuring the match between the true GT answer distribution and thepredicted distribution.
64
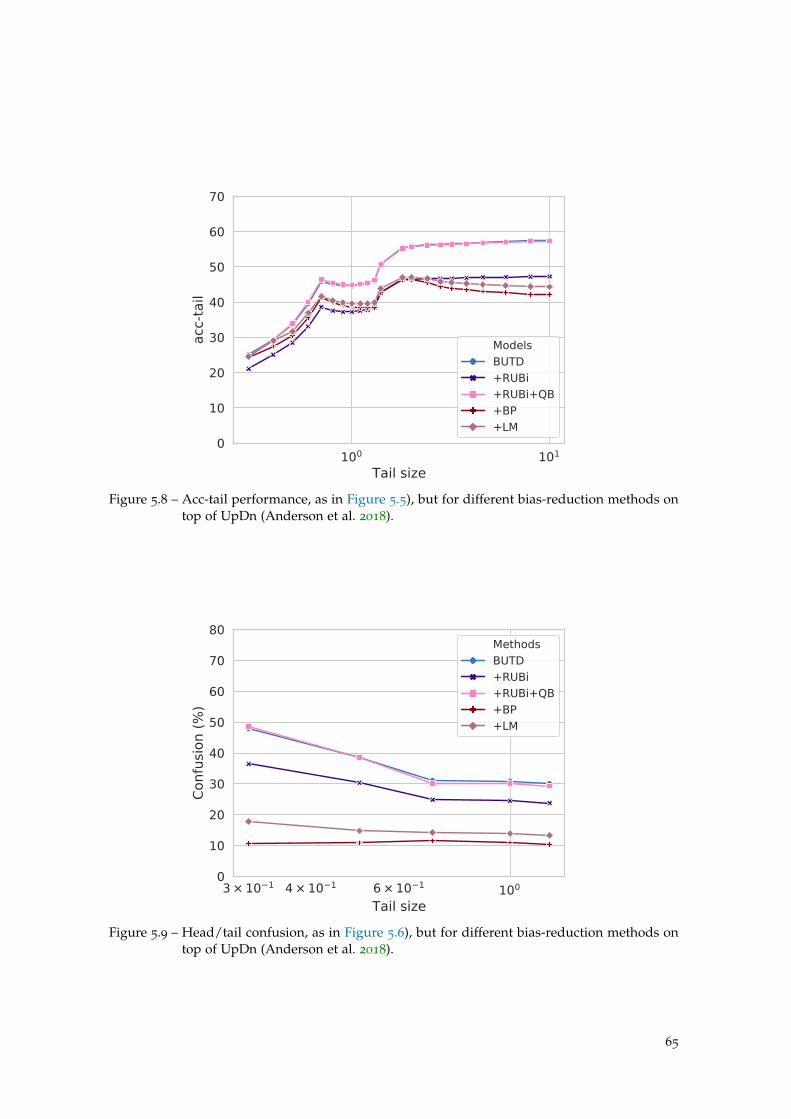
100 101
Tail size
0
10
20
30
40
50
60
70ac
c-ta
il
ModelsBUTD+RUBi+RUBi+QB+BP+LM
Figure 5.8 – Acc-tail performance, as in Figure 5.5), but for different bias-reduction methods ontop of UpDn (Anderson et al. 2018).
1003 × 10 1 4 × 10 1 6 × 10 1
Tail size
0
10
20
30
40
50
60
70
80
Conf
usio
n (%
)
MethodsBUTD+RUBi+RUBi+QB+BP+LM
Figure 5.9 – Head/tail confusion, as in Figure 5.6), but for different bias-reduction methods ontop of UpDn (Anderson et al. 2018).
65
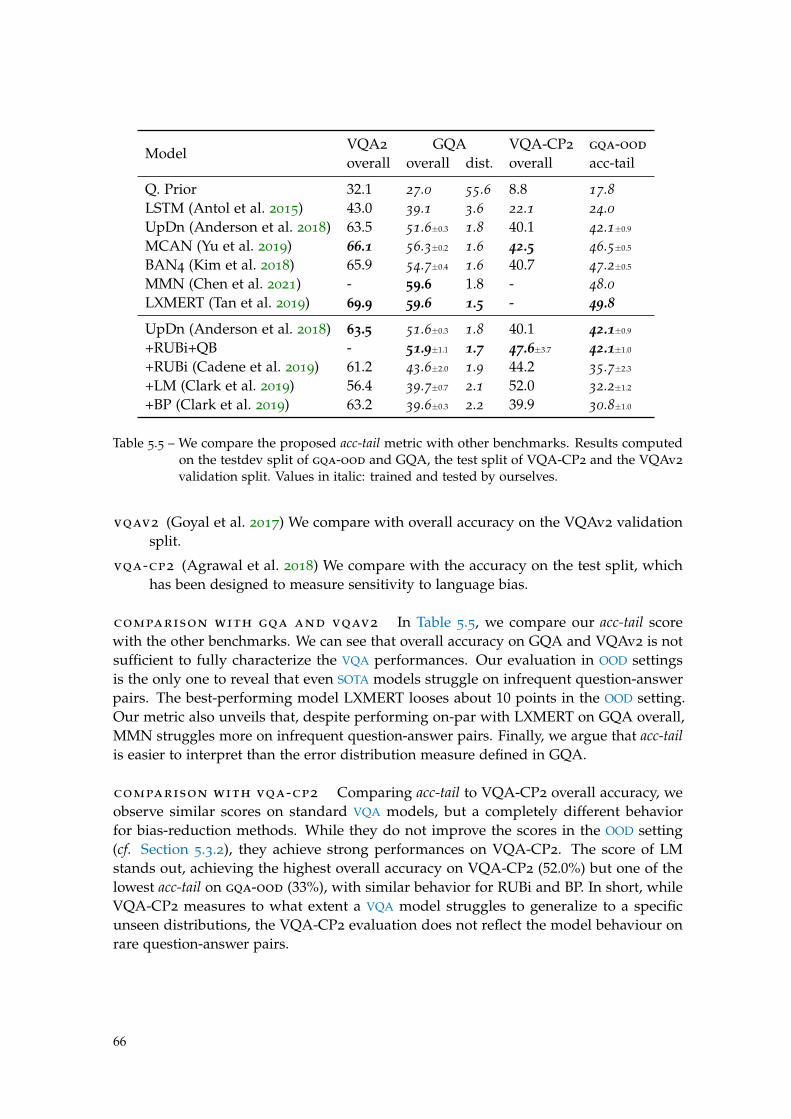
ModelVQA2 GQA VQA-CP2 gqa-ood
overall overall dist. overall acc-tail
Q. Prior 32.1 27.0 55.6 8.8 17.8LSTM (Antol et al. 2015) 43.0 39.1 3.6 22.1 24.0UpDn (Anderson et al. 2018) 63.5 51.6±0.3 1.8 40.1 42.1±0.9
MCAN (Yu et al. 2019) 66.1 56.3±0.2 1.6 42.5 46.5±0.5
BAN4 (Kim et al. 2018) 65.9 54.7±0.4 1.6 40.7 47.2±0.5
MMN (Chen et al. 2021) - 59.6 1.8 - 48.0LXMERT (Tan et al. 2019) 69.9 59.6 1.5 - 49.8
UpDn (Anderson et al. 2018) 63.5 51.6±0.3 1.8 40.1 42.1±0.9
+RUBi+QB - 51.9±1.1 1.7 47.6±3.7 42.1±1.0
+RUBi (Cadene et al. 2019) 61.2 43.6±2.0 1.9 44.2 35.7±2.3
+LM (Clark et al. 2019) 56.4 39.7±0.7 2.1 52.0 32.2±1.2
+BP (Clark et al. 2019) 63.2 39.6±0.3 2.2 39.9 30.8±1.0
Table 5.5 – We compare the proposed acc-tail metric with other benchmarks. Results computedon the testdev split of gqa-ood and GQA, the test split of VQA-CP2 and the VQAv2
validation split. Values in italic: trained and tested by ourselves.
vqav2 (Goyal et al. 2017) We compare with overall accuracy on the VQAv2 validationsplit.
vqa-cp2 (Agrawal et al. 2018) We compare with the accuracy on the test split, whichhas been designed to measure sensitivity to language bias.
comparison with gqa and vqav2 In Table 5.5, we compare our acc-tail scorewith the other benchmarks. We can see that overall accuracy on GQA and VQAv2 is notsufficient to fully characterize the VQA performances. Our evaluation in OOD settingsis the only one to reveal that even SOTA models struggle on infrequent question-answerpairs. The best-performing model LXMERT looses about 10 points in the OOD setting.Our metric also unveils that, despite performing on-par with LXMERT on GQA overall,MMN struggles more on infrequent question-answer pairs. Finally, we argue that acc-tailis easier to interpret than the error distribution measure defined in GQA.
comparison with vqa-cp2 Comparing acc-tail to VQA-CP2 overall accuracy, weobserve similar scores on standard VQA models, but a completely different behaviorfor bias-reduction methods. While they do not improve the scores in the OOD setting(cf. Section 5.3.2), they achieve strong performances on VQA-CP2. The score of LMstands out, achieving the highest overall accuracy on VQA-CP2 (52.0%) but one of thelowest acc-tail on gqa-ood (33%), with similar behavior for RUBi and BP. In short, whileVQA-CP2 measures to what extent a VQA model struggles to generalize to a specificunseen distributions, the VQA-CP2 evaluation does not reflect the model behaviour onrare question-answer pairs.
66
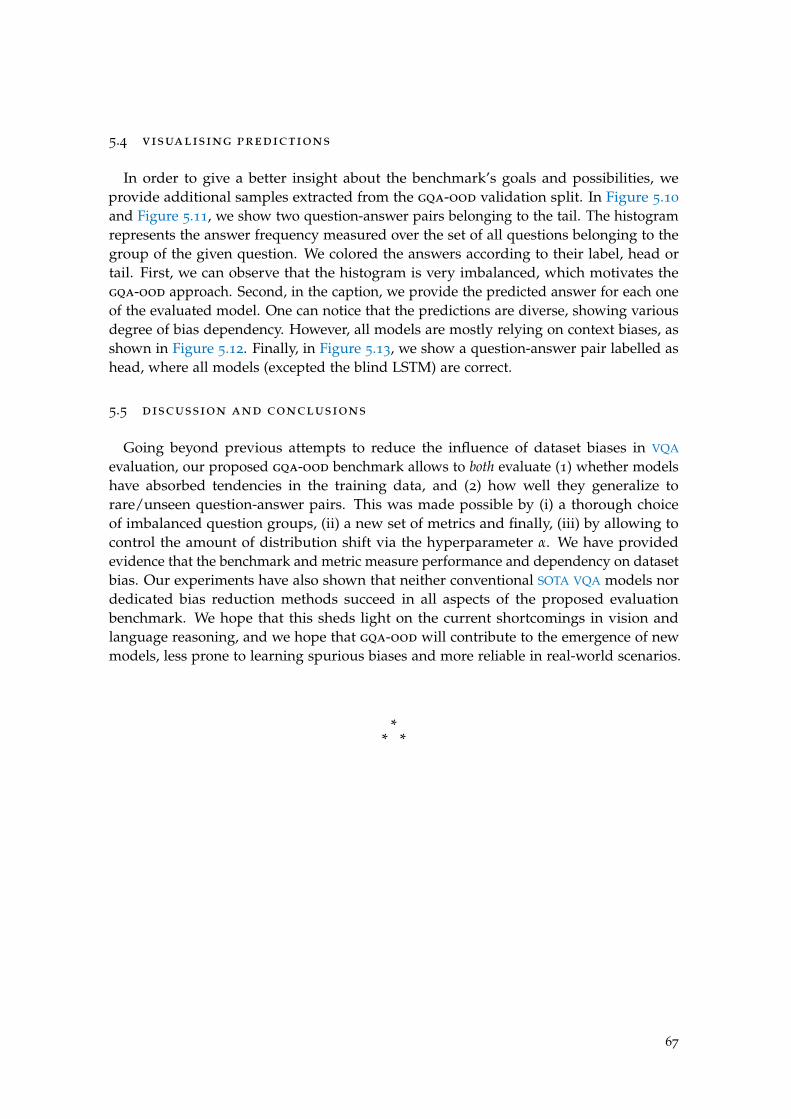
5.4 visualising predictions
In order to give a better insight about the benchmark’s goals and possibilities, weprovide additional samples extracted from the gqa-ood validation split. In Figure 5.10
and Figure 5.11, we show two question-answer pairs belonging to the tail. The histogramrepresents the answer frequency measured over the set of all questions belonging to thegroup of the given question. We colored the answers according to their label, head ortail. First, we can observe that the histogram is very imbalanced, which motivates thegqa-ood approach. Second, in the caption, we provide the predicted answer for each oneof the evaluated model. One can notice that the predictions are diverse, showing variousdegree of bias dependency. However, all models are mostly relying on context biases, asshown in Figure 5.12. Finally, in Figure 5.13, we show a question-answer pair labelled ashead, where all models (excepted the blind LSTM) are correct.
5.5 discussion and conclusions
Going beyond previous attempts to reduce the influence of dataset biases in VQA
evaluation, our proposed gqa-ood benchmark allows to both evaluate (1) whether modelshave absorbed tendencies in the training data, and (2) how well they generalize torare/unseen question-answer pairs. This was made possible by (i) a thorough choiceof imbalanced question groups, (ii) a new set of metrics and finally, (iii) by allowing tocontrol the amount of distribution shift via the hyperparameter α. We have providedevidence that the benchmark and metric measure performance and dependency on datasetbias. Our experiments have also shown that neither conventional SOTA VQA models nordedicated bias reduction methods succeed in all aspects of the proposed evaluationbenchmark. We hope that this sheds light on the current shortcomings in vision andlanguage reasoning, and we hope that gqa-ood will contribute to the emergence of newmodels, less prone to learning spurious biases and more reliable in real-world scenarios.
** *
67
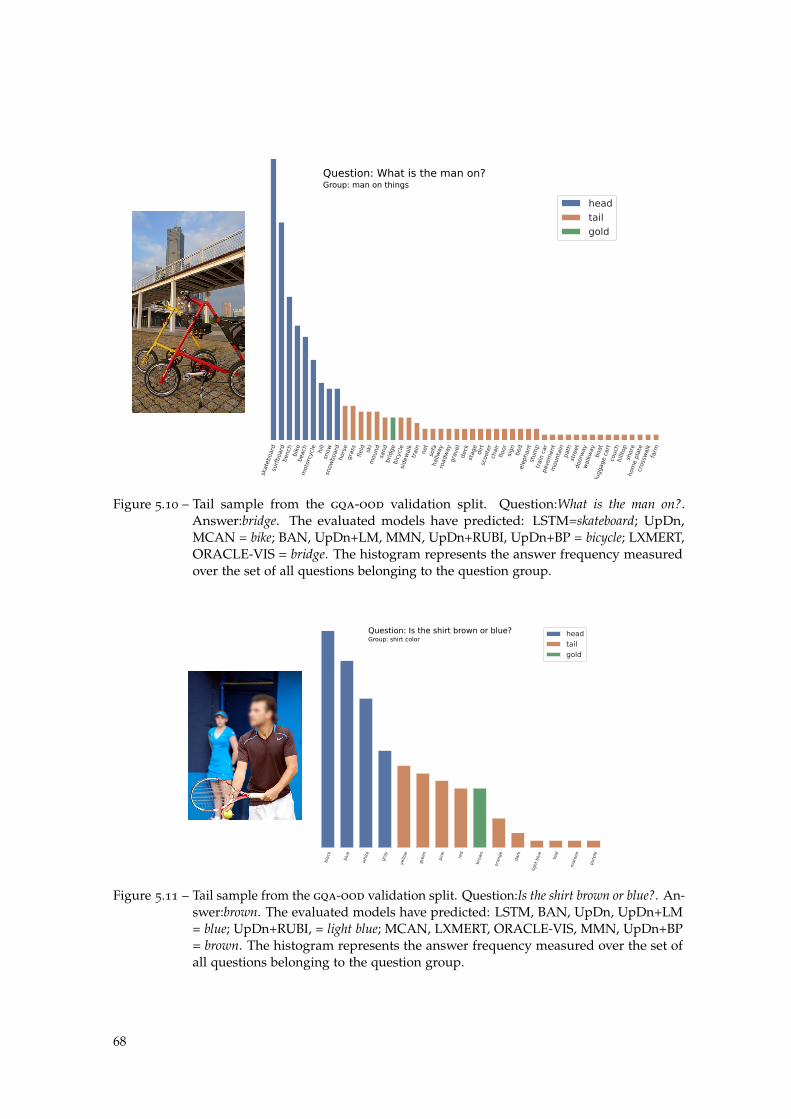
skat
eboa
rdsu
rfboa
rdben
chbik
ebea
chm
otor
cycl
ehill
snow
snow
boa
rdhor
segra
ssfiel
dsk
im
ound
sand
bri
dge
bic
ycle
sidew
alk
trai
nnet
sofa
hal
lway
road
way
gra
vel
dec
kst
age
dir
tsc
oote
rch
air
floo
rsi
gn
bed
elep
han
tst
um
ptr
ain c
arpav
emen
tm
ounta
inpat
hst
reet
doo
rway
wal
kway
boa
tlu
ggag
e ca
rtco
uch
hill
top
shor
ehom
e pla
tecr
ossw
alk
farm
head
tail
gold
Question: What is the man on?Group: man on things
Figure 5.10 – Tail sample from the gqa-ood validation split. Question:What is the man on?.Answer:bridge. The evaluated models have predicted: LSTM=skateboard; UpDn,MCAN = bike; BAN, UpDn+LM, MMN, UpDn+RUBI, UpDn+BP = bicycle; LXMERT,ORACLE-VIS = bridge. The histogram represents the answer frequency measuredover the set of all questions belonging to the question group.
bla
ck
blu
e
white
gra
y
yello
w
gre
en
pin
k
red
bro
wn
oran
ge
dar
k
light
blu
e
teal
mar
oon
purp
le
head
tail
gold
Question: Is the shirt brown or blue?Group: shirt color
Figure 5.11 – Tail sample from the gqa-ood validation split. Question:Is the shirt brown or blue?. An-swer:brown. The evaluated models have predicted: LSTM, BAN, UpDn, UpDn+LM= blue; UpDn+RUBI, = light blue; MCAN, LXMERT, ORACLE-VIS, MMN, UpDn+BP= brown. The histogram represents the answer frequency measured over the set ofall questions belonging to the question group.
68
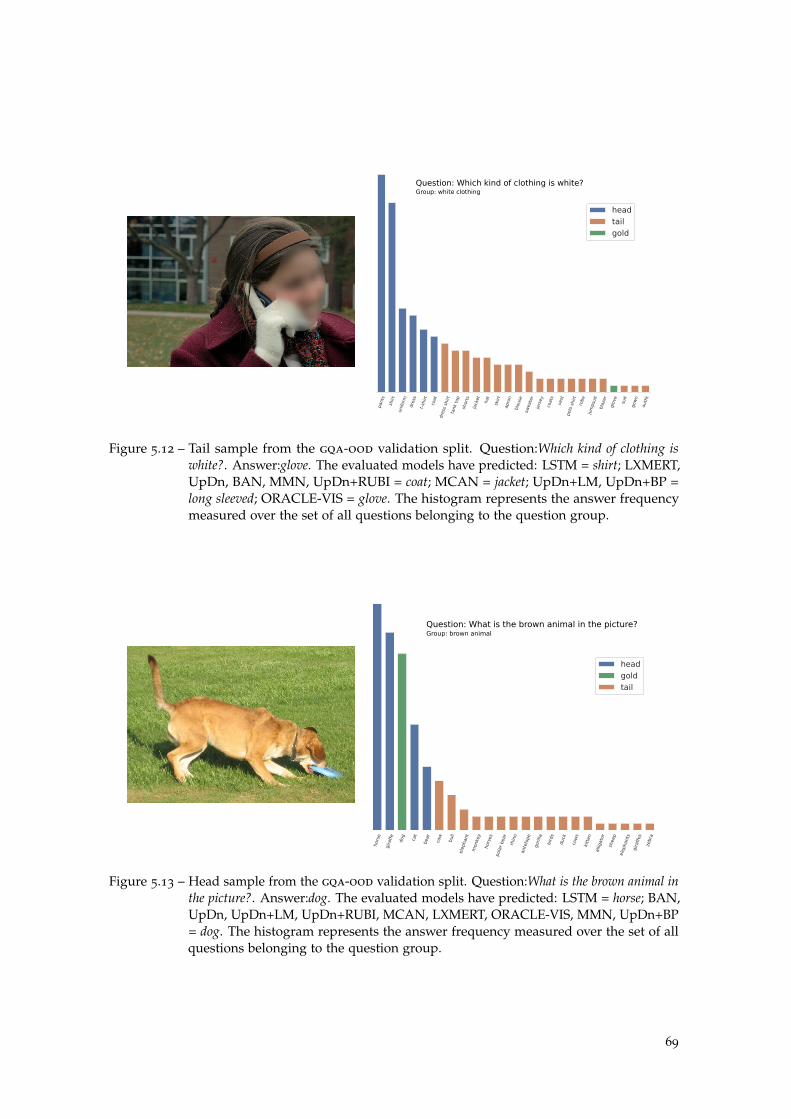
pan
ts
shir
t
unifor
m
dre
ss
t-sh
irt
coat
dre
ss s
hir
tta
nk
top
shor
ts
jack
et
hat
skir
t
apro
n
blo
use
swea
ter
jers
ey
coat
s
vest
pol
o sh
irt
robe
jum
psu
itbla
zer
glo
ve suit
gow
n
outf
it
Question: Which kind of clothing is white?Group: white clothing
head
tail
gold
Figure 5.12 – Tail sample from the gqa-ood validation split. Question:Which kind of clothing iswhite?. Answer:glove. The evaluated models have predicted: LSTM = shirt; LXMERT,UpDn, BAN, MMN, UpDn+RUBI = coat; MCAN = jacket; UpDn+LM, UpDn+BP =long sleeved; ORACLE-VIS = glove. The histogram represents the answer frequencymeasured over the set of all questions belonging to the question group.
hor
se
gir
affe
dog ca
t
bea
r
cow
bull
elep
han
tm
onke
y
hor
ses
pol
ar b
ear
rhin
o
ante
lope
gor
illa
bir
ds
duck
cow
s
kitt
en
allig
ator
shee
p
elep
han
tsgir
affe
s
zebra
head
gold
tail
Question: What is the brown animal in the picture?Group: brown animal
Figure 5.13 – Head sample from the gqa-ood validation split. Question:What is the brown animal inthe picture?. Answer:dog. The evaluated models have predicted: LSTM = horse; BAN,UpDn, UpDn+LM, UpDn+RUBI, MCAN, LXMERT, ORACLE-VIS, MMN, UpDn+BP= dog. The histogram represents the answer frequency measured over the set of allquestions belonging to the question group.
69


Part III
A N A LY S E : I N S E A R C H O F R E A S O N I N G PAT T E R N S

I N T R O D U C T I O N
Part II has shown that current VQA models are prone to exploiting harmful biases inthe data, which can provide unwanted shortcuts to learning in the form of “Clever Hans”effects. We demonstrated (in Chapter 5) the necessity to define new ways of evaluatingVQA models, going beyond the standard overall accuracy. But more importantly, wehighlighted the fact that this bias-related issue is difficult to identify and measure. Indeed,although the VQA bias dependency has already been largely studied and analyzed (e.g.see Agrawal (2019)), the issue persists. SOTA VQA models are still bias dependent, anddatasets initially designed to measure bias dependency become quickly insufficient. VQA-CP (Agrawal et al. 2018) is probably the most eloquent example: while it allowed to revealthe strong bias dependency of VQA models, it is currently at the origin of new types ofbiases leading to negative results (in a few words, de-bias methods designed on top ofVQA-CP tend to overfit on its specific setup, cf. Chapter 5 for details). Summarizing, itappears that designing one (or many) benchmark(s) is not sufficient to solve the biasissue.
but then, why is the study of bias so difficult? A pessimistic answer wouldbe that designing bias reduction methods generally boils down to a trade-off betweenseemingly incompatible goals: reaching high accuracy on standard benchmarks (which arebiased), or being robust against biases. Thereby, working on bias-reduction would not bean attractive choice because it could steer efforts away from the classic SOTA competitionmetrics. But this hypothesis is not completely satisfying. First, reaching SOTA accuracyon standard (biased) benchmarks while being robust against biases is, theoretically, notincompatible, but arguably, hard. As an illustration, we observed in gqa-ood (Chapter 5)that models performing the best in in-distribution settings are also the best performing inout-of-distribution ones (which measure bias-robustness). Second, there is a large amountof work trying to address (with more or less success) bias robustness in VQA (cf. Part II),suggesting that this issue is a topic perceived as relevant by the field.
Actually, we rather think that the origin of the problem is simpler. Working on biasrobustness is difficult precisely because it is hard to correctly diagnose bias dependencies.Why? Because of the lack of interpretability of VQA models. As models are not inter-pretable enough, experts have to build their own interpretation of models’ predictions, atthe risk of overestimating their reasoning capabilities (à la “Clever Hans”), and so ignoringbias issues. In a nutshell, it is hard to solve a problem that we do not understand well.
vqa interpretability In the line of recent work in AI explainability (Lipton 2016;Ribeiro et al. 2016), and data visualization (Hohman et al. 2018; Vig 2019a; DeRose et al.2020), we aim at improving our understanding of VQA model predictions. More precisely,we propose to borrow tools and methods from AI explainability to draw a better pictureof the bias issue in VQA, in a complementary way with the benchmark-based evaluationsdiscussed in Part II. For this purpose, we develop a tool (VisQA) and conduct in-depth
73
analyses of attention mechanisms at work in VQA models, providing cues to answer thefollowing questions: When is the model relying on biases? What did it learn? What are theconditions for the emergence of reasoning?
This work on VQA interpretability is directly related to the discussion on VQA evaluationdone in Part II, and contributes to designing new VQA methods introduced in Part IV. Thewhole part is the result of a collaboration between experts in visual analytics (in particular, ThéoJaunet), and experts in Visual Question Answering systems and Machine Learning. Part III isorganized as follows:
Chapter 6 aims at improving the interpretability of a VL-Transformer VQA modelusing VisQA, an instance-level visual analytics tool for VQA, developed in collaborationwith Théo Jaunet. In particular, we show that analyzing the attention mechanism atwork in the VQA model help experts to better judge when it is reasoning or exploitingshortcuts. This work has resulted in an online interactive tool, publicly available athttps://visqa.liris.cnrs.fr.
Chapter 7 extends the VisQA analysis, conducted at an instance-level, to get a broaderview of the behavior of the VL-Transformer at a dataset level. In particular, we focuson the emergence of reasoning patterns at work in the attention layers of the model.We experimentally demonstrate that the reasoning patterns emerge when the trainingconditions are favorable enough, and in particular when the uncertainty in the visual partis reduced.
This part has led to the publication of the following conference papers:
• Theo Jaunet, Corentin Kervadec, Romain Vuillemot, Grigory Antipov, Moez Baccouche, andChristian Wolf (2021). “VisQA: X-raying Vision and Language Reasoning in Transformers”.In: IEEE Transactions on Visualization and Computer Graphics (TVCG);
• Corentin Kervadec, Theo Jaunet, Grigory Antipov, Moez Baccouche, Romain Vuillemot, andChristian Wolf (2021c). “How Transferable are Reasoning Patterns in VQA?”. In: Proceedingsof the IEEE/CVF Conference on Computer Vision and Pattern Recognition (CVPR);
74
C h a p t e r
6
I N V E S T I G AT I N G AT T E N T I O N I N T R A N S F O R M E R S
6.1 introduction
Attention is at the heart of the VL-Transformer architecture (cf. Section 3.5 in Chapter 3).While conceptually simple, it makes possible learning very complex relationships betweeninput items. Making sense of the learned attention and verifying its inner workings is adifficult problem, which is addressed by VisQA. More precisely, VisQA is an instance-based visual analytic tool designed to help domain experts investigate how informationflows in a VL-Transformer architecture and how the model relates different items ofinterest to each other in vision and language reasoning. In this chapter, we propose to useVisQA in order to elucidate if the so-called attention is informative enough to provide insightson the emergence of reasoning or bias exploitation in the context of VQA.
For this purpose, we explore the different attention maps, represented as heatmaps,generated by the VL-Transformer for a given question-image pair. The exploration isguided by color codes that convey the intensity of each attention head, i.e. whether theyfocus attention narrowly on specific items, or broadly over the full input set. Complemen-tary dataset-wide statistics are provided for each selected attention head, either globally,or with respect to specific task functions, e.g. “What is”, “Where is“, “What color” etc. (thisaspect will be discussed in more detail in Chapter 7). While VisQA is post-hoc, it is alsointeractive and allows certain modifications to the internal structure of the model. At anytime, attention maps can be pruned to observe their impact on the output answer.
In a first part, we motivate the need of an attention visualization in a detailed casestudy. We show that VisQA improves the interpretability of the VL-Tranformer and helpsto better understand the reason of its failure. In a second part, we ask different expertsin deep learning, who were not involved in the project nor its design, to evaluate thefeasibility of using attention analysis to identify bias exploitation and reasoning in themodel. We answer positively, and report experiments with qualitative interviews andresults in Section 6.4.
This chapter results from a collaboration with visual analytics experts. The scopeof this thesis is the study of bias vs reasoning in VQA and not data visualization itself,hence we let the reader refer to our associated paper (Jaunet et al. 2021) to get all thedetails on the design of VisQA. However, we encourage the reader to watch the short
75
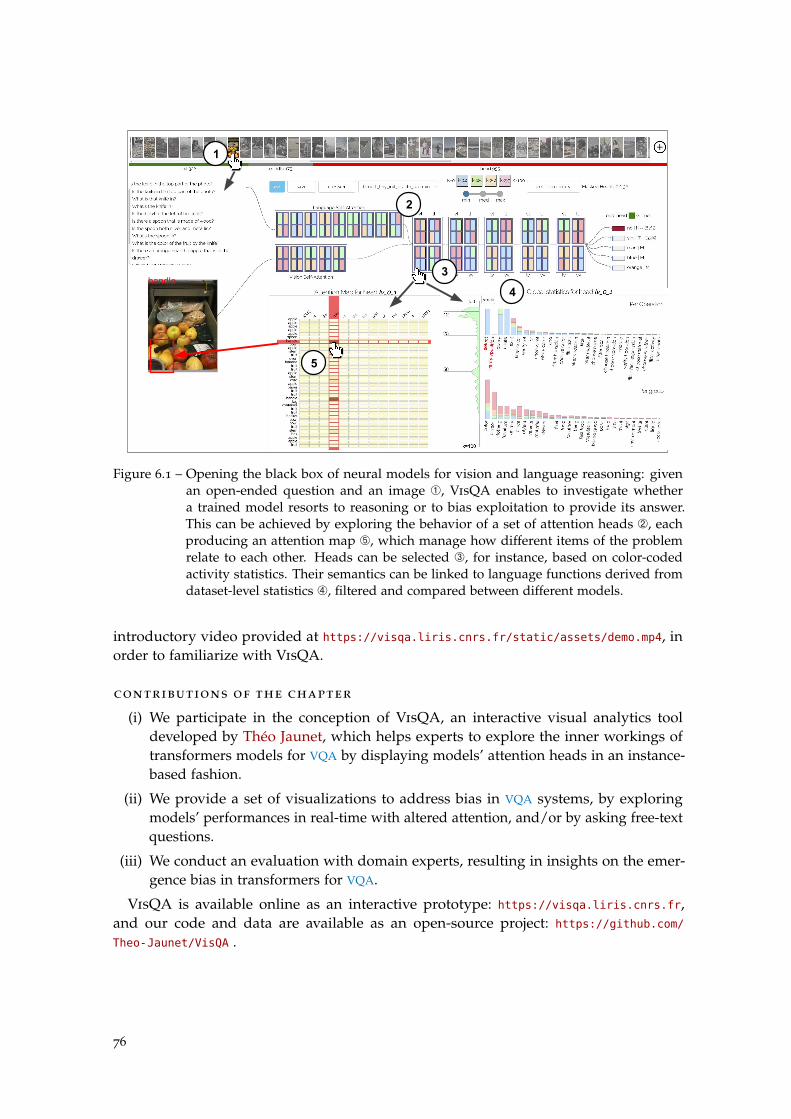
1
2
3
5
4handle
Figure 6.1 – Opening the black box of neural models for vision and language reasoning: givenan open-ended question and an image À, VisQA enables to investigate whethera trained model resorts to reasoning or to bias exploitation to provide its answer.This can be achieved by exploring the behavior of a set of attention heads Á, eachproducing an attention map Ä, which manage how different items of the problemrelate to each other. Heads can be selected Â, for instance, based on color-codedactivity statistics. Their semantics can be linked to language functions derived fromdataset-level statistics Ã, filtered and compared between different models.
introductory video provided at https://visqa.liris.cnrs.fr/static/assets/demo.mp4, inorder to familiarize with VisQA.
contributions of the chapter
(i) We participate in the conception of VisQA, an interactive visual analytics tooldeveloped by Théo Jaunet, which helps experts to explore the inner workings oftransformers models for VQA by displaying models’ attention heads in an instance-based fashion.
(ii) We provide a set of visualizations to address bias in VQA systems, by exploringmodels’ performances in real-time with altered attention, and/or by asking free-textquestions.
(iii) We conduct an evaluation with domain experts, resulting in insights on the emer-gence bias in transformers for VQA.
VisQA is available online as an interactive prototype: https://visqa.liris.cnrs.fr,and our code and data are available as an open-source project: https://github.com/
Theo-Jaunet/VisQA .
76
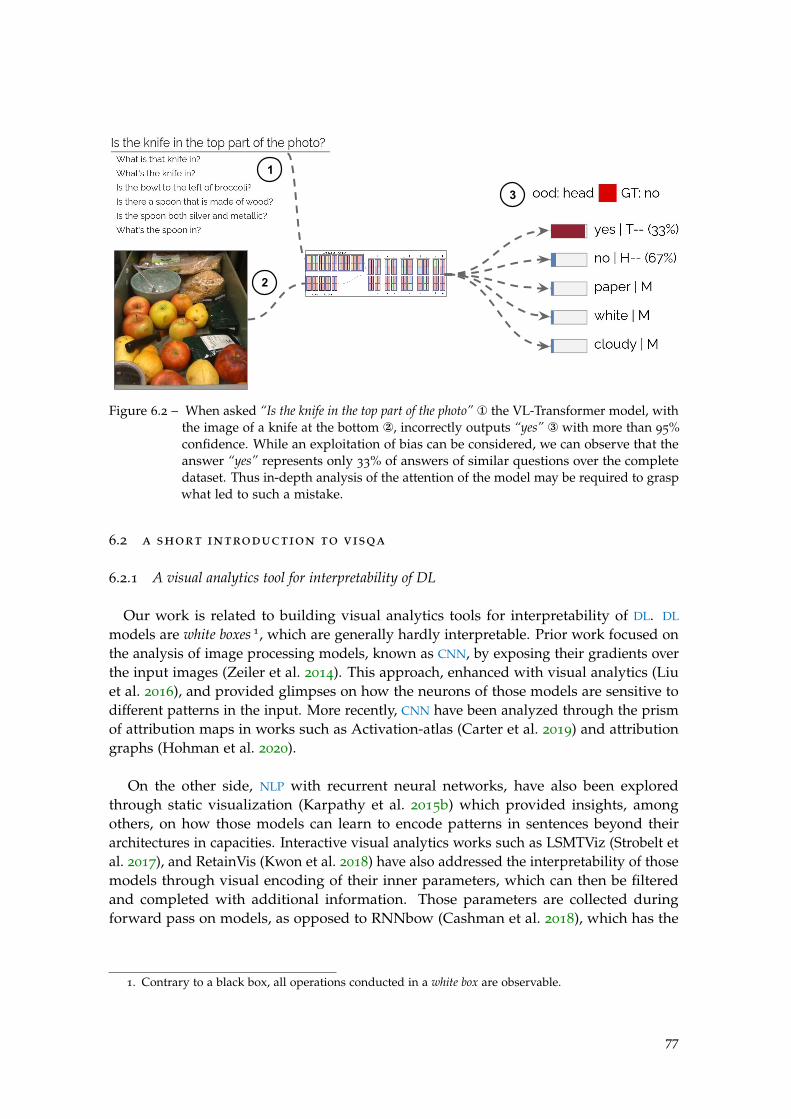
1
23
2
3
1
2
1
Figure 6.2 – When asked “Is the knife in the top part of the photo” ¬ the VL-Transformer model, withthe image of a knife at the bottom , incorrectly outputs “yes” ® with more than 95%confidence. While an exploitation of bias can be considered, we can observe that theanswer “yes” represents only 33% of answers of similar questions over the completedataset. Thus in-depth analysis of the attention of the model may be required to graspwhat led to such a mistake.
6.2 a short introduction to visqa
6.2.1 A visual analytics tool for interpretability of DL
Our work is related to building visual analytics tools for interpretability of DL. DL
models are white boxes 1, which are generally hardly interpretable. Prior work focused onthe analysis of image processing models, known as CNN, by exposing their gradients overthe input images (Zeiler et al. 2014). This approach, enhanced with visual analytics (Liuet al. 2016), and provided glimpses on how the neurons of those models are sensitive todifferent patterns in the input. More recently, CNN have been analyzed through the prismof attribution maps in works such as Activation-atlas (Carter et al. 2019) and attributiongraphs (Hohman et al. 2020).
On the other side, NLP with recurrent neural networks, have also been exploredthrough static visualization (Karpathy et al. 2015b) which provided insights, amongothers, on how those models can learn to encode patterns in sentences beyond theirarchitectures in capacities. Interactive visual analytics works such as LSMTViz (Strobelt etal. 2017), and RetainVis (Kwon et al. 2018) have also addressed the interpretability of thosemodels through visual encoding of their inner parameters, which can then be filteredand completed with additional information. Those parameters are collected duringforward pass on models, as opposed to RNNbow (Cashman et al. 2018), which has the
1. Contrary to a black box, all operations conducted in a white box are observable.
77
particularity to focus on visualizing gradients of those models through back-propagationduring training.
More recently, models with attention (Vaswani et al. 2017) increasingly gained pop-ularity due to their improvement of state-of-the-art performance, and their attentionmechanisms which may be more interpretable than CNN and RNNs. The interpretabilityof attention models similar to the transformer models used in this work, initially designedfor NLP, has also been addressed by visual analytics contributions. Commonly, in workssuch as (Strobelt et al. 2018; Olah et al. 2016; Vig 2019b), the attention of those modelsis presented, in instance-based (Hohman et al. 2019) interfaces as graphs with bipartiteconnections that can be inspected to grasp how input words are associated with eachother. Attention Flows (DeRose et al. 2020) addresses the influence of BERT pre-trainingon model predictions by comparing two transformers models applied to NLP. Similar toVisQA, such a tool displays an overview of each attention head with a color encodingtheir activity. Those methods are specific to NLP tasks. In this work, we address thechallenges provided by the bi-modality of vision and language reasoning, and expand theinterpretability of VQA systems which can rely on visual cues or dataset biases. Currentpractices of VQA visualization include attention heatmaps of selected VL heads based ontheir activation (Li et al. 2020a) to highlight word/key-object associations, global overviewheatmaps of attention heatmaps towards a specific token (Cao et al. 2020), and guidedbackpropagation (Goyal et al. 2016) to highlight the most relevant words in questions.Following those works, VisQA provides a visualization of every head’s attention heatmapsand word/object associations, along with an overview of their activations.
This work is complementary with an alternative direction of work, proposing toincrease the interpretability through explanation generation. Thus, Hendricks et al. (2016)and Park et al. (2018) directly supervise their model to generate an explanation in additionto the task-related answer, resulting in an explainable vision-and-language model. Beside,we also propose a complementary approach to Manjunatha et al. (2019), which run rulemining algorithms to explicitly discover VQA shortcuts.
6.2.2 A tool for investigating hypothesis on bias vs reasoning
VisQA have been designed to investigate hypotheses on the presence of bias vs rea-soning in a VL-Transformer based VQA model (we let the reader refer to Section 3.5 fora detailed review of the aforementioned architecture). In particular, VisQA focuses onattention maps, which are a key feature of transformer-based neural models, as they fullydetermine relationships between input items. We recommend the reader referring toJaunet et al. (2021) to familiarize itself with VisQA, or watching the short introductoryvideo available at https://visqa.liris.cnrs.fr/static/assets/demo.mp4. We neverthelessbriefly recall its main features.
free-form questions By default, VisQA loads the GQA dataset to provide imagesand questions. But at any time, we can type and ask free-form open-ended questions.Such an interaction allows investigating the model’s bias exploitation. For instance, when
78
asked the following question from the GQA dataset “Is this a mirror or a sofa”, the modelcorrectly outputs “mirror”. However, when asked the following question “Is there a mirrorin this image?”, the model fails and outputs “no”. This suggests that the model might haveexploited biases when it answered the first question, which is supported by the fact thatin the GQA dataset, “mirror” is the correct answer to the question “Is this a mirror or a sofa”in 85% of all cases.
visual summary VisQA allows us to explore the attention maps generated by theVL-Transformer attention heads for a given question-image pair. In order to scope withthe relatively high dimension of attentions maps, making them hardly interpretable ina reasonable amount of time, we rely on summarizing each of them to a single scalar.Such a scalar, referred to as k-number (Ramsauer et al. 2020), represents the normalizedamount of tokens per row summed up to reach a threshold of 90% of energy. A k-numberclose to 0 indicates that the corresponding row has peaky attention focusing on only onecolumn (as seen in Figure 6.3 ¬), and a high k-number encodes a uniform attention (asin Figure 6.3 ). Then we combine each of those k-number together using either min,median, or max functions. Such functions can be selected in VisQA, depending on theattention maps intensity they want to investigate. VisQA provides this interaction becausefor a head to have a low k-number, the majority of its rows needs to be highly activated.This can shadow attention maps with less than half of their rows with peaky attention.In VisQA, the k-number is discretized and color encoded in 4 categories as it follows:
. In addition, for each head, we provide global (i.e. dataset-level) statisticswhich will be the subject of the next Chapter 7.
head interactions VisQA let the possibility to dynamically interact with the model.More precisely, it makes possible to filter and prune attention head. By clicking on arow, column, or cell, we can filter attention heads to only keep the ones in which thecorresponding clicked element has attention above a threshold. This facilitates seeking forheads in which a specific association is expected e.g. a word in the question with an objectof the image required to answer. It is also possible to prune selected attention heads.Pruning here means that the attention head does not perform any focused attention, butuniformly distributes attention over the full set of items (objects or words). Each row of apruned attention map is thus the equivalent of an average calculation. This can be used inorder to test hypotheses on attention head interpretations, as explored in Section 6.4. Thebenefit of such pruning is that it preserves the amount of energy in the head, at contraryto an alternative approach where the attention head output is simply zeroed.
setup VisQA is based on the VL-Transformer architecture described in Chapter 3. Weuse the compact version, with an embedding size equals to d=128 and a number of headsper-layers set to h=4. As a recall, in addition to the VQA objective, we train the modelparameters also on MS-COCO (Lin et al. 2014) and Visual-Genome (Krishna et al. 2017)images following the semi-supervised BERT (Devlin et al. 2019)-like strategy introducedin (Tan et al. 2019). In particular, the model is trained to perform simple tasks such asrecognizing masked words and visual objects, or predicting if a given sentence matches
79
the question. After pre-training on these auxiliary tasks, the model is fine-tuned on theGQA (Hudson et al. 2019b) dataset with the VQA objective.
6.3 motivating case study
We illustrate the advantages and the power of instance-level visualizations with VisQAon the following case study. It is based on the following input instance, i.e. the imagegiven in Figure 6.2(), and associated question “Is the knife in the top part of this photo?” ¬.The correct ground truth answer is of course “No”, but the model incorrectly answers“Yes” ®. We see the frequency of the different possible answers provided in the interface,and observe that the wrong answer “Yes” is not the most frequent one for this kind ofquestion as “No” is the correct answer 67% of the time, which does not provide evidencefor bias exploitation. The objective is to use VisQA to dive deeper into the inner workingsof the model.
A first step is to analyze whether the model is provided with all necessary information.While the input image itself does contain all the information required to find the answer,the neural transformer model reasons over a list of objects detected by a first objectdetection and recognition module – Faster R-CNN (Ren et al. 2015) –, the outputs ofwhich may be erroneous.
is the knife detected by the vision module? VisQA provides access to thebounding boxes of the objects detected by the input pipeline. Each bounding box can bedisplayed superimposed over the input image along with the corresponding object labelpredicted by the object recognition module. We can observe that the key object “knife”lacks a suitable bounding box or class label, it has not been detected. Since this objectis required to answer the question for this image, the model cannot predict a coherentanswer. However, the question remains why the wrong answer is “yes”, corresponding tothe presence of a knife.
can attention maps provide cues for reasoning? For the example above, weare interested in checking the correspondence between the question word “knife” and theset of bounding boxes, which should provide us with evidence whether the model wascapable of associating the concept with the visual object in the scene, which is, of course,not sufficient for correctly answering, but a necessary step. This verification is non-trivial,however, since the model is free to perform this operation in any of the inter-modalitylayers and heads. VisQA allows to select the different heads, and we could observe thatnone of the heads provides a correct association. As an example, we can see the behaviorof a head in Figure 6.3 ¬, which associates the word “knife” to various objects, mostlyfruits. No other head is found, indicating a more promising relationship.
is computer vision the bottleneck? From the example above, as well as similarobservations in other instances, we conjecture that the computer vision input pipeline(notably, the imperfect object detector) is one of the main bottlenecks in preventingcorrect reasoning. To validate this hypothesis, we explored training an Oracle model
80
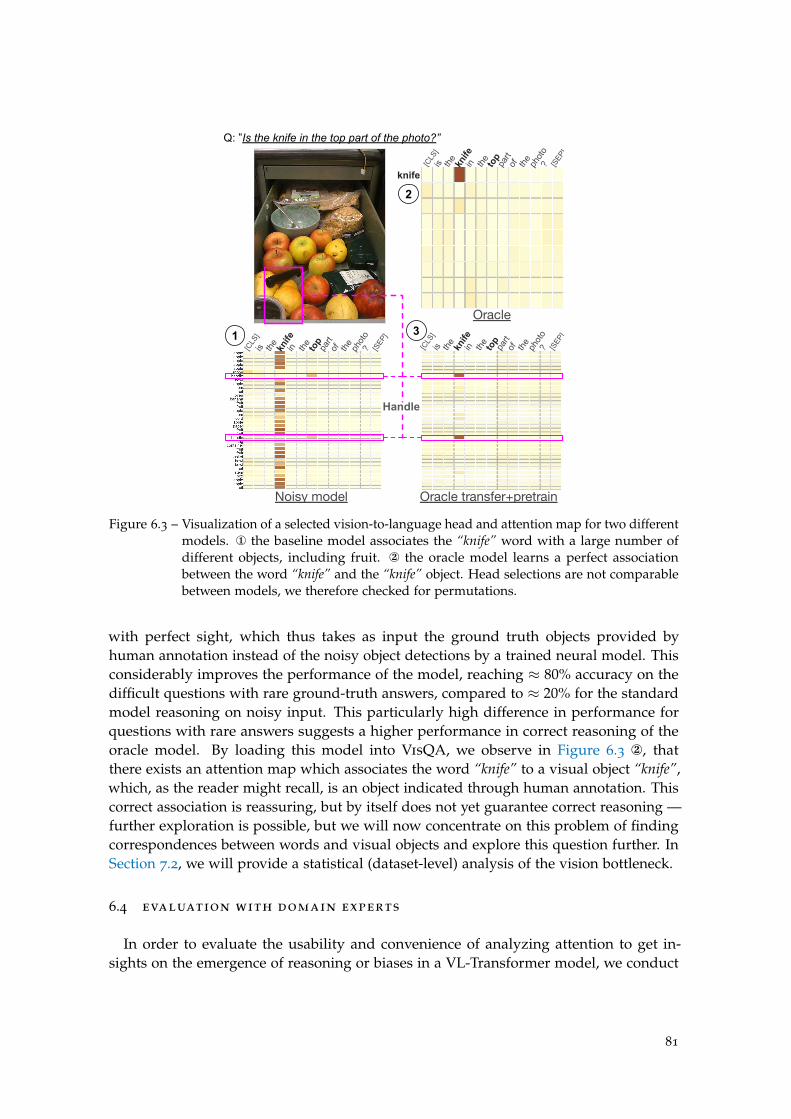
Noisy model
in
Handle
Oracle transfer+pretrain
Q: ”Is the knife in the top part of the photo?”
Oracle
knife
istheknife
inthetoppart
ofthe
photo?
[SEP]
[CLS]is
theknife
inthetop
partofthe
photo
?[SEP]
is[CLS
]
the knife
the top
part
of the
phot
o? [S
EP]
is[CLS
]th
e knife
in the top
part
of the
phot
o? [S
EP]
is[CLS
]th
e knife
in the top
part
of the
phot
o? [S
EP]
knife
22
3
1 3
Figure 6.3 – Visualization of a selected vision-to-language head and attention map for two differentmodels. ¬ the baseline model associates the “knife” word with a large number ofdifferent objects, including fruit. the oracle model learns a perfect associationbetween the word “knife” and the “knife” object. Head selections are not comparablebetween models, we therefore checked for permutations.
with perfect sight, which thus takes as input the ground truth objects provided byhuman annotation instead of the noisy object detections by a trained neural model. Thisconsiderably improves the performance of the model, reaching ≈ 80% accuracy on thedifficult questions with rare ground-truth answers, compared to ≈ 20% for the standardmodel reasoning on noisy input. This particularly high difference in performance forquestions with rare answers suggests a higher performance in correct reasoning of theoracle model. By loading this model into VisQA, we observe in Figure 6.3 , thatthere exists an attention map which associates the word “knife” to a visual object “knife”,which, as the reader might recall, is an object indicated through human annotation. Thiscorrect association is reassuring, but by itself does not yet guarantee correct reasoning —further exploration is possible, but we will now concentrate on this problem of findingcorrespondences between words and visual objects and explore this question further. InSection 7.2, we will provide a statistical (dataset-level) analysis of the vision bottleneck.
6.4 evaluation with domain experts
In order to evaluate the usability and convenience of analyzing attention to get in-sights on the emergence of reasoning or biases in a VL-Transformer model, we conduct
81
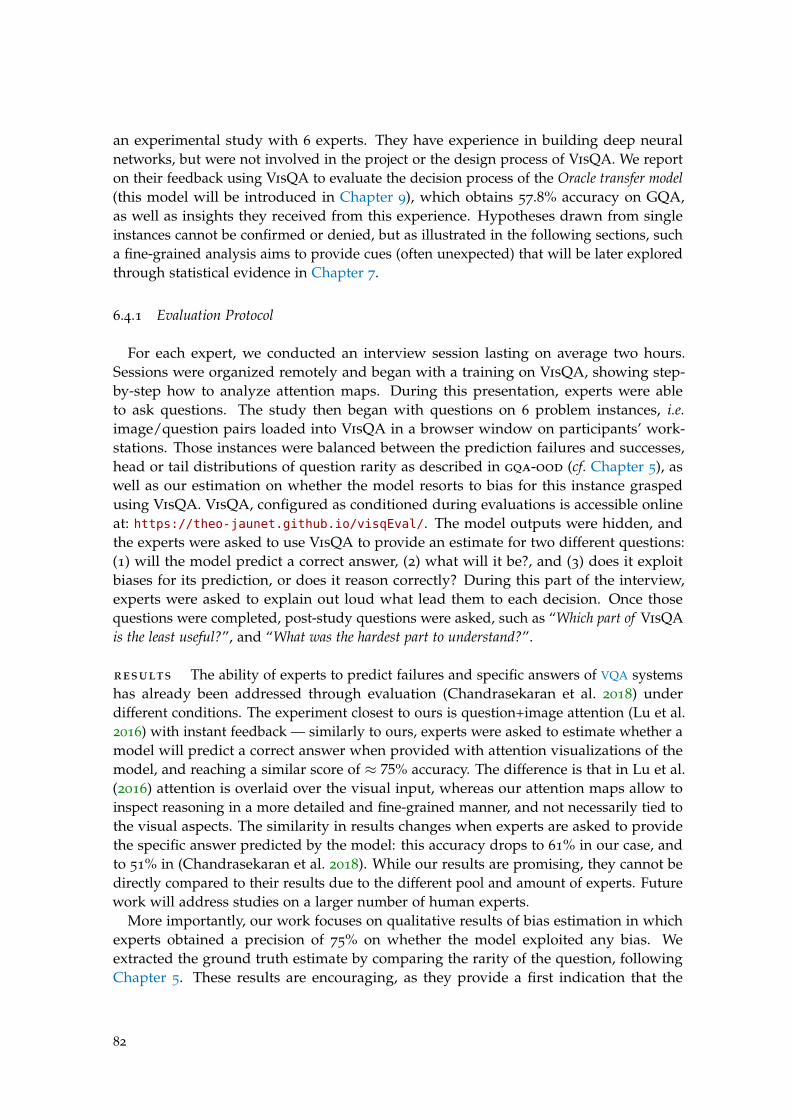
an experimental study with 6 experts. They have experience in building deep neuralnetworks, but were not involved in the project or the design process of VisQA. We reporton their feedback using VisQA to evaluate the decision process of the Oracle transfer model(this model will be introduced in Chapter 9), which obtains 57.8% accuracy on GQA,as well as insights they received from this experience. Hypotheses drawn from singleinstances cannot be confirmed or denied, but as illustrated in the following sections, sucha fine-grained analysis aims to provide cues (often unexpected) that will be later exploredthrough statistical evidence in Chapter 7.
6.4.1 Evaluation Protocol
For each expert, we conducted an interview session lasting on average two hours.Sessions were organized remotely and began with a training on VisQA, showing step-by-step how to analyze attention maps. During this presentation, experts were ableto ask questions. The study then began with questions on 6 problem instances, i.e.image/question pairs loaded into VisQA in a browser window on participants’ work-stations. Those instances were balanced between the prediction failures and successes,head or tail distributions of question rarity as described in gqa-ood (cf. Chapter 5), aswell as our estimation on whether the model resorts to bias for this instance graspedusing VisQA. VisQA, configured as conditioned during evaluations is accessible onlineat: https://theo-jaunet.github.io/visqEval/. The model outputs were hidden, andthe experts were asked to use VisQA to provide an estimate for two different questions:(1) will the model predict a correct answer, (2) what will it be?, and (3) does it exploitbiases for its prediction, or does it reason correctly? During this part of the interview,experts were asked to explain out loud what lead them to each decision. Once thosequestions were completed, post-study questions were asked, such as “Which part of VisQAis the least useful?”, and “What was the hardest part to understand?”.
results The ability of experts to predict failures and specific answers of VQA systemshas already been addressed through evaluation (Chandrasekaran et al. 2018) underdifferent conditions. The experiment closest to ours is question+image attention (Lu et al.2016) with instant feedback — similarly to ours, experts were asked to estimate whether amodel will predict a correct answer when provided with attention visualizations of themodel, and reaching a similar score of ≈ 75% accuracy. The difference is that in Lu et al.(2016) attention is overlaid over the visual input, whereas our attention maps allow toinspect reasoning in a more detailed and fine-grained manner, and not necessarily tied tothe visual aspects. The similarity in results changes when experts are asked to providethe specific answer predicted by the model: this accuracy drops to 61% in our case, andto 51% in (Chandrasekaran et al. 2018). While our results are promising, they cannot bedirectly compared to their results due to the different pool and amount of experts. Futurework will address studies on a larger number of human experts.
More importantly, our work focuses on qualitative results of bias estimation in whichexperts obtained a precision of 75% on whether the model exploited any bias. Weextracted the ground truth estimate by comparing the rarity of the question, followingChapter 5. These results are encouraging, as they provide a first indication that the
82
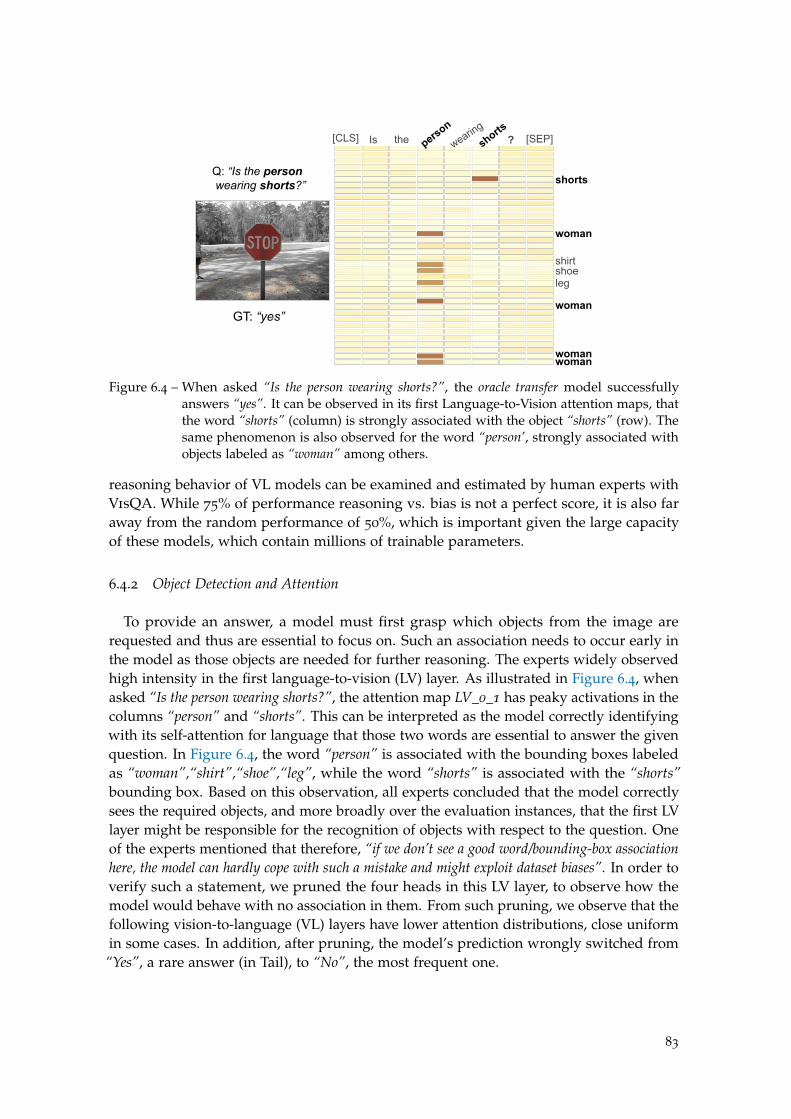
Q: “Is the person wearing shorts?”
GT: “yes”
Is the[CLS] perso
n? [SEP]we
aringshorts
shorts
woman
shirtshoeleg
woman
womanwoman
Figure 6.4 – When asked “Is the person wearing shorts?”, the oracle transfer model successfullyanswers “yes”. It can be observed in its first Language-to-Vision attention maps, thatthe word “shorts” (column) is strongly associated with the object “shorts” (row). Thesame phenomenon is also observed for the word “person’, strongly associated withobjects labeled as “woman” among others.
reasoning behavior of VL models can be examined and estimated by human experts withVisQA. While 75% of performance reasoning vs. bias is not a perfect score, it is also faraway from the random performance of 50%, which is important given the large capacityof these models, which contain millions of trainable parameters.
6.4.2 Object Detection and Attention
To provide an answer, a model must first grasp which objects from the image arerequested and thus are essential to focus on. Such an association needs to occur early inthe model as those objects are needed for further reasoning. The experts widely observedhigh intensity in the first language-to-vision (LV) layer. As illustrated in Figure 6.4, whenasked “Is the person wearing shorts?”, the attention map LV_0_1 has peaky activations in thecolumns “person” and “shorts”. This can be interpreted as the model correctly identifyingwith its self-attention for language that those two words are essential to answer the givenquestion. In Figure 6.4, the word “person” is associated with the bounding boxes labeledas “woman”,“shirt”,“shoe”,“leg”, while the word “shorts” is associated with the “shorts”bounding box. Based on this observation, all experts concluded that the model correctlysees the required objects, and more broadly over the evaluation instances, that the first LVlayer might be responsible for the recognition of objects with respect to the question. Oneof the experts mentioned that therefore, “if we don’t see a good word/bounding-box associationhere, the model can hardly cope with such a mistake and might exploit dataset biases”. In order toverify such a statement, we pruned the four heads in this LV layer, to observe how themodel would behave with no association in them. From such pruning, we observe that thefollowing vision-to-language (VL) layers have lower attention distributions, close uniformin some cases. In addition, after pruning, the model’s prediction wrongly switched from“Yes”, a rare answer (in Tail), to “No”, the most frequent one.
83
GT: “no” KNIVES
Pizza
Pizza
KNIVES
Q: “Are there both knives and pizzas in this image?”
“both”
1
2
“and”
Figure 6.5 – When asked “Are there both knives and pizzas in this image?”, the oracle transfer modelfails and answers “yes”. By filtering heads associated with a selected word, we canobserve that language self-attention heads are more responsive to the word “both” ¬,as opposed to the word “and” .
6.4.3 Questions with Logical Operators
During the evaluation, experts were shown two instances with questions containing theword “and”. Such instances are interesting because, as one of the experts mentioned, “thisword has a lot of importance is this question”. To answer correctly, the model needs to graspthat it must analyze the image over two different aspects. With the image, illustratedin Figure 6.5, and asked “Are there both knives and pizzas in this image?”, the model failsand answer “yes”, the most frequent answer despite having no knife in the picture norprovided bounding-boxes. However, when asked “Are there knives in this image?” themodel correctly answers “no”. This suggests that the model failed to grasp the meaningof the keyword “and”, and thus that the self-attention language heads might associatewrong words. Also, swapping the terms “knives” and “pizzas” in the question, yieldsthe correct answer, i.e. “no”. This may indicate that the model ignores the first termwhen questions contain the operator “and”. Using the head-filtering interaction, we canobserve that in attention heads, the word “and” has little to no attention. Instead, theword “both” has peaky attention scattered across most of self-language layers, and somelanguage-to-language heads. Pruning those 19 heads makes the model correctly yield“no”, regardless of the order the words “knives” and “pizzas” are in the question. Such abehavior can be observed over our evaluation dataset, in which 34 questions have thekeyword “and”. On those questions the model, without pruning, can provide a correctanswer 62% of cases, up to 64% with the two words around “and” are swapped. Inopposition, while having the 19 attention-heads with peaky attention for the word “both”pruned, the model reached an accuracy of 76%, down to 74% with words around “and”swapped. In the worst case, this pruning of the 19 attention heads illustrated in Figure 6.5is responsible for an improvement of 10% on question contain the operator “and”.
6.4.4 Vision to Vision Contextualization
When asked “What is the woman holding?”, with the image in Figure 6.6, the model failsand outputs “remote-control”, a frequent answer, instead of “hair dryer”. This could beinterpreted as bias exploitation. However, in such a dataset, “remote-control” is not among
84
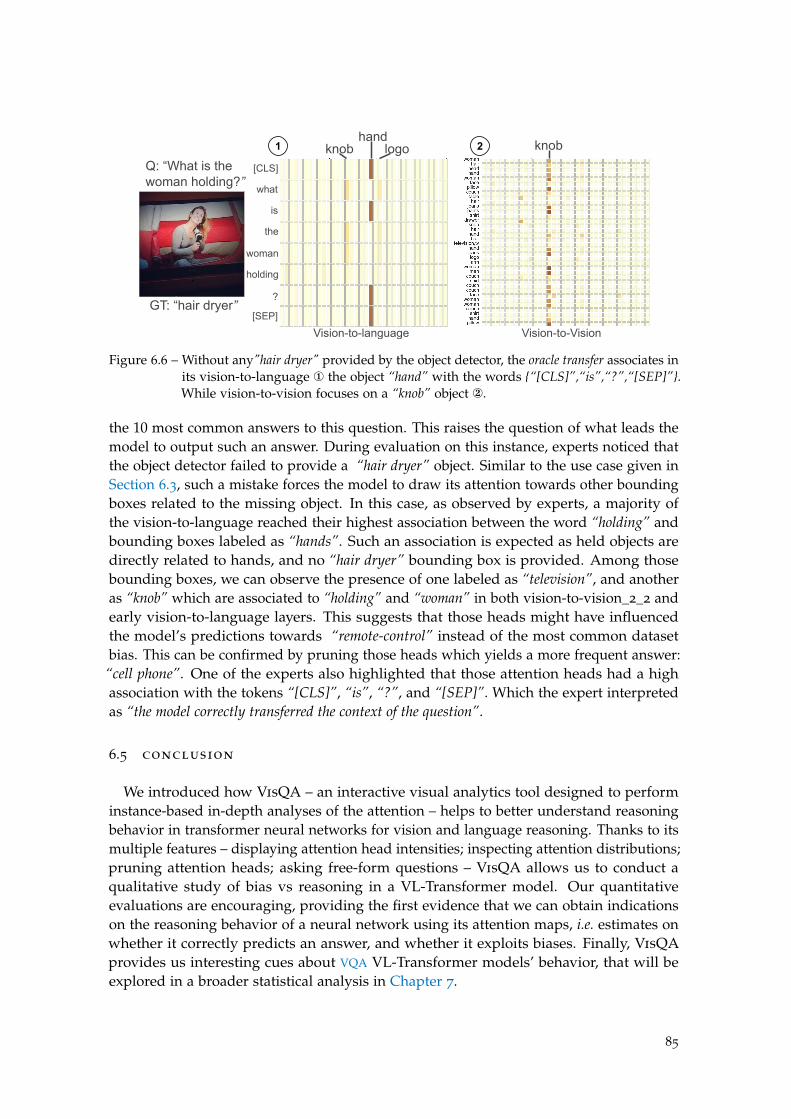
Q: “What is the woman holding?”
GT: “hair dryer”[SEP]
?
[CLS]
what
is
the
woman
holding
handlogoknob knob1 2
Vision-to-language Vision-to-Vision
Figure 6.6 – Without any"hair dryer" provided by the object detector, the oracle transfer associates inits vision-to-language ¬ the object “hand” with the words {“[CLS]”,“is”,“?”,“[SEP]”}.While vision-to-vision focuses on a “knob” object .
the 10 most common answers to this question. This raises the question of what leads themodel to output such an answer. During evaluation on this instance, experts noticed thatthe object detector failed to provide a “hair dryer” object. Similar to the use case given inSection 6.3, such a mistake forces the model to draw its attention towards other boundingboxes related to the missing object. In this case, as observed by experts, a majority ofthe vision-to-language reached their highest association between the word “holding” andbounding boxes labeled as “hands”. Such an association is expected as held objects aredirectly related to hands, and no “hair dryer” bounding box is provided. Among thosebounding boxes, we can observe the presence of one labeled as “television”, and anotheras “knob” which are associated to “holding” and “woman” in both vision-to-vision_2_2 andearly vision-to-language layers. This suggests that those heads might have influencedthe model’s predictions towards “remote-control” instead of the most common datasetbias. This can be confirmed by pruning those heads which yields a more frequent answer:“cell phone”. One of the experts also highlighted that those attention heads had a highassociation with the tokens “[CLS]”, “is”, “?”, and “[SEP]”. Which the expert interpretedas “the model correctly transferred the context of the question”.
6.5 conclusion
We introduced how VisQA – an interactive visual analytics tool designed to performinstance-based in-depth analyses of the attention – helps to better understand reasoningbehavior in transformer neural networks for vision and language reasoning. Thanks to itsmultiple features – displaying attention head intensities; inspecting attention distributions;pruning attention heads; asking free-form questions – VisQA allows us to conduct aqualitative study of bias vs reasoning in a VL-Transformer model. Our quantitativeevaluations are encouraging, providing the first evidence that we can obtain indicationson the reasoning behavior of a neural network using its attention maps, i.e. estimates onwhether it correctly predicts an answer, and whether it exploits biases. Finally, VisQAprovides us interesting cues about VQA VL-Transformer models’ behavior, that will beexplored in a broader statistical analysis in Chapter 7.
85

C h a p t e r 7
O N T H E E M E R G E N C E O F R E A S O N I N G PAT T E R N S I N V Q A
7.1 introduction
In this chapter, we continue to study the capabilities of VQA models to “reason”. Asa recall, while an exact definition of this term is difficult, we refer to (Bottou 2014) anddefine it as “algebraically manipulating words and visual objects to answer a new question” (cf.Chapter 2). In particular, we interpret reasoning as the opposite of exploiting spuriousbiases in training data. We argue, and will provide evidence, that learning to algebraicallymanipulate words and objects is difficult when visual input is noisy and uncertaincompared to learning from perfect information about a scene. When objects are frequentlymissing, detected multiple times or recognized with ambiguous visual embeddingswrongly overlapping with different categories, relying on statistical shortcuts may be asimple and tempting alternative for the optimizer.
In Chapter 6, we introduced VisQA, a tool designed to help researchers analyzing thereasoning and biases at work in Transformer based VQA models. This interactive toolprovides a fine-grained understanding of the reasoning and bias mechanisms learned bythe model. However, this study is limited to be at instance level. This is at the same timea benefit and a drawback. A benefit, as it lets the user inspect attention layers withoutalteration due to statistical aggregations. Thus, it provides cues and intuitions on whathas been learned by the VQA model. At the same time, instance level visualization is notsufficient to discover how the model behaves at a dataset level. Therefore, in this chapter,we conduct a complementary analysis, focusing on a large scale statistical analysis of theattention mechanisms learned by the same VL-Transformer VQA model.
More precisely, drawing conclusion from Chapter 6, we propose an in-depth analysisof attention mechanisms in Transformer-based models and provide indications of thepatterns of reasoning employed by models of different strengths. We visualize differentoperating modes of attention and link them to different sub tasks (“functions”) requiredfor solving VQA. In particular, we use this analysis for a comparison between perfect-sighted (oracle) models and standard models processing noisy and uncertain visual input,highlighting the presence of reasoning patterns in the former and less so in the latter.Indeed, we show that a perfect-sighted oracle model learns to predict answers whilesignificantly less relying on biases in training data. Therefore, we claim that once thenoise has been removed from visual input, replacing object detection output by Ground
87
Truth (GT) object annotations, a deep neural network can more easily learn the reasoningpatterns required for prediction and for generalization.
In addition to improving our understanding of VL-Transformer decisions, this largescale analysis will serve as a basis for enhancing VQA training methods. In particular,we will explore a method for transferring the reasoning patterns learned by the oracle(trained with GT visual input) to the standard settings where visual inputs are extractedusing an (imperfect) object detector (cf. Chapter 9).
contributions of the chapter
(i) A study of the visual bottleneck in VQA, i.e. we explore how the visual uncertainty(caused by imperfect object detectors) affects VQA performance.
(ii) An in-depth analysis of reasoning patterns at work in Transformer-based models,including: (a) visualizations of attention modes; (b) an analysis of the relationshipsbetween attention modes and reasoning; and (c) an exploration of the impact ofattention pruning on reasoning.
(iii) A comparison of oracle vs. noisy (standard) models, where we show that the formermore easily learns reasoning patterns.
7.2 vision is the bottleneck
VisQA study made us wonder: is computer vision the bottleneck? We conjecture thatdifficulties in the computer vision pipeline are the main cause preventing VQA modelsfrom learning to reason well, and which leads them to exploit spurious biases in trainingdata. Most of these methods use pre-trained off-the-shelf object detectors during trainingand evaluation steps. But in a significant number of cases, the visual objects necessary forreasoning are misclassified, or even not detected at all, as indicated by detection rates ofSOTA detectors on the Visual Genome dataset (Krishna et al. 2017), for instance. In thatcontext, Under these circumstances, even a perfect VQA model is unable to predict correctanswers without relying on statistical shortcuts. In the context of a collaboration withPierre Marza, we propose two experiences shedding light on the visual bottleneck and itspotential consequences.
object detection quality We evaluate the quality of the objects detected by FasterRCNN (Ren et al. 2015) for the VQA task. In particular, we ask: are important objects (giventhe question) correctly detected by the detector? Therefore, for each question of the gqa-ood
validation split, we measure the proportion of object correctly detected and required foranswering the question. Results are shown in Table 7.1. In our setup, an object is correctlydetected if it sufficiently overlaps (measured with IoU, Intersection over Union) with theground truth. It is worth to notice that it only provide an underestimation of the detectorcapabilities, as we do not consider the predicted label associated to the image region(e.g. in some case, a region can be falsely detected). We observe that the detection is notaccurate enough for VQA, as many important objects are not detected (especially whenthe IoU threshold is set to 0.8).
88
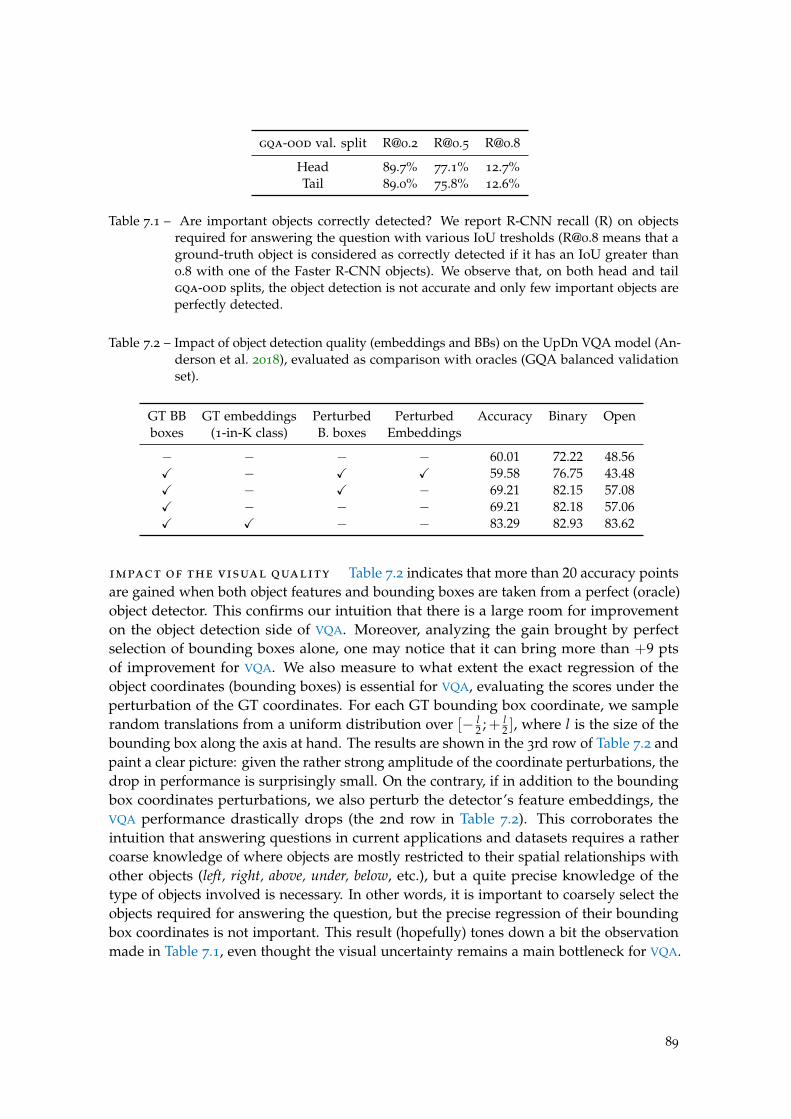
gqa-ood val. split [email protected] [email protected] [email protected]
Head 89.7% 77.1% 12.7%Tail 89.0% 75.8% 12.6%
Table 7.1 – Are important objects correctly detected? We report R-CNN recall (R) on objectsrequired for answering the question with various IoU tresholds ([email protected] means that aground-truth object is considered as correctly detected if it has an IoU greater than0.8 with one of the Faster R-CNN objects). We observe that, on both head and tailgqa-ood splits, the object detection is not accurate and only few important objects areperfectly detected.
Table 7.2 – Impact of object detection quality (embeddings and BBs) on the UpDn VQA model (An-derson et al. 2018), evaluated as comparison with oracles (GQA balanced validationset).
GT BB GT embeddings Perturbed Perturbed Accuracy Binary Openboxes (1-in-K class) B. boxes Embeddings
− − − − 60.01 72.22 48.56X − X X 59.58 76.75 43.48X − X − 69.21 82.15 57.08X − − − 69.21 82.18 57.06X X − − 83.29 82.93 83.62
impact of the visual quality Table 7.2 indicates that more than 20 accuracy pointsare gained when both object features and bounding boxes are taken from a perfect (oracle)object detector. This confirms our intuition that there is a large room for improvementon the object detection side of VQA. Moreover, analyzing the gain brought by perfectselection of bounding boxes alone, one may notice that it can bring more than +9 ptsof improvement for VQA. We also measure to what extent the exact regression of theobject coordinates (bounding boxes) is essential for VQA, evaluating the scores under theperturbation of the GT coordinates. For each GT bounding box coordinate, we samplerandom translations from a uniform distribution over [− l
2 ;+ l2 ], where l is the size of the
bounding box along the axis at hand. The results are shown in the 3rd row of Table 7.2 andpaint a clear picture: given the rather strong amplitude of the coordinate perturbations, thedrop in performance is surprisingly small. On the contrary, if in addition to the boundingbox coordinates perturbations, we also perturb the detector’s feature embeddings, theVQA performance drastically drops (the 2nd row in Table 7.2). This corroborates theintuition that answering questions in current applications and datasets requires a rathercoarse knowledge of where objects are mostly restricted to their spatial relationships withother objects (left, right, above, under, below, etc.), but a quite precise knowledge of thetype of objects involved is necessary. In other words, it is important to coarsely select theobjects required for answering the question, but the precise regression of their boundingbox coordinates is not important. This result (hopefully) tones down a bit the observationmade in Table 7.1, even thought the visual uncertainty remains a main bottleneck for VQA.
89
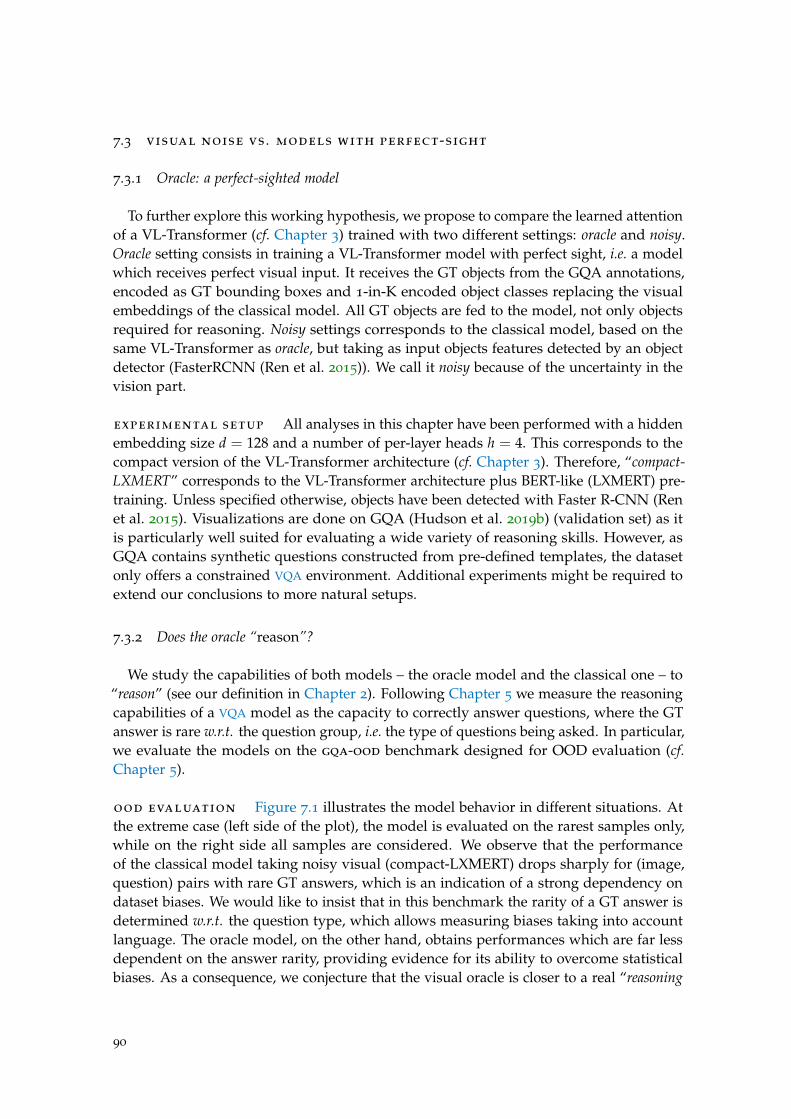
7.3 visual noise vs . models with perfect-sight
7.3.1 Oracle: a perfect-sighted model
To further explore this working hypothesis, we propose to compare the learned attentionof a VL-Transformer (cf. Chapter 3) trained with two different settings: oracle and noisy.Oracle setting consists in training a VL-Transformer model with perfect sight, i.e. a modelwhich receives perfect visual input. It receives the GT objects from the GQA annotations,encoded as GT bounding boxes and 1-in-K encoded object classes replacing the visualembeddings of the classical model. All GT objects are fed to the model, not only objectsrequired for reasoning. Noisy settings corresponds to the classical model, based on thesame VL-Transformer as oracle, but taking as input objects features detected by an objectdetector (FasterRCNN (Ren et al. 2015)). We call it noisy because of the uncertainty in thevision part.
experimental setup All analyses in this chapter have been performed with a hiddenembedding size d = 128 and a number of per-layer heads h = 4. This corresponds to thecompact version of the VL-Transformer architecture (cf. Chapter 3). Therefore, “compact-LXMERT” corresponds to the VL-Transformer architecture plus BERT-like (LXMERT) pre-training. Unless specified otherwise, objects have been detected with Faster R-CNN (Renet al. 2015). Visualizations are done on GQA (Hudson et al. 2019b) (validation set) as itis particularly well suited for evaluating a wide variety of reasoning skills. However, asGQA contains synthetic questions constructed from pre-defined templates, the datasetonly offers a constrained VQA environment. Additional experiments might be required toextend our conclusions to more natural setups.
7.3.2 Does the oracle “reason”?
We study the capabilities of both models – the oracle model and the classical one – to“reason” (see our definition in Chapter 2). Following Chapter 5 we measure the reasoningcapabilities of a VQA model as the capacity to correctly answer questions, where the GTanswer is rare w.r.t. the question group, i.e. the type of questions being asked. In particular,we evaluate the models on the gqa-ood benchmark designed for OOD evaluation (cf.Chapter 5).
ood evaluation Figure 7.1 illustrates the model behavior in different situations. Atthe extreme case (left side of the plot), the model is evaluated on the rarest samples only,while on the right side all samples are considered. We observe that the performanceof the classical model taking noisy visual (compact-LXMERT) drops sharply for (image,question) pairs with rare GT answers, which is an indication of a strong dependency ondataset biases. We would like to insist that in this benchmark the rarity of a GT answer isdetermined w.r.t. the question type, which allows measuring biases taking into accountlanguage. The oracle model, on the other hand, obtains performances which are far lessdependent on the answer rarity, providing evidence for its ability to overcome statisticalbiases. As a consequence, we conjecture that the visual oracle is closer to a real “reasoning
90
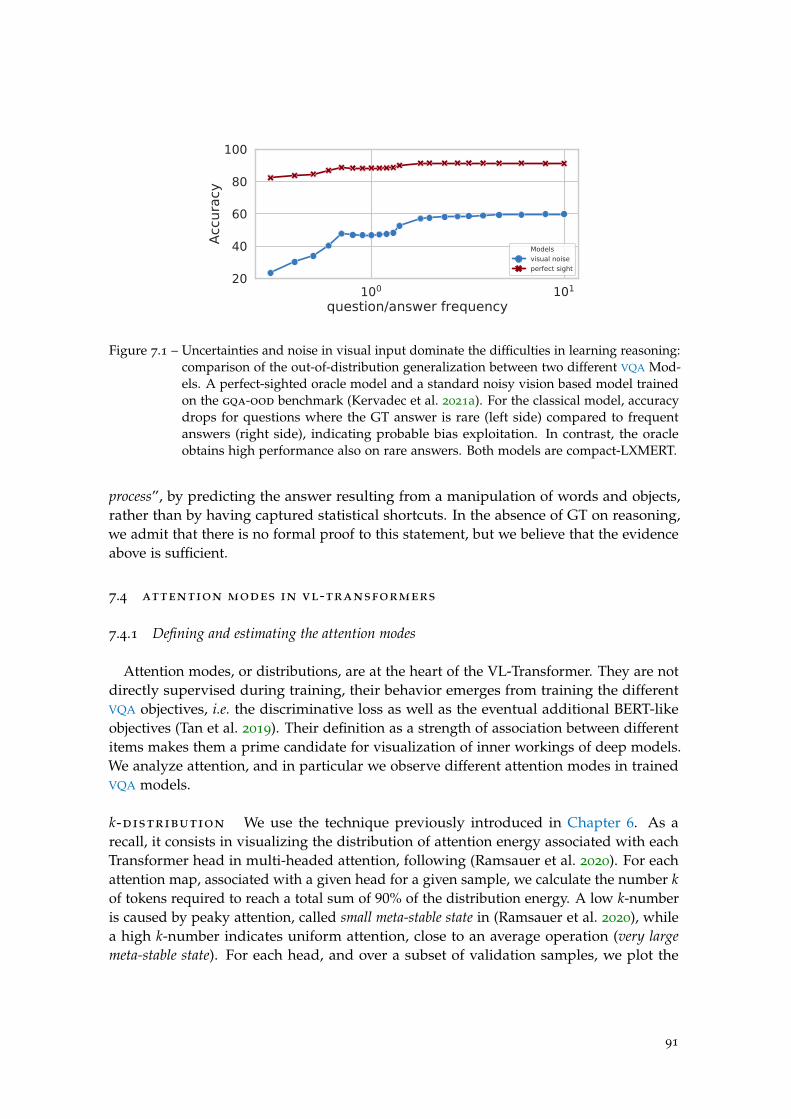
100 101
question/answer frequency20
40
60
80
100
Accu
racy
Modelsvisual noiseperfect sight
Figure 7.1 – Uncertainties and noise in visual input dominate the difficulties in learning reasoning:comparison of the out-of-distribution generalization between two different VQA Mod-els. A perfect-sighted oracle model and a standard noisy vision based model trainedon the gqa-ood benchmark (Kervadec et al. 2021a). For the classical model, accuracydrops for questions where the GT answer is rare (left side) compared to frequentanswers (right side), indicating probable bias exploitation. In contrast, the oracleobtains high performance also on rare answers. Both models are compact-LXMERT.
process”, by predicting the answer resulting from a manipulation of words and objects,rather than by having captured statistical shortcuts. In the absence of GT on reasoning,we admit that there is no formal proof to this statement, but we believe that the evidenceabove is sufficient.
7.4 attention modes in vl-transformers
7.4.1 Defining and estimating the attention modes
Attention modes, or distributions, are at the heart of the VL-Transformer. They are notdirectly supervised during training, their behavior emerges from training the differentVQA objectives, i.e. the discriminative loss as well as the eventual additional BERT-likeobjectives (Tan et al. 2019). Their definition as a strength of association between differentitems makes them a prime candidate for visualization of inner workings of deep models.We analyze attention, and in particular we observe different attention modes in trainedVQA models.
k-distribution We use the technique previously introduced in Chapter 6. As arecall, it consists in visualizing the distribution of attention energy associated with eachTransformer head in multi-headed attention, following (Ramsauer et al. 2020). For eachattention map, associated with a given head for a given sample, we calculate the number kof tokens required to reach a total sum of 90% of the distribution energy. A low k-numberis caused by peaky attention, called small meta-stable state in (Ramsauer et al. 2020), whilea high k-number indicates uniform attention, close to an average operation (very largemeta-stable state). For each head, and over a subset of validation samples, we plot the
91
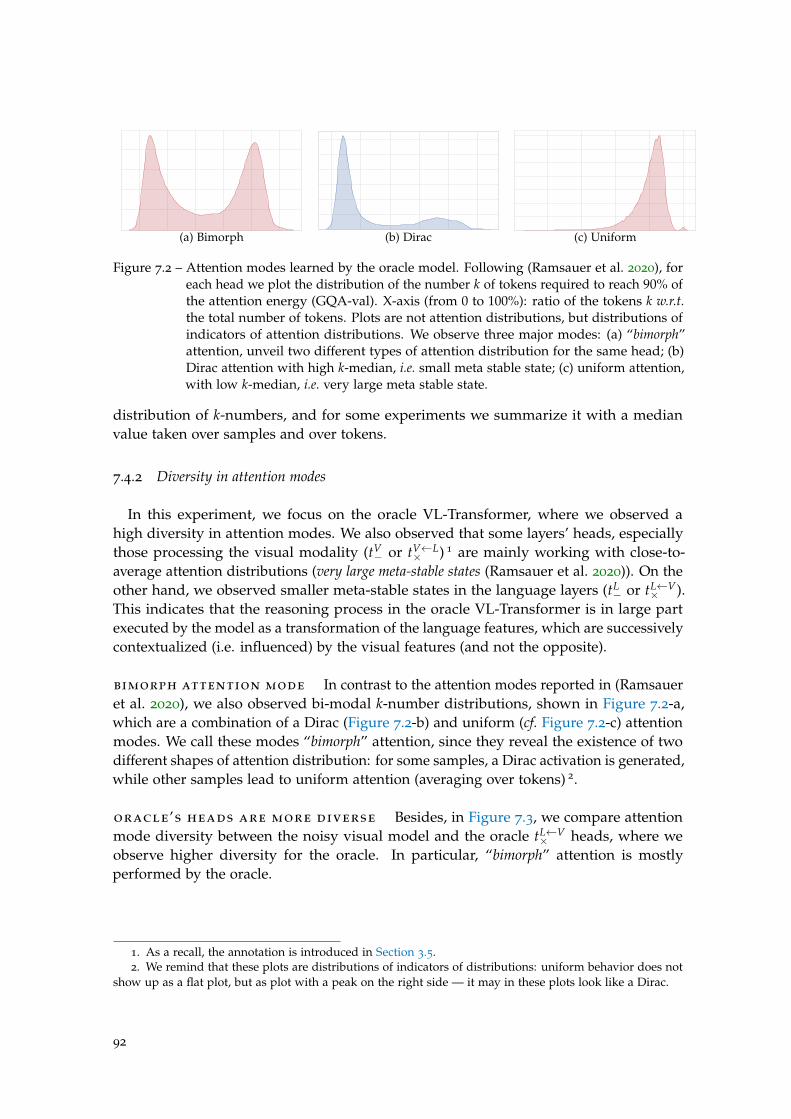
(a) Bimorph (b) Dirac (c) Uniform
Figure 7.2 – Attention modes learned by the oracle model. Following (Ramsauer et al. 2020), foreach head we plot the distribution of the number k of tokens required to reach 90% ofthe attention energy (GQA-val). X-axis (from 0 to 100%): ratio of the tokens k w.r.t.the total number of tokens. Plots are not attention distributions, but distributions ofindicators of attention distributions. We observe three major modes: (a) “bimorph”attention, unveil two different types of attention distribution for the same head; (b)Dirac attention with high k-median, i.e. small meta stable state; (c) uniform attention,with low k-median, i.e. very large meta stable state.
distribution of k-numbers, and for some experiments we summarize it with a medianvalue taken over samples and over tokens.
7.4.2 Diversity in attention modes
In this experiment, we focus on the oracle VL-Transformer, where we observed ahigh diversity in attention modes. We also observed that some layers’ heads, especiallythose processing the visual modality (tV
− or tV←L× ) 1 are mainly working with close-to-
average attention distributions (very large meta-stable states (Ramsauer et al. 2020)). On theother hand, we observed smaller meta-stable states in the language layers (tL
− or tL←V× ).
This indicates that the reasoning process in the oracle VL-Transformer is in large partexecuted by the model as a transformation of the language features, which are successivelycontextualized (i.e. influenced) by the visual features (and not the opposite).
bimorph attention mode In contrast to the attention modes reported in (Ramsaueret al. 2020), we also observed bi-modal k-number distributions, shown in Figure 7.2-a,which are a combination of a Dirac (Figure 7.2-b) and uniform (cf. Figure 7.2-c) attentionmodes. We call these modes “bimorph” attention, since they reveal the existence of twodifferent shapes of attention distribution: for some samples, a Dirac activation is generated,while other samples lead to uniform attention (averaging over tokens) 2.
oracle’s heads are more diverse Besides, in Figure 7.3, we compare attentionmode diversity between the noisy visual model and the oracle tL←V
× heads, where weobserve higher diversity for the oracle. In particular, “bimorph” attention is mostlyperformed by the oracle.
1. As a recall, the annotation is introduced in Section 3.5.2. We remind that these plots are distributions of indicators of distributions: uniform behavior does not
show up as a flat plot, but as plot with a peak on the right side — it may in these plots look like a Dirac.
92
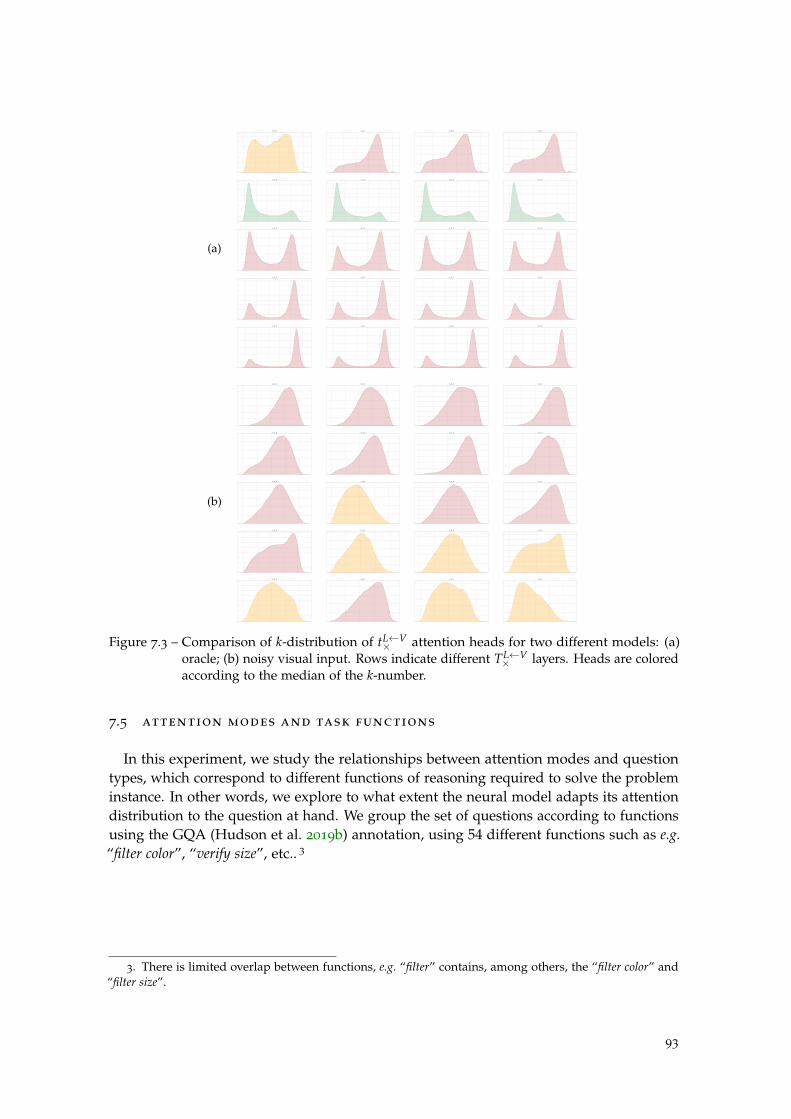
(a)
vl_0_0 vl_0_1 vl_0_2 vl_0_3
vl_1_0 vl_1_1 vl_1_2 vl_1_3
vl_2_0 vl_2_1 vl_2_2 vl_2_3
vl_3_0 vl_3_1 vl_3_2 vl_3_3
vl_4_0 vl_4_1 vl_4_2 vl_4_3
(b)
vl_0_0 vl_0_1 vl_0_2 vl_0_3
vl_1_0 vl_1_1 vl_1_2 vl_1_3
vl_2_0 vl_2_1 vl_2_2 vl_2_3
vl_3_0 vl_3_1 vl_3_2 vl_3_3
vl_4_0 vl_4_1 vl_4_2 vl_4_3
Figure 7.3 – Comparison of k-distribution of tL←V× attention heads for two different models: (a)
oracle; (b) noisy visual input. Rows indicate different TL←V× layers. Heads are colored
according to the median of the k-number.
7.5 attention modes and task functions
In this experiment, we study the relationships between attention modes and questiontypes, which correspond to different functions of reasoning required to solve the probleminstance. In other words, we explore to what extent the neural model adapts its attentiondistribution to the question at hand. We group the set of questions according to functionsusing the GQA (Hudson et al. 2019b) annotation, using 54 different functions such as e.g.“filter color”, “verify size”, etc.. 3
3. There is limited overlap between functions, e.g. “filter” contains, among others, the “filter color” and“filter size”.
93
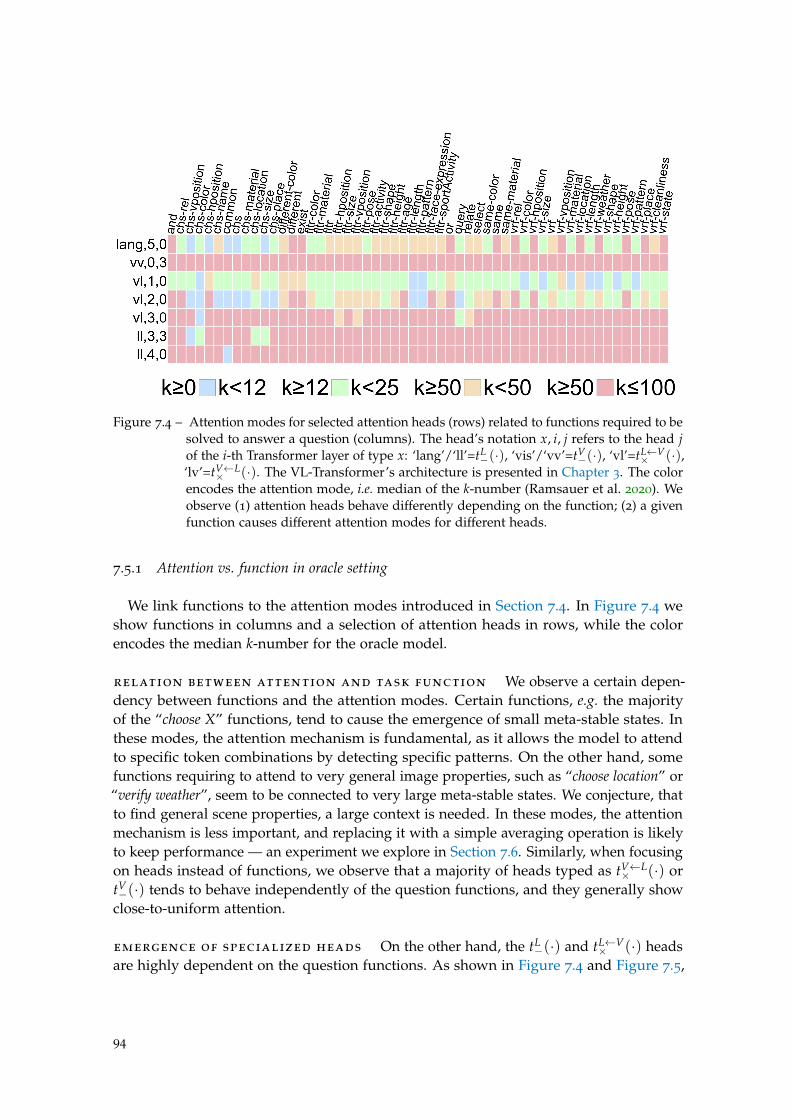
Figure 7.4 – Attention modes for selected attention heads (rows) related to functions required to besolved to answer a question (columns). The head’s notation x, i, j refers to the head jof the i-th Transformer layer of type x: ‘lang’/‘ll’=tL
−(·), ‘vis’/‘vv’=tV−(·), ‘vl’=tL←V
× (·),‘lv’=tV←L
× (·). The VL-Transformer’s architecture is presented in Chapter 3. The colorencodes the attention mode, i.e. median of the k-number (Ramsauer et al. 2020). Weobserve (1) attention heads behave differently depending on the function; (2) a givenfunction causes different attention modes for different heads.
7.5.1 Attention vs. function in oracle setting
We link functions to the attention modes introduced in Section 7.4. In Figure 7.4 weshow functions in columns and a selection of attention heads in rows, while the colorencodes the median k-number for the oracle model.
relation between attention and task function We observe a certain depen-dency between functions and the attention modes. Certain functions, e.g. the majorityof the “choose X” functions, tend to cause the emergence of small meta-stable states. Inthese modes, the attention mechanism is fundamental, as it allows the model to attendto specific token combinations by detecting specific patterns. On the other hand, somefunctions requiring to attend to very general image properties, such as “choose location” or“verify weather”, seem to be connected to very large meta-stable states. We conjecture, thatto find general scene properties, a large context is needed. In these modes, the attentionmechanism is less important, and replacing it with a simple averaging operation is likelyto keep performance — an experiment we explore in Section 7.6. Similarly, when focusingon heads instead of functions, we observe that a majority of heads typed as tV←L
× (·) ortV−(·) tends to behave independently of the question functions, and they generally show
close-to-uniform attention.
emergence of specialized heads On the other hand, the tL−(·) and tL←V
× (·) headsare highly dependent on the question functions. As shown in Figure 7.4 and Figure 7.5,
94
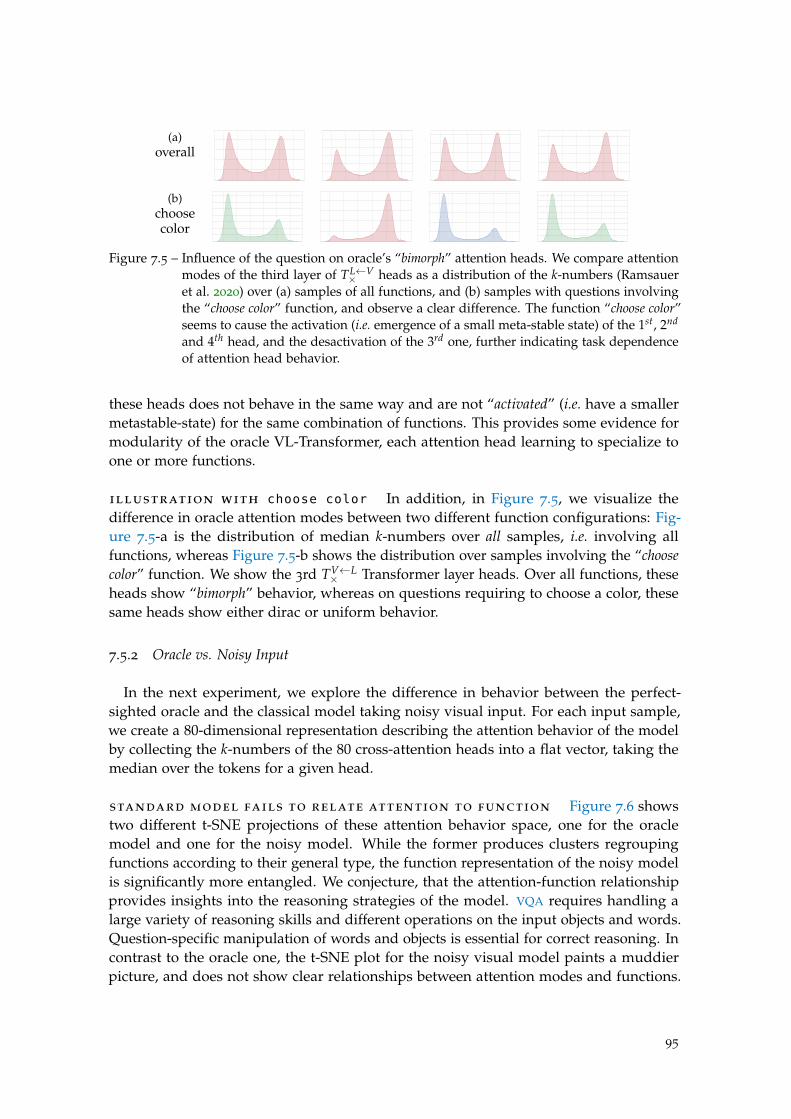
(a)overall
(b)choosecolor
Figure 7.5 – Influence of the question on oracle’s “bimorph” attention heads. We compare attentionmodes of the third layer of TL←V
× heads as a distribution of the k-numbers (Ramsaueret al. 2020) over (a) samples of all functions, and (b) samples with questions involvingthe “choose color” function, and observe a clear difference. The function “choose color”seems to cause the activation (i.e. emergence of a small meta-stable state) of the 1st, 2nd
and 4th head, and the desactivation of the 3rd one, further indicating task dependenceof attention head behavior.
these heads does not behave in the same way and are not “activated” (i.e. have a smallermetastable-state) for the same combination of functions. This provides some evidence formodularity of the oracle VL-Transformer, each attention head learning to specialize toone or more functions.
illustration with choose color In addition, in Figure 7.5, we visualize thedifference in oracle attention modes between two different function configurations: Fig-ure 7.5-a is the distribution of median k-numbers over all samples, i.e. involving allfunctions, whereas Figure 7.5-b shows the distribution over samples involving the “choosecolor” function. We show the 3rd TV←L
× Transformer layer heads. Over all functions, theseheads show “bimorph” behavior, whereas on questions requiring to choose a color, thesesame heads show either dirac or uniform behavior.
7.5.2 Oracle vs. Noisy Input
In the next experiment, we explore the difference in behavior between the perfect-sighted oracle and the classical model taking noisy visual input. For each input sample,we create a 80-dimensional representation describing the attention behavior of the modelby collecting the k-numbers of the 80 cross-attention heads into a flat vector, taking themedian over the tokens for a given head.
standard model fails to relate attention to function Figure 7.6 showstwo different t-SNE projections of these attention behavior space, one for the oraclemodel and one for the noisy model. While the former produces clusters regroupingfunctions according to their general type, the function representation of the noisy modelis significantly more entangled. We conjecture, that the attention-function relationshipprovides insights into the reasoning strategies of the model. VQA requires handling alarge variety of reasoning skills and different operations on the input objects and words.Question-specific manipulation of words and objects is essential for correct reasoning. Incontrast to the oracle one, the t-SNE plot for the noisy visual model paints a muddierpicture, and does not show clear relationships between attention modes and functions.
95
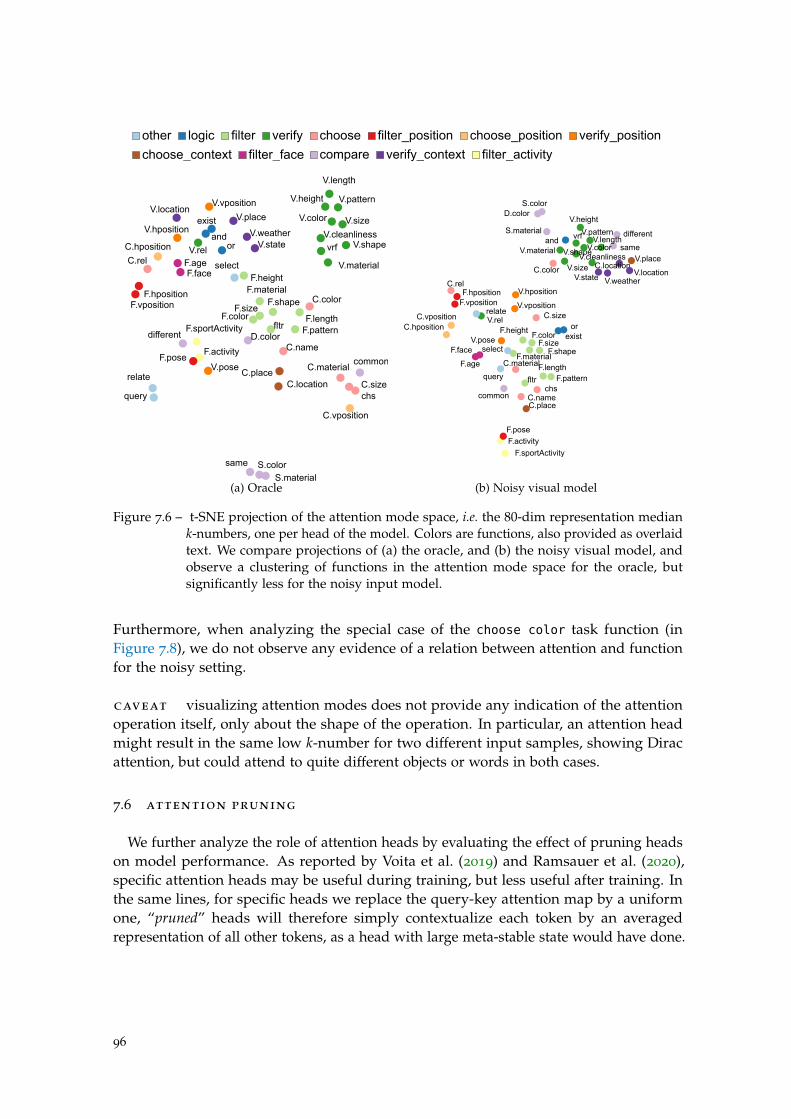
other logic filter verify choose filter_position choose_position verify_position
compare verify_context filter_activitychoose_context filter_face
V.stateV.cleanliness
V.place
F.sportActivity
C.place
V.pattern
different
F.face
F.pattern
V.pose
F.length
C.size
V.height
S.material
same
F.age
F.height
V.shape
F.shape
C.location
C.material
V.weather
V.length
F.activity
V.location
chs
common
V.material
V.vposition
F.pose
S.color
D.color
vrf
V.size
C.name
V.hposition
C.hposition
F.vposition F.sizeC.color
C.vposition
F.hposition
fltr
F.material
C.rel
V.color
and
V.rel or
F.color
exist
query
relate
selectV.state
V.cleanliness V.place
F.sportActivity
C.place
V.pattern different
F.face
F.pattern
V.pose
F.length
C.size
V.heightS.material
same
F.age
F.height
V.shape
F.shape
C.location
C.material
V.weather
V.length
F.activity
V.location
chscommon
V.material
V.vposition
F.pose
S.colorD.color
vrf
V.size
C.name
V.hposition
C.hposition
F.vposition
F.size
C.color
C.vposition
F.hposition
fltr
F.material
C.rel
V.colorand
V.relor
F.color exist
query
relate
select
(a) Oracle (b) Noisy visual model
Figure 7.6 – t-SNE projection of the attention mode space, i.e. the 80-dim representation mediank-numbers, one per head of the model. Colors are functions, also provided as overlaidtext. We compare projections of (a) the oracle, and (b) the noisy visual model, andobserve a clustering of functions in the attention mode space for the oracle, butsignificantly less for the noisy input model.
Furthermore, when analyzing the special case of the choose color task function (inFigure 7.8), we do not observe any evidence of a relation between attention and functionfor the noisy setting.
caveat visualizing attention modes does not provide any indication of the attentionoperation itself, only about the shape of the operation. In particular, an attention headmight result in the same low k-number for two different input samples, showing Diracattention, but could attend to quite different objects or words in both cases.
7.6 attention pruning
We further analyze the role of attention heads by evaluating the effect of pruning headson model performance. As reported by Voita et al. (2019) and Ramsauer et al. (2020),specific attention heads may be useful during training, but less useful after training. Inthe same lines, for specific heads we replace the query-key attention map by a uniformone, “pruned” heads will therefore simply contextualize each token by an averagedrepresentation of all other tokens, as a head with large meta-stable state would have done.
96
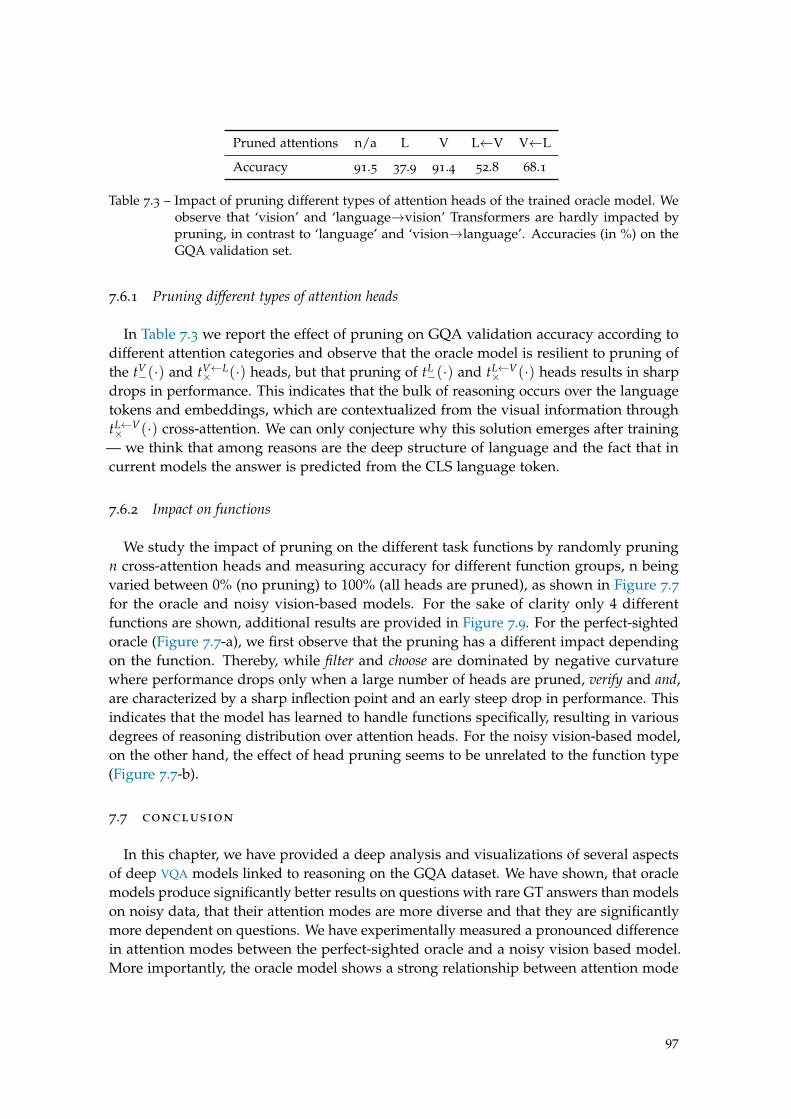
Pruned attentions n/a L V L←V V←L
Accuracy 91.5 37.9 91.4 52.8 68.1
Table 7.3 – Impact of pruning different types of attention heads of the trained oracle model. Weobserve that ‘vision’ and ‘language→vision’ Transformers are hardly impacted bypruning, in contrast to ‘language’ and ‘vision→language’. Accuracies (in %) on theGQA validation set.
7.6.1 Pruning different types of attention heads
In Table 7.3 we report the effect of pruning on GQA validation accuracy according todifferent attention categories and observe that the oracle model is resilient to pruning ofthe tV
−(·) and tV←L× (·) heads, but that pruning of tL
−(·) and tL←V× (·) heads results in sharp
drops in performance. This indicates that the bulk of reasoning occurs over the languagetokens and embeddings, which are contextualized from the visual information throughtL←V× (·) cross-attention. We can only conjecture why this solution emerges after training
— we think that among reasons are the deep structure of language and the fact that incurrent models the answer is predicted from the CLS language token.
7.6.2 Impact on functions
We study the impact of pruning on the different task functions by randomly pruningn cross-attention heads and measuring accuracy for different function groups, n beingvaried between 0% (no pruning) to 100% (all heads are pruned), as shown in Figure 7.7for the oracle and noisy vision-based models. For the sake of clarity only 4 differentfunctions are shown, additional results are provided in Figure 7.9. For the perfect-sightedoracle (Figure 7.7-a), we first observe that the pruning has a different impact dependingon the function. Thereby, while filter and choose are dominated by negative curvaturewhere performance drops only when a large number of heads are pruned, verify and and,are characterized by a sharp inflection point and an early steep drop in performance. Thisindicates that the model has learned to handle functions specifically, resulting in variousdegrees of reasoning distribution over attention heads. For the noisy vision-based model,on the other hand, the effect of head pruning seems to be unrelated to the function type(Figure 7.7-b).
7.7 conclusion
In this chapter, we have provided a deep analysis and visualizations of several aspectsof deep VQA models linked to reasoning on the GQA dataset. We have shown, that oraclemodels produce significantly better results on questions with rare GT answers than modelson noisy data, that their attention modes are more diverse and that they are significantlymore dependent on questions. We have experimentally measured a pronounced differencein attention modes between the perfect-sighted oracle and a noisy vision based model.More importantly, the oracle model shows a strong relationship between attention mode
97
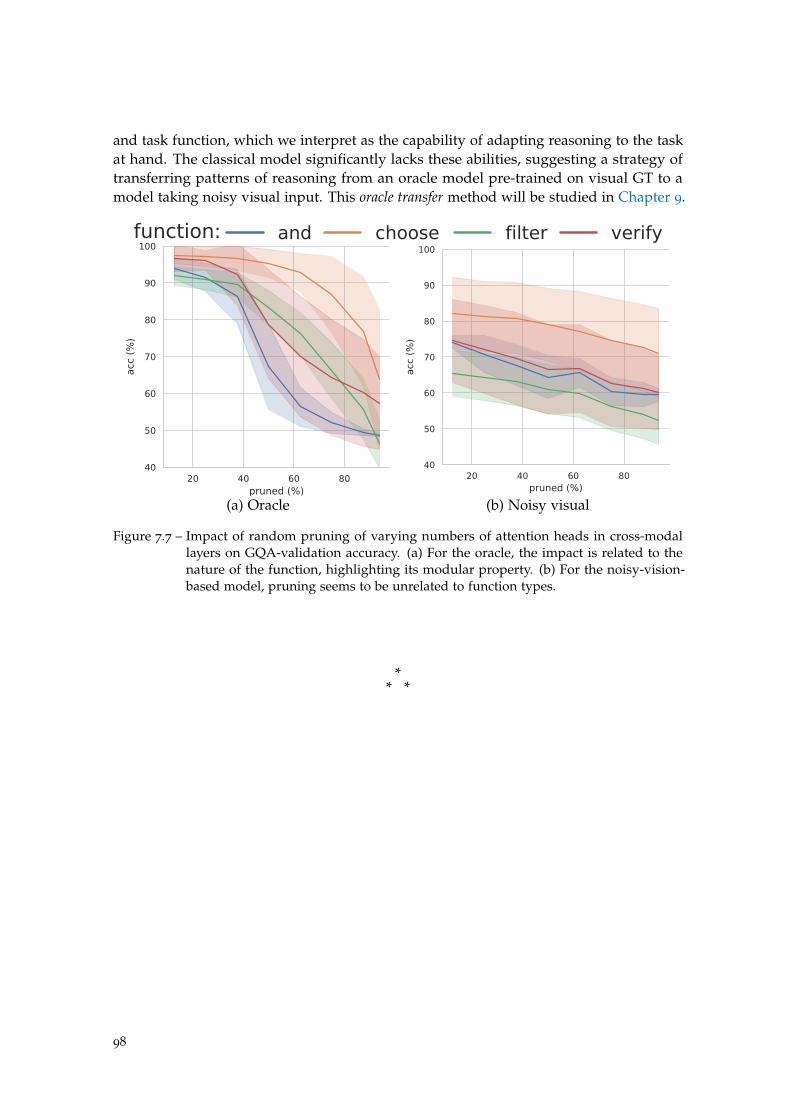
and task function, which we interpret as the capability of adapting reasoning to the taskat hand. The classical model significantly lacks these abilities, suggesting a strategy oftransferring patterns of reasoning from an oracle model pre-trained on visual GT to amodel taking noisy visual input. This oracle transfer method will be studied in Chapter 9.
function: and choose filter verify
20 40 60 80pruned (%)
40
50
60
70
80
90
100
acc
(%
)
20 40 60 80pruned (%)
40
50
60
70
80
90
100
acc
(%
)
(a) Oracle (b) Noisy visual
Figure 7.7 – Impact of random pruning of varying numbers of attention heads in cross-modallayers on GQA-validation accuracy. (a) For the oracle, the impact is related to thenature of the function, highlighting its modular property. (b) For the noisy-vision-based model, pruning seems to be unrelated to function types.
** *
98
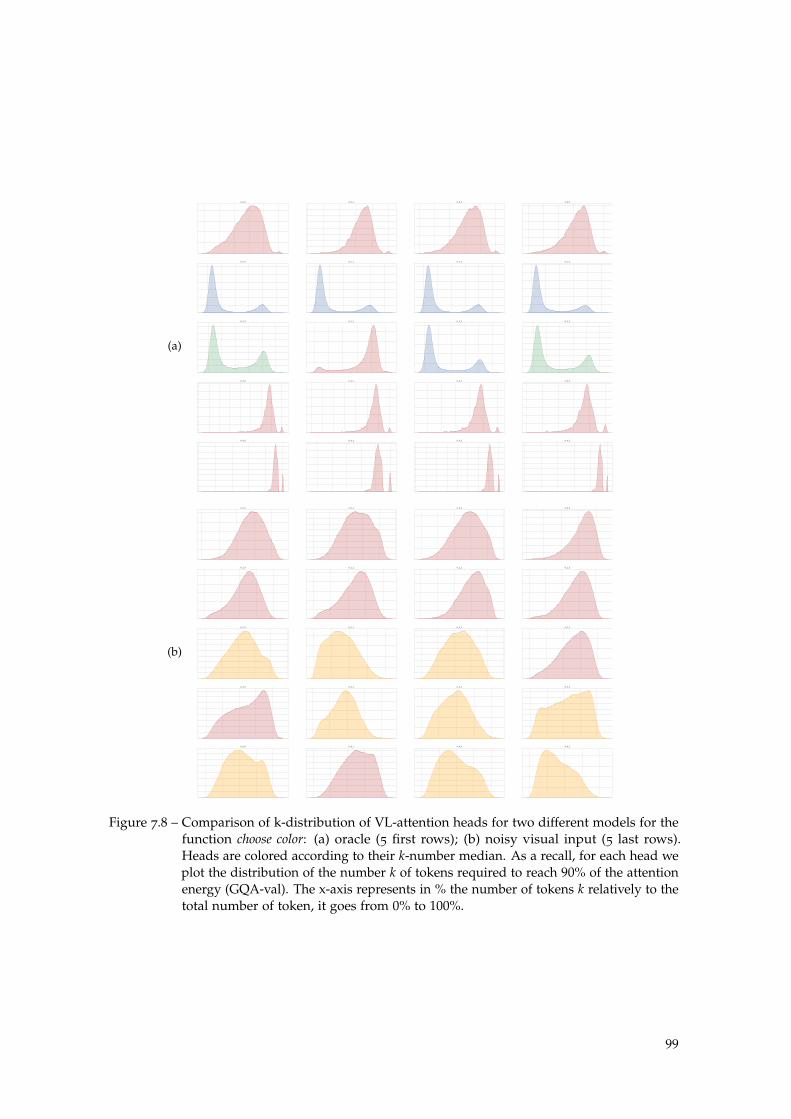
(a)
(b)
Figure 7.8 – Comparison of k-distribution of VL-attention heads for two different models for thefunction choose color: (a) oracle (5 first rows); (b) noisy visual input (5 last rows).Heads are colored according to their k-number median. As a recall, for each head weplot the distribution of the number k of tokens required to reach 90% of the attentionenergy (GQA-val). The x-axis represents in % the number of tokens k relatively to thetotal number of token, it goes from 0% to 100%.
99
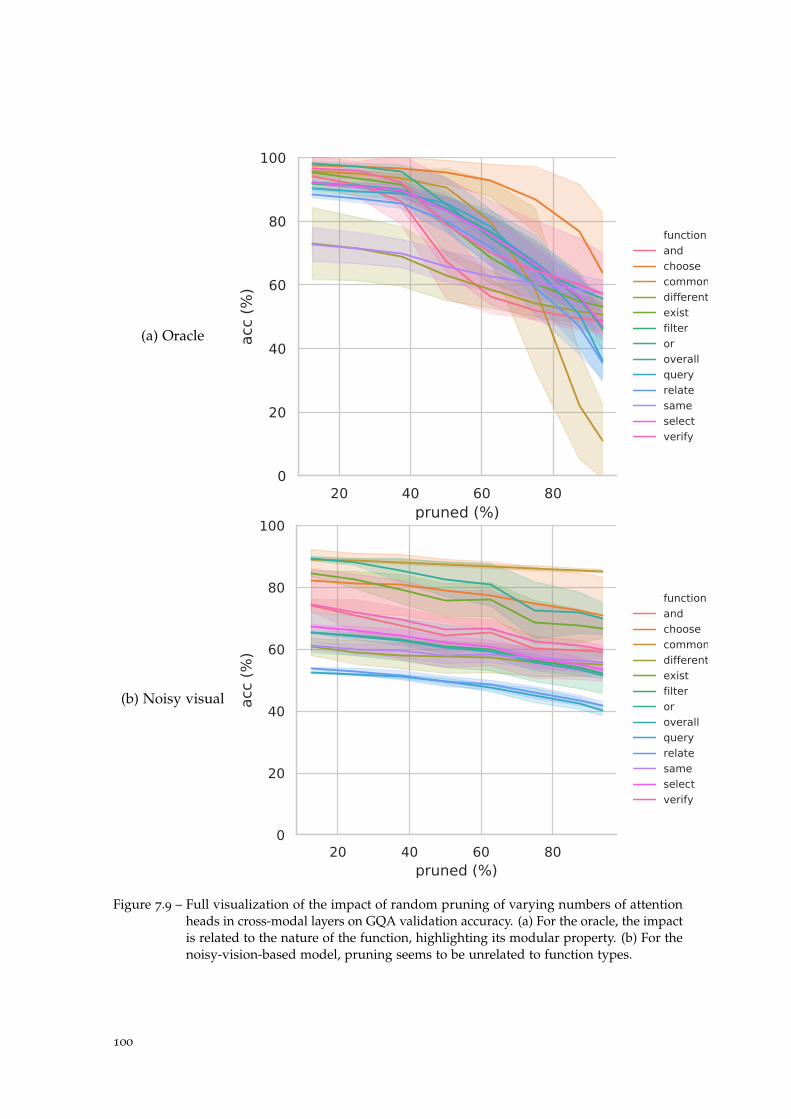
(a) Oracle
20 40 60 80pruned (%)
0
20
40
60
80
100
acc
(%
)function
and
choose
common
different
exist
filter
or
overall
query
relate
same
select
verify
(b) Noisy visual
20 40 60 80pruned (%)
0
20
40
60
80
100
acc
(%
)
function
and
choose
common
different
exist
filter
or
overall
query
relate
same
select
verify
Figure 7.9 – Full visualization of the impact of random pruning of varying numbers of attentionheads in cross-modal layers on GQA validation accuracy. (a) For the oracle, the impactis related to the nature of the function, highlighting its modular property. (b) For thenoisy-vision-based model, pruning seems to be unrelated to function types.
100

Part IV
I M P R O V E : A N E W H O P E

I N T R O D U C T I O N
In the year 2021 AD, 2 liters of coffee and 100 pages later:
– Sir?– You, again?
– Now I understand everything! We are call VQA a “visual turing test”, but it turns outthat, rather than reasoning, VQA models only learn shortcuts. . .
– Don’t be so pessimistic. In some cases, VQA models still succeed in reasoning.Slowly, but surely, we are moving towards models more apt to reason.
– Do you mean that there is sill hope?– Exactly, and I have some ideas!
In Part II and Part III we experimentally demonstrate that SOTA VQA models tendto leverage dataset biases and shortcuts in learning rather than performing reasoning,leading to lack of generalization. Using VisQA (cf. Chapter 6) to inspect the attentionmaps learned by a VL-Transformer taught us that it struggles to detect the fined-grainedinteractions between language and vision. Furthermore, when it succeeds, it is oftendominated by shortcuts. As an illustration, when asking “What is the woman holding?”with the picture in Figure 7.10 to the tiny-LXMERT (Tan et al. 2019) model, it wronglypredicts “a banana”. Yet, the attention map VL_3_0 informs us that the model has correctlygrounded “woman” and “holding” to the woman’s face and the glove, respectively. Thissuggests that the reasoning process, leading to the answer prediction, does not rely onthe right cues (here, it relies on shortcuts rather than on word-object alignment). Thus, itappears as a necessity to develop methods preventing shortcut learning in VQA.
improving the reasoning process Drawing conclusion from our evaluations(Part II) and analyses (Part III), we now propose to improve the performance of VQA
models. In the VQA literature, the reasoning ability is frequently assumed to be implicitlylearned during training from application-specific losses, mostly cross-entropy for classifi-cation, or the use of inductive biases in the model’s architecture. We conjecture that it isnot so obvious, and explore two alternatives, improving the VQA accuracy and reducingthe impact of biases on the prediction. The first one aims at guiding the reasoning processduring training, leveraging a weak supervision of the object-word alignment or a super-vision of the operations steps required to answer the question. The second one consistsin pre-training the VQA model on perfect (oracle) input, in order to learn the reasoningpatterns observed in Chapter 7, and transfer them to the standard settings, where visionis uncertain. The underlying intuition is that it is easier to learn a shortcut-free reasoningwhen the training conditions are favorable enough (i.e. when the uncertainty in the inputis reduced). Part IV is organized as follows:
103
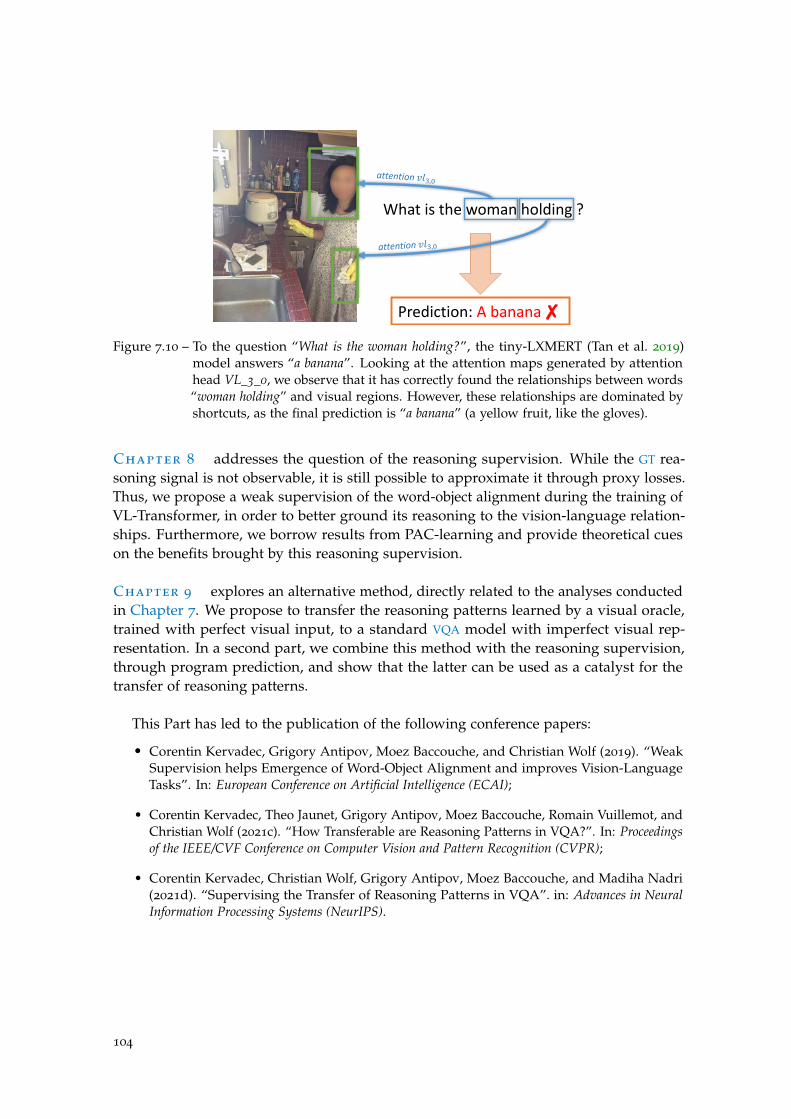
Figure 7.10 – To the question “What is the woman holding?”, the tiny-LXMERT (Tan et al. 2019)model answers “a banana”. Looking at the attention maps generated by attentionhead VL_3_0, we observe that it has correctly found the relationships between words“woman holding” and visual regions. However, these relationships are dominated byshortcuts, as the final prediction is “a banana” (a yellow fruit, like the gloves).
Chapter 8 addresses the question of the reasoning supervision. While the GT rea-soning signal is not observable, it is still possible to approximate it through proxy losses.Thus, we propose a weak supervision of the word-object alignment during the training ofVL-Transformer, in order to better ground its reasoning to the vision-language relation-ships. Furthermore, we borrow results from PAC-learning and provide theoretical cueson the benefits brought by this reasoning supervision.
Chapter 9 explores an alternative method, directly related to the analyses conductedin Chapter 7. We propose to transfer the reasoning patterns learned by a visual oracle,trained with perfect visual input, to a standard VQA model with imperfect visual rep-resentation. In a second part, we combine this method with the reasoning supervision,through program prediction, and show that the latter can be used as a catalyst for thetransfer of reasoning patterns.
This Part has led to the publication of the following conference papers:
• Corentin Kervadec, Grigory Antipov, Moez Baccouche, and Christian Wolf (2019). “WeakSupervision helps Emergence of Word-Object Alignment and improves Vision-LanguageTasks”. In: European Conference on Artificial Intelligence (ECAI);
• Corentin Kervadec, Theo Jaunet, Grigory Antipov, Moez Baccouche, Romain Vuillemot, andChristian Wolf (2021c). “How Transferable are Reasoning Patterns in VQA?”. In: Proceedingsof the IEEE/CVF Conference on Computer Vision and Pattern Recognition (CVPR);
• Corentin Kervadec, Christian Wolf, Grigory Antipov, Moez Baccouche, and Madiha Nadri(2021d). “Supervising the Transfer of Reasoning Patterns in VQA”. in: Advances in NeuralInformation Processing Systems (NeurIPS).
104
C h a p t e r
8
A P R O X Y L O S S F O R S U P E RV I S I N G R E A S O N I N G
8.1 introduction
High-capacity deep neural networks trained on a large amount of data currentlydominate methods addressing problems involving either vision or language, or both ofthese modalities jointly (Tan et al. 2019). Examples for vision-language tasks are imageretrieval task (Karpathy et al. 2015a) – retrieve an image given a query sentence –, imagecaptioning (Lin et al. 2014) – describe the content of an input image in one or moresentences –, or VQA. These tasks require different forms of reasoning, among which wefind the capacity to analyze instructions – e.g. the question in VQA –, or the ability tofuse modalities. Additionally, they often require different levels of understanding, froma global image-text comparison to fine-grained object-word matching. In this context, awide panoply of high-performing models adopt self-attention architectures (Vaswani et al.2017) and BERT-like (Devlin et al. 2019) training objectives, which complement the maintask-related loss with other auxiliary losses correlated to the task (see VL-Transformer inChapter 3). The common point of this large body of work is the large-scale training ofunified vision-language encoders on image-sentence pairs.
However, despite their impressive success in standards benchmarks, we have shown inChapter 5 that these models – in particular, LXMERT (Tan et al. 2019) – are prone to learnshortcuts instead of reasoning. More precisely, when analyzing the attention maps learnedby a VL-Transfomer with VisQA (cf. Chapter 6), we observe that, despite its ability tomodel interactions unique to one modality (i.e. intra-relationships), it tends to struggleto identify fine-grained object-word relationships (inter-relationships, or cross-modalityrelationships). Yet, these relationships are essential in visual reasoning, which can beillustrated in the example of VQA (cf. Figure 8.1): answering a question given an inputimage requires the detection of certain objects in the image, which correspond to wordsin the question, and possibly the detection of more fine-grained relationships betweenvisual objects, which are related to entities in the sentence.
In this chapter, we claim that the word-object alignment does not necessarily emergeautomatically, but rather requires explicit supervision. Therefore, we design a train-ing signal, aiming at supervising the model to learn a fine-grained matching betweenquestion’s words and visual objects. This takes the form of an additional pre-trainingsupervision, which can be viewed as a proxy loss for guiding the model to learn reasoning.
105
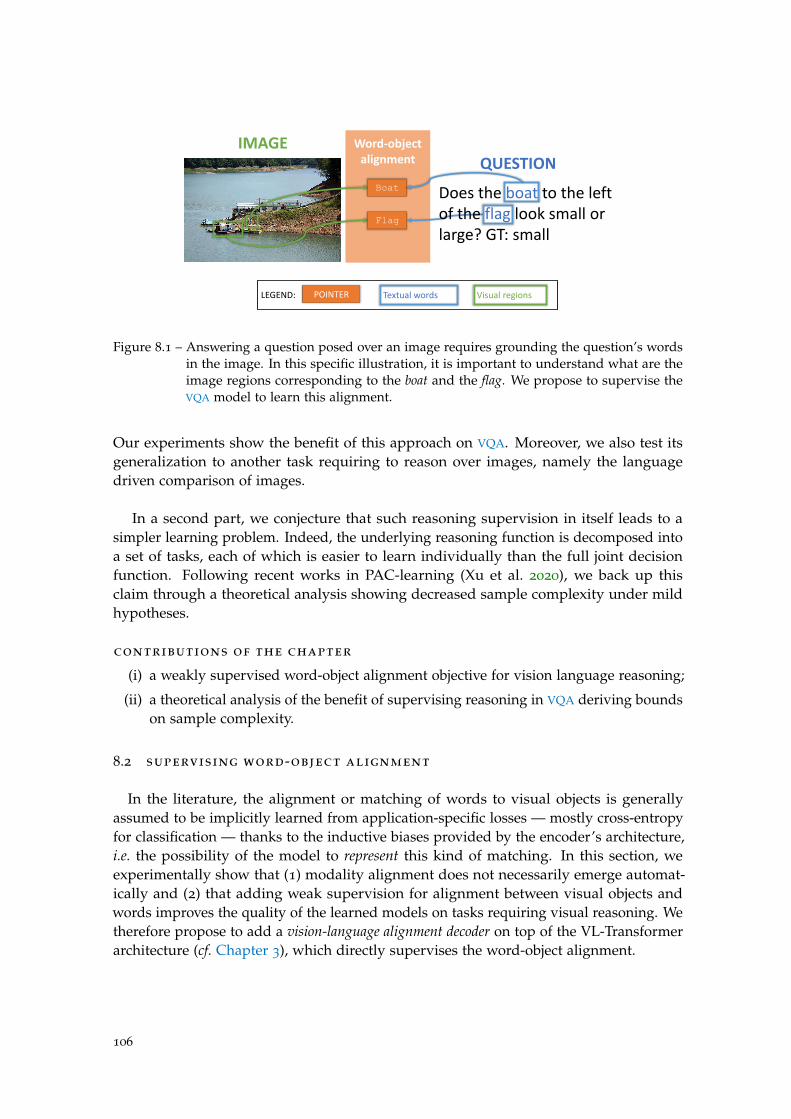
Figure 8.1 – Answering a question posed over an image requires grounding the question’s wordsin the image. In this specific illustration, it is important to understand what are theimage regions corresponding to the boat and the flag. We propose to supervise theVQA model to learn this alignment.
Our experiments show the benefit of this approach on VQA. Moreover, we also test itsgeneralization to another task requiring to reason over images, namely the languagedriven comparison of images.
In a second part, we conjecture that such reasoning supervision in itself leads to asimpler learning problem. Indeed, the underlying reasoning function is decomposed intoa set of tasks, each of which is easier to learn individually than the full joint decisionfunction. Following recent works in PAC-learning (Xu et al. 2020), we back up thisclaim through a theoretical analysis showing decreased sample complexity under mildhypotheses.
contributions of the chapter
(i) a weakly supervised word-object alignment objective for vision language reasoning;
(ii) a theoretical analysis of the benefit of supervising reasoning in VQA deriving boundson sample complexity.
8.2 supervising word-object alignment
In the literature, the alignment or matching of words to visual objects is generallyassumed to be implicitly learned from application-specific losses — mostly cross-entropyfor classification — thanks to the inductive biases provided by the encoder’s architecture,i.e. the possibility of the model to represent this kind of matching. In this section, weexperimentally show that (1) modality alignment does not necessarily emerge automat-ically and (2) that adding weak supervision for alignment between visual objects andwords improves the quality of the learned models on tasks requiring visual reasoning. Wetherefore propose to add a vision-language alignment decoder on top of the VL-Transformerarchitecture (cf. Chapter 3), which directly supervises the word-object alignment.
106
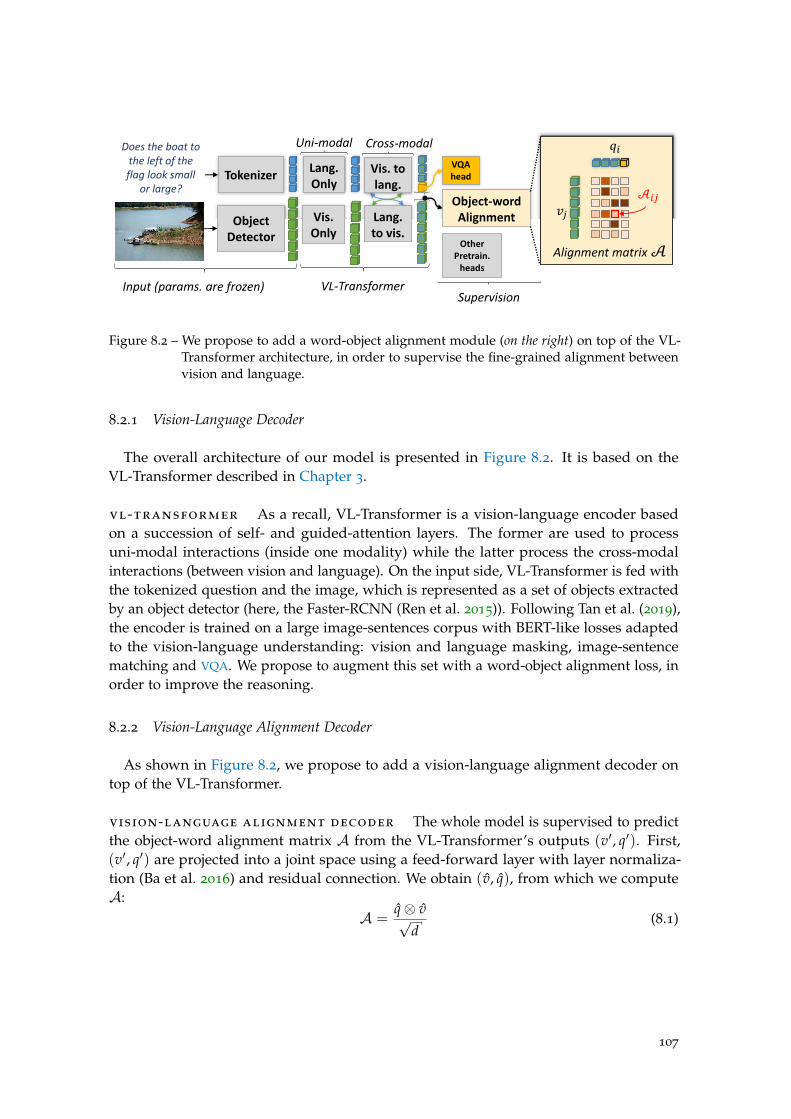
Figure 8.2 – We propose to add a word-object alignment module (on the right) on top of the VL-Transformer architecture, in order to supervise the fine-grained alignment betweenvision and language.
8.2.1 Vision-Language Decoder
The overall architecture of our model is presented in Figure 8.2. It is based on theVL-Transformer described in Chapter 3.
vl-transformer As a recall, VL-Transformer is a vision-language encoder basedon a succession of self- and guided-attention layers. The former are used to processuni-modal interactions (inside one modality) while the latter process the cross-modalinteractions (between vision and language). On the input side, VL-Transformer is fed withthe tokenized question and the image, which is represented as a set of objects extractedby an object detector (here, the Faster-RCNN (Ren et al. 2015)). Following Tan et al. (2019),the encoder is trained on a large image-sentences corpus with BERT-like losses adaptedto the vision-language understanding: vision and language masking, image-sentencematching and VQA. We propose to augment this set with a word-object alignment loss, inorder to improve the reasoning.
8.2.2 Vision-Language Alignment Decoder
As shown in Figure 8.2, we propose to add a vision-language alignment decoder ontop of the VL-Transformer.
vision-language alignment decoder The whole model is supervised to predictthe object-word alignment matrix A from the VL-Transformer’s outputs (v′, q′). First,(v′, q′) are projected into a joint space using a feed-forward layer with layer normaliza-tion (Ba et al. 2016) and residual connection. We obtain (v, q), from which we computeA:
A =q⊗ v√
d(8.1)
107
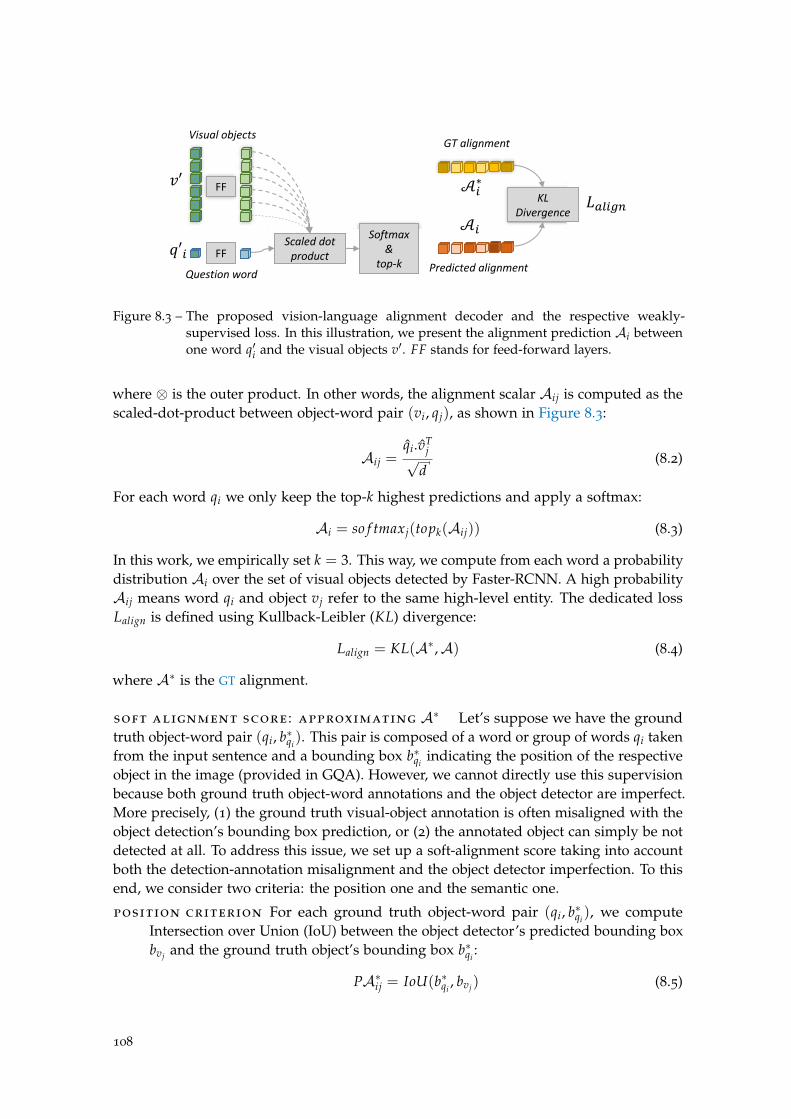
Figure 8.3 – The proposed vision-language alignment decoder and the respective weakly-supervised loss. In this illustration, we present the alignment prediction Ai betweenone word q′i and the visual objects v′. FF stands for feed-forward layers.
where ⊗ is the outer product. In other words, the alignment scalar Aij is computed as thescaled-dot-product between object-word pair (vi, qj), as shown in Figure 8.3:
Aij =qi.vT
j√d
(8.2)
For each word qi we only keep the top-k highest predictions and apply a softmax:
Ai = so f tmaxj(topk(Aij)) (8.3)
In this work, we empirically set k = 3. This way, we compute from each word a probabilitydistribution Ai over the set of visual objects detected by Faster-RCNN. A high probabilityAij means word qi and object vj refer to the same high-level entity. The dedicated lossLalign is defined using Kullback-Leibler (KL) divergence:
Lalign = KL(A∗,A) (8.4)
where A∗ is the GT alignment.
soft alignment score : approximating A∗ Let’s suppose we have the groundtruth object-word pair (qi, b∗qi
). This pair is composed of a word or group of words qi takenfrom the input sentence and a bounding box b∗qi
indicating the position of the respectiveobject in the image (provided in GQA). However, we cannot directly use this supervisionbecause both ground truth object-word annotations and the object detector are imperfect.More precisely, (1) the ground truth visual-object annotation is often misaligned with theobject detection’s bounding box prediction, or (2) the annotated object can simply be notdetected at all. To address this issue, we set up a soft-alignment score taking into accountboth the detection-annotation misalignment and the object detector imperfection. To thisend, we consider two criteria: the position one and the semantic one.
position criterion For each ground truth object-word pair (qi, b∗qi), we compute
Intersection over Union (IoU) between the object detector’s predicted bounding boxbvj and the ground truth object’s bounding box b∗qi
:
PA∗ij = IoU(b∗qi, bvj) (8.5)
108
A high IoU leads to a high position criterion value. Therefore, this criterion allowsgiving more importance to objects detected in the same image region as the GT
object.
semantic criterion Since we cannot only rely on positional information, we alsohave to take into account the semantics of the object detector’s prediction. Thiswould avoid aligning a word with a well-localized but a semantically-differentobject (according to the detector). Therefore, we define the semantic criterion whichcomputes the semantic similarity between a word qi and the object’s class cvj – andattribute avj – predicted by the detector:
SA∗ij =34
S(qi, cvj) +14
S(qi, avj) (8.6)
where S(·, ·) compute the cosine similarity between the GloVe embeddings of theclass/attribute names. We bias the similarity toward object class, as we empiricallyfound it more relevant than the attribute prediction.
Finally, we combine the two criteria in order to obtain a soft alignment score for eachobject-word pair in the annotation:
A∗ij =normj(PA∗ij) + normj(SA∗ij)
2(8.7)
The resulting soft-alignment scores are normalized over the objects such as:
nobjects
∑jA∗ij = 1 (8.8)
Hence the ground truth soft alignment score A∗i of word qi is a probability distributionover the set of visual objects detected by the object detector. The soft alignment scoredefined in this chapter is by construction incomplete and approximate. It is for this reasonthat we refer to the designed supervision signal as weak, according to the definition of“weak supervision” in (Zhou 2018).
8.2.3 Experimental evaluation
We now study in what extent the weak supervision of the object-word alignmentimprove the reasoning. For this purpose, we evaluate the encoder on the VQA task,and in particular, on the GQA dataset. In order to further evaluate the generalizationof our conclusions on other tasks requiring reasoning, we also conduct an evaluationon the language-driven comparison of images task, using the Natural Language forVisual Reasoning (NLVR2) dataset (Suhr et al. 2019). The latter is composed of triplets(img1, img2, sentence) where img1 and img2 are two images and sentence is a sentencedescribing one or both images. The goal is to predict if the sentence is true. It is worthnoticing that NLVR2 data is not viewed during the encoder training, therefore it trulyevaluates the generalization capacity of our method.
109
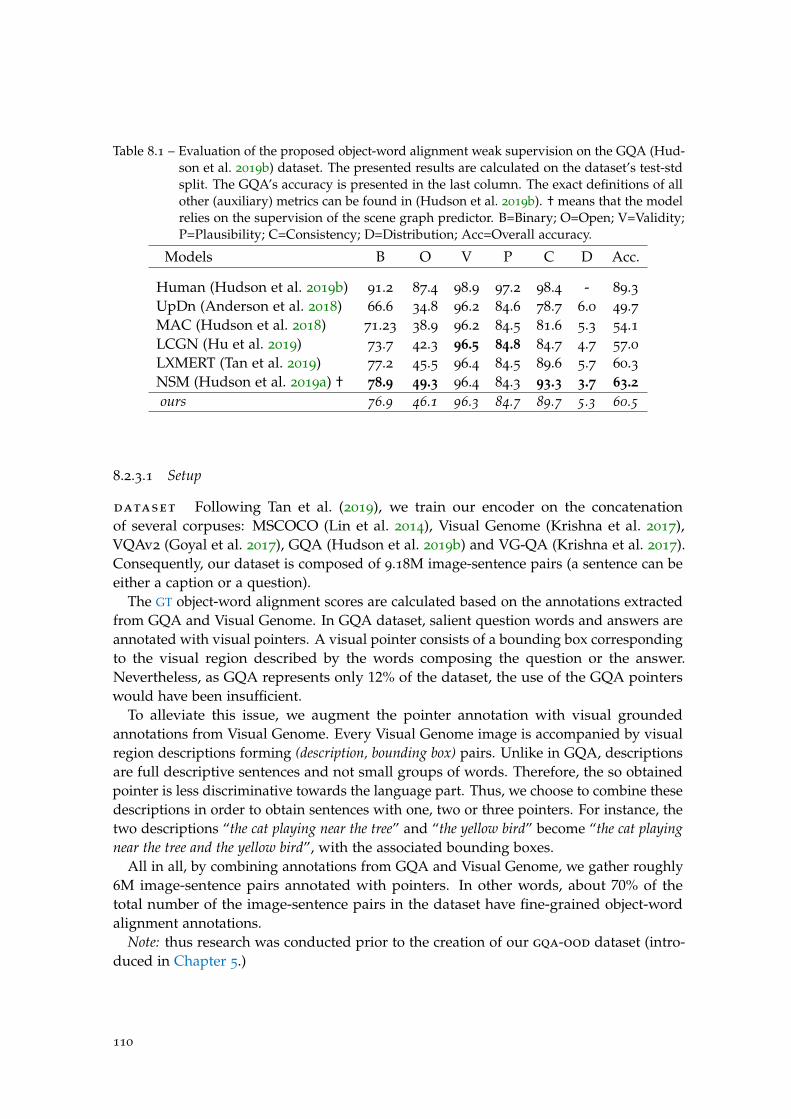
Table 8.1 – Evaluation of the proposed object-word alignment weak supervision on the GQA (Hud-son et al. 2019b) dataset. The presented results are calculated on the dataset’s test-stdsplit. The GQA’s accuracy is presented in the last column. The exact definitions of allother (auxiliary) metrics can be found in (Hudson et al. 2019b). † means that the modelrelies on the supervision of the scene graph predictor. B=Binary; O=Open; V=Validity;P=Plausibility; C=Consistency; D=Distribution; Acc=Overall accuracy.
Models B O V P C D Acc.
Human (Hudson et al. 2019b) 91.2 87.4 98.9 97.2 98.4 - 89.3UpDn (Anderson et al. 2018) 66.6 34.8 96.2 84.6 78.7 6.0 49.7MAC (Hudson et al. 2018) 71.23 38.9 96.2 84.5 81.6 5.3 54.1LCGN (Hu et al. 2019) 73.7 42.3 96.5 84.8 84.7 4.7 57.0LXMERT (Tan et al. 2019) 77.2 45.5 96.4 84.5 89.6 5.7 60.3NSM (Hudson et al. 2019a) † 78.9 49.3 96.4 84.3 93.3 3.7 63.2ours 76.9 46.1 96.3 84.7 89.7 5.3 60.5
8.2.3.1 Setup
dataset Following Tan et al. (2019), we train our encoder on the concatenationof several corpuses: MSCOCO (Lin et al. 2014), Visual Genome (Krishna et al. 2017),VQAv2 (Goyal et al. 2017), GQA (Hudson et al. 2019b) and VG-QA (Krishna et al. 2017).Consequently, our dataset is composed of 9.18M image-sentence pairs (a sentence can beeither a caption or a question).
The GT object-word alignment scores are calculated based on the annotations extractedfrom GQA and Visual Genome. In GQA dataset, salient question words and answers areannotated with visual pointers. A visual pointer consists of a bounding box correspondingto the visual region described by the words composing the question or the answer.Nevertheless, as GQA represents only 12% of the dataset, the use of the GQA pointerswould have been insufficient.
To alleviate this issue, we augment the pointer annotation with visual groundedannotations from Visual Genome. Every Visual Genome image is accompanied by visualregion descriptions forming (description, bounding box) pairs. Unlike in GQA, descriptionsare full descriptive sentences and not small groups of words. Therefore, the so obtainedpointer is less discriminative towards the language part. Thus, we choose to combine thesedescriptions in order to obtain sentences with one, two or three pointers. For instance, thetwo descriptions “the cat playing near the tree” and “the yellow bird” become “the cat playingnear the tree and the yellow bird”, with the associated bounding boxes.
All in all, by combining annotations from GQA and Visual Genome, we gather roughly6M image-sentence pairs annotated with pointers. In other words, about 70% of thetotal number of the image-sentence pairs in the dataset have fine-grained object-wordalignment annotations.
Note: thus research was conducted prior to the creation of our gqa-ood dataset (intro-duced in Chapter 5.)
110
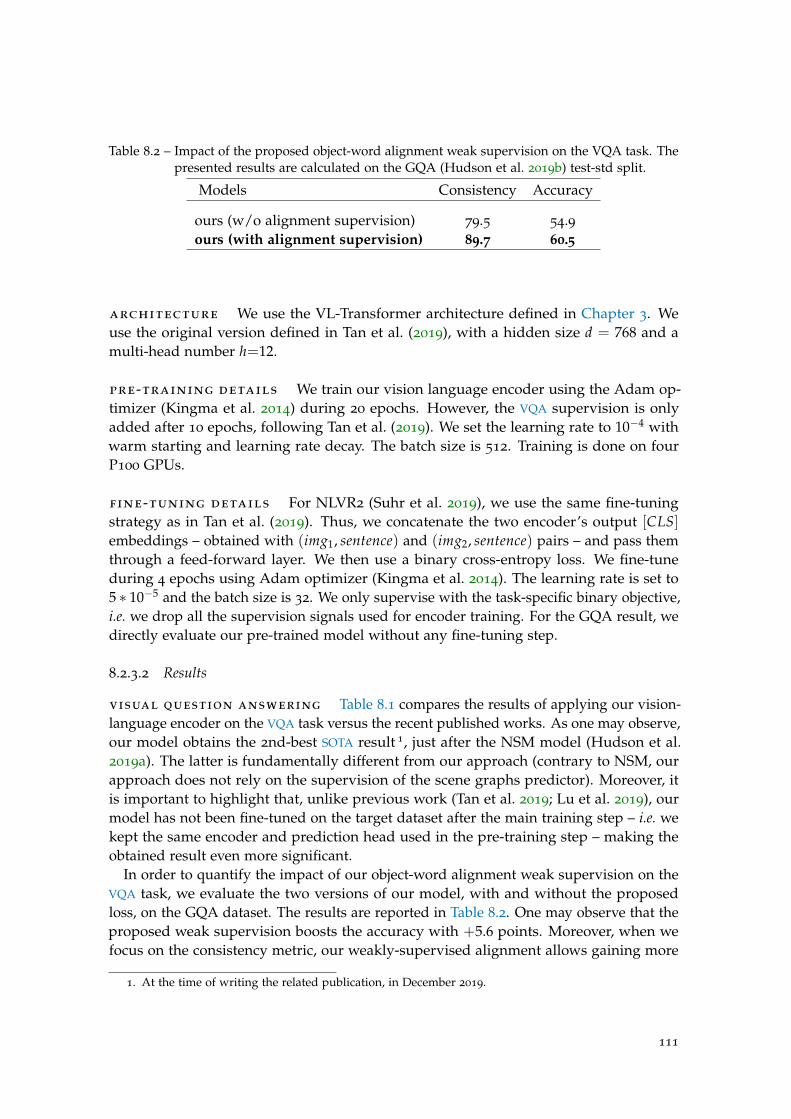
Table 8.2 – Impact of the proposed object-word alignment weak supervision on the VQA task. Thepresented results are calculated on the GQA (Hudson et al. 2019b) test-std split.
Models Consistency Accuracy
ours (w/o alignment supervision) 79.5 54.9ours (with alignment supervision) 89.7 60.5
architecture We use the VL-Transformer architecture defined in Chapter 3. Weuse the original version defined in Tan et al. (2019), with a hidden size d = 768 and amulti-head number h=12.
pre-training details We train our vision language encoder using the Adam op-timizer (Kingma et al. 2014) during 20 epochs. However, the VQA supervision is onlyadded after 10 epochs, following Tan et al. (2019). We set the learning rate to 10−4 withwarm starting and learning rate decay. The batch size is 512. Training is done on fourP100 GPUs.
fine-tuning details For NLVR2 (Suhr et al. 2019), we use the same fine-tuningstrategy as in Tan et al. (2019). Thus, we concatenate the two encoder’s output [CLS]embeddings – obtained with (img1, sentence) and (img2, sentence) pairs – and pass themthrough a feed-forward layer. We then use a binary cross-entropy loss. We fine-tuneduring 4 epochs using Adam optimizer (Kingma et al. 2014). The learning rate is set to5 ∗ 10−5 and the batch size is 32. We only supervise with the task-specific binary objective,i.e. we drop all the supervision signals used for encoder training. For the GQA result, wedirectly evaluate our pre-trained model without any fine-tuning step.
8.2.3.2 Results
visual question answering Table 8.1 compares the results of applying our vision-language encoder on the VQA task versus the recent published works. As one may observe,our model obtains the 2nd-best SOTA result 1, just after the NSM model (Hudson et al.2019a). The latter is fundamentally different from our approach (contrary to NSM, ourapproach does not rely on the supervision of the scene graphs predictor). Moreover, itis important to highlight that, unlike previous work (Tan et al. 2019; Lu et al. 2019), ourmodel has not been fine-tuned on the target dataset after the main training step – i.e. wekept the same encoder and prediction head used in the pre-training step – making theobtained result even more significant.
In order to quantify the impact of our object-word alignment weak supervision on theVQA task, we evaluate the two versions of our model, with and without the proposedloss, on the GQA dataset. The results are reported in Table 8.2. One may observe that theproposed weak supervision boosts the accuracy with +5.6 points. Moreover, when wefocus on the consistency metric, our weakly-supervised alignment allows gaining more
1. At the time of writing the related publication, in December 2019.
111
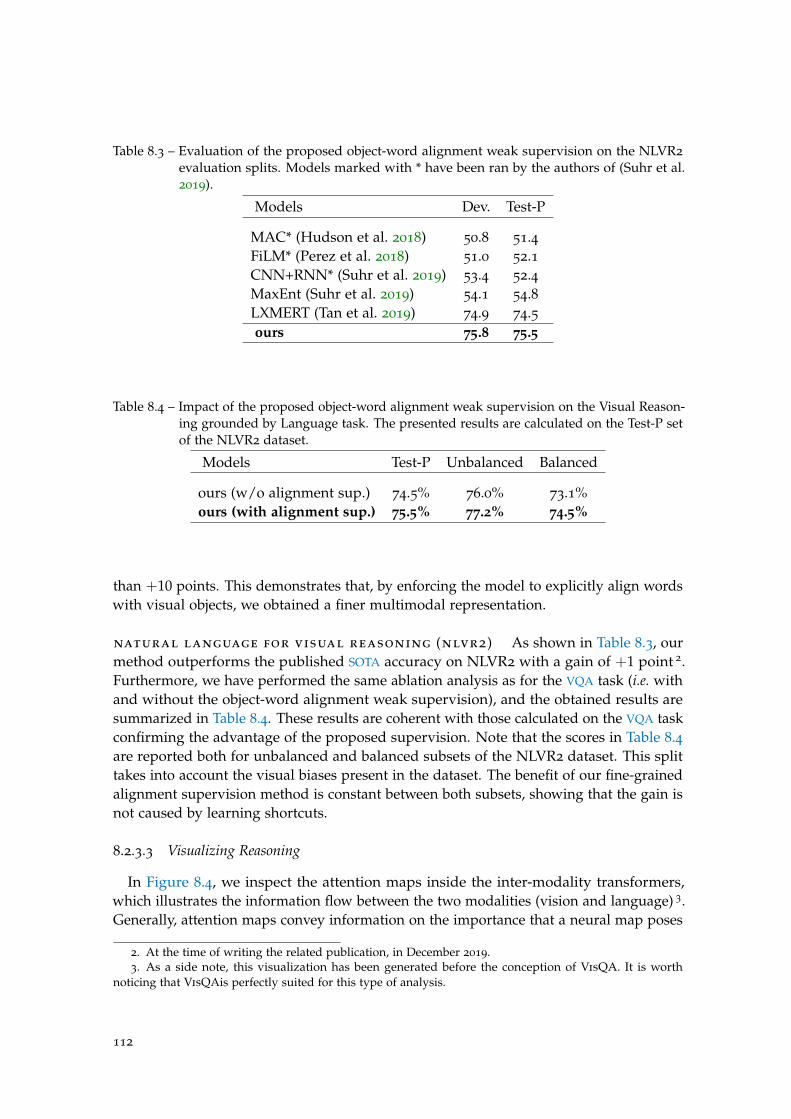
Table 8.3 – Evaluation of the proposed object-word alignment weak supervision on the NLVR2
evaluation splits. Models marked with * have been ran by the authors of (Suhr et al.2019).
Models Dev. Test-P
MAC* (Hudson et al. 2018) 50.8 51.4FiLM* (Perez et al. 2018) 51.0 52.1CNN+RNN* (Suhr et al. 2019) 53.4 52.4MaxEnt (Suhr et al. 2019) 54.1 54.8LXMERT (Tan et al. 2019) 74.9 74.5ours 75.8 75.5
Table 8.4 – Impact of the proposed object-word alignment weak supervision on the Visual Reason-ing grounded by Language task. The presented results are calculated on the Test-P setof the NLVR2 dataset.
Models Test-P Unbalanced Balanced
ours (w/o alignment sup.) 74.5% 76.0% 73.1%ours (with alignment sup.) 75.5% 77.2% 74.5%
than +10 points. This demonstrates that, by enforcing the model to explicitly align wordswith visual objects, we obtained a finer multimodal representation.
natural language for visual reasoning (nlvr2) As shown in Table 8.3, ourmethod outperforms the published SOTA accuracy on NLVR2 with a gain of +1 point 2.Furthermore, we have performed the same ablation analysis as for the VQA task (i.e. withand without the object-word alignment weak supervision), and the obtained results aresummarized in Table 8.4. These results are coherent with those calculated on the VQA taskconfirming the advantage of the proposed supervision. Note that the scores in Table 8.4are reported both for unbalanced and balanced subsets of the NLVR2 dataset. This splittakes into account the visual biases present in the dataset. The benefit of our fine-grainedalignment supervision method is constant between both subsets, showing that the gain isnot caused by learning shortcuts.
8.2.3.3 Visualizing Reasoning
In Figure 8.4, we inspect the attention maps inside the inter-modality transformers,which illustrates the information flow between the two modalities (vision and language) 3.Generally, attention maps convey information on the importance that a neural map poses
2. At the time of writing the related publication, in December 2019.3. As a side note, this visualization has been generated before the conception of VisQA. It is worth
noticing that VisQAis perfectly suited for this type of analysis.
112
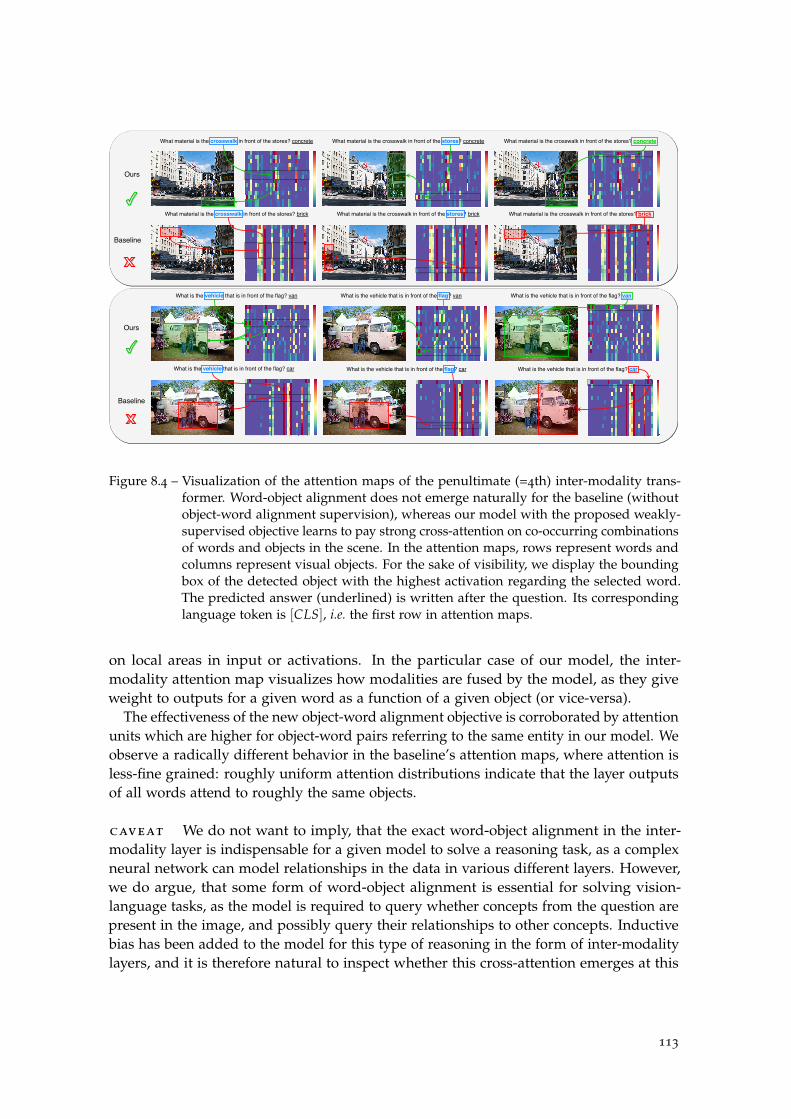
What material is the crosswalk in front of the stores? concrete What material is the crosswalk in front of the stores? concrete What material is the crosswalk in front of the stores? concrete
What material is the crosswalk in front of the stores? brick What material is the crosswalk in front of the stores? brick What material is the crosswalk in front of the stores? brick
Ours
Baseline
What is the vehicle that is in front of the flag? van
Ours
Baseline
What is the vehicle that is in front of the flag? van What is the vehicle that is in front of the flag? van
What is the vehicle that is in front of the flag? car What is the vehicle that is in front of the flag? car What is the vehicle that is in front of the flag? car
Figure 8.4 – Visualization of the attention maps of the penultimate (=4th) inter-modality trans-former. Word-object alignment does not emerge naturally for the baseline (withoutobject-word alignment supervision), whereas our model with the proposed weakly-supervised objective learns to pay strong cross-attention on co-occurring combinationsof words and objects in the scene. In the attention maps, rows represent words andcolumns represent visual objects. For the sake of visibility, we display the boundingbox of the detected object with the highest activation regarding the selected word.The predicted answer (underlined) is written after the question. Its correspondinglanguage token is [CLS], i.e. the first row in attention maps.
on local areas in input or activations. In the particular case of our model, the inter-modality attention map visualizes how modalities are fused by the model, as they giveweight to outputs for a given word as a function of a given object (or vice-versa).
The effectiveness of the new object-word alignment objective is corroborated by attentionunits which are higher for object-word pairs referring to the same entity in our model. Weobserve a radically different behavior in the baseline’s attention maps, where attention isless-fine grained: roughly uniform attention distributions indicate that the layer outputsof all words attend to roughly the same objects.
caveat We do not want to imply, that the exact word-object alignment in the inter-modality layer is indispensable for a given model to solve a reasoning task, as a complexneural network can model relationships in the data in various different layers. However,we do argue, that some form of word-object alignment is essential for solving vision-language tasks, as the model is required to query whether concepts from the question arepresent in the image, and possibly query their relationships to other concepts. Inductivebias has been added to the model for this type of reasoning in the form of inter-modalitylayers, and it is therefore natural to inspect whether this cross-attention emerges at this
113
exact place. We would also like to point out that we do not force or favor word-objectalignment at a specific layer, as our proposed supervision signal is injected through a newmodule attached to the inter-modality layer (see Figure 8.2). The attention maps showthat the supervision signal is successfully propagated from the new alignment head tothe inter-modality layer.
8.3 sample complexity of reasoning supervision
In the previous section, we experimentally show the benefit of guiding the reasoningprocess through supervision. Why does this additional supervision help to learn reasoning ?.
In this section we focus on supervising reasoning programs, i.e. we suppose thatthe exact logical function computing the output answer from input is known duringtraining time (not during testing). We provide a theoretical analysis indicating that theprediction and supervision of reasoning can improve learnability in vision and languagereasoning under some assumptions. We back up this claim through a theoretical analysisshowing decreased sample complexity under mild hypotheses. This will be experimentallyconfirmed in chapter 9.
8.3.1 Measuring complexity of learning problems
Measuring complexity of learning problems and thus generalization, has been a goal oftheoretical machine learning since the early days, with a large body of work based onPAC-Learning (Valiant 1984; S. Shalev-Shwart et al. 2014). Traditionally, bounds havebeen provided ignoring data distributions and focusing uniquely on hypothesis classes(network structures in neural network language), e.g. as measured by VC-dimension.Surprising experimental results on training networks on random samples have seeminglycontradicted learning theory (Zhang et al. 2017), in particular Rademacher Complexity.To cope with this, we use the modern estimators of sample complexity developed forthe deep learning era (see Belkin (2021) for an overview), which provide the possibilityof calculating tighter bounds under the assumption that learning is performed by over-parametrized deep networks and stochastic gradient descent. These estimators aredata-dependent and as such more powerful.
Within this framework, in particular the work of Arora et al. (2019), sample complexityis linked to the functional form of the decision function directly. If the functional form issimpler, learning it requires fewer samples. Arora et al. (2019) provides a direct way toestimate sample complexity, if the functional form is known, or through its estimation fromtraining data in the form of a stochastic Gram matrix. Algorithmic alignment betweenneural network structures and the decomposition of underlying reasoning functionshas been studied in Xu et al. (2020), with a focus on algorithms based on dynamicprogramming. Our theoretical contribution in Section 8.3.2 builds on the latter twomethodologies and extends this type of analysis to intermediate supervision of reasoningprograms.
114
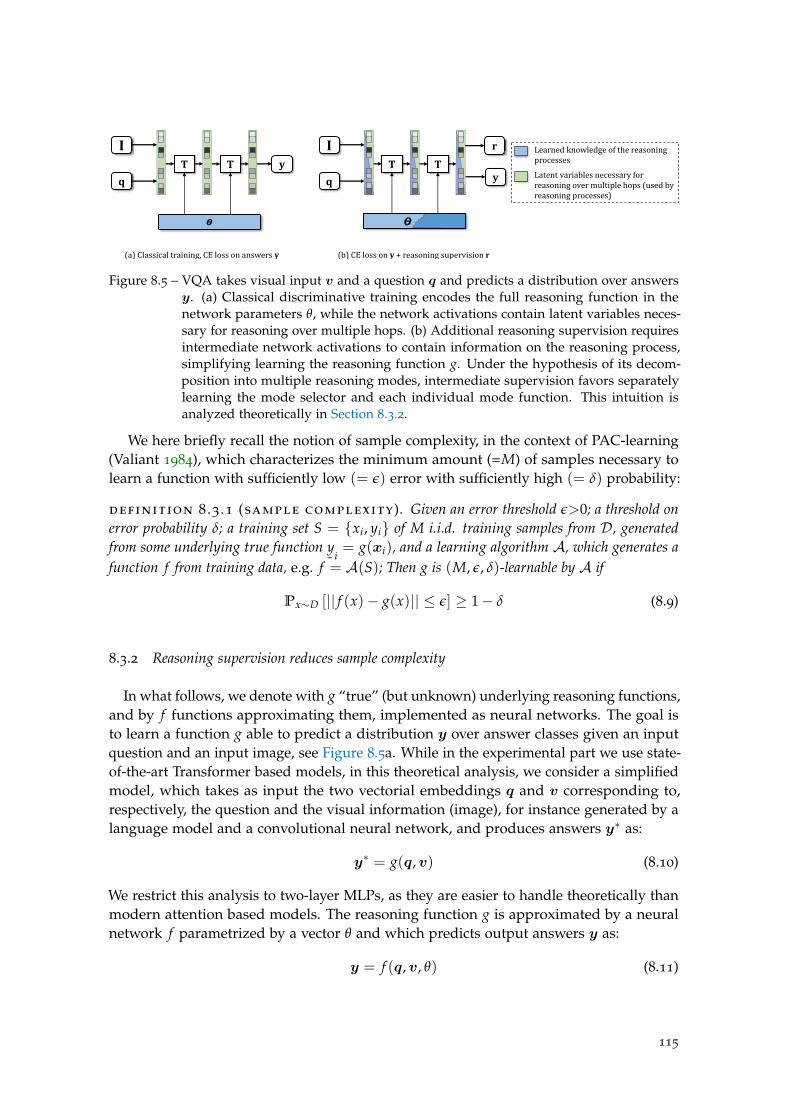
Figure 8.5 – VQA takes visual input v and a question q and predicts a distribution over answersy. (a) Classical discriminative training encodes the full reasoning function in thenetwork parameters θ, while the network activations contain latent variables neces-sary for reasoning over multiple hops. (b) Additional reasoning supervision requiresintermediate network activations to contain information on the reasoning process,simplifying learning the reasoning function g. Under the hypothesis of its decom-position into multiple reasoning modes, intermediate supervision favors separatelylearning the mode selector and each individual mode function. This intuition isanalyzed theoretically in Section 8.3.2.
We here briefly recall the notion of sample complexity, in the context of PAC-learning(Valiant 1984), which characterizes the minimum amount (=M) of samples necessary tolearn a function with sufficiently low (= ε) error with sufficiently high (= δ) probability:
definition 8 .3 .1 (sample complexity). Given an error threshold ε>0; a threshold onerror probability δ; a training set S = {xi, yi} of M i.i.d. training samples from D, generatedfrom some underlying true function y
¯ i= g(xi), and a learning algorithm A, which generates a
function f from training data, e.g. f = A(S); Then g is (M, ε, δ)-learnable by A if
Px∼D [|| f (x)− g(x)|| ≤ ε] ≥ 1− δ (8.9)
8.3.2 Reasoning supervision reduces sample complexity
In what follows, we denote with g “true” (but unknown) underlying reasoning functions,and by f functions approximating them, implemented as neural networks. The goal isto learn a function g able to predict a distribution y over answer classes given an inputquestion and an input image, see Figure 8.5a. While in the experimental part we use state-of-the-art Transformer based models, in this theoretical analysis, we consider a simplifiedmodel, which takes as input the two vectorial embeddings q and v corresponding to,respectively, the question and the visual information (image), for instance generated by alanguage model and a convolutional neural network, and produces answers y∗ as:
y∗ = g(q, v) (8.10)
We restrict this analysis to two-layer MLPs, as they are easier to handle theoretically thanmodern attention based models. The reasoning function g is approximated by a neuralnetwork f parametrized by a vector θ and which predicts output answers y as:
y = f (q, v, θ) (8.11)
115
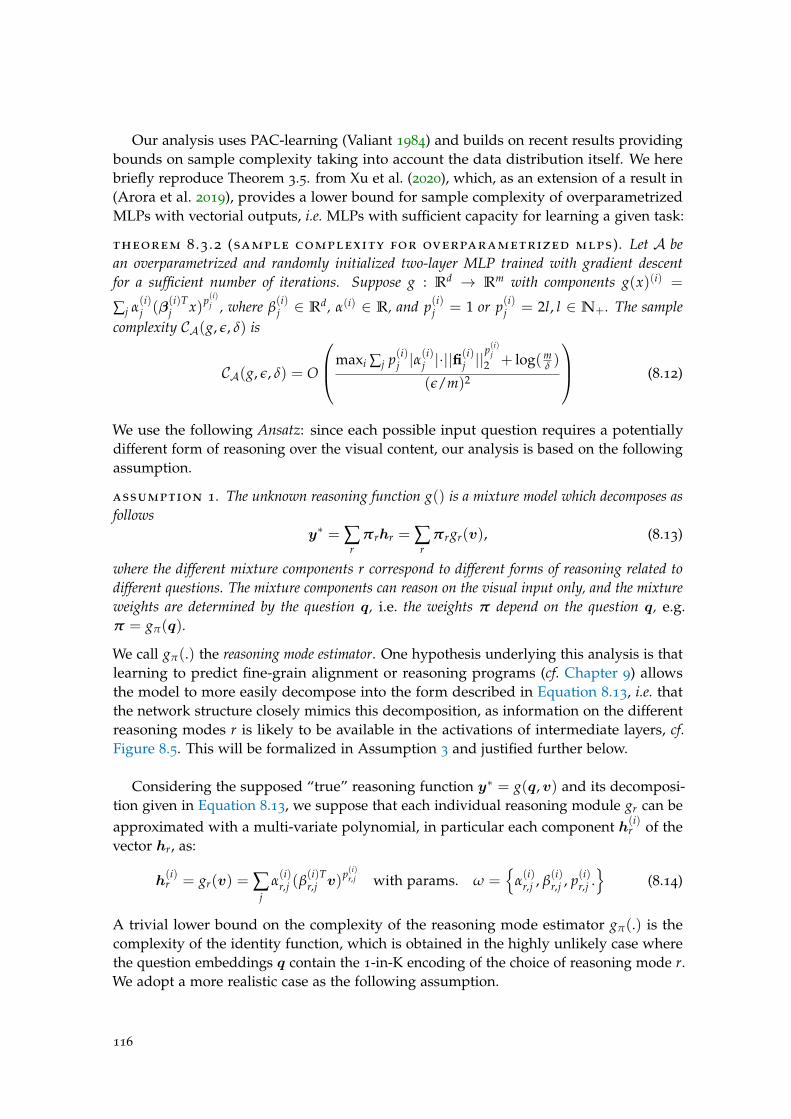
Our analysis uses PAC-learning (Valiant 1984) and builds on recent results providingbounds on sample complexity taking into account the data distribution itself. We herebriefly reproduce Theorem 3.5. from Xu et al. (2020), which, as an extension of a result in(Arora et al. 2019), provides a lower bound for sample complexity of overparametrizedMLPs with vectorial outputs, i.e. MLPs with sufficient capacity for learning a given task:
theorem 8 .3 .2 (sample complexity for overparametrized mlps). Let A bean overparametrized and randomly initialized two-layer MLP trained with gradient descentfor a sufficient number of iterations. Suppose g : Rd → Rm with components g(x)(i) =
∑j α(i)j (β
(i)Tj x)p(i)j , where β
(i)j ∈ Rd, α(i) ∈ R, and p(i)j = 1 or p(i)j = 2l, l ∈ N+. The sample
complexity CA(g, ε, δ) is
CA(g, ε, δ) = O
maxi ∑j p(i)j |α(i)j |·||fi
(i)j ||
p(i)j2 + log(m
δ )
(ε/m)2
(8.12)
We use the following Ansatz: since each possible input question requires a potentiallydifferent form of reasoning over the visual content, our analysis is based on the followingassumption.
assumption 1. The unknown reasoning function g() is a mixture model which decomposes asfollows
y∗ = ∑r
πrhr = ∑r
πrgr(v), (8.13)
where the different mixture components r correspond to different forms of reasoning related todifferent questions. The mixture components can reason on the visual input only, and the mixtureweights are determined by the question q, i.e. the weights π depend on the question q, e.g.π = gπ(q).
We call gπ(.) the reasoning mode estimator. One hypothesis underlying this analysis is thatlearning to predict fine-grain alignment or reasoning programs (cf. Chapter 9) allowsthe model to more easily decompose into the form described in Equation 8.13, i.e. thatthe network structure closely mimics this decomposition, as information on the differentreasoning modes r is likely to be available in the activations of intermediate layers, cf.Figure 8.5. This will be formalized in Assumption 3 and justified further below.
Considering the supposed “true” reasoning function y∗ = g(q, v) and its decomposi-tion given in Equation 8.13, we suppose that each individual reasoning module gr can beapproximated with a multi-variate polynomial, in particular each component h(i)
r of thevector hr, as:
h(i)r = gr(v) = ∑
jα(i)r,j (β
(i)Tr,j v)
p(i)r,j with params. ω ={
α(i)r,j , β
(i)r,j , p(i)r,j .
}(8.14)
A trivial lower bound on the complexity of the reasoning mode estimator gπ(.) is thecomplexity of the identity function, which is obtained in the highly unlikely case wherethe question embeddings q contain the 1-in-K encoding of the choice of reasoning mode r.We adopt a more realistic case as the following assumption.
116
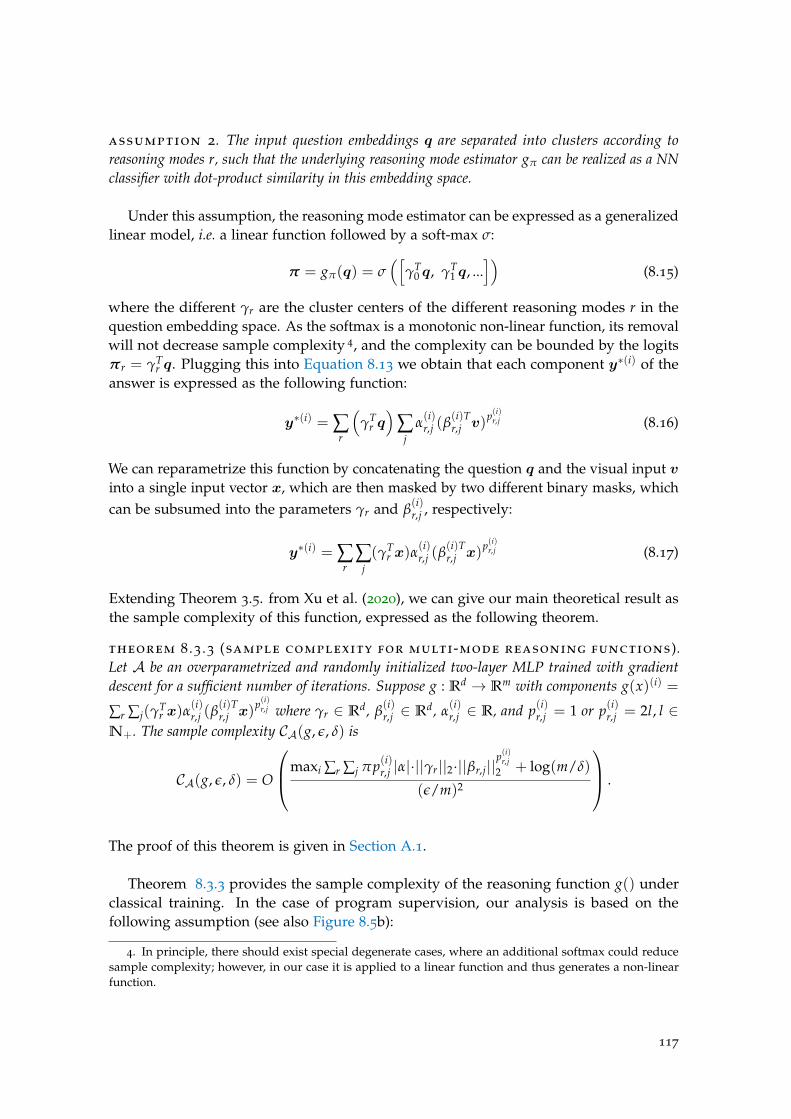
assumption 2. The input question embeddings q are separated into clusters according toreasoning modes r, such that the underlying reasoning mode estimator gπ can be realized as a NNclassifier with dot-product similarity in this embedding space.
Under this assumption, the reasoning mode estimator can be expressed as a generalizedlinear model, i.e. a linear function followed by a soft-max σ:
π = gπ(q) = σ([
γT0 q, γT
1 q, ...])
(8.15)
where the different γr are the cluster centers of the different reasoning modes r in thequestion embedding space. As the softmax is a monotonic non-linear function, its removalwill not decrease sample complexity 4, and the complexity can be bounded by the logitsπr = γT
r q. Plugging this into Equation 8.13 we obtain that each component y∗(i) of theanswer is expressed as the following function:
y∗(i) = ∑r
(γT
r q)
∑j
α(i)r,j (β
(i)Tr,j v)
p(i)r,j (8.16)
We can reparametrize this function by concatenating the question q and the visual input vinto a single input vector x, which are then masked by two different binary masks, whichcan be subsumed into the parameters γr and β
(i)r,j , respectively:
y∗(i) = ∑r
∑j(γT
r x)α(i)r,j (β
(i)Tr,j x)
p(i)r,j (8.17)
Extending Theorem 3.5. from Xu et al. (2020), we can give our main theoretical result asthe sample complexity of this function, expressed as the following theorem.
theorem 8 .3 .3 (sample complexity for multi-mode reasoning functions).Let A be an overparametrized and randomly initialized two-layer MLP trained with gradientdescent for a sufficient number of iterations. Suppose g : Rd → Rm with components g(x)(i) =
∑r ∑j(γTr x)α
(i)r,j (β
(i)Tr,j x)
p(i)r,j where γr ∈ Rd, β(i)r,j ∈ Rd, α
(i)r,j ∈ R, and p(i)r,j = 1 or p(i)r,j = 2l, l ∈
N+. The sample complexity CA(g, ε, δ) is
CA(g, ε, δ) = O
maxi ∑r ∑j πp(i)r,j |α|·||γr||2·||βr,j||p(i)r,j2 + log(m/δ)
(ε/m)2
.
The proof of this theorem is given in Section A.1.
Theorem 8.3.3 provides the sample complexity of the reasoning function g() underclassical training. In the case of program supervision, our analysis is based on thefollowing assumption (see also Figure 8.5b):
4. In principle, there should exist special degenerate cases, where an additional softmax could reducesample complexity; however, in our case it is applied to a linear function and thus generates a non-linearfunction.
117
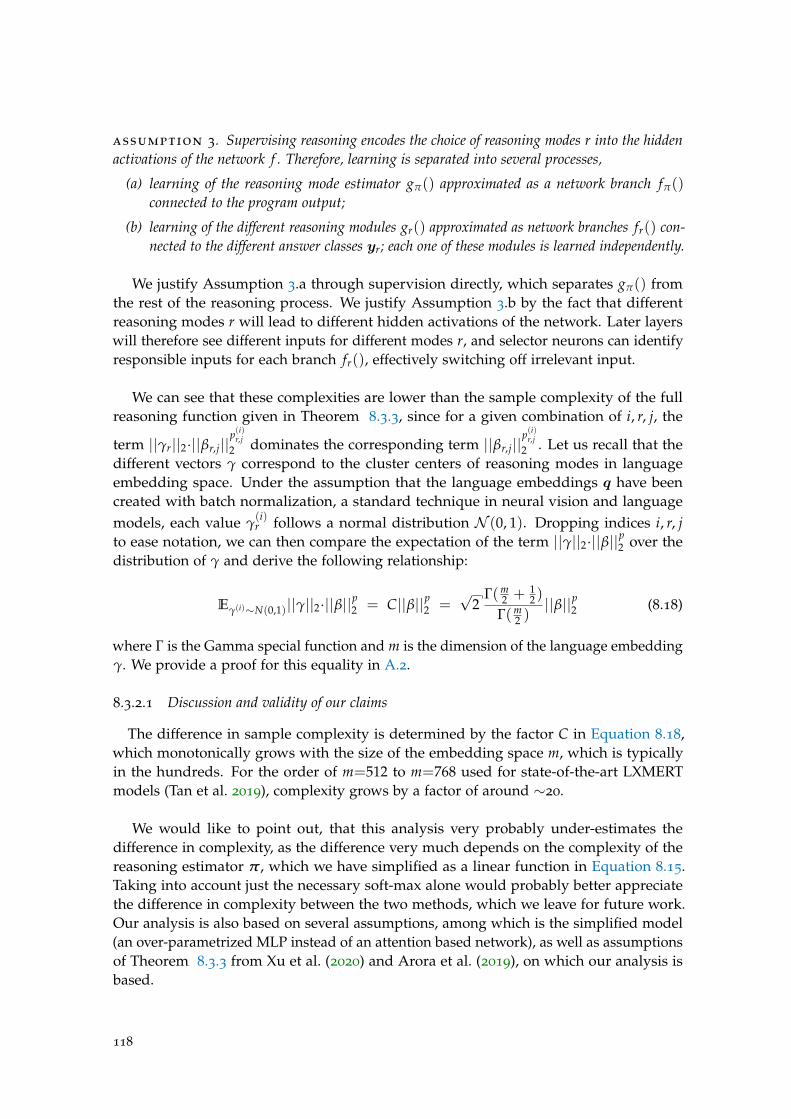
assumption 3. Supervising reasoning encodes the choice of reasoning modes r into the hiddenactivations of the network f . Therefore, learning is separated into several processes,
(a) learning of the reasoning mode estimator gπ() approximated as a network branch fπ()
connected to the program output;
(b) learning of the different reasoning modules gr() approximated as network branches fr() con-nected to the different answer classes yr; each one of these modules is learned independently.
We justify Assumption 3.a through supervision directly, which separates gπ() fromthe rest of the reasoning process. We justify Assumption 3.b by the fact that differentreasoning modes r will lead to different hidden activations of the network. Later layerswill therefore see different inputs for different modes r, and selector neurons can identifyresponsible inputs for each branch fr(), effectively switching off irrelevant input.
We can see that these complexities are lower than the sample complexity of the fullreasoning function given in Theorem 8.3.3, since for a given combination of i, r, j, the
term ||γr||2·||βr,j||p(i)r,j2 dominates the corresponding term ||βr,j||
p(i)r,j2 . Let us recall that the
different vectors γ correspond to the cluster centers of reasoning modes in languageembedding space. Under the assumption that the language embeddings q have beencreated with batch normalization, a standard technique in neural vision and languagemodels, each value γ
(i)r follows a normal distribution N (0, 1). Dropping indices i, r, j
to ease notation, we can then compare the expectation of the term ||γ||2·||β||p2 over thedistribution of γ and derive the following relationship:
Eγ(i)∼N(0,1)||γ||2·||β||p2 = C||β||p2 =
√2
Γ(m2 + 1
2 )
Γ(m2 )||β||p2 (8.18)
where Γ is the Gamma special function and m is the dimension of the language embeddingγ. We provide a proof for this equality in A.2.
8.3.2.1 Discussion and validity of our claims
The difference in sample complexity is determined by the factor C in Equation 8.18,which monotonically grows with the size of the embedding space m, which is typicallyin the hundreds. For the order of m=512 to m=768 used for state-of-the-art LXMERTmodels (Tan et al. 2019), complexity grows by a factor of around ∼20.
We would like to point out, that this analysis very probably under-estimates thedifference in complexity, as the difference very much depends on the complexity of thereasoning estimator π, which we have simplified as a linear function in Equation 8.15.Taking into account just the necessary soft-max alone would probably better appreciatethe difference in complexity between the two methods, which we leave for future work.Our analysis is also based on several assumptions, among which is the simplified model(an over-parametrized MLP instead of an attention based network), as well as assumptionsof Theorem 8.3.3 from Xu et al. (2020) and Arora et al. (2019), on which our analysis isbased.
118
Lastly, we would like to comment on the fact that we compare two different bounds:(i) the bound on sample complexity for learning the full multi-modal reasoning given inTheorem 8.3.3, and (ii) the bound for learning a single reasoning mode given by Theorem8.3.2. While comparing bounds does not provide definitive answers on the order of
models, both bounds have been derived by the same algebraic manipulations, and weclaim that they are comparable.
We also provide an experimental evaluation of the sample complexity of both variants,with and without program supervision, in section 9.3.2.2, Figure 9.6.
8.4 conclusion
In this chapter, we have demonstrated that it is possible to improve the reasoningabilities of VQA models by designing an additional supervision loss. In particular, wepropose to guide the learning of reasoning during the VL-Transformer training throughthe weak supervision of the fine-grained word-object alignment. We experimentallyshow that our method improves the performance on GQA, and generalizes well to thelanguage-driven comparison of images, another visual reasoning task. Furthermore, ourexperiments are supported by a theoretical analysis, providing cues on the benefit ofthis additional supervision. More precisely, we leverage theorems from PAC-learning todemonstrate that program supervision can decrease sample complexity, under reasonablehypothesis. In the next Chapter 9, we will show how this reasoning supervision canbe used as a catalyst for transferring reasoning patterns learned on perfect trainingconditions.
119

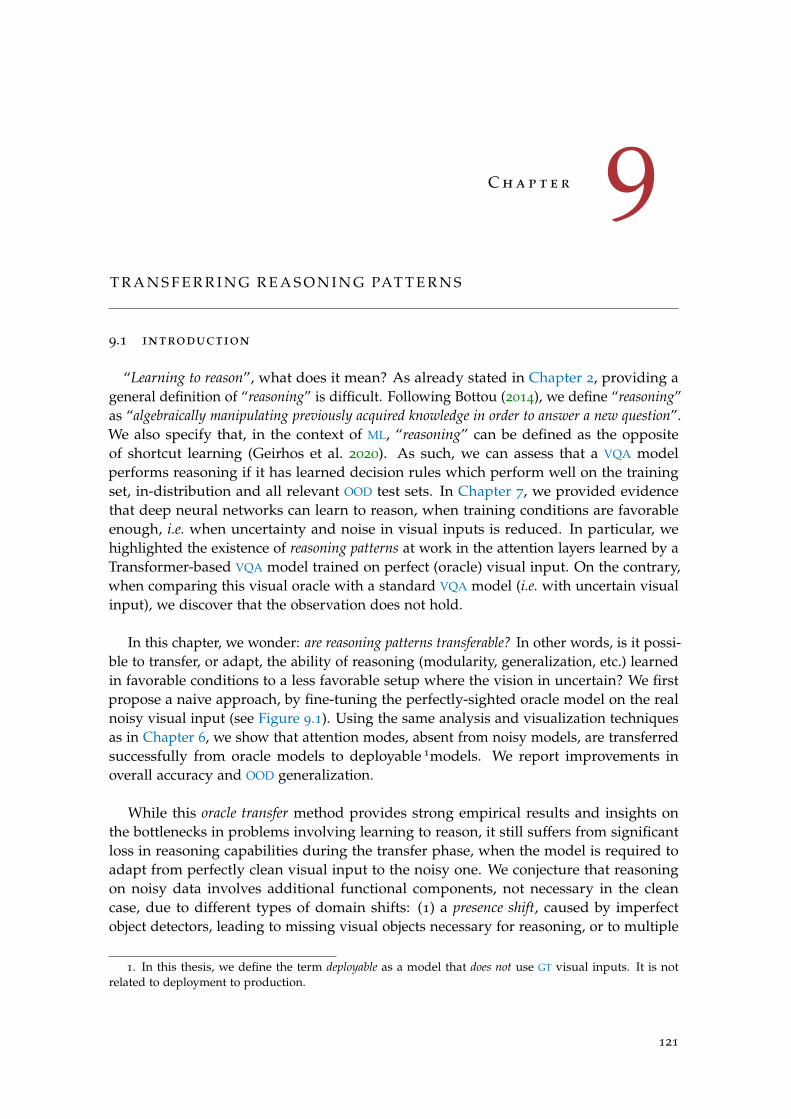
C h a p t e r 9
T R A N S F E R R I N G R E A S O N I N G PAT T E R N S
9.1 introduction
“Learning to reason”, what does it mean? As already stated in Chapter 2, providing ageneral definition of “reasoning” is difficult. Following Bottou (2014), we define “reasoning”as “algebraically manipulating previously acquired knowledge in order to answer a new question”.We also specify that, in the context of ML, “reasoning” can be defined as the oppositeof shortcut learning (Geirhos et al. 2020). As such, we can assess that a VQA modelperforms reasoning if it has learned decision rules which perform well on the trainingset, in-distribution and all relevant OOD test sets. In Chapter 7, we provided evidencethat deep neural networks can learn to reason, when training conditions are favorableenough, i.e. when uncertainty and noise in visual inputs is reduced. In particular, wehighlighted the existence of reasoning patterns at work in the attention layers learned by aTransformer-based VQA model trained on perfect (oracle) visual input. On the contrary,when comparing this visual oracle with a standard VQA model (i.e. with uncertain visualinput), we discover that the observation does not hold.
In this chapter, we wonder: are reasoning patterns transferable? In other words, is it possi-ble to transfer, or adapt, the ability of reasoning (modularity, generalization, etc.) learnedin favorable conditions to a less favorable setup where the vision in uncertain? We firstpropose a naive approach, by fine-tuning the perfectly-sighted oracle model on the realnoisy visual input (see Figure 9.1). Using the same analysis and visualization techniquesas in Chapter 6, we show that attention modes, absent from noisy models, are transferredsuccessfully from oracle models to deployable 1models. We report improvements inoverall accuracy and OOD generalization.
While this oracle transfer method provides strong empirical results and insights onthe bottlenecks in problems involving learning to reason, it still suffers from significantloss in reasoning capabilities during the transfer phase, when the model is required toadapt from perfectly clean visual input to the noisy one. We conjecture that reasoningon noisy data involves additional functional components, not necessary in the cleancase, due to different types of domain shifts: (1) a presence shift, caused by imperfectobject detectors, leading to missing visual objects necessary for reasoning, or to multiple
1. In this thesis, we define the term deployable as a model that does not use GT visual inputs. It is notrelated to deployment to production.
121
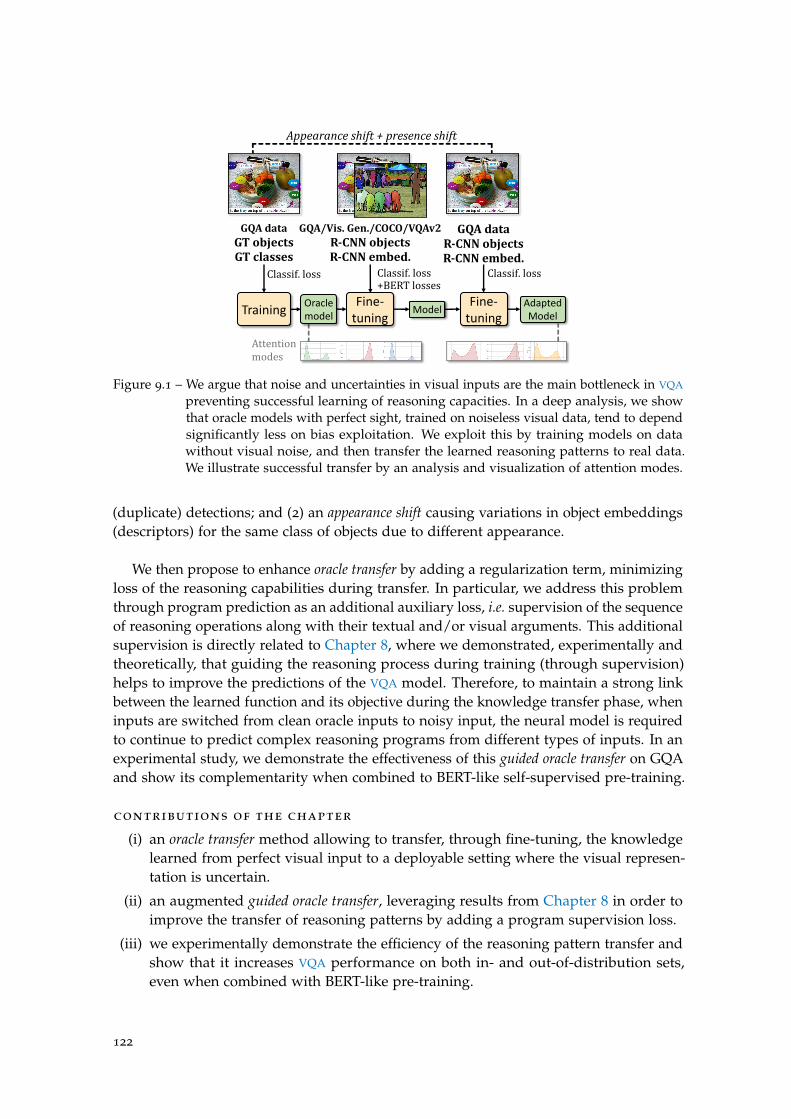
GQAdataGTobjectsGTclasses
GQAdataR-CNNobjectsR-CNNembed.
GQA/Vis.Gen./COCO/VQAv2R-CNNobjectsR-CNNembed.
Appearanceshift+presenceshift
Oracle model
Fine-tuning
Model AdaptedModel
Fine-tuningTraining
Classif.loss+BERTlosses
Classif.loss Classif.loss
Attentionmodes
Figure 9.1 – We argue that noise and uncertainties in visual inputs are the main bottleneck in VQA
preventing successful learning of reasoning capacities. In a deep analysis, we showthat oracle models with perfect sight, trained on noiseless visual data, tend to dependsignificantly less on bias exploitation. We exploit this by training models on datawithout visual noise, and then transfer the learned reasoning patterns to real data.We illustrate successful transfer by an analysis and visualization of attention modes.
(duplicate) detections; and (2) an appearance shift causing variations in object embeddings(descriptors) for the same class of objects due to different appearance.
We then propose to enhance oracle transfer by adding a regularization term, minimizingloss of the reasoning capabilities during transfer. In particular, we address this problemthrough program prediction as an additional auxiliary loss, i.e. supervision of the sequenceof reasoning operations along with their textual and/or visual arguments. This additionalsupervision is directly related to Chapter 8, where we demonstrated, experimentally andtheoretically, that guiding the reasoning process during training (through supervision)helps to improve the predictions of the VQA model. Therefore, to maintain a strong linkbetween the learned function and its objective during the knowledge transfer phase, wheninputs are switched from clean oracle inputs to noisy input, the neural model is requiredto continue to predict complex reasoning programs from different types of inputs. In anexperimental study, we demonstrate the effectiveness of this guided oracle transfer on GQAand show its complementarity when combined to BERT-like self-supervised pre-training.
contributions of the chapter
(i) an oracle transfer method allowing to transfer, through fine-tuning, the knowledgelearned from perfect visual input to a deployable setting where the visual represen-tation is uncertain.
(ii) an augmented guided oracle transfer, leveraging results from Chapter 8 in order toimprove the transfer of reasoning patterns by adding a program supervision loss.
(iii) we experimentally demonstrate the efficiency of the reasoning pattern transfer andshow that it increases VQA performance on both in- and out-of-distribution sets,even when combined with BERT-like pre-training.
122
9.2 transferring reasoning patterns from oracle
Our purpose is to transfer the reasoning patterns learned by a visual oracle, whenthe uncertainty in the visual input is reduced, to a standard model taking as input theimperfect image representation extracted by an object detector. Therefore, we proposea method called oracle transfer. It consists in first pre-training the VQA model on theoracle (perfect) visual input, and then further training on the standard (noisy) data. InChapter 7, we conjecture that the uncertainty in vision is one of the major cause leadingto shortcut learning. Therefore, we argue that the first optimization steps are crucial forthe emergence of specific attention modes, and claim that such oracle pre-training putsthe model in favorable condition for avoiding learning shortcuts.
9.2.1 Method: oracle transfer
oracle transfer As shown in Figure 9.1, training proceeds as follows:
1. Training of a perfectly-sighted oracle model on GT visual inputs from the GQAannotations, in particular a symbolic representation concatenating the 1-in-K encodedobject class and attributes of each object.
2. Initializing a new model with the oracle parameters. This new model is taking noisyvisual input in a form of the dense representation (2048-dim feature vector extractedby Faster-RCNN (Ren et al. 2015) fused with bounding-boxes). The first visual layers(TV− ) are initialized randomly due to the difference in nature between dense and
symbolic representations.
3. Optionally and complementary, continue training with large-scale self-supervisedobjectives (LXMERT (Tan et al. 2019)/BERT-like) on combined data from VisualGenome (Krishna et al. 2017), MS COCO (Lin et al. 2014), VQAv2 (Goyal et al. 2017).
4. Fine-tuning with the standard VQA classification objective on the target dataset (GQAor VQAv2).
9.2.2 Experimental evaluation
9.2.2.1 Setup
dataset Our models are trained on the balanced GQA (Hudson et al. 2019b) trainingset (∼1M question-answer pairs). LXMERT pretraining is done on the on a corpus gather-ing images and sentences from MSCOCO (Lin et al. 2014) and VisualGenome (Krishnaet al. 2017). Note that, as the GQA dataset is built upon VisualGenome, the originalLXMERT pre-training dataset contains samples from the GQA validation split. Therefore,we removed these validation samples from the pre-training corpus, in order to be able to validateon the GQA validation split. We evaluate on the GQA, our own gqa-ood (cf. Chapter 5)and VQAv2 (Goyal et al. 2017) datasets.
architecture We use the same compact VL-Transformer architecture as defined inChapter 3.
123
Oracle(a)
overall
(b)choosecolor
Oracle transfer(c)
overall
(d)choosecolor
Figure 9.2 – We reproduce Figure 7.5, (a) and (b), with our VL-Transformer + dense Oracle Transfer(same heads/layers). As we can see in (c), the attention heads have retained their“bimorph” property, although their shape is distorted by the noisy visual training. Inaddition, when we measure the attention mode on questions involving the choose
color function, in (d), we observe that the attention heads are still function-dependant,although in a lesser extent.
training details All models were trained with the Adam optimizer (Kingma et al.2014), a learning rate of 10−4 with warm starting and learning rate decay. Training wasdone on one P100 GPU. Two P100 GPUs were used for BERT/LXMERT (Tan et al. 2019)pre-training. For the oracle, the batch size was equal to 256. We train during 40 epochs andselect the best epoch using accuracy on validation. The oracle transfer follows exactly thesame procedure, except when using LXMERT pretraining. In that case, BERT/LXMERTpretraining is performed during 20 epochs max with a batch size of 512. All pretraininglosses are added from the beginning, including the VQA one. After pre-training, wefine-tune either on GQA or VQAv2. For GQA, we fine-tune during 4 epochs, with a batchsize of 32 and a learning rate equal to 10−5. For VQAv2, we fine-tune during 8 epochs,with a batch size of 32 and a learning rate equal to 10−5. Hyperparameters are selectedeither on the testdev (for VQAv2) or validation (for gqa-ood and GQA) sets
9.2.2.2 Results
evaluating transfer We evaluate the impact of Oracle Transfer on three differentbenchmarks in Table 9.1, observing that transferring knowledge from the oracle signifi-cantly boosts accuracy. We also evaluate the effect of Oracle Transfer on bias reduction andbenchmark on gqa-ood (cf. Chapter 5), reporting gains in OOD settings — rare samples,“acc-tail” — by a large margin, which suggests improved generalization ability. Ourexperiments show that Oracle Transfer is complementary to large-scale vision-languageself-supervised objectives of type LXMERT/BERT-like pretraining as introduced in (Tanet al. 2019). An overall gain of about +1 accuracy points is observed from models (c) to (d)
124
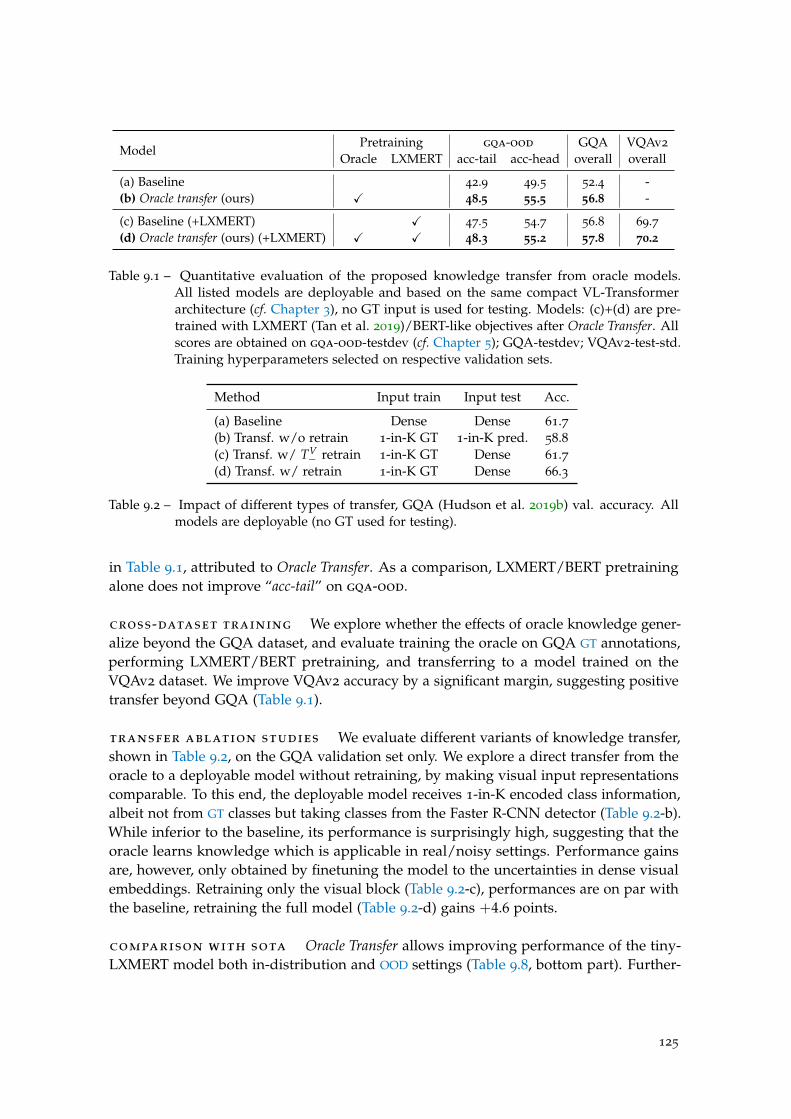
ModelPretraining gqa-ood GQA VQAv2
Oracle LXMERT acc-tail acc-head overall overall
(a) Baseline 42.9 49.5 52.4 -(b) Oracle transfer (ours) X 48.5 55.5 56.8 -
(c) Baseline (+LXMERT) X 47.5 54.7 56.8 69.7(d) Oracle transfer (ours) (+LXMERT) X X 48.3 55.2 57.8 70.2
Table 9.1 – Quantitative evaluation of the proposed knowledge transfer from oracle models.All listed models are deployable and based on the same compact VL-Transformerarchitecture (cf. Chapter 3), no GT input is used for testing. Models: (c)+(d) are pre-trained with LXMERT (Tan et al. 2019)/BERT-like objectives after Oracle Transfer. Allscores are obtained on gqa-ood-testdev (cf. Chapter 5); GQA-testdev; VQAv2-test-std.Training hyperparameters selected on respective validation sets.
Method Input train Input test Acc.
(a) Baseline Dense Dense 61.7(b) Transf. w/o retrain 1-in-K GT 1-in-K pred. 58.8(c) Transf. w/ TV
− retrain 1-in-K GT Dense 61.7(d) Transf. w/ retrain 1-in-K GT Dense 66.3
Table 9.2 – Impact of different types of transfer, GQA (Hudson et al. 2019b) val. accuracy. Allmodels are deployable (no GT used for testing).
in Table 9.1, attributed to Oracle Transfer. As a comparison, LXMERT/BERT pretrainingalone does not improve “acc-tail” on gqa-ood.
cross-dataset training We explore whether the effects of oracle knowledge gener-alize beyond the GQA dataset, and evaluate training the oracle on GQA GT annotations,performing LXMERT/BERT pretraining, and transferring to a model trained on theVQAv2 dataset. We improve VQAv2 accuracy by a significant margin, suggesting positivetransfer beyond GQA (Table 9.1).
transfer ablation studies We evaluate different variants of knowledge transfer,shown in Table 9.2, on the GQA validation set only. We explore a direct transfer from theoracle to a deployable model without retraining, by making visual input representationscomparable. To this end, the deployable model receives 1-in-K encoded class information,albeit not from GT classes but taking classes from the Faster R-CNN detector (Table 9.2-b).While inferior to the baseline, its performance is surprisingly high, suggesting that theoracle learns knowledge which is applicable in real/noisy settings. Performance gainsare, however, only obtained by finetuning the model to the uncertainties in dense visualembeddings. Retraining only the visual block (Table 9.2-c), performances are on par withthe baseline, retraining the full model (Table 9.2-d) gains +4.6 points.
comparison with sota Oracle Transfer allows improving performance of the tiny-LXMERT model both in-distribution and OOD settings (Table 9.8, bottom part). Further-
125
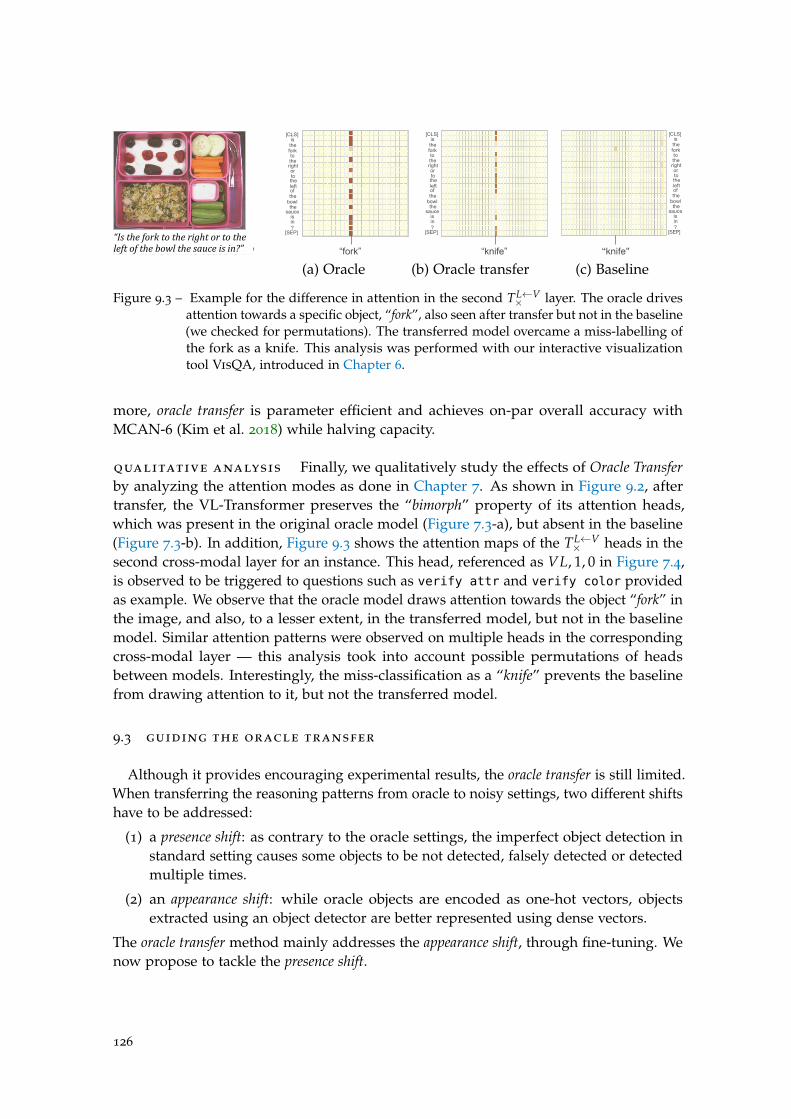
WKH
>&/6@
WKHVDXFH
LQ"
LV
WKH
RU
WKH
IRUN
LV
'RHV�WKH�EHQFK�ORRN�EURZQ�DQG�ZRRGHQ"
,V�WKH�IRUN�WR�WKH�ULJKW�RU�WR�WKH�OHIW�RI�WKH�ERZO�WKH�VDXFH�LV�LQ"
2UDFOH 2UDFOH�WUDQVIHU�SUHWUDLQ /;0(57
³NQLIH´ ŗNQLIHŘ³IRUN´
>&/6@
GRHVWKHEHQFKORRNEURZQDQGZRRGHQ">6(3@
>&/6@
'RHVWKHEHQFKORRNEURZQDQGZRRGHQ">6(3@
>6(3@
WR
ULJKW
WRWKH
ERZO
OHIWRI
WKH
>&/6@
WKHVDXFH
LQ"
LV
WKH
RU
WKH
IRUN
LV
>6(3@
WR
ULJKW
WRWKH
ERZO
OHIWRI
>&/6@
'RHVWKHEHQFKORRNEURZQDQGZRRGHQ">6(3@
³EHQFK´ ³EHQFK´
WKH
>&/6@
WKHVDXFH
LQ"
LV
WKH
RU
WKH
IRUN
LV
>6(3@
WR
ULJKW
WRWKH
ERZO
OHIWRI
³EHQFK´
“Istheforktotherightortotheleftofthebowlthesauceisin?”
(a) Oracle (b) Oracle transfer (c) Baseline
Figure 9.3 – Example for the difference in attention in the second TL←V× layer. The oracle drives
attention towards a specific object, “fork”, also seen after transfer but not in the baseline(we checked for permutations). The transferred model overcame a miss-labelling ofthe fork as a knife. This analysis was performed with our interactive visualizationtool VisQA, introduced in Chapter 6.
more, oracle transfer is parameter efficient and achieves on-par overall accuracy withMCAN-6 (Kim et al. 2018) while halving capacity.
qualitative analysis Finally, we qualitatively study the effects of Oracle Transferby analyzing the attention modes as done in Chapter 7. As shown in Figure 9.2, aftertransfer, the VL-Transformer preserves the “bimorph” property of its attention heads,which was present in the original oracle model (Figure 7.3-a), but absent in the baseline(Figure 7.3-b). In addition, Figure 9.3 shows the attention maps of the TL←V
× heads in thesecond cross-modal layer for an instance. This head, referenced as VL, 1, 0 in Figure 7.4,is observed to be triggered to questions such as verify attr and verify color providedas example. We observe that the oracle model draws attention towards the object “fork” inthe image, and also, to a lesser extent, in the transferred model, but not in the baselinemodel. Similar attention patterns were observed on multiple heads in the correspondingcross-modal layer — this analysis took into account possible permutations of headsbetween models. Interestingly, the miss-classification as a “knife” prevents the baselinefrom drawing attention to it, but not the transferred model.
9.3 guiding the oracle transfer
Although it provides encouraging experimental results, the oracle transfer is still limited.When transferring the reasoning patterns from oracle to noisy settings, two different shiftshave to be addressed:
(1) a presence shift: as contrary to the oracle settings, the imperfect object detection instandard setting causes some objects to be not detected, falsely detected or detectedmultiple times.
(2) an appearance shift: while oracle objects are encoded as one-hot vectors, objectsextracted using an object detector are better represented using dense vectors.
The oracle transfer method mainly addresses the appearance shift, through fine-tuning. Wenow propose to tackle the presence shift.
126
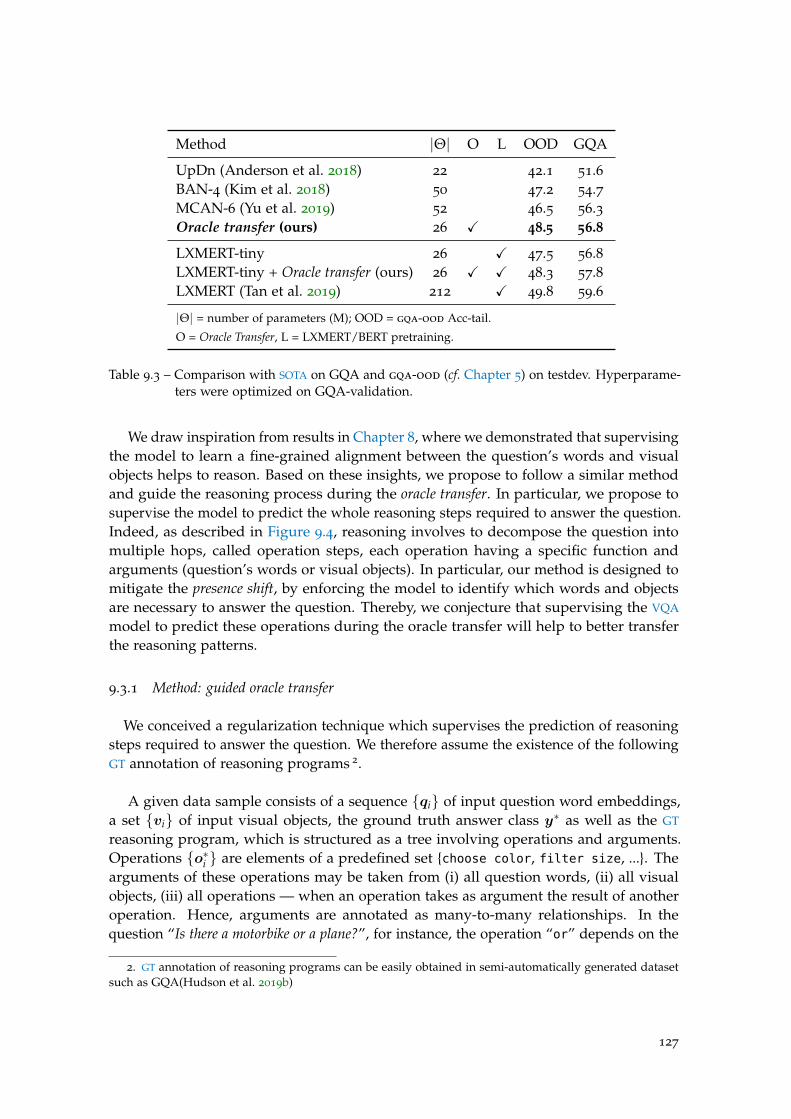
Method |Θ| O L OOD GQA
UpDn (Anderson et al. 2018) 22 42.1 51.6BAN-4 (Kim et al. 2018) 50 47.2 54.7MCAN-6 (Yu et al. 2019) 52 46.5 56.3Oracle transfer (ours) 26 X 48.5 56.8
LXMERT-tiny 26 X 47.5 56.8LXMERT-tiny + Oracle transfer (ours) 26 X X 48.3 57.8LXMERT (Tan et al. 2019) 212 X 49.8 59.6
|Θ| = number of parameters (M); OOD = gqa-ood Acc-tail.
O = Oracle Transfer, L = LXMERT/BERT pretraining.
Table 9.3 – Comparison with SOTA on GQA and gqa-ood (cf. Chapter 5) on testdev. Hyperparame-ters were optimized on GQA-validation.
We draw inspiration from results in Chapter 8, where we demonstrated that supervisingthe model to learn a fine-grained alignment between the question’s words and visualobjects helps to reason. Based on these insights, we propose to follow a similar methodand guide the reasoning process during the oracle transfer. In particular, we propose tosupervise the model to predict the whole reasoning steps required to answer the question.Indeed, as described in Figure 9.4, reasoning involves to decompose the question intomultiple hops, called operation steps, each operation having a specific function andarguments (question’s words or visual objects). In particular, our method is designed tomitigate the presence shift, by enforcing the model to identify which words and objectsare necessary to answer the question. Thereby, we conjecture that supervising the VQA
model to predict these operations during the oracle transfer will help to better transferthe reasoning patterns.
9.3.1 Method: guided oracle transfer
We conceived a regularization technique which supervises the prediction of reasoningsteps required to answer the question. We therefore assume the existence of the followingGT annotation of reasoning programs 2.
A given data sample consists of a sequence {qi} of input question word embeddings,a set {vi} of input visual objects, the ground truth answer class y∗ as well as the GT
reasoning program, which is structured as a tree involving operations and arguments.Operations {o∗i } are elements of a predefined set {choose color, filter size, ...}. Thearguments of these operations may be taken from (i) all question words, (ii) all visualobjects, (iii) all operations — when an operation takes as argument the result of anotheroperation. Hence, arguments are annotated as many-to-many relationships. In thequestion “Is there a motorbike or a plane?”, for instance, the operation “or” depends on the
2. GT annotation of reasoning programs can be easily obtained in semi-automatically generated datasetsuch as GQA(Hudson et al. 2019b)
127
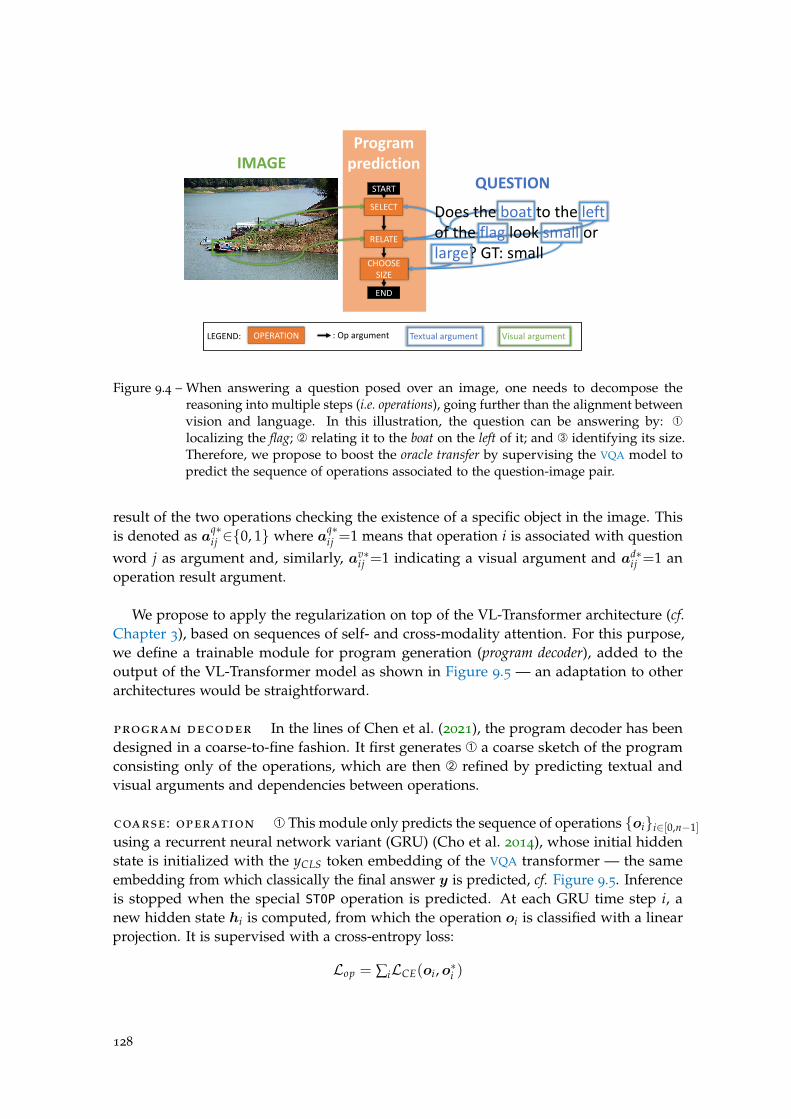
Figure 9.4 – When answering a question posed over an image, one needs to decompose thereasoning into multiple steps (i.e. operations), going further than the alignment betweenvision and language. In this illustration, the question can be answering by: À
localizing the flag; Á relating it to the boat on the left of it; and  identifying its size.Therefore, we propose to boost the oracle transfer by supervising the VQA model topredict the sequence of operations associated to the question-image pair.
result of the two operations checking the existence of a specific object in the image. Thisis denoted as aq∗
ij ∈{0, 1} where aq∗ij =1 means that operation i is associated with question
word j as argument and, similarly, av∗ij =1 indicating a visual argument and ad∗
ij =1 anoperation result argument.
We propose to apply the regularization on top of the VL-Transformer architecture (cf.Chapter 3), based on sequences of self- and cross-modality attention. For this purpose,we define a trainable module for program generation (program decoder), added to theoutput of the VL-Transformer model as shown in Figure 9.5 — an adaptation to otherarchitectures would be straightforward.
program decoder In the lines of Chen et al. (2021), the program decoder has beendesigned in a coarse-to-fine fashion. It first generates À a coarse sketch of the programconsisting only of the operations, which are then Á refined by predicting textual andvisual arguments and dependencies between operations.
coarse : operation À This module only predicts the sequence of operations {oi}i∈[0,n−1]using a recurrent neural network variant (GRU) (Cho et al. 2014), whose initial hiddenstate is initialized with the yCLS token embedding of the VQA transformer — the sameembedding from which classically the final answer y is predicted, cf. Figure 9.5. Inferenceis stopped when the special STOP operation is predicted. At each GRU time step i, anew hidden state hi is computed, from which the operation oi is classified with a linearprojection. It is supervised with a cross-entropy loss:
Lop = ∑iLCE(oi, o∗i )
128
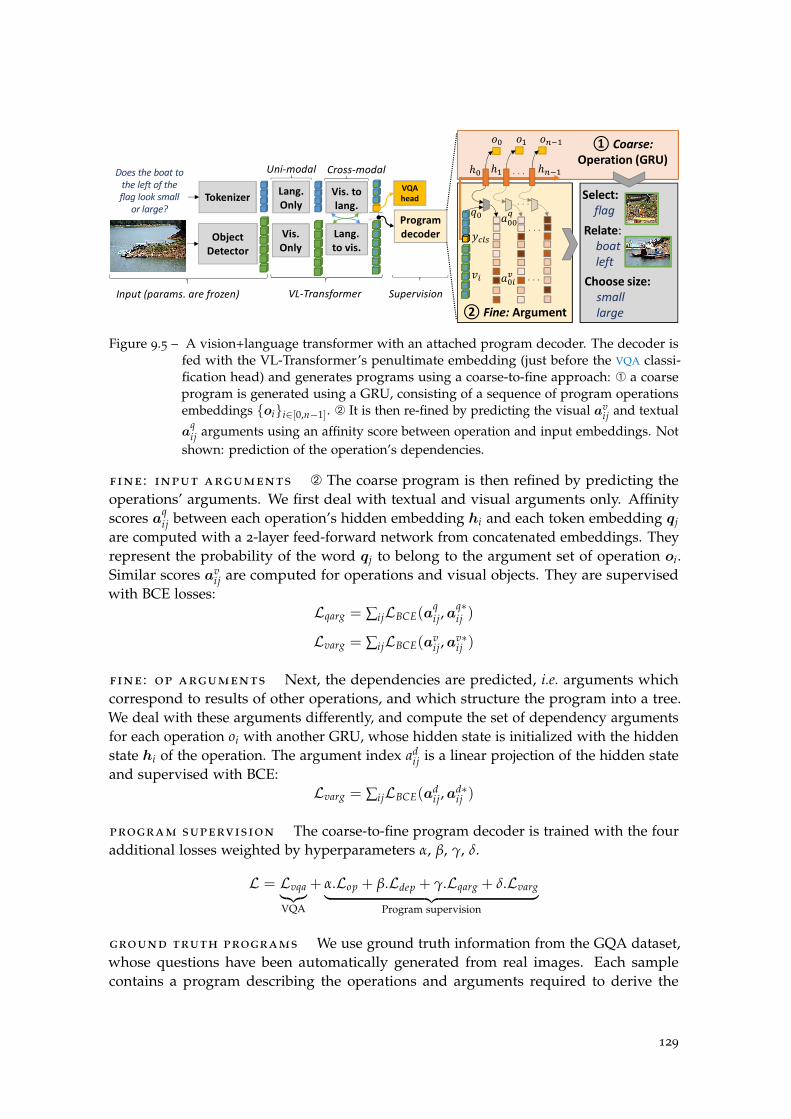
Figure 9.5 – A vision+language transformer with an attached program decoder. The decoder isfed with the VL-Transformer’s penultimate embedding (just before the VQA classi-fication head) and generates programs using a coarse-to-fine approach: À a coarseprogram is generated using a GRU, consisting of a sequence of program operationsembeddings {oi}i∈[0,n−1]. Á It is then re-fined by predicting the visual av
ij and textual
aqij arguments using an affinity score between operation and input embeddings. Not
shown: prediction of the operation’s dependencies.
fine : input arguments Á The coarse program is then refined by predicting theoperations’ arguments. We first deal with textual and visual arguments only. Affinityscores aq
ij between each operation’s hidden embedding hi and each token embedding qjare computed with a 2-layer feed-forward network from concatenated embeddings. Theyrepresent the probability of the word qj to belong to the argument set of operation oi.Similar scores av
ij are computed for operations and visual objects. They are supervisedwith BCE losses:
Lqarg = ∑ijLBCE(aqij,a
q∗ij )
Lvarg = ∑ijLBCE(avij,a
v∗ij )
fine : op arguments Next, the dependencies are predicted, i.e. arguments whichcorrespond to results of other operations, and which structure the program into a tree.We deal with these arguments differently, and compute the set of dependency argumentsfor each operation oi with another GRU, whose hidden state is initialized with the hiddenstate hi of the operation. The argument index ad
ij is a linear projection of the hidden stateand supervised with BCE:
Lvarg = ∑ijLBCE(adij,a
d∗ij )
program supervision The coarse-to-fine program decoder is trained with the fouradditional losses weighted by hyperparameters α, β, γ, δ.
L = Lvqa︸︷︷︸VQA
+ α.Lop + β.Ldep + γ.Lqarg + δ.Lvarg︸ ︷︷ ︸Program supervision
ground truth programs We use ground truth information from the GQA dataset,whose questions have been automatically generated from real images. Each samplecontains a program describing the operations and arguments required to derive the
129
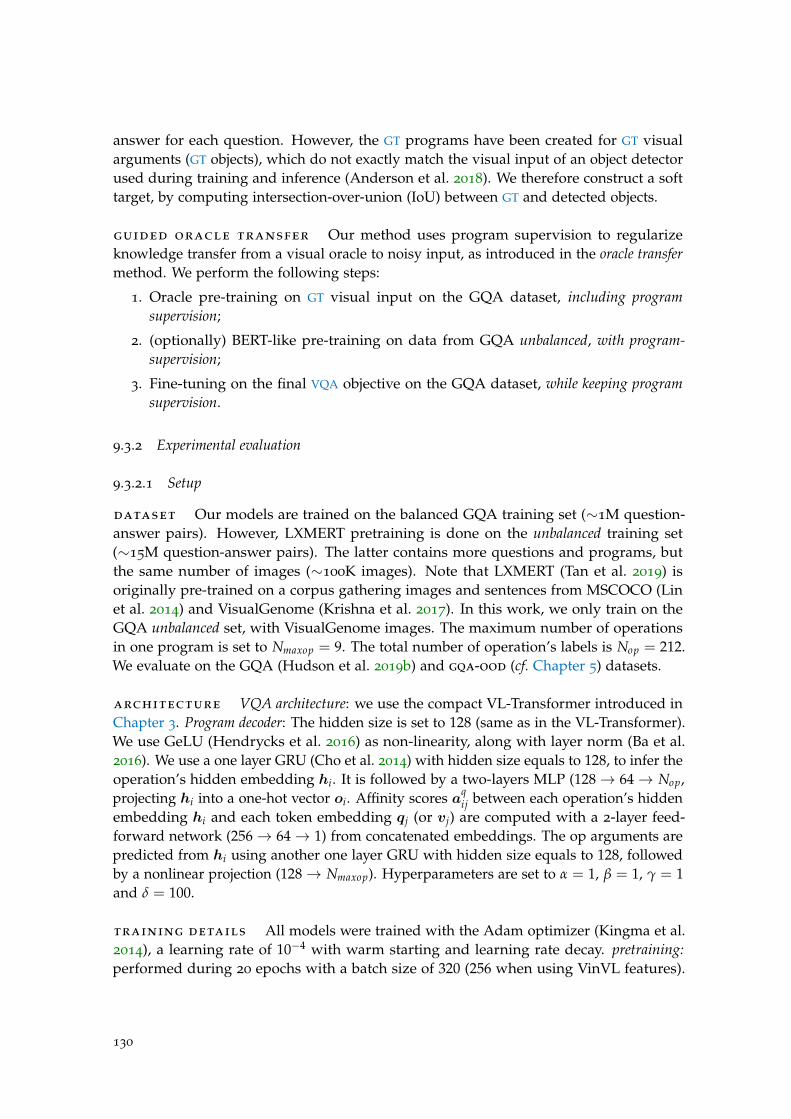
answer for each question. However, the GT programs have been created for GT visualarguments (GT objects), which do not exactly match the visual input of an object detectorused during training and inference (Anderson et al. 2018). We therefore construct a softtarget, by computing intersection-over-union (IoU) between GT and detected objects.
guided oracle transfer Our method uses program supervision to regularizeknowledge transfer from a visual oracle to noisy input, as introduced in the oracle transfermethod. We perform the following steps:
1. Oracle pre-training on GT visual input on the GQA dataset, including programsupervision;
2. (optionally) BERT-like pre-training on data from GQA unbalanced, with program-supervision;
3. Fine-tuning on the final VQA objective on the GQA dataset, while keeping programsupervision.
9.3.2 Experimental evaluation
9.3.2.1 Setup
dataset Our models are trained on the balanced GQA training set (∼1M question-answer pairs). However, LXMERT pretraining is done on the unbalanced training set(∼15M question-answer pairs). The latter contains more questions and programs, butthe same number of images (∼100K images). Note that LXMERT (Tan et al. 2019) isoriginally pre-trained on a corpus gathering images and sentences from MSCOCO (Linet al. 2014) and VisualGenome (Krishna et al. 2017). In this work, we only train on theGQA unbalanced set, with VisualGenome images. The maximum number of operationsin one program is set to Nmaxop = 9. The total number of operation’s labels is Nop = 212.We evaluate on the GQA (Hudson et al. 2019b) and gqa-ood (cf. Chapter 5) datasets.
architecture VQA architecture: we use the compact VL-Transformer introduced inChapter 3. Program decoder: The hidden size is set to 128 (same as in the VL-Transformer).We use GeLU (Hendrycks et al. 2016) as non-linearity, along with layer norm (Ba et al.2016). We use a one layer GRU (Cho et al. 2014) with hidden size equals to 128, to infer theoperation’s hidden embedding hi. It is followed by a two-layers MLP (128→ 64→ Nop,projecting hi into a one-hot vector oi. Affinity scores aq
ij between each operation’s hiddenembedding hi and each token embedding qj (or vj) are computed with a 2-layer feed-forward network (256→ 64→ 1) from concatenated embeddings. The op arguments arepredicted from hi using another one layer GRU with hidden size equals to 128, followedby a nonlinear projection (128→ Nmaxop). Hyperparameters are set to α = 1, β = 1, γ = 1and δ = 100.
training details All models were trained with the Adam optimizer (Kingma et al.2014), a learning rate of 10−4 with warm starting and learning rate decay. pretraining:performed during 20 epochs with a batch size of 320 (256 when using VinVL features).
130
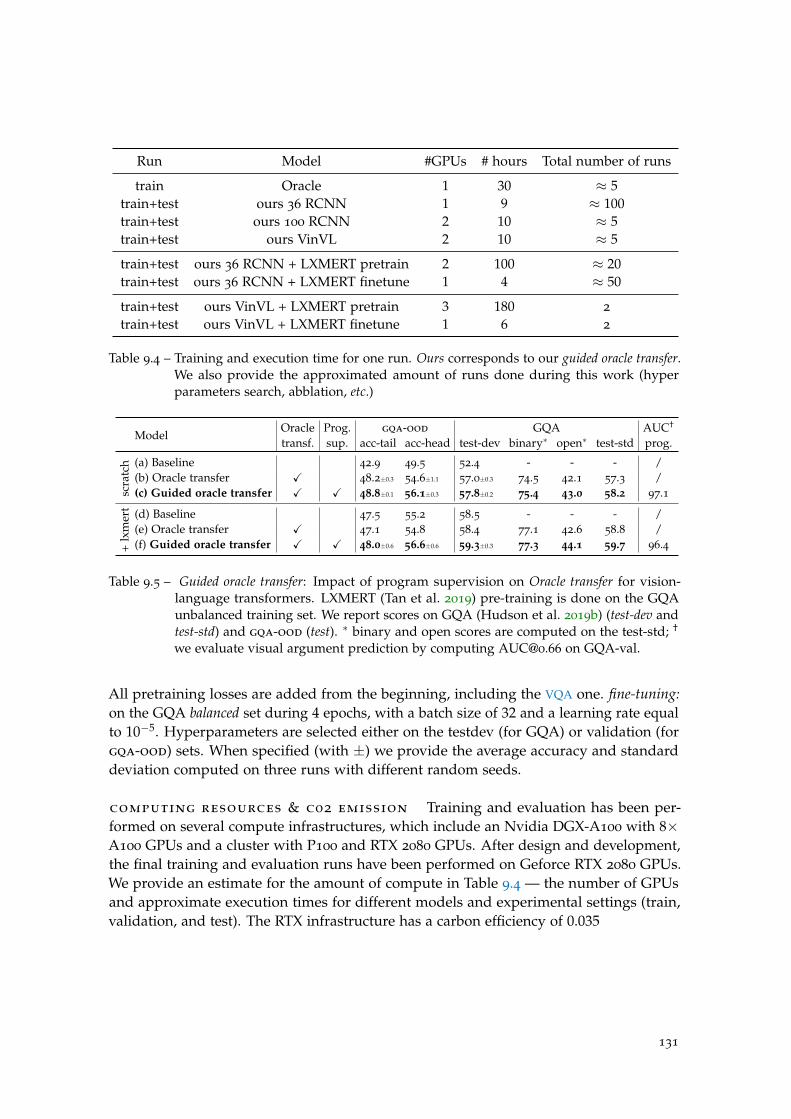
Run Model #GPUs # hours Total number of runs
train Oracle 1 30 ≈ 5train+test ours 36 RCNN 1 9 ≈ 100train+test ours 100 RCNN 2 10 ≈ 5train+test ours VinVL 2 10 ≈ 5
train+test ours 36 RCNN + LXMERT pretrain 2 100 ≈ 20train+test ours 36 RCNN + LXMERT finetune 1 4 ≈ 50
train+test ours VinVL + LXMERT pretrain 3 180 2
train+test ours VinVL + LXMERT finetune 1 6 2
Table 9.4 – Training and execution time for one run. Ours corresponds to our guided oracle transfer.We also provide the approximated amount of runs done during this work (hyperparameters search, abblation, etc.)
ModelOracle Prog. gqa-ood GQA AUC†
transf. sup. acc-tail acc-head test-dev binary∗ open∗ test-std prog.
scra
tch (a) Baseline 42.9 49.5 52.4 - - - /
(b) Oracle transfer X 48.2±0.3 54.6±1.1 57.0±0.3 74.5 42.1 57.3 /(c) Guided oracle transfer X X 48.8±0.1 56.1±0.3 57.8±0.2 75.4 43.0 58.2 97.1
+lx
mer
t (d) Baseline 47.5 55.2 58.5 - - - /(e) Oracle transfer X 47.1 54.8 58.4 77.1 42.6 58.8 /(f) Guided oracle transfer X X 48.0±0.6 56.6±0.6 59.3±0.3 77.3 44.1 59.7 96.4
Table 9.5 – Guided oracle transfer: Impact of program supervision on Oracle transfer for vision-language transformers. LXMERT (Tan et al. 2019) pre-training is done on the GQAunbalanced training set. We report scores on GQA (Hudson et al. 2019b) (test-dev andtest-std) and gqa-ood (test). ∗ binary and open scores are computed on the test-std; †
we evaluate visual argument prediction by computing [email protected] on GQA-val.
All pretraining losses are added from the beginning, including the VQA one. fine-tuning:on the GQA balanced set during 4 epochs, with a batch size of 32 and a learning rate equalto 10−5. Hyperparameters are selected either on the testdev (for GQA) or validation (forgqa-ood) sets. When specified (with ±) we provide the average accuracy and standarddeviation computed on three runs with different random seeds.
computing resources & c02 emission Training and evaluation has been per-formed on several compute infrastructures, which include an Nvidia DGX-A100 with 8×A100 GPUs and a cluster with P100 and RTX 2080 GPUs. After design and development,the final training and evaluation runs have been performed on Geforce RTX 2080 GPUs.We provide an estimate for the amount of compute in Table 9.4 — the number of GPUsand approximate execution times for different models and experimental settings (train,validation, and test). The RTX infrastructure has a carbon efficiency of 0.035
131
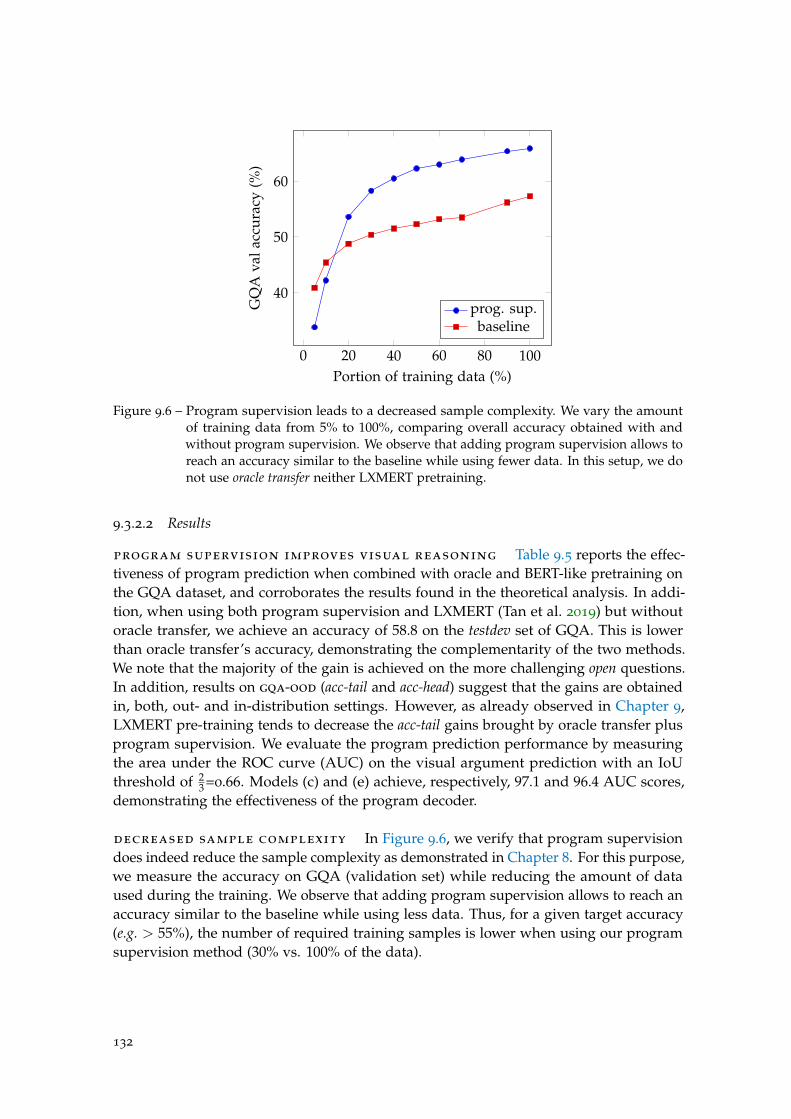
0 20 40 60 80 100
40
50
60
Portion of training data (%)
GQ
Ava
lacc
urac
y(%
)
prog. sup.baseline
Figure 9.6 – Program supervision leads to a decreased sample complexity. We vary the amountof training data from 5% to 100%, comparing overall accuracy obtained with andwithout program supervision. We observe that adding program supervision allows toreach an accuracy similar to the baseline while using fewer data. In this setup, we donot use oracle transfer neither LXMERT pretraining.
9.3.2.2 Results
program supervision improves visual reasoning Table 9.5 reports the effec-tiveness of program prediction when combined with oracle and BERT-like pretraining onthe GQA dataset, and corroborates the results found in the theoretical analysis. In addi-tion, when using both program supervision and LXMERT (Tan et al. 2019) but withoutoracle transfer, we achieve an accuracy of 58.8 on the testdev set of GQA. This is lowerthan oracle transfer’s accuracy, demonstrating the complementarity of the two methods.We note that the majority of the gain is achieved on the more challenging open questions.In addition, results on gqa-ood (acc-tail and acc-head) suggest that the gains are obtainedin, both, out- and in-distribution settings. However, as already observed in Chapter 9,LXMERT pre-training tends to decrease the acc-tail gains brought by oracle transfer plusprogram supervision. We evaluate the program prediction performance by measuringthe area under the ROC curve (AUC) on the visual argument prediction with an IoUthreshold of 2
3 =0.66. Models (c) and (e) achieve, respectively, 97.1 and 96.4 AUC scores,demonstrating the effectiveness of the program decoder.
decreased sample complexity In Figure 9.6, we verify that program supervisiondoes indeed reduce the sample complexity as demonstrated in Chapter 8. For this purpose,we measure the accuracy on GQA (validation set) while reducing the amount of dataused during the training. We observe that adding program supervision allows to reach anaccuracy similar to the baseline while using less data. Thus, for a given target accuracy(e.g. > 55%), the number of required training samples is lower when using our programsupervision method (30% vs. 100% of the data).
132
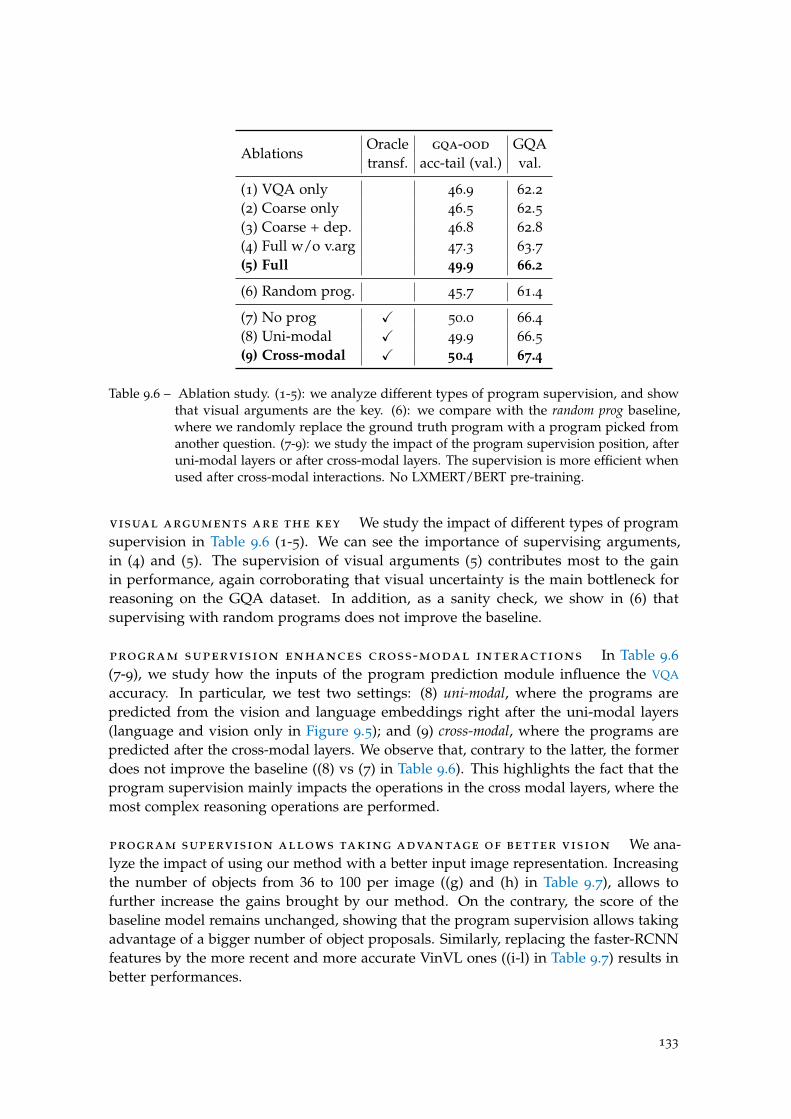
AblationsOracle gqa-ood GQAtransf. acc-tail (val.) val.
(1) VQA only 46.9 62.2(2) Coarse only 46.5 62.5(3) Coarse + dep. 46.8 62.8(4) Full w/o v.arg 47.3 63.7(5) Full 49.9 66.2
(6) Random prog. 45.7 61.4
(7) No prog X 50.0 66.4(8) Uni-modal X 49.9 66.5(9) Cross-modal X 50.4 67.4
Table 9.6 – Ablation study. (1-5): we analyze different types of program supervision, and showthat visual arguments are the key. (6): we compare with the random prog baseline,where we randomly replace the ground truth program with a program picked fromanother question. (7-9): we study the impact of the program supervision position, afteruni-modal layers or after cross-modal layers. The supervision is more efficient whenused after cross-modal interactions. No LXMERT/BERT pre-training.
visual arguments are the key We study the impact of different types of programsupervision in Table 9.6 (1-5). We can see the importance of supervising arguments,in (4) and (5). The supervision of visual arguments (5) contributes most to the gainin performance, again corroborating that visual uncertainty is the main bottleneck forreasoning on the GQA dataset. In addition, as a sanity check, we show in (6) thatsupervising with random programs does not improve the baseline.
program supervision enhances cross-modal interactions In Table 9.6(7-9), we study how the inputs of the program prediction module influence the VQA
accuracy. In particular, we test two settings: (8) uni-modal, where the programs arepredicted from the vision and language embeddings right after the uni-modal layers(language and vision only in Figure 9.5); and (9) cross-modal, where the programs arepredicted after the cross-modal layers. We observe that, contrary to the latter, the formerdoes not improve the baseline ((8) vs (7) in Table 9.6). This highlights the fact that theprogram supervision mainly impacts the operations in the cross modal layers, where themost complex reasoning operations are performed.
program supervision allows taking advantage of better vision We ana-lyze the impact of using our method with a better input image representation. Increasingthe number of objects from 36 to 100 per image ((g) and (h) in Table 9.7), allows tofurther increase the gains brought by our method. On the contrary, the score of thebaseline model remains unchanged, showing that the program supervision allows takingadvantage of a bigger number of object proposals. Similarly, replacing the faster-RCNNfeatures by the more recent and more accurate VinVL ones ((i-l) in Table 9.7) results inbetter performances.
133
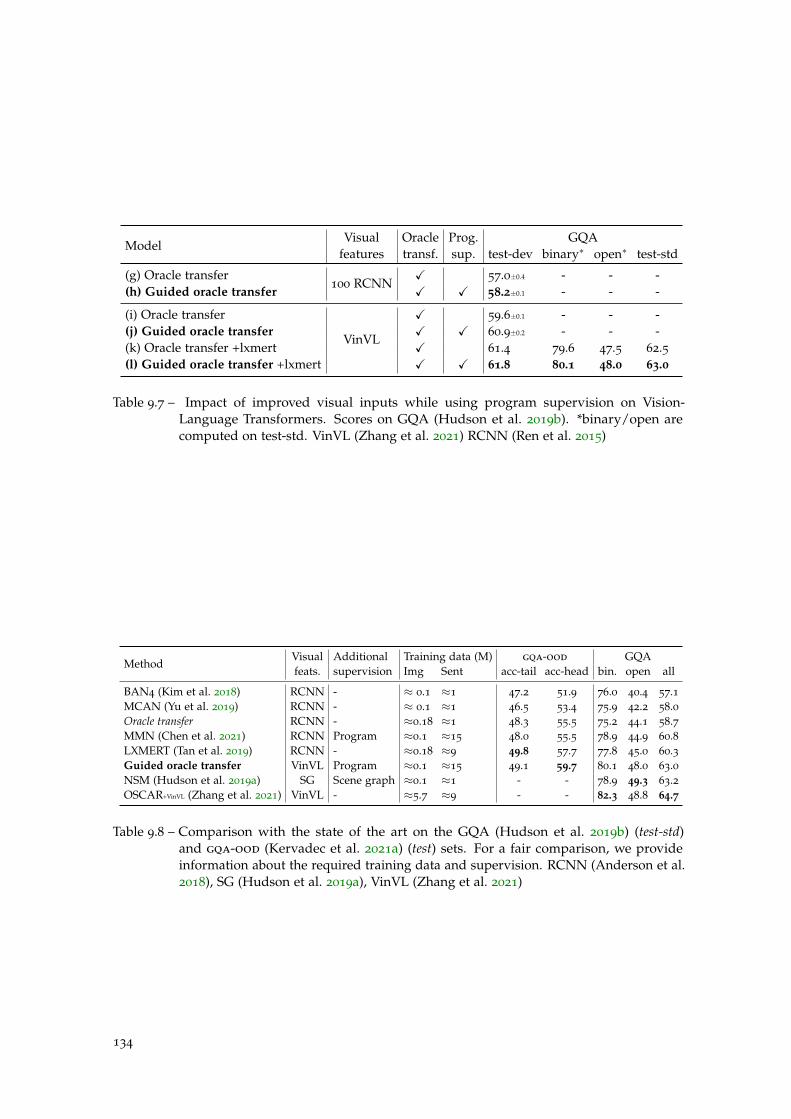
ModelVisual Oracle Prog. GQA
features transf. sup. test-dev binary∗ open∗ test-std
(g) Oracle transfer100 RCNN
X 57.0±0.4 - - -(h) Guided oracle transfer X X 58.2±0.1 - - -
(i) Oracle transfer
VinVL
X 59.6±0.1 - - -(j) Guided oracle transfer X X 60.9±0.2 - - -(k) Oracle transfer +lxmert X 61.4 79.6 47.5 62.5(l) Guided oracle transfer +lxmert X X 61.8 80.1 48.0 63.0
Table 9.7 – Impact of improved visual inputs while using program supervision on Vision-Language Transformers. Scores on GQA (Hudson et al. 2019b). *binary/open arecomputed on test-std. VinVL (Zhang et al. 2021) RCNN (Ren et al. 2015)
MethodVisual Additional Training data (M) gqa-ood GQAfeats. supervision Img Sent acc-tail acc-head bin. open all
BAN4 (Kim et al. 2018) RCNN - ≈ 0.1 ≈1 47.2 51.9 76.0 40.4 57.1MCAN (Yu et al. 2019) RCNN - ≈ 0.1 ≈1 46.5 53.4 75.9 42.2 58.0Oracle transfer RCNN - ≈0.18 ≈1 48.3 55.5 75.2 44.1 58.7MMN (Chen et al. 2021) RCNN Program ≈0.1 ≈15 48.0 55.5 78.9 44.9 60.8LXMERT (Tan et al. 2019) RCNN - ≈0.18 ≈9 49.8 57.7 77.8 45.0 60.3Guided oracle transfer VinVL Program ≈0.1 ≈15 49.1 59.7 80.1 48.0 63.0NSM (Hudson et al. 2019a) SG Scene graph ≈0.1 ≈1 - - 78.9 49.3 63.2OSCAR+VinVL (Zhang et al. 2021) VinVL - ≈5.7 ≈9 - - 82.3 48.8 64.7
Table 9.8 – Comparison with the state of the art on the GQA (Hudson et al. 2019b) (test-std)and gqa-ood (Kervadec et al. 2021a) (test) sets. For a fair comparison, we provideinformation about the required training data and supervision. RCNN (Anderson et al.2018), SG (Hudson et al. 2019a), VinVL (Zhang et al. 2021)
134
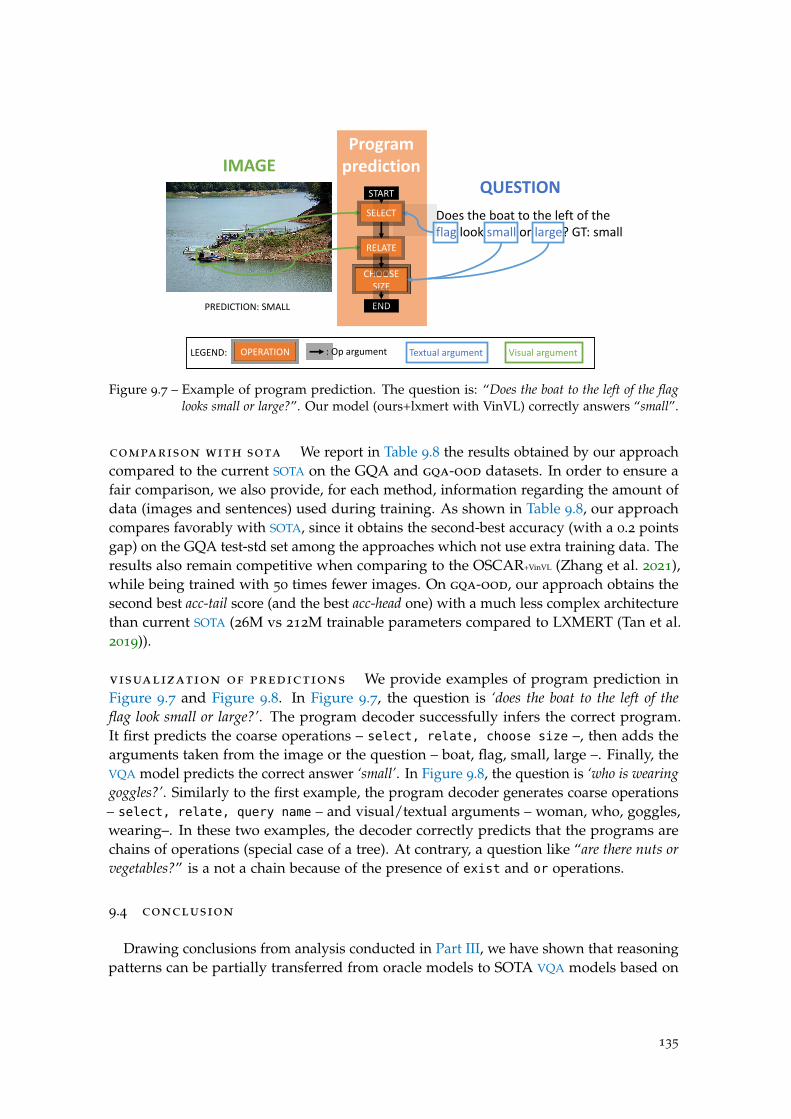
Does the boat to the left of the flag look small or large? GT: small
SELECT
RELATE
CHOOSE SIZE
START
END
IMAGEQUESTION
PREDICTION: SMALL
Programprediction
OPERATION : Op argument Textual argument Visual argumentLEGEND:
Figure 9.7 – Example of program prediction. The question is: “Does the boat to the left of the flaglooks small or large?”. Our model (ours+lxmert with VinVL) correctly answers “small”.
comparison with sota We report in Table 9.8 the results obtained by our approachcompared to the current SOTA on the GQA and gqa-ood datasets. In order to ensure afair comparison, we also provide, for each method, information regarding the amount ofdata (images and sentences) used during training. As shown in Table 9.8, our approachcompares favorably with SOTA, since it obtains the second-best accuracy (with a 0.2 pointsgap) on the GQA test-std set among the approaches which not use extra training data. Theresults also remain competitive when comparing to the OSCAR+VinVL (Zhang et al. 2021),while being trained with 50 times fewer images. On gqa-ood, our approach obtains thesecond best acc-tail score (and the best acc-head one) with a much less complex architecturethan current SOTA (26M vs 212M trainable parameters compared to LXMERT (Tan et al.2019)).
visualization of predictions We provide examples of program prediction inFigure 9.7 and Figure 9.8. In Figure 9.7, the question is ‘does the boat to the left of theflag look small or large?’. The program decoder successfully infers the correct program.It first predicts the coarse operations – select, relate, choose size –, then adds thearguments taken from the image or the question – boat, flag, small, large –. Finally, theVQA model predicts the correct answer ‘small’. In Figure 9.8, the question is ‘who is wearinggoggles?’. Similarly to the first example, the program decoder generates coarse operations– select, relate, query name – and visual/textual arguments – woman, who, goggles,wearing–. In these two examples, the decoder correctly predicts that the programs arechains of operations (special case of a tree). At contrary, a question like “are there nuts orvegetables?” is a not a chain because of the presence of exist and or operations.
9.4 conclusion
Drawing conclusions from analysis conducted in Part III, we have shown that reasoningpatterns can be partially transferred from oracle models to SOTA VQA models based on
135
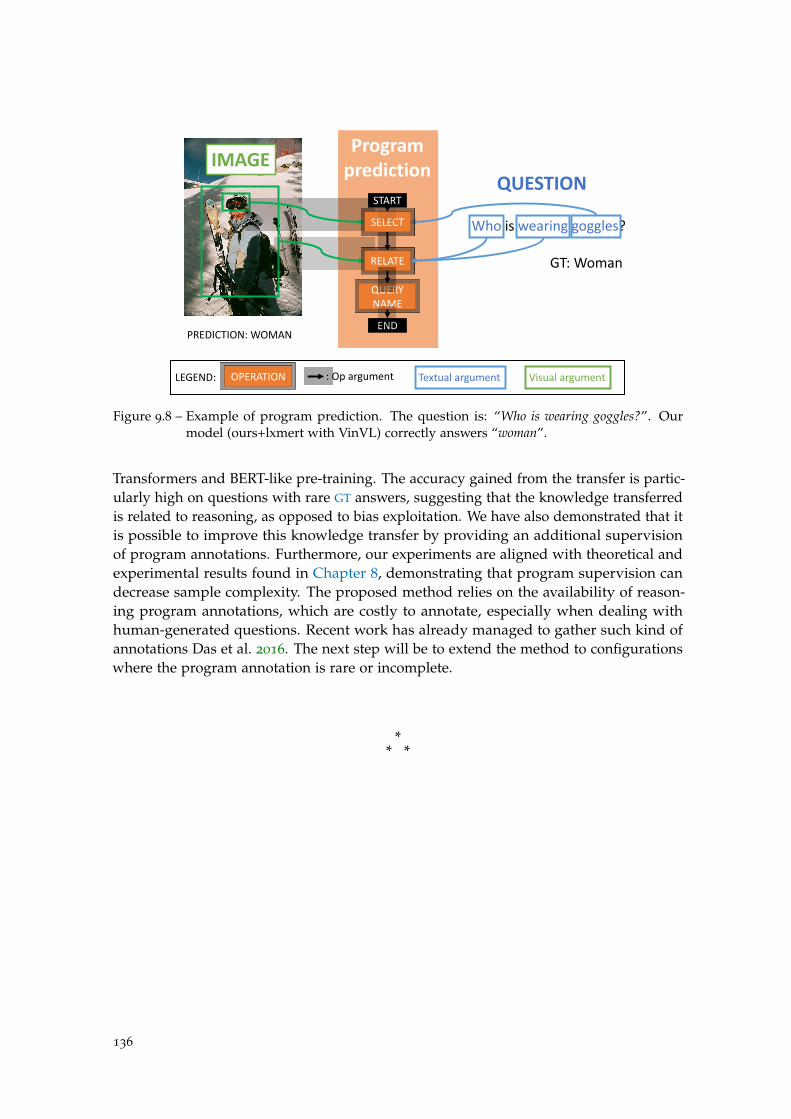
Who is wearing goggles?
GT: Woman
SELECT
RELATE
QUERY NAME
START
END
IMAGEQUESTION
PREDICTION: WOMAN
Programprediction
OPERATION : Op argument Textual argument Visual argumentLEGEND:
Figure 9.8 – Example of program prediction. The question is: “Who is wearing goggles?”. Ourmodel (ours+lxmert with VinVL) correctly answers “woman”.
Transformers and BERT-like pre-training. The accuracy gained from the transfer is partic-ularly high on questions with rare GT answers, suggesting that the knowledge transferredis related to reasoning, as opposed to bias exploitation. We have also demonstrated that itis possible to improve this knowledge transfer by providing an additional supervisionof program annotations. Furthermore, our experiments are aligned with theoretical andexperimental results found in Chapter 8, demonstrating that program supervision candecrease sample complexity. The proposed method relies on the availability of reason-ing program annotations, which are costly to annotate, especially when dealing withhuman-generated questions. Recent work has already managed to gather such kind ofannotations Das et al. 2016. The next step will be to extend the method to configurationswhere the program annotation is rare or incomplete.
** *
136

137

C h a p t e r 10
G E N E R A L C O N C L U S I O N
10.1 summary of contributions
This thesis focuses on the question of bias vs reasoning in VQA. Part II and Part IIIprovide a diagnostic on the effect of shortcut learning on VQA. Drawing a conclusion fromit, Part IV proposes two complementary methods, improving the model’s predictionswhile mitigating the effect of biases. All in all, our contributions can be summarized asfollows:
evaluate (Part II) We conduct a comprehensive review of existing evaluation meth-ods for VQA. We show that they struggle to correctly evaluate the reasoning ability, so wepropose our own benchmark called gqa-ood. It consists in providing a multidimensionalevaluation, allowing to measure the OOD performance – which we argue to be related tothe reasoning ability – by controlling the rarity of the used test examples (in-distribution vsout-of-distribution). Thus, gqa-ood has been designed to address most of the limitationsfound in others benchmarks: evaluate both in- and out-of-distribution accuracies at thesame time, validate in OOD setting, maintain natural biases. Thereby, we experimentallydemonstrate that all the VQA models that we have tested are brittle to OOD evaluation. Thissuggests that they have learned to rely on shortcuts instead of reasoning. Furthermore,our results show that even methods specifically devised to mitigate the influence of biasesfail in our setup. gqa-ood is publicly available: we encourage researchers to evaluatetheir models on it, or to extend our methodology to other tasks.
analyze (Part III) We complement the quantitative results provided by the eval-uation part (Part II) with qualitative observations. For this purpose, we conduct aninstance-based visualization of the attention learned by a VL-Transformer using VisQA(developed in collaboration with Théo Jaunet). This analysis highlights interesting insightsabout the type of reasoning which is performed by the learned model. In particular, weobserve potential bottlenecks for learning to reason, such as the uncertainty in the visualpart (e.g. useful objects are not correctly detected), the difficulty to precisely align visualregions with question words, or other language biases (e.g. with logical operators). Then,in a broader dataset-level study of the learned attention maps, we analyze the emergenceof reasoning patterns in the same VL-Transformer. We demonstrate that the ability torelate attention to the task at hand (i.e. the ability to reason) is present when the training
139
conditions are favorable enough, e.g. when the uncertainty in the visual part is reduced(visual oracle), but not in the standard setting.
improve (Part IV) In the last part, we design two complementary approaches forimproving reasoning in VQA. The first one focuses on training supervision. In particular,we propose to add a proxy loss for reasoning (e.g. a weak supervision of the fine-grainedword-object alignment). In an experimental study, we show that this additional su-pervision helps to improve the visual reasoning performance. We complement thoseexperimental results, by providing theoretical clues (based on PAC-learning) demonstrat-ing that reasoning supervision reduces the sample complexity, and eases the learning ofreasoning. The second method directly takes inspiration from the results obtains in theanalysis part (Part III). We propose to transfer the reasoning patterns learned when thetraining conditions are favorable to the standard settings having uncertainty in the input.We show that this transfer is feasible and does improve the VQA performances in bothin- and out-of-distribution settings. Furthermore, we combine the transfer of reasoningpatterns with the reasoning supervision and experimentally demonstrate that the latter isa catalyst for the former.
10.2 perspectives for future work
The work conducted in this thesis opens a wide range of exciting perspectives andchallenges that we have listed below. It includes the conception of new evaluation processfor ML, the design of methods to mitigate shortcut learning, and the exploration ofreasoning beyond DL. There are also numerous other broader issues, not mentionedenough in this thesis, which are primordial for the ML field. Thus, we can cite theimportance of studying and preventing the (potentially negative) societal impact causedby biases in DL-based technologies, or the urgent need to conciliate DL usage with concernsraised by climate change.
10.2.1 Evaluation in ML
In Part II, we propose a new method for evaluating VQA models. An interestingperspective would be to adapt our method to other tasks, going beyond VQA or vision-and-language understanding. Besides, we also think that we have to keep putting effortin improving the way we evaluate and compare ML approaches.
real-world scenarios In the real world, it can be difficult to disentangle reasoningfrom perception. Therefore, while synthetic datasets – such as CLEVR (Johnson et al.2017) for VQA – are useful (and necessary) tools for diagnosing weaknesses and strengthsin models, we also have to work on real-world scenarios. A large part of the work in thisthesis has been conducted on the GQA database (Hudson et al. 2019b). As explainedin Chapter 4, GQA is the best suited for evaluating reasoning capabilities in VQA. Atthe same time, it is semisynthetic, because it contains both real images and syntheticquestions. While it was a necessary step, in the future, we will have to validate our
140
approaches on a more realistic setup. For instance, a dataset such as VizWiz (Gurariet al. 2018) is a good candidate for real-world evaluation. Such adaptation to real-worldapplications brings new challenges, such as a greater diversity of concept, or a higheruncertainty in annotation.
dynamic benchmarks We think that a good evaluation cannot be static. The quickevolution of DL, combined with the SOTA race, can lead to a kind of overfitting, wheremodels are unconsciously selected on the test set. One possible solution could be to designdynamic benchmarks. Therefore, Gorman et al. (2019) analyzed published part-of-speechtaggers, and propose to use randomly generated splits instead of the static standard splits.Recently, two VQA benchmarks – namely adVQA (Sheng et al. 2021) and AVVQA (Li et al.2021) – make use of a human adversarial evaluation in order to update the standard testset with questions fooling a SOTA model. We could imagine doing such test update on aregular basis, to obtain a kind of dynamic evaluation, where benchmarks update acrosstime.
a better scientific method Improving evaluation and diagnosing in ML goeshand in hand with a better scientific method. In this thesis, we tried (even if it is far frombeing perfect) to carefully evaluate the significance of our experimental results beforedrawing conclusions. It includes the use of adequate baselines and ablation studies,but also a statistical measure of the results’ significance (here, we use basic statistics,namely the average plus std across random seed). On this subject, Picard (2021) showshow important can be the impact of the random seed selection on the final performance,suggesting that the statistical significance of experimental results do have to be carefullyhandled. However, there is still a large room for improvement. Thus, to avoid the negativeresults depicted in Chapter 4 (where some VQA methods are directly validated on thetest set!), it appears to be necessary to re-think our ML practices. A good starting point isthe discussion led by Forde et al. (2019), taking inspiration from physics to provide goodpractices, which could positively enhance the scientific method in ML.
10.2.2 Mitigating shortcut learning
This thesis puts a lot of efforts on diagnosing the cause and effect of shortcut learningin VQA. Designing new methods for mitigating these unwanted effects is an obviousperspective, which goes beyond the scope of VQA.
improve the vision part We have seen that uncertainty in the vision part is a crucialfactor leading to shortcuts in vision-and-language understanding. Therefore, a fruitfulperspective of work would be to improve the vision part. We can think about designingobject detectors with a better precision, in order to reduce the visual uncertainty as donein Zhang et al. (2021). Alternatively, as already started by Jiang et al. (2020), conductinganalyzes on which image representation type – namely, grid-level, object-level or anythingelse – is the best suited for visual reasoning is also essential. Finally, vision-and-languageunderstanding requires a strong alignment between vision and language. Then, it couldbe interesting to address this issue as early as possible in the pipeline, and jointly learn
141
vision and language features, in the same vain as in Ramesh et al. (2021) or Radford et al.(2021).
design bias-agnostic methods Many approaches for mitigating biases duringlearning have been proposed. However, as shown in Chapter 5 (and confirmed in Dancetteet al. (2021)), most of them provide limited improvement. We think that progress has tobe made on this topic. Promising approaches includes multiple domain training (Rameet al. 2021), training collection of models while favoring diversity (Teney et al. 2021), orcombining ML with causal approaches e.g. using counterfactual examples (Teney et al.2020a).
10.2.3 Explore reasoning beyond DL
It appears, from our study, that many of the obstacles preventing from learning toreason are intrinsic to DL. In particular, we think of shortcut learning (Geirhos et al. 2020)and simplicity bias (Shah et al. 2020). In that context, it would be interesting to explorereasoning beyond DL, taking inspiration from other domains, in a cross-disciplinaryfashion.
embodied learning In the standard DL training, a neural net is optimized, throughiterative gradient descent on data samples, to minimize an objective loss aligned with thetask to be accomplished. In that settings, the neural net has only access to i.i.d. samples ina read only fashion. However, as demonstrated in the infamous 1 experiment conductedby Held et al. (1963), the combination of perception with interaction (through sensoryfeedback) is essential for the development of the mammal brain. Thereby, it seems thatthe ability to interact with its environment is an essential property for learning to reason.This motivates methods for adapting the read only DL training to a setup where an agenthas the possibility to interact with its environment. This is the objective of embodiedlearning, which have been notably used for VQA in Das et al. (2018).
causal representation learning In a similar vain, graphical causality (Pearlet al. 2000), seeks to overcome ML issues by leveraging the notion of intervention in the data.As already seen in Chapter 2, “causality” is a property of “reasoning”. In that context, itseems relevant to combine methods from both ML and graphical causality, as proposed bySchölkopf et al. (2021). It is worth noticing that some works already introduces causalityin DL, e.g. in VQA (Teney et al. 2020a; Agarwal et al. 2020) or in counterfactual learning ofphysics (Baradel et al. 2019).
cognitive sciences Another perspective would be to develop new ways for learningto reason by taking inspiration from cognitive sciences. For instance, Lazaridou et al.(2017) make use of game theory and language evolution in order propose to analyze
1. In a nutshell, the experiment consisted in putting two kittens in a carousel. The first one can see andmove. The second one can also see, but is not free to move. Its movements are mechanically linked with thefirst kitten, such that it does not have any control on them. It turns out that the kitten which cannot decidewhere it goes does not develop normally (Held et al. 1963).
142

the emergence of language in multiagent (neural agents) referential games. In the samecontext, Chaabouni et al. (2020) study whether such emergent languages have the facultyof “compositionality” and “generalization”, two properties of “reasoning”. Would it be possibleto do the same and study the emergence of visual reasoning? Vani et al. (2021) already try totackle the question, and propose to use iterated learning on a synthetic VQA task. Wethink that these cross-disciplinary works, borrowing results from cognitive sciences, willplay an important role in the development of new neural models devised to reason.
* * *
143


145

A p p e n d i x AP R O O F S : S A M P L E C O M P L E X I T Y O F R E A S O N I N G S U P E RV I S I O N
a.1 proof of theorem 8 .3 .3
In the lines of Arora et al. (2019), we first define the case for a single component y(i) ofthe vector y and define the following Corollary:
corollary a .0 .1 (sample complexity for multi-mode reasoning functions
with a single scalar component). Let A be an overparametrized and randomlyinitialized two-layer MLP trained with gradient descent for a sufficient number of iterations.Suppose g : Rd → Rm with g(x) = ∑r ∑j(γ
Tr x)αr,j(βT
r,jx)pr,j where γr ∈ Rd, βr,j ∈ Rd,
αr,j ∈ R, and pr,j = 1 or pr,j = 2l, l ∈N+. The sample complexity CA(g, ε, δ) is:
CA(g, ε0, δ0) = O
(∑r ∑j πpr,j|α|·||γr||2·||βr,j||
pr,j2 + log( 1
δ0)
ε20
),
proof of corollary A.0 .1 Using Theorem 5.1 from Arora et al. (2019), we knowthat sums of learnable functions are learnable, and can thus focus on a single term:
y = g(x) = α(γTx)(βTx)p (A.1)
where we dropped indices r and j and the superscript (i) for convenience. We proceed inthe lines of the proof of Theorem 5.1 in Arora et al. (2019). Given a set of i.i.d data samplesS = {(xs, ys)}n
s=1 = (X , y) from the underlying function g(x), let w be the weights of thefirst layer of a two-layers network with ReLu activations; let H∞ ∈ Rn,n be a Gram matrixdefined as follows, with elements:
H∞ij = Ew∼N (0,1)
[xT
i xjI{wtxi≥0,wtxi≥0}]
.
To provide bounds on the sample complexity of g(x), using Theorem 5.1 of Arora et al.(2019), it suffices to show that the following bound holds:√
yT(H∞)−1y < Mg (A.2)
for a bound Mg independent of the number of samples n.
147
We first introduce some notation. For matrices A = [a1, ...,an3 ] ∈ Rn1×n3 and B =
[b1, ..., bn3 ] ∈ Rn2×n3 , the Khatri-Rao product is defined asA�B = [a1⊗b1,a2⊗b2, ...,an3⊗bn3 ].Let ◦ be the Haddamard product (element wise multiplication) of two matrices. We alsodenote the corresponding powers by A⊗l ,A�l ,A◦l . We denote by A† = (ATA)−1AT
the Moore-Penrose pseudo-inverse, and by PA = A12A†A
12 the projection matrix for the
subspace spanned by A. From the proof of Theorem 5.1 in (Arora et al. 2019), we alsoknow that:
H∞ � K◦2l
2π(2l − 1)2
where K = XTX , and X is the data matrix of all row vectors xi.
Let us consider the case of p = 1. Reformulating Equation A.1, we get:
y = g(x) = α(γTx)(βTx) (A.3)
= α(xTγ)(xT β) (A.4)
= α(x⊗x)T(γ⊗β) (A.5)
Now, taking the full set of input vectors xi arranged into the full data matrix X , we canperform similar algebraic operations to get
y = g(X) = α(XTγ) ◦ (XT β) (A.6)
= α(X�2)T(γ⊗β) (A.7)
Plugging Equation A.6 and Equation A.7 into Equation A.2, we need to show that thefollowing expression is smaller than a constant Mg:
α2((XTγ) ◦ (XT β))T(H∞)−1(X�2)T(γ⊗β) (A.8)
=α2((X�2)T(γ⊗β))T(H∞)−1(X�2)T(γ⊗β) (A.9)
=α2(γ⊗β)T(X�2)(H∞)−1(X�2)T(γ⊗β) (A.10)
≤2πα2(γ⊗β)T(X�2)(K◦2)†(X�2)T(γ⊗β) (A.11)
=2πα2(γ⊗β)TPX�2(X�2)T (γ⊗β) (A.12)
≤2πα2||(γ⊗β)||22 (A.13)
=2πα2||γ||22 · ||β||22 (A.14)
where we made use of ||a⊗b||22 = ||a||22||b||22 for two vectors a and b and an integer n. Thisfinishes the proof for the case p = 1.
Let us consider the case of p = 2l+1. Reformulating Equation A.1, we get:
y = g(X) = α(XTγ) ◦ (XT β)p (A.15)
= α(X�2l)T(γ⊗β⊗(2l+1)) (A.16)
148
Plugging Equation A.16) into Equation A.2, we again need to show that the followingexpression is smaller than a constant Mg:
α2((X�2l)T(γ⊗β⊗(2l+1)))T (A.17)
(H∞)−1(X�2l)T(γ⊗β⊗(2l+1)) (A.18)
=α2(γ⊗β⊗(2l+1))T (A.19)
(X�2l)(H∞)−1(X�2l)T(γ⊗β⊗(2l+1)) (A.20)
≤2π(2l − 1)2α2(γ⊗β⊗(2l+1))T (A.21)
(X�2l)(K◦2)†(X�2l)T(γ⊗β⊗(2l+1)) (A.22)
=2π(2l − 1)2α2(γ⊗β⊗(2l+1))T (A.23)
PX�2l(X�2l)T (γ⊗β⊗(2l+1)) (A.24)
≤2π(2l − 1)2α2||(γ⊗β⊗(2l+1))||22 (A.25)
≤2πp2α2||(γ⊗β⊗(2l+1))||22 (A.26)
=2πp2α2||γ||22 · ||β||2p2 (A.27)
where we made use of ||a⊗b||22 = ||a||22||b||22 and therefore ||a⊗n||22 = ||a||2n2 for two vectors
a and b and an integer n. This finishes the proof for the case p = 2l+1.
the case of vectorial outputs In the lines of (Xu et al. 2020), we consider eachcomponent of the output vector independent and apply a union bound to Corollary A.0.1.If the individual components y(i) fail to learn with probability δ0, then the full output ofdimension m fails with probability mδ0 and with an error of at most mε0. A change ofvariables from (ε0, δ0) to (ε, δ) gives a complexity for the model with vectorial output of
CA(g, ε, δ) = O
maxi ∑r ∑j πp(i)r,j |α|·||γ||2·||βr,j||p(i)r,j2 + log(m/δ)
(ε/m)2
,
This ends the proof of Theorem 4.2.
a.2 proof of the inequality in Equation 8 .18
Let us denote by p(x) the density of normal distribution. And to make the notationmore succinct and to avoid confusion between different usages of superscripts, in thisproof we will change γi
r to γi, i.e. the ith component of the vector γ, not to be confusedwith γr, a vector corresponding to the embedding of the rth reasoning mode. Then:
Eγi∼N(0,1)||γ||2·||β||p2 (A.28)
=||β||p2Eγi∼N(0,1)
(∑
iγ2
i
) 12
(A.29)
We now perform a change of variables and introduce a new random variable:
z = ∑i
γ2i (A.30)
149
Since each individual γi is distributed normal, z is distributed according to a χ2 distribu-tion with m degrees of freedom, and we get:
Eγi∼N(0,1)||γ||2·||β||p2 (A.31)
=||β||p2 Ez∼χ2 [z12 ] (A.32)
The expectation now corresponds to 12
thcentered moment of the χ2 distribution with m
degrees of freedom, whose kth moments are given as:
Ez∼χ2 [zk] = 2k Γ(m2 + k)
Γ(m2 )
(A.33)
This ends the proof of the equality.
B I B L I O G R A P H Y
Abbasnejad, Ehsan, Damien Teney, Amin Parvaneh, Javen Shi, and Anton van den Hengel(2020). “Counterfactual vision and language learning”. In: Proceedings of the IEEE/CVFConference on Computer Vision and Pattern Recognition, pp. 10044–10054 (cit. on p. 27).
Agarwal, Vedika, Rakshith Shetty, and Mario Fritz (2020). “Towards causal vqa: Reveal-ing and reducing spurious correlations by invariant and covariant semantic editing”.In: Proceedings of the IEEE/CVF Conference on Computer Vision and Pattern Recognition,pp. 9690–9698 (cit. on pp. 16, 45, 46, 142).
Agrawal, Aishwarya (2019). “Visual question answering and beyond”. PhD thesis. GeorgiaInstitute of Technology (cit. on p. 73).
Agrawal, Aishwarya, Dhruv Batra, and Devi Parikh (2016). “Analyzing the Behavior ofVisual Question Answering Models”. In: EMNLP, pp. 1955–1960 (cit. on pp. 35, 45).
Agrawal, Aishwarya, Dhruv Batra, Devi Parikh, and Aniruddha Kembhavi (2018). “Don’tJust Assume; Look and Answer: Overcoming Priors for Visual Question Answering”.In: CVPR (cit. on pp. 26, 47–49, 53, 58, 59, 66, 73).
Anderson, Peter, Xiaodong He, Chris Buehler, Damien Teney, Mark Johnson, StephenGould, and Lei Zhang (2018). “Bottom-up and top-down attention for image captioningand visual question answering”. In: CVPR, pp. 6077–6086 (cit. on pp. 4, 5, 20–22, 28, 30,45, 47, 58–60, 64–66, 89, 110, 127, 130, 134).
Andreas, Jacob, Marcus Rohrbach, Trevor Darrell, and Dan Klein (2016). “Neural modulenetworks”. In: CVPR (cit. on p. 26).
Antol, Stanislaw, Aishwarya Agrawal, Jiasen Lu, Margaret Mitchell, Dhruv Batra, CLawrence Zitnick, and Devi Parikh (2015). “Vqa: Visual question answering”. In: ICCV(cit. on pp. 17, 18, 38, 39, 60, 66).
Arora, S., S.S. Du, W. Hu, Z. Li, and R. Wang (2019). “Fine-grained Analysis of optimizationand generalization for overparametrized two-layer neural networks”. In: ICML (cit. onpp. 114, 116, 118, 147, 148).
Ba, Jimmy Lei, Jamie Ryan Kiros, and Geoffrey E Hinton (2016). “Layer normalization”.In: arXiv preprint arXiv:1607.06450 (cit. on pp. 107, 130).
Bahdanau, Dzmitry, Harm de Vries, Timothy J O’Donnell, Shikhar Murty, PhilippeBeaudoin, Yoshua Bengio, and Aaron Courville (2019). “Closure: Assessing systematicgeneralization of clevr models”. In: arXiv preprint arXiv:1912.05783 (cit. on p. 47).
Baradel, Fabien, Natalia Neverova, Julien Mille, Greg Mori, and Christian Wolf (2019).“CoPhy: Counterfactual Learning of Physical Dynamics”. In: International Conference onLearning Representations (cit. on pp. 13, 142).
Barrett, David, Felix Hill, Adam Santoro, Ari Morcos, and Timothy Lillicrap (2018).“Measuring abstract reasoning in neural networks”. In: International conference on machinelearning. PMLR, pp. 511–520 (cit. on pp. 3, 18).
Battaglia, Peter W, Jessica B Hamrick, Victor Bapst, Alvaro Sanchez-Gonzalez, ViniciusZambaldi, Mateusz Malinowski, Andrea Tacchetti, David Raposo, Adam Santoro, Ryan
151
Faulkner, et al. (2018). “Relational inductive biases, deep learning, and graph networks”.In: arXiv preprint arXiv:1806.01261 (cit. on p. 22).
Beery, Sara, Grant Van Horn, and Pietro Perona (2018). “Recognition in terra incognita”.In: Proceedings of the European conference on computer vision (ECCV), pp. 456–473 (cit. onp. 14).
Belkin, Mikhail (2021). “Fit without fear: remarkable mathematical phenomena of deeplearning through the prism of interpolation”. In: arXiv preprint arXiv:2105.14368 (cit. onp. 114).
Ben-Younes, Hedi, Rémi Cadene, Matthieu Cord, and Nicolas Thome (2017). “Mutan:Multimodal tucker fusion for visual question answering”. In: ICCV (cit. on pp. 3, 22).
Ben-Younes, Hedi, Remi Cadene, Nicolas Thome, and Matthieu Cord (2019). “Block:Bilinear superdiagonal fusion for visual question answering and visual relationshipdetection”. In: Proceedings of the AAAI Conference on Artificial Intelligence. Vol. 33, pp. 8102–8109 (cit. on p. 22).
Bhattacharya, Nilavra and Danna Gurari (2019). “VizWiz Dataset Browser: A Tool forVisualizing Machine Learning Datasets”. In: arXiv preprint arXiv:1912.09336 (cit. onp. 41).
Bommasani, Rishi, Drew A Hudson, Ehsan Adeli, Russ Altman, Simran Arora, Sydneyvon Arx, Michael S Bernstein, Jeannette Bohg, Antoine Bosselut, Emma Brunskill, et al.(2021). “On the Opportunities and Risks of Foundation Models”. In: arXiv preprintarXiv:2108.07258 (cit. on p. 12).
Bottou, Léon (2014). “From machine learning to machine reasoning”. In: Machine learning94.2, pp. 133–149 (cit. on pp. 11–14, 35, 87, 121).
Bugliarello, Emanuele, Ryan Cotterell, Naoaki Okazaki, and Desmond Elliott (2020).“Multimodal Pretraining Unmasked: Unifying the Vision and Language BERTs”. In:arXiv preprint arXiv:2011.15124 (cit. on p. 24).
Buolamwini, Joy and Timnit Gebru (2018). “Gender shades: Intersectional accuracy dis-parities in commercial gender classification”. In: Conference on fairness, accountability andtransparency. PMLR, pp. 77–91 (cit. on pp. 5, 15).
Cadene, Remi, Corentin Dancette, Matthieu Cord, Devi Parikh, et al. (2019). “RUBi:Reducing Unimodal Biases for Visual Question Answering”. In: Advances in NeuralInformation Processing Systems, pp. 839–850 (cit. on pp. 26, 50, 53, 58, 63, 64, 66).
Cao, Jize, Zhe Gan, Yu Cheng, Licheng Yu, Yen-Chun Chen, and Jingjing Liu (2020).“Behind the Scene: Revealing the Secrets of Pre-trained Vision-and-Language Models”.In: arXiv preprint arXiv:2005.07310 (cit. on p. 78).
Carter, Shan, Zan Armstrong, Ludwig Schubert, Ian Johnson, and Chris Olah (2019).“Activation Atlas”. In: Distill. https://distill.pub/2019/activation-atlas (cit. on p. 77).
Cashman, Dylan, Genevieve Patterson, Abigail Mosca, Nathan Watts, Shannon Robinson,and Remco Chang (2018). “Rnnbow: Visualizing learning via backpropagation gradientsin rnns”. In: IEEE Computer Graphics and Applications 38.6, pp. 39–50 (cit. on p. 77).
Chaabouni, Rahma, Eugene Kharitonov, Diane Bouchacourt, Emmanuel Dupoux, andMarco Baroni (2020). “Compositionality and Generalization In Emergent Languages”.In: Proceedings of the 58th Annual Meeting of the Association for Computational Linguistics,pp. 4427–4442 (cit. on p. 143).
152
Chandrasekaran, A., V. Prabhu, D. Yadav, P. Chattopadhyay, and D. Parikh (2018). “Doexplanations make VQA models more predictable to a human?” In: EMNLP (cit. onp. 82).
Chen, Wenhu, Zhe Gan, Linjie Li, Yu Cheng, William Wang, and Jingjing Liu (2021). “Metamodule network for compositional visual reasoning”. In: WACV (cit. on pp. 26, 60, 66,128, 134).
Chen, Yen-Chun, Linjie Li, Licheng Yu, Ahmed El Kholy, Faisal Ahmed, Zhe Gan, YuCheng, and Jingjing Liu (2020). “UNITER: UNiversal image-TExt representation learn-ing”. In: ECCV (cit. on p. 24).
Cho, Kyunghyun, Bart van Merriënboer, Caglar Gulcehre, Dzmitry Bahdanau, FethiBougares, Holger Schwenk, and Yoshua Bengio (2014). “Learning Phrase Representa-tions using RNN Encoder–Decoder for Statistical Machine Translation”. In: EMNLP,pp. 1724–1734 (cit. on pp. 20, 128, 130).
Chollet, François (2019). “On the measure of intelligence”. In: arXiv preprint arXiv:1911.01547(cit. on pp. 3, 18).
Clark, Christopher, Mark Yatskar, and Luke Zettlemoyer (2019). “Don’t Take the EasyWay Out: Ensemble Based Methods for Avoiding Known Dataset Biases”. In: EMNLP,pp. 4060–4073 (cit. on pp. 27, 50, 53, 58, 63, 64, 66).
Dancette, Corentin, Remi Cadene, Damien Teney, and Matthieu Cord (2021). “Beyondquestion-based biases: Assessing multimodal shortcut learning in visual questionanswering”. In: ICCV (cit. on pp. 48, 142).
Das, Abhishek, Harsh Agrawal, C. Lawrence Zitnick, Devi Parikh, and Dhruv Batra (2016).“Human Attention in Visual Question Answering: Do Humans and Deep NetworksLook at the Same Regions?” In: EMNLP (cit. on pp. 26, 136).
Das, Abhishek, Samyak Datta, Georgia Gkioxari, Stefan Lee, Devi Parikh, and DhruvBatra (2018). “Embodied Question Answering”. In: Proceedings of the IEEE Conference onComputer Vision and Pattern Recognition (CVPR) (cit. on pp. 18, 142).
Deng, Jia, Wei Dong, Richard Socher, Li-Jia Li, Kai Li, and Li Fei-Fei (2009). “Imagenet: Alarge-scale hierarchical image database”. In: 2009 IEEE conference on computer vision andpattern recognition. Ieee, pp. 248–255 (cit. on p. 20).
DeRose, Joseph F, Jiayao Wang, and Matthew Berger (2020). “Attention Flows: Analyzingand Comparing Attention Mechanisms in Language Models”. In: IEEE Transactions onVisualization and Computer Graphics (cit. on pp. 73, 78).
Descola, Philippe (2013). Beyond nature and culture. University of Chicago Press (cit. onp. 14).
Devlin, Jacob, Ming-Wei Chang, Kenton Lee, and Kristina Toutanova (2019). “BERT:Pre-training of Deep Bidirectional Transformers for Language Understanding”. In:Conference of the North American Chapter of the Association for Computational Linguistics:Human Language Technologies (cit. on pp. 3, 20, 24, 30, 79, 105).
Forde, Jessica Zosa and Michela Paganini (2019). “The scientific method in the science ofmachine learning”. In: arXiv preprint arXiv:1904.10922 (cit. on pp. 51, 141).
Fukui, Akira, Dong Huk Park, Daylen Yang, Anna Rohrbach, Trevor Darrell, and MarcusRohrbach (2016). “Multimodal Compact Bilinear Pooling for Visual Question Answeringand Visual Grounding”. In: EMNLP (cit. on p. 22).
153
Gao, Peng, Zhengkai Jiang, Haoxuan You, Pan Lu, Steven CH Hoi, Xiaogang Wang, andHongsheng Li (2019). “Dynamic fusion with intra-and inter-modality attention flow forvisual question answering”. In: CVPR (cit. on p. 23).
Geirhos, Robert, Jörn-Henrik Jacobsen, Claudio Michaelis, Richard Zemel, Wieland Bren-del, Matthias Bethge, and Felix A Wichmann (2020). “Shortcut learning in deep neuralnetworks”. In: Nature Machine Intelligence 2.11, pp. 665–673 (cit. on pp. ix, 4, 12, 15, 121,142).
Geman, Donald, Stuart Geman, Neil Hallonquist, and Laurent Younes (2015). “Visualturing test for computer vision systems”. In: Proceedings of the National Academy ofSciences 112.12, pp. 3618–3623 (cit. on pp. ix, 3, 16).
Gokhale, Tejas, Pratyay Banerjee, Chitta Baral, and Yezhou Yang (2020a). “MUTANT:A Training Paradigm for Out-of-Distribution Generalization in Visual Question An-swering”. In: Proceedings of the 2020 Conference on Empirical Methods in Natural LanguageProcessing (EMNLP), pp. 878–892 (cit. on p. 27).
Gokhale, Tejas, Pratyay Banerjee, Chitta Baral, and Yezhou Yang (2020b). “Vqa-lol: Visualquestion answering under the lens of logic”. In: European conference on computer vision.Springer, pp. 379–396 (cit. on p. 47).
Goodfellow, Ian, Yoshua Bengio, and Aaron Courville (2016). Deep learning. MIT press(cit. on pp. ix, 3, 6).
Gorman, Kyle and Steven Bedrick (2019). “We need to talk about standard splits”. In:Proceedings of the 57th annual meeting of the association for computational linguistics, pp. 2786–2791 (cit. on pp. 51, 141).
Goyal, Yash, Tejas Khot, Douglas Summers-Stay, Dhruv Batra, and Devi Parikh (2017).“Making the V in VQA matter: Elevating the role of image understanding in VisualQuestion Answering”. In: CVPR, pp. 6904–6913 (cit. on pp. 18, 37–40, 53, 55, 58, 66, 110,123).
Goyal, Yash, Akrit Mohapatra, Devi Parikh, and Dhruv Batra (2016). “Towards trans-parent ai systems: Interpreting visual question answering models”. In: arXiv preprintarXiv:1608.08974 (cit. on p. 78).
Gurari, Danna, Qing Li, Abigale J Stangl, Anhong Guo, Chi Lin, Kristen Grauman, JieboLuo, and Jeffrey P Bigham (2018). “Vizwiz grand challenge: Answering visual questionsfrom blind people”. In: Proceedings of the IEEE Conference on Computer Vision and PatternRecognition, pp. 3608–3617 (cit. on pp. 40, 141).
He, Kaiming, Xiangyu Zhang, Shaoqing Ren, and Jian Sun (2016). “Deep residual learningfor image recognition”. In: Proceedings of the IEEE conference on computer vision and patternrecognition, pp. 770–778 (cit. on p. 20).
Held, Richard and Alan Hein (1963). “Movement-produced stimulation in the develop-ment of visually guided behavior.” In: Journal of comparative and physiological psychology56.5, p. 872 (cit. on p. 142).
Hendricks, Lisa Anne, Zeynep Akata, Marcus Rohrbach, Jeff Donahue, Bernt Schiele,and Trevor Darrell (2016). “Generating visual explanations”. In: European conference oncomputer vision. Springer, pp. 3–19 (cit. on p. 78).
Hendricks, Lisa Anne, Kaylee Burns, Kate Saenko, Trevor Darrell, and Anna Rohrbach(2018). “Women also snowboard: Overcoming bias in captioning models”. In: ECAI.Springer, pp. 793–811 (cit. on pp. 5, 15, 26, 60).
154
Hendrycks, Dan and Kevin Gimpel (2016). “Gaussian error linear units (gelus)”. In: arXivpreprint arXiv:1606.08415 (cit. on p. 130).
Hochreiter, Sepp and Jürgen Schmidhuber (1997). “Long short-term memory”. In: Neuralcomputation 9.8, pp. 1735–1780 (cit. on pp. 20, 58).
Hohman, Fred, Minsuk Kahng, Robert Pienta, and Duen Horng Chau (2018). “VisualAnalytics in Deep Learning: An Interrogative Survey for the Next Frontiers”. In: IEEETransactions on Visualization and Computer Graphics (cit. on p. 73).
Hohman, Fred, Haekyu Park, Caleb Robinson, and Duen Horng Chau (2020). “Summit:Scaling Deep Learning Interpretability by Visualizing Activation and Attribution Sum-marizations”. In: IEEE Transactions on Visualization and Computer Graphics (TVCG) (cit. onp. 77).
Hohman, Fred Matthew, Minsuk Kahng, Robert Pienta, and Duen Horng Chau (2019).“Visual Analytics in Deep Learning: An Interrogative Survey for the Next Frontiers”. In:IEEE Transactions on Visualization and Computer Graphics (cit. on p. 78).
Hu, Ronghang, Anna Rohrbach, Trevor Darrell, and Kate Saenko (2019). “Language-conditioned graph networks for relational reasoning”. In: Proceedings of the IEEE/CVFInternational Conference on Computer Vision, pp. 10294–10303 (cit. on pp. 23, 110).
Hudson, Drew and Christopher D Manning (2019a). “Learning by abstraction: The neuralstate machine”. In: Advances in Neural Information Processing Systems, pp. 5901–5914
(cit. on pp. 26, 110, 111, 134).Hudson, Drew A and Christopher D Manning (2018). “Compositional Attention Networks
for Machine Reasoning”. In: International Conference on Learning Representations (cit. onpp. 110, 112).
Hudson, Drew A and Christopher D Manning (2019b). “Gqa: A new dataset for real-worldvisual reasoning and compositional question answering”. In: CVPR, pp. 6700–6709 (cit.on pp. 4, 5, 16, 18, 37, 42–46, 53, 55, 58, 59, 62–64, 80, 90, 93, 110, 111, 123, 125, 127, 130,131, 134, 140).
Jaunet, Theo, Corentin Kervadec, Romain Vuillemot, Grigory Antipov, Moez Baccouche,and Christian Wolf (2021). “VisQA: X-raying Vision and Language Reasoning in Trans-formers”. In: IEEE Transactions on Visualization and Computer Graphics (TVCG) (cit. onpp. 7, 74, 75, 78).
Jiang, Huaizu, Ishan Misra, Marcus Rohrbach, Erik Learned-Miller, and Xinlei Chen(2020). “In defense of grid features for visual question answering”. In: Proceedings of theIEEE/CVF Conference on Computer Vision and Pattern Recognition, pp. 10267–10276 (cit. onpp. 21, 141).
Jiang, Yu, Vivek Natarajan, Xinlei Chen, Marcus Rohrbach, Dhruv Batra, and Devi Parikh(2018). “Pythia v0. 1: the winning entry to the vqa challenge 2018”. In: arXiv preprintarXiv:1807.09956 (cit. on p. 47).
Johnson, Justin, Bharath Hariharan, Laurens van der Maaten, Li Fei-Fei, C LawrenceZitnick, and Ross Girshick (2017). “Clevr: A diagnostic dataset for compositionallanguage and elementary visual reasoning”. In: CVPR, pp. 2901–2910 (cit. on pp. 18, 37,40, 41, 47, 140).
Kafle, Kushal and Christopher Kanan (2017). “An Analysis of Visual Question AnsweringAlgorithms”. In: ICCV (cit. on p. 44).
155
Karpathy, Andrej and Li Fei-Fei (2015a). “Deep visual-semantic alignments for generatingimage descriptions”. In: Proceedings of the IEEE conference on computer vision and patternrecognition, pp. 3128–3137 (cit. on pp. 17, 105).
Karpathy, Andrej, Justin Johnson, and Li Fei-Fei (2015b). “Visualizing and understandingrecurrent networks”. In: arXiv preprint arXiv:1506.02078 (cit. on p. 77).
Kazemzadeh, Sahar, Vicente Ordonez, Mark Matten, and Tamara Berg (2014). “Refer-itgame: Referring to objects in photographs of natural scenes”. In: Proceedings of the2014 conference on empirical methods in natural language processing (EMNLP), pp. 787–798
(cit. on p. 17).Kervadec, C., G. Antipov, M. Baccouche, and C. Wolf (2021a). “Roses Are Red, Violets Are
Blue... but Should VQA Expect Them To?” In: Proceedings of the IEEE/CVF Conference onComputer Vision and Pattern Recognition (CVPR) (cit. on pp. 91, 134).
Kervadec, Corentin, Grigory Antipov, Moez Baccouche, and Christian Wolf (2019). “WeakSupervision helps Emergence of Word-Object Alignment and improves Vision-LanguageTasks”. In: European Conference on Artificial Intelligence (ECAI) (cit. on pp. 7, 104).
Kervadec, Corentin, Grigory Antipov, Moez Baccouche, and Christian Wolf (2021b).“Roses Are Red, Violets Are Blue... but Should Vqa Expect Them To?” In: Proceedings ofthe IEEE/CVF Conference on Computer Vision and Pattern Recognition (CVPR) (cit. on pp. 7,36).
Kervadec, Corentin, Theo Jaunet, Grigory Antipov, Moez Baccouche, Romain Vuillemot,and Christian Wolf (2021c). “How Transferable are Reasoning Patterns in VQA?” In:Proceedings of the IEEE/CVF Conference on Computer Vision and Pattern Recognition (CVPR)(cit. on pp. 7, 74, 104).
Kervadec, Corentin, Christian Wolf, Grigory Antipov, Moez Baccouche, and MadihaNadri (2021d). “Supervising the Transfer of Reasoning Patterns in VQA”. In: Advancesin Neural Information Processing Systems (NeurIPS) (cit. on pp. 7, 104).
Kim, Jin-Hwa, Jaehyun Jun, and Byoung-Tak Zhang (2018). “Bilinear attention networks”.In: Advances in Neural Information Processing Systems, pp. 1564–1574 (cit. on pp. 22, 60,66, 126, 127, 134).
Kim, Jin-Hwa, Kyoung-Woon On, Woosang Lim, Jeonghee Kim, Jung-Woo Ha, andByoung-Tak Zhang (2016). “Hadamard product for low-rank bilinear pooling”. In: arXivpreprint arXiv:1610.04325 (cit. on p. 22).
Kingma, Diederik P and Jimmy Ba (2014). “Adam: A method for stochastic optimization”.In: (cit. on pp. 58, 111, 124, 130).
Kipf, Thomas N and Max Welling (2017). “Semi-supervised classification with graphconvolutional networks”. In: (cit. on p. 23).
Krishna, Ranjay, Yuke Zhu, Oliver Groth, Justin Johnson, Kenji Hata, Joshua Kravitz,Stephanie Chen, Yannis Kalantidis, Li-Jia Li, David A Shamma, et al. (2017). “Visualgenome: Connecting language and vision using crowdsourced dense image annota-tions”. In: IJCV 123.1, pp. 32–73 (cit. on pp. 59, 79, 88, 110, 123, 130).
Kwon, Bum Chul, Min-Je Choi, Joanne Taery Kim, Edward Choi, Young Bin Kim, Soon-wook Kwon, Jimeng Sun, and Jaegul Choo (2018). “Retainvis: Visual analytics withinterpretable and interactive recurrent neural networks on electronic medical records”.In: IEEE transactions on visualization and computer graphics 25.1, pp. 299–309 (cit. on p. 77).
156
Lazaridou, Angeliki, Alexander Peysakhovich, and Marco Baroni (2017). “Multi-AgentCooperation and the Emergence of (Natural) Language”. In: (cit. on p. 142).
Lee, Kuang-Huei, Xi Chen, Gang Hua, Houdong Hu, and Xiaodong He (2018). “Stackedcross attention for image-text matching”. In: Proceedings of the European Conference onComputer Vision (ECCV), pp. 201–216 (cit. on p. 17).
Legg, Shane, Marcus Hutter, et al. (2007). “A collection of definitions of intelligence”. In:(cit. on p. 12).
Li, Linjie, Jie Lei, Zhe Gan, and Jingjing Liu (2021). “Adversarial VQA: A New Benchmarkfor Evaluating the Robustness of VQA Models”. In: arXiv preprint arXiv:2106.00245(cit. on pp. 48, 141).
Li, Liunian Harold, Mark Yatskar, Da Yin, Cho-Jui Hsieh, and Kai-Wei Chang (2020a).“What Does BERT with Vision Look At?” In: ACL (short) (cit. on p. 78).
Li, Xiujun, Xi Yin, Chunyuan Li, Pengchuan Zhang, Xiaowei Hu, Lei Zhang, Lijuan Wang,Houdong Hu, Li Dong, Furu Wei, et al. (2020b). “Oscar: Object-semantics aligned pre-training for vision-language tasks”. In: European Conference on Computer Vision. Springer,pp. 121–137 (cit. on p. 24).
Li, Yikang, Nan Duan, Bolei Zhou, Xiao Chu, Wanli Ouyang, Xiaogang Wang, and MingZhou (2018). “Visual question generation as dual task of visual question answering”. In:Proceedings of the IEEE conference on computer vision and pattern recognition, pp. 6116–6124
(cit. on p. 17).Lin, Tsung-Yi, Michael Maire, Serge Belongie, James Hays, Pietro Perona, Deva Ramanan,
Piotr Dollár, and C Lawrence Zitnick (2014). “Microsoft coco: Common objects incontext”. In: ECCV (cit. on pp. 17, 58, 79, 105, 110, 123, 130).
Lipton, Zachary C (2016). “The mythos of model interpretability”. In: arXiv preprintarXiv:1606.03490 (cit. on p. 73).
Liu, Mengchen, Jiaxin Shi, Zhen Li, Chongxuan Li, Jun Zhu, and Shixia Liu (2016).“Towards better analysis of deep convolutional neural networks”. In: IEEE transactionson visualization and computer graphics 23.1, pp. 91–100 (cit. on p. 77).
Lu, Jiasen, Dhruv Batra, Devi Parikh, and Stefan Lee (2019). “Vilbert: Pretraining task-agnostic visiolinguistic representations for vision-and-language tasks”. In: NeurIPS(cit. on pp. 24, 30, 111).
Lu, Jiasen, Jianwei Yang, Dhruv Batra, and Devi Parikh (2016). “Hierarchical question-image co-attention for visual question answering”. In: Proceedings of the 30th InternationalConference on Neural Information Processing Systems, pp. 289–297 (cit. on p. 82).
Malinowski, Mateusz and Mario Fritz (2014). “A multi-world approach to questionanswering about real-world scenes based on uncertain input”. In: NeurIPS (cit. onpp. 44, 45).
Manjunatha, Varun, Nirat Saini, and Larry S Davis (2019). “Explicit bias discovery in visualquestion answering models”. In: Proceedings of the IEEE/CVF Conference on ComputerVision and Pattern Recognition, pp. 9562–9571 (cit. on p. 78).
Mansimov, Elman, Emilio Parisotto, Lei Jimmy Ba, and Ruslan Salakhutdinov (2016).“Generating Images from Captions with Attention”. In: ICLR (cit. on p. 17).
Mikolov, Tomas, Ilya Sutskever, Kai Chen, Greg S Corrado, and Jeff Dean (2013). “Dis-tributed representations of words and phrases and their compositionality”. In: Advancesin neural information processing systems, pp. 3111–3119 (cit. on p. 19).
157
Mitchell, Tom M (1980). The need for biases in learning generalizations. Department ofComputer Science, Laboratory for Computer Science Research . . . (cit. on p. 14).
Norcliffe-Brown, Will, Stathis Vafeias, and Sarah Parisot (2018). “Learning ConditionedGraph Structures for Interpretable Visual Question Answering”. In: NeurIPS (cit. onp. 23).
Olah, Chris and Shan Carter (2016). “Attention and Augmented Recurrent Neural Net-works”. In: Distill. url: http://distill.pub/2016/augmented-rnns (cit. on p. 78).
Park, Dong Huk, Lisa Anne Hendricks, Zeynep Akata, Anna Rohrbach, Bernt Schiele,Trevor Darrell, and Marcus Rohrbach (2018). “Multimodal explanations: Justifyingdecisions and pointing to the evidence”. In: Proceedings of the IEEE Conference on ComputerVision and Pattern Recognition, pp. 8779–8788 (cit. on p. 78).
Pearl, Judea et al. (2000). “Models, reasoning and inference”. In: Cambridge, UK: Cambridge-UniversityPress 19 (cit. on pp. 13, 142).
Pennington, Jeffrey, Richard Socher, and Christopher D Manning (2014). “Glove: Globalvectors for word representation”. In: EMNLP, pp. 1532–1543 (cit. on p. 19).
Perez, Ethan, Florian Strub, Harm De Vries, Vincent Dumoulin, and Aaron Courville(2018). “Film: Visual reasoning with a general conditioning layer”. In: Proceedings of theAAAI Conference on Artificial Intelligence. Vol. 32. 1 (cit. on p. 112).
Picard, David (2021). “Torch. manual_seed (3407) is all you need: On the influence ofrandom seeds in deep learning architectures for computer vision”. In: arXiv preprintarXiv:2109.08203 (cit. on p. 141).
Plummer, Bryan A, Liwei Wang, Chris M Cervantes, Juan C Caicedo, Julia Hockenmaier,and Svetlana Lazebnik (2015). “Flickr30k entities: Collecting region-to-phrase correspon-dences for richer image-to-sentence models”. In: Proceedings of the IEEE internationalconference on computer vision, pp. 2641–2649 (cit. on p. 17).
Popper, Karl (1934). The Logic of Scientific Discovery. Routledge (cit. on p. 12).Radford, Alec, Jong Wook Kim, Chris Hallacy, Aditya Ramesh, Gabriel Goh, Sandhini
Agarwal, Girish Sastry, Amanda Askell, Pamela Mishkin, Jack Clark, et al. (2021).“Learning transferable visual models from natural language supervision”. In: arXivpreprint arXiv:2103.00020 (cit. on p. 142).
Rajpurkar, Pranav, Jian Zhang, Konstantin Lopyrev, and Percy Liang (2016). “SQuAD:100, 000+ Questions for Machine Comprehension of Text”. In: EMNLP (cit. on pp. 17,18).
Ramakrishnan, Sainandan, Aishwarya Agrawal, and Stefan Lee (2018). “Overcominglanguage priors in visual question answering with adversarial regularization”. In:Advances in Neural Information Processing Systems, pp. 1541–1551 (cit. on pp. 26, 50).
Rame, Alexandre, Corentin Dancette, and Matthieu Cord (2021). “Fishr: Invariant GradientVariances for Out-of-distribution Generalization”. In: arXiv preprint arXiv:2109.02934(cit. on p. 142).
Ramesh, Aditya, Mikhail Pavlov, Gabriel Goh, Scott Gray, Chelsea Voss, Alec Radford,Mark Chen, and Ilya Sutskever (2021). “Zero-shot text-to-image generation”. In: arXivpreprint arXiv:2102.12092 (cit. on pp. 17, 142).
Ramsauer, Hubert, Bernhard Schäfl, Johannes Lehner, Philipp Seidl, Michael Widrich,Lukas Gruber, Markus Holzleitner, Milena Pavlovic, Geir Kjetil Sandve, Victor Greiff,
158
et al. (2020). “Hopfield networks is all you need”. In: arXiv preprint arXiv:2008.02217(cit. on pp. 79, 91, 92, 94–96).
Ray, Arijit, Karan Sikka, Ajay Divakaran, Stefan Lee, and Giedrius Burachas (2019).“Sunny and Dark Outside?! Improving Answer Consistency in VQA through EntailedQuestion Generation”. In: Proceedings of the 2019 Conference on Empirical Methods inNatural Language Processing and the 9th International Joint Conference on Natural LanguageProcessing (EMNLP-IJCNLP), pp. 5863–5868 (cit. on p. 46).
Ren, Shaoqing, Kaiming He, Ross Girshick, and Jian Sun (2015). “Faster r-cnn: Towardsreal-time object detection with region proposal networks”. In: Advances in neural in-formation processing systems, pp. 91–99 (cit. on pp. 3, 20, 21, 28, 80, 88, 90, 107, 123,134).
Ribeiro, Marco Tulio, Sameer Singh, and Carlos Guestrin (2016). “Why should i trust you?:Explaining the predictions of any classifier”. In: Proceedings of the 22nd ACM SIGKDDinternational conference on knowledge discovery and data mining. ACM, pp. 1135–1144
(cit. on p. 73).S. Shalev-Shwart, Shai and S. Ben-David (2014). Understanding Machine Learning - From
Theory to Algorithms. Cambridge University Press (cit. on p. 114).Santoro, Adam, David Raposo, David G Barrett, Mateusz Malinowski, Razvan Pascanu,
Peter Battaglia, and Timothy Lillicrap (2017). “A simple neural network module forrelational reasoning”. In: Advances in Neural Information Processing Systems 30 (cit. onp. 23).
Schölkopf, Bernhard, Francesco Locatello, Stefan Bauer, Nan Rosemary Ke, Nal Kalch-brenner, Anirudh Goyal, and Yoshua Bengio (2021). “Toward causal representationlearning”. In: Proceedings of the IEEE 109.5, pp. 612–634 (cit. on p. 142).
Selvaraju, Ramprasaath R, Stefan Lee, Yilin Shen, Hongxia Jin, Shalini Ghosh, Larry Heck,Dhruv Batra, and Devi Parikh (2019). “Taking a hint: Leveraging explanations to makevision and language models more grounded”. In: ICCV (cit. on pp. 27, 50).
Selvaraju, Ramprasaath R, Purva Tendulkar, Devi Parikh, Eric Horvitz, Marco TulioRibeiro, Besmira Nushi, and Ece Kamar (2020). “SQuINTing at VQA Models: Introspect-ing VQA Models With Sub-Questions”. In: Proceedings of the IEEE/CVF Conference onComputer Vision and Pattern Recognition, pp. 10003–10011 (cit. on p. 46).
Shah, Harshay, Kaustav Tamuly, Aditi Raghunathan, Prateek Jain, and Praneeth Netrapalli(2020). “The Pitfalls of Simplicity Bias in Neural Networks”. In: NeurIPS. url: https://proceedings.neurips.cc/paper/2020/hash/6cfe0e6127fa25df2a0ef2ae1067d915-
Abstract.html (cit. on pp. 15, 142).Shah, Meet, Xinlei Chen, Marcus Rohrbach, and Devi Parikh (2019). “Cycle-consistency
for robust visual question answering”. In: Proceedings of the IEEE/CVF Conference onComputer Vision and Pattern Recognition, pp. 6649–6658 (cit. on pp. 16, 45).
Sheng, Sasha, Amanpreet Singh, Vedanuj Goswami, Jose Alberto Lopez Magana, WojciechGaluba, Devi Parikh, and Douwe Kiela (2021). “Human-Adversarial Visual QuestionAnswering”. In: arXiv preprint arXiv:2106.02280 (cit. on pp. 36, 48, 141).
Shrestha, Robik, Kushal Kafle, and Christopher Kanan (2020). “A negative case analysisof visual grounding methods for VQA”. In: Proceedings of the 58th Annual Meeting of theAssociation for Computational Linguistics (cit. on p. 50).
159
Shridhar, Mohit, Jesse Thomason, Daniel Gordon, Yonatan Bisk, Winson Han, RoozbehMottaghi, Luke Zettlemoyer, and Dieter Fox (2020). “Alfred: A benchmark for interpret-ing grounded instructions for everyday tasks”. In: Proceedings of the IEEE/CVF conferenceon computer vision and pattern recognition, pp. 10740–10749 (cit. on p. 18).
Strobelt, Hendrik, Sebastian Gehrmann, Michael Behrisch, Adam Perer, Hanspeter Pfister,and Alexander M Rush (2018). “Seq2seq-vis: A visual debugging tool for sequence-to-sequence models”. In: IEEE transactions on visualization and computer graphics 25.1,pp. 353–363 (cit. on p. 78).
Strobelt, Hendrik, Sebastian Gehrmann, Hanspeter Pfister, and Alexander M Rush (2017).“Lstmvis: A tool for visual analysis of hidden state dynamics in recurrent neuralnetworks”. In: IEEE transactions on visualization and computer graphics 24.1, pp. 667–676
(cit. on p. 77).Suhr, Alane, Stephanie Zhou, Ally Zhang, Iris Zhang, Huajun Bai, and Yoav Artzi (2019).
“A Corpus for Reasoning about Natural Language Grounded in Photographs”. In:Proceedings of the 57th Annual Meeting of the Association for Computational Linguistics,pp. 6418–6428 (cit. on pp. 17, 109, 111, 112).
Sun, Chen, Austin Myers, Carl Vondrick, Kevin Murphy, and Cordelia Schmid (2019).“Videobert: A joint model for video and language representation learning”. In: Proceed-ings of the IEEE/CVF International Conference on Computer Vision, pp. 7464–7473 (cit. onp. 25).
Tan, Hao and Mohit Bansal (2019). “LXMERT: Learning Cross-Modality Encoder Repre-sentations from Transformers”. In: EMNLP, pp. 5103–5114 (cit. on pp. 24, 25, 27, 28, 30,31, 47, 58–60, 63, 66, 79, 91, 103–105, 107, 110–112, 118, 123–125, 127, 130–132, 134, 135).
Teney, Damien, Ehsan Abbasnedjad, and Anton van den Hengel (2020a). “Learningwhat makes a difference from counterfactual examples and gradient supervision”. In:Computer Vision–ECCV 2020: 16th European Conference, Glasgow, UK, August 23–28, 2020,Proceedings, Part X 16. Springer, pp. 580–599 (cit. on pp. 13, 27, 142).
Teney, Damien, Ehsan Abbasnejad, and Anton van den Hengel (2020b). “Unshuffling datafor improved generalization”. In: arXiv preprint arXiv:2002.11894 (cit. on pp. 27, 50).
Teney, Damien, Ehsan Abbasnejad, Kushal Kafle, Robik Shrestha, Christopher Kanan,and Anton van den Hengel (2020c). “On the Value of Out-of-Distribution Testing: AnExample of Goodhart's Law”. In: NeurIPS (cit. on pp. 27, 47, 49, 50).
Teney, Damien, Ehsan Abbasnejad, Simon Lucey, and Anton van den Hengel (2021).“Evading the Simplicity Bias: Training a Diverse Set of Models Discovers Solutions withSuperior OOD Generalization”. In: arXiv preprint arXiv:2105.05612 (cit. on p. 142).
Teney, Damien, Lingqiao Liu, and Anton van Den Hengel (2017). “Graph-structuredrepresentations for visual question answering”. In: Proceedings of the IEEE conference oncomputer vision and pattern recognition, pp. 1–9 (cit. on p. 23).
Valiant, L.G. (1984). “A theory of the learnable”. In: Communications of the ACM. Vol. 27(11)(cit. on pp. 114–116).
Vani, Ankit, Max Schwarzer, Yuchen Lu, Eeshan Dhekane, and Aaron Courville (2021).“Iterated learning for emergent systematicity in {VQA}”. In: International Conference onLearning Representations. url: https://openreview.net/forum?id=Pd_oMxH8IlF (cit. onp. 143).
160
Vaswani, Ashish, Noam Shazeer, Niki Parmar, Jakob Uszkoreit, Llion Jones, Aidan NGomez, Łukasz Kaiser, and Illia Polosukhin (2017). “Attention is all you need”. In:Advances in neural information processing systems, pp. 5998–6008 (cit. on pp. x, 3, 21, 23,28, 78, 105).
Vig, Jesse (2019a). “A Multiscale Visualization of Attention in the Transformer Model”.In: arXiv preprint arXiv:1906.05714. url: https://arxiv.org/abs/1906.05714 (cit. onp. 73).
Vig, Jesse (2019b). “A Multiscale Visualization of Attention in the Transformer Model”.In: Proceedings of the 57th Annual Meeting of the Association for Computational Linguistics:System Demonstrations (cit. on p. 78).
Voita, Elena, David Talbot, Fedor Moiseev, Rico Sennrich, and Ivan Titov (2019). “Analyz-ing Multi-Head Self-Attention: Specialized Heads Do the Heavy Lifting, the Rest CanBe Pruned”. In: Proceedings of the 57th Annual Meeting of the Association for ComputationalLinguistics, pp. 5797–5808 (cit. on p. 96).
Wikipedia (2021). Commonsense reasoning — Wikipedia, The Free Encyclopedia. [Online;accessed 10-September-2021]. url: https://en.wikipedia.org/wiki/Commonsense_reasoning (cit. on p. 13).
Wiktionary (2021). Reasoning — Wiktionary, The Free Dictionary. [Online; accessed 10-September-2021]. url: https://en.wiktionary.org/wiki/reasoning (cit. on p. 11).
Wu, Jialin and Raymond Mooney (2019). “Self-Critical Reasoning for Robust VisualQuestion Answering”. In: Advances in Neural Information Processing Systems, pp. 8601–8611 (cit. on pp. 27, 50).
Wu, Qi, Damien Teney, Peng Wang, Chunhua Shen, Anthony Dick, and Anton van denHengel (2017). “Visual question answering: A survey of methods and datasets”. In:Computer Vision and Image Understanding 163, pp. 21–40 (cit. on p. 44).
Wu, Yonghui, Mike Schuster, Zhifeng Chen, Quoc V Le, Mohammad Norouzi, WolfgangMacherey, Maxim Krikun, Yuan Cao, Qin Gao, Klaus Macherey, et al. (2016). “Google’sneural machine translation system: Bridging the gap between human and machinetranslation”. In: arXiv preprint arXiv:1609.08144 (cit. on p. 28).
Xie, Ning, Farley Lai, Derek Doran, and Asim Kadav (2019). “Visual entailment: A noveltask for fine-grained image understanding”. In: arXiv preprint arXiv:1901.06706 (cit. onp. 17).
Xu, K., J. Li, M. Zhang, S.S. Du, K.-I. K., and S. Jegelka (2020). “What can Neural NetworksReason About”. In: ICLR (cit. on pp. 106, 114, 116–118, 149).
Xu, Kelvin, Jimmy Ba, Ryan Kiros, Kyunghyun Cho, Aaron Courville, Ruslan Salakhudi-nov, Rich Zemel, and Yoshua Bengio (2015). “Show, attend and tell: Neural imagecaption generation with visual attention”. In: International conference on machine learning.PMLR, pp. 2048–2057 (cit. on pp. 20, 21).
Yang, Zichao, Xiaodong He, Jianfeng Gao, Li Deng, and Alex Smola (2016). “Stackedattention networks for image question answering”. In: CVPR, pp. 21–29 (cit. on p. 22).
Yi, Kexin, Jiajun Wu, Chuang Gan, Antonio Torralba, Pushmeet Kohli, and Josh Tenen-baum (2018). “Neural-symbolic vqa: Disentangling reasoning from vision and languageunderstanding”. In: NeurIPS (cit. on pp. 26, 38, 42).
161
Yu, Zhou, Jun Yu, Yuhao Cui, Dacheng Tao, and Qi Tian (2019). “Deep modular co-attention networks for visual question answering”. In: CVPR, pp. 6281–6290 (cit. onpp. 3, 23, 24, 29, 58, 60, 66, 127, 134).
Zeiler, Matthew D and Rob Fergus (2014). “Visualizing and understanding convolutionalnetworks”. In: European conference on computer vision. Springer, pp. 818–833 (cit. onp. 77).
Zhang, C., S. Bengio, M. Hardt, B. Recht, and O. Vinyals (2017). “Understanding deeplearning requires rethinking generalization ”. In: ICLR (cit. on p. 114).
Zhang, Pengchuan, Xiujun Li, Xiaowei Hu, Jianwei Yang, Lei Zhang, Lijuan Wang, YejinChoi, and Jianfeng Gao (2021). “Vinvl: Revisiting visual representations in vision-language models”. In: Proceedings of the IEEE/CVF Conference on Computer Vision andPattern Recognition, pp. 5579–5588 (cit. on pp. 20, 38, 134, 135, 141).
Zhou, Zhi-Hua (2018). “A brief introduction to weakly supervised learning”. In: Nationalscience review 5.1, pp. 44–53 (cit. on p. 109).
Zhu, Yuke, Oliver Groth, Michael Bernstein, and Li Fei-Fei (2016). “Visual7w: Groundedquestion answering in images”. In: Proceedings of the IEEE conference on computer visionand pattern recognition, pp. 4995–5004 (cit. on p. 44).
162
FOLIO ADMINISTRATIF
THESE DE L’UNIVERSITE DE LYON OPEREE AU SEIN DE L’INSA LYON
NOM : KERVADEC DATE de SOUTENANCE : 09/12/2021
Prénoms : Corentin Adrien Joseph
TITRE : Biais et raisonnement dans les systèmes de questions réponses visuelles
NATURE : Doctorat Numéro d'ordre : 2021LYSEI101
Ecole doctorale : Ecole doctorale d’Informatique et Mathématique de Lyon (INFOMATHS, ED 512) Spécialité : Informatique RESUME : De quelle couleur est le terrain de tennis ? Quelle est la taille du chien ? Y a-t-il une voiture à droite du vélo sous le cocotier ? Répondre à ces questions fondamentales est le sujet de la tâche appelée question-réponses visuelle (VQA, en anglais), dans laquelle un agent doit répondre à des questions posées sur des images. Plus précisément, le VQA requiert de mettre au point un agent capable de maitriser une grande variété de compétences : reconnaître des objets, reconnaitre des attributs (couleur, taille, matériaux, etc.), identifier des relations (e.g. spatiales), déduire des enchainements logiques, etc. C'est pourquoi, le VQA est parfois désigné comme un test de Turing visuel, dont le but est d'évaluer la capacité d'un agent à raisonner sur des images. Cette tâche a récemment connu d'important progrès grâce à l'utilisation des réseaux de neurones et de l'apprentissage profond. Après une revue détaillée de l'État de l'Art sur le VQA, ainsi qu'une définition de notre utilisation du terme raisonnement, nous nous intéressons à la question suivante : les modèles de VQA actuels raisonnent-ils vraiment ? La mise en œuvre d'une nouvelle méthode d'évaluation (GQA-OOD) nous permettra de répondre négativement à cette question. En particulier, nous mettrons en évidence la tendance des modèles à apprendre des raccourcis, autrement appelés biais, présent dans les données d'entrainement, mais heurtant les capacités de généralisation. Nous proposerons alors, dans une troisième partie une analyse approfondie des mécanismes d'attention appris par les réseaux de neurones artificiels. Nous étudierons quels sont les enchainements aboutissant à un raisonnement, ou, au contraire, à une prédiction biaisée par un raccourci frauduleux. La dernière et quatrième partie tire conclusion de nos évaluations et analyses, afin de développer de nouvelles méthodes améliorant les performances des modèles de VQA. En résumé, cette thèse a pour objet l'étude du raisonnement visuel dans des réseaux de neurones artificiels entrainés par apprentissage profond, dans le cadre du VQA. Mais surtout, ce qui nous intéressera en premier lieu, c'est l'évaluation et l'analyse de l'influence qu'ont les biais, présents dans les données d'apprentissage, sur les prédictions de nos modèles. MOTS-CLÉS : Machine Learning; Deep Learning; Vision and Language; Visual Reasoning; // Apprentissage Automatique ; Apprentissage Profond; Vision et Langage; Raisonnement Visuel ; Laboratoire (s) de recherche : LIRIS (INSA Lyon), Orange Innovation Directeur de thèse: Christian Wolf (directeur), Grigory Antipov (co-encadrant), Moez Baccouche (co-encadrant) Président de jury : David Picard Composition du jury : Rapporteur : David Picard, Nicolas Thome // Examinateur·rice·s : Cordelia Schmid, Damien Teney, Akata Zeynep // Directeur de thèse : Christian Wolf // Co-encadrants : Grigory Antipov, Moez Baccouche
Related Documents