1 Why Does Understanding Business Data Matter for Your Company? Improving Business Insight A GUIDE FOR SMALL AND MID-SIZED BUSINESSES You know your busi ness better than anyone else, and making decisions about how to run your business is part of your everyday life. No matter what the size of your organization, the data you capture and share on a daily basis—through various business systems, customer relationships, partner and supplier inter- actions, Web-based ex- periences, and more—is becoming ubiquitous. Finding ways to tap into and analyze that data can help you make bet- ter decisions that sup- port business success. This can mean being able to: • Produceaccurateandup-to-dat erev enue statements when applying for a new loan. • Understandsales by geography or by individual sales representative. • Developalistof your topcustomersin minutes. • Creat edail yupda testo a“ salesb yprodu ct against target” report to motivate the sales team. • Compa redata fromy ourac coun ting system with your sales records to highlight discrepancies between invoices and orders or analyze customer payment status prior to accepting new orders. Regardless of the type of business you run, data- driven actions can quickly and directly impact the protabilityofyouroperations.Sohowdoyoureg - ularly—and automatically—access and compile this data? Per haps you r salesteamhas certa inspread - sheets and reports to review; your bookkeeper has otherprot/lossinfor - mation; your money management software has aggregated your bank statements and credit card expenses. The challenge with this do-it-yourself ap- proach to business decision-making is that everyone in your company has their own way of gathering and interpreting in- formation. The result is that there’s no single version of truth, and insight gained is often not transferable or sharable. Housing or managing all this data in a way that allows you to easily compile, analyze, and share reports is key to making sense of business data across the organization. But the reality is that if you’re a small business, you likely don’t have an internal IT department to do this. Sometimesitseemsit’sjusteasiertoworkwithwhat you already know—a couple of spreadsheets and a whiteboard, maybe some Web metrics from your hosting service—than to pay for an outside IT con- sultant and learn to use all the seemingly complex technology. “Business intelligence? No thanks, we’re just a small company… we don’t need complicated, expensive technology that’s just going to tell us what we already know...”

Welcome message from author
This document is posted to help you gain knowledge. Please leave a comment to let me know what you think about it! Share it to your friends and learn new things together.
Transcript

8/6/2019 BI Whitepaper V4
http://slidepdf.com/reader/full/bi-whitepaper-v4 1/10
1
Why Does Understanding Business Data Matter for Your Company?
Improving Business InsightA GUIDE FOR SMALL AND MID-SIZED BUSINESSES
You know your business better than anyone else, and
making decisions about how to run your business is
part of your everyday life. No matter what the size
of your organization, the data you capture and share
on a daily basis—through various business systems,customer relationships, partner and supplier inter-
actions, Web-based ex-
periences, and more—is
becoming ubiquitous.
Finding ways to tap into
and analyze that data
can help you make bet-
ter decisions that sup-
port business success.
This can mean being
able to:
• Produceaccurateandup-to-daterevenue
statements when applying for a new loan.
• Understandsalesbygeographyorby
individual sales representative.
• Developalistofyourtopcustomersin
minutes.
• Createdailyupdatestoa“salesbyproduct
against target” report to motivate the sales
team.
• Comparedatafromyouraccounting
system with your sales records to highlight
discrepancies between invoices and orders
or analyze customer payment status prior to
accepting new orders.
Regardless of the type of business you run, data-
driven actions can quickly and directly impact the
protabilityofyouroperations.Sohowdoyoureg -
ularly—and automatically—access and compile this
data?Perhapsyoursalesteamhas certainspread-sheets and reports to review; your bookkeeper has
otherprot/lossinfor -
mation; your money
management software
has aggregated your
bank statements and
credit card expenses.
The challenge with
this do-it-yourself ap-
proach to business
decision-making is that everyone in your companyhas their own way of gathering and interpreting in-
formation. The result is that there’s no single version
of truth, and insight gained is often not transferable
or sharable. Housing or managing all this data in a
way that allows you to easily compile, analyze, and
share reports is key to making sense of business data
across the organization.
But the reality is that if you’re a small business, you
likely don’t have an internal IT department to do this.
Sometimesitseemsit’sjusteasiertoworkwithwhat
you already know—a couple of spreadsheets and
a whiteboard, maybe some Web metrics from your
hosting service—than to pay for an outside IT con-
sultant and learn to use all the seemingly complex
technology.
“Business intelligence? No thanks, we’re
just a small company… we don’t need
complicated, expensive technology that’s
just going to tell us what we already
know...”
8/6/2019 BI Whitepaper V4
http://slidepdf.com/reader/full/bi-whitepaper-v4 2/10
2
While large enterprises have increasingly embraced
incorporating “business intelligence” into their op-
erations, smaller businesses have often been slower
to embrace the practice. The reasons? Historically,adding this functionality meant additional costs for
licenses and training, as well as dealing with the com-
plexity of installing, maintaining, and incorporating
yet another application into everyday activities.
Todayyou don’tneed tomakea signicant ITin-
vestment to get a better picture of your operations.
Your business can take advantage of the Microsoft
products you may already own and use to explore
abusinessintelligencesolutionthattsyou.Costis
no longer a barrier since you likely already have thelicenses you need; and by getting more out of the
tools you use every day, you make it easy for every-
one to take a closer look at the data they need to
make the best decisions for the business.
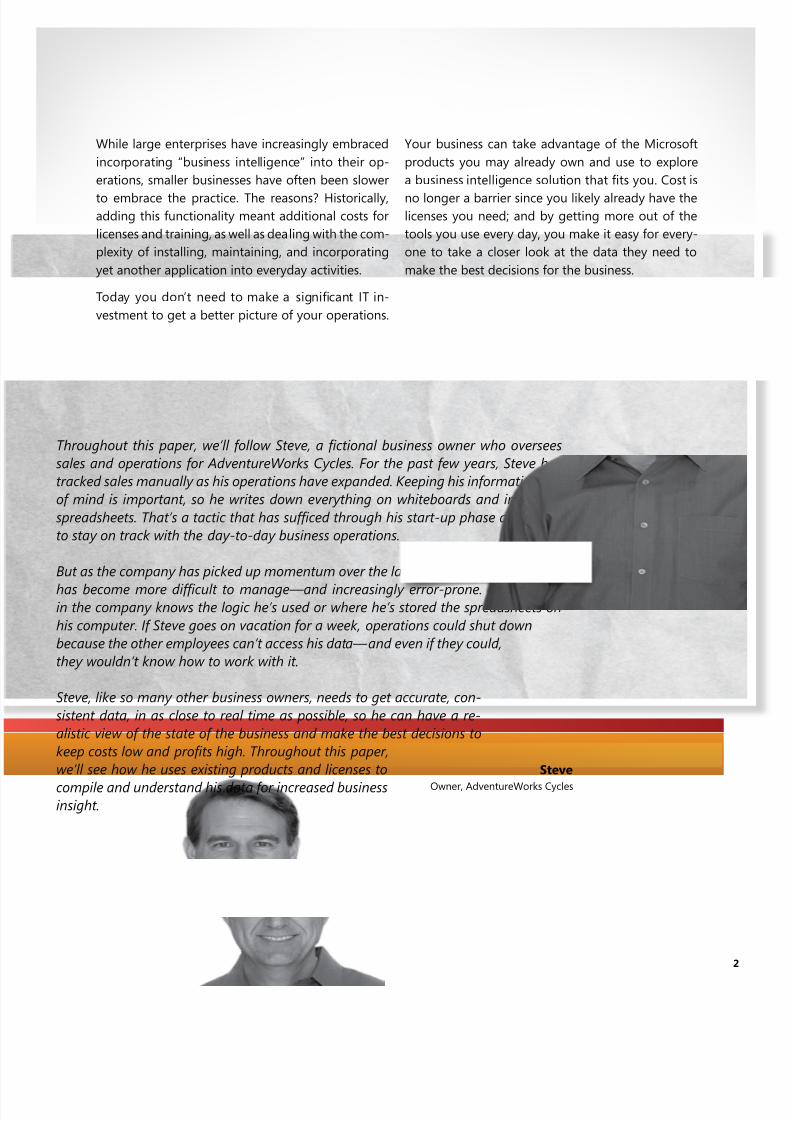
Throughout this paper, we’ll follow Steve, a ctional business owner who oversees
sales and operations for AdventureWorks Cycles. For the past few years, Steve has
tracked sales manually as his operations have expanded. Keeping his information top
of mind is important, so he writes down everything on whiteboards and in ad hoc
spreadsheets. That’s a tactic that has sufced through his start-up phase as he tries
to stay on track with the day-to-day business operations.
But as the company has picked up momentum over the last few years, this approach
has become more difcult to manage—and increasingly error-prone. No one elsein the company knows the logic he’s used or where he’s stored the spreadsheets on
his computer. If Steve goes on vacation for a week, operations could shut down
because the other employees can’t access his data—and even if they could,
they wouldn’t know how to work with it.
Steve, like so many other business owners, needs to get accurate, con-
sistent data, in as close to real time as possible, so he can have a re-
alistic view of the state of the business and make the best decisions to
keep costs low and prots high. Throughout this paper,
we’ll see how he uses existing products and licenses to
compile and understand his data for increased businessinsight.
Steve
Owner,AdventureWorksCycles

8/6/2019 BI Whitepaper V4
http://slidepdf.com/reader/full/bi-whitepaper-v4 3/10
3
Unlocking Data to Support Better Decisions
Every business process generates metrics that, with basic analysis, can help you make better decisions. Byanalyzing your data, you can begin to connect the dots around key data points and answer questions that
have an impact on how you approach various activities:
• Whichworkstreamsorbusinessofferingsaretrulyprotable?
• Whichofferingsappearprotablebutaren’t?
• Wheredoyou(oryourprojects)standinreachingcriticalmilestones?
• Whenisthebesttimetolaunchamarketingcampaign?
• Whatwasthebestperformingproductorservicelastquarter?
• Doeseveryoneinthecompany,whetherintheofceormobile,haveaccesstothesame
dependable data?
Asaresult,youcangainabetteroverallviewofthebusiness.Unprotableproductlinescanbeeliminated,andresourcescanbeusedmoreefcientlyorperhapsmovedtomoreprotableareasofthebusiness.Your
company becomes smarter, leaner, more effective, and better positioned to face challenges successfully.
Database
Mobile Access to Data
Tracking BusinessPerformance
Tools for Analysis

8/6/2019 BI Whitepaper V4
http://slidepdf.com/reader/full/bi-whitepaper-v4 4/10
4
Finding the Right Solution for Your Business
That’s exactly what Steve from AdventureWorks Cycles did. Steve has recently begun using standard SQL
Server reports to get an accurate, consistent view of sales data for the whole company. Business opera-
tions have branched out into several regions, and each regional sales manager is keeping track of that
area’s performance.
Steve wants to make sure he can keep each regional sales manager aware of the overall company per-
formance, and develop a useful way for everyone to collaborate and see into the specic sales and prot
margins of each region so they can collectively make better decisions across the whole organization.
A basic SQL Server reporting solution helps him quickly generate
and build intuitive reports, analyze data, easily create charts,
and get a snapshot of information such as bank account
balances, important reminders, and accounts receivable
and payable—all on one screen.
Finally, using Microsoft Ofce Excel and other familiar
Microsoft Ofce tools, Steve makes this data analysis
easier and more intuitive by adding simple data vi-
sualization for quicker and more informed business
decisions. With PowerPivot for Excel 2010, he’s ableto speedily transform very large quantities of data
into meaningful information, getting the answers he
needs in seconds.
Timely, relevant, accurate information is what candrivewise andprotable decisions. Your business
canbenetfromasolutionthatgetsyoutheright
information at the right time. Here’s how to start—
and how you can expand your solution over time as
your needs change.
Getting Started with Reporting and Data
Visualization
UsingthefamiliarMicrosoftOfcesystemandSQL
Server,youcantrackandimproveyourbusinessper -
formance to make better-informed decisions andstaycompetitive.SQLServer includesstandardre-
ports that can give you a consistent view of business
operations (includingnancial, inventory, andcost
data),andthesereportscanbeeasilypublishedand
shared. You can also use Microsoft Excel to add eas-
ily recognizable data visualization, rich sorting and
lteringcapabilities,andmorewaystointeractwith
and act on the data you’ve collected.

8/6/2019 BI Whitepaper V4
http://slidepdf.com/reader/full/bi-whitepaper-v4 5/10
5
Sharing Reports and Adding Richer Data Visualization
Taking his quest for business insight further, Steve builds and manages SQL Server reports
to gather and share sales performance data with his regional managers. The SQL Server
reports he creates are customizable and automated, and give him an improved view into
AdventureWorks Cycles’ nancial and business performance.
Next, Steve turns the data from his
business applications into ac-
tionable items by making reports
available to all employees using
familiar formats such as Excel
spreadsheets, Word documents,and even the Web. He also posts
the reports to the company’s
Microsoft SharePoint collabo-
ration portal to keep the latest
data available in a central loca-
tion for anyone to access.
WhenyourbusinessapplicationsrunonSQLServer,
you have access to standard reports using ReportingServicesandReportBuilderthatcangiveyoumore
visibility into your data. You can easily work with and
view these reportsusingfamiliarOfce tools,and
you can share them with others in your organization
to help everyone understand business performance.
Once you have set up access to the database from
within Reporting Services, you can start creating,modifying, and sharing reports. Reports can be pub-
lished to a central location—such as the Web, your
SharePointsite,oranothersharedlocation—andau-
tomatically updated so you and your team can make
decisions based on current information.

8/6/2019 BI Whitepaper V4
http://slidepdf.com/reader/full/bi-whitepaper-v4 6/10
6
Holistic Reporting, Rich Scorecards, and Dashboards
A more in-depth solution can take data from your
existing systems and consolidate it into a single ho-listicview.Thisgivesyoutheexibilitytorunwhat’s
knownas“adhoc”reportswhichallowyoutocreate
specic,customizedqueries.Youcanalsocreateau-
tomatically updated, intuitive scorecards that track
your company’s key performance indicators with
rich data visualization, including embedded graphs
and charts.
A scorecard is an at-a-glance way for you to look at
the all-up performance of your business across vari-
ous criteria for your company’s success. Your score-card may include some of the following metrics:
• Frequencyofin-personcustomervisits
• Websitevisitorrates
• Percentageofsalesonrstcontact
• Stockdeliveries• Numberofleads
• Callcentersales
Just as scorecards can help you see whether you’re
meeting specic objectives, dashboards can give
you a visual display of the most important informa-
tion you need toachieveone ormore objectives.
Dashboardsdisplay holisticbusiness data, consoli-
dated and arranged on a single screen so you can
view information as a snapshot and drill deeper to
uncover the underlying triggers for various results.These visually-based presentations of business met-
rics can be used to quickly inform management de-
cision-making.
Let’s take a look at Steve’s example once more. While his current reports are helpful for gaining
perspective, he’d like to combine data from various systems to more accurately map actual perfor-
mance numbers to sales goals, and to display it in an easy-to-understand way. Steve also wants
to give every employee access to accurate, actionable information so they can understand the key
drivers for the business and make appropriate, timely decisions that support increased prots.
Using familiar Microsoft products, he’s able to create in-
teractive reports and visually present the data in score-
cards and dashboards that users can explore for more
information. Together, Ofce Excel, SharePoint Server,
and SQL Server enable Steve to create a solution that
combines data from different business applications and
data sources to create a single, holistic view of overall
company operations. And he easily publishes these re-
ports to a central location, thus helping everyone in the
company access the data they need to stay focused on
the business priorities.
8/6/2019 BI Whitepaper V4
http://slidepdf.com/reader/full/bi-whitepaper-v4 7/10
7
Get More Out of the Microsoft Products You Already Own
Here’s how familiar Microsoft products can help you gain more insight into your business data:
Data storage and reporting
SQLServeristhefoundationthatfast,smart,efcientbusinessesarebuilton.It’san
optimal way to store and analyze your data and run a wide variety of standard and
custom reports with built-in reporting features.
Sharing and collaboration
Ascompaniesgrow,it’softendifculttokeeptrackofthemultiplyingdocuments
andtheirlocations.SharePointenablesyoutostoreandshareallyourlesina
central site, manage dashboards and scorecards, and collaborate on documents and
processes—anytime, anywhere.
Visualization and Analysis
Microsoft Excel helps you visualize your data, navigate it quickly, query the most relevant information, and
conduct“what-if”analysissocanyoucondentlyplanthebestcourseofaction.Youcandothisfromjustasimple
spreadsheetoryoucanbuildprofessional-lookingchartsandapplyrichvisualenhancementssuchas3-Deffects,
soft shadowing, and transparency.
PowerPivotforExcel2010isadataanalysistoolthatdeliversevenmorecomputationalpowerdirectlywithinExcel
Andifyou’realreadyusingSharePoint,youcangainaddedefciencythroughSharePoint-basedmanagementtoo
WiththefullsuiteofMicrosoftOfceproductsyoualreadyuse,youcaneasilyandeffectivelycreate,analyze,and
sharereports.BuildchartsinExcel,shareyourinfowithSharePoint,explorericherdatavisualizationwithMicrosoft
OfceVisio®,andcreatereportsandpresentationswithyourndingsinMicrosoftOfceWordandMicrosoftOf
PowerPoint®.Sharingdataacrossmultipleapplicationsiseasy,soyoucanusethetoolsyou’remostfamiliarwithto
increase your business insight.
Why look to Microsoft products and technologies tofuelyourefforts?Themainreasons:Cost,familiar -
ity, and the peace of mind that Microsoft technol-
ogycanscaleasyourbusinessgrows.Usingtheca-
pabilities built into the Microsoft products you may
already own, you can compile the raw data you have
quickly and affordably, and start getting more rel-
evant insight from your data.
The Microsoft platform provides better value foryour money because it allows you to maximize your
existing investments in software and licenses. It also
has lower support, training, and maintenance costs,
andissupportedbytrustedpartners.Andnally,itis
simple, intuitive, and interoperable with the systems
you already know and use.

8/6/2019 BI Whitepaper V4
http://slidepdf.com/reader/full/bi-whitepaper-v4 8/10
8
Checklist: Finding the Right Partner
While you’re the expert in running your own busi-ness, where you may need support is comprehensive
IT knowledge. This is why it’s important to engage an
experienced partner to help shape your data analysis
efforts, cost-effectively leverage your existing tech-
nology,andkeepyoufrom“reinventingthewheel”
by pointing out best practices from others.
Here’s what to look for in considering an IT partner
to help you get started with data analysis:
1. IsthepartnercertiedonMicrosoft
products?CertiedMicrosoftpartners,withproven
expertise, are available worldwide to
help companies of all sizes and industries
select and implement the right business
technology—and to provide support through
future business changes.
2. Willthepartnerprovidereferences?
Make sure the partner will supply you with
a list of customers in your industry who
will answer questions and provide written
references to you. If not, the partner is not
for you. If the partner does supply a client list,
you may want to ask them these remaining
questions.
3. Is the partner’s business stable?
Find out if the partner is a stable business
organization with the technical infrastructure
and staff to deploy a solution for your
business within your timeframe. After the
partner implements the business solution, you
want to make sure the organization supportsyourstaffbyhelpingtone-tunethesystem
and address any problems that might arise.
4. Is the partner an expert in your industry?You need a partner who demonstrates a clear
understanding of your business concerns and
your industry, a partner who can draw from
extensive expertise with multiple businesses.
Your partner should suggest strategies and
develop your business solution with you.
5. Does the partner clearly consider the
featuresandcomponentsyouneed?
The software solution proposed by the
partner should be the right one to address
your business requirements. If it isn’t, the
partner needs to be willing to rework the
proposal until you have exactly what you
need. For example, does the partner have
expertise in working with the database, portal,
and data analysis solutions you intend to use?
Find out ahead of time about any hidden fees
related to revising your solution.
6. Are the partner’s consultants technologi-
callyprocient?
Make sure the partner uses a proven imple-mentationmethodologyandconguration
toolsthatspeedimplementation,congura-
tion, and upgrades. Ask the partner if the
consultants who will implement your solution
havebeencertiedbythesoftwarevendoron
thatsolution.Whatkindsofcerticationsdo
they have?
Wecanhelpyoundapartnerthathascompleted
the Microsoft Business Intelligence competency at
http://pinpoint.microsoft.com/ .

8/6/2019 BI Whitepaper V4
http://slidepdf.com/reader/full/bi-whitepaper-v4 9/10
9
Now that you’ve started to look at your data in newways and create reporting solutions for more insight,
what’s next? How can you be sure that the technol-
ogy investments you make now for better business
insight will be good for both the short and the long
term?
Microsoft is committed to helping small and mid-
sized businesses to maximize their technology ben-
etswhilereducingtheiroverallcosts.Onewayisby
leveragingthepowerofthecloud.Theterm“cloud”
has become a bit of a buzzword—essentially it refers
to infrastructure that resides in and uses the simplic-
ity,accessibility,andexibilityoftheInternet.When
you have your servers and applications in the cloud
instead of on-premises, you can access your data
fromvirtuallyanywhere,andyoucansaveasigni-
cant amount of money and IT burden by not need-ing to invest in managing and maintaining your own
servers.
Moving forward, Microsoft is continuing to invest in
development of new technologies like cloud-based
WindowsAzureandSQLAzuretohelpyouusethe
products you have now to make it even easier to ac-
cess and analyze data. Azure and other cloud ser-
vicescangiveyourbusinessexibilityandscalewith
the ability to pay as you grow, they can reduce data-
base procurement and management needs, and can
enableanywhereaccesstokeybusinessdata.Learn
more at http://www.azure.com.
What Your Data Looks Like in the Future
Your
Cloud-based
Data and
Applications
AzureWindows® TM
platform
AppFabric
Windows Azure Platform
Your Users

8/6/2019 BI Whitepaper V4
http://slidepdf.com/reader/full/bi-whitepaper-v4 10/10
10
Summary: How to Gain Insight to Strengthen Your Business
Today it is critical to know what is really happening inyour business and to know it fast enough so that you
can make the right decisions when it counts. Taking
full advantage of the technology investment you’ve
already made, you can make business insight work
for you. Here’s how:
• Haveaprocessinplacefordeterminingwhat
you want your data to tell you. Otherwise, you
won’t be able to use it to its fullest extent.
• Createandnurtureacultureofdataatyour
business. A few extra minutes spent onreporting and analysis can result in direct and
tangible business gains.
• Understandthattheprocessisdynamic.
It’s not something that you implement and
forget. Regularly review the use of your data
analysis tools.
Because you already own many Microsoft products,
gaining new insight into your business can be very
cost-effective. A solution based on Microsoft tech-
nologies can offer your company these compellingbenets:
• Lowertotalcosts.Leverageyourexisting
investmentsinSQLServer,SharePoint
technologies,andtheOfcesystem.
• Empoweryouremployeestomakebetter
business decisions. Give them visibility into
data and enable them to perform analysis
with minimal hand-holding, so they can then
make fast, accurate decisions.
• Enjoyrapiddeploymentandfastertime-
to-benets.Promotewidespreadadoption
with intuitive yet powerful business analysis
capabilities embedded within the everyday
productivity tools your employees already use.
Find a Microsoft partner at http://pinpoint.microsoft.com to help you explore cost-effective business in-
telligence solutions that can help you make better-
informed decisions.
To learn more about business intelligence for small
and mid-sized companies, visit http://www.microsoft.
com/businessinsight .
Related Documents