BARC N E W S L E T T E R Bi-monthly • September - October • 2014 ISSN:0976-2108 IN THIS ISSUE • Prompt Identification of T Prompt Identification of T Prompt Identification of T Prompt Identification of T Prompt Identification of Tsunamigenic sunamigenic sunamigenic sunamigenic sunamigenic Earthquakes from Multi-Station Seismic Data Earthquakes from Multi-Station Seismic Data Earthquakes from Multi-Station Seismic Data Earthquakes from Multi-Station Seismic Data Earthquakes from Multi-Station Seismic Data • Phase T Phase T Phase T Phase T Phase Transformation and Deformation ransformation and Deformation ransformation and Deformation ransformation and Deformation ransformation and Deformation Studies in Zr Based Alloys Studies in Zr Based Alloys Studies in Zr Based Alloys Studies in Zr Based Alloys Studies in Zr Based Alloys • Assessment of Higher Order Shear and Normal Assessment of Higher Order Shear and Normal Assessment of Higher Order Shear and Normal Assessment of Higher Order Shear and Normal Assessment of Higher Order Shear and Normal Deformations Theories for Stress Analysis and Deformations Theories for Stress Analysis and Deformations Theories for Stress Analysis and Deformations Theories for Stress Analysis and Deformations Theories for Stress Analysis and Free Vibration of Functionally Graded Plates Free Vibration of Functionally Graded Plates Free Vibration of Functionally Graded Plates Free Vibration of Functionally Graded Plates Free Vibration of Functionally Graded Plates • The elusive neutrino The elusive neutrino The elusive neutrino The elusive neutrino The elusive neutrino • Seamless Access to Networked Information: Seamless Access to Networked Information: Seamless Access to Networked Information: Seamless Access to Networked Information: Seamless Access to Networked Information: The Role of Domain Ontologies The Role of Domain Ontologies The Role of Domain Ontologies The Role of Domain Ontologies The Role of Domain Ontologies BHABHA ATOMIC RESEARCH CENTRE ³ÖÖ³ÖÖ ¯Ö¸ü´ÖÖÖã †−ÖãÃÖÓ¬ÖÖ−Ö ëú¦ü

Welcome message from author
This document is posted to help you gain knowledge. Please leave a comment to let me know what you think about it! Share it to your friends and learn new things together.
Transcript

BARCN E W S L E T T E R
Bi-monthly • September - October • 2014 ISSN:0976-2108
IN THIS ISSUE
• Prompt Identification of TPrompt Identification of TPrompt Identification of TPrompt Identification of TPrompt Identification of Tsunamigenicsunamigenicsunamigenicsunamigenicsunamigenic
Earthquakes from Multi-Station Seismic DataEarthquakes from Multi-Station Seismic DataEarthquakes from Multi-Station Seismic DataEarthquakes from Multi-Station Seismic DataEarthquakes from Multi-Station Seismic Data
• Phase TPhase TPhase TPhase TPhase Transformation and Deformationransformation and Deformationransformation and Deformationransformation and Deformationransformation and DeformationStudies in Zr Based AlloysStudies in Zr Based AlloysStudies in Zr Based AlloysStudies in Zr Based AlloysStudies in Zr Based Alloys
• Assessment of Higher Order Shear and NormalAssessment of Higher Order Shear and NormalAssessment of Higher Order Shear and NormalAssessment of Higher Order Shear and NormalAssessment of Higher Order Shear and NormalDeformations Theories for Stress Analysis andDeformations Theories for Stress Analysis andDeformations Theories for Stress Analysis andDeformations Theories for Stress Analysis andDeformations Theories for Stress Analysis andFree Vibration of Functionally Graded PlatesFree Vibration of Functionally Graded PlatesFree Vibration of Functionally Graded PlatesFree Vibration of Functionally Graded PlatesFree Vibration of Functionally Graded Plates
• The elusive neutrinoThe elusive neutrinoThe elusive neutrinoThe elusive neutrinoThe elusive neutrino
• Seamless Access to Networked Information:Seamless Access to Networked Information:Seamless Access to Networked Information:Seamless Access to Networked Information:Seamless Access to Networked Information:The Role of Domain OntologiesThe Role of Domain OntologiesThe Role of Domain OntologiesThe Role of Domain OntologiesThe Role of Domain Ontologies
BHABHA ATOMIC RESEARCH CENTRE ³ÖÖ³ÖÖ ¯Ö¸ü´ÖÖ�Öã †−ÖãÃÖÓ¬ÖÖ−Ö � ëú¦ü

BARC NEWSLETTER
I ISSUE NO. 340 I SEPTEMBER - OCTOBER 2014
In the Forthcoming IssueIn the Forthcoming IssueIn the Forthcoming IssueIn the Forthcoming IssueIn the Forthcoming Issue
1. Multiple diglycolamide functionalized ligands in room temperatureionic liquids: ‘green’ solvents for actinide partitioningArijit Sengupta et al.
2. Design, Development and Commercialization of ISOCAD (IntegratedSystem Of Computer Aided Dosimetry) for gamma irradiatorsAmit Shrivastava et al.
3. Delayed Time Response Self-Powered Neutron Detectors for ReactorControlA. Mishra et al.
4. Photosensitization of skin cancer cells, by coralyne, is mediatedthrough ATR-p38 MAPK-Bax and JAK2-STAT1-BAX pathwaysRahul Bhattacharyya et al.
5. Drop-Interface Coalescence in Liquid-Liquid systems: Effect of surfaceactive agentsSmita Dixit, et al.

BARC NEWSLETTER
ISSUE NO. 340 I SEPTEMBER - OCTOBER 2014 I i
CONTENTS
Editorial Note ii
Brief Communications
•· Lutetium-177 Labeled Hydroxyapatite (HA) for the Treatment of Rheumatoid Arthritis: iii
Kit Product Development
•·High Figure-of-Merit Thermoelectric Materials iv
Research Articles
• Prompt Identification of Tsunamigenic Earthquakes from Multi-Station Seismic Data 1
A.K.Pal, et al.
•· Phase Transformation and Deformation Studies in Zr Based Alloys 8
K.V. Mani Krishna, D. Srivastava and G.K. Dey
•· Assessment of Higher Order Shear and Normal Deformations Theories for Stress Analysis and 13
Free Vibration of Functionally Graded Plates
D.K. Jha,et al.
Feature Articles
• The elusive neutrino 22
V.M. Datar
• Seamless Access to Networked Information: The Role of Domain Ontologies 31
Sangeeta Deokattey and K. Bhanumurthy
News and Events
• Theme Meeting on Challenges in Fast Reactor Fuel Reprocessing (CFRFR-2014) 38
• Technology Transfer to Industries 39
• Honour for BARC 43
BARC Scientists Honoured 44

BARC NEWSLETTER
ii I ISSUE NO. 340 I SEPTEMBER - OCTOBER 2014
SEPTEMBER - OCTOBER
Editorial Committee
Chairman
Dr. S.K. Apte,
Director, Bio-Science Group
Editor
Dr. K. Bhanumurthy
Head, SIRD
Associate Editors for this issue
Dr. G. Rami Reddy, RSD
Dr. A.K. Naik, RED
Members
Dr. R.C. Hubli, MPD
Dr. D.N. Badodkar, DRHR
Dr. K.T. Shenoy, ChED
Dr. A.P. Tiwari, RCnD
Dr. S.M. Yusuf, SSPD
Dr. A.K. Tyagi, ChD
Mr. G. Venugopala Rao, APPD
Dr. C.P. Kaushik, WMD
Dr. G. Rami Reddy, RSD
Dr. S. Kannan, FCD
Dr. A.K. Nayak, RED
Dr. S.K. Sandur, RB&HSD
Dr. S.C. Deokattey, SIRD
From the Editor’s Desk...............
Welcome to the September-October 2014 issue of the BARC
Newsletter. It features five articles, Two Brief Communications
and reports of various scientific events organized by BARC.
One of the articles showcases R&D work (which received the
INSA Young Scientist Honour) on microstructural and textural
changes, taking place during the processing of the Zirconium
alloys and their role in the hydriding behavior. Zirconium-based
structural components are an integral part of thermal nuclear
reactors.
The second article is on Functionally Graded Materials (FGMs),
which are recent additions to the family of engineering
composites made of two or more constituent phases. These
materials are used for making nuclear components. Stress
analysis and free vibration of FG elastic, rectangular and simply
(diaphragm) supported plates are discussed in the article.
Under-sea earthquakes have the deadly potential of generating
Tsunamis. Quick determination of hypocenter, magnitude and
fault plane parameters of these earthquakes is essential in
assessing the tsunami generating potential of these earthquakes.
The article discusses an in-house software that has been
developed to analyze various parameters from the seismic
waveform data recorded at global stations available over the
internet.
A feature article on Neutrinos throws light on the elementary
particle, its various sources and the Indian effort to build an
underground laboratory; the India-based Neutrino Observatory
(INO).
Another feature article discusses the role of domain ontologies,
(which are semantic networks of interconnected concepts on
various subject domains), in providing seamless access to
networked information and R&D efforts at BARC in this direction.
Dr. K. BhanumurthyOn behalf of the Editorial Committee
ISSUE NO. 340 I SEPTEMBER - OCTOBER 2014 I iii
BARC NEWSLETTERBRIEF COMMUNICATION
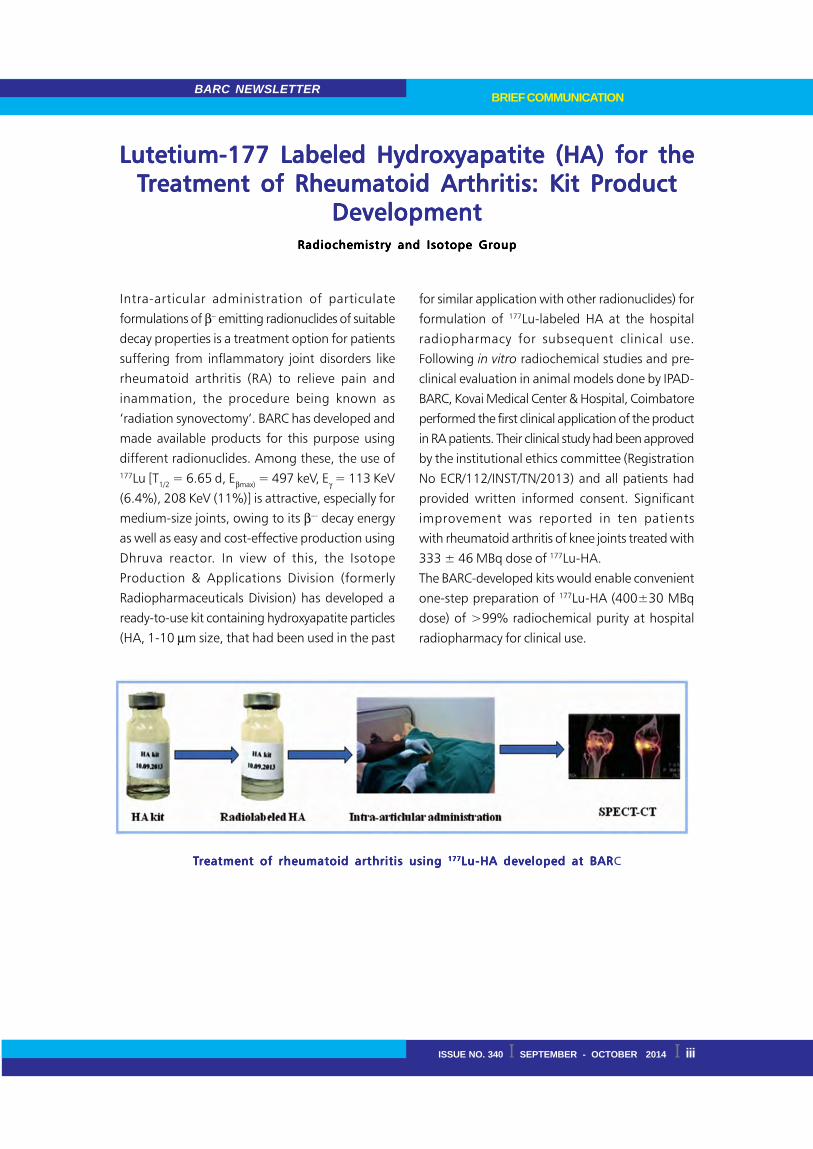
TTTTTreatment of rheumatoid arthritis using reatment of rheumatoid arthritis using reatment of rheumatoid arthritis using reatment of rheumatoid arthritis using reatment of rheumatoid arthritis using 177177177177177Lu-HA developed at BARLu-HA developed at BARLu-HA developed at BARLu-HA developed at BARLu-HA developed at BARC
Lutetium-177 Labeled Hydroxyapatite (HA) for theLutetium-177 Labeled Hydroxyapatite (HA) for theLutetium-177 Labeled Hydroxyapatite (HA) for theLutetium-177 Labeled Hydroxyapatite (HA) for theLutetium-177 Labeled Hydroxyapatite (HA) for theTTTTTreatment of Rheumatoid Arthritis: Kit Productreatment of Rheumatoid Arthritis: Kit Productreatment of Rheumatoid Arthritis: Kit Productreatment of Rheumatoid Arthritis: Kit Productreatment of Rheumatoid Arthritis: Kit Product
DevelopmentDevelopmentDevelopmentDevelopmentDevelopmentRadiochemistry and Isotope GroupRadiochemistry and Isotope GroupRadiochemistry and Isotope GroupRadiochemistry and Isotope GroupRadiochemistry and Isotope Group
Intra-articular administration of particulate
formulations of β− emitting radionuclides of suitable
decay properties is a treatment option for patients
suffering from inflammatory joint disorders like
rheumatoid arthritis (RA) to relieve pain and
inammation, the procedure being known as
‘radiation synovectomy’. BARC has developed and
made available products for this purpose using
different radionuclides. Among these, the use of177Lu [T1/2 = 6.65 d, Eβmax) = 497 keV, Eγ = 113 KeV
(6.4%), 208 KeV (11%)] is attractive, especially for
medium-size joints, owing to its β−- decay energy
as well as easy and cost-effective production using
Dhruva reactor. In view of this, the Isotope
Production & Applications Division (formerly
Radiopharmaceuticals Division) has developed a
ready-to-use kit containing hydroxyapatite particles
(HA, 1-10 μm size, that had been used in the past
for similar application with other radionuclides) for
formulation of 177Lu-labeled HA at the hospital
radiopharmacy for subsequent clinical use.
Following in vitro radiochemical studies and pre-
clinical evaluation in animal models done by IPAD-
BARC, Kovai Medical Center & Hospital, Coimbatore
performed the first clinical application of the product
in RA patients. Their clinical study had been approved
by the institutional ethics committee (Registration
No ECR/112/INST/TN/2013) and all patients had
provided written informed consent. Significant
improvement was reported in ten patients
with rheumatoid arthritis of knee joints treated with
333 ± 46 MBq dose of 177Lu-HA.
The BARC-developed kits would enable convenient
one-step preparation of 177Lu-HA (400±30 MBq
dose) of >99% radiochemical purity at hospital
radiopharmacy for clinical use.
BARC NEWSLETTERBRIEF COMMUNICATION
iv I ISSUE NO. 340 I SEPTEMBER - OCTOBER 2014
High Figure-of-Merit Thermoelectric MaterialsHigh Figure-of-Merit Thermoelectric MaterialsHigh Figure-of-Merit Thermoelectric MaterialsHigh Figure-of-Merit Thermoelectric MaterialsHigh Figure-of-Merit Thermoelectric MaterialsPhysics GroupPhysics GroupPhysics GroupPhysics GroupPhysics Group
Thermoelectric power generators (TEG) are gaining
importance for the conversion of waste heat (from
automobiles, industries, nuclear reactors etc.)
directly into electricity. The key parameter for
obtaining high conversion efficiency is figure-of-
merit i.e. ZT = (S2σ/k)T, where S,σ,k, and T are
respectively, Seebeck coefficient, electrical
conductivity, thermal conductivity and temperature.
For a given thermoelectric material, S, σ and k are
interdependent and typical ZT is limited to ≤ 1 [1].
One of the effective approaches to maximize ZT is
to lower down k without reducing the power factor
(S2σ), which can be achieved by reducing the lattice
contribution of k. Based on this approach,
(AgCrSe2)0.5(CuCrSe2)0.5 composites and SiGe
materials were synthesized using solid-state reaction
and mechanical alloying, respectively. The ZT of
(AgCrSe2)0.5(CuCrSe2)0.5 composite was found to be
1.4 (at 773 K), which is far superior as compared to
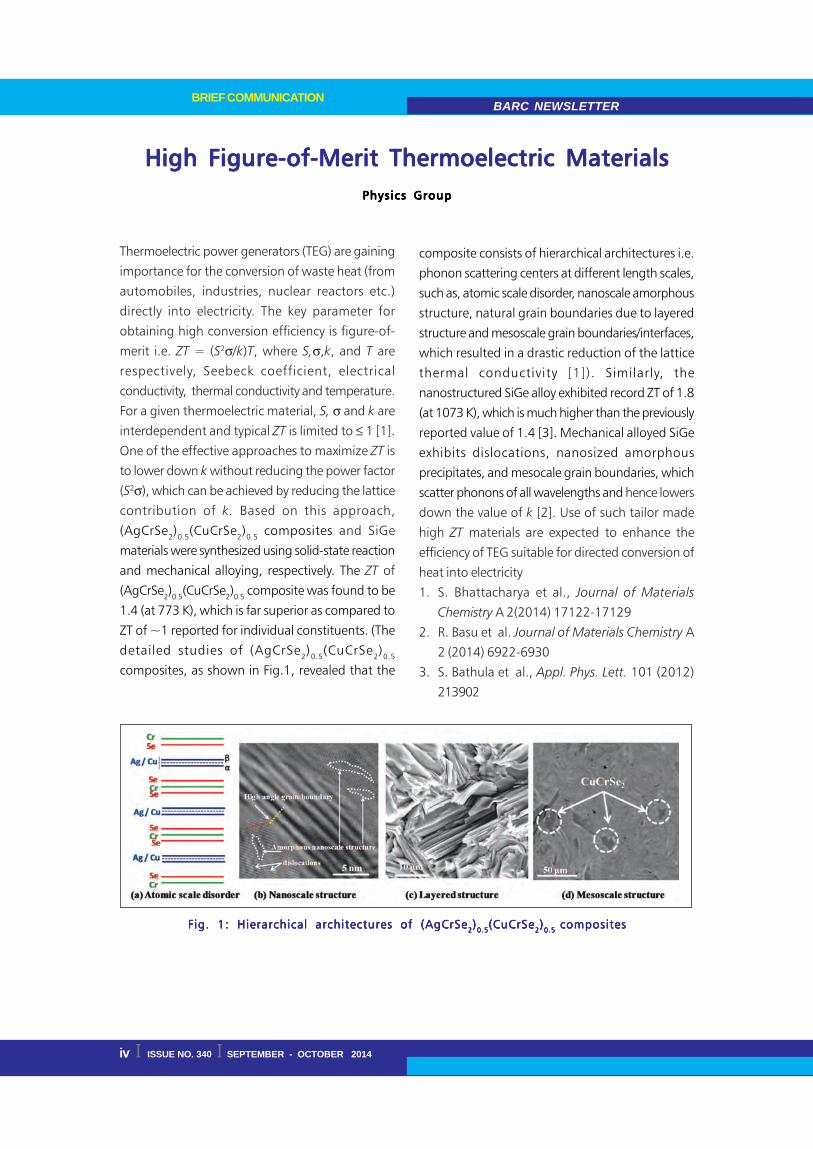
ZT of ~1 reported for individual constituents. (The
detailed studies of (AgCrSe2)0.5(CuCrSe2)0.5
composites, as shown in Fig.1, revealed that the
composite consists of hierarchical architectures i.e.
phonon scattering centers at different length scales,
such as, atomic scale disorder, nanoscale amorphous
structure, natural grain boundaries due to layered
structure and mesoscale grain boundaries/interfaces,
which resulted in a drastic reduction of the lattice
thermal conductivity [1]). Similarly, the
nanostructured SiGe alloy exhibited record ZT of 1.8
(at 1073 K), which is much higher than the previously
reported value of 1.4 [3]. Mechanical alloyed SiGe
exhibits dislocations, nanosized amorphous
precipitates, and mesocale grain boundaries, which
scatter phonons of all wavelengths and hence lowers
down the value of k [2]. Use of such tailor made
high ZT materials are expected to enhance the
efficiency of TEG suitable for directed conversion of
heat into electricity
1. S. Bhattacharya et al., Journal of Materials
Chemistry A 2(2014) 17122-17129
2. R. Basu et al. Journal of Materials Chemistry A
2 (2014) 6922-6930
3. S. Bathula et al., Appl. Phys. Lett. 101 (2012)
213902
Fig. 1: Hierarchical architectures of (AgCrSeFig. 1: Hierarchical architectures of (AgCrSeFig. 1: Hierarchical architectures of (AgCrSeFig. 1: Hierarchical architectures of (AgCrSeFig. 1: Hierarchical architectures of (AgCrSe22222)))))0.50.50.50.50.5(CuCrSe(CuCrSe(CuCrSe(CuCrSe(CuCrSe22222)))))0.5 0.5 0.5 0.5 0.5 compositescompositescompositescompositescomposites

ISSUE NO. 340 I SEPTEMBER - OCTOBER 2014 I 1
BARC NEWSLETTERRESEARCH ARTICLE
Prompt Identification ofPrompt Identification ofPrompt Identification ofPrompt Identification ofPrompt Identification ofTTTTTsunamigenic Earthquakes from Multi-Stationsunamigenic Earthquakes from Multi-Stationsunamigenic Earthquakes from Multi-Stationsunamigenic Earthquakes from Multi-Stationsunamigenic Earthquakes from Multi-Station
Seismic DataSeismic DataSeismic DataSeismic DataSeismic DataAAAAA.K.P.K.P.K.P.K.P.K.Pal, Aal, Aal, Aal, Aal, A.K.K.K.K.Kundu, K.K.Bhuyan, Aundu, K.K.Bhuyan, Aundu, K.K.Bhuyan, Aundu, K.K.Bhuyan, Aundu, K.K.Bhuyan, A.C.Joy.C.Joy.C.Joy.C.Joy.C.Joy, Y, Y, Y, Y, Y.S.Bhadauria,.S.Bhadauria,.S.Bhadauria,.S.Bhadauria,.S.Bhadauria,
A.Vijaya Kumar and S.MukhopadhyayA.Vijaya Kumar and S.MukhopadhyayA.Vijaya Kumar and S.MukhopadhyayA.Vijaya Kumar and S.MukhopadhyayA.Vijaya Kumar and S.MukhopadhyaySeismology Division
IntroductionIntroductionIntroductionIntroductionIntroduction
Tsunamis are mainly generated by vertical uplift of
water from an undersea earthquake. Usually a large
earthquake with thrust fault in the oceanic
subduction zone generates tsunami. On the other
hand large undersea earthquakes with strike-slip fault
may not generate appreciable tsunami. For example
strike-slip earthquake of 8.6 magnitude in Indian
Ocean, which occurred on 11th April, 2012 did not
generate significant tsunami. Thus tsunami
generation is not only dependent on the earthquake
magnitude but also on the type of fault, local
bathymetry and earthquake location (latitude,
longitude and depth of the hypocenter) [1]. Based
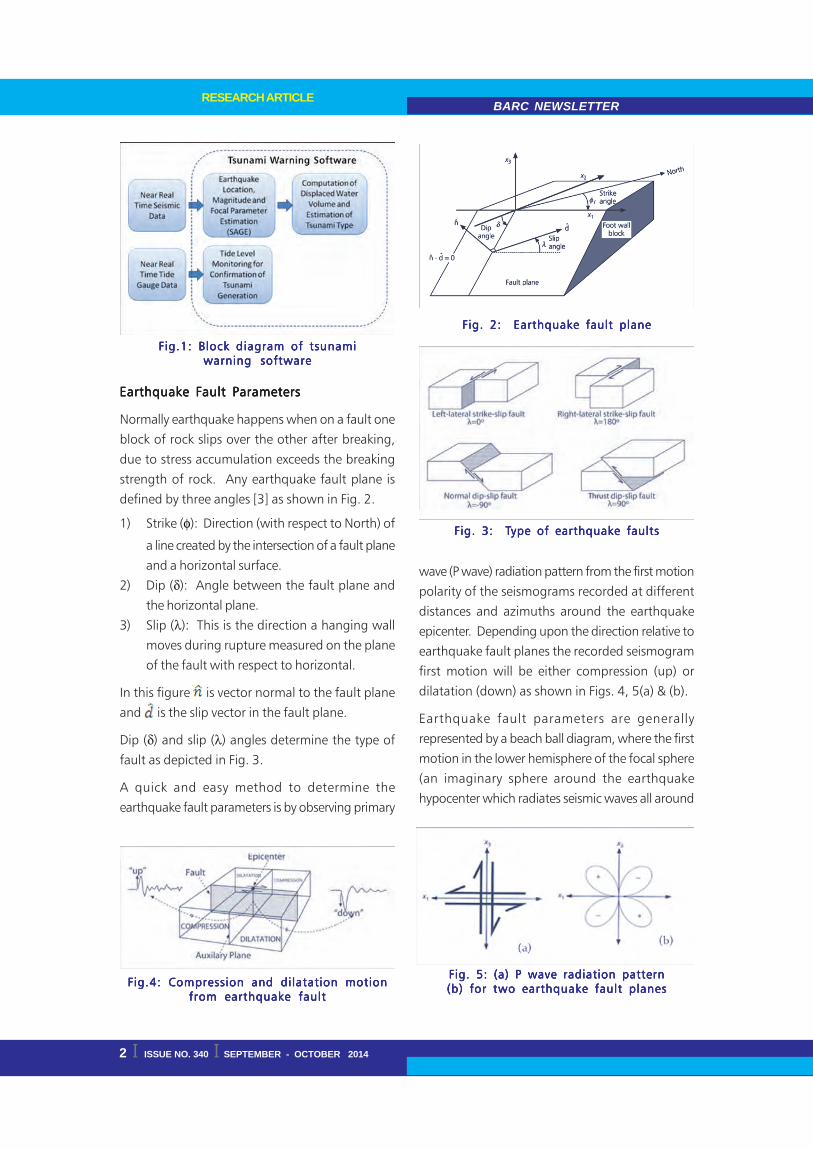
on this information, a tsunami warning software
(Fig. 1) has been developed, which consists of two
modules, one for the estimation of earthquake
hypocenter, magnitude and fault plane parameters
using global seismic waveform data [2] and the other
for the estimation of the displaced volume of water
from earthquake using fault plane parameters and
local bathymetry near the earthquake hypocenter.
It is well known that fault plane parameters are best
estimated using data from seismic stations which
are azimuthally distributed around the source.
Seismogram Analysis of Global Events (SAGE)
module has been developed to estimate the
earthquake location, magnitude and fault plane
parameters (strike, dip and slip angles) using near
real time seismic data (latency about one minute)
from the global seismic stations. Earthquake
hypocenter location, magnitude and fault parameters
are passed on to the tsunami assessment module
which determines whether the earthquake is
undersea (using global bathymetry data) and
computes the volume of water displaced by the
earthquake. Depending upon the quantity of the
water volume displaced, the tsunami type is
categorized as local tsunami, regional tsunami,
ocean-wide tsunami or no tsunami. The generation
of tsunami is further confirmed using tide gauge
monitoring tool which has been developed to
monitor the sea level from available tide gauge data
from global tide stations.
AbstractAbstractAbstractAbstractAbstract
Quick determination of hypocenter, magnitude and fault plane parameters of a large undersea earthquake
is useful in assessing its tsunami generating potential. An in-house software has been developed to find out
these parameters of the earthquake from the near real time seismic waveform data recorded at global
stations. Using these parameters vertical displacement of ocean floor is computed which effectively determines
the volume of water displaced by the earthquake. Decision logic has been implemented to generate
warning based on the computed water volume. Water level data from tide gauge stations near the earthquake
source is also monitored to confirm generation of tsunami. At present the software has been developed to
monitor earthquakes in the Andaman, Nicobar and Sumatra Regions in Indian Ocean/ Bay of Bengal.
BARC NEWSLETTERRESEARCH ARTICLE
2 I ISSUE NO. 340 I SEPTEMBER - OCTOBER 2014
Earthquake Fault ParametersEarthquake Fault ParametersEarthquake Fault ParametersEarthquake Fault ParametersEarthquake Fault Parameters
Normally earthquake happens when on a fault one
block of rock slips over the other after breaking,
due to stress accumulation exceeds the breaking
strength of rock. Any earthquake fault plane is
defined by three angles [3] as shown in Fig. 2.
1) Strike (φ): Direction (with respect to North) of
a line created by the intersection of a fault plane
and a horizontal surface.
2) Dip (δ): Angle between the fault plane and
the horizontal plane.
3) Slip (λ): This is the direction a hanging wall
moves during rupture measured on the plane
of the fault with respect to horizontal.
In this figure is vector normal to the fault plane
and is the slip vector in the fault plane.
Dip (δ) and slip (λ) angles determine the type of
fault as depicted in Fig. 3.
A quick and easy method to determine the
earthquake fault parameters is by observing primary
wave (P wave) radiation pattern from the first motion
polarity of the seismograms recorded at different
distances and azimuths around the earthquake
epicenter. Depending upon the direction relative to
earthquake fault planes the recorded seismogram
first motion will be either compression (up) or
dilatation (down) as shown in Figs. 4, 5(a) & (b).
Earthquake fault parameters are generally
represented by a beach ball diagram, where the first
motion in the lower hemisphere of the focal sphere
(an imaginary sphere around the earthquake
hypocenter which radiates seismic waves all around
Fig.1: Block diagram of tsunamiFig.1: Block diagram of tsunamiFig.1: Block diagram of tsunamiFig.1: Block diagram of tsunamiFig.1: Block diagram of tsunamiwarning softwarewarning softwarewarning softwarewarning softwarewarning software
Fig. 3: TFig. 3: TFig. 3: TFig. 3: TFig. 3: Type of earthquake faultsype of earthquake faultsype of earthquake faultsype of earthquake faultsype of earthquake faults
Fig.4: Compression and dilatation motionFig.4: Compression and dilatation motionFig.4: Compression and dilatation motionFig.4: Compression and dilatation motionFig.4: Compression and dilatation motionfrom earthquake faultfrom earthquake faultfrom earthquake faultfrom earthquake faultfrom earthquake fault
Fig. 2: Earthquake fault planeFig. 2: Earthquake fault planeFig. 2: Earthquake fault planeFig. 2: Earthquake fault planeFig. 2: Earthquake fault plane
Fig. 5: (a) P wave radiation patternFig. 5: (a) P wave radiation patternFig. 5: (a) P wave radiation patternFig. 5: (a) P wave radiation patternFig. 5: (a) P wave radiation pattern(b) for two earthquake fault planes(b) for two earthquake fault planes(b) for two earthquake fault planes(b) for two earthquake fault planes(b) for two earthquake fault planes

ISSUE NO. 340 I SEPTEMBER - OCTOBER 2014 I 3
BARC NEWSLETTERRESEARCH ARTICLE
as shown in Fig. 6) is projected on a surface and
compression motion is shaded black (dark) and
dilatational motion is shaded white (light). Beach
ball representations of some common fault types
are shown in Fig. 7.
Estimation of Earthquake Location,Estimation of Earthquake Location,Estimation of Earthquake Location,Estimation of Earthquake Location,Estimation of Earthquake Location,
Magnitude and Fault ParametersMagnitude and Fault ParametersMagnitude and Fault ParametersMagnitude and Fault ParametersMagnitude and Fault Parameters
When a large earthquake occurs, data from the
stations having a good azimuthal coverage of source
region are fetched from Incorporated Research
Institutes for Seismology (IRIS) data server [2] using
SAGE module. Earthquake location and magnitude
are estimated by picking up onset times of Primary
(P) and Secondary (S) phases recorded on the
seismograms. Body wave magnitude (Mb) is
computed from short period P wave amplitude and
surface wave magnitude (Ms) is computed from 20
second period Rayleigh (LR) wave which is recorded
after P and S waves. However it is well known that
both Mb and Ms saturate at around 6.5 and 8
respectively. Hence for large magnitude earthquakes
it is preferred to compute moment magnitude as
representative of actual energy released by the
earthquake. A computation module has also been
incorporated in SAGE to compute moment
magnitude (Mw) from very long period surface
waves using variable period (between 40 and 300
second) mantle magnitude technique introduced by
Okal and Talandeir [4], [5]. While picking up P wave
onset, the polarity of the first motion (either up or
down) is also marked on the seismograms. For focal
mechanism estimation, a grid search algorithm has
been implemented to find the best fitted strike, dip
and slip values by iteratively comparing the observed
P wave radiation pattern with the theoretically
computed P wave radiation pattern (Fig. 8). This
best fit set of strike, dip and slip values is taken as
primary focal plane solution and an additional
solution corresponding to auxiliary focal plane is
also computed.
TTTTTsunami Wsunami Wsunami Wsunami Wsunami Warning Based on Earthquakearning Based on Earthquakearning Based on Earthquakearning Based on Earthquakearning Based on Earthquake
Location, Magnitude and Fault PlaneLocation, Magnitude and Fault PlaneLocation, Magnitude and Fault PlaneLocation, Magnitude and Fault PlaneLocation, Magnitude and Fault Plane
ParametersParametersParametersParametersParameters
After the seismic moment magnitude (Mw) and fault
plane parameters are computed, the tsunami
category can be found approximately by computing
the volume (VT) of the displaced water at the tsunami
source that is approximately equal to the volume of
displaced ocean bottom. For a shallow faulting
(depth less than 70km) with dip δ and slip λ, volume
VT can be approximately expressed as [6]
(1)
Where M0 is the seismic moment and μ is the rigidity
of the earth crust at the source.
Fig. 6: Earthquake focal sphereFig. 6: Earthquake focal sphereFig. 6: Earthquake focal sphereFig. 6: Earthquake focal sphereFig. 6: Earthquake focal sphere
Fig. 7: Representation of earthquake focalFig. 7: Representation of earthquake focalFig. 7: Representation of earthquake focalFig. 7: Representation of earthquake focalFig. 7: Representation of earthquake focalmechanism in beach ball plotmechanism in beach ball plotmechanism in beach ball plotmechanism in beach ball plotmechanism in beach ball plot
VT = Mosin(δ) sin (λ)μ

BARC NEWSLETTERRESEARCH ARTICLE
4 I ISSUE NO. 340 I SEPTEMBER - OCTOBER 2014
Note that seismic moment (M0) is related to
moment magnitude by [7]
Mw=0.67 log(Mo) -10.7 (2)
where, M0 is in dyne-cm. Using (1) and (2) VT can
be expressed in m3 as:
(3)
Using (3) and considering =3x10¹⁰ N/m2 [6] ,
volume of the displaced water has been computed
for a large number of tsunamigenic as well as non-
tsunamigenic events that had occurred around the
world in the past and whose effects in the regions
around the epicenter are well documented [8].
Comparing these water volumes with the reported
effects following empirical tsunami category scale,
as given in Table 1 has been implemented in the
software.
* Local Tsunami: Destructive effects are confined to
coasts within about 100km of the source.
** Regional Tsunami: Destructive effects are
confined to coasts up to about 1000km of the source
*** Ocean-Wide Tsunami: Destructive effects are
spread beyond 1000km from the source.
In the tsunami estimation module, before computing
the volume of water displaced, it is essential to
ascertain whether the earthquake is under the sea.
For this water depth above the earthquake
hypocenter is estimated using global bathymetry
data ETOPO2 [9], which has been incorporated in
this module. Another way to confirm the earthquake
Fig. 8: SAGE module for earthquake focal mechanism, hypocenter location and magnitudeFig. 8: SAGE module for earthquake focal mechanism, hypocenter location and magnitudeFig. 8: SAGE module for earthquake focal mechanism, hypocenter location and magnitudeFig. 8: SAGE module for earthquake focal mechanism, hypocenter location and magnitudeFig. 8: SAGE module for earthquake focal mechanism, hypocenter location and magnitudeest imat ion.est imat ion.est imat ion.est imat ion.est imat ion.
VT = sin(δ) sin (λ) 10 (Mw+10.7)/0.67μ107
VT < 1.0 x 10⁸ No Tsunami
1.0 x 10⁸ ≤ VT < 1.0 x 10⁹ Local Tsunami*
1.2 x 10⁹ ≤ VT < 2.0 x 10¹⁰ Regional Tsunami **
VT ≥ 2.0 x 10¹⁰ Ocean-wideTsunami ***
TTTTTable 1: Table 1: Table 1: Table 1: Table 1: Tsunami category scalesunami category scalesunami category scalesunami category scalesunami category scale

ISSUE NO. 340 I SEPTEMBER - OCTOBER 2014 I 5
BARC NEWSLETTERRESEARCH ARTICLE
as under sea is by observing the presence of Tertiary
(T) phase in the seismogram. The T phase travels as
short period acoustic wave through the low velocity
SOFAR channel in the sea and is recorded at coastal
stations after P, S and LR waves. This module also
calculates the tentative arrival time of tsunami at
tidal stations located in this region (Fig. 9). An online
tide monitoring tool has been developed to acquire
and monitor tide gauge data of Sumatra region,
Andaman-Nicobar Islands and of Indian Coast
(Fig. 10). Brief explanation with figure.
Fig. 9: TFig. 9: TFig. 9: TFig. 9: TFig. 9: Tsunami estimation modulesunami estimation modulesunami estimation modulesunami estimation modulesunami estimation module
Fig. 10: Online tide gauge monitoring toolFig. 10: Online tide gauge monitoring toolFig. 10: Online tide gauge monitoring toolFig. 10: Online tide gauge monitoring toolFig. 10: Online tide gauge monitoring tool

BARC NEWSLETTERRESEARCH ARTICLE
6 I ISSUE NO. 340 I SEPTEMBER - OCTOBER 2014
This data is de-tided using prediction error filter to
remove the natural tide from the data and monitored
continuously for detection of tsunami waves.
Results and DiscussionResults and DiscussionResults and DiscussionResults and DiscussionResults and Discussion
The software has been tested with the following
earthquakes: a) Sumatra Earthquake on 26
December 2004 of Magnitude 9.1, b) Japan
Earthquake on 11th March 2011 of Magnitude 9.0
and c) Indian Ocean Earthquake on 11th April 2012
of Magnitude 8.6. Geographical distribution of first
motion of P wave at global seismic stations and
focal mechanism beach ball diagram obtained using
SAGE module are shown in Fig. 11 (blue mark
represents first motion up wards and green
downward first motion). Out of these two focal
plane parameters (blue and black lines in the beach
ball diagram), the primary focal plane is determined
by the known tectonic setting of that region and it
is passed on to the tsunami estimation module. In
case where tectonic setting is not known
beforehand, tsunami estimation is done for both
the focal plane solutions.
ConclusionConclusionConclusionConclusionConclusion
Using near real time global seismic data, a quick
and easy to use method of estimating earthquake
source parameters including location, magnitude
and its focal mechanism has been developed and
implemented into an in-house software for prompt
identification of tsunamigenic earthquakes from
Indian Ocean region. Although accuracy of the focal
plane parameters depends on the availability of
seismic stations with good azimuthal coverage, but
it is sufficient to distinguish between a thrust fault
event and a strike slip event. Estimation of the volume
of water displaced from the earthquake fault
parameters and magnitude has been used to take a
Fig. 11: Geographical distribution of first motion polarity (top row), focal mechanism beachFig. 11: Geographical distribution of first motion polarity (top row), focal mechanism beachFig. 11: Geographical distribution of first motion polarity (top row), focal mechanism beachFig. 11: Geographical distribution of first motion polarity (top row), focal mechanism beachFig. 11: Geographical distribution of first motion polarity (top row), focal mechanism beachball diagram (middle row) and fault plane parameters along with Vball diagram (middle row) and fault plane parameters along with Vball diagram (middle row) and fault plane parameters along with Vball diagram (middle row) and fault plane parameters along with Vball diagram (middle row) and fault plane parameters along with VTTTTT corresponding to both corresponding to both corresponding to both corresponding to both corresponding to boththe nodal planes (NP1 and NP2) (bottom row) of a) Sumatra Earthquake on 26the nodal planes (NP1 and NP2) (bottom row) of a) Sumatra Earthquake on 26the nodal planes (NP1 and NP2) (bottom row) of a) Sumatra Earthquake on 26the nodal planes (NP1 and NP2) (bottom row) of a) Sumatra Earthquake on 26the nodal planes (NP1 and NP2) (bottom row) of a) Sumatra Earthquake on 26ththththth December December December December December2004 of Magnitude 9.1 b) Japan Earthquake on 11th March 2011 of Magnitude 9.0 and c)2004 of Magnitude 9.1 b) Japan Earthquake on 11th March 2011 of Magnitude 9.0 and c)2004 of Magnitude 9.1 b) Japan Earthquake on 11th March 2011 of Magnitude 9.0 and c)2004 of Magnitude 9.1 b) Japan Earthquake on 11th March 2011 of Magnitude 9.0 and c)2004 of Magnitude 9.1 b) Japan Earthquake on 11th March 2011 of Magnitude 9.0 and c)Indian Ocean Earthquake on 11Indian Ocean Earthquake on 11Indian Ocean Earthquake on 11Indian Ocean Earthquake on 11Indian Ocean Earthquake on 11ththththth April 2012 of Magnitude 8.6. Both a) and b) are of thrust April 2012 of Magnitude 8.6. Both a) and b) are of thrust April 2012 of Magnitude 8.6. Both a) and b) are of thrust April 2012 of Magnitude 8.6. Both a) and b) are of thrust April 2012 of Magnitude 8.6. Both a) and b) are of thrusttype fault and had produced ocean-wide tsunami. On the other hand c) is of strike-slip typetype fault and had produced ocean-wide tsunami. On the other hand c) is of strike-slip typetype fault and had produced ocean-wide tsunami. On the other hand c) is of strike-slip typetype fault and had produced ocean-wide tsunami. On the other hand c) is of strike-slip typetype fault and had produced ocean-wide tsunami. On the other hand c) is of strike-slip typefault and had produced local/regional tsunami.fault and had produced local/regional tsunami.fault and had produced local/regional tsunami.fault and had produced local/regional tsunami.fault and had produced local/regional tsunami.
ISSUE NO. 340 I SEPTEMBER - OCTOBER 2014 I 7
BARC NEWSLETTERRESEARCH ARTICLE
decision about the type of tsunami it will generate.
This technique has been tested with some
tsunamigenic and non-tsunamigenic earthquakes
which have occurred in the past. Further, tsunami
generation is confirmed with near real time tide gauge
stations available over the internet. The performance
of the system is limited by the availability of near
real time seismic and tide gauge data over the
internet. The problem may be overcome by
waveform modeling techniques so that fault plane
parameters could be obtained using fewer stations’
data.
AcknowledgementAcknowledgementAcknowledgementAcknowledgementAcknowledgement
The seismic data obtained for this software is
downloaded from IRIS [2]. Figure 1 - 6 have been
taken from site [3]. Authors are grateful to Dr. F.
Roy, former Head, Seismology Division for his
guidance to bring this work to a logical conclusion.
Authors would also like to thank Shri C. K. Pithawa,
Director E&IG and AMG and Dr R. K. Singh,
Associate Director, RDDG for their kind support.
ReferencesReferencesReferencesReferencesReferences
1. Roy Falguni and Nair G. J., “A Real Time Seismic
Monitoring and Tsunami Alert System”,
International workshop on external flooding
hazards at NPP sites, Organized by AERB,
NPCIL and IAEA, 29 August - 02 September,
2005, Kalpakkam, India.
2. IRIS : http://www.iris.edu
3. S. Stein and M. Wysession, An Introduction to
Seismology, Earthquakes, and Earth Structure,
Blackwell Publishing, 2003 , http://
epsc.wustl.edu/seismology/book/
4. Okal E. A. and Talandier J., “Mm- A Variable-
Period Mantle Magnitude”, Journal of
Geophysical Research, 94(B4), 1989.
5. Talandier J. and Okal E. A., “An Algorithm for
Automated Tsunami Warning in French
Polynesia Based on Mantle Magnitudes”,
Bulletin of the Seismological Society of
America, 79(4), 1989.
6. Kanamori H, “Mechanism of Tsunami
Earthquakes”, Physics Earth Planet. Interiors,
6, 1972.
7. Hanks T.C. and Kanamori H. , “A Moment
Magnitude Scale”, Journal of Geophysical
Research, 84(B5), 1979.
8. International Tsunami Information Center: http:/
/itic.ioc-unesco.org.
9. ETOPO Global Relief Model: http://
www.ngdc.noaa.gov/mgg/global/global.html

BARC NEWSLETTERRESEARCH ARTICLE
8 I ISSUE NO. 340 I SEPTEMBER - OCTOBER 2014
Phase Transformation and Deformation Studies inZr Based Alloys
K.VK.VK.VK.VK.V. Mani Krishna, D. Srivastava. Mani Krishna, D. Srivastava. Mani Krishna, D. Srivastava. Mani Krishna, D. Srivastava. Mani Krishna, D. Srivastava and G.K. Dey G.K. Dey G.K. Dey G.K. Dey G.K. Dey
Materials Science Division
AbstractAbstractAbstractAbstractAbstract
A brief account of microstructural and textural changes taking place during the processing of the Zirconium
alloys and their role in the hydriding behavior is presented. . . . . The linkage between the microstructural
evolution and textural development is demonstrated in case of processing of nuclear reactor’s structural
components. A new methodology for the reconstruction of the high temperature phase microstructure,
using which the significant variant selection taking place during the transformation of β -Zr into α-Zr is
demonstrated. The role of microstructure on the hydride formation is discussed in terms of effect of grain/
phase boundaries.
IntroductionIntroductionIntroductionIntroductionIntroduction
The importance of Zr based structural components
in the thermal nuclear reactors can not be
overemphasized. Pressure tubes, clad tubes are but
few examples of several crucial Zr based ‘in-reactor’
components in PHWR type of reactors. The service
performance of these components largely depends
on their as-fabricated microstructure and texture. In
addition, hydride formation, irradiation creep and
growth are some of the important life limiting
phenomena which are directly influenced by the
component’s microstructural and textural
conditions. Hence it is important to understand (a)
the evolution of the microstructure and texture during
the fabrication (b) the role of the microstructure on
the phenomena like hydride formation etc [1]. Such
understanding helps tailoring the microstructures
to mitigate the ill effects of the hydride formation.
Understanding of the microstructural evolution as a
function of process parameters, on the other hand,
helps in optimizing the fabrication flow sheet to
obtain the desired microstructures for enhanced
component performance.
Present paper presents an overview of
microstructural and textural evolution studies in
various Zr based alloys and the microtextural aspects
of various phase transformations in them.
Application of this knowledge for the design and
implementation of new fabrication route for the
production of pressure tube shall be described.
Deformation heterogeneity in Zr :Deformation heterogeneity in Zr :Deformation heterogeneity in Zr :Deformation heterogeneity in Zr :Deformation heterogeneity in Zr :
Understanding through dislocationUnderstanding through dislocationUnderstanding through dislocationUnderstanding through dislocationUnderstanding through dislocation
dynamics:dynamics:dynamics:dynamics:dynamics:
In view of its importance in microstructural and
textural evolution, orientation sensitive deformation
heterogeneity in Zr has been studied in detail. Clear
evidences of temperature and orientation dependent
heterogeneous plastic deformation were observed
in zirconium when subjected to plane strain
compression. Heterogeneities were in terms of grain
fragmentation and apparent strain partitioning. Near
basal grains showed least fragmentation, in-grain
misorientation developments and changes in aspect
ratio during room temperature rolling. This was
diminished significantly during warm (500 and 700
K) rolling, see Fig 1(a). To address these experimental
observations, dislocation dynamics (DD) simulations
were carried out. These simulations, incorporating
temperature dependent threshold criterion for the
activation of slip systems, were successful in
capturing the experimental observations, Fig. 1(b).
DD simulations also brought out a novel mode of

ISSUE NO. 340 I SEPTEMBER - OCTOBER 2014 I 9
BARC NEWSLETTERRESEARCH ARTICLE
activation of dormant slip systems through
interaction of active dislocations. Dormant slip
systems, slip systems where the applied stress was
below critical resolved shear stress, were activated
due to interactions with active primary dislocations.
This mechanism was shown to activate dormant
dislocations in basal orientations, thus contributing
to reduction in deformation heterogeneities during
warm rolling. The proposed mechanism also has
the potential to alter orientation sensitive plastic
deformation in hexagonal metallic materials.
Reconstruction of high temperature Reconstruction of high temperature Reconstruction of high temperature Reconstruction of high temperature Reconstruction of high temperature βββββ phase phase phase phase phase
As shown in the previous section one of the
important steps of the component fabrication is the
β-quenching step which results in texture
randomization. However, the degree of texture
randomization and the resulting microstructure
subsequent to quenching are functions of nature of
the phase transformation and microstructure of high
temperature phase. Hence, knowledge of
microstructure of high temperature phase and nature
Fig.1: (a) Inverse pole figure (IPF) maps of Zircaloy 2 at different working temperatures. It isFig.1: (a) Inverse pole figure (IPF) maps of Zircaloy 2 at different working temperatures. It isFig.1: (a) Inverse pole figure (IPF) maps of Zircaloy 2 at different working temperatures. It isFig.1: (a) Inverse pole figure (IPF) maps of Zircaloy 2 at different working temperatures. It isFig.1: (a) Inverse pole figure (IPF) maps of Zircaloy 2 at different working temperatures. It isevident that some grains which are shown in ‘red’ having basal orientation are non-deformedevident that some grains which are shown in ‘red’ having basal orientation are non-deformedevident that some grains which are shown in ‘red’ having basal orientation are non-deformedevident that some grains which are shown in ‘red’ having basal orientation are non-deformedevident that some grains which are shown in ‘red’ having basal orientation are non-deformedat 30% of reduction at room temperature. The same grains, howeverat 30% of reduction at room temperature. The same grains, howeverat 30% of reduction at room temperature. The same grains, howeverat 30% of reduction at room temperature. The same grains, howeverat 30% of reduction at room temperature. The same grains, however, at higher temperature, at higher temperature, at higher temperature, at higher temperature, at higher temperaturecan be seen to elongate. (b) Snap shots of DD simulations showing the activation of thecan be seen to elongate. (b) Snap shots of DD simulations showing the activation of thecan be seen to elongate. (b) Snap shots of DD simulations showing the activation of thecan be seen to elongate. (b) Snap shots of DD simulations showing the activation of thecan be seen to elongate. (b) Snap shots of DD simulations showing the activation of thesecondary dislocation sources. For these simulations, the orientation of the crystal with respectsecondary dislocation sources. For these simulations, the orientation of the crystal with respectsecondary dislocation sources. For these simulations, the orientation of the crystal with respectsecondary dislocation sources. For these simulations, the orientation of the crystal with respectsecondary dislocation sources. For these simulations, the orientation of the crystal with respectto the applied stress is such that prismatic dislocations (green ones in the figure) did not haveto the applied stress is such that prismatic dislocations (green ones in the figure) did not haveto the applied stress is such that prismatic dislocations (green ones in the figure) did not haveto the applied stress is such that prismatic dislocations (green ones in the figure) did not haveto the applied stress is such that prismatic dislocations (green ones in the figure) did not haveany resolved forces along them. Howeverany resolved forces along them. Howeverany resolved forces along them. Howeverany resolved forces along them. Howeverany resolved forces along them. However, they did get activated once the other moving, they did get activated once the other moving, they did get activated once the other moving, they did get activated once the other moving, they did get activated once the other movingdislocations (pyramidal dislocations shown in blue) approach them closely due to interactiondislocations (pyramidal dislocations shown in blue) approach them closely due to interactiondislocations (pyramidal dislocations shown in blue) approach them closely due to interactiondislocations (pyramidal dislocations shown in blue) approach them closely due to interactiondislocations (pyramidal dislocations shown in blue) approach them closely due to interactionforces. The arrows indicate the resolved (along local burgers vectors) forces acting on theforces. The arrows indicate the resolved (along local burgers vectors) forces acting on theforces. The arrows indicate the resolved (along local burgers vectors) forces acting on theforces. The arrows indicate the resolved (along local burgers vectors) forces acting on theforces. The arrows indicate the resolved (along local burgers vectors) forces acting on theprismatic dislocations.prismatic dislocations.prismatic dislocations.prismatic dislocations.prismatic dislocations.
BARC NEWSLETTERRESEARCH ARTICLE
10 I ISSUE NO. 340 I SEPTEMBER - OCTOBER 2014
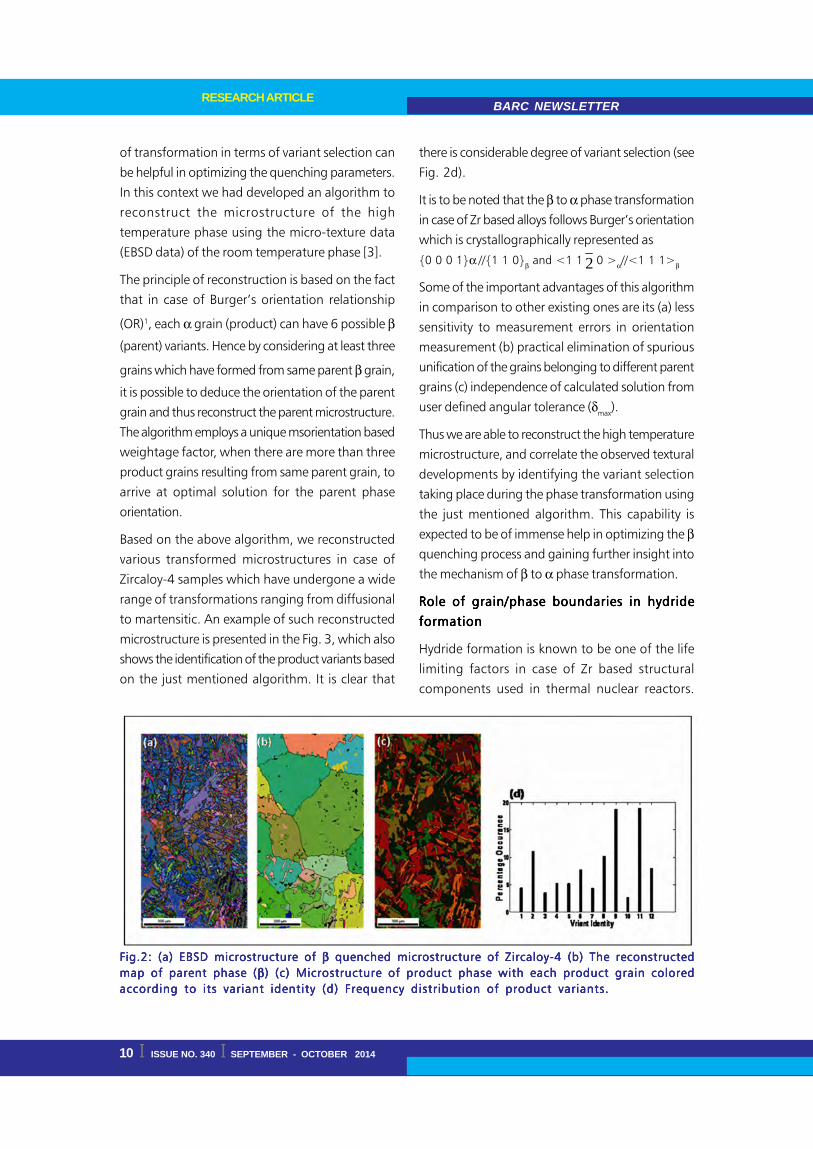
of transformation in terms of variant selection can
be helpful in optimizing the quenching parameters.
In this context we had developed an algorithm to
reconstruct the microstructure of the high
temperature phase using the micro-texture data
(EBSD data) of the room temperature phase [3].
The principle of reconstruction is based on the fact
that in case of Burger’s orientation relationship
(OR)1, each α grain (product) can have 6 possible β
(parent) variants. Hence by considering at least three
grains which have formed from same parent β grain,
it is possible to deduce the orientation of the parent
grain and thus reconstruct the parent microstructure.
The algorithm employs a unique msorientation based
weightage factor, when there are more than three
product grains resulting from same parent grain, to
arrive at optimal solution for the parent phase
orientation.
Based on the above algorithm, we reconstructed
various transformed microstructures in case of
Zircaloy-4 samples which have undergone a wide
range of transformations ranging from diffusional
to martensitic. An example of such reconstructed
microstructure is presented in the Fig. 3, which also
shows the identification of the product variants based
on the just mentioned algorithm. It is clear that
there is considerable degree of variant selection (see
Fig. 2d).
It is to be noted that the β to α phase transformation
in case of Zr based alloys follows Burger’s orientation
which is crystallographically represented as
{0 0 0 1}α //{1 1 0}β and <1 1 2 0 >α//<1 1 1>β
Some of the important advantages of this algorithm
in comparison to other existing ones are its (a) less
sensitivity to measurement errors in orientation
measurement (b) practical elimination of spurious
unification of the grains belonging to different parent
grains (c) independence of calculated solution from
user defined angular tolerance (δmax).
Thus we are able to reconstruct the high temperature
microstructure, and correlate the observed textural
developments by identifying the variant selection
taking place during the phase transformation using
the just mentioned algorithm. This capability is
expected to be of immense help in optimizing the βquenching process and gaining further insight into
the mechanism of β to α phase transformation.
Role of grain/phase boundaries in hydrideRole of grain/phase boundaries in hydrideRole of grain/phase boundaries in hydrideRole of grain/phase boundaries in hydrideRole of grain/phase boundaries in hydride
formationformationformationformationformation
Hydride formation is known to be one of the life
limiting factors in case of Zr based structural
components used in thermal nuclear reactors.
Fig.2: (a) EBSD microstructure of Fig.2: (a) EBSD microstructure of Fig.2: (a) EBSD microstructure of Fig.2: (a) EBSD microstructure of Fig.2: (a) EBSD microstructure of βββββ quenched microstructure of Zircaloy-4 (b) The reconstructed quenched microstructure of Zircaloy-4 (b) The reconstructed quenched microstructure of Zircaloy-4 (b) The reconstructed quenched microstructure of Zircaloy-4 (b) The reconstructed quenched microstructure of Zircaloy-4 (b) The reconstructedmap of parent phase (map of parent phase (map of parent phase (map of parent phase (map of parent phase (βββββ) (c) Microstructure of product phase with each product grain colored) (c) Microstructure of product phase with each product grain colored) (c) Microstructure of product phase with each product grain colored) (c) Microstructure of product phase with each product grain colored) (c) Microstructure of product phase with each product grain coloredaccording to its variant identity (d) Frequency distribution of product variants.according to its variant identity (d) Frequency distribution of product variants.according to its variant identity (d) Frequency distribution of product variants.according to its variant identity (d) Frequency distribution of product variants.according to its variant identity (d) Frequency distribution of product variants.
ISSUE NO. 340 I SEPTEMBER - OCTOBER 2014 I 11
BARC NEWSLETTERRESEARCH ARTICLE
Understanding the mechanism of hydride formation
can help tailor the suitable microstructures for better
hydride mitigation in these alloy components.
However, very little information was available on
the role of nature of the grain boundaries and
interfaces in controlling the hydride formation [4,
5]. In the present article we report, substantial
improvement in understanding of the role of grain/
phase boundaries with explicit use of local
orientation measurements through EBSD technique.
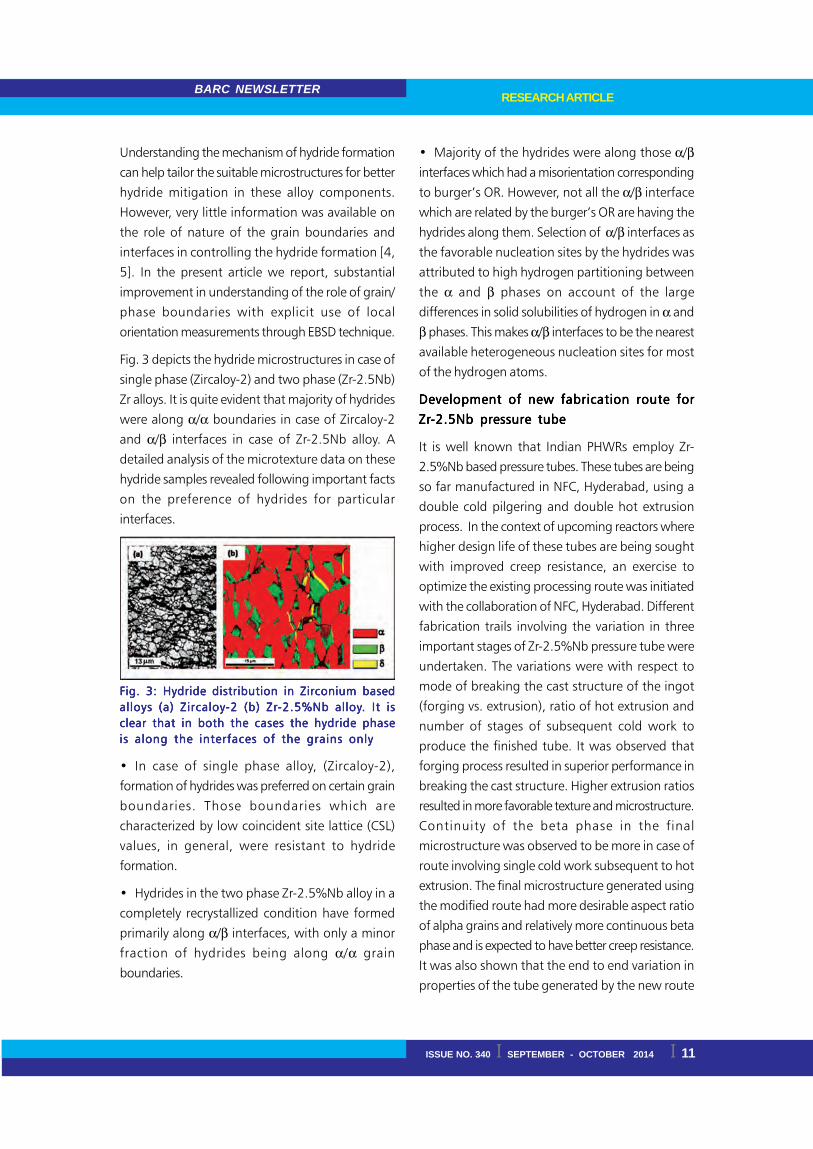
Fig. 3 depicts the hydride microstructures in case of
single phase (Zircaloy-2) and two phase (Zr-2.5Nb)
Zr alloys. It is quite evident that majority of hydrides
were along α/α boundaries in case of Zircaloy-2
and α/β interfaces in case of Zr-2.5Nb alloy. A
detailed analysis of the microtexture data on these
hydride samples revealed following important facts
on the preference of hydrides for particular
interfaces.
• In case of single phase alloy, (Zircaloy-2),
formation of hydrides was preferred on certain grain
boundaries. Those boundaries which are
characterized by low coincident site lattice (CSL)
values, in general, were resistant to hydride
formation.
• Hydrides in the two phase Zr-2.5%Nb alloy in a
completely recrystallized condition have formed
primarily along α/β interfaces, with only a minor
fraction of hydrides being along α/α grain
boundaries.
• Majority of the hydrides were along those α/βinterfaces which had a misorientation corresponding
to burger’s OR. However, not all the α/β interface
which are related by the burger’s OR are having the
hydrides along them. Selection of α/β interfaces as
the favorable nucleation sites by the hydrides was
attributed to high hydrogen partitioning between
the α and β phases on account of the large
differences in solid solubilities of hydrogen in α and
β phases. This makes α/β interfaces to be the nearest
available heterogeneous nucleation sites for most
of the hydrogen atoms.
Development of new fabrication route forDevelopment of new fabrication route forDevelopment of new fabrication route forDevelopment of new fabrication route forDevelopment of new fabrication route for
ZrZrZrZrZr-2.5Nb pressure tube-2.5Nb pressure tube-2.5Nb pressure tube-2.5Nb pressure tube-2.5Nb pressure tube
It is well known that Indian PHWRs employ Zr-
2.5%Nb based pressure tubes. These tubes are being
so far manufactured in NFC, Hyderabad, using a
double cold pilgering and double hot extrusion
process. In the context of upcoming reactors where
higher design life of these tubes are being sought
with improved creep resistance, an exercise to
optimize the existing processing route was initiated
with the collaboration of NFC, Hyderabad. Different
fabrication trails involving the variation in three
important stages of Zr-2.5%Nb pressure tube were
undertaken. The variations were with respect to
mode of breaking the cast structure of the ingot
(forging vs. extrusion), ratio of hot extrusion and
number of stages of subsequent cold work to
produce the finished tube. It was observed that
forging process resulted in superior performance in
breaking the cast structure. Higher extrusion ratios
resulted in more favorable texture and microstructure.
Continuity of the beta phase in the final
microstructure was observed to be more in case of
route involving single cold work subsequent to hot
extrusion. The final microstructure generated using
the modified route had more desirable aspect ratio
of alpha grains and relatively more continuous beta
phase and is expected to have better creep resistance.
It was also shown that the end to end variation in
properties of the tube generated by the new route
Fig. 3: Hydride distribution in Zirconium basedFig. 3: Hydride distribution in Zirconium basedFig. 3: Hydride distribution in Zirconium basedFig. 3: Hydride distribution in Zirconium basedFig. 3: Hydride distribution in Zirconium basedalloys (a) Zircaloyalloys (a) Zircaloyalloys (a) Zircaloyalloys (a) Zircaloyalloys (a) Zircaloy-2 (b) Zr-2 (b) Zr-2 (b) Zr-2 (b) Zr-2 (b) Zr-2.5%Nb alloy-2.5%Nb alloy-2.5%Nb alloy-2.5%Nb alloy-2.5%Nb alloy. It is. It is. It is. It is. It isclear that in both the cases the hydride phaseclear that in both the cases the hydride phaseclear that in both the cases the hydride phaseclear that in both the cases the hydride phaseclear that in both the cases the hydride phaseis along the interfaces of the grains onlyis along the interfaces of the grains onlyis along the interfaces of the grains onlyis along the interfaces of the grains onlyis along the interfaces of the grains only
BARC NEWSLETTERRESEARCH ARTICLE
12 I ISSUE NO. 340 I SEPTEMBER - OCTOBER 2014
is superior to that of the conventional route. The
modified route has actually been accepted and
inducted for the production of the pressure tubes
for the upcoming reactor.
AcknowledgementsAcknowledgementsAcknowledgementsAcknowledgementsAcknowledgements
Significant part of the above research was in active
collaboration with Prof. I Samajdar, IIT Bombay and
Shri. N. Saibaba, NFC, Hyderabad. We gratefully
acknowledge their contributions to this research.
ReferencesReferencesReferencesReferencesReferences
1. D O Northwood, U. Kosasih, Int Met Rev
(1983) 28- 92
2. V Randle V, O Engler, Introduction to Texture
Analysis Microtexture and Orietation Mapping,
ISBN 90-5699-224-4, Taylor and Francis Limited,
11 New Fetter Lane, London, UK, 2003.
3. K V Mani Krishna, P Tripathi, V D Hiwarkar, P
Pant, I Samajdar, D Srivastava, G K Dey, Scipta
Materilia, 62, (2010) 391-394.
4. K V Mani Krishna, D Srivastava, G K Dey, V
Hiwarkar, I Samajdar, S Banerjee, J Nucl Mater.
414 (2011) 270-275.
5. K V Mani Krishna, A Sain, I Samajdar, G K Dey,
D Srivastava, S Neogy, R Tewari and S Banerjee,
Acta Materilia 54(2006) 4665-4675.

ISSUE NO. 340 I SEPTEMBER - OCTOBER 2014 I 13
BARC NEWSLETTERRESEARCH ARTICLE
Assessment of Higher Order Shear and NormalAssessment of Higher Order Shear and NormalAssessment of Higher Order Shear and NormalAssessment of Higher Order Shear and NormalAssessment of Higher Order Shear and NormalDeformations Theories for Stress AnalysisDeformations Theories for Stress AnalysisDeformations Theories for Stress AnalysisDeformations Theories for Stress AnalysisDeformations Theories for Stress Analysis
and Fand Fand Fand Fand Free Vibration of Free Vibration of Free Vibration of Free Vibration of Free Vibration of FunctionallyunctionallyunctionallyunctionallyunctionallyGraded PlatesGraded PlatesGraded PlatesGraded PlatesGraded Plates
D.K. JhaD.K. JhaD.K. JhaD.K. JhaD.K. Jha andandandandand K. SrinivasK. SrinivasK. SrinivasK. SrinivasK. SrinivasCivil Engineering Division
andTTTTTarun Kantarun Kantarun Kantarun Kantarun Kant
Department of Civil Engineering,Indian Institute of Technology Bombay, Mumbai
andR.K. SinghR.K. SinghR.K. SinghR.K. SinghR.K. Singh
Reactor Safety Division
AbstractAbstractAbstractAbstractAbstract
Stress analysis and free vibration of functionally graded (FG) elastic, rectangular, and simply (diaphragm)
supported plates are presented based on higher order shear/shear-normal deformations theories (HOSTs/
HOSNTs). The theoretical models are based on Taylor’s series expansion of the in-plane and transverse
displacements in the thickness coordinate defining the plate deformations. The material properties of FG
plates are assumed in this case to be varying through the thickness of the plate in a continuous manner
according to the volume fraction of constituents which is mathematically modelled as exponential and
power law functions. The governing equations for the FG plates are derived on the basis of HOSTs/HOSNTs
assuming varying material properties. Analytical solutions are obtained by employing the Navier solution
technique. Accuracy of the analytical solutions obtained employing Navier solution technique using present
models has been compared with exact three dimensional (3D) elasticity solutions.
KKKKKeywordseywordseywordseywordseywords: Functionally graded materials; higher order, analytical solutions; stress analysis, natural frequency;
material grading index.
IntroductionIntroductionIntroductionIntroductionIntroduction
Functionally graded materials (FGMs) are recent
development in the family of engineering composites
made of two or more constituent phases with
continuous and smoothly varying composition
[Koizumi1]. This has been possible through research
and development in the area of mechanics of FGMs
for the present day modern technologies of special
nuclear components, spacecraft structural members,
ceramics and composites etc. To improve the
properties of thermal-barrier systems, FGMs
consisting of metallic and ceramic components are
preferred because cracking or de-lamination, which
are often observed in conventional multi-layer
systems are avoided due to the smooth transition
between the properties of the components. With
the increase in application of FGMs in various fields
of science and technology, new methodologies need
to be developed to characterize FGMs and also
designing structural components, viz., beams, plates
and shells made of it. In view of its engineering
application to create the divertor plate (also called,
the first wall) of the International Thermonuclear
Experimental Reactor (ITER) made of a graded layer
bonded between a homogeneous substrate and a
homogeneous coating, a two-dimensional (2D)
model for the analysis of functionally graded (FG)

BARC NEWSLETTERRESEARCH ARTICLE
14 I ISSUE NO. 340 I SEPTEMBER - OCTOBER 2014
plate with reasonably high accuracy and
computational efforts is rationalized.
Literature ReviewLiterature ReviewLiterature ReviewLiterature ReviewLiterature Review
Three-dimensional (3D) analytical solutions are very
useful since they provide benchmark results to assess
the accuracy of various 2D plate theories and finite
element formulations, but their solution methods
involve mathematical complexities and are very
difficult and tedious to solve. The benchmark exact
3D elasticity solutions of simply supported laminated
plates available in the literature [Refs. 2–5] have
proved to be very useful in assessing two-
dimensional (2D) plate theories by various
researchers [Refs. 6–9]. There are many studies
available in the literature as well on the analysis of
isotropic, orthotropic and laminated composite
plates, but these investigations are valid for
laminated plates and shells, where the material
properties are piecewise constant, but not applicable
for finding solutions of plate problems with
continuous in-homogeneity of material properties
such as FGMs. Due to the special properties exhibited
by the FGMs, such as high degree of anisotropy,
higher load carrying capacity due to membrane-
bending coupling for preferential structural
performance, the method of analysis based on
Classical Plate Theory (CPT) which neglects the effect
of out-of-plane (transverse) stresses/strains become
inadequate. First Order Shear Deformation Theory
(FOST) assumes constant states of transverse shear
stresses and requires the use of shear correction
coefficients suggested by Mindlin (1951) for
homogeneous isotropic plates in order to match
the response predicted by this two-dimensional (2D)
theory with that of three-dimensional (3D) elasticity
theory and to simplify the shear stresses/strains
through the plate thickness in an approximate
manner, which at times may become unrealistic.
Next in the line of the plate theories are the higher-
order shear deformation plate theories which consider
the warping of the cross-sections and satisfy the
zero transverse shear stress condition of the upper
and lower fibers of the cross-section. In the literature,
various higher-order shear deformation theories, viz.
Second order shear deformation theory (SSDT), Third
order shear deformation theory (TSDT) which satisfies
the above-mentioned conditions are proposed by
several researchers.
Suresh and Mortensen10 provided an excellent
introduction to the fundamentals of FGMs. Since
then, many publications are reported in the literature
on the use of various two-dimensional (2D) theories
for the thermo-elastic and vibration analyses of FG
plates during the last few years. Both analytical and
finite element methods are used for the analysis.
Praveen and Reddy11 reported the response of FG
ceramic metal plates using a plate finite element
formulation. Main and Spencer12 constituted a class
of exact 3D solutions for FG plates with traction-
free surfaces. Vel and Batra13 presented the 3D exact
solutions for the free and forced vibrations of simply
supported FG rectangular plates by assuming the
suitable displacement functions that identically satisfy
boundary conditions. These displacement functions
are used to reduce equations governing steady state
vibrations of a plate to a set of coupled ordinary
differential equations, which are then solved by
employing the power series method. The exact
solution is valid for thick and thin plates, and for
arbitrary variation of material properties in the
thickness direction. Carrera et al.14 studied the effects
of stretching of thickness in FG plates and shells
deriving the advanced theories for bending analysis
adopting Reissner’s mixed variational approach.
Recently, Wen et al.15 have presented the 3D analysis
of isotropic and orthotropic FG plates with simply
supported edges under static and dynamic loads.
The governing equations of the 3D elastic problem
for the FG plates were formulated based on the
state-space approach in the Laplace transform
domain, transforming it to a one dimensional
problem, and solved using the radial basis functions
(RBF) method. For a complete reference on the recent
research studies on the static, vibration and stability
analyses of FG plates, the reader may refer the critical
review on the subject matter by Jha et al.16. In most
ISSUE NO. 340 I SEPTEMBER - OCTOBER 2014 I 15
BARC NEWSLETTERRESEARCH ARTICLE
of the 2D theories developed to predict the global
responses of FG plates till date, only transverse shear
deformations have been considered, and very few
theories consider the effect of both transverse shear
and transverse normal deformations. Very limited
studies are reported in the literature on the evaluation
of the various 2D higher order theories and about
their range of application and the accuracy in
predicting the global responses.
Theoretical FormulationTheoretical FormulationTheoretical FormulationTheoretical FormulationTheoretical Formulation
Owing to the above limitations, analytical
formulations are developed using a set of
displacement based higher order shear/shear-normal
deformation theories (HOSTs/HOSNTs) for the stress
analysis and free vibration of FG elastic, rectangular,
and simply (diaphragm) supported plates. The
theoretical models are based on Taylor’s series
expansion of the in-plane and transverse
displacements in thickness coordinate defining the
plate deformations. Some of these models
reformulated by Jha et al.17-18 for FG plates listed in
Table 1 account for the effects of transverse shear
and normal deformations and nonlinear variation
of in-plane displacements. The material properties
of FG plates are considered in this case to be varying
through thickness of plate in a continuous manner.
Poisson’s ratio is assumed to be constant, but their
Young’s modulii and material density vary
continuously in thickness direction according to the
volume fraction of constituents which is
mathematically modelled as exponential and power
law functions, represented as:
⎟⎟⎠
⎞⎜⎜⎝
⎛=⎟⎟
⎠
⎞⎜⎜⎝
⎛⎟⎠⎞
⎜⎝⎛ −−=
b
tt P
Pln21λwhere,,
h2z1λexpPP(z)
( ) ( ) bbt Pk
21
hzPPzP +⎟
⎠⎞
⎜⎝⎛ +−= (1)
Here P(z) denotes a typical material property, viz.,
Young’s modulus of elasticity (E), material density
(ñ), etc. of the structures made of FGM. h represents
the total thickness of structure. Pt and Pb are the
material properties at the top-most ( and
bottom-most ( surfaces. λ in the
exponential model and k in the power model are
the material grading indexes respectively.
The governing equations for the FG plates are derived
on the basis of HOSTs/HOSNTs assuming varying
material properties across thickness of plate. The
equations of equilibrium are derived using Principle
of Minimum Potential Energy (PMPE) and the
equations of motion by Hamilton’s principle.
Numerical solutions are obtained in closed-form
using Navier’s solution technique. The membrane-
flexure coupling phenomenon exhibited by a FG
plate necessitates the use of a displacement field
containing both, membrane as well as flexural
deformation terms which contribute to the overall
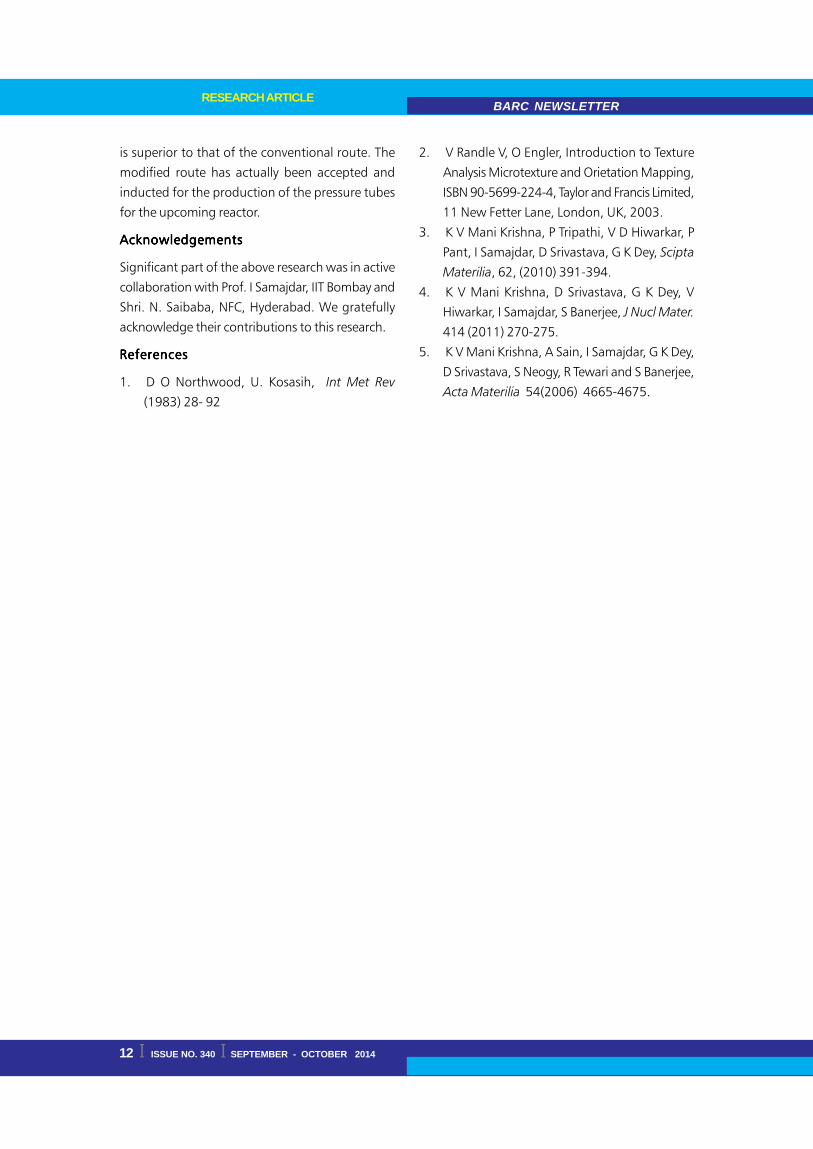
response of the plate. The displacements u, v and
w of a general point (x, y, z) in the plate domain
shown in Fig. 1 in x, y and z directions, respectively
are given by:
y)(x,θzy)(x,uzy)(x,zθy)(x,uz)y,u(x, *x
3*o
2xo +++=
y)(x,θzy)(x,vzy)(x,zθy)(x,vz)y,v(x, *y
3*o
2yo +++=
y)(x,θzξy)(x,wzξy)(x,zθξy)(x,wz)y,w(x, *z
33
*o
22z1o +++= (2)
Here, the parameters oo v,u are the in-plane
tangential displacements and ow is the transverse
displacement of a point (x, y) on the plate’s middle
surface. yx θ,θ are rotations of the normals to the
plate’s middle surface (z=0) about y and x axes
respectively.
z*z
*y
*x
*o
*o
*o θandθ,θ,θ,w,v,u
are the higher order
terms in the Taylor’s series expansion and represent
Fig. 1: Geometry of FG plate with positiveFig. 1: Geometry of FG plate with positiveFig. 1: Geometry of FG plate with positiveFig. 1: Geometry of FG plate with positiveFig. 1: Geometry of FG plate with positiveset of reference axes and its displacementset of reference axes and its displacementset of reference axes and its displacementset of reference axes and its displacementset of reference axes and its displacement
components (For “HOSNT12” model)components (For “HOSNT12” model)components (For “HOSNT12” model)components (For “HOSNT12” model)components (For “HOSNT12” model)

BARC NEWSLETTERRESEARCH ARTICLE
16 I ISSUE NO. 340 I SEPTEMBER - OCTOBER 2014
the higher order transverse cross sectional
deformation modes.
In addition to the above mentioned higher order
models, the FOST19 and CPT20 models are also
considered for the analyses of FG plates for the sake
of comparison.
Numerical StudiesNumerical StudiesNumerical StudiesNumerical StudiesNumerical Studies
A simply (diaphragm) supported rectangular/square
plate is considered throughout as a test problem.
Sinusoidal and uniform transverse loadings are
considered for the stress analysis of FG Plates with
various geometrical configurations and material
grading indexes. A set of computer programs based
on the present models is developed in MATLAB7.0
to solve the boundary value problem for the stress
analysis and eigenvalue problem for the free
vibration. The numerical results for the stress analysis
of FG plates are presented for in-plane and transverse
displacements, in-plane normal and shear stresses
and transverse shear stresses. Further, the natural
frequencies of FG plates using various higher order
models are also presented. The accuracy of solutions
obtained from different models is established by
comparing the results with the 3D exact elasticity
solutions and the solutions obtained by various other
models in literature.
Model
1
2
3
4
5
6
Theory
HOSNT
HOSNT
HOSNT
HOSNT
HOSNT
HOST
DOFs
12
11
11
10
10
9
Designation
HOSNT12
HOSNT11
HOSNT11M
HOSNT10B
HOSNT10M
HOST9
Displacementfield
As definedinEqn. (2) with
1ξξξ 321 ===
As definedinEqn. (2) with
0ξ1;ξξ 321 ===
As definedinEqn. (2) with
0ξ1;ξξ 231 ===
As definedinEqn. (2) with
1ξ0;ξξ 231 ===
As definedinEqn. (2) with
0ξξ;1ξ 321 ===
As definedinEqn. (2) with
0ξξξ 321 ===
Transverseshear
deformations( γγγγγxz and γγγγγyz)
Cubic
Parabolic
Cubic
Parabolic
Parabolic
Parabolic
Transversenormal
deformation(εεεεεz)
Parabolic
Linear
Parabolic
Linear
Constant
Not considered
TTTTTable 1: List of displacement models based on higher order refined theoriesable 1: List of displacement models based on higher order refined theoriesable 1: List of displacement models based on higher order refined theoriesable 1: List of displacement models based on higher order refined theoriesable 1: List of displacement models based on higher order refined theories
ISSUE NO. 340 I SEPTEMBER - OCTOBER 2014 I 17
BARC NEWSLETTERRESEARCH ARTICLE
Stress analysis of FG PlatesStress analysis of FG PlatesStress analysis of FG PlatesStress analysis of FG PlatesStress analysis of FG Plates
A sinusoidally loaded, simply (diaphragm)
supported, FG square plate of side, a=1m and
thicknesses-to-width ratio, h/a=0.1 is considered
as in Ref.15. The elastic modulii are Et=70 GPa,
Eb=151GPa, and the Poisson’s ratio is ν =0.3. Here
Et and Eb indicate Young’s modulii on the top (i.e.,
z=+h/2) and bottom (i.e., z=-h/2) surfaces of the
FG plate, respectively. The normalized static load is
assumed as q(x, y)=-q0 sin (πx/a)sin (πy/a), where,
q0=10-3Co33, in which, Co
33=Eb(1-ν)/[(1+ν)(1-2ν)].
The variation of material properties in plate’s
thickness direction is considered to follow an
exponential law, i.e., Czij =Co
ij eλ(z+h/2), where Co
ij
indicates material coefficients on the bottom
surfaces, and the material gradation coefficient,
λ(=ln (Et/Eb). The analytical solutions for deflections
and stresses of the FG plate are available at point
(a/4,a/4,-h/4) by Wen et al.15 using RBF
interpolation. Exact elasticity solutions of the same
problem are also available in Zhang and Zhong21.
The non-dimensional displacements and stresses
parameters are evaluated at the same point (a/4,
a/4,-h/4) using various models considered in the
present study for validation.
The solutions obtained using models HOSNT12 and
HOSNT11 are in close agreement with 3D elasticity
solutions of the same problem by Zhang and
Zhong21. It is found here that HOSNT12 computes
the most accurate results with 0.006% errors in the
in-plane displacements and 0.003% error in
transverse deflection which are best among all other
analytical solutions including the RBF analytical
solutions15 with highest number of collocation
points. HOST9 computes the displacements with a
maximum error of 1.045% for a moderately thick
FG plate (h/a=0.1). HOSNT11M and HOSNT10M
models fall short here to predict the static behaviour
of FG plates with a significant error of about 18%
in displacements. The HOSNT12 model is the most
accurate with the errors of -0.502% and -0.004%
in and . The error in transverse shear stresses
is of identical order for all higher order formulations.
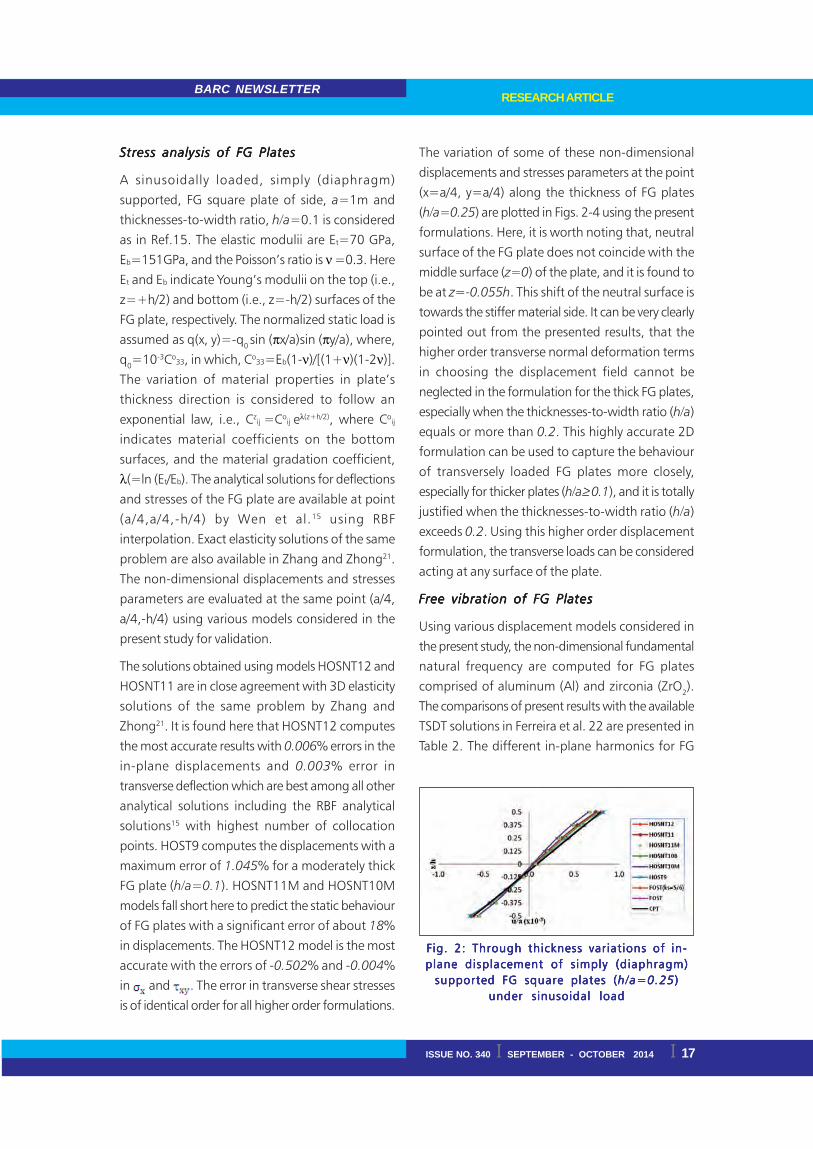
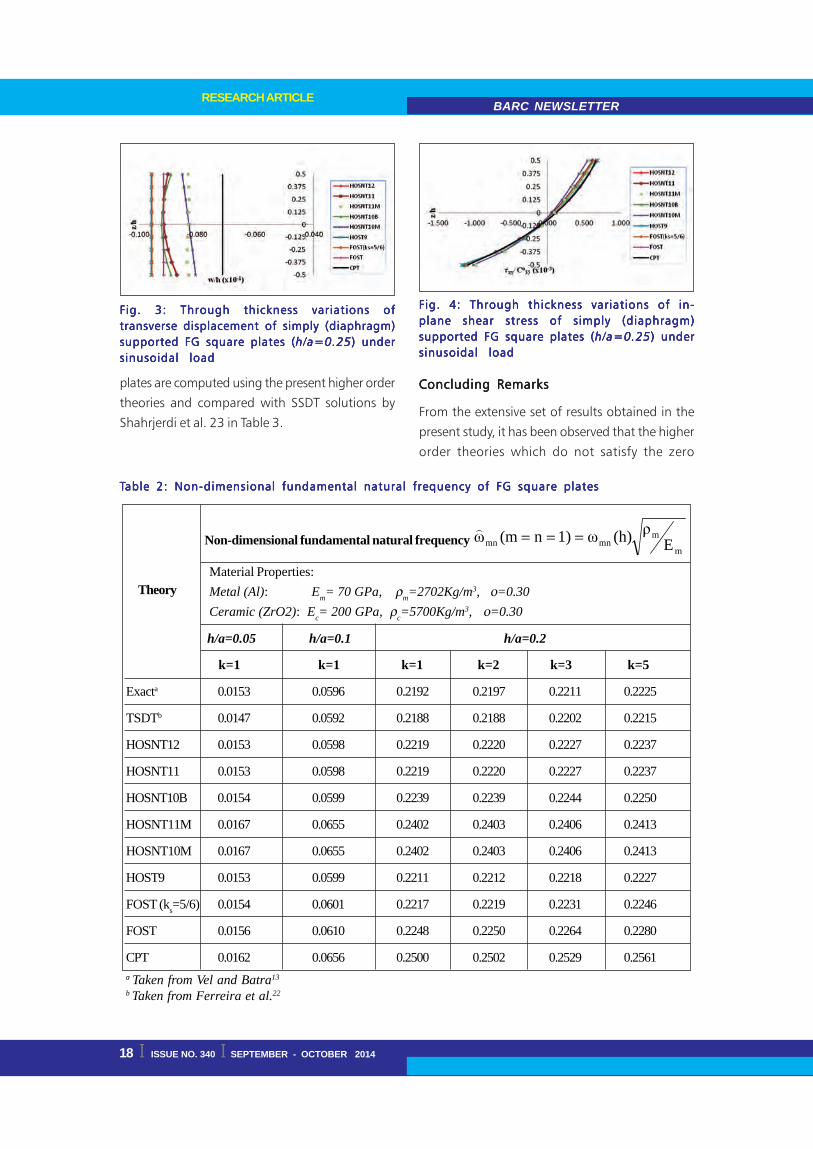
The variation of some of these non-dimensional
displacements and stresses parameters at the point
(x=a/4, y=a/4) along the thickness of FG plates
(h/a=0.25) are plotted in Figs. 2-4 using the present
formulations. Here, it is worth noting that, neutral
surface of the FG plate does not coincide with the
middle surface (z=0) of the plate, and it is found to
be at z=-0.055h. This shift of the neutral surface is
towards the stiffer material side. It can be very clearly
pointed out from the presented results, that the
higher order transverse normal deformation terms
in choosing the displacement field cannot be
neglected in the formulation for the thick FG plates,
especially when the thicknesses-to-width ratio (h/a)
equals or more than 0.2. This highly accurate 2D
formulation can be used to capture the behaviour
of transversely loaded FG plates more closely,
especially for thicker plates (h/a≥ 0.1), and it is totally
justified when the thicknesses-to-width ratio (h/a)
exceeds 0.2. Using this higher order displacement
formulation, the transverse loads can be considered
acting at any surface of the plate.
Free vibration of FG PlatesFree vibration of FG PlatesFree vibration of FG PlatesFree vibration of FG PlatesFree vibration of FG Plates
Using various displacement models considered in
the present study, the non-dimensional fundamental
natural frequency are computed for FG plates
comprised of aluminum (Al) and zirconia (ZrO2).
The comparisons of present results with the available
TSDT solutions in Ferreira et al. 22 are presented in
Table 2. The different in-plane harmonics for FG
Fig. 2: Through thickness variations of in-Fig. 2: Through thickness variations of in-Fig. 2: Through thickness variations of in-Fig. 2: Through thickness variations of in-Fig. 2: Through thickness variations of in-plane displacement of simply (diaphragm)plane displacement of simply (diaphragm)plane displacement of simply (diaphragm)plane displacement of simply (diaphragm)plane displacement of simply (diaphragm)
supported FG square plates (supported FG square plates (supported FG square plates (supported FG square plates (supported FG square plates (h/a=0.25h/a=0.25h/a=0.25h/a=0.25h/a=0.25 )))))under sinusoidal loadunder sinusoidal loadunder sinusoidal loadunder sinusoidal loadunder sinusoidal load
BARC NEWSLETTERRESEARCH ARTICLE
18 I ISSUE NO. 340 I SEPTEMBER - OCTOBER 2014
plates are computed using the present higher order
theories and compared with SSDT solutions by
Shahrjerdi et al. 23 in Table 3.
Concluding RemarksConcluding RemarksConcluding RemarksConcluding RemarksConcluding Remarks
From the extensive set of results obtained in the
present study, it has been observed that the higher
order theories which do not satisfy the zero
Fig. 3: Through thickness variations ofFig. 3: Through thickness variations ofFig. 3: Through thickness variations ofFig. 3: Through thickness variations ofFig. 3: Through thickness variations oftransverse displacement of simply (diaphragm)transverse displacement of simply (diaphragm)transverse displacement of simply (diaphragm)transverse displacement of simply (diaphragm)transverse displacement of simply (diaphragm)supported FG square plates (supported FG square plates (supported FG square plates (supported FG square plates (supported FG square plates (h/a=0.25h/a=0.25h/a=0.25h/a=0.25h/a=0.25) under) under) under) under) undersinusoidal loadsinusoidal loadsinusoidal loadsinusoidal loadsinusoidal load
Fig. 4: Through thickness variations of in-Fig. 4: Through thickness variations of in-Fig. 4: Through thickness variations of in-Fig. 4: Through thickness variations of in-Fig. 4: Through thickness variations of in-plane shear stress of simply (diaphragm)plane shear stress of simply (diaphragm)plane shear stress of simply (diaphragm)plane shear stress of simply (diaphragm)plane shear stress of simply (diaphragm)supported FG square plates (supported FG square plates (supported FG square plates (supported FG square plates (supported FG square plates (h/a=0.25h/a=0.25h/a=0.25h/a=0.25h/a=0.25) under) under) under) under) undersinusoidal loadsinusoidal loadsinusoidal loadsinusoidal loadsinusoidal load
Non-dimensional fundamental natural frequency m
mmnmn E
ρ(h)ω1)n(mω ===)
Material Properties:Metal (Al): Em= 70 GPa, ρm=2702Kg/m3, ο=0.30Ceramic (ZrO2): Ec= 200 GPa, ρc=5700Kg/m3, ο=0.30
h/a=0.05 h/a=0.1 h/a=0.2
k=1 k=1 k=1 k=2 k=3 k=5
Exacta 0.0153 0.0596 0.2192 0.2197 0.2211 0.2225
TSDTb 0.0147 0.0592 0.2188 0.2188 0.2202 0.2215
HOSNT12 0.0153 0.0598 0.2219 0.2220 0.2227 0.2237
HOSNT11 0.0153 0.0598 0.2219 0.2220 0.2227 0.2237
HOSNT10B 0.0154 0.0599 0.2239 0.2239 0.2244 0.2250
HOSNT11M 0.0167 0.0655 0.2402 0.2403 0.2406 0.2413
HOSNT10M 0.0167 0.0655 0.2402 0.2403 0.2406 0.2413
HOST9 0.0153 0.0599 0.2211 0.2212 0.2218 0.2227
FOST (ks=5/6) 0.0154 0.0601 0.2217 0.2219 0.2231 0.2246
FOST 0.0156 0.0610 0.2248 0.2250 0.2264 0.2280
CPT 0.0162 0.0656 0.2500 0.2502 0.2529 0.2561
Theory
TTTTTable 2: Non-dimensional fundamental natural frequency of FG square platesable 2: Non-dimensional fundamental natural frequency of FG square platesable 2: Non-dimensional fundamental natural frequency of FG square platesable 2: Non-dimensional fundamental natural frequency of FG square platesable 2: Non-dimensional fundamental natural frequency of FG square plates
a Taken from Vel and Batra13
b Taken from Ferreira et al.22
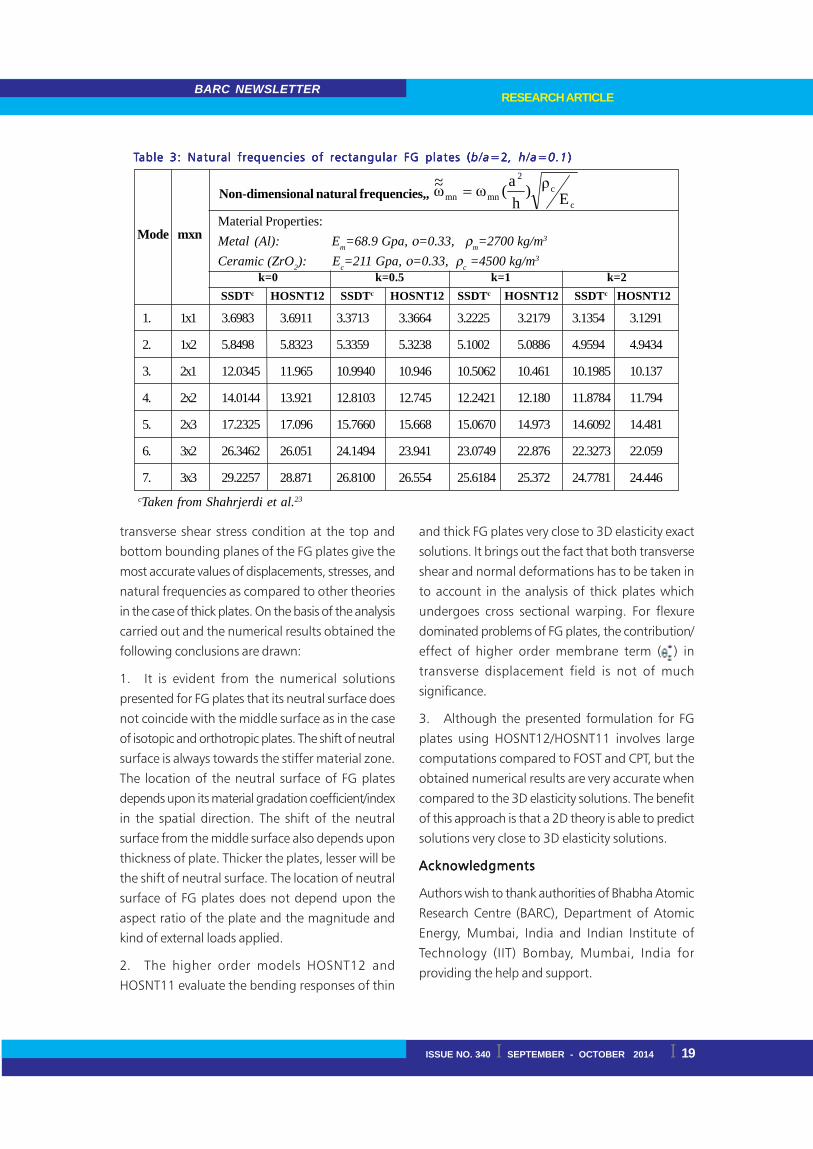
ISSUE NO. 340 I SEPTEMBER - OCTOBER 2014 I 19
BARC NEWSLETTERRESEARCH ARTICLE
transverse shear stress condition at the top and
bottom bounding planes of the FG plates give the
most accurate values of displacements, stresses, and
natural frequencies as compared to other theories
in the case of thick plates. On the basis of the analysis
carried out and the numerical results obtained the
following conclusions are drawn:
1. It is evident from the numerical solutions
presented for FG plates that its neutral surface does
not coincide with the middle surface as in the case
of isotopic and orthotropic plates. The shift of neutral
surface is always towards the stiffer material zone.
The location of the neutral surface of FG plates
depends upon its material gradation coefficient/index
in the spatial direction. The shift of the neutral
surface from the middle surface also depends upon
thickness of plate. Thicker the plates, lesser will be
the shift of neutral surface. The location of neutral
surface of FG plates does not depend upon the
aspect ratio of the plate and the magnitude and
kind of external loads applied.
2. The higher order models HOSNT12 and
HOSNT11 evaluate the bending responses of thin
and thick FG plates very close to 3D elasticity exact
solutions. It brings out the fact that both transverse
shear and normal deformations has to be taken in
to account in the analysis of thick plates which
undergoes cross sectional warping. For flexure
dominated problems of FG plates, the contribution/
effect of higher order membrane term ( ) in
transverse displacement field is not of much
significance.
3. Although the presented formulation for FG
plates using HOSNT12/HOSNT11 involves large
computations compared to FOST and CPT, but the
obtained numerical results are very accurate when
compared to the 3D elasticity solutions. The benefit
of this approach is that a 2D theory is able to predict
solutions very close to 3D elasticity solutions.
AcknowledgmentsAcknowledgmentsAcknowledgmentsAcknowledgmentsAcknowledgments
Authors wish to thank authorities of Bhabha Atomic
Research Centre (BARC), Department of Atomic
Energy, Mumbai, India and Indian Institute of
Technology (IIT) Bombay, Mumbai, India for
providing the help and support.
Non-dimensional natural frequencies,, c
c2
mnmn Eρ)
ha(ωω
~~ =
Material Properties:Metal (Al): Em=68.9 Gpa, ο=0.33, ρm=2700 kg/m3
Ceramic (ZrO2): Ec=211 Gpa, ο=0.33, ρc =4500 kg/m3
1. 1x1 3.6983 3.6911 3.3713 3.3664 3.2225 3.2179 3.1354 3.1291
2. 1x2 5.8498 5.8323 5.3359 5.3238 5.1002 5.0886 4.9594 4.9434
3. 2x1 12.0345 11.965 10.9940 10.946 10.5062 10.461 10.1985 10.137
4. 2x2 14.0144 13.921 12.8103 12.745 12.2421 12.180 11.8784 11.794
5. 2x3 17.2325 17.096 15.7660 15.668 15.0670 14.973 14.6092 14.481
6. 3x2 26.3462 26.051 24.1494 23.941 23.0749 22.876 22.3273 22.059
7. 3x3 29.2257 28.871 26.8100 26.554 25.6184 25.372 24.7781 24.446
k=0 k=0.5 k=1 k=2SSDTc HOSNT12 SSDTc HOSNT12 SSDTc HOSNT12 SSDTc HOSNT12
Mode mxn
cTaken from Shahrjerdi et al.23
TTTTTable 3: Natural frequencies of rectangular FG plates (able 3: Natural frequencies of rectangular FG plates (able 3: Natural frequencies of rectangular FG plates (able 3: Natural frequencies of rectangular FG plates (able 3: Natural frequencies of rectangular FG plates (b/ab/ab/ab/ab/a=2=2=2=2=2 , h/a=0.1, h/a=0.1, h/a=0.1, h/a=0.1, h/a=0.1 )))))
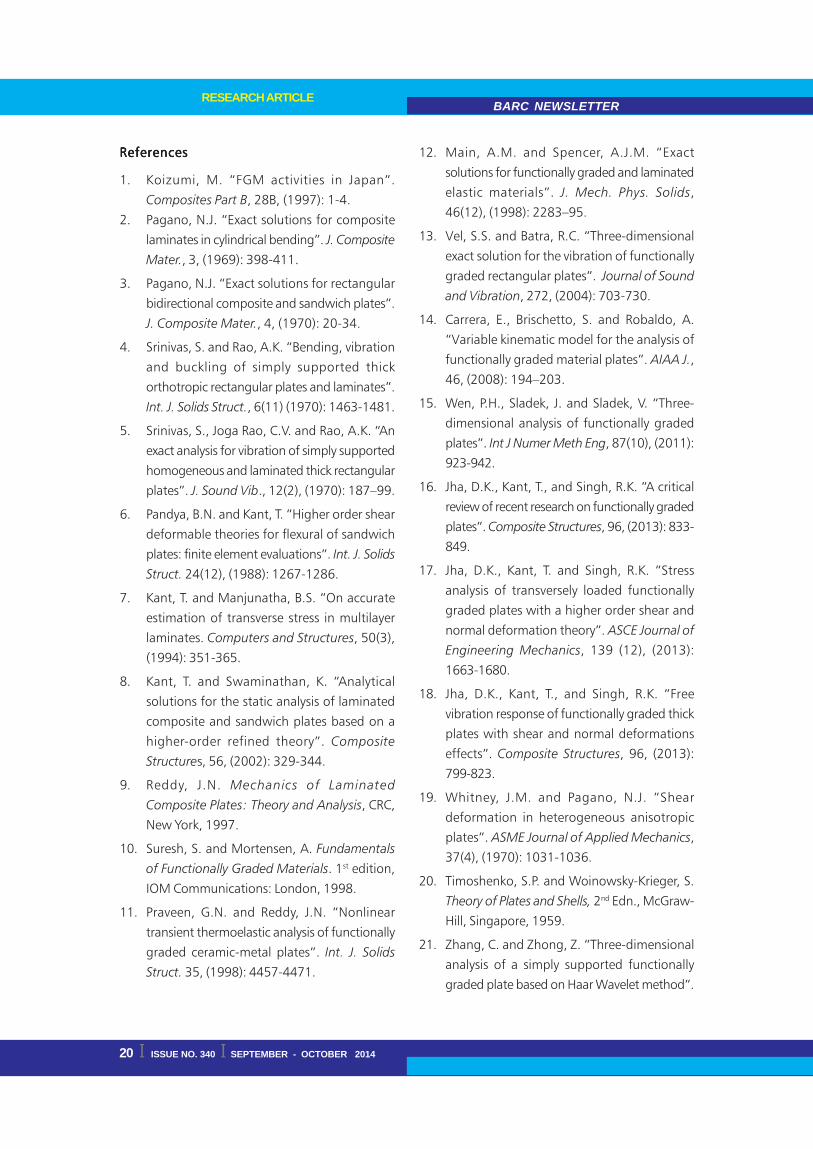
BARC NEWSLETTERRESEARCH ARTICLE
20 I ISSUE NO. 340 I SEPTEMBER - OCTOBER 2014
ReferencesReferencesReferencesReferencesReferences
1. Koizumi, M. “FGM activities in Japan”.
Composites Part B, 28B, (1997): 1-4.
2. Pagano, N.J. “Exact solutions for composite
laminates in cylindrical bending”. J. Composite
Mater., 3, (1969): 398-411.
3. Pagano, N.J. “Exact solutions for rectangular
bidirectional composite and sandwich plates”.
J. Composite Mater., 4, (1970): 20-34.
4. Srinivas, S. and Rao, A.K. “Bending, vibration
and buckling of simply supported thick
orthotropic rectangular plates and laminates”.
Int. J. Solids Struct., 6(11) (1970): 1463-1481.
5. Srinivas, S., Joga Rao, C.V. and Rao, A.K. “An
exact analysis for vibration of simply supported
homogeneous and laminated thick rectangular
plates”. J. Sound Vib., 12(2), (1970): 187–99.
6. Pandya, B.N. and Kant, T. “Higher order shear
deformable theories for flexural of sandwich
plates: finite element evaluations”. Int. J. Solids
Struct. 24(12), (1988): 1267-1286.
7. Kant, T. and Manjunatha, B.S. “On accurate
estimation of transverse stress in multilayer
laminates. Computers and Structures, 50(3),
(1994): 351-365.
8. Kant, T. and Swaminathan, K. “Analytical
solutions for the static analysis of laminated
composite and sandwich plates based on a
higher-order refined theory”. Composite
Structures, 56, (2002): 329-344.
9. Reddy, J.N. Mechanics of Laminated
Composite Plates: Theory and Analysis, CRC,
New York, 1997.
10. Suresh, S. and Mortensen, A. Fundamentals
of Functionally Graded Materials. 1st edition,
IOM Communications: London, 1998.
11. Praveen, G.N. and Reddy, J.N. “Nonlinear
transient thermoelastic analysis of functionally
graded ceramic-metal plates”. Int. J. Solids
Struct. 35, (1998): 4457-4471.
12. Main, A.M. and Spencer, A.J.M. “Exact
solutions for functionally graded and laminated
elastic materials”. J. Mech. Phys. Solids,
46(12), (1998): 2283–95.
13. Vel, S.S. and Batra, R.C. “Three-dimensional
exact solution for the vibration of functionally
graded rectangular plates”. Journal of Sound
and Vibration, 272, (2004): 703-730.
14. Carrera, E., Brischetto, S. and Robaldo, A.
“Variable kinematic model for the analysis of
functionally graded material plates”. AIAA J.,
46, (2008): 194–203.
15. Wen, P.H., Sladek, J. and Sladek, V. “Three-
dimensional analysis of functionally graded
plates”. Int J Numer Meth Eng, 87(10), (2011):
923-942.
16. Jha, D.K., Kant, T., and Singh, R.K. “A critical
review of recent research on functionally graded
plates”. Composite Structures, 96, (2013): 833-
849.
17. Jha, D.K., Kant, T. and Singh, R.K. “Stress
analysis of transversely loaded functionally
graded plates with a higher order shear and
normal deformation theory”. ASCE Journal of
Engineering Mechanics, 139 (12), (2013):
1663-1680.
18. Jha, D.K., Kant, T., and Singh, R.K. “Free
vibration response of functionally graded thick
plates with shear and normal deformations
effects”. Composite Structures, 96, (2013):
799-823.
19. Whitney, J.M. and Pagano, N.J. “Shear
deformation in heterogeneous anisotropic
plates”. ASME Journal of Applied Mechanics,
37(4), (1970): 1031-1036.
20. Timoshenko, S.P. and Woinowsky-Krieger, S.
Theory of Plates and Shells, 2nd Edn., McGraw-
Hill, Singapore, 1959.
21. Zhang, C. and Zhong, Z. “Three-dimensional
analysis of a simply supported functionally
graded plate based on Haar Wavelet method”.

ISSUE NO. 340 I SEPTEMBER - OCTOBER 2014 I 21
BARC NEWSLETTERRESEARCH ARTICLE
Acta Mechanica Solida Sinica, 28(3), (2007):
217-223.
22. Ferreira, A.J.M., Batra, R.C, Roque, C.M.C.,
Qian, L.F. and Jorge, R.M.N. “Natural
frequencies of functionally graded plates by a
meshless method”. Composite Structures, 75,
(2006): 593-600.
23. Shahrjerdi, A., Mustapha, F., Bayat, M.,
Sapuan, S.M., Zahari, R. and Shahzamanian,
M.M. “Natural frequency of F.G. rectangular
plate by shear deformation theory”. IOP Conf.
Series: Materials Science and Engineering,
17(1), (2011): 1-6.

BARC NEWSLETTERFEATURE ARTICLE
22 I ISSUE NO. 340 I SEPTEMBER - OCTOBER 2014
The elusive neutrinoThe elusive neutrinoThe elusive neutrinoThe elusive neutrinoThe elusive neutrinoVVVVV.M. Datar.M. Datar.M. Datar.M. Datar.M. Datar
Nuclear Physics Division
AbstractAbstractAbstractAbstractAbstract
After briefly introducing the neutrino the observations that led to the discovery of neutrino oscillations are
described. Various sources of neutrinos have been used to uncover facets of neutrinos including the more
recent measurement of one of key neutrino parameters in a reactor based experiment at Daya Bay, China.
The Indian effort to build an underground laboratory for rare processes is outlined. The flagship experiment
to measure atmospheric muon neutrinos and antineutrinos, separately, will target the open problem of
ordering of the 3 tiny neutrino masses. Together with other experiments worldwide this will help address CP
violation in the neutrino sector. This could help us understand why there is a preponderance of matter over
anti-matter in the universe we live in.
Introducing neutrinosIntroducing neutrinosIntroducing neutrinosIntroducing neutrinosIntroducing neutrinos
The neutrino is an elementary particle proposed by
Wolfgang Pauli (Fig.1) in 1930 to explain the
continuous energy spectrum of electrons in nuclear
beta decay. The neutrino has no electric charge, a
tiny mass a millionth of that of an electron and
interacts weakly [1] with matter. The weak
interaction [2] is responsible for the beta decay of
nuclei such as 14C (used in dating substances
containing organic carbon) and 40K (present at a
level of about 100 parts per million in all naturally
occurring potassium). Were it much stronger, for
example, of the order of the electromagnetic (EM)
interaction, the sun would have burnt itself out in a
matter of days rather than billions of years. Among
other consequences, this would have made
impossible the evolution of life, as we understand
it.
The neutrino is the second most abundant particle
in the universe (~330 neutrinos/cm3), after the
photon, the quantum of electromagnetic
interactions. However because of its weak interaction
and low energy (~170 μeV), the cosmic neutrinos,
which are relics of the big bang explosion that
resulted in our universe, remain undetected. In
contrast the cosmic EM radiation is characteristic
of a blackbody at 2.7°K, peaks in the microwave
region.Its measurement by space based radio
telescopes have allowed us to infer the fluctuations
in the very early stages of the universe leading to
the present day large scale structure of the universe.
In the Standard Model of particle physics, whose
predictions have been extensively verified, the
neutrino mass is expected to be zero. The three
varieties of neutrinos belonging to the electron,
muon and tau lepton families, also transform into
one another, a phenomenon known as neutrino
oscillations.
Because of their weak interaction with matter, unlike
EM radiation, neutrinos can penetrate matter
effortlessly. For example a neutrino, with an energy
~ MeV, has a probability of only 10-10 of interacting
with matter were it to traverse the diameter of the
earth. It is this property that has enabled scientists
Fig. 1: (Left to Right) WFig. 1: (Left to Right) WFig. 1: (Left to Right) WFig. 1: (Left to Right) WFig. 1: (Left to Right) W. P. P. P. P. Pauli, E. Fauli, E. Fauli, E. Fauli, E. Fauli, E. Fermi,ermi,ermi,ermi,ermi,C.L. Cowan and FC.L. Cowan and FC.L. Cowan and FC.L. Cowan and FC.L. Cowan and F. Reines. Reines. Reines. Reines. Reines

ISSUE NO. 340 I SEPTEMBER - OCTOBER 2014 I 23
BARC NEWSLETTERFEATURE ARTICLE
to peer into the heart of the sun and confirm that
the p-p fusion reaction chain (see Box 1) is
responsible for its huge energy production. Violent
explosions that could occured towards the end of a
star’s life, called supernovae, can also be studied
through neutrinos produced during the
neutronization (where electrons and protons
combine to form a neutron and a neutrino).
Historically, the theory for β-decay [3] was first
formulated by Enrico Fermi, the famous Italian-
American physicist (awarded the Nobel prize in
Physics for work on slow neutron induced
transmutation of nuclei in 1938). The theory was
modeled on the theory of EM interactions. It also
discussed the method for measuring the mass of
the neutrino through a measurement of the shape
of the beta spectrum near the end point. It was
Fermi who gave this new neutral particle a name
viz. the little neutron or neutrino. The neutrino was
first detected in a reactor experiment [4] by Cowan
and Reines in 1956. This is actually the electron
type of (anti-) neutrino. Subsequently two other
varieties of neutrinos were discovered, the muon
neutrino in 1962 by Schwartz, Steinberger and
Lederman at Brookhaven National laboratory, USA
[5] and the tau neutrino in 1999 by the DONUT
collaboration at Fermilab, USA [6]. The detection of
neutral current events at CERN, provided a very
important verification of a prediction of the electro-
weak (EW) theory of Steven Weinberg, Abdus Salam
and Sheldon Glashow which apart from unifying
the quantum theory of electrodynamics and weak
interactions, also predicted the existence of the W+,
W- and Z0 bosons, whose exchange between particles
is responsible for the weak force (see Table1). This
is analogous to photon exchange between charged
particles giving rise to the repulsive or attractive
Coulomb force. The EW theory field combined with
a quantum theory for strong interactions called
quantum chromodynamics (QCD), and the
associated Higgs boson constitutes the standard
model (SM) of particle physics (see Table 2 for the
fundamental particles therein). One of the key
ingredients of the SM is the Higgs. The Higgs field
is responsible for giving mass to particles such as
the electron and it has been discovered recently at
the Large Hadron Collider (LHC) at CERN.
Neutrinos oscillate!Neutrinos oscillate!Neutrinos oscillate!Neutrinos oscillate!Neutrinos oscillate!
We now return to the phenomenon of neutrino
oscillations. While the spin and electric charge of
the neutrino are known, its rest mass is not. Only
an upper bound can be placed by experiments, the
Box 1. Nuclear reactions powering the sunBox 1. Nuclear reactions powering the sunBox 1. Nuclear reactions powering the sunBox 1. Nuclear reactions powering the sunBox 1. Nuclear reactions powering the sun
TTTTTable 1: Fable 1: Fable 1: Fable 1: Fable 1: Four basic interactions in natureour basic interactions in natureour basic interactions in natureour basic interactions in natureour basic interactions in nature
Type Range Force mediator Relative strength ExampleGravitational Infinite Graviton (?) 10-38 Earth-Sun
Weak 10-18 m W±, Z0 10-5 β± decay
Electromagnetic Infinite Photon 1/137 Hydrogen atom Quarks in proton,
nucleons in nuclei *range of nucleon - nucleon force
Strong 10-15 m* Gluon 1
The pp chain reactions, proposed by Hans
Bethe (Nobel prize in Physics 1967) occur
in the core of the sun where the
temperature reaches 15,000,000 °K. The
reactions are:
p+p→ d+e++νe
d+p→3He+γ3He+3He→4He+2p3He+4He→7Be+γ, 7Be+p→8B+ γ8B → 8Be + β++νe,
8Be → 4He + 4He or
4p→→→→→ 4He + 2βββββ−−−−−+++++ 2νννννe releasing ∼∼∼∼∼ 24
MeV energy

BARC NEWSLETTERFEATURE ARTICLE
24 I ISSUE NO. 340 I SEPTEMBER - OCTOBER 2014
most stringent being that on the electron anti-
neutrino of ~2 eV/c2. For comparison the rest mass
of the electron is 511 keV/c2. Although we do not
yet know the mass(es) of the neutrino(s) we do
know the mass differences, or more precisely, the
difference(s) of the square of the masses. The
possibility that neutrinos oscillate was first pointed
out by Pontecorvo, a student of Fermi, in the mid-
60s. A requirement of the phenomenon of neutrino
oscillations is that at least 2 of the 3 known types
of neutrinos have non-zero mass. If this is the case
a neutrino, born as a particular type (e, μ or τ)
propagates in space with the different mass states
moving with different speeds. Since they are moving
close to the speed of light (c), the relative differences
in speed, measured on this scale, are small. Each
flavor of neutrino has a different mix of neutrino
mass states, decided by nature and parametrized in
terms of 3 mixing angles, 3 differences in the square
of masses and another angle related to the possibly
different behaviour of particles as compared to
antiparticles. At a certain distance from its birth an
electron type neutrino may transform, chameleon-
like, into a muon - or tau- type of neutrino. Such
oscillations, also known as mixing, are seen in the
strongly interacting particles at a much smaller level.
As the late John Bahcall, an eminent astrophysicist
who, with Ray Davis, proposed the radiochemical
Chlorine detector for measuring solar neutrinos and
calculated their expected flux leading to the solar
neutrino problem, has put it -
Solar neutrinos have a multiple personality disorder.
They are created as electron neutrinos in the Sun,
but on the way to the Earth they change their type.
For neutrinos, the origin of the personality disorder
is a quantum mechanical process, called “neutrino
oscillations”.
Interestingly, Bahcall’s proposal that the observed
shortfall in the measured solar neutrinos as compared
to his calculations had a particle physics origin, viz.
neutrino oscillations, was not taken seriously by the
high energy physics community. His stand was
however vindicated, first through observations on
atmospheric neutrinos (described later) and then
through a neutrino type or flavor blind measurement
at the Sudbury Neutrino Observatory, a 1.7 km deep
mine in Canada. The latter experiment used 1000
tons of pure heavy water and measured the flux of
electron neutrinos as well as the sum of fluxes of all
(active) neutrino flavours. The shortfall seen in the
former flavor was made up in the latter and
confirmed the conjecture of Bahcall.
Neutrino oscillations may be understood by first
looking at the simpler two-flavour mixing. Let us
look at an analogous situation in optics related to
the propagation of light in a optical medium that
has a ‘handedness’ in that it responds differently to
left handed and right handed circularly polarized
light. This results in rotating the plane of polarization
of plane polarized light to the left (laevorotatory) or
to the right (dextrorotatory). In a similar manner,
the two mass states move at different speeds so
that what started out as an electron neutrino looks
partly like the muon neutrino as it propagates over
space and returns to its original (electron neutrino)
state at a distance characteristic of its energy and
the quantity m22 - m1
2. Here m1 and m2 are the
masses in the alternate description where masses
Quarks
u c td s b Leptonsνe νμ ντ
e- μ- τ-
Electriccharge
+2/3-1/3
0
-1
Mass (GeV)0.0023, 1.275, 1730.0048, 0.095, 4.2
< 2x10⁻⁹, <1.7x10⁻⁴, 1.8x10⁻²
0.511x10⁻³, 0.106, 1.78
Bosons mediatinginteractions [mass (GeV)]
Gluon g (0)Photon γ γ γ γ γ (0)Weak bosons W+, W-(80.4each), Z0 (91.2)Higgs boson H0 (126)
TTTTTable 2: Fable 2: Fable 2: Fable 2: Fable 2: Fundamental particlesundamental particlesundamental particlesundamental particlesundamental particles
ISSUE NO. 340 I SEPTEMBER - OCTOBER 2014 I 25
BARC NEWSLETTERFEATURE ARTICLE
are definite, as opposed to the “electron-ness” or
“muon-ness”. Using elementary quantum
mechanics, the time evolution of a neutrino starting
as one of say the electron type can be calculated in
the 2-flavour mixing scenario. It can be shown that
the survival probability is given by
where θ is the mixing angle, E the neutrino energy
in MeV, L is the neutrino propagation length in
metres and Δm2 in eV2. The angle θ (which is real) is
used to parametrize the elements of the 2´2 mass
mixing matrix that connects the leptonic and mass
eigenstates through the relation
Here e, μ are the two leptonic eigenstates and m1,
m2 are the two mass eigenstates.
The more realistic 3-flavour case has more
complicated expressions involving 3 mixing angles,
analogous to the 3 Euler angles which are needed
to connect 2 coordinate frames connected by
rotations in 3D space. In addition there are 3 mass
squared differences and one CP violating phase. #####
The most compelling evidence for neutrino
oscillations was obtained from measurements on
atmospheric neutrinos. The neutrinos originate from
the decays of the pion and the daughter muon. The
pions are produced in cosmic ray interactions with14N and 16O nuclei in the upper atmosphere. The
pions then decay with a lifetime of about 26 nsec
producing a muon and a muon neutrino and the
muon in turn decays to an electron, muon neutrino
and an electron neutrino. Thus for every pion decay
there are 2 muon neutrinos and 1 electron neutrino.
As this is the major source of atmospheric neutrinos,
the ratio of the detected muon to electron neutrinos
is model independent and therefore very robust.
The Kamiokande I experiment found the expected
ratio of muon to electron neutrinos for downward
pointing events but a deficit, by about a factor of
two, for upward pointing events. A natural
explanation was that the upward going muon
neutrinos change their flavor becoming tau neutrinos
which are detected with much less efficiency as
compared to muon or electron neutrinos.
Neutrino sources and experimentsNeutrino sources and experimentsNeutrino sources and experimentsNeutrino sources and experimentsNeutrino sources and experiments
There are several sources of neutrinos listed below
(see Fig.2): (a) the sun [7] (b) cosmic ray interactions
with the earth’s atmosphere [8] (c) supernovae and
other explosive events in universe [9] (d) particle
accelerators such as at CERN in Geneva [5,10] (e)
nuclear reactors [4] and (f) Geo-radioactivity [11].
Each has a characteristic energy range, flux or source
strength and angular distribution (isotropic from
source for most except the accelerator produced).
The first ever detection of supernova neutrinos, from
SN1987a, took place in 1987 by several detectors
worldwide, chief among them being Kamiokande I
which detected 11 of the total of 17 events. The
beginning of neutrino astronomy was acknowledged
by the award of a shared Nobel prize to Koshiba
who led the Kamiokande experiment. This
experiment had been designed to look for proton
decay which it did not find, as nature did not oblige!
On the other hand the background due to neutrinos
turned out to be a rich mine viz. atmospheric
neutrinos which led to the discovery of neutrino
oscillations, the first real time detection of solar
neutrinos including the direction of their source (the
sun) and neutrinos from a stellar collapse SN1987a.
Man made muon neutrinos via in flight decay of
pions were first detected by a team led by Schwartz,
Lederman and Steinberger in 1962 at Brookhaven
National Lab. All three received the Nobel prize in
the year 1962 for this discovery. The same method
was used with more powerful accelerators and using
the off axis decay to produce quasi-mono-energetic
muon neutrinos to do several measurements. If the
pions are relativistic (speed ≈ speed of light) the
neutrinos travel in a narrow cone whose angle is
small enough to allow experiments to be done at
Pee = 1 - sin2 2θ sin2 1.27 Δm2 L E
e cos θ sin θ m1
μ - sin θ cos θ m2
=
##### C changes particle to anti-particle, P stands for parity under whose operation rrrrr →→→→→ - rrrrr. . . . . CP symmetry implies invariance
under the combined operations of C and P.
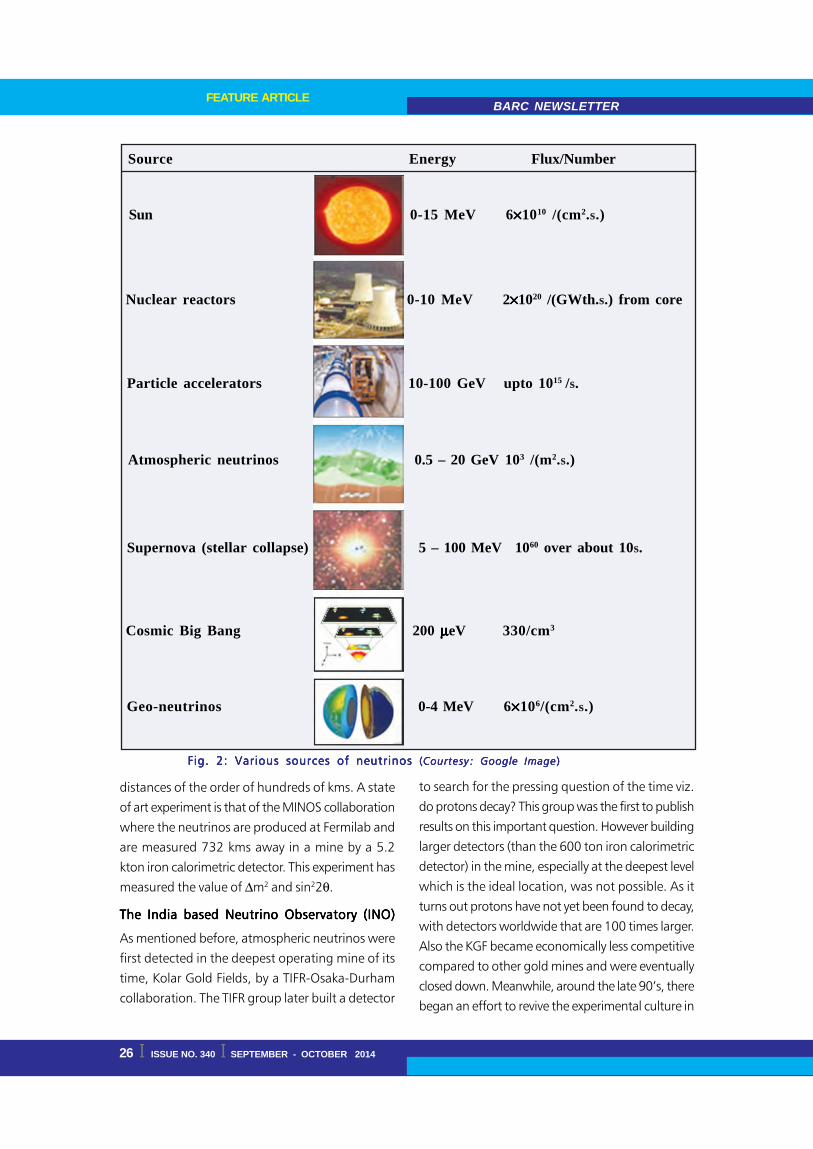
BARC NEWSLETTERFEATURE ARTICLE
26 I ISSUE NO. 340 I SEPTEMBER - OCTOBER 2014
distances of the order of hundreds of kms. A state
of art experiment is that of the MINOS collaboration
where the neutrinos are produced at Fermilab and
are measured 732 kms away in a mine by a 5.2
kton iron calorimetric detector. This experiment has
measured the value of Δm2 and sin22θ.
The India based Neutrino Observatory (INO)The India based Neutrino Observatory (INO)The India based Neutrino Observatory (INO)The India based Neutrino Observatory (INO)The India based Neutrino Observatory (INO)
As mentioned before, atmospheric neutrinos were
first detected in the deepest operating mine of its
time, Kolar Gold Fields, by a TIFR-Osaka-Durham
collaboration. The TIFR group later built a detector
to search for the pressing question of the time viz.
do protons decay? This group was the first to publish
results on this important question. However building
larger detectors (than the 600 ton iron calorimetric
detector) in the mine, especially at the deepest level
which is the ideal location, was not possible. As it
turns out protons have not yet been found to decay,
with detectors worldwide that are 100 times larger.
Also the KGF became economically less competitive
compared to other gold mines and were eventually
closed down. Meanwhile, around the late 90’s, there
began an effort to revive the experimental culture in
Fig. 2: Various sources of neutrinos Fig. 2: Various sources of neutrinos Fig. 2: Various sources of neutrinos Fig. 2: Various sources of neutrinos Fig. 2: Various sources of neutrinos (((((Courtesy: Google ImageCourtesy: Google ImageCourtesy: Google ImageCourtesy: Google ImageCourtesy: Google Image )))))
Sun 0-15 MeV 6×××××1010 /(cm2.s.)
Nuclear reactors 0-10 MeV 2×××××1020 /(GWth.s.) from core
Particle accelerators 10-100 GeV upto 1015 /s.
Atmospheric neutrinos 0.5 – 20 GeV 103 /(m2.s.)
Supernova (stellar collapse) 5 – 100 MeV 1060 over about 10s.
Cosmic Big Bang 200 μμμμμeV 330/cm3
Geo-neutrinos 0-4 MeV 6×××××106/(cm2.s.)
Source Energy Flux/Number

ISSUE NO. 340 I SEPTEMBER - OCTOBER 2014 I 27
BARC NEWSLETTERFEATURE ARTICLE
India and focusing on non-accelerator experiments
in an underground laboratory. Building such a lab
at the end of a tunnel, such as at Kamioka in Japan
and Gran Sasso in Italy, was a better option for
housing large detectors. At around this time the
field of neutrino physics was becoming very
interesting in view of results from the Kamiokande-
I and Irvine-Michigan-Brookhaven experiments,
which turned the background for proton decay (for
which only upper bounds could be placed)
measurements into a signal for atmospheric neutrino
oscillations!
The idea of building an underground laboratory in
India began with the signing of a MoU by the
directors of 6 institutes of the Department of Atomic
Energy in 2002. Early on it was decided that we
build a 50-100 kton magnetized iron calorimeter
(ICAL) to measure atmospheric neutrinos. This would
be unique in that it would have the capability of
distinguishing between neutrino and anti-neutrino
induced events using the so called charged current
interactions which produce muons of opposite
charge. A similar proposal, MONOLITH, had been
considered by an Italian group with a somewhat
smaller detector of 32 kton. Simultaneously, R&D
was begun on simulations (both for neutrino
detection and the magnet) and the active detector
element viz. glass Resistive Plate Chamber (RPC), a
position sensitive, fast gas detector. It was envisaged
that after some ground work a project report would
be prepared. This was done in May 2006 [12] and
reviewed by 6 international referees. The overall
rating of the project was high with an advice that
the project be implemented quickly.
The INO will be an underground laboratory located
in Pottipuram, about 110 kms to the west of
Madurai, at the end of a 2 km long tunnel with
about 1 km rock cover all round (see Fig. 3 for a
bird’s eye view of the project). This will reduce the
cosmic ray background by about a factor of a million
enabling low background experiments to be carried
out. While the ICAL detector for measuring
atmospheric muon neutrinos will be the largest in
the underground laboratory, there are at least two
other experiments which make use of the low cosmic
background to search for neutrinoless double beta
decay in 124Sn and a silicon detector for directly
detecting dark matter particles. Both will be based
on cryogenic bolometers operating at temperatures
of about 10 milli-Kelvin and are presently in the
R&D phase at TIFR and SINP, respectively.
The main scientific goals [ of the ICAL experiment
are (i) the determination of the ordering of neutrino
masses, known as the mass hierarchy problem viz.
whether m3>m2>m1 (normal hierarchy) or
m2>m1>m3 (inverted hierarchy) (ii) a more precise
measurement of the mixing parameters θ23 and Δm232
(iii) confirm (iii) search for explanation of anomalous
Kolar events and possibly (iv) together with long
baseline accelerator experiments address the very
fundamental problem of the predominance of
matter over antimatter in the universe [14]. The ICAL
detector is best suited for making measurements of
muons, and hence of, primarily, muon neutrinos.
The hierarchy sensitivity of the ICAL detector, which
has a discovery potential, has its origin in the “matter
effect” where the effective neutrino mass and mixing
angles change when neutrinos propagate through
any material such as the earth. The change is
different for neutrinos and antineutrinos, something
which can be used in measurements which can
discriminate between the two such as those with
the magnetic calorimeter ICAL. The large range of
energies (1-10 GeV) and propagation distances (1-
13000 km) of atmospheric neutrinos and the ability
of ICAL to separately measure neutrinos and anti-
neutrinos enables a very important problem of mass
ordering, known as the mass hierarchy problem, of
neutrinos to be addressed. We know from solar
neutrino experiments that the mass eigenstate
m2>m1 but we do not know from experiments
whether m3>m1, m2 or m3<m1, m2. It should be
mentioned that Δm212 = m2
2 - m12 is about 30
times smaller than Δm322. Other detectors working
in conjunction with accelerators are plagued with
an ambiguity problem whereby for certain values

BARC NEWSLETTERFEATURE ARTICLE
28 I ISSUE NO. 340 I SEPTEMBER - OCTOBER 2014
the parameter which quantifies the CP violation
(related to the different behavior of neutrino and
anti-neutrinos) in the neutrino sector there is no
sensitivity to the mass hierarchy. On the other hand
if the results of ICAL and accelerator based
experiments such as Nova using the Fermilab
neutrino beam and T2K could yield a definite answer
whether the CP symmetry is violated in the neutrino
sector, and if so, whether it is enough to explain the
matter-antimatter asymmetry in the universe.
The precision measurement of Δm322 and sin22θ23 is
another goal of ICAL. Similarly a handful of events,
the so called Kolar events, have been observed in
the KGF experiments (~1965-1990) at depths of
about 2.3 kms. At these depths cosmic ray muons
constitute a negligible background. These anomalous
events were then ascribed to a new particle produced
in neutrino-rock interactions which emerges from
the rock to decay in the air volume. This should
then have been seen in accelerator which turned up
negative. A possible recent explanation [15] could
be verified at INO.
ReferencesReferencesReferencesReferencesReferences
1. How weak is the weak force? For example,
the weak force between a proton and the
neutron in a nucleus is about 10-14 times
weaker than the strong force which is
responsible for binding the nuclear
constituents. W. Pauli, H.A. Bethe (another
Nobel prize winner who proposed the fusion
Fig. 3: From top left clockwise (a) view of the mountain inside which the INOFig. 3: From top left clockwise (a) view of the mountain inside which the INOFig. 3: From top left clockwise (a) view of the mountain inside which the INOFig. 3: From top left clockwise (a) view of the mountain inside which the INOFig. 3: From top left clockwise (a) view of the mountain inside which the INOcaverns will be located (b) cavern complex (c) schematic of ICAL magnet withcaverns will be located (b) cavern complex (c) schematic of ICAL magnet withcaverns will be located (b) cavern complex (c) schematic of ICAL magnet withcaverns will be located (b) cavern complex (c) schematic of ICAL magnet withcaverns will be located (b) cavern complex (c) schematic of ICAL magnet withRPC handling trolleys (d) schematic of glass RPC with glass gap, graphite coatingRPC handling trolleys (d) schematic of glass RPC with glass gap, graphite coatingRPC handling trolleys (d) schematic of glass RPC with glass gap, graphite coatingRPC handling trolleys (d) schematic of glass RPC with glass gap, graphite coatingRPC handling trolleys (d) schematic of glass RPC with glass gap, graphite coatingfor application of high voltage and pickup strips on either side of gap in Xfor application of high voltage and pickup strips on either side of gap in Xfor application of high voltage and pickup strips on either side of gap in Xfor application of high voltage and pickup strips on either side of gap in Xfor application of high voltage and pickup strips on either side of gap in X-----and Yand Yand Yand Yand Y-directions (e) simulated magnetic field across 16m×16m area. The color-directions (e) simulated magnetic field across 16m×16m area. The color-directions (e) simulated magnetic field across 16m×16m area. The color-directions (e) simulated magnetic field across 16m×16m area. The color-directions (e) simulated magnetic field across 16m×16m area. The colorcode indicates the Bcode indicates the Bcode indicates the Bcode indicates the Bcode indicates the B-field strength in T-field strength in T-field strength in T-field strength in T-field strength in Tesla.esla.esla.esla.esla.

ISSUE NO. 340 I SEPTEMBER - OCTOBER 2014 I 29
BARC NEWSLETTERFEATURE ARTICLE
reaction as a power source of the stars including
the sun) and R. Peierls had predicted that it would
be impossible to detect because of its extremely
low probability of interaction with matter.
2. The weak interaction is one of the 4 basic
interactions in nature, the other three being
the strong interaction (which binds nucleons
in a nucleus or quarks in a proton or neutron,
for example), the familiar electromagnetic
interaction (which binds atoms and molecules,
and which helps mobile communication) and
gravitational interaction (which gives us weight
and holds the earth in its orbit around the
sun).
3. E. Fermi, Ricerca Scientifica, 2, No. 12 (1933);
Z. Phys., 88, 161 (1934). An English
translation by Fred L. Wilson, can be found in
“Fermi’s Theory of Beta Decay”, Am. J. Phys.
36 (1968) 1150. Interestingly, Fermi’s paper
was first submitted to Nature which rejected
it. The journal later acknowledged this decision
as one its greatest blunders.
4. C.L. Cowan, F. Reines, F.B. Harrison, H.W.
Kruse, A.D. McGuire, “Detection of the free
neutrino: a confirmation”, Science, 124
(1956) 103-104. Reines has recalled that he
first toyed with the idea of detecting neutrinos
from the atomic bomb of the Manhattan
Project at Los Alamos. He was persuaded by
Luis Alvarez to look for a more steady and
enduring source of neutrinos such as a nuclear
reactor! Nuclear reactors have also been used
to produce strong radioactive sources such as51Cr for calibrating the Gallex, Sage and GNO
detectors built to measure solar neutrinos using71Ga as the probe nucleus.
5. G. Danby, J-M. Gaillard, K. Goulianos, L.M.
Lederman, N. Mistry, M. Schwartz, J.
Steinberger, “Observation of high-energy
neutrino reactions and the existence of two
kinds of neutrinos”, Phys. Rev. Lett. 9 (1962)
36-44.
6. K. Kodama et al., “Observation of tau neutrino
interactions”, Phys Lett. B 504 (2001) 218-
224. The DONUT collaboration found the first
evidence for the tau neutrino at Fermilab.
7. R. Davis, Nobel Lecture: A half-century with
solar neutrinos, Rev. Mod. Phys., 75, (2003)
985-994; J.N. Bahcall, “Solar neutrinos. I.
Theoretical”, Phys.Rev. Lett. 12 (1964) 300–
302.; J.N. Bahcall, M.H. Pinsonneault, and
S. Basu, ‘‘Solar models: current epoch and
time dependences, neutrinos, and
helioseismological properties,’’ Astrophys. J.
555 (2001) 990-1012.
8. First discovered in an experiment at the Kolar
Gold Fields by a TIFR-Osaka-Durham
collaboration. C.V. Achar et al, Phys. Lett. 18
(1965) 196-199.
9. K. Hirata et al. (Kamiokande II collaboration),
“Observation of a neutrino burst from the
supernova SN1987A” , Phys. Rev. Lett. 58
(1987) 1490-1493; R.M. Bionta et al. (IMB
collaboration), Phys. Rev. Lett. 58 (1987)
1494-1496.
10. P. Adamson et al. (MINOS collaboration), Phys.
Rev. Lett. 101 (2008) 131802-1:5.
11. T. Araki et al., “Experimental investigation of
geologically produced antineutrinos with
KamLAND”, Nature 436, (2005) 499-503.
12. INO Report (2007) and the INO website
www.ino.tifr.res.in
13. It may mentioned that quite often the stated
goals may not necessarily be achieved because
of the very nature of scientific research. On
the other hand state of art instruments
sometimes unearth phenomena that were not
anticipated at the start of the project. One such
examples is the Japanese water Cerenkov
detectors at Kamiokande which were built to
search for proton decay, did not find it, but
turned the background from neutrinos into
signals that lead to the discovery of neutrino
oscillations using atmospheric neutrinos.

BARC NEWSLETTERFEATURE ARTICLE
30 I ISSUE NO. 340 I SEPTEMBER - OCTOBER 2014
14. A.D. Sakharov, “Violation of CP invariance, C
asymmetry and baryon asymmetry of the
universe”, JETP Lett. 5 (1967) 24-27. Sakharov
was the first to point out that the matter-
antimatter asymmetry in the universe can arise
only if 3 conditions are met viz. (a) non-
equilibrium conditions (b) baryon non-
conservation (c) CP violation.
15. M.V.N. Murthy and G. Rajasekaran,
“Anomalous Kolar events revisited: Dark
matter?”, Pramana, 82 (2014) L609-615.
ISSUE NO. 340 I SEPTEMBER - OCTOBER 2014 I 31
BARC NEWSLETTERFEATURE ARTICLE
Seamless Access to Networked Information:Seamless Access to Networked Information:Seamless Access to Networked Information:Seamless Access to Networked Information:Seamless Access to Networked Information:The Role of Domain OntologiesThe Role of Domain OntologiesThe Role of Domain OntologiesThe Role of Domain OntologiesThe Role of Domain Ontologies
Sangeeta Deokattey and K. BhanumurthySangeeta Deokattey and K. BhanumurthySangeeta Deokattey and K. BhanumurthySangeeta Deokattey and K. BhanumurthySangeeta Deokattey and K. BhanumurthyScientific Information Resource Division
AbstractAbstractAbstractAbstractAbstract
In the current information overload mode, access to the right kind of information is even today an uphill
task. This is because of complexities both in the types of documents and in the information contents of the
documents. Providing seamless access to networked information through a single platform is still achievable,
through the use of Domain Ontologies. The present article provides basic information on Domain Ontologies,
how they can be developed and a flavor of R&D activities at the Scientific Information Resource Division on
Domain Ontologies.
IntroductionIntroductionIntroductionIntroductionIntroduction
We live in a world of information. Einstein [1]
reinstated its importance when he said “Know where
to find the information and use it; that is the secret
of success”. According to Horowitz [2], American
Information Scientist, “Not having the information
you need when you need it, leaves you wanting.
Not knowing where to look for that information
leaves you powerless. In a society where information
is King, none of us can afford that”.
We live in an information society. Apart from the
traditional disseminators of information, such as the
mass media, the scientific and technical publishing
houses and learned societies, there is now a new
medium of mass communication: the Internet. It is
turning the entire gamut of writing, publishing and
copyright issues, upside down. Libraries and
Information Centres, have been providing and
continue to provide information services to their
clientele, in this ever changing scenario.
Knowledge Organization (KO)Knowledge Organization (KO)Knowledge Organization (KO)Knowledge Organization (KO)Knowledge Organization (KO)
Organization of Knowledge for effective retrieval is
one of the most important functions of an
Information Centre. Every information system uses
two distinct schema for encoding information
embodied in a document. One represents the subject
contents of a document through the use of a
classification scheme, a thesaurus or a subject
heading list etc., the other provides descriptive
information about a document like title, author,
publisher, etc. These are handled by metadata
schema. The main problem in the context of
interoperability is that, a subject schema used in
one library may not be compatible with that of
another library. If a piece of information is
downloaded from the Internet, it is represented in
an entirely different schema. Therefore, achieving
semantic homogeneity in heterogeneous digital
information resources is a real challenge.
The electronic era, the Internet and theThe electronic era, the Internet and theThe electronic era, the Internet and theThe electronic era, the Internet and theThe electronic era, the Internet and the
subject approach to informationsubject approach to informationsubject approach to informationsubject approach to informationsubject approach to information
Advances in Internet-based information services, have
further precipitated the need, to organize
information in a more effective way. As far as
indexing and vocabulary control methods are
concerned, there is no standardization of
terminology on the web. A number of research
methods and experiments are currently on, to create
a semantic web; a semantic interlinking of all the
information on the web. These methods include
BARC NEWSLETTERFEATURE ARTICLE
32 I ISSUE NO. 340 I SEPTEMBER - OCTOBER 2014
the use of free text, i.e “key words” taken from the
text, clustering methods based on statistical co-
occurrence of words, linguistic methods using
semantic clustering and neural network methods
for browsing and searching the web.
Current scenario in Knowledge OrganizationCurrent scenario in Knowledge OrganizationCurrent scenario in Knowledge OrganizationCurrent scenario in Knowledge OrganizationCurrent scenario in Knowledge Organization
Digital information explosion, has necessitated the
growth and development of new indexing tools and
systems. Several efforts have been made to use
Classification schemes to organize digital
information, both in Libraries and Information
Centres and on the Internet. Controlled Vocabularies
and Natural Language Indexing Systems continue
to be used by many database systems on the
Internet. But, these systems are one-dimensional in
their approach, i.e. concepts or keywords have a
one-to-one correspondence among themselves. This
approach was feasible in the case of traditional
subjects, represented by these systems, over the
years. But now, subject areas are no longer clearly
delineated. There is an intermingling of other
subjects. For e.g. Bioinformatics, in which, Biology,
Computers and Technology have fused together, as
one compound, interdisciplinary subject. In such a
scenario, a one-to-one correspondence between
concepts/keywords will not provide an accurate
representation of the subject contents of a document.
A one-to-many correspondence between concepts
or keywords becomes the norm and this
correspondence needs to be brought out during
concept mapping and indexing. A whole new
vocabulary needs to be developed, to semantically
map the entire subject field. Creating a subject-
specific indexing tool such as a Thesaurus is time-
consuming, requires subject expertise and is difficult
to update regularly.
OntologiesOntologiesOntologiesOntologiesOntologies
An Ontology provides an answer to these problems.
It is multidimensional in its approach to organizing
information. Any number of linkages (relationships)
can be provided for each concept or keyword as
and when required, since it is a continuously
evolving, dynamic system. An Ontology is also more
amenable to the addition of new concepts as there
is no need for developing a rigid vocabulary, which
has to be strictly adhered to, both during indexing
and searching (as in the case of thesauri). An
Ontology makes use of both standard terms and
free-text terms, with the result that updating is
almost immediate. A user is free to suggest any
new concept that he/she feels is important and is
relevant to the subject. Ontologies are increasingly
being used as KO tools, especially for digital
information and web-based information services.
Ontologies and Philosophy: Ontologies and Philosophy: Ontologies and Philosophy: Ontologies and Philosophy: Ontologies and Philosophy: According to the
Oxford English Dictionary the first recorded use of
the word “Ontology” in English, was in year 1721.
Ontology (ontos = being and logos = study) means
“the study of being”. It is the theory of objects and
their ties. Traditionally, Ontology as a subject, was
the focus of Philosophers and Logicians who used
the term to denote the study of what is, i.e. what
exists, the kinds and structures of objects, properties
and other aspects of reality of the universe. Ontology
is the first part that actually belongs to Metaphysics.
It is a pure doctrine of elements of all our a priori
cognitions; or it contains the summation of all our
pure concepts that we can have a priori of things.
Ontologies and Artificial Intelligence: Ontologies and Artificial Intelligence: Ontologies and Artificial Intelligence: Ontologies and Artificial Intelligence: Ontologies and Artificial Intelligence: In the
field of Artificial Intelligence, an Ontology is a theory
concerning the kinds of entities and specifically the
kinds of abstract entities, that are to be admitted to
a language system. The concept was developed and
implemented since the early 1990s. AI researchers
use Ontologies (in plural) for two basic purposes:
Problem Solving Methods (PSMs) and Knowledge
Based Systems (KBSs). One of the most popular
definitions of Ontologies is by Gruber [4]: an
Ontology is “a formal explicit specification of a
shared conceptualization”.
Ontologies and the Semantic Web InitiativeOntologies and the Semantic Web InitiativeOntologies and the Semantic Web InitiativeOntologies and the Semantic Web InitiativeOntologies and the Semantic Web Initiative
by the W3C: by the W3C: by the W3C: by the W3C: by the W3C: The ultimate goal of the Web is to
enable computers to do more useful work and to
develop systems that can support trusted interactions

ISSUE NO. 340 I SEPTEMBER - OCTOBER 2014 I 33
BARC NEWSLETTERFEATURE ARTICLE
over the network. The term “Semantic Web” refers
to W3C’s vision of the Web of linked data. The
Semantic Web is the communication platform
between computers and people operable via
semantically encoded information. It is an extension
of the current Web, in which meaning of
information is clearly and explicitly linked from the
information itself, better enabling computers and
people to work in cooperation. Ontologies are an
integral part of this communication platform.
Ontologies and Information Science: Ontologies and Information Science: Ontologies and Information Science: Ontologies and Information Science: Ontologies and Information Science: In the
context of Information Science, an Ontology is yet
to be formally defined. As of now, Ontology is still
an evolving concept and a consensus is yet to be
reached on the exact definition. Therefore the
authors have evolved a workingworkingworkingworkingworking definition of a
domain ontology for the purpose of developing new
domain ontologies.
“A domain ontology is a Knowledge Organization
tool on any subject domain either pure,
interdisciplinary or multidisciplinary and which
incorporates both a metadata schema and a
vocabulary. It is based on WWW standard for
metadata encoding and is thus interoperable in any
digital environment either intranet or Internet. It uses
both available controlled vocabulary terms and free
index terms and is based on the concept of Literary
Warrant”.
TTTTTypes of Ontologiesypes of Ontologiesypes of Ontologiesypes of Ontologiesypes of Ontologies
According to Gruber’s definition of an Ontology, it
is “a formal explicit specification of a shared
conceptualization”; ‘Formal’ refers to the fact that
an Ontology should be machine readable. ‘Explicit’
means that the types of concepts used and the
constraints on their use should be explicitly defined.
‘Shared’ implies acceptance and use of consensual
knowledge by the participating groups. And finally,
‘conceptualization’ refers to an abstract model of
phenomena in the world through identification of
relevant concepts of those phenomena. AI
researchers have classified Ontologies using different
criteria.
According to van Heijst [5], Ontologies can be
classified into two main types as seen in Fig. 1.
Fig. 1: Ontological types (van Heijst [5])Fig. 1: Ontological types (van Heijst [5])Fig. 1: Ontological types (van Heijst [5])Fig. 1: Ontological types (van Heijst [5])Fig. 1: Ontological types (van Heijst [5])
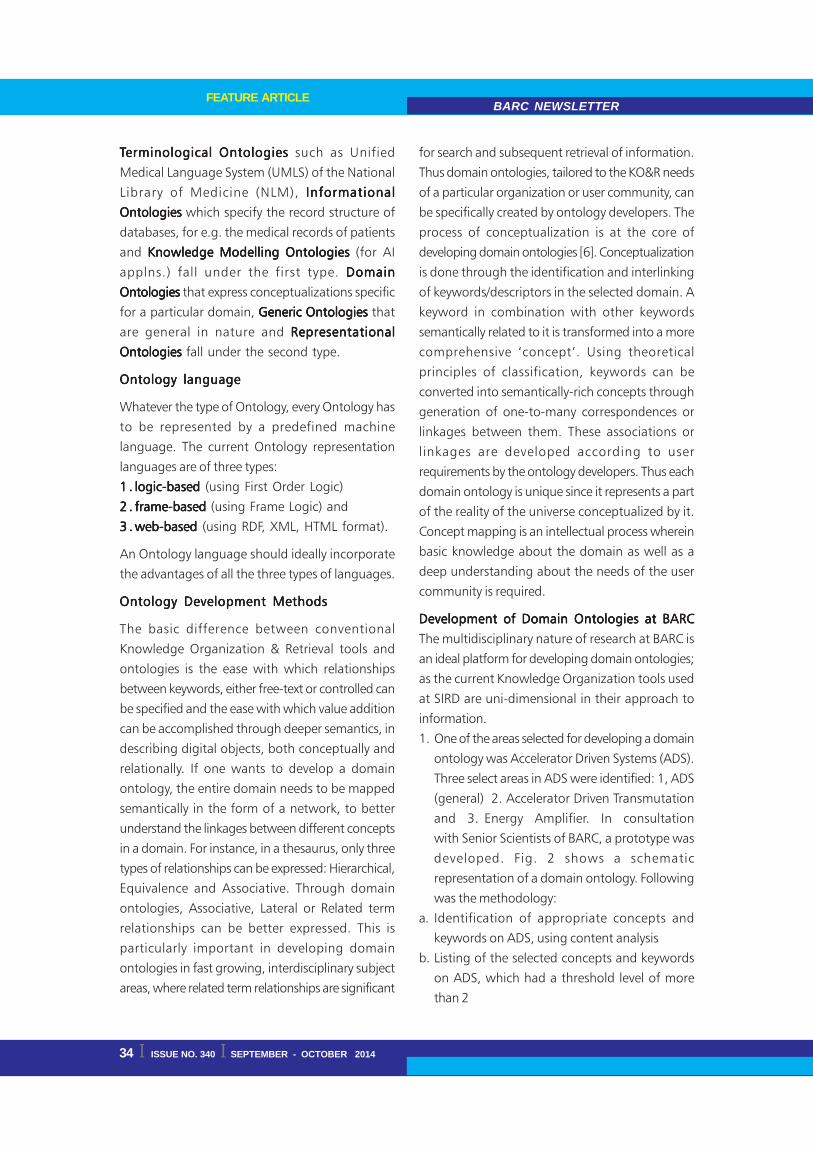
BARC NEWSLETTERFEATURE ARTICLE
34 I ISSUE NO. 340 I SEPTEMBER - OCTOBER 2014
TTTTTerminological Ontologieserminological Ontologieserminological Ontologieserminological Ontologieserminological Ontologies such as Unified
Medical Language System (UMLS) of the National
Library of Medicine (NLM), InformationalInformationalInformationalInformationalInformational
Ontologies Ontologies Ontologies Ontologies Ontologies which specify the record structure of
databases, for e.g. the medical records of patients
and Knowledge Modelling OntologiesKnowledge Modelling OntologiesKnowledge Modelling OntologiesKnowledge Modelling OntologiesKnowledge Modelling Ontologies (for AI
applns.) fall under the first type. DomainDomainDomainDomainDomain
Ontologies Ontologies Ontologies Ontologies Ontologies that express conceptualizations specific
for a particular domain, Generic Ontologies Generic Ontologies Generic Ontologies Generic Ontologies Generic Ontologies that
are general in nature and RepresentationalRepresentationalRepresentationalRepresentationalRepresentational
Ontologies Ontologies Ontologies Ontologies Ontologies fall under the second type.
Ontology languageOntology languageOntology languageOntology languageOntology language
Whatever the type of Ontology, every Ontology has
to be represented by a predefined machine
language. The current Ontology representation
languages are of three types:
1 .1 .1 .1 .1 . logic-basedlogic-basedlogic-basedlogic-basedlogic-based (using First Order Logic)
2 .2 .2 .2 .2 . frame-basedframe-basedframe-basedframe-basedframe-based (using Frame Logic) and
3 .3 .3 .3 .3 . web-basedweb-basedweb-basedweb-basedweb-based (using RDF, XML, HTML format).
An Ontology language should ideally incorporate
the advantages of all the three types of languages.
Ontology Development MethodsOntology Development MethodsOntology Development MethodsOntology Development MethodsOntology Development Methods
The basic difference between conventional
Knowledge Organization & Retrieval tools and
ontologies is the ease with which relationships
between keywords, either free-text or controlled can
be specified and the ease with which value addition
can be accomplished through deeper semantics, in
describing digital objects, both conceptually and
relationally. If one wants to develop a domain
ontology, the entire domain needs to be mapped
semantically in the form of a network, to better
understand the linkages between different concepts
in a domain. For instance, in a thesaurus, only three
types of relationships can be expressed: Hierarchical,
Equivalence and Associative. Through domain
ontologies, Associative, Lateral or Related term
relationships can be better expressed. This is
particularly important in developing domain
ontologies in fast growing, interdisciplinary subject
areas, where related term relationships are significant
for search and subsequent retrieval of information.
Thus domain ontologies, tailored to the KO&R needs
of a particular organization or user community, can
be specifically created by ontology developers. The
process of conceptualization is at the core of
developing domain ontologies [6]. Conceptualization
is done through the identification and interlinking
of keywords/descriptors in the selected domain. A
keyword in combination with other keywords
semantically related to it is transformed into a more
comprehensive ‘concept’. Using theoretical
principles of classification, keywords can be
converted into semantically-rich concepts through
generation of one-to-many correspondences or
linkages between them. These associations or
linkages are developed according to user
requirements by the ontology developers. Thus each
domain ontology is unique since it represents a part
of the reality of the universe conceptualized by it.
Concept mapping is an intellectual process wherein
basic knowledge about the domain as well as a
deep understanding about the needs of the user
community is required.
Development of Domain Ontologies at BARCDevelopment of Domain Ontologies at BARCDevelopment of Domain Ontologies at BARCDevelopment of Domain Ontologies at BARCDevelopment of Domain Ontologies at BARC
The multidisciplinary nature of research at BARC is
an ideal platform for developing domain ontologies;
as the current Knowledge Organization tools used
at SIRD are uni-dimensional in their approach to
information.
1. One of the areas selected for developing a domain
ontology was Accelerator Driven Systems (ADS).
Three select areas in ADS were identified: 1, ADS
(general) 2. Accelerator Driven Transmutation
and 3. Energy Amplifier. In consultation
with Senior Scientists of BARC, a prototype was
developed. Fig. 2 shows a schematic
representation of a domain ontology. Following
was the methodology:
a. Identification of appropriate concepts and
keywords on ADS, using content analysis
b. Listing of the selected concepts and keywords
on ADS, which had a threshold level of more
than 2
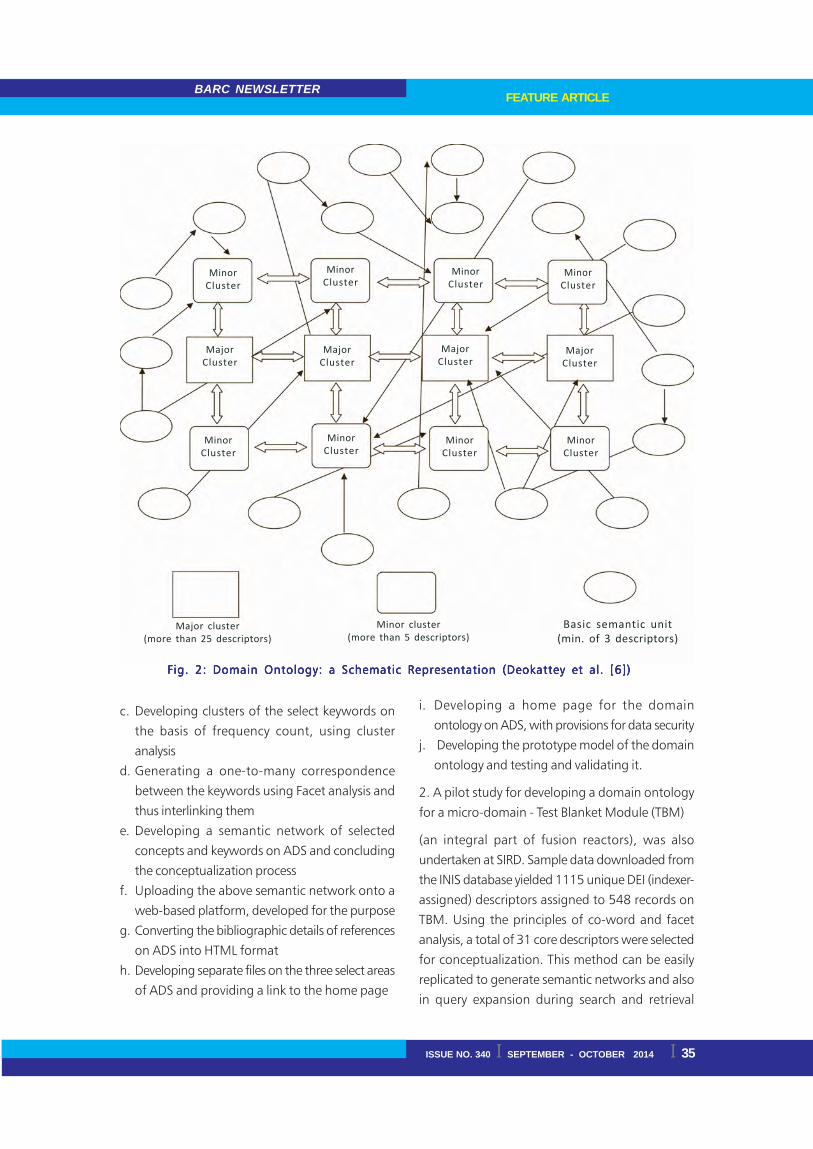
ISSUE NO. 340 I SEPTEMBER - OCTOBER 2014 I 35
BARC NEWSLETTERFEATURE ARTICLE
c. Developing clusters of the select keywords on
the basis of frequency count, using cluster
analysis
d. Generating a one-to-many correspondence
between the keywords using Facet analysis and
thus interlinking them
e. Developing a semantic network of selected
concepts and keywords on ADS and concluding
the conceptualization process
f. Uploading the above semantic network onto a
web-based platform, developed for the purpose
g. Converting the bibliographic details of references
on ADS into HTML format
h. Developing separate files on the three select areas
of ADS and providing a link to the home page
i. Developing a home page for the domain
ontology on ADS, with provisions for data security
j. Developing the prototype model of the domain
ontology and testing and validating it.
2. A pilot study for developing a domain ontology
for a micro-domain - Test Blanket Module (TBM)
(an integral part of fusion reactors), was also
undertaken at SIRD. Sample data downloaded from
the INIS database yielded 1115 unique DEI (indexer-
assigned) descriptors assigned to 548 records on
TBM. Using the principles of co-word and facet
analysis, a total of 31 core descriptors were selected
for conceptualization. This method can be easily
replicated to generate semantic networks and also
in query expansion during search and retrieval
Major cluster(more than 25 descriptors)
Minor cluster(more than 5 descriptors)
Basic semantic unit(min. of 3 descriptors)
MinorCluster
MinorCluster
MinorCluster
MinorCluster
MinorCluster
MinorCluster
MinorCluster
MinorCluster
MajorCluster
MajorCluster
MajorCluster
MajorCluster
Fig. 2:Fig. 2:Fig. 2:Fig. 2:Fig. 2: Domain Ontology: a Schematic Representation (Deokattey et al. [6])Domain Ontology: a Schematic Representation (Deokattey et al. [6])Domain Ontology: a Schematic Representation (Deokattey et al. [6])Domain Ontology: a Schematic Representation (Deokattey et al. [6])Domain Ontology: a Schematic Representation (Deokattey et al. [6])
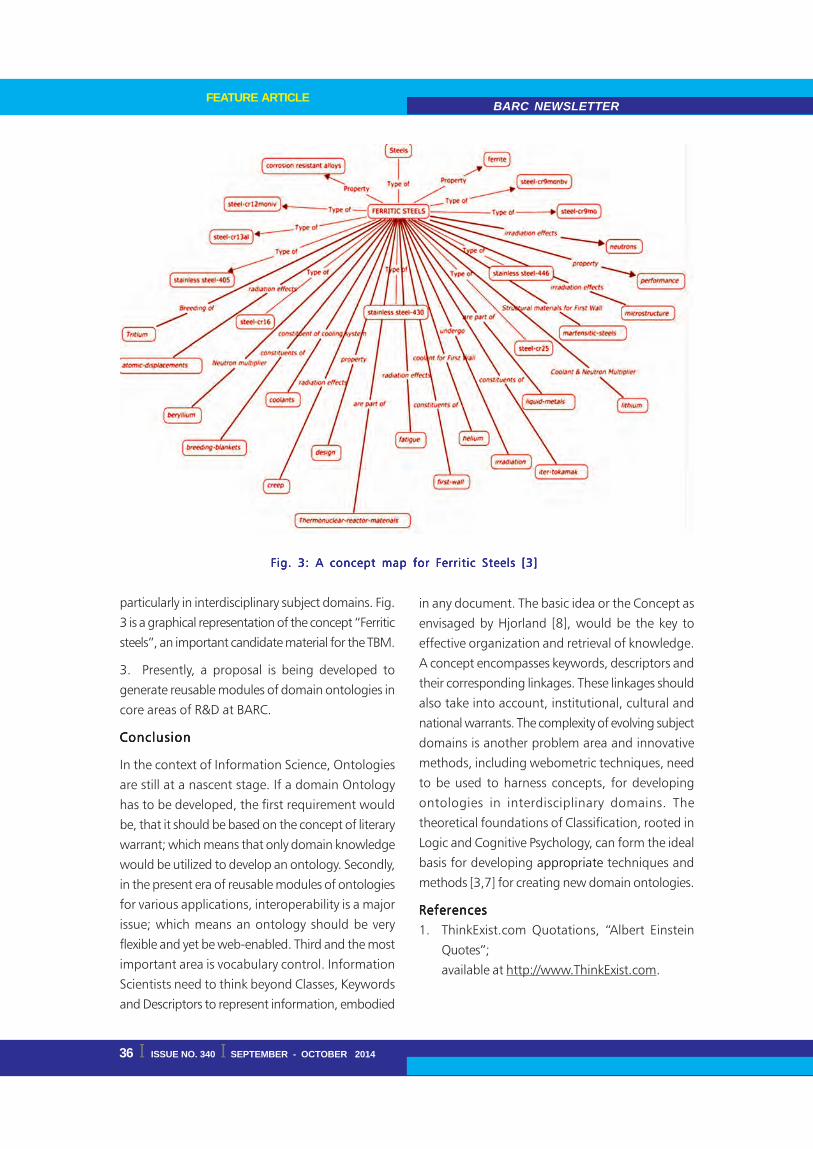
BARC NEWSLETTERFEATURE ARTICLE
36 I ISSUE NO. 340 I SEPTEMBER - OCTOBER 2014
particularly in interdisciplinary subject domains. Fig.
3 is a graphical representation of the concept “Ferritic
steels”, an important candidate material for the TBM.
3. Presently, a proposal is being developed to
generate reusable modules of domain ontologies in
core areas of R&D at BARC.
ConclusionConclusionConclusionConclusionConclusion
In the context of Information Science, Ontologies
are still at a nascent stage. If a domain Ontology
has to be developed, the first requirement would
be, that it should be based on the concept of literary
warrant; which means that only domain knowledge
would be utilized to develop an ontology. Secondly,
in the present era of reusable modules of ontologies
for various applications, interoperability is a major
issue; which means an ontology should be very
flexible and yet be web-enabled. Third and the most
important area is vocabulary control. Information
Scientists need to think beyond Classes, Keywords
and Descriptors to represent information, embodied
in any document. The basic idea or the Concept as
envisaged by Hjorland [8], would be the key to
effective organization and retrieval of knowledge.
A concept encompasses keywords, descriptors and
their corresponding linkages. These linkages should
also take into account, institutional, cultural and
national warrants. The complexity of evolving subject
domains is another problem area and innovative
methods, including webometric techniques, need
to be used to harness concepts, for developing
ontologies in interdisciplinary domains. The
theoretical foundations of Classification, rooted in
Logic and Cognitive Psychology, can form the ideal
basis for developing appropriate techniques and
methods [3,7] for creating new domain ontologies.
ReferencesReferencesReferencesReferencesReferences
1. ThinkExist.com Quotations, “Albert Einstein
Quotes”;
available at http://www.ThinkExist.com.
Fig. 3: A concept map for Ferritic Steels [3]Fig. 3: A concept map for Ferritic Steels [3]Fig. 3: A concept map for Ferritic Steels [3]Fig. 3: A concept map for Ferritic Steels [3]Fig. 3: A concept map for Ferritic Steels [3]
ISSUE NO. 340 I SEPTEMBER - OCTOBER 2014 I 37
BARC NEWSLETTERFEATURE ARTICLE
2. Available at http://www.nonstopenglish.com/
reading/quotations
3. Deokattey, Sangeeta; Dixit, D.K. and
Bhanumurthy, K. Co-word and Facet analysis
as tools for conceptualization in Ontologies; a
preliminary study of a micro-domain. (pp153-
158) In: Neelameghan, A. & Raghavan, K.S.
(Eds.): Categories, Contexts and Relations in
Knowledge Organization: Proceedings of the
12th International ISKO Conference, 6-9 Aug.,
2012, Mysore, India. Wurzburg, Ergon-Verlag,
2012.
4. Gruber, T.R.: Towards principles for the design
of Ontologies used for Knowledge Sharing.
International Journal for Human Computer
Studies, 43, (5/6), 1995, pp.907-928.
5. van Heijst, G., Schreiber, A.T. and Wielinga, B.:
Using explicit Ontologies in KBS Development.
International Journal of Human Computer
Studies, 46, 1998, p.184.
6. Deokattey Sangeeta, Neelameghan A. and Vijai
Kumar: A method for developing a domain
ontology; case study for a multidisciplinary
subject. Knowledge Organization, 37 (3), 2010,
pp.173-184.
7. Deokattey Sangeeta and K. Bhanumurthy.
Domain Visualization Using Concept Maps: A
Case Study. DESIDOC Journal of Library &
Information Technology, 33 (4), July 2013, pp.
295-299.
8. Hjorland, B.: Concept Theory. Journal of the
American Society for Information Science,
60,2009,pp.1519-1536.

BARC NEWSLETTERNEWS & EVENTS
38 I ISSUE NO. 340 I SEPTEMBER - OCTOBER 2014
Theme Meeting on Challenges in FTheme Meeting on Challenges in FTheme Meeting on Challenges in FTheme Meeting on Challenges in FTheme Meeting on Challenges in Fast Reactorast Reactorast Reactorast Reactorast ReactorFFFFFuel Reprocessing (CFRFR-2014)uel Reprocessing (CFRFR-2014)uel Reprocessing (CFRFR-2014)uel Reprocessing (CFRFR-2014)uel Reprocessing (CFRFR-2014)
A theme meeting on “Challenges in fast reactor fuelreprocessing” was organised at AFFF Lecture Hall,BARC, Tarapur on October 18, 2013. The meeting wasorganized by Indian Association of Nuclear Chemistsand Allied Scientists, Tarapur chapter in associationwith Board of Research in Nuclear Sciences (BRNS),Department of Atomic Energy, Government of India.The welcome address was given by Shri. Mohd. Afzal,Head A3F and chairman, IANCAS Tarapur chapter. Themeeting was inaugurated by Dr. K.L. Ramakumar,Director, Radiochemistry and Isotope Group andPresident, IANCAS, Mumbai. In his inaugural speech,Dr. Ramakumar emphasized on the nuclear materialaccounting issues encountered in nuclear process onevery stage. He stressed that handling of large amountof fissile materials and its losses during reprocessingand fuel fabrication should be taken care due to theirstrategic importance. He also emphasized that thetheme of the topic is very relevant in view of thecurrent thrust area for the scientists and engineers asPFBR is on the verge of implementation with MOXfuel shortly. Shri. Arun Kumar, Director, Nuclear FuelsGroup acquainted the audience with the importantaspects and associated challenges in fuel fabricationfor fast reactors. He specially mentioned the MOXsolid waste residuals and the recovery of plutoniumfrom such waste.
The meeting was divided into two sessions. In Session-I, eminent speakers from various units of DAE deliveredtheir lectures. Shri R. Natarajan, Director, Reprocessing
Group, IGCAR, Shri. Arun Kumar, Director, Nuclear FuelsGroup, BARC presented the invited lectures. Shri K.Nagrajan, Associte director,Chemistry Group, IGCAR,Dr. P.N. Pathak, RCD, BARC and Shri. Y. Kulkarni,CS,TNRPO delivered invited talk in second session. Anumber of challenges were discussed by speakers withregard to engineering and physical design, safetyassessment, chemistry challenges encompassing theentire nuclear fuel cycle starting from front and stageof fuel fabrication to back end of fuel reprocessingand waste management aspects.
In the concluding session, a panel discussion wasconducted where Dr. K.L. Ramakumar, Director, RC &IGroup, Shri Arun Kumar, Director, NFG, Shri R.Natarajan, Director, Reprocessing Group, IGCAR, Shri.Y. Kulkarni,CS, TNRPO and Shri. Mohd. Afzal, Head,AFFF and Chairman, IANCAS, Tarapur chapterparticipated. Shri. Arun Kumar focused the importanceof waste management as waste managers are the partof fuel fabrication facilities in upcoming projects. Dr.Natarajan emphasized on remotization of the facilitiesto minimize neutron and radiation dose to theworkers. Shri. Y. Kulkarni addressed the limits ofneutron dose limits. He suggested to provide theplant level facility to test the alternate extractants inevery aspects to be encountered in FBR fuelreprocessing.
Dr. Ramakumar appreciated the efforts of IANCASTarapur Chapter for bringing together the experts
from different centres of DAE for the theme meeting.
DrDrDrDrDr. K.L. Ramakumar. K.L. Ramakumar. K.L. Ramakumar. K.L. Ramakumar. K.L. Ramakumar, Director, Director, Director, Director, Director, Radiochemistry and Isotope Group and President,, Radiochemistry and Isotope Group and President,, Radiochemistry and Isotope Group and President,, Radiochemistry and Isotope Group and President,, Radiochemistry and Isotope Group and President,IANCAS, delivering the inaugural address.IANCAS, delivering the inaugural address.IANCAS, delivering the inaugural address.IANCAS, delivering the inaugural address.IANCAS, delivering the inaugural address.Shri. Arun KShri. Arun KShri. Arun KShri. Arun KShri. Arun Kumarumarumarumarumar, Director, Director, Director, Director, Director, NFG, Dr, NFG, Dr, NFG, Dr, NFG, Dr, NFG, Dr. K.L. Ramakumar. K.L. Ramakumar. K.L. Ramakumar. K.L. Ramakumar. K.L. Ramakumar, Shri Mohd. Afzal, Head, A3F, Shri Mohd. Afzal, Head, A3F, Shri Mohd. Afzal, Head, A3F, Shri Mohd. Afzal, Head, A3F, Shri Mohd. Afzal, Head, A3F*Director*Director*Director*Director*Director, GSO, GSO, GSO, GSO, GSO, Shri Y, Shri Y, Shri Y, Shri Y, Shri Y. K. K. K. K. Kulkarni, CFulkarni, CFulkarni, CFulkarni, CFulkarni, CF, TNRPO at the concluding session., TNRPO at the concluding session., TNRPO at the concluding session., TNRPO at the concluding session., TNRPO at the concluding session.
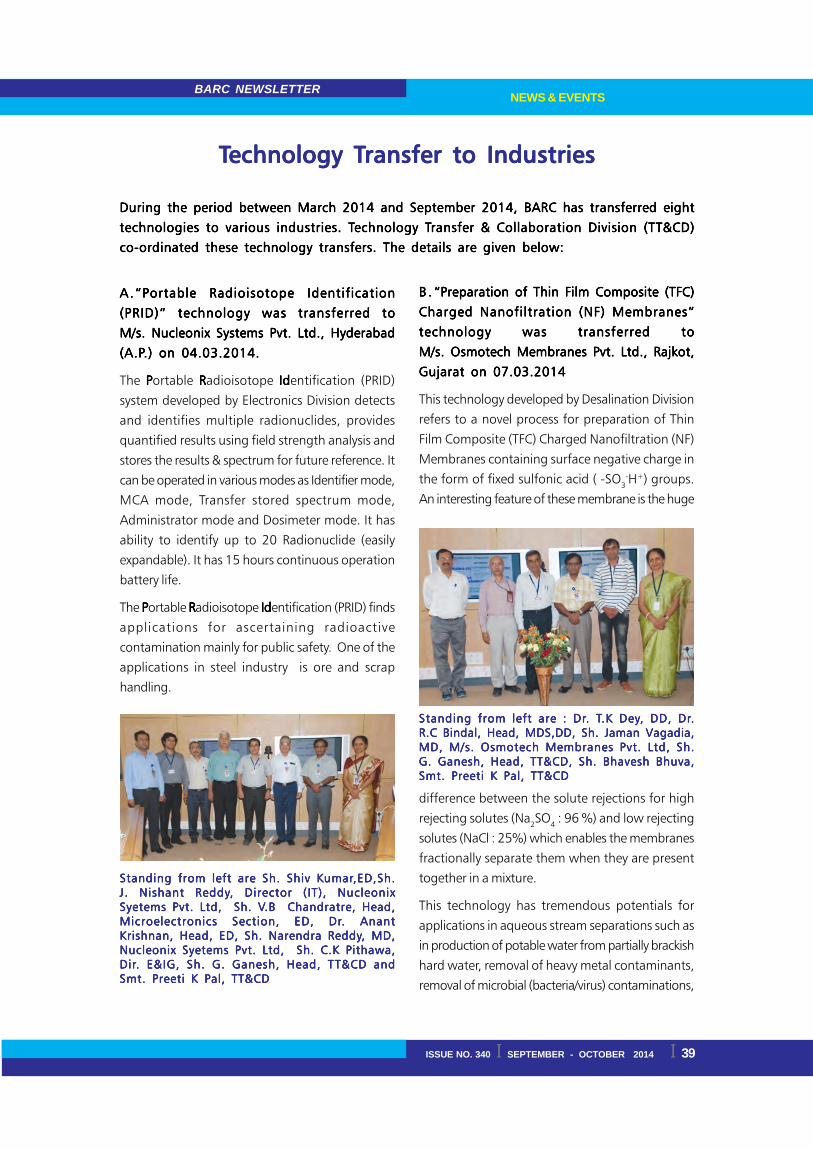
ISSUE NO. 340 I SEPTEMBER - OCTOBER 2014 I 39
BARC NEWSLETTERNEWS & EVENTS
TTTTTechnology Technology Technology Technology Technology Transfer to Industriesransfer to Industriesransfer to Industriesransfer to Industriesransfer to Industries
A.A .A .A .A .“Portable Radioisotope Identification“Portable Radioisotope Identification“Portable Radioisotope Identification“Portable Radioisotope Identification“Portable Radioisotope Identification
(PRID)” technology was transferred to(PRID)” technology was transferred to(PRID)” technology was transferred to(PRID)” technology was transferred to(PRID)” technology was transferred to
M/s. Nucleonix Systems Pvt. Ltd., HyderabadM/s. Nucleonix Systems Pvt. Ltd., HyderabadM/s. Nucleonix Systems Pvt. Ltd., HyderabadM/s. Nucleonix Systems Pvt. Ltd., HyderabadM/s. Nucleonix Systems Pvt. Ltd., Hyderabad
(A(A(A(A(A.P.P.P.P.P.) on 04.03.2014..) on 04.03.2014..) on 04.03.2014..) on 04.03.2014..) on 04.03.2014.
The PPPPPortable RRRRRadioisotope IdIdIdIdIdentification (PRID)
system developed by Electronics Division detects
and identifies multiple radionuclides, provides
quantified results using field strength analysis and
stores the results & spectrum for future reference. It
can be operated in various modes as Identifier mode,
MCA mode, Transfer stored spectrum mode,
Administrator mode and Dosimeter mode. It has
ability to identify up to 20 Radionuclide (easily
expandable). It has 15 hours continuous operation
battery life.
The PPPPPortable RRRRRadioisotope IdIdIdIdIdentification (PRID) finds
applications for ascertaining radioactive
contamination mainly for public safety. One of the
applications in steel industry is ore and scrap
handling.
B .B .B .B .B . “Preparation of Thin Film Composite (TFC)“Preparation of Thin Film Composite (TFC)“Preparation of Thin Film Composite (TFC)“Preparation of Thin Film Composite (TFC)“Preparation of Thin Film Composite (TFC)
Charged Nanofiltration (NF) Membranes”Charged Nanofiltration (NF) Membranes”Charged Nanofiltration (NF) Membranes”Charged Nanofiltration (NF) Membranes”Charged Nanofiltration (NF) Membranes”
technology was transferred totechnology was transferred totechnology was transferred totechnology was transferred totechnology was transferred to
M/s. Osmotech Membranes Pvt. Ltd., Rajkot,M/s. Osmotech Membranes Pvt. Ltd., Rajkot,M/s. Osmotech Membranes Pvt. Ltd., Rajkot,M/s. Osmotech Membranes Pvt. Ltd., Rajkot,M/s. Osmotech Membranes Pvt. Ltd., Rajkot,
Gujarat on 07.03.2014Gujarat on 07.03.2014Gujarat on 07.03.2014Gujarat on 07.03.2014Gujarat on 07.03.2014
This technology developed by Desalination Division
refers to a novel process for preparation of Thin
Film Composite (TFC) Charged Nanofiltration (NF)
Membranes containing surface negative charge in
the form of fixed sulfonic acid ( -SO3-H+) groups.
An interesting feature of these membrane is the huge
difference between the solute rejections for high
rejecting solutes (Na2SO4 : 96 %) and low rejecting
solutes (NaCl : 25%) which enables the membranes
fractionally separate them when they are present
together in a mixture.
This technology has tremendous potentials for
applications in aqueous stream separations such as
in production of potable water from partially brackish
hard water, removal of heavy metal contaminants,
removal of microbial (bacteria/virus) contaminations,
Standing from left are Sh. Shiv KStanding from left are Sh. Shiv KStanding from left are Sh. Shiv KStanding from left are Sh. Shiv KStanding from left are Sh. Shiv Kumarumarumarumarumar,ED,Sh.,ED,Sh.,ED,Sh.,ED,Sh.,ED,Sh.J. Nishant ReddyJ. Nishant ReddyJ. Nishant ReddyJ. Nishant ReddyJ. Nishant Reddy, Director (IT), Nucleonix, Director (IT), Nucleonix, Director (IT), Nucleonix, Director (IT), Nucleonix, Director (IT), NucleonixSyetems Pvt. Ltd, Sh. VSyetems Pvt. Ltd, Sh. VSyetems Pvt. Ltd, Sh. VSyetems Pvt. Ltd, Sh. VSyetems Pvt. Ltd, Sh. V.B Chandratre, Head,.B Chandratre, Head,.B Chandratre, Head,.B Chandratre, Head,.B Chandratre, Head,Microelectronics Section, ED, DrMicroelectronics Section, ED, DrMicroelectronics Section, ED, DrMicroelectronics Section, ED, DrMicroelectronics Section, ED, Dr. Anant. Anant. Anant. Anant. AnantKrishnan, Head, ED, Sh. Narendra ReddyKrishnan, Head, ED, Sh. Narendra ReddyKrishnan, Head, ED, Sh. Narendra ReddyKrishnan, Head, ED, Sh. Narendra ReddyKrishnan, Head, ED, Sh. Narendra Reddy, MD,, MD,, MD,, MD,, MD,Nucleonix Syetems Pvt. Ltd, Sh. C.K Pithawa,Nucleonix Syetems Pvt. Ltd, Sh. C.K Pithawa,Nucleonix Syetems Pvt. Ltd, Sh. C.K Pithawa,Nucleonix Syetems Pvt. Ltd, Sh. C.K Pithawa,Nucleonix Syetems Pvt. Ltd, Sh. C.K Pithawa,DirDirDirDirDir. E&IG, Sh. G. Ganesh, Head, T. E&IG, Sh. G. Ganesh, Head, T. E&IG, Sh. G. Ganesh, Head, T. E&IG, Sh. G. Ganesh, Head, T. E&IG, Sh. G. Ganesh, Head, TT&CD andT&CD andT&CD andT&CD andT&CD andSmt. Preeti K Pal, TT&CDSmt. Preeti K Pal, TT&CDSmt. Preeti K Pal, TT&CDSmt. Preeti K Pal, TT&CDSmt. Preeti K Pal, TT&CD
Standing from left are : DrStanding from left are : DrStanding from left are : DrStanding from left are : DrStanding from left are : Dr. T. T. T. T. T.K Dey.K Dey.K Dey.K Dey.K Dey, DD, Dr, DD, Dr, DD, Dr, DD, Dr, DD, Dr.....R.C Bindal, Head, MDS,DD, Sh. Jaman Vagadia,R.C Bindal, Head, MDS,DD, Sh. Jaman Vagadia,R.C Bindal, Head, MDS,DD, Sh. Jaman Vagadia,R.C Bindal, Head, MDS,DD, Sh. Jaman Vagadia,R.C Bindal, Head, MDS,DD, Sh. Jaman Vagadia,MD, M/s. Osmotech Membranes Pvt. Ltd, Sh.MD, M/s. Osmotech Membranes Pvt. Ltd, Sh.MD, M/s. Osmotech Membranes Pvt. Ltd, Sh.MD, M/s. Osmotech Membranes Pvt. Ltd, Sh.MD, M/s. Osmotech Membranes Pvt. Ltd, Sh.G. Ganesh, Head, TT&CD, Sh. Bhavesh Bhuva,G. Ganesh, Head, TT&CD, Sh. Bhavesh Bhuva,G. Ganesh, Head, TT&CD, Sh. Bhavesh Bhuva,G. Ganesh, Head, TT&CD, Sh. Bhavesh Bhuva,G. Ganesh, Head, TT&CD, Sh. Bhavesh Bhuva,Smt. Preeti K Pal, TT&CDSmt. Preeti K Pal, TT&CDSmt. Preeti K Pal, TT&CDSmt. Preeti K Pal, TT&CDSmt. Preeti K Pal, TT&CD
During the period between March 2014 and September 2014, BARC has transferred eightDuring the period between March 2014 and September 2014, BARC has transferred eightDuring the period between March 2014 and September 2014, BARC has transferred eightDuring the period between March 2014 and September 2014, BARC has transferred eightDuring the period between March 2014 and September 2014, BARC has transferred eight
technologies to various industries. Ttechnologies to various industries. Ttechnologies to various industries. Ttechnologies to various industries. Ttechnologies to various industries. Technology Technology Technology Technology Technology Transfer & Collaboration Division (Transfer & Collaboration Division (Transfer & Collaboration Division (Transfer & Collaboration Division (Transfer & Collaboration Division (TT&CD)T&CD)T&CD)T&CD)T&CD)
co-ordinated these technology transfers. The details are given below:co-ordinated these technology transfers. The details are given below:co-ordinated these technology transfers. The details are given below:co-ordinated these technology transfers. The details are given below:co-ordinated these technology transfers. The details are given below:

BARC NEWSLETTERNEWS & EVENTS
40 I ISSUE NO. 340 I SEPTEMBER - OCTOBER 2014
pretreatment of saline water for desalination
processes like RO and MSF, and a host of other
areas like pharmaceuticals and bio technological
industries, downstream processing, food and
beverage industries, dairy industry, waste water
treatment.
C .C .C .C .C .“Nanocomposite Ultrafiltration Membrane“Nanocomposite Ultrafiltration Membrane“Nanocomposite Ultrafiltration Membrane“Nanocomposite Ultrafiltration Membrane“Nanocomposite Ultrafiltration Membrane
Device for Domestic Drinking WDevice for Domestic Drinking WDevice for Domestic Drinking WDevice for Domestic Drinking WDevice for Domestic Drinking Water water water water water w.r.r.r.r.r.t..t..t..t..t.
Arsenic, Iron & Microbial ContaminationsArsenic, Iron & Microbial ContaminationsArsenic, Iron & Microbial ContaminationsArsenic, Iron & Microbial ContaminationsArsenic, Iron & Microbial Contaminations”””””
TTTTTechnology was transferred echnology was transferred echnology was transferred echnology was transferred echnology was transferred to two partiesto two partiesto two partiesto two partiesto two parties
(1) M/s. Rupali Industries, Mumbai on(1) M/s. Rupali Industries, Mumbai on(1) M/s. Rupali Industries, Mumbai on(1) M/s. Rupali Industries, Mumbai on(1) M/s. Rupali Industries, Mumbai on
May 9, 2014 and (2) M/s. SONADKA,May 9, 2014 and (2) M/s. SONADKA,May 9, 2014 and (2) M/s. SONADKA,May 9, 2014 and (2) M/s. SONADKA,May 9, 2014 and (2) M/s. SONADKA,
Mumbai on June 16,2014.Mumbai on June 16,2014.Mumbai on June 16,2014.Mumbai on June 16,2014.Mumbai on June 16,2014.
Desalination Division (DD) has developed a
methodology to produce a domestic water
purification device which is made of polysulfone
based nanocomposite ultrafiltration membrane in
cylindrical configuration. This device can be effective
for removal of microbial contaminations and
decontamination of arsenic and iron through
chemical addition without the need of any electricity
and overhead water tank, and hence can be used
even in slums and rural areas of the country. The
contamination level is reduced below the permissible
limits as specified by IS 10500 for drinking water
standard.
D .D .D .D .D .“Mass Multiplication Medium for“Mass Multiplication Medium for“Mass Multiplication Medium for“Mass Multiplication Medium for“Mass Multiplication Medium for
Biofungicide TBiofungicide TBiofungicide TBiofungicide TBiofungicide Trichoderma Spp.” Trichoderma Spp.” Trichoderma Spp.” Trichoderma Spp.” Trichoderma Spp.” Technologyechnologyechnologyechnologyechnology
was transferred to M/s Ajay Biotech (I) Ltd.,was transferred to M/s Ajay Biotech (I) Ltd.,was transferred to M/s Ajay Biotech (I) Ltd.,was transferred to M/s Ajay Biotech (I) Ltd.,was transferred to M/s Ajay Biotech (I) Ltd.,
Pune on 20.5.2014Pune on 20.5.2014Pune on 20.5.2014Pune on 20.5.2014Pune on 20.5.2014
This technology has been developed by NA&BTD.
The field applications of Trichoderma spp.
require mass multiplication which can be
done using solid as well as liquid state
fermentation. In the industrialized nations,
liquid fermentation is extensively used for
multiplication of Trichoderma spp. for
commercial formulation. A low cost mass
multiplication medium for faster growth
of Trichoderma spp. is developed. This
material supports better growth of
biofungicide compared to existing methods and
addition of synthetic sticker is not required while
making its formulation. The process is cheaper than
the existing methods and is based on the material
which is inexpensive and available locally. Hence,
in true sense this technology generates wealth from
waste.
E .E .E .E .E . “Process for Retaining Pericarp Colour and“Process for Retaining Pericarp Colour and“Process for Retaining Pericarp Colour and“Process for Retaining Pericarp Colour and“Process for Retaining Pericarp Colour and
Extending Shelf Life of Litchi” technologyExtending Shelf Life of Litchi” technologyExtending Shelf Life of Litchi” technologyExtending Shelf Life of Litchi” technologyExtending Shelf Life of Litchi” technology
was transferred to M/s SCRIMAD,was transferred to M/s SCRIMAD,was transferred to M/s SCRIMAD,was transferred to M/s SCRIMAD,was transferred to M/s SCRIMAD,
MadagascarMadagascarMadagascarMadagascarMadagascar, on 03.06.2014., on 03.06.2014., on 03.06.2014., on 03.06.2014., on 03.06.2014.
Litchi is a highly perishable commodity which
remains fresh only for 2-3 days after harvest. India
produces nearly 500,000 tons of litchi second only
to China. Because of poor shelf life of litchi it cannot
be transported to distant markets in India, also
cannot be exported due to shelf life and quarantine
barriers. Food Technology Division, BARC has
developed a technology based on dip treatment
using GRAS (Generally Recognized As Safe)
chemicals which extends the shelf life of litchi fruit
up to 60 days while maintained at 40 C retaining its
appealing pinkish-red color.
M/s SCRIMAD is a Madagascar based international
trading company operating since 1998 in the
Madagascan litchi industry. It is a member of the
Groupement des exportateurs de Litchi de
Madagascar (Group of Exporters of Madagascan
Lychee), and markets the brand “MADPREMIUM
Lychee”. During the transfer of the technology, Dr.
Sekhar Basu, Director, BARC, discussed about the
prospects and benefits of this technology for litchi
Dr S Gautam, FTD, Mr S Rakotondraohva, M/s SCRIMAD,Dr S Gautam, FTD, Mr S Rakotondraohva, M/s SCRIMAD,Dr S Gautam, FTD, Mr S Rakotondraohva, M/s SCRIMAD,Dr S Gautam, FTD, Mr S Rakotondraohva, M/s SCRIMAD,Dr S Gautam, FTD, Mr S Rakotondraohva, M/s SCRIMAD,Dr N Khalap, TDr N Khalap, TDr N Khalap, TDr N Khalap, TDr N Khalap, TT&CD, Dr S K Apte, DirT&CD, Dr S K Apte, DirT&CD, Dr S K Apte, DirT&CD, Dr S K Apte, DirT&CD, Dr S K Apte, Dir, B, B, B, B, BSG, Dr ArunSG, Dr ArunSG, Dr ArunSG, Dr ArunSG, Dr ArunSharma, Head, FTD and Shri G Ganesh, Head, TT&CDSharma, Head, FTD and Shri G Ganesh, Head, TT&CDSharma, Head, FTD and Shri G Ganesh, Head, TT&CDSharma, Head, FTD and Shri G Ganesh, Head, TT&CDSharma, Head, FTD and Shri G Ganesh, Head, TT&CD

ISSUE NO. 340 I SEPTEMBER - OCTOBER 2014 I 41
BARC NEWSLETTERNEWS & EVENTS
growers of Madagascar with Mr.Simon
Rakotondrahova, GM, M/s SCRIMAD. Dr.S.K. Apte,
Director, Bioscience Group; Dr. A. K. Sharma, Head,
FTD, and Shri G Ganesh, Head, Technology Transfer
& Collaboration Division, too were present during
this technology transfer. Later, the technology was
demonstrated to Mr.Simon Rakotondrahova by
processing the fresh fruit at FTD, BARC. He was
also given sample fruits which were processed about
10 days back for taste and he was fully satisfied.
FFFFF..... “““““Auto TLD Badge Reader” technology wasAuto TLD Badge Reader” technology wasAuto TLD Badge Reader” technology wasAuto TLD Badge Reader” technology wasAuto TLD Badge Reader” technology was
transferred to M/s. Intech Dosimeters Pvt.transferred to M/s. Intech Dosimeters Pvt.transferred to M/s. Intech Dosimeters Pvt.transferred to M/s. Intech Dosimeters Pvt.transferred to M/s. Intech Dosimeters Pvt.
Ltd., New Delhi on 22/08/2014.Ltd., New Delhi on 22/08/2014.Ltd., New Delhi on 22/08/2014.Ltd., New Delhi on 22/08/2014.Ltd., New Delhi on 22/08/2014.
PC based automatic TLD badge reader (Auto-TLD
BR) has been developed by RP&AD to ensure health
and safety of persons working in radiation
environment by monitoring the radiation dose
received by them ( as per the TLD badges worn by
them) and maintain a record. The Auto-TLD BR
(Model TLDBR 7B) is capable of automatically
Dr S Basu, DirectorDr S Basu, DirectorDr S Basu, DirectorDr S Basu, DirectorDr S Basu, Director, BARC, addressing the, BARC, addressing the, BARC, addressing the, BARC, addressing the, BARC, addressing thegroup during transfer of technology to M/sgroup during transfer of technology to M/sgroup during transfer of technology to M/sgroup during transfer of technology to M/sgroup during transfer of technology to M/sSCRIMAD.SCRIMAD.SCRIMAD.SCRIMAD.SCRIMAD.
evaluating 50 TLD badges. It has built-in diagnostic
software & safeguards against malfunctioning. This
badge reader finds its application in the Personnel
Monitoring of radiation workers in Nuclear power
stations, Isotope laboratories, Industrial radiography
installations, diagnostic & therapeutic radiology
centres, etc.
G .G .G .G .G .“Nitrogen Oxides releasing wound“Nitrogen Oxides releasing wound“Nitrogen Oxides releasing wound“Nitrogen Oxides releasing wound“Nitrogen Oxides releasing wound
dressing” technology was transferred todressing” technology was transferred todressing” technology was transferred todressing” technology was transferred todressing” technology was transferred to
M/s Cologenesis Healthcare Pvt. Ltd., SalemM/s Cologenesis Healthcare Pvt. Ltd., SalemM/s Cologenesis Healthcare Pvt. Ltd., SalemM/s Cologenesis Healthcare Pvt. Ltd., SalemM/s Cologenesis Healthcare Pvt. Ltd., Salem
(T(T(T(T(T.N.) on September 15.N.) on September 15.N.) on September 15.N.) on September 15.N.) on September 15ththththth, 2014., 2014., 2014., 2014., 2014.
The technology of “Nitrogen Oxides releasing wound
dressing” has been developed by Water and Steam
Chemistry Division, BARC Facilities, Kalpakkam
under technology incubation MoU with M/s
Cologenesis Healthcare Pvt. Ltd., Salem (T.N.). The
dressing works on the principle of release of gaseous
nitrogen oxides (including nitric oxide) from a
collagen matrix containing citric acid and sodium
nitrite. The hydrogel based dressing possesses the
antimicrobial properties of acidified sodium nitrite
and the properties of collagen such as attraction of
keratinocytes and fibroblasts to the wound area that
encourages angiogenesis and re-epithelialization. The
cotton gauze-collagen hydrogel combination is
Standing from right are :Sh. R.N Khanderao,,Standing from right are :Sh. R.N Khanderao,,Standing from right are :Sh. R.N Khanderao,,Standing from right are :Sh. R.N Khanderao,,Standing from right are :Sh. R.N Khanderao,,Dr Ratna Pradeep, Head,TLD PMSS, RP&AD, Sh.Dr Ratna Pradeep, Head,TLD PMSS, RP&AD, Sh.Dr Ratna Pradeep, Head,TLD PMSS, RP&AD, Sh.Dr Ratna Pradeep, Head,TLD PMSS, RP&AD, Sh.Dr Ratna Pradeep, Head,TLD PMSS, RP&AD, Sh.VVVVV.N Kabadi, Director.N Kabadi, Director.N Kabadi, Director.N Kabadi, Director.N Kabadi, Director, M/s. Intech Dosimeters, M/s. Intech Dosimeters, M/s. Intech Dosimeters, M/s. Intech Dosimeters, M/s. Intech DosimetersPvt. Ltd., Sh. G.Ganesh, Head, TPvt. Ltd., Sh. G.Ganesh, Head, TPvt. Ltd., Sh. G.Ganesh, Head, TPvt. Ltd., Sh. G.Ganesh, Head, TPvt. Ltd., Sh. G.Ganesh, Head, TT&CD, DrT&CD, DrT&CD, DrT&CD, DrT&CD, Dr. D.A. D.A. D.A. D.A. D.A.R.R.R.R.RBabu, Head, RP&AD, DrBabu, Head, RP&AD, DrBabu, Head, RP&AD, DrBabu, Head, RP&AD, DrBabu, Head, RP&AD, Dr. M.S K. M.S K. M.S K. M.S K. M.S Kulkarni, Head,ulkarni, Head,ulkarni, Head,ulkarni, Head,ulkarni, Head,RPIS, RP&AD and Smt. Preeti K Pal, TT&CDRPIS, RP&AD and Smt. Preeti K Pal, TT&CDRPIS, RP&AD and Smt. Preeti K Pal, TT&CDRPIS, RP&AD and Smt. Preeti K Pal, TT&CDRPIS, RP&AD and Smt. Preeti K Pal, TT&CD
Photograph after signing the agreement withPhotograph after signing the agreement withPhotograph after signing the agreement withPhotograph after signing the agreement withPhotograph after signing the agreement withM/s Cologenesis Healthcare Pvt. Ltd., SalemM/s Cologenesis Healthcare Pvt. Ltd., SalemM/s Cologenesis Healthcare Pvt. Ltd., SalemM/s Cologenesis Healthcare Pvt. Ltd., SalemM/s Cologenesis Healthcare Pvt. Ltd., Salem(T(T(T(T(T.N.), seen from left to right, Dr.N.), seen from left to right, Dr.N.), seen from left to right, Dr.N.), seen from left to right, Dr.N.), seen from left to right, Dr. B. N. Jagtap,. B. N. Jagtap,. B. N. Jagtap,. B. N. Jagtap,. B. N. Jagtap,DirectorDirectorDirectorDirectorDirector, ChG, Shri R. Krishna K, ChG, Shri R. Krishna K, ChG, Shri R. Krishna K, ChG, Shri R. Krishna K, ChG, Shri R. Krishna Kumarumarumarumarumar, MD, M/, MD, M/, MD, M/, MD, M/, MD, M/s Cologenesis Healthcare Pvt. Ltd., Shri G.s Cologenesis Healthcare Pvt. Ltd., Shri G.s Cologenesis Healthcare Pvt. Ltd., Shri G.s Cologenesis Healthcare Pvt. Ltd., Shri G.s Cologenesis Healthcare Pvt. Ltd., Shri G.Ganesh, Head, TGanesh, Head, TGanesh, Head, TGanesh, Head, TGanesh, Head, TT&CD, DrT&CD, DrT&CD, DrT&CD, DrT&CD, Dr. V. V. V. V. V. P. P. P. P. P. V. V. V. V. Venugopalan,enugopalan,enugopalan,enugopalan,enugopalan,Head, BBPS, WSCD & Shri VHead, BBPS, WSCD & Shri VHead, BBPS, WSCD & Shri VHead, BBPS, WSCD & Shri VHead, BBPS, WSCD & Shri V. K. Upadhyay. K. Upadhyay. K. Upadhyay. K. Upadhyay. K. Upadhyay,,,,,TT&CD.TT&CD.TT&CD.TT&CD.TT&CD.
BARC NEWSLETTERNEWS & EVENTS
42 I ISSUE NO. 340 I SEPTEMBER - OCTOBER 2014
cross-linked by glutaraldehyde and dried by freeze-
drying. At the time of application, the freeze-dried
dressing is wetted by sodium nitrite solution.
The nitrogen oxides releasing wound dressing is
useful for treatment of chronic infected wounds and
non- healing wounds (diabetic foot, pressure ulcer,
venous stasis wound etc). The dressing works by
decreasing the infection, increasing the
microvasculirization and granulation thereby aiding
faster wound healing. The dressing is also suitable
for application which requires preparation of wound
bed for acceptance of split skin graft based surgery.
H .H .H .H .H .Nisargruna Biogas TNisargruna Biogas TNisargruna Biogas TNisargruna Biogas TNisargruna Biogas Technology based onechnology based onechnology based onechnology based onechnology based on
biodegradable waste biodegradable waste biodegradable waste biodegradable waste biodegradable waste has been developed by
NA&BTD. The plant processes biodegradable waste
into biogas and weed free manure. It was transferred
to the following nine parties :-
• M/s Venson Green Solutions Pvt. Ltd.,
Mysore on 11.4.2014
• M/s Innovative Environmental Technologies
Pvt. Ltd., Pune on 21.4.2014
• M/s. North East Green Tech Pvt. Ltd., Assam
on 29.5.2014
• M/s. Green & Clean Solutions (P) Ltd.,
Bangalore on 25.6.2014
• M/s. Synod Bioscience Pvt. Ltd., Cochin on
21.7.2014
• M/s. Engynova Technologies, Navi Mumbai
on 31.7.2014
• M/s. VIMI Associates, Latur on 18.8.2014
• M/s. PCP Chemicals Pvt. Ltd., Thane on
8.9.2014
• M/s. Ajna Advisors Pvt. Ltd., Mumbai on
24.9.2014

ISSUE NO. 340 I SEPTEMBER - OCTOBER 2014 I 43
BARC NEWSLETTERNEWS & EVENTS
Honour for BARC
The Plant Mutat ion Breeding Team, Nuclear Agriculture & Biotechnology
Division, BARC received the “Achievement Award” inst ituted by the Joint FAO/
IAEA Programme on Nuclear Techniques in Food and Agriculture. This award was
received by Dr. Sekhar Basu, Director, BARC in Vienna, in September 2014 and
was given in appreciat ion and recognit ion of the contribut ion to food security and
sustainable agricultural development through Plant Mutat ion Breeding
Dr. Sekhar Basu, Director, BARC receiving the Achievement Award fromMr. Aldo Malawasi, Deputy Director General of the IAEA Dept. of NuclearApplications (DDG-NA) and Mr. Deepak Ojha, Counsellor, Atomic EnergyPermanent Mission of India

BARC NEWSLETTERNEWS & EVENTS
44 I ISSUE NO. 340 I SEPTEMBER - OCTOBER 2014
BARC Scientists HonouredBARC Scientists HonouredBARC Scientists HonouredBARC Scientists HonouredBARC Scientists Honoured
Name of the ScientistName of the ScientistName of the ScientistName of the ScientistName of the Scientist : S.M. YS.M. YS.M. YS.M. YS.M. Yusufusufusufusufusuf
AffiliationAffiliationAffiliationAffiliationAffiliation : Solid State Physics Division
Award/HonourAward/HonourAward/HonourAward/HonourAward/Honour : Elected as a Fellow of the National Academy of Sciences,
India in the year 2014
Name of the ScientistsName of the ScientistsName of the ScientistsName of the ScientistsName of the Scientists : N.S.Rawat, M.S.Kulkarni,D.R.Mishra,N.S.Rawat, M.S.Kulkarni,D.R.Mishra,N.S.Rawat, M.S.Kulkarni,D.R.Mishra,N.S.Rawat, M.S.Kulkarni,D.R.Mishra,N.S.Rawat, M.S.Kulkarni,D.R.Mishra,
B.C.Bhatt and D.A.R.BabuB.C.Bhatt and D.A.R.BabuB.C.Bhatt and D.A.R.BabuB.C.Bhatt and D.A.R.BabuB.C.Bhatt and D.A.R.Babu
AffiliationAffiliationAffiliationAffiliationAffiliation : Radiological Physics & Advisory Division
Award/HonourAward/HonourAward/HonourAward/HonourAward/Honour : Best poster paper award
Title of the PaperTitle of the PaperTitle of the PaperTitle of the PaperTitle of the Paper ::::: An attempt to correlate shift in TL peak with heating
rate and black-body radiation
Presented atPresented atPresented atPresented atPresented at ::::: 31th National Conference on Advances in Radiation
Measurement Systems and Techniques; organized by
the Indian Association for Radiation Protection
(IARP) and held at BARC, Mumbai during
March 19-21, 2014.

B A R C N E W S L E T T E R
I ISSUE NO. 340 I SEPTEMBER - OCTOBER 2014
Edited & Published by:Scientific Information Resource Division,
Bhabha Atomic Research Centre, Trombay, Mumbai 400 085, IndiaBARC Newsletter is also available at URL:http://www.barc.gov.in
Central Complex, BARC
Related Documents