Dashboard Best Practices 2016 v.2

Welcome message from author
This document is posted to help you gain knowledge. Please leave a comment to let me know what you think about it! Share it to your friends and learn new things together.
Transcript

Dashboard Best Practices 2016 v.2


What do business-users want?


Why Dashboards?

2 types of BI users

Dashboards for the BI Consumer

1 - Purpose

Who is the dashboard for?

What data do you need?

4 - Functionality

How will the dashboard be used?

Planning your dashboard

Make dashboards an engaging experience
Examine data further with
TooltipsDrill BrushingFiltersDate SliderSeries SelectionMap Zoom & Layers

2 - Summarize

Single subject area per tabDon't overwhelm
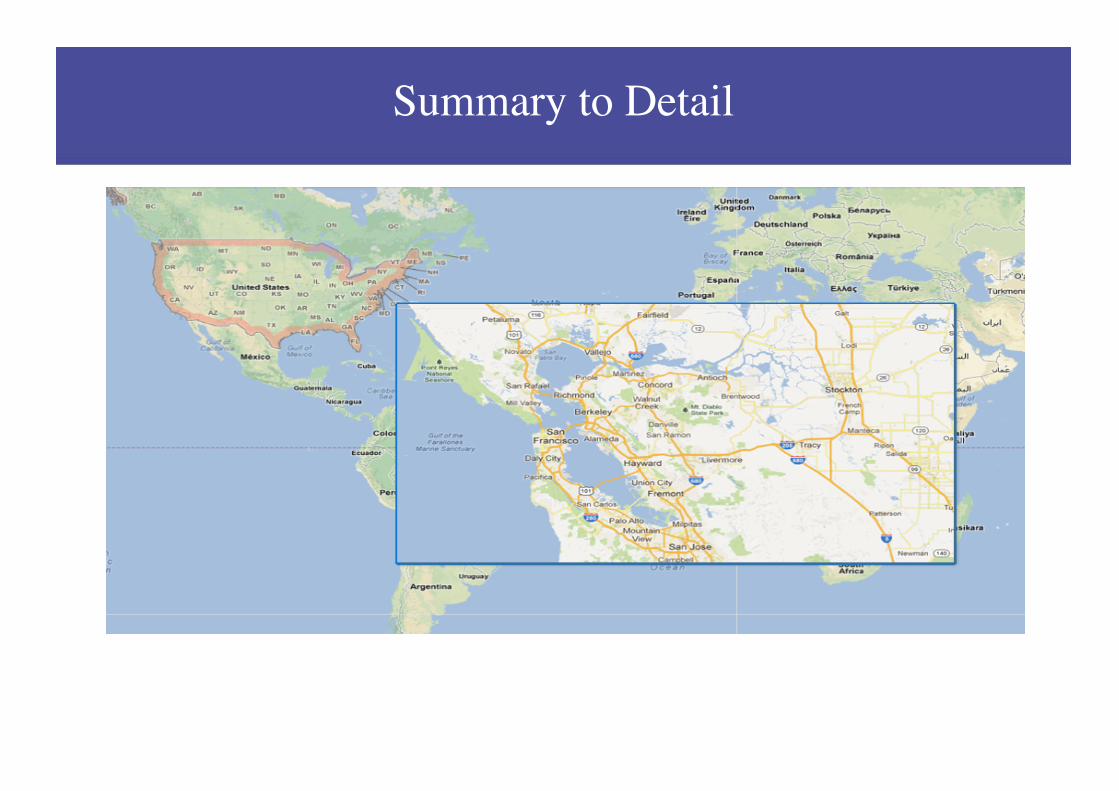
Summary to Detail
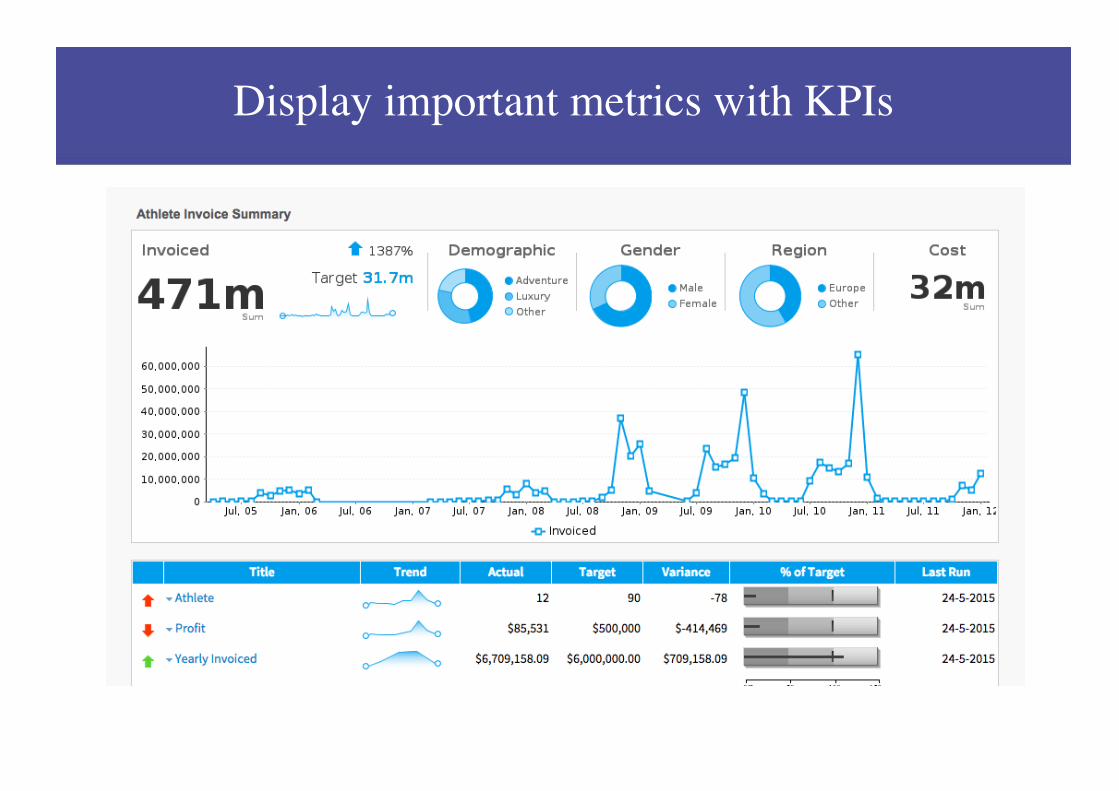
Display important metrics with KPIs

3 - Relevance

Is it relevant to your audience

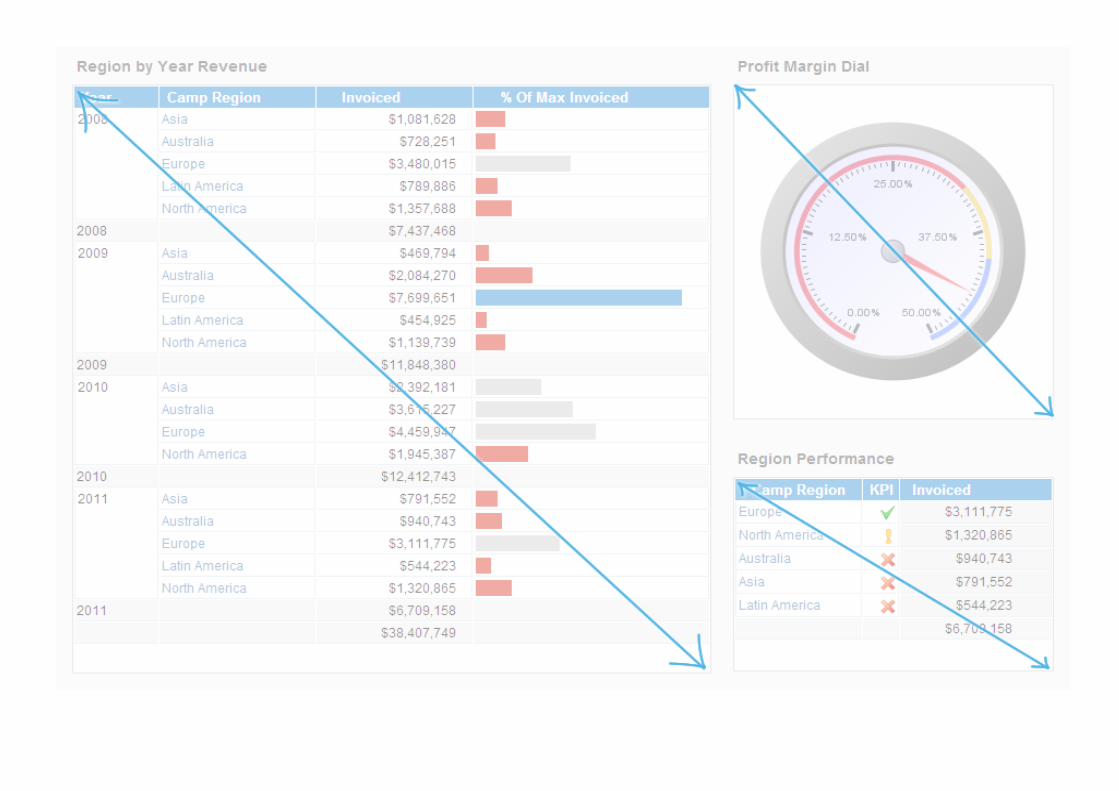
5 - Visual Fit

Right chart to tell your story

6 - Layout

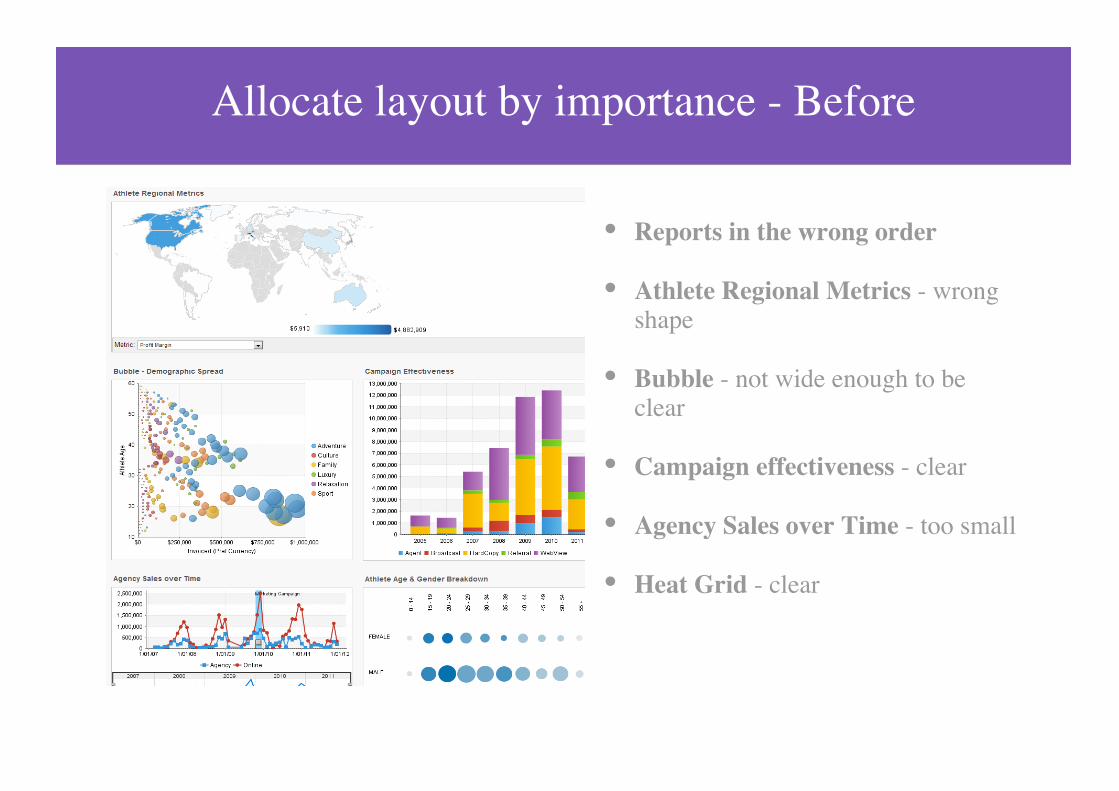
Allocate layout by importance - Before
Reports in the wrong order
Athlete Regional Metrics - wrong shape
Bubble - not wide enough to be clear
Campaign effectiveness - clear
Agency Sales over Time - too small
Heat Grid - clear

Allocate layout by importance - After
Athlete Regional Metrics - correct shape & size
Bubble - double width now, easier to read
Campaign Effectiveness - slightly more space
Agency Sales over Time - double width, easier to read
Heat Grid - clear

7 - Clarity
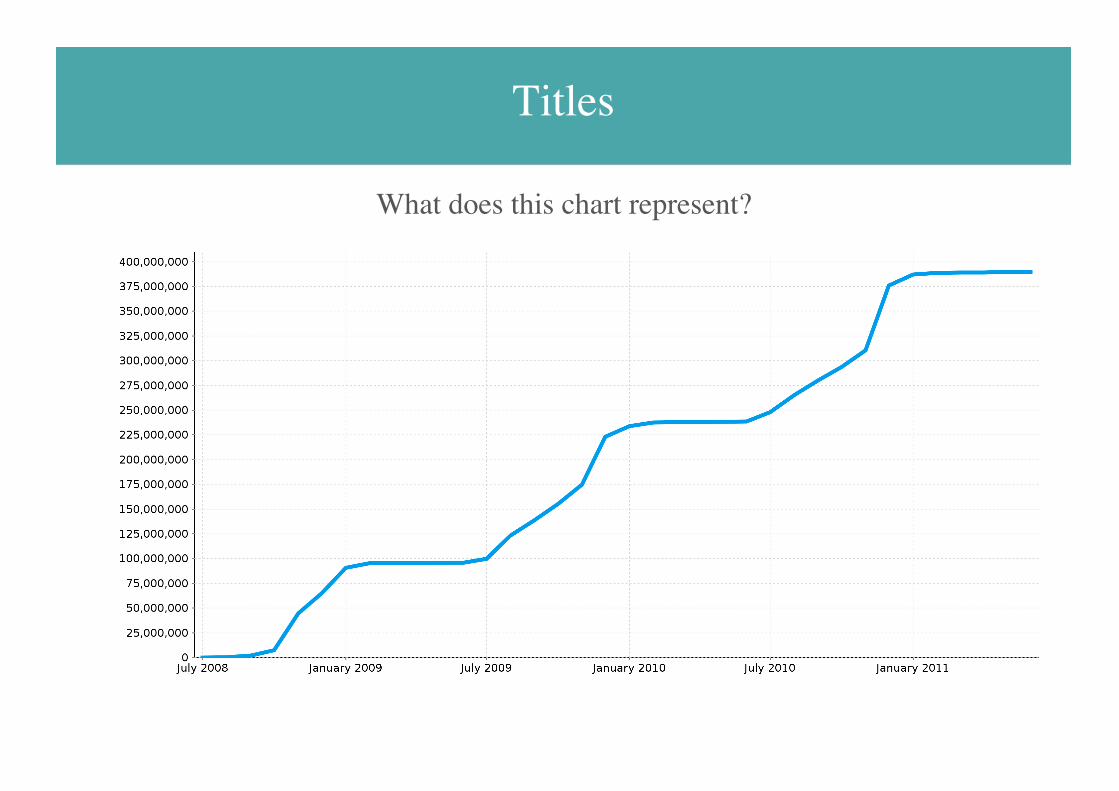
Titles
What does this chart represent?

Descriptions

Conditional Formatting
Rank Flag Camp Country Invoiced Profit Cost Rating % of Max1 Italy $8,882,013.53
2 Austria $7,447,954.66
3 USA $5,642,422.04
4 Australia $4,490,174.68
5 New Zealand $3,637,444.43
6 Japan $2,185,357.28
7 Germany $1,681,510.02
8 Canada $1,458,473.15
9 Armenia $1,296,521.07
10 Finland $1,145,911.31
Colours to highlight extremesIcon alertsFlags

Annotations and Reference Lines
Use annotation sparinglyAnnotations get more attention Higher dwell time
8 - Consistency

Consistency
9 - Trust


10 - Share

Any Platform, Any Device

Data-Driven Decisions


Related Documents


