People and Place, vol. 12, no. 1, 2004, page 15 BEYOND THREE SCORE YEARS AND TEN: PROSPECTS FOR LONGEVITY IN AUSTRALIA Heath er Boo th and L eonie Tic kle Most estimates and projections of life expectancy are based on period measures. This paper presents forecasts of cohort life expectancy for older generations derived using the Lee-Carter method of forecasting mortality. These cohort measures point to more years of life expectancy than the commonly-cited current period measures. The new forecasts also indicate a more rapid increase in future life expectancy than official projections assume. Policy-makers and those planning retirement should take into account that Australians are likely to live longer than currently envisaged The average length of human life has roughly doubled over the last 200 years. Most of this increase took place over the last 100 years. In Australia, life expec- tancy at birth was 57 years in 1901-10 and increased to 80 years in 2000. During the early part of the 20 th century, the greatest gains were due to reductions in mortality from infectious and para sitic diseases at young ages, while during the later part reduced mortality from chronic diseases at middle and older ages was the dominant factor. Life expectancy at age 50 increased from 25 years in 1950 to 32 years in 200 0. These unpreced ented increases in human life expectancy have prompted researchers to address the issue of whether there is an upper limit to human longevity. 1 To date, there is no consensus on whether such a limit exists, what the limit might be and how soon it might be reached. 2 Certainly the increases show no signs of slowing down, 3 giving no indica- tion that a limit might soon appear on the horizon. For the individual, increasing longev- ity presents the prospect of many years of post-retirement leisure but also the possi- bility of spending quite lengthy periods in various states of disability and ill-health. Thus, planning for retirement and old age — both lifestyle and financial — is becoming of increasing importance. Available evidence suggests, however, that people do not plan for a lengthy retirement. 4 Moreo ver, studies of the assets of older Australians show that many individuals (in particular, women and those living in high-cost centres such as Sydney) are woefully ill-prepared. 5 Further, many middle-aged Australians are grappling with issues of care of elderly parents, who are living beyond popular expectation, at a time when they are also planning for their own old age. Despite the backdrop o f ever-increasing years of life, for many ind ividuals, it is as though longevity has crept up on them without warning. Indeed, many elderly people are asking in tones of weary impa- tience, ‘How long will life go on?’ What then are the longe vity prospec ts of people living in Australia today? In particular what are the longevity pros- pects of today’s population aged 50 years or older — those who are planning for retirement, facing retirement or experi- encing old age? This pap er examine s this question using probabilistic forecasting methods. It concentrates on four popula- tion cohorts defined by their age in 2001: those aged 50 (labelled baby boomers), those aged 65 (labelled current retirees), those aged 85 (labelled current old-old) and those aged 90 (labelled current oldest-old). 6 The sex- a nd age-spe cific mortality rates for these cohorts are fore-

Welcome message from author
This document is posted to help you gain knowledge. Please leave a comment to let me know what you think about it! Share it to your friends and learn new things together.
Transcript
People and Place, vol. 12, no. 1, 2004, page 15
BEYOND THREE SCORE YEARS AND TEN: PROSPECTS FORLONGEVITY IN AUSTRALIA
Heath er Boo th and L eonie Tic kleMost estimates and projections of life expectancy are based on period measures. This paper presents
forecasts of cohort life expectancy for older generations derived using the Lee-Carter method of
forecasting mortality. These cohort measures point to more years of life expectancy than the
commonly-cited current period measures. The new forecasts also indicate a more rapid increase in
future life expectancy than official projections assume. Policy-makers and those planning retirement
should take into account that Australians are likely to live longer than currently envisaged
The average length of human life has
roughly doubled over the last 200 years.
Most of this increase took place over the
last 100 years. In Australia, life expec-
tancy at birth was 57 years in 1901-10
and increased to 80 years in 2000. During
the early part of the 20th century, the
greatest gains were due to reductions in
mortality from infectiou s and para sitic
diseases at young ages, while during the
later part reduced mortality from chro nic
diseases at middle and older ages was the
dominant factor. Life expectancy at age
50 increased from 25 years in 1950 to 32
years in 200 0.
These unpreced ented incre ases in
human life expectancy have prompted
researchers to address the issue of
whether there is an upper limit to human
longevity.1 To date, there is no consensus
on whether such a limit exists, what the
limit might be and how soon it might be
reached.2 Certainly the increases show no
signs of slowing down,3 giving no indica-
tion that a limit might soon appear on the
horizon.
For the individua l, increasing longev-
ity presents the prospect of many years of
post-retirement leisure but also the p ossi-
bility of spending quite lengthy periods in
various states of disability and ill-health.
Thus, planning for retirement and old age
— both lifestyle and financial — is
becoming of increasing importance.
Available evidence suggests, however,
that people do not plan for a lengthy
retirement. 4 Moreo ver, studies of t he
assets of older A ustralians show that
many individuals (in particular, women
and those living in high-cost centres such
as Sydney) are woefully ill-prepared.5
Further, many middle-aged Australians
are grappling with issues of care of
elderly parents, who are living beyond
popular expectation, at a time when they
are also planning for their own old age.
Despite the backdrop o f ever-increasing
years of life, for many ind ividuals, it is as
though longevity has crept up on them
without warning. Indeed, many elder ly
people are asking in tones of weary impa-
tience, ‘How long will life go on?’
What then are the longe vity prospec ts
of people living in Australia today? In
particular what are the longevity pros-
pects of today’s population aged 50 years
or older — those who are planning for
retirement, facing retirement or experi-
encing old age? This pap er examine s this
question using probabilistic forecasting
methods. It concentrates on four popula-
tion cohorts defined by their age in 2001:
those aged 50 (labelled b aby boomers),
those aged 65 (labelled current retirees),
those aged 85 (labelled current old-old)
and those aged 90 (labelled current
oldest-old).6 The sex- a nd age-spe cific
mortality rates for these cohorts are fore-
People and Place, vol. 12, no. 1, 2004, page 16
cast over the rem ainder of the ir lives, and
there rates are used to derive co hort life
expectancies. The paper demonstrates the
extent to which longevity is likely to
increase over the lifetime of cohorts now
alive. The uncertainty in the forecasts is
discussed and comparison is made with the
limited information on cohort mortality
available in official publications. The
implications at the individual level of these
forecasts of increasing longevity are
discussed in relation to the baby boom and
older cohorts.
COHORT VERSUS PERIOD
MEASURES
The estimates of life expectancy com-
monly used in discussions of longevity and
ageing are period or cross-sectional
measures. An example of such a measure
is life expectancy at birth in 2000. This
measure refers to a hypothetical population
of individuals who over the course of their
lifetime experience the age-specific death
rates occurring in 2000. In other words, it
indicates what life expectancy at birth
would be if 2000 age-specific rates were to
continue for 100 years or so. The life
expectancies published by the Australian
Bureau of Statistics (ABS) are usually
period measures, as are ABS projections
of future life expectan cy.
Though useful as indicators of the
overall level of mortality and hence of
changes over time, period measures are
inappro priate for examining survival over
the life course, for example the survival
prospec ts of a particular cohort. This is
because mortality rates change. For babies
born in 2000, for example, the period
measure provides at best an estimate of the
minimum life expectancy at birth because
mortality rates are expected to continue to
decline as they have for the last 100 years.
Similarly, the 2000 period life expectancy
at a given age will underestim ate the
average number of years of life remaining
for persons of that age in 2000.
In order to take account of life course
changes in mortality, cohort measures are
required. Cohort life expectancy is based
on the mortality experience over the life
course. The difficulty in adopting cohort
measures is that the mortality experience
of cohorts bo rn after 190 0, or there-
abouts, is incomplete. For the baby boom
cohort, for example, the mortality exp eri-
ence of more than 92 per cent of its mem-
bers has yet to occur. In order to con-
struct cohort life tables for living genera-
tions, therefore, forecasts of their future
mortality are required.
NEW FORECASTS OF COHORT LIFE
EXPECTANCY
The forecasts presented in this paper
were derived using a modified version of
the Lee-Carter method of mortality fore-
casting.7 Among the method’s advantages
are that it involves a minimum of subjec-
tive judgeme nt since forecasts are based
entirely on past trends, and that probab il-
istic prediction intervals8 are provided for
its forecasts. The Lee-Carter method has
been applied to data for the US, giving
results that were significantly better than
official US forecasts.9 It has also been
used for G7 countries, 10 and is being
adopted by some o fficial statistical
agencies.
The Lee-Carter method combines a
demog raphic model o f mortality with
time-series methods of forecasting.11 The
demog raphic model expresses the loga-
rithms of death rates at any given age and
time as a function of two age-related
parameters, a time-related parameter
representing the general lev el of mortal-
ity, and a random error. The time-related
parameter can be extrapolated into the
future and used to derive future m ortality.
The Lee-Ca rter model of mortality is:

People and Place, vol. 12, no. 1, 2004, page 17
1nmx,t = ax + bxkt + gx,t
where mx,t is the central dea th rate
at age x in year t
kt is an index of the level
of mortality at time t
ax is the general pattern of
mortality by age
bx is the relative speed of
change at each age
gx,t is the residual at age x
and time t.
The ax were calculated as the average
of 1nmx,t over time, in which case the bx
sum to one and the kt sum to zero. Singu-
lar value decomposition12 was used to
estimate the model parameters. In the
modified method, in o rder to correct for
the distorted weighting involved in esti-
mating the logarithms of rates, each kt
was adjusted by refitting to the age d istri-
bution of observe d deaths, wh ile ax and bx
remained unchanged.13
For forecasting p urposes, o nly kt is of
interest since ax and bx are assumed con-
stant over time . The series of kt obtained
from the fitted Lee-Carter mo del is
extrapolated into the future using time
series methods. T he time series model
fitted to kt was
kt = kt-1 + d + et
where d is constant annual change in kt and
et are uncorrelated errors. This linear
model was used to extrapola te kt into the
future. The combined standard error in d
and et represents the uncertainty associated
with a one-year forecast. This is used to
produce probab ilistic prediction intervals
for the forecast values of kt and, through
substitution in the equation for 1nmx,t = ax
+ bxkt + gx,t, for forecast mortality rates and
hence for life-table functions such as life
expectan cy.
The modified Lee-Carter method was
applied to central mortality rates by sex at
ages 50+ fo r the period 1964 to 2000.
These single year rates were obtained
from the Australian Demographic Data-
Bank at the Australian Centre for Popula-
tion Research. In fitting the mod el, data
for the period 1964 to 2000 were judged
to be ‘optimal’ based on statistical
goodne ss-of-fit criteria assuming the
above linear model. Choice of fitting
period is an integral part of the modified
Lee-Carter method.14
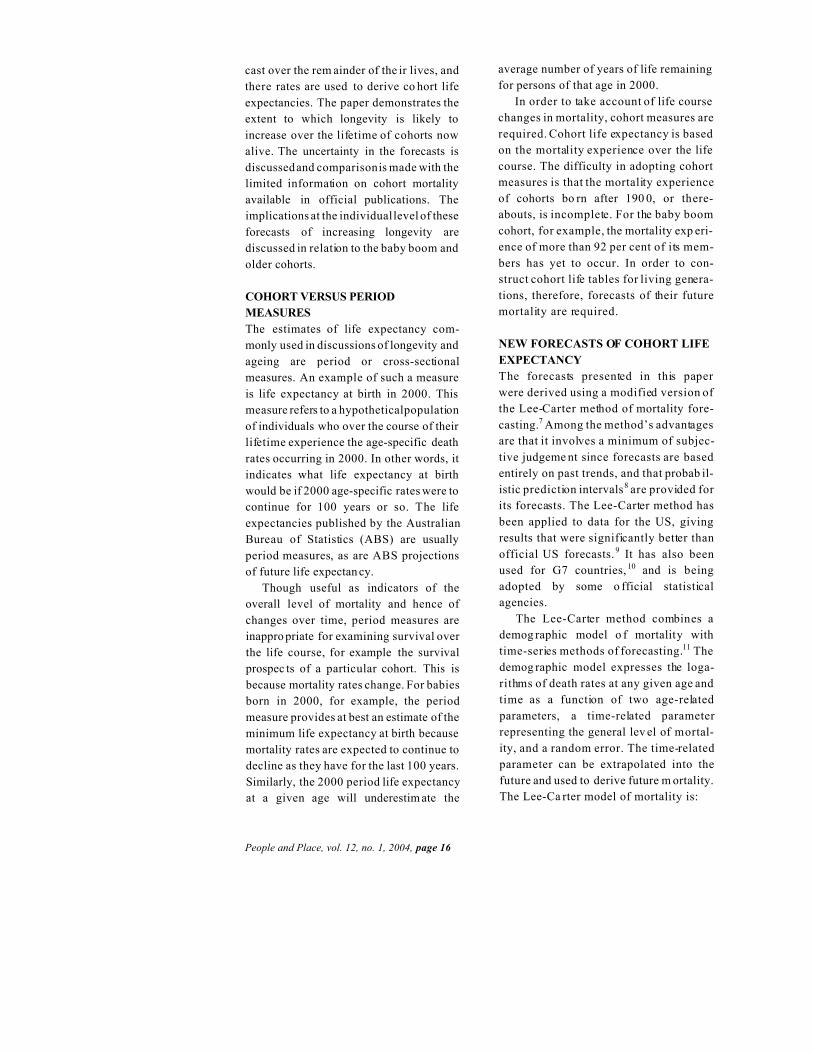
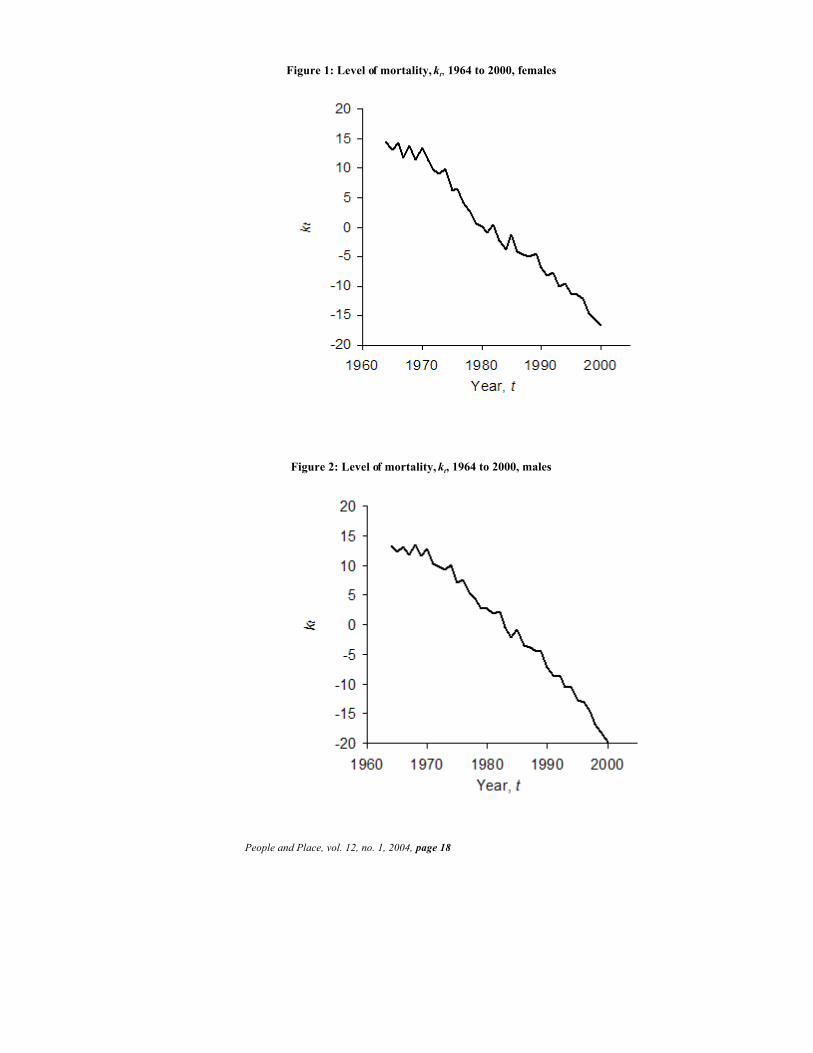
The overall dec line in mortality over
the period 1964-2000, as represented on
an arbitrary scale by the parameter kt, is
shown in Figure 1 fo r females and in
Figure 2 for males. It is seen that the
decline has been fairly constant over the
period in question and it is assumed that
this decline will co ntinue to 20 41.
While kt represents the general decline
in mortality over ages 50+ , bx represents
the extent to which this decline is experi-
enced at each age. For this d ataset, bx
decreases with age for both females and
males, representing the fact that the mor-
tality decline has b een more rapid in
middle ag e than at olde r ages.
The fitted ax and bx values along with
the forecast kt are substituted in equation
(1) to give forecast p eriod cen tral death
rates at ages 50+ for females and males
for the years 20 01 to 20 41. These fore-
casts embody a substantial increase in life
expectancy at age 50 as seen in Figures 3
and 4. Between 2000 and 2041, life
expectancy at age 50 is forecast to
increase from 34.1 to 40.7 years for
females and from 30.0 to 37.2 years for
males. Figures 3 and 4 also show 95 per
cent prediction intervals for the forecast.
Similar increases are forecast for the
older cohorts; the forecast expected ages
at death15 of people aged 50, 65, 75, 85
and 90 are shown in Table 1. These
People and Place, vol. 12, no. 1, 2004, page 18
Figure 1: Level of mortality, kt, 1964 to 2000, females
Figure 2: Level of mortality, kt, 1964 to 2000, males

People and Place, vol. 12, no. 1, 2004, page 19
Figure 3:Actual and forecast life expectancy at age 50 with 95 per centpredication interval for the years 1964 to 2041 and forecast lifeexpectancy for the cohort aged 50 in 2001, females
Figure 4: Actual and forecast life expectancy at age 50 with 95per cent predication interval for th years 1964 to 2041and forecast life expectancy for the cohort aged 50 in2001, males
Note: Comparable data are not available from the Australian Bureau of Statistics publications

People and Place, vol. 12, no. 1, 2004, page 20
Table 1: Cohort and period expected age at death at specified aged by sex
AgePeriod Cohort: age in 2001
2000 2041 90 85 65 50Female
50 84.1 90.7 88.865 85.7 91.5 88.0 90.375 87.9 92.7 90.2 92.185 91.8 95.2 92.1 93.7 95.190 94.9 97.6 95.0 95.2 96.5 97.6
Male50 80.0 87.2 84.465 82.2 88.1 84.1 86.575 85.5 89.9 87.4 89.185 90.7 93.7 91.0 92.4 93.690 94.4 97.0 94.5 94.7 95.9 97.0
Sex difference (Female - Male)50 4.1 3.5 4.465 3.5 3.4 3.9 3.875 2.4 2.8 2.8 3.085 1.1 1.5 1.1 1.3 1.590 0.5 0.6 0.5 0.5 0.6 0.6
Note: Comparable data are not available from the ABS publications.
increases are smaller at older ages
because of the shorter exposure to the
forecast mortality decline and because
rates are forecast to decline m ore rapid ly
at younger ages.
Mortality rates for the four selected
cohorts were extracted from the ap propri-
ate diagonals of the matrix of these
period forecasts and used in the construc-
tion of cohort life tables. The resulting
cohort forecasts indicate that members of
the baby boom cohort can expect to live
a further 38.8 years, if female, and 34.4
years if male, giving an expected age at
death of 88.8 yea rs for females and 84.4
years for males. These cohort life expec-
tancies at age 50 are shown in Figures 3
and 4 at the right hand side; also shown
are cohort 95 per cent prediction inter-
vals. Similarly, as Table 1 shows, current
retirees can expect to live to 88.0 and
84.1 years, the curre nt old-old can expect
to live to 92.1 and 91.0 years and the
current oldest-old can expec t to live to
95.0 and 94.5 years respectively.
The cohort life expectancies lie
between the corresponding period values
for 2000 and 2041. For the baby boom
cohort at age 50, expected age at d eath
lies roughly midway between the 2000
and 2041 v alues beca use the mor tality
experience of this cohort will take place
over the entire 41 ye ar period . For the
current old-old and oldest-old cohorts,
their remaining life experienc e will occur
in the early part of the forecasting period
so that expected age at death is close to
the period expectation in 2000. For
females, for example, the expected age at
death of the cohort aged 85 in 2001 is
92.1 years, only 0.3 years greater than the
2000 period value. By the time the baby
boom cohort reaches age 85, in 2036, its
future experienc e will be closer to that in
2041, giving an expected ag e at death
that approaches the 2041 period value
(for females, a cohort value of 95.1 com-
pared with 95.2 in 2041). Current retirees
occupy an intermediate position.16
Table 1 also shows expected age at
death at future ages for each cohort. For
example, baby boo mers who s urvive to
age 65 can expect to live to age 90.3 if
female and 86.5 if male. Expected age at

People and Place, vol. 12, no. 1, 2004, page 21
Figure 5: Life expectancy by age for the female baby boom cohort
death is greater for younger cohorts (seen
by comparing acro ss the columns), due to
the forecast mortality decline. In addition,
the differences between cohorts are
greater at younger ages, due to longer
remaining exposure to differential mortal-
ity rates. For ex ample, whe n the female
baby boom cohort reache s age 65, its
surviving members will have a greater
life expectanc y than current re tirees by
2.3 years. When these same tw o cohor ts
reach age 85, however, the baby boomer
advantage will be reduced to 1.4 yea rs.
When they reach ag e 90, the baby
boomer advantage will be further
reduced .
GAINS DUE TO SURVIVAL
In any life table, expected age at death
increases with age. Like a reward for
good behaviour, by surviving survivors
gain an extra lease of life.17 This is seen
in both the period and cohort values
shown in Table 1. For the baby boom
cohort, for examp le, female surviv ors to
age 85 can expect to live 6.3 years longer
in total than those who were a live at age
50. Most of this gain is earned after age
65, because mortality rates are higher at
older ages. Survival to age 65 is not par-
ticularly difficult to achieve, so the reward
is only 1.5 years of extra life. Survival at
older ages, however, presents more of a
challenge, with increasing rewards: 1.8
years for surviving from 65 to 75, 3.0
years for surviving from 75 to 85, and 2.5
years for surviving the five years from 85
to 90. At very old ages (not shown), the
reward for surviving an extra year
approaches one year, so that remaining
years diminish only slightly. This
phenomenon is seen in Figure 5 which
represents life expectancy (remaining
years) as the difference between expected
age at death and age: the two lines
converge at a slower rate at older ages.

People and Place, vol. 12, no. 1, 2004, page 22
Table 2: Cohort period survival probabilities at specified ages by sex
Probability of survival Period Cohort: age in 2001
2000 2041 85 65 50Female
From 50 to 65 0.94 0.98 0.95From 65 to 75 0.87 0.95 0.89 0.92From 75 to 85 0.65 0.82 0.73 0.79From 85 to 90 0.58 0.76 0.60 0.69 0.75From current age to 75 0.82 0.92 0.89 0.87From current age to 85 0.53 0.76 0.65 0.69From current age to 90 0.31 0.57 0.60 0.45 0.52
MaleFrom 50 to 65 0.90 0.97 0.92From 65 to 75 0.78 0.91 0.81 0.86From 75 to 85 0.50 0.70 0.59 0.66From 85 to 90 0.48 0.65 0.49 0.58 0.64From current age to 75 0.71 0.88 0.81 0.79From current age to 85 0.35 0.62 0.47 0.52From current age to 90 0.17 0.40 0.49 0.27 0.34
Note: Current age equals age in 2001 for cohort values and age 50 for period values. Comparable data arenot available from the ABS publications.
Since these gains are greater where
mortality rates are higher, gains due to
survival between any two ages de crease
over time as mortality rates decline. Thus
current old -old females gain an extra 3.1
years by surviving to age 90, 0.6 years
more than female bab y boomers.
FORECAST SURVIVAL
PROBABILITIES
While life expectancies provid e an esti-
mate of average age at death, they do not
provide information on the proba bility of
surviving between specified ages. For
many purposes, such as planning for old
age, it may be more informative to know
the chances of survival to a certain age.
For a female baby boomer in 2001, for
example, her comp lete life expectancy of
88.8 years gives no indication of how
likely she is to survive fro m (say) age 50
to 65 or from 75 to 90. For this, survival
probab ilities are required .
Forecast survival pro babilities for
each cohort are shown in Table 2,18
together with 2000 and 2041 period
values for comp arison. For example, a
female baby boomer has a 95 per cent
chance of surviving from age 50 to 65 , a
92 per chance of surviving from 65 to 75,
a 79 per cent chance of surviving from 75
to 85 and a 75 per cent chance of
surviving from 85 to 90. A gain, these
cohort values l ie between th e
corresponding period values for 2000 and
2041 and reflect the fo recast decline in
mortality (that is, increasing survival
probabilities). The prod ucts of these
survival probabilities gives the probab il-
ity of surviving be tween releva nt ages;
for example, for female baby boomers the
probability of surviving from age 50 to
90 is 0.52, which is the product of the
four probab ilities just cited. Ta ble 2 also
shows these prob abilities of survival from
current age fo r each coh ort.
SEX DIFFERENTIALS
Since male mortality exceeds fem ale
mortality, the sex differential in life ex-
pectancy (shown in Table 1) favours
females at every age. The sex differential
at age 50 was 4.1 years in 2000 and has
been narrowing in recent dec ades due to
a more rap id decline in m ale mortality.
The forecast rates continue this trend, and
in 2041 the forecast sex d ifferential is 3.5
years. Because of differences between the

People and Place, vol. 12, no. 1, 2004, page 23
sexes in mortality patterns by age, how-
ever, the cohor t sex differentials ten d to
exceed the period values. For the baby
boom cohort, for example, the sex differ-
ence in life expectan cy at age 50 of 4.4
years exceeds both the 2000 and 2041
values. Further, there is no clear pattern
across cohorts. For this measure (unlike
those already discussed), period values
do not represent the lower and upper
bounds for cohort values and th ere is not
necessarily a gradual trend across co-
horts. Thus period life tables may be
particularly misleading in situations
where male and fe male mor tality are
being compared.
The sex differential in life expectancy
diminishes as age increases. By age 90, the
sex differential for baby boomers is
reduced to 0.6 years. This diminution is
also seen in the survival probabilities in
Table 2. While female baby boomers have
a markedly greater chance of reaching age
85 (69 per cent compared with 52 per cent
for males), once they reach this age,
survival prospec ts are much more
equitable (a 75 per cent chance of
surviving to age 90 for females compared
with a 64 per cent chance for males).
ASSESSABLE UNCERTAINTY
The forecasts presented above are ex-
pected values in the statistical sense and
are subject to uncertainty. For example,
the female baby boomer complete life
expectancy of 88.8 years has a 95 per cent
prediction interval of 84.6 to 93.5 years
and the male value of 84.4 years has a
prediction interval of 81.2 to 88.0 years.
Similar uncertainty statements can be
made about survival probabilities. In
addition to knowing the forecast proba-
bility of surviving to a certain age, it is
possible to specify the range of probab ili-
ties for which survival is 95 per cent
certain, For exam ple, a female baby
boomer has an estimated 52 per cent
chance of surviving to age 90, a nd a 33 to
66 per cent chance of surviving to age 90
with 95 per cent certainty. A lternatively,
uncertainty may be expressed as a range
of ages. For example, a female baby
boomer has a 75 per cent chance of sur-
viving to between ag es 78.5 an d 86.9
with 95 per cent certainty. Such uncer-
tainty is of particular interest in relation
to annuities and financial plann ing.
COMPARISON WITH OFFICIAL
LONGEVITY ESTIMATES
Official estimates of longevity published
by the ABS include current life tables19
and future life expectancy assumptions
used in population projections;20 both are
period measures. Cohort life expectancies
are generally not available; as a result,
period measures are commo nly used as
indicators of cohort life expectan cy.
Further, official future period life expec-
tancies are limited to life expectancy at
birth.
As seen in Table 1, the current (2000)
period life table underestimates cohort
life expectanc y by up to 4.7 years with
larger discrepancies occurring at younger
ages and for younger cohorts who have
more years left to bene fit from mor tality
decline. Thus financial planners and
others who rely on current life tables to
provide mortality information for existing
cohorts will base their advice on signifi-
cantly undere stimated long evity.
The assumption s about future life
expectancy used in official population
projections are also problematic as
sources of information on cohort longev-
ity. First, they are pe riod rather th an
cohort values. Second, published values
are usually restricted to life expectancy at
birth, giving none of the d etail required to
address survival from other ages. Third,
they are likely to be conservative: it has

People and Place, vol. 12, no. 1, 2004, page 24
been demon strated that the d ecline in
Australian mortality has been system ati-
cally undere stimated in the p ast.21
Projections of cohort m ortality are
made by the Australian Government
Actuary (AGA)22 (based o n data to
1995-97) and provide a few points of
comparison. These projec tions indicate
an expected age at death for the cohort
aged 65 in 2001 of at most 87.4 for
females and 83.6 for males; these are 0.6
and 0.5 years, respectively, lower than
the values reported in this paper. Other
comparisons are not possible.
IMPLICATIONS OF THE FORECASTS
For planning and policy formulation at
any level, it is of crucial importance to
base decisions on the most valid and
reliable evidence. The longevity forecasts
in this paper represent a significant ad-
vance on previously available informa-
tion. Not only are they presente d in terms
of the correct measure for addressing
cohort longevity, but they are also likely
to more acc urately portra y future mortal-
ity. These lo ngevity foreca sts are supple-
mented by corresponding survival proba-
bilities, which constitute useful informa-
tion for planning. F urther, the provision
of proba bilistic prediction intervals is an
important innovation. Information about
forecast uncertainty should form an
essential and integral part of the evidence
on which planning is based.23
A key finding is that these fo recasts
show a longer complete life expectancy
than previous e stimates would imply.
This calls for the revision of a wide range
of models, p lans and po licies, including
those forming the basis of advice on
personal financial and life planning, that
are predicated on years of life. The
rapidly growing body of research con-
cerned with ageing and gerontology is
based on longevity prospects that fall far
short of those reported here. The prob-
lems and issues addressed by this body of
research are thus likely to be of even
greater significance than currently
acknowledged.
What are the implications of these
longevity prospects for the baby boom
and older coh orts? First, it is of funda-
mental importance to acknowledge the
length of forecast life expectancies. For
baby boomers, the prospect at age 50 of
a further 38.8 years of life if female, or
34.4 if male, may not always be fully
appreciated and calls for a degree of
planning most will not have envisaged.24
Neither is it likely that probabilities of
survival are consciously taken on board.
It is sobering to observe, for example,
that 52 per cent of female and 34 per cent
of male baby boomers can expect to live
to age 90. How many will be prepared for
this eventuality?
Though the prospe ct of a lengthy life
may be welcomed by individuals as an
oppor tunity to achieve o utstanding life
goals, it also points to the need for ser i-
ous considera tion of plans for financial
security in old age.25 Moreover, the pros-
pect of still greater longevity stemming
from gains due to survival should be
taken into account. The female baby
boomer planning for retirement must
make provision for a lifetime of 88 .8
years, but if she survives to this age she
can expect to live another 8.1 years. Such
substantial survival gains imply that
financial plans should be regularly
revised. The uncertainty in the estimates
should also be taken into account.
While personal r etirement and finan-
cial planning would ideally take forecast
life expectancy and survival probabilities
into account, evidence suggests that cur-
rent practice often falls below the ideal.26
In particular, the forecast longevity pros-
pects call into question the wisdom of

People and Place, vol. 12, no. 1, 2004, page 25
early retirement from the labour force.27
Even based on conservative conventional
longevity estimates, early retirement
often leads to disadvantage.28 Further, the
spending strategies of many retirees may
prove to be incon sistent with their true
longevity prospects: enjoying the fruits of
one’s labour in early retirement may
leave one seriously short in later years
when health and aged care costs can be
very high. Many Australians migrate on
retirement in search of lifestyle and sun,
the ramifications of which may not be
fully appreciated until they are upon
them: the need for health and aged care
without the support of nearby kin.29
Improved longevity pro spects also
have implications for the role of the
family in aged care . Where as in the past,
middle-aged adults would typically care
for family members aged 70-80, carers
now face the prospect of caring for the
very old when they themselves are qu ite
elderly. With an average age at
childbearing of 29 years in the 1930s, a
small but significant proportion of current
retirees are finding that they are
responsib le in one way or another for the
care of 95 year-old parents. This
pre-baby-boom generation also has rela-
tively few siblings to share the responsi-
bility.30 If elderly parents do not have
sufficient assets, the retirees may find that
they are obliged to build support for
elderly parents into their own financial
plans. Where migration of family members
has taken place, care of the elderly may be
an especially difficult and expensive issue,
often necessitating further migration when
elderly parents become frail.
These personal financial and aged care
implications are all the more important
when it is considered that increased years
of life are likely to be spent in a state of
disability. Recent research has shown that
between 1988 a nd 199 8, all of the male
and two-thirds of the female incre ase in
life expectanc y was spent in a state of
disability.31
The new forecasts also challenge the
conventional wisdom that females can
expect to live significantly longer than
males. In fact, among survivors to older
ages (85 and above), m ale and fem ale
survival prospec ts are quite simil ar: by
age 90 the female advantage in life ex-
pectancy is only half a year. This calls for
a change in thinking about the likelihood
that females will experience an extended
period of widowhood in old age. Indeed,
marriage between partners of similar age
may minimise years spent in widowhood,
provided that both partners survive to old
age. The survival prospec ts of each pa rt-
ner are also important in financial plan-
ning, where the inadequacies of period
life tables for forecasting sex differentials
underline the need for coh ort tables.
Finally, this analysis has focused on
increasing longevity and its implications
at the individua l level, rather than a t the
population level. Neverth eless, the contri-
bution of increasing longevity to struc-
tural population ageing , particularly its
effect on old-age dependency ratios and
proportions who are very old, cannot be
ignored.32 The und erestimation in official
longevity assumptions, as indicated by
the new forecasts, means that official
population projections underestimate the
extent of ageing.33 Existing studies34 of
the financial implications of ageing for
the public pro vision of socia l security and
health and aged care services will there-
fore underestim ate the full effect. Thus,
though most of the existing studies indi-
cate that the costs of population ageing
are manageable,35 the new longe vity
forecasts call fo r their re-exam ination.
In addition, these stud ies show that a
continuation of existing trends towards
the greater use per person of high-cost

People and Place, vol. 12, no. 1, 2004, page 26
1 For example, K. W. Wachter and C. E. Finch (Eds) Between Zeus and the Salmon: the Biodemography ofLongevity, National Academy Press, Washington, D.C., 1997
2 See evidence cited in J. Oeppen and J. W. Vaupel, ‘Broken limits to life expectancy’, Science, vol. 296,2002, pp. 1029-1031.
3 ibid.; J. Wilmoth, ‘Demography of longevity: past, present and future trends’, Experimental Gerontology,vol. 35, 2000, pp. 1111-1129
4 The National Strategy for an Ageing Australia, Background Paper, Department of Hea lth and Aged Care,Canberra, 1999, p. 14
5 S. Kelly, ‘Forecasting wealth in an ageing Australia — an app roach using dynamic microsimulation ’,presented at the 7th Nordic Seminar on Microsim ulation Models, Helsinki, Finland 13 June 2003,<http://www.natsem.canberra.edu.au/pubs/cp03/2003_005/cp2003_005.pdf>; S. Kelly, ‘Incomes and assetsof New South Wales baby boomers in 2020’, presented at the Future of Ageing Conference, Coffs Harbour,20 February 2003, <h ttp://www. natsem.canberra.edu.a u/pubs/cp03 /2003_002/cp2003_002 .pdf>; A.Harding, A. King and S. Kelly, ‘Trends in the incomes and assets of older Australians’, Discussion Paperno. 58, National Centre for Social and Economic Modelling, (NATSEM), Canberra, June 2002; S. Kelly,A. Harding and R. Percival, ‘Live long and prosper? Projecting the likely superannuation of the babyboomers in 2020’, NATSEM, Presented at the 2002 Australian Conference of Economists BusinessSymposium, October 2002; P. Noad. ‘Too busy, too tired — too hard! Queensland women: funding ourfutures’, Australian Pensioners’ and Superannuants’ League (Qld) Inc., 2000; ‘Inquiry into long-termstrategies to address the ageing of the Australian population over the next 40 years’, submission to the 2003House of Representati ves Standing C ommittee on Ageing, Occasional Paper no. 8, CommonwealthDepartment of Family and Community Services (FACS), Canberra, 2003
6 Small numbers and inaccuracies in reported age preclude examination of individual cohorts aged over 90.7 R. Lee and L. Carter, Modeling and forecasting the time series of US mortality. Journal of the American
Statistical Association, vol. 87, 1992, pp. 659-771. Details of t he modified Lee-Car ter method, designed toimprove forecasting reliability, are given in H. Booth, J. Maindonald and L. Smith, ‘Applying Lee-Cart erunder conditions of variable mortality decline’, Population Studies, vol. 56, no. 3, 2002, pp. 325-336
8 A prediction interval is a confidence interval for a forecast.9 R. Lee and T. Miller, ‘Evaluating the performance of the Lee-Carter method for forecasting mortality’,
Demography, vol. 38, no. 4, 2001, pp. 537-54910 S. Tuljapurkar, N. Li and C. Boe, ‘A universal pattern of mortality decline in the G-7 countries’, Nature, vol.
405, 2000, pp. 789-79211 Lee and Carter, 1992, op. cit.12 L. Trefethen and D. Bau, Numerical Linear Algebra, Society for Industrial and Applied Mathematics,
Philadelphia, 199713 Booth et. al., 2002, op. cit.14 For technical details see ibid.15 Also known as complete life expec tancy, the expec ted age at death of persons aged x is obtained by adding
the number of years already survived (that is, x) to (remaining ) life expectancy at age x. It should be notedthat all life expectancies presented in this paper are conditional on first havin g survived to the specified age.
16 Longer-term forecasts are less reliable than short-term. However, only forecasts for the baby boom cohortat older ages include the later years of the forecast period.
17 These survival gains are, of course, due to the fact that individuals who do survive are generally ‘fitter’ andcan therefore expec t to survive longer t han average.
services would present a major challenge
to fiscal sustainability. Tha t this chal-
lenge is likely to be even greater than
anticipated is a further implication of the
new forecasts: it is at very old ag es in
particular, where health costs are highest
and increasing,36 that underestimation is
greatest in official projections.37 The new
forecasts would imply, therefore, that
future provision fo r the elderly will
require a higher level of public funding
t h a n c u rr e nt ly e nv i sa g ed . T he
implications of increasing lo ngevity
should be taken into account in retirement
planning and related po licies.
AcknowledgmentThe authors are grateful to Len Smith for insightfulcomments.
References

People and Place, vol. 12, no. 1, 2004, page 27
18 In Table 2, surviva l probabiliti es from current age cannot be compared between cohorts because each cohorthas a different current age. Survival probabiliti es cannot be ca lculated for the oldest-old cohort, since 90 andover is the last age group.
19 Deaths, Australia, 2002, Cat. no. 3302.0, Australian Bureau of Statistics (ABS), Canberra, 200320 Population Projections, Australia, 2002-2101, Cat. no. 3222.0, ABS, Canberra, 200321 H. Booth. ‘From modelling to forecasting: it ain’t straightforward!’, presentation at the Australasian Centre
for Policing Research, (ACPR), Workshop on Mortality Modelling and Forecasting, Canberra, 13-14February 2003, <http://acpr.edu .au /Mortality %20Workshop.html>
22 Australian Life Tables 1995-97, Australian Government Actuary (AGA), Canberra, 199923 H. Booth, ‘On the importance of being uncertain: forecasting population fut ures for Australia’, People and
Place, forthcoming, 200424 The National Strategy for an Ageing Australia, Background Paper, Department of Hea lth and Aged Care,
Canberra, 1999, p. 1425 An increasing proportion of people will engage in personal financial planning: while 55 per cent of persons
aged 65 and over were in receipt of the full-rate age pension in 1998, this proportion will decline asemployer-sponsored and private superannuation increase as a result of existing policy. See, ibid., p. 12.
26 See endnote 527 Labour force participation rates for persons aged 55 and over have declined sharply in recent decades. See
D Carey, ‘Coping with population ageing in Australia’, Organisation for Economic Co-Operation andDevelopment, (OECD), Economics Department Working Papers no. 217, OECD, Paris, 1999
28 ‘Inquiry into long-term strategies to address the ageing of the Australian population over the next 40 years’,submission to the 2003 House of Representatives Standin g Committee on Ageing, Occasional Paper no. 8,Commonwealth Department of Family and Community Services (FACS), Canberra, 2003
29 This also creates considerable strain on local resources.30 Total fertility averaged 2.2 in the 1930s.31 This includes relatively minor disabilities. C.R. Heathcote, B.A. Davis, B.D. Puza and T.J. O’Neill. ‘The
health expectancies of older Australians’, Journal of Population Research, vol. 20, no. 2, 2003, pp. 169-185.32 Declining fertility in the past is the principal cause of structural ageing; this effect is known an d fixed. Given
the current structure, future longevity will determine the size of the elderly population. 33 H. Booth and L. Tickle, ‘The future aged: new projections of Australia’s elderly population’, Australasian
Journal on Ageing, vol. 22, no. 4, 2003, pp. 196-20234 Intergenerational Report 2002-03, 2002-03 Budget Paper No. 5, Commonwealth of Australia, Canberra,
14 May 2002; C. Cooper and P. Hagan, ‘The Ageing Australian Population and Future Health Costs:1996-2051’, Occasional Papers: New Series no. 7, Department of Health and Aged Care, Canberra, 1999;Allen Consulting Group, ‘The Financial Implications of Cari ng for the Aged to 2020: A report commissionedin conjunction with The Myer Foundation project, 2 020: A Vision for Aged Care in Australia,’ Final Reportto the Myer Foundation, 2002; J. Creedy, ‘Population ageing and the growth of social expenditure’, inProceedings of the Policy Implications of the Ageing of Australia’s Population Conference, 10 August1999, <http://www.pc.gov.au/research/confproc/ageing/paper10.pdf>; P. Johnson, ‘Ageing in thetwenty-first century: implications for public policy’, in Proceedings of the Policy Implications of the Ageingof Australia’s Population Conference, 10 August 1999, <http://www.pc.gov.au/research/confproc/ageing/paper02.pdf>
35 The Intergenerational Report 2002-03, op. cit., pp. 60-62, shows that an additional increase of about oneyear in life expectancy over the next 40 years would necessitate an increase of 0.48 per cent of GDP ingovernment spending by 2041-42. However, this is based on life expectancies a t birth of 88 .5 for femalesand 83.9 for males, which are likely to be lower than comparable forecast values.
36 Intergenerational Report 2002-03, op. cit.37 Booth and Tickle, 2003, op. cit.
Related Documents