International J. Soc. Sci. & Education 2015 Vol.5 Issue 2, ISSN: 2223-4934 E and 2227-393X Print 203 Beyond Inquiry Based Science Program: It’s Relevance in Changing Students’ Stereotypical Images about Scientist By Sedat Karaçam Düzce University Education Faculty Science Education Department, Düzce-Turkey Abstract This study aimed to investigate the influence of “Inquiry Based Science Program (IBSP)” on scientist image of 6 th graders and the perceptions underlying these images. 29 students attending the 6 th grade of a secondary school in Ankara participated in the study. However, data from 24 students were used in the study since 5 students could not complete the research. The program lasted 31 weeks during 2012-2013 academic year. Students’ images about scientists were identified before and after the program implementation via DAST. Data obtained via DAST were analyzed through DAST-C. Results of analysis showed that IBSP did not change students’ stereotypical scientist images but only increased their focus on technology symbols. Semi-structured interviews were given to determine the reasons why IBSP was unable to change students’ stereotypical scientist images. Results obtained from semi- structured interviews pointed to the fact that since students i) believed that they “learned about” doing science instead of doing science, ii) arrived at known events, phenomena or concepts as a result of their research and iii) did qualitative research in social fields in their inquiries, they did not feel themselves as scientists and therefore their scientist images did not undergo transformations. These results point to the fact that the program in which the purpose is to teach science by using inquiries that involve qualitative research techniques has no influence on students’ scientist images. Keywords: Inquiry, Science Teaching Program, Scientist Image 1. Introduction Studies related to identification of individuals’ scientist images which started in 1957 with Mead and Metraux’s study are becoming more prominent along with the increases of the importance of science and technology. Mead & Metraux (1957) asked 35.000 high school students to prepare written documents about scientists. Results of their research pointed to the fact that individuals generally expressed their views on scientists as follows: The scientist is a man who wears a white coat and works in a laboratory. He is elderly or middle aged and wears glasses . . . he may wear a beard. . . he is surrounded by equipment: test tubes, bunsen burners, flasks and bottles, a jungle gym of blown glass tubes and weird machines with dials . . , he writes neatly in black notebooks . . . One day he may straighten up and shout: “I’ve found it! I’ve found it!”. . . Through his work people will have new and better products. . . he has to keep dangerous secrets . . . his work may be dangerous . . . he is always reading a book (p. 386). Semantic differential scale, Likert type scales and essays were used in various studies from Mead & Metraux (1957) to Chambers (1983). Results of studies undertaken in the ‘60s and ‘70s showed that students had a stereotypical scientist image resistant to change and that this image was common for individuals from various cultures worldwide. Chambers (1983) developed “Draw A Scientist Test” (DAST) technique. The researcher portrayed students’ images about scientists through the drawings of 4807 primary grade students (pre-school to 5th grade). Study results pointed that students’ images about were generally collected under seven categories: lab coat, glasses, beard or mustache, technology symbols, knowledge symbols, research symbols and topics regarding the field of study.

Welcome message from author
This document is posted to help you gain knowledge. Please leave a comment to let me know what you think about it! Share it to your friends and learn new things together.
Transcript
International J. Soc. Sci. & Education
2015 Vol.5 Issue 2, ISSN: 2223-4934 E and 2227-393X Print
203
Beyond Inquiry Based Science Program: It’s Relevance in Changing
Students’ Stereotypical Images about Scientist
By
Sedat Karaçam Düzce University Education Faculty Science Education Department, Düzce-Turkey
Abstract
This study aimed to investigate the influence of “Inquiry Based Science Program (IBSP)” on scientist image of 6th
graders and the perceptions underlying these images. 29 students attending the 6th grade of a secondary school in
Ankara participated in the study. However, data from 24 students were used in the study since 5 students could not
complete the research. The program lasted 31 weeks during 2012-2013 academic year. Students’ images about
scientists were identified before and after the program implementation via DAST. Data obtained via DAST were
analyzed through DAST-C. Results of analysis showed that IBSP did not change students’ stereotypical scientist
images but only increased their focus on technology symbols. Semi-structured interviews were given to determine the
reasons why IBSP was unable to change students’ stereotypical scientist images. Results obtained from semi-
structured interviews pointed to the fact that since students i) believed that they “learned about” doing science
instead of doing science, ii) arrived at known events, phenomena or concepts as a result of their research and iii) did
qualitative research in social fields in their inquiries, they did not feel themselves as scientists and therefore their
scientist images did not undergo transformations. These results point to the fact that the program in which the
purpose is to teach science by using inquiries that involve qualitative research techniques has no influence on
students’ scientist images.
Keywords: Inquiry, Science Teaching Program, Scientist Image
1. Introduction
Studies related to identification of individuals’ scientist images which started in 1957 with Mead and
Metraux’s study are becoming more prominent along with the increases of the importance of science and
technology. Mead & Metraux (1957) asked 35.000 high school students to prepare written documents
about scientists. Results of their research pointed to the fact that individuals generally expressed their
views on scientists as follows:
The scientist is a man who wears a white coat and works in a laboratory. He is elderly or
middle aged and wears glasses . . . he may wear a beard. . . he is surrounded by equipment:
test tubes, bunsen burners, flasks and bottles, a jungle gym of blown glass tubes and weird
machines with dials . . , he writes neatly in black notebooks . . . One day he may straighten up
and shout: “I’ve found it! I’ve found it!”. . . Through his work people will have new and
better products. . . he has to keep dangerous secrets . . . his work may be dangerous . . . he is
always reading a book (p. 386).
Semantic differential scale, Likert type scales and essays were used in various studies from Mead &
Metraux (1957) to Chambers (1983). Results of studies undertaken in the ‘60s and ‘70s showed that
students had a stereotypical scientist image resistant to change and that this image was common for
individuals from various cultures worldwide.
Chambers (1983) developed “Draw A Scientist Test” (DAST) technique. The researcher portrayed
students’ images about scientists through the drawings of 4807 primary grade students (pre-school to 5th
grade). Study results pointed that students’ images about were generally collected under seven categories:
lab coat, glasses, beard or mustache, technology symbols, knowledge symbols, research symbols and
topics regarding the field of study.

Sedat Karaçam
204
In order to increase the reliability of data obtained from DAST, students have been asked to explain their
drawings or draw more than one scientist in the studies undertaken since 1990’s. In addition to this,
several instruments including interviews, surveys composed of open-ended questions, semantic
differential and Likert type scales, DAST and essays have been used to describe individuals’ images
about scientists. These studies (Mason, Kahle & Gardner, 1991; Bowtell, 1996; She, 1998; Farland, 2003;
Scherz & Oren, 2006) also found students’ scientist images to be stereotype.
It is stated that students’ scientist images are related to their attitudes towards science, their self-efficacy
and locus of control and influence their tendency to have future careers in science (Finson, 2002).
Similarly She (1998) expresses that stereotypical scientist images negatively affect science careers and
therefore studies should be supported that facilitate students’ perceptions of scientists as individuals that
can be met in daily life. To increase student tendencies to have future science careers, studies have
emphasized the need for practices that will reconstruct students’ scientist images towards a more realistic
image rather than the stereotypical scientist image that the students have. In that context, the study
examined the influence of IBSP in changing 6th grade students’ stereotypical scientist images. Previous
studies in the field are provided below.
2. Theoretical Framework
Although the importance of positively structuring students’ scientist images is emphasized, rather limited
number of strategies has been developed in this field. With their general perspectives towards influencing
students’ scientist images in the positive direction Finson (2002) stated that students’ scientist images are
more stereotypical in traditional approach compared to constructivist approach.
Studies that focus on changing students’ stereotypical scientist images are examined below:
Visiting the Scientists
Studies that focus on the strategy of visits aim to make students realize that scientists are actual
individuals, have them accept scientists as role models and observe their work environment and working
styles. Smith & Erb (1986) who used this strategy in their studies that focus on visiting especially female
scientists found that this strategy facilitated positive views towards science and female scientists in 5th-
8th graders. In another study, Scherz & Oren (2006) implemented a program for 8th and 9th graders that
involved visits to centers that provided scientific and technological activities, observations in these
centers and undertaking and reporting a sample research. Study results showed that the implementation
positively affected students’ science, technology and scientist images and students’ scientist images
changed in the positive direction.
Science Camp
General purpose of the science camp is to have students regard scientists as actual individuals, accept
them as role models and become aware of their work via hands-on activities. In their study,
Leblebicioglu, Metin, Yardimci & Cetin (2011) identified that secondary school students portrayed
scientists as male and elderly in the pre-test but portrayed them as female and young in the post-test.
Similarly, the number of stereotypical indicators was found to decrease in the post-test. Farland-Smith
(2012) found that 5th-9th graders’ image of scientists as individuals with lab coats, bald, single males that
work with chemical materials and instruments was revised after the science camp practice and they
developed the image of scientist as female individuals who work outside the lab. Researchers claimed
that one main reason that led to these results was the existence of female scientists in the camp and the
research samples were selected from environments outside the lab.
Inviting scientists to teaching environments
General aim of studies that focus on inviting scientists to teaching environments is to provide students
with information about scientists, their work and their experiences in making decisions to become
Beyond Inquiry Based Science Program: It’s Relevance in Changing Students’ Stereotypical Images
about Scientist
205
scientists. In their study which utilized this strategy, Mason et al. (1991) identified that compared to the
control group, high school students in the experimental group drew higher number of female scientists
and produced fewer drawings of dangerous experiments. Bodzin & Gehringer (2001) determined that the
percentage of students who drew scientists as male and with lab coats and glasses decreased in the post
test compared to the pre-test. Howitt & Rennie (2008) suggested that practices such as inviting scientists
to the classroom positively affected students’ science and scientist images and that the effects were
stronger in younger children compared to older children.
In their study, Buck, Leslie-Pelecky & Kirby (2002) provided hands-on activities in the class for students
with the participation of scientists in addition to practices mentioned above. Results of the study
implemented on 4th and 5th graders showed that although inviting female scientists to the classroom
allowed students to question their stereotypical images about scientists, their images did not change.
In their study, Chen & Cowie (2013) and Narayan (2011) based their study on sharing videos in which
scientists presented themselves rather than inviting them to the teaching environments. As results of those
study it is found that students’ scientist images became more realistic as a result of the study.
Inviting scientists to teaching environments and visiting scientists
The majority of studies that focused on inviting scientists to teaching environments and visiting them in
their work environments aim to provide information about scientists, their work, their work environments
and their experiences related to their career choices. In their study, Cakmakcı, Tosun, Turgut, Orenler,
Sengul & Top (2011) claimed that the majority of the students in the experimental group started to regard
scientists as actual individuals rather than bionic and legendary creatures however students in the control
group kept their stereotypical line of thoughts and continued to think of scientists as male individuals
with no social lives working in labs, wearing lab coats. Hopwood (2012) found that 6th graders’ formal
interactions with scientists positively affected their stereotypical images. As a result of the
implementation undertaken with 5th graders, Flick (1990) found that students mostly drew female
scientists and used plant and animal figures in their drawings instead of vaporous test tubes.
Presenting scientists’ life stories
Studies in this group aim to help students take scientists as role models with the help of scientists’ life
stories that present some characteristics of scientists. In their study, Varda, Koren, Rubin & Buck (2013)
examined the effects of a model that involves testing, explanation, confrontation, creation of
disequilibrium and extension based on scientists’ life stories on teacher candidates’ scientist images.
Results showed that although teacher candidates’ scientist images were stereotypical in the pre-test, the
number of students who drew female scientists and scientists who worked in fields other than chemistry
increased after the implementation. Erten, Kiray & Sen-Gumus (2013) investigated the effects of content
based teaching approach and using life stories of scientists on the science and scientist image of 11-12
years old students. Changes in some categories of stereotypical images were observed.
Sharkawy (2009; 2012) examined the effects of presentations of scientists’ life stories from different
cultures on students’ scientist images found that students drew more female scientists, scientists with
different ethnic backgrounds and scientists who worked together in the post test compared to the pretest.
Different from the studies mentioned above, Korkmaz (2011) found that presenting scientists’ life stories
did not change students’ scientist images but extended them.
Scientific Inquiry (hands-on) activities
The goal of inquiry based studies is to have students work as scientists, have them feel like scientists and
ensure changing their scientist images. In their study, Jane, Fleer & Gipps (2007) examined the effects of
hands-on activities on primary school students’ scientist images. Results showed that hands-on activities

Sedat Karaçam
206
allowed students to question stereotypical images by letting students feel like scientists but this
questioning was not reflected on students’ drawings. Huber & Burton (1995) investigated the effects of a
program composed of hands-on activities on 12 year-old students’ scientist images. Results pointed that
although the program had very little effect on female students’ scientist images, it actually decreased
male students’ stereotypical scientist images. Kielborn’s (2001) study examined the effects of field-based
research on 6th graders’ scientist images. Study results found that students drew younger scientists that
worked in outer environments and used more research symbols in their drawings in the post-test
compared to pre-test. Based on these findings, it was found that field-based research practices allowed
changes in students’ science and scientist images since they gave students the feelings of doing science
and working as scientists. The results of the study by Avraamidou (2013) in which students participated
in inquiry activities with scientists showed that prior to implementation, the majority of students had
stereotypical scientist images but these images were reconstructed as a consequence of the
implementation. Researchers suggested that practices that aim to change images should be lengthier and
take part in environments outside the school. Altun & Yıldız-Demirtas (2013) investigated the effects of
the teaching program composed of inquiry and scientists’ life stories on 6 year-old children’s scientist
images. Results showed that the teaching program was effective on children’s scientist images.
Based on the studies in the literature, it is suggested that inquiry positively affects scientist images since it
allows students to do research like scientists.
Rationale of this Study
Studies undertaken in the last twenty years have generally focused on changing stereotypical scientist
images since these images negatively affect student tendencies to have future careers in science. Main
purpose of these studies can be summarized as providing opportunities for students to revise their
scientist images of males that work with chemical materials in labs by themselves and have revised
images of scientists as females or males who can work in environments other than labs in cooperation
with a group of people by using materials other than chemicals. The majority of studies in this regard
(Smith & Erb, 1986; Mason et al., 1991; Scherz & Oren, 2006; Leblebicioglu et al., 2011; Farland-Smith,
2012) are based on teaching strategies that allow formal or informal interactions with scientists in which
students have the opportunities to adopt scientists as their role models. It is identified that the strategies
implemented in the framework of these studies positively affect students’ scientist images since they
allow informal or formal interactions with scientists.
Studies that do not allow interaction with scientists generally include presentations of scientists’ life
stories in teaching environments and inquiry (hands-on) activities. Results of some studies show that
students’ scientist images change as a result of studies that utilize presentations of scientists’ life stories
(Varda et al., 2013; Erten et al., 2013) however the study by Korkmaz (2011) has confirmed the opposite.
Other studies in which no interaction is present with scientists include inquiry (hands-on) activities but
the number of these studies is rather limited. Many of the studies based on inquiry (Huber & Burton,
1995; Kielborn, 2001; Avraamidou, 2013) include hands-on activities for students. It is suggested that
inquiry approach leads to positive images since it allows students to do research feel like scientists. In
general, hands-on activities in the literature are expected to change students’ scientist images. Unlike
other studies in the literature, this study did not limit student inquiries with hands-on activities and
allowed students to do research on areas in the framework of teaching science that were of interest to
them. In this sense, the current study is expected to provide answers to the following question: “Do
inquiries that are not based on hands-on activities and prepared in the framework of teaching science
influence students’ scientist images?” Students generally involve inquiry experiences except hand on
activities. “So if we construct science education based on inquiry except hands on activity, may this
educational situation provide to change students’ images about scientist?” The answer to this query is
expected to shed some light on the literature regarding whether students’ scientist images can be changed
while teaching science and/or social science.

Beyond Inquiry Based Science Program: It’s Relevance in Changing Students’ Stereotypical Images
about Scientist
207
3. Method
Research Method
The study utilized case study which is a qualitative research technique (Creswell, 2013). According to
Creswell (2013), case study is an approach in which the researcher can portray a situation or present the
themes or collect detailed and in-depth information about real life, a modern limited system or multiple
limited systems in a specific period via multiple sources of information such as interviews, observations
and documents. So in this study, 6th graders is approached as a case and examined the influence of IBSP
on students’ scientist images.
Participants
A total of 29 students attending 6th grade of a secondary school located in one of the central districts of
Ankara during 2012-2013 academic year participated in the study. Students were informed about IBSP,
program implementation period and the expectations. Students were given a week to enroll in the
program if interested. At the end of a week, 29 students were registered to take part in the program. Since
the number of students was not too high, no selection was necessary and all voluntary students were
included in the study. However, data from 24 (female=13, male=11) students were used in the study since
5 of the volunteer students could not complete their studies during the implementation period of the
study. In socio-economic respects, the participating students are the children of immigrant families who
came to Ankara to find employment from the rural parts of Anatolia. In this sense, these families who
came from a closed culture are still adapting to the urban culture. It is possible for families and children
to reflect naïve cultural elements in which rural regions, Islam and Turkish cultures are blended together.
In the economic sense, all of the mothers are housewives and the fathers work in either private sector in
government with regular employment. These families believe that their children can improve their socio-
economic levels through education and they consider the education process of their children as important.
However, mothers generally take part in their children’s learning and the fathers are the authority figures
in the households.
Examination of students’ science education process shows that they learn science topics in the framework
of social studies in grades 1 through 3. Social studies classes consist of thematic units based on social
knowledge and science topics. Students start to learn science topics in 4th and 5th grades in Science and
Technology lesson but this class is not taught separately and taught alternately with social studies each
month. Students are taught one unit from Science and Technology lesson one month and taught one unit
from Social Studies in the following month. Lessons 1-5 in which students learn about science are taught
by classroom teachers who are not trained in science education. Students start to take Science and
Technology lesson starting from the 6th grade. This lesson is taught three hours a week by teachers who
are at least bachelors in the field.
Implementation
The implementation was undertaken in 2012-2013 academic year. Before starting with the IBSP, students
were given DAST in order to identify their scientist images and they were asked to draw a scientist at
working and explain their drawings. Following DAST, IBSP was implemented with the purpose of
teaching science. IBSP was prepared by one field expert and three Science and Technology teachers. The
implementation continued for a total of 31 weeks, two hours per day for two days a week in addition to
regular class hours and was taught in the science lab by a teacher expert in the field. IBSP process can be
summarized as follows: firstly work was done to increase student awareness towards science and
scientists. Later, trainings were provided to identify the problem, to form hypotheses and to determine the
variables in scientific studies in relation with the question “How are scientific studies are done?”.
Students were not directed to work individually or in groups and were allowed to do their research
individually or in groups according to their wishes. During this period, students were grouped based on
their interests and started to define the problems they would work on. Students were not interfered with

Sedat Karaçam
208
while they were making decisions regarding the problem they would work on. Students decided on the
problems themselves based on their interests and concerns. Activities to introduce scientific methods
were provided after decision making phase. In this stage, all students formed their groups, identified their
problems and some of them even determined their research methods. Three students each in different
groups in the program focused on the problems cited below:
“What are the effects of gender and fondness for sweet things on 6th graders’ body mass index?”
“What are the effects of fruit consumption and gender on adults’ blood values?”
“What are the views of primary school 4th and 8th graders on smoking?”
“Which of the technological tools are most frequently used by 6th graders?”
“What are the perceptions regarding the changes that occur in the body during old age?”
“What are the views of adults regarding whether science is done in Turkey and the reasons related to
these views?”
“What are the first things that adults think when they hear the word medicine?”
Two students each from different groups focused on the problems provided below:
“What are the effects of watching documentaries and gender on 6th graders fondness for science
classes?”
“What are the technological tools 1st graders think first when they hear the term technological tools?”
“Are teachers’ shouting to “go in the classroom” or blowing whistles to collect students effective on
student behavior to get back to class at the end of the break?”
One student each from different groups worked on the topics specified below:
“What are the effects of gender on the amount of chocolate consumption?”
“What are the views of 6th graders related to the strongest car in the world?”
After all students identified their topics, literature review was undertaken. Students were supported to
identify key concepts in this stage. Students reviewed the literature for two weeks and shared the
resources they found with the researcher. The researcher provided guidance in selecting the resources that
were related to the topic. Later, data collection process began. Prior to data collection process, questions
were identified with the students and pilot studies were undertaken. Data collection process was
completed in two weeks.
Students were taught how to analyze especially qualitative data and data analysis was undertaken by the
students. Analysis of quantitative data was undertaken by the researcher with the help of the students and
this task was used to raise student awareness. Students reported their research in the last phase. 5 students
who were studying the problems of “What are the views of adults regarding whether science is done in
Turkey and the reasons related to these views?” and “Are teachers’ shouting to “go in the classroom” or
blowing whistles to collect students effective on student behavior to get back to class at the end of the
break?” could not complete their research. Other students successfully completed their research. DAST
was implemented again following the completion of the teaching program in order to redefine students’
scientist images. Analysis of DAST showed that the teaching program did not change students’
stereotypical scientist images. Semi-structured interviews were organized to study the reasons for this
finding. The whole process of program implementation and data collection was conducted in the school
lab and students were provided with the necessary technological tools during the research phase.
Data Collection Techniques
Two data collection techniques were used in this study: semi-structured interview and Draw-A-Scientist
Test (DAST).
Semi-Structured Interview
A semi-structured interview was given to students to identify student perceptions regarding the reasons
why IBSP was unable to change stereotypical scientist images. The interview was organized in the pilot
school’s laboratory with the participation of all students that participated in the study. Interview questions

Beyond Inquiry Based Science Program: It’s Relevance in Changing Students’ Stereotypical Images
about Scientist
209
were prepared by two experts in the field. The interview was recorded with video and audio. Students
were asked the following questions during the interview:
Can you see the difference when you compare the drawings about scientists I asked you to draw before
and after your research?
Why is/isn’t there a difference?
Have you ever considered drawing yourself when you drew your scientist image after your research was
completed? Why?
Draw-A-Scientist Test (DAST)
DAST was used to determine sixth graders’ images about scientists. This test was developed by
Chambers (1983) and was used in various studies (She, 1995; Newton & Newton, 1998). DAST was used
to have students present their relevant images about scientists. Students were informed before DAST
implementation that they could use colored pen/pencils in their drawings and that they could also write on
their drawings. Students were also told that their drawings were not to be examined for accuracy or
validity, they were not going to be judged for accuracy and they were expected to present their visual
imageries about scientists in their drawings. Students were asked to provide a written expression about
their drawings to support the analysis. Students were given one class hour to complete their drawings.
Analysis
Different approaches were used to analyze the data collected via two separate data collection tools. Data
obtained from DAST were analyzed by using DAST-C. DAST-C was developed by Finson et al. (1995).
Researchers developed this checklist through a stereotypic characteristic derived from literature reviews
related to students' images of scientists and especially DAST-C firstly developed by Chambers (1983).
DAST-C consists of seven indicators about scientists. DAST-C developed by Finson et al. (1995) consists
of some indicators about individuals’ stereotypical scientist images. Those indicators are “lab coat,
eyeglasses, facial hair, symbols of research, symbols of knowledge, technology products, relevant
captions, male gender, Caucasian, indications of danger, presence of light bulbs, mythic stereotypes,
indications of secrecy, scientist working indoors, and middle-aged or elderly scientist”. Indicators found
in the study that were not normally included in DAST-C were added to the coding list. Frequencies and
percentages of stereotypical indicators found in the pre and posttest drawings of students were identified
and compared.
Semi-structured interview data were analyzed through descriptive analysis method (Merriam, 1998).
Interviews were transcribed and all data were carefully read. This procedure allows the researcher to be
informed of the whole data. The second phases consisted of coding. Student expressions were coded in
this stage. Coding was undertaken by two experts in the field. When the coding procedure was completed,
consistency between the two coders was examined by using the approach developed by Miles &
Huberman (1994). It was found that 22 of the 24 codes provided by two coders were consistent with each
other and there was 92% consistency between the two coders. This ratio shows that the results obtained
via the interview technique were reliable. Miles & Huberman (1994) asserted that consistency values
above 90% between coders indicate high reliability of results. The codes that did not provide consistency
were reviewed and a common decision was made.
4. Findings
Although the study was initiated with 29 students, only 24 students were able to complete the study.
Therefore, the pre and post drawings of only those 24 students were taken into consideration during data
analysis. Findings obtained through analyses are provided in two headings:
Does IBSP have an influence on 6th graders’ scientist images?
Table 1 presents participating students’ scientist images obtained from pre and post IBSP.

Sedat Karaçam
210
Table 1. Percentage of DAST-C indicators relevant to students’ images about scientists obtained
from pre and post-test drawings
Categories Indicators Pre Post
f (%) f (%)
Outlook of
Scientist
Lab coat 19 (79,2) 18 (75)
Casual 3 (12,5) 5 (20,8)
Uniform (Dress/Skirt etc.) 2 (8,3) 1 (4,2)
Eye glasses 12 (50) 9 (37,5)
Hair Style
Bald 2 (8,3) 0
Untidy 8 (33,3) 10 (41,6)
Neat 14 (58,4) 14 (58,4)
Facial hair Beard 2 (8,3) 4 (16,6)
Moustache 2 (8,3) 3 (12,5)
Symbols of
research
(volumetric flask, test tubes, atom model, Bunsen burner, glass pipe,
bones) 23 (95,8) 23 (95,8)
Symbols of
knowledge
(books, chalkboard, charts/posters, clipboards, pens in pocket,
bookshelves) 12 (50) 12 (50)
Symbols of
technology
(computers, head-light, stethoscope, rocket, microscopes, telescope,
repair tool, telephone) 7 (29,2) 12 (50)
Relevant captions 3 (12,5) 3 (12,5)
Gender Male 24 (100) 24 (100)
Female 0 0
Age
Old 6 (25) 7 (29,2)
Middle Age 18 (75) 16 (66,6)
Young 0 1 (4,2)
Working Place In door (Laboratory, working room etc.) 24 (100) 24 (100)
Outdoor (Space, Ocean, Nature etc.) 0 0
Facial
Expression
Smiling/Happy 17 (70,8) 17 (70,8)
Wild/Crazy 2 (8,3) 2 (8,3)
Frowning/Angry 1 (4,2) 1 (4,2)
Unhappy 1 (4,2) 0
Thoughtful (Question Marks/Thinking balloons etc.) 3 (12,5) 4 (16,6)
Working with
group or alone
Alone 24 (100) 24 (100)
Group 0 0
Presence of light bulb 1 (4,2) 3 (12,5)
Indication of danger 2 (8,3) 2 (8,3)
Mythic Stereotypes (Frankenstein, etc.) 0 0
Indication of secrecy 0 0
Examination of Table 1 shows that 79.2% of the students drew scientists in lab coats prior to
implementation while 75% used lab coats in their drawings of scientists after the implementation.
Students who did not use lab coats in their drawings of scientists drew them in casual clothes or in suits.
Raito of students who drew scientists with glasses was 50% prior to implementation whereas this ratio
was found to be 37.5% after the implementation. The majority of students (58.4%) drew scientists with
tidy hair both in pre and post drawings. While the ratio of students who drew scientists as bald was 8.3%
prior to implementation, no students drew scientists as bald subsequently. The ratio of students who drew
scientists with untidy hair was 33.3% prior to implementation and this ratio increased to 41.3% after the
implementation. Ratio of students who drew scientists with facial hair was found to be rather low. While
8.3% students drew scientists with beards or mustaches prior to implementation, the ratio of students who
drew scientists with beard and mustache was found to be 16.6% and 12.5% respectively after the
implementation. Prior and subsequent to implementation, 8.3% of the students drew wild/crazy scientists
and 4.2% drew them as frowning and angry.

Beyond Inquiry Based Science Program: It’s Relevance in Changing Students’ Stereotypical Images
about Scientist
211
Prior and subsequent to implementation, the majority of students emphasized symbols that surround
scientists. 95.8% of the students emphasized symbols such as bunsen burners, flasks etc. similarly 50% of
the students were found to emphasize knowledge symbols such as books, pencils, note pads etc. prior and
subsequent to implementation. Although there were no differences between the ratio of knowledge and
research symbols used in their drawings of scientists prior and subsequent to implementation, the ratio of
technology symbols use was found to increase. 29.25 of the students were found to include technology
symbols prior to implementation whereas this ratio increased to 50%. 12.5% of the students used relevant
captions prior and subsequent to implementation.
Students were found to draw scientists as single males working indoors both prior and subsequent to
implementation. 25% of the students drew scientists as old and 75% as medium aged prior to
implementation while after the implementation, 29.2% drew scientists as old, 66.6% as medium aged and
4.2% as young. The majority of students (70.8%) drew scientists as smiling/happy prior and subsequent
to implementation. While 12.5% of the students drew scientists as thoughtful prior to implementation,
16.6% of the students drew them as thoughtful subsequently. 8.3% of the students were found to draw
scientists as individuals who undertake dangerous experiments prior and subsequent to implementation.
4.2% of the students were found to prefer light bubble in their drawings prior to implementation while
this ratio increased to 12% after the implementation. None of the students drew scientists as mythical
persons or as individuals with secret missions. Some of the pre and post drawings are presented in
appendix A.
Why did not students draw themselves as scientists during post-test? Why did not their experiences
about inquiry influence their images about scientists?
Students in the study undertook qualitative research in social fields in the framework of IBSP. However,
it was found that students’ scientist images were not influenced by the program that was implemented. A
semi-structured interview was given to students to identify student perceptions regarding the reasons why
the program was ineffective to cause change. Data obtained from this interview is provided below.
Various questions were asked in the interview but this section provides quotations from answers provided
to the following question: “Why did not you draw yourself as a scientist in your drawing following the
completion of your research?.
All of the students in the study emphasized the theme “unable to feel like scientists” during their
research. Student perceptions regarding this theme were collected under three codes: obtaining
knowledge and results about already known events, concepts or phenomena as a result of their research,
learning about science instead of doing science and using qualitative techniques. 58.4% of the students in
the study (f=14) stated that they did not feel like scientists because they learned about science instead of
doing it and therefore they did not think of drawing themselves as scientists following the
implementation. Some student views are provided below:
“….We only learned about doing science in our research. Scientists do not learn in this manner.
Therefore I have never regarded myself as a scientist….”. (S1)
“…I have never felt like a scientist. When you called us doctors and I was laughing because we were
like apprentices instead. Like the apprentices of scientists. We were learning how to do science….”.
(S23)
“…We learned about science. We just sat and listened to the teacher. Scientists do not listen to
teachers. They do scientific studies…”. (S14)
25% of the students (f=6) stated that they did not feel like scientists because they obtained knowledge and
results about already known events, concepts or phenomena as a result of their research. Some student
views are provided below:
Sedat Karaçam
212
“…We cannot be scientists, why would I draw myself? We found the already known concepts via our
research. Scientists find new /unknown things such as atom, electricity, the light bulb..”. (S3)
“…Scientists create things that do not already exist. We did not do that at all. I measured my friends’
height and weight and calculated their indexes. We discovered that female indexes were higher. We
already see girls are fatter. Scientists do not act like that. They discover the unknown and tell other
people…”. (S22)
“…I could not do the drawing based on myself, teacher. Because they told me that they smoked
because they aspired to smoke because of their peers. They already know that. I found something in
my study that was already known. Scientists do not do that. They discover knowledge that others do
not know…”. (S7)
16,6% of the students (f=4) stated that they did not feel like scientists because they used qualitative
techniques in their research. Some student views are provided below:
“…We gave interviews and obtained our friends’ views about smoking. Scientists do not do that, they
do experiments….”. (S9)
“…I do not believe that doing science is as easy as what we did here. We did not work like scientists.
They do experiments day and night. They do discoveries. We asked questions to people and they
answered. We recorded and examined them…”. (S19)
“…I could not have drawn myself as a scientist because you cannot be a scientist by obtaining the
ideas of others. We are not scientists at all. Journalists do what we did here….”. (S15)
5. Discussion
The study examined the influence of IBSP on students’ stereotypical scientist images and student
perceptions regarding the reasons related to these imageries. The study consisted of a hypothesis that
students’ stereotypical scientist images would change due to the program in the framework of IBSP since
students did research in social fields under IBSP. However, pre and posttest results showed that the
majority of students perceived scientists as happy and elderly or middle aged male individuals wearing
lab coats and working alone in a lab surrounded by research symbols such as chemical materials. The
ratio of scientist image as individuals with glasses,, beards or mustaches in DAST pre and posttest
implementation was found to be lower than those found in studies by Chambers (1983) and Finson et al.
(1995). While there was not a general emphasis on technology symbols in student drawings, it was
identified that the ratio of students who used technology symbols in their drawings in the posttest was
higher compared to the pretest. Results show that IBSP did not change students’ scientist images but
extended them. This finding is contradictory to the findings of various studies in the literature (Huber &
Burton, 1995; Kielborn, 2001; Avraamidou, 2013). However, results of the study undertaken by Jane et
al. (2007) support the findings of the current study.
Literature states that the main reason for the inability to change students’ scientist images is based on the
fact that these images are fully formed by 5th grade and the resistance to change increases in the
following educational levels (Finson, Pederson & Thomas, 2006). However, many studies that
implemented hands-on activities in 5th grade and higher grades (Huber & Burton, 1995; Kielborn, 2001;
Avraamidou, 2013) found that these programs positively affect students’ scientist images. Results in the
literature indicate that the inability of IBSP in changing 6th graders’ scientist images cannot be explained
by resistance to change. Therefore, reasons regarding the inefficacy of IBSP to change students’
stereotypical scientist images and the contradictory findings of the study with the findings of previous
studies in literature should be assessed in terms of student perceptions regarding IBSP.
Studies in the literature (Huber & Burton, 1995; Kielborn, 2001; Avraamidou, 2013) cite the fact that
inquiry activities make students feel like scientists and therefore these programs positively affect
students’ scientist images in general. However, data form student interviews in the current study show
that students stated they did not feel like scientists during inquiry activities. The reason of the
Beyond Inquiry Based Science Program: It’s Relevance in Changing Students’ Stereotypical Images
about Scientist
213
contradictory findings between this study and the studies in the literature is based on whether students
feel like scientists or not during inquiry activities. In order to understand the background of this
contradiction, it is necessary to answer the following question: “Why students did not feel like scientists
during the activities undertaken in the framework of IBSP?”. Examination of data obtained from
interviews shows that students did not feel like scientists because i) they believed they learned about
science instead of doing science, ii) they believed they obtained knowledge and results about already
known events, concepts or phenomena as a result of their research and iii) they did research in social
fields by using qualitative techniques. It can be claimed that the contradictory findings of this study with
the findings in previous studies may be based on the differences of goals and scope of inquiry activities in
various programs.
When inquiries are examined in terms of goals, it can be stated that inquiries implemented in the
framework of ISBP in this study were not effective to make students feel like scientists since they stayed
at the level of only learning about science and therefore this program did not influence students’ scientist
images. Kirschner, Sweller & Clark (2006) define that type of inquiry as “Science as inquiry”. According
to researchers, the teaching environment focuses on teaching scientific processes during “science as
inquiry”. Kirschner et al. who defined the other dimension as “science by inquiry” claim that this
dimension focuses on teaching a scientific topic by using inquiry. As a result, it can be stated that
programs based on “science as inquiry” approach do not give students the feeling that they work like
scientists and therefore have no effect on students’ scientist images. Similarly, as a result of their study on
4th graders, Zhai, Jocz & Tan (2013) found that compared to approaches based on “science as inquiry”,
the approaches using “science by inquiry” help students fell like scientists and they shape student views
about classroom experiences and their perceptions on science and scientists. Based on the results of this
study and the findings by Zhai et al. (2013), we can claim that students’ scientist images cannot be
changed by programs based on teaching science and inquiry approach. Thus, “science by inquiry”
approach should be used rather than “science as inquiry” approach in implementations that aim to change
students’ stereotypical scientist images.
When inquiries are examined in scope, we see two dimensions. The first dimension is the student views
that they obtained already known events, phenomena and concepts as a result of their research. Archer,
DeWitt, Osborne, Dillon, Willis & Wong (2010) found that 6th graders believed scientific studies
undertaken at the school helped them to rediscover known scientific knowledge whereas scientists
discovered real scientific topics and reconstructed scientific knowledge. Researchers stated that this
perception affected the probability of defining oneself as scientist and influenced self-esteem. The other
dimension is related to the use of qualitative research techniques such as interviews in the study (different
than studies in the literature). Since students perceive scientists as individuals who do experiments, they
feel like scientists when hey undertake hands-on activities. Similarly Zhai et al. (2013) also identified in
their study that students regard themselves as scientists the most when they do experiments.
6. Conclusion and Implications
This study which examined the effects of IBSP, a program that aims to teach science, on students’
scientist images identified that inquiries implemented in the framework of IBSP did not have any
influence on students’ scientist images. The reasons related to the lack of influence of IBSP on students’
scientist images were found to be related to the fact that students did not feel like scientists since they
believed that they learned about science instead of doing science in the inquiries implemented during the
program, they obtained known events, phenomena and concepts in their research and used qualitative
research techniques in their study such as interviews. These results show that students do not feel like
scientists with the implementation of a program that sets to teach science based on inquiry approach and
therefore their images cannot be changed. The rationale for using inquiry based approaches is related to
the thesis that prerequisite for changing students’ scientist images requires increasing student awareness
Sedat Karaçam
214
to science and scientific process. However it is only an assumption and therefore studies should be
undertaken towards the following problem as well: “Does a program that aims to teach science to
students with science and scientific process awareness influence their scientist images?”
Based on the results of this study, it can be claimed that the main purpose of studies that aim to change
students’ scientist images via inquiry based programs should be to have students feel like scientists as a
result of implemented inquiries. Literature suggests that “science by inquiry” approach should be adopted
to ensure that students feel like scientists instead of “science as inquiry” approach that aim to teach
science. However “science by inquiry” approach should be implemented in a manner to prevent students
from not feeling like scientists due to the effects of obtaining already known events, phenomena and
concepts and due to the use of qualitative research techniques such as interviews. Thus, support of
scientists should be sought to have them as role models in inquiry studies implemented in line with
science by inquiry approach. Another suggestion is the use of hands-on activities rather than inquiries that
use qualitative research techniques such as interviews. These suggestions are for 6th graders. A study can
be implemented to examine the effects of inquiries (without scientists support and by using qualitative
research techniques) on students at higher levels.
References
Altun, E. & Yıldız-Demirtas, V. (2013). Effectiveness of science and scientists teaching program
prepared for children age 6. Mehmet Akif Universitesi Egitim Fakultesi Dergisi, 13(27), 67-97 (In
Turkish).
Archer, L., DeWitt, J., Osborne, J., Dillon, J., Willis, B., &Wong, B. (2010). ‘Doing’ science versus
‘being’ a scientist: Examining 10/11-year-old schoolchildren’s constructions of science through the
lens of identity. Science Education, 94(4), 617–639.
Avraamidou, L., (2013). Superheroes and supervillains: Reconstructing the mad-scientist stereotype in
school science. Research in Science & Technological Education, 31(1), 90-115. DOI:
10.1080/02635143.2012.761605
Bodzin, A., & Gehringer, M. (2001). Breaking science stereotypes: Can meeting actual scientists change
students’ perceptions of scientists? Science and Children, 36–41.
Bowtell, E. (1996). Educational stereotyping: Children's perceptions of scientists: 1990's style. Australian
Primary & Junior Science Journal, 12(1).
Buck, G. A., Leslie-Pelecky, D. & Kirby, S. K. (2002). Bringing female scientists into the elementary
classroom: Confronting the strength of elementary students' stereotypical images of scientists.
Journal of Elementary Science Education, 14(2), 1-9.
Cakmakcı, G., Tosun,O., Turgut, S., Orenler, S., Sengul, K. & Top, G. (2011). Promoting an inclusive
image of scientists among students:Towars research evidence-based practice. International Journal
of Science and Mathematics Education, 9(3), 627-655
Chambers, D. W. (1983). Stereotypic images of the scientist: The A-Draw-Scientist-Test. Science
Education, 67(2), 255–265.
Chen, J. & Cowie, B. (2013). Scientist talking to students through videos. International Journal of
Science and Mathematics Education. 12(2), 445-465. DOI: 10.1007/s10763-013-9415-y.
Creswell, J. (2013). Qualitative inquiry and research design: Choosing among five approaches, 3rd
edition. SAGE Publications - ISBN 9781412995306.
Erten, S., Kiray, S.A., & Sen-Gumus, B. (2013). Influence of scientific stories on students ideas about
science and scientists. International Journal of Education in Mathematics, Science and Technology,
1(2), 122-137.
Beyond Inquiry Based Science Program: It’s Relevance in Changing Students’ Stereotypical Images
about Scientist
215
Farland, D. (2003). Modified draw-a-scientist test. Unpublished doctoral dissertation, University of
Massachusetts, Lowell.
Farland-Smith, D. (2012). Personal and social interactions between young girls and scientists: Examining
Critical aspects for identity construction. J Sci Teacher Educ, 23, 1–18. DOI 10.1007/s10972-011-
9259-7
Finson, K. D., Beaver, J. B. & Cramond, B. L. (1995). Development and field tests of a checklist for the
draw-a-scientist test. School Science and Mathematics, 95 (4), 195-205.
Finson, K. D. (2002). Drawing a scientist: What do we do and do not know after fifty years of drawings.
School Science and Mathematics, 102, 335-345.
Finson, K. D., Pedersen, J., & Thomas, J. (2006). Comparing science teaching styles to students'
perceptions of scientists. School Science and Mathematics, 106(1), 8-15.
Flick, L. (1990). Scientist in residence program improving children’s image of science and scientists.
School Science and Mathematics, 90, 205-214.
Hopwood, A. (2012). Hosting professional scientists in the classroom:The effect on rural sixth graders’
attitudes toward science. Unpublished Thesis degree of Master in Science, Montana State
University:USA.
Howitt, C., & Rennie, L. J. (2008). Evaluation of the scientists in schools pilot project. (A report prepared
for CSIRO). Dickson, ACT: CSIRO Education.
Jane, B., Fleer, M. & Gipps, J. (2007). Changing children's views of science and scientists through
school-based teaching. Asia-Pacific Forum on Science Learning and Teaching, 8(1), 1-21
Kielborn, T. L. (2001). Sixth grade students' perceptions of science and scientists following a field-based
science investigation. Unpublished Doctoral Dissertation, The Florida State University, Florida,USA.
Kirschner, P. A., Sweller, J., & Clark, R. E. (2006). Why minimal guidance during instruction does not
work: An analysis of the failure of constructivist, discovery, problem-based, experiential, and
inquiry-based teaching. Educational Psychologist, 41(2), 75–86.
Korkmaz, H. (2011). The contribution of science stories accompanied by story mapping to students’
images of biological science and scientists. Electronic Journal of Science Education, 15(1), 1-41.
Leblebicioglu, G., Metin, D., Yardimci, E. & Cetin, P. S. (2011). The effect of informal and formal
interaction between scientists and children at a science camp on their images of scientists. Sci Educ
Int, 22(3), 158–174
Mason, C., Kahle, J. & Gardner, A. (1991). Draw-A-Scientist Test: Future implications. School Science
and Mathematics, 91(5), 193-198.
Mead, M. & Metraux, R. (1957). Images of the scientists among high-school students. Science, 126, 384-
390.
Merriam, S. B. (1998). Qualitative research and case study applications in education. San Francisco:
Jossey-Bass.
Miles, M. B. ve Huberman, A. M. (1994). Qualitative data analysis. Thousand Oaks, CA: SAGE.
Narayan, C. (2011). Year 8 students perceptions of science and scientist. Unpublished Master
Dissertation, The University of Waikato:New Zelland.
Sharkawy, A. (2009). Moving beyond the lone scientist: Helping 1st-grade students appreciate the social
context of scientific work using stories about scientists. Journal of Elementary Science Education, 21
(1): 67–78.

Sedat Karaçam
216
Sharkawy, A. (2012). Exploring the potential of using stories about diverse scientists and reflective
activities to enrich primary students’ images of scientists and scientific work. Cult Stud of Sci Educ,
7, 307–340. DOI:10.1007/s11422-012-9386-2.
Scherz, Z., & Oren, M. (2006). How to change students‘ images of science and technology. Science
Education, 90(6), 965-985. doi: 10.1002/sce.20159
She, H. (1998). Gender and Grade Level Differences in Taiwan Students’ Stereotypes of Science and
Scientists. Research in Science & Technological Education, 16(2), 125-135, DOI:
10.1080/0263514980160203.
Smith, W. & Erb, T. (1986). Effect of women science career role models on early adolescents’ attitudes
toward scientists and women in science. Journal of Research in Science Teaching, 23(8), 667-76.
Varda, B., Koren, P., Rubin, E. & Buck, A. G. (2013). Changing the image of scientists among college
students in Israel. American Journal of Educational Research, 1(9), 396-405.
DOI:10.12691/education-1-9-8
Zhai, J., Jocz, J. A. & Tan, A., (2013). ‘Am I Like a Scientist?’: Primary children's images of doing
science in school. International Journal of Science Education, 1-24. DOI:
10.1080/09500693.2013.791958.
Beyond Inquiry Based Science Program: It’s Relevance in Changing Students’ Stereotypical Images
about Scientist
217
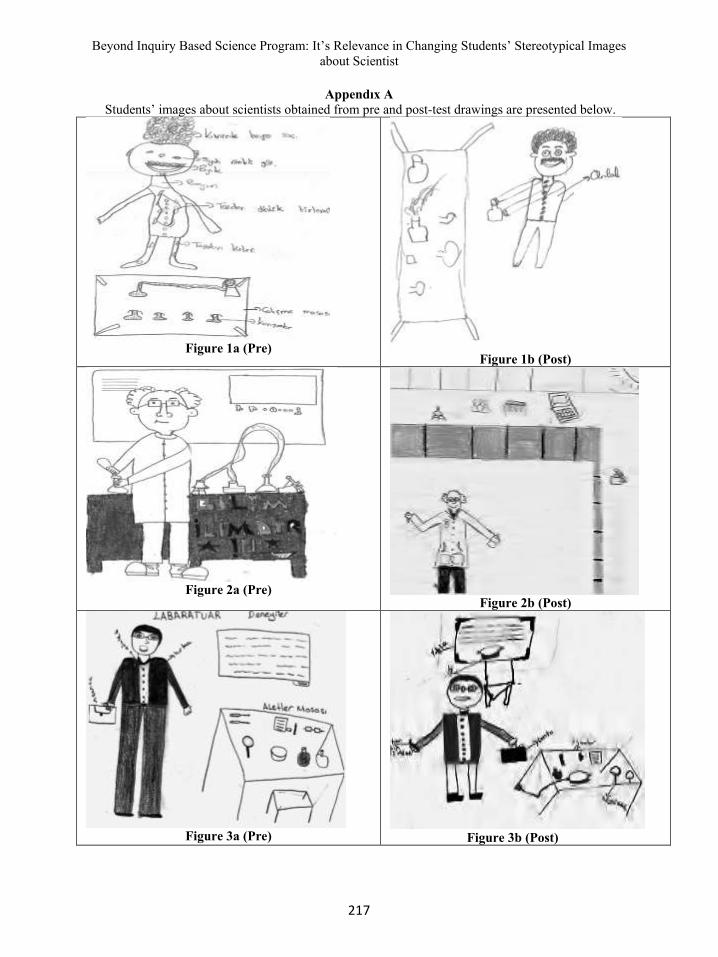
Appendıx A
Students’ images about scientists obtained from pre and post-test drawings are presented below.
Figure 1a (Pre)
Figure 1b (Post)
Figure 2a (Pre)
Figure 2b (Post)
Figure 3a (Pre)
Figure 3b (Post)
Related Documents