Beyond Financial Accounting using simple operational reports to manage causes. Wednesday, February 22, 12

Beyond financial accounting part i
Jul 18, 2015
Welcome message from author
This document is posted to help you gain knowledge. Please leave a comment to let me know what you think about it! Share it to your friends and learn new things together.
Transcript

Beyond Financial Accountingusing simple operational reports to manage causes.
Wednesday, February 22, 12

What We Will CoverWednesday, February 22, 12

What is Useful?
Wednesday, February 22, 12

What does this Mean?Image from “Understanding Variation” by Donald Wheeler, SPC Press
Wednesday, February 22, 12
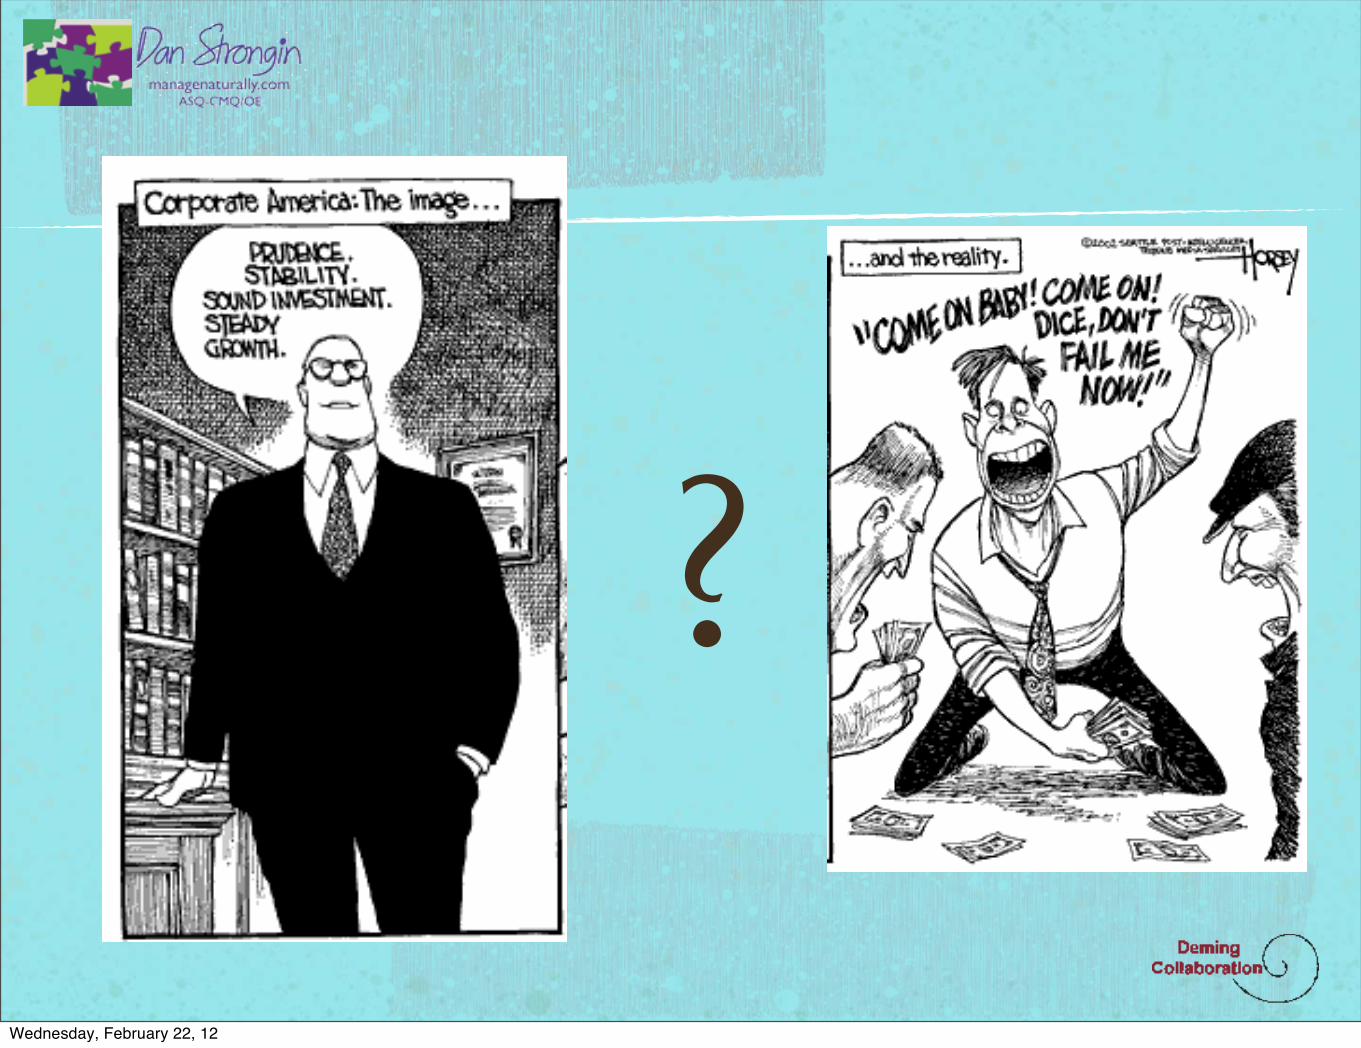
?
Wednesday, February 22, 12

A Backwards FocusLooking Through the Rear View Mirror
Wednesday, February 22, 12

Data is not Information!
For the Eight Months Ending August 31, 2007AUG 2007 % Budget Variance AUG 2006 % Year To Date YTD Budget % ytd % budget AVG ytd
RevenueWhole Sale
4111 Whole Sale Cheese 28802 184924 -156122 133211 760640 1131629 950804112 Whole Sale Cheese to Retail Store 23516 25867 -2351 35334 152601 125986 190754114 Whole Sale Ice Cream 8446 8446 11820 14784115 Whole Sale Ice Cream to Retail 9034 14500 -5466 9654 59174 60400 7397
Total Whole Sale: 69798 225291 -155493 178200 984235 1318015 1230294500 Freight 108 108 61 564 70
Total Revenue 69907 225291 -155384 178260 984799 1318015 = 123100Cost Of SalesWhole Sale
5111 Whole Sale Cheese 21707 116653 -94946 97579 575549 732076 58.48% 55.54% 719445112 Whole Sale Cheese to Retail 20157 6262 13895 18594 112382 32172 11.42% 2.44% 140485114 Whole Sale Ice Cream 5150 5150 7087 0.72% 0.00% 8865115 Whole Sale Ice Cream to Retail 9034 14500 -5466 9654 59174 60400 6.01% 4.58% 7397
Total Whole Sale Cost 56047 137415 -81368 125826 754193 824648 76.63% 62.57% 942745500 Freight 632 632 411 3878 0.00% 4855800 Other Cost -2122 1844 -3966 1253 8426 11464 0.86% 0.87% 1053
Total Cost Of Sales 54557 78% 139259 -84702 127490 72% 766497 836112 77.88% 63.44% 95812 Gross Profit 15350 22% 86032 -70682 50770 28% 218302 481903 22.18% 36.56% 27288
ExpensesPayroll
6083 CP Manager Salery 12019 12019 0 10417 6% 84135 84132 8.55% 6.38% 105176084 CP Hourly 5875 10272 -4397 9973 6% 66305 73181 6.74% 5.55% 82886087 CP Asst Manager Salery 6231 4808 1423 4167 2% 37000 33654 3.76% 2.55% 46256099 Pension Plan Exp 548 505 43 0% 3634 3535 0.37% 0.27% 4546100 Payroll Expenses 1906 2439 -533 0% 16699 17907 1.70% 1.36% 2087
Total Payroll 26578 38% 30043 -3465 24556 14% 207773 212409 21.11% 16.12% 25972Operating Expenses
6040 Advertising/Marketing 2799 4.0% 2500 299 0% 13443 20000 1.37% 1.52% 16806060 Donations 0.0% 100 -100 0% 3513 800 0.36% 0.06% 4396105 Contract Labor 0.0% 0 44 0% 0.00% 0.00% 06115 Storage Rental 229 0.3% 191 38 191 0% 2067 1528 0.21% 0.12% 2586120 Insurance 1769 2.5% 2500 -731 2350 1% 15982 22500 1.62% 1.71% 19986125 Waste Water Disposal 0.0% 1300 -1300 1500 1% 8626 10400 0.88% 0.79% 10786160 Legal & Acounting 0.0% 150 -150 0% 1558 4550 0.16% 0.35% 1956165 Lease (Building) 10000 14.3% 10000 0 12747 7% 80000 80000 8.13% 6.07% 100006170 Professional Services 5250 7.5% 7400 -2150 4430 2% 46366 41100 4.71% 3.12% 57966180 Depreciation Expense 2363 3.4% 2300 63 2375 1% 17569 18400 1.79% 1.40% 21966220 Repairs & Maintenance 19172 27.4% 10540 8632 2747 2% 58731 62881 5.97% 4.77% 73416235 Freight Charges 299 0.4% 200 99 663 0% 2018 1600 0.21% 0.12% 2526240 Supplies 6799 9.7% 10540 -3741 10629 6% 80298 62881 8.16% 4.77% 100376245 Sample Testing Cheese 572 0.8% 3162 -2590 2953 2% 12081 18863 1.23% 1.43% 15106250 Office Supplies 103 0.1% 150 -47 43 0% 1183 1200 0.12% 0.09% 1486260 Telephone 272 0.4% 300 -28 299 0% 2142 2400 0.22% 0.18% 2686280 Utilities 3612 5.2% 5900 -2288 5749 3% 44317 51600 4.50% 3.91% 55406290 Travel 979 1.4% 600 379 422 0% 2845 5700 0.29% 0.43% 3566292 Meals, Entertainment & Lodging 169 0.2% 300 -131 78 0% 2315 2900 0.24% 0.22% 2896320 Continuing Education 0.0% 0 0% 466 0.05% 0.00% 586325 Uniforms 298 0.4% 450 -152 456 0% 3488 3600 0.35% 0.27% 4366330 Dues & Subscriptions 0.0% 300 -300 317 0% 1936 1900 0.20% 0.14% 2426335 Health Insurance 884 1.3% 850 34 821 0% 6624 7950 0.67% 0.60% 8286340 Leasing Expenses 89 0.1% 100 -11 92 0% 677 800 0.07% 0.06% 856350 Show & Conference Fees 1650 2.4% 400 1250 400 0% 4396 2300 0.45% 0.17% 5506580 Supplier Set up Charges 0.0% 300 -300 0% 2314 2400 0.24% 0.18% 2896650 Service Fee 0.0% 1000 -1000 0% 8000 0.00% 0.61% 06660 Security Patrol 0.0% 520 -520 750 0% 3825 4160 0.39% 0.32% 4786700 Tax & License Fees 0.0% 0 0% 1424 0.14% 0.00% 1786820 Taxes Property 0.0% 0 0% 5532 6600 0.56% 0.50% 6916999 Over Head Allication 1044 1.5% 1305 -261 0% 8352 9135 0.85% 0.69% 10447010 Interest Income 0 -28 0% -54 -90 -0.01% -0.01% -7
Total Operating Expenses 58352 83.5% 63358 -5006 50030 28% 434033 456058 44.10% 34.60% 54254Total Expenses 84930 121.5% 93401 -8471 74586 42% 641806 668467 65.21% 50.72% 80226Net Income From Operation -69580 -99.5% -7369 -62211 -23816 -13% -423503 -186564 -52938Net Income (Loss) -69580 -99.5% -7369 -62211 -23816 -13% -423503 -186564 -52938
Wednesday, February 22, 12

Shoot then AimSingle Datapoints Tell You Nothing
Wednesday, February 22, 12

Babe RuthSeason 18 19 20 21 22 23 24 25 26 27 28 29 30 31 32 33 34
Home Runs 11 29 54 59 35 41 46 25 47 60 54 46 49 46 41 34 22
Roger MarisSeason 57 58 59 60 61 62 63 64 65 66 67 68
Home Runs 14 28 16 39 61 33 23 26 8 13 9 5
Mickey MantleSeason 51 52 53 54 55 56 57 58 59 60 61 62 63 64 65 66 67 68
Home Runs 13 23 21 27 37 52 34 42 31 40 54 30 15 35 19 23 22 18
Hank AaronSeason 54 55 56 57 58 59 60 61 62 63 64 65 66 67 68 69 70 71 72 73 74 75 76
Home Runs 13 27 26 44 30 39 40 34 45 44 24 32 44 39 29 44 38 47 34 40 20 12 10
Barry BondsSeason 86 87 88 89 90 91 92 93 94 95 96 97 98 99 0 1 2 3 4 5 6 7
Home Runs 16 25 24 19 33 25 34 46 37 33 42 40 37 34 49 73 46 45 45 5 26 28
Wednesday, February 22, 12

VISUAL!
Wednesday, February 22, 12

0
7
13
20
26
33
39
46
52
59
65
1 2 3 4 5 6 7 8 9 10 11 12 13 14 15 16 17 18
Ruth Maris
Wednesday, February 22, 12

Babe RuthSeason 18 19 20 21 22 23 24 25 26 27 28 29 30 31 32 33 34
Home Runs 11 29 54 59 35 41 46 25 47 60 54 46 49 46 41 34 22
Roger MarisSeason 57 58 59 60 61 62 63 64 65 66 67 68
Home Runs 14 28 16 39 61 33 23 26 8 13 9 5
Mickey MantleSeason 51 52 53 54 55 56 57 58 59 60 61 62 63 64 65 66 67 68
Home Runs 13 23 21 27 37 52 34 42 31 40 54 30 15 35 19 23 22 18
Hank AaronSeason 54 55 56 57 58 59 60 61 62 63 64 65 66 67 68 69 70 71 72 73 74 75 76
Home Runs 13 27 26 44 30 39 40 34 45 44 24 32 44 39 29 44 38 47 34 40 20 12 10
Barry BondsSeason 86 87 88 89 90 91 92 93 94 95 96 97 98 99 0 1 2 3 4 5 6 7
Home Runs 16 25 24 19 33 25 34 46 37 33 42 40 37 34 49 73 46 45 45 5 26 28
Wednesday, February 22, 12

0
7
13
20
26
33
39
46
52
59
65
Ruth Mantle
Wednesday, February 22, 12

0
15
30
45
60
yr 1 2 3 4 5 6 7 8 9 10 11 12 13 14 15 16 17 18 19 20 21 22 23
Aaron Ruth
Wednesday, February 22, 12

0
20
40
60
80
yr 1 2 3 4 5 6 7 8 9 10 11 12 13 14 15 16 17 18 19 20 21 22 23
Bonds Ruth
Wednesday, February 22, 12

0
8
15
23
30
38
45
53
60
68
75Aaron Bonds
Wednesday, February 22, 12

0
18
35
53
70
Maris Mantle
Wednesday, February 22, 12

0
18
35
53
70
Maris Mantle
Wednesday, February 22, 12

Present Visually in Time to Clarify the Context in the Data!
Wednesday, February 22, 12

Babe RuthSeason 18 19 20 21 22 23 24 25 26 27 28 29 30 31 32 33 34
Home Runs 11 29 54 59 35 41 46 25 47 60 54 46 49 46 41 34 22
Roger MarisSeason 57 58 59 60 61 62 63 64 65 66 67 68
Home Runs 14 28 16 39 61 33 23 26 8 13 9 5
Mickey MantleSeason 51 52 53 54 55 56 57 58 59 60 61 62 63 64 65 66 67 68
Home Runs 13 23 21 27 37 52 34 42 31 40 54 30 15 35 19 23 22 18
Hank AaronSeason 54 55 56 57 58 59 60 61 62 63 64 65 66 67 68 69 70 71 72 73 74 75 76
Home Runs 13 27 26 44 30 39 40 34 45 44 24 32 44 39 29 44 38 47 34 40 20 12 10
Barry BondsSeason 86 87 88 89 90 91 92 93 94 95 96 97 98 99 0 1 2 3 4 5 6 7
Home Runs 16 25 24 19 33 25 34 46 37 33 42 40 37 34 49 73 46 45 45 5 26 28
Wednesday, February 22, 12

0
20
40
60
80
yr 1 2 3 4 5 6 7 8 9 10 11 12 13 14 15 16 17 18 19 20 21 22 23
AaronRuthMantleBonds
Wednesday, February 22, 12

60406060
Operating Expenses AUG 2007 % Budget Variance AUG 2006 % Year To Date YTD Budget % ytd % budget AVG ytd
Advertising/Marketing 2799 4.0% 2500 299 0% 13443 20000 1.37% 1.52% 1680Donations 0.0% 100 -100 0% 3513 800 0.36% 0.06% 439
61056115612061256160616561706320
Contract Labor 0.0% 0 44 0% 0.00% 0.00% 0Storage Rental 229 0.3% 191 38 191 0% 2067 1528 0.21% 0.12% 258Insurance 1769 2.5% 2500 -731 2350 1% 15982 22500 1.62% 1.71% 1998Waste Water Disposal 0.0% 1300 -1300 1500 1% 8626 10400 0.88% 0.79% 1078Legal & Acounting 0.0% 150 -150 0% 1558 4550 0.16% 0.35% 195Lease (Building) 10000 14.3% 10000 0 12747 7% 80000 80000 8.13% 6.07% 10000Professional Services 5250 7.5% 7400 -2150 4430 2% 46366 41100 4.71% 3.12% 5796Continuing Education 0.0% 0 0% 466 0.05% 0.00% 58
Wednesday, February 22, 12

January through December 2002
Cost of Goods Sold
SOOO • Cost of Goods Sold Jan - Dec 02 Jan - Dec 01 $ Change % Change
5020-1 . PURCHASE Other SUPPLIES TBF
5020-2 . PURCHASES PAPER SUPPLIES
5030 . PURCHASES-WINE AND BEER
5040-1 . PURCHASES- CHEESE TBF
23,216.57 5,626.08 17,590.49 76%
22055.27 21113.14 942.13 4.3%
88,323 97,224 -8,901 -10%
63,882.44 54,157.1 9,725.34 15%
Wednesday, February 22, 12

0
25,000
50,000
75,000
100,000
2001 2002
Other SuppliesPaper SuppliesWine/BeerCheese
Wednesday, February 22, 12

0
5250
10500
15750
21000
12/24/94 1/7/95 1/28/95 2/11/95 2/25/95 3/11/95 3/25/95
Date: Kitchen12/24/9412/31/941/7/951/21/951/28/952/4/952/11/952/18/952/25/953/4/953/11/953/18/953/25/954/2/95
2084211392116851188512017130391214012989137431215012347132101241813535
Wednesday, February 22, 12
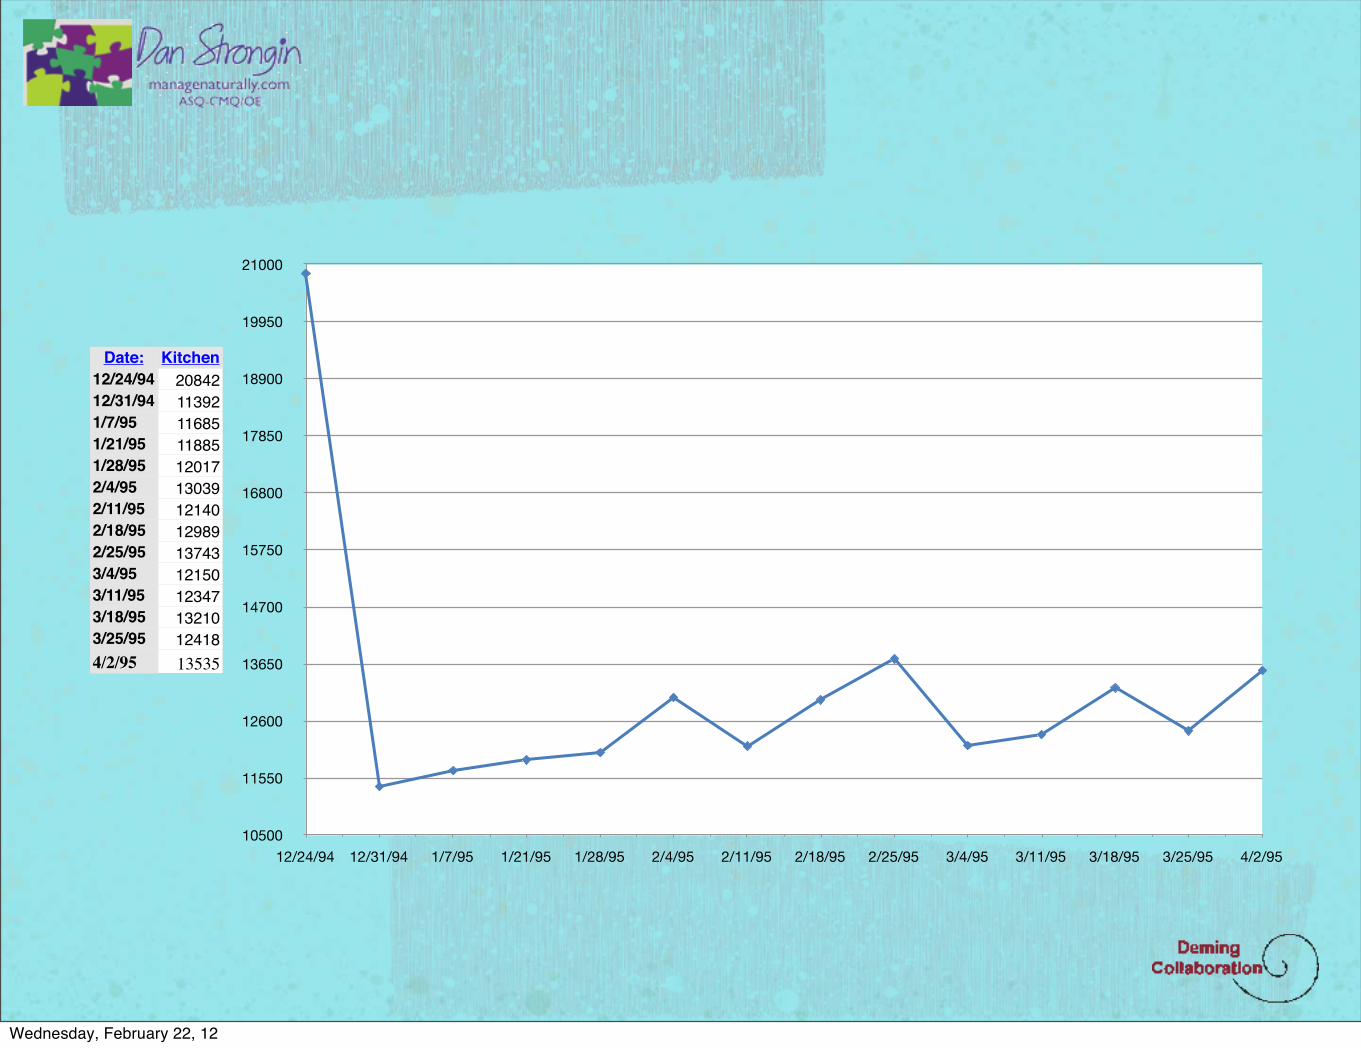
Date: Kitchen12/24/9412/31/941/7/951/21/951/28/952/4/952/11/952/18/952/25/953/4/953/11/953/18/953/25/954/2/95
2084211392116851188512017130391214012989137431215012347132101241813535
10500
11550
12600
13650
14700
15750
16800
17850
18900
19950
21000
12/24/94 12/31/94 1/7/95 1/21/95 1/28/95 2/4/95 2/11/95 2/18/95 2/25/95 3/4/95 3/11/95 3/18/95 3/25/95 4/2/95
Wednesday, February 22, 12

Date: Kitchen % Cheese % Meat % Misc. % Bakery % Total % Ad12/24/9412/31/941/7/951/21/951/28/952/4/952/11/952/18/952/25/953/4/953/11/953/18/953/25/954/2/95
20842 34.7% 13382 22.3% 9912 16.5% 2315 3.9% 13567 22.6% 60018 14.0% Christmas11392 30.7% 8287 22.3% 6908 18.6% 1452 3.9% 9108 24.5% 37147 13.3% New Years11685 31.6% 8081 21.9% 6402 17.3% 1285 3.5% 9502 25.7% 36955 12.6% Finladia Lite and Party Lasagna11885 31.6% 8148 21.7% 6837 18.2% 1037 2.8% 9677 25.7% 37584 13.3% Cal Cheddar and Jack12017 32.1% 7536 20.1% 5973 16.0% 1499 4.0% 10391 27.8% 37416 13.1% Montana Beef, Salsa, Party Las.13039 34.0% 7232 18.8% 6477 16.9% 1501 3.9% 10156 26.4% 38405 13.3% Queso Quesadilla12140 33.4% 6994 19.3% 6319 17.4% 1173 3.2% 9700 26.7% 36326 12.9% Stilton, Caesar, Chscke Valent..12989 32.8% 7795 19.7% 6762 17.1% 1136 2.9% 10888 27.5% 39570 13.6% New Menu and Cambazola13743 34.9% 7517 19.1% 6661 16.9% 1429 3.6% 9977 25.4% 39327 13.6% Auric. Gorg, Moli Mild, Kitchen12150 33.1% 6953 18.9% 6547 17.8% 1232 3.4% 9863 26.8% 36745 12.8% Bear Flag Fresh Jacks12347 32.8% 7630 20.3% 6445 17.1% 1347 3.6% 9841 26.2% 37610 13.1% Wisconsin13210 34.6% 7311 19.2% 6537 17.1% 1206 3.2% 9867 25.9% 38131 13.3% Sonoma12418 32.6% 7017 18.4% 6797 17.8% 1397 3.7% 10452 27.4% 38081 Reny Brie, Ham I Am, Kitchen13535 34.3% 7016 17.8% 7332 18.6% 1289 3.3% 10272 26.0% 39444 Spit Roast Chicken
Wednesday, February 22, 12

Preserve the Meaning
Wednesday, February 22, 12

Date:Kitche
nChees
eMea
tMisc.
Bakery Total Ad
12/24/9412/31/941/7/951/21/951/28/952/4/952/11/952/18/952/25/953/4/953/11/953/18/953/25/954/2/95
20842 13382 9912 2315 13567 60018Christmas11392 8287 6908 1452 9108 37147New Years11685 8081 6402 1285 9502 36955Finladia Lite and Party Lasagna11885 8148 6837 1037 9677 37584Cal Cheddar and Jack12017 7536 5973 1499 10391 37416Montana Beef, Salsa, Party Las.13039 7232 6477 1501 10156 38405Queso Quesadilla12140 6994 6319 1173 9700 36326Stilton, Caesar, Chscke Valent..12989 7795 6762 1136 10888 39570New Menu and Cambazola13743 7517 6661 1429 9977 39327Auric. Gorg, Moli Mild, Kitchen12150 6953 6547 1232 9863 36745Bear Flag Fresh Jacks12347 7630 6445 1347 9841 37610Wisconsin13210 7311 6537 1206 9867 38131Sonoma12418 7017 6797 1397 10452 38081Reny Brie, Ham I Am, Kitchen13535 7016 7332 1289 10272 39444Spit Roast Chicken
0
17500
35000
52500
70000
12/24/94 1/7/95 1/28/95 2/11/95 2/25/95 3/11/95 3/25/95
Kitche
nChe
ese
Mea
tMisc.
Bake
ryTo
tal
Wednesday, February 22, 12

30,62538,50046,37554,25062,12570,000
Wk 1 2 3 4 5 6 7 8 9 10 11 12 13 14
Total
0
2,250
4,500
6,750
9,000
11,250
13,500
15,750
18,000
20,250
22,500
Wk 1 2 3 4 5 6 7 8 9 10 11 12 13 14
Kitchen Cheese Meat Misc. Bakery
Wednesday, February 22, 12

USE Simple Tools, especially at first!
Wednesday, February 22, 12

Pencil and paper works great!the Uncomputer
Wednesday, February 22, 12

Predict!
Wednesday, February 22, 12

Understand VariationEveryday faults built into the system are called common or natral variation, they are the noise. “Fixing” them makes things worse.
Faults from fleeting events are “special.” They are the signals that something must be done and NOW. You must stop what you are doing, find, study, understand, and dealt with them right away, or the will bring chaos.
Wednesday, February 22, 12

Common Causes
Poor work flow, ill-designed equipment, lack of training, built-in inefficiency
Every day, normal, natural variation.
Wednesday, February 22, 12

Special Causes
Illness of employees, new clients, weather, fads, change in federal regulations, loose fly wheel, a machine out of adjustment, a new employee...
Out of the Ordinary, Special, every once in a while...
Wednesday, February 22, 12

failure of banking system leading to massive bailout sucking available capital out of the system
Tampering
Wednesday, February 22, 12

Who
What
Why
When
Where
HOW?
don’t tamper– understandWednesday, February 22, 12

How one Organizes Data
Can point to things that don’t exist, and miss things that do!
Wednesday, February 22, 12

To UnderstandYou need to see what happens over time
Wednesday, February 22, 12

Run ChartsShow results over time...
Wednesday, February 22, 12
Related Documents