Welcome message from author
This document is posted to help you gain knowledge. Please leave a comment to let me know what you think about it! Share it to your friends and learn new things together.
Transcript
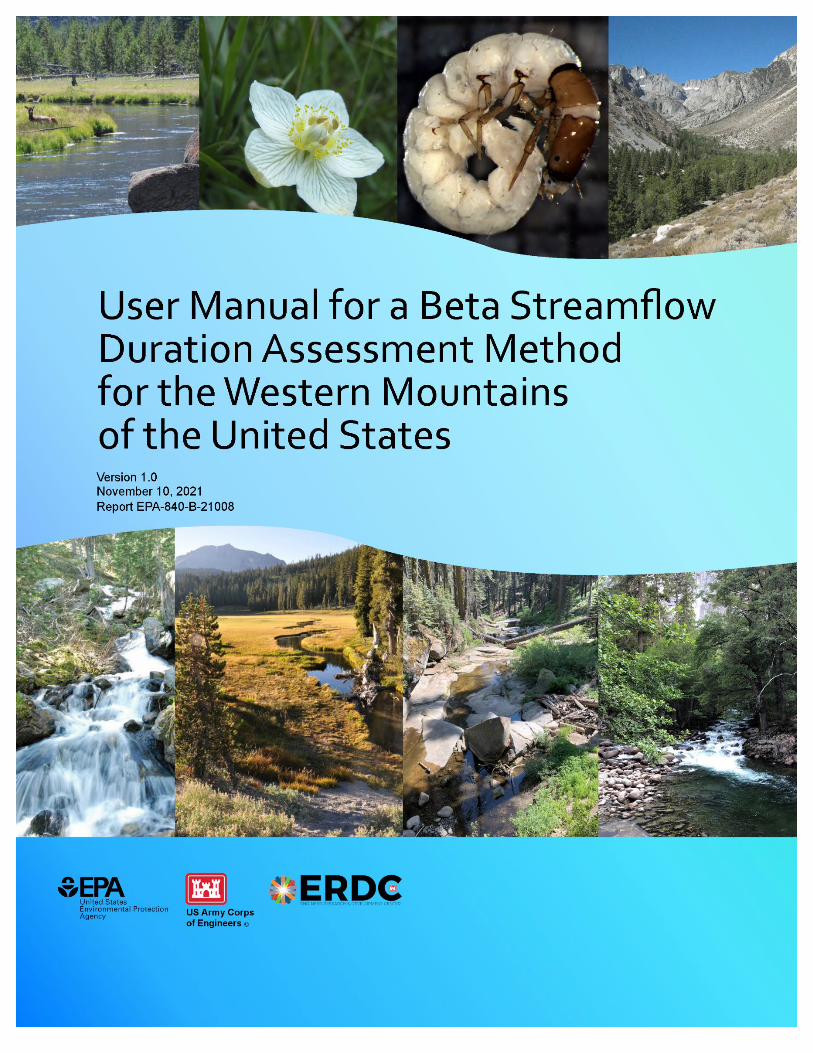

User Manual for a Beta Streamflow Duration Assessment Method for the
Western Mountains of the United States Version 1.0
November 10, 2021
Prepared by Raphael Mazor1, Brian Topping2, Tracie-Lynn Nadeau2,3, Ken M. Fritz4, Julia Kelso5, Rachel Harrington6, Whitney Beck2, Kenneth McCune1, Aaron Allen7, Robert Leidy8, James T. Robb9, Gabrielle C. L. David10, and Loribeth Tanner11. 1 Southern California Coastal Water Research Project. Costa Mesa, CA 2 U.S. Environmental Protection Agency—Office of Wetlands, Oceans, and Watersheds. Washington, D.C. 3 U.S. Environmental Protection Agency—Region 10. Portland, OR 4 U.S. Environmental Protection Agency—Office of Research and Development. Cincinnati, OH 5 Oak Ridge Institute of Science and Education (ORISE) Fellow at U.S. Environmental Protection Agency—Office of Wetlands, Oceans, and Watersheds. Washington, D.C. 6 U.S. Environmental Protection Agency—Region 8. Denver, CO 7 U.S. Army Corps of Engineers–South Pacific Division. Los Angeles, CA 8 U.S. Environmental Protection Agency—Region 9. San Francisco, CA 9 U.S. Army Corps of Engineers – South Pacific Division. Sacramento, CA 10 U.S. Army Corps of Engineers—Engineer Research and Development Center Cold Regions Research and Engineering Laboratory. Hanover, NH 11 S. Environmental Protection Agency—Region 6. Dallas, TX
Suggested citation:
Mazor, R.D., Topping, B., Nadeau, T.-L., Fritz, K.M., Kelso, J., Harrington, R., Beck, W., McCune, K., Allen, A., Leidy, R., Robb, J.T., David, G.C.L., and Tanner, L. 2021. User Manual for a Beta Streamflow Duration Assessment Method for the Western Mountains of the United States. Version 1.0. Document No. EPA-840-B-21008.
i
Acknowledgments
The development of this method and supporting materials was guided by a regional steering committee consisting of representatives of federal regulatory agencies in the Western U.S.: James T. Robb (U.S. Army Corps of Engineers [USACE]—South Pacific Division, Sacramento District), Robert Leidy (U.S. Environmental Protection Agency [USEPA]—Region 9), Aaron Allen (USACE—South Pacific Division, Los Angeles District), Gabrielle C. L. David (USACE—Engineer Research and Development Center, Cold Regions Research and Engineering Laboratory), Loribeth Tanner (USEPA—Region 6), Rachel Harrington (USEPA – Region 8), Joe Morgan (USEPA—Region 9), Matt Wilson (USACE—Headquarters), Tunis McElwain (USACE—Headquarters), Silvia Gazzera (USACE – Headquarters), Kevin Little, (USACE – Northwestern Division, Omaha District), Jess Jordan (USACE – Northwestern Division, Seattle District), and Rose Kwok (USEPA—Headquarters).
We thank Abel Santana, Robert Butler, Duy Nguyen, Kristine Gesulga, and Anne Holt for assistance with data management, and Jeff Brown, Liesl Tiefenthaler, Mason London, John Olson, Matthew Robinson, Emma Haines, Jess Turner, Katharina Zimmerman, Kelsey Trammel, Marcus Beck, Savannah Peña, Abigail Rivera, and Andrew Caudillo for assistance with data collection. Rob Coulombe provided training.
Numerous researchers and land managers with local expertise assisted with the selection of study reaches to calibrate the method: Patricia Spindler, Eric Stein, Andrew C. Rehn, Peter R. Ode, Nathan Mack, Shawn McBride, Stephanie Kampf, Lindsey Reynolds, Kris Barrios, Marcia Radke, Keith Bouma-Gregson, Kira Puntenney-Desmond, Andy Brummond, Don Lee, Ed Schenk, Eric Hargett, Gabe Rossi, Mark Ockey, Sean Tevlin, Sean Lovill, Josh Smith, and Michael Bogan. We thank the California Department of Fish and Wildlife’s Aquatic Bioassessment Lab and Daniel Pickard for use of imagery from the macroinvertebrate digital reference collection.
This document has been reviewed in accordance with U.S. Environmental Protection Agency policy and approved for publication. Any mention of trade names, manufacturers or products does not imply an endorsement by the United States Government or the U.S. Environmental Protection Agency. EPA and its employees do not endorse any commercial products, services, or enterprises.
The contents of this report are not to be used for advertising, publication, or promotional purposes. Citation of trade names does not constitute an official endorsement or approval of the use of such commercial products. All product names and trademarks cited are the property of their respective owners. The findings of this report are not to be construed as an official Department of the Army or the U.S. Environmental Protection Agency position unless so designated by other authorized documents. Destroy this report when no longer needed. Do not return it to the originator.
ii
Table of Contents Section 1: Introduction and Background ...................................................................................................... 1
The beta method for the Western Mountains ......................................................................................... 3
Intended use and limitations .................................................................................................................... 6
Development of the beta SDAM WM ....................................................................................................... 7
How the beta SDAM WM differs from other regional SDAMs ................................................................. 9
Section 2: Overview of the Beta SDAM WM and the Assessment Process ................................................ 11
Considerations for assessing streamflow duration and interpreting indicators .................................... 11
Clean Water Act Jurisdiction ............................................................................................................... 11
Scales of assessment ........................................................................................................................... 11
Spatial variability ................................................................................................................................. 11
Temporal variability ............................................................................................................................ 12
Ditches and modified natural streams ................................................................................................ 12
Other disturbances ............................................................................................................................. 12
Multi-threaded systems ...................................................................................................................... 13
Section 3: Data Collection ........................................................................................................................... 14
Order of operations in completing the beta SDAM WM assessment .................................................... 14
Conduct desktop reconnaissance ........................................................................................................... 14
Optional: Perform preliminary assessments of selected indicators ................................................... 15
Prepare sampling gear ............................................................................................................................ 16
Timing of sampling .................................................................................................................................. 16
Assessment reach size, selection, and placement .................................................................................. 17
Walking the assessment reach............................................................................................................ 18
How many assessment reaches are needed? ..................................................................................... 18
Photo-documentation ............................................................................................................................. 18
Conducting assessments and completing the field form ........................................................................ 19
General reach information .................................................................................................................. 19
Assessment reach sketch .................................................................................................................... 22
How to measure indicators of streamflow duration .............................................................................. 22
1. Abundance and richness of aquatic invertebrates ......................................................................... 23
2. Algal cover on the streambed ......................................................................................................... 29
3. Fish abundance ............................................................................................................................... 33
4. Differences in vegetation ................................................................................................................ 35
iii
5. Bankfull channel width .................................................................................................................... 38
6. Sinuosity .......................................................................................................................................... 39
7. Precipitation .................................................................................................................................... 41
8. Annual maximum temperature ...................................................................................................... 41
Supplemental information .................................................................................................................. 42
Additional notes and photographs ......................................................................................................... 47
Section 4: Data Interpretation and using the web application ................................................................... 48
Outcomes of SDAM classification ........................................................................................................... 48
Single Indicators .................................................................................................................................. 48
Applications of the Beta SDAM WM outside the intended area ............................................................ 49
What to do if more information about streamflow duration is needed? .............................................. 49
Evaluate supplemental information collected during assessments ................................................... 49
Conduct additional assessments at the same reach ........................................................................... 49
Conduct evaluations at nearby reaches .............................................................................................. 50
Review historical aerial imagery ......................................................................................................... 50
Conduct reach revisits during regionally appropriate wet and dry seasons ...................................... 51
Collect additional hydrologic data ...................................................................................................... 52
References .................................................................................................................................................. 53
Appendix A. Glossary of terms .................................................................................................................... 56
Appendix B. Images of Aquatic Invertebrates of the Western USA ........................................................... 61
General insect anatomy .......................................................................................................................... 61
Ephemeroptera (mayflies) larvae ........................................................................................................... 62
Plecoptera (stonefly) larvae .................................................................................................................... 66
Trichoptera (caddisfly) larvae and pupae ............................................................................................... 71
Coleoptera (beetles) larvae and adults ................................................................................................... 80
Megaloptera (fishflies and dobsonflies) larvae ...................................................................................... 84
Odonata (dragonflies and damselflies) larvae ........................................................................................ 87
Other insect orders ................................................................................................................................. 92
Hemiptera (true bugs) ......................................................................................................................... 92
Diptera (true flies) ............................................................................................................................... 93
Non-insects: Bivalves .............................................................................................................................. 96
Non-insects: Gastropods (snails) .......................................................................................................... 100
Appendix C. Field Forms ........................................................................................................................... 105

iv

Section 1: Introduction and Background
1
Section 1: Introduction and Background Streams exhibit a diverse range of hydrologic regimes, and the hydrologic regime strongly influences the physical, chemical, and biological characteristics of active stream channels and their adjacent riparian areas. Thus, information describing a stream’s hydrologic regime is useful to support resource management decisions, including regulatory decisions. One important aspect of the hydrologic regime is streamflow duration—the length of time that a stream sustains surface flow. However, hydrologic data to determine flow duration has not been collected for most stream reaches nationwide. Although maps, hydrologic models, and other data resources exist (e.g., the National Hydrography Dataset, McKay et al. 2014), they may exclude small headwater streams and unnamed second- or third-order tributaries, and limitations on accuracy and spatial or temporal resolution may reduce their utility for many management applications (Hall et al. 1998, Nadeau and Rains 2007, Fritz et al. 2013). Therefore, there is a need for rapid, field-based methods to determine flow duration class at the reach scale (defined in Section 2) in the absence of long-term hydrologic data (Fritz et al. 2020).
This method is intended to classify stream reaches into one of three streamflow duration classes 1:
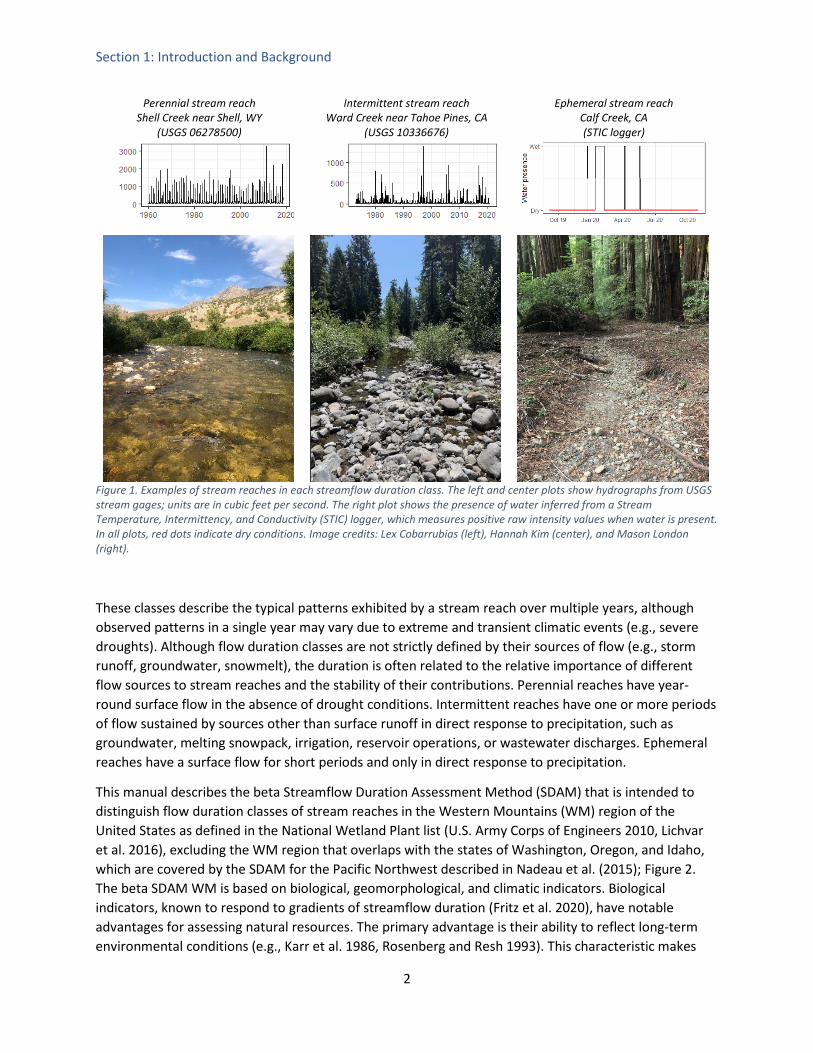
Ephemeral reaches are channels that flow only in direct response to precipitation. Water typically flows only during and/or shortly after large precipitation events, the streambed is always above the water table, and stormwater runoff is the primary water source. Intermittent reaches are channels that contain sustained flowing water for only part of the year, typically during the wet season, where the streambed may be below the water table and/or where the snowmelt from surrounding uplands provides sustained flow. The flow may vary greatly with stormwater runoff. Perennial reaches are channels that contain flowing water continuously during a year of normal rainfall, often with the streambed located below the water table for most of the year. Groundwater typically supplies the baseflow for perennial reaches, but the baseflow may also be supplemented by stormwater runoff and/or snowmelt.
Example photographs and hydrographs of stream reaches in each class are shown in Figure 1.
1 The definitions used for development of this manual are consistent with the definitions used to develop the streamflow duration assessment method for the Pacific Northwest and the beta SDAM for the Arid West.
Section 1: Introduction and Background
2
Perennial stream reach Shell Creek near Shell, WY
(USGS 06278500)
Intermittent stream reach Ward Creek near Tahoe Pines, CA
(USGS 10336676)
Ephemeral stream reach Calf Creek, CA (STIC logger)
Figure 1. Examples of stream reaches in each streamflow duration class. The left and center plots show hydrographs from USGS stream gages; units are in cubic feet per second. The right plot shows the presence of water inferred from a Stream Temperature, Intermittency, and Conductivity (STIC) logger, which measures positive raw intensity values when water is present. In all plots, red dots indicate dry conditions. Image credits: Lex Cobarrubias (left), Hannah Kim (center), and Mason London (right).
These classes describe the typical patterns exhibited by a stream reach over multiple years, although observed patterns in a single year may vary due to extreme and transient climatic events (e.g., severe droughts). Although flow duration classes are not strictly defined by their sources of flow (e.g., storm runoff, groundwater, snowmelt), the duration is often related to the relative importance of different flow sources to stream reaches and the stability of their contributions. Perennial reaches have year-round surface flow in the absence of drought conditions. Intermittent reaches have one or more periods of flow sustained by sources other than surface runoff in direct response to precipitation, such as groundwater, melting snowpack, irrigation, reservoir operations, or wastewater discharges. Ephemeral reaches have a surface flow for short periods and only in direct response to precipitation.
This manual describes the beta Streamflow Duration Assessment Method (SDAM) that is intended to distinguish flow duration classes of stream reaches in the Western Mountains (WM) region of the United States as defined in the National Wetland Plant list (U.S. Army Corps of Engineers 2010, Lichvar et al. 2016), excluding the WM region that overlaps with the states of Washington, Oregon, and Idaho, which are covered by the SDAM for the Pacific Northwest described in Nadeau et al. (2015); Figure 2. The beta SDAM WM is based on biological, geomorphological, and climatic indicators. Biological indicators, known to respond to gradients of streamflow duration (Fritz et al. 2020), have notable advantages for assessing natural resources. The primary advantage is their ability to reflect long-term environmental conditions (e.g., Karr et al. 1986, Rosenberg and Resh 1993). This characteristic makes

Section 1: Introduction and Background
3
them well suited for assessing streamflow duration, because some species reflect the aggregate hydrologic conditions that a stream has experienced over multiple years. As a result, relatively rapid field observation of biological indicators made at a single point in time can provide long-term insights into streamflow duration and other hydrological characteristics of a stream reach. Geomorphological and climatic indicators can also be rapidly measured and provide information about the hydrologic drivers of streamflow duration. For example, wide channels in areas with low precipitation are associated with shorter durations of streamflow; in contrast, in wetter areas, narrow channels are typically associated with headwaters, where the contributing catchments may be too small to generate long-duration flows.
Figure 2. Mountainous regions of the western USA. The beta SDAM WM applies to the dark blue region shown above.
The beta method for the Western Mountains This manual describes a protocol that uses a small number of indicators to predict the streamflow duration class of stream reaches in the WM. Some indicators are measured through desktop analysis, while others are quantified during a single field visit. The method will be made available as a beta version for one year to allow the user community to provide feedback before a final SDAM WM is
Section 1: Introduction and Background
4
produced. For more information on the development of this SDAM, and SDAMs for other U.S. regions, please refer to EPA’s SDAM website: https://www.epa.gov/streamflow-duration-assessment.
The beta SDAM WM results in one of four possible classifications: ephemeral, intermittent, perennial, and at least intermittent. The latter category occurs when an intermittent or perennial classification cannot be made with high confidence, but an ephemeral classification can be ruled out. The tool uses a machine learning model known as random forest. Random forest models are increasingly common in the environmental sciences because of their superior performance in handling complex relationships among indicators used to predict classifications. Because random forest models require specialized software to run, we have developed an online open-access, user-friendly web application intended for users who have little to no familiarity with machine learning models.
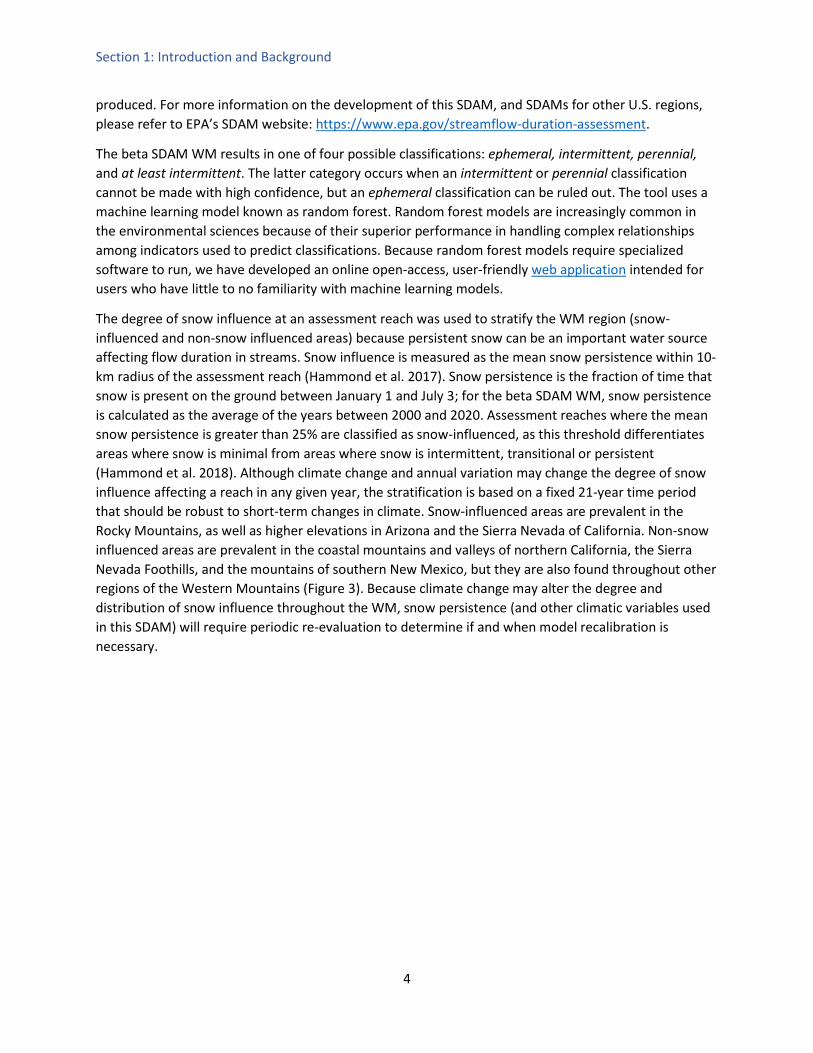
The degree of snow influence at an assessment reach was used to stratify the WM region (snow-influenced and non-snow influenced areas) because persistent snow can be an important water source affecting flow duration in streams. Snow influence is measured as the mean snow persistence within 10-km radius of the assessment reach (Hammond et al. 2017). Snow persistence is the fraction of time that snow is present on the ground between January 1 and July 3; for the beta SDAM WM, snow persistence is calculated as the average of the years between 2000 and 2020. Assessment reaches where the mean snow persistence is greater than 25% are classified as snow-influenced, as this threshold differentiates areas where snow is minimal from areas where snow is intermittent, transitional or persistent (Hammond et al. 2018). Although climate change and annual variation may change the degree of snow influence affecting a reach in any given year, the stratification is based on a fixed 21-year time period that should be robust to short-term changes in climate. Snow-influenced areas are prevalent in the Rocky Mountains, as well as higher elevations in Arizona and the Sierra Nevada of California. Non-snow influenced areas are prevalent in the coastal mountains and valleys of northern California, the Sierra Nevada Foothills, and the mountains of southern New Mexico, but they are also found throughout other regions of the Western Mountains (Figure 3). Because climate change may alter the degree and distribution of snow influence throughout the WM, snow persistence (and other climatic variables used in this SDAM) will require periodic re-evaluation to determine if and when model recalibration is necessary.
Section 1: Introduction and Background
5
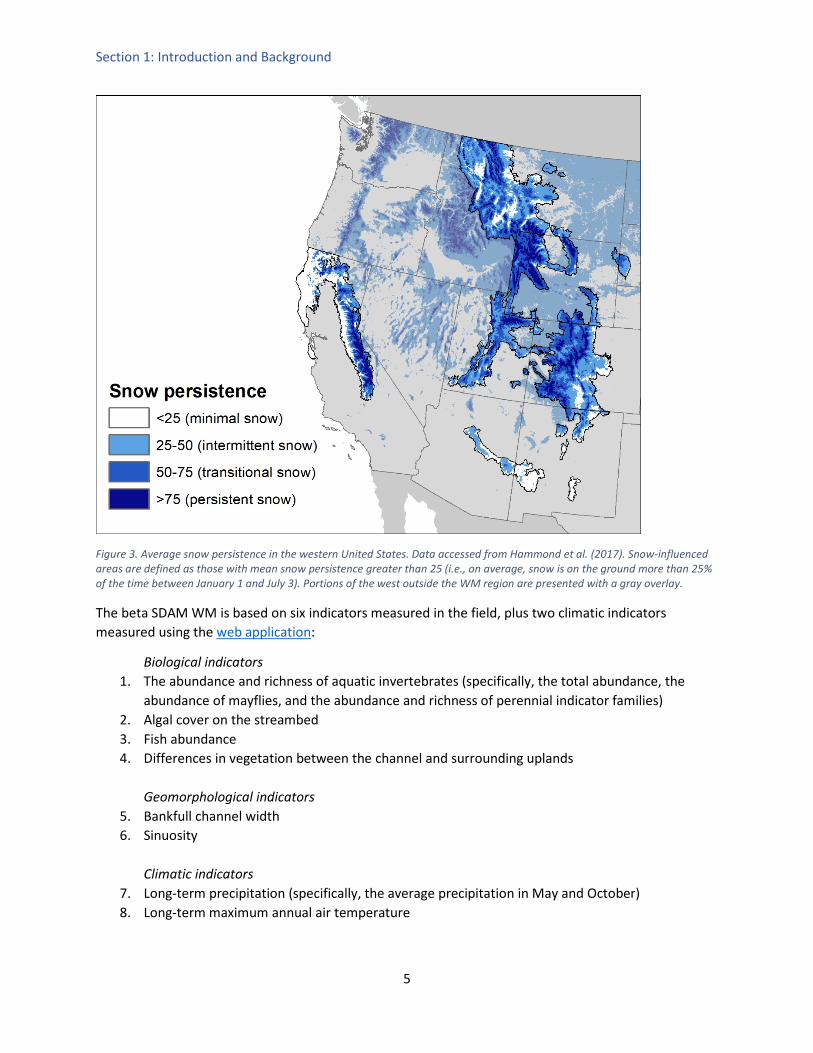
Figure 3. Average snow persistence in the western United States. Data accessed from Hammond et al. (2017). Snow-influenced areas are defined as those with mean snow persistence greater than 25 (i.e., on average, snow is on the ground more than 25% of the time between January 1 and July 3). Portions of the west outside the WM region are presented with a gray overlay.
The beta SDAM WM is based on six indicators measured in the field, plus two climatic indicators measured using the web application:
Biological indicators 1. The abundance and richness of aquatic invertebrates (specifically, the total abundance, the
abundance of mayflies, and the abundance and richness of perennial indicator families) 2. Algal cover on the streambed 3. Fish abundance 4. Differences in vegetation between the channel and surrounding uplands
Geomorphological indicators
5. Bankfull channel width 6. Sinuosity
Climatic indicators
7. Long-term precipitation (specifically, the average precipitation in May and October) 8. Long-term maximum annual air temperature
Section 1: Introduction and Background
6
In addition, fish are used as a “single indicator” which can classify a stream as at least intermittent, even if the other indicators suggest an ephemeral classification.
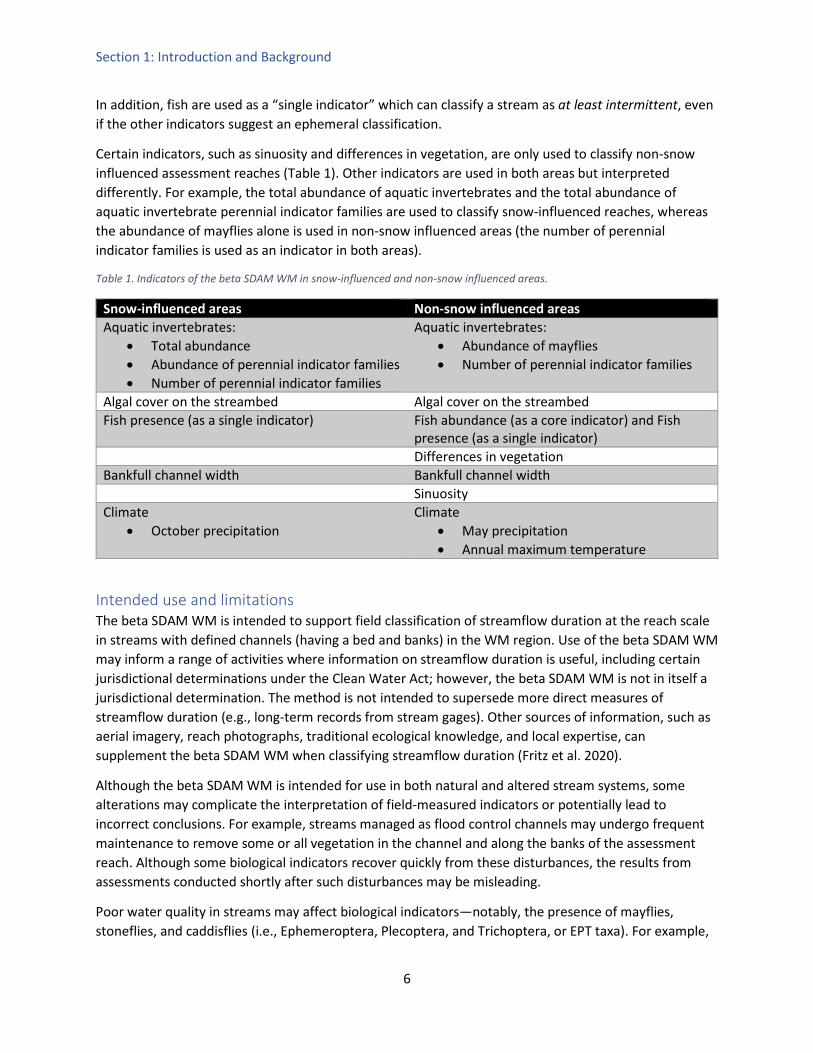
Certain indicators, such as sinuosity and differences in vegetation, are only used to classify non-snow influenced assessment reaches (Table 1). Other indicators are used in both areas but interpreted differently. For example, the total abundance of aquatic invertebrates and the total abundance of aquatic invertebrate perennial indicator families are used to classify snow-influenced reaches, whereas the abundance of mayflies alone is used in non-snow influenced areas (the number of perennial indicator families is used as an indicator in both areas).
Table 1. Indicators of the beta SDAM WM in snow-influenced and non-snow influenced areas.
Snow-influenced areas Non-snow influenced areas Aquatic invertebrates:
• Total abundance • Abundance of perennial indicator families • Number of perennial indicator families
Aquatic invertebrates: • Abundance of mayflies • Number of perennial indicator families
Algal cover on the streambed Algal cover on the streambed Fish presence (as a single indicator) Fish abundance (as a core indicator) and Fish
presence (as a single indicator) Differences in vegetation Bankfull channel width Bankfull channel width Sinuosity Climate
• October precipitation Climate
• May precipitation • Annual maximum temperature
Intended use and limitations The beta SDAM WM is intended to support field classification of streamflow duration at the reach scale in streams with defined channels (having a bed and banks) in the WM region. Use of the beta SDAM WM may inform a range of activities where information on streamflow duration is useful, including certain jurisdictional determinations under the Clean Water Act; however, the beta SDAM WM is not in itself a jurisdictional determination. The method is not intended to supersede more direct measures of streamflow duration (e.g., long-term records from stream gages). Other sources of information, such as aerial imagery, reach photographs, traditional ecological knowledge, and local expertise, can supplement the beta SDAM WM when classifying streamflow duration (Fritz et al. 2020).
Although the beta SDAM WM is intended for use in both natural and altered stream systems, some alterations may complicate the interpretation of field-measured indicators or potentially lead to incorrect conclusions. For example, streams managed as flood control channels may undergo frequent maintenance to remove some or all vegetation in the channel and along the banks of the assessment reach. Although some biological indicators recover quickly from these disturbances, the results from assessments conducted shortly after such disturbances may be misleading.
Poor water quality in streams may affect biological indicators—notably, the presence of mayflies, stoneflies, and caddisflies (i.e., Ephemeroptera, Plecoptera, and Trichoptera, or EPT taxa). For example,

Section 1: Introduction and Background
7
streams affected by heavy metal contamination associated with acid mine drainage may have depressed or extirpated populations of EPT taxa (e.g., Clements et al. 2000, Cain et al. 2004). Several studies have documented the absence of these sensitive taxa in effluent-dominated rivers in the Southwest, including streams within the WM (e.g., Halaburka et al. 2013, Hamdhani et al. 2020). However, upgrades to water treatment plants can lead to a recovery of mayfly taxa (Baker and Sharp 1998). Consequently, the beta SDAM WM may fail to identify perennial systems as Perennial in situations where water quality has been severely degraded by wastewater or other types of stress such that EPT taxa are eliminated. The beta SDAM WM includes other biological indicators that are less affected by poor water quality, and therefore it will typically classify such streams as At least intermittent.
Development of the beta SDAM WM
Figure 4. Locations of ephemeral, intermittent, and perennial stream reaches used to develop the beta SDAM WM.
This method resulted from a multi-year study conducted in 149 locations across the Western Mountains (Figure 4) following the process described in Fritz et al. (2020). Streamflow duration class was directly determined from USGS stream gage records at 46% of these study reaches. Other sources of hydrologic data used to directly classify study reaches include continuous data loggers, trail cameras, published studies, and consultation with local experts. Multiple sources of hydrologic data were used to classify 47 of the ungaged assessment reaches, and a single source was used at 33 ungaged study reaches. In general, more hydrologic data was available at perennial reaches than at intermittent or ephemeral reaches.
Twenty-one candidate indicators expected to control or respond to streamflow duration were tested at 31 ephemeral, 66 intermittent, and 52 perennial study reaches (two additional study reaches were sampled, but their true flow duration class was ambiguous so they were withheld from use in method development). Through statistical analyses, the subset of indicators with the highest diagnostic accuracy of flow duration class was combined into the beta SDAM WM. An expanded data collection effort is underway to continue sampling at some sites and add more than 60 new study reaches to inform the development of the final SDAM WM. The primary goals of this expanded effort are to improve upon the precision and accuracy of the beta SDAM WM and address any shortcomings or limitations identified during the one-year review period following publication of the beta method.

Section 1: Introduction and Background
8
Development of the beta SDAM WM followed the below process steps (Fritz et al. 2020):
• Conducted a literature review with two goals: o Identified existing SDAMs, focusing on those in the Western Mountains and comparable
mountainous regions o Identified potential biological, hydrologic, and physical indicators of streamflow
duration for evaluation in the Western Mountains • Identified candidate study reaches with known streamflow duration class, representing diverse
environmental settings throughout the region • Collected indicator data at 151 study reaches
o Loggers were deployed at 48 “baseline” reaches and were revisited 3 times over a year. Data from loggers were used to confirm or determine true streamflow duration class.
o 103 “validation” reaches were visited once, and true streamflow duration class was determined from available hydrologic data (69 reaches) or local expertise (34 reaches). Data from 2 reaches where true streamflow duration class could not be determined with confidence were excluded from further analysis, leaving 101 validation reaches.
• Calibrated a classification model using a machine learning algorithm (i.e., random forest) • Refined and simplified the model for rapid and consistent application
The literature review (Mazor and McCune 2021) identified eight flow duration methods for temperate regions, two of which cover portions of the Western Mountains as defined for this project: the SDAM for the Pacific Northwest (PNW; Nadeau 2015) and the New Mexico method (NM; NMED 2011). From these methods and the scientific literature, 43 potential geomorphological, hydrological, and biological candidate indicators were identified. These candidate indicators were screened using several criteria, including consistency, repeatability, defensibility, rapidness, and objectivity, and then evaluated for their ability to discriminate among streamflow duration classes. The final set of metrics was simplified to reduce the amount of time required to conduct measurements in the field while maintaining the performance of the method (e.g., by converting continuous measurements to discrete or presence/absence measurements). Climatic measures that characterize hydrologic drivers of streamflow duration (e.g., long-term precipitation and temperature) and were straightforward to calculate using GIS were also evaluated. These metrics were then used to calibrate a model that could classify a stream based on the observed indicators. If the model can rule out ephemeral status but cannot confidently determine if a stream is perennial or intermittent, the stream is classified as At least intermittent. If a single indicator of intermittent or perennial streamflow duration (i.e., fish presence) is observed at a reach that would otherwise be classified as Ephemeral, then the classification becomes At least intermittent. The final method correctly classified 69% of study reaches, and 89% of study reaches that were classified correctly as ephemeral vs. at least intermittent. Misclassifications among intermittent and perennial reaches were more common than misclassifications among ephemeral and intermittent reaches. That this SDAM more accurately and consistently discriminated ephemeral reaches from those that are at least intermittent than it distinguishes among three streamflow duration classes corroborates findings from previous studies evaluating streamflow duration indicators and assessment methods (Fritz et al. 2008, 2013, Nadeau et al. 2015).
Section 1: Introduction and Background
9
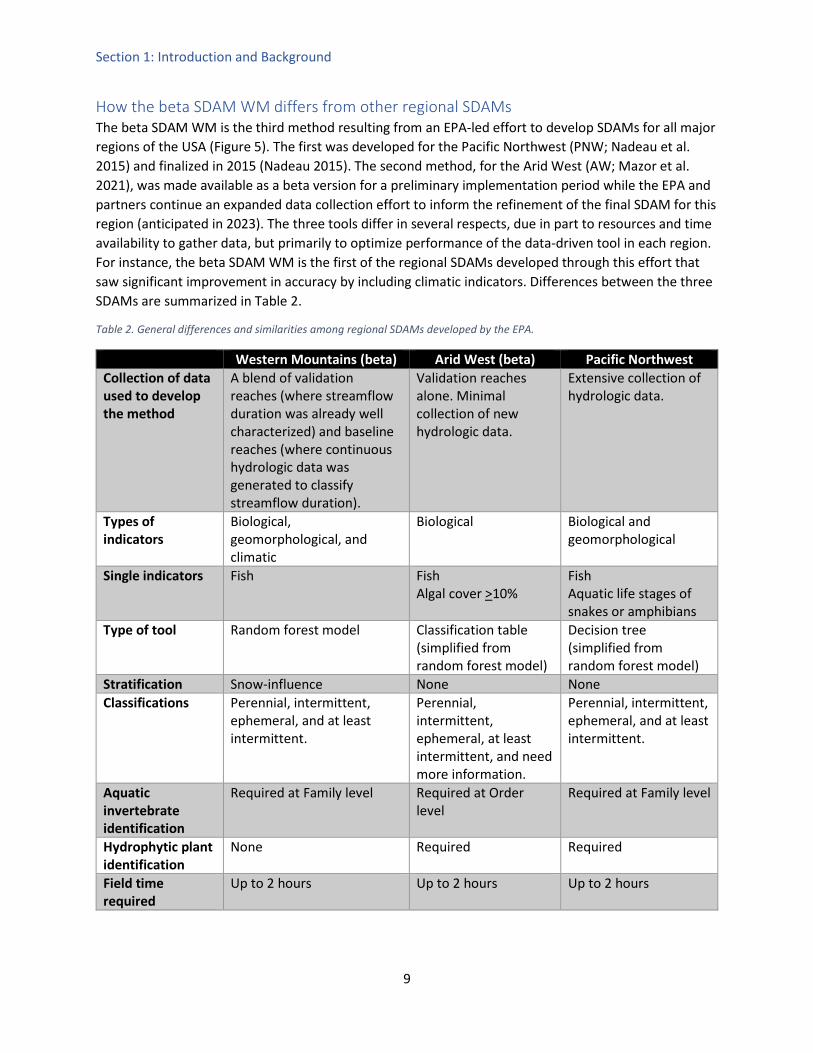
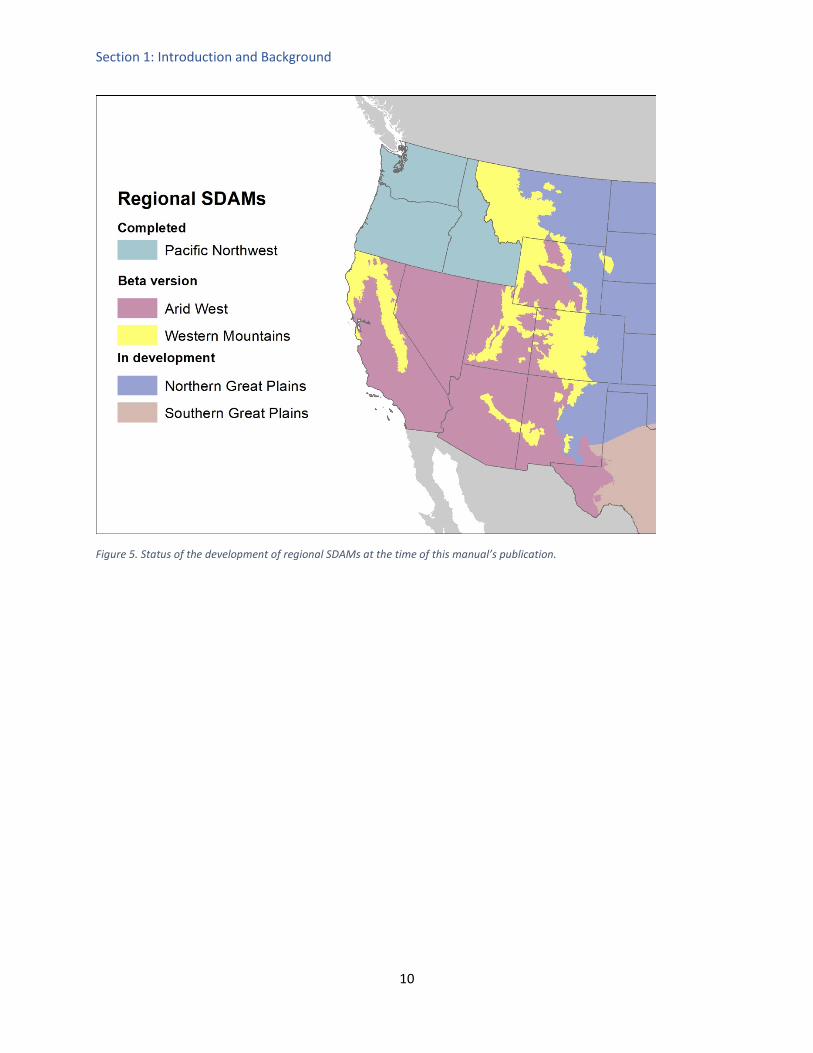
How the beta SDAM WM differs from other regional SDAMs The beta SDAM WM is the third method resulting from an EPA-led effort to develop SDAMs for all major regions of the USA (Figure 5). The first was developed for the Pacific Northwest (PNW; Nadeau et al. 2015) and finalized in 2015 (Nadeau 2015). The second method, for the Arid West (AW; Mazor et al. 2021), was made available as a beta version for a preliminary implementation period while the EPA and partners continue an expanded data collection effort to inform the refinement of the final SDAM for this region (anticipated in 2023). The three tools differ in several respects, due in part to resources and time availability to gather data, but primarily to optimize performance of the data-driven tool in each region. For instance, the beta SDAM WM is the first of the regional SDAMs developed through this effort that saw significant improvement in accuracy by including climatic indicators. Differences between the three SDAMs are summarized in Table 2.
Table 2. General differences and similarities among regional SDAMs developed by the EPA.
Western Mountains (beta) Arid West (beta) Pacific Northwest Collection of data used to develop the method
A blend of validation reaches (where streamflow duration was already well characterized) and baseline reaches (where continuous hydrologic data was generated to classify streamflow duration).
Validation reaches alone. Minimal collection of new hydrologic data.
Extensive collection of hydrologic data.
Types of indicators
Biological, geomorphological, and climatic
Biological Biological and geomorphological
Single indicators Fish Fish Algal cover >10%
Fish Aquatic life stages of snakes or amphibians
Type of tool Random forest model Classification table (simplified from random forest model)
Decision tree (simplified from random forest model)
Stratification Snow-influence None None Classifications Perennial, intermittent,
ephemeral, and at least intermittent.
Perennial, intermittent, ephemeral, at least intermittent, and need more information.
Perennial, intermittent, ephemeral, and at least intermittent.
Aquatic invertebrate identification
Required at Family level Required at Order level
Required at Family level
Hydrophytic plant identification
None Required Required
Field time required
Up to 2 hours Up to 2 hours Up to 2 hours
Section 1: Introduction and Background
10
Figure 5. Status of the development of regional SDAMs at the time of this manual’s publication.

Section 2: Overview of the beta SDAM WM and the assessment process
11
Section 2: Overview of the Beta SDAM WM and the Assessment Process Considerations for assessing streamflow duration and interpreting indicators Clean Water Act Jurisdiction Regulatory agencies evaluate aquatic resources based on current regulations, guidance, and policy, and the beta SDAM WM does not incorporate that broad scope of analysis. Rather, the method provides information that may support timely decisions because it helps determine streamflow duration class.
Scales of assessment The beta SDAM WM protocol applies to an assessment reach, the length of which scales with the mean bankfull channel width (from a minimum of 40 m to a maximum of 200 m). Indicator observations are restricted to the bankfull channel and within one-half bankfull channel width from the top of each bank. Floodplains and wetlands extending beyond the one-half bankfull channel width from top of banks are not included in the assessment of beta SDAM WM indicators. However, ancillary information from outside the assessment reach (such as surrounding land use) is also recorded, and some indicators require comparison of conditions in the channel with conditions in adjacent uplands. The minimum reach-length of 40 m is necessary to ensure that a sufficient area has been assessed to observe indicators.
Spatial variability Indicators of streamflow duration (and other biological, hydrologic, and geomorphic characteristics of streams) vary in their strength of expression within and among reaches in a stream system. The main drivers of spatial variation are generally the physiographic province (e.g., geology and soils) and climate (e.g., seasonal patterns of precipitation, snowmelt, and evapotranspiration). For example, certain indicators, such as riparian vegetation, may be more strongly expressed in a floodplain with deep alluvial soils than they would be in a reach underlain by shallow bedrock, even if both reaches have a similar duration of flow. Therefore, understanding the sources of spatial variability in streamflow indicators will help ensure that assessments are conducted within relatively homogenous reaches.
Common sources of variation within a stream system include:
• Longitudinal changes in stream indicators are related to increasing duration and volume of flow. As streams gain or lose streamflow, the expression of indicators changes.
• Longitudinal changes are due to channel gradient and valley width, which affect physical processes, and they may directly or indirectly affect the expression of indicators. Sharp transitions in valley gradient or width (e.g., going from a confined canyon to an alluvial fan) can be associated with changes in streamflow duration.
• The size of the stream; streams develop different channel dimensions due to differences in flow magnitude, sediment loads, landscape position, land-use history, and other factors.
• Other natural sources of variation, such as fractured bedrock, volcanic parent material, recent or extensive relic colluvial activity (landslides or debris flows), and drought or unusually high precipitation events, should also be noted by the user.
• Transitions in land use with different water use (e.g., from commercial forest to pasture, from pasture to cultivated farmland, or cultivated farmland to an urban setting), or changes in management practices (e.g., intensification of grazing) that affect the expression of indicators.
Section 2: Overview of the beta SDAM WM and the assessment process
12
• Stream management and manipulation, such as diversions, water importation, dam operations, and habitat modification (e.g., streambed armoring), can also influence the appearance of biological, hydrological, and physical characteristics of streams.
Temporal variability Temporal variability in indicators may affect streamflow duration assessment in two ways: interannual (e.g., year-to-year) variability and intra-annual (e.g., seasonal) variability. This method was developed to be robust to both types of temporal variability and is intended to classify streams based on their long-term patterns in either flowing or dry conditions. However, both long-term sources of temporal variability (such as El Niño-related climatic cycles) and short-term sources (such as scouring storms before sampling) may influence the ability to measure or interpret indicators at the time of assessment. Timing of management practices, such as dam operations, channel clearing, or groundwater pumping, may also affect the flow duration assessment.
Some indicators are highly responsive to temporal variability. For example, algal growth may be detected in a streambed only following a few weeks of sustained inundation. In contrast, long-lived riparian plants tend to reflect long-term patterns, and changes in flow regimes may take several years to result in changes in the riparian corridor. For example, willows with well-established root systems are likely to survive in an intermittent reach experiencing severe drought, even when flow in a single year is insufficient to support expression of algal or aquatic invertebrate indicators. Through the inclusion of multiple indicators having different lifespans and life-history traits, beta SDAM WM classifications reflect both recent and long-term patterns in flow duration.
Ditches and modified natural streams Assessment of streamflow duration is sometimes needed in canals, ditches, and modified natural streams that are primarily used to convey water. These systems tend to have altered flow regimes, and the beta SDAM WM may determine if these flow regimes support indicators consistent with different streamflow duration classes. Thus, the beta SDAM WM may be applied to these systems when streamflow duration information is needed.
Geomorphological indicators (specifically, bankfull channel width and sinuosity) may be difficult to assess in straightened or heavily modified systems. Indicator measurements should be based on present-day conditions, not historic conditions. Assessors should note if the channel geomorphology reflects natural processes or if it reflects the effects of management activities.
The “differences in vegetation” indicator may be challenging to assess in highly modified systems where surrounding upland vegetation has been replaced with highly managed or developed landscapes. In these settings, assessors may compare channel vegetation to upland vegetation in comparable settings outside the assessment reach or based on experience and knowledge of the typical upland vegetation in the region. Assessors should note how upland vegetation was assessed when varying from normal procedures.
Other disturbances Assessors should be alert for natural or human-induced disturbances that either alter streamflow duration directly or modify the ability to measure indicators. Streamflow duration can be directly affected by flow diversions, urbanization and stormwater management, septic inflows, agricultural and irrigation practices, effluent dominance, or other activities. In the method development data set, the
Section 2: Overview of the beta SDAM WM and the assessment process
13
beta SDAM WM classified disturbed reaches with similar accuracy as undisturbed reaches. When the disturbance is severe enough to convert a reach from one streamflow duration class to another, the beta SDAM WM typically identifies the new class if sufficient time has passed since the disturbance.
Streamflow duration indicators can also be affected by disturbances that may not substantially affect streamflow duration (for instance, grading, grazing, recent fire, riparian vegetation management, and bank stabilization); in extreme cases, these disturbances may eliminate specific indicators (e.g., absence of aquatic invertebrates in channels that have undergone recent grading activity). Wildfire may have a strong impact on the ability to assess differences in vegetation, and assessments conducted in burned areas may underestimate this indicator until the vegetation begins to recover. Diversions can affect both vegetation and geomorphological indicators (e.g., Caskey et al. 2015). Some long-term alterations or disturbances (e.g., impoundments) can make streamflow duration class more predictable by reducing year-to-year variation in flow duration and/or indicators. Discussion of how specific indicators are affected by disturbance is provided below in the section on data collection. Assessors should describe disturbances in the “Notes on disturbances or difficult assessment reach conditions” section of the field form.
Multi-threaded systems Assessors should identify the lateral extent of the active channel, based on the outer limits of ordinary high-water mark (OHWM), and apply the method to that area as a whole. That is, do not perform separate assessments on each channel within a multi-threaded system. Some indicators may be more apparent in the main channel versus the secondary channels; note these differences on the field assessment form.
Section 3: Data collection
14
Section 3: Data Collection Order of operations in completing the beta SDAM WM assessment The following general workflow is recommended for efficiency in the field:
1. Conduct desktop reconnaissance. a. Optional: Perform preliminary assessments of selected indicators.
2. Prepare sampling gear. 3. Walk the reach.
a. Measure the bankfull channel width at three locations and calculate the average to determine the total reach length.
b. Record the presence of fish (i.e., one of the beta SDAM WM indicators), amphibians, and other organisms that may be disturbed by field crew activity.
c. Take photographs at appropriate locations (i.e., the top, middle, and bottom of the assessment reach) and begin sketching the reach on the field form.
4. Determine the length of assessment reach and reach boundaries. 5. Record general reach information on the data sheet. 6. Evaluate the remaining indicators:
a. Collect invertebrates from at least 6 suitable locations. Tally individuals, and search for mayflies and perennial indicator families in the sampled material.
b. Visually estimate the percent cover of algae in the streambed. c. Assess differences in vegetation d. Assess sinuosity
7. Complete and review the field form. 8. Enter data into the web application, which will calculate the appropriate climatic indicators and
determine the degree of snow influence based on reach location (sccwrp.shinyapps.io/beta_sdam_wm).
Conduct desktop reconnaissance Before an assessment reach visit, desktop reconnaissance helps ensure a successful assessment of a stream. During desktop reconnaissance, assessors evaluate reach accessibility and set expectations for conditions that may affect field sampling. In addition, assessors can begin to compile additional data that may inform determination of streamflow duration, such as location of nearby stream gages.
This stage of the evaluation is crucial for determining reach access. The reach or project area should be plotted on a map to determine access routes and whether landowner permissions are required. Safety concerns or hazards that may affect sampling should be identified, such as road closures or landslides associated with wildfire. These access constraints are sometimes the most challenging aspect of environmental field activities, and desktop reconnaissance can reduce these difficulties. Also, assessors can determine if inaccessible portions of the reach (e.g., those on adjacent private property) have consistent geomorphology or other attributes, compared with accessible portions.
Desktop reconnaissance can also help identify features that may affect assessment reach placement or the number of assessment reaches required for a project requiring streamflow duration information. Look for natural and artificial features that may affect streamflow duration at the reach—particularly those that may not be evident during the field visit, or on inaccessible land outside the assessment area.
Section 3: Data collection
15
These features include sharp transitions in geomorphology, upstream dams or reservoirs, and major tributaries. It may be possible to see bedrock outcrops or other features that modify streamflow duration in sparsely vegetated areas. A review of historical imagery may also indicate whether the reach or its upstream watershed is influenced by snowmelt.
Evaluating watershed characteristics during desktop reconnaissance can produce useful information that will help assessors anticipate field conditions or provide contextual data to help interpret results. The USGS StreamStats tool, as well as the U.S. EPA WATERS GeoViewer, provide convenient online access to watershed information for most assessment reaches in the United States, such as drainage area, soils, land use or impervious cover in the catchment, or modeled bankfull discharge.
• USGS StreamStats: https://streamstats.usgs.gov/ss/ • U.S. EPA WATERS GeoViewer: https://www.epa.gov/waterdata/waters-geoviewer
Assessors should consult local experts and agencies to gain additional insights about reach conditions and see if additional data are available. For example, state agencies may have records on water quality sampling, indicating times when the reach was sampled, and when it was dry. Local experts may have information about changes in the reach’s streamflow duration.
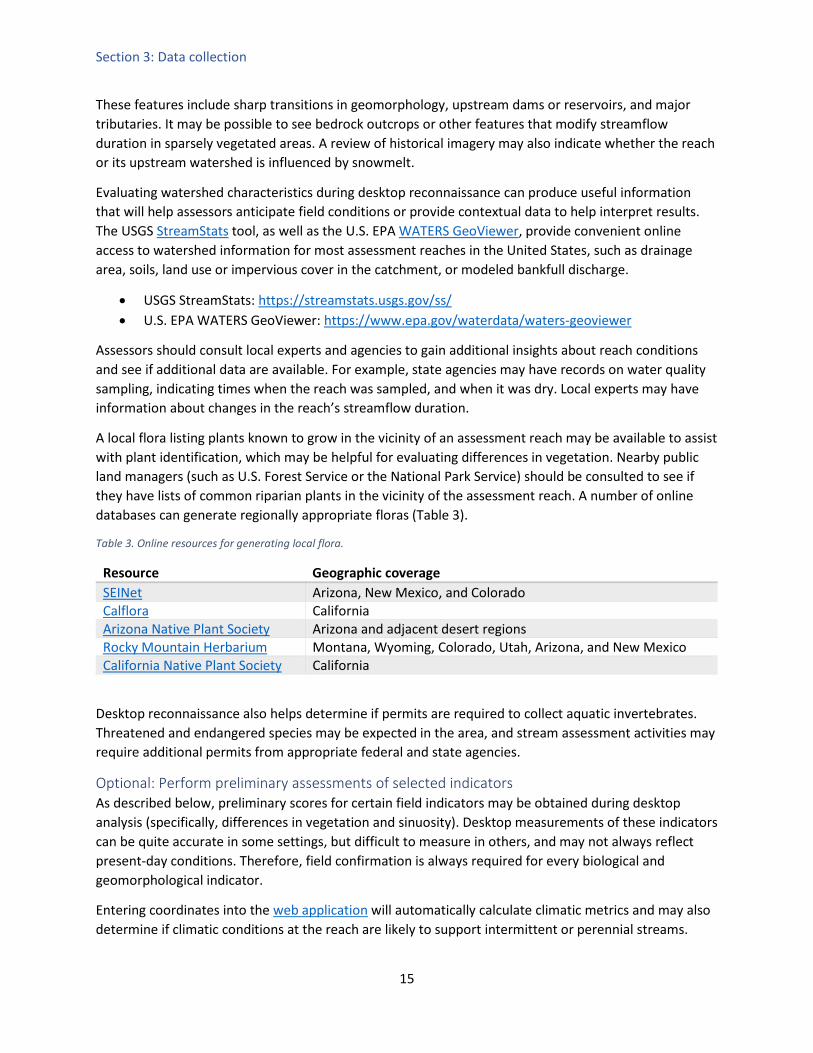
A local flora listing plants known to grow in the vicinity of an assessment reach may be available to assist with plant identification, which may be helpful for evaluating differences in vegetation. Nearby public land managers (such as U.S. Forest Service or the National Park Service) should be consulted to see if they have lists of common riparian plants in the vicinity of the assessment reach. A number of online databases can generate regionally appropriate floras (Table 3).
Table 3. Online resources for generating local flora.
Resource Geographic coverage SEINet Arizona, New Mexico, and Colorado Calflora California Arizona Native Plant Society Arizona and adjacent desert regions Rocky Mountain Herbarium Montana, Wyoming, Colorado, Utah, Arizona, and New Mexico California Native Plant Society California
Desktop reconnaissance also helps determine if permits are required to collect aquatic invertebrates. Threatened and endangered species may be expected in the area, and stream assessment activities may require additional permits from appropriate federal and state agencies.
Optional: Perform preliminary assessments of selected indicators As described below, preliminary scores for certain field indicators may be obtained during desktop analysis (specifically, differences in vegetation and sinuosity). Desktop measurements of these indicators can be quite accurate in some settings, but difficult to measure in others, and may not always reflect present-day conditions. Therefore, field confirmation is always required for every biological and geomorphological indicator.
Entering coordinates into the web application will automatically calculate climatic metrics and may also determine if climatic conditions at the reach are likely to support intermittent or perennial streams.

Section 3: Data collection
16
Prepare sampling gear The following gear is needed for completion of the beta SDAM WM. Ensure that all equipment is available and functional before each assessment visit. Also ensure that all equipment has been cleaned off-site between assessment visits to prevent the spread of invasive species.
• This manual, and copies of paper field forms. • Clipboard/pencils/sharpies. • Field notebook. • Maps and aerial photographs (1:250 scale if possible). • Global Positioning System (GPS) – used to identify the boundaries of the reach assessed. A
smartphone that includes a GPS may be a suitable substitute. • Tape measure – for measuring bankfull channel width and reach length. • Kick-net or small net and tray – used to sample aquatic invertebrates. • Mechanical tally counter (optional). • Hand lens – to assist with macroinvertebrate and plant identification. • Digital camera (or smartphone with camera), plus charger. Ideally, use a digital camera that
automatically record metadata, such as time, date, directionality, and location, as part of the EXIF data associated with the photograph.
• Polarized sunglasses – for eliminating surface glare when looking for fish, amphibians, and aquatic invertebrates.
• Shovel, soil augur, rock hammer, hand trowel, pick or other digging tools to facilitate hydrological observations of subsurface flow.
• Aquatic invertebrate field guides (e.g., A Guide to Common Freshwater Invertebrates of North America, Voshell 2002).
• Vials filled with 70% ethanol and sealable plastic bags for collection of biological specimens, with sample labels printed on waterproof paper.
• Herpetological field guides (e.g., A Field Guide to Western Reptiles and Amphibians, Stebbins 2003).
• Fish identification guides (e.g., Peterson Field Guide to Freshwater Fishes, Page et al. 2011). • First-aid kit, sunscreen, insect repellant, and appropriate clothing.
Timing of sampling Ideally, beta SDAM WM application should occur during the growing season when many aquatic invertebrates are most active and most readily identifiable. In high elevations, this may be in the late summer or early fall, while in lower elevations, late spring or early summer may be more suitable. Assessments may be made during other times of the year, but there is an increased likelihood of specific indicators being dormant or difficult to measure at the time of assessment. However, several of the indicators included in the method persist well beyond a single growing season (e.g., long-lived aquatic invertebrates, riparian vegetation, algal cover), reducing the sensitivity of the method to the timing of sampling.
The protocol may be used in flowing streams as well as in dry or drying streams. However, care should be taken to avoid sampling during flooding conditions and assessors should wait at least one week after large storm events that impact vegetation and sediment in the active stream channel before collecting data to allow aquatic invertebrates and other biological indicators to recover (Grimm and Fisher 1989).

Section 3: Data collection
17
In general, aquatic invertebrate abundance is suppressed during and shortly after major channel-scouring events, potentially leading to inaccurate assessments. Recent rainfall can interfere with measurements (e.g., by washing away aquatic invertebrates or increasing turbidity such that algae on the streambed are not visible). Assessors should note recent rainfall events on the field form and consider the timing of field evaluations to assess each indicator’s applicability. Field evaluations should not be completed within one week of significant rainfall that results in surface runoff. Local weather data and drought information should be reviewed before assessing a reach or interpreting indicators. Whenever interpreting beta SDAM WM data, it is recommended that antecedent precipitation data from nearby weather stations be evaluated after each sampling event to determine if storms may have affected data collection.
Assessment reach size, selection, and placement An assessment reach should have a length equal to 40 bankfull channel-widths, with a minimum of 40 m (to ensure that sufficient area is assessed to observe indicators) and a maximum length of 200 m. Bankfull channel width is averaged from measurements at three locations (e.g., at the downstream end, at 15 m, and at 30 m upstream from the downstream end). Width measurements are made at bankfull elevation, perpendicular to the thalweg (i.e., the deepest point within the channel). In single-thread systems, the channel-width is the same as the bankfull width. In multi-thread systems, the width is measured for the entire active channel, based on the outer limits of the OHWM. Reach length is measured along the thalweg. If access constraints require a shorter assessment reach than needed, the actual assessed reach-length should be noted on the field form, along with an explanation for why a shortened reach was necessary.
Assessors should look for indicators of bankfull elevation when measuring bankfull channel width. These indicators include topographic features (such as the point where the stream transitions to its floodplain or breaks in the slope of the bank), changes in particle size distribution, changes in vegetation, distribution of debris on the floodplain, exposed tree roots, water stains on rocks, and lichen lines. Certain indicators may be more or less evident in different stream types, so assessors should evaluate multiple bankfull indicators when measuring bankfull channel width.
For some applications, reach placement is dictated by project requirements. For example, a small project area may be fully covered by a single assessment reach. In these cases, assessment reaches may contain diverse segments with different streamflow duration classes (e.g., a primarily perennial reach with a short intermittent portion where the flow goes subsurface). In these cases, the portions of the reach with long-duration flows will likely have a greater influence on the outcome than the portions with short-duration flows, depending on each portion’s relative size.
Natural features, such as bedrock outcrops or valley confinements, and non-natural features like culverts or road crossings may alter hydrologic characteristics in their immediate vicinity. For example, culverts may create plunge pools, and drainage from roadways is often directed to roadside ditches that enter the stream near crossings, leading to a potential increase in indicators of long streamflow duration. Specific applications may require that these areas be included in the assessment, even though they are atypical of the larger assessment reach. For other applications, the area of influence may be avoided by moving the reach at least 10 m up- or downstream.
Section 3: Data collection
18
Note that bankfull channel width is not only used to determine the total length of the assessment reach, but also as an indicator of streamflow duration, as described below (Indicator #5).
Walking the assessment reach Stream assessments should begin by first walking the channel’s length, to the extent feasible, from the target downstream end to the top of the assessment reach. This initial review of the reach allows the assessor to examine the channel’s overall form, landscape, parent material, and variation within these attributes as it develops or disappears upstream and downstream. This investigation may determine whether adjustments to assessment reach boundaries are needed, or whether multiple assessment reaches are needed to adequately characterize streamflow duration throughout the project area where information is needed. Walking alongside, rather than in, the channel is recommended for the initial review to avoid unnecessary disturbance to the stream and maximize the opportunity to observe single indicator organisms (e.g., fish). Walking the channel also allows the assessor to observe the surrounding landscape’s characteristics, such as land use and sources of flow (e.g., stormwater pipes, springs, seeps, and upstream tributaries).
Once the walk is complete, the assessor can identify the areas along the stream channel where these various sources (e.g., stormflow, tributaries, or groundwater) or sinks (alluvial fans, abrupt changes in bed slope, etc.) of water may cause abrupt changes in flow duration. When practical, assessment reaches should have relatively uniform channel morphology. When evaluating the reach’s homogeneity, focus on permanent features that control streamflow duration (such as valley gradient and width), rather than on the presence or absence of surface water. Project areas that include confluences with large tributaries, significant changes in geologic confinement, or other features that may affect flow duration may require separate assessments above and below the feature. Regardless of whether a reach is moved or shortened, it should not be less than 40 m in length to ensure that indicators are measured appropriately. Assessments based on reaches shorter than 40 m may not detect indicators that would be recorded by assessments with the recommended size and may thus provide inaccurate classifications.
How many assessment reaches are needed? The outcome of an assessment applies to the assessed reach and may also apply to adjacent reaches some distance up- or down-stream. The factors affecting spatial variability of streamflow duration indicators (described above) dictate how far from an assessment reach a classification applies. More than one assessment may be necessary if streamflow duration information is needed for a large or heterogenous project area (and multiple assessments are usually preferable to a single assessment). In areas that include the confluence of large tributaries, road crossings, or other features that may alter the hydrology, multiple assessment reaches may be required (e.g., one above and one below the feature).
Photo-documentation Photographs can provide strong evidence to support the beta SDAM WM’s conclusions, and extensive photo-documentation is recommended. Taking several photos of the reach condition and any disturbances or modifications relevant to making a final streamflow duration classification is strongly recommended. Specifically, the following photos should be taken as part of every assessment:
• A photograph from the top (upstream) end of the reach, looking downstream.

Section 3: Data collection
19
• Two photographs from the middle of the reach, one looking upstream and one looking downstream.
• A photograph from the bottom of the reach, looking upstream.
These photographs are also strongly recommended:
• Vegetation near the channel, paired with a second photograph showing vegetation in surrounding uplands.
• Aquatic invertebrates, if practical. • Algae on the streambed. • Any vertebrates encountered (especially fish). • Disturbed or unusual conditions that may affect the measurement or interpretation of
indicators.
Conducting assessments and completing the field form General reach information After walking the reach and determining the appropriate boundaries for the assessment area, enter the project name, reach code or identifier, waterway name, assessor(s) name(s), and the date of the assessment visit. These data provide essential context for understanding the assessment but are not indicators for determining streamflow duration class.
Coordinates Record the coordinates of the downstream end of the reach from the center of the channel.
Weather conditions Note current weather conditions. If known, note precipitation within the previous week on the datasheet, and consider delaying sampling, if possible. If rescheduling is not possible, note whether the streambed is recently scoured, and if turbidity is likely to affect the measurement of indicators.
Surrounding land use Indicate the dominant land-use around the reach within 100-m buffer. Check up to two of the following:
• Urban/industrial/residential (buildings, pavement, or other anthropogenically hardened surfaces).
• Agricultural (e.g., farmland, crops, vineyard, pasture). • Developed open-space (e.g., golf course, sports fields). • Forested. • Other natural. • Other (describe).
Bankfull channel width and reach length Record the bankfull channel width at three locations at bankfull elevation, and record to the nearest 0.1 m. Widths should be measured perpendicular to the thalweg. In braided systems, widths should span all channels within the OHWM. Taking measurements at 0, 15, and 30 m above the downstream end of the reach or approximately one-third of the expected reach length is recommended. Calculate the average width.
Section 3: Data collection
20
Record the reach length, which should be 40 times the average bankfull channel width, but no less than 40 m and no more than 200 m, and measured along the thalweg (i.e., along the deepest points within the channel). In multi-thread systems, measure reach-length along the thalweg of the deepest channel. If circumstances require a shorter reach length, enter the assessed reach’s actual length. Justification for an assessment reach length shorter than 40 m should be provided in “Describe reach boundaries.”
Describe reach boundaries Record observations about the reach on the field form, such as changes in land use, disturbances, or natural changes in stream characteristics that occur immediately up or downstream. If the reach is less than 200 m and shorter than 40 times the average bankfull channel width, explain why a shorter reach length was appropriate. For example: “The downstream end is 30 m upstream of a culvert under a road. The upstream end is close to a conspicuous dead tree just past a large meander, near a fence marking a private property boundary. The reach length was shortened to 150 m to avoid private property.”
Photo-documentation of reach Check the boxes on the field form as you take the required photographs from the bottom, middle, and top of reach. Record the photo ID on the designated part of the field form.
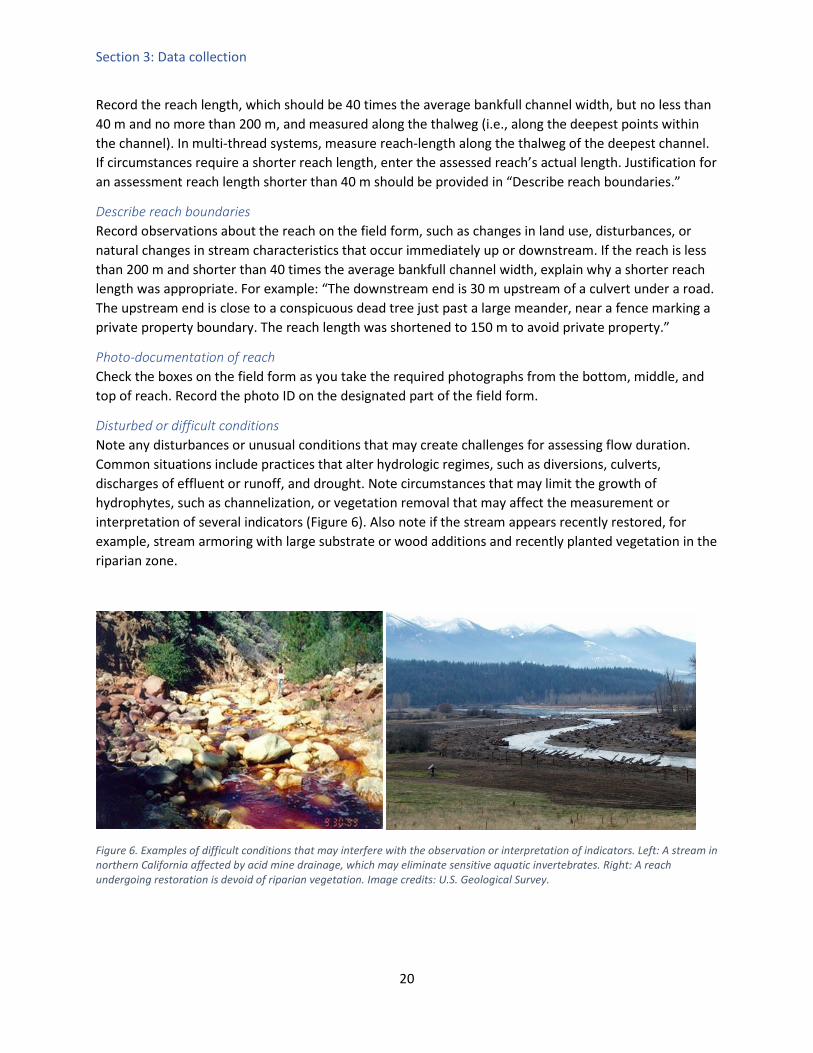
Disturbed or difficult conditions Note any disturbances or unusual conditions that may create challenges for assessing flow duration. Common situations include practices that alter hydrologic regimes, such as diversions, culverts, discharges of effluent or runoff, and drought. Note circumstances that may limit the growth of hydrophytes, such as channelization, or vegetation removal that may affect the measurement or interpretation of several indicators (Figure 6). Also note if the stream appears recently restored, for example, stream armoring with large substrate or wood additions and recently planted vegetation in the riparian zone.
Figure 6. Examples of difficult conditions that may interfere with the observation or interpretation of indicators. Left: A stream in northern California affected by acid mine drainage, which may eliminate sensitive aquatic invertebrates. Right: A reach undergoing restoration is devoid of riparian vegetation. Image credits: U.S. Geological Survey.
Section 3: Data collection
21
Observed hydrology Surface flow Visually estimate the percentage of the reach-length that has flowing surface water, or subsurface flow. The reach sketch should indicate where surface flow is evident and where dry portions occur.
Subsurface flow If the reach has discontinuous surface flow, investigate the dry portions to see if subsurface flow is evident. Examine below the streambed by turning over cobbles and digging with a trowel. Resurfacing flow downstream may be considered evidence of subsurface flow (Figure 7). Other evidence of subsurface flow includes:
• Flowing surface water disappears into alluvial deposits and reappears downstream. This is scenario is common when a large, recent alluvium deposit created by a downed log or other grade-control structure creates a sharp transition in the channel gradient or in valley confinement.
• Water flows out of the streambed (alluvium) and into isolated pools. • Water flows below the streambed and may be observed by moving streambed rocks or digging a
small hole in the streambed. • Shallow subsurface water can be heard moving in the channel, particularly in steep channels
with coarse substrates.
Record the percent of the reach with subsurface and surface flow (combined). That is, the percent of reach with subsurface flow should be greater than or equal to the percent of reach with surface flow (Figure 7).
The reach sketch should indicate where subsurface flow is evident.
Number of isolated pools If the reach is dry or has discontinuous surface flow, look for isolated pools within the channel that provide aquatic habitat. If there is continuous surface flow throughout the reach, enter 0. The reach sketch should indicate the location of pools in the channel or on the floodplain. Only isolated pools within the channel are counted, including isolated pools within secondary channels that are part of the active channel and within the OHWM. Pools connected to flowing surface water and isolated pools on the floodplain do not count. Dry pools (i.e., pools that contain no standing water at the time of assessment) do not count.

Section 3: Data collection
22
100% surface flow 100% surface + subsurface flow 0 isolated pools
70% surface flow 70% surface + subsurface flow 0 isolated pools
80% surface flow 100% surface + subsurface flow 0 isolated pools
70% surface flow 70% surface + subsurface flow 1 isolated pool
Figure 7. Examples of estimating surface and subsurface flow, and isolated pools. Orange represents the dry channel and blue represents surface water in the channels. White represents the floodplain outside the channel. The pool in A does not count because it is outside the channel, whereas the pools in B and C do not count because they are connected to flowing surface water. In contrast, the lower pool in D counts because it is isolated from any flowing surface water and is within the channel.
Assessment reach sketch On the data sheet, sketch the assessment reach, indicating important features, such as access points, important geomorphological features, the extent of dry or aquatic habitats, riffles, pools, etc. Note locations where photographs are taken and where channel measurements are made.
How to measure indicators of streamflow duration Assessments are based on the measurement of eight indicators of streamflow duration:
Biological indicators 1. The abundance and richness of aquatic invertebrates 2. Algal cover on the streambed 3. Fish abundance 4. Differences in vegetation between the channel and surrounding uplands
A B C D

Section 3: Data collection
23
Geomorphological indicators 5. Bankfull channel width 6. Sinuosity
Climatic indicators
7. Long-term precipitation 8. Long-term maximum annual air temperature
The biological indicators are all positive indicators of streamflow duration. That is, the presence or abundance of those indicators are associated with longer duration flows. For example, higher aquatic invertebrate abundance is associated with perennial reaches. Similarly, sinuosity is a positive indicator, in that more sinuous reaches typically have longer streamflow duration. The relationship between streamflow duration and bankfull channel width or the climatic indicators is less straightforward; in general, wider channels are more likely to be perennial, as are reaches with higher precipitation or lower temperatures. However, a wide range of streamflow durations occur in a variety of climatic settings and in both narrow and wide channels. These indicators affect the way other indicators are interpreted, and they were included in the method because they greatly improve the overall accuracy of its classifications.
These indicators are based on what is observed at the time of assessment, not on what would be predicted to occur if the channel were wet, or in the absence of disturbances or modifications. Disturbances and modifications (e.g., vegetation management, channel hardening, diversions) should be described in the “Notes” section of the datasheet and are taken into account when drawing conclusions. Under each indicator, some common ways that disturbances can interfere with indicator measurement are described.
1. Abundance and richness of aquatic invertebrates Aquatic invertebrates require the presence of water (and in many cases flowing water) for their growth and development for at least part of their life cycle. A wide range of taxonomic groups are considered aquatic invertebrates, including insects (e.g., mayflies, stoneflies, caddisflies, hellgrammites, midges), annelids (worms and leeches), mollusks (clams and snails), amphipods, isopods and crayfish (crustaceans). Only invertebrates that can be seen without magnification (i.e., macroinvertebrates) are counted as part of this indicator. Only aquatic life stages of aquatic invertebrates are considered in this indicator. For example, the winged adult life stage of dragonflies is excluded from scoring this indicator as they are able to fly from other water bodies.
Such invertebrates are indicators of streamflow duration because they require aquatic habitat to complete specific life stages. For example, several mollusk species cannot survive extended periods outside of water, in contrast to some stonefly or alderfly larvae that resist desiccation in some seasons of the year by burrowing into the hyporheic zone. Some invertebrates can survive short periods of drying in damp soils below the surface in egg or larval stages that are resistant to drying. Others are quick to colonize temporary water and complete the aquatic portion of their life cycle during the wettest part of the year when sustained flows are most likely.
Invertebrates are assessed within the defined reach using a single site-visit. Aquatic invertebrate indicators do not differentiate between live organisms and non-living material such as shells, casings,

Section 3: Data collection
24
and exuviae (i.e., the shed skins of larvae and nymphs left behind as they emerge as winged adults). In other words, mussel shells are treated the same as live mussels, and empty caddisfly cases are treated the same as cases with living caddisflies. Note if the distribution of the dead material suggests that it may have been transported from outside the assessment reach. For example, shells found within wrack lines may indicate transportation from upstream sources by a flood, and shells found within middens (i.e., mounds of bones, shells, and other unconsumed food scraps) may indicate transportation from other waterbodies by an animal.
Although they require aquatic habitats, mosquitos in larval or pupal form should not be counted. Their rapid lifecycles make them unsuitable for use as indicators of streamflow duration.
A kick-net or D-frame net and a hand lens are required to collect and identify specimens. Assessors begin sampling at the most downstream point in the assessment reach and proceed to sample the upstream direction. The kick-net is placed perpendicular against the streambed and stir the substrate upstream of the net for a minimum of one minute. Jab the net under banks, overhanging terrestrial and aquatic vegetation, leaf packs, and in log jams or other woody material. Samples should be collected from at least six distinct locations representing the different habitats occurring in the reach. Empty contents of the net into a white tray with fresh water for counting and identification. Many individuals will appear cryptic and/or the same until seen against a contrasting color background, and some bivalves and other invertebrates can be pea-sized or smaller.
Searching is complete when:
• At least six different locations within the reach have been sampled across the range of habitat types and a minimum of 15 minutes of effort expended (not including specimen identification time), or;
• All available habitat in the assessment reach has been completely searched in less than 15 minutes. A search in dry stream channels with little bed or bank development and low habitat diversity may be completed in less than 15 minutes.
During the 15-minute sampling period, search the full range of habitats present, including: water under overhanging banks or roots, in pools and riffles, accumulations of leaf packs, woody debris, and the coarse inorganic particles (pick up rocks and loose gravel). To find mollusks, one should examine hard substrates, such as sticks and rocks for mussels, clams and snails, silty areas of the stream bed for clams, and aquatic plants for snails. Empty clam shells can be found washed up on banks and bars and in coarse sand or gravel deposits.
Dry channels: Assessors should first walk the reach to ascertain whether it is completely dry or if areas of standing water are present. Focus the search on areas serving as refuge such as any remaining pools or areas of moist substrate for living macroinvertebrates, the sandy channel margins for mussel and aquatic snail shells, and under cobbles and other larger bed materials for caddisfly casings. Exuviae of emergent mayflies or stoneflies may be observed on dry cobbles or stream-side vegetation (Figure 8). In summary, sampling methodology consistent with the Xerces Society’s recommendations on using aquatic macroinvertebrates as indicators of streamflow duration (Mazzacano and Black 2008) is recommended.

Section 3: Data collection
25
If a reach contains both dry and wet areas, focus on searching the wet habitats, as these are the most likely places to encounter aquatic invertebrates. However, do not ignore dry areas.
When searching dry channels (or dry portions of partially wet channels), be sure to avoid counting terrestrial invertebrates in the streambed (Figure 9). Some insect families, such as crane flies (Diptera: Tipulidae), include both aquatic and terrestrial species. If you are unsure whether the invertebrates you encounter are aquatic or terrestrial, collecting a specimen and identifying it in a lab setting or consulting an entomologist is recommended.
Figure 8. Examples of aquatic invertebrates found in dry streambeds. Top left: Some species of dobsonfly (Megaloptera: Corydalidae) construct chambers in the moist substrate of dry streambeds. Top right: Stonefly (Plecoptera) exuvia. Exuviae are left behind when aquatic nymphs or pupae emerge from the stream and go through a final molt to metamorphose to winged adults. Bottom left: Caddisfly cases may persist under large cobbles or boulders well after the cessation of flow. Bottom right:

Section 3: Data collection
26
Snail shells (especially in the Hydrobiidae and Physidae families) are among the most frequently encountered aquatic invertebrates in dry streambeds, but care should be taken to avoid mistakenly counting terrestrial snails as aquatic snails (e.g., Figure 9). Image credits: Michael Bogan (top left) and Raphael Mazor (other photographs).
Figure 9. The larvae of terrestrial soldier flies (Stratiomyidae, left), and terrestrial garden snails (Cornu aspersum) may be found in dry stream channels. Care should be taken to avoid mistaking terrestrial invertebrates for aquatic invertebrates with similar appearances. Image credits (Raphael Mazor).
Enumeration and identification of aquatic invertebrates Aquatic invertebrate data is required to calculate four metrics used in the beta SDAM WM (Table 4).
Table 4. Aquatic invertebrate metrics used in the beta SDAM WM
Metric Areas where metric is used 1-1 Total abundance of aquatic invertebrates Snow-influenced 1-2 Total abundance of mayflies Non-snow influenced 1-3 Total abundance of perennial indicator
families Snow-influenced
1-4 Total number of perennial indicator families Both snow-influenced and non-snow influenced
To calculate these metrics, identification of certain groups (specifically, mayflies and perennial indicator families) is required. These identifications may be conducted in the field (“streamside”), or in a lab setting.
First, remove the taxa from the leaf litter or other detritus caught in the sample. Separate taxa into groups based on morphology. For every taxon observed, count the number of individuals found during the search (up to 10 per taxon). Non-living material (such as empty pupal cases or shed exoskeletons) counts the same as live individuals. Indicate the taxon name on the field form, the abundance, and indicate if the taxon is a mayfly, a perennial indicator family, or another group (these three groups are mutually exclusive).
Mayflies (Ephemeroptera) are widespread aquatic insects in perennial and intermittent streams but are not typically found in ephemeral streams. Along with stoneflies (Plecoptera) and caddisflies (Trichoptera), they often comprise the most abundant invertebrates in mountain streams. They are readily identified by the presence of plate- or feather-like abdominal gills, two or three cerci (tail-like
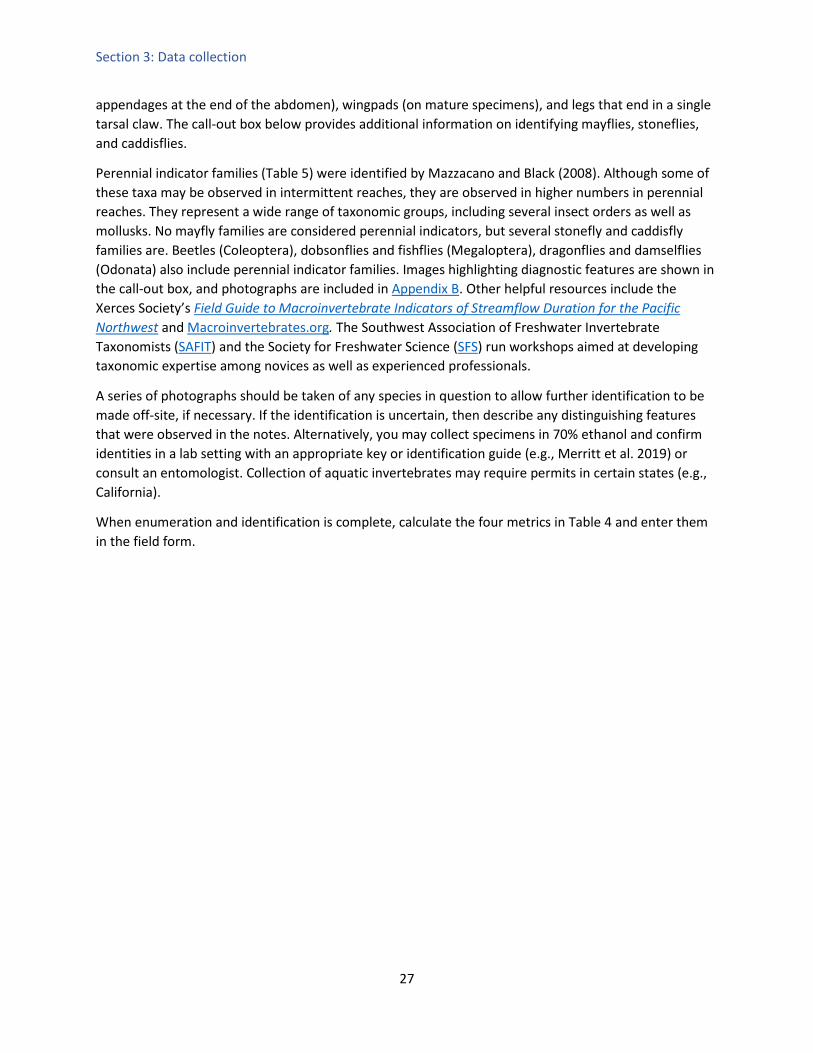
Section 3: Data collection
27
appendages at the end of the abdomen), wingpads (on mature specimens), and legs that end in a single tarsal claw. The call-out box below provides additional information on identifying mayflies, stoneflies, and caddisflies.
Perennial indicator families (Table 5) were identified by Mazzacano and Black (2008). Although some of these taxa may be observed in intermittent reaches, they are observed in higher numbers in perennial reaches. They represent a wide range of taxonomic groups, including several insect orders as well as mollusks. No mayfly families are considered perennial indicators, but several stonefly and caddisfly families are. Beetles (Coleoptera), dobsonflies and fishflies (Megaloptera), dragonflies and damselflies (Odonata) also include perennial indicator families. Images highlighting diagnostic features are shown in the call-out box, and photographs are included in Appendix B. Other helpful resources include the Xerces Society’s Field Guide to Macroinvertebrate Indicators of Streamflow Duration for the Pacific Northwest and Macroinvertebrates.org. The Southwest Association of Freshwater Invertebrate Taxonomists (SAFIT) and the Society for Freshwater Science (SFS) run workshops aimed at developing taxonomic expertise among novices as well as experienced professionals.
A series of photographs should be taken of any species in question to allow further identification to be made off-site, if necessary. If the identification is uncertain, then describe any distinguishing features that were observed in the notes. Alternatively, you may collect specimens in 70% ethanol and confirm identities in a lab setting with an appropriate key or identification guide (e.g., Merritt et al. 2019) or consult an entomologist. Collection of aquatic invertebrates may require permits in certain states (e.g., California).
When enumeration and identification is complete, calculate the four metrics in Table 4 and enter them in the field form.
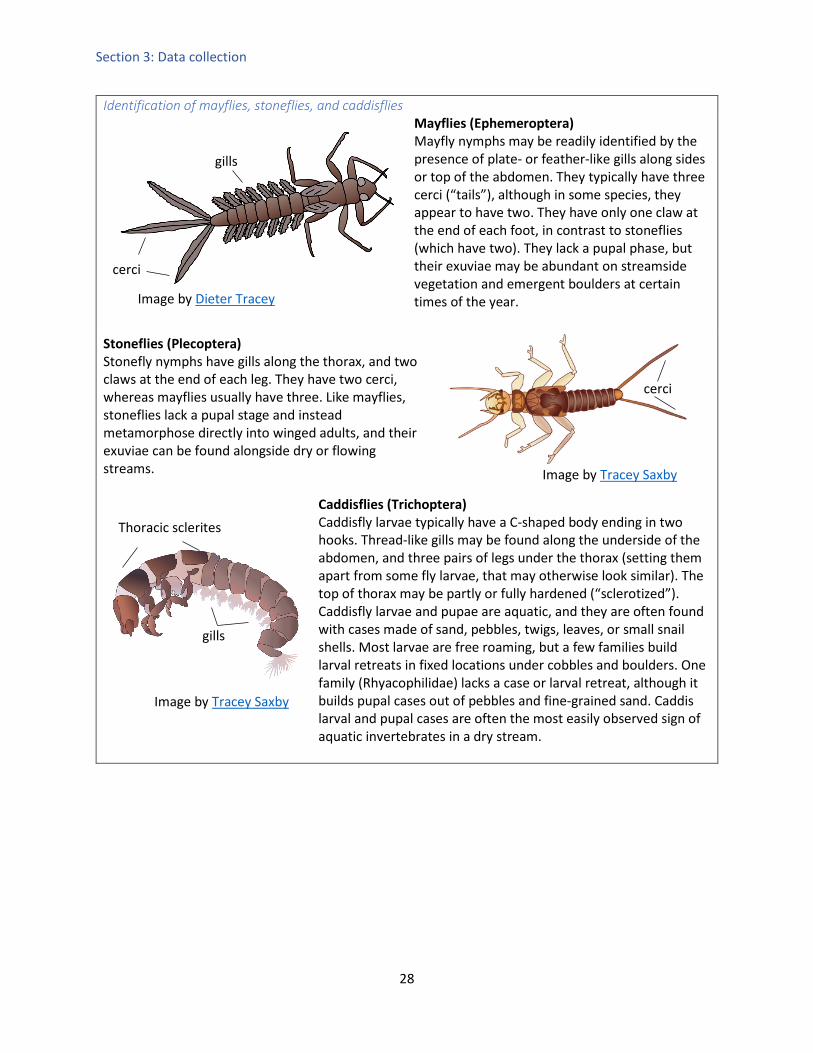
Section 3: Data collection
28
Identification of mayflies, stoneflies, and caddisflies
Mayflies (Ephemeroptera) Mayfly nymphs may be readily identified by the presence of plate- or feather-like gills along sides or top of the abdomen. They typically have three cerci (“tails”), although in some species, they appear to have two. They have only one claw at the end of each foot, in contrast to stoneflies (which have two). They lack a pupal phase, but their exuviae may be abundant on streamside vegetation and emergent boulders at certain times of the year.
Stoneflies (Plecoptera) Stonefly nymphs have gills along the thorax, and two claws at the end of each leg. They have two cerci, whereas mayflies usually have three. Like mayflies, stoneflies lack a pupal stage and instead metamorphose directly into winged adults, and their exuviae can be found alongside dry or flowing streams. Caddisflies (Trichoptera)
Caddisfly larvae typically have a C-shaped body ending in two hooks. Thread-like gills may be found along the underside of the abdomen, and three pairs of legs under the thorax (setting them apart from some fly larvae, that may otherwise look similar). The top of thorax may be partly or fully hardened (“sclerotized”). Caddisfly larvae and pupae are aquatic, and they are often found with cases made of sand, pebbles, twigs, leaves, or small snail shells. Most larvae are free roaming, but a few families build larval retreats in fixed locations under cobbles and boulders. One family (Rhyacophilidae) lacks a case or larval retreat, although it builds pupal cases out of pebbles and fine-grained sand. Caddis larval and pupal cases are often the most easily observed sign of aquatic invertebrates in a dry stream.
cerci
Image by Tracey Saxby
Image by Dieter Tracey
gills
cerci
Image by Tracey Saxby
gills
Thoracic sclerites

Section 3: Data collection
29
Table 5. Perennial indicator taxa identified by Blackburn and Mazzacano (2012) for use in SDAM for the Pacific Northwest (Nadeau 2015), with modifications indicated by superscripts. 1: The sole North American representative of Tateidae is the New Zealand mudsnail (Potamopyrgus antipodarum). This taxon is sometimes treated as a subfamily of Hydrobiidae, although genetic evidence supports treating it as a separate family (Wilke et al. 2013). Due to this species’ intolerance to desiccation, it may be treated as a perennial indicator taxon (Richards et al. 2004, Bennett et al. 2015). 2: Dreissenidae includes two introduced species of freshwater mussel, the zebra mussel (Dreissena polymorpha) and the quagga mussel (D. bugensis). Both species are typically found in reservoirs and lakes, but may be found in perennial reaches downstream of infested waterbodies (Ussery and McMahon 1995). 3: Corydalidae in the Protochauliodes-Neohermes group include taxa specialized for life in intermittent streams (see top left panel Figure 8); however, the Orohermes-Corydalus group are typically found in perennial streams in the western U.S. (Cover et al. 2015).
Group Order Perennial indicator families Mollusks Snails (any life stage) Pleuroceridae
Ancylidae Hydrobiidae Tateidae1
Freshwater mussels (any life stage) Margaritiferidae Unionidae Dreissenidae2
Insects Caddisfly larvae and pupae Rhyacophilidae Philopotamidae Hydropsychidae Glossosomatidae
Stonefly nymphs Perlidae Pteronarcyiidae
Beetle larvae Elmidae Psephenidae
Dragonfly and damselfly nymphs Gomphidae Cordulegastridae Calopterygidae
Dobsonfly and fishfly larvae Cordyalidae3
2. Algal cover on the streambed Visually estimate the extent of algal cover on the streambed (from the toe of one bank to the toe of the other) over the entire assessment reach. Algal cover is based on the entirety of the streambed and is not restricted to the wetted channel. In multi-threaded systems, estimate algal cover as a percent of the streambed of the channel where algal cover is most extensive (if any algae are observed).
Algae are visible as a pigmented mass or film, or sometimes hair-like growths on submerged surfaces of rocks, logs, plants, and any other structures within the channel, and may form mats that cover portions of the streambed. Microscopic algae associated with biofilm can be felt as a slippery film on substrates, but growth must be extensive enough to be visible to the naked eye to be counted. Periphyton growth is influenced by chemical disturbances such as increased nutrient (nitrogen or phosphorus) inputs and physical disturbances such as increased sunlight to the stream from riparian zone disturbances. All macroscopic algal forms (filamentous algae, mats, periphyton, macroalgal clumps, or microalgae growing as a visible biofilm or mat) count, whether living, dead, or dying. Estimates should fall into one of the following categories:
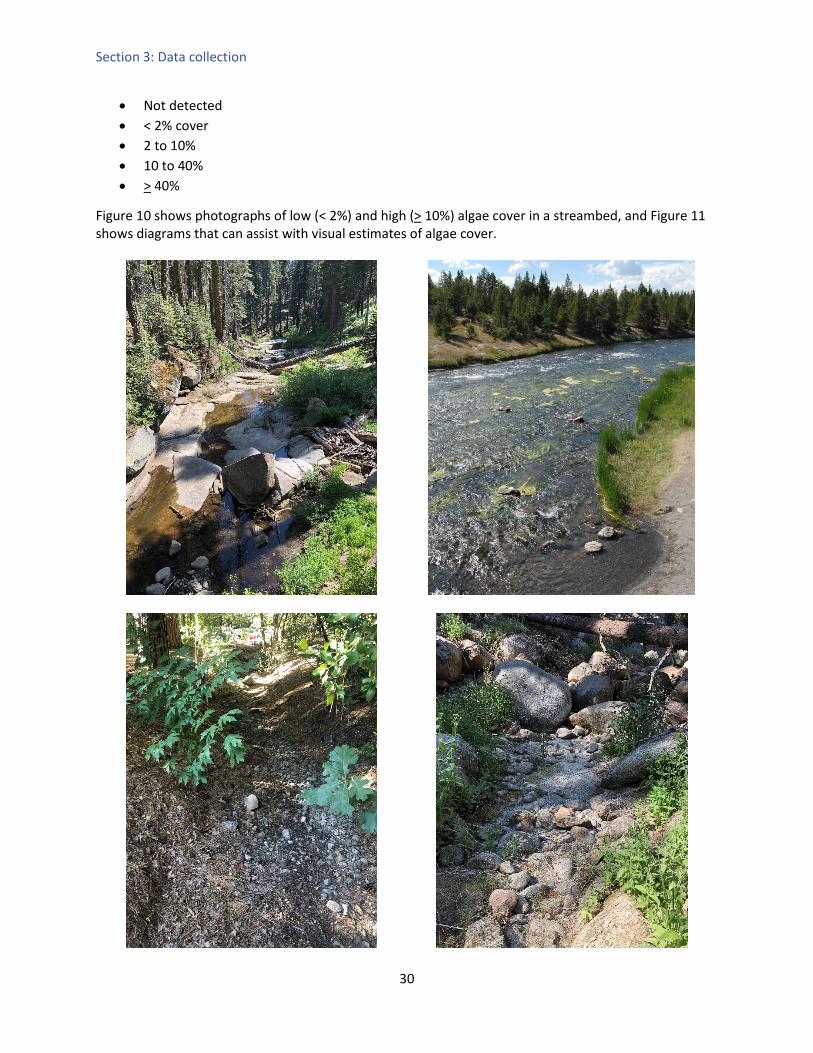
Section 3: Data collection
30
• Not detected • < 2% cover • 2 to 10% • 10 to 40% • > 40%
Figure 10 shows photographs of low (< 2%) and high (> 10%) algae cover in a streambed, and Figure 11 shows diagrams that can assist with visual estimates of algae cover.

Section 3: Data collection
31
Figure 10. Examples of low (left) and high (right) algae cover in flowing (top) and dry (bottom) streams. Image credits: Top-right: Raphael Mazor. Others: Ken Fritz.
Figure 11. Visual guides to assist estimates of algal cover on a streambed. The top row shows a relatively dispersed distribution, whereas the bottom row shows a more clustered distribution.
Live algae typically have a dull to bright green color, whereas biofilms made of diatoms are typically golden-brown. In contrast, dead algal mats are typically dull brown under wet conditions or powdery white when desiccated (Figure 12). It is possible to observe dead algal mats submerged under water if a stream has only recently started to flow.
40%1% 2% 5% 10% 20%
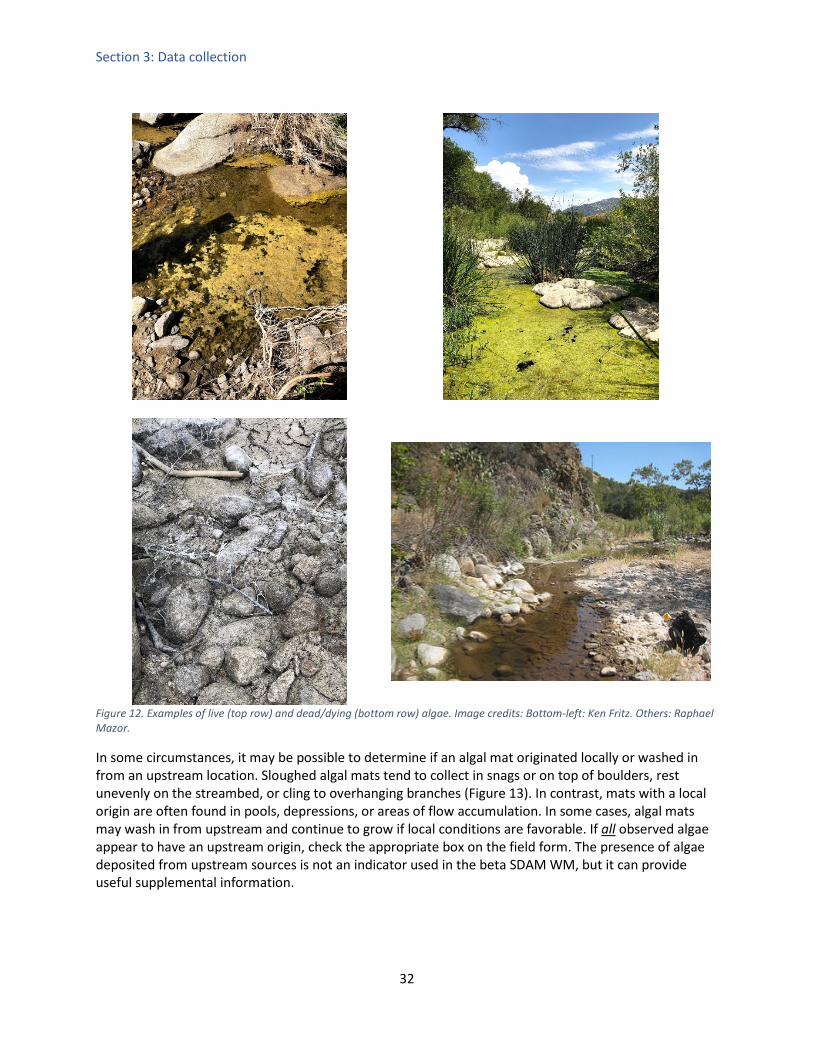
Section 3: Data collection
32
Figure 12. Examples of live (top row) and dead/dying (bottom row) algae. Image credits: Bottom-left: Ken Fritz. Others: Raphael Mazor.
In some circumstances, it may be possible to determine if an algal mat originated locally or washed in from an upstream location. Sloughed algal mats tend to collect in snags or on top of boulders, rest unevenly on the streambed, or cling to overhanging branches (Figure 13). In contrast, mats with a local origin are often found in pools, depressions, or areas of flow accumulation. In some cases, algal mats may wash in from upstream and continue to grow if local conditions are favorable. If all observed algae appear to have an upstream origin, check the appropriate box on the field form. The presence of algae deposited from upstream sources is not an indicator used in the beta SDAM WM, but it can provide useful supplemental information.
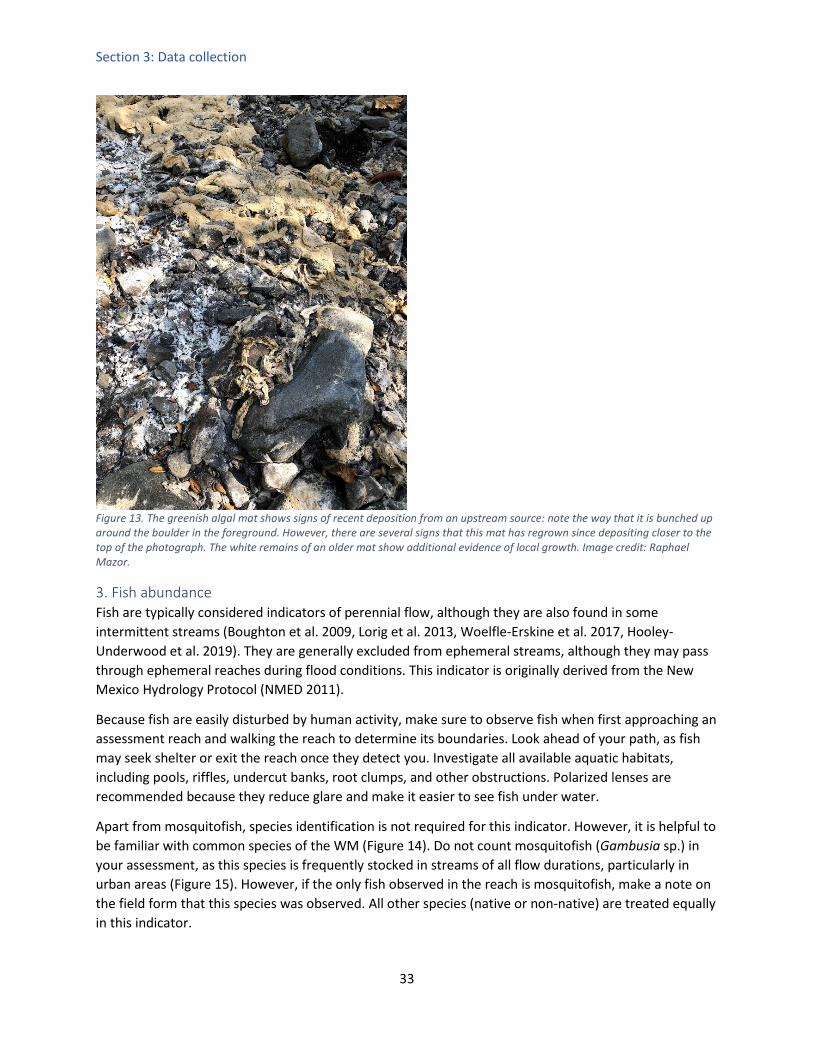
Section 3: Data collection
33
Figure 13. The greenish algal mat shows signs of recent deposition from an upstream source: note the way that it is bunched up around the boulder in the foreground. However, there are several signs that this mat has regrown since depositing closer to the top of the photograph. The white remains of an older mat show additional evidence of local growth. Image credit: Raphael Mazor.
3. Fish abundance Fish are typically considered indicators of perennial flow, although they are also found in some intermittent streams (Boughton et al. 2009, Lorig et al. 2013, Woelfle-Erskine et al. 2017, Hooley-Underwood et al. 2019). They are generally excluded from ephemeral streams, although they may pass through ephemeral reaches during flood conditions. This indicator is originally derived from the New Mexico Hydrology Protocol (NMED 2011).
Because fish are easily disturbed by human activity, make sure to observe fish when first approaching an assessment reach and walking the reach to determine its boundaries. Look ahead of your path, as fish may seek shelter or exit the reach once they detect you. Investigate all available aquatic habitats, including pools, riffles, undercut banks, root clumps, and other obstructions. Polarized lenses are recommended because they reduce glare and make it easier to see fish under water.
Apart from mosquitofish, species identification is not required for this indicator. However, it is helpful to be familiar with common species of the WM (Figure 14). Do not count mosquitofish (Gambusia sp.) in your assessment, as this species is frequently stocked in streams of all flow durations, particularly in urban areas (Figure 15). However, if the only fish observed in the reach is mosquitofish, make a note on the field form that this species was observed. All other species (native or non-native) are treated equally in this indicator.
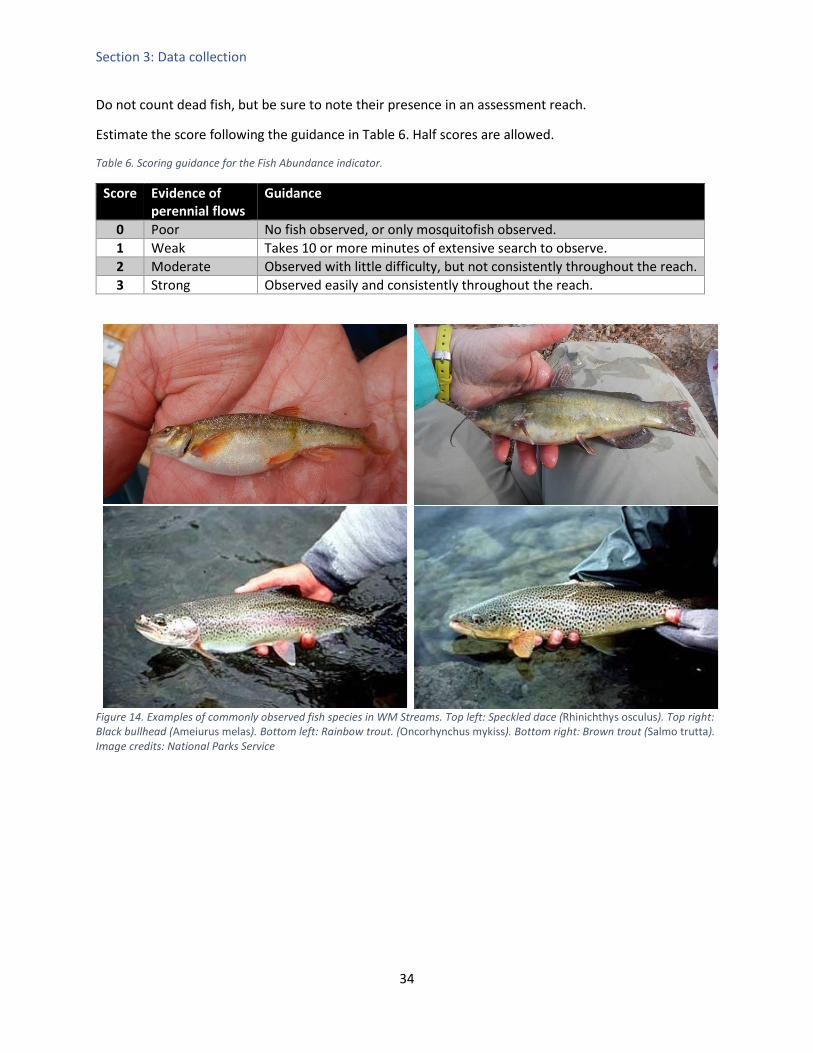
Section 3: Data collection
34
Do not count dead fish, but be sure to note their presence in an assessment reach.
Estimate the score following the guidance in Table 6. Half scores are allowed.
Table 6. Scoring guidance for the Fish Abundance indicator.
Score Evidence of perennial flows
Guidance
0 Poor No fish observed, or only mosquitofish observed. 1 Weak Takes 10 or more minutes of extensive search to observe. 2 Moderate Observed with little difficulty, but not consistently throughout the reach. 3 Strong Observed easily and consistently throughout the reach.
Figure 14. Examples of commonly observed fish species in WM Streams. Top left: Speckled dace (Rhinichthys osculus). Top right: Black bullhead (Ameiurus melas). Bottom left: Rainbow trout. (Oncorhynchus mykiss). Bottom right: Brown trout (Salmo trutta). Image credits: National Parks Service

Section 3: Data collection
35
Figure 15. Western mosquitofish (Gambusia affinis). This species is native to Gulf Slope drainages, including small portions of the Southwest. However, it has been widely introduced into waterbodies throughout the WM as a method of vector control, and it should not be used to measure fish abundance for the beta SDAM WM. Image credit: Robert McDowell, US Geological Survey.
4. Differences in vegetation Streams with long streamflow durations tend to support riparian vegetation with a distinct set of plant species not found in surrounding uplands. Many of these plants will include hydrophytes that require saturated soil for some of their lifespan. In some cases, upland species will grow more vigorously in and or near the channel than in surrounding uplands. When assessing this indicator, consider the entire length of the reach, and choose the score from Table 7 that best characterizes the predominant condition in the reach. Half scores are allowed. Consider how many species found within the riparian corridor are absent from adjacent uplands, and vice-versa. For species that grow in both the riparian corridor and adjacent uplands, consider whether they grow as vigorously or in similar densities in both environments. High levels of distinctness in either composition or vigor results in a higher score. Figure 16 provides examples of reaches with different scores for this indicator. It may be helpful to refer to the National Wetland Plant List for the Western Mountains and Coastal Valleys (Lichvar et al. 2016). In general, the riparian zones of perennial reaches often include plants with wetland indicator statuses of FAC, FACW and OBL status, whereas those in ephemeral reaches have few such plants. In settings where upland vegetation cannot be assessed due to development in the surrounding area, consider the upland vegetation growing in comparable areas outside the reach. In settings where the riparian corridor has been eliminated due to wildfire or management activities (e.g., channel clearing), the preferred option is to conduct the assessment after the vegetation has had a chance to recover. Look for the early colonists, and determine if they are largely hydrophytes, or are plants more typically found in upland areas. When a delay is not an option and the riparian corridor is devoid of vegetation, a score of zero is appropriate.
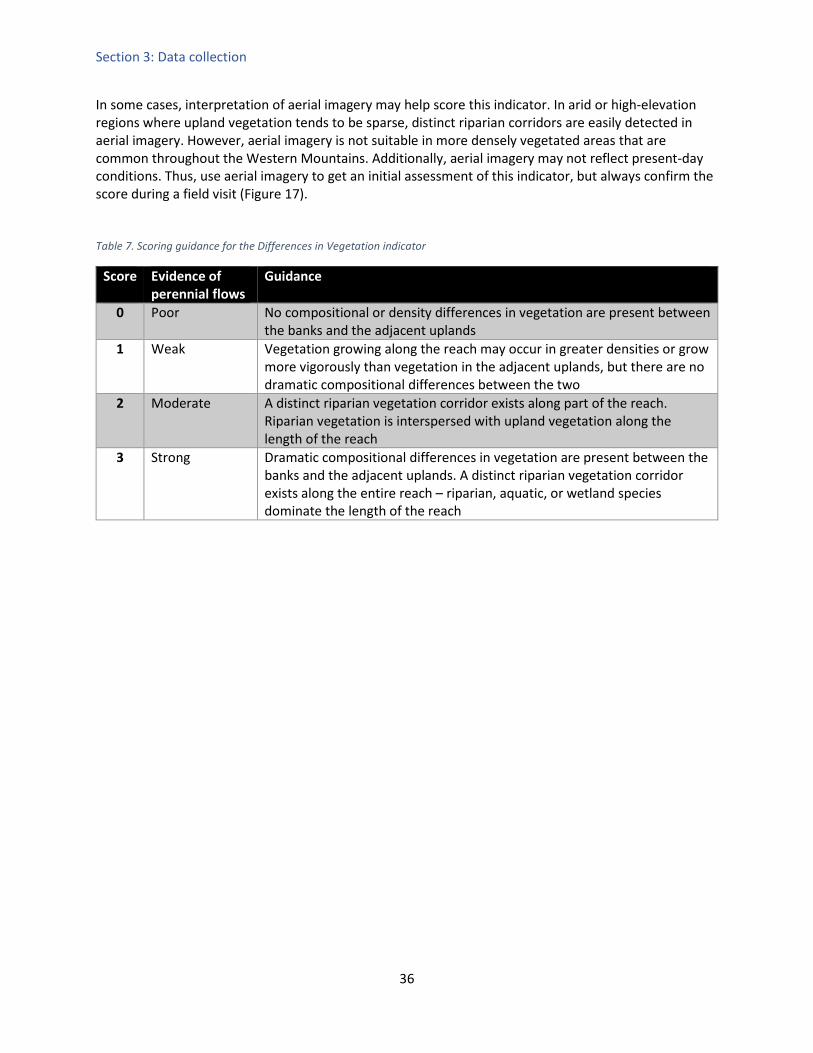
Section 3: Data collection
36
In some cases, interpretation of aerial imagery may help score this indicator. In arid or high-elevation regions where upland vegetation tends to be sparse, distinct riparian corridors are easily detected in aerial imagery. However, aerial imagery is not suitable in more densely vegetated areas that are common throughout the Western Mountains. Additionally, aerial imagery may not reflect present-day conditions. Thus, use aerial imagery to get an initial assessment of this indicator, but always confirm the score during a field visit (Figure 17). Table 7. Scoring guidance for the Differences in Vegetation indicator
Score Evidence of perennial flows
Guidance
0 Poor No compositional or density differences in vegetation are present between the banks and the adjacent uplands
1 Weak Vegetation growing along the reach may occur in greater densities or grow more vigorously than vegetation in the adjacent uplands, but there are no dramatic compositional differences between the two
2 Moderate A distinct riparian vegetation corridor exists along part of the reach. Riparian vegetation is interspersed with upland vegetation along the length of the reach
3 Strong Dramatic compositional differences in vegetation are present between the banks and the adjacent uplands. A distinct riparian vegetation corridor exists along the entire reach – riparian, aquatic, or wetland species dominate the length of the reach
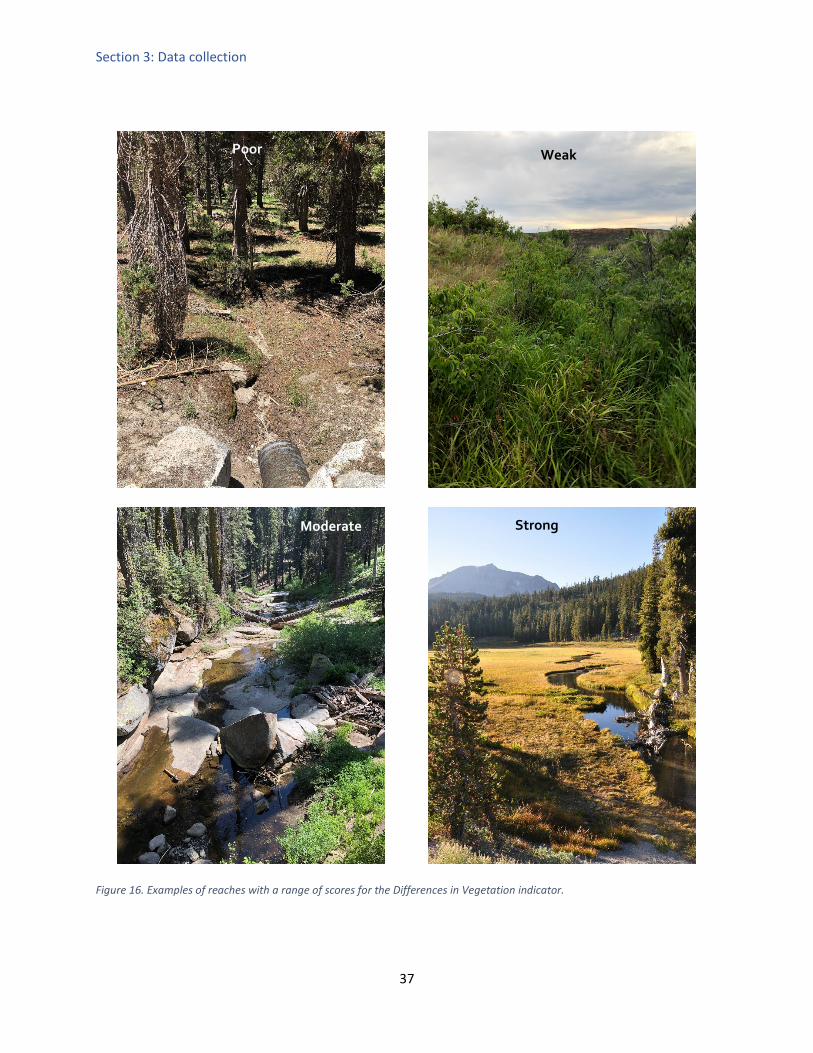
Section 3: Data collection
37
Figure 16. Examples of reaches with a range of scores for the Differences in Vegetation indicator.
Poor Weak
Moderate Strong
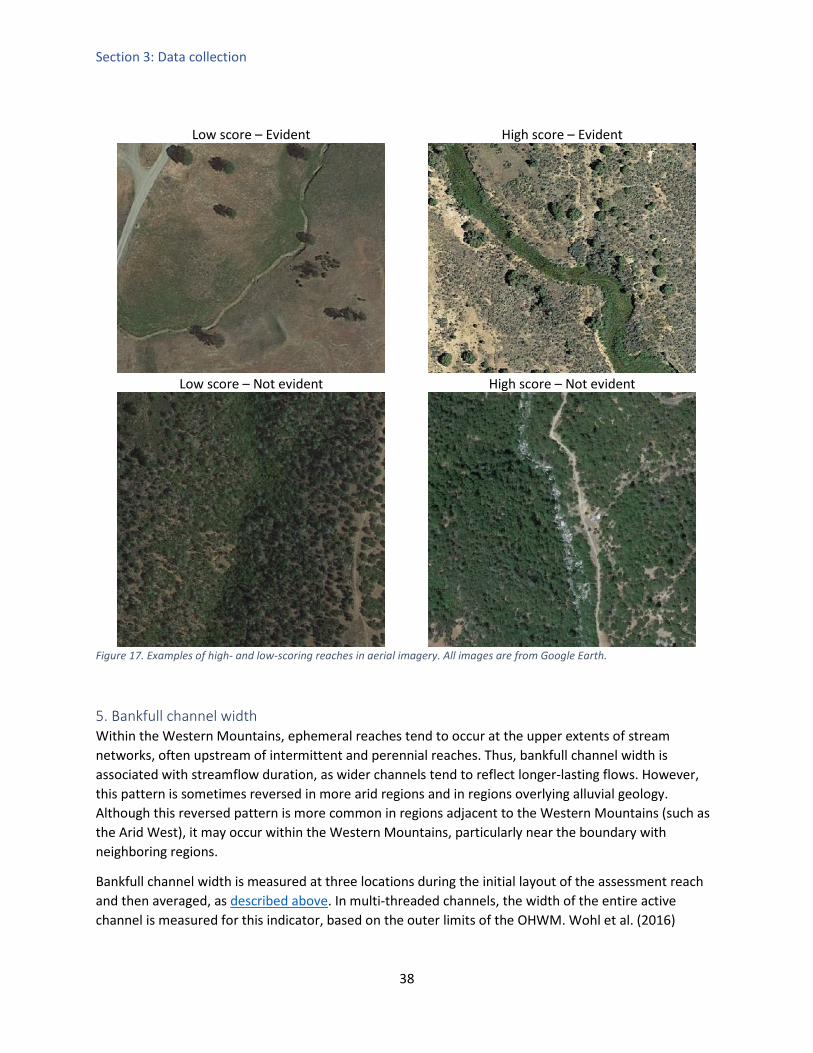
Section 3: Data collection
38
Low score – Evident High score – Evident
Low score – Not evident High score – Not evident
Figure 17. Examples of high- and low-scoring reaches in aerial imagery. All images are from Google Earth.
5. Bankfull channel width Within the Western Mountains, ephemeral reaches tend to occur at the upper extents of stream networks, often upstream of intermittent and perennial reaches. Thus, bankfull channel width is associated with streamflow duration, as wider channels tend to reflect longer-lasting flows. However, this pattern is sometimes reversed in more arid regions and in regions overlying alluvial geology. Although this reversed pattern is more common in regions adjacent to the Western Mountains (such as the Arid West), it may occur within the Western Mountains, particularly near the boundary with neighboring regions.
Bankfull channel width is measured at three locations during the initial layout of the assessment reach and then averaged, as described above. In multi-threaded channels, the width of the entire active channel is measured for this indicator, based on the outer limits of the OHWM. Wohl et al. (2016)

Section 3: Data collection
39
described active channel as the portion of the valley bottom distinguished by one or more of the following characteristics:
• Channels defined by erosional and depositional features created by river processes (as opposed to upland processes, such as sheet flow or debris flow);
• The upper elevation limit at which water is contained within a channel; and/or • Portions of a channel generally without trunks of mature woody vegetation.
6. Sinuosity Sinuosity is a measure of the curviness of a stream channel and is measured as the ratio of the stream length to valley length. When the two lengths are equal, the ratio is 1, and sinuosity is considered low; that is, the stream flows in a straight channel from the top to the bottom of the reach. In contrast, when the stream channel follows a meandering path, the stream length will be greater than the valley length, and the ratio will be greater than 1; a higher ratio reflects a more meandering path.
Sinuosity is caused by hydraulic processes that deposit sediment on one side of a reach while eroding it from another. It is typically highest in sand- and gravel-bed stream-reaches, and lowest in confined stream-reaches within canyons. Local features resistant to erosion (such as bedrock outcrops or logjams) may increase sinuosity as well. Although it has no direct relationship with streamflow duration (that is, it is neither a driver of, nor a response to, streamflow duration), perennial reaches more frequently exhibit the conditions necessary to produce meanders than ephemeral streams (Billi et al. 2018). As such, it is an effective indicator of streamflow duration in the Western Mountains.
Sinuosity may be assessed in a number of ways in both the field and from a desktop through a GIS or interpretation of aerial imagery. For the beta SDAM WM, field measurement is preferred, and whenever desktop estimates are used, field confirmation is required.
In the field, sinuosity may be visually estimated, or measured using a surveyor’s level. Although the length of the assessment reach may too short to properly characterize sinuosity for certain stream-reaches, the beta SDAM WM is calibrated for estimates made at reaches ranging from 40 to 200 m in length (i.e., 40 times the bankfull channel width).
To score this indicator, compare the measured sinuosity value to the guidance in Table 8 and Figure 18. In multi-threaded systems, the sinuosity measurement should be based on the dominant (i.e., lowest elevation) channel, and not the entire active channel (Figure 19).
This indicator is originally derived from the New Mexico Hydrology Protocol (NMED 2011).

Section 3: Data collection
40
Table 8. Scoring guidance for the Sinuosity indicator.
Score Evidence of perennial flows
Guidance
0 Poor Ratio of valley length: Stream length < 1.05. Stream is completely straight with no bends
1 Weak Ratio between 1.05 and 1.2. Stream has very few bends, and mostly straight section.
2 Moderate Ratio between 1.2 and 1.4. Stream has good sinuosity with some straight sections.
3 Strong Ratio > 1.4. Stream has numerous, closely-spaced bends with few straight sections.
Poor (0) 1.0 to 1.05
Weak (1) 1.05 to 1.2
Moderate (2) 1.2 to 1.4
Strong (3) Above 1.4
Figure 18. Scoring guidance for the Sinuosity indicator Values in parentheses are sinuosity scores and ranges are for ratios of stream length to valley length.
Stream length: 200 m Valley length: 107 m
Sinuosity = 200/107 = 1.87
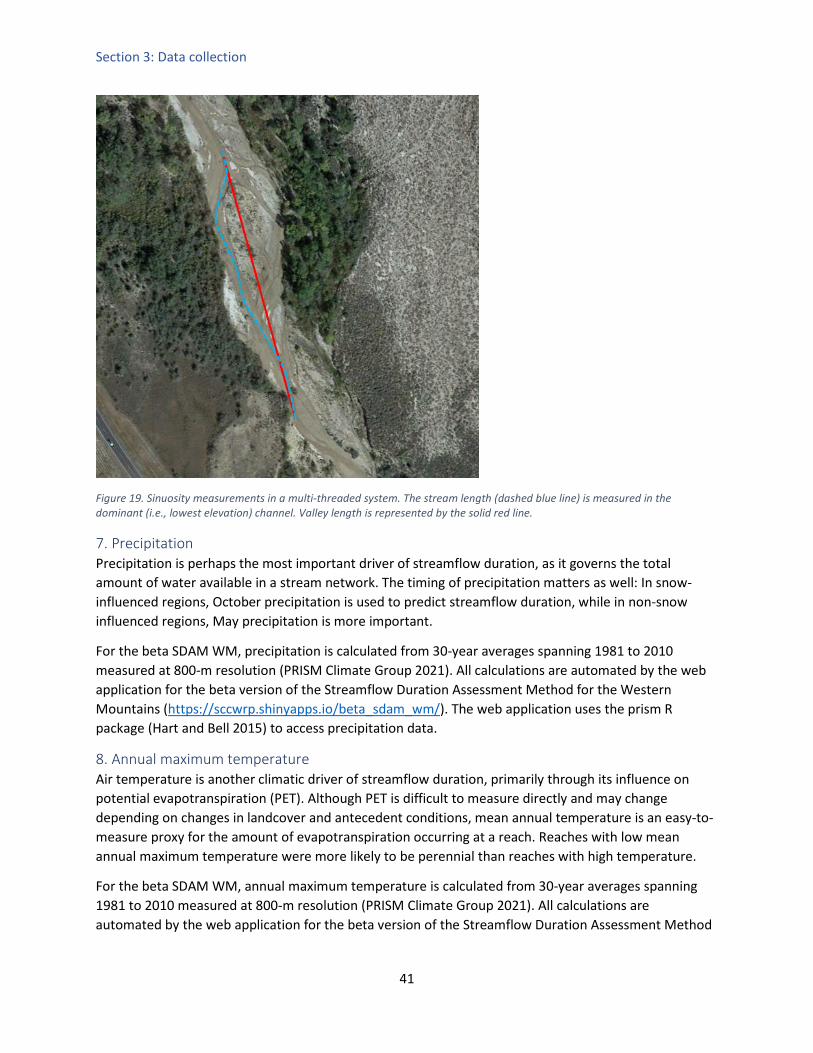
Section 3: Data collection
41
Figure 19. Sinuosity measurements in a multi-threaded system. The stream length (dashed blue line) is measured in the dominant (i.e., lowest elevation) channel. Valley length is represented by the solid red line.
7. Precipitation Precipitation is perhaps the most important driver of streamflow duration, as it governs the total amount of water available in a stream network. The timing of precipitation matters as well: In snow-influenced regions, October precipitation is used to predict streamflow duration, while in non-snow influenced regions, May precipitation is more important.
For the beta SDAM WM, precipitation is calculated from 30-year averages spanning 1981 to 2010 measured at 800-m resolution (PRISM Climate Group 2021). All calculations are automated by the web application for the beta version of the Streamflow Duration Assessment Method for the Western Mountains (https://sccwrp.shinyapps.io/beta_sdam_wm/). The web application uses the prism R package (Hart and Bell 2015) to access precipitation data.
8. Annual maximum temperature Air temperature is another climatic driver of streamflow duration, primarily through its influence on potential evapotranspiration (PET). Although PET is difficult to measure directly and may change depending on changes in landcover and antecedent conditions, mean annual temperature is an easy-to-measure proxy for the amount of evapotranspiration occurring at a reach. Reaches with low mean annual maximum temperature were more likely to be perennial than reaches with high temperature.
For the beta SDAM WM, annual maximum temperature is calculated from 30-year averages spanning 1981 to 2010 measured at 800-m resolution (PRISM Climate Group 2021). All calculations are automated by the web application for the beta version of the Streamflow Duration Assessment Method

Section 3: Data collection
42
for the Western Mountains (https://sccwrp.shinyapps.io/beta_sdam_wm/). The web application uses the prism R package (Hart and Bell 2015) to access temperature data.
Supplemental information Although not required for flow duration classification, additional flow duration measures may be observed during the SDAM assessment. These observations should be noted to provide additional contextual information in support of a streamflow duration classification. It is recommended that supplemental measures be documented at all assessment reaches where streamflow duration is assessed and evaluated to determine if they corroborate the beta SDAM WM classification or provide new insights about the classification.
Other indicators Because indicators are interpreted differently depending on whether a reach is influenced by snow, only a subset of the measured indicators are used to make a classification. For example, sinuosity is an indicator in non-snow influenced areas, but not in snow-influenced areas. These “unused” indicators should be treated as supplemental information collected at every assessment.
Aquatic or semi-aquatic amphibians and reptiles Like fish, aquatic or semi-aquatic life stages of amphibians, snakes, and turtles are rarely found in ephemeral streams; if any are encountered during the assessment, their presence should be recorded. Certain frogs and salamanders inhabit the shallow, slow-moving waters of stream pools and near the sides of banks. Note if any adult frogs are seen or vocalizations are heard, even if no frogs are visually observed. Many aquatic vertebrate species are protected by state and federal law, and therefore should not be collected for streamflow duration assessment. Instead, identifications should be made on-site, without disturbing the organisms. It is recommended that a series of photographs be taken of any species in question to allow further identification to be made off-site, if necessary. If unable to closely observe and/or photograph any vertebrate species and the identification is uncertain, then describe any distinguishing features that were observed in the notes. As with fish, dead specimens may be noted on the field forms. Amphibians Amphibians are typically associated with aquatic habitats, and some amphibians require aquatic habitat for much or all their lives (Table 9). Aquatic life stages include eggs and tadpoles or larvae of many amphibian species; adults of several species are aquatic or semi-aquatic as well, and their presence should also be noted (Figure 20).
Aquatic salamanders in the Western Mountains include the genera Rhyacotriton (torrent salamanders), Taricha (Pacific newts), and Dicamptodon (giant salamanders). The genus Rhyacotriton is aquatic throughout most of its life, whereas the latter two taxa may have terrestrial adult phases that return to the water to breed. Ambystoma (mole salamanders) is another western genus with fully aquatic life stages, but this group is rarely found in flowing water. The Coeur d’Alene salamander (Plethodon idahoensis) are terrestrial, but are associated with small seeps in Northwestern Montana. All other salamander species found in the Western Mountains are primarily terrestrial and are only found in California and a small portion of New Mexico.

Section 3: Data collection
43
Many frog and toad species lay eggs in the water and have aquatic tadpole, metamorph, and juvenile stages. Although several of these species have terrestrial adults that only return to the water to breed, some species (such as bullfrogs, Lithobates catesbeianus¸ and red-legged frogs, Rana draytonii) remain primarily aquatic as adults. An introduced species, the African clawed frog (Xenopus laevis) has an exclusively aquatic life cycle. Tailed frogs (Ascaphus spp.) in particular are adapted to cold, fast-flowing streams.
Figure 20. A tadpole of a Great Basin spadefoot toad (Spea intermontana, top left), a California tree frog (Pseudacris cadaverina, top right), and a California newt (Taricha torosa bottom). Image credits: Robert Leidy (top left), Raphael Mazor (top right) and Alex Heyman (bottom).
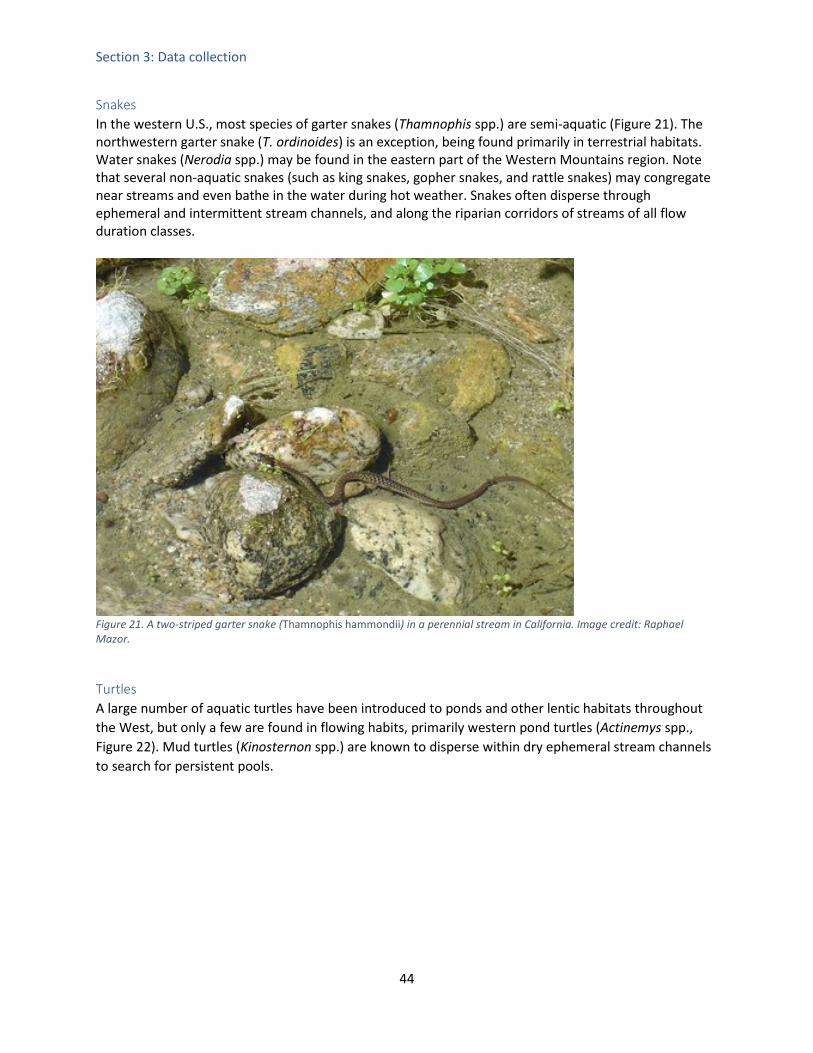
Section 3: Data collection
44
Snakes In the western U.S., most species of garter snakes (Thamnophis spp.) are semi-aquatic (Figure 21). The northwestern garter snake (T. ordinoides) is an exception, being found primarily in terrestrial habitats. Water snakes (Nerodia spp.) may be found in the eastern part of the Western Mountains region. Note that several non-aquatic snakes (such as king snakes, gopher snakes, and rattle snakes) may congregate near streams and even bathe in the water during hot weather. Snakes often disperse through ephemeral and intermittent stream channels, and along the riparian corridors of streams of all flow duration classes.
Figure 21. A two-striped garter snake (Thamnophis hammondii) in a perennial stream in California. Image credit: Raphael Mazor.
Turtles A large number of aquatic turtles have been introduced to ponds and other lentic habitats throughout the West, but only a few are found in flowing habits, primarily western pond turtles (Actinemys spp., Figure 22). Mud turtles (Kinosternon spp.) are known to disperse within dry ephemeral stream channels to search for persistent pools.
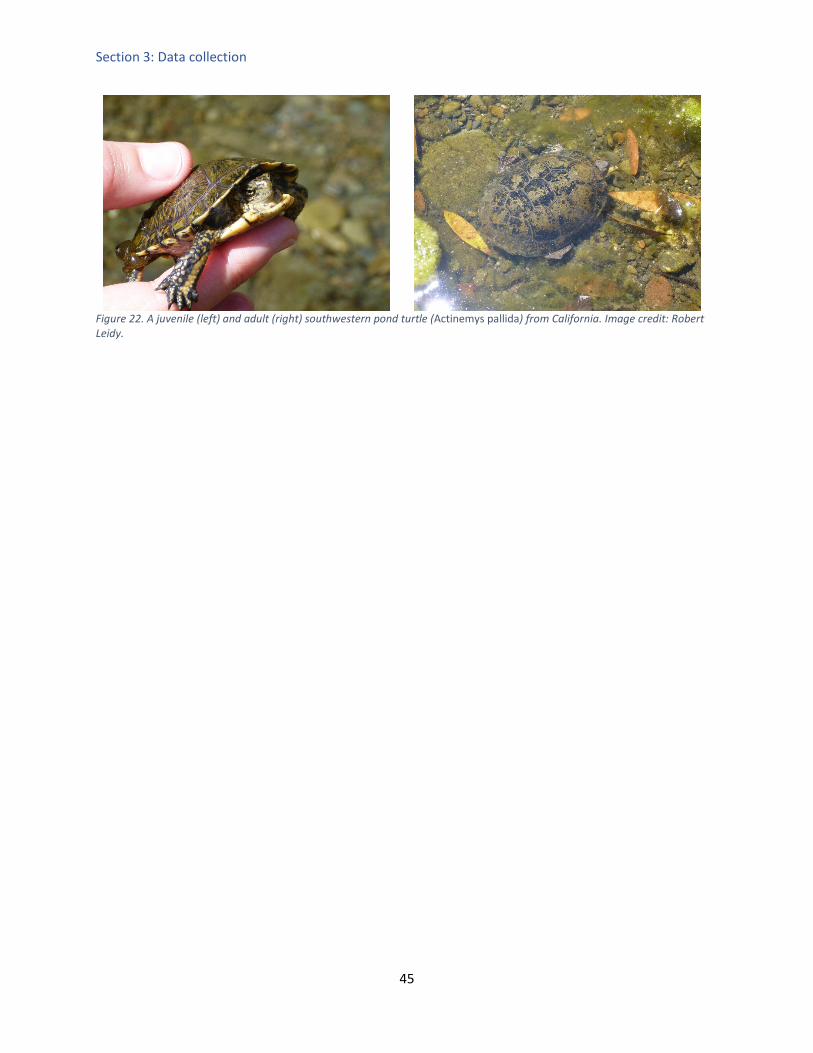
Section 3: Data collection
45
Figure 22. A juvenile (left) and adult (right) southwestern pond turtle (Actinemys pallida) from California. Image credit: Robert Leidy.
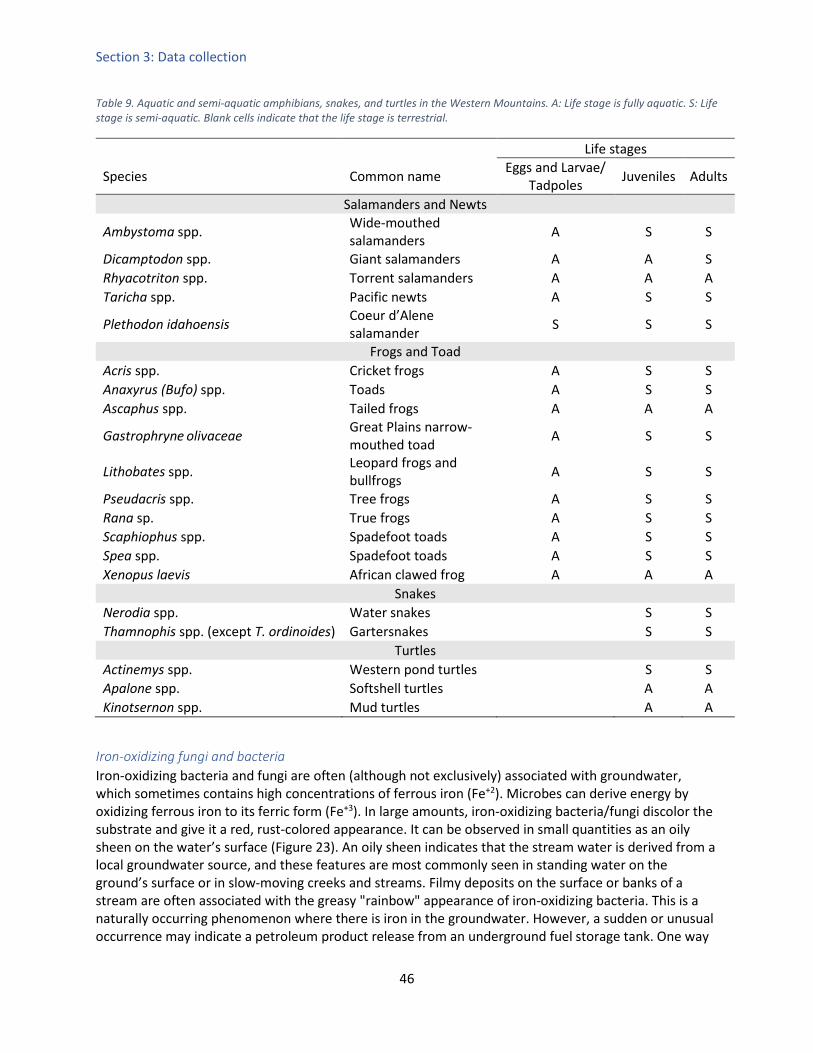
Section 3: Data collection
46
Table 9. Aquatic and semi-aquatic amphibians, snakes, and turtles in the Western Mountains. A: Life stage is fully aquatic. S: Life stage is semi-aquatic. Blank cells indicate that the life stage is terrestrial.
Life stages
Species Common name Eggs and Larvae/ Tadpoles Juveniles Adults
Salamanders and Newts
Ambystoma spp. Wide-mouthed salamanders A S S
Dicamptodon spp. Giant salamanders A A S Rhyacotriton spp. Torrent salamanders A A A Taricha spp. Pacific newts A S S
Plethodon idahoensis Coeur d’Alene salamander S S S
Frogs and Toad Acris spp. Cricket frogs A S S Anaxyrus (Bufo) spp. Toads A S S Ascaphus spp. Tailed frogs A A A
Gastrophryne olivaceae Great Plains narrow-mouthed toad A S S
Lithobates spp. Leopard frogs and bullfrogs A S S
Pseudacris spp. Tree frogs A S S Rana sp. True frogs A S S Scaphiophus spp. Spadefoot toads A S S Spea spp. Spadefoot toads A S S Xenopus laevis African clawed frog A A A
Snakes Nerodia spp. Water snakes S S Thamnophis spp. (except T. ordinoides) Gartersnakes S S
Turtles Actinemys spp. Western pond turtles S S Apalone spp. Softshell turtles A A Kinotsernon spp. Mud turtles A A
Iron-oxidizing fungi and bacteria Iron-oxidizing bacteria and fungi are often (although not exclusively) associated with groundwater, which sometimes contains high concentrations of ferrous iron (Fe+2). Microbes can derive energy by oxidizing ferrous iron to its ferric form (Fe+3). In large amounts, iron-oxidizing bacteria/fungi discolor the substrate and give it a red, rust-colored appearance. It can be observed in small quantities as an oily sheen on the water’s surface (Figure 23). An oily sheen indicates that the stream water is derived from a local groundwater source, and these features are most commonly seen in standing water on the ground’s surface or in slow-moving creeks and streams. Filmy deposits on the surface or banks of a stream are often associated with the greasy "rainbow" appearance of iron-oxidizing bacteria. This is a naturally occurring phenomenon where there is iron in the groundwater. However, a sudden or unusual occurrence may indicate a petroleum product release from an underground fuel storage tank. One way
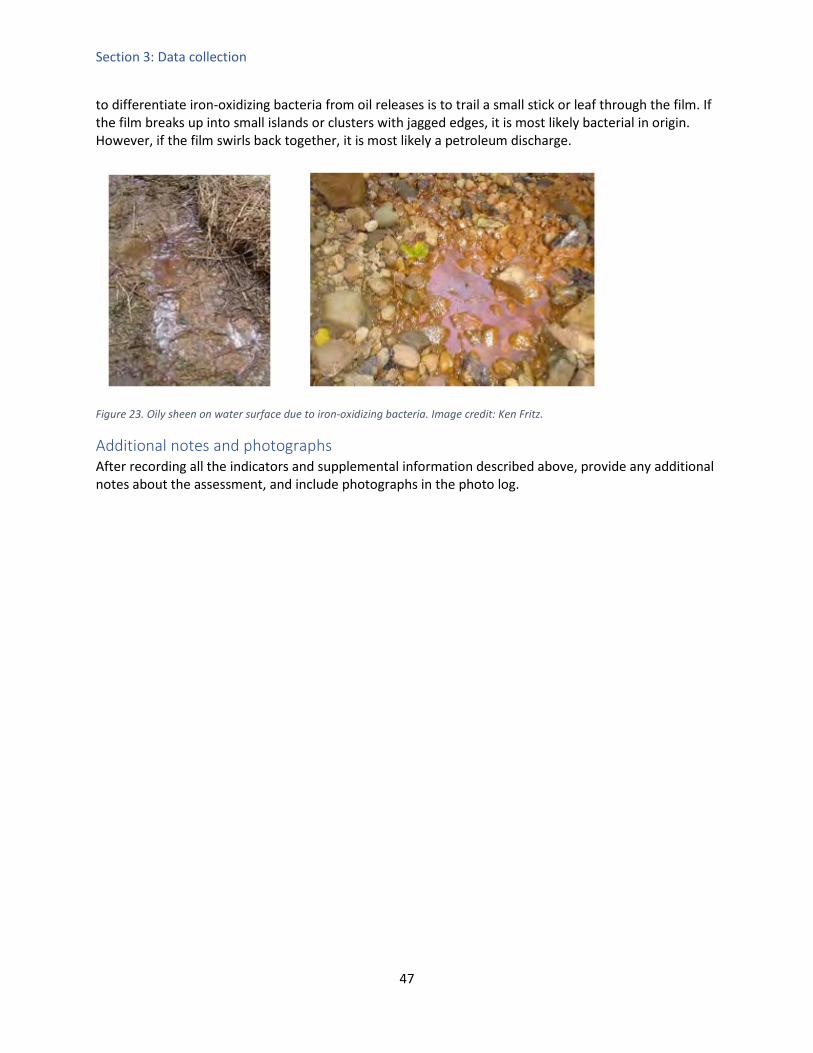
Section 3: Data collection
47
to differentiate iron-oxidizing bacteria from oil releases is to trail a small stick or leaf through the film. If the film breaks up into small islands or clusters with jagged edges, it is most likely bacterial in origin. However, if the film swirls back together, it is most likely a petroleum discharge.
Figure 23. Oily sheen on water surface due to iron-oxidizing bacteria. Image credit: Ken Fritz.
Additional notes and photographs After recording all the indicators and supplemental information described above, provide any additional notes about the assessment, and include photographs in the photo log.
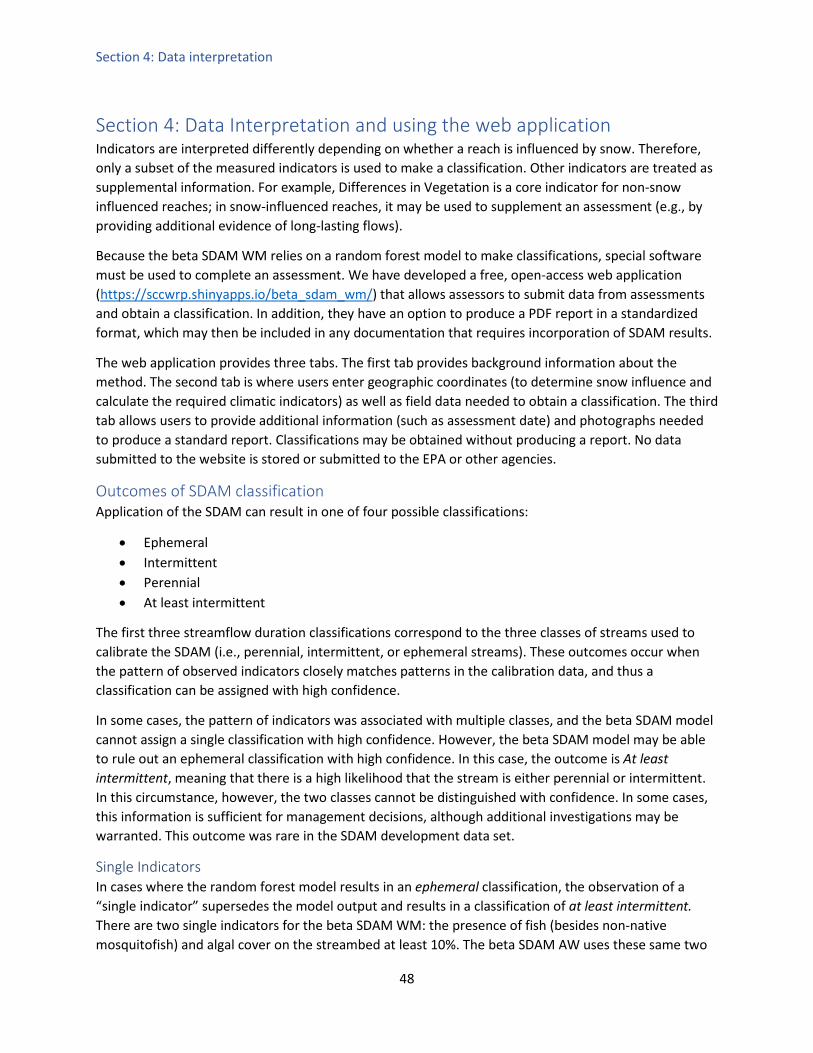
Section 4: Data interpretation
48
Section 4: Data Interpretation and using the web application Indicators are interpreted differently depending on whether a reach is influenced by snow. Therefore, only a subset of the measured indicators is used to make a classification. Other indicators are treated as supplemental information. For example, Differences in Vegetation is a core indicator for non-snow influenced reaches; in snow-influenced reaches, it may be used to supplement an assessment (e.g., by providing additional evidence of long-lasting flows).
Because the beta SDAM WM relies on a random forest model to make classifications, special software must be used to complete an assessment. We have developed a free, open-access web application (https://sccwrp.shinyapps.io/beta_sdam_wm/) that allows assessors to submit data from assessments and obtain a classification. In addition, they have an option to produce a PDF report in a standardized format, which may then be included in any documentation that requires incorporation of SDAM results.
The web application provides three tabs. The first tab provides background information about the method. The second tab is where users enter geographic coordinates (to determine snow influence and calculate the required climatic indicators) as well as field data needed to obtain a classification. The third tab allows users to provide additional information (such as assessment date) and photographs needed to produce a standard report. Classifications may be obtained without producing a report. No data submitted to the website is stored or submitted to the EPA or other agencies.
Outcomes of SDAM classification Application of the SDAM can result in one of four possible classifications:
• Ephemeral • Intermittent • Perennial • At least intermittent
The first three streamflow duration classifications correspond to the three classes of streams used to calibrate the SDAM (i.e., perennial, intermittent, or ephemeral streams). These outcomes occur when the pattern of observed indicators closely matches patterns in the calibration data, and thus a classification can be assigned with high confidence.
In some cases, the pattern of indicators was associated with multiple classes, and the beta SDAM model cannot assign a single classification with high confidence. However, the beta SDAM model may be able to rule out an ephemeral classification with high confidence. In this case, the outcome is At least intermittent, meaning that there is a high likelihood that the stream is either perennial or intermittent. In this circumstance, however, the two classes cannot be distinguished with confidence. In some cases, this information is sufficient for management decisions, although additional investigations may be warranted. This outcome was rare in the SDAM development data set.
Single Indicators In cases where the random forest model results in an ephemeral classification, the observation of a “single indicator” supersedes the model output and results in a classification of at least intermittent. There are two single indicators for the beta SDAM WM: the presence of fish (besides non-native mosquitofish) and algal cover on the streambed at least 10%. The beta SDAM AW uses these same two

Section 4: Data interpretation
49
single indicators. Because these single indicators are included within the “core” set of eight indicators described above, no additional steps are required for their measurement.
Fish are rarely found in ephemeral streams, and their presence is a strong sign that a stream is intermittent or perennial. Record the presence of any live fish observed. If the only fish present are non-native mosquitofish (Gambusia sp., typically G. affinis, Figure 15), record their presence, but do not treat them as a single indicator of intermittent or perennial flow. Mosquitofish are widely stocked in waterbodies, including ephemeral streams, as a method of vector control.
Although algae may grow sparsely in ephemeral streams, heavy algal growth is usually a sign of longer-duration flows, particularly in dry streambeds where few other indicators may be evident. This indicator is also measured as part of this SDAM. Take extra care to ensure that the distribution of algae in the streambed is consistent with local growth, not deposition from upstream sources (Figure 13); deposition of algal mats in ephemeral streams is possible where they are closely connected to upstream perennial source (e.g., perennial stream-reaches, stock or irrigation ponds, detention basins).
Although some protocols (e.g., NMED 2011, Nadeau 2015) consider single indicators sufficient evidence to make a streamflow duration determination (and thus field data collection may end once they are observed), completing data collection for the beta method whether or not single indicators are observed is recommended.
Applications of the Beta SDAM WM outside the intended area The beta SDAM WM is intended only for application to the WM region shown in Figure 2. Furthermore, the snow-influenced model of the beta SDAM WM is intended only for application to snow-influenced assessment reaches (as determined from the data in the map shown in Figure 3), and the non-snow influenced model is intended only for non-snow influenced reaches. The online web application allows the user to apply the tool to reaches outside the WM, and to select the snow-influenced or non-snow influenced model to any reach, as long as it is within the Western USA. Classifications resulting from these applications are for informational purposes only and may be helpful to assess reaches near regional boundaries, or where snow influenced is not well characterized by the data in the map shown in Figure 3. Reports generated from such applications are accompanied by warnings.
What to do if more information about streamflow duration is needed? The beta SDAM WM will always result in one of the four classifications described above. There may be cases when additional information is desired. For example, conditions at the time of assessment may have complicated the measurement of some indicators. It may help to examine other lines of evidence (such as the supplemental information included in the protocol) or conduct additional evaluations.
Evaluate supplemental information collected during assessments The beta SDAM WM classification is based on eight indicators. Still, the protocol includes the collection of supplemental information—specifically, the presence of aquatic life stages of amphibians or reptiles (Table 9), and iron-oxidizing fungi or bacteria (Figure 23). In general, the presence of any of these organisms may be considered evidence of longer-duration flows.
Conduct additional assessments at the same reach Some indicators may be difficult to detect or interpret due to short-term disturbances, floods, severe drought, or other conditions that affect the sampling event’s validity. A repeat application of the SDAM,
Section 4: Data interpretation
50
even a few weeks later when the affecting disturbances have cleared, may be sufficient to provide a determination. Similarly, conducting an additional evaluation during a different season may improve the ability to identify differences in vegetation and aquatic invertebrates, leading to more conclusive assessments.
Conduct evaluations at nearby reaches Indicators may provide more conclusive results at reaches up- or downstream from the assessment reach, as long as those locations represent similar conditions. For example, there should be no significant discharges, diversions, or confluences between the new and original assessment locations, and they should have similar geomorphology. See the section above (Reach selection and placement) for guidance.
Review historical aerial imagery In some parts of the Western Mountains, sequences of aerial imagery can provide information about streamflow duration. Google Earth’s time slider offers a convenient method of reviewing historical imagery, particularly for high-elevation systems with little riparian vegetation that could obscure the channel (however, note that the Google Earth time slider may not have accurate image dates), as does the USGS Earth Explorer. If surface water is observed in all interpretable images across multiple years (especially during dry seasons), this may provide evidence that the reach is likely perennial. Suppose surface water is never observed, even when other nearby intermittent streams show water. In this case, the consistent absence of surface water may provide evidence that the reach is likely ephemeral (particularly if images are captured during the wet season or after major storm events). If surface water is present in some images and dry in others, the stream may be intermittent. This evidence is strong if the images with surface water occur in the dry season, and do not coincide with storm events.
Anytime that discrete observations of flow or no flow are used to inform a determination of flow duration class, it is recommended that such observations be evaluated in the context of relatively normal climatic conditions. Doing so ensures that flow duration class is not determined based on observations of flow or no flow during abnormally wet or abnormally dry periods. A useful tool to determine the antecedent precipitation conditions for any particular reach and date is the Antecedent Precipitation Tool (APT), developed by the U.S. Army Corps of Engineers (https://www.epa.gov/nwpr/antecedent-precipitation-tool-apt) (U.S. Army Corps of Engineers 2020). However, aerial images may not have high enough temporal resolution to confidently classify streams as ephemeral or perennial without additional data. See examples in Figure 24.
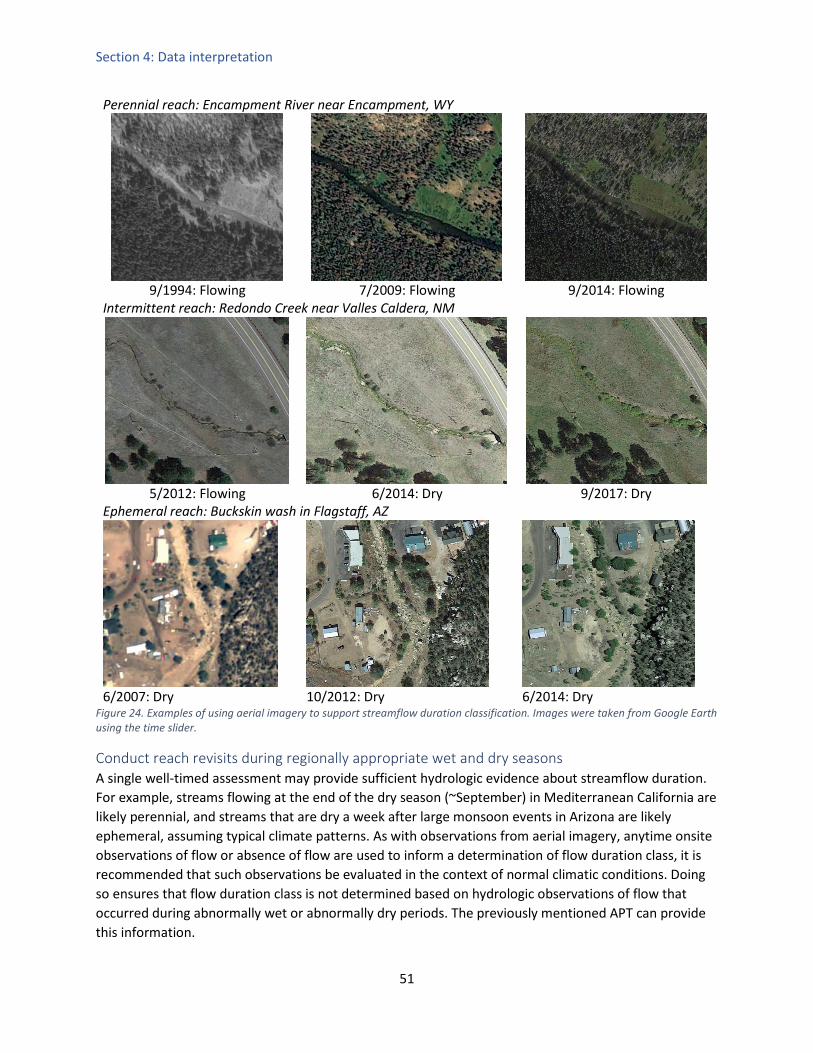
Section 4: Data interpretation
51
Perennial reach: Encampment River near Encampment, WY
9/1994: Flowing
7/2009: Flowing
9/2014: Flowing
Intermittent reach: Redondo Creek near Valles Caldera, NM
5/2012: Flowing
6/2014: Dry
9/2017: Dry
Ephemeral reach: Buckskin wash in Flagstaff, AZ
6/2007: Dry
10/2012: Dry
6/2014: Dry
Figure 24. Examples of using aerial imagery to support streamflow duration classification. Images were taken from Google Earth using the time slider.
Conduct reach revisits during regionally appropriate wet and dry seasons A single well-timed assessment may provide sufficient hydrologic evidence about streamflow duration. For example, streams flowing at the end of the dry season (~September) in Mediterranean California are likely perennial, and streams that are dry a week after large monsoon events in Arizona are likely ephemeral, assuming typical climate patterns. As with observations from aerial imagery, anytime onsite observations of flow or absence of flow are used to inform a determination of flow duration class, it is recommended that such observations be evaluated in the context of normal climatic conditions. Doing so ensures that flow duration class is not determined based on hydrologic observations of flow that occurred during abnormally wet or abnormally dry periods. The previously mentioned APT can provide this information.

Section 4: Data interpretation
52
Collect additional hydrologic data Properly deployed loggers, stream gauges, or wildlife cameras can provide direct evidence about streamflow duration at ambiguous assessment reaches. It may be possible to distinguish intermittent from ephemeral streams in just a single season, assuming typical precipitation.
Appendices
53
References Baker, S. C., and H. F. Sharp. 1998. Evaluation of the Recovery of a Polluted Urban Stream Using the
Ephemeroptera-Plecoptera-Trichoptera Index. Journal of Freshwater Ecology 13:229–234. Bennett, D. M., T. L. Dudley, S. D. Cooper, and S. S. Sweet. 2015. Ecology of the invasive New Zealand
mud snail, Potamopyrgus antipodarum (Hydrobiidae), in a mediterranean-climate stream system. Hydrobiologia 746:375–399.
Billi, P., B. Demissie, J. Nyssen, G. Moges, and M. Fazzini. 2018. Meander hydromorphology of ephemeral streams: Similarities and differences with perennial rivers. Geomorphology 319:35–46.
Blackburn, M., and C. Mazzacano. 2012. Using aquatic macroinvertebrates as indicators of streamflow duration: Washington and Idaho indicators. The Xerces Society, Portland, OR.
Boughton, D. A., H. Fish, J. Pope, and G. Holt. 2009. Spatial patterning of habitat for Oncorhynchus mykiss in a system of intermittent and perennial streams. Ecology of Freshwater Fish 18:92–105.
Cain, D. J., S. N. Luoma, and W. G. Wallace. 2004. Linking metal bioaccumulation of aquatic insects to their distribution patterns in a mining-impacted river. Environmental Toxicology and Chemistry 23:1463.
Caskey, S. T., T. S. Blaschak, E. Wohl, E. Schnackenberg, D. M. Merritt, and K. A. Dwire. 2015. Downstream effects of stream flow diversion on channel characteristics and riparian vegetation in the Colorado Rocky Mountains, USA: Effects of flow diversion in Colorado Rocky Mountains. Earth Surface Processes and Landforms 40:586–598.
Clements, W. H., D. M. Carlisle, J. M. Lazorchak, and P. C. Johnson. 2000. Heavy metals structure benthic communities in Colorado mountain streams. Ecological Applications 10:626–638.
Cover, M. R., J. H. Seo, and V. H. Resh. 2015. Life History, Burrowing Behavior, and Distribution of Neohermes filicornis (Megaloptera: Corydalidae), a Long-Lived Aquatic Insect in Intermittent Streams. Western North American Naturalist 75:474.
Fritz, K. M., B. R. Johnson, and D. M. Walters. 2008. Physical indicators of hydrologic permanence in forested headwater streams. Journal of the North American Benthological Society 27:690–704.
Fritz, K. M., T.-L. Nadeau, J. E. Kelso, W. S. Beck, R. D. Mazor, R. A. Harrington, and B. J. Topping. 2020. Classifying Streamflow Duration: The Scientific Basis and an Operational Framework for Method Development. Water 12:2545.
Fritz, K. M., W. R. Wenerick, and M. S. Kostich. 2013. A Validation Study of a Rapid Field-Based Rating System for Discriminating Among Flow Permanence Classes of Headwater Streams in South Carolina. Environmental Management 52:1286–1298.
Grimm, N. B., and S. G. Fisher. 1989. Stability of Periphyton and Macroinvertebrates to Disturbance by Flash Floods in a Desert Stream. Journal of the North American Benthological Society 8:293–307.
Halaburka, B. J., J. E. Lawrence, H. N. Bischel, J. Hsiao, M. H. Plumlee, V. H. Resh, and R. G. Luthy. 2013. Economic and Ecological Costs and Benefits of Streamflow Augmentation Using Recycled Water in a California Coastal Stream. Environmental Science & Technology 47:10735–10743.
Hall, R. K., P. Husby, G. Wolinsky, O. Hansen, and M. Mares. 1998. Site access and sample frame issues for R-EMAP Central Valley, California, stream assessment. Environmental Monitoring and Assessment 51:357–367.
Hamdhani, H., D. E. Eppehimer, and M. T. Bogan. 2020. Release of treated effluent into streams: A global review of ecological impacts with a consideration of its potential use for environmental flows. Freshwater Biology 65:1657–1670.
Hammond, J. C., F. A. Saavedra, and S. K. Kampf. 2017. MODIS MOD10A2 derived snow persistence and no data index for the western U.S.
Appendices
54
Hammond, J. C., F. A. Saavedra, and S. K. Kampf. 2018. How Does Snow Persistence Relate to Annual Streamflow in Mountain Watersheds of the Western U.S. With Wet Maritime and Dry Continental Climates? Water Resources Research 54:2605–2623.
Hart, E., and K. Bell. 2015. Prism: Access Data From The Oregon State Prism Climate Project. Zenodo. Hooley-Underwood, Z. E., S. B. Stevens, N. R. Salinas, and K. G. Thompson. 2019. An Intermittent Stream
Supports Extensive Spawning of Large-River Native Fishes. Transactions of the American Fisheries Society 148:426–441.
Karr, J. R., K. D. Fausch, P. R. Angermeier, and I. J. Schlosser. 1986. Assessment of Biological Integrity in Running Waters: A Method and Its Rationale. Special Publication 5, Illinois Natural History Survey.
Lichvar, R. W., D. L. Banks, W. N. Kirchner, and N. C. Melvin. 2016. The National Wetland Plant List: 2016 wetland ratings. Phytoneutron 30:1–17.
Lorig, R. C., M. P. Marchetti, and G. Kopp. 2013. Spatial and temporal distribution of native fish larvae in seasonal and perennial tributaries of the Sacramento River, CA, USA. Journal of Freshwater Ecology 28:179–197.
Mazor, R. D., and K. S. McCune. 2021. Review of flow duration methods and indicators of flow duration in the scientific literature: Western Mountains. Page 55. 1222, Southern California Coastal Water Research Project, Costa Mesa, CA. (Available from: https://ftp.sccwrp.org/pub/download/DOCUMENTS/TechnicalReports/1222_FlowDurationLitReview_WesternMountains.pdf)
Mazor, R. D., B. J. Topping, T.-L. Nadeau, K. M. Fritz, J. E. Kelso, R. A. Harrington, W. S. Beck, K. McCune, H. Lowman, A. Aaron, R. Leidy, J. T. Robb, and G. C. L. David. 2021. User Manual for a Beta Streamflow Duration Assessment Method for the Arid West of the United States. Version 1.0. EPA 800-K-21001. (Available from: https://www.epa.gov/sites/production/files/2021-03/documents/user_manual_beta_sdam_aw.pdf)
Mazzacano, C., and S. H. Black. 2008. Using aquatic macroinvertebrates as indicators of streamflow duration. Page 28. The Xerces Society, Portland, OR.
McKay, L., T. Bondelid, T. Dewald, J. Johnson, R. Moore, and A. Rea. 2014. NHDPlus Version 2: User Guide. Page 173. U.S. Environmental Protection Agency. (Available from: https://nctc.fws.gov/courses/references/tutorials/geospatial/CSP7306/Readings/NHDPlusV2_User_Guide.pdf)
Merritt, R. W., K. W. Cummins, and M. B. Berg (Eds.). 2019. An introduction to the aquatic insects of North America.
Nadeau, T.-L. 2015. Streamflow Duration Assessment Method for the Pacific Northwest. Page 36. EPA 910-K-14-001, U.S. Environmental Protection Agency.
Nadeau, T.-L., S. G. Leibowitz, P. J. Wigington, J. L. Ebersole, K. M. Fritz, R. A. Coulombe, R. L. Comeleo, and K. A. Blocksom. 2015. Validation of Rapid Assessment Methods to Determine Streamflow Duration Classes in the Pacific Northwest, USA. Environmental Management 56:34–53.
Nadeau, T.-L., and M. C. Rains. 2007. Hydrological Connectivity Between Headwater Streams and Downstream Waters: How Science Can Inform Policy. JAWRA Journal of the American Water Resources Association 43:118–133.
New Mexico Environment Department (NMED). 2011. Hydrology protocol for the determination of uses supported by ephemeral, intermittent, and perennial waters. Page 35. Surface Water Quality Bureau, New Mexico Environment Department, Albuquerque, NM.
Page, L. M., B. M. Burr, and L. M. Page. 2011. Peterson field guide to freshwater fishes of North America north of Mexico. 2nd ed. Houghton Mifflin Harcourt, Boston.
PRISM Climate Group. 2021. PRISM Climate Data. Oregon State University. (Available from: http://prism.oregonstate.edu/)
Appendices
55
Richards, D. C., P. O’Connell, and D. C. Shinn. 2004. Simple Control Method to Limit the Spread of the New Zealand Mudsnail Potamopyrgus antipodarum. North American Journal of Fisheries Management 24:114–117.
Rosenberg, D. M., and V. H. Resh (Eds.). 1993. Freshwater biomonitoring and benthic macroinvertebrates. Chapman & Hall, New York.
Stebbins, R. C. 2003. A field guide to western reptiles and amphibians. 3rd ed. Houghton Mifflin, Boston. Strong, E., and N. Whelan. 2019. Data from “Assessing the diversity of Western North American Juga
(Semisulcospiridae, Gastropoda).” figshare. U.S. Army Corps of Engineers. 2010. Regional Supplement to the Corps of Engineers Wetland
Delineation Manual: Western Mountains, Valleys, and Coast Region (Version 2.0). Page 153. ed. J. S. Wakeley, R. W. Lichvar, and C. V. Noble. ERDC/EL TR-10-3, U.S. Army Engineer Research and Development Center, Vicksburg, MS: U.S. Army Engineer Research and Development Center.
U.S. Army Corps of Engineers. 2020. Antecedent Precipitation Tool (APT). Ussery, T. A., and R. F. McMahon. 1995. Comparative study of the desiccation resistence of zebra
mussels (Dreissena polymorpha) and quagga mussels (Dreissena bugensis). Pages 1–27. Technical Report EL-95-6, US Army Engineer Waterways Experiment Station, Vicksburg, MS.
Voshell, J. R. 2002. A guide to common freshwater invertebrates of North America. McDonald & Woodward Pub, Blacksburg, Va.
Wilke, T., M. Haase, R. Hershler, H.-P. Liu, B. Misof, and W. Ponder. 2013. Pushing short DNA fragments to the limit: Phylogenetic relationships of ‘hydrobioid’ gastropods (Caenogastropoda: Rissooidea). Molecular Phylogenetics and Evolution 66:715–736.
Woelfle-Erskine, C., L. G. Larsen, and S. M. Carlson. 2017. Abiotic habitat thresholds for salmonid over-summer survival in intermittent streams. Ecosphere 8:e01645.
Wohl, E., M. K. Mersel, A. O. Allen, K. M. Fritz, S. L. Kichefski, R. W. Lichvar, T.-L. Nadeau, B. J. Topping, P. H. Tier, and F. B. Vanderbilt. 2016. Synthesizing the Scientific Foundation for Ordinary High Water Mark Delineation in Fluvial Systems. Page 217. Wetlands Regulatory Assistance Program ERDC/CCREL SR-16-5, U.S. Army Corps of Engineers Engineer Research and Development Center. (Available from: https://apps.dtic.mil/sti/pdfs/AD1025116.pdf)
Appendices
56
Appendix A. Glossary of terms Term Definition Abdomen The terminal section of an arthropod body. Algae A large and diverse group of photosynthetic single- and multi-cellular
organisms that live in waterbodies. Algae may grow suspended in water (i.e., phytoplankton), or, more typical for streams, attached to stable substrate, such as rocks or submerged logs (i.e., periphyton). For the beta SDAM WM, this group includes diatoms, cyanobacteria, green algae, and red algae. Vascular plants, mosses, and non-photosynthetic bacteria or fungi are not considered algae.
Active channel A portion of the valley bottom that can be distinguished based on the three primary criteria of (i) channels defined by erosional and depositional forms created by river processes, (ii) the upper elevation limit at which water is contained within a channel, and (iii) portions of a channel without mature woody vegetation. Braided systems have multiple threads and channel bars that are all part of the active channel.
Alluvial Refers to natural, channelized runoff from terrestrial terrain, and the material borne or deposited by such runoff.
Assessment reach The length of reach, ranging from 40 m to 200 m, where beta SDAM WM indicators are measured.
Bank The side of an active channel, typically associated with a steeper side gradient than the adjacent channel bed, floodplain, or valley bottom.
Bankfull elevation The elevation associated with a shift in the hydraulic geometry of the channel and the transition point between the channel and the floodplain. In unconstrained settings this is the height of the water in the channel just when it begins to flow onto the floodplain.
Braided system A stream with a wide, relatively horizontal channel bed over which during low flows, water forms an interlacing pattern of splitting into numerous small conveyances that coalesce a short system downstream. Same as multi-threaded system.
Benthic macroinvertebrates
Invertebrate organisms found at the bottom of waterbodies and visible without the use of a microscope (i.e., > 0.5 mm body length).
Canal An artificial or formerly natural waterway used to convey water between locations, possibly in both directions. Same as ditch.
Catchment An area of land, bounded by a drainage divide, which drains to a channel or waterbody. Synonymous with watershed.
Cerci The tail-like filaments at the posterior end of some arthropods’ abdomens. Singular: cerucs.
Channel A feature in fluvial systems consisting of a bed and its opposing banks which confines and conveys surface water flow. A braided system consists of multiple channels, including inactive or abandoned channels.
Confinement The degree to which levees, terraces, hillsides, or canyon walls prevent the lateral migration of a fluvial channel.
Culvert A drain or covered channel that crosses under a road, pathway, or railway. Ditch An artificial or formerly natural waterway used to convey water between
locations, possibly in both directions. Same as canal.

Appendices
57
Ephemeral Ephemeral streams are channels that flow only in direct response to precipitation. Water typically flows at the surface only during and/or shortly after large precipitation events, the streambed is always above the water table, and stormwater runoff is the primary water source.
Exuviae The shed exoskeletons of arthropods typically left behind when an aquatic larva or nymph becomes a winged adult. Singular: exuvium.
FACW Facultative wetland plans. They usually occur in wetlands, but may occur in non-wetlands.
Floodplain The bench or broad flat area of a fluvial channel that corresponds to the height of bankfull flow. It is a relatively flat depositional area that is periodically flooded (as evidenced by deposits of fine sediment, wrack lines, vertical zonation of plant communities, etc.)
Groundwater Water found underground in soil, pores, or crevices in rocks. Head The anterior-most section of an arthropod body, where mouthparts, eyes, and
other sensory organs are located. The head is typically (but not always) distinct from the rest of the body.
Hydrophyte Plants that are adapted to inundated conditions found in wetlands and riparian areas.
Hyporheic The saturated zone under a river or stream, including the substrate and water-filled spaces between the particles.
Indicator A measurement of environmental conditions. For the beta SDAM WM, indicators are rapid, field-based biological measurements that predict streamflow duration class.
Intermittent Intermittent reaches are channels that contain sustained flowing surface water for only part of the year, typically during the wet season, where the streambed may be below the water table and/or where the snowmelt from surrounding uplands provides sustained flow. The flow may vary greatly with stormwater runoff.
Larva An immature stage of an insect or other invertebrates. Several insects have aquatic larval stages, such as mayflies, stoneflies, and caddisflies. Immature salamanders are sometimes also described as larvae. Plural: larvae.
Low-flow channel In braided systems, the low-flow channel is the main channel with the lowest thalweg elevation. In intermittent or ephemeral reaches, the low-flow channel typically retains flow longer than other channels.
Macrophyte Aquatic plants. Metamorphosis The process of transforming from one life stage to another. The term may
apply to the transformation from larval to adult insects, as well as to amphibians (e.g., the transformation from tadpoles to adult frogs). Newly transformed frogs are sometimes called metamorphs. Insects with incomplete metamorphosis (e.g., mayflies and stoneflies) transition directly from larval to adult stages, whereas insects with complete metamorphosis (e.g., caddisflies) go through a pupal stage.
Multi-threaded system
A stream with a wide, relatively horizontal channel bed over which during low flows, water forms an interlacing pattern of splitting into numerous small conveyances that coalesce a short system downstream. Same as braided system.
Appendices
58
Nymph An immature stage of an insect. The term only applies to insect orders that lack complete metamorphosis (i.e., groups that lack a pupal stage and transform directly from larva to adult). Mayflies and stoneflies are examples of aquatic insects that have larvae known as nymphs.
OBL Obligate wetland plants. They almost always occur in wetlands. Ordinary high-water mark (OHWM)
The line on the shore established by the fluctuations of water and indicated by physical characteristics, such as a clear natural line impressed on the bank, shelving, changes in the character of the soil, destruction of terrestrial vegetation, the presence of litter and debris, or other appropriate means that consider the characteristics of the surrounding areas. See 33 CFR 328.3. An OHWM is required to establish lateral extent of USACE jurisdiction in non-tidal streams. See 33 CFR 328.4.
Perennial Perennial reaches are channels that contain flowing surface water continuously during a year of normal rainfall, often with the streambed located below the water table for most of the year. Groundwater typically supplies the baseflow for perennial reaches, but the baseflow may also be supplemented by stormwater runoff and/or snowmelt.
Pool A depression in a channel where water velocity is slow and suspended particles tend to deposit. Pools typically retain surface water longer than other portions of intermittent or ephemeral streams.
Proleg Leg-like extensions on the abdomen (never the thorax) of some insect larvae. Typically, prolegs are unsegmented.
Pupa An immature stage of insect orders with complete metamorphosis, occurring between the larval and adult stage. Pupal stages are typically immobile. Caddisflies are an example of an aquatic insect order with a pupal stage. Plural: pupae.
Reach A length of stream that generally has consistent geomorphological and biological characteristics.
Riffle A shallow portion of a channel where water velocity and turbulence is high, typically with coarse substrate (cobble and gravels). Riffles typically dry out earlier than other portions of intermittent or ephemeral streams, and harbor higher abundance and diversity of aquatic invertebrates.
Riparian A transitional area between the channel and adjacent terrestrial ecosystems. Runoff Surface flow of water caused by precipitation or irrigation over saturated or
impervious surfaces. SAV Submerged aquatic vegetation. This class is treated the same as OBL in current
versions of the National Wetland Plant List. Sclerotized Hardened, as in the tough plates covering various body parts in some
arthropods. Scour Concentrated erosive action of flowing water in streams that removes and
carries material away from the bed or banks. Algal and invertebrate abundance is typically depressed after scouring events.
Secondary channel A subsidiary channel that branches from the main channel and trend parallel or subparallel to the main channel before rejoining it downstream.
Streambed The bottom of a stream channel between the banks that is inundated during baseflow conditions.
Thalweg The line along the deepest flowpath within the channel.
Appendices
59
Thorax The middle section of an arthropod body where legs and wing pads (if present) are attached.
Tributary A stream that conveys water and sediment to a larger waterbody downstream. Uplands Any portion of a drainage basin outside the river corridor. Valley width The portion of the valley within which the fluvial channel is able to migrate
without cutting into hill slopes, terraces, or artificial structures. Watershed An area of land, bounded by a drainage divide, which drains to a channel or
waterbody. Synonymous with catchment.

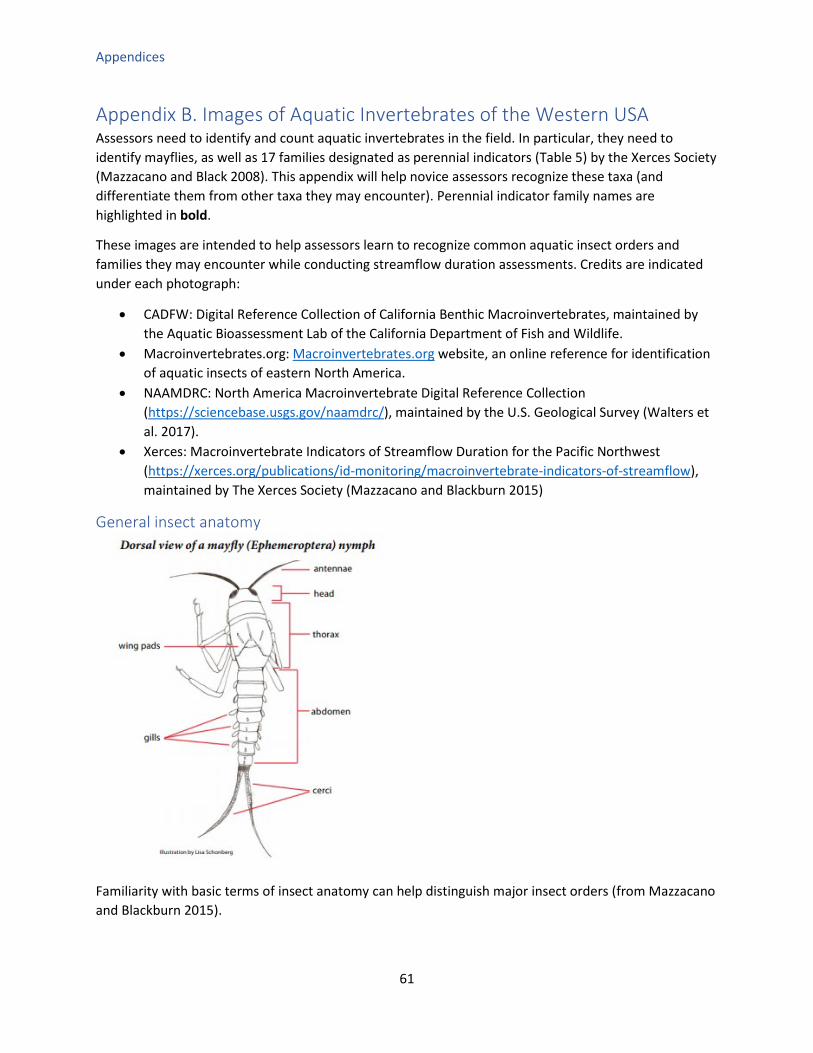
Appendices
61
Appendix B. Images of Aquatic Invertebrates of the Western USA Assessors need to identify and count aquatic invertebrates in the field. In particular, they need to identify mayflies, as well as 17 families designated as perennial indicators (Table 5) by the Xerces Society (Mazzacano and Black 2008). This appendix will help novice assessors recognize these taxa (and differentiate them from other taxa they may encounter). Perennial indicator family names are highlighted in bold.
These images are intended to help assessors learn to recognize common aquatic insect orders and families they may encounter while conducting streamflow duration assessments. Credits are indicated under each photograph:
• CADFW: Digital Reference Collection of California Benthic Macroinvertebrates, maintained by the Aquatic Bioassessment Lab of the California Department of Fish and Wildlife.
• Macroinvertebrates.org: Macroinvertebrates.org website, an online reference for identification of aquatic insects of eastern North America.
• NAAMDRC: North America Macroinvertebrate Digital Reference Collection (https://sciencebase.usgs.gov/naamdrc/), maintained by the U.S. Geological Survey (Walters et al. 2017).
• Xerces: Macroinvertebrate Indicators of Streamflow Duration for the Pacific Northwest (https://xerces.org/publications/id-monitoring/macroinvertebrate-indicators-of-streamflow), maintained by The Xerces Society (Mazzacano and Blackburn 2015)
General insect anatomy
Familiarity with basic terms of insect anatomy can help distinguish major insect orders (from Mazzacano and Blackburn 2015).
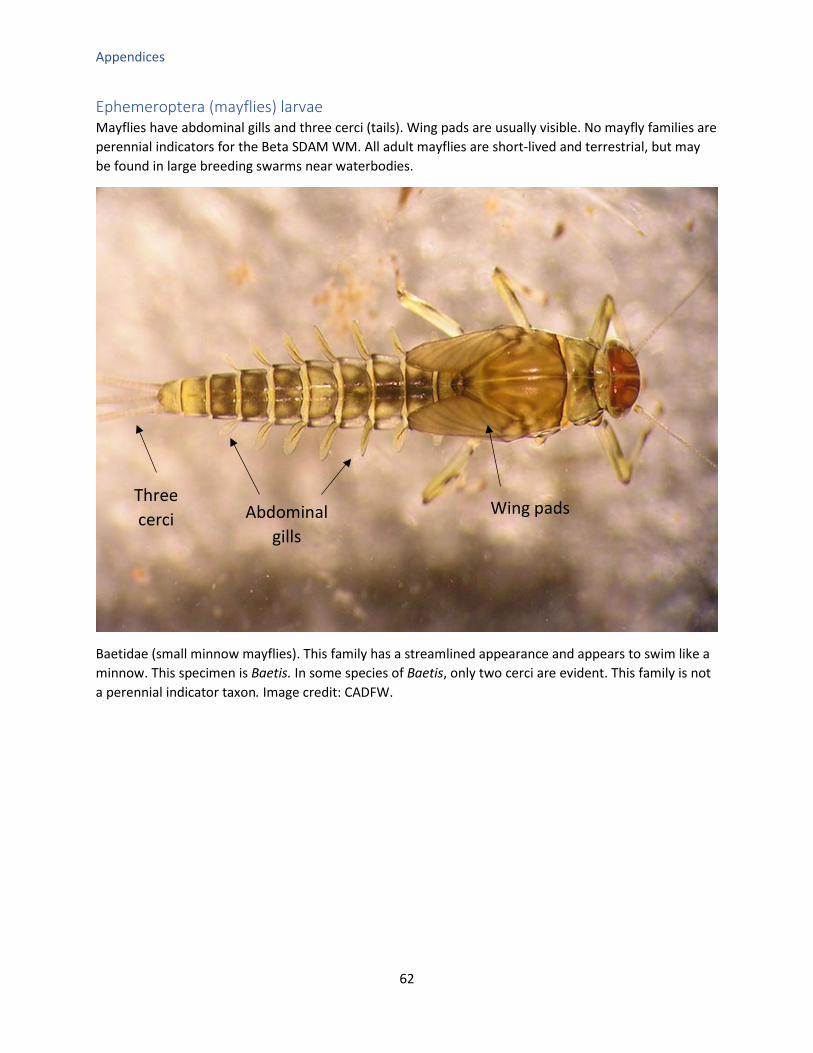
Appendices
62
Ephemeroptera (mayflies) larvae Mayflies have abdominal gills and three cerci (tails). Wing pads are usually visible. No mayfly families are perennial indicators for the Beta SDAM WM. All adult mayflies are short-lived and terrestrial, but may be found in large breeding swarms near waterbodies.
Baetidae (small minnow mayflies). This family has a streamlined appearance and appears to swim like a minnow. This specimen is Baetis. In some species of Baetis, only two cerci are evident. This family is not a perennial indicator taxon. Image credit: CADFW.
Three cerci Abdominal
gills Wing pads
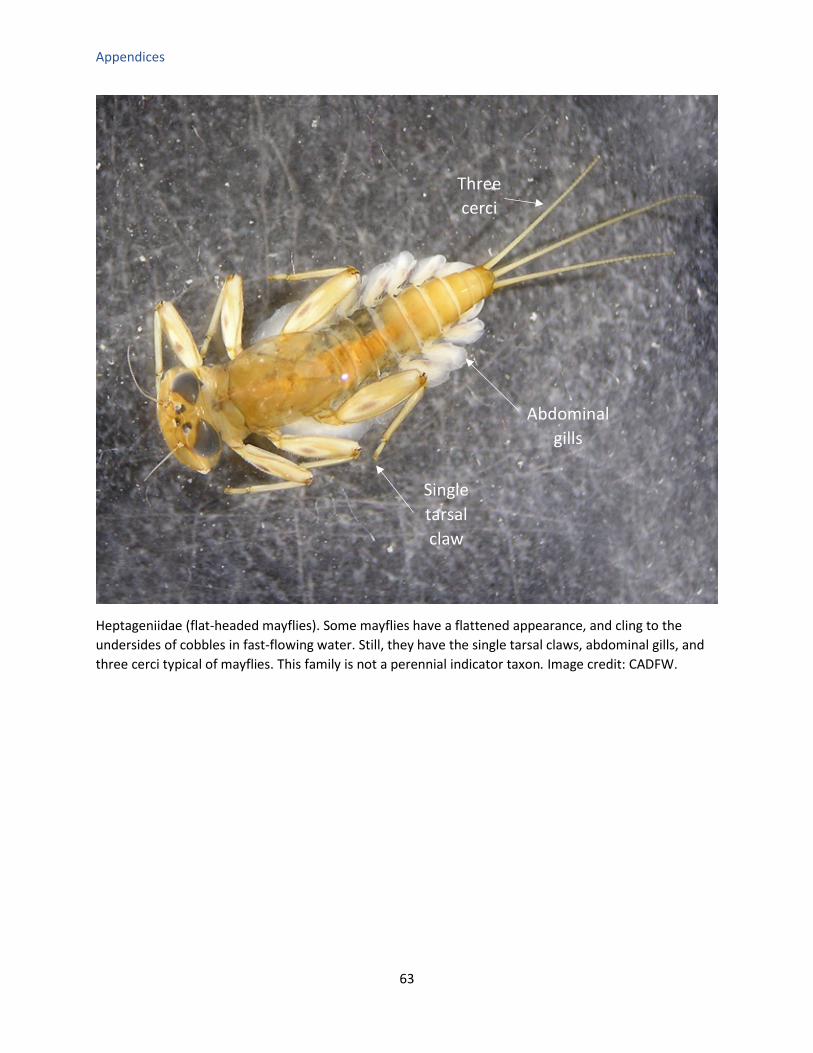
Appendices
63
Heptageniidae (flat-headed mayflies). Some mayflies have a flattened appearance, and cling to the undersides of cobbles in fast-flowing water. Still, they have the single tarsal claws, abdominal gills, and three cerci typical of mayflies. This family is not a perennial indicator taxon. Image credit: CADFW.
Abdominal gills
Three cerci
Single tarsal claw
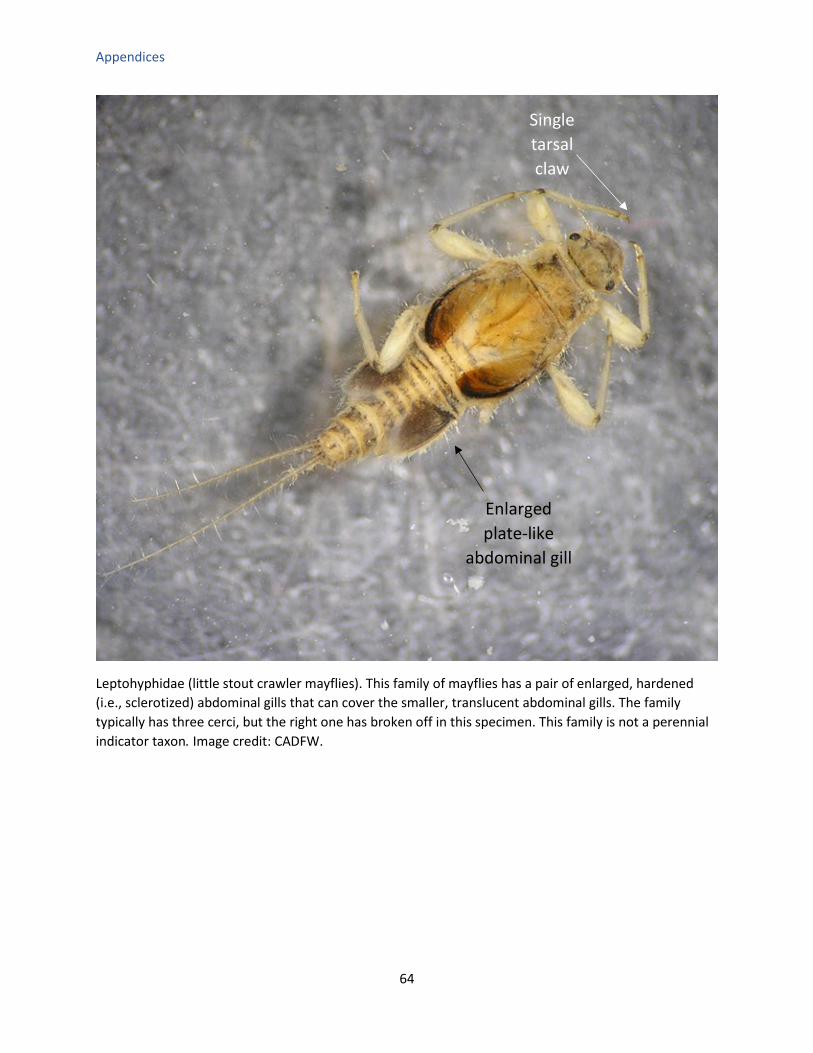
Appendices
64
Leptohyphidae (little stout crawler mayflies). This family of mayflies has a pair of enlarged, hardened (i.e., sclerotized) abdominal gills that can cover the smaller, translucent abdominal gills. The family typically has three cerci, but the right one has broken off in this specimen. This family is not a perennial indicator taxon. Image credit: CADFW.
Single tarsal claw
Enlarged plate-like
abdominal gill
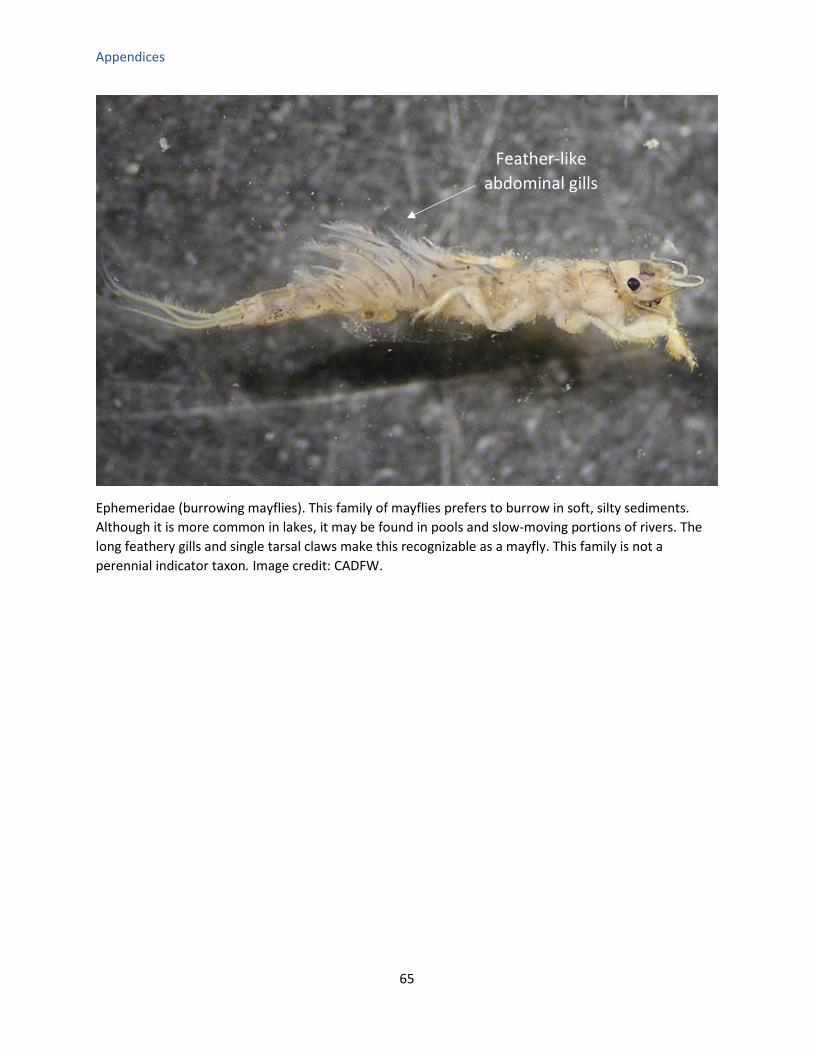
Appendices
65
Ephemeridae (burrowing mayflies). This family of mayflies prefers to burrow in soft, silty sediments. Although it is more common in lakes, it may be found in pools and slow-moving portions of rivers. The long feathery gills and single tarsal claws make this recognizable as a mayfly. This family is not a perennial indicator taxon. Image credit: CADFW.
Feather-like abdominal gills
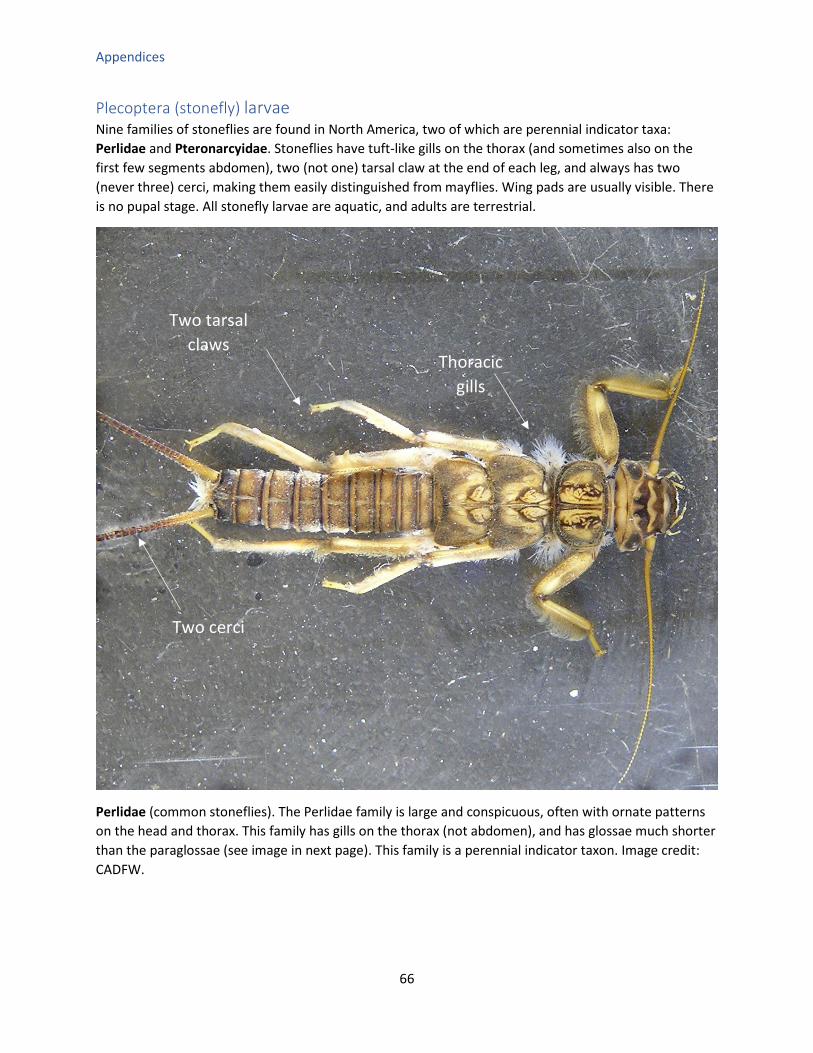
Appendices
66
Plecoptera (stonefly) larvae Nine families of stoneflies are found in North America, two of which are perennial indicator taxa: Perlidae and Pteronarcyidae. Stoneflies have tuft-like gills on the thorax (and sometimes also on the first few segments abdomen), two (not one) tarsal claw at the end of each leg, and always has two (never three) cerci, making them easily distinguished from mayflies. Wing pads are usually visible. There is no pupal stage. All stonefly larvae are aquatic, and adults are terrestrial.
Perlidae (common stoneflies). The Perlidae family is large and conspicuous, often with ornate patterns on the head and thorax. This family has gills on the thorax (not abdomen), and has glossae much shorter than the paraglossae (see image in next page). This family is a perennial indicator taxon. Image credit: CADFW.
Two tarsal claws
Two cerci
Thoracic gills
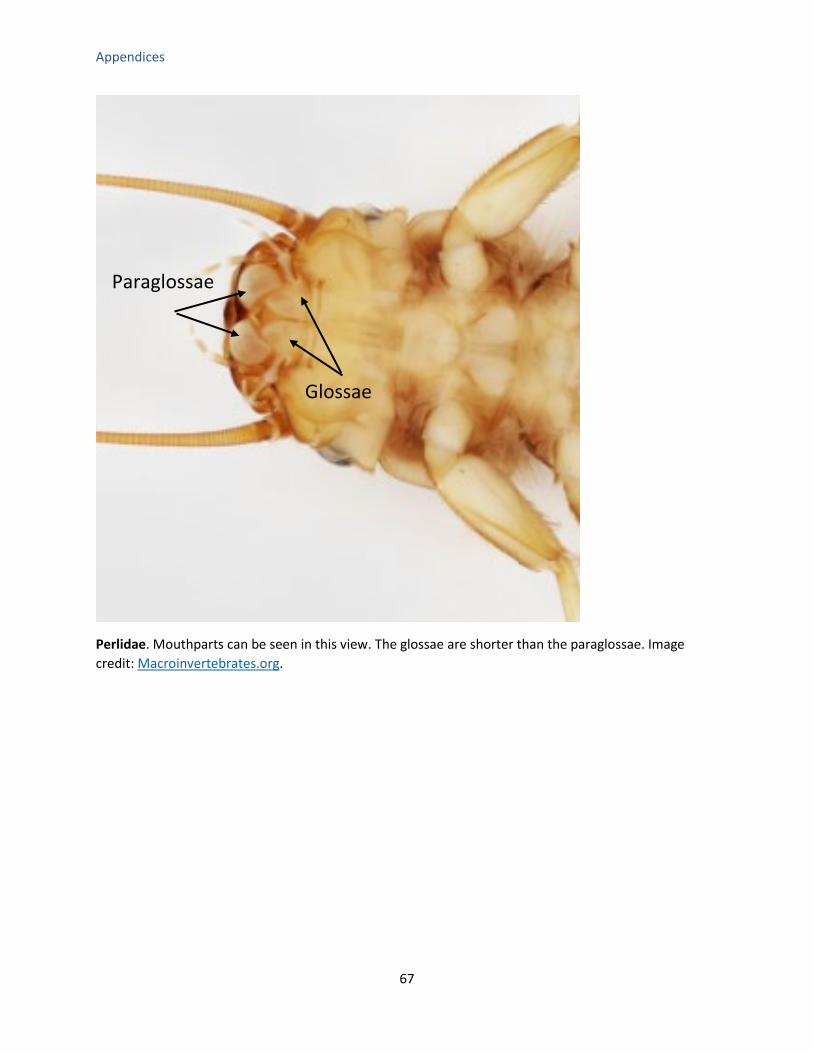
Appendices
67
Perlidae. Mouthparts can be seen in this view. The glossae are shorter than the paraglossae. Image credit: Macroinvertebrates.org.
Glossae
Paraglossae

Appendices
68
Pteronarcyidae (giant stoneflies). This family can be distinguished from other stoneflies by their large size, the presence of gill tufts on the thorax and the first two abdominal segments. In addition, the glossae and paraglossae are about the same length. The image on the bottom-left illustrates the large size mature larvae can attain. This family is a perennial indicator taxon. Image credits: Bottom-left: Raphael Mazor. Others: Macroinvertebrates.org.
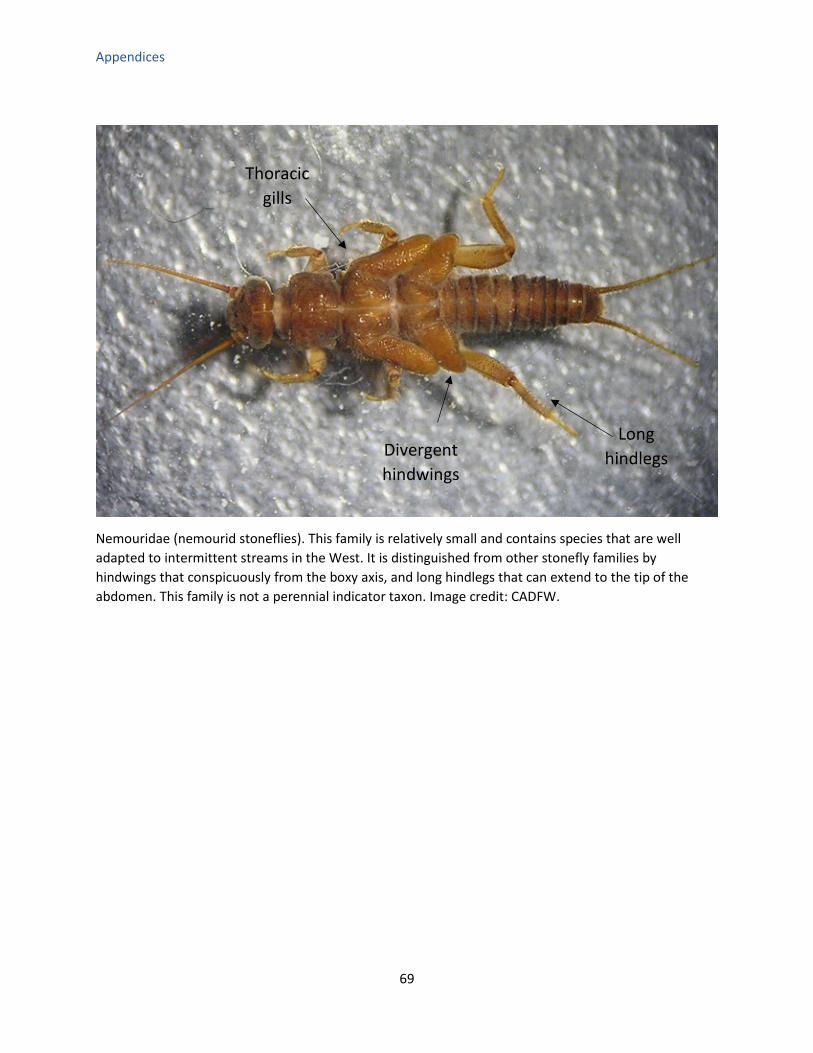
Appendices
69
Nemouridae (nemourid stoneflies). This family is relatively small and contains species that are well adapted to intermittent streams in the West. It is distinguished from other stonefly families by hindwings that conspicuously from the boxy axis, and long hindlegs that can extend to the tip of the abdomen. This family is not a perennial indicator taxon. Image credit: CADFW.
Thoracic gills
Long hindlegs Divergent
hindwings

Appendices
70
Peltoperlidae (roach-like stoneflies). Even more so than other stonefly families, peltoperlids have a roach-like appearance. This family is not a perennial indicator taxon. Image credit: CADFW.
Two cerci
Wing pads
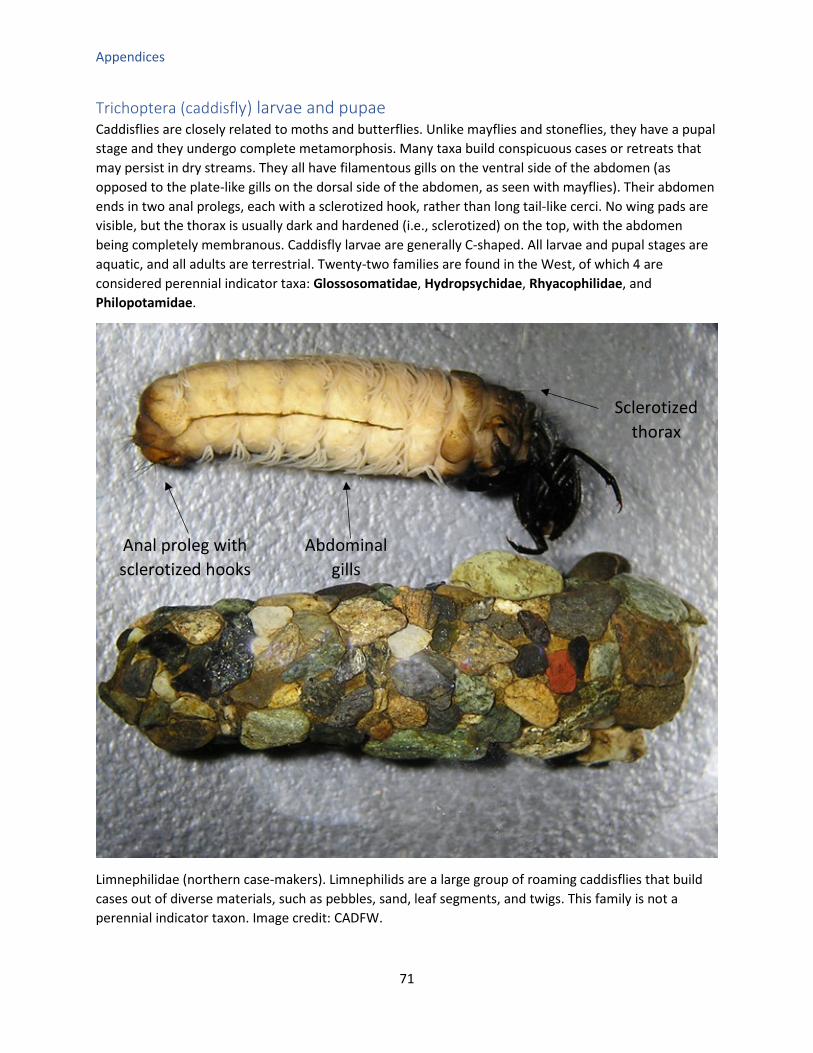
Appendices
71
Trichoptera (caddisfly) larvae and pupae Caddisflies are closely related to moths and butterflies. Unlike mayflies and stoneflies, they have a pupal stage and they undergo complete metamorphosis. Many taxa build conspicuous cases or retreats that may persist in dry streams. They all have filamentous gills on the ventral side of the abdomen (as opposed to the plate-like gills on the dorsal side of the abdomen, as seen with mayflies). Their abdomen ends in two anal prolegs, each with a sclerotized hook, rather than long tail-like cerci. No wing pads are visible, but the thorax is usually dark and hardened (i.e., sclerotized) on the top, with the abdomen being completely membranous. Caddisfly larvae are generally C-shaped. All larvae and pupal stages are aquatic, and all adults are terrestrial. Twenty-two families are found in the West, of which 4 are considered perennial indicator taxa: Glossosomatidae, Hydropsychidae, Rhyacophilidae, and Philopotamidae.
Limnephilidae (northern case-makers). Limnephilids are a large group of roaming caddisflies that build cases out of diverse materials, such as pebbles, sand, leaf segments, and twigs. This family is not a perennial indicator taxon. Image credit: CADFW.
Abdominal gills
Anal proleg with sclerotized hooks
Sclerotized thorax

Appendices
72
Glossosomatidae (saddle case-maker). This family has a distinctive case with two openings (although these are sealed in pupal cases). The larvae are distinguished from other caddisfly families by having only one sclerotized thoracic segment, a small sclerite on the next-to-last segment of the abdomen, and three pairs of setae (small hairs) on the last segment of the thorax. This family is a perennial indicator taxon. Image credit: Macroinvertebrates.org.
Sclerotized thorax
Abdominal sclerite
3 pairs of setae (hairs) on last
segment of thorax
Anterior opening
Posterior opening
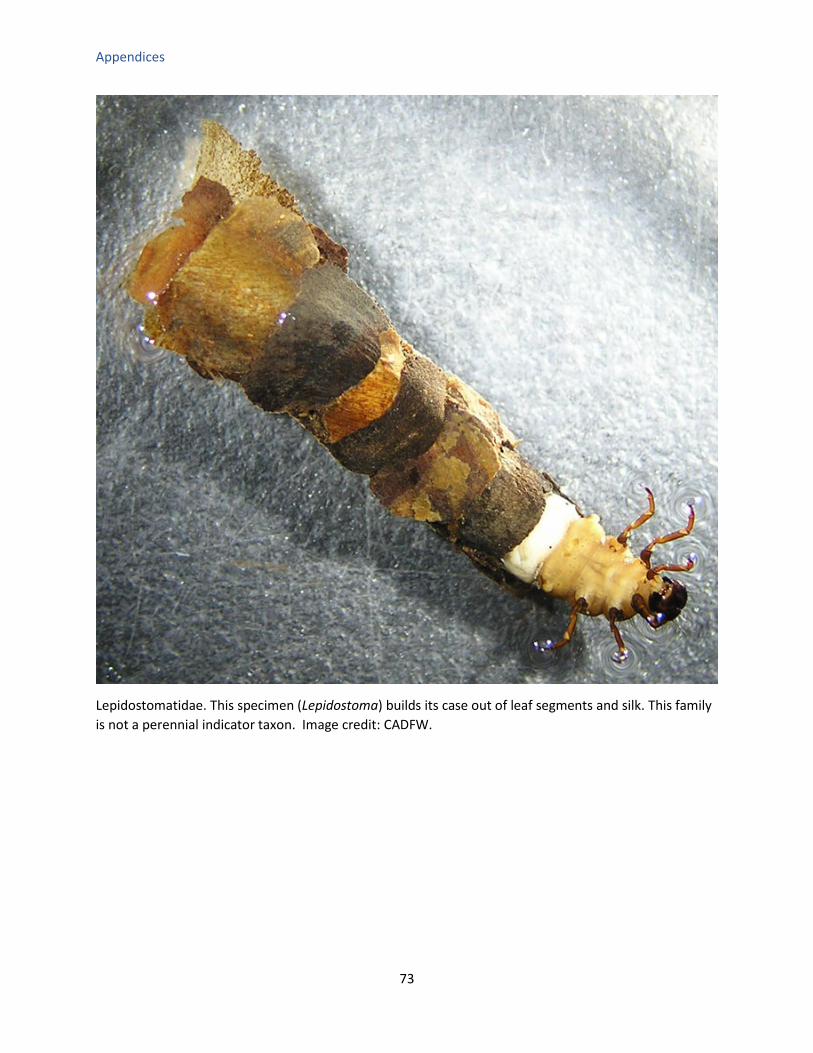
Appendices
73
Lepidostomatidae. This specimen (Lepidostoma) builds its case out of leaf segments and silk. This family is not a perennial indicator taxon. Image credit: CADFW.

Appendices
74
Lepidostomatidae. This specimen (Lepidostoma) has a case made out of twigs. This family is not a perennial indicator taxon. Image credit: CADFW.

Appendices
75
Rhyacophilidae (free-roaming caddisflies). This family is usually found wandering freely on the undersides of boulders and cobbles, actively hunting for prey. Abdominal gills are present, but not evident in this photograph. Notice the long anal prolegs, which have large sclerotized claws. Some species of this family have a striking blue-green coloration, which may fade when preserved in alcohol. This family is a perennial indicator taxon. Image credit: CADFW.
Two anal prolegs with sclerotized
hooks
Sclerotized thoracic segment
Unsclerotized thoracic
segments

Appendices
76
Hydroptilidae (micro caddisflies). These are small caddisflies (2-4 mm long) that build purse-like cases out of sand grains. They may be very abundant, but hard to see due to their size. This family is not a perennial indicator taxon. Image credit: CADFW.
Sclerotized thoracic
segments

Appendices
77
Helicopsychidae (snail case-makers) are unusual in that they build spiral-shaped, snail-like cases. This family is not a perennial indicator taxon. Image credit: CADFW.
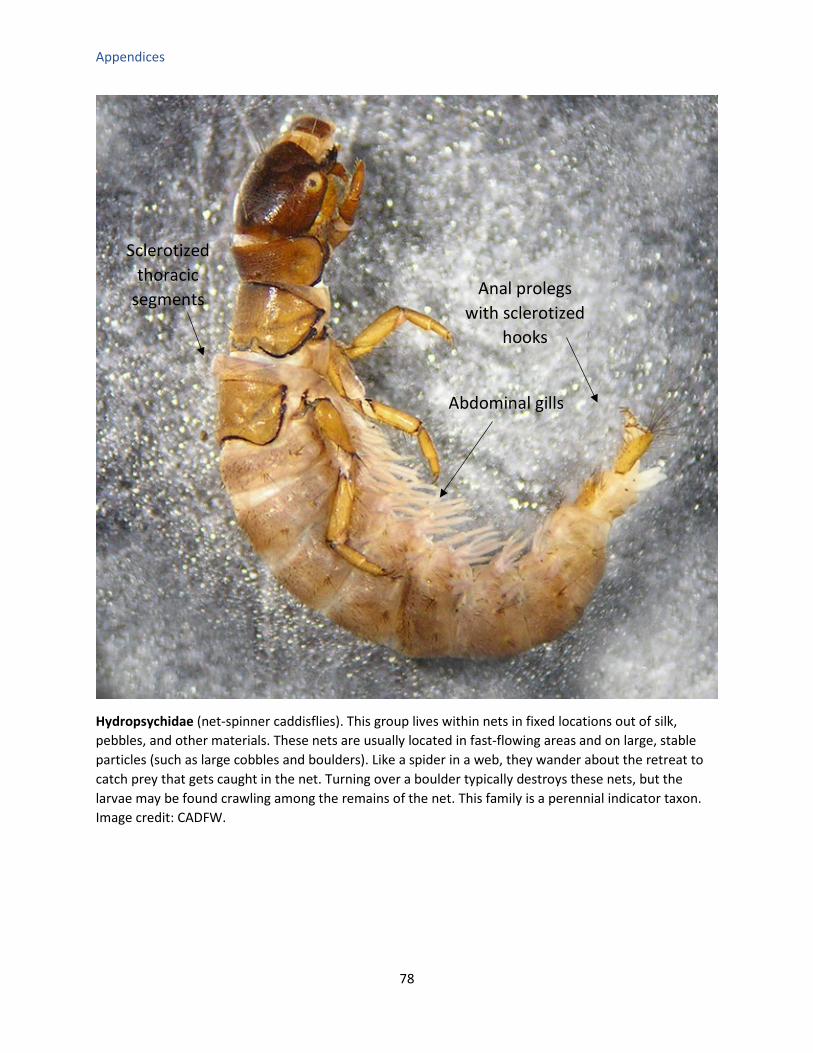
Appendices
78
Hydropsychidae (net-spinner caddisflies). This group lives within nets in fixed locations out of silk, pebbles, and other materials. These nets are usually located in fast-flowing areas and on large, stable particles (such as large cobbles and boulders). Like a spider in a web, they wander about the retreat to catch prey that gets caught in the net. Turning over a boulder typically destroys these nets, but the larvae may be found crawling among the remains of the net. This family is a perennial indicator taxon. Image credit: CADFW.
Sclerotized thoracic
segments
Abdominal gills
Anal prolegs with sclerotized
hooks
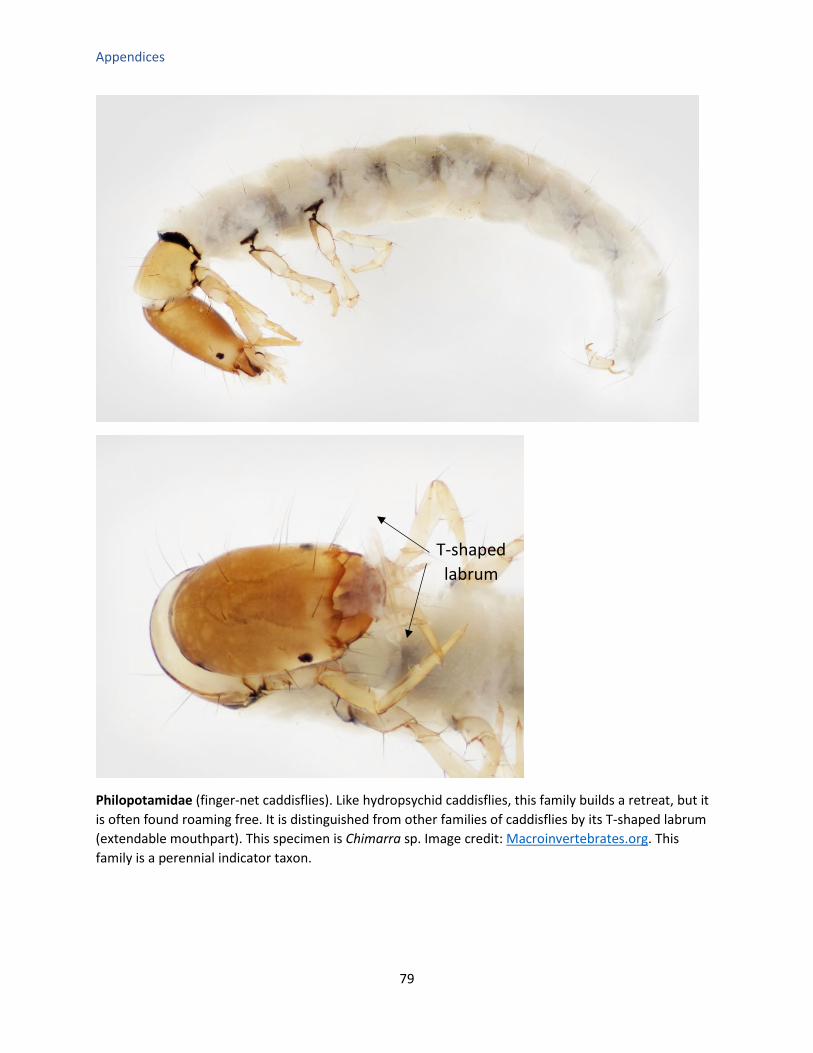
Appendices
79
Philopotamidae (finger-net caddisflies). Like hydropsychid caddisflies, this family builds a retreat, but it is often found roaming free. It is distinguished from other families of caddisflies by its T-shaped labrum (extendable mouthpart). This specimen is Chimarra sp. Image credit: Macroinvertebrates.org. This family is a perennial indicator taxon.
T-shaped labrum
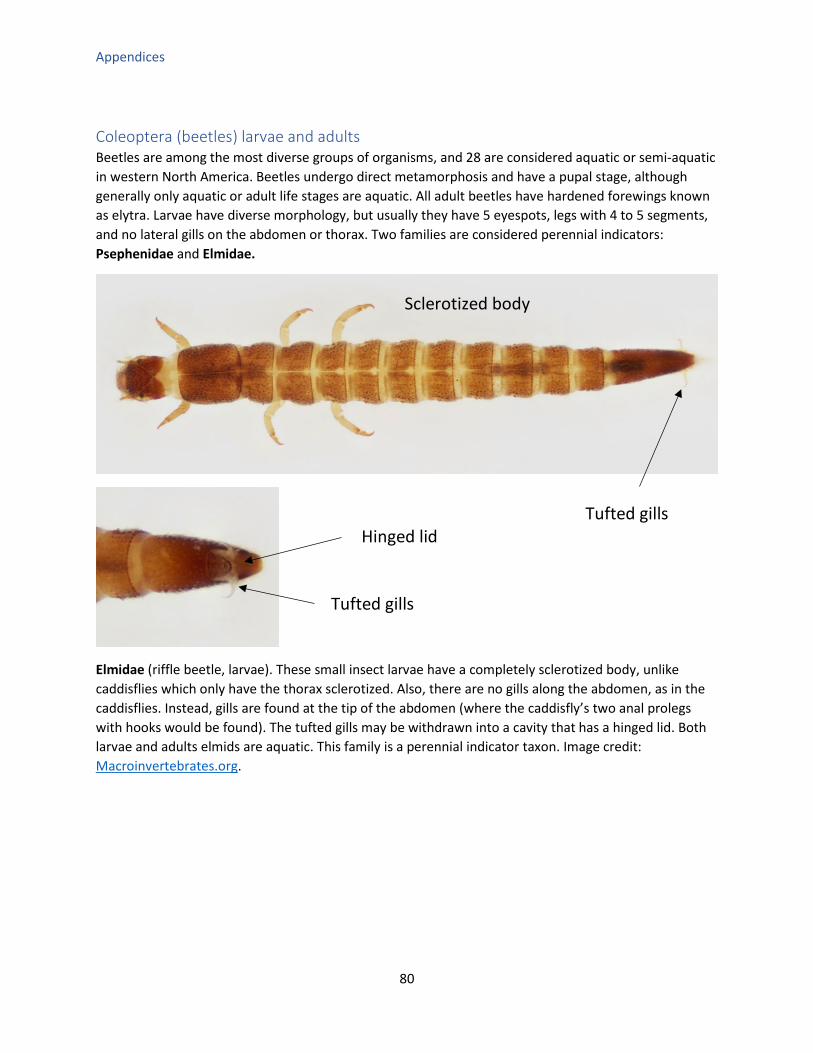
Appendices
80
Coleoptera (beetles) larvae and adults Beetles are among the most diverse groups of organisms, and 28 are considered aquatic or semi-aquatic in western North America. Beetles undergo direct metamorphosis and have a pupal stage, although generally only aquatic or adult life stages are aquatic. All adult beetles have hardened forewings known as elytra. Larvae have diverse morphology, but usually they have 5 eyespots, legs with 4 to 5 segments, and no lateral gills on the abdomen or thorax. Two families are considered perennial indicators: Psephenidae and Elmidae.
Elmidae (riffle beetle, larvae). These small insect larvae have a completely sclerotized body, unlike caddisflies which only have the thorax sclerotized. Also, there are no gills along the abdomen, as in the caddisflies. Instead, gills are found at the tip of the abdomen (where the caddisfly’s two anal prolegs with hooks would be found). The tufted gills may be withdrawn into a cavity that has a hinged lid. Both larvae and adults elmids are aquatic. This family is a perennial indicator taxon. Image credit: Macroinvertebrates.org.
Tufted gills
Hinged lid Tufted gills
Sclerotized body

Appendices
81
Elmidae (riffle beetle, adult). Adult elmids are typically very small (1 to 8 mm). They frequently have rows of indentations along the elytra, relatively long legs ending in proportionally long claws, and thread-like antennae. This specimen is Dubiraphia sp. Image credit: Macroinvertebrates.org.

Appendices
82
Psephenidae (water penny). The round, flat appearance of these larvae explain the common name of the water-penny family. They are often found clinging to cobbles in fast-flowing streams. Their unusual shape makes them unmistakable for any other aquatic insect larvae. Adults are rarely observed. This family is a perennial indicator taxon. Image credit: Macroinverterates.org.
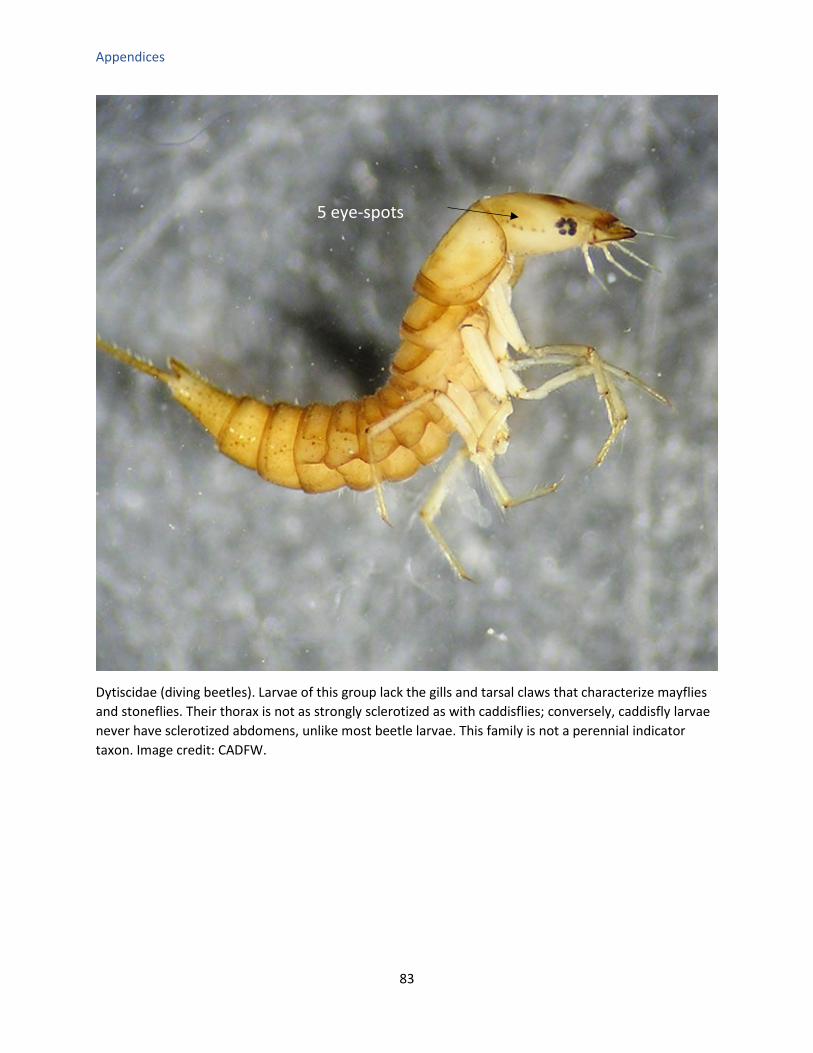
Appendices
83
Dytiscidae (diving beetles). Larvae of this group lack the gills and tarsal claws that characterize mayflies and stoneflies. Their thorax is not as strongly sclerotized as with caddisflies; conversely, caddisfly larvae never have sclerotized abdomens, unlike most beetle larvae. This family is not a perennial indicator taxon. Image credit: CADFW.
5 eye-spots
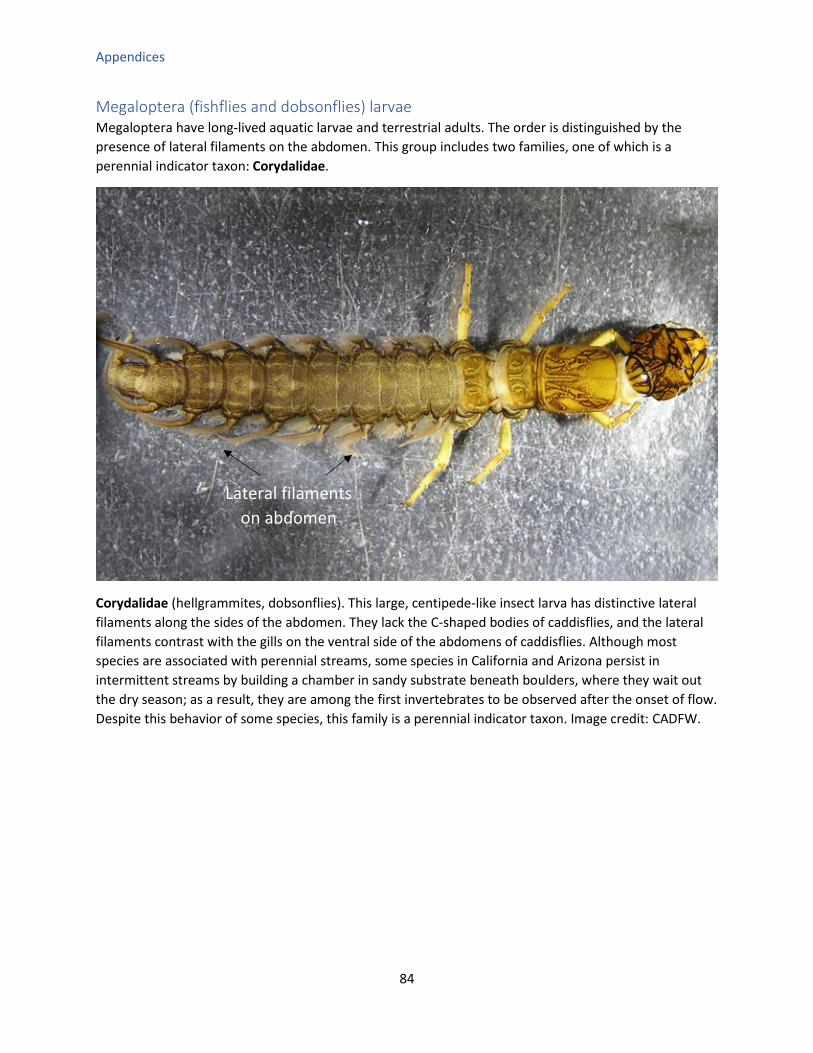
Appendices
84
Megaloptera (fishflies and dobsonflies) larvae Megaloptera have long-lived aquatic larvae and terrestrial adults. The order is distinguished by the presence of lateral filaments on the abdomen. This group includes two families, one of which is a perennial indicator taxon: Corydalidae.
Corydalidae (hellgrammites, dobsonflies). This large, centipede-like insect larva has distinctive lateral filaments along the sides of the abdomen. They lack the C-shaped bodies of caddisflies, and the lateral filaments contrast with the gills on the ventral side of the abdomens of caddisflies. Although most species are associated with perennial streams, some species in California and Arizona persist in intermittent streams by building a chamber in sandy substrate beneath boulders, where they wait out the dry season; as a result, they are among the first invertebrates to be observed after the onset of flow. Despite this behavior of some species, this family is a perennial indicator taxon. Image credit: CADFW.
Lateral filaments on abdomen
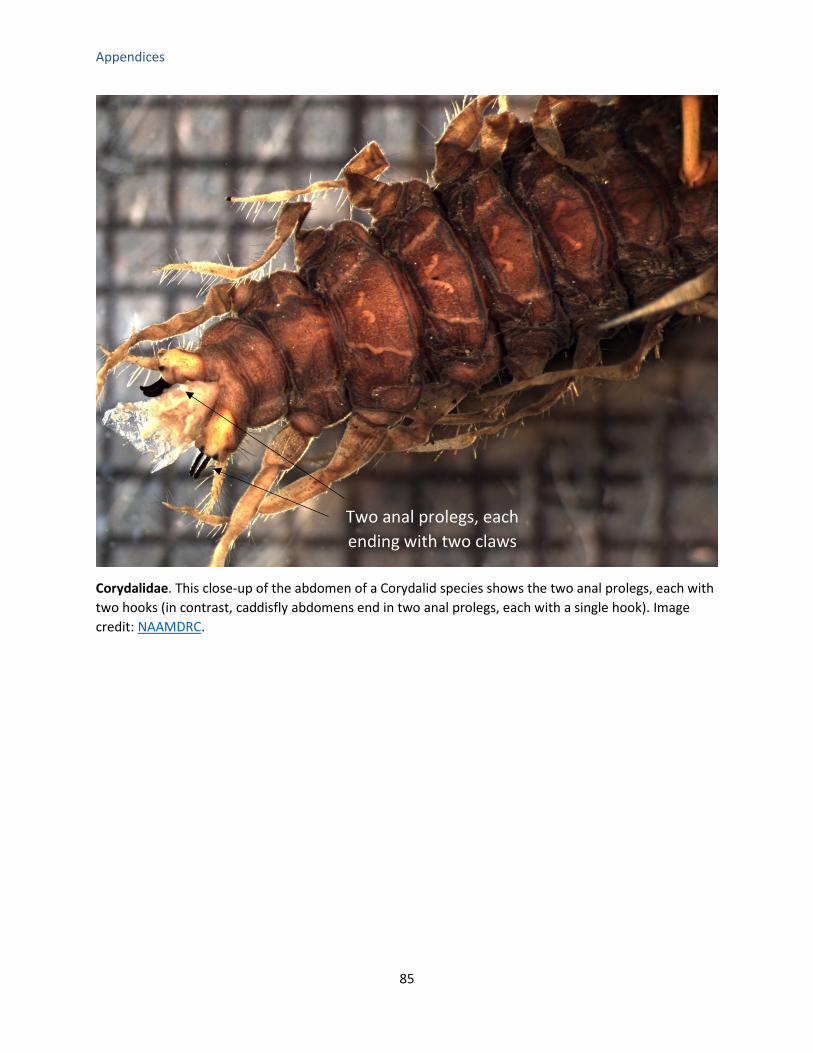
Appendices
85
Corydalidae. This close-up of the abdomen of a Corydalid species shows the two anal prolegs, each with two hooks (in contrast, caddisfly abdomens end in two anal prolegs, each with a single hook). Image credit: NAAMDRC.
Two anal prolegs, each ending with two claws
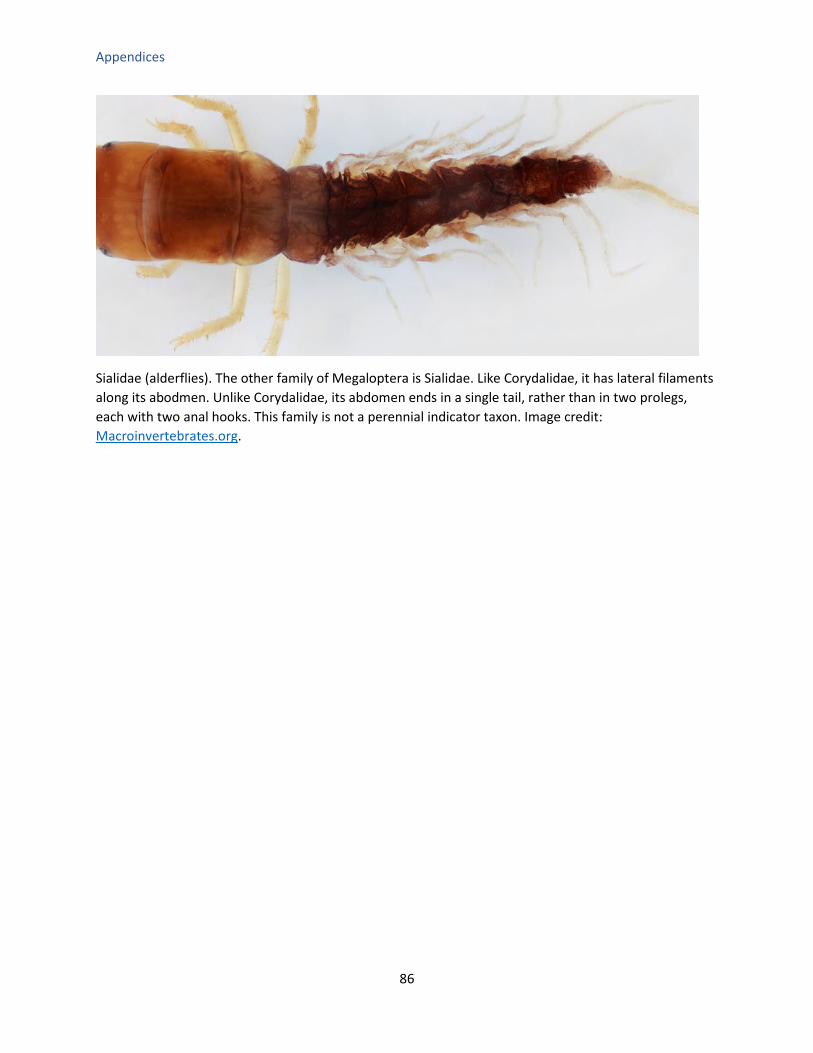
Appendices
86
Sialidae (alderflies). The other family of Megaloptera is Sialidae. Like Corydalidae, it has lateral filaments along its abodmen. Unlike Corydalidae, its abdomen ends in a single tail, rather than in two prolegs, each with two anal hooks. This family is not a perennial indicator taxon. Image credit: Macroinvertebrates.org.
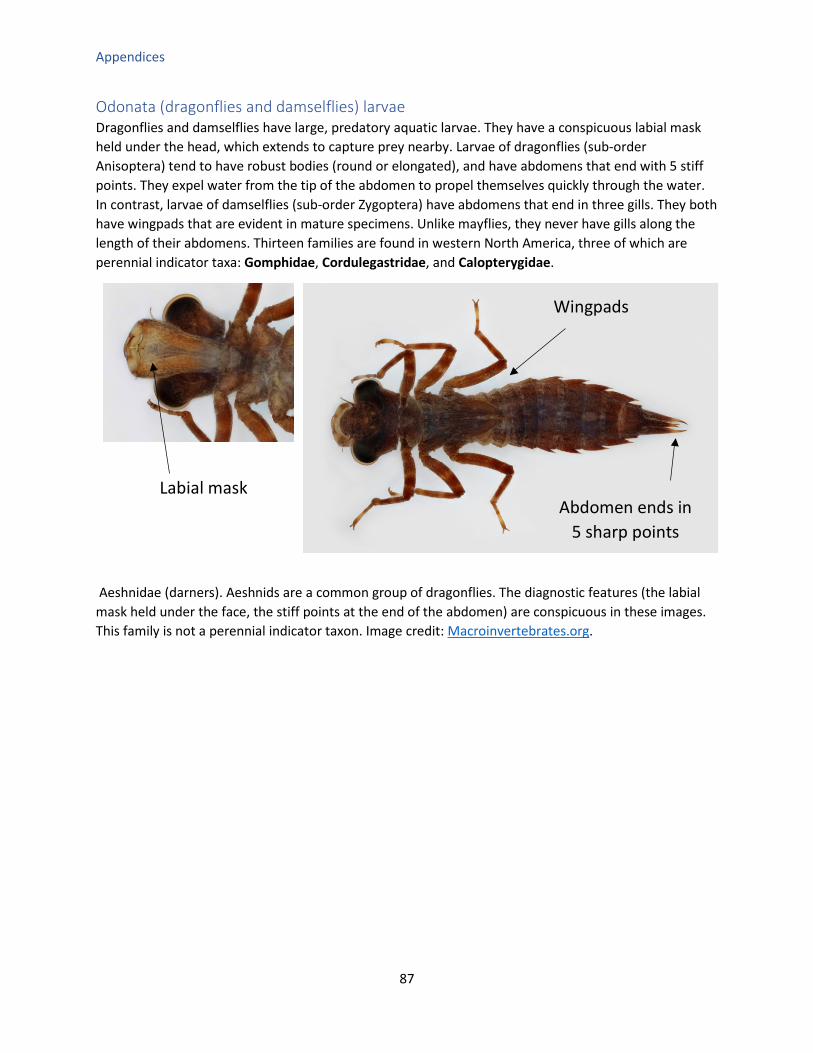
Appendices
87
Odonata (dragonflies and damselflies) larvae Dragonflies and damselflies have large, predatory aquatic larvae. They have a conspicuous labial mask held under the head, which extends to capture prey nearby. Larvae of dragonflies (sub-order Anisoptera) tend to have robust bodies (round or elongated), and have abdomens that end with 5 stiff points. They expel water from the tip of the abdomen to propel themselves quickly through the water. In contrast, larvae of damselflies (sub-order Zygoptera) have abdomens that end in three gills. They both have wingpads that are evident in mature specimens. Unlike mayflies, they never have gills along the length of their abdomens. Thirteen families are found in western North America, three of which are perennial indicator taxa: Gomphidae, Cordulegastridae, and Calopterygidae.
Aeshnidae (darners). Aeshnids are a common group of dragonflies. The diagnostic features (the labial mask held under the face, the stiff points at the end of the abdomen) are conspicuous in these images. This family is not a perennial indicator taxon. Image credit: Macroinvertebrates.org.
Labial mask Abdomen ends in
5 sharp points
Wingpads

Appendices
88
Gomphidae (clubtail dragonflies). This family is distinguished by its short, 4-segmented antennae, the third of which is much larger than all the other segments (the final segment may be very small). The labial mask is relatively flat. This family is a perennial indicator taxon. Image credit: Macroinvertebrates.org.
3rd segment of antennae greatly enlarged
Abdomen ends in 5 sharp points
Wingpads
Flat labial mask
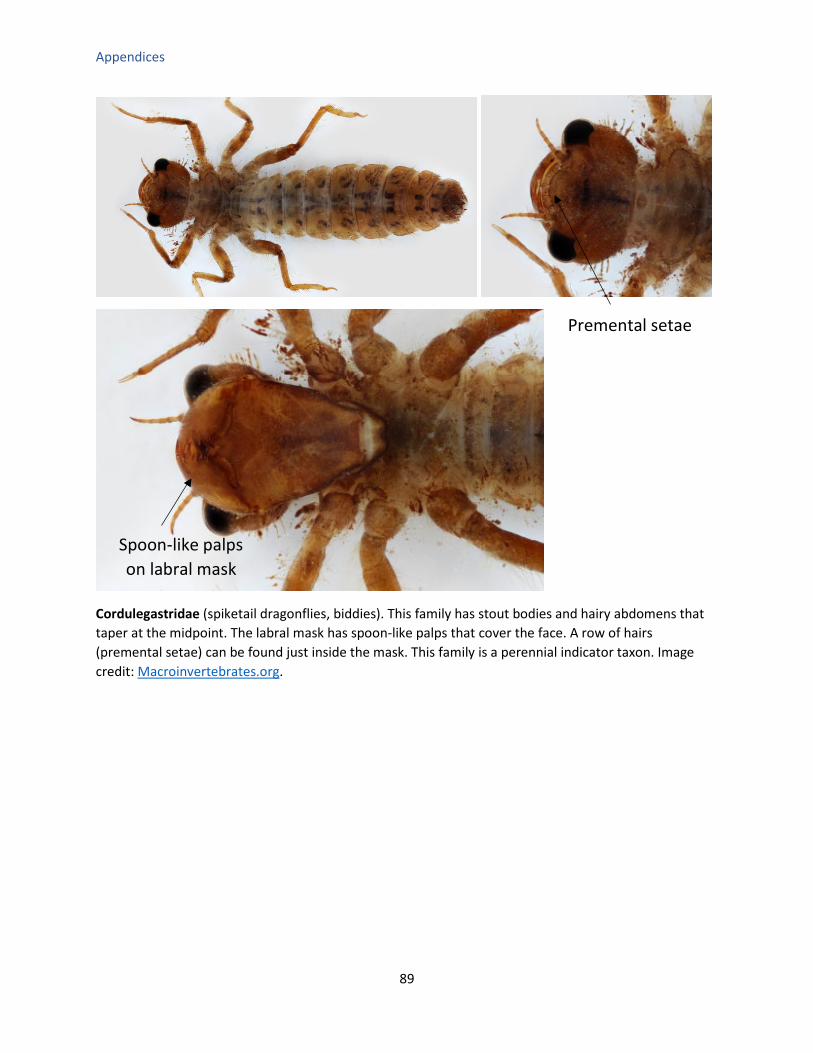
Appendices
89
Cordulegastridae (spiketail dragonflies, biddies). This family has stout bodies and hairy abdomens that taper at the midpoint. The labral mask has spoon-like palps that cover the face. A row of hairs (premental setae) can be found just inside the mask. This family is a perennial indicator taxon. Image credit: Macroinvertebrates.org.
Spoon-like palps on labral mask
Premental setae
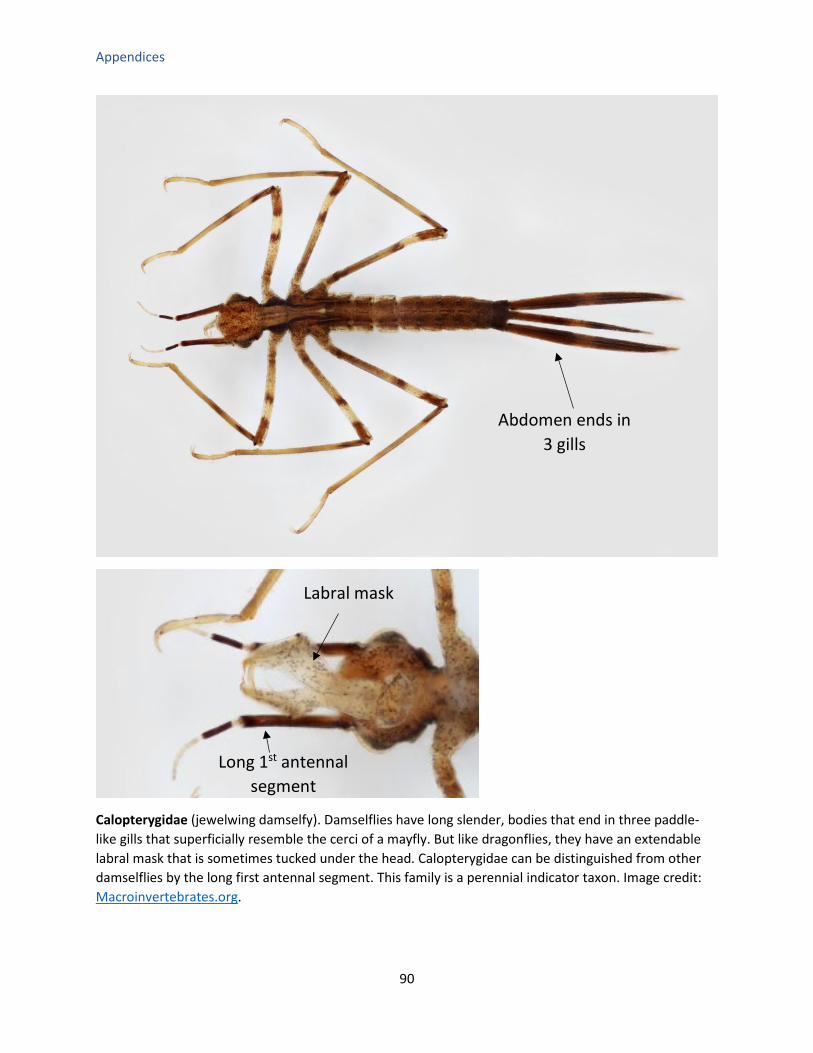
Appendices
90
Calopterygidae (jewelwing damselfy). Damselflies have long slender, bodies that end in three paddle-like gills that superficially resemble the cerci of a mayfly. But like dragonflies, they have an extendable labral mask that is sometimes tucked under the head. Calopterygidae can be distinguished from other damselflies by the long first antennal segment. This family is a perennial indicator taxon. Image credit: Macroinvertebrates.org.
Labral mask
Long 1st antennal segment
Abdomen ends in 3 gills
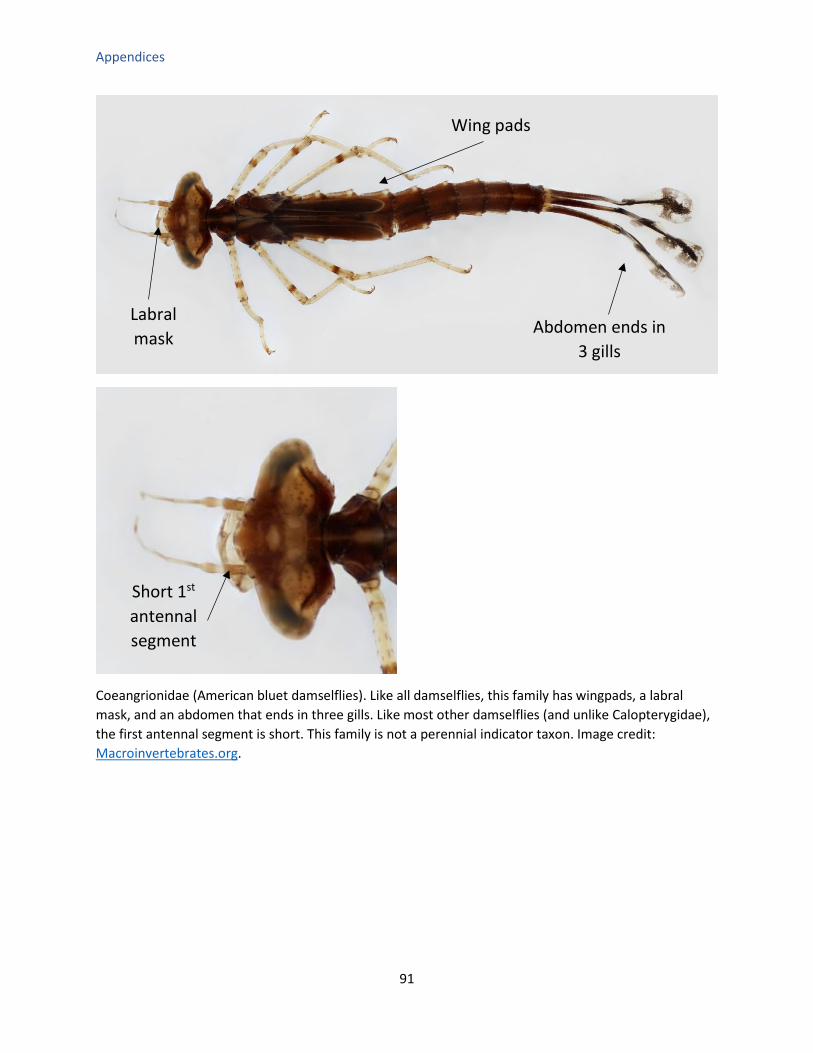
Appendices
91
Coeangrionidae (American bluet damselflies). Like all damselflies, this family has wingpads, a labral mask, and an abdomen that ends in three gills. Like most other damselflies (and unlike Calopterygidae), the first antennal segment is short. This family is not a perennial indicator taxon. Image credit: Macroinvertebrates.org.
Abdomen ends in 3 gills
Wing pads
Labral mask
Short 1st antennal segment
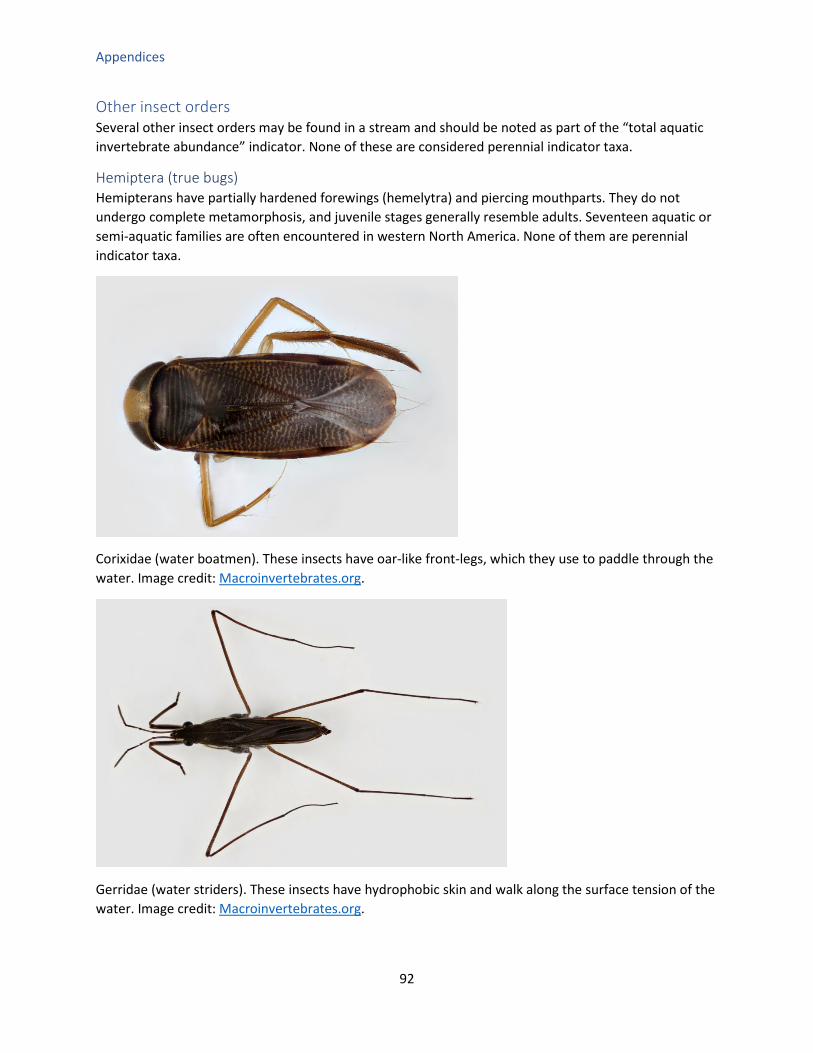
Appendices
92
Other insect orders Several other insect orders may be found in a stream and should be noted as part of the “total aquatic invertebrate abundance” indicator. None of these are considered perennial indicator taxa.
Hemiptera (true bugs) Hemipterans have partially hardened forewings (hemelytra) and piercing mouthparts. They do not undergo complete metamorphosis, and juvenile stages generally resemble adults. Seventeen aquatic or semi-aquatic families are often encountered in western North America. None of them are perennial indicator taxa.
Corixidae (water boatmen). These insects have oar-like front-legs, which they use to paddle through the water. Image credit: Macroinvertebrates.org.
Gerridae (water striders). These insects have hydrophobic skin and walk along the surface tension of the water. Image credit: Macroinvertebrates.org.

Appendices
93
Diptera (true flies) Dipterans are a diverse group of insects that undergo direct metamorphosis. 26 families with aquatic or semi-aquatic larval stages are found in western North America, and a few have aquatic pupal phases too. Numerous dipteran families are terrestrial, and some families with aquatic taxa may also include terrestrial species (e.g., Tipulidae, or crane flies). Aquatic dipteran larvae are soft-bodied and legless (although they may have unsegmented leg-like appendages called prolegs). Some families have conspicuous head capsules (e.g., Simuliidae, or black flies), while others have inconspicuous heads that are withdrawn into the thorax (e.g., Ephydridae, or shore flies).
Chironomidae (non-biting midges). Chironomidae are among the most numerous and widespread aquatic invertebrates in water bodies. While they are often small, some species are several centimeters in length. Some species have hemoglobin pigments to help them extract oxygen from hypoxic water, giving them a blood-red appearance. They have a distinct head capsule, a c-shaped body, and prolegs on the thorax and abdomen (anal prolegs). Several species are found in tubes of silk lined with silt and muck. This family is not a perennial indicator taxon. Image credit: Top row: Macroinvertebrates.org. Bottom row: CADFW.
Anal prolegs
Thoracic proleg
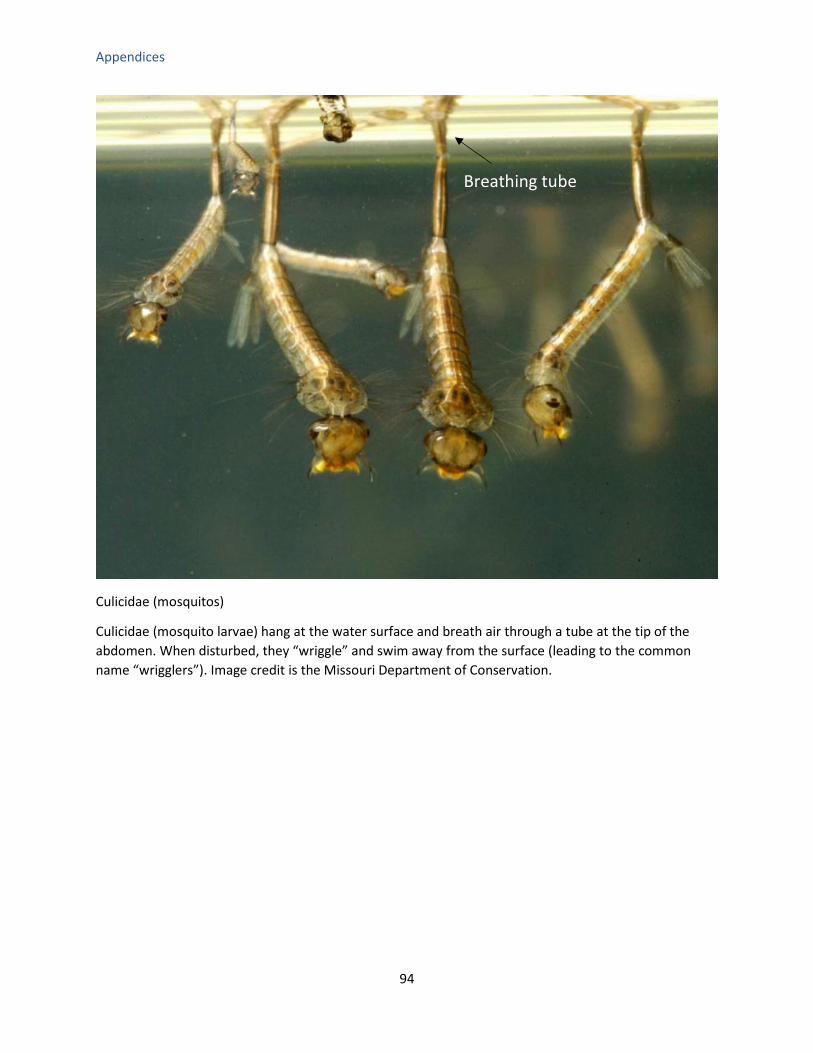
Appendices
94
Culicidae (mosquitos)
Culicidae (mosquito larvae) hang at the water surface and breath air through a tube at the tip of the abdomen. When disturbed, they “wriggle” and swim away from the surface (leading to the common name “wrigglers”). Image credit is the Missouri Department of Conservation.
Breathing tube

Appendices
95
Simuliidae (black flies). This family is common in fast-flowing microhabitats, such as riffles and cascades. The base of their abdomen is swollen, giving them a “bowling pin” appearance, and they have two labral fans they use to filter particles from the stream. They spin silk and use it grasp onto substrates with a “crochet” of hooks at the tip of the abdomen. This family is not a perennial indicator taxon. Image credit: Macroinvertebrates.org.
Tipulidae (crane flies). Larvae of this family are sometimes the largest aquatic insects encountered in a stream. They are legless, appear to be headless (the head is withdrawn into the body), and have conspicuous lobed spiracles at the end of the abdomen. This family is not a perennial indicator taxon. Image credit: Macroinvertebrates.org.
Labral fan
Swollen abdomen
Crochet
Lobed spiracles
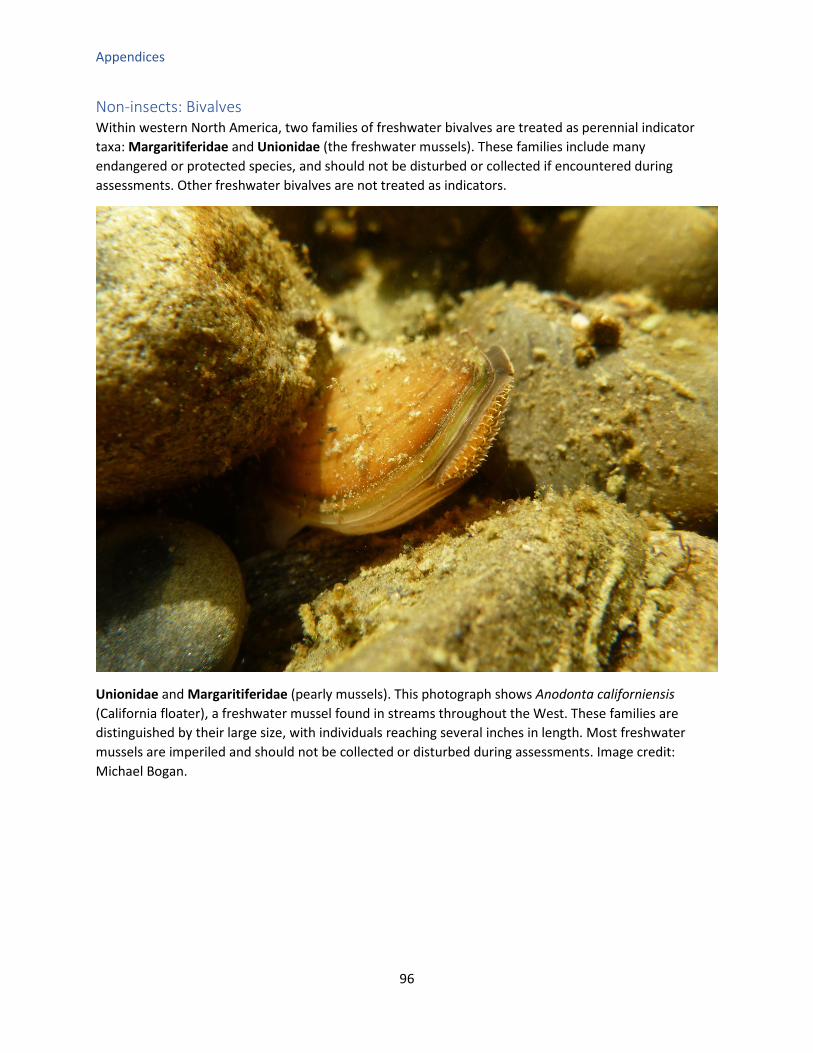
Appendices
96
Non-insects: Bivalves Within western North America, two families of freshwater bivalves are treated as perennial indicator taxa: Margaritiferidae and Unionidae (the freshwater mussels). These families include many endangered or protected species, and should not be disturbed or collected if encountered during assessments. Other freshwater bivalves are not treated as indicators.
Unionidae and Margaritiferidae (pearly mussels). This photograph shows Anodonta californiensis (California floater), a freshwater mussel found in streams throughout the West. These families are distinguished by their large size, with individuals reaching several inches in length. Most freshwater mussels are imperiled and should not be collected or disturbed during assessments. Image credit: Michael Bogan.

Appendices
97
Dreissenidae (zebra and quagga mussels). Two species of Dressenidae native to Europe have been introduced to North America where they have created major economic and environmental impacts due to their proliferation. If encountered, make sure to clean all gear before entering another waterbody to avoid further dispersal. Observations should be reported to the U.S. Geological Survey non-indigenous aquatic species reporting form (https://nas.er.usgs.gov/SightingReport.aspx). Dreissenids are primarily found in reservoirs and lakes, but may be found in larger rivers as well. They are typically under 1 inch long, and have conspicuous stripes. This family is a perennial indicator taxon. Image credit: Amy Benson, U.S. Geological Survey.
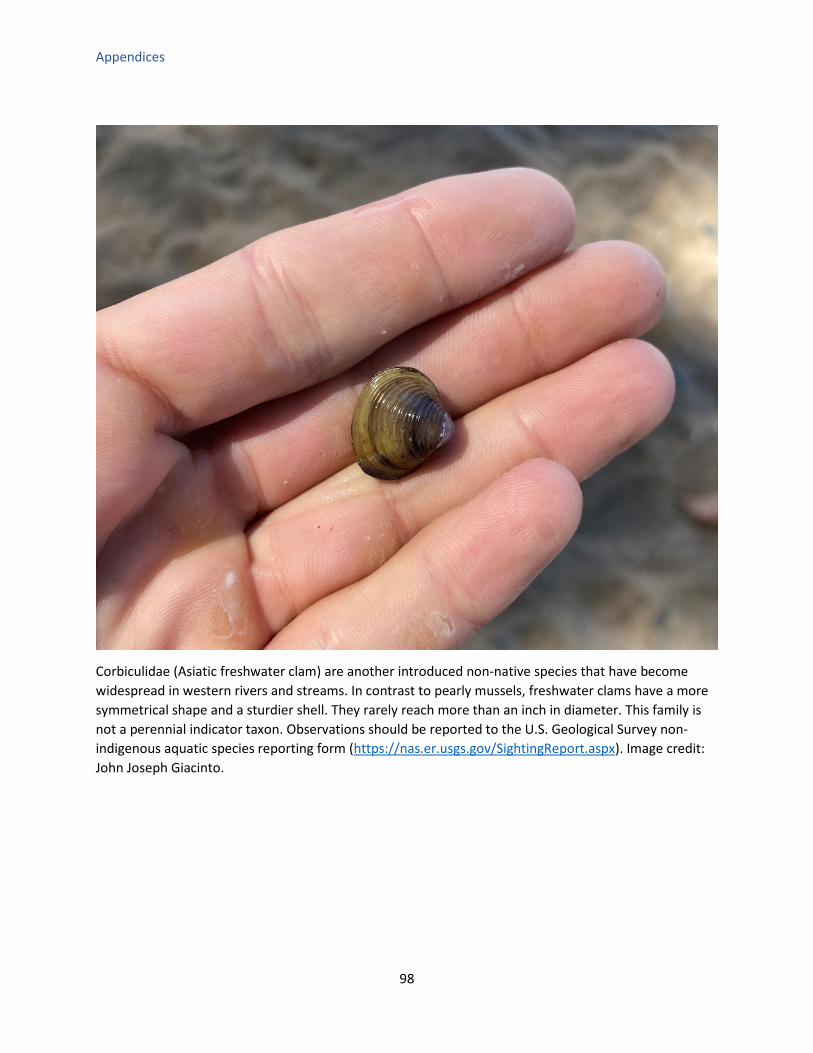
Appendices
98
Corbiculidae (Asiatic freshwater clam) are another introduced non-native species that have become widespread in western rivers and streams. In contrast to pearly mussels, freshwater clams have a more symmetrical shape and a sturdier shell. They rarely reach more than an inch in diameter. This family is not a perennial indicator taxon. Observations should be reported to the U.S. Geological Survey non-indigenous aquatic species reporting form (https://nas.er.usgs.gov/SightingReport.aspx). Image credit: John Joseph Giacinto.
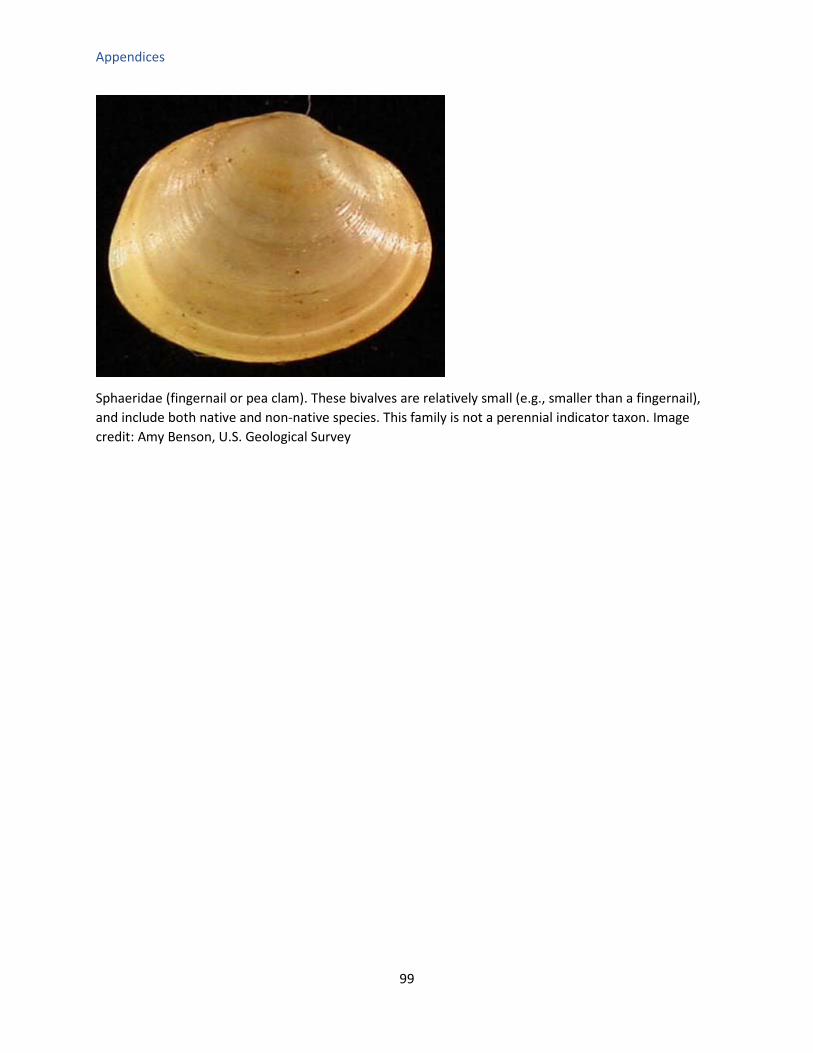
Appendices
99
Sphaeridae (fingernail or pea clam). These bivalves are relatively small (e.g., smaller than a fingernail), and include both native and non-native species. This family is not a perennial indicator taxon. Image credit: Amy Benson, U.S. Geological Survey
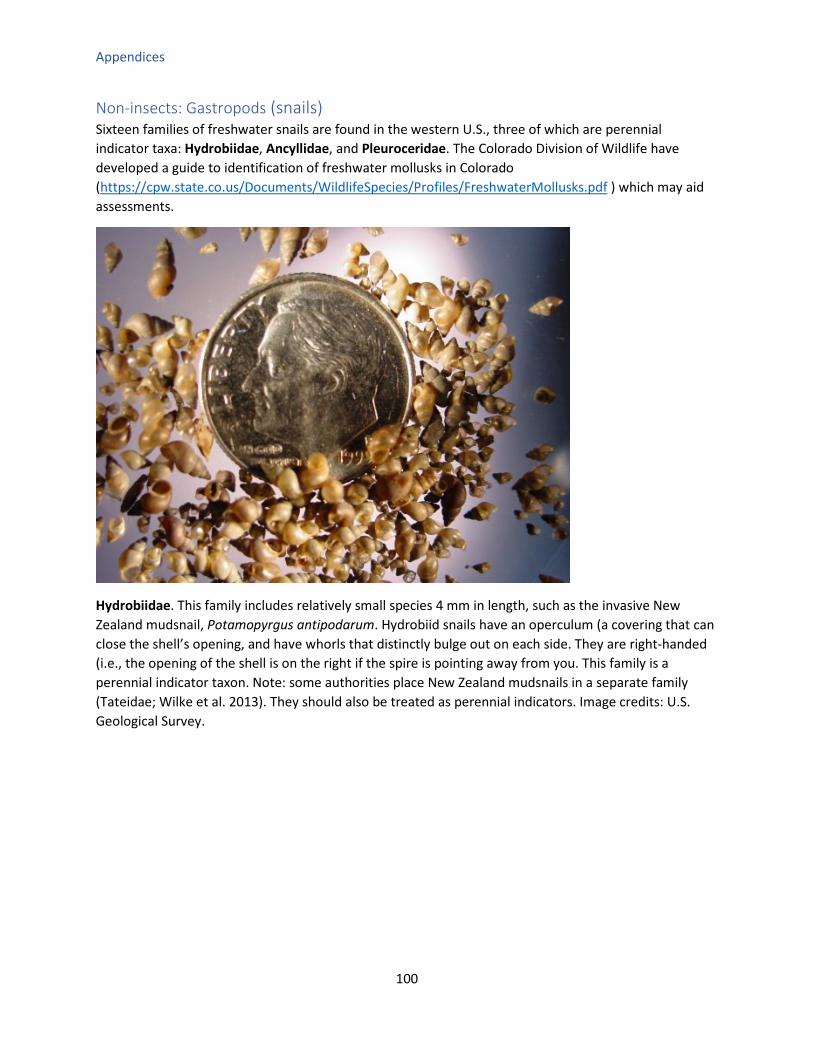
Appendices
100
Non-insects: Gastropods (snails) Sixteen families of freshwater snails are found in the western U.S., three of which are perennial indicator taxa: Hydrobiidae, Ancyllidae, and Pleuroceridae. The Colorado Division of Wildlife have developed a guide to identification of freshwater mollusks in Colorado (https://cpw.state.co.us/Documents/WildlifeSpecies/Profiles/FreshwaterMollusks.pdf ) which may aid assessments.
Hydrobiidae. This family includes relatively small species 4 mm in length, such as the invasive New Zealand mudsnail, Potamopyrgus antipodarum. Hydrobiid snails have an operculum (a covering that can close the shell’s opening, and have whorls that distinctly bulge out on each side. They are right-handed (i.e., the opening of the shell is on the right if the spire is pointing away from you. This family is a perennial indicator taxon. Note: some authorities place New Zealand mudsnails in a separate family (Tateidae; Wilke et al. 2013). They should also be treated as perennial indicators. Image credits: U.S. Geological Survey.
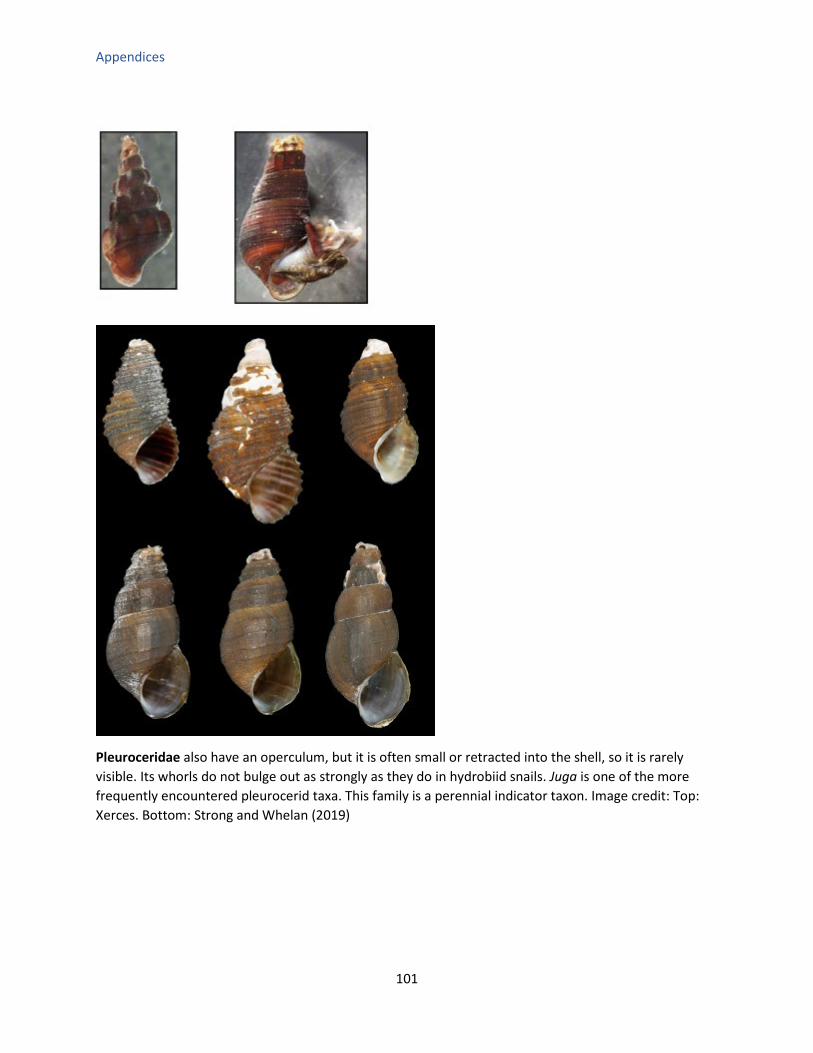
Appendices
101
Pleuroceridae also have an operculum, but it is often small or retracted into the shell, so it is rarely visible. Its whorls do not bulge out as strongly as they do in hydrobiid snails. Juga is one of the more frequently encountered pleurocerid taxa. This family is a perennial indicator taxon. Image credit: Top: Xerces. Bottom: Strong and Whelan (2019)
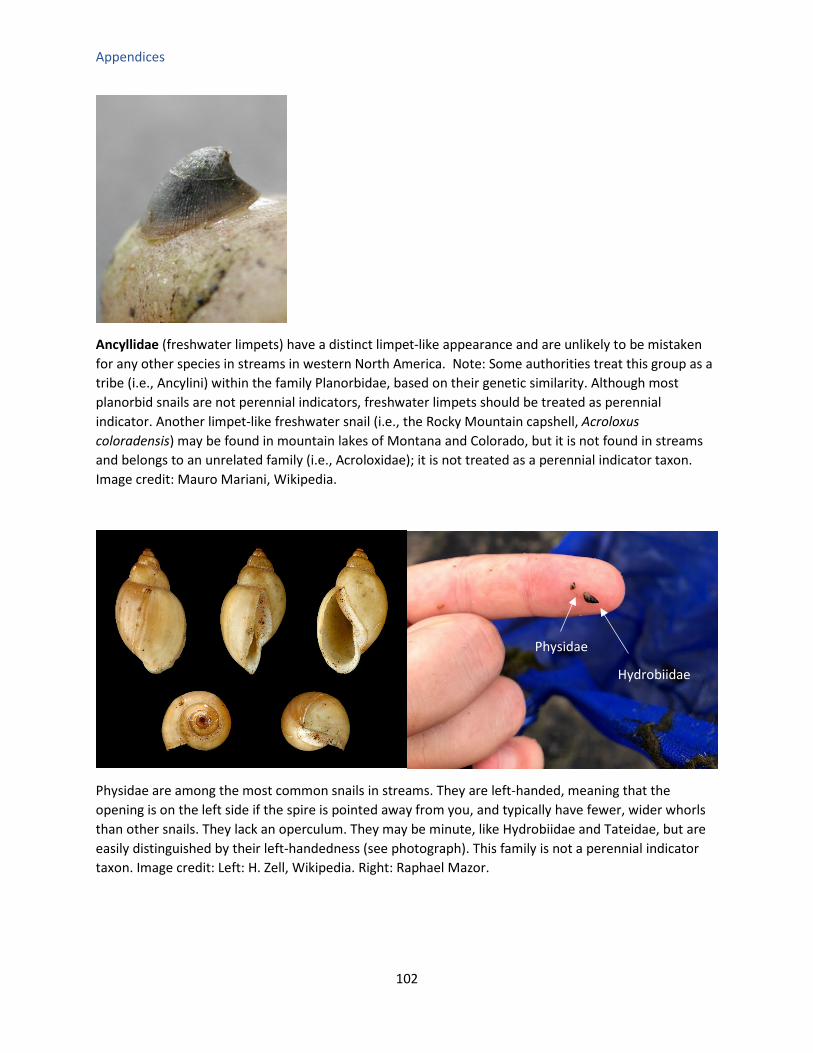
Appendices
102
Ancyllidae (freshwater limpets) have a distinct limpet-like appearance and are unlikely to be mistaken for any other species in streams in western North America. Note: Some authorities treat this group as a tribe (i.e., Ancylini) within the family Planorbidae, based on their genetic similarity. Although most planorbid snails are not perennial indicators, freshwater limpets should be treated as perennial indicator. Another limpet-like freshwater snail (i.e., the Rocky Mountain capshell, Acroloxus coloradensis) may be found in mountain lakes of Montana and Colorado, but it is not found in streams and belongs to an unrelated family (i.e., Acroloxidae); it is not treated as a perennial indicator taxon. Image credit: Mauro Mariani, Wikipedia.
Physidae are among the most common snails in streams. They are left-handed, meaning that the opening is on the left side if the spire is pointed away from you, and typically have fewer, wider whorls than other snails. They lack an operculum. They may be minute, like Hydrobiidae and Tateidae, but are easily distinguished by their left-handedness (see photograph). This family is not a perennial indicator taxon. Image credit: Left: H. Zell, Wikipedia. Right: Raphael Mazor.
Hydrobiidae
Physidae
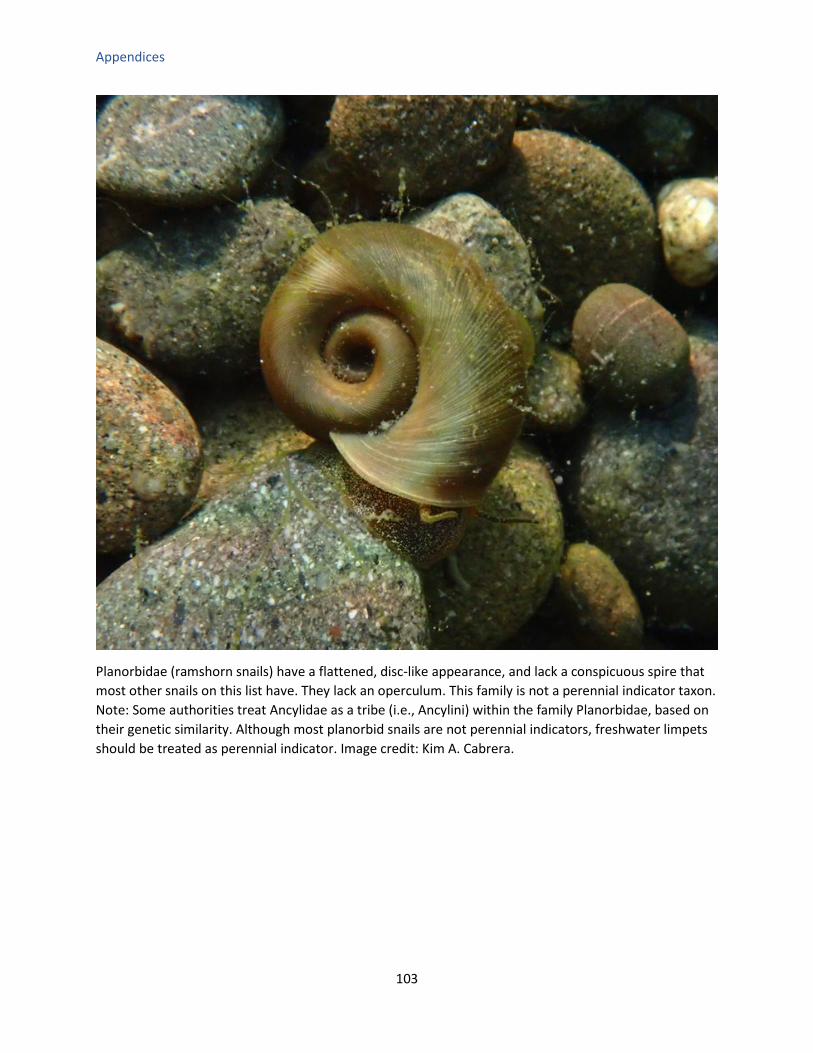
Appendices
103
Planorbidae (ramshorn snails) have a flattened, disc-like appearance, and lack a conspicuous spire that most other snails on this list have. They lack an operculum. This family is not a perennial indicator taxon. Note: Some authorities treat Ancylidae as a tribe (i.e., Ancylini) within the family Planorbidae, based on their genetic similarity. Although most planorbid snails are not perennial indicators, freshwater limpets should be treated as perennial indicator. Image credit: Kim A. Cabrera.
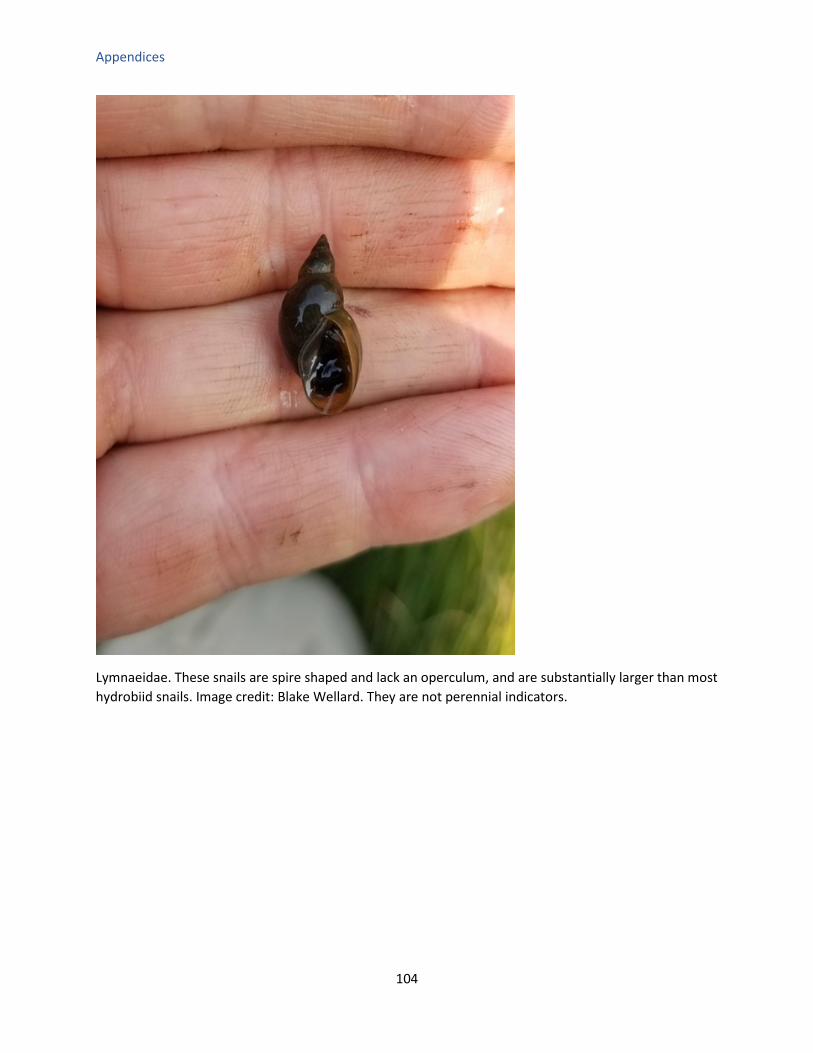
Appendices
104
Lymnaeidae. These snails are spire shaped and lack an operculum, and are substantially larger than most hydrobiid snails. Image credit: Blake Wellard. They are not perennial indicators.

Appendices
Appendix C. Field Forms
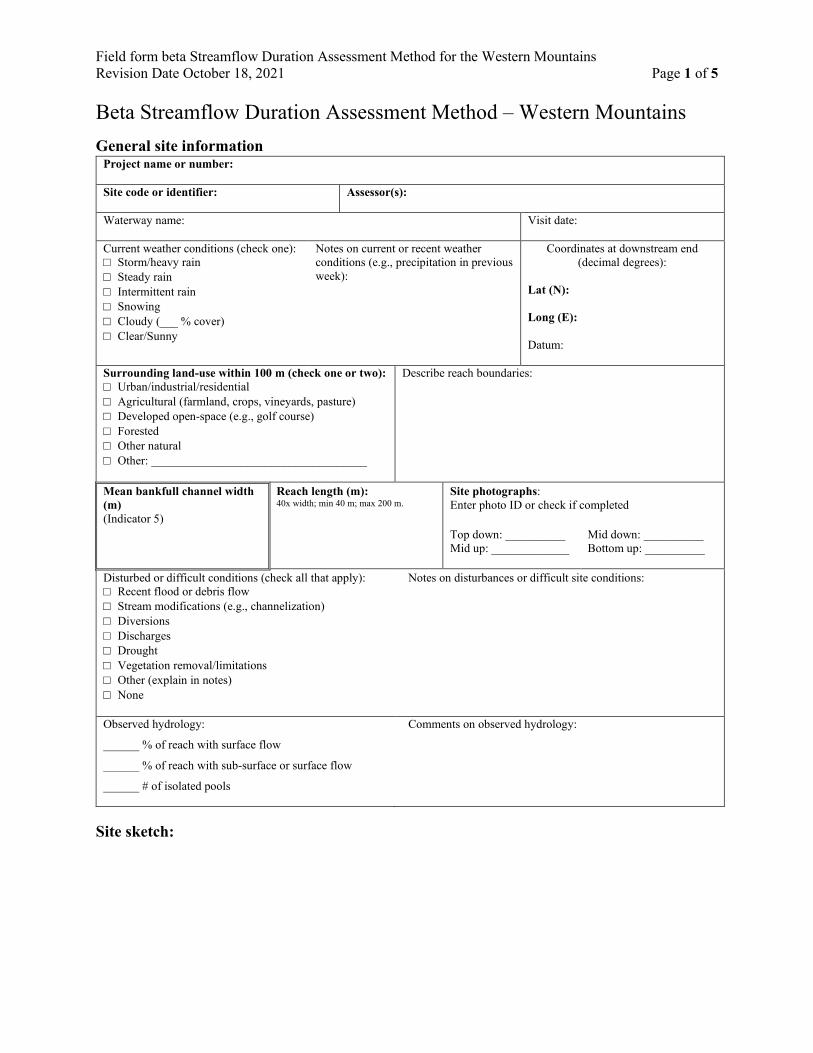
Field form beta Streamflow Duration Assessment Method for the Western Mountains Revision Date October 18, 2021 Page 1 of 5
Beta Streamflow Duration Assessment Method – Western Mountains General site information
Project name or number: Site code or identifier:
Assessor(s):
Waterway name:
Visit date:
Current weather conditions (check one): □ Storm/heavy rain □ Steady rain □ Intermittent rain □ Snowing □ Cloudy (___ % cover) □ Clear/Sunny
Notes on current or recent weather conditions (e.g., precipitation in previous week):
Coordinates at downstream end (decimal degrees):
Lat (N): Long (E): Datum:
Surrounding land-use within 100 m (check one or two): □ Urban/industrial/residential □ Agricultural (farmland, crops, vineyards, pasture) □ Developed open-space (e.g., golf course) □ Forested □ Other natural □ Other: ____________________________________
Describe reach boundaries:
Mean bankfull channel width (m) (Indicator 5)
Reach length (m): 40x width; min 40 m; max 200 m.
Site photographs: Enter photo ID or check if completed Top down: __________ Mid up: _____________
Mid down: __________ Bottom up: __________
Disturbed or difficult conditions (check all that apply): □ Recent flood or debris flow □ Stream modifications (e.g., channelization) □ Diversions □ Discharges □ Drought □ Vegetation removal/limitations □ Other (explain in notes) □ None
Notes on disturbances or difficult site conditions:
Observed hydrology:
______ % of reach with surface flow
______ % of reach with sub-surface or surface flow
______ # of isolated pools
Comments on observed hydrology:
Site sketch:
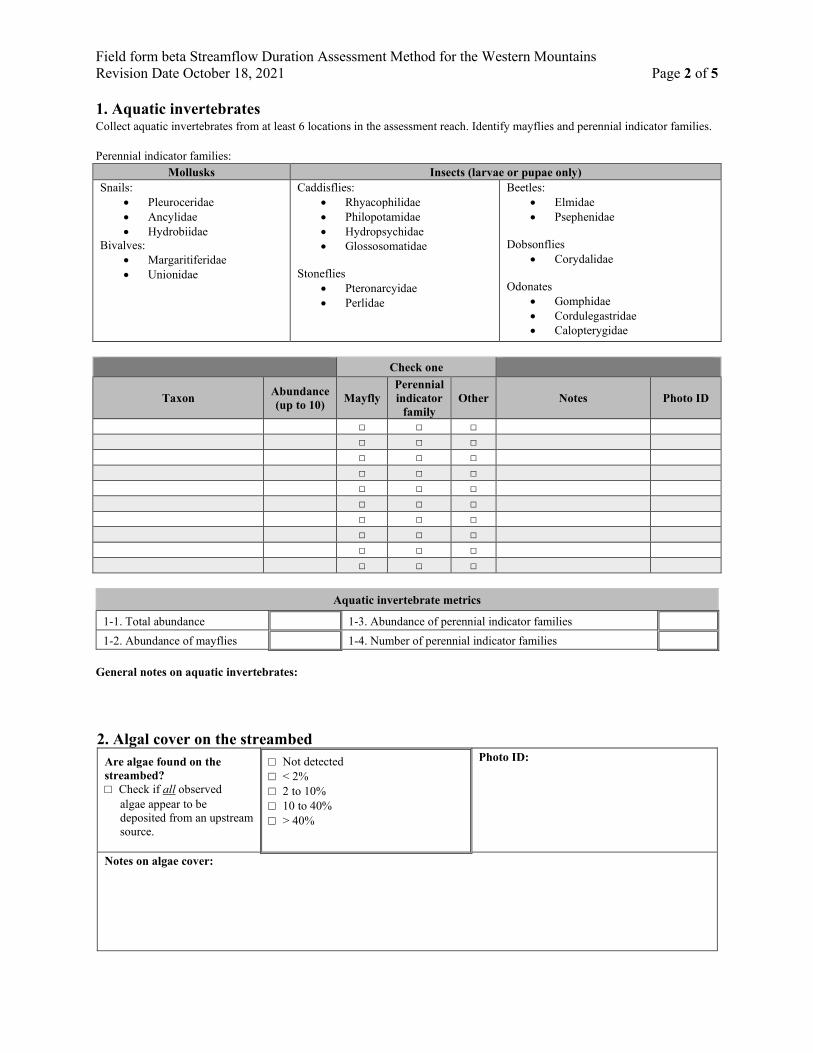
Field form beta Streamflow Duration Assessment Method for the Western Mountains Revision Date October 18, 2021 Page 2 of 5
1. Aquatic invertebrates Collect aquatic invertebrates from at least 6 locations in the assessment reach. Identify mayflies and perennial indicator families. Perennial indicator families:
Mollusks Insects (larvae or pupae only) Snails:
• Pleuroceridae • Ancylidae • Hydrobiidae
Bivalves: • Margaritiferidae • Unionidae
Caddisflies: • Rhyacophilidae • Philopotamidae • Hydropsychidae • Glossosomatidae
Stoneflies
• Pteronarcyidae • Perlidae
Beetles: • Elmidae • Psephenidae
Dobsonflies
• Corydalidae Odonates
• Gomphidae • Cordulegastridae • Calopterygidae
Check one
Taxon Abundance (up to 10) Mayfly
Perennial indicator
family Other Notes Photo ID
□ □ □ □ □ □ □ □ □ □ □ □ □ □ □ □ □ □ □ □ □ □ □ □ □ □ □ □ □ □
Aquatic invertebrate metrics
1-1. Total abundance 1-3. Abundance of perennial indicator families
1-2. Abundance of mayflies 1-4. Number of perennial indicator families General notes on aquatic invertebrates:
2. Algal cover on the streambed
Are algae found on the streambed? □ Check if all observed
algae appear to be deposited from an upstream source.
□ Not detected □ < 2% □ 2 to 10% □ 10 to 40% □ > 40%
Photo ID:
Notes on algae cover:
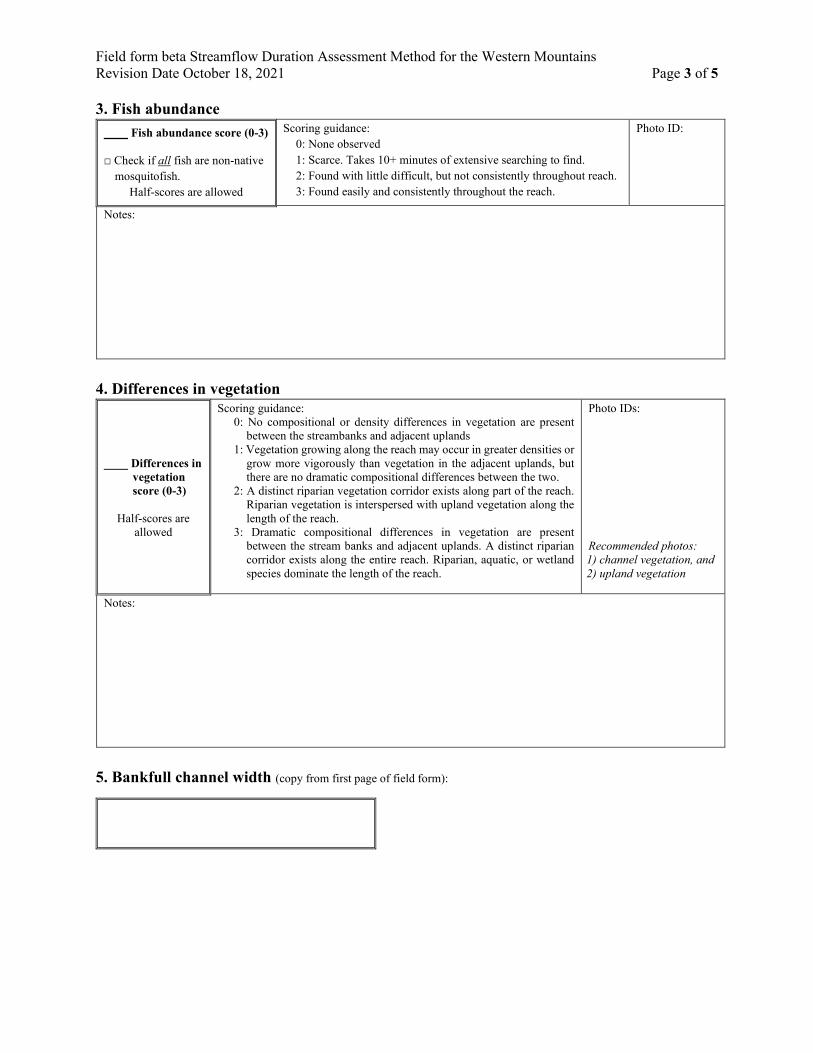
Field form beta Streamflow Duration Assessment Method for the Western Mountains Revision Date October 18, 2021 Page 3 of 5
3. Fish abundance ____ Fish abundance score (0-3) □ Check if all fish are non-native
mosquitofish. Half-scores are allowed
Scoring guidance: 0: None observed 1: Scarce. Takes 10+ minutes of extensive searching to find. 2: Found with little difficult, but not consistently throughout reach. 3: Found easily and consistently throughout the reach.
Photo ID:
Notes:
4. Differences in vegetation
____ Differences in vegetation score (0-3)
Half-scores are
allowed
Scoring guidance: 0: No compositional or density differences in vegetation are present
between the streambanks and adjacent uplands 1: Vegetation growing along the reach may occur in greater densities or
grow more vigorously than vegetation in the adjacent uplands, but there are no dramatic compositional differences between the two.
2: A distinct riparian vegetation corridor exists along part of the reach. Riparian vegetation is interspersed with upland vegetation along the length of the reach.
3: Dramatic compositional differences in vegetation are present between the stream banks and adjacent uplands. A distinct riparian corridor exists along the entire reach. Riparian, aquatic, or wetland species dominate the length of the reach.
Photo IDs: Recommended photos: 1) channel vegetation, and 2) upland vegetation
Notes:
5. Bankfull channel width (copy from first page of field form):
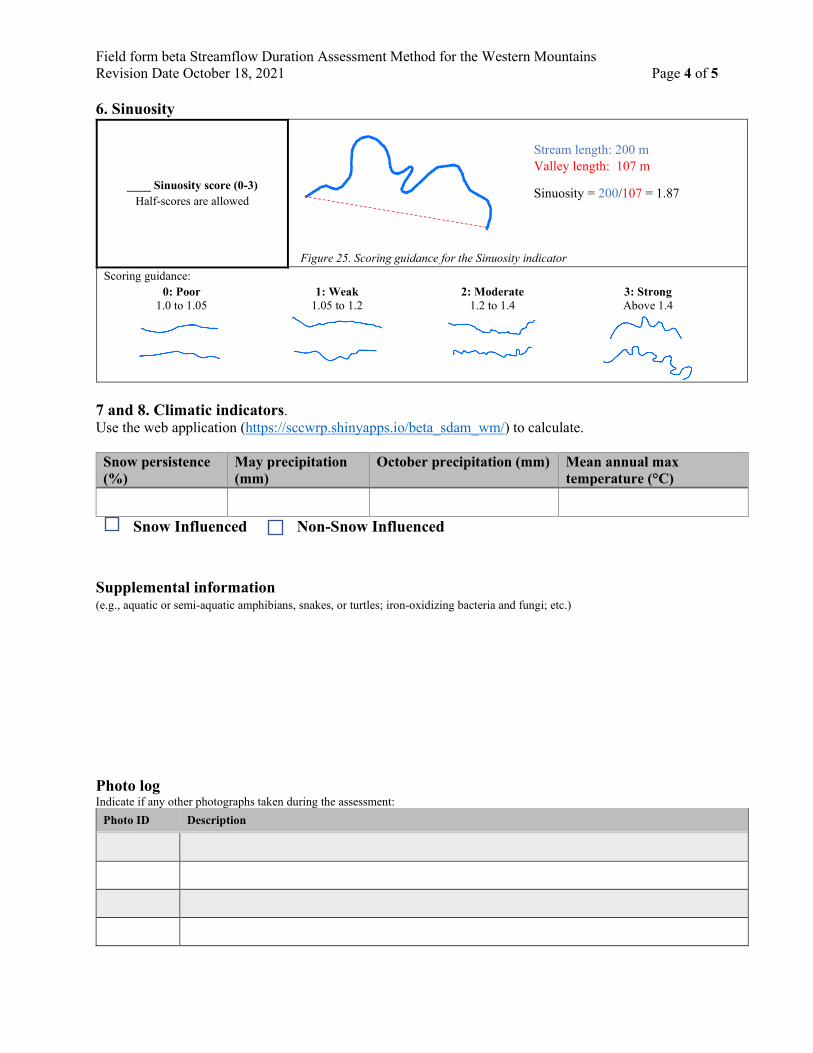
Field form beta Streamflow Duration Assessment Method for the Western Mountains Revision Date October 18, 2021 Page 4 of 5
6. Sinuosity
____ Sinuosity score (0-3) Half-scores are allowed
Figure 25. Scoring guidance for the Sinuosity indicator
Scoring guidance: 0: Poor
1.0 to 1.05 1: Weak
1.05 to 1.2 2: Moderate
1.2 to 1.4 3: Strong Above 1.4
7 and 8. Climatic indicators. Use the web application (https://sccwrp.shinyapps.io/beta_sdam_wm/) to calculate.
Snow persistence (%)
May precipitation (mm)
October precipitation (mm) Mean annual max temperature (°C)
Snow Influenced Non-Snow Influenced
Supplemental information (e.g., aquatic or semi-aquatic amphibians, snakes, or turtles; iron-oxidizing bacteria and fungi; etc.)
Photo log Indicate if any other photographs taken during the assessment:
Photo ID Description
Stream length: 200 m Valley length: 107 m
Sinuosity = 200/107 = 1.87

Field form beta Streamflow Duration Assessment Method for the Western Mountains Revision Date October 18, 2021 Page 5 of 5
Additional notes about the assessment:
Model Classification:
Ephemeral
At least intermittent
Intermittent
Perennial
Related Documents