Page 1 of 32 Printed January 31, 2022 BEST’S RATING REPORT LEGAL & GENERAL GROUP PLC Domiciliary Address: One Coleman Street, London EC2R 5AA, United Kingdom AMB #: 086120 NAIC #: N/A FEIN #: N/A Phone: 44-020-3124-2000 Fax: 44-020-3124-2500 Website: www.legalandgeneralgroup.com BANNER LIFE INSURANCE COMPANY A+ Domiciliary Address: 3275 Bennett Creek Avenue, Frederick, Maryland 21704 United States AMB #: 006468 NAIC #: 94250 FEIN #: 52-1236145 Phone: +1-301-279-4800 Fax: +1-301-279-4178 Website: www.lgamerica.com WILLIAM PENN LIFE INSURANCE COMPANY OF NEW YORK A+ Domiciliary Address: 70 E. Sunrise Highway, Suite 500, Valley Stream, New York 11581 United States Administrative Office: 3275 Bennett Creek Avenue, Frederick, Maryland 21704 United States AMB #: 006734 NAIC #: 66230 FEIN #: 13-1976260 Phone: +1-516-794-3700 Fax: +1-301-279-4178 Website: www.LGAmerica.com

Welcome message from author
This document is posted to help you gain knowledge. Please leave a comment to let me know what you think about it! Share it to your friends and learn new things together.
Transcript
BEST’S RATING REPORT
Page 1 of 32 Printed January 31, 2022
BEST’S RATING REPORTBEST’S RATING REPORT
LEGAL & GENERAL GROUP PLCDomiciliary Address: One Coleman Street, London EC2R 5AA, United KingdomAMB #: 086120 NAIC #: N/A FEIN #: N/APhone: 44-020-3124-2000 Fax: 44-020-3124-2500 Website: www.legalandgeneralgroup.com
BANNER LIFE INSURANCE COMPANY A+Domiciliary Address: 3275 Bennett Creek Avenue, Frederick, Maryland 21704 United StatesAMB #: 006468 NAIC #: 94250 FEIN #: 52-1236145Phone: +1-301-279-4800 Fax: +1-301-279-4178 Website: www.lgamerica.com
WILLIAM PENN LIFE INSURANCE COMPANY OF NEW YORK A+Domiciliary Address: 70 E. Sunrise Highway, Suite 500, Valley Stream, New York 11581 United StatesAdministrative Office: 3275 Bennett Creek Avenue, Frederick, Maryland 21704 United StatesAMB #: 006734 NAIC #: 66230 FEIN #: 13-1976260Phone: +1-516-794-3700 Fax: +1-301-279-4178 Website: www.LGAmerica.com
Page 2 of 32 Printed January 31, 2022
BEST’S RATING REPORT
Best's Credit Rating Effective DateDecember 03, 2021
Analytical ContactsStanislav Stoev, ACCAFinancial [email protected]+44 207 626 6264
Ghislain Le Cam, [email protected]+44 207 397 0268
InformationBest's Credit Rating Methodology
Guide to Best's Credit Ratings
Market Segment Outlooks
Financial Data PresentedThe financial data in this report reflects themost current data available to the AnalyticalTeam at the time of the rating. Updates tothe financial exhibits in this report areavailable here: Best's Financial Report.
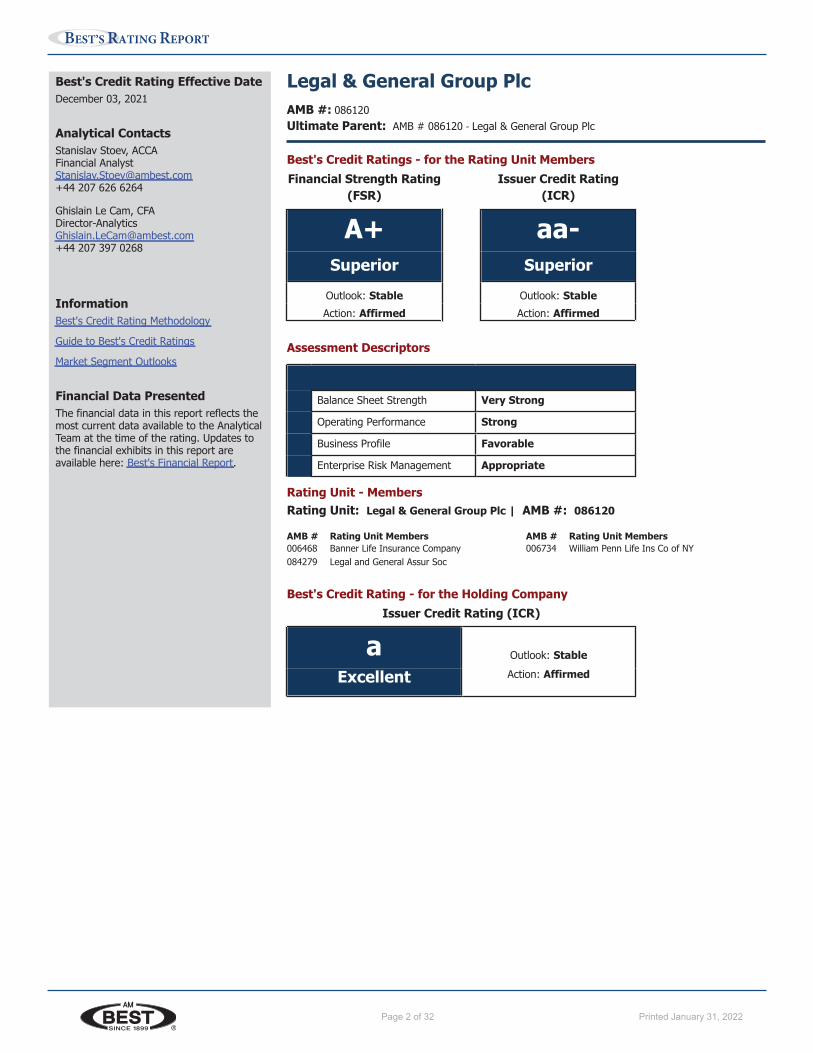
Legal & General Group PlcAMB #: 086120Ultimate Parent: AMB # 086120 - Legal & General Group Plc
Best's Credit Ratings - for the Rating Unit MembersFinancial Strength Rating Issuer Credit Rating
(FSR) (ICR)
A+ aa-Superior Superior
Outlook: Stable Outlook: StableAction: Affirmed Action: Affirmed
Assessment Descriptors
Balance Sheet Strength Very Strong
Operating Performance Strong
Business Profile Favorable
Enterprise Risk Management Appropriate
Rating Unit - MembersRating Unit: Legal & General Group Plc | AMB #: 086120
AMB # Rating Unit Members006468 Banner Life Insurance Company084279 Legal and General Assur Soc
AMB # Rating Unit Members006734 William Penn Life Ins Co of NY
Best's Credit Rating - for the Holding CompanyIssuer Credit Rating (ICR)
a Outlook: Stable
Excellent Action: Affirmed
www.ambest.com Page 2Printed for Bcrs on January 10, 2022
Page 3 of 32 Printed January 31, 2022
BEST’S RATING REPORT
Rating Rationale - for the Rating Unit MembersThe Issuer Credit Ratings and Financial Strength Ratings of the member operating companies of the rating unit are determined inaccordance with Best's building block rating methodology as applied to the consolidated group's financial statements, and thesupporting analytics and results are described in the following sections of this report.
Balance Sheet Strength: Very Strong• Legal & General Group Plc's (L&G) consolidated risk-adjusted capitalisation, as measured by Best's Capital Adequacy Ratio
(BCAR), is assessed to be at the strongest level.• Pension risk transfer volumes are still high in the UK at a time when the group is also expanding in other territories; nonetheless,
the prospective BCAR scores are expected to remain supportive of the strongest assessment.• Moderate financial leverage and good interest coverage ratios are considered in the assessment. The group is expected to
decrease its leverage through continued internal capital generation.
Operating Performance: Strong• Track record of strong operating performance, evidenced by a five-year average weighted return on equity (ROE) of 20.4% at
the end of 2020. The profitability of the annuity business and the contributions from investment management have been themain drivers of high ROEs over the period.
• Operating performance is expected to remain strong, supported by the group’s excellent market positions in its core products inthe United Kingdom and the United States, growth in its pension risk transfer business, and careful management of itsinvestment portfolio, with close matching of liabilities.
• L&G's growth in workplace pensions, both in the UK and the US, is expected to more than offset declines from UK pensionsassets becoming mature and/or being subject to bulk annuity transactions.
Business Profile: Favorable• L&G holds a leading UK market position in its product range across bulk annuities, protection and pension fund investment
management due to the accumulated volume and its sophisticated management of these products.• The group benefits from a strong diversification of earnings with a strong positioning throughout the life insurance value chain.
• Scale of operations and strong positive cash flows from asset management activity enhance the group's ability to be competitivein annuity products.
• An expanding commitment to socially responsible longer-term investments, including construction phase real estatedevelopment, is part of L&G’s strategy, providing a competitive advantage for the bulk annuity activity.
Enterprise Risk Management: Appropriate• L&G has a well-developed risk management framework with appropriate practices in place.
• The group's risk management capabilities are appropriate given the inherent risks in L&G's product profile, which principallyreside in the group's annuity book. In selling bulk annuity products, the group takes on longevity and investment return risks.Real assets are held for asset/liability matching purposes and are a part of the group's strategy to meet return objectives.
• The group's longevity risks are partly diversified by mortality-based products and the successful Investment Managementdivision.
• In AM Best's view, the group's credit, investment and longevity risks are effectively managed. Severe investment stress scenariosare likely to present the greatest test for the group's ERM although the group has demonstrated its resilience through theCOVID-19 pandemic.
Outlook• The stable outlooks reflect AM Best's expectation that the group's risk-adjusted capitalisation will remain at the strongest level,
as measured by BCAR, supported by strong operating performance over the economic cycle and resilient business strategyfocused on strong positioning throughout the life insurance value chain.
Rating Drivers• Positive rating action could occur if the group were to demonstrate very strong profitability through the economic cycle.
• Negative rating pressure could result from regulatory changes or a sudden deterioration in economic conditions in Legal &General Group Plc's core markets of the UK and the US.
AMB #: 086120 - Legal & General Group Plc
www.ambest.com Page 3Printed for Bcrs on January 10, 2022
Page 4 of 32 Printed January 31, 2022
BEST’S RATING REPORT
• Negative rating pressure could also emanate from a marked decline in the group's risk-adjusted capitalisation or a persistentdeterioration in operating performance.
Rating Rationale - for the Holding CompanyThe rating of the holding company is determined by reference to the Issuer Credit Rating (ICR) of the operating insurance companymembers. It reflects consideration of holding company sources and uses of cash, the competing demands placed upon holdingcompany resources and normal subordination of holding company creditors to claims of the policyholders of the operating insurancecompanies. In general, therefore, the holding company's Issuer Credit Rating is notched from those assigned to the operatingcompanies of the rating unit.
Key Financial IndicatorsBest's Capital Adequacy Ratio (BCAR) Scores (%)Confidence Level 95.0 99.0 99.5 99.6BCAR Score 60.3 46.3 41.6 40.5Source: Best's Capital Adequacy Ratio Model - Universal
Key Financial Indicators2020
GBP (000)2019
GBP (000)2018
GBP (000)2017
GBP (000)2016
GBP (000)Net Premiums Written:
Life 9,358,000 11,751,000 10,729,000 5,705,000 8,358,000Non-Life ... ... ... 369,000 326,000Composite 9,358,000 11,751,000 10,729,000 6,074,000 8,684,000
Net Income 1,571,000 1,810,000 1,808,000 1,902,000 1,265,000Total Assets 570,565,000 560,736,000 492,517,000 504,352,000 467,854,000Total Capital and Surplus 9,966,000 9,093,000 8,652,000 7,592,000 7,283,000
Source: BestLink ® - Best's Financial Suite
Key Financial Indicators & Ratios 2020 2019 2018 2017 2016
Weighted5-Year
AverageProfitability:
Balance on Life Technical Account 984,000 1,172,000 1,161,000 1,730,000 1,563,000 ...Balance on Non-Life Technical Account ... ... ... 369,000 133,000 ...Net Income Return on Revenue (%) 3.2 2.8 -99.9 4.7 1.7 3.7Net Income Return on Capital and Surplus (%) 16.5 20.4 22.3 25.6 18.1 20.4Non-Life Combined Ratio (%) ... ... ... ... 59.2 27.8Net Investment Yield (%) 2.0 1.5 2.4 1.7 1.4 1.8
Leverage:Net Premiums Written to Capital and Surplus (%) 93.6 130.0 125.0 80.8 125.0 ...
Source: BestLink ® - Best's Financial Suite
Credit AnalysisBalance Sheet Strength
Legal and General Group Plc’s (L&G) balance sheet strength assessment is underpinned by risk-adjusted capitalisation, as measured byBest's Capital Adequacy Ratio (BCAR), at the strongest level. The assessment considers the group’s good organic capital generationand moderate financial leverage with good interest coverage. Partially offsetting factors to the assessment include the strategiccommitment to real assets, which introduces potential valuation uncertainties, and the risks inherent to longevity exposure. Fungibilityof capital across the group and access to debt markets are considered positive factors in the balance sheet strength assessment.Taking the group's overall strategy into account, including dividend policy and the exposure to less liquid direct investments, AM Bestexpects L&G's balance sheet strength to remain very strong.
Capitalisation
The BCAR scores presented under the "Best's Capital Adequacy Ratio (BCAR) Scores (%)" section of this report are based on the 2020year-end audited financial statements.
AMB #: 086120 - Legal & General Group Plc
www.ambest.com Page 4Printed for Bcrs on January 10, 2022
Page 5 of 32 Printed January 31, 2022
BEST’S RATING REPORT
Balance Sheet Strength (Continued...)
The principal risks borne by L&G’s balance sheet relate to default costs, other permanent reductions in expected returns from assetsheld, and longevity risk. Balance sheet items giving rise to these risks are generated for the most part by L&G’s bulk annuity activity.The group has solid asset and liability management capability, and assets are closely matched to liabilities by duration, which minimisesexposure to bond spread fluctuations. Furthermore, L&G has a market leading expertise in longevity pricing in its chosen markets.Investment experience and realised default costs on direct investments have been benign in recent years, as well as in 2021.
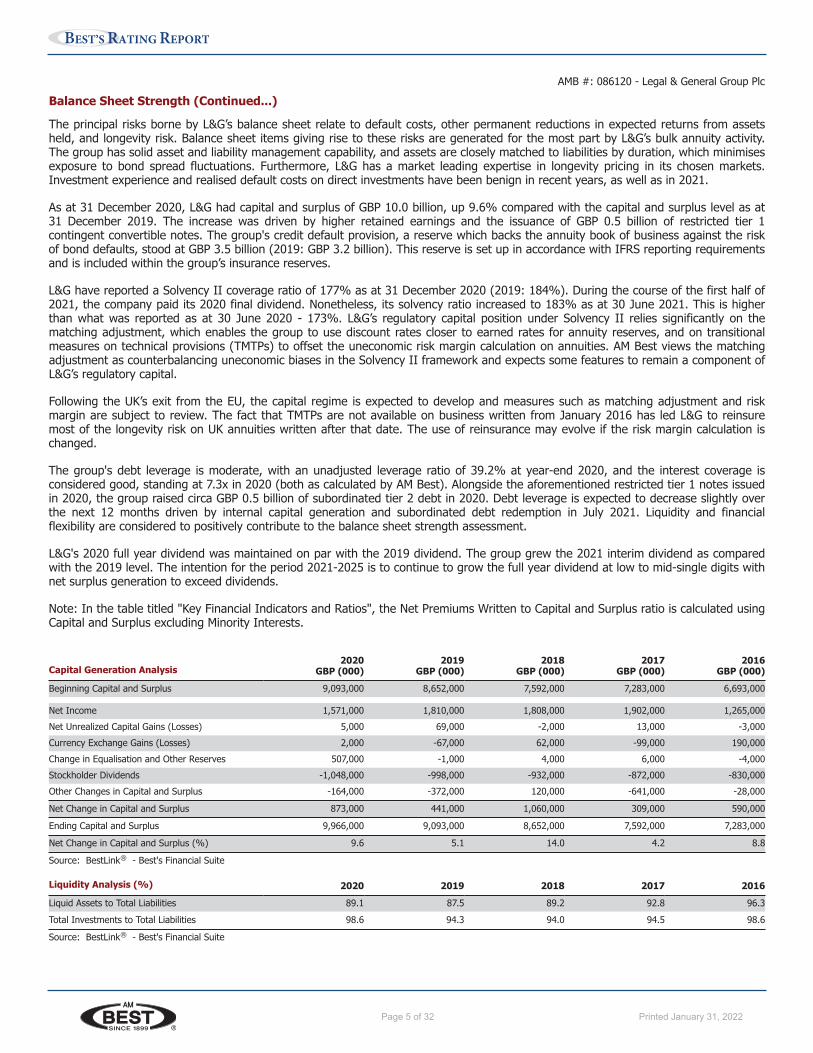
As at 31 December 2020, L&G had capital and surplus of GBP 10.0 billion, up 9.6% compared with the capital and surplus level as at31 December 2019. The increase was driven by higher retained earnings and the issuance of GBP 0.5 billion of restricted tier 1contingent convertible notes. The group's credit default provision, a reserve which backs the annuity book of business against the riskof bond defaults, stood at GBP 3.5 billion (2019: GBP 3.2 billion). This reserve is set up in accordance with IFRS reporting requirementsand is included within the group’s insurance reserves.
L&G have reported a Solvency II coverage ratio of 177% as at 31 December 2020 (2019: 184%). During the course of the first half of2021, the company paid its 2020 final dividend. Nonetheless, its solvency ratio increased to 183% as at 30 June 2021. This is higherthan what was reported as at 30 June 2020 - 173%. L&G’s regulatory capital position under Solvency II relies significantly on thematching adjustment, which enables the group to use discount rates closer to earned rates for annuity reserves, and on transitionalmeasures on technical provisions (TMTPs) to offset the uneconomic risk margin calculation on annuities. AM Best views the matchingadjustment as counterbalancing uneconomic biases in the Solvency II framework and expects some features to remain a component ofL&G’s regulatory capital.
Following the UK’s exit from the EU, the capital regime is expected to develop and measures such as matching adjustment and riskmargin are subject to review. The fact that TMTPs are not available on business written from January 2016 has led L&G to reinsuremost of the longevity risk on UK annuities written after that date. The use of reinsurance may evolve if the risk margin calculation ischanged.
The group's debt leverage is moderate, with an unadjusted leverage ratio of 39.2% at year-end 2020, and the interest coverage isconsidered good, standing at 7.3x in 2020 (both as calculated by AM Best). Alongside the aforementioned restricted tier 1 notes issuedin 2020, the group raised circa GBP 0.5 billion of subordinated tier 2 debt in 2020. Debt leverage is expected to decrease slightly overthe next 12 months driven by internal capital generation and subordinated debt redemption in July 2021. Liquidity and financialflexibility are considered to positively contribute to the balance sheet strength assessment.
L&G's 2020 full year dividend was maintained on par with the 2019 dividend. The group grew the 2021 interim dividend as comparedwith the 2019 level. The intention for the period 2021-2025 is to continue to grow the full year dividend at low to mid-single digits withnet surplus generation to exceed dividends.
Note: In the table titled "Key Financial Indicators and Ratios", the Net Premiums Written to Capital and Surplus ratio is calculated usingCapital and Surplus excluding Minority Interests.
Capital Generation Analysis2020
GBP (000)2019
GBP (000)2018
GBP (000)2017
GBP (000)2016
GBP (000)Beginning Capital and Surplus 9,093,000 8,652,000 7,592,000 7,283,000 6,693,000
Net Income 1,571,000 1,810,000 1,808,000 1,902,000 1,265,000Net Unrealized Capital Gains (Losses) 5,000 69,000 -2,000 13,000 -3,000Currency Exchange Gains (Losses) 2,000 -67,000 62,000 -99,000 190,000Change in Equalisation and Other Reserves 507,000 -1,000 4,000 6,000 -4,000Stockholder Dividends -1,048,000 -998,000 -932,000 -872,000 -830,000Other Changes in Capital and Surplus -164,000 -372,000 120,000 -641,000 -28,000
Net Change in Capital and Surplus 873,000 441,000 1,060,000 309,000 590,000
Ending Capital and Surplus 9,966,000 9,093,000 8,652,000 7,592,000 7,283,000
Net Change in Capital and Surplus (%) 9.6 5.1 14.0 4.2 8.8
Source: BestLink ® - Best's Financial Suite
Liquidity Analysis (%) 2020 2019 2018 2017 2016Liquid Assets to Total Liabilities 89.1 87.5 89.2 92.8 96.3Total Investments to Total Liabilities 98.6 94.3 94.0 94.5 98.6
Source: BestLink ® - Best's Financial Suite
AMB #: 086120 - Legal & General Group Plc
www.ambest.com Page 5Printed for Bcrs on January 10, 2022
Page 6 of 32 Printed January 31, 2022
BEST’S RATING REPORT
Balance Sheet Strength (Continued...)
Asset Liability Management - Investments
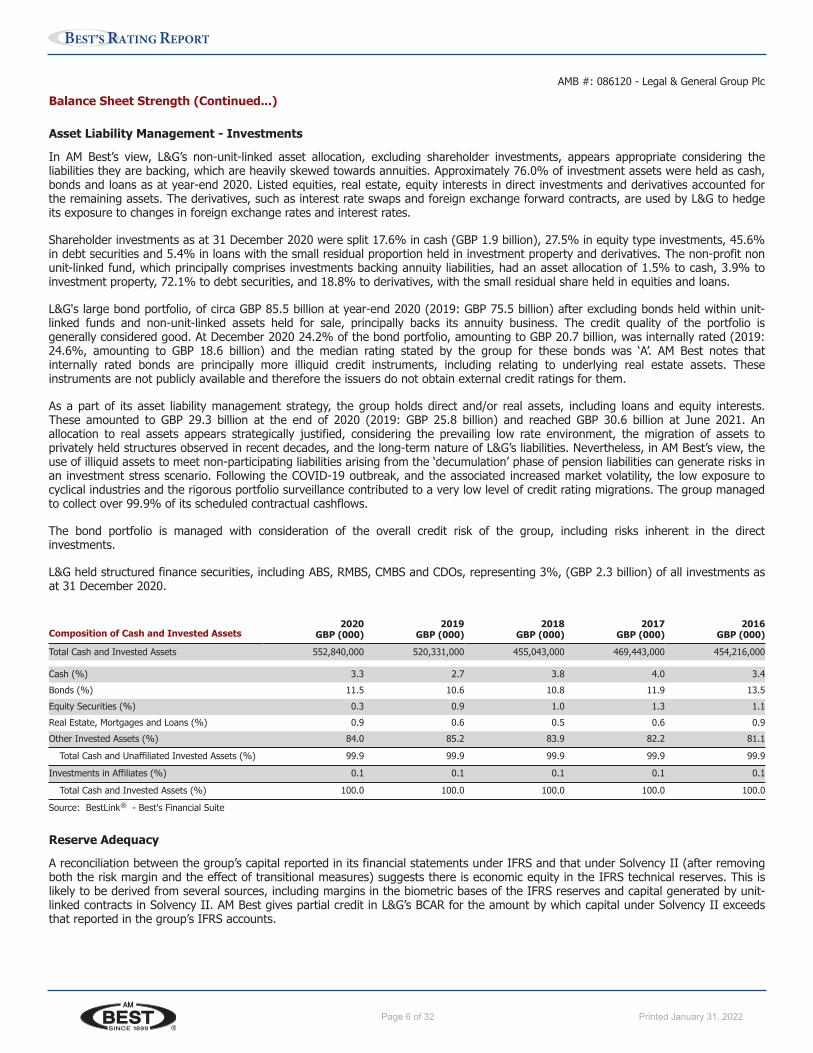
In AM Best’s view, L&G’s non-unit-linked asset allocation, excluding shareholder investments, appears appropriate considering theliabilities they are backing, which are heavily skewed towards annuities. Approximately 76.0% of investment assets were held as cash,bonds and loans as at year-end 2020. Listed equities, real estate, equity interests in direct investments and derivatives accounted forthe remaining assets. The derivatives, such as interest rate swaps and foreign exchange forward contracts, are used by L&G to hedgeits exposure to changes in foreign exchange rates and interest rates.
Shareholder investments as at 31 December 2020 were split 17.6% in cash (GBP 1.9 billion), 27.5% in equity type investments, 45.6%in debt securities and 5.4% in loans with the small residual proportion held in investment property and derivatives. The non-profit nonunit-linked fund, which principally comprises investments backing annuity liabilities, had an asset allocation of 1.5% to cash, 3.9% toinvestment property, 72.1% to debt securities, and 18.8% to derivatives, with the small residual share held in equities and loans.
L&G's large bond portfolio, of circa GBP 85.5 billion at year-end 2020 (2019: GBP 75.5 billion) after excluding bonds held within unit-linked funds and non-unit-linked assets held for sale, principally backs its annuity business. The credit quality of the portfolio isgenerally considered good. At December 2020 24.2% of the bond portfolio, amounting to GBP 20.7 billion, was internally rated (2019:24.6%, amounting to GBP 18.6 billion) and the median rating stated by the group for these bonds was ‘A’. AM Best notes thatinternally rated bonds are principally more illiquid credit instruments, including relating to underlying real estate assets. Theseinstruments are not publicly available and therefore the issuers do not obtain external credit ratings for them.
As a part of its asset liability management strategy, the group holds direct and/or real assets, including loans and equity interests.These amounted to GBP 29.3 billion at the end of 2020 (2019: GBP 25.8 billion) and reached GBP 30.6 billion at June 2021. Anallocation to real assets appears strategically justified, considering the prevailing low rate environment, the migration of assets toprivately held structures observed in recent decades, and the long-term nature of L&G’s liabilities. Nevertheless, in AM Best’s view, theuse of illiquid assets to meet non-participating liabilities arising from the ‘decumulation’ phase of pension liabilities can generate risks inan investment stress scenario. Following the COVID-19 outbreak, and the associated increased market volatility, the low exposure tocyclical industries and the rigorous portfolio surveillance contributed to a very low level of credit rating migrations. The group managedto collect over 99.9% of its scheduled contractual cashflows.
The bond portfolio is managed with consideration of the overall credit risk of the group, including risks inherent in the directinvestments.
L&G held structured finance securities, including ABS, RMBS, CMBS and CDOs, representing 3%, (GBP 2.3 billion) of all investments asat 31 December 2020.
Composition of Cash and Invested Assets2020
GBP (000)2019
GBP (000)2018
GBP (000)2017
GBP (000)2016
GBP (000)Total Cash and Invested Assets 552,840,000 520,331,000 455,043,000 469,443,000 454,216,000
Cash (%) 3.3 2.7 3.8 4.0 3.4Bonds (%) 11.5 10.6 10.8 11.9 13.5Equity Securities (%) 0.3 0.9 1.0 1.3 1.1Real Estate, Mortgages and Loans (%) 0.9 0.6 0.5 0.6 0.9Other Invested Assets (%) 84.0 85.2 83.9 82.2 81.1
Total Cash and Unaffiliated Invested Assets (%) 99.9 99.9 99.9 99.9 99.9
Investments in Affiliates (%) 0.1 0.1 0.1 0.1 0.1
Total Cash and Invested Assets (%) 100.0 100.0 100.0 100.0 100.0
Source: BestLink ® - Best's Financial Suite
Reserve Adequacy
A reconciliation between the group’s capital reported in its financial statements under IFRS and that under Solvency II (after removingboth the risk margin and the effect of transitional measures) suggests there is economic equity in the IFRS technical reserves. This islikely to be derived from several sources, including margins in the biometric bases of the IFRS reserves and capital generated by unit-linked contracts in Solvency II. AM Best gives partial credit in L&G’s BCAR for the amount by which capital under Solvency II exceedsthat reported in the group’s IFRS accounts.
AMB #: 086120 - Legal & General Group Plc
www.ambest.com Page 6Printed for Bcrs on January 10, 2022
Page 7 of 32 Printed January 31, 2022
BEST’S RATING REPORT
Balance Sheet Strength (Continued...)
AM Best notes that the company has been releasing reserves in respect of longevity in the period 2017-2020, and views positively theimplications of this for the conservatism of reserves for annuity contracts.
Holding Company Assessment
There is good fungibility of capital for a life-oriented insurer. In addition, the holding company owns a large and successful assetmanager, which provides valuable cash flow.
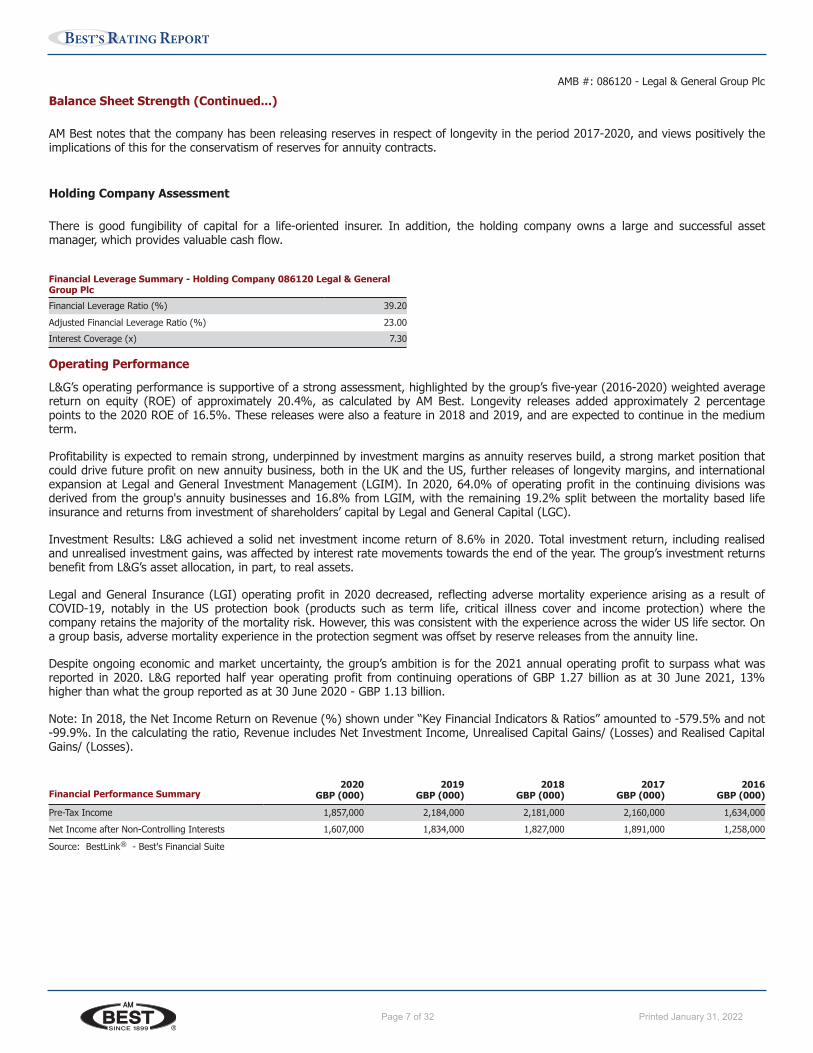
Financial Leverage Summary - Holding Company 086120 Legal & GeneralGroup PlcFinancial Leverage Ratio (%) 39.20Adjusted Financial Leverage Ratio (%) 23.00Interest Coverage (x) 7.30
Operating Performance
L&G’s operating performance is supportive of a strong assessment, highlighted by the group’s five-year (2016-2020) weighted averagereturn on equity (ROE) of approximately 20.4%, as calculated by AM Best. Longevity releases added approximately 2 percentagepoints to the 2020 ROE of 16.5%. These releases were also a feature in 2018 and 2019, and are expected to continue in the mediumterm.
Profitability is expected to remain strong, underpinned by investment margins as annuity reserves build, a strong market position thatcould drive future profit on new annuity business, both in the UK and the US, further releases of longevity margins, and internationalexpansion at Legal and General Investment Management (LGIM). In 2020, 64.0% of operating profit in the continuing divisions wasderived from the group's annuity businesses and 16.8% from LGIM, with the remaining 19.2% split between the mortality based lifeinsurance and returns from investment of shareholders’ capital by Legal and General Capital (LGC).
Investment Results: L&G achieved a solid net investment income return of 8.6% in 2020. Total investment return, including realisedand unrealised investment gains, was affected by interest rate movements towards the end of the year. The group’s investment returnsbenefit from L&G’s asset allocation, in part, to real assets.
Legal and General Insurance (LGI) operating profit in 2020 decreased, reflecting adverse mortality experience arising as a result ofCOVID-19, notably in the US protection book (products such as term life, critical illness cover and income protection) where thecompany retains the majority of the mortality risk. However, this was consistent with the experience across the wider US life sector. Ona group basis, adverse mortality experience in the protection segment was offset by reserve releases from the annuity line.
Despite ongoing economic and market uncertainty, the group’s ambition is for the 2021 annual operating profit to surpass what wasreported in 2020. L&G reported half year operating profit from continuing operations of GBP 1.27 billion as at 30 June 2021, 13%higher than what the group reported as at 30 June 2020 - GBP 1.13 billion.
Note: In 2018, the Net Income Return on Revenue (%) shown under “Key Financial Indicators & Ratios” amounted to -579.5% and not-99.9%. In the calculating the ratio, Revenue includes Net Investment Income, Unrealised Capital Gains/ (Losses) and Realised CapitalGains/ (Losses).
Financial Performance Summary2020
GBP (000)2019
GBP (000)2018
GBP (000)2017
GBP (000)2016
GBP (000)Pre-Tax Income 1,857,000 2,184,000 2,181,000 2,160,000 1,634,000Net Income after Non-Controlling Interests 1,607,000 1,834,000 1,827,000 1,891,000 1,258,000
Source: BestLink ® - Best's Financial Suite
AMB #: 086120 - Legal & General Group Plc
www.ambest.com Page 7Printed for Bcrs on January 10, 2022
Page 8 of 32 Printed January 31, 2022
BEST’S RATING REPORT
Operating Performance (Continued...)
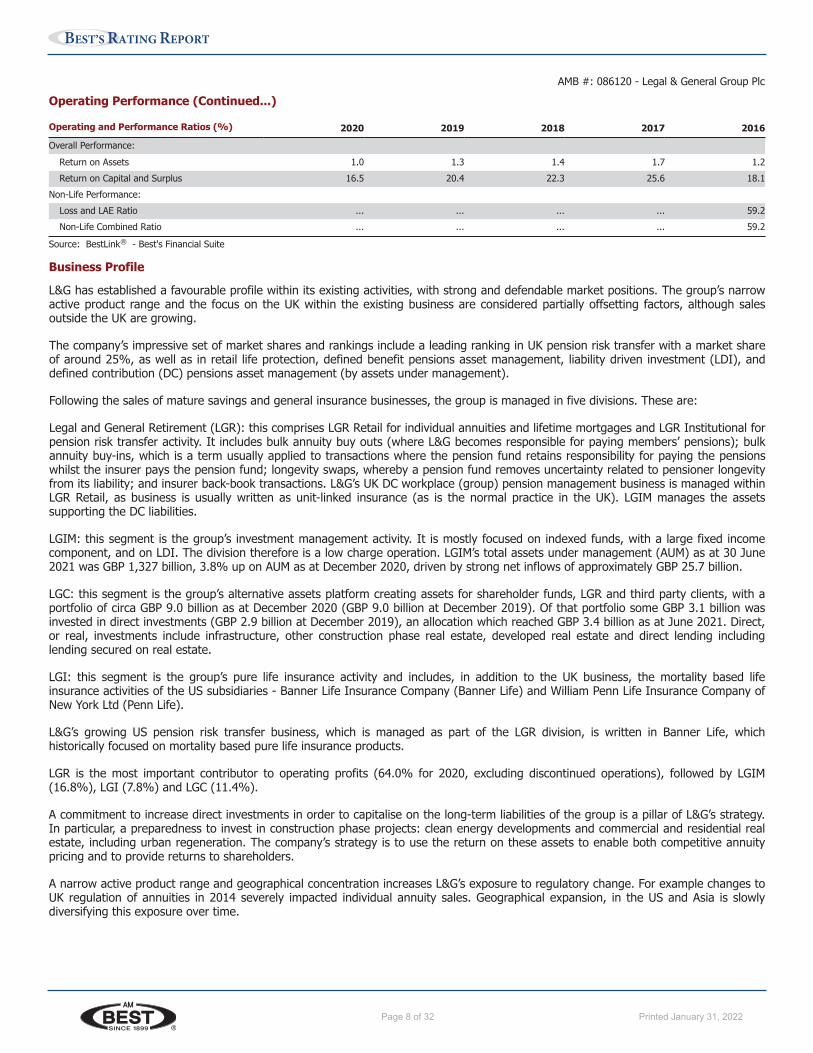
Operating and Performance Ratios (%) 2020 2019 2018 2017 2016Overall Performance:
Return on Assets 1.0 1.3 1.4 1.7 1.2Return on Capital and Surplus 16.5 20.4 22.3 25.6 18.1
Non-Life Performance:Loss and LAE Ratio ... ... ... ... 59.2Non-Life Combined Ratio ... ... ... ... 59.2
Source: BestLink ® - Best's Financial Suite
Business Profile
L&G has established a favourable profile within its existing activities, with strong and defendable market positions. The group’s narrowactive product range and the focus on the UK within the existing business are considered partially offsetting factors, although salesoutside the UK are growing.
The company’s impressive set of market shares and rankings include a leading ranking in UK pension risk transfer with a market shareof around 25%, as well as in retail life protection, defined benefit pensions asset management, liability driven investment (LDI), anddefined contribution (DC) pensions asset management (by assets under management).
Following the sales of mature savings and general insurance businesses, the group is managed in five divisions. These are:
Legal and General Retirement (LGR): this comprises LGR Retail for individual annuities and lifetime mortgages and LGR Institutional forpension risk transfer activity. It includes bulk annuity buy outs (where L&G becomes responsible for paying members’ pensions); bulkannuity buy-ins, which is a term usually applied to transactions where the pension fund retains responsibility for paying the pensionswhilst the insurer pays the pension fund; longevity swaps, whereby a pension fund removes uncertainty related to pensioner longevityfrom its liability; and insurer back-book transactions. L&G’s UK DC workplace (group) pension management business is managed withinLGR Retail, as business is usually written as unit-linked insurance (as is the normal practice in the UK). LGIM manages the assetssupporting the DC liabilities.
LGIM: this segment is the group’s investment management activity. It is mostly focused on indexed funds, with a large fixed incomecomponent, and on LDI. The division therefore is a low charge operation. LGIM’s total assets under management (AUM) as at 30 June2021 was GBP 1,327 billion, 3.8% up on AUM as at December 2020, driven by strong net inflows of approximately GBP 25.7 billion.
LGC: this segment is the group’s alternative assets platform creating assets for shareholder funds, LGR and third party clients, with aportfolio of circa GBP 9.0 billion as at December 2020 (GBP 9.0 billion at December 2019). Of that portfolio some GBP 3.1 billion wasinvested in direct investments (GBP 2.9 billion at December 2019), an allocation which reached GBP 3.4 billion as at June 2021. Direct,or real, investments include infrastructure, other construction phase real estate, developed real estate and direct lending includinglending secured on real estate.
LGI: this segment is the group’s pure life insurance activity and includes, in addition to the UK business, the mortality based lifeinsurance activities of the US subsidiaries - Banner Life Insurance Company (Banner Life) and William Penn Life Insurance Company ofNew York Ltd (Penn Life).
L&G’s growing US pension risk transfer business, which is managed as part of the LGR division, is written in Banner Life, whichhistorically focused on mortality based pure life insurance products.
LGR is the most important contributor to operating profits (64.0% for 2020, excluding discontinued operations), followed by LGIM(16.8%), LGI (7.8%) and LGC (11.4%).
A commitment to increase direct investments in order to capitalise on the long-term liabilities of the group is a pillar of L&G’s strategy.In particular, a preparedness to invest in construction phase projects: clean energy developments and commercial and residential realestate, including urban regeneration. The company’s strategy is to use the return on these assets to enable both competitive annuitypricing and to provide returns to shareholders.
A narrow active product range and geographical concentration increases L&G’s exposure to regulatory change. For example changes toUK regulation of annuities in 2014 severely impacted individual annuity sales. Geographical expansion, in the US and Asia is slowlydiversifying this exposure over time.
AMB #: 086120 - Legal & General Group Plc
www.ambest.com Page 8Printed for Bcrs on January 10, 2022
Page 9 of 32 Printed January 31, 2022
BEST’S RATING REPORT
Enterprise Risk Management
L&G has a well-developed ERM framework with appropriate practices in place. The risk management function operates across thebusiness to provide objective challenge and guidance on risk matters. Risk management is the operational responsibility of the grouprisk committee, which reports directly to the group Board.
The group's risk management capabilities are considered appropriate in relation to the inherent risks in L&G's product profile, whichprincipally reside in the group's annuity products. In the bulk annuity product, the group takes longevity and investment return risksonto its balance sheet in lumpy transactions. Meeting the investment return commitments, and generating profit for the group, is partlydependent on obtaining favourable returns from illiquid investment assets.
The group's risks are partly diversified by mortality-based products and the successful investment management division.
In AM Best’s view, the group's credit, other investment and longevity risks are effectively managed. There is a managementintervention ladder, which appears as effective across all the risk areas. Severe investment stress scenarios remain among the greatestrisks for the group.
L&G maintains an active approach to keeping its risk management processes up to date.
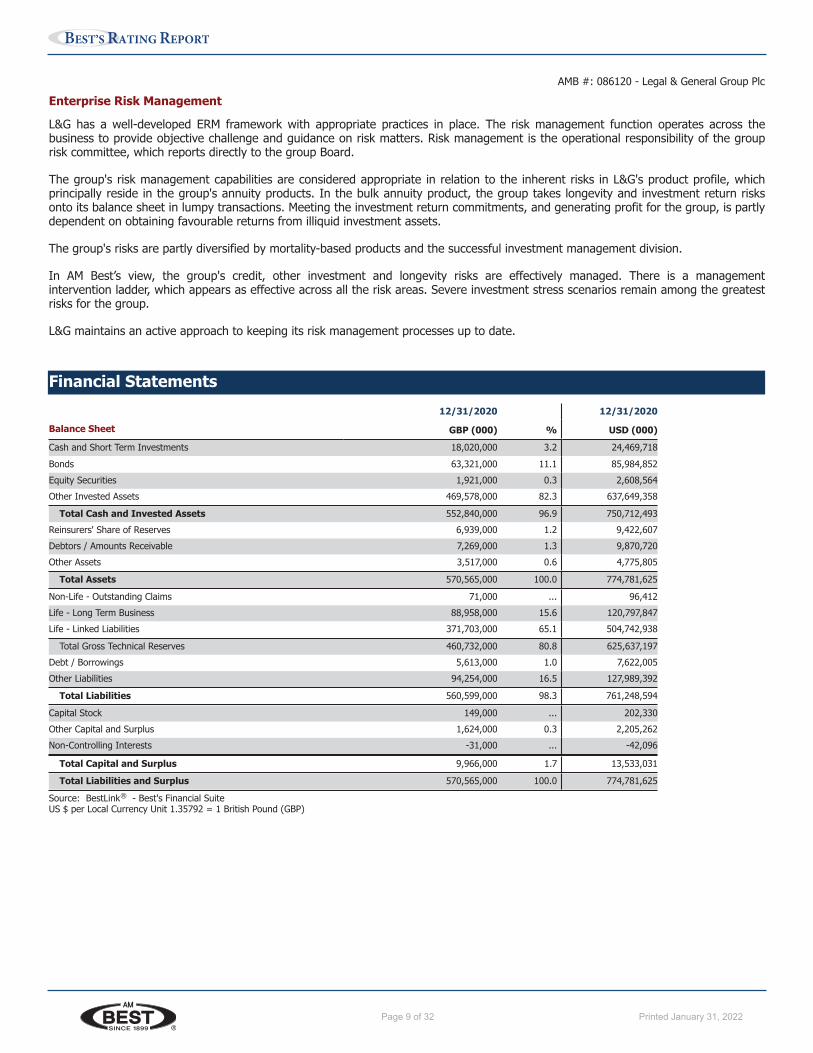
Financial Statements12/31/2020 12/31/2020
Balance Sheet GBP (000) % USD (000)Cash and Short Term Investments 18,020,000 3.2 24,469,718Bonds 63,321,000 11.1 85,984,852Equity Securities 1,921,000 0.3 2,608,564Other Invested Assets 469,578,000 82.3 637,649,358
Total Cash and Invested Assets 552,840,000 96.9 750,712,493Reinsurers' Share of Reserves 6,939,000 1.2 9,422,607Debtors / Amounts Receivable 7,269,000 1.3 9,870,720Other Assets 3,517,000 0.6 4,775,805
Total Assets 570,565,000 100.0 774,781,625
Non-Life - Outstanding Claims 71,000 ... 96,412Life - Long Term Business 88,958,000 15.6 120,797,847Life - Linked Liabilities 371,703,000 65.1 504,742,938
Total Gross Technical Reserves 460,732,000 80.8 625,637,197Debt / Borrowings 5,613,000 1.0 7,622,005Other Liabilities 94,254,000 16.5 127,989,392
Total Liabilities 560,599,000 98.3 761,248,594
Capital Stock 149,000 ... 202,330Other Capital and Surplus 1,624,000 0.3 2,205,262Non-Controlling Interests -31,000 ... -42,096
Total Capital and Surplus 9,966,000 1.7 13,533,031
Total Liabilities and Surplus 570,565,000 100.0 774,781,625
Source: BestLink ® - Best's Financial SuiteUS $ per Local Currency Unit 1.35792 = 1 British Pound (GBP)
AMB #: 086120 - Legal & General Group Plc
www.ambest.com Page 9Printed for Bcrs on January 10, 2022
Page 10 of 32 Printed January 31, 2022
BEST’S RATING REPORT
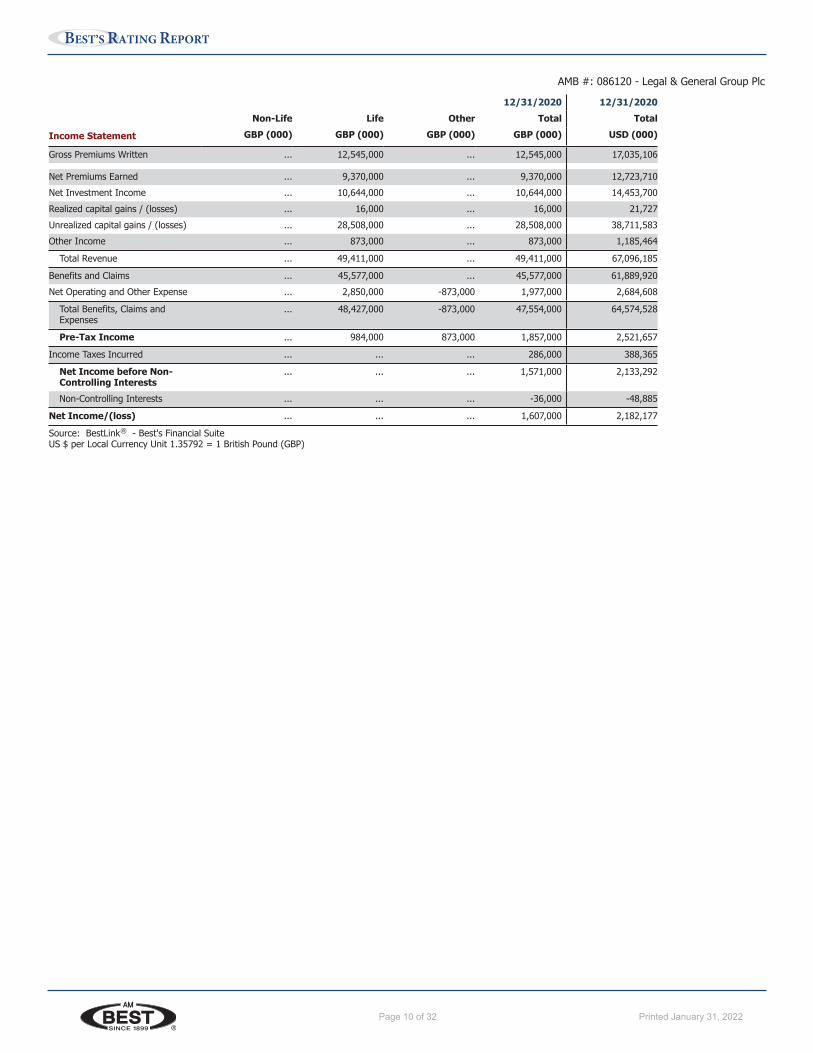
12/31/2020 12/31/2020Non-Life Life Other Total Total
Income Statement GBP (000) GBP (000) GBP (000) GBP (000) USD (000)
Gross Premiums Written ... 12,545,000 ... 12,545,000 17,035,106
Net Premiums Earned ... 9,370,000 ... 9,370,000 12,723,710Net Investment Income ... 10,644,000 ... 10,644,000 14,453,700Realized capital gains / (losses) ... 16,000 ... 16,000 21,727Unrealized capital gains / (losses) ... 28,508,000 ... 28,508,000 38,711,583Other Income ... 873,000 ... 873,000 1,185,464
Total Revenue ... 49,411,000 ... 49,411,000 67,096,185
Benefits and Claims ... 45,577,000 ... 45,577,000 61,889,920Net Operating and Other Expense ... 2,850,000 -873,000 1,977,000 2,684,608
Total Benefits, Claims andExpenses
... 48,427,000 -873,000 47,554,000 64,574,528
Pre-Tax Income ... 984,000 873,000 1,857,000 2,521,657
Income Taxes Incurred ... ... ... 286,000 388,365
Net Income before Non-Controlling Interests
... ... ... 1,571,000 2,133,292
Non-Controlling Interests ... ... ... -36,000 -48,885
Net Income/(loss) ... ... ... 1,607,000 2,182,177
Source: BestLink ® - Best's Financial SuiteUS $ per Local Currency Unit 1.35792 = 1 British Pound (GBP)
AMB #: 086120 - Legal & General Group Plc
www.ambest.com Page 10Printed for Bcrs on January 10, 2022
Page 11 of 32 Printed January 31, 2022
BEST’S RATING REPORT
Last UpdateDecember 03, 2021
IdentifiersAMB #: 086120LEI #: 213800JH9QQWHLO99821
Contact InformationDomiciliary Address:One Coleman Street,London EC2R 5AA,United Kingdom
Web:www.legalandgeneralgroup.comPhone: 44-020-3124-2000Fax: 44-020-3124-2500
Financial Data PresentedThe financial data in this reportreflects the most current dataavailable at the time the report wasprinted.
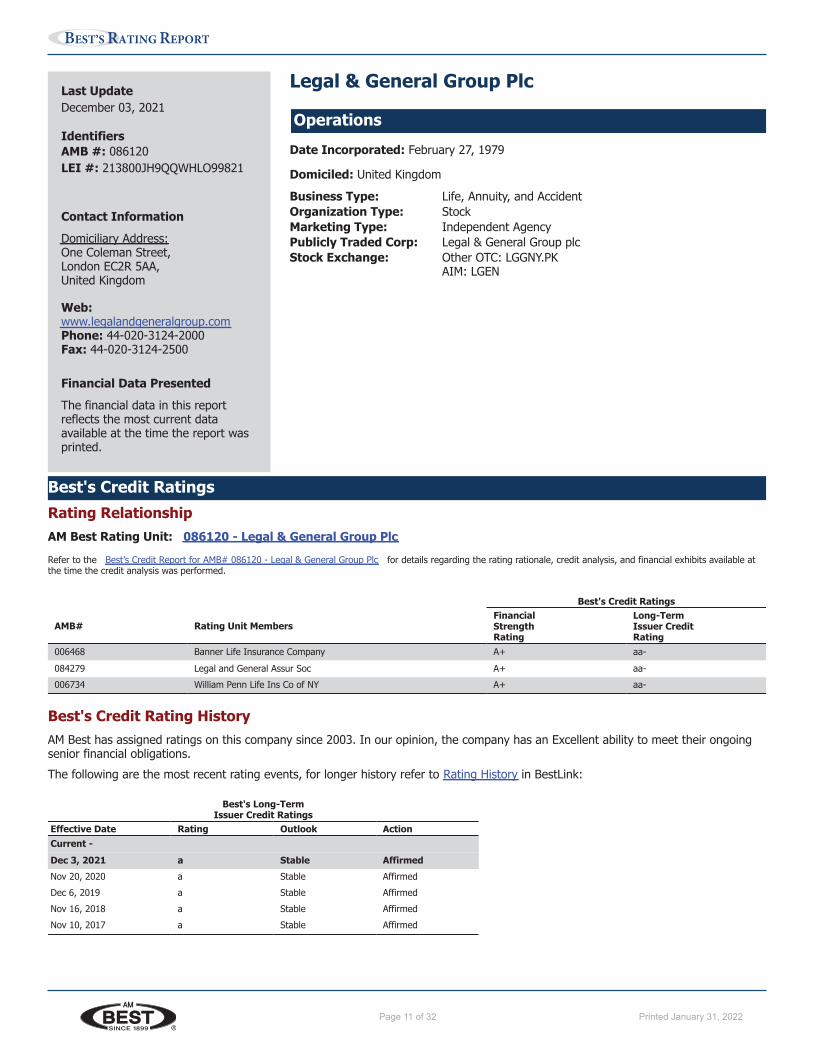
Legal & General Group Plc
OperationsDate Incorporated: February 27, 1979
Domiciled: United Kingdom
Business Type: Life, Annuity, and AccidentOrganization Type: StockMarketing Type: Independent AgencyPublicly Traded Corp: Legal & General Group plcStock Exchange: Other OTC: LGGNY.PK
AIM: LGEN
Best's Credit RatingsRating RelationshipAM Best Rating Unit: 086120 - Legal & General Group Plc
Refer to the Best’s Credit Report for AMB# 086120 - Legal & General Group Plc for details regarding the rating rationale, credit analysis, and financial exhibits available atthe time the credit analysis was performed.
Best's Credit Ratings
AMB# Rating Unit MembersFinancialStrengthRating
Long-TermIssuer CreditRating
006468 Banner Life Insurance Company A+ aa-084279 Legal and General Assur Soc A+ aa-006734 William Penn Life Ins Co of NY A+ aa-
Best's Credit Rating HistoryAM Best has assigned ratings on this company since 2003. In our opinion, the company has an Excellent ability to meet their ongoingsenior financial obligations.The following are the most recent rating events, for longer history refer to Rating History in BestLink:
Best's Long-TermIssuer Credit Ratings
Effective Date Rating Outlook ActionCurrent -Dec 3, 2021 a Stable AffirmedNov 20, 2020 a Stable AffirmedDec 6, 2019 a Stable AffirmedNov 16, 2018 a Stable AffirmedNov 10, 2017 a Stable Affirmed
www.ambest.com Page 11Printed for Bcrs on January 10, 2022
Page 12 of 32 Printed January 31, 2022
BEST’S RATING REPORT
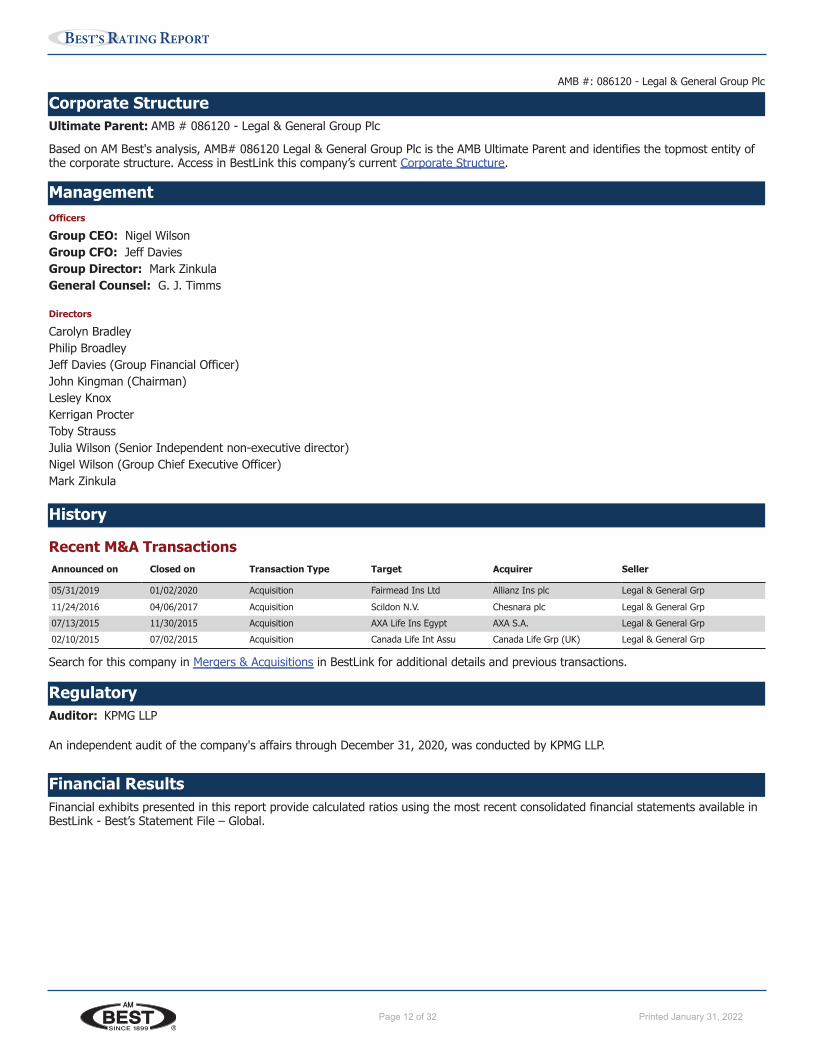
Corporate StructureUltimate Parent: AMB # 086120 - Legal & General Group Plc
Based on AM Best's analysis, AMB# 086120 Legal & General Group Plc is the AMB Ultimate Parent and identifies the topmost entity ofthe corporate structure. Access in BestLink this company’s current Corporate Structure.
ManagementOfficers
Group CEO: Nigel WilsonGroup CFO: Jeff DaviesGroup Director: Mark ZinkulaGeneral Counsel: G. J. Timms
Directors
Carolyn BradleyPhilip BroadleyJeff Davies (Group Financial Officer)John Kingman (Chairman)Lesley KnoxKerrigan ProcterToby StraussJulia Wilson (Senior Independent non-executive director)Nigel Wilson (Group Chief Executive Officer)Mark Zinkula
History
Recent M&A TransactionsAnnounced on Closed on Transaction Type Target Acquirer Seller
05/31/2019 01/02/2020 Acquisition Fairmead Ins Ltd Allianz Ins plc Legal & General Grp11/24/2016 04/06/2017 Acquisition Scildon N.V. Chesnara plc Legal & General Grp07/13/2015 11/30/2015 Acquisition AXA Life Ins Egypt AXA S.A. Legal & General Grp02/10/2015 07/02/2015 Acquisition Canada Life Int Assu Canada Life Grp (UK) Legal & General Grp
Search for this company in Mergers & Acquisitions in BestLink for additional details and previous transactions.
RegulatoryAuditor: KPMG LLP
An independent audit of the company's affairs through December 31, 2020, was conducted by KPMG LLP.
Financial ResultsFinancial exhibits presented in this report provide calculated ratios using the most recent consolidated financial statements available inBestLink - Best’s Statement File – Global.
AMB #: 086120 - Legal & General Group Plc
www.ambest.com Page 12Printed for Bcrs on January 10, 2022
Page 13 of 32 Printed January 31, 2022
BEST’S RATING REPORT
Balance Sheet Highlights
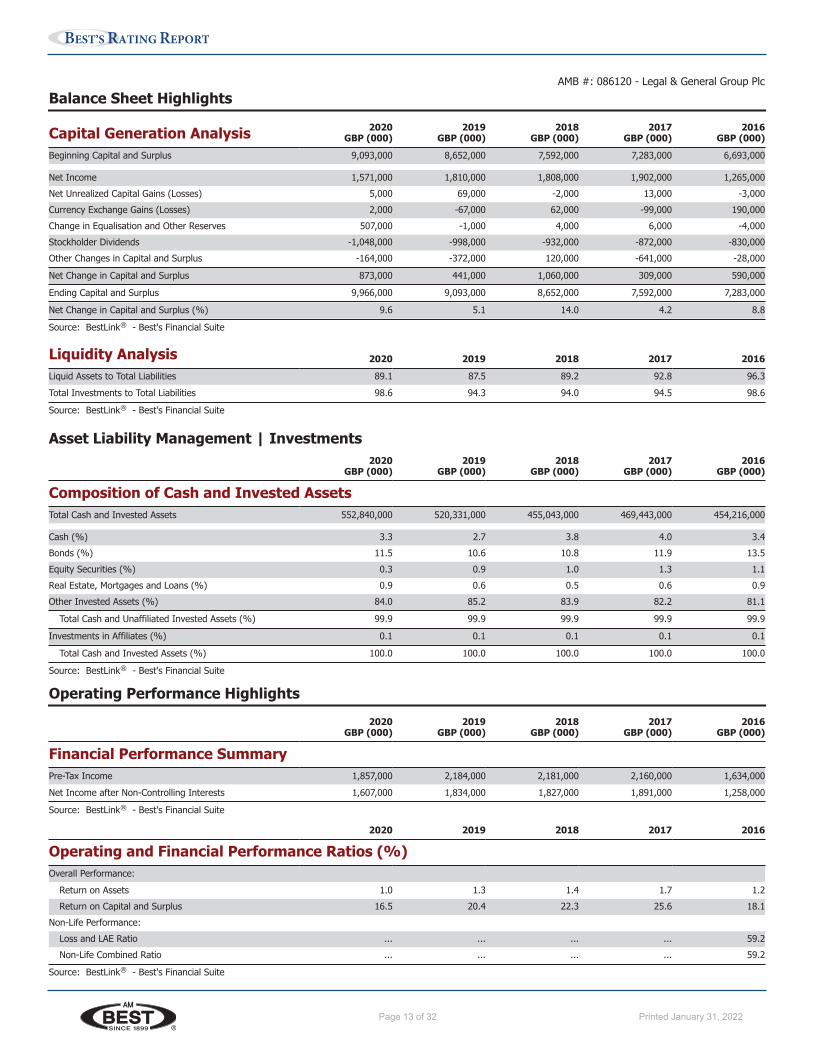
Capital Generation Analysis 2020GBP (000)
2019GBP (000)
2018GBP (000)
2017GBP (000)
2016GBP (000)
Beginning Capital and Surplus 9,093,000 8,652,000 7,592,000 7,283,000 6,693,000
Net Income 1,571,000 1,810,000 1,808,000 1,902,000 1,265,000Net Unrealized Capital Gains (Losses) 5,000 69,000 -2,000 13,000 -3,000Currency Exchange Gains (Losses) 2,000 -67,000 62,000 -99,000 190,000Change in Equalisation and Other Reserves 507,000 -1,000 4,000 6,000 -4,000Stockholder Dividends -1,048,000 -998,000 -932,000 -872,000 -830,000Other Changes in Capital and Surplus -164,000 -372,000 120,000 -641,000 -28,000
Net Change in Capital and Surplus 873,000 441,000 1,060,000 309,000 590,000
Ending Capital and Surplus 9,966,000 9,093,000 8,652,000 7,592,000 7,283,000
Net Change in Capital and Surplus (%) 9.6 5.1 14.0 4.2 8.8
Source: BestLink ® - Best's Financial Suite
Liquidity Analysis 2020 2019 2018 2017 2016Liquid Assets to Total Liabilities 89.1 87.5 89.2 92.8 96.3Total Investments to Total Liabilities 98.6 94.3 94.0 94.5 98.6
Source: BestLink ® - Best's Financial Suite
Asset Liability Management | Investments2020
GBP (000)2019
GBP (000)2018
GBP (000)2017
GBP (000)2016
GBP (000)
Composition of Cash and Invested AssetsTotal Cash and Invested Assets 552,840,000 520,331,000 455,043,000 469,443,000 454,216,000
Cash (%) 3.3 2.7 3.8 4.0 3.4Bonds (%) 11.5 10.6 10.8 11.9 13.5Equity Securities (%) 0.3 0.9 1.0 1.3 1.1Real Estate, Mortgages and Loans (%) 0.9 0.6 0.5 0.6 0.9Other Invested Assets (%) 84.0 85.2 83.9 82.2 81.1
Total Cash and Unaffiliated Invested Assets (%) 99.9 99.9 99.9 99.9 99.9
Investments in Affiliates (%) 0.1 0.1 0.1 0.1 0.1
Total Cash and Invested Assets (%) 100.0 100.0 100.0 100.0 100.0
Source: BestLink ® - Best's Financial Suite
Operating Performance Highlights2020
GBP (000)2019
GBP (000)2018
GBP (000)2017
GBP (000)2016
GBP (000)
Financial Performance SummaryPre-Tax Income 1,857,000 2,184,000 2,181,000 2,160,000 1,634,000Net Income after Non-Controlling Interests 1,607,000 1,834,000 1,827,000 1,891,000 1,258,000
Source: BestLink ® - Best's Financial Suite
2020 2019 2018 2017 2016
Operating and Financial Performance Ratios (%)Overall Performance:
Return on Assets 1.0 1.3 1.4 1.7 1.2Return on Capital and Surplus 16.5 20.4 22.3 25.6 18.1
Non-Life Performance:Loss and LAE Ratio ... ... ... ... 59.2Non-Life Combined Ratio ... ... ... ... 59.2
Source: BestLink ® - Best's Financial Suite
AMB #: 086120 - Legal & General Group Plc
www.ambest.com Page 13Printed for Bcrs on January 10, 2022
Page 14 of 32 Printed January 31, 2022
BEST’S RATING REPORT
Last UpdateJanuary 28, 2022
IdentifiersAMB #: 006468NAIC #: 94250FEIN #: 52-1236145LEI #: 254900XJ2DBFAP2BC608
Contact InformationDomiciliary Address:3275 Bennett Creek Avenue,Frederick, Maryland 21704United States
Web: www.lgamerica.comPhone: +1-301-279-4800Fax: +1-301-279-4178
Financial Data PresentedThe financial data in this reportreflects the most current dataavailable at the time the report wasprinted.
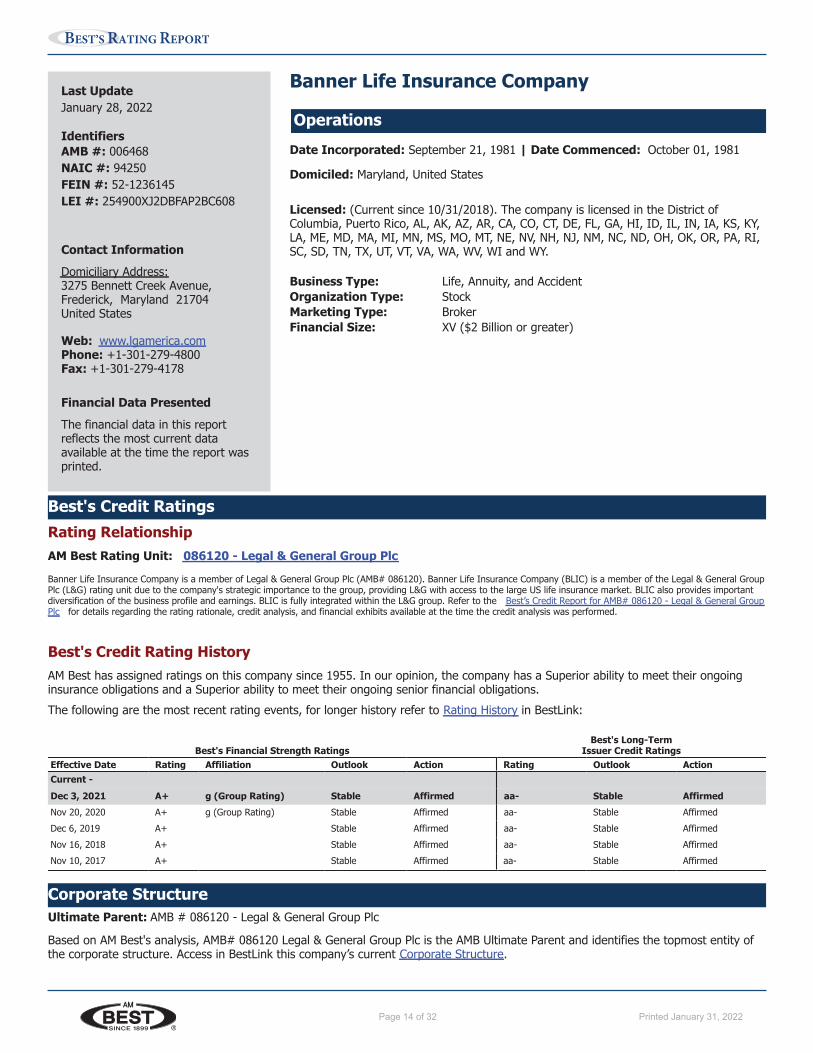
Banner Life Insurance Company
OperationsDate Incorporated: September 21, 1981 | Date Commenced: October 01, 1981
Domiciled: Maryland, United States
Licensed: (Current since 10/31/2018). The company is licensed in the District ofColumbia, Puerto Rico, AL, AK, AZ, AR, CA, CO, CT, DE, FL, GA, HI, ID, IL, IN, IA, KS, KY,LA, ME, MD, MA, MI, MN, MS, MO, MT, NE, NV, NH, NJ, NM, NC, ND, OH, OK, OR, PA, RI,SC, SD, TN, TX, UT, VT, VA, WA, WV, WI and WY.
Business Type: Life, Annuity, and AccidentOrganization Type: StockMarketing Type: BrokerFinancial Size: XV ($2 Billion or greater)
Best's Credit RatingsRating RelationshipAM Best Rating Unit: 086120 - Legal & General Group Plc
Banner Life Insurance Company is a member of Legal & General Group Plc (AMB# 086120). Banner Life Insurance Company (BLIC) is a member of the Legal & General GroupPlc (L&G) rating unit due to the company's strategic importance to the group, providing L&G with access to the large US life insurance market. BLIC also provides importantdiversification of the business profile and earnings. BLIC is fully integrated within the L&G group. Refer to the Best’s Credit Report for AMB# 086120 - Legal & General GroupPlc for details regarding the rating rationale, credit analysis, and financial exhibits available at the time the credit analysis was performed.
Best's Credit Rating HistoryAM Best has assigned ratings on this company since 1955. In our opinion, the company has a Superior ability to meet their ongoinginsurance obligations and a Superior ability to meet their ongoing senior financial obligations.The following are the most recent rating events, for longer history refer to Rating History in BestLink:
Best's FinancialBest's Financial Strength Ratings
Best's Long-TermIssuer Credit Ratings
Effective Date Rating Affiliation Outlook Action Rating Outlook ActionCurrent -Dec 3, 2021 A+ g (Group Rating) Stable Affirmed aa- Stable AffirmedNov 20, 2020 A+ g (Group Rating) Stable Affirmed aa- Stable AffirmedDec 6, 2019 A+ Stable Affirmed aa- Stable AffirmedNov 16, 2018 A+ Stable Affirmed aa- Stable AffirmedNov 10, 2017 A+ Stable Affirmed aa- Stable Affirmed
Corporate StructureUltimate Parent: AMB # 086120 - Legal & General Group Plc
Based on AM Best's analysis, AMB# 086120 Legal & General Group Plc is the AMB Ultimate Parent and identifies the topmost entity ofthe corporate structure. Access in BestLink this company’s current Corporate Structure.
www.ambest.com Page 14Printed for Bcrs on January 28, 2022
Page 15 of 32 Printed January 31, 2022
BEST’S RATING REPORT
ManagementOfficers
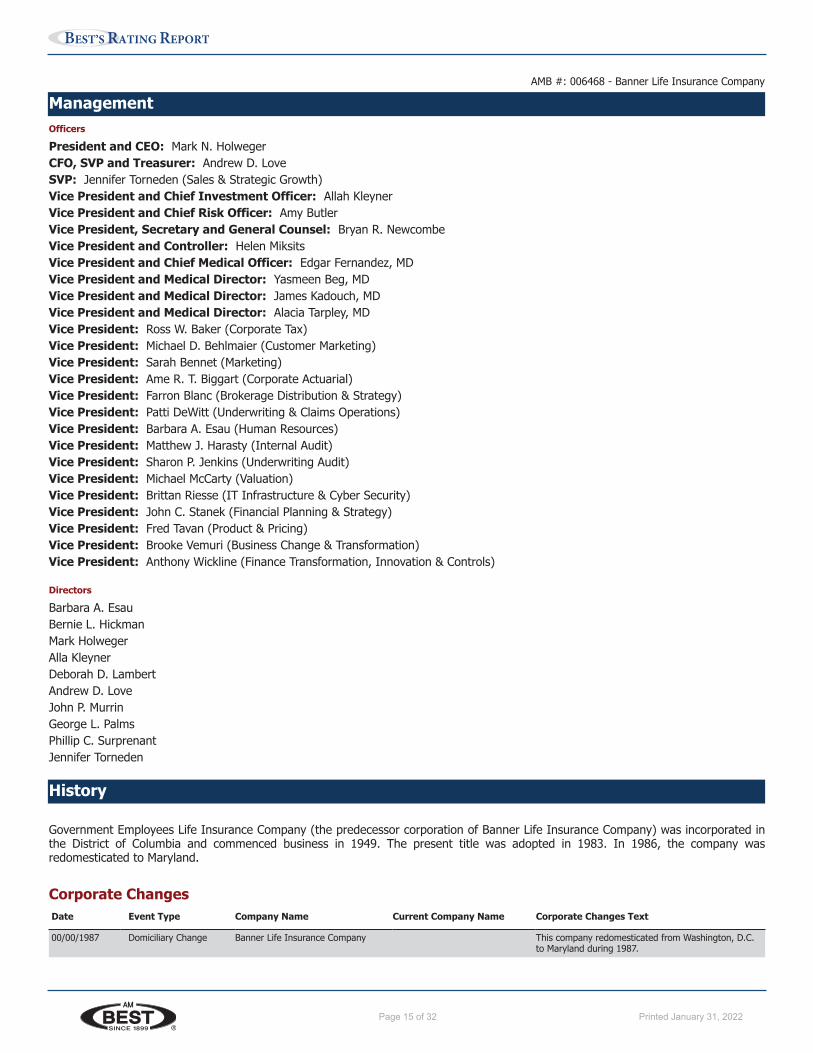
President and CEO: Mark N. HolwegerCFO, SVP and Treasurer: Andrew D. LoveSVP: Jennifer Torneden (Sales & Strategic Growth)Vice President and Chief Investment Officer: Allah KleynerVice President and Chief Risk Officer: Amy ButlerVice President, Secretary and General Counsel: Bryan R. NewcombeVice President and Controller: Helen MiksitsVice President and Chief Medical Officer: Edgar Fernandez, MDVice President and Medical Director: Yasmeen Beg, MDVice President and Medical Director: James Kadouch, MDVice President and Medical Director: Alacia Tarpley, MDVice President: Ross W. Baker (Corporate Tax)Vice President: Michael D. Behlmaier (Customer Marketing)Vice President: Sarah Bennet (Marketing)Vice President: Ame R. T. Biggart (Corporate Actuarial)Vice President: Farron Blanc (Brokerage Distribution & Strategy)Vice President: Patti DeWitt (Underwriting & Claims Operations)Vice President: Barbara A. Esau (Human Resources)Vice President: Matthew J. Harasty (Internal Audit)Vice President: Sharon P. Jenkins (Underwriting Audit)Vice President: Michael McCarty (Valuation)Vice President: Brittan Riesse (IT Infrastructure & Cyber Security)Vice President: John C. Stanek (Financial Planning & Strategy)Vice President: Fred Tavan (Product & Pricing)Vice President: Brooke Vemuri (Business Change & Transformation)Vice President: Anthony Wickline (Finance Transformation, Innovation & Controls)
Directors
Barbara A. EsauBernie L. HickmanMark HolwegerAlla KleynerDeborah D. LambertAndrew D. LoveJohn P. MurrinGeorge L. PalmsPhillip C. SurprenantJennifer Torneden
History
Government Employees Life Insurance Company (the predecessor corporation of Banner Life Insurance Company) was incorporated inthe District of Columbia and commenced business in 1949. The present title was adopted in 1983. In 1986, the company wasredomesticated to Maryland.
Corporate ChangesDate Event Type Company Name Current Company Name Corporate Changes Text
00/00/1987 Domiciliary Change Banner Life Insurance Company This company redomesticated from Washington, D.C.to Maryland during 1987.
AMB #: 006468 - Banner Life Insurance Company
www.ambest.com Page 15Printed for Bcrs on January 28, 2022
Page 16 of 32 Printed January 31, 2022
BEST’S RATING REPORT
Corporate Changes (Continued...)Date Event Type Company Name Current Company Name Corporate Changes Text
01/03/1983 Name Change Government Employees LifeInsurance Company
Banner Life Insurance Company Changed its name to Banner Life Insurance Companyeffective January 3, 1983.
Search for this company in Corporate Changes in BestLink to review previous changes.
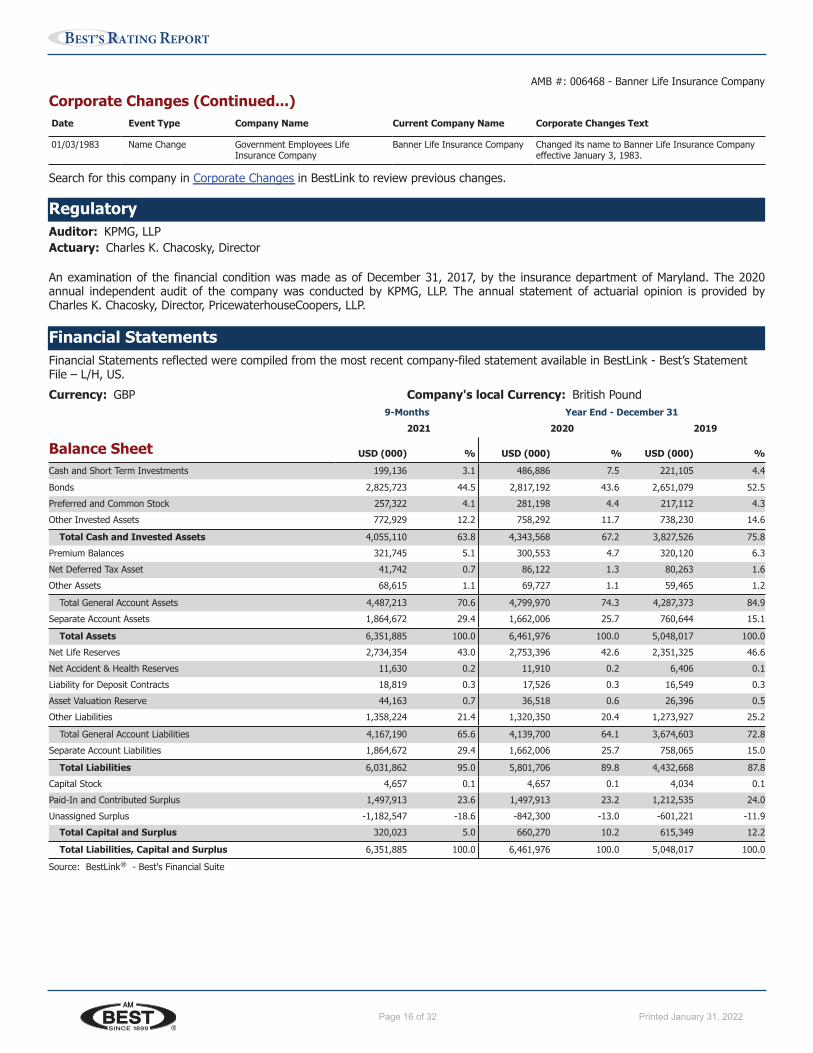
RegulatoryAuditor: KPMG, LLPActuary: Charles K. Chacosky, Director
An examination of the financial condition was made as of December 31, 2017, by the insurance department of Maryland. The 2020annual independent audit of the company was conducted by KPMG, LLP. The annual statement of actuarial opinion is provided byCharles K. Chacosky, Director, PricewaterhouseCoopers, LLP.
Financial StatementsFinancial Statements reflected were compiled from the most recent company-filed statement available in BestLink - Best’s StatementFile – L/H, US.Currency: GBP Company's local Currency: British Pound
9-Months Year End - December 312021 2020 2019
Balance Sheet USD (000) % USD (000) % USD (000) %Cash and Short Term Investments 199,136 3.1 486,886 7.5 221,105 4.4Bonds 2,825,723 44.5 2,817,192 43.6 2,651,079 52.5Preferred and Common Stock 257,322 4.1 281,198 4.4 217,112 4.3Other Invested Assets 772,929 12.2 758,292 11.7 738,230 14.6
Total Cash and Invested Assets 4,055,110 63.8 4,343,568 67.2 3,827,526 75.8Premium Balances 321,745 5.1 300,553 4.7 320,120 6.3Net Deferred Tax Asset 41,742 0.7 86,122 1.3 80,263 1.6Other Assets 68,615 1.1 69,727 1.1 59,465 1.2
Total General Account Assets 4,487,213 70.6 4,799,970 74.3 4,287,373 84.9Separate Account Assets 1,864,672 29.4 1,662,006 25.7 760,644 15.1
Total Assets 6,351,885 100.0 6,461,976 100.0 5,048,017 100.0Net Life Reserves 2,734,354 43.0 2,753,396 42.6 2,351,325 46.6Net Accident & Health Reserves 11,630 0.2 11,910 0.2 6,406 0.1Liability for Deposit Contracts 18,819 0.3 17,526 0.3 16,549 0.3Asset Valuation Reserve 44,163 0.7 36,518 0.6 26,396 0.5Other Liabilities 1,358,224 21.4 1,320,350 20.4 1,273,927 25.2
Total General Account Liabilities 4,167,190 65.6 4,139,700 64.1 3,674,603 72.8Separate Account Liabilities 1,864,672 29.4 1,662,006 25.7 758,065 15.0
Total Liabilities 6,031,862 95.0 5,801,706 89.8 4,432,668 87.8Capital Stock 4,657 0.1 4,657 0.1 4,034 0.1Paid-In and Contributed Surplus 1,497,913 23.6 1,497,913 23.2 1,212,535 24.0Unassigned Surplus -1,182,547 -18.6 -842,300 -13.0 -601,221 -11.9
Total Capital and Surplus 320,023 5.0 660,270 10.2 615,349 12.2
Total Liabilities, Capital and Surplus 6,351,885 100.0 6,461,976 100.0 5,048,017 100.0
Source: BestLink ® - Best's Financial Suite
AMB #: 006468 - Banner Life Insurance Company
www.ambest.com Page 16Printed for Bcrs on January 28, 2022
Page 17 of 32 Printed January 31, 2022
BEST’S RATING REPORT
9-Months Year End - December 31
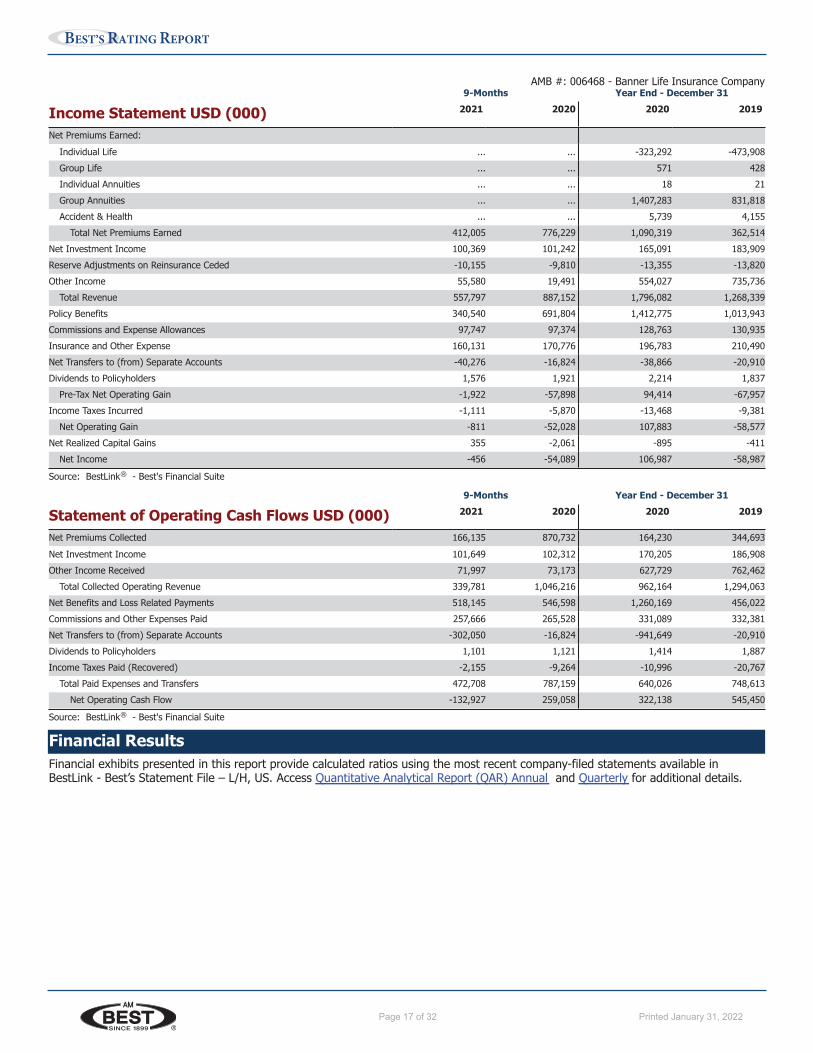
Income Statement USD (000) 2021 2020 2020 2019
Net Premiums Earned:Individual Life ... ... -323,292 -473,908Group Life ... ... 571 428Individual Annuities ... ... 18 21Group Annuities ... ... 1,407,283 831,818Accident & Health ... ... 5,739 4,155
Total Net Premiums Earned 412,005 776,229 1,090,319 362,514Net Investment Income 100,369 101,242 165,091 183,909Reserve Adjustments on Reinsurance Ceded -10,155 -9,810 -13,355 -13,820Other Income 55,580 19,491 554,027 735,736
Total Revenue 557,797 887,152 1,796,082 1,268,339Policy Benefits 340,540 691,804 1,412,775 1,013,943Commissions and Expense Allowances 97,747 97,374 128,763 130,935Insurance and Other Expense 160,131 170,776 196,783 210,490Net Transfers to (from) Separate Accounts -40,276 -16,824 -38,866 -20,910Dividends to Policyholders 1,576 1,921 2,214 1,837
Pre-Tax Net Operating Gain -1,922 -57,898 94,414 -67,957Income Taxes Incurred -1,111 -5,870 -13,468 -9,381
Net Operating Gain -811 -52,028 107,883 -58,577Net Realized Capital Gains 355 -2,061 -895 -411
Net Income -456 -54,089 106,987 -58,987
Source: BestLink ® - Best's Financial Suite
9-Months Year End - December 31
Statement of Operating Cash Flows USD (000) 2021 2020 2020 2019
Net Premiums Collected 166,135 870,732 164,230 344,693Net Investment Income 101,649 102,312 170,205 186,908Other Income Received 71,997 73,173 627,729 762,462
Total Collected Operating Revenue 339,781 1,046,216 962,164 1,294,063Net Benefits and Loss Related Payments 518,145 546,598 1,260,169 456,022Commissions and Other Expenses Paid 257,666 265,528 331,089 332,381Net Transfers to (from) Separate Accounts -302,050 -16,824 -941,649 -20,910Dividends to Policyholders 1,101 1,121 1,414 1,887Income Taxes Paid (Recovered) -2,155 -9,264 -10,996 -20,767
Total Paid Expenses and Transfers 472,708 787,159 640,026 748,613Net Operating Cash Flow -132,927 259,058 322,138 545,450
Source: BestLink ® - Best's Financial Suite
Financial ResultsFinancial exhibits presented in this report provide calculated ratios using the most recent company-filed statements available inBestLink - Best’s Statement File – L/H, US. Access Quantitative Analytical Report (QAR) Annual and Quarterly for additional details.
AMB #: 006468 - Banner Life Insurance Company
www.ambest.com Page 17Printed for Bcrs on January 28, 2022
Page 18 of 32 Printed January 31, 2022
BEST’S RATING REPORT
Key Financial Indicators9-Months Year End - December 31
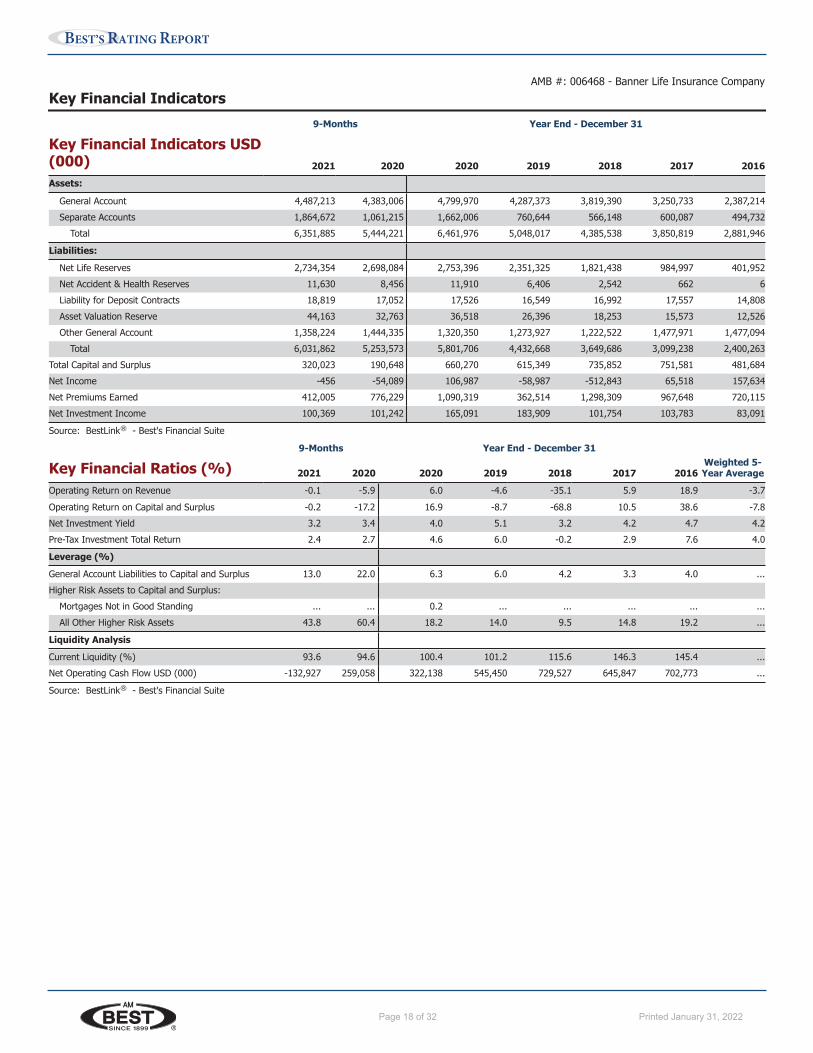
Key Financial Indicators USD(000) 2021 2020 2020 2019 2018 2017 2016Assets:
General Account 4,487,213 4,383,006 4,799,970 4,287,373 3,819,390 3,250,733 2,387,214Separate Accounts 1,864,672 1,061,215 1,662,006 760,644 566,148 600,087 494,732
Total 6,351,885 5,444,221 6,461,976 5,048,017 4,385,538 3,850,819 2,881,946
Liabilities:Net Life Reserves 2,734,354 2,698,084 2,753,396 2,351,325 1,821,438 984,997 401,952Net Accident & Health Reserves 11,630 8,456 11,910 6,406 2,542 662 6Liability for Deposit Contracts 18,819 17,052 17,526 16,549 16,992 17,557 14,808Asset Valuation Reserve 44,163 32,763 36,518 26,396 18,253 15,573 12,526Other General Account 1,358,224 1,444,335 1,320,350 1,273,927 1,222,522 1,477,971 1,477,094
Total 6,031,862 5,253,573 5,801,706 4,432,668 3,649,686 3,099,238 2,400,263Total Capital and Surplus 320,023 190,648 660,270 615,349 735,852 751,581 481,684Net Income -456 -54,089 106,987 -58,987 -512,843 65,518 157,634Net Premiums Earned 412,005 776,229 1,090,319 362,514 1,298,309 967,648 720,115Net Investment Income 100,369 101,242 165,091 183,909 101,754 103,783 83,091
Source: BestLink ® - Best's Financial Suite
9-Months Year End - December 31Weighted 5-Year AverageKey Financial Ratios (%) 2021 2020 2020 2019 2018 2017 2016
Operating Return on Revenue -0.1 -5.9 6.0 -4.6 -35.1 5.9 18.9 -3.7Operating Return on Capital and Surplus -0.2 -17.2 16.9 -8.7 -68.8 10.5 38.6 -7.8Net Investment Yield 3.2 3.4 4.0 5.1 3.2 4.2 4.7 4.2Pre-Tax Investment Total Return 2.4 2.7 4.6 6.0 -0.2 2.9 7.6 4.0
Leverage (%)General Account Liabilities to Capital and Surplus 13.0 22.0 6.3 6.0 4.2 3.3 4.0 ...Higher Risk Assets to Capital and Surplus:
Mortgages Not in Good Standing ... ... 0.2 ... ... ... ... ...All Other Higher Risk Assets 43.8 60.4 18.2 14.0 9.5 14.8 19.2 ...
Liquidity AnalysisCurrent Liquidity (%) 93.6 94.6 100.4 101.2 115.6 146.3 145.4 ...Net Operating Cash Flow USD (000) -132,927 259,058 322,138 545,450 729,527 645,847 702,773 ...
Source: BestLink ® - Best's Financial Suite
AMB #: 006468 - Banner Life Insurance Company
www.ambest.com Page 18Printed for Bcrs on January 28, 2022
Page 19 of 32 Printed January 31, 2022
BEST’S RATING REPORT
Balance Sheet Highlights9-Months Year End - December 31
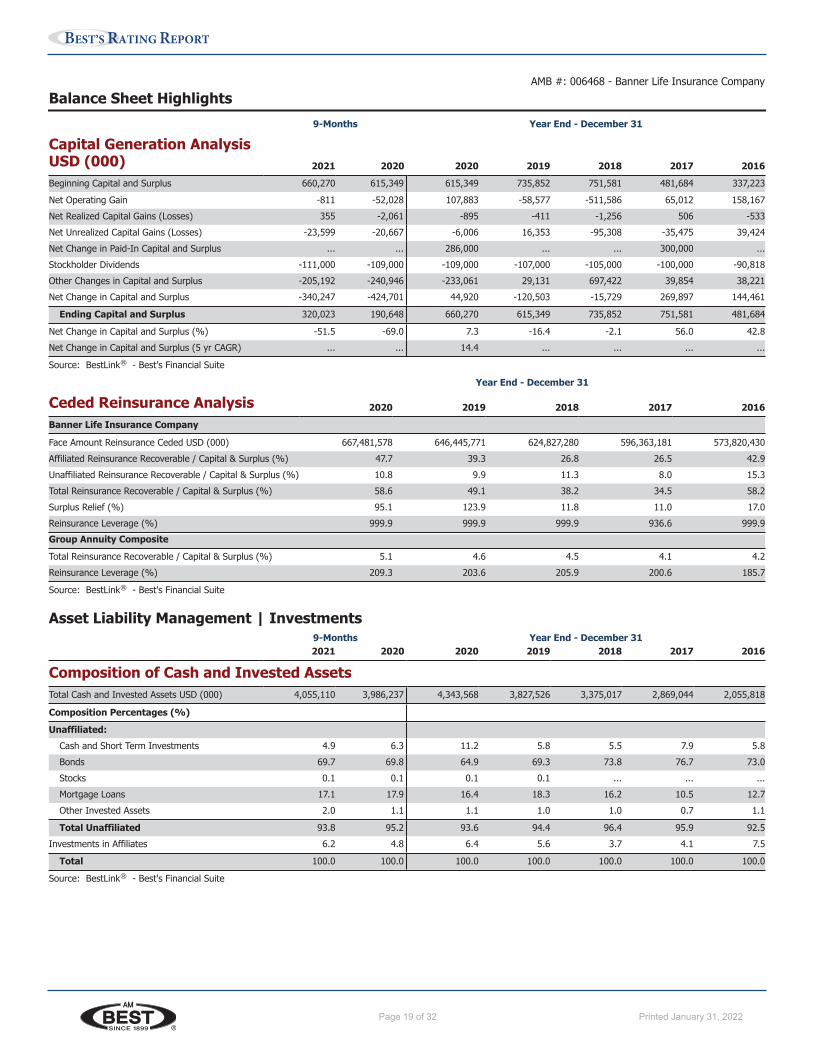
Capital Generation AnalysisUSD (000) 2021 2020 2020 2019 2018 2017 2016Beginning Capital and Surplus 660,270 615,349 615,349 735,852 751,581 481,684 337,223Net Operating Gain -811 -52,028 107,883 -58,577 -511,586 65,012 158,167Net Realized Capital Gains (Losses) 355 -2,061 -895 -411 -1,256 506 -533Net Unrealized Capital Gains (Losses) -23,599 -20,667 -6,006 16,353 -95,308 -35,475 39,424Net Change in Paid-In Capital and Surplus ... ... 286,000 ... ... 300,000 ...Stockholder Dividends -111,000 -109,000 -109,000 -107,000 -105,000 -100,000 -90,818Other Changes in Capital and Surplus -205,192 -240,946 -233,061 29,131 697,422 39,854 38,221Net Change in Capital and Surplus -340,247 -424,701 44,920 -120,503 -15,729 269,897 144,461
Ending Capital and Surplus 320,023 190,648 660,270 615,349 735,852 751,581 481,684
Net Change in Capital and Surplus (%) -51.5 -69.0 7.3 -16.4 -2.1 56.0 42.8Net Change in Capital and Surplus (5 yr CAGR) ... ... 14.4 ... ... ... ...
Source: BestLink ® - Best's Financial Suite
Year End - December 31
Ceded Reinsurance Analysis 2020 2019 2018 2017 2016Banner Life Insurance Company
Face Amount Reinsurance Ceded USD (000) 667,481,578 646,445,771 624,827,280 596,363,181 573,820,430Affiliated Reinsurance Recoverable / Capital & Surplus (%) 47.7 39.3 26.8 26.5 42.9Unaffiliated Reinsurance Recoverable / Capital & Surplus (%) 10.8 9.9 11.3 8.0 15.3Total Reinsurance Recoverable / Capital & Surplus (%) 58.6 49.1 38.2 34.5 58.2Surplus Relief (%) 95.1 123.9 11.8 11.0 17.0Reinsurance Leverage (%) 999.9 999.9 999.9 936.6 999.9Group Annuity CompositeTotal Reinsurance Recoverable / Capital & Surplus (%) 5.1 4.6 4.5 4.1 4.2Reinsurance Leverage (%) 209.3 203.6 205.9 200.6 185.7
Source: BestLink ® - Best's Financial Suite
Asset Liability Management | Investments9-Months Year End - December 312021 2020 2020 2019 2018 2017 2016
Composition of Cash and Invested AssetsTotal Cash and Invested Assets USD (000) 4,055,110 3,986,237 4,343,568 3,827,526 3,375,017 2,869,044 2,055,818
Composition Percentages (%)Unaffiliated:
Cash and Short Term Investments 4.9 6.3 11.2 5.8 5.5 7.9 5.8Bonds 69.7 69.8 64.9 69.3 73.8 76.7 73.0Stocks 0.1 0.1 0.1 0.1 ... ... ...Mortgage Loans 17.1 17.9 16.4 18.3 16.2 10.5 12.7Other Invested Assets 2.0 1.1 1.1 1.0 1.0 0.7 1.1
Total Unaffiliated 93.8 95.2 93.6 94.4 96.4 95.9 92.5Investments in Affiliates 6.2 4.8 6.4 5.6 3.7 4.1 7.5
Total 100.0 100.0 100.0 100.0 100.0 100.0 100.0
Source: BestLink ® - Best's Financial Suite
AMB #: 006468 - Banner Life Insurance Company
www.ambest.com Page 19Printed for Bcrs on January 28, 2022
Page 20 of 32 Printed January 31, 2022
BEST’S RATING REPORT
Balance Sheet Highlights
Asset Liability Management | Investments (Continued...)Years
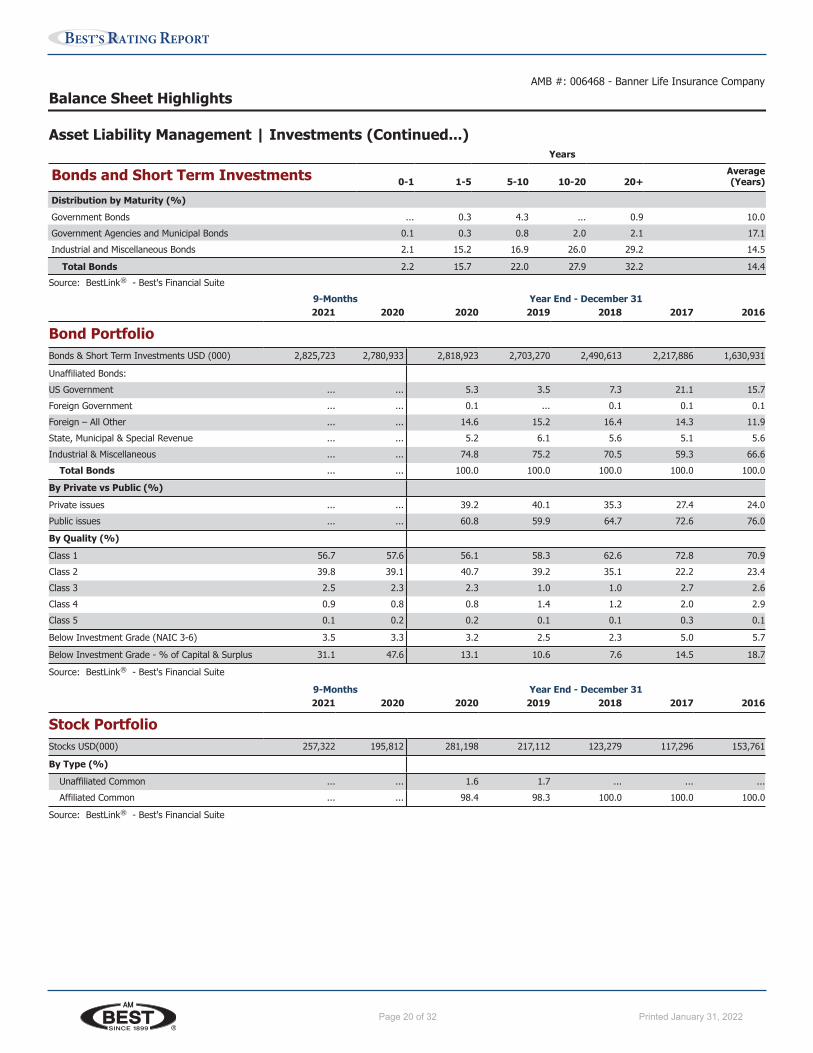
Bonds and Short Term Investments 0-1 1-5 5-10 10-20 20+Average(Years)
Distribution by Maturity (%)Government Bonds ... 0.3 4.3 ... 0.9 10.0Government Agencies and Municipal Bonds 0.1 0.3 0.8 2.0 2.1 17.1Industrial and Miscellaneous Bonds 2.1 15.2 16.9 26.0 29.2 14.5
Total Bonds 2.2 15.7 22.0 27.9 32.2 14.4Source: BestLink ® - Best's Financial Suite
9-Months Year End - December 312021 2020 2020 2019 2018 2017 2016
Bond PortfolioBonds & Short Term Investments USD (000) 2,825,723 2,780,933 2,818,923 2,703,270 2,490,613 2,217,886 1,630,931
Unaffiliated Bonds:US Government ... ... 5.3 3.5 7.3 21.1 15.7Foreign Government ... ... 0.1 ... 0.1 0.1 0.1Foreign – All Other ... ... 14.6 15.2 16.4 14.3 11.9State, Municipal & Special Revenue ... ... 5.2 6.1 5.6 5.1 5.6Industrial & Miscellaneous ... ... 74.8 75.2 70.5 59.3 66.6
Total Bonds ... ... 100.0 100.0 100.0 100.0 100.0
By Private vs Public (%)Private issues ... ... 39.2 40.1 35.3 27.4 24.0Public issues ... ... 60.8 59.9 64.7 72.6 76.0
By Quality (%)Class 1 56.7 57.6 56.1 58.3 62.6 72.8 70.9Class 2 39.8 39.1 40.7 39.2 35.1 22.2 23.4Class 3 2.5 2.3 2.3 1.0 1.0 2.7 2.6Class 4 0.9 0.8 0.8 1.4 1.2 2.0 2.9Class 5 0.1 0.2 0.2 0.1 0.1 0.3 0.1
Below Investment Grade (NAIC 3-6) 3.5 3.3 3.2 2.5 2.3 5.0 5.7
Below Investment Grade - % of Capital & Surplus 31.1 47.6 13.1 10.6 7.6 14.5 18.7
Source: BestLink ® - Best's Financial Suite
9-Months Year End - December 312021 2020 2020 2019 2018 2017 2016
Stock PortfolioStocks USD(000) 257,322 195,812 281,198 217,112 123,279 117,296 153,761
By Type (%)Unaffiliated Common ... ... 1.6 1.7 ... ... ...Affiliated Common ... ... 98.4 98.3 100.0 100.0 100.0
Source: BestLink ® - Best's Financial Suite
AMB #: 006468 - Banner Life Insurance Company
www.ambest.com Page 20Printed for Bcrs on January 28, 2022
Page 21 of 32 Printed January 31, 2022
BEST’S RATING REPORT
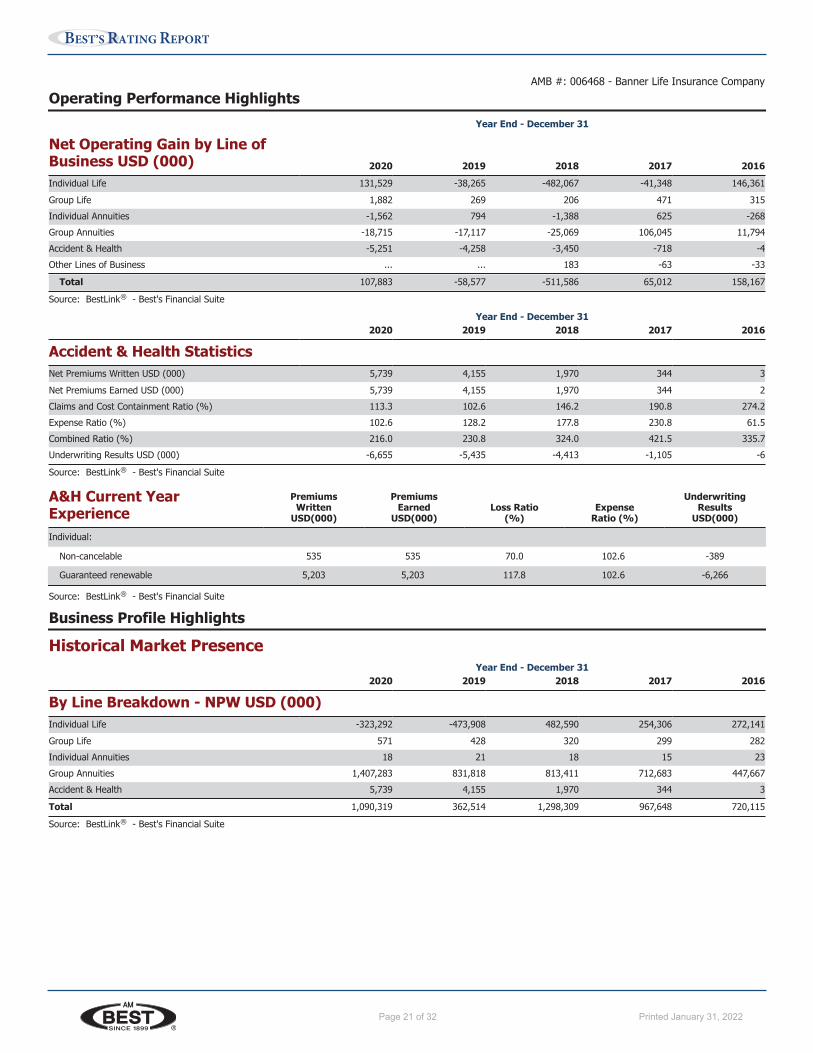
Operating Performance HighlightsYear End - December 31
Net Operating Gain by Line ofBusiness USD (000) 2020 2019 2018 2017 2016Individual Life 131,529 -38,265 -482,067 -41,348 146,361Group Life 1,882 269 206 471 315Individual Annuities -1,562 794 -1,388 625 -268Group Annuities -18,715 -17,117 -25,069 106,045 11,794Accident & Health -5,251 -4,258 -3,450 -718 -4Other Lines of Business ... ... 183 -63 -33
Total 107,883 -58,577 -511,586 65,012 158,167
Source: BestLink ® - Best's Financial Suite
Year End - December 312020 2019 2018 2017 2016
Accident & Health StatisticsNet Premiums Written USD (000) 5,739 4,155 1,970 344 3Net Premiums Earned USD (000) 5,739 4,155 1,970 344 2Claims and Cost Containment Ratio (%) 113.3 102.6 146.2 190.8 274.2Expense Ratio (%) 102.6 128.2 177.8 230.8 61.5Combined Ratio (%) 216.0 230.8 324.0 421.5 335.7Underwriting Results USD (000) -6,655 -5,435 -4,413 -1,105 -6
Source: BestLink ® - Best's Financial Suite
A&H Current YearExperience
PremiumsWritten
USD(000)
PremiumsEarned
USD(000)Loss Ratio
(%)Expense
Ratio (%)
UnderwritingResults
USD(000)
Individual:
Non-cancelable 535 535 70.0 102.6 -389
Guaranteed renewable 5,203 5,203 117.8 102.6 -6,266
Source: BestLink ® - Best's Financial Suite
Business Profile Highlights
Historical Market PresenceYear End - December 31
2020 2019 2018 2017 2016
By Line Breakdown - NPW USD (000)Individual Life -323,292 -473,908 482,590 254,306 272,141Group Life 571 428 320 299 282Individual Annuities 18 21 18 15 23Group Annuities 1,407,283 831,818 813,411 712,683 447,667Accident & Health 5,739 4,155 1,970 344 3
Total 1,090,319 362,514 1,298,309 967,648 720,115
Source: BestLink ® - Best's Financial Suite
AMB #: 006468 - Banner Life Insurance Company
www.ambest.com Page 21Printed for Bcrs on January 28, 2022
Page 22 of 32 Printed January 31, 2022
BEST’S RATING REPORT
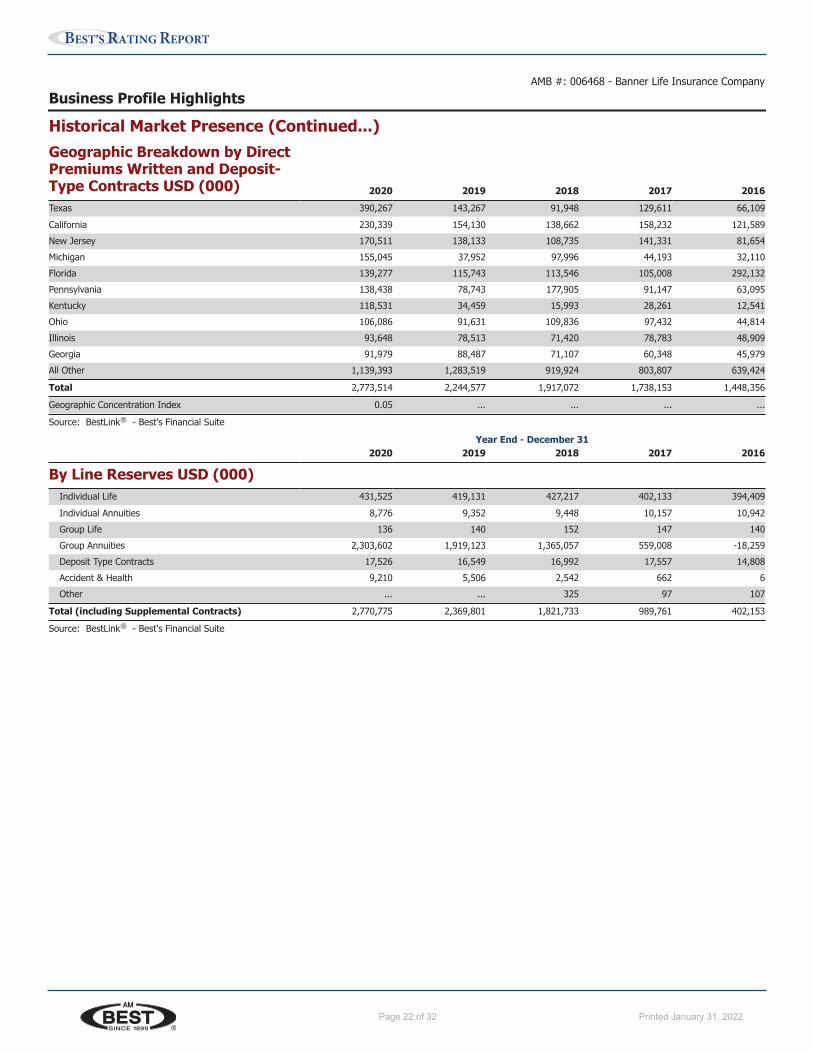
Business Profile Highlights
Historical Market Presence (Continued...)Geographic Breakdown by DirectPremiums Written and Deposit-Type Contracts USD (000) 2020 2019 2018 2017 2016Texas 390,267 143,267 91,948 129,611 66,109California 230,339 154,130 138,662 158,232 121,589New Jersey 170,511 138,133 108,735 141,331 81,654Michigan 155,045 37,952 97,996 44,193 32,110Florida 139,277 115,743 113,546 105,008 292,132Pennsylvania 138,438 78,743 177,905 91,147 63,095Kentucky 118,531 34,459 15,993 28,261 12,541Ohio 106,086 91,631 109,836 97,432 44,814Illinois 93,648 78,513 71,420 78,783 48,909Georgia 91,979 88,487 71,107 60,348 45,979All Other 1,139,393 1,283,519 919,924 803,807 639,424
Total 2,773,514 2,244,577 1,917,072 1,738,153 1,448,356
Geographic Concentration Index 0.05 ... ... ... ...
Source: BestLink ® - Best's Financial Suite
Year End - December 312020 2019 2018 2017 2016
By Line Reserves USD (000)Individual Life 431,525 419,131 427,217 402,133 394,409Individual Annuities 8,776 9,352 9,448 10,157 10,942Group Life 136 140 152 147 140Group Annuities 2,303,602 1,919,123 1,365,057 559,008 -18,259Deposit Type Contracts 17,526 16,549 16,992 17,557 14,808Accident & Health 9,210 5,506 2,542 662 6Other ... ... 325 97 107
Total (including Supplemental Contracts) 2,770,775 2,369,801 1,821,733 989,761 402,153
Source: BestLink ® - Best's Financial Suite
AMB #: 006468 - Banner Life Insurance Company
www.ambest.com Page 22Printed for Bcrs on January 28, 2022
Page 23 of 32 Printed January 31, 2022
BEST’S RATING REPORT
Business Profile Highlights
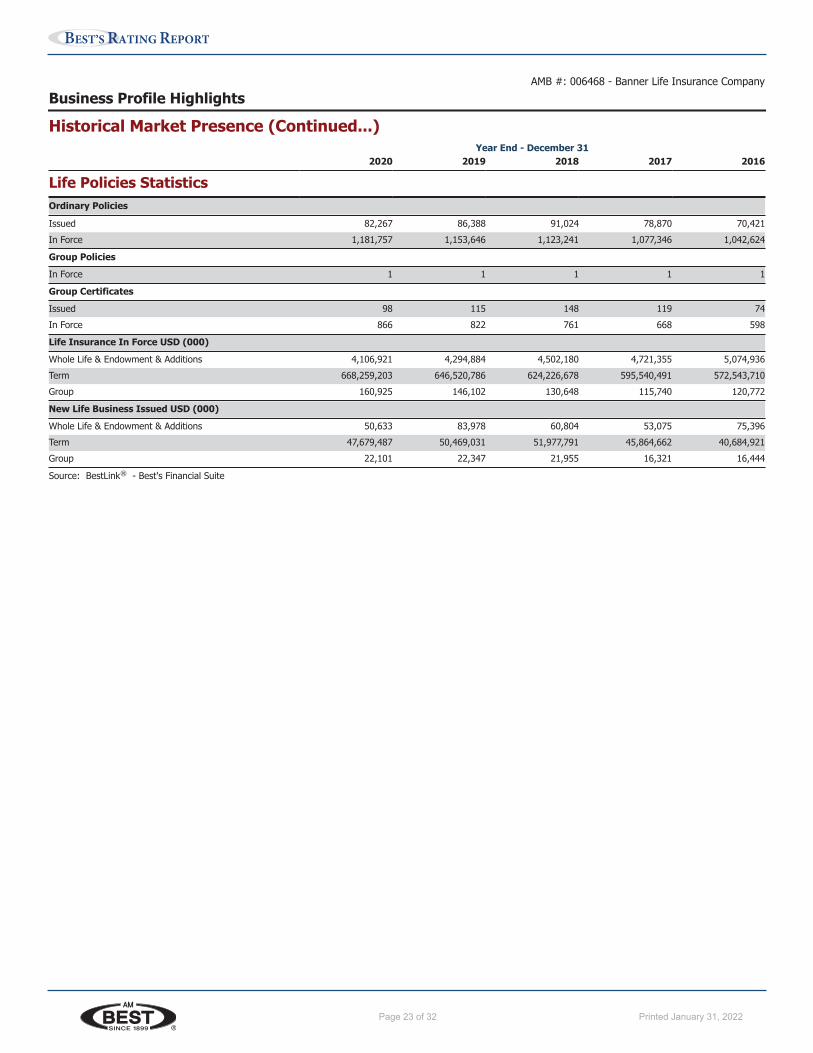
Historical Market Presence (Continued...)Year End - December 31
2020 2019 2018 2017 2016
Life Policies StatisticsOrdinary Policies
Issued 82,267 86,388 91,024 78,870 70,421In Force 1,181,757 1,153,646 1,123,241 1,077,346 1,042,624
Group PoliciesIn Force 1 1 1 1 1
Group CertificatesIssued 98 115 148 119 74In Force 866 822 761 668 598
Life Insurance In Force USD (000)Whole Life & Endowment & Additions 4,106,921 4,294,884 4,502,180 4,721,355 5,074,936Term 668,259,203 646,520,786 624,226,678 595,540,491 572,543,710Group 160,925 146,102 130,648 115,740 120,772
New Life Business Issued USD (000)Whole Life & Endowment & Additions 50,633 83,978 60,804 53,075 75,396Term 47,679,487 50,469,031 51,977,791 45,864,662 40,684,921Group 22,101 22,347 21,955 16,321 16,444
Source: BestLink ® - Best's Financial Suite
AMB #: 006468 - Banner Life Insurance Company
www.ambest.com Page 23Printed for Bcrs on January 28, 2022
Page 24 of 32 Printed January 31, 2022
BEST’S RATING REPORT
Last UpdateJanuary 28, 2022
IdentifiersAMB #: 006734NAIC #: 66230FEIN #: 13-1976260LEI #: 5493001KE6Q5DH04LJ92
Contact InformationAdministrative Office:3275 Bennett Creek Avenue,Frederick, Maryland 21704United StatesDomiciliary Address:70 E. Sunrise Highway, Suite 500,Valley Stream, New York 11581United States
Web: www.LGAmerica.comPhone: +1-516-794-3700Fax: +1-301-279-4178
Financial Data PresentedThe financial data in this reportreflects the most current dataavailable at the time the report wasprinted.
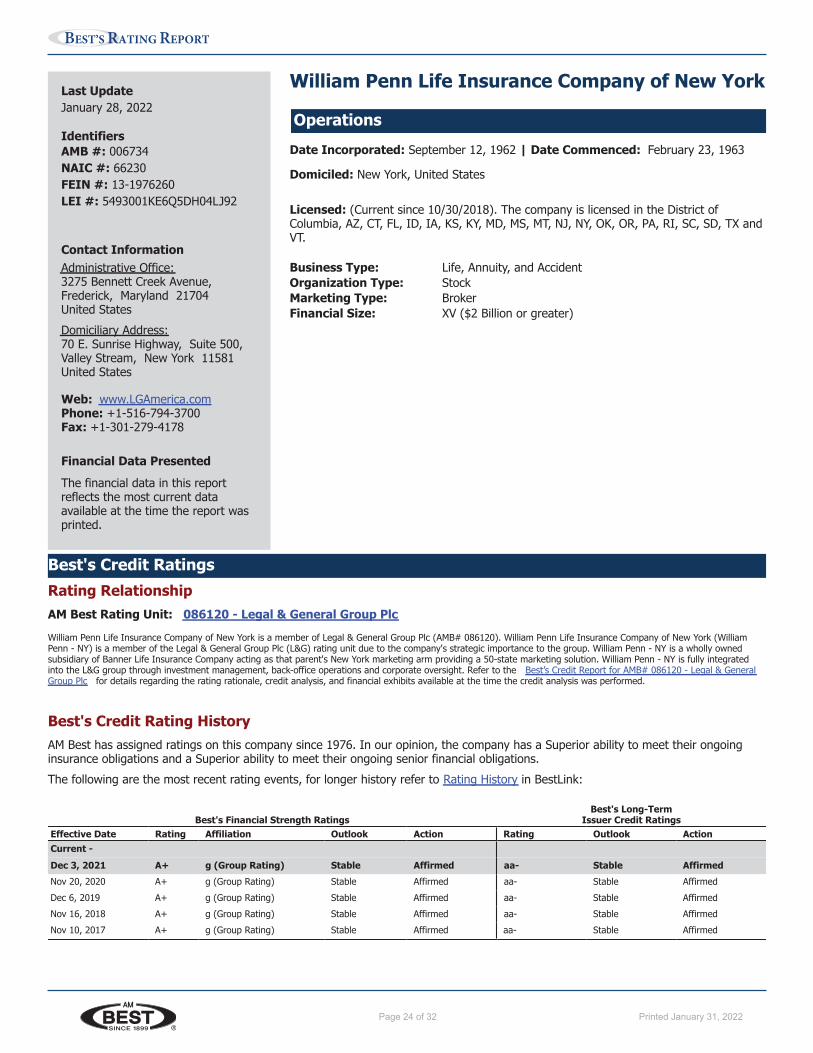
William Penn Life Insurance Company of New York
OperationsDate Incorporated: September 12, 1962 | Date Commenced: February 23, 1963
Domiciled: New York, United States
Licensed: (Current since 10/30/2018). The company is licensed in the District ofColumbia, AZ, CT, FL, ID, IA, KS, KY, MD, MS, MT, NJ, NY, OK, OR, PA, RI, SC, SD, TX andVT.
Business Type: Life, Annuity, and AccidentOrganization Type: StockMarketing Type: BrokerFinancial Size: XV ($2 Billion or greater)
Best's Credit RatingsRating RelationshipAM Best Rating Unit: 086120 - Legal & General Group Plc
William Penn Life Insurance Company of New York is a member of Legal & General Group Plc (AMB# 086120). William Penn Life Insurance Company of New York (WilliamPenn - NY) is a member of the Legal & General Group Plc (L&G) rating unit due to the company's strategic importance to the group. William Penn - NY is a wholly ownedsubsidiary of Banner Life Insurance Company acting as that parent's New York marketing arm providing a 50-state marketing solution. William Penn - NY is fully integratedinto the L&G group through investment management, back-office operations and corporate oversight. Refer to the Best’s Credit Report for AMB# 086120 - Legal & GeneralGroup Plc for details regarding the rating rationale, credit analysis, and financial exhibits available at the time the credit analysis was performed.
Best's Credit Rating HistoryAM Best has assigned ratings on this company since 1976. In our opinion, the company has a Superior ability to meet their ongoinginsurance obligations and a Superior ability to meet their ongoing senior financial obligations.The following are the most recent rating events, for longer history refer to Rating History in BestLink:
Best's FinancialBest's Financial Strength Ratings
Best's Long-TermIssuer Credit Ratings
Effective Date Rating Affiliation Outlook Action Rating Outlook ActionCurrent -Dec 3, 2021 A+ g (Group Rating) Stable Affirmed aa- Stable AffirmedNov 20, 2020 A+ g (Group Rating) Stable Affirmed aa- Stable AffirmedDec 6, 2019 A+ g (Group Rating) Stable Affirmed aa- Stable AffirmedNov 16, 2018 A+ g (Group Rating) Stable Affirmed aa- Stable AffirmedNov 10, 2017 A+ g (Group Rating) Stable Affirmed aa- Stable Affirmed
www.ambest.com Page 24Printed for Bcrs on January 31, 2022
Page 25 of 32 Printed January 31, 2022
BEST’S RATING REPORT
Corporate StructureUltimate Parent: AMB # 086120 - Legal & General Group Plc
Based on AM Best's analysis, AMB# 086120 Legal & General Group Plc is the AMB Ultimate Parent and identifies the topmost entity ofthe corporate structure. Access in BestLink this company’s current Corporate Structure.
ManagementOfficers
President and CEO: Mark N. HolwegerCFO, SVP and Treasurer: Andrew D. LoveSVP: Jennifer Torneden (Sales & Strategic Growth)Vice President and Chief Investment Officer: Allah KleynerVice President and Chief Risk Officer: Amy ButlerVice President, Secretary and General Counsel: Bryan R. NewcombeVice President and Controller: Helen MiksitsVice President and Chief Medical Officer: Edgar Fernandez, MDVice President and Medical Director: Yasmeen Beg, MDVice President and Medical Director: James Kadouch, MDVice President and Medical Director: Alacia Tarpley, MDVice President: Ross W. Baker (Corporate Tax)Vice President: Michael D. Behlmaier (Customer Marketing)Vice President: Sarah Bennet (Marketing)Vice President: Ame R. T. Biggart (Corporate Actuarial)Vice President: Farron Blanc (Brokerage Distribution & Strategy)Vice President: Patti DeWitt (Underwriting & Claims Operations)Vice President: Barbara A. Esau (Human Resources)Vice President: Matthew J. Harasty (Internal Audit)Vice President: Sharon P. Jenkins (Underwriting Audit)Vice President: Michael McCarty (Valuation)Vice President: Brittan Riesse (IT Infrastructure & Cyber Security)Vice President: John C. Stanek (Financial Planning & Strategy)Vice President: Fred Tavan (Product & Pricing)Vice President: Brooke Vemuri (Business Change & Transformation)Vice President: Anthony Wickline (Finance Transformation, Innovation & Controls)
Directors
Bernie L. HickmanMark HolwegerAlla KleynerDeborah D. LambertAndrew D. LoveJohn P. MurrinGeorge L. Palms, Jr.Philip C. SurprenantJennifer Torneden
History
Originally incorporated as Modern Life Insurance Company, in 1968 the title was changed to ITT Life Insurance Company of New York.In 1972 the name changed to William Penn Life Insurance Company of New York and its present title was adopted in 1975.
AMB #: 006734 - William Penn Life Ins Co of New York
www.ambest.com Page 25Printed for Bcrs on January 31, 2022
Page 26 of 32 Printed January 31, 2022
BEST’S RATING REPORT
Corporate ChangesDate Event Type Company Name Current Company Name Corporate Changes Text
01/15/1975 Name Change Penn Life Insurance Company of NewYork
William Penn Life InsuranceCompany of New York
Changed its name to William Penn Life InsuranceCompany of New York effective January 15, 1975.
12/29/1972 Name Change ITT Life Insurance Company of NewYork
William Penn Life InsuranceCompany of New York
Changed its name to Penn Life Insurance Company ofNew York effective December 29, 1972.
04/01/1968 Name Change Modern Life Insurance Company William Penn Life InsuranceCompany of New York
Changed its name to ITT Life Insurance Companyeffective April 1, 1968.
Search for this company in Corporate Changes in BestLink to review previous changes.
Mergers
Banner Life Insurance Company of New York, 1991.
RegulatoryAuditor: KPMG, LLPActuary: Charles K. Chacosky, FSA, MAAA
An examination of the financial condition was made as of December 31, 2017, by the insurance department of New York. The 2020annual independent audit of the company was conducted by KPMG, LLP. The annual statement of actuarial opinion is provided byCharles K. Chacosky, FSA, MAAA, PricewaterhouseCoopers, LLP.
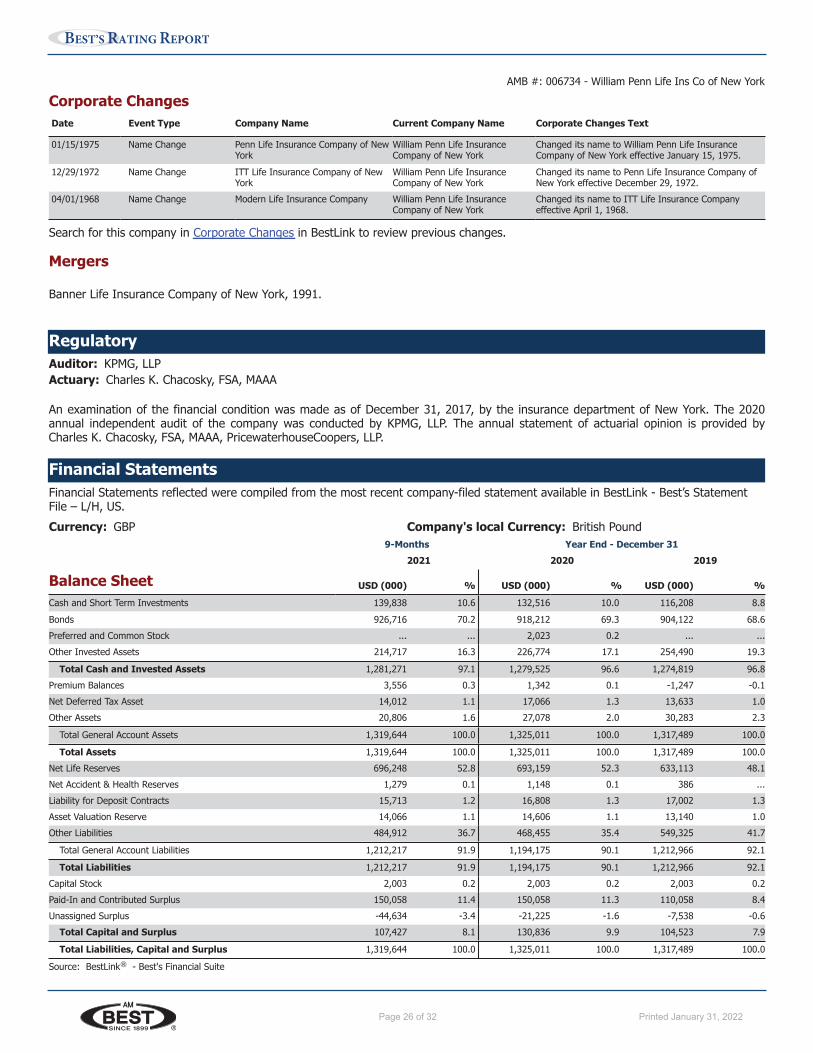
Financial StatementsFinancial Statements reflected were compiled from the most recent company-filed statement available in BestLink - Best’s StatementFile – L/H, US.Currency: GBP Company's local Currency: British Pound
9-Months Year End - December 312021 2020 2019
Balance Sheet USD (000) % USD (000) % USD (000) %Cash and Short Term Investments 139,838 10.6 132,516 10.0 116,208 8.8Bonds 926,716 70.2 918,212 69.3 904,122 68.6Preferred and Common Stock ... ... 2,023 0.2 ... ...Other Invested Assets 214,717 16.3 226,774 17.1 254,490 19.3
Total Cash and Invested Assets 1,281,271 97.1 1,279,525 96.6 1,274,819 96.8Premium Balances 3,556 0.3 1,342 0.1 -1,247 -0.1Net Deferred Tax Asset 14,012 1.1 17,066 1.3 13,633 1.0Other Assets 20,806 1.6 27,078 2.0 30,283 2.3
Total General Account Assets 1,319,644 100.0 1,325,011 100.0 1,317,489 100.0
Total Assets 1,319,644 100.0 1,325,011 100.0 1,317,489 100.0Net Life Reserves 696,248 52.8 693,159 52.3 633,113 48.1Net Accident & Health Reserves 1,279 0.1 1,148 0.1 386 ...Liability for Deposit Contracts 15,713 1.2 16,808 1.3 17,002 1.3Asset Valuation Reserve 14,066 1.1 14,606 1.1 13,140 1.0Other Liabilities 484,912 36.7 468,455 35.4 549,325 41.7
Total General Account Liabilities 1,212,217 91.9 1,194,175 90.1 1,212,966 92.1
Total Liabilities 1,212,217 91.9 1,194,175 90.1 1,212,966 92.1Capital Stock 2,003 0.2 2,003 0.2 2,003 0.2Paid-In and Contributed Surplus 150,058 11.4 150,058 11.3 110,058 8.4Unassigned Surplus -44,634 -3.4 -21,225 -1.6 -7,538 -0.6
Total Capital and Surplus 107,427 8.1 130,836 9.9 104,523 7.9
Total Liabilities, Capital and Surplus 1,319,644 100.0 1,325,011 100.0 1,317,489 100.0
Source: BestLink ® - Best's Financial Suite
AMB #: 006734 - William Penn Life Ins Co of New York
www.ambest.com Page 26Printed for Bcrs on January 31, 2022
Page 27 of 32 Printed January 31, 2022
BEST’S RATING REPORT
9-Months Year End - December 31
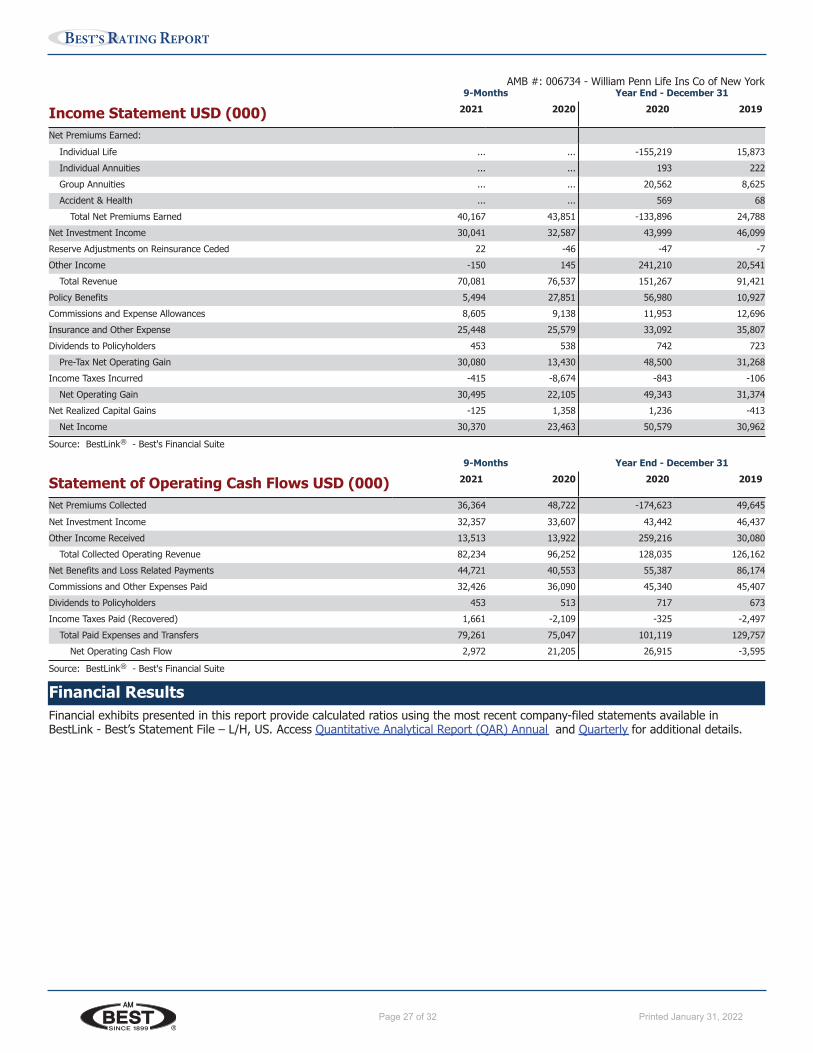
Income Statement USD (000) 2021 2020 2020 2019
Net Premiums Earned:Individual Life ... ... -155,219 15,873Individual Annuities ... ... 193 222Group Annuities ... ... 20,562 8,625Accident & Health ... ... 569 68
Total Net Premiums Earned 40,167 43,851 -133,896 24,788Net Investment Income 30,041 32,587 43,999 46,099Reserve Adjustments on Reinsurance Ceded 22 -46 -47 -7Other Income -150 145 241,210 20,541
Total Revenue 70,081 76,537 151,267 91,421Policy Benefits 5,494 27,851 56,980 10,927Commissions and Expense Allowances 8,605 9,138 11,953 12,696Insurance and Other Expense 25,448 25,579 33,092 35,807Dividends to Policyholders 453 538 742 723
Pre-Tax Net Operating Gain 30,080 13,430 48,500 31,268Income Taxes Incurred -415 -8,674 -843 -106
Net Operating Gain 30,495 22,105 49,343 31,374Net Realized Capital Gains -125 1,358 1,236 -413
Net Income 30,370 23,463 50,579 30,962
Source: BestLink ® - Best's Financial Suite
9-Months Year End - December 31
Statement of Operating Cash Flows USD (000) 2021 2020 2020 2019
Net Premiums Collected 36,364 48,722 -174,623 49,645Net Investment Income 32,357 33,607 43,442 46,437Other Income Received 13,513 13,922 259,216 30,080
Total Collected Operating Revenue 82,234 96,252 128,035 126,162Net Benefits and Loss Related Payments 44,721 40,553 55,387 86,174Commissions and Other Expenses Paid 32,426 36,090 45,340 45,407Dividends to Policyholders 453 513 717 673Income Taxes Paid (Recovered) 1,661 -2,109 -325 -2,497
Total Paid Expenses and Transfers 79,261 75,047 101,119 129,757Net Operating Cash Flow 2,972 21,205 26,915 -3,595
Source: BestLink ® - Best's Financial Suite
Financial ResultsFinancial exhibits presented in this report provide calculated ratios using the most recent company-filed statements available inBestLink - Best’s Statement File – L/H, US. Access Quantitative Analytical Report (QAR) Annual and Quarterly for additional details.
AMB #: 006734 - William Penn Life Ins Co of New York
www.ambest.com Page 27Printed for Bcrs on January 31, 2022
Page 28 of 32 Printed January 31, 2022
BEST’S RATING REPORT
Key Financial Indicators9-Months Year End - December 31
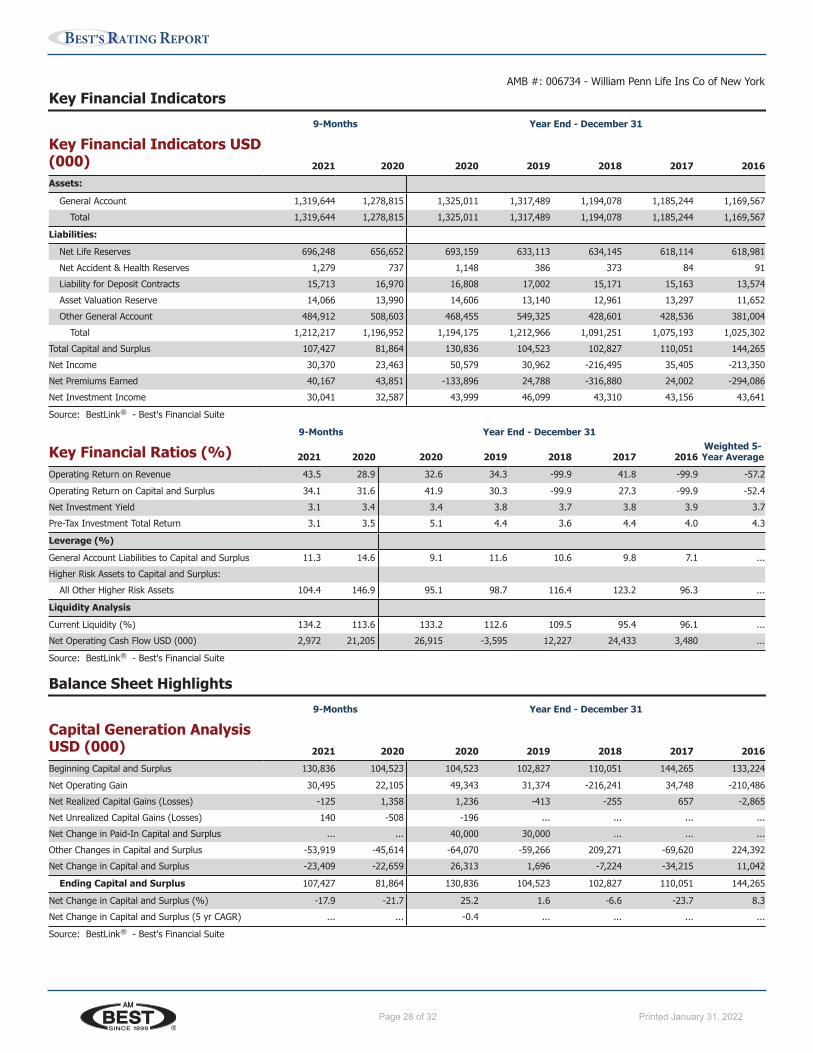
Key Financial Indicators USD(000) 2021 2020 2020 2019 2018 2017 2016Assets:
General Account 1,319,644 1,278,815 1,325,011 1,317,489 1,194,078 1,185,244 1,169,567Total 1,319,644 1,278,815 1,325,011 1,317,489 1,194,078 1,185,244 1,169,567
Liabilities:Net Life Reserves 696,248 656,652 693,159 633,113 634,145 618,114 618,981Net Accident & Health Reserves 1,279 737 1,148 386 373 84 91Liability for Deposit Contracts 15,713 16,970 16,808 17,002 15,171 15,163 13,574Asset Valuation Reserve 14,066 13,990 14,606 13,140 12,961 13,297 11,652Other General Account 484,912 508,603 468,455 549,325 428,601 428,536 381,004
Total 1,212,217 1,196,952 1,194,175 1,212,966 1,091,251 1,075,193 1,025,302Total Capital and Surplus 107,427 81,864 130,836 104,523 102,827 110,051 144,265Net Income 30,370 23,463 50,579 30,962 -216,495 35,405 -213,350Net Premiums Earned 40,167 43,851 -133,896 24,788 -316,880 24,002 -294,086Net Investment Income 30,041 32,587 43,999 46,099 43,310 43,156 43,641
Source: BestLink ® - Best's Financial Suite
9-Months Year End - December 31Weighted 5-Year AverageKey Financial Ratios (%) 2021 2020 2020 2019 2018 2017 2016
Operating Return on Revenue 43.5 28.9 32.6 34.3 -99.9 41.8 -99.9 -57.2Operating Return on Capital and Surplus 34.1 31.6 41.9 30.3 -99.9 27.3 -99.9 -52.4Net Investment Yield 3.1 3.4 3.4 3.8 3.7 3.8 3.9 3.7Pre-Tax Investment Total Return 3.1 3.5 5.1 4.4 3.6 4.4 4.0 4.3
Leverage (%)General Account Liabilities to Capital and Surplus 11.3 14.6 9.1 11.6 10.6 9.8 7.1 ...Higher Risk Assets to Capital and Surplus:
All Other Higher Risk Assets 104.4 146.9 95.1 98.7 116.4 123.2 96.3 ...
Liquidity AnalysisCurrent Liquidity (%) 134.2 113.6 133.2 112.6 109.5 95.4 96.1 ...Net Operating Cash Flow USD (000) 2,972 21,205 26,915 -3,595 12,227 24,433 3,480 ...
Source: BestLink ® - Best's Financial Suite
Balance Sheet Highlights9-Months Year End - December 31
Capital Generation AnalysisUSD (000) 2021 2020 2020 2019 2018 2017 2016Beginning Capital and Surplus 130,836 104,523 104,523 102,827 110,051 144,265 133,224Net Operating Gain 30,495 22,105 49,343 31,374 -216,241 34,748 -210,486Net Realized Capital Gains (Losses) -125 1,358 1,236 -413 -255 657 -2,865Net Unrealized Capital Gains (Losses) 140 -508 -196 ... ... ... ...Net Change in Paid-In Capital and Surplus ... ... 40,000 30,000 ... ... ...Other Changes in Capital and Surplus -53,919 -45,614 -64,070 -59,266 209,271 -69,620 224,392Net Change in Capital and Surplus -23,409 -22,659 26,313 1,696 -7,224 -34,215 11,042
Ending Capital and Surplus 107,427 81,864 130,836 104,523 102,827 110,051 144,265
Net Change in Capital and Surplus (%) -17.9 -21.7 25.2 1.6 -6.6 -23.7 8.3Net Change in Capital and Surplus (5 yr CAGR) ... ... -0.4 ... ... ... ...
Source: BestLink ® - Best's Financial Suite
AMB #: 006734 - William Penn Life Ins Co of New York
www.ambest.com Page 28Printed for Bcrs on January 31, 2022
Page 29 of 32 Printed January 31, 2022
BEST’S RATING REPORT
Balance Sheet HighlightsYear End - December 31
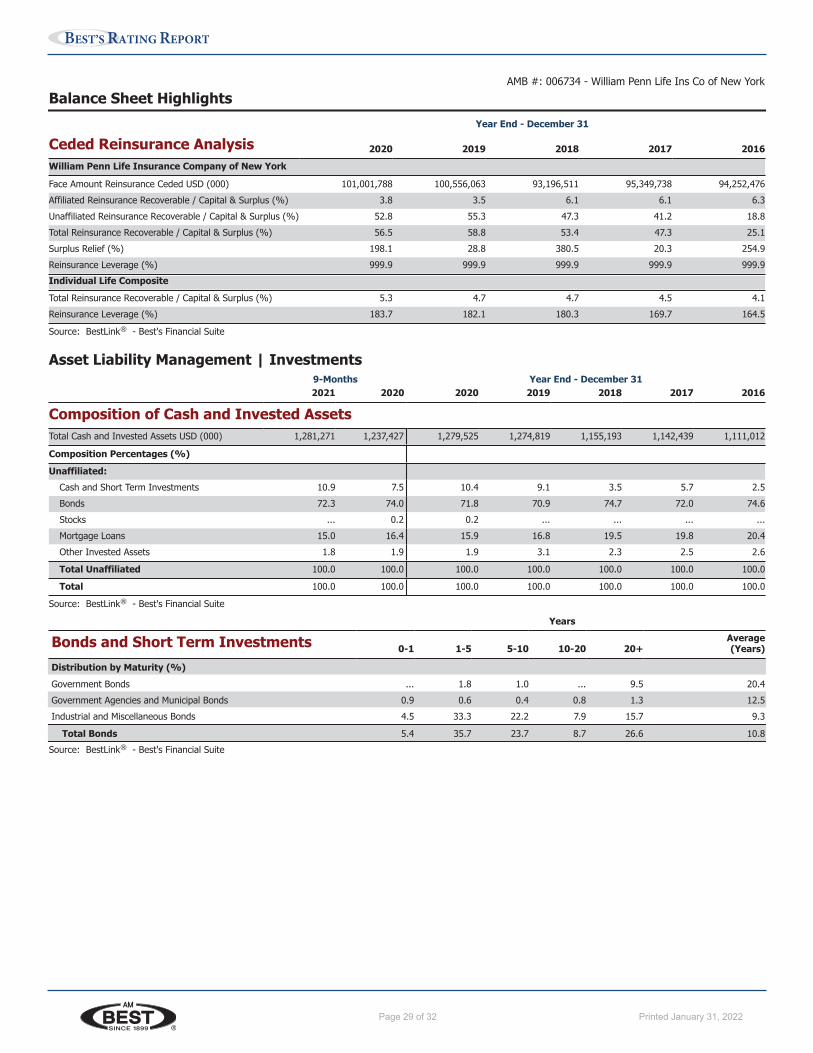
Ceded Reinsurance Analysis 2020 2019 2018 2017 2016William Penn Life Insurance Company of New York
Face Amount Reinsurance Ceded USD (000) 101,001,788 100,556,063 93,196,511 95,349,738 94,252,476Affiliated Reinsurance Recoverable / Capital & Surplus (%) 3.8 3.5 6.1 6.1 6.3Unaffiliated Reinsurance Recoverable / Capital & Surplus (%) 52.8 55.3 47.3 41.2 18.8Total Reinsurance Recoverable / Capital & Surplus (%) 56.5 58.8 53.4 47.3 25.1Surplus Relief (%) 198.1 28.8 380.5 20.3 254.9Reinsurance Leverage (%) 999.9 999.9 999.9 999.9 999.9Individual Life CompositeTotal Reinsurance Recoverable / Capital & Surplus (%) 5.3 4.7 4.7 4.5 4.1Reinsurance Leverage (%) 183.7 182.1 180.3 169.7 164.5
Source: BestLink ® - Best's Financial Suite
Asset Liability Management | Investments9-Months Year End - December 312021 2020 2020 2019 2018 2017 2016
Composition of Cash and Invested AssetsTotal Cash and Invested Assets USD (000) 1,281,271 1,237,427 1,279,525 1,274,819 1,155,193 1,142,439 1,111,012
Composition Percentages (%)Unaffiliated:
Cash and Short Term Investments 10.9 7.5 10.4 9.1 3.5 5.7 2.5Bonds 72.3 74.0 71.8 70.9 74.7 72.0 74.6Stocks ... 0.2 0.2 ... ... ... ...Mortgage Loans 15.0 16.4 15.9 16.8 19.5 19.8 20.4Other Invested Assets 1.8 1.9 1.9 3.1 2.3 2.5 2.6
Total Unaffiliated 100.0 100.0 100.0 100.0 100.0 100.0 100.0
Total 100.0 100.0 100.0 100.0 100.0 100.0 100.0
Source: BestLink ® - Best's Financial Suite
Years
Bonds and Short Term Investments 0-1 1-5 5-10 10-20 20+Average(Years)
Distribution by Maturity (%)Government Bonds ... 1.8 1.0 ... 9.5 20.4Government Agencies and Municipal Bonds 0.9 0.6 0.4 0.8 1.3 12.5Industrial and Miscellaneous Bonds 4.5 33.3 22.2 7.9 15.7 9.3
Total Bonds 5.4 35.7 23.7 8.7 26.6 10.8Source: BestLink ® - Best's Financial Suite
AMB #: 006734 - William Penn Life Ins Co of New York
www.ambest.com Page 29Printed for Bcrs on January 31, 2022
Page 30 of 32 Printed January 31, 2022
BEST’S RATING REPORT
Balance Sheet Highlights
Asset Liability Management | Investments (Continued...)9-Months Year End - December 312021 2020 2020 2019 2018 2017 2016
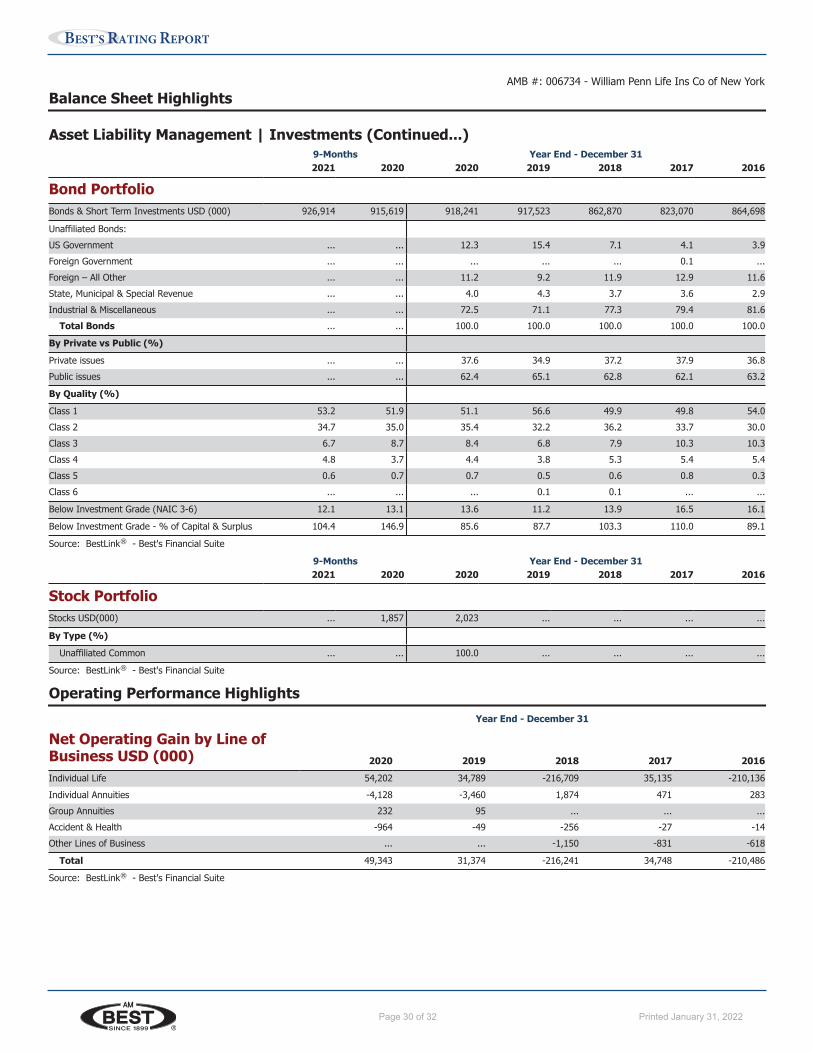
Bond PortfolioBonds & Short Term Investments USD (000) 926,914 915,619 918,241 917,523 862,870 823,070 864,698
Unaffiliated Bonds:US Government ... ... 12.3 15.4 7.1 4.1 3.9Foreign Government ... ... ... ... ... 0.1 ...Foreign – All Other ... ... 11.2 9.2 11.9 12.9 11.6State, Municipal & Special Revenue ... ... 4.0 4.3 3.7 3.6 2.9Industrial & Miscellaneous ... ... 72.5 71.1 77.3 79.4 81.6
Total Bonds ... ... 100.0 100.0 100.0 100.0 100.0
By Private vs Public (%)Private issues ... ... 37.6 34.9 37.2 37.9 36.8Public issues ... ... 62.4 65.1 62.8 62.1 63.2
By Quality (%)Class 1 53.2 51.9 51.1 56.6 49.9 49.8 54.0Class 2 34.7 35.0 35.4 32.2 36.2 33.7 30.0Class 3 6.7 8.7 8.4 6.8 7.9 10.3 10.3Class 4 4.8 3.7 4.4 3.8 5.3 5.4 5.4Class 5 0.6 0.7 0.7 0.5 0.6 0.8 0.3Class 6 ... ... ... 0.1 0.1 ... ...
Below Investment Grade (NAIC 3-6) 12.1 13.1 13.6 11.2 13.9 16.5 16.1
Below Investment Grade - % of Capital & Surplus 104.4 146.9 85.6 87.7 103.3 110.0 89.1
Source: BestLink ® - Best's Financial Suite
9-Months Year End - December 312021 2020 2020 2019 2018 2017 2016
Stock PortfolioStocks USD(000) ... 1,857 2,023 ... ... ... ...
By Type (%)Unaffiliated Common ... ... 100.0 ... ... ... ...
Source: BestLink ® - Best's Financial Suite
Operating Performance HighlightsYear End - December 31
Net Operating Gain by Line ofBusiness USD (000) 2020 2019 2018 2017 2016Individual Life 54,202 34,789 -216,709 35,135 -210,136Individual Annuities -4,128 -3,460 1,874 471 283Group Annuities 232 95 ... ... ...Accident & Health -964 -49 -256 -27 -14Other Lines of Business ... ... -1,150 -831 -618
Total 49,343 31,374 -216,241 34,748 -210,486
Source: BestLink ® - Best's Financial Suite
AMB #: 006734 - William Penn Life Ins Co of New York
www.ambest.com Page 30Printed for Bcrs on January 31, 2022
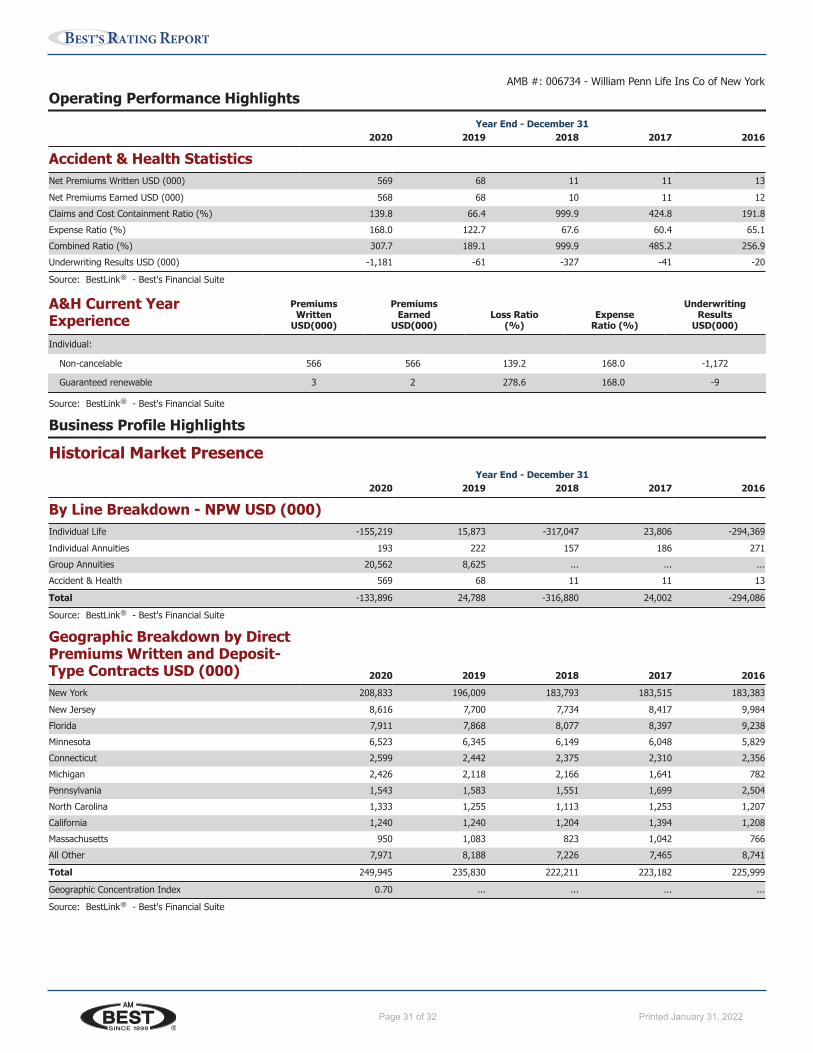
Page 31 of 32 Printed January 31, 2022
BEST’S RATING REPORT
Operating Performance HighlightsYear End - December 31
2020 2019 2018 2017 2016
Accident & Health StatisticsNet Premiums Written USD (000) 569 68 11 11 13Net Premiums Earned USD (000) 568 68 10 11 12Claims and Cost Containment Ratio (%) 139.8 66.4 999.9 424.8 191.8Expense Ratio (%) 168.0 122.7 67.6 60.4 65.1Combined Ratio (%) 307.7 189.1 999.9 485.2 256.9Underwriting Results USD (000) -1,181 -61 -327 -41 -20
Source: BestLink ® - Best's Financial Suite
A&H Current YearExperience
PremiumsWritten
USD(000)
PremiumsEarned
USD(000)Loss Ratio
(%)Expense
Ratio (%)
UnderwritingResults
USD(000)
Individual:
Non-cancelable 566 566 139.2 168.0 -1,172
Guaranteed renewable 3 2 278.6 168.0 -9
Source: BestLink ® - Best's Financial Suite
Business Profile Highlights
Historical Market PresenceYear End - December 31
2020 2019 2018 2017 2016
By Line Breakdown - NPW USD (000)Individual Life -155,219 15,873 -317,047 23,806 -294,369Individual Annuities 193 222 157 186 271Group Annuities 20,562 8,625 ... ... ...Accident & Health 569 68 11 11 13
Total -133,896 24,788 -316,880 24,002 -294,086
Source: BestLink ® - Best's Financial Suite
Geographic Breakdown by DirectPremiums Written and Deposit-Type Contracts USD (000) 2020 2019 2018 2017 2016New York 208,833 196,009 183,793 183,515 183,383New Jersey 8,616 7,700 7,734 8,417 9,984Florida 7,911 7,868 8,077 8,397 9,238Minnesota 6,523 6,345 6,149 6,048 5,829Connecticut 2,599 2,442 2,375 2,310 2,356Michigan 2,426 2,118 2,166 1,641 782Pennsylvania 1,543 1,583 1,551 1,699 2,504North Carolina 1,333 1,255 1,113 1,253 1,207California 1,240 1,240 1,204 1,394 1,208Massachusetts 950 1,083 823 1,042 766All Other 7,971 8,188 7,226 7,465 8,741
Total 249,945 235,830 222,211 223,182 225,999
Geographic Concentration Index 0.70 ... ... ... ...
Source: BestLink ® - Best's Financial Suite
AMB #: 006734 - William Penn Life Ins Co of New York
www.ambest.com Page 31Printed for Bcrs on January 31, 2022
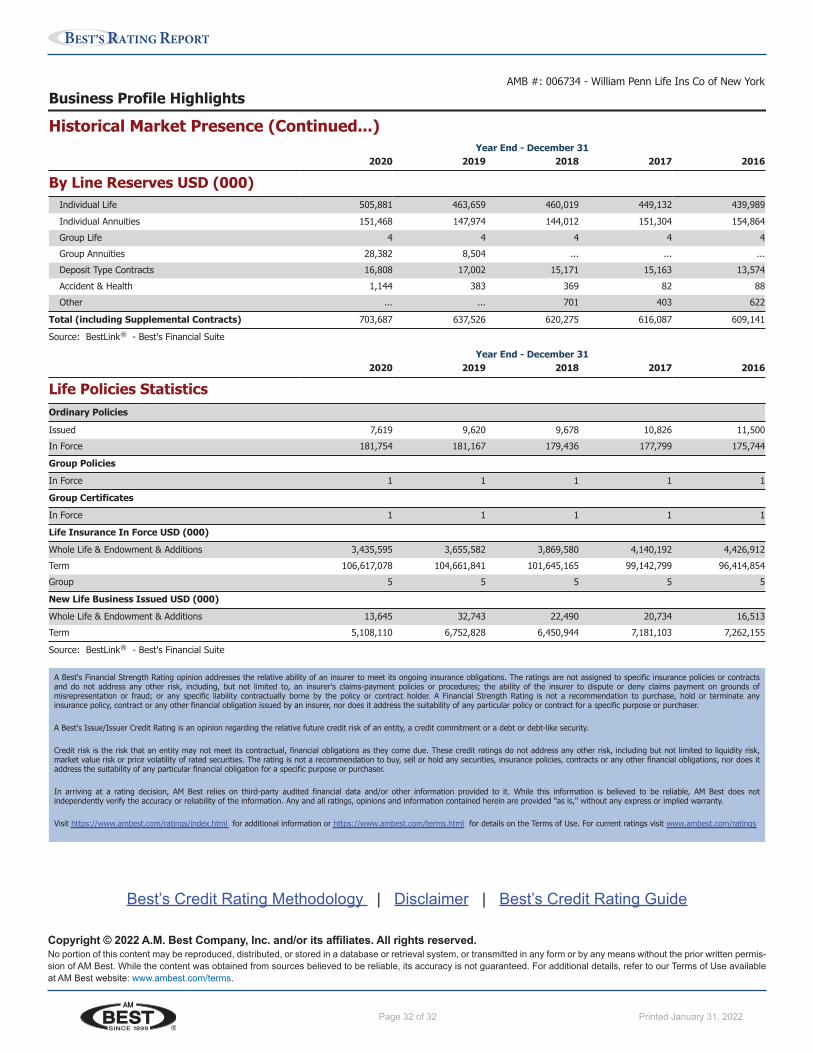
BEST’S RATING REPORT
Page 32 of 32 Printed January 31, 2022
Copyright © 2022 A.M. Best Company, Inc. and/or its affiliates. All rights reserved.No portion of this content may be reproduced, distributed, or stored in a database or retrieval system, or transmitted in any form or by any means without the prior written permis-sion of AM Best. While the content was obtained from sources believed to be reliable, its accuracy is not guaranteed. For additional details, refer to our Terms of Use available at AM Best website: www.ambest.com/terms.
Best’s Credit Rating Methodology | Disclaimer | Best’s Credit Rating Guide
Business Profile Highlights
Historical Market Presence (Continued...)Year End - December 31
2020 2019 2018 2017 2016
By Line Reserves USD (000)Individual Life 505,881 463,659 460,019 449,132 439,989Individual Annuities 151,468 147,974 144,012 151,304 154,864Group Life 4 4 4 4 4Group Annuities 28,382 8,504 ... ... ...Deposit Type Contracts 16,808 17,002 15,171 15,163 13,574Accident & Health 1,144 383 369 82 88Other ... ... 701 403 622
Total (including Supplemental Contracts) 703,687 637,526 620,275 616,087 609,141
Source: BestLink ® - Best's Financial Suite
Year End - December 312020 2019 2018 2017 2016
Life Policies StatisticsOrdinary Policies
Issued 7,619 9,620 9,678 10,826 11,500In Force 181,754 181,167 179,436 177,799 175,744
Group PoliciesIn Force 1 1 1 1 1
Group CertificatesIn Force 1 1 1 1 1
Life Insurance In Force USD (000)Whole Life & Endowment & Additions 3,435,595 3,655,582 3,869,580 4,140,192 4,426,912Term 106,617,078 104,661,841 101,645,165 99,142,799 96,414,854Group 5 5 5 5 5
New Life Business Issued USD (000)Whole Life & Endowment & Additions 13,645 32,743 22,490 20,734 16,513Term 5,108,110 6,752,828 6,450,944 7,181,103 7,262,155
Source: BestLink ® - Best's Financial Suite
A Best's Financial Strength Rating opinion addresses the relative ability of an insurer to meet its ongoing insurance obligations. The ratings are not assigned to specific insurance policies or contractsand do not address any other risk, including, but not limited to, an insurer's claims-payment policies or procedures; the ability of the insurer to dispute or deny claims payment on grounds ofmisrepresentation or fraud; or any specific liability contractually borne by the policy or contract holder. A Financial Strength Rating is not a recommendation to purchase, hold or terminate anyinsurance policy, contract or any other financial obligation issued by an insurer, nor does it address the suitability of any particular policy or contract for a specific purpose or purchaser.
A Best's Issue/Issuer Credit Rating is an opinion regarding the relative future credit risk of an entity, a credit commitment or a debt or debt-like security.
Credit risk is the risk that an entity may not meet its contractual, financial obligations as they come due. These credit ratings do not address any other risk, including but not limited to liquidity risk,market value risk or price volatility of rated securities. The rating is not a recommendation to buy, sell or hold any securities, insurance policies, contracts or any other financial obligations, nor does itaddress the suitability of any particular financial obligation for a specific purpose or purchaser.
In arriving at a rating decision, AM Best relies on third-party audited financial data and/or other information provided to it. While this information is believed to be reliable, AM Best does notindependently verify the accuracy or reliability of the information. Any and all ratings, opinions and information contained herein are provided "as is," without any express or implied warranty.
Visit https://www.ambest.com/ratings/index.html for additional information or https://www.ambest.com/terms.html for details on the Terms of Use. For current ratings visit www.ambest.com/ratings
AMB #: 006734 - William Penn Life Ins Co of New York
www.ambest.com Page 32Printed for Bcrs on January 31, 2022
Copyright © 2022 A.M. Best Company, Inc. and/or its affiliates. All rights reserved.No portion of this content may be reproduced, distributed, or stored in a database or retrieval system, or transmitted in any form or by any means without the prior written permis-sion of AM Best. While the content was obtained from sources believed to be reliable, its accuracy is not guaranteed. For additional details, refer to our Terms of Use available at AM Best website: www.ambest.com/terms.
Related Documents


