Best Practices in Hospital Key Financial Indicators – Hospital Key Financial Indicators Setting and Achieving Goals Steven Berger, CHE, FHFMA, CPA President H lth I i ht LLC Healthcare Insights, LLC 510 Roosevelt Drive Libertyville, IL 60048 847-362-1244 1 E-mail: [email protected] www.hcillc.com

Best Practices in Key Financial Metrics - 2008 -Id
Nov 05, 2014
Welcome message from author
This document is posted to help you gain knowledge. Please leave a comment to let me know what you think about it! Share it to your friends and learn new things together.
Transcript

Best Practices in Hospital Key Financial Indicators –Hospital Key Financial Indicators
Setting and Achieving GoalsSteven Berger, CHE, FHFMA, CPAPresidentH lth I i ht LLCHealthcare Insights, LLC510 Roosevelt DriveLibertyville, IL 60048847-362-1244
1
E-mail: [email protected]

About the PresenterAbout the PresenterSteven Berger is President of Healthcare Insights, LLC, which specializes in the teaching and consulting of
healthcare financial management issues. In addition, Healthcare Insights has developed INSIGHTS, a management accountability and decision support software solution for the healthcare industry. Prior to his role at Healthcare y pp yInsights, Mr. Berger was Vice President, Finance for seven years at 250‐ bed Highland Park Hospital in suburban Chicago, Illinois. Before Highland Park Hospital and since 1978, he has been a hospital or health system finance officer in New York, New Jersey and Missouri. Mr. Berger has over 30 years of healthcare financial management experience. He holds a Bachelors of Science degree
in History and a Master of Science in Accounting from the State University of New York at Binghamton. He is a CPA, a Fellow of the Healthcare Financial Management Association (FHFMA) where he has served as President of the First Illinois Chapter. Mr. Berger also served a three‐year term on the HFMA’s National Board of Examiners and was recently the Regional Executive of Region 7 of the HFMA. He is also a Fellow of the American College of Healthcare Executives (FACHE).
In addition, over the past several years he has presented many healthcare finance related seminars throughout the U i d S d C d i l di l d l h F d l f H l h Fi i l United States and Canada including several two‐day classes such as Fundamentals of Healthcare Financial Management, Turning Data into Useful Information and Hospital Financial Management for the Non‐Financial Manager. He has also been published several times in Healthcare Financial Management magazine, including an August 2004 Nationally Award Winning article on the Ten Ways to Improve Cost Management in Hospital, an April 2002 management column and a February 2000 commentary in Modern Healthcare on the lack of training in the healthcare industryhealthcare industry
Additionally, Mr. Berger is the author of “Fundamentals of Healthcare Financial Management,” originally published in 1999 by McGraw‐Hill and the Healthcare Financial Management Association. This book was written from a practitioners point of view and is a distillation of Mr. Berger’s many years on the inside of healthcare institutions. The third edition of the book was published in January 2008 and is available at www.josseybass.com. Additionally, Mr. Berger co‐authored the 2002 text, “HFMA’s Introduction to Hospital Accounting, 4th edition”, published by Kendall
2
Berger co authored the 2002 text, HFMAs Introduction to Hospital Accounting, 4th edition , published by Kendall Hunt, available at www.hfma.org. Mr. Berger’s 2003 book, “Understanding Nonprofit Financial Statements”, was published by BoardSource and is available at www.boardsource.org. His latest book, “The Power of Financial and Clinical Metrics: Achieving Superior Results in Your Hospital” was published in March 2005 and is available at www.ache.org.
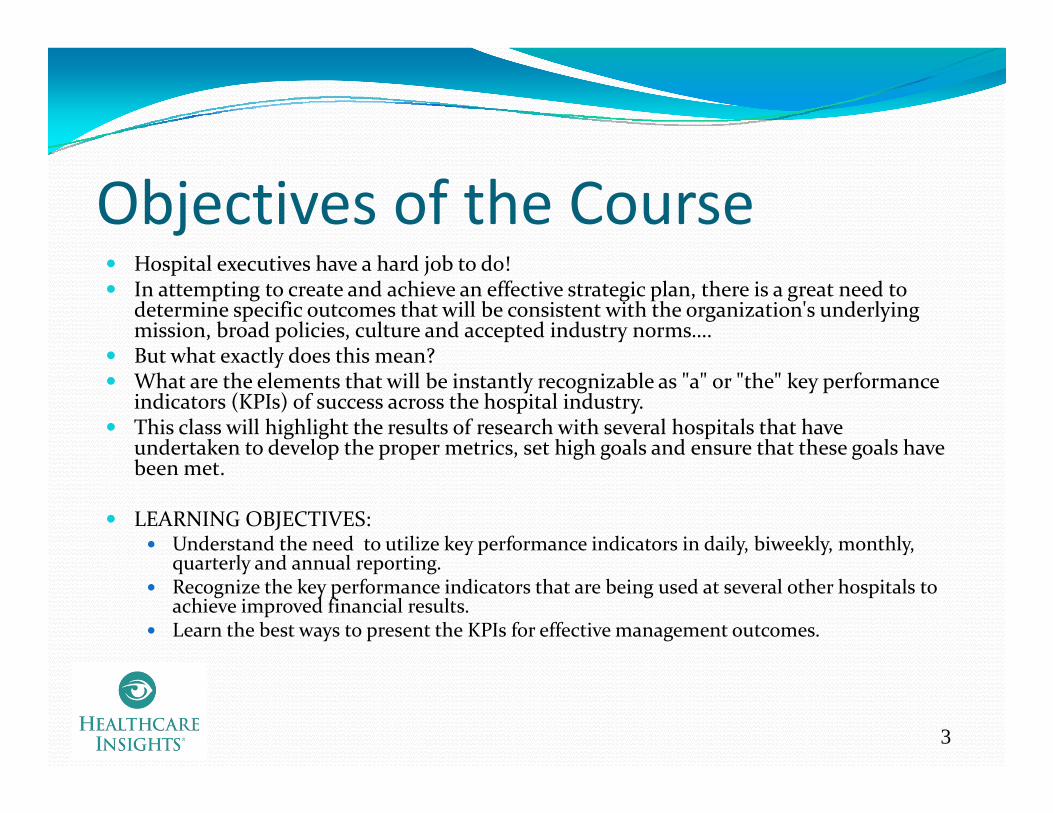
Objectives of the CourseHospital executives have a hard job to do! In attempting to create and achieve an effective strategic plan, there is a great need to determine specific outcomes that will be consistent with the organization's underlying mission, broad policies, culture and accepted industry norms….But what exactly does this mean? But what exactly does this mean? What are the elements that will be instantly recognizable as "a" or "the" key performance indicators (KPIs) of success across the hospital industry. This class will highlight the results of research with several hospitals that have undertaken to develop the proper metrics, set high goals and ensure that these goals have p p p g g gbeen met.
LEARNING OBJECTIVES:Understand the need to utilize key performance indicators in daily, biweekly, monthly, quarterly and annual reportingquarterly and annual reporting.Recognize the key performance indicators that are being used at several other hospitals to achieve improved financial results. Learn the best ways to present the KPIs for effective management outcomes.
3
Objective #1
Understanding the Need to Utilize K P f I di t i D ilKey Performance Indicators in Daily, Biweekly, Monthly, Quarterly and y y y
Annual Reporting
4

What areWhat are Key Performance Indicators (KPIs)?
Key Performance Indicators (KPIs) are defined as measures or metrics that have been chosen, by an organization’s leadership team, as representative of organizations leadership team, as representative of the most important outcomes to be achievedKPIs are developed to measure the results of
i i l li i i d dorganizational policies, practices and proceduresKPIs represent key driver and critical success factors to the organizationto the organizationThe organization needs to monitor the results of these performance metrics to determine the quality f it fi i l ti
5
of its financial operations
How Can KPIs Be UsedHow Can KPIs Be Used to Determine Financial Quality?
KPIs allows the organization toRecognize key organizational success driversSet the level of these drivers (goals)
Most often through strategic and operational benchmarking
Manage for achievement of these goalsManage for achievement of these goalsFoster accountability through the recognition of the achievementSet pay and bonus levels based on goals and outcomes
6
How Do Best Practice Hospitals UseHow Do Best Practice Hospitals Use KPIs in Their Operations?
Best Practice Hospitals Utilize a set of numbers (metrics) representing key success factors Set goals through objectively derived benchmarksMonitor the goals in a value‐added manner
DailyW klWeeklyBiweeklyMonthlyQuarterlyQuarterlyAnnually
Take appropriate management actions as a result of the achievement or lack thereof.
7
What Do Best Practice KPIWhat Do Best Practice KPI Hospitals Do Differently?
Best Practice HospitalsUse many tools and techniques to set and monitor goalsPay great attention to the detailed outcomesEmploy a “best practices” orientation through the utilization of peer benchmarksutilization of peer benchmarksApply management techniques including:
Accountability for meeting goals, and positive and negative consequences
Achieve outcomes far in excess of the average
8
What are the Values of the KPIs?The KPIs provide significant value to any organization that utilizes them to
Choose the most important indicators for the organizationChoose the most important indicators for the organizationSet the goals (using benchmarks)Create action plans to achieve the goalsImplement the action plansMonitor the results of the implementationC i t th lt b k t th ff t d ti (F db k)Communicate the results back to the affected parties (Feedback)Development positive and negative consequences based on the results
9

Success with KPIsIn the 1970’s and early 1980’s, Humana corporate office mandated several targets that the individual hospital CEO’s had to meet in order to get bonuses and stockThe CEO’s had targets for The CEO s had targets for
BudgetsCensus day volumesProfit marginsProfit margins
Because these goals were consistently met,“Humana hospital administrators were known as the best paid administrators in the early 1980s”, andy 9 ,“In 1987, of the 40 hospitals with the highest operating profit margins”, 17 were Humana facilities, according to a study by HCIA. 22 of the remaining 23 hospitals on the list were also investor‐owned
10
owned.Source: Columbia/HCA: Healthcare on Overdrive, Sandy Lutz and E.Preston Gee, McGraw Hill, page 15.
How Other Industries Use KPIs toHow Other Industries Use KPIs to Achieve Superior Results
Every industry has key performance indicators that represent success factors. For example,
Ai liAirlinesRevenue per passenger mile
SteelSteelMetric tons of steel produced
RetailingSales per square foot
11

Objective #2
Recognizing the Key Performance I di t Th t B i U d tIndicators That are Being Used at Several Other Hospitals to Achieve p
Improved Financial Results
12
KPI ElementsKPIs come in so many different typesEvery organization is likely to choose different KPIsKPIs by the nature of their usefulness will affected by a KPIs, by the nature of their usefulness, will affected by a variety of factors
LocationU b b b l Urban, suburban, rural, state
Payer mixMedicare, Medicaid, Managed Care, Self Pay
Tax statusFor‐profit, not‐for‐profit, governmental, military
Reporting periods
13
Daily, weekly, biweekly, monthly, quarterly, annually
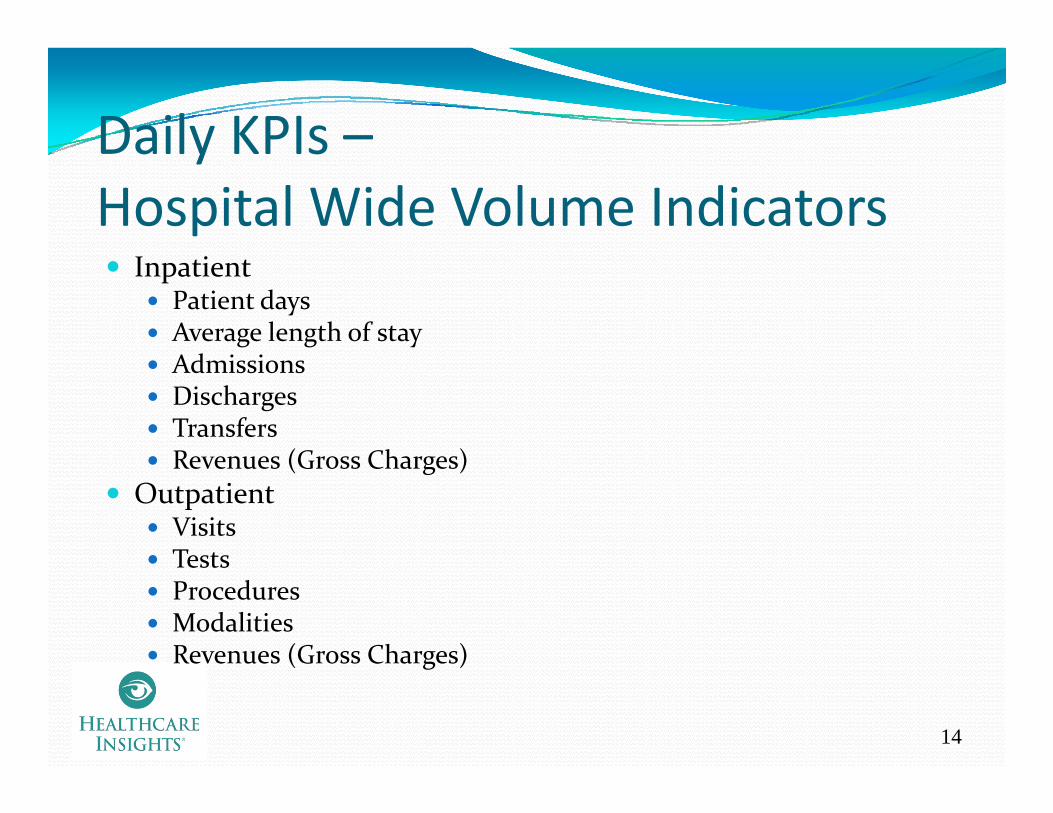
Daily KPIs –Daily KPIs Hospital Wide Volume Indicators
Inpatient Patient daysAverage length of stayAd i iAdmissionsDischargesTransfersRevenues (Gross Charges)Revenues (Gross Charges)
Outpatient VisitsTestsTestsProceduresModalitiesRevenues (Gross Charges)
14
Revenues (Gross Charges)
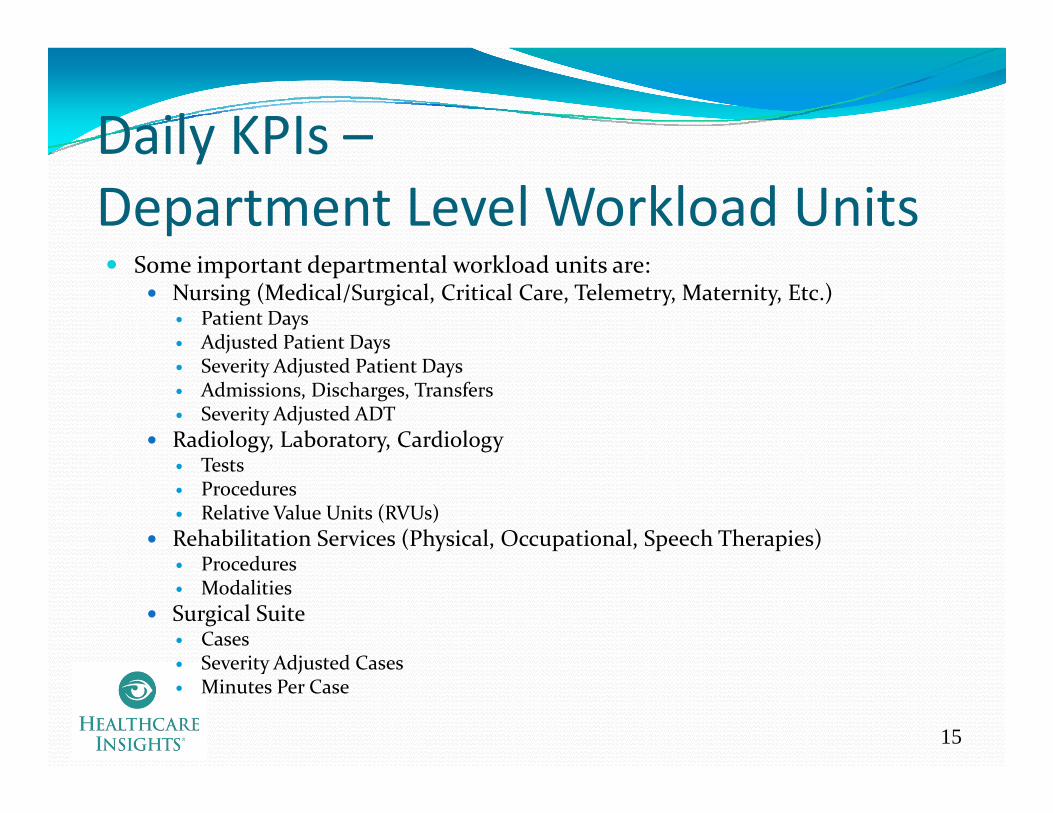
Daily KPIs –Daily KPIs Department Level Workload Units
Some important departmental workload units are:Nursing (Medical/Surgical, Critical Care, Telemetry, Maternity, Etc.)
Patient DaysAdjusted Patient DaysSeverity Adjusted Patient DaysAdmissions, Discharges, TransfersSeverity Adjusted ADT
Radiology, Laboratory, CardiologyTTestsProceduresRelative Value Units (RVUs)
Rehabilitation Services (Physical, Occupational, Speech Therapies)P dProceduresModalities
Surgical SuiteCasesSeverity Adjusted Cases
15
Severity Adjusted CasesMinutes Per Case
Sick bab
ies)
ns
Admission
s
us
OS
Posted
)*
ation
s*
ies*
ries*
s eries
s nue
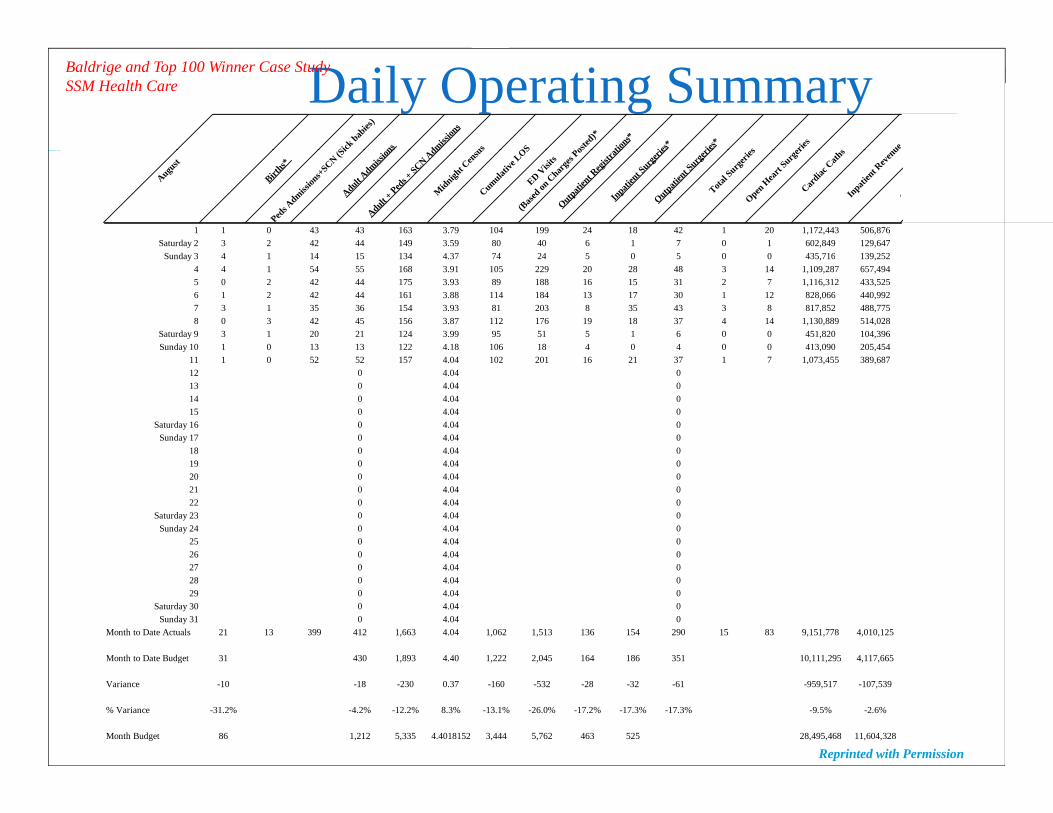
Daily Operating SummaryBaldrige and Top 100 Winner Case Study SSM Health Care
August
Births*
Peds A
dmission
s+SCN (S
iAdult A
dmission
Adult + Ped
s + SCN A
dmM
idnight C
ensu
sCumulat
ive LOS
ED Visi
ts
(Base
d on C
harge
s Po
Outpatien
t Reg
istra
tiIn
patien
t Surg
erie
Outpatien
t Surg
eriTota
l Surg
eries
Open H
eart
Surger
Cardiac
Cath
sIn
patien
t Rev
enu
O
1 1 0 43 43 163 3.79 104 199 24 18 42 1 20 1,172,443 506,876Saturday 2 3 2 42 44 149 3.59 80 40 6 1 7 0 1 602,849 129,647
S d 3 4 1 14 1 134 4 3 4 24 0 0 0 43 16 139 2 2Sunday 3 4 1 14 15 134 4.37 74 24 5 0 5 0 0 435,716 139,2524 4 1 54 55 168 3.91 105 229 20 28 48 3 14 1,109,287 657,4945 0 2 42 44 175 3.93 89 188 16 15 31 2 7 1,116,312 433,5256 1 2 42 44 161 3.88 114 184 13 17 30 1 12 828,066 440,9927 3 1 35 36 154 3.93 81 203 8 35 43 3 8 817,852 488,7758 0 3 42 45 156 3.87 112 176 19 18 37 4 14 1,130,889 514,028
Saturday 9 3 1 20 21 124 3.99 95 51 5 1 6 0 0 451,820 104,396Sunday 10 1 0 13 13 122 4.18 106 18 4 0 4 0 0 413,090 205,454
11 1 0 52 52 157 4.04 102 201 16 21 37 1 7 1,073,455 389,68712 0 4.04 013 0 4.04 014 0 4.04 015 0 4.04 0
Saturday 16 0 4.04 0Sunday 17 0 4.04 0
18 0 4.04 019 0 4.04 020 0 4.04 021 0 4.04 022 0 4.04 0
Saturday 23 0 4.04 0Sunday 24 0 4.04 0
25 0 4.04 026 0 4.04 027 0 4.04 028 0 4.04 029 0 4.04 0
Saturday 30 0 4.04 0Sunday 31 0 4.04 0
Month to Date Actuals 21 13 399 412 1,663 4.04 1,062 1,513 136 154 290 15 83 9,151,778 4,010,125
Month to Date Budget 31 430 1,893 4.40 1,222 2,045 164 186 351 10,111,295 4,117,665
16
Variance -10 -18 -230 0.37 -160 -532 -28 -32 -61 -959,517 -107,539
% Variance -31.2% -4.2% -12.2% 8.3% -13.1% -26.0% -17.2% -17.3% -17.3% -9.5% -2.6%
Month Budget 86 1,212 5,335 4.4018152 3,444 5,762 463 525 28,495,468 11,604,328
Reprinted with Permission
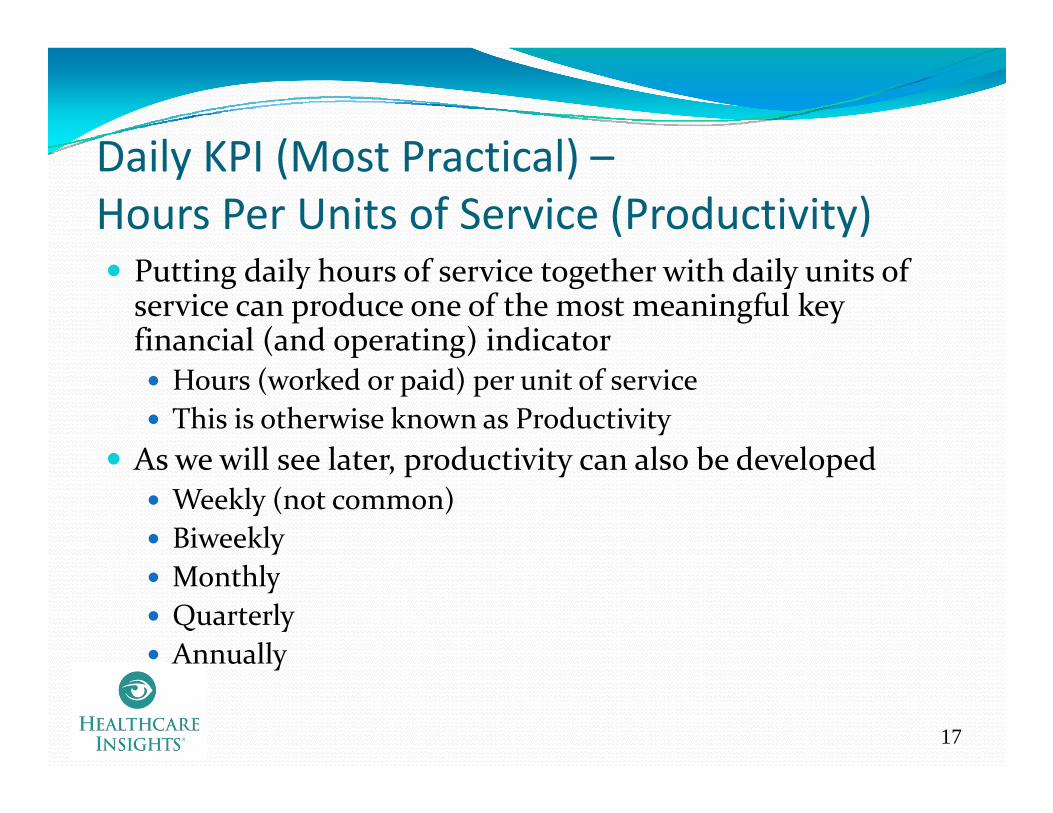
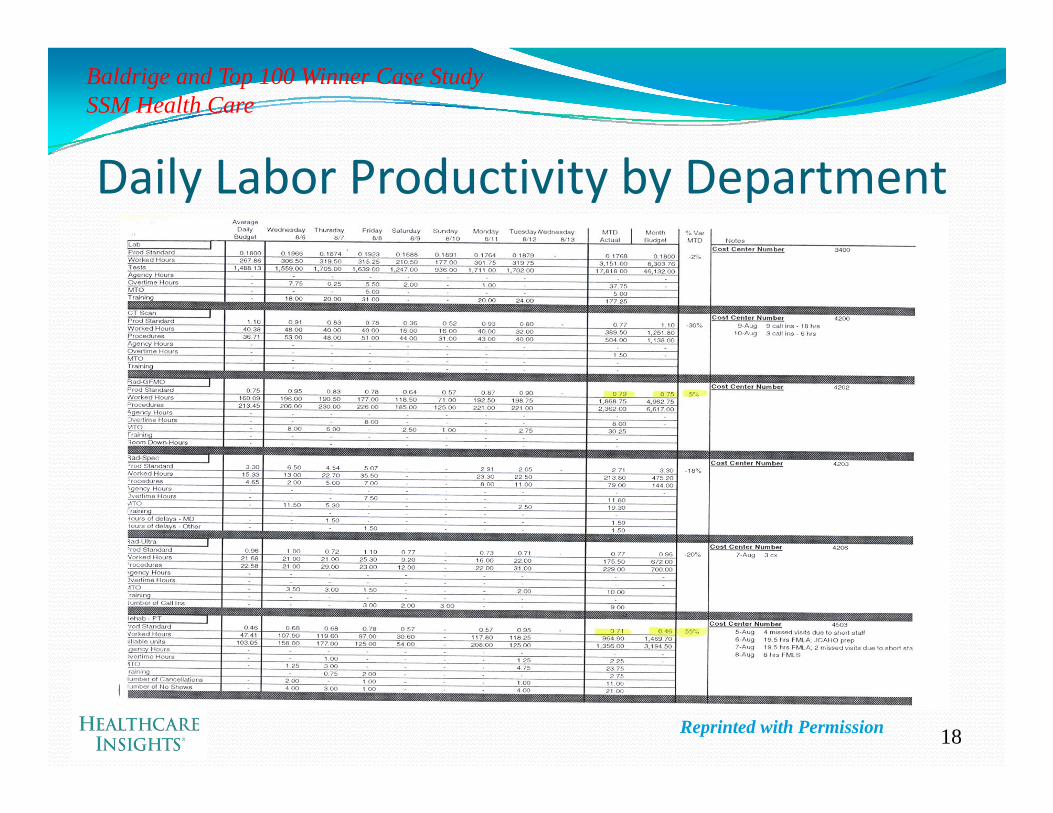
Daily KPI (Most Practical)Daily KPI (Most Practical) –Hours Per Units of Service (Productivity)
Putting daily hours of service together with daily units of service can produce one of the most meaningful key financial (and operating) indicator( p g)
Hours (worked or paid) per unit of serviceThis is otherwise known as Productivity
As we will see later productivity can also be developedAs we will see later, productivity can also be developedWeekly (not common)BiweeklyMonthlyQuarterlyAnnually
17
Annually
Baldrige and Top 100 Winner Case Study SSM Health Care
Daily Labor Productivity by Department
18Reprinted with Permission

Weekly KPIsAny KPI that is produced on a daily basis can be aggregated on a weekly basisW ill ll i f hi l i We will see an excellent representation of this later in the class
19
Biweekly KPIsWhen reporting biweekly results, the most common KPIs are labor related:
PayrollHours paidHours worked
Non payrollNon payrollSimple units of service (Tests, Procedures)Complex units of service (Relative Value Units)
Productivity BasedHour worked per units of serviceH id it f iHours paid per units of serviceAverage dollars per units of service, and…The variances
Efficiency Variance (this is also available on a daily basis, if desiredDifference between budgeted and actual hours
R V iRate VarianceDifference between budgeted and actual average hourly rates
All of the other KPIs developed for daily reporting are applicable on a biweekly basis, including Charge Based (chargeable services rendered)
Inpatient gross revenues
20
p gOutpatient gross revenues
Monthly KPI ConceptsMonthly is the time period most often associated with financial reporting
KPIs are often the result of monthly balance sheet and KPIs are often the result of monthly balance sheet and income statement reportingThe most important KPIs to report on a monthly basis th th t d d t b l t t b d ti are those that are deemed to be relevant to bond ratings
(even if there are no bonds outstanding…maybe someday soon, the organization will want to go out to th d bt k t)the debt market)
It is important to set up the KPI reporting to maximize the understanding of the reader
21
g
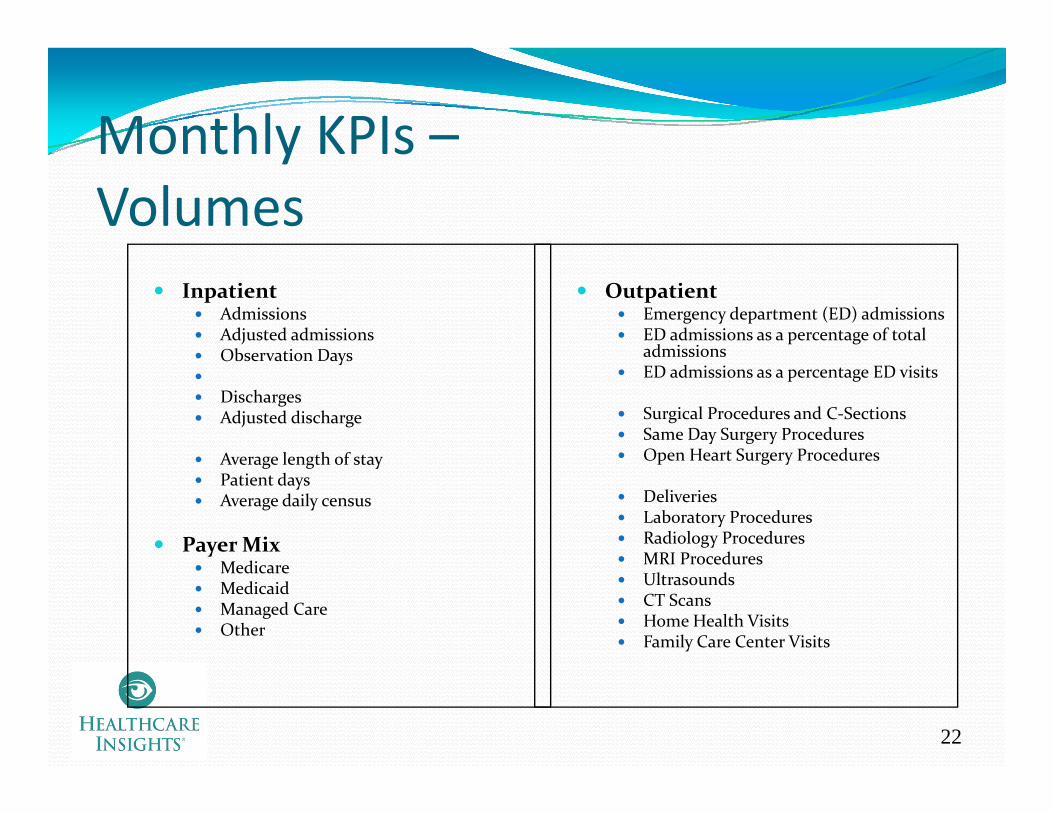
Monthly KPIs –Monthly KPIs Volumes
InpatientAdmissionsAdjusted admissionsObservation Days
OutpatientEmergency department (ED) admissionsED admissions as a percentage of total admissionsObservation Days
DischargesAdjusted discharge
Average length of stay
admissionsED admissions as a percentage ED visits
Surgical Procedures and C‐SectionsSame Day Surgery ProceduresOpen Heart Surgery ProceduresAverage length of stay
Patient daysAverage daily census
Payer Mixd
Open Heart Surgery Procedures
DeliveriesLaboratory ProceduresRadiology ProceduresMRI ProceduresMedicare
MedicaidManaged CareOther
MRI ProceduresUltrasoundsCT ScansHome Health VisitsFamily Care Center Visits
22
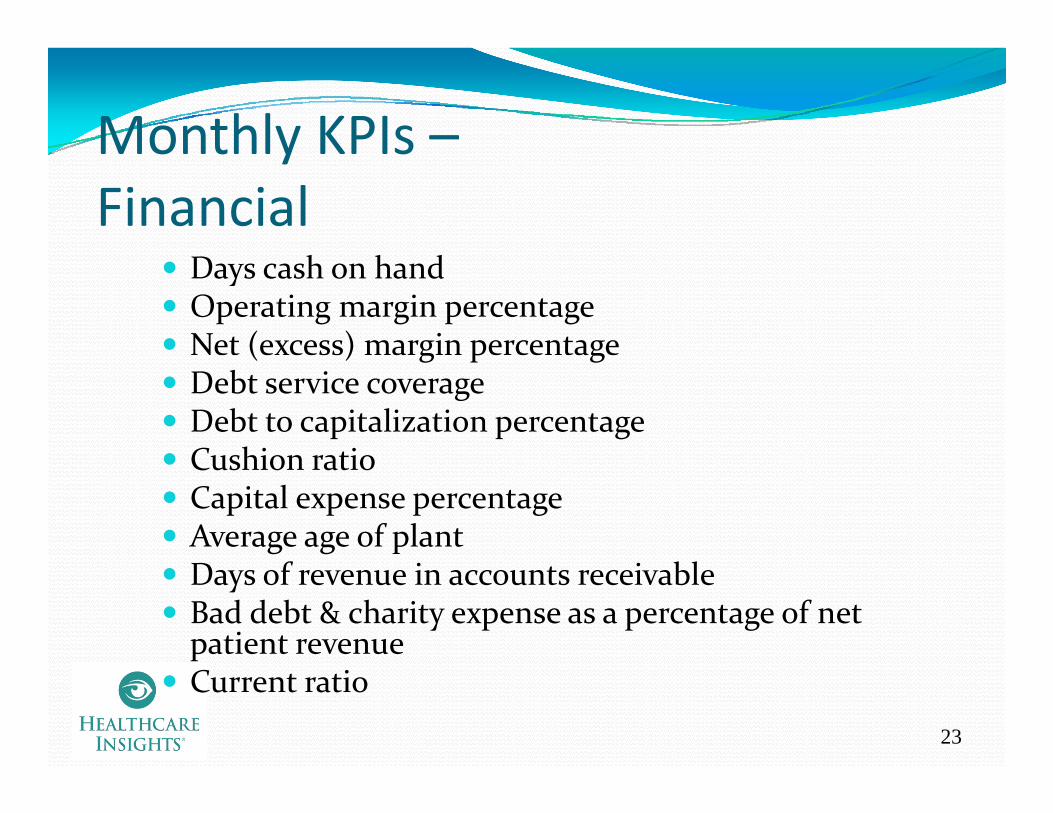
Monthly KPIs –Monthly KPIs Financial
Days cash on handOperating margin percentageNet (excess) margin percentage( ) g p gDebt service coverageDebt to capitalization percentageCushion ratioCushion ratioCapital expense percentageAverage age of plantDays of revenue in accounts receivableBad debt & charity expense as a percentage of net patient revenue
23
Current ratio

Monthly KPIs –Monthly KPIs Operational
Salaries, fringe benefits and contract labor as a percentage of total revenueSalary expense per adjusted admissionSupply expense per adjusted admissionTotal expense per adjusted admissionSupply expense as a percentage of net patient revenueSupply expense as a percentage of net patient revenueOutpatient revenue as a percentage of total revenueCase mix index (CMI)N t dj t d d i i ( i Net revenue per adjusted admission (case mix adjusted)Cost per adjusted admission (case mix adjusted) T l id h dj d i d
24
Total paid hours per adjusted patient day
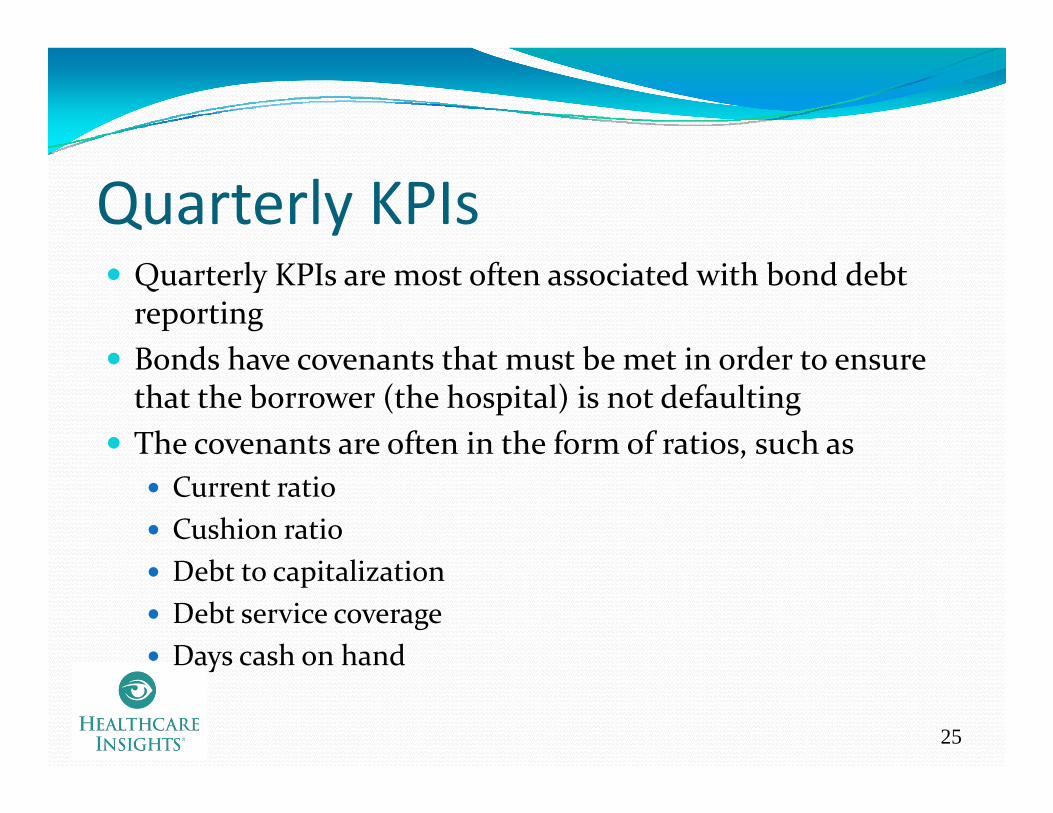
Quarterly KPIsQuarterly KPIs are most often associated with bond debt reportingBonds have covenants that must be met in order to ensure Bonds have covenants that must be met in order to ensure that the borrower (the hospital) is not defaultingThe covenants are often in the form of ratios, such as,
Current ratioCushion ratio
b lDebt to capitalizationDebt service coverageDays cash on hand
25
Days cash on hand

Annual KPIsFor annual KPIs, best practice hospitals are utilizing a variety of benchmarked metrics that are to the industry There are several different sets of Best Practice Key There are several different sets of Best Practice Key Financial Indicators to choose from. Here is a sampling:
Solucient’s 100 Top Hospitals® Financial KPIsCleverley and Associates Financial Strength MeasuresCleverley and Associates Financial Strength MeasuresHMFA’s Key Hospital Financial Statistics and Ratios
Standard and PoorsFi h R iFitch RatingsIngenixPremier S l i t
26
Solucient

Thomson 100 Top Hospitals® FinancialThomson 100 Top Hospitals Financial KPIs Calculations and Benchmarks
100 Top Hospital Winners
Peer Group of U.S. Hospitals
1) Severity-adjusted average length of stay 3.52 3.94l i ( dj d f i ( G))Total Patient Days (adjusted for severity (RDRG))
Total Discharges 2) Expense per adjusted discharge, case mix- and wage adjusted $ 4,147 $ 4,950
Total Operating Expenses Number of Adjusted Discharges (case mix and wage adjusted)
3) Profitability (operating profit margin) % 8.95 2.46Total Operating Revenue – Total Expenses Total Operating Revenue
4) Cash flow to total debt ratio 0.35 0.16Net Income + Depreciation Expense + Interest Expense Total Liabilities
5) Tangible assets (net PPE) per adjusted discharge $ 3,026 $ 2,727
27
Total Property, Plant and Equipment – Accumulated Depreciation Total Number of Acute Care Discharges
Reprinted with Permission – Solucient, Courtesy of Jean Chenowith, Executive Director,Published in 2007 www.solucient.com
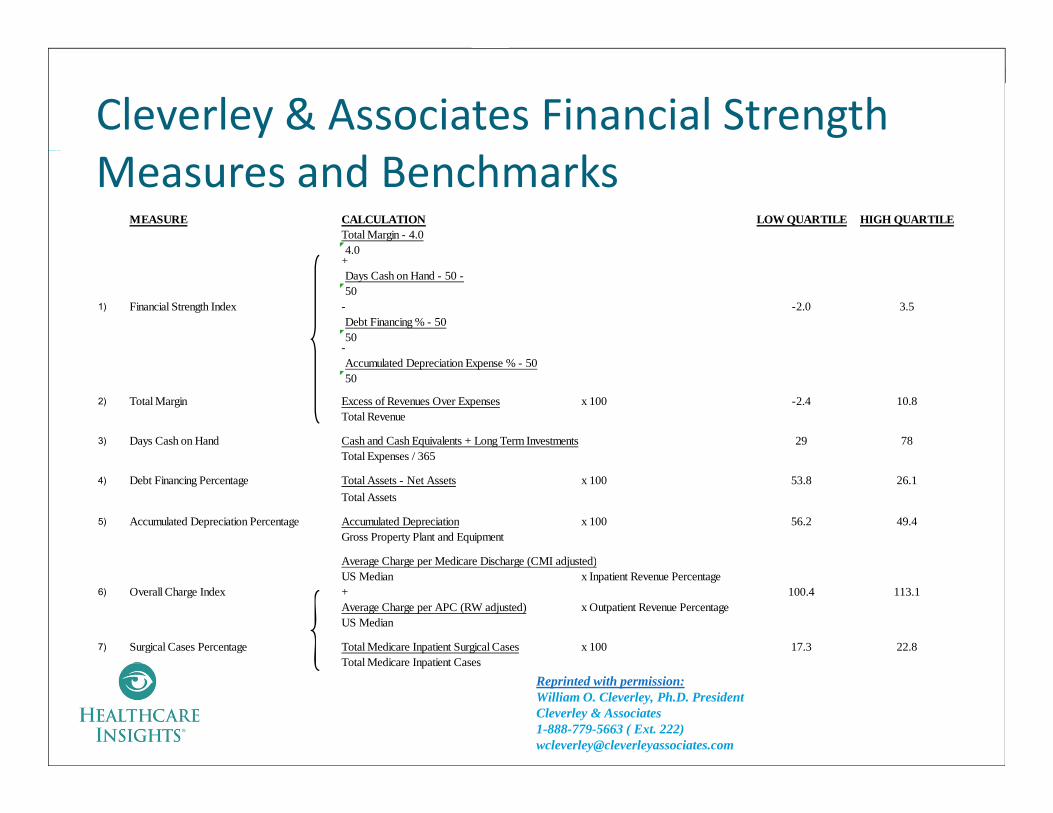
Cleverley & Associates Financial Strength Measures and Benchmarks
MEASURE CALCULATION LOW QUARTILE HIGH QUARTILETotal Margin - 4.04.04.0
+Days Cash on Hand - 50 -50
1) Financial Strength Index - -2.0 3.5Debt Financing % - 5050
-Accumulated Depreciation Expense % - 5050
2) Total Margin Excess of Revenues Over Expenses x 100 -2.4 10.8Total Revenue
3) Days Cash on Hand Cash and Cash Equivalents + Long Term Investments 29 78Total Expenses / 365Total Expenses / 365
4) Debt Financing Percentage Total Assets - Net Assets x 100 53.8 26.1Total Assets
5) Accumulated Depreciation Percentage Accumulated Depreciation x 100 56.2 49.4Gross Property Plant and Equipment
Average Charge per Medicare Discharge (CMI adjusted)Average Charge per Medicare Discharge (CMI adjusted)US Median x Inpatient Revenue Percentage
6) Overall Charge Index + 100.4 113.1Average Charge per APC (RW adjusted) x Outpatient Revenue PercentageUS Median
7) Surgical Cases Percentage Total Medicare Inpatient Surgical Cases x 100 17.3 22.8Total Medicare Inpatient Cases
28
Total Medicare Inpatient Cases
Reprinted with permission:William O. Cleverley, Ph.D. President Cleverley & Associates 1-888-779-5663 ( Ext. 222) [email protected]
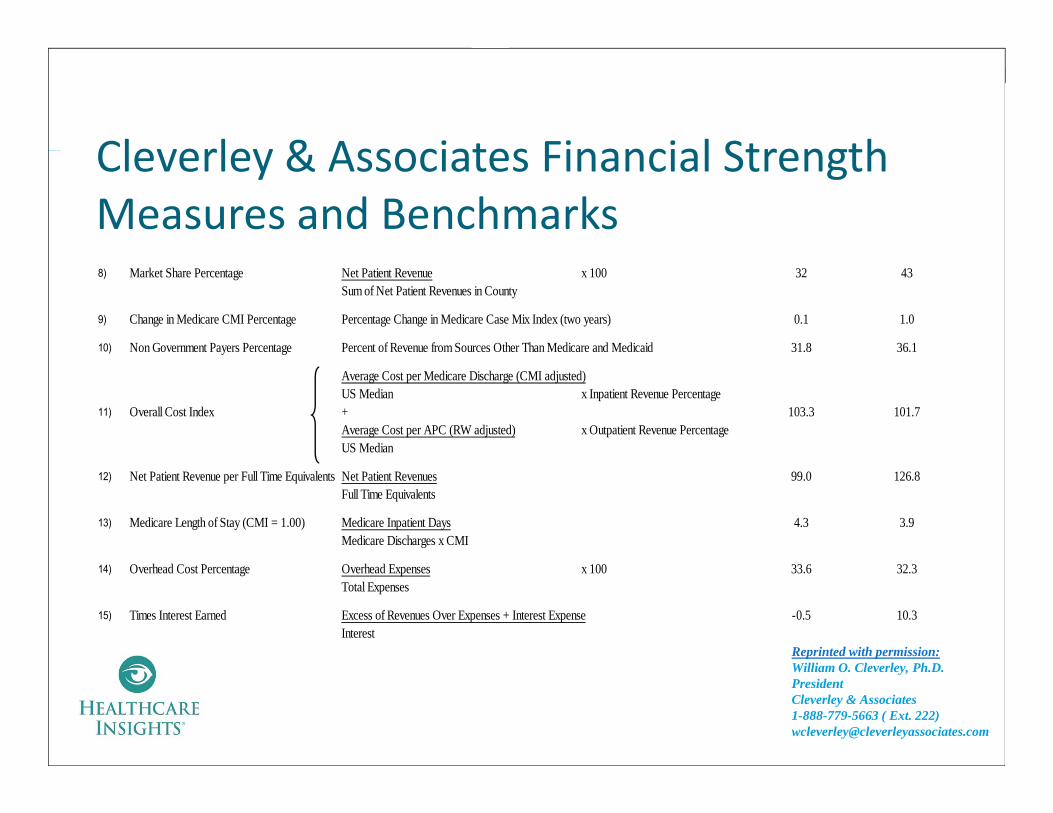
Cleverley & Associates Financial StrengthCleverley & Associates Financial Strength Measures and Benchmarks8) Market Share Percentage Net Patient Revenue x 100 32 43
Sum of Net Patient Revenues in County
9) Change in Medicare CMI Percentage Percentage Change in Medicare Case Mix Index (two years) 0.1 1.0
10) Non Government Payers Percentage Percent of Revenue from Sources Other Than Medicare and Medicaid 31.8 36.1
Average Cost per Medicare Discharge (CMI adjusted)US Median x Inpatient Revenue Percentage
11) Overall Cost Index + 103.3 101.7Average Cost per APC (RW adjusted) x Outpatient Revenue PercentageUS Median
12) Net Patient Revenue per Full Time Equivalents Net Patient Revenues 99.0 126.8Full Time Equivalents
13) Medicare Length of Stay (CMI = 1.00) Medicare Inpatient Days 4.3 3.9Medicare Discharges x CMI
14) Overhead Cost Percentage Overhead Expenses x 100 33.6 32.3Total Expenses
15) Times Interest Earned Excess of Revenues Over Expenses + Interest Expense -0.5 10.3Interest
Reprinted with permission:illi O Cl l h
29
William O. Cleverley, Ph.D. President Cleverley & Associates 1-888-779-5663 ( Ext. 222) [email protected]
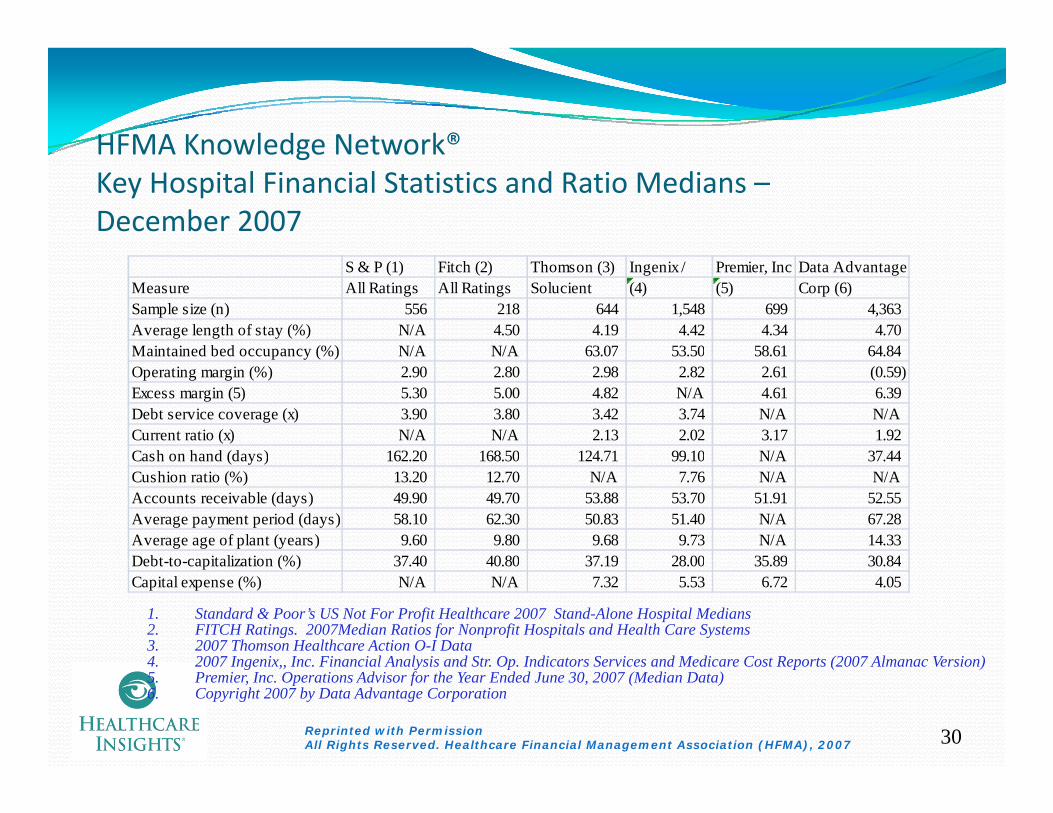
HFMA Knowledge Network®HFMA Knowledge Network Key Hospital Financial Statistics and Ratio Medians –December 2007
S & P (1) Fitch (2) Thomson (3) Ingenix / Premier, Inc Data AdvantageMeasure All Ratings All Ratings Solucient (4) (5) Corp (6)Sample size (n) 556 218 644 1,548 699 4,363 Average length of stay (%) N/A 4.50 4.19 4.42 4.34 4.70 Maintained bed occupancy (%) N/A N/A 63.07 53.50 58.61 64.84Maintained bed occupancy (%) N/A N/A 63.07 53.50 58.61 64.84 Operating margin (%) 2.90 2.80 2.98 2.82 2.61 (0.59) Excess margin (5) 5.30 5.00 4.82 N/A 4.61 6.39 Debt service coverage (x) 3.90 3.80 3.42 3.74 N/A N/ACurrent ratio (x) N/A N/A 2.13 2.02 3.17 1.92 Cash on hand (days) 162 20 168 50 124 71 99 10 N/A 37 44Cash on hand (days) 162.20 168.50 124.71 99.10 N/A 37.44 Cushion ratio (%) 13.20 12.70 N/A 7.76 N/A N/AAccounts receivable (days) 49.90 49.70 53.88 53.70 51.91 52.55 Average payment period (days) 58.10 62.30 50.83 51.40 N/A 67.28 Average age of plant (years) 9.60 9.80 9.68 9.73 N/A 14.33 Debt to capitalization (%) 37 40 40 80 37 19 28 00 35 89 30 84Debt-to-capitalization (%) 37.40 40.80 37.19 28.00 35.89 30.84 Capital expense (%) N/A N/A 7.32 5.53 6.72 4.05
1. Standard & Poor’s US Not For Profit Healthcare 2007 Stand-Alone Hospital Medians2. FITCH Ratings. 2007Median Ratios for Nonprofit Hospitals and Health Care Systems 3. 2007 Thomson Healthcare Action O-I Data4 2007 Ingenix Inc Financial Analysis and Str Op Indicators Services and Medicare Cost Reports (2007 Almanac Version)
30
4. 2007 Ingenix,, Inc. Financial Analysis and Str. Op. Indicators Services and Medicare Cost Reports (2007 Almanac Version)5. Premier, Inc. Operations Advisor for the Year Ended June 30, 2007 (Median Data)6. Copyright 2007 by Data Advantage Corporation
Reprinted with PermissionAll Rights Reserved. Healthcare Financial Management Association (HFMA), 2007
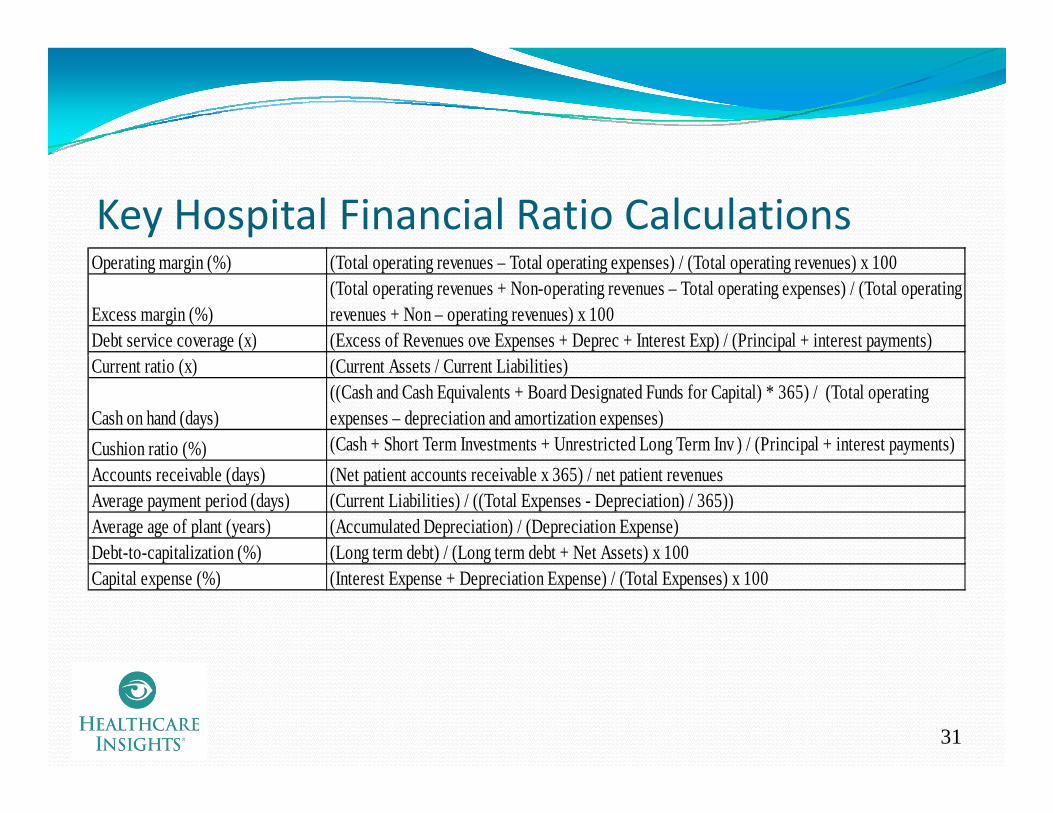
Key Hospital Financial Ratio CalculationsOperating margin (%) (Total operating revenues – Total operating expenses) / (Total operating revenues) x 100
Excess margin (%)(Total operating revenues + Non-operating revenues – Total operating expenses) / (Total operating revenues + Non – operating revenues) x 100
Debt service coverage (x) (Excess of Revenues ove Expenses + Deprec + Interest Exp) / (Principal + interest payments)Current ratio (x) (Current Assets / Current Liabilities)
Cash on hand (days)((Cash and Cash Equivalents + Board Designated Funds for Capital) * 365) / (Total operating expenses – depreciation and amortization expenses)
Cushion ratio (%) (Cash + Short Term Investments + Unrestricted Long Term Inv ) / (Principal + interest payments)( )Accounts receivable (days) (Net patient accounts receivable x 365) / net patient revenuesAverage payment period (days) (Current Liabilities) / ((Total Expenses - Depreciation) / 365))Average age of plant (years) (Accumulated Depreciation) / (Depreciation Expense)Debt-to-capitalization (%) (Long term debt) / (Long term debt + Net Assets) x 100p ( ) ( g ) ( g )Capital expense (%) (Interest Expense + Depreciation Expense) / (Total Expenses) x 100
31

Poll Questions1. Are you capturing and reporting the budgeted and actual results of the 11 financial metrics on a monthly basis?
Y Yes No
2. Have you developed labor productivity standards at your h i l?hospital?
Yes No
3. If yes, are you routinely (biweekly) reporting the budgeted and actual labor productivity results?
Yes
32
No
Objective #3Objective #3
L i th B t W t P tLearning the Best Ways to Present the Key Performance Indicators for y f f
Effective Management Outcomes
33
Understanding the Need to Utilize KeyUnderstanding the Need to Utilize Key Performance Indicators in ReportingThere are so many different ways to present financial information
Report designs should include a variety of optionsWho is the recipient (i.e. who is the report being designed for?)Who else will be receiving the report?What is the purpose of the report (what is trying to be achieved?)What is the scope of the report?Wh t ti i d d d i th t?What time periods are needed in the report?
Report designs should include a variety of looksTrendsColor codingColor codingGraphs and charts rather than tables and narratives, if appropriate
Most importantly, all reports should be ACTIONABLE!!!Building reports around key financial indicators helps to achieve
34
Building reports around key financial indicators helps to achieve these goals
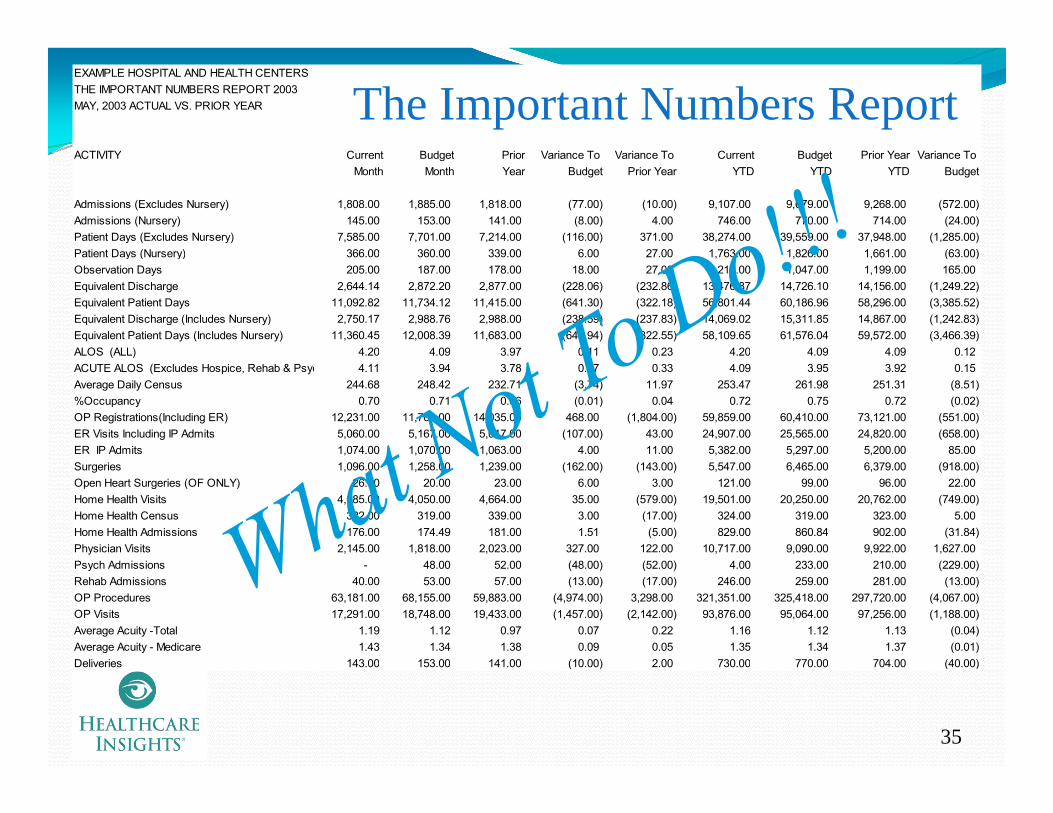
EXAMPLE HOSPITAL AND HEALTH CENTERS THE IMPORTANT NUMBERS REPORT 2003MAY, 2003 ACTUAL VS. PRIOR YEAR
The Important Numbers Report
Important Numbers ReportACTIVITY Current Budget Prior Variance To Variance To Current Budget Prior Year Variance To
Month Month Year Budget Prior Year YTD YTD YTD Budget
Admissions (Excludes Nursery) 1,808.00 1,885.00 1,818.00 (77.00) (10.00) 9,107.00 9,679.00 9,268.00 (572.00) Admissions (Nursery) 145.00 153.00 141.00 (8.00) 4.00 746.00 770.00 714.00 (24.00) Patient Days (Excludes Nursery) 7,585.00 7,701.00 7,214.00 (116.00) 371.00 38,274.00 39,559.00 37,948.00 (1,285.00) Patient Days (Nursery) 366 00 360 00 339 00 6 00 27 00 1 763 00 1 826 00 1 661 00 (63 00)Patient Days (Nursery) 366.00 360.00 339.00 6.00 27.00 1,763.00 1,826.00 1,661.00 (63.00) Observation Days 205.00 187.00 178.00 18.00 27.00 1,212.00 1,047.00 1,199.00 165.00 Equivalent Discharge 2,644.14 2,872.20 2,877.00 (228.06) (232.86) 13,476.87 14,726.10 14,156.00 (1,249.22) Equivalent Patient Days 11,092.82 11,734.12 11,415.00 (641.30) (322.18) 56,801.44 60,186.96 58,296.00 (3,385.52) Equivalent Discharge (Includes Nursery) 2,750.17 2,988.76 2,988.00 (238.59) (237.83) 14,069.02 15,311.85 14,867.00 (1,242.83) Equivalent Patient Days (Includes Nursery) 11,360.45 12,008.39 11,683.00 (647.94) (322.55) 58,109.65 61,576.04 59,572.00 (3,466.39) ALOS (ALL) 4.20 4.09 3.97 0.11 0.23 4.20 4.09 4.09 0.12ALOS (ALL) 4.20 4.09 3.97 0.11 0.23 4.20 4.09 4.09 0.12 ACUTE ALOS (Excludes Hospice, Rehab & Psyc 4.11 3.94 3.78 0.17 0.33 4.09 3.95 3.92 0.15 Average Daily Census 244.68 248.42 232.71 (3.74) 11.97 253.47 261.98 251.31 (8.51) %Occupancy 0.70 0.71 0.66 (0.01) 0.04 0.72 0.75 0.72 (0.02) OP Registrations(Including ER) 12,231.00 11,763.00 14,035.00 468.00 (1,804.00) 59,859.00 60,410.00 73,121.00 (551.00) ER Visits Including IP Admits 5,060.00 5,167.00 5,017.00 (107.00) 43.00 24,907.00 25,565.00 24,820.00 (658.00) ER IP Admits 1,074.00 1,070.00 1,063.00 4.00 11.00 5,382.00 5,297.00 5,200.00 85.00 Surgeries 1,096.00 1,258.00 1,239.00 (162.00) (143.00) 5,547.00 6,465.00 6,379.00 (918.00) Open Heart Surgeries (OF ONLY) 26.00 20.00 23.00 6.00 3.00 121.00 99.00 96.00 22.00 Home Health Visits 4,085.00 4,050.00 4,664.00 35.00 (579.00) 19,501.00 20,250.00 20,762.00 (749.00) Home Health Census 322.00 319.00 339.00 3.00 (17.00) 324.00 319.00 323.00 5.00 Home Health Admissions 176.00 174.49 181.00 1.51 (5.00) 829.00 860.84 902.00 (31.84) Physician Visits 2,145.00 1,818.00 2,023.00 327.00 122.00 10,717.00 9,090.00 9,922.00 1,627.00 Psych Admissions - 48.00 52.00 (48.00) (52.00) 4.00 233.00 210.00 (229.00) Rehab Admissions 40.00 53.00 57.00 (13.00) (17.00) 246.00 259.00 281.00 (13.00) OP Procedures 63,181.00 68,155.00 59,883.00 (4,974.00) 3,298.00 321,351.00 325,418.00 297,720.00 (4,067.00) OP Visits 17,291.00 18,748.00 19,433.00 (1,457.00) (2,142.00) 93,876.00 95,064.00 97,256.00 (1,188.00) Average Acuity -Total 1.19 1.12 0.97 0.07 0.22 1.16 1.12 1.13 (0.04) Average Acuity - Medicare 1.43 1.34 1.38 0.09 0.05 1.35 1.34 1.37 (0.01) Deliveries 143 00 153 00 141 00 (10 00) 2 00 730 00 770 00 704 00 (40 00)
35
Deliveries 143.00 153.00 141.00 (10.00) 2.00 730.00 770.00 704.00 (40.00)

EXAMPLE HOSPITAL AND HEALTH CENTERS THE IMPORTANT NUMBERS REPORT 2003MAY, 2003 ACTUAL VS. PRIOR YEAR
ACTIVITY Current Budget PriorVariance To Variance To Current Budget Prior Year Variance To
Month Month Year Budget Prior Year YTD YTD YTD BudgetBALANCE SHEET
The Important Numbers ReportBALANCE SHEET Net Days in Receivables 70 62 60 7 Net Days in Receivables (Regional Summary)* 70 62 58 Capital Expenditures and Equity Transfers 30,513,618 6,307,832 Equity Growth -4.09% 3.01% -1.23%Total Contributions - Restricted/Unrestricted 382,219 134,406 *Includes Current YTD Net Patient Serv. Revenue (excludes Premium Revenue)
OPERATIONS ALLOPERATIONS ALL Gross Revenues 49,757,630 46,366,746 44,239,820 3,390,884 5,517,810 244,634,967 234,559,312 215,098,122 10,075,655 Contractual Allowances+CGS 30,040,511 26,966,161 25,222,690 3,074,350 4,817,821 147,991,222 136,414,939 123,938,114 11,576,283 Net Patient Revenue 19,717,119 19,400,585 19,017,130 316,534 699,989 96,643,745 98,144,373 91,160,008 (1,500,628) Other Revenue 1,052,379 796,248 461,124 256,131 591,255 4,149,651 3,992,939 2,261,950 156,712 Salary, Benefits and Contract L 10,585,072 10,086,119 9,583,229 498,953 1,001,843 49,934,732 49,795,099 44,870,888 139,633 Interest, Depreciation and Amo 1,391,636 1,392,883 1,353,030 (1,247) 38,606 6,959,504 6,964,415 6,765,332 (4,911) Total Expenses 20,914,879 20,356,576 19,796,885 558,303 1,117,994 102,991,121 101,294,472 94,474,069 1,696,649 T t l O ti I (145 381) (159 743) (318 631) 14 362 173 250 (2 197 725) 842 840 (1 052 111) (3 040 565)Total Operating Income (145,381) (159,743) (318,631) 14,362 173,250 (2,197,725) 842,840 (1,052,111) (3,040,565) Investment Income 26,688 50,077 2,672 (23,389) 24,016 86,625 250,385 476,313 (163,760) Contributions 5,015 85,243 3,867 (80,228) 1,148 28,098 426,215 3,633 (398,117) Other Non Operating Income 19,248 - 3,670 19,248 15,578 18,808 - 8,308 18,808 Net Income (94,430) (24,423) (308,422) (70,007) 213,992 (2,064,194) 1,519,440 (563,857) (3,583,634) EBIDTA 1,246,255 1,233,140 1,034,399 13,115 211,856 4,761,779 7,807,255 5,713,221 (3,045,476) EBIDTA Margin 6.00% 6.11% 5.31% -0.11% 0.69% 4.72% 7.64% 6.12% -2.92%
NET INCOME BY ENTITYNET INCOME BY ENTITYHospital and Other (170,897) (234,050) (350,663) 63,153 179,766 (2,509,343) 382,926 (1,523,150) (2,892,269) Home Health 90,518 138,058 185,238 (47,540) (94,720) 616,696 749,465 1,078,048 (132,769) Outpatient Pharmacy 42,208 2,328 (5,067) 39,880 47,275 28,881 13,443 78,264 15,438 Buildings (46,042) (9,118) (52,593) (36,924) 6,551 (45,201) (45,599) (282,989) 398 Professional Practice (61,168) (56,961) (95,546) (4,207) 34,378 (288,758) (257,395) (402,284) (31,363) Operating Income/(Loss) (145,381) (159,743) (318,631) 14,362 173,250 (2,197,725) 842,840 (1,052,111) (3,040,565) Operating Margin -0.70% -0.79% -1.64% 0.09% 0.94% -2.18% 0.83% -1.13% -3.01%Non Operating Hospital 50 951 135 320 10 209 (84 369) 40 742 133 531 676 600 488 254 (543 069)Non-Operating Hospital 50,951 135,320 10,209 (84,369) 40,742 133,531 676,600 488,254 (543,069) Total (94,430) (24,423) (308,422) (70,007) 213,992 (2,064,194) 1,519,440 (563,857) (3,583,634) Total Margin Pct. -0.45% -0.12% -1.58% -0.33% 1.13% -2.05% 1.49% -0.60% -3.54%Return on Investment -2.92% 2.15% -0.52% -5.08%
REVENUE % Inpatient 68.38% 65.63% 63.41% 2.75% 4.97% 67.38% 65.73% 65.31% 1.66%%Outpatient 31 62% 34 37% 36 59% 2 75% 4 97% 32 62% 34 27% 34 69% 1 66%
36
%Outpatient 31.62% 34.37% 36.59% -2.75% -4.97% 32.62% 34.27% 34.69% -1.66%

The Important Numbers ReportEXAMPLE HOSPITAL AND HEALTH CENTERS THE IMPORTANT NUMBERS REPORT 2003MAY, 2003 ACTUAL VS. PRIOR YEAR
The Important Numbers Report
ACTIVITY Current Budget Priorariance To Variance To Current Budget Prior YearVariance To
Month Month Year Budget Prior Year YTD YTD YTD BudgetSALARY INFOFTE per Adjusted Occupied Bed 5.55 5.03 5.10 0.52 0.45 5.30 4.89 4.83 0.41 Employees Paid (Last Payroll) 2 256 00 2 188 00 68 00Employees Paid (Last Payroll) 2,256.00 2,188.00 68.00 Paid FTE's 1,985.62 1,902.66 1,871.46 82.95 114.16 1,989.13 1,947.74 1,865.62 41.39 Worked FTE's 1,824.00 1,705.00 119.00 1,807.00 1,763.00 1,691.99 44.00 Compensation Ratio 54.97% 53.98% 53.79% 0.99% 1.18% 53.70% 52.70% 52.60% 1.00%Salary/Benefit/Contract Labor per Operating Rev. 50.96% 49.94% 1.03% 49.54% 48.75% 48.03% 0.79%Benefit Percentage of Salaries 29.21% 25.56% 26.29% 26.00% 24.93% 0.29%Salary/Benefit per FTE 5,330.88 5,301.05 29.83 25,103.82 25,565.59 24,052.00 (461.78) y p , , , , , ( )%OT 2.74% 2.41% 0.33% 2.74% 2.35% 5.35% 0.38%%Non Productive 8.67% 10.17% -1.50% 9.23% 9.94% 9.10% -0.72%Manhours Per Adjusted Admission * 132.66 117.03 15.64 126.64 113.81 112.77 12.83 Manhours Per Adjusted Patient Day * 31.62 28.64 2.98 30.13 27.85 27.54 2.29 * Includes contracted labor hours
FTE's BY ENTITY (Paid) *Hospital and Other CH* 1,412.37 1,318.84 1,295.87 93.53 116.50 1,422.19 1,363.11 1,277.17 59.07 Hospital and Other OF* 502.63 517.45 506.05 (14.82) (3.42) 495.99 517.19 519.06 (21.20) Home Health 57.88 55.53 56.67 2.35 1.21 57.98 56.59 56.08 1.39 Professional Practice* 12.74 10.84 12.87 1.90 (0.13) 12.97 10.84 13.31 2.13 Total* 1,985.62 1,902.66 1,871.46 82.95 114.16 1,989.13 1,947.74 1,865.62 41.39 * Includes contracted labor hours
37
Includes contracted labor hours

The Important Numbers ReportEXAMPLE HOSPITAL AND HEALTH CENTERS THE IMPORTANT NUMBERS REPORT 2003MAY, 2003 ACTUAL VS. PRIOR YEAR
The Important Numbers Report
ACTIVITY Current Budget Prior ariance To ariance To Current Budget Prior YearVariance To
Month Month Year Budget Prior Year YTD YTD YTD BudgetOTHER INFO% Bad Debt 1.48% 1.49% 1.52% -0.02% -0.04% 1.83% 1.49% 1.62% 0.34%% Charity 2 75% 2 77% 2 82% 0 03% 0 07% 3 40% 2 77% 3 01% 0 62%% Charity 2.75% 2.77% 2.82% -0.03% -0.07% 3.40% 2.77% 3.01% 0.62%Deductability Ratio W/Bad Debt 61.85% 59.65% 58.53% 2.20% 3.32% 62.32% 59.65% 59.23% 2.67%Volunteer Hours 4,704.00 4,240.00 5,250.00 464.00 (546.00) 23,519.00 21,777.00 25,424.00 1,742.00 Capitated Lives/Member Months PHO 14,000.00 14,000.00 13,500.00 - 500.00 70,000.00 70,000.00 66,000.00 - Net Revenue per Employee 10,459.98 10,615.03 10,408.05 (155.05) 51.93 50,672.12 52,438.91 50,076.00 (1,766.79) Inpatient Nursing Unit Costs 420.64 414.20 374.01 6.44
Days In Accounts Receivable by Entity Hospital and Other 69.95 60.00 60.94 9.95 Home Health 57.36 48.83 48.36 8.53 MD 55.58 80.00 57.57 (24.42) Total 69.57 62.21 59.71 7.36
OTHER INFODrug Expense Per Adjusted Patient Day 75.18 71.60 70.50 3.58 4.68 65.49 71.02 66.32 (5.54) Other Medical Expense Per Adjusted Patient Day 172.69 156.26 161.44 16.43 11.25 183.26 152.69 148.11 30.57 Gross Patient Revenue Per Adjusted Admission 18,818.06 16,143.28 15,379.00 2,674.78 3,439.06 18,152.20 15,928.14 15,108.00 2,224.06 Gross Revenue Per Adjusted Patient Day 4,485.57 3,951.45 3,876.00 534.12 609.57 4,306.84 3,897.18 3,690.00 409.67 Net Revenue Per Adjusted Admission 7,854.91 7,031.83 6,771.00 823.08 1,083.91 7,478.99 6,935.80 6,562.00 543.19
38
Net Revenue Per Adjusted Patient Day 1,872.34 1,721.21 1,706.00 151.13 166.34 1,774.49 1,697.00 1,603.00 77.49 Expense Per Adjusted Admission 7,909.89 7,087.45 6,882.00 822.44 1,027.89 7,642.06 6,878.57 6,636.00 763.49 Expense Per Adjusted Patient Day 1,885.44 1,734.82 1,734.00 150.62 151.44 1,813.18 1,683.00 1,621.00 130.18

Instead, let’s look at reports that use Instead, let s look at reports that use key performance indicators
as their basis and… i l expect actions to result
from every report outcome!
King’s Daughters Medical CenterJPS Health Network
ll l hIngalls Health System
39
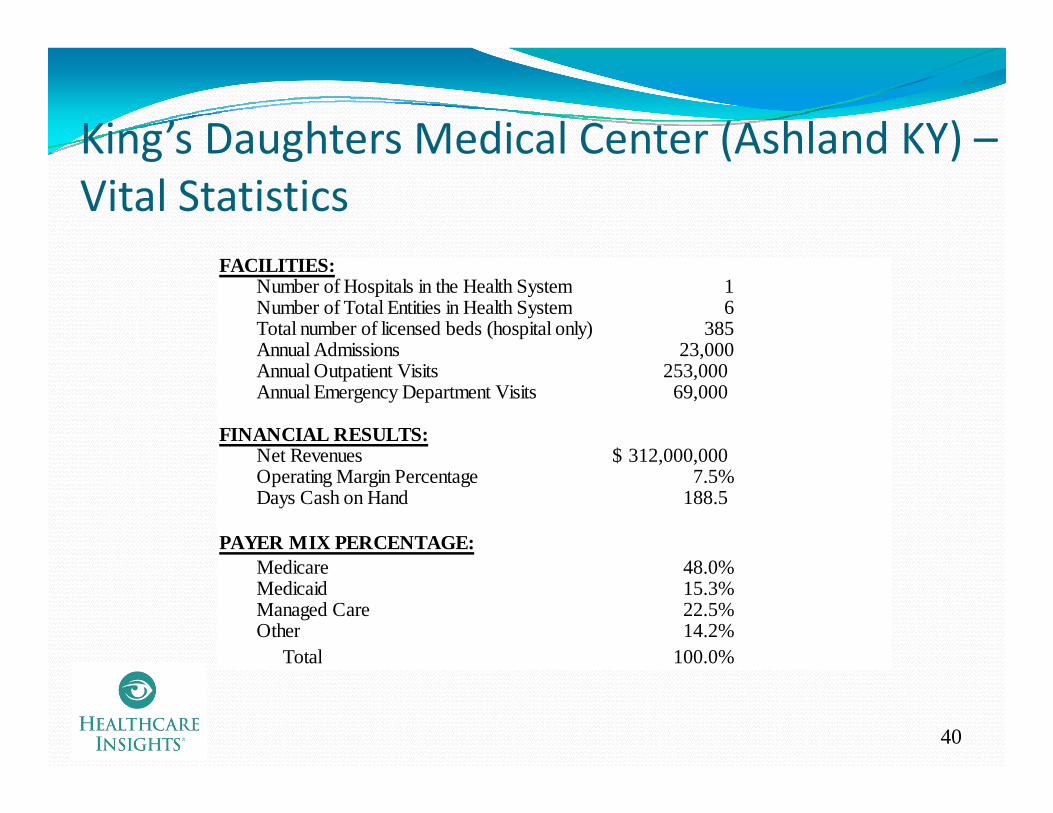
King’s Daughters Medical Center (Ashland KY) –King s Daughters Medical Center (Ashland KY) Vital Statistics
FACILITIES:Number of Hospitals in the Health System 1Number of Total Entities in Health System 6Total number of licensed beds (hospital only) 385Annual Admissions 23,000Annual Admissions 23,000Annual Outpatient Visits 253,000 Annual Emergency Department Visits 69,000
FINANCIAL RESULTS:Net Revenues 312 000 000$Net Revenues 312,000,000$ Operating Margin Percentage 7.5%Days Cash on Hand 188.5
PAYER MIX PERCENTAGE:M di 48 0%Medicare 48.0%Medicaid 15.3%Managed Care 22.5%Other 14.2%
Total 100.0%
40
Total 100.0%
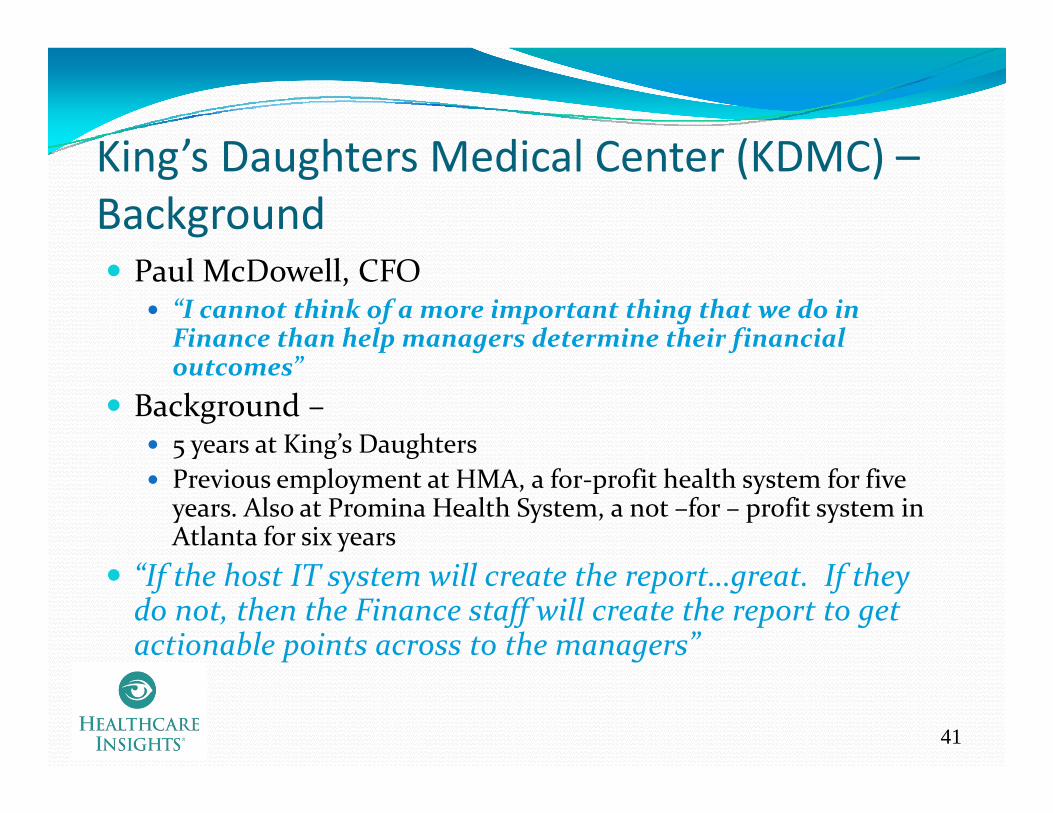
King’s Daughters Medical Center (KDMC)King’s Daughters Medical Center (KDMC) –Background
Paul McDowell, CFO“I cannot think of a more important thing that we do in Finance than help managers determine their financial outcomes”
Background –5 years at King’s Daughters5 y g gPrevious employment at HMA, a for‐profit health system for five years. Also at Promina Health System, a not –for – profit system in Atlanta for six years
“If the host IT system will create the report…great. If they do not, then the Finance staff will create the report to get actionable points across to the managers”
41
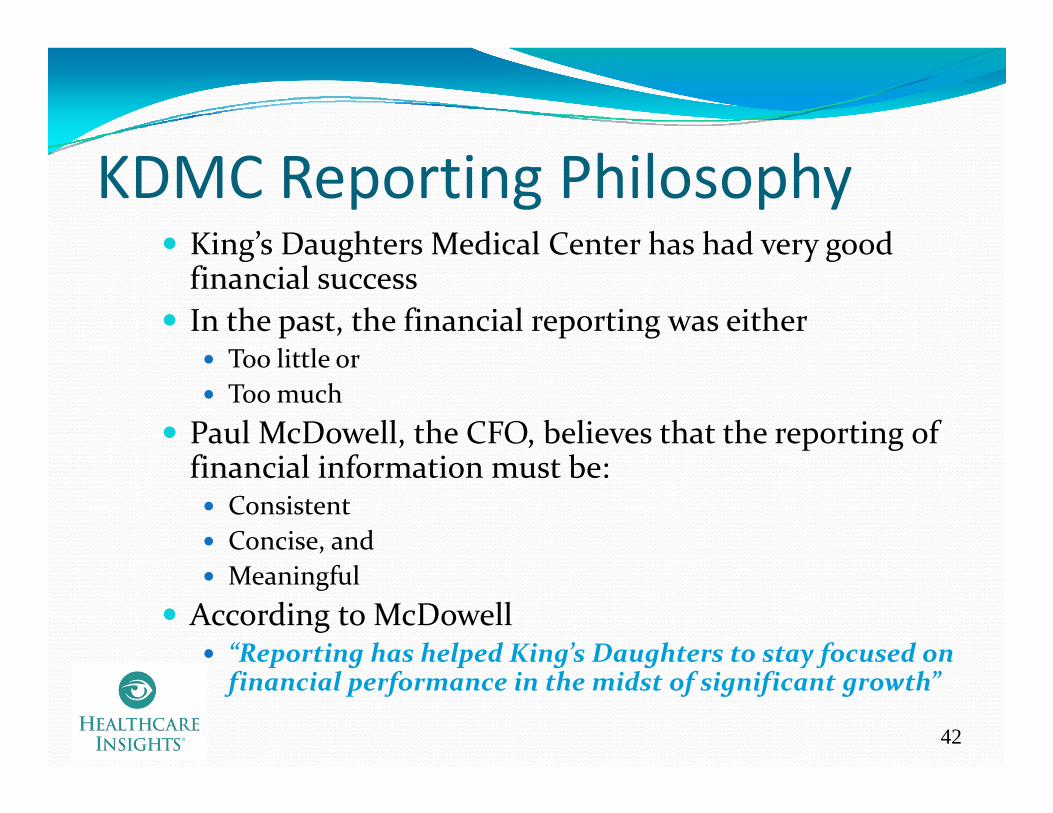
KDMC Reporting PhilosophyKing’s Daughters Medical Center has had very good King s Daughters Medical Center has had very good financial successIn the past, the financial reporting was either
Too little orToo little orToo much
Paul McDowell, the CFO, believes that the reporting of fi i l i f i b financial information must be:
Consistent Concise, andMeaningful
According to McDowell“Reporting has helped King’s Daughters to stay focused on
42
p g p g g y ffinancial performance in the midst of significant growth”
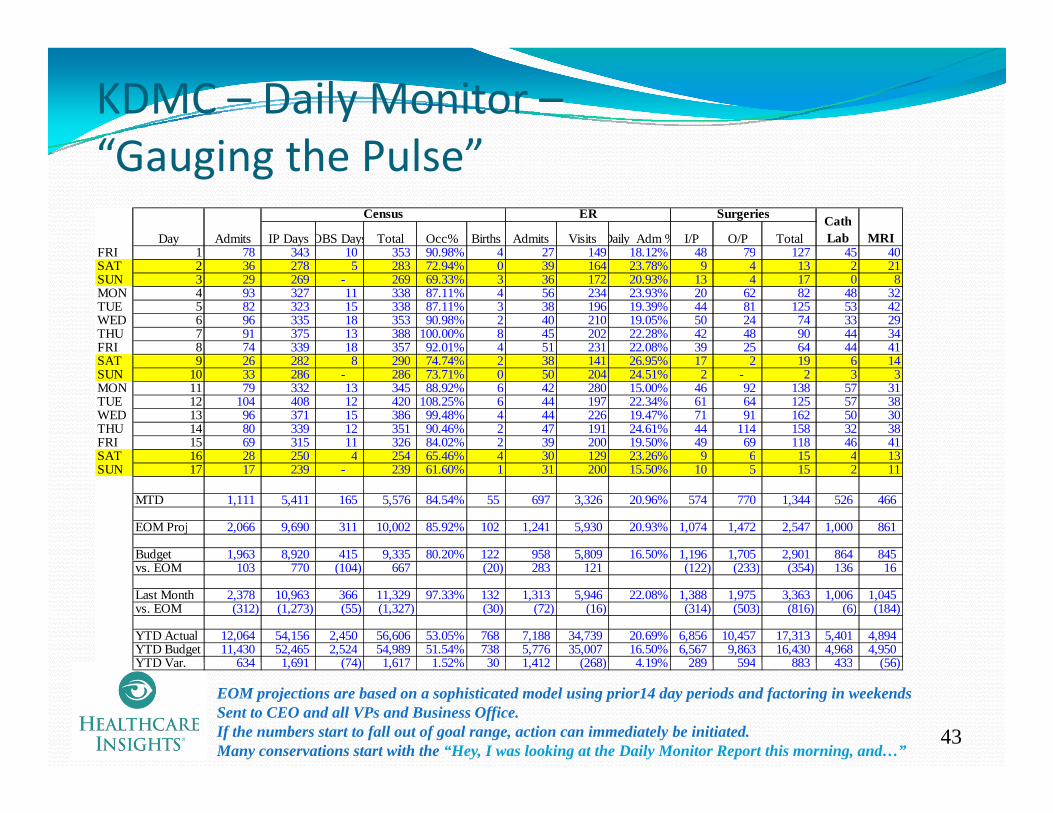
KDMC – Daily Monitor –“Gauging the Pulse”Gauging the Pulse
Day Admits IP Days OBS Days Total Occ% Births Admits Visits Daily Adm % I/P O/P TotalFRI 1 78 343 10 353 90 98% 4 27 149 18 12% 48 79 127 45 40
Census ER Surgeries Cath Lab MRI
FRI 1 78 343 10 353 90.98% 4 27 149 18.12% 48 79 127 45 40SAT 2 36 278 5 283 72.94% 0 39 164 23.78% 9 4 13 2 21SUN 3 29 269 - 269 69.33% 3 36 172 20.93% 13 4 17 0 8MON 4 93 327 11 338 87.11% 4 56 234 23.93% 20 62 82 48 32TUE 5 82 323 15 338 87.11% 3 38 196 19.39% 44 81 125 53 42WED 6 96 335 18 353 90.98% 2 40 210 19.05% 50 24 74 33 29THU 7 91 375 13 388 100.00% 8 45 202 22.28% 42 48 90 44 34FRI 8 74 339 18 357 92.01% 4 51 231 22.08% 39 25 64 44 41SAT 9 26 282 8 290 74.74% 2 38 141 26.95% 17 2 19 6 14SUN 10 33 286 - 286 73.71% 0 50 204 24.51% 2 - 2 3 3MON 11 79 332 13 345 88.92% 6 42 280 15.00% 46 92 138 57 31TUE 12 104 408 12 420 108.25% 6 44 197 22.34% 61 64 125 57 38WED 13 96 371 15 386 99.48% 4 44 226 19.47% 71 91 162 50 30THU 14 80 339 12 351 90.46% 2 47 191 24.61% 44 114 158 32 38FRI 15 69 315 11 326 84.02% 2 39 200 19.50% 49 69 118 46 41SAT 16 28 250 4 254 65 46% 4 30 129 23 26% 9 6 15 4 13SAT 16 28 250 4 254 65.46% 4 30 129 23.26% 9 6 15 4 13SUN 17 17 239 - 239 61.60% 1 31 200 15.50% 10 5 15 2 11
MTD 1,111 5,411 165 5,576 84.54% 55 697 3,326 20.96% 574 770 1,344 526 466
EOM Proj 2,066 9,690 311 10,002 85.92% 102 1,241 5,930 20.93% 1,074 1,472 2,547 1,000 861
Budget 1,963 8,920 415 9,335 80.20% 122 958 5,809 16.50% 1,196 1,705 2,901 864 845 gvs. EOM 103 770 (104) 667 (20) 283 121 (122) (233) (354) 136 16
Last Month 2,378 10,963 366 11,329 97.33% 132 1,313 5,946 22.08% 1,388 1,975 3,363 1,006 1,045vs. EOM (312) (1,273) (55) (1,327) (30) (72) (16) (314) (503) (816) (6) (184)
YTD Actual 12,064 54,156 2,450 56,606 53.05% 768 7,188 34,739 20.69% 6,856 10,457 17,313 5,401 4,894YTD Budget 11,430 52,465 2,524 54,989 51.54% 738 5,776 35,007 16.50% 6,567 9,863 16,430 4,968 4,950YTD Var 634 1 691 (74) 1 617 1 52% 30 1 412 (268) 4 19% 289 594 883 433 (56)
43
YTD Var. 634 1,691 (74) 1,617 1.52% 30 1,412 (268) 4.19% 289 594 883 433 (56)
EOM projections are based on a sophisticated model using prior14 day periods and factoring in weekendsSent to CEO and all VPs and Business Office.If the numbers start to fall out of goal range, action can immediately be initiated.Many conservations start with the “Hey, I was looking at the Daily Monitor Report this morning, and…”

KDMC – Daily Team Huddle –Fi i l IFinancial Issues
March was a TREMENDOUS record‐breaking month! Way to go Team KDMC… Here’s what you did during the month of March:March:
80,765 Laboratory tests performed – an 8% increase over last March’s tests of 74,826. The most tests ever performed in the history of the hospital.1,388 Surgical Procedures and C‐Sections – an almost 13% increase of the record set in October this year with 1,230 procedures. This is a record number of inpatient surgery procedures for a month
The Daily Team Huddle is prepared each day for each of the different organizational priorities (Customer, Quality, month.
1,975 Same Day Surgery Procedures – over 6% increase of last March’s procedures of 1,852. This is a record number of outpatient surgery procedures for a month. 10,495 Radiology Procedures – over 11% increase more than December 2003 record procedures of 9,428. This is another recordnumber of procedures for a month.3 078 CT Scans over 10% increase more than last April’s record
Community, Finance, Culture)
- The Financial Issues page is prepared by the Finance Division3,078 CT Scans – over 10% increase more than last April s record
setting CT scans of 2,780. Yet another record set in the imaging services department.1,045 MRI procedures – more than a 15% increase over last March’s record breaking procedures of 907 setting a new record in the history of the diagnostic center. 80 Open Heart Surgeries ‐ an over 8% increase more than the record set in October 2004 of 74
Division- Delivered to the staff through department management every Thursday- Different financial issues record set in October 2004 of 74.
1,006 Cath Lab Procedures – an over 4% increase more than the record set in September 2004 with 960 procedures. This is a recordin the history of the heart program at KDMC. 182 Angioplasty Procedures – a 5% increase over last March’s record number of 173 procedures. This is yet another record in the history of the heart program at KDMC.
M th k t ll f h k d h d d i thi
ff fare highlighted each week. It may not just be statistical. (ie. Supply utilization, Overtime monitoring, etx)
44
Many thanks to all of you who worked so very hard during this month.KEEP UP THE GREAT WORK!!!
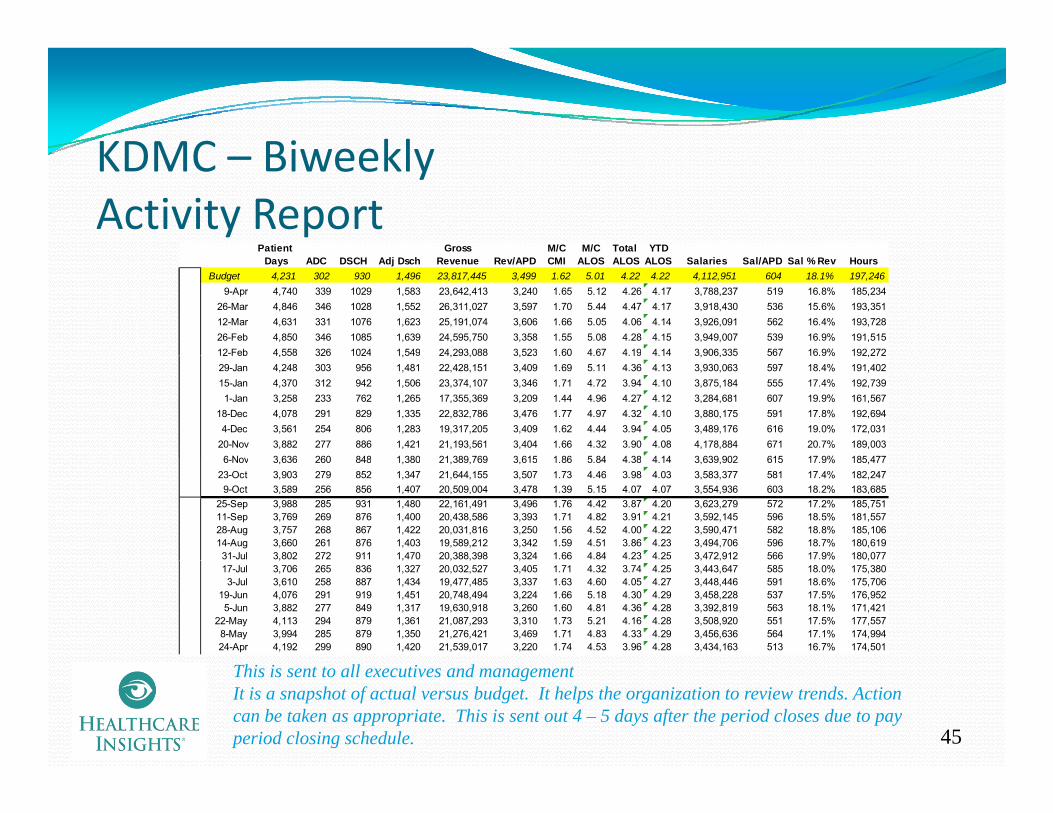
KDMC BiweeklyKDMC – BiweeklyActivity Report
Patient Gross M/C M/C Total YTD Days ADC DSCH Adj Dsch Revenue Rev/APD CMI ALOS ALOS ALOS Salaries Sal/APD Sal % Rev Hours
Budget 4,231 302 930 1,496 23,817,445 3,499 1.62 5.01 4.22 4.22 4,112,951 604 18.1% 197,2469-Apr 4,740 339 1029 1,583 23,642,413 3,240 1.65 5.12 4.26 4.17 3,788,237 519 16.8% 185,234
26-Mar 4,846 346 1028 1,552 26,311,027 3,597 1.70 5.44 4.47 4.17 3,918,430 536 15.6% 193,35112-Mar 4,631 331 1076 1,623 25,191,074 3,606 1.66 5.05 4.06 4.14 3,926,091 562 16.4% 193,72826-Feb 4,850 346 1085 1,639 24,595,750 3,358 1.55 5.08 4.28 4.15 3,949,007 539 16.9% 191,51512-Feb 4,558 326 1024 1,549 24,293,088 3,523 1.60 4.67 4.19 4.14 3,906,335 567 16.9% 192,27212 Feb 4,558 326 1024 1,549 24,293,088 3,523 1.60 4.67 4.19 4.14 3,906,335 567 16.9% 192,27229-Jan 4,248 303 956 1,481 22,428,151 3,409 1.69 5.11 4.36 4.13 3,930,063 597 18.4% 191,40215-Jan 4,370 312 942 1,506 23,374,107 3,346 1.71 4.72 3.94 4.10 3,875,184 555 17.4% 192,7391-Jan 3,258 233 762 1,265 17,355,369 3,209 1.44 4.96 4.27 4.12 3,284,681 607 19.9% 161,567
18-Dec 4,078 291 829 1,335 22,832,786 3,476 1.77 4.97 4.32 4.10 3,880,175 591 17.8% 192,6944-Dec 3,561 254 806 1,283 19,317,205 3,409 1.62 4.44 3.94 4.05 3,489,176 616 19.0% 172,031
20-Nov 3,882 277 886 1,421 21,193,561 3,404 1.66 4.32 3.90 4.08 4,178,884 671 20.7% 189,0036 Nov 3 636 260 848 1 380 21 389 769 3 615 1 86 5 84 4 38 4 14 3 639 902 615 17 9% 185 4776-Nov 3,636 260 848 1,380 21,389,769 3,615 1.86 5.84 4.38 4.14 3,639,902 615 17.9% 185,477
23-Oct 3,903 279 852 1,347 21,644,155 3,507 1.73 4.46 3.98 4.03 3,583,377 581 17.4% 182,2479-Oct 3,589 256 856 1,407 20,509,004 3,478 1.39 5.15 4.07 4.07 3,554,936 603 18.2% 183,685
25-Sep 3,988 285 931 1,480 22,161,491 3,496 1.76 4.42 3.87 4.20 3,623,279 572 17.2% 185,75111-Sep 3,769 269 876 1,400 20,438,586 3,393 1.71 4.82 3.91 4.21 3,592,145 596 18.5% 181,55728-Aug 3,757 268 867 1,422 20,031,816 3,250 1.56 4.52 4.00 4.22 3,590,471 582 18.8% 185,10614-Aug 3,660 261 876 1,403 19,589,212 3,342 1.59 4.51 3.86 4.23 3,494,706 596 18.7% 180,61931-Jul 3,802 272 911 1,470 20,388,398 3,324 1.66 4.84 4.23 4.25 3,472,912 566 17.9% 180,077, , , , , , , ,17-Jul 3,706 265 836 1,327 20,032,527 3,405 1.71 4.32 3.74 4.25 3,443,647 585 18.0% 175,3803-Jul 3,610 258 887 1,434 19,477,485 3,337 1.63 4.60 4.05 4.27 3,448,446 591 18.6% 175,706
19-Jun 4,076 291 919 1,451 20,748,494 3,224 1.66 5.18 4.30 4.29 3,458,228 537 17.5% 176,9525-Jun 3,882 277 849 1,317 19,630,918 3,260 1.60 4.81 4.36 4.28 3,392,819 563 18.1% 171,421
22-May 4,113 294 879 1,361 21,087,293 3,310 1.73 5.21 4.16 4.28 3,508,920 551 17.5% 177,5578-May 3,994 285 879 1,350 21,276,421 3,469 1.71 4.83 4.33 4.29 3,456,636 564 17.1% 174,99424-Apr 4,192 299 890 1,420 21,539,017 3,220 1.74 4.53 3.96 4.28 3,434,163 513 16.7% 174,501
45
This is sent to all executives and managementIt is a snapshot of actual versus budget. It helps the organization to review trends. Action can be taken as appropriate. This is sent out 4 – 5 days after the period closes due to pay period closing schedule.
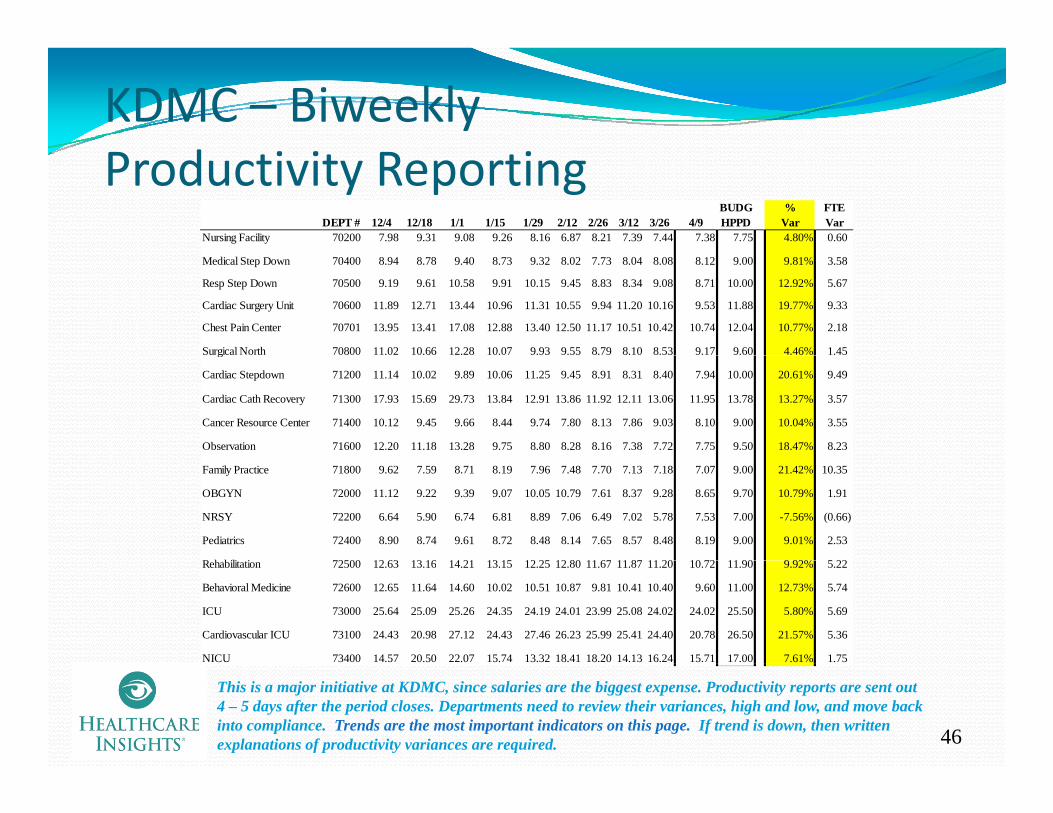
KDMC – BiweeklydProductivity Reporting
BUDG % FTEDEPT # 12/4 12/18 1/1 1/15 1/29 2/12 2/26 3/12 3/26 4/9 HPPD Var Var
Nursing Facility 70200 7.98 9.31 9.08 9.26 8.16 6.87 8.21 7.39 7.44 7.38 7.75 4.80% 0.60
Medical Step Down 70400 8.94 8.78 9.40 8.73 9.32 8.02 7.73 8.04 8.08 8.12 9.00 9.81% 3.58
Resp Step Down 70500 9.19 9.61 10.58 9.91 10.15 9.45 8.83 8.34 9.08 8.71 10.00 12.92% 5.67
Cardiac Surgery Unit 70600 11.89 12.71 13.44 10.96 11.31 10.55 9.94 11.20 10.16 9.53 11.88 19.77% 9.33
Chest Pain Center 70701 13.95 13.41 17.08 12.88 13.40 12.50 11.17 10.51 10.42 10.74 12.04 10.77% 2.18
Surgical North 70800 11.02 10.66 12.28 10.07 9.93 9.55 8.79 8.10 8.53 9.17 9.60 4.46% 1.45 g
Cardiac Stepdown 71200 11.14 10.02 9.89 10.06 11.25 9.45 8.91 8.31 8.40 7.94 10.00 20.61% 9.49
Cardiac Cath Recovery 71300 17.93 15.69 29.73 13.84 12.91 13.86 11.92 12.11 13.06 11.95 13.78 13.27% 3.57
Cancer Resource Center 71400 10.12 9.45 9.66 8.44 9.74 7.80 8.13 7.86 9.03 8.10 9.00 10.04% 3.55
Observation 71600 12.20 11.18 13.28 9.75 8.80 8.28 8.16 7.38 7.72 7.75 9.50 18.47% 8.23
Family Practice 71800 9.62 7.59 8.71 8.19 7.96 7.48 7.70 7.13 7.18 7.07 9.00 21.42% 10.35
OBGYN 72000 11.12 9.22 9.39 9.07 10.05 10.79 7.61 8.37 9.28 8.65 9.70 10.79% 1.91
NRSY 72200 6.64 5.90 6.74 6.81 8.89 7.06 6.49 7.02 5.78 7.53 7.00 -7.56% (0.66)
Pediatrics 72400 8.90 8.74 9.61 8.72 8.48 8.14 7.65 8.57 8.48 8.19 9.00 9.01% 2.53
R h bili i 72500 12 63 13 16 14 21 13 15 12 25 12 80 11 67 11 87 11 20 10 72 11 90 9 92% 5 22Rehabilitation 72500 12.63 13.16 14.21 13.15 12.25 12.80 11.67 11.87 11.20 10.72 11.90 9.92% 5.22
Behavioral Medicine 72600 12.65 11.64 14.60 10.02 10.51 10.87 9.81 10.41 10.40 9.60 11.00 12.73% 5.74
ICU 73000 25.64 25.09 25.26 24.35 24.19 24.01 23.99 25.08 24.02 24.02 25.50 5.80% 5.69
Cardiovascular ICU 73100 24.43 20.98 27.12 24.43 27.46 26.23 25.99 25.41 24.40 20.78 26.50 21.57% 5.36
NICU 73400 14.57 20.50 22.07 15.74 13.32 18.41 18.20 14.13 16.24 15.71 17.00 7.61% 1.75
46
This is a major initiative at KDMC, since salaries are the biggest expense. Productivity reports are sent out 4 – 5 days after the period closes. Departments need to review their variances, high and low, and move back into compliance. Trends are the most important indicators on this page. If trend is down, then written explanations of productivity variances are required.
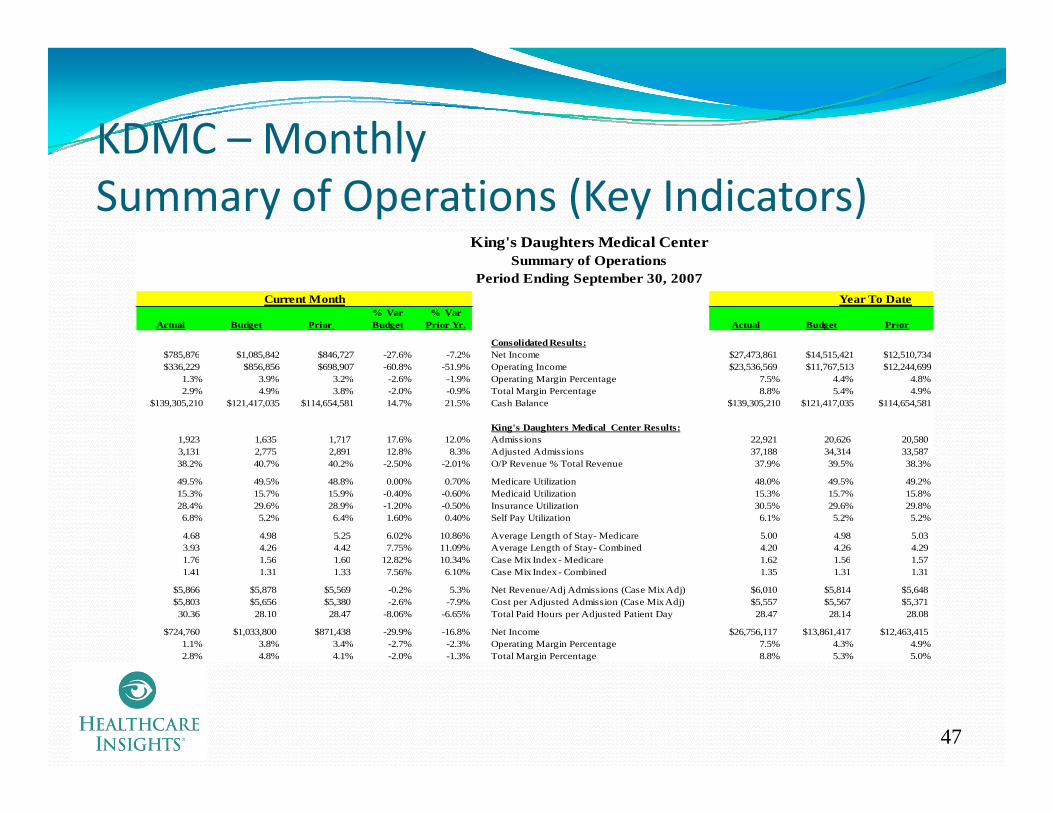
KDMC – MonthlyKDMC Monthly Summary of Operations (Key Indicators)
King's Daughters Medical Center
% Var % Var Actual Budget Prior Budget Prior Yr. Actual Budget Prior
Consolidated Results:$785 876 $1 085 842 $846 727 -27 6% -7 2% Net Income $27 473 861 $14 515 421 $12 510 734
Summary of OperationsPeriod Ending September 30, 2007
Current Month Year To Date
$785,876 $1,085,842 $846,727 -27.6% -7.2% Net Income $27,473,861 $14,515,421 $12,510,734$336,229 $856,856 $698,907 -60.8% -51.9% Operating Income $23,536,569 $11,767,513 $12,244,699
1.3% 3.9% 3.2% -2.6% -1.9% Operating Margin Percentage 7.5% 4.4% 4.8%2.9% 4.9% 3.8% -2.0% -0.9% Total Margin Percentage 8.8% 5.4% 4.9%
$139,305,210 $121,417,035 $114,654,581 14.7% 21.5% Cash Balance $139,305,210 $121,417,035 $114,654,581
King's Daughters Medical Center Results:1,923 1,635 1,717 17.6% 12.0% Admissions 22,921 20,626 20,5803,131 2,775 2,891 12.8% 8.3% Adjusted Admissions 37,188 34,314 33,58738.2% 40.7% 40.2% -2.50% -2.01% O/P Revenue % Total Revenue 37.9% 39.5% 38.3%
49.5% 49.5% 48.8% 0.00% 0.70% Medicare Utilization 48.0% 49.5% 49.2%15.3% 15.7% 15.9% -0.40% -0.60% Medicaid Utilization 15.3% 15.7% 15.8%28.4% 29.6% 28.9% -1.20% -0.50% Insurance Utilization 30.5% 29.6% 29.8%6.8% 5.2% 6.4% 1.60% 0.40% Self Pay Utilization 6.1% 5.2% 5.2%
4.68 4.98 5.25 6.02% 10.86% Average Length of Stay- Medicare 5.00 4.98 5.033.93 4.26 4.42 7.75% 11.09% Average Length of Stay- Combined 4.20 4.26 4.291 76 1 56 1 60 12 82% 10 34% Case Mix Index- Medicare 1 62 1 56 1 571.76 1.56 1.60 12.82% 10.34% Case Mix Index - Medicare 1.62 1.56 1.57 1.41 1.31 1.33 7.56% 6.10% Case Mix Index - Combined 1.35 1.31 1.31
$5,866 $5,878 $5,569 -0.2% 5.3% Net Revenue/Adj Admissions (Case Mix Adj) $6,010 $5,814 $5,648$5,803 $5,656 $5,380 -2.6% -7.9% Cost per Adjusted Admission (Case Mix Adj) $5,557 $5,567 $5,37130.36 28.10 28.47 -8.06% -6.65% Total Paid Hours per Adjusted Patient Day 28.47 28.14 28.08
$724,760 $1,033,800 $871,438 -29.9% -16.8% Net Income $26,756,117 $13,861,417 $12,463,4151.1% 3.8% 3.4% -2.7% -2.3% Operating Margin Percentage 7.5% 4.3% 4.9%2.8% 4.8% 4.1% -2.0% -1.3% Total Margin Percentage 8.8% 5.3% 5.0%
47

KDMC – Monthly Hospital Statistics Report
King's Daughters Medical CenterStatistical Indicator Report
Period Ending September 30, 2007Period Ending September 30, 2007
% Var % Var % VarActual Budget Prior Budget Prior Yr Actual Budget Prior Budget
Hospital Volumes 1,923 1,635 1,717 17.6% 12.0% Admissions 22,921 20,626 20,580 11.1%3,131 2,775 2,891 12.8% 8.3% Adjusted Admissions 37,188 34,314 33,587 8.4%
276 251 263 9.7% 4.9% Average Daily Census 283 260 260 8.5%1 193 884 1 009 35 0% 18 2% Surgical Procedures and C Sections 13 359 11 790 11 771 13 3%
Current Month Year to Date
1,193 884 1,009 35.0% 18.2% Surgical Procedures and C-Sections 13,359 11,790 11,771 13.3%1,698 1,330 1,526 27.7% 11.3% Same Day Surgery Procedures 19,260 17,462 17,169 10.3%
66 53 50 24.5% 32.0% Open Heart Surgery Procedures 697 620 576 12.4%960 620 596 54.8% 61.1% Cath Lab Procedures 9,338 7,160 6,984 30.4%160 99 77 62.1% 107.8% Angioplasty Procedures 1,602 1,140 1,125 40.5%
5,864 5,787 5,880 1.3% -0.3% Emergency Department Visits 69,398 67,048 67,094 3.5%140 107 123 30.8% 13.8% Deliveries 1,465 1,286 1,313 13.9%474 420 462 12.9% 2.6% Observation Days 5,093 5,104 5,039 -0.2%
65,678 59,110 62,444 11.1% 5.2% Laboratory Procedures 798,613 710,270 705,946 12.4%8,847 8,694 8,972 1.8% -1.4% Radiology Procedures 108,122 107,178 104,592 0.9%
819 848 848 -3.4% -3.4% MRI Procedures 9,679 9,537 9,187 1.5%1,501 1,206 1,380 24.5% 8.8% Ultrasounds 17,303 15,600 14,797 10.9%2,751 2,532 2,658 8.6% 3.5% CT Scans 32,213 29,710 28,997 8.4%2,389 1,911 2,583 25.0% -7.5% Home Health Visits 29,589 28,897 29,153 2.4%9,963 11,209 10,642 -11.1% -6.4% Family Care Center Visits 130,540 135,020 109,923 -3.3%
Hospital Labor Costs2,391 2,102 2,209 -13.8% -8.2% Total FTE's, Including Contract Employees 2,289 2,140 2,089 -7.0%, , , , g p y , , ,5.33 4.93 5.00 -8.1% -6.7% FTE's per Adjusted Occupied Bed 5.00 4.94 4.93 -1.2%
30.36 28.10 28.47 -8.1% -6.7% Total Paid Hours per Adjusted Patient Day 28.47 28.14 28.08 -1.2%$2,551 $2,556 $2,527 0.2% -1.0% Salary Expense per Adjusted Admission $2,524 $2,539 $2,468 0.6%$20.11 $20.40 $19.91 1.4% -1.0% Average Hourly Wage $20.26 $20.21 $19.67 -0.2%
Hospital Credit & Collections53.6 59.5 60.3 10.0% 11.2% Net Days in Accounts Receivable 53.6 59.5 60.3 10.0%5.9% 5.2% 2.9% -0.6% -3.0% Bad Debt & Charity % Total Patient Revenue 5.3% 5.2% 4.7% -0.1%
i S
48
Hospital Supply Management10.60% 10.05% 11.39% -0.5% 0.8% Supply Expense % of Total Patient Revenue 10.21% 10.01% 11.39% -0.2%$1,631 $1,417 $1,559 -15.1% -4.6% Supply Expense per Adjusted Admission $1,505 $1,408 $1,371 -6.9%
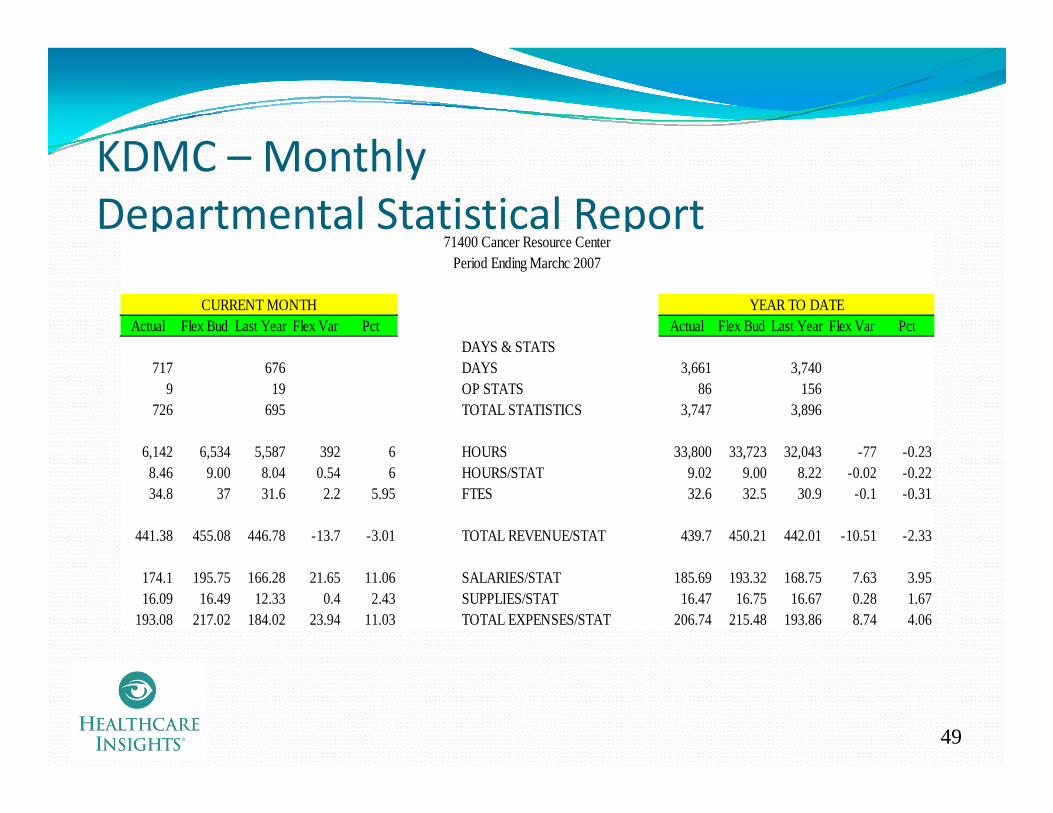
KDMC MonthlyKDMC – MonthlyDepartmental Statistical Report
71400 Cancer Resource Center
Actual Flex Bud Last Year Flex Var Pct Actual Flex Bud Last Year Flex Var PctDAYS & STATS
CURRENT MONTH YEAR TO DATE
Period Ending Marchc 2007
717 676 DAYS 3,661 3,7409 19 OP STATS 86 156
726 695 TOTAL STATISTICS 3,747 3,896
6,142 6,534 5,587 392 6 HOURS 33,800 33,723 32,043 -77 -0.23, , , , , ,8.46 9.00 8.04 0.54 6 HOURS/STAT 9.02 9.00 8.22 -0.02 -0.2234.8 37 31.6 2.2 5.95 FTES 32.6 32.5 30.9 -0.1 -0.31
441.38 455.08 446.78 -13.7 -3.01 TOTAL REVENUE/STAT 439.7 450.21 442.01 -10.51 -2.33
174.1 195.75 166.28 21.65 11.06 SALARIES/STAT 185.69 193.32 168.75 7.63 3.9516.09 16.49 12.33 0.4 2.43 SUPPLIES/STAT 16.47 16.75 16.67 0.28 1.67
193.08 217.02 184.02 23.94 11.03 TOTAL EXPENSES/STAT 206.74 215.48 193.86 8.74 4.06
49

KDMC – Monthly Productivity Graph
HPPD StaffingTornado FYTD thru March 2007 for Nursing Units
Goal 0 00%
5 5%6.1%
7.6%11.6%11.9%
28.2%
Cardiovascular ICU
Respiratory Step-Down
Family Practice
Neonatal ICU
Labor & Delivery
Clinical Resource TeamGoal 0.00%
0 5%1.1%
3.0%3.9%4.3%4.6%
5.5%
Medical Step-Down
Pediatrics
Obstetrics/Gynecology
Newborn Nursery
Cardiac Surgery Unit
-1.4%-0.8%-0.6%-0.2%
0.3%0.5%
ICU
Surgery/Ortho
Cardiac Step-Down
Cancer Resource Center
Observation
Behavioral Medic ine
-8.6%-6.8%-6.2%
-2.8%
-15 0% -10 0% -5 0% 0 0% 5 0% 10 0% 15 0% 20 0% 25 0% 30 0% 35 0%
Chest Pain Unit
Skilled Nursing
Rehabilitation
Cardiac Cath Recovery
50
15.0% 10.0% 5.0% 0.0% 5.0% 10.0% 15.0% 20.0% 25.0% 30.0% 35.0%This is used by executives and management to quickly show the department that did…or did not, meet their productivity goals. This is also used at the monthly leadership meeting for all the divisions. It is meant to create peer pressure and competition. “Nobody wants to be in the red,” according to Paul McDowell.
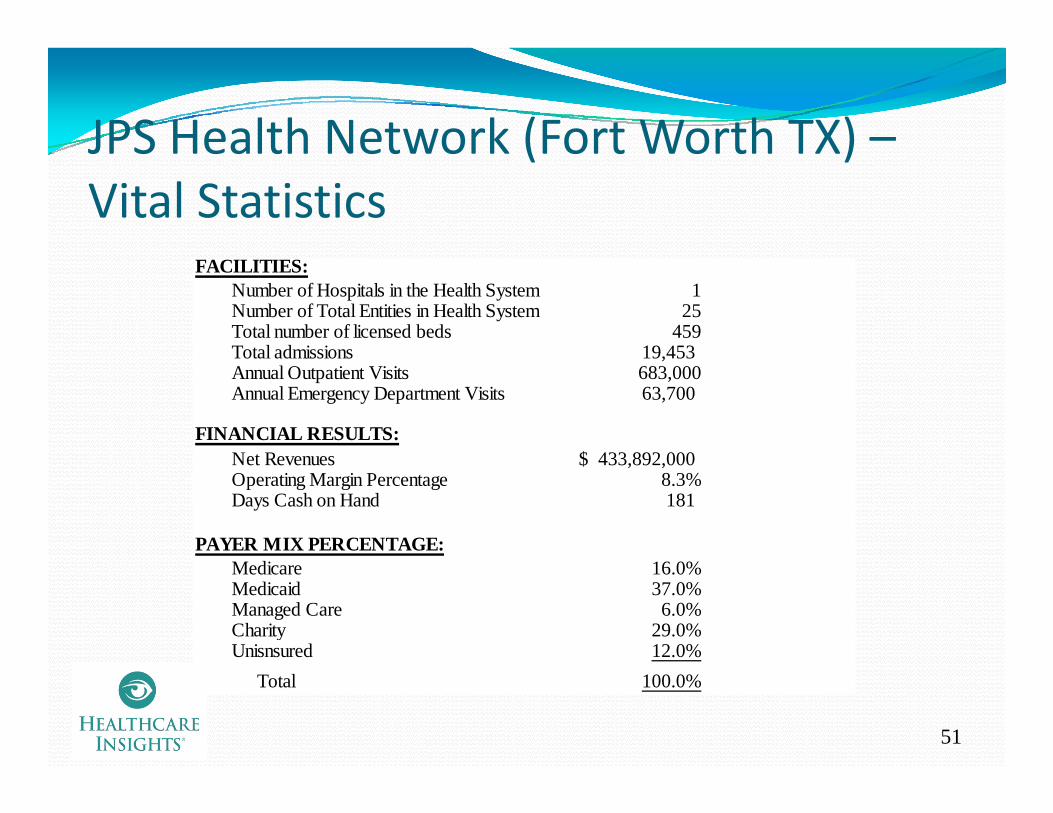
JPS Health Network (Fort Worth TX) –JPS Health Network (Fort Worth TX) Vital Statistics
FACILITIES:Number of Hospitals in the Health System 1Number of Total Entities in Health System 25Total number of licensed beds 459Total admissions 19 453Total admissions 19,453 Annual Outpatient Visits 683,000Annual Emergency Department Visits 63,700
FINANCIAL RESULTS:Net Revenues 433 892 000$Net Revenues 433,892,000$ Operating Margin Percentage 8.3%Days Cash on Hand 181
PAYER MIX PERCENTAGE:Medicare 16.0%Medicaid 37.0%Managed Care 6.0%Charity 29.0%Unisnsured 12.0%
51
Total 100.0%

JPS Health Network –Background
Gale Pileggi, CFOgg“We owe it to our county residents to be the most efficient and effective facility we can possibly be. I believe that the proper reporting of information can help this greatly. Before I came here three years ago, very little reporting took place. A culture h i d ”change was in order”
CFO at JPS for three yearsBackground in two different for‐profit systems, over 11 years; 15 years in a non‐profit Children’s Hospital
JPS is a Hospital District, where Ad Valorem Taxes provide a substantial amount of tax money ($205 million) to the operation of the facility.If the facility is able to operate more efficiently the government If the facility is able to operate more efficiently, the government money will be utilized to generate
More volumes (community goal)At lower unit costsI i i l i d f ili i
52
Investment in capital equipment and facilities
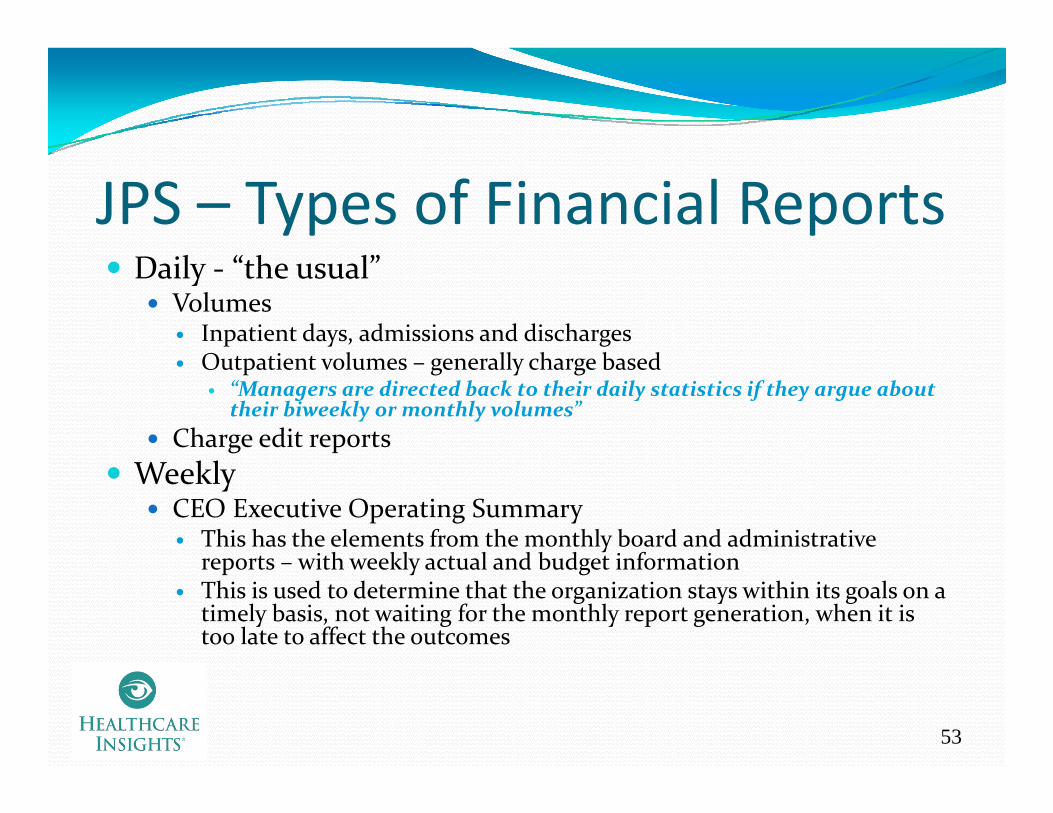
JPS – Types of Financial ReportsDaily ‐ “the usual”
VolumesInpatient days, admissions and dischargesO i l ll h b dOutpatient volumes – generally charge based
“Managers are directed back to their daily statistics if they argue about their biweekly or monthly volumes”
Charge edit reportsWeekly
CEO Executive Operating SummaryThis has the elements from the monthly board and administrative reports with weekly actual and budget informationreports – with weekly actual and budget informationThis is used to determine that the organization stays within its goals on a timely basis, not waiting for the monthly report generation, when it is too late to affect the outcomes
53

JPS – Types of Financial ReportsBiweekly
Labor ReportingProductivity reportingy p g
“We invested a lot of time in developing productivity standards and we expect the management team to achieve these standards on a biweekly basis. Our management team find these reports invaluable in measuring past performance and planning future staffing. We believe i h h h hl l b i b h in these reports more than the monthly labor reporting, because the accruals on the monthly reports include estimates that distort the variance analysis., while the biweekly totals are real.”
MonthlyyBoard Finance Package
Prepared for and sent to Administrators and Board membersDepartment Manager Package
54
p g g
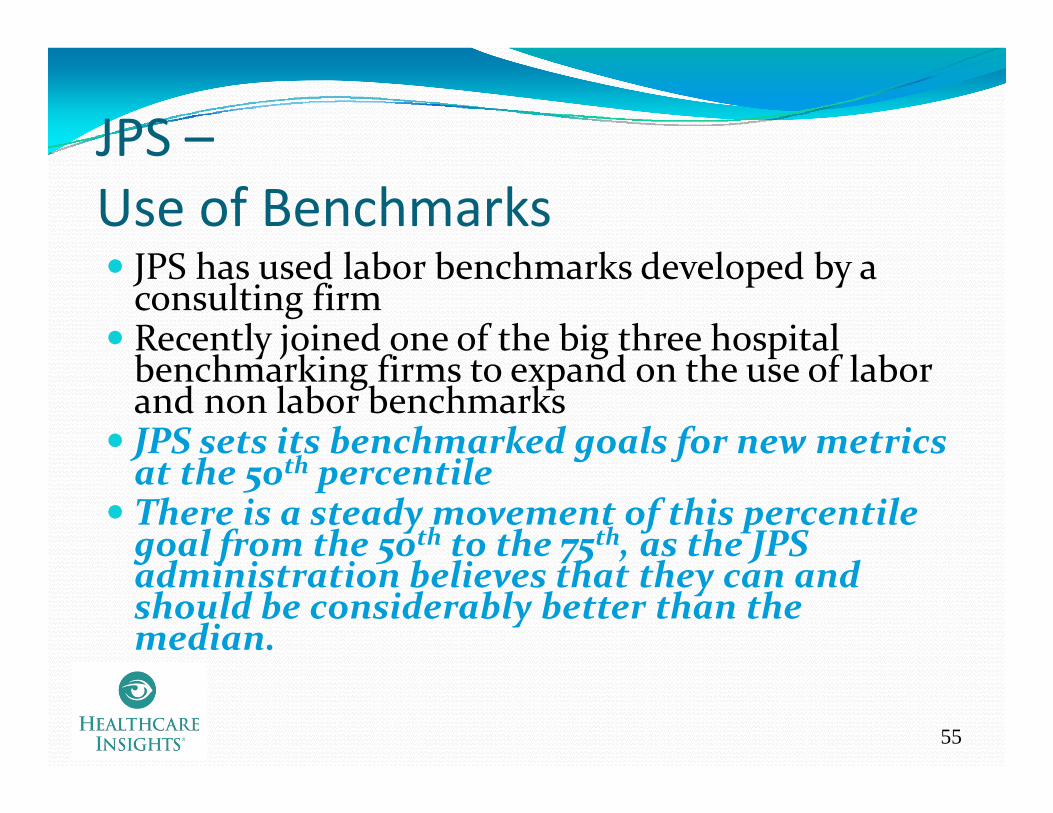
JPS –JPS Use of Benchmarks
h d l b b h k d l d bJPS has used labor benchmarks developed by a consulting firmRecently joined one of the big three hospital b h k f d h f l b
y j g pbenchmarking firms to expand on the use of labor and non labor benchmarksJPS sets its benchmarked goals for new metrics
h h lJ g fat the 50th percentileThere is a steady movement of this percentile goal from the 50th to the 75th, as the JPS d b l h h d
g f 5 75 , Jadministration believes that they can and should be considerably better than the median.
55

JPS – DailyD S i i R iDepartment Statistics Reporting
4/27/2007 4/28/2007 4/29/2007 4/30/2007 5/1/2007 5/2/2007 5/3/2007Departmental Stats - Units 14 16 17 18 16 16 14 This daily report Actual Labor Hours - Productive Overtime 7 19 28 22Actual Labor Dollars - Productive Overtim 330 856 777 780Actual Overtime Rate/Hour 45 45 27 36
Actual Labor Hours - Productive Regular 217 181 158 173 156 190 215Actual Labor Dollars - Productive Regular 4,679 3,770 3,167 4,406 4,064 4,152 4,744Actual Regular Rate/Hour 22 21 20 25 26 22 22
is available, online, to the department managers, by mid morning of theActual Regular Rate/Hour 22 21 20 25 26 22 22
Total Actual Productive Hours 217 188 177 202 178 190 215Total Actual Productive Dollars 4,679 4,100 4,023 5,183 4,843 4,152 4,744Actual Productive Rate/Hour 21.58 21.82 22.70 25.69 27.21 21.87 22.11
Actual Productive Rate/Hour 22 22 23 26 27 22 22
morning of the following day.Managers are
expected to check the recorded
l dBudgeted Rate/Hour 24 24 24 24 24 24 24Actual Productive Hours/Unit 15 12 10 11 11 12 15Budgeted Productive Hours/Unit 11 11 11 11 11 11 11Actual Productive Cost/Unit 334 256 237 288 303 259 339Budgeted Productive Cost/Unit 257 257 257 257 257 257 257
Budgeted Productive Hours 152 173.60 184.45 195.30 173.60 174 152
volumes and ensure that they are correct.
Managers are not able to g
Actual Productive Hours 217 188 177 202 178 190 215Productive Hours Variance -65 -14 7 -6 -4 -16 -63Efficiency Variance Cost -1,539 -339 171 -154 -104 -384 -1,487
Budgeted Productive Dollars 5,141 4,455 4,203 4,784 4,220 4,500 5,088Actual Productive Dollars 4,679 4,100 4,023 5,183 4,843 4,152 4,744Productive Rate Variance 462 355 180 399 623 349 344
complain about their monthly statistics if they have not been reviewing their
56
Productive Rate Variance 462 355 180 -399 -623 349 344
Total Variance Favorable (Unfavorable) -1,077 16 350 -553 -727 -35 -1,143
reviewing their daily statistical indicators.
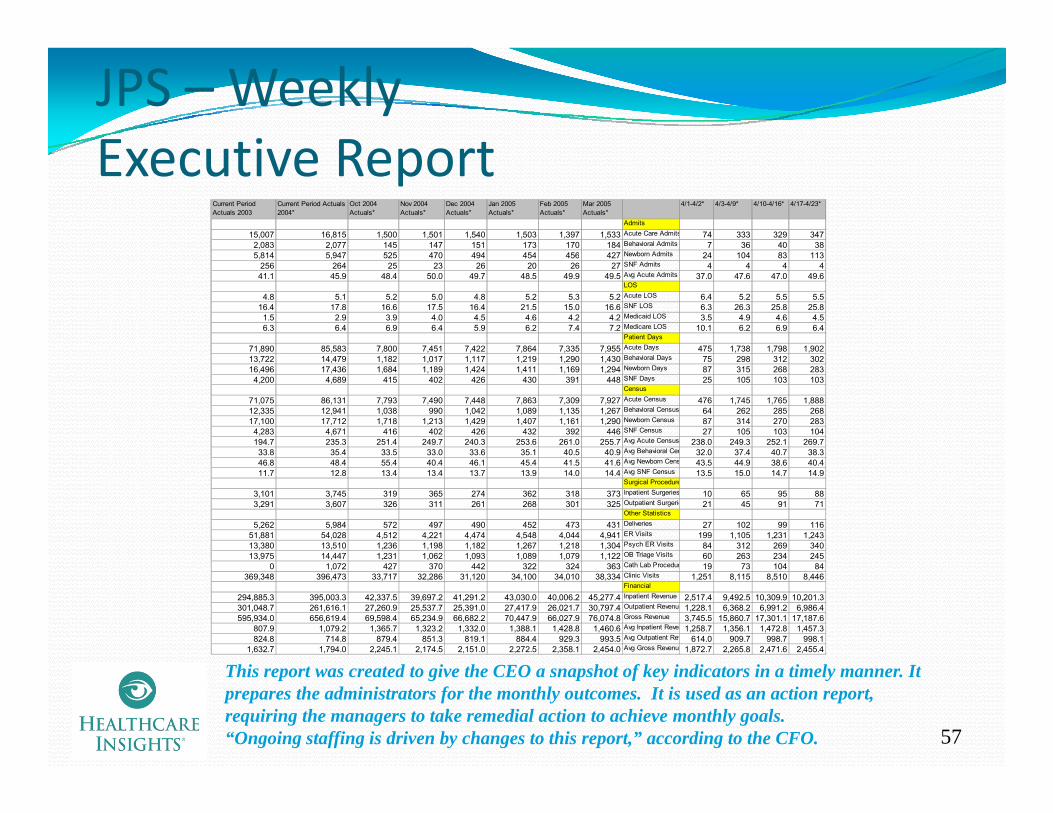
JPS – Weekly Executive ReportExecutive Report
Current Period Actuals 2003
Current Period Actuals 2004*
Oct 2004 Actuals*
Nov 2004 Actuals*
Dec 2004 Actuals*
Jan 2005 Actuals*
Feb 2005 Actuals*
Mar 2005 Actuals*
4/1-4/2* 4/3-4/9* 4/10-4/16* 4/17-4/23*
Admits
15,007 16,815 1,500 1,501 1,540 1,503 1,397 1,533 Acute Care Admits 74 333 329 3472,083 2,077 145 147 151 173 170 184 Behavioral Admits 7 36 40 385 814 5 947 525 470 494 454 456 427 Newborn Admits 24 104 83 1135,814 5,947 525 470 494 454 456 427 Newborn Admits 24 104 83 113
256 264 25 23 26 20 26 27 SNF Admits 4 4 4 441.1 45.9 48.4 50.0 49.7 48.5 49.9 49.5 Avg Acute Admits 37.0 47.6 47.0 49.6
LOS
4.8 5.1 5.2 5.0 4.8 5.2 5.3 5.2 Acute LOS 6.4 5.2 5.5 5.516.4 17.8 16.6 17.5 16.4 21.5 15.0 16.6 SNF LOS 6.3 26.3 25.8 25.8
1.5 2.9 3.9 4.0 4.5 4.6 4.2 4.2 Medicaid LOS 3.5 4.9 4.6 4.56.3 6.4 6.9 6.4 5.9 6.2 7.4 7.2 Medicare LOS 10.1 6.2 6.9 6.4
Patient Days
71,890 85,583 7,800 7,451 7,422 7,864 7,335 7,955 Acute Days 475 1,738 1,798 1,902B h i l D13,722 14,479 1,182 1,017 1,117 1,219 1,290 1,430 Behavioral Days 75 298 312 302
16,496 17,436 1,684 1,189 1,424 1,411 1,169 1,294 Newborn Days 87 315 268 2834,200 4,689 415 402 426 430 391 448 SNF Days 25 105 103 103
Census
71,075 86,131 7,793 7,490 7,448 7,863 7,309 7,927 Acute Census 476 1,745 1,765 1,88812,335 12,941 1,038 990 1,042 1,089 1,135 1,267 Behavioral Census 64 262 285 26817,100 17,712 1,718 1,213 1,429 1,407 1,161 1,290 Newborn Census 87 314 270 283
4,283 4,671 416 402 426 432 392 446 SNF Census 27 105 103 104194.7 235.3 251.4 249.7 240.3 253.6 261.0 255.7 Avg Acute Census 238.0 249.3 252.1 269.733.8 35.4 33.5 33.0 33.6 35.1 40.5 40.9 Avg Behavioral Cen 32.0 37.4 40.7 38.346.8 48.4 55.4 40.4 46.1 45.4 41.5 41.6 Avg Newborn Cens 43.5 44.9 38.6 40.411.7 12.8 13.4 13.4 13.7 13.9 14.0 14.4 Avg SNF Census 13.5 15.0 14.7 14.9
Surgical Procedure
3,101 3,745 319 365 274 362 318 373 Inpatient Surgeries 10 65 95 883,291 3,607 326 311 261 268 301 325 Outpatient Surgerie 21 45 91 71
Other Statistics
5,262 5,984 572 497 490 452 473 431 Deliveries 27 102 99 11651,881 54,028 4,512 4,221 4,474 4,548 4,044 4,941 ER Visits 199 1,105 1,231 1,24313,380 13,510 1,236 1,198 1,182 1,267 1,218 1,304 Psych ER Visits 84 312 269 34013,975 14,447 1,231 1,062 1,093 1,089 1,079 1,122 OB Triage Visits 60 263 234 245
0 1,072 427 370 442 322 324 363 Cath Lab Procedur 19 73 104 84369,348 396,473 33,717 32,286 31,120 34,100 34,010 38,334 Clinic Visits 1,251 8,115 8,510 8,446
Financial
294,885.3 395,003.3 42,337.5 39,697.2 41,291.2 43,030.0 40,006.2 45,277.4 Inpatient Revenue 2,517.4 9,492.5 10,309.9 10,201.3301,048.7 261,616.1 27,260.9 25,537.7 25,391.0 27,417.9 26,021.7 30,797.4 Outpatient Revenue 1,228.1 6,368.2 6,991.2 6,986.4595,934.0 656,619.4 69,598.4 65,234.9 66,682.2 70,447.9 66,027.9 76,074.8 Gross Revenue 3,745.5 15,860.7 17,301.1 17,187.6
807.9 1,079.2 1,365.7 1,323.2 1,332.0 1,388.1 1,428.8 1,460.6 Avg Inpatient Reven 1,258.7 1,356.1 1,472.8 1,457.3824.8 714.8 879.4 851.3 819.1 884.4 929.3 993.5 Avg Outpatient Rev 614.0 909.7 998.7 998.1
1,632.7 1,794.0 2,245.1 2,174.5 2,151.0 2,272.5 2,358.1 2,454.0 Avg Gross Revenue 1,872.7 2,265.8 2,471.6 2,455.4
57
This report was created to give the CEO a snapshot of key indicators in a timely manner. It prepares the administrators for the monthly outcomes. It is used as an action report, requiring the managers to take remedial action to achieve monthly goals.“Ongoing staffing is driven by changes to this report,” according to the CFO.

JPS – Biweekly Labor ReportVolume Adjusted Variances ‐ Dollars
Salary and Wage Report Productive OnlyVolume Adjusted Variance AnalysisPay Period Ending Mar 13, 2007 YTD
Routine Areas
AdminCost Center Cost Center Name Budget Actual Var Budget Actual Var Budget Actual Var
LOWE CC612 PROGRESSIVE CARE WEST 3 382 3 557 175 841 740 988 240 146 500 248 89 277 83 28 94
Units Salary and Wage SW per Unit
LOWE CC612 PROGRESSIVE CARE WEST 3,382 3,557 175 841,740 988,240 146,500 248.89 277.83 28.94LOWE CC618 TOWER FIVE 3,404 3,843 439 658,578 777,915 119,336 193.47 202.42 8.95LOWE CC619 TELEMETRY NORTH 2,704 2,583 (121) 636,128 688,838 52,710 235.25 266.68 31.43LOWE CC621 TOWER SEVEN 4,609 4,168 (441) 959,343 975,706 16,363 208.15 234.09 25.95LOWE CC622 PROGRESSIVE CARE EAST 3,515 3,548 33 893,136 962,671 69,535 254.09 271.33 17.23LOWE CC626 TOWER ELEVEN 2,787 2,746 (41) 522,754 594,487 71,733 187.57 216.49 28.92LOWE CC640 ICU 3,019 3,007 (12) 1,699,252 1,667,444 (31,807) 562.85 554.52 (8.33)LOWE CC646 2 SOUTH 3,215 2,614 (601) 599,276 772,056 172,780 186.40 295.35 108.95LOWE CC648 2 NORTH 3 127 3 201 74 517 795 617 292 99 496 165 59 192 84 27 25LOWE CC648 2 NORTH 3,127 3,201 74 517,795 617,292 99,496 165.59 192.84 27.25LOWE CC650 NEWBORN NURSERY 3,464 4,183 719 386,537 467,996 81,459 111.59 111.88 0.29LOWE CC651 NEONATAL ICU 2,509 3,060 551 1,031,576 1,259,186 227,609 411.15 411.50 0.35LOWE CC654 CONTINUING CARE NURSERY 1,324 489 (835) 214,146 52,010 (162,136) 161.74 106.36 (55.38)LOWE CC663 TOWER SIX 4,346 4,302 (44) 823,695 804,362 (19,333) 189.53 186.97 (2.56)LOWE CC668 TOWER TWO 3,180 2,809 (371) 722,888 628,994 (93,895) 227.32 223.92 (3.40)LOWE CC670 LABOR & DELIVERY 4,449 4,316 (133) 1,422,463 1,301,131 (121,332) 319.73 301.47 (18.26)LOWE CC761 SKILLED NURSING FACILITY 2,362 2,317 (45) 344,807 370,161 25,354 145.98 159.76 13.78
12 274 117 12 928 489 654 37212,274,117 12,928,489 654,372
Both this report (dollars) and the report on the next page (hours), are used extensively by the administrators to ensure that the managers are meeting their biweekly labor goals. These reports have even greater significance than the monthly labor reports because they d t t i thl l (A l “kill ” di t th CFO)
58
do not contain any monthly accruals. (Accruals are “killers” according to the CFO)The administrators rely on this report rather than the monthly report because it is
- More timely, and- “absolutely accurate”
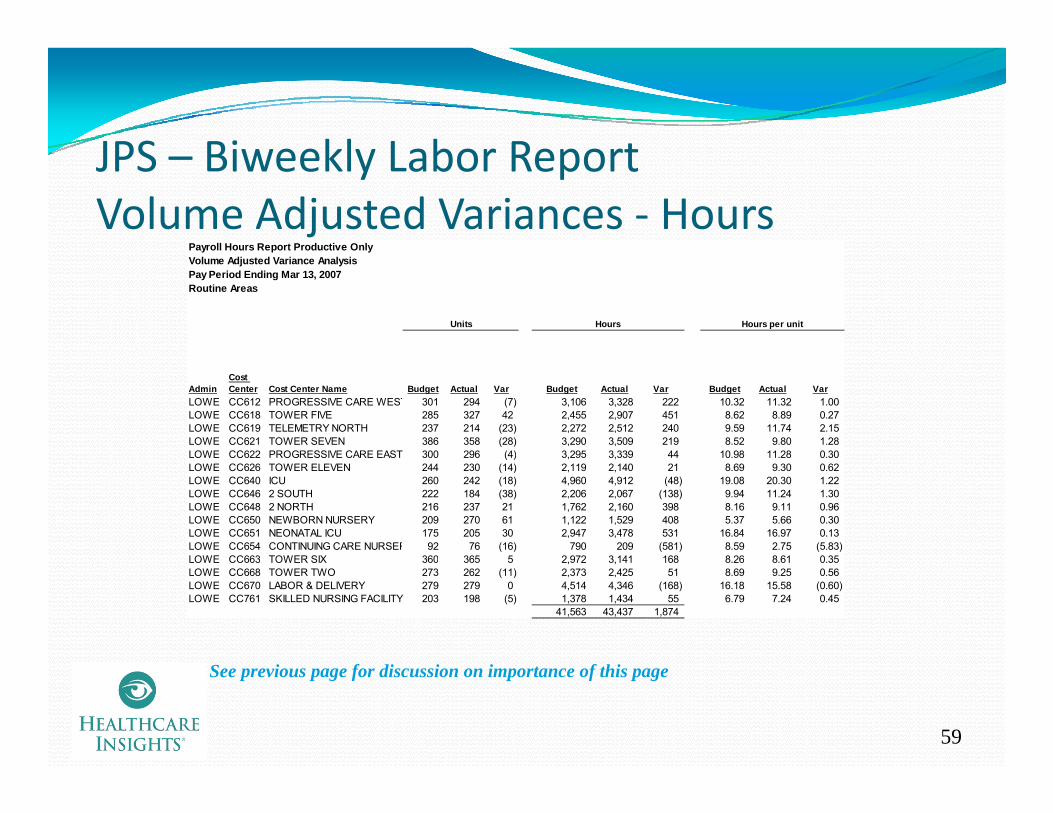
JPS Biweekly Labor ReportJPS – Biweekly Labor ReportVolume Adjusted Variances ‐ Hours
Payroll Hours Report Productive OnlyVolume Adjusted Variance AnalysisPay Period Ending Mar 13, 2007Routine Areas
Units Hours Hours per unit
AdminCost Center Cost Center Name Budget Actual Var Budget Actual Var Budget Actual Var
LOWE CC612 PROGRESSIVE CARE WEST 301 294 (7) 3,106 3,328 222 10.32 11.32 1.00LOWE CC618 TOWER FIVE 285 327 42 2,455 2,907 451 8.62 8.89 0.27LOWE CC619 TELEMETRY NORTH 237 214 (23) 2,272 2,512 240 9.59 11.74 2.15LOWE CC621 TOWER SEVEN 386 358 (28) 3,290 3,509 219 8.52 9.80 1.28LOWE CC622 PROGRESSIVE CARE EAST 300 296 (4) 3,295 3,339 44 10.98 11.28 0.30( ) , ,LOWE CC626 TOWER ELEVEN 244 230 (14) 2,119 2,140 21 8.69 9.30 0.62LOWE CC640 ICU 260 242 (18) 4,960 4,912 (48) 19.08 20.30 1.22LOWE CC646 2 SOUTH 222 184 (38) 2,206 2,067 (138) 9.94 11.24 1.30LOWE CC648 2 NORTH 216 237 21 1,762 2,160 398 8.16 9.11 0.96LOWE CC650 NEWBORN NURSERY 209 270 61 1,122 1,529 408 5.37 5.66 0.30LOWE CC651 NEONATAL ICU 175 205 30 2,947 3,478 531 16.84 16.97 0.13LOWE CC654 CONTINUING CARE NURSER 92 76 (16) 790 209 (581) 8.59 2.75 (5.83)LOWE CC663 TOWER SIX 360 365 5 2 972 3 141 168 8 26 8 61 0 35LOWE CC663 TOWER SIX 360 365 5 2,972 3,141 168 8.26 8.61 0.35LOWE CC668 TOWER TWO 273 262 (11) 2,373 2,425 51 8.69 9.25 0.56LOWE CC670 LABOR & DELIVERY 279 279 0 4,514 4,346 (168) 16.18 15.58 (0.60)LOWE CC761 SKILLED NURSING FACILITY 203 198 (5) 1,378 1,434 55 6.79 7.24 0.45
41,563 43,437 1,874
59
See previous page for discussion on importance of this page

JPS Biweekly Departmental ProductivityJPS – Biweekly Departmental Productivity Report
Labor Dollars - Productive ContrContract Rate/Hour
Labor Hours - Productive Overtim 230 230 4,064L b D ll P d ti O t 7 667 2 879 4 788 131 054Labor Dollars - Productive Overt 7,667 2,879 4,788 131,054Overtime Rate/Hour 33 33 32
Labor Hours - Productive Regula 2,664.74 3,001.05 (336.31) 45,149.88Labor Dollars - Productive Regul 62,262.31 71,081.26 (8,818.95) 1,081,660.11Regular Rate/Hour 23 24 (0) 24
This biweekly labor report is sent to the department managers on a
Total Productive Hours 2,894.58 3,001.05 (106.47) 49,213.67Total Productive Dollars 69,929.56 73,960.17 (4,030.61) 1,212,714.28Total Productive Rate/Hour 24 25 (0) 25
Productive Rate/Hour 24.16 24.64 (0.49) 24.64Productive Hours/Unit 12.98 10.60 2.38 11.39P d ti C t/U it 314 261 52 281
manage s on atimely basis.
The managers are expected to meet their labor
lProductive Cost/Unit 314 261 52 281
Hours Variance 13,056.60 13,056.60 84,014.58Rate Variance (1,406.61) (1,406.61) 10,462.51Spending Variance 11,650 11,650 94,477
Volume Variance (15,680.60) (15,680.60) 37,533.42
goals.Actions are
initiated if the goals are not met.
( ) ( )Total Variance - Productive (4,030.61) (4,030.61) 132,010.51
Productive and Non Productive H 3,002.58 3,305.92 (303.34) 52,833.96Payroll Dollars Productive and N 75,050.73 81,178.54 (6,127.81) 1,325,363.54Total Rate/Hour 25.00 24.56 0.44 25.09Total Hours/Unit 13 12 2 12Total Cost/Unit 336 55 286 85 49 70 306 80
60
Total Cost/Unit 336.55 286.85 49.70 306.80
Hours Variance 9,762 9,762 59,996Rate Variance 1,320.85 1,320.85 39,485.78Total Spending Variance 11,083.19 11,083.19 99,481.50

JPS – Monthly Administrative & BoardJPS Monthly Administrative & BoardReporting Page ‐ Key Financial Ratios
FYE 2007 Aa Rating
Operating Margin 8.3% 3.3%
Current Ratio 3.5 1.8
Days of cash on hand 207 225Days of cash on hand 207 225
Days of cash on hand (excluding self insurance trust funds and prior year adjustments in FY03)
192 225
prior year adjustments in FY03)
Accounts Receivable days 59 # 56
Debt-to-Capitalization 12% 34% See next page
# Three month average
This is one of the first pages of the monthly Board report. It was developed to give the Leadership a snapshot of the hospital’s financial position. In fact, these ratios were determined based on the ratios used by the BOND RATING AGENCIES, and are set to
61
achieve high ratings. The current bond ratings for JPS are:Moody’s A2Standard and Poors AA

JPS ‐Monthly Board ReportingDebt‐to‐Capitalization (%)
51.00%
66.20%
60.00%
70.00%
16.06% 14.67%12 16%
17.67%
33.60%
39.80%
20 00%
30.00%
40.00%
50.00%
6.65%
12.16%
0.00%
10.00%
20.00%
FY 2001 FY 2002 FY 2003 FY 2004 06 Pro-forma
Aa A Baa <Baa
Debt-to-capitalization (%) = Long-term debt + short term-debtLong-term debt + short-term debt + unrestricted fund balance
Pro forma assumes the issuance of $35 million in Certificates of Obligation.
62
This is one of several pages reported to the Board, providing additional trending information around the indicators on the previous page.
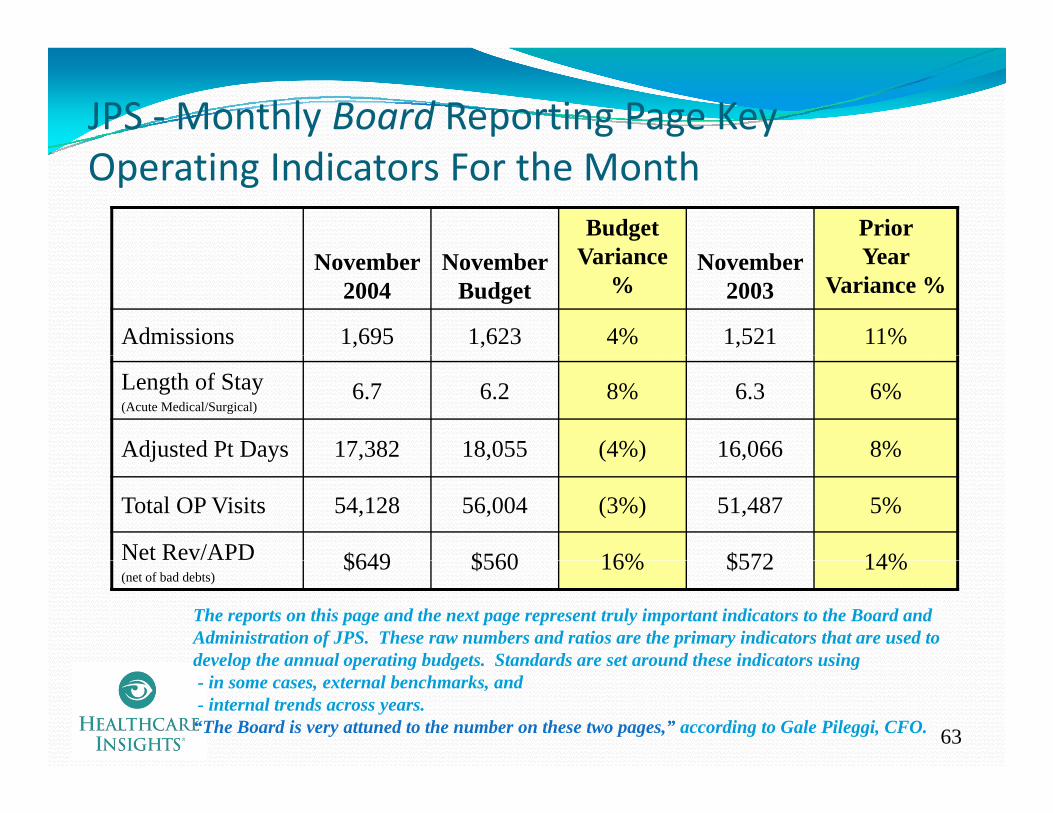
JPS ‐Monthly Board Reporting Page Key Operating Indicators For the Month
Budget Variance
Prior YearNovember
2004November
BudgetVariance
%November
2003Year
Variance %
Admissions 1,695 1,623 4% 1,521 11%
Length of Stay(Acute Medical/Surgical)
6.7 6.2 8% 6.3 6%
Adjusted Pt Days 17,382 18,055 (4%) 16,066 8%j y , , ( ) ,
Total OP Visits 54,128 56,004 (3%) 51,487 5%
Net Rev/APD $649 $560 16% $572 14%(net of bad debts)
$649 $560 16% $572 14%
The reports on this page and the next page represent truly important indicators to the Board and Administration of JPS. These raw numbers and ratios are the primary indicators that are used to develop the annual operating budgets Standards are set around these indicators using
63
develop the annual operating budgets. Standards are set around these indicators using- in some cases, external benchmarks, and- internal trends across years.“The Board is very attuned to the number on these two pages,” according to Gale Pileggi, CFO.

JPS ‐Monthly Board Reporting PageJPS ‐Monthly Board Reporting Page Key Operating Indicators For the Month
November2007
NovemberBudget
Budget Variance
%
November 2006
Prior Year Variance
%
FTE/APD 5.0 4.6 9% 5.2 (4%)
SWB/APD $783 $770 2% $837 (6%)( )
Supplies/APD $304 $293 4% $306 (1%)
Op Exp/APD* $1,688 $1,627 4% $1,708 (1%)
Net Income ($000) $1,148 $497 $525
64* Excludes bad debts, depreciation and interest
See previous page for discussion on importance of this page
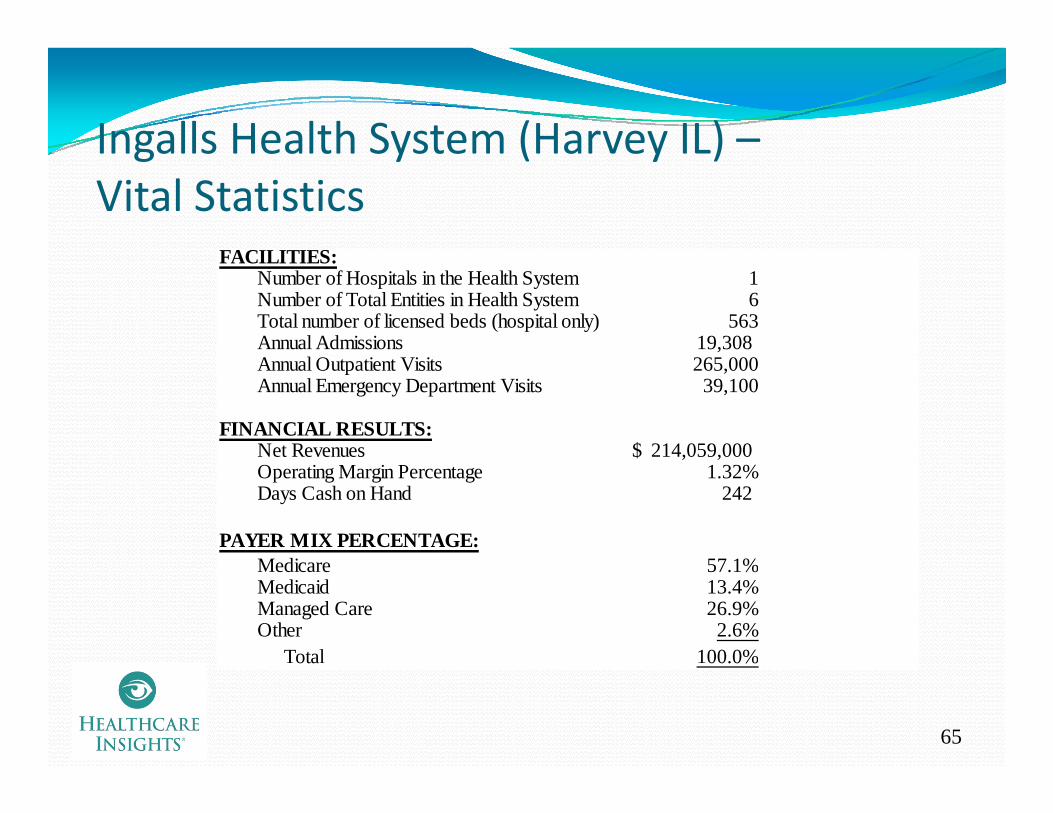
Ingalls Health System (Harvey IL) –Ingalls Health System (Harvey IL) Vital Statistics
FACILITIESFACILITIES:Number of Hospitals in the Health System 1Number of Total Entities in Health System 6Total number of licensed beds (hospital only) 563Annual Admissions 19,308 Annual Outpatient Visits 265,000Annual Emergency Department Visits 39,100
FINANCIAL RESULTS:Net Revenues 214,059,000$ , ,$Operating Margin Percentage 1.32%Days Cash on Hand 242
PAYER MIX PERCENTAGE:M di 57 1%Medicare 57.1%Medicaid 13.4%Managed Care 26.9%Other 2.6% Total 100.0%
65
ota 00.0%

Ingalls Health System (IHS) –g y ( )Background
Vince Pryor, CFOVince Pryor, CFO“Better reporting and monitoring has helped Ingalls to maintain its financial viability and continue to provide its community with high quality healthcare, despite a challenging payer mix”
CFO at Ingalls for three yearsPreviously served as Vice President of Finance at a large not‐for‐y gprofit health system
Ingalls was a Solucient 100 Top Hospital Most Improved in 20044
It was able to enhance Solucient’s five financial and four clinical indicators at a rate greater than its peers
66
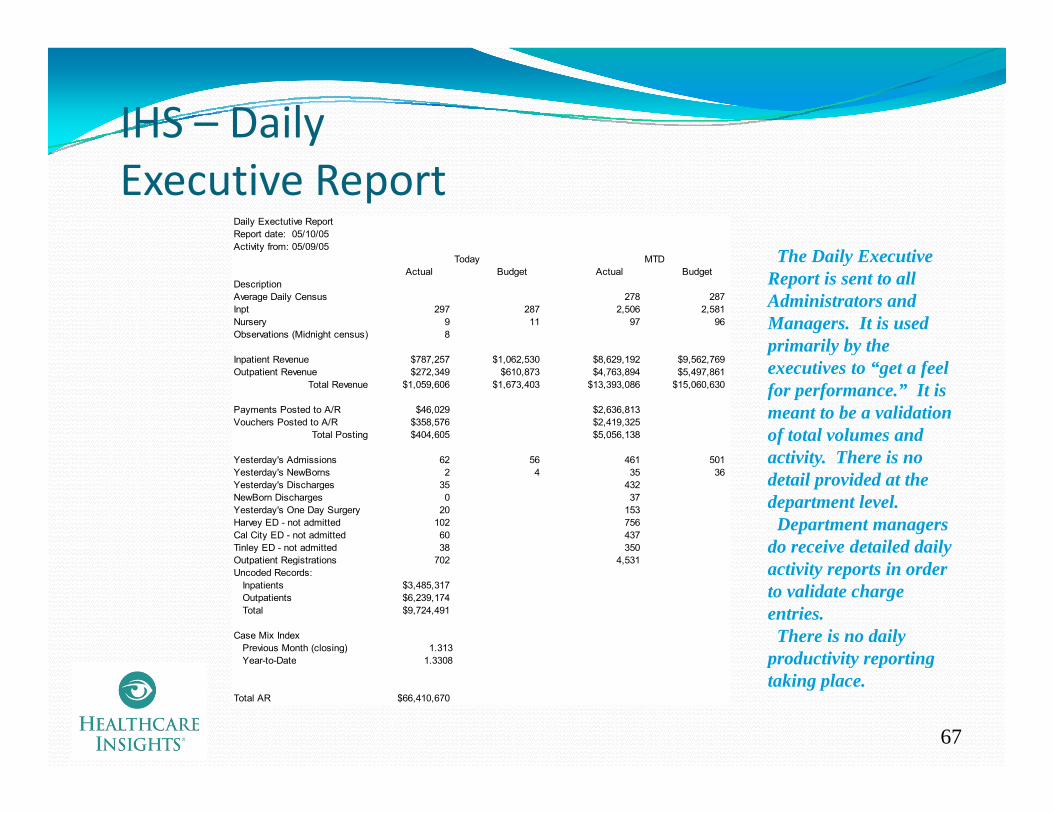
IHS – Daily Executive Report
Daily Exectutive ReportReport date: 05/10/05Activity from: 05/09/05
Th D il E tiToday MTDActual Budget Actual Budget
DescriptionAverage Daily Census 278 287Inpt 297 287 2,506 2,581Nursery 9 11 97 96Observations (Midnight census) 8
$ $ $ $
The Daily Executive Report is sent to all Administrators and Managers. It is used primarily by the
Inpatient Revenue $787,257 $1,062,530 $8,629,192 $9,562,769Outpatient Revenue $272,349 $610,873 $4,763,894 $5,497,861
Total Revenue $1,059,606 $1,673,403 $13,393,086 $15,060,630
Payments Posted to A/R $46,029 $2,636,813Vouchers Posted to A/R $358,576 $2,419,325
Total Posting $404,605 $5,056,138
Yesterda 's Admissions 62 56 461 501
executives to “get a feel for performance.” It is meant to be a validation of total volumes and activity There is noYesterday's Admissions 62 56 461 501
Yesterday's NewBorns 2 4 35 36Yesterday's Discharges 35 432NewBorn Discharges 0 37Yesterday's One Day Surgery 20 153Harvey ED - not admitted 102 756Cal City ED - not admitted 60 437Tinley ED - not admitted 38 350Outpatient Registrations 702 4 531
activity. There is no detail provided at the department level.Department managers
do receive detailed daily Outpatient Registrations 702 4,531Uncoded Records: Inpatients $3,485,317 Outpatients $6,239,174 Total $9,724,491
Case Mix Index Previous Month (closing) 1.313
Year-to-Date 1.3308
activity reports in order to validate charge entries.There is no daily
productivity reporting
67
Year to Date 1.3308
Total AR $66,410,670
productivity reporting taking place.
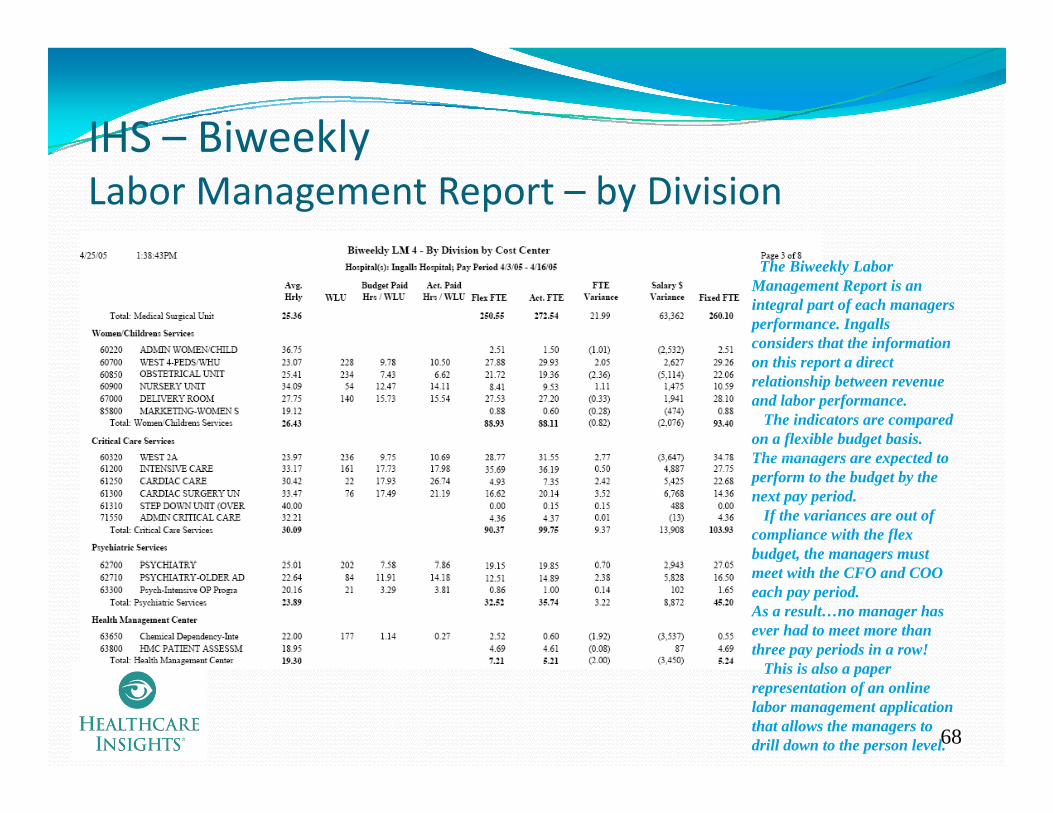
IHS – BiweeklyIHS BiweeklyLabor Management Report – by Division
The Biweekly Labor Management Report is an integral part of each managers performance. Ingalls considers that the information on this report a direct relationship between revenue and labor performance.
The indicators are compared on a flexible budget basis. The managers are expected toThe managers are expected to perform to the budget by the next pay period.
If the variances are out of compliance with the flex budget, the managers must g , gmeet with the CFO and COO each pay period.As a result…no manager has ever had to meet more than three pay periods in a row!
hi i l
68
This is also a paper representation of an online labor management application that allows the managers to drill down to the person level.
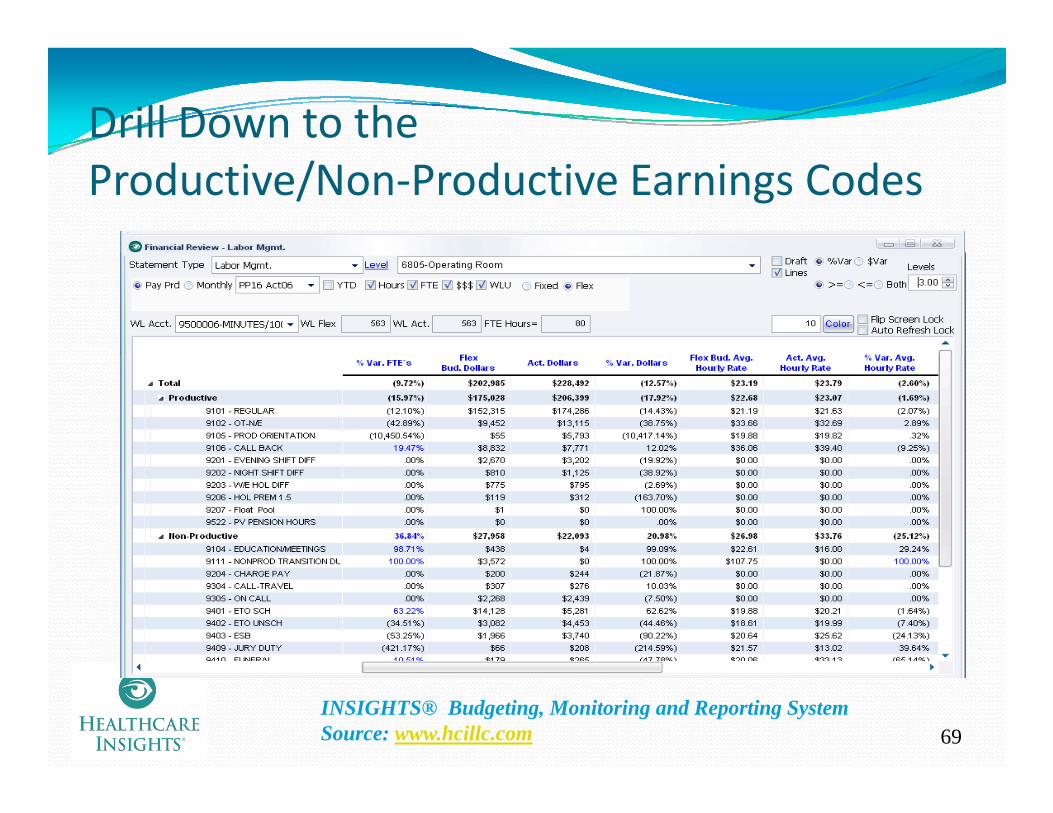
Drill Down to the Productive/Non‐Productive Earnings Codes
69INSIGHTS® Budgeting, Monitoring and Reporting System Source: www.hcillc.com

Labor Drill Down to Hours and Dollars by Earnings Code and Job Title
70
INSIGHTS® Budgeting, Monitoring and Reporting System Source: www.hcillc.com
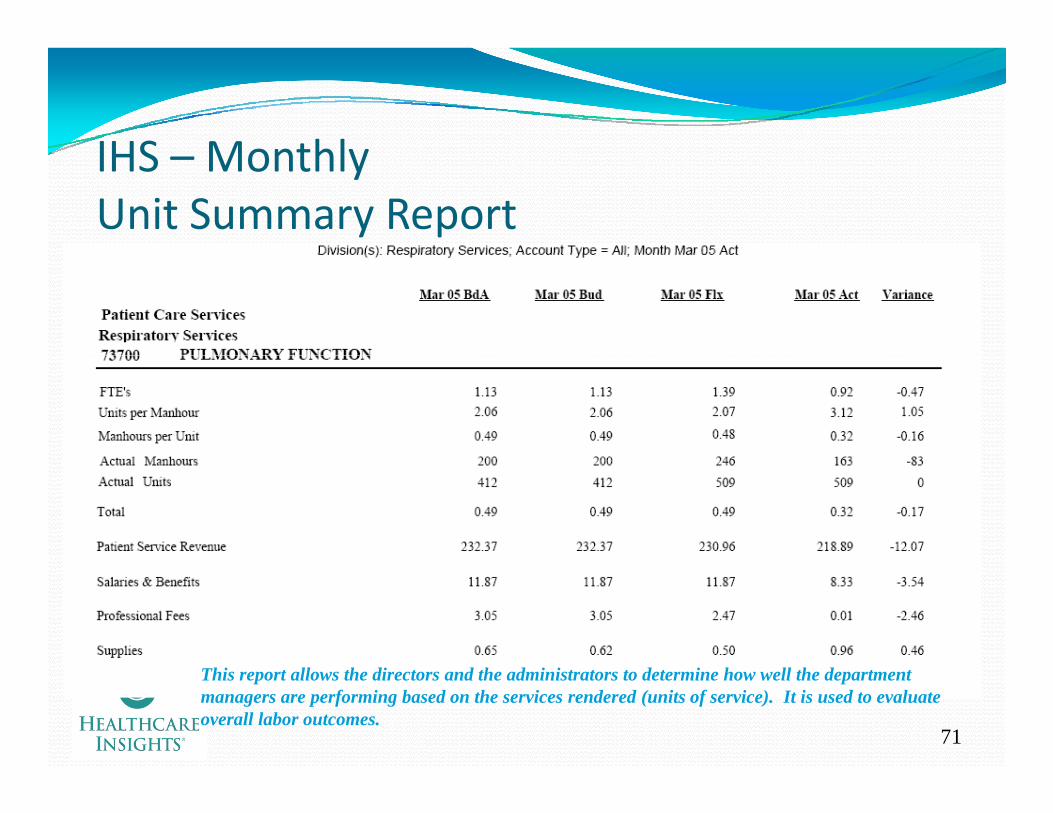
IHS MonthlyIHS – MonthlyUnit Summary Report
71
This report allows the directors and the administrators to determine how well the department managers are performing based on the services rendered (units of service). It is used to evaluate overall labor outcomes.
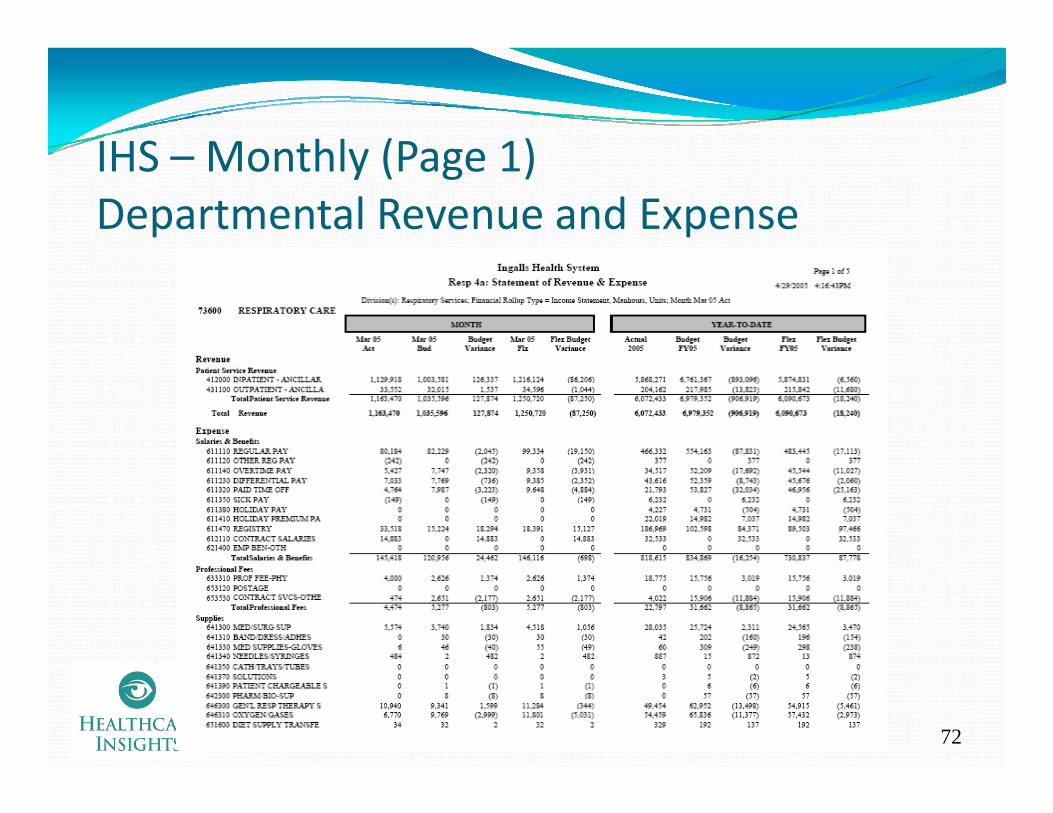
IHS Monthly (Page 1)IHS – Monthly (Page 1)Departmental Revenue and Expense
72
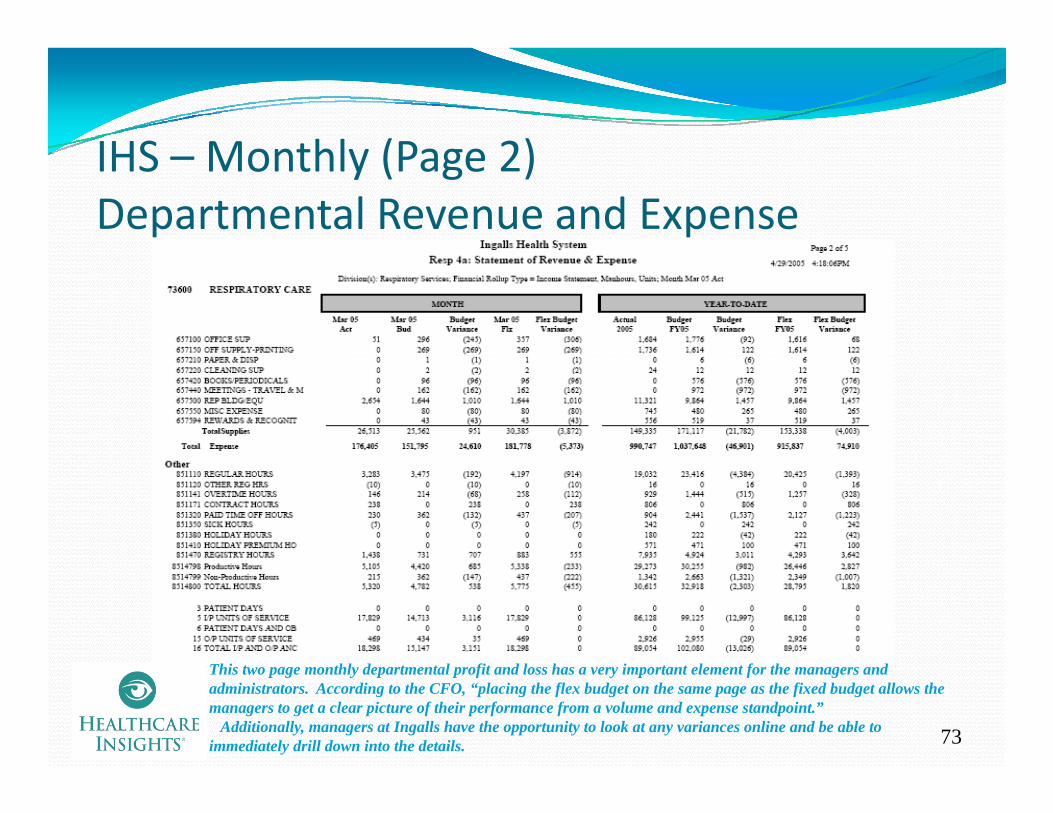
IHS Monthly (Page 2)IHS – Monthly (Page 2)Departmental Revenue and Expense
73
This two page monthly departmental profit and loss has a very important element for the managers and administrators. According to the CFO, “placing the flex budget on the same page as the fixed budget allows the managers to get a clear picture of their performance from a volume and expense standpoint.”
Additionally, managers at Ingalls have the opportunity to look at any variances online and be able to immediately drill down into the details.
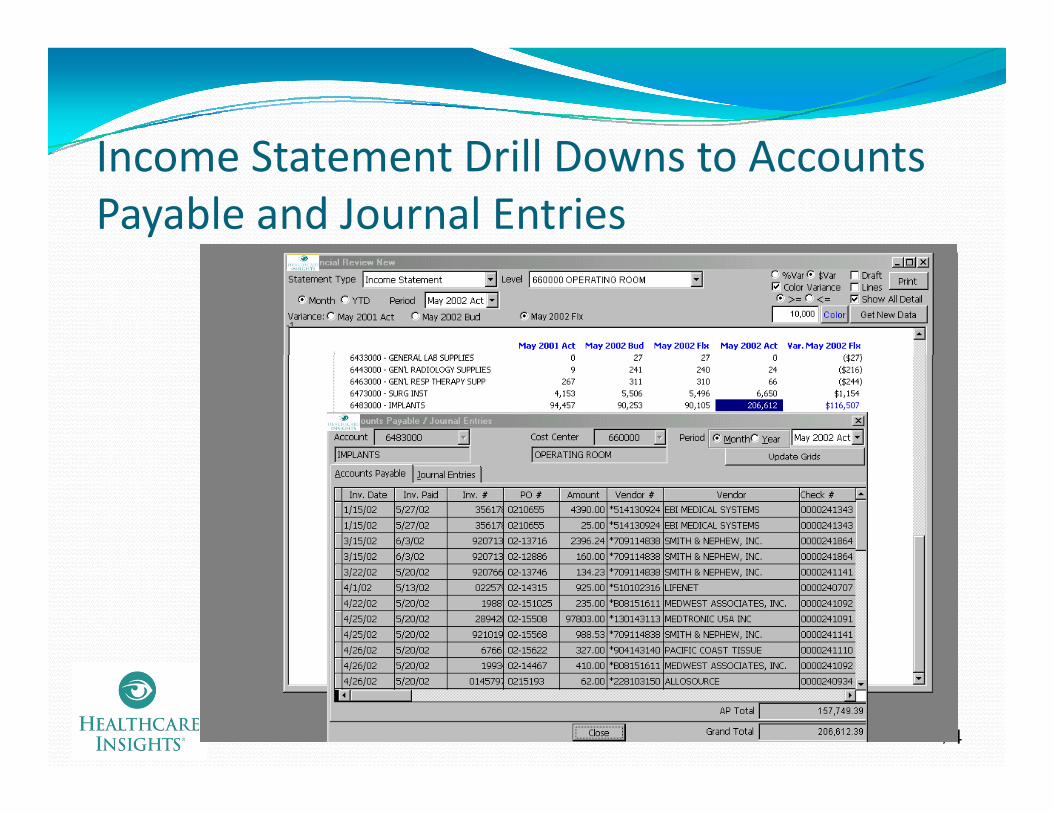
Income Statement Drill Downs to AccountsIncome Statement Drill Downs to Accounts Payable and Journal Entries
74
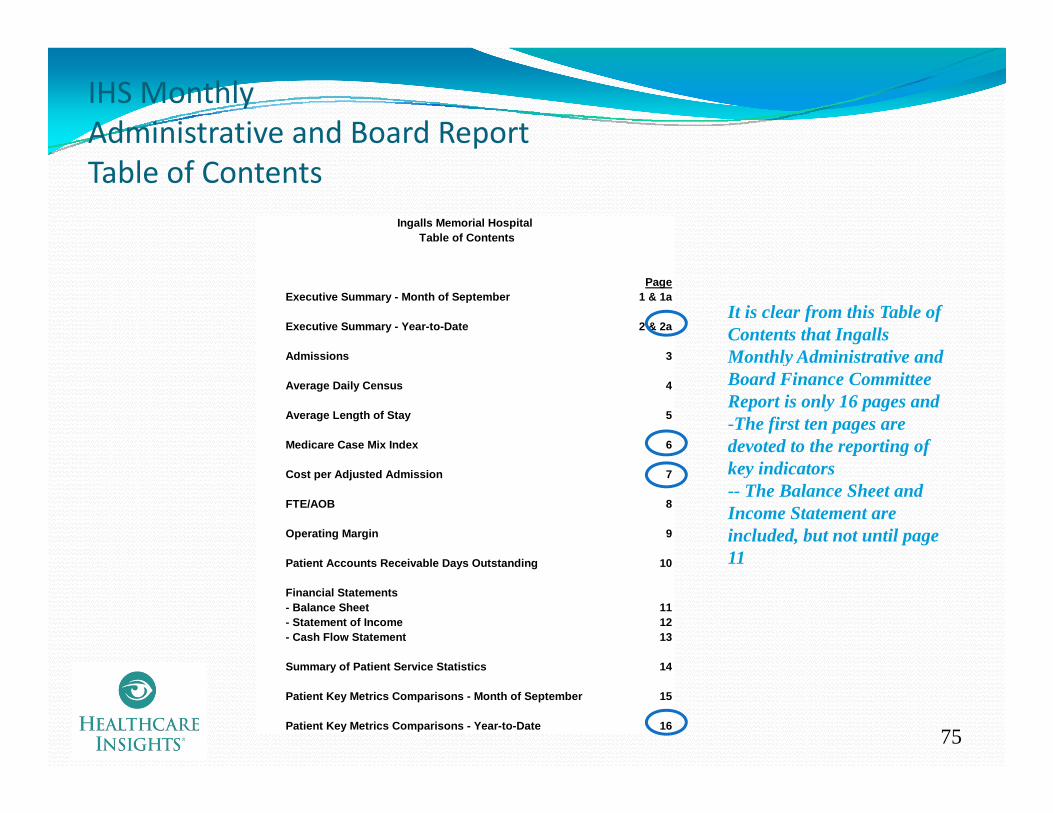
IHS Monthly Administrative and Board ReportTable of Contents
Ingalls Memorial Hospital Table of Contents
PageExecutive Summary - Month of September 1 & 1a
Executive Summary - Year-to-Date 2 & 2a
Admissions 3
It is clear from this Table of Contents that Ingalls Monthly Administrative andAdmissions 3
Average Daily Census 4
Average Length of Stay 5
Medicare Case Mix Index 6
Monthly Administrative and Board Finance Committee Report is only 16 pages and-The first ten pages are devoted to the reporting of
Cost per Adjusted Admission 7
FTE/AOB 8
Operating Margin 9
P ti t A t R i bl D O t t di 10
key indicators-- The Balance Sheet and Income Statement are included, but not until page 11Patient Accounts Receivable Days Outstanding 10
Financial Statements- Balance Sheet 11- Statement of Income 12- Cash Flow Statement 13
S f P ti t S i St ti ti 14
11
75
Summary of Patient Service Statistics 14
Patient Key Metrics Comparisons - Month of September 15
Patient Key Metrics Comparisons - Year-to-Date 16
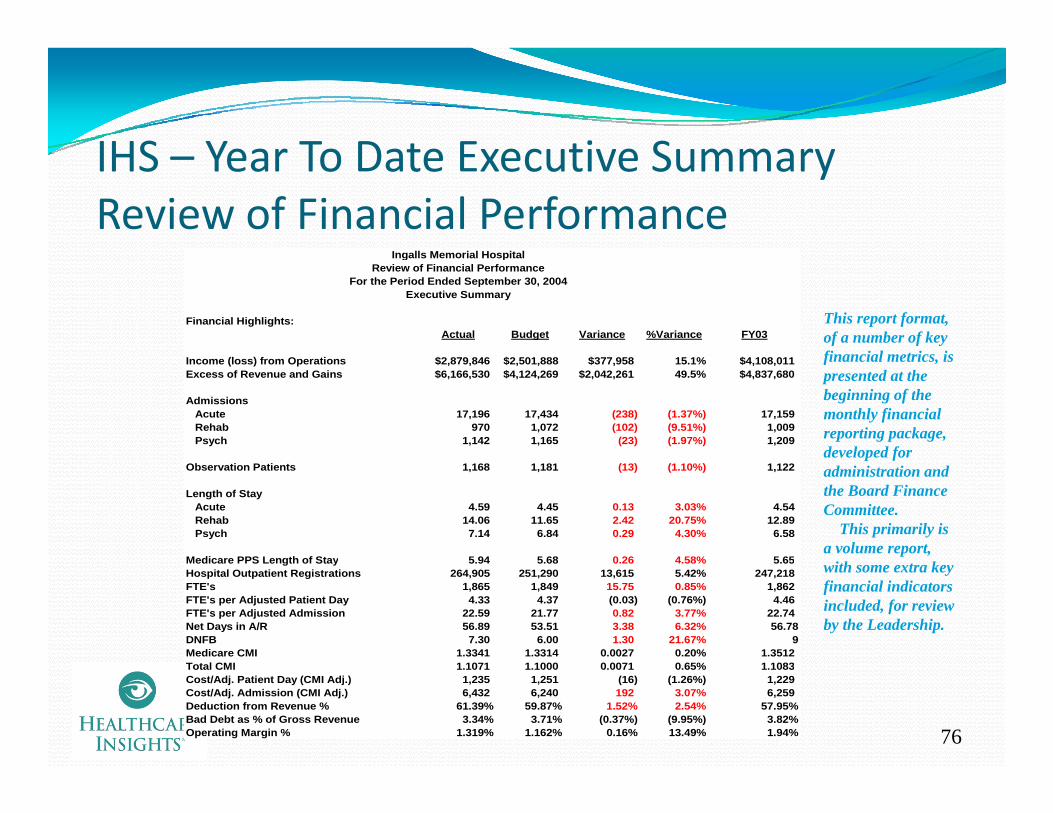
IHS Year To Date Executive SummaryIHS – Year To Date Executive SummaryReview of Financial Performance
Ingalls Memorial HospitalIngalls Memorial HospitalReview of Financial Performance
For the Period Ended September 30, 2004Executive Summary
Financial Highlights:Actual Budget Variance %Variance FY03
This report format, of a number of key financial metrics isIncome (loss) from Operations $2,879,846 $2,501,888 $377,958 15.1% $4,108,011
Excess of Revenue and Gains $6,166,530 $4,124,269 $2,042,261 49.5% $4,837,680
Admissions Acute 17,196 17,434 (238) (1.37%) 17,159 Rehab 970 1,072 (102) (9.51%) 1,009 Psych 1,142 1,165 (23) (1.97%) 1,209
financial metrics, is presented at the beginning of the monthly financial reporting package, developed for
Observation Patients 1,168 1,181 (13) (1.10%) 1,122
Length of Stay Acute 4.59 4.45 0.13 3.03% 4.54 Rehab 14.06 11.65 2.42 20.75% 12.89 Psych 7.14 6.84 0.29 4.30% 6.58
Medicare PPS Length of Stay 5 94 5 68 0 26 4 58% 5 65
p fadministration and the Board Finance Committee.
This primarily is a volume report,
Medicare PPS Length of Stay 5.94 5.68 0.26 4.58% 5.65Hospital Outpatient Registrations 264,905 251,290 13,615 5.42% 247,218FTE's 1,865 1,849 15.75 0.85% 1,862FTE's per Adjusted Patient Day 4.33 4.37 (0.03) (0.76%) 4.46FTE's per Adjusted Admission 22.59 21.77 0.82 3.77% 22.74Net Days in A/R 56.89 53.51 3.38 6.32% 56.78DNFB 7.30 6.00 1.30 21.67% 9Medicare CMI 1.3341 1.3314 0.0027 0.20% 1.3512T t l CMI 1 1071 1 1000 0 0071 0 65% 1 1083
with some extra key financial indicators included, for review by the Leadership.
76
Total CMI 1.1071 1.1000 0.0071 0.65% 1.1083Cost/Adj. Patient Day (CMI Adj.) 1,235 1,251 (16) (1.26%) 1,229Cost/Adj. Admission (CMI Adj.) 6,432 6,240 192 3.07% 6,259Deduction from Revenue % 61.39% 59.87% 1.52% 2.54% 57.95%Bad Debt as % of Gross Revenue 3.34% 3.71% (0.37%) (9.95%) 3.82%Operating Margin % 1.319% 1.162% 0.16% 13.49% 1.94%

IHS – Monthly Trend GraphIHS – Monthly Trend GraphCost Per Adjusted Admission (CMI adjusted)
Ingalls Memorial HospitalCost per Adjusted Admission
8,500
9,000
7,500
8,000
8,500
6,500
7,000
6,000Actual 6,773 7,719 6,946 7,426 7,402 6,663 6,974 7,113 6,956 7,123 7,228 7,238Budget 6,784 7,040 7,012 6,730 7,080 6,682 6,985 6,891 6,879 6,777 6,729 6,823Prior Year 6,392 6,785 6,735 6,771 7,049 6,523 6,607 6,612 7,081 6,793 7,177 8,844
OCT NOV DEC JAN FEB MAR APR MAY JUN JUL AUG SEP
77
Because both Medicare and Medicaid are case based and make up 70% of the Ingalls revenue, the IHS administration and its Board Finance Committee uses the information from this key indicator, as reporting in this trended fashion, to determine how well they are managing their costs.

IHS – Monthly Patient Key Metrics Comparison
Ingalls Memorial HospitalKey Metrics ComparisonsFor the Month Ended September 30, 2004
Actual Budget Fav/(Unfav) % Variance Moody'sActual Budget Fav/(Unfav) % Variance Moody s
Cash Flow Days Cash on Hand 241.5 266.3 (24.7) (9.29%) 151.9 Average Payment Period 44.9 64.7 (19.8) (30.63%) 58.7 Net A/R Days 56.9 53.5 (3.4) (6.32%) 58.1
Net Revenue
Unlike the more volume related reports at the beginning of the monthly administrative and Board Finance Committee
k thi t i Net to Total Gross Patient Revenue 38.81% 41.56% (2.75%) (6.62%) Net Revenue per Adjusted Patient Day 1,366 1,363 3 0.21% Net Revenue per Adjusted Admission 7,269 6,740 529 7.85% Medicare Case Mix 1.3116 1.3314 (0.0198) (1.49%) 1.46 Total Facility Case Mix 1.1323 1.1000 0.0323 2.94%
Salaries/Wages/Benefits SWB as Percentage of Net Revenue 49.32% 49.87% 0.55% 1.10%
package, this report is clearly titled as a “key metrics comparison” and is used to determine the variances between the goals and the actual
SWB per Adjusted Patient Day 674 680 6 0.88% SWB per Adjusted Admission 3,585 3,361 (224) (6.66%) Benefits as a Percentage of Salaries 15.33% 20.06% 4.73% 23.58% FTE's per Adjusted Patient Day 4.27 4.38 0.12 2.70% FTE's per Adjusted Admission 22.40 21.68 (0.72) (3.34%)
Expenses IndicatorsSupplies as a Percentage of Net Revenue 17.74% 13.41% (4.32%) (32.22%)
goals and the actual outcomes.
The CFO will prepare additional information based upon the outcome of these Performance Supplies as a Percentage of Net Revenue 17.74% 13.41% (4.32%) (32.22%)
Supplies per Adjusted Patient Day 242 183 (59) (32.51%) Supplies per Adjusted Admission 1,289 904 (385) (42.60%) Bad Expense as a Percentage of Gross Revenue 3.29% 3.66% 0.38% 10.31% Cost Per Adjusted Patient Day CMI Adjusted 1,201 1,254 53 4.24% Cost Per Adjusted Admission CMI Adjusted 6,392 6,202 (190) (3.06%)
Global IndicatorsMedicare LOS 5 91 5 68 (0 23) (4 05%)
Drivers.According to Vince
Pryor, Ingalls CFO, “Color coding the variances have proven to be extremely helpful to
78
Medicare LOS 5.91 5.68 (0.23) (4.05%) Hospital Length of Stay 5.25 4.94 (0.31) (6.21%) 4.7 Operating Margin as a Percentage 1.15% 0.39% 0.75% 192.28% 2.0% Average Age of Plant 11.6 10.9 (0.7) (6.53%) 9.0
Moody's = "A" rated organizations
be extremely helpful to the Board Members in understanding the outcomes.”
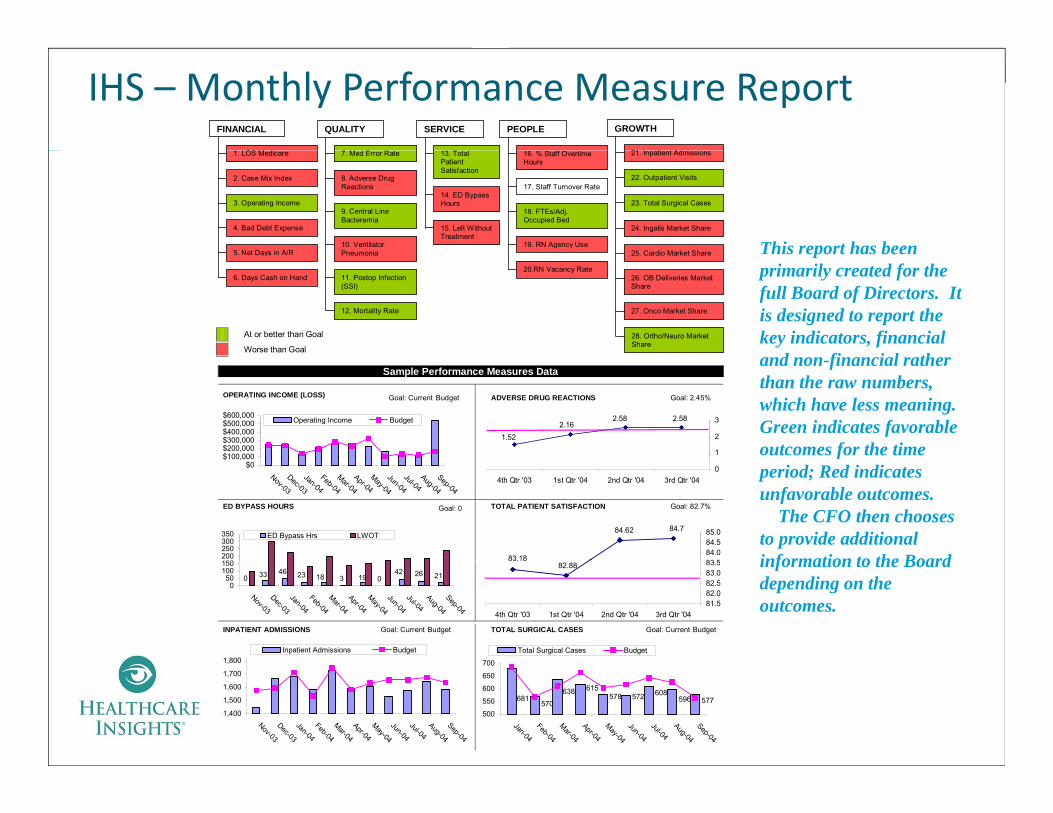
IHS – Monthly Performance Measure Report
SERVICE PEOPLEQUALITY GROWTHFINANCIAL
OS 21 I ti t Ad i i
13. Total Patient Satisfaction
16. % Staff Overtime Hours
7. Med Error Rate
8. Adverse Drug Reactions
3. Operating Income
2. Case Mix Index
1. LOS Medicare 21. Inpatient Admissions
22. Outpatient Visits
15. Left Without Treatment
24. Ingalls Market Share
25 Cardio Market Share
9. Central Line Bacteremia
10. Ventilator Pneumonia
17. Staff Turnover Rate
18. FTEs/Adj. Occupied Bed
19. RN Agency Use
23. Total Surgical Cases
4. Bad Debt Expense
5 Net Days in A/R
14. ED Bypass Hours
This report has been
At or better than Goal
Worse than Goal
25. Cardio Market Share
26. OB Deliveries Market Share
27. Onco Market Share
Pneumonia
11. Postop Infection (SSI)
12. Mortality Rate
20.RN Vacancy Rate
28. Ortho/Neuro Market Share
5. Net Days in A/R
6. Days Cash on Hand
This report has been primarily created for the full Board of Directors. It is designed to report the key indicators, financial
d fi i l thSample Performance Measures Data
OPERATING INCOME (LOSS) Goal: Current Budget ADVERSE DRUG REACTIONS Goal: 2.45%
$100 000$200,000$300,000$400,000$500,000$600,000 Operating Income Budget 2.582.58
2.161.52
1
2
3
and non-financial rather than the raw numbers, which have less meaning.Green indicates favorable outcomes for the time
ED BYPASS HOURS Goal: 0 TOTAL PATIENT SATISFACTION Goal: 82.7%
$0$100,000
Nov-03
Dec-03
Jan-04
Feb-04
Mar-04
Apr-04
May-04
Jun-04
Jul-04Aug-04
Sep-04
03rd Qtr '042nd Qtr '041st Qtr '044th Qtr '03
83.18
84.784.62
83 584.084.585.0
1 0200250300350 ED Bypass Hrs LWOT
fperiod; Red indicates unfavorable outcomes.
The CFO then chooses to provide additional information to the Board
INPATIENT ADMISSIONS Goal: Current Budget TOTAL SURGICAL CASES Goal: Current Budget
83.1882.88
81.582.082.583.083.5
3rd Qtr '042nd Qtr '041st Qtr '044th Qtr '03
21264203 19182346330
050
100150
Nov-03Dec-03Jan-04Feb-04Mar-04Apr-04May-04Jun-04Jul-04Aug-04Sep-04
1,800Inpatient Admissions Budget
700
Total Surgical Cases Budget
information to the Board depending on the outcomes.
79
1,400
1,500
1,600
1,700
,
Nov-03Dec-03Jan-04Feb-04Mar-04Apr-04May-04Jun-04Jul-04Aug-04Sep-04
577596608572578681
615638570
500
550
600
650
700
Jan-04Feb-04Mar-04Apr-04May-04Jun-04Jul-04Aug-04Sep-04
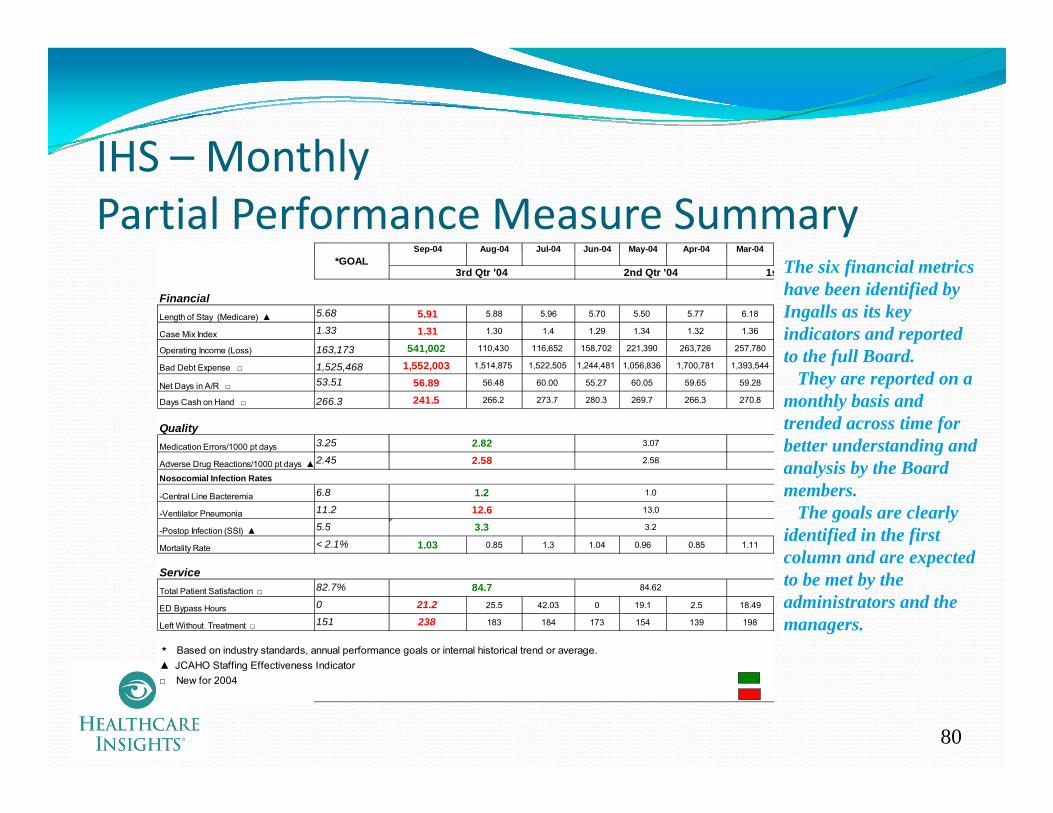
IHS MonthlyIHS – Monthly Partial Performance Measure Summary
Sep-04 Aug-04 Jul-04 Jun-04 May-04 Apr-04 Mar-04p g y p
FinancialLength of Stay (Medicare) ▲ 5.68 5.91 5.88 5.96 5.70 5.50 5.77 6.18
Case Mix Index 1.33 1.31 1.30 1.4 1.29 1.34 1.32 1.36
Operating Income (Loss) 163,173 541,002 110,430 116,652 158,702 221,390 263,726 257,780
2nd Qtr '04*GOAL
1s3rd Qtr '04 The six financial metrics have been identified by Ingalls as its key indicators and reported to the full Board
Bad Debt Expense □ 1,525,468 1,552,003 1,514,875 1,522,505 1,244,481 1,056,836 1,700,781 1,393,544
Net Days in A/R □ 53.51 56.89 56.48 60.00 55.27 60.05 59.65 59.28
Days Cash on Hand □ 266.3 241.5 266.2 273.7 280.3 269.7 266.3 270.8
QualityMedication Errors/1000 pt days 3.25
2 45
3.07
2 58
2.822 58
to the full Board.They are reported on a
monthly basis and trended across time for better understanding and
Adverse Drug Reactions/1000 pt days ▲2.45
Nosocomial Infection Rates
-Central Line Bacteremia 6.8
-Ventilator Pneumonia 11.2
-Postop Infection (SSI) ▲ 5.5
Mortality Rate < 2.1% 1.03 0.85 1.3 1.04 0.96 0.85 1.11
12.63.3
2.58
1.0
13.0
3.2
2.58
1.2
analysis by the Board members.
The goals are clearly identified in the first column and are expected
Service Total Patient Satisfaction □ 82.7%
ED Bypass Hours 0 21.2 25.5 42.03 0 19.1 2.5 18.49
Left Without Treatment □ 151 238 183 184 173 154 139 198
* Based on industry standards, annual performance goals or internal historical trend or average. ▲ JCAHO St ffi Eff ti I di t
84.7 84.62
column and are expected to be met by the administrators and the managers.
80
▲ JCAHO Staffing Effectiveness Indicator□ New for 2004
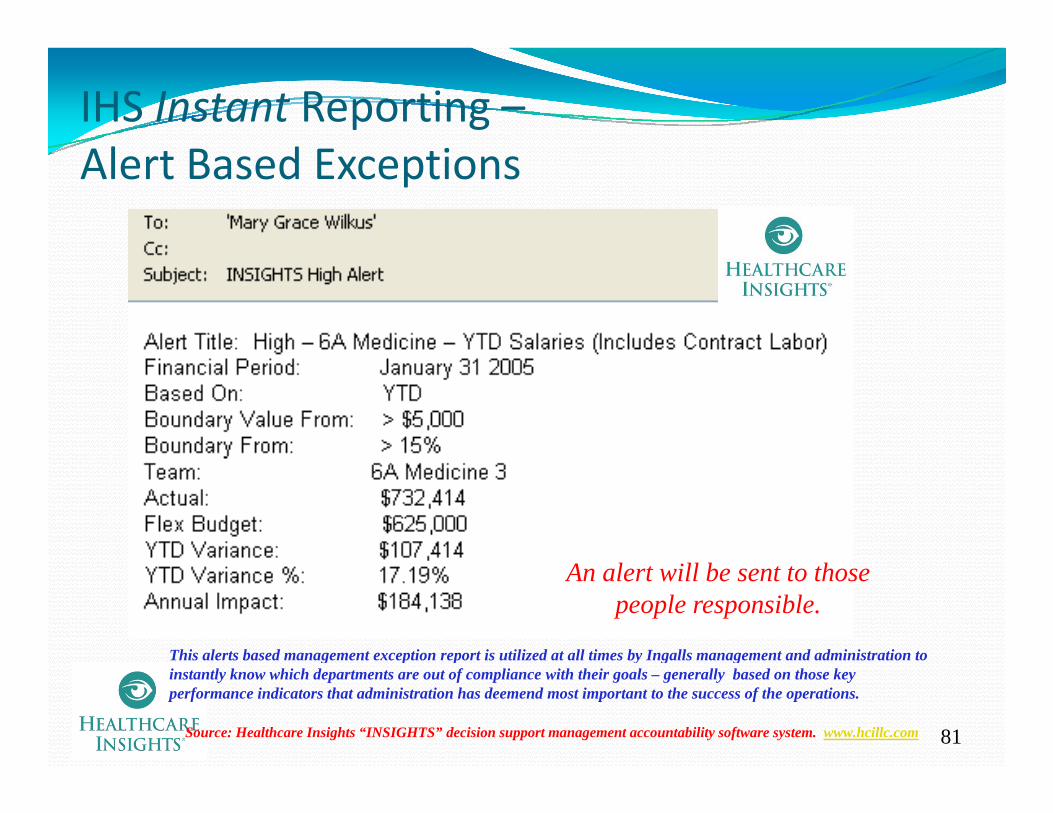
IHS Instant Reporting –Al B d E iAlert Based Exceptions
An alert will be sent to those people responsible.
This alerts based management exception report is utilized at all times by Ingalls management and administration to
81Source: Healthcare Insights “INSIGHTS” decision support management accountability software system. www.hcillc.com
g p p y g ginstantly know which departments are out of compliance with their goals – generally based on those key performance indicators that administration has deemend most important to the success of the operations.

What Do the Reports ofWhat Do the Reports of All Three Hospitals Have In Common?
All three of the best practice hospitals have developed similar reports that allow them to take ACTIONS
Daily reports that use ratios to track and trend actual activities Daily reports that use ratios to track and trend actual activities against budget, prior periods and, in some cases, benchmarks Biweekly productivity analysis, which use different looks trying to get to the same result achieving budgetary goalsget to the same result – achieving budgetary goalsMonthly executive and administrative reports that utilize KPIs to a great degree, ensuring that the organization stays on track to meet its goalsits goalsThe use of graphs and trend graphs to highlight the results of the indicators
82
Poll Questions4. Do you set your hospital metrics goals at the median (50th percentile) or higher?
50th percentile50th percentileHigher
5. Has the hospital developed a set of Balanced 5 p pScorecard metrics that are reported on a regular basis?
Yes NNo
83
C l iConclusionKey performance indicators (KPIs) represent key driver Key performance indicators (KPIs) represent key driver and critical success factors to the organizationThe KPIs are developed in order to measure the results of organizational policies practices and proceduresof organizational policies, practices and proceduresPerformance indicators can provide significant value to any organization that utilizes them, particularly to
Set the goalsPresent the results in an clear manner to enhance decision makingl h ’ d h hHealthcare organization’s needs to ensure that they use
KPIs to maximize their outcomes into the future
84
Related Documents


