Best Linear Unbiased Prediction (BLUP) of Random Effects in the Normal Linear Mixed Effects Model *Modified notes from Dr. Dan Nettleton from ISU

Welcome message from author
This document is posted to help you gain knowledge. Please leave a comment to let me know what you think about it! Share it to your friends and learn new things together.
Transcript

Best Linear Unbiased Prediction(BLUP) of Random Effects in the
Normal Linear Mixed Effects Model
*Modified notes from Dr. Dan Nettleton from ISU

Suppose intelligence quotients (IQs) for apopulation of students are normally distributedwith a mean µ and variance σ2u.
µ
IQ ~ N(µ,σu2)

Suppose an IQ test was given to an i.i.d sampleof such students.
Suppose that, given the IQ of a student(something hard to measure), the test score forthat student is normally distributed with amean equal to the student’s IQ and a varianceof σ2 and is independent of the test score ofany other student.
IQ
score|IQ ~ N(IQ,σ2)

Consider our linear mixed effects model
Y = Xβ + Zu + e
where [ue
]∼ N
([00
],
[G 00 R
])
Note that this model coincides with u ∼ N(0,G ),e ∼ N(0,R), independent of each other.

Given the data y , what is our best guess forthe unobserved vector u? (The random studenteffects).
Because u is a random vector rather than afixed parameter, we talk about predicting urather than estimating u.
We seek a Best Linear Unbiased Predictor(BLUP) for u, which we will denote by u.

To be a BLUP, we require...
1. u to be a linear function of y ,
2. u to be unbiased for u so that E (u − u) = 0,and
3. Var(u − u) to be no ‘larger’ than theVar(v − u), where v is any other linear andunbiased predictor.

The BLUP of u is
u = GZ ′Σ−1 (y − X βΣ )
And for the usual case in which
G and Σ = ZG ′Z + R
are unknown, we replace the matrices by estimatesand approximate the BLUP of u by
u = G Z ′Σ−1 (y − X βΣ )

Let’s return to the IQ example...
Suppose it is known thatσ2uσ2 =9
If the we sample 100 students and their samplemean IQ was 100, what is the best predictionof the IQ of a student who scored 130 on thetest?

We will assume u1, . . . , u100iid∼ N(0,σ2u)
independent of e1, . . . , e100iid∼ N(0,σ2).
If we let µ + ui denote the IQ of student i ,then IQs of the students are N(µ,σ2u), as statedat the beginning.
If we let yi = µ + ui + ei denote the test scoreof student i , then yi |(µ + ui) ∼ N(µ + ui ,σ
2),as stated at the beginning.

For this case, we have n = 100
Y = Xβ + Zu + e
where X =1n, β = µ,Z = In,G = σ2uIn,R = σ2In
and Σ = ZG ′Z + R = (σ2u + σ2 )In.
Then,
GZ ′Σ−1 =σ2
u
σ2u + σ2
In

And the BLUP for u is
u = GZ ′Σ−1 (y − X βΣ ) =σ2u
σ2u + σ2(y − 1y·)
The i th element of this vector is
ui =σ2u
σ2u + σ2(yi − y·)
Thus, the BLUP for µ + ui (the IQ of student i) is
µ+ui = y·+σ2u
σ2u + σ2(yi−y·) =
σ2uσ2u + σ2
yi+σ2
σ2u + σ2y·
Note that the BLUP is a weighted average of theindividual score and the overall mean score.
σ2uσ2u + σ2
yi +σ2
σ2u + σ2y·
If there is relatively high variability among studentscores (compared to variability within a student),then more weight is put on the individual score.

Let’s return to the IQ example...
Suppose it is known thatσ2uσ2 =9
If we sample 100 students and their samplemean IQ was 100, what is the best predictionof the IQ of a student who scored 130 on thetest?
σ2uσ2u + σ2
=σ2u
σ2
σ2u
σ2 + 1=
9
9 + 1= 0.9
We would predict the IQ of a student whoscored 130 on the test to be somewhat shrunktoward the mean as 0.9(130) + 0.1(100) = 127

Example: Gene Expression
Earlier in the semester, we introduced randomeffects using a gene expression example wherethere were 10 randomly chosen lines and 3replicates within each line for a given gene.
Yij = µ + Li + εij
for i = 1, 2, . . . , 10 and j = 1, 2, 3
with Li ∼iid∼ N(0, σ2L) and εij ∼
iid∼ N(0, σ2)

Example: Gene Expression
Fit the random effects model for gene 1 andsave the blups in a data set using the ODSoutput statement.
-----------
ods output SolutionR=blups;
proc mixed data=gene1;
class Line;
model Expression=;
random Line/solution; /* <---- */
run;
ods output close;
-----------

Example: Gene Expression
The grand mean is 4.1014755.
data blups; set blups;
LineBlup = 4.1014755 + Estimate;
keep Line LineBlup;
proc print data=blups;
run;
Obs Line LineBlup
1 1 10.1086
2 2 -1.2306
3 3 12.6436
4 4 -0.2442
5 5 8.9209
6 6 -1.5892
7 7 4.7326
8 8 1.4462
9 9 -0.5588
10 10 6.7856

Example: Gene Expression
Get the line means and compare to blups.
ods output summary=means;
proc means data=gene1;
by Line;
var Expression;
run;
ods output close;
data means; set means;
keep Line Expression_Mean Expression_N;
run;
data both; merge means blups;
run;
proc print data=both;
run;

Example: Gene Expression
Expression_ Expression_
Obs Line N Mean LineBlup
1 1 3 10.726236046 10.1086
2 2 3 -1.778853209 -1.2306
3 3 3 13.52190063 12.6436
4 4 3 -0.690971975 -0.2442
5 5 3 9.4164066268 8.9209
6 6 3 -2.174338546 -1.5892
7 7 3 4.7975438821 4.7326
8 8 3 1.1732040112 1.4462
9 9 3 -1.038008446 -0.5588
10 10 3 7.0616363943 6.7856
Line means that are above the overall mean Y.. = 4.10 haveBLUPS that are brought down a bit (those that are below theoverall mean have BLUPS that are brought up a bit). This isshrinkage toward the mean.

Example: Gene Expression
proc sgplot data=both;
scatter x=Expression_Mean y=LineBlup;
lineparm x=0 y=0 slope=1;
refline 4.1014755/ axis=x;
refline 4.1014755/ axis=y;
run;

Example: Gene Expression
We usually check the normality of the residuals(i.e. given the BLUPS, or conditioning on theBLUPS), but we could also check the normalityof the random Li effects using the BLUPS,though I don’t think this is done in practicevery often.
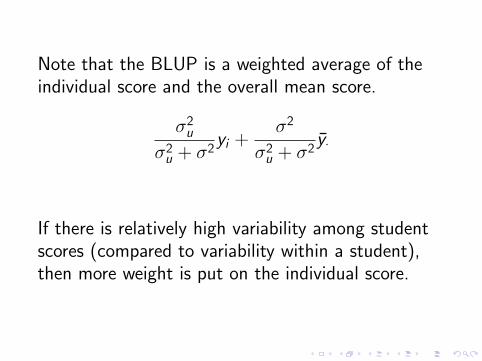
Example: Gene Expression
proc rank data=blups normal=blom out=diag;
var LineBlup;
ranks rankvalue;
run;
proc sgplot data=diag;
scatter x=rankvalue y=LineBlup;
xaxis label="Normal Quantiles";
run;
Related Documents