This article was downloaded by:[Asian Institute of Technology] [Asian Institute of Technology] On: 31 May 2007 Access Details: [subscription number 732450293] Publisher: Taylor & Francis Informa Ltd Registered in England and Wales Registered Number: 1072954 Registered office: Mortimer House, 37-41 Mortimer Street, London W1T 3JH, UK International Journal of Remote Sensing Publication details, including instructions for authors and subscription information: http://www.informaworld.com/smpp/title~content=t713722504 Best band combination for landslide studies in temperate environments M. F. Ramli a ; D. N. Petley b a Faculty of Environmental Studies, Universiti Putra Malaysia. 43400 Serdang. Malaysia b Department of Geography, University of Durham. Durham DH1 3LE. UK To cite this Article: Ramli, M. F. and Petley, D. N. , 'Best band combination for landslide studies in temperate environments', International Journal of Remote Sensing, 27:6, 1219 - 1231 To link to this article: DOI: 10.1080/01431160500306740 URL: http://dx.doi.org/10.1080/01431160500306740 PLEASE SCROLL DOWN FOR ARTICLE Full terms and conditions of use: http://www.informaworld.com/terms-and-conditions-of-access.pdf This article maybe used for research, teaching and private study purposes. Any substantial or systematic reproduction, re-distribution, re-selling, loan or sub-licensing, systematic supply or distribution in any form to anyone is expressly forbidden. The publisher does not give any warranty express or implied or make any representation that the contents will be complete or accurate or up to date. The accuracy of any instructions, formulae and drug doses should be independently verified with primary sources. The publisher shall not be liable for any loss, actions, claims, proceedings, demand or costs or damages whatsoever or howsoever caused arising directly or indirectly in connection with or arising out of the use of this material. © Taylor and Francis 2007

Welcome message from author
This document is posted to help you gain knowledge. Please leave a comment to let me know what you think about it! Share it to your friends and learn new things together.
Transcript
This article was downloaded by:[Asian Institute of Technology][Asian Institute of Technology]
On: 31 May 2007Access Details: [subscription number 732450293]Publisher: Taylor & FrancisInforma Ltd Registered in England and Wales Registered Number: 1072954Registered office: Mortimer House, 37-41 Mortimer Street, London W1T 3JH, UK
International Journal of RemoteSensingPublication details, including instructions for authors and subscription information:http://www.informaworld.com/smpp/title~content=t713722504
Best band combination for landslide studies intemperate environmentsM. F. Ramli a; D. N. Petley ba Faculty of Environmental Studies, Universiti Putra Malaysia. 43400 Serdang.Malaysiab Department of Geography, University of Durham. Durham DH1 3LE. UK
To cite this Article: Ramli, M. F. and Petley, D. N. , 'Best band combination forlandslide studies in temperate environments', International Journal of RemoteSensing, 27:6, 1219 - 1231To link to this article: DOI: 10.1080/01431160500306740
URL: http://dx.doi.org/10.1080/01431160500306740
PLEASE SCROLL DOWN FOR ARTICLE
Full terms and conditions of use: http://www.informaworld.com/terms-and-conditions-of-access.pdf
This article maybe used for research, teaching and private study purposes. Any substantial or systematic reproduction,re-distribution, re-selling, loan or sub-licensing, systematic supply or distribution in any form to anyone is expresslyforbidden.
The publisher does not give any warranty express or implied or make any representation that the contents will becomplete or accurate or up to date. The accuracy of any instructions, formulae and drug doses should beindependently verified with primary sources. The publisher shall not be liable for any loss, actions, claims, proceedings,demand or costs or damages whatsoever or howsoever caused arising directly or indirectly in connection with orarising out of the use of this material.
© Taylor and Francis 2007
Dow
nloa
ded
By: [
Asia
n In
stitu
te o
f Tec
hnol
ogy]
At:
12:4
1 31
May
200
7
Best band combination for landslide studies in temperate environments
M. F. RAMLI*{ and D. N. PETLEY{{Faculty of Environmental Studies, Universiti Putra Malaysia, 43400 Serdang, Malaysia
{Department of Geography, University of Durham, Durham DH1 3LE, UK
(Received 9 August 2005 )
Multi-spectral imagery has great potential for the detection and delineation of
landslides in temperate areas due to its ability to show changes in surface material
properties. In this study, an assessment of the best band combination of the
eleven-band Airborne Thematic Mapper (ATM) imagery for landslide studies
was undertaken. The ATM composite image for Stonebarrow Hill in West
Dorset, an area that is renowned for landslide activity, was assessed by
comparing the image with a 1: 2000-scale geomorphological map compiled
through ground mapping. A suggestion of the best band combination to be used
under various conditions, such as in arable and pasture lands, heavily vegetated
areas and shadow affected areas, is presented.
1. Introduction
Landslide delineation and mapping remains a subjective process (Fookes et al.
1992). The subjectivity of landslide mapping is shown by a slightly different map
produced for a similar area by two experienced mappers. Ramli and Petley (2002)
compared their morphological map with that of Brunsden and Jones (1972).
Although there are some differences in the placement of some landslide features,
such as back-tilted blocks, overall trends of slope morphology and water courses
are still similar. Fookes et al. (1992) compared the aerial photograph (AP)
photograph interpretation of eight interpreters in a landslide area at the proposed
Ok Ma dam, Papua New Guinea, and found that their interpretations were mostly
related to their training, skill, judgement and also type, scale and quality of the APs.
Techniques for mapping landslides include direct field observation, direct
subsurface investigations (for example, boreholes and trial pits), indirect subsurface
investigations (geophysics), aerial photographic interpretation and multi-spectral
remote sensing. Of these, aerial photography remains the most commonly used tool
over large areas, due to its ability to project a complete, wide-scale stereo model,
which allows the detection of morphologies that might indicate the presence of relict
landslides. Although many such features can be delineated, difficulties still arise in
areas with very subdued morphology (Hutchinson 1983, 2001). Furthermore, aerial
photographs provide information only on physical appearance, relying on a high
level of skill and experience from the operator to provide an interpretation. It is
unsurprising therefore that levels of reproducibility between different mappers is low
(Fookes and Dale 1992).
*Corresponding author. Email: [email protected]
International Journal of Remote Sensing
Vol. 27, No. 6, 20 March 2006, 1219–1231
International Journal of Remote SensingISSN 0143-1161 print/ISSN 1366-5901 online # 2006 Taylor & Francis
http://www.tandf.co.uk/journalsDOI: 10.1080/01431160500306740
Dow
nloa
ded
By: [
Asia
n In
stitu
te o
f Tec
hnol
ogy]
At:
12:4
1 31
May
200
7 Since multi-spectral remote sensing provides measurements of the spectral
response of the terrain across a range of wavelengths, it potentially represents a
more scientific technique for landslide recognition and delineation. In general, two
main approaches can be used – ‘direct’ and ‘indirect’ mapping. ‘Direct’ mapping is
used to identify evidence of past and potential landslide areas through the analysis
of landforms using visual identification of features on an image. Thus, in common
with aerial photographic interpretation, it involves the identification of landslide
features, such as shear surfaces, rotated blocks, deep fissures or tension cracks. The
relationships between landforms, geomorphological settings and geological condi-
tions can be used to indicate the presence of unstable land. ‘Indirect’ mapping
involves the analysis of the spectral response of a surface, which may be related to
the properties of the underlying materials. For example, the thermal response of a
surface may be affected by lithology, soil type and thickness (Dubucq et al. 1991,
Samarakoon et al. 1993, Kusaka et al. 1996, Mantovani et al. 1996), all of which
vary as a result of the presence of a landslide.
The introduction of high spectral and spatial resolutions of airborne imagery that
are currently unavailable from satellite imagery, such as the Airborne Thematic
Mapper (ATM), allows detailed landslide interpretation to be performed. ATM
detects the spectral differences on the ground surface that may be related to
landslide features. These differences are a result of the combination of spectral
response from the surface features of the particular area (Mason et al. 1995). In
unstable areas, the spectral response of the ground surface may be related to
landslide features through variations, for example, in vegetation and soil type
(Mason et al. 1995). Eyers et al. (1995) found that in semi-arid environments
in Spain, the use of the ATM instrument significantly increased the detectability
of smaller landslides when compared with satellite instruments. When compared
with Landsat TM, the ATM has been proved very effective in the mapping of
distinctive rock types, including in situ landslide debris. The thermal bands were
found to be particularly applicable to lithological and soil moisture distribution
mapping.
Spectral analysis of the ATM imagery also allowed detailed soil and vegetation
mapping, and the identification of less obvious landslides and debris flows
compared with Landsat TM, SPOT PAN and aerial photographs (Mason et al.
1995). The increasing spectral resolution, as in ATM with 11 bands compared with
Landsat TM of 7 bands, would make choosing the best band combination time
consuming . Various statistical methods have been introduced to choose the band
combination containing the most information for environmental and geological
studies, such as optimum index factor (Chavez et al. 1982), maximum variance–
covariance determinant (Sheffield 1985) and principal component analysis (PCA).
Although these statistical methods are useful in finding the best possible
combination using statistical aspects of the scene, visual inspection of the colour
composite is still required. Ramli et al. (2002) showed that these methods are not
reliable in predicting the best band combination for landslide studies.
In order to maximize image analysis and data extraction, the best colour
composite that shows the most relevant information can be generated. A colour
composite image is a combination of three different bands using three primary
colour guns – red, green and blue – to produce a composite image. The main
objective of this research is to evaluate the best band combination for landside
studies utilizing ATM. To achieve this objective, all of the possible band
1220 M. F. Ramli and D. N. Petley
Dow
nloa
ded
By: [
Asia
n In
stitu
te o
f Tec
hnol
ogy]
At:
12:4
1 31
May
200
7 combinations were generated for the study. Prior to that, ground mapping was
undertaken for familiarization of the landslide features in the study area, where a 1:
2000-scale geomorphological map was compiled. The separate sections from the
map were published in Ramli et al. (2000, 2002) and Ramli and Petley (2002).
2. Methodology
2.1 Study area
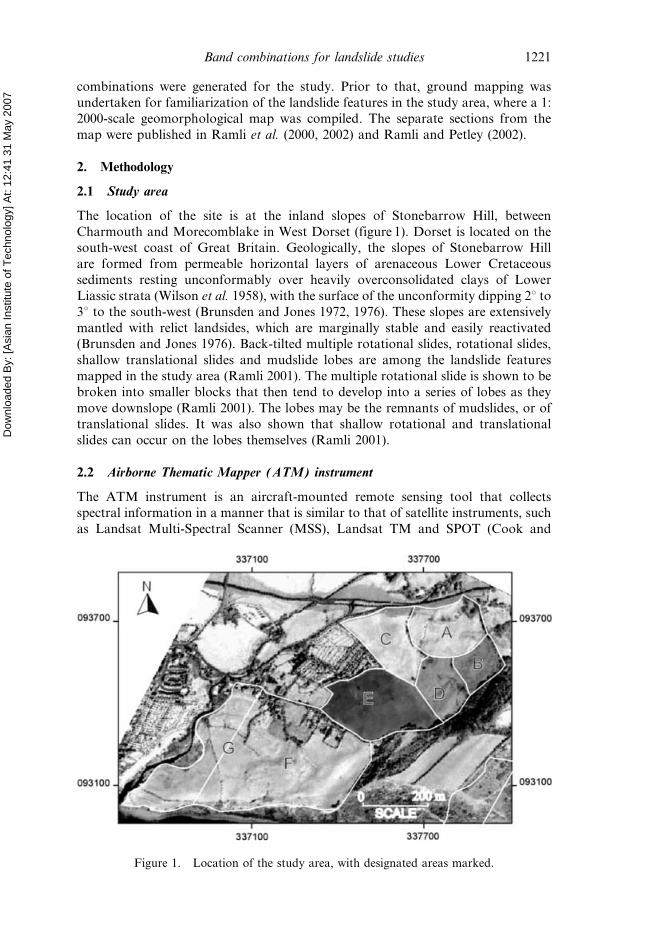
The location of the site is at the inland slopes of Stonebarrow Hill, between
Charmouth and Morecomblake in West Dorset (figure 1). Dorset is located on the
south-west coast of Great Britain. Geologically, the slopes of Stonebarrow Hill
are formed from permeable horizontal layers of arenaceous Lower Cretaceous
sediments resting unconformably over heavily overconsolidated clays of Lower
Liassic strata (Wilson et al. 1958), with the surface of the unconformity dipping 2u to
3u to the south-west (Brunsden and Jones 1972, 1976). These slopes are extensively
mantled with relict landsides, which are marginally stable and easily reactivated
(Brunsden and Jones 1976). Back-tilted multiple rotational slides, rotational slides,
shallow translational slides and mudslide lobes are among the landslide features
mapped in the study area (Ramli 2001). The multiple rotational slide is shown to be
broken into smaller blocks that then tend to develop into a series of lobes as they
move downslope (Ramli 2001). The lobes may be the remnants of mudslides, or of
translational slides. It was also shown that shallow rotational and translational
slides can occur on the lobes themselves (Ramli 2001).
2.2 Airborne Thematic Mapper (ATM) instrument
The ATM instrument is an aircraft-mounted remote sensing tool that collects
spectral information in a manner that is similar to that of satellite instruments, such
as Landsat Multi-Spectral Scanner (MSS), Landsat TM and SPOT (Cook and
Figure 1. Location of the study area, with designated areas marked.
Band combinations for landslide studies 1221
Dow
nloa
ded
By: [
Asia
n In
stitu
te o
f Tec
hnol
ogy]
At:
12:4
1 31
May
200
7 White 1990). In this study, the Daedalus AADS 1268 ATM instrument was used,
which is an eleven-band (ten bands within the reflectance part of the electromagnetic
spectrum, one in the emittance part), across-track, multi-spectral scanner. It detects
the radiance or emittance of the target (ground surface) along a 718 pixel scan-line
aligned perpendicular to the flight line. The spatial resolution of the ATM depends
on the instantaneous field of view (IFOV) of the sensor and the flying height. IFOV
is the solid angle through which a detector is sensitive to radiation and forms the
limit to the resolution of an imagery system (Drury 1998). For this instrument the
IFOV is fixed at 2.5 mrad. Two epochs of ATM data were acquired by the Natural
Environment Research Council (NERC) using the Daedalus AADS 1268 airborne
scanner, one on 6 November 1994 (winter) and the other on 16 April 1995 (spring).
The spatial resolution of the first epoch of the imagery is about 2.5 m, whilst the
second is 2.3 m, the difference being attributable to changes in the flying height of
the aircraft.
In the winter imagery, shadows affected nearly a quarter of the study area. The
spring imagery, however is free from any shadow. Band 11 (the thermal band) of the
winter imagery was affected by a cold surface wind, resulting in parallel, curved lines
of lighter and darker tones.
2.3 Area selection
Within the study area, six areas were selected in the winter imagery and seven in the
spring imagery. The selection of these areas was based on spectral homogeneity in
order to reduce the complexity of the statistical recognition and to reduce
the likelihood of confusion between spectrally similar objects (Ramli et al. 2002).
Dividing the area into several spectrally homogeneous sub-areas may maximize the
contrast stretching that is performed in order to enhance the colour composite. A
spectrally homogeneous area means that the area histogram is unimodal and the
colour of the particular area under red, blue and green guns is similar. The choice of
contrast stretching to show the maximum amount of information is highly
subjective and depends on the operator. Some operators prefer using linear
stretching, some histogram stretching and others prefer further kinds of stretching,
such as level-slice stretching or logarithmic stretching. However, the application of
linear contrast stretching to the imagery with a unimodal histogram may maximize
the image display (Jensen 1996). Raw imagery was used to preserve the original
spectral data. To simplify explanation, every area was named based on the field
boundary and section. An area that was affected badly by cloud shadow was
selected in the winter imagery (field F) to investigate the optimum band to be used in
these conditions (table 1). Field G is also included as an extension of field F which is
not covered in the winter imagery.
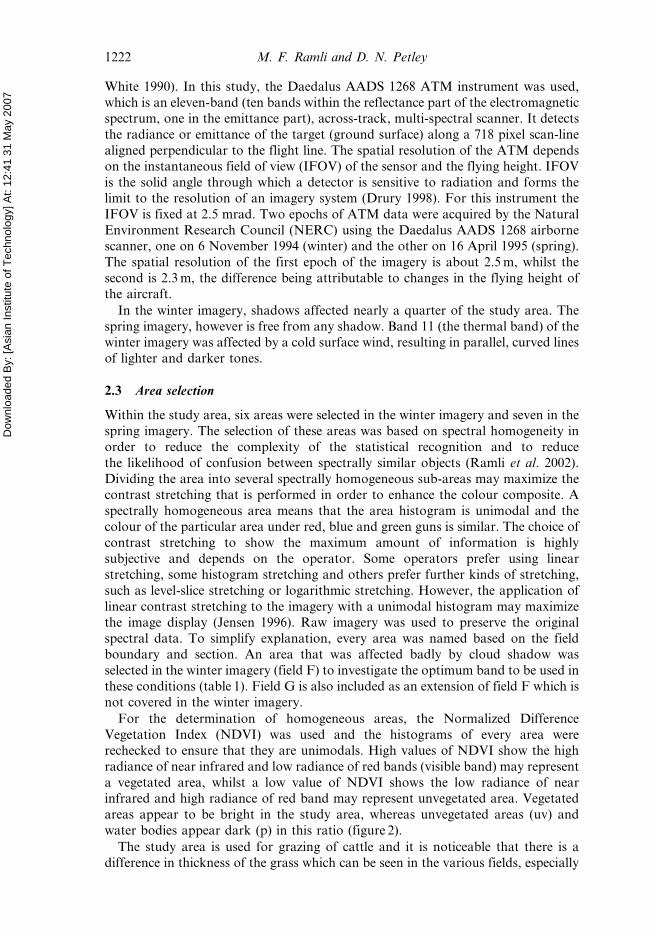
For the determination of homogeneous areas, the Normalized Difference
Vegetation Index (NDVI) was used and the histograms of every area were
rechecked to ensure that they are unimodals. High values of NDVI show the high
radiance of near infrared and low radiance of red bands (visible band) may represent
a vegetated area, whilst a low value of NDVI shows the low radiance of near
infrared and high radiance of red band may represent unvegetated area. Vegetated
areas appear to be bright in the study area, whereas unvegetated areas (uv) and
water bodies appear dark (p) in this ratio (figure 2).
The study area is used for grazing of cattle and it is noticeable that there is a
difference in thickness of the grass which can be seen in the various fields, especially
1222 M. F. Ramli and D. N. Petley
Dow
nloa
ded
By: [
Asia
n In
stitu
te o
f Tec
hnol
ogy]
At:
12:4
1 31
May
200
7
in the spring imagery. The thickest grass based on the NDVI is found in fields C and
G, closely followed by fields A, D and B (figure 2, table 1). For the winter imagery,
the grass in field B is probably less thick than the combination of fields A, C and D
with almost the same thickness. Field E has probably been subjected to ploughing.
Inspection using the near-infrared band and wetness index showed that this area is
probably very wet in winter imagery and very dry in spring imagery. Earlier results for
the best band combination for the winter imagery in this study are presented briefly in
Ramli et al. (2002). Some of those results are quoted again for comparison purposes
with the spring imagery, but with more detailed explanation and discussion.
Areas consisting of a field or a combination of several fields were selected in order
to test whether dividing the study area into homogeneous units makes contrast
enhancement easier. The description of each sub-area is summarized in tables 2 and 3.
Textural information of each band was also evaluated in order to study the effect
of combination of the band to the texture.
The procedure for generating a colour composite image is:
1. the preferred three bands are loaded into the three separate red, green and
blue guns;
Figure 2. NDVI images of the study area: (a) winter imagery; (b) spring imagery. E, hasbeen subjected to ploughing; P; water bodies; UV, unvegetated.
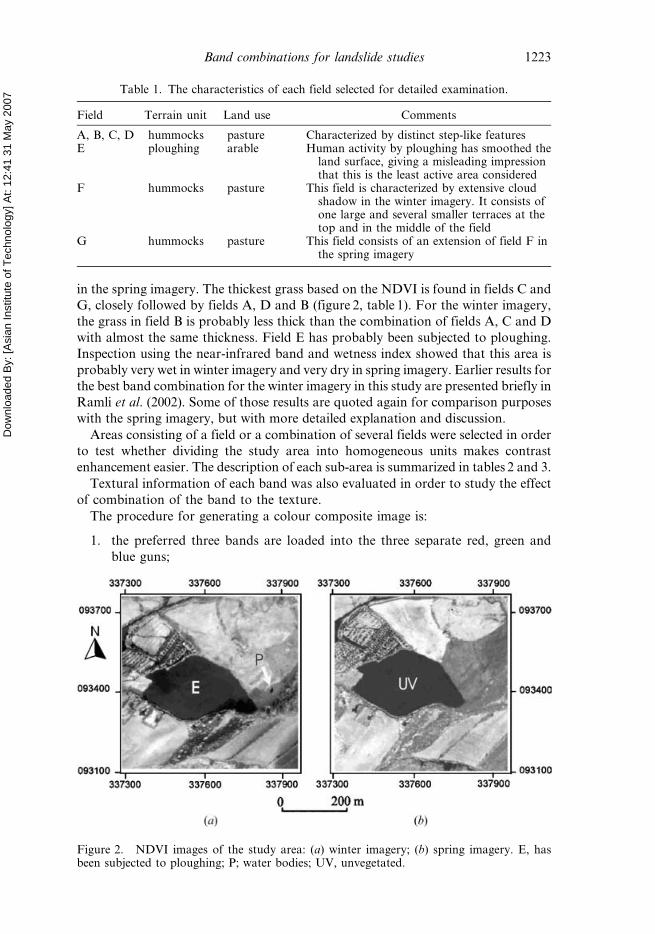
Table 1. The characteristics of each field selected for detailed examination.
Field Terrain unit Land use Comments
A, B, C, D hummocks pasture Characterized by distinct step-like featuresE ploughing arable Human activity by ploughing has smoothed the
land surface, giving a misleading impressionthat this is the least active area considered
F hummocks pasture This field is characterized by extensive cloudshadow in the winter imagery. It consists ofone large and several smaller terraces at thetop and in the middle of the field
G hummocks pasture This field consists of an extension of field F inthe spring imagery
Band combinations for landslide studies 1223
Dow
nloa
ded
By: [
Asia
n In
stitu
te o
f Tec
hnol
ogy]
At:
12:4
1 31
May
200
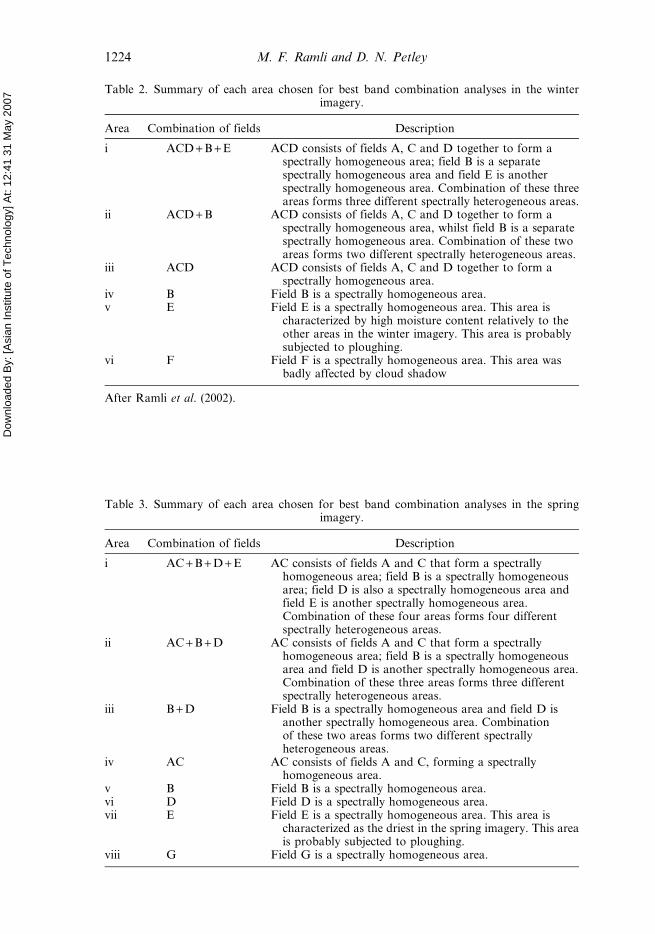
7 Table 2. Summary of each area chosen for best band combination analyses in the winterimagery.
Area Combination of fields Description
i ACD + B + E ACD consists of fields A, C and D together to form aspectrally homogeneous area; field B is a separatespectrally homogeneous area and field E is anotherspectrally homogeneous area. Combination of these threeareas forms three different spectrally heterogeneous areas.
ii ACD + B ACD consists of fields A, C and D together to form aspectrally homogeneous area, whilst field B is a separatespectrally homogeneous area. Combination of these twoareas forms two different spectrally heterogeneous areas.
iii ACD ACD consists of fields A, C and D together to form aspectrally homogeneous area.
iv B Field B is a spectrally homogeneous area.v E Field E is a spectrally homogeneous area. This area is
characterized by high moisture content relatively to theother areas in the winter imagery. This area is probablysubjected to ploughing.
vi F Field F is a spectrally homogeneous area. This area wasbadly affected by cloud shadow
After Ramli et al. (2002).
Table 3. Summary of each area chosen for best band combination analyses in the springimagery.
Area Combination of fields Description
i AC + B + D + E AC consists of fields A and C that form a spectrallyhomogeneous area; field B is a spectrally homogeneousarea; field D is also a spectrally homogeneous area andfield E is another spectrally homogeneous area.Combination of these four areas forms four differentspectrally heterogeneous areas.
ii AC + B + D AC consists of fields A and C that form a spectrallyhomogeneous area; field B is a spectrally homogeneousarea and field D is another spectrally homogeneous area.Combination of these three areas forms three differentspectrally heterogeneous areas.
iii B + D Field B is a spectrally homogeneous area and field D isanother spectrally homogeneous area. Combinationof these two areas forms two different spectrallyheterogeneous areas.
iv AC AC consists of fields A and C, forming a spectrallyhomogeneous area.
v B Field B is a spectrally homogeneous area.vi D Field D is a spectrally homogeneous area.vii E Field E is a spectrally homogeneous area. This area is
characterized as the driest in the spring imagery. This areais probably subjected to ploughing.
viii G Field G is a spectrally homogeneous area.
1224 M. F. Ramli and D. N. Petley
Dow
nloa
ded
By: [
Asia
n In
stitu
te o
f Tec
hnol
ogy]
At:
12:4
1 31
May
200
7
2. linear contrast enhancement with a 99% clip is applied to give a ‘consistent’image stretching method;
3. the three bands were then loaded against a different combination of these
three primary colour guns. The best result in terms of colour and texture was
taken from all possible combinations of the three bands in the three guns.
Band 1 in both sets of imagery was discarded due to the high level of atmospheric
scattering, which leads to a noisy image (Sabins 1978, Curran 1985, Lillesand and
Kiefer 1994). A total of 580 combinations were generated, captured and analysed for
each area.
3. Results
3.1 Single band textural classification
Textural classification was performed on each band in order to understand the
contribution of texture content from each band in the composite image. The abilityto express the texture that might be related to the landslide features is important in
landslide studies (Eyers et al. 1995, Hervas and Rosin 1996). Visual classification of
textural expression has been undertaken by applying a scale of one to four, with the
worst textural expression being recorded as one and the best as four. However, the
scale applied is not necessarily comparable within the separated area in the imagery.
For example, a scale of 4 in area (i) is not necessarily compatible with a scale of 4 in
area (ii) since it is a combination of different fields.
The relationship between bands can be inspected using statistical information.This is performed in order to confirm the general rule that the most useful
information can be shown using a composite image of three bands due to the high
degree of redundancy within the same group of wavelengths (Rothery 1987).
Generally, within the ten bands available, the correlation was found to be high
within the same class of bandwidth. The correlation matrix is an estimation of the
degree of interrelation between variables in a manner not influenced by
measurement units (Davis 1973). In remote sensing terms, the measure shows the
degree of redundancy in the imagery. Redundancy means that the two bandscontain similar information. For this reason and also to simplify the explanation,
the bands were grouped under three broad electromagnetic regions: visible, near-
infrared and middle infrared bands.
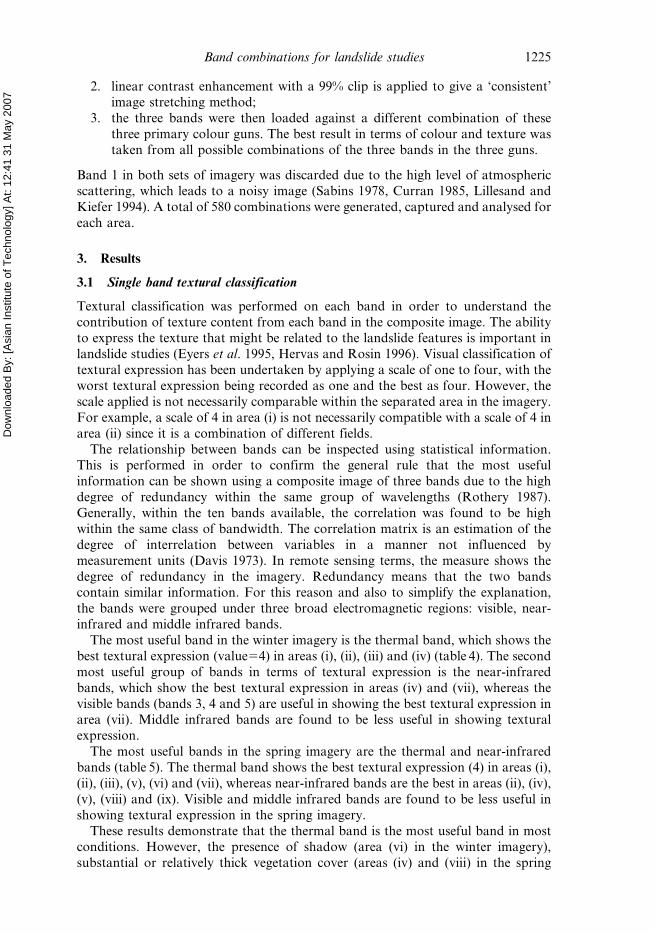
The most useful band in the winter imagery is the thermal band, which shows the
best textural expression (value54) in areas (i), (ii), (iii) and (iv) (table 4). The second
most useful group of bands in terms of textural expression is the near-infrared
bands, which show the best textural expression in areas (iv) and (vii), whereas the
visible bands (bands 3, 4 and 5) are useful in showing the best textural expression inarea (vii). Middle infrared bands are found to be less useful in showing textural
expression.
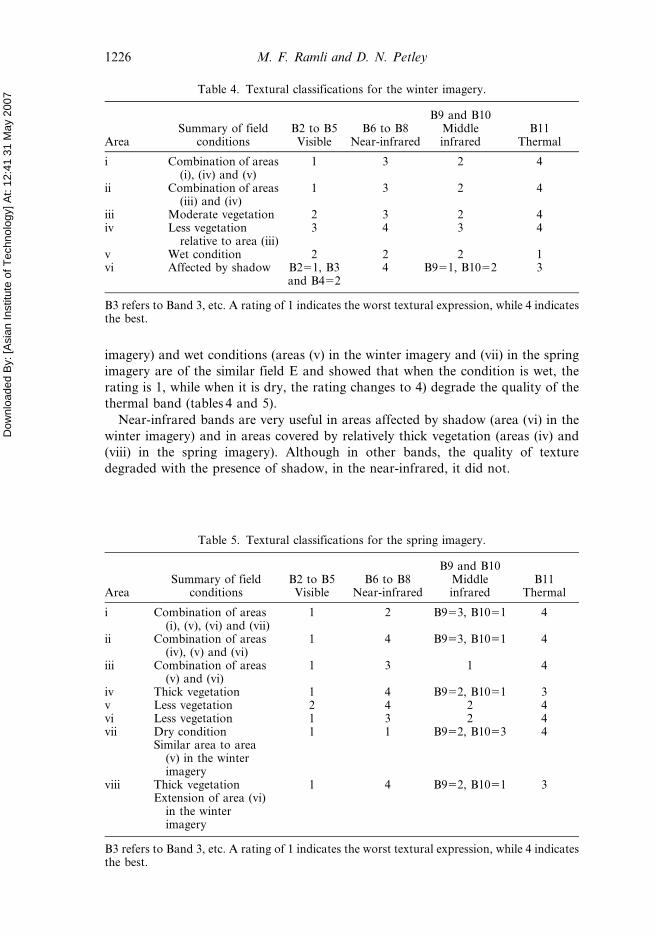
The most useful bands in the spring imagery are the thermal and near-infrared
bands (table 5). The thermal band shows the best textural expression (4) in areas (i),
(ii), (iii), (v), (vi) and (vii), whereas near-infrared bands are the best in areas (ii), (iv),
(v), (viii) and (ix). Visible and middle infrared bands are found to be less useful in
showing textural expression in the spring imagery.
These results demonstrate that the thermal band is the most useful band in mostconditions. However, the presence of shadow (area (vi) in the winter imagery),
substantial or relatively thick vegetation cover (areas (iv) and (viii) in the spring
Band combinations for landslide studies 1225
Dow
nloa
ded
By: [
Asia
n In
stitu
te o
f Tec
hnol
ogy]
At:
12:4
1 31
May
200
7
imagery) and wet conditions (areas (v) in the winter imagery and (vii) in the spring
imagery are of the similar field E and showed that when the condition is wet, the
rating is 1, while when it is dry, the rating changes to 4) degrade the quality of the
thermal band (tables 4 and 5).
Near-infrared bands are very useful in areas affected by shadow (area (vi) in the
winter imagery) and in areas covered by relatively thick vegetation (areas (iv) and
(viii) in the spring imagery). Although in other bands, the quality of texture
degraded with the presence of shadow, in the near-infrared, it did not.
Table 4. Textural classifications for the winter imagery.
AreaSummary of field
conditionsB2 to B5Visible
B6 to B8Near-infrared
B9 and B10Middleinfrared
B11Thermal
i Combination of areas(i), (iv) and (v)
1 3 2 4
ii Combination of areas(iii) and (iv)
1 3 2 4
iii Moderate vegetation 2 3 2 4iv Less vegetation
relative to area (iii)3 4 3 4
v Wet condition 2 2 2 1vi Affected by shadow B251, B3
and B4524 B951, B1052 3
B3 refers to Band 3, etc. A rating of 1 indicates the worst textural expression, while 4 indicatesthe best.
Table 5. Textural classifications for the spring imagery.
AreaSummary of field
conditionsB2 to B5Visible
B6 to B8Near-infrared
B9 and B10Middleinfrared
B11Thermal
i Combination of areas(i), (v), (vi) and (vii)
1 2 B953, B1051 4
ii Combination of areas(iv), (v) and (vi)
1 4 B953, B1051 4
iii Combination of areas(v) and (vi)
1 3 1 4
iv Thick vegetation 1 4 B952, B1051 3v Less vegetation 2 4 2 4vi Less vegetation 1 3 2 4vii Dry condition
Similar area to area(v) in the winterimagery
1 1 B952, B1053 4
viii Thick vegetationExtension of area (vi)
in the winterimagery
1 4 B952, B1051 3
B3 refers to Band 3, etc. A rating of 1 indicates the worst textural expression, while 4 indicatesthe best.
1226 M. F. Ramli and D. N. Petley
Dow
nloa
ded
By: [
Asia
n In
stitu
te o
f Tec
hnol
ogy]
At:
12:4
1 31
May
200
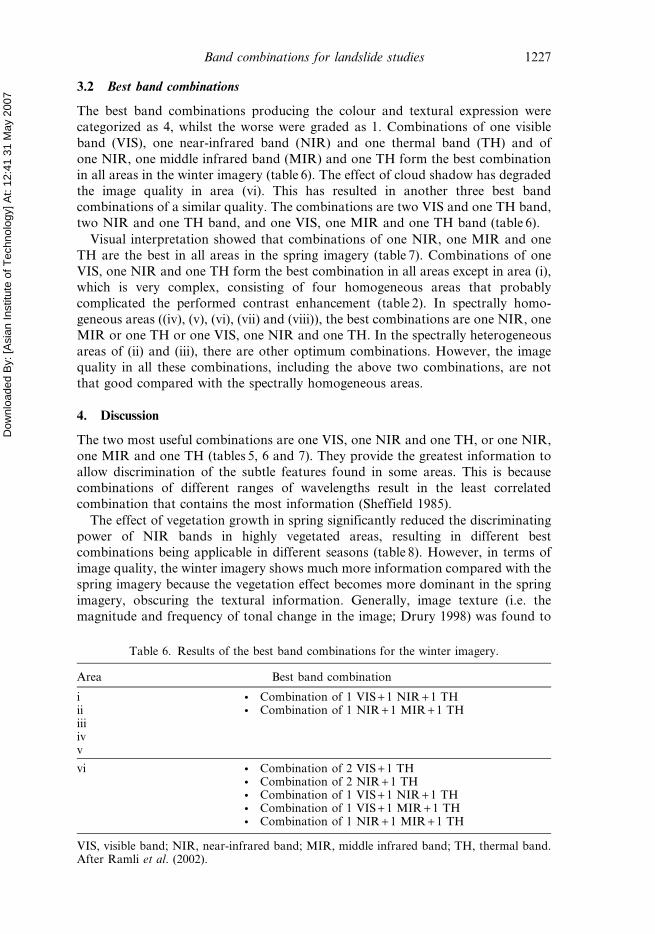
7 3.2 Best band combinations
The best band combinations producing the colour and textural expression were
categorized as 4, whilst the worse were graded as 1. Combinations of one visible
band (VIS), one near-infrared band (NIR) and one thermal band (TH) and of
one NIR, one middle infrared band (MIR) and one TH form the best combination
in all areas in the winter imagery (table 6). The effect of cloud shadow has degraded
the image quality in area (vi). This has resulted in another three best band
combinations of a similar quality. The combinations are two VIS and one TH band,
two NIR and one TH band, and one VIS, one MIR and one TH band (table 6).
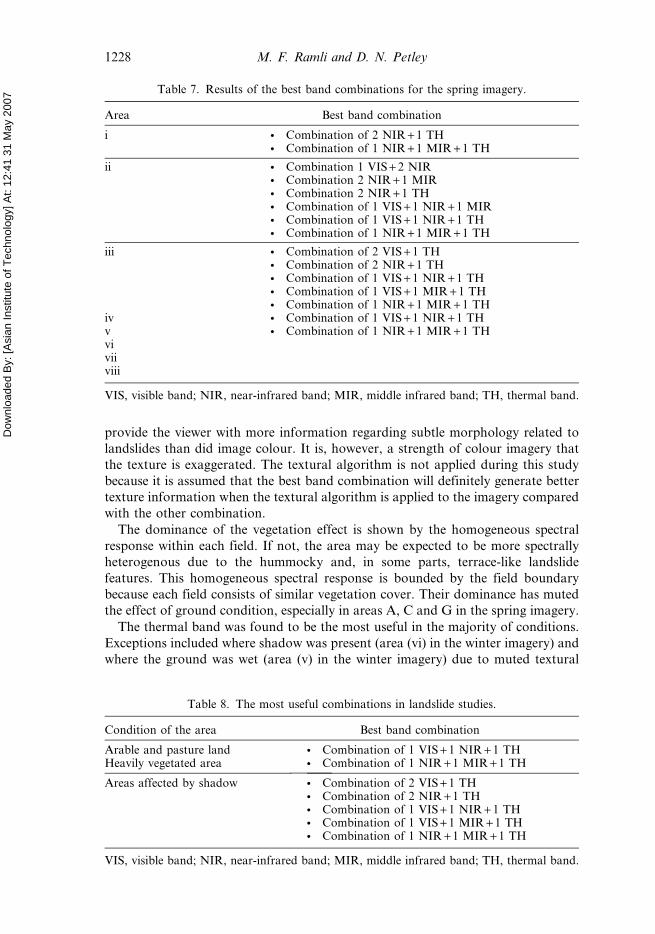
Visual interpretation showed that combinations of one NIR, one MIR and one
TH are the best in all areas in the spring imagery (table 7). Combinations of one
VIS, one NIR and one TH form the best combination in all areas except in area (i),
which is very complex, consisting of four homogeneous areas that probably
complicated the performed contrast enhancement (table 2). In spectrally homo-
geneous areas ((iv), (v), (vi), (vii) and (viii)), the best combinations are one NIR, one
MIR or one TH or one VIS, one NIR and one TH. In the spectrally heterogeneous
areas of (ii) and (iii), there are other optimum combinations. However, the image
quality in all these combinations, including the above two combinations, are not
that good compared with the spectrally homogeneous areas.
4. Discussion
The two most useful combinations are one VIS, one NIR and one TH, or one NIR,
one MIR and one TH (tables 5, 6 and 7). They provide the greatest information to
allow discrimination of the subtle features found in some areas. This is because
combinations of different ranges of wavelengths result in the least correlated
combination that contains the most information (Sheffield 1985).
The effect of vegetation growth in spring significantly reduced the discriminating
power of NIR bands in highly vegetated areas, resulting in different best
combinations being applicable in different seasons (table 8). However, in terms of
image quality, the winter imagery shows much more information compared with the
spring imagery because the vegetation effect becomes more dominant in the spring
imagery, obscuring the textural information. Generally, image texture (i.e. the
magnitude and frequency of tonal change in the image; Drury 1998) was found to
Table 6. Results of the best band combinations for the winter imagery.
Area Best band combination
i N Combination of 1 VIS + 1 NIR + 1 THii N Combination of 1 NIR + 1 MIR + 1 THiiiivv
vi N Combination of 2 VIS + 1 THN Combination of 2 NIR + 1 THN Combination of 1 VIS + 1 NIR + 1 THN Combination of 1 VIS + 1 MIR + 1 THN Combination of 1 NIR + 1 MIR + 1 TH
VIS, visible band; NIR, near-infrared band; MIR, middle infrared band; TH, thermal band.After Ramli et al. (2002).
Band combinations for landslide studies 1227
Dow
nloa
ded
By: [
Asia
n In
stitu
te o
f Tec
hnol
ogy]
At:
12:4
1 31
May
200
7
provide the viewer with more information regarding subtle morphology related to
landslides than did image colour. It is, however, a strength of colour imagery that
the texture is exaggerated. The textural algorithm is not applied during this study
because it is assumed that the best band combination will definitely generate better
texture information when the textural algorithm is applied to the imagery compared
with the other combination.
The dominance of the vegetation effect is shown by the homogeneous spectral
response within each field. If not, the area may be expected to be more spectrally
heterogenous due to the hummocky and, in some parts, terrace-like landslide
features. This homogeneous spectral response is bounded by the field boundary
because each field consists of similar vegetation cover. Their dominance has muted
the effect of ground condition, especially in areas A, C and G in the spring imagery.
The thermal band was found to be the most useful in the majority of conditions.
Exceptions included where shadow was present (area (vi) in the winter imagery) and
where the ground was wet (area (v) in the winter imagery) due to muted textural
Table 8. The most useful combinations in landslide studies.
Condition of the area Best band combination
Arable and pasture land N Combination of 1 VIS + 1 NIR + 1 THHeavily vegetated area N Combination of 1 NIR + 1 MIR + 1 TH
Areas affected by shadow N Combination of 2 VIS + 1 THN Combination of 2 NIR + 1 THN Combination of 1 VIS + 1 NIR + 1 THN Combination of 1 VIS + 1 MIR + 1 THN Combination of 1 NIR + 1 MIR + 1 TH
VIS, visible band; NIR, near-infrared band; MIR, middle infrared band; TH, thermal band.
Table 7. Results of the best band combinations for the spring imagery.
Area Best band combination
i N Combination of 2 NIR + 1 THN Combination of 1 NIR + 1 MIR + 1 TH
ii N Combination 1 VIS + 2 NIRN Combination 2 NIR + 1 MIRN Combination 2 NIR + 1 THN Combination of 1 VIS + 1 NIR + 1 MIRN Combination of 1 VIS + 1 NIR + 1 THN Combination of 1 NIR + 1 MIR + 1 TH
iii N Combination of 2 VIS + 1 THN Combination of 2 NIR + 1 THN Combination of 1 VIS + 1 NIR + 1 THN Combination of 1 VIS + 1 MIR + 1 THN Combination of 1 NIR + 1 MIR + 1 TH
iv N Combination of 1 VIS + 1 NIR + 1 THv N Combination of 1 NIR + 1 MIR + 1 THviviiviii
VIS, visible band; NIR, near-infrared band; MIR, middle infrared band; TH, thermal band.
1228 M. F. Ramli and D. N. Petley
Dow
nloa
ded
By: [
Asia
n In
stitu
te o
f Tec
hnol
ogy]
At:
12:4
1 31
May
200
7 information. It usually provides the best textural expression compared with other
bands. The thermal band provides an indication of the radiant temperature of the
surface, which is often related to surface moisture (Davidson and Watson 1995,
Kusaka et al. 1996). Of course, in many cases, landslides are associated with
variations in surface moisture and this can thus be a good indicator of the presence
of existing or relict slides, although clearly it is only useful when used in conjunction
with other pieces of information. In this study, a good textural contrast in the
thermal band was found to correlate with landslide-affected areas, as identified
during ground mapping. Care is needed, however, as marked variations in thermal
response were noted between the hotter and brighter tones of the sun-facing slopes
and the cooler back-facing slopes, which are sufficiently cold to appear as a band of
consistent dark shadow. The thermal band was also found to be one of the most
important bands for the production of composite images.
The near-infrared is the most useful individual band after the thermal band for
landslide recognition. Soeters and van Westen (1996) stressed that the near-infrared
band is useful because landslides frequently produce subtle changes in the health of
vegetation and in growth vigour and may also cause increases in soil moisture
content. The results of this study support this finding. A comparison between the
near-infrared and other bands, such as middle infrared and visible, showed that
morphological features ‘stand out’ more in this band (tables 4 and 5). This is
probably due to shadow enhancement, but may also be related to vegetation
differences (Sauchyn and Trench 1978). In very wet and vegetated areas and in the
areas affected by shadow, the near-infrared was found to be much better at showing
the textural expression of the morphological features than the thermal band.
However, in areas that are moderately vegetated and not very wet, the thermal band
was found to be better. If the area is very wet, the textural expression in the thermal
band is probably masked by the dominance of the low emittance value. The presence
of a highly vegetated area also reduces the capability of the thermal band in showing
the morphological features by trapping the moisture inside its canopy, masking any
spectral information from the ground. However, the inclusion of the thermal band is
critical in increasing the colour contrast in the false colour composite.
The visible and middle near-infrared bands are found to be of little use in
expressing texture in the less vegetated, dry and wet areas. However, when used in a
composite image, the colour contrast increases, making the differentiation between
the subtle spectral response better. It must also be noted that ranking all the best
colour composites is subjective. It is anticipated that the higher the training,skill and
judgement of the interpreter, the less subjective the interpretation between two
interpreters (Fookes et al.1992).
It is suggested that in idealized conditions the appropriate best band combination
in terms of colour and texture for each homogeneous area are used. This procedure
can be performed after the area is subdivided, in which contrast stretching can be
undertaken individually upon each sub-area.
5. Conclusions
Overall, landslide features proved to be considerably more distinct in the winter
imagery than in the spring imagery, probably due to the low winter sun angle, which
produces shadows that enhance subtle morphological features. Furthermore,
vegetation effects are suppressed in winter because of the lower levels of vegetation
growth, which are reflected in the low spectral response of the near-infrared band.
Band combinations for landslide studies 1229
Dow
nloa
ded
By: [
Asia
n In
stitu
te o
f Tec
hnol
ogy]
At:
12:4
1 31
May
200
7
The two most useful combinations which can be used in arable and pasture lands,in heavily vegetated areas and in areas affected by shadow are (a) one visible band,
one near-infrared and one thermal band or (b) one near-infrared, one middle
infrared and one thermal band. In areas affected by shadow, three more
combinations produce imagery of similar quality: (c) two visible and one thermal
band; (d) two near-infrared and one thermal band; and (e) one visible, one middle
infrared and one thermal band.
Overall, the thermal band (band 11), which measures the amount of radiation
emitted from the ground surface, was found to be the most useful, followed by thenear-infrared band. The visible and middle near-infrared bands, when used in a
composite image with the near-infrared and thermal band, will increase the colour
contrast, improving the differentiation between subtle spectral responses.
Acknowledgement
The imagery for this project was collected by NERC Airborne Remote Sensing
Facility under grant number 94/25. The authors would like to thank Dr Bill
Murphy, Dr Rob Inkpen, Dr Andy Gibson and Malcolm Whitworth for their greathelp during the research.
ReferencesBRUNSDEN, D. and JONES, D.K.C., 1972, The morphology of degraded landslide slopes in
South west Dorset. The Quarterly Journal of Engineering Geology, 5, pp. 205–222.
BRUNSDEN, D. and JONES, D.K.C., 1976, The evolution of landslide slopes in Dorset.
Philosophical Transactions of the Royal Society of London, Series A: Mathematical and
Physical Sciences, 283, pp. 605–631.
CHAVEZ, P.S., BERLIN, J.L. and SOWERS, B., 1982, Statistical method for selecting Landsat
MSS ratios. Journal of Applied Photographic Engineering, 8, pp. 23–30.
COOK, F.J. and WHITE, S.J., 1990, Overview of the 1989 NERC Airborne Remote Sensing
Campaign. In Proceedings of the NERC Symposium on Airborne Remote Sensing, pp.
1–6 (Keyworth, Nottingham: British Geological Survey).
CURRAN, P.J., 1985, Principles of remote sensing (London: Longman).
DAVIDSON, A.D. and WATSON, A., 1995, Spatial variability in soil moisture as predicted from
airborne thematic mapper (ATM) data. Earth Surface Processes and Landforms, 20,
pp. 219–230.
DAVIS, J.C., 1973, Statistics and data analysis in geology (New York: John Wiley).
DRURY, S.A., 1998, Images of earth: A guide to remote sensing (London: Allen & Unwin).
DUBUCQ, M., DARTEYRE, L. and REVEL, J.C., 1991, Identification and cartography of soil
surface erosion and crusting in the Lauragais (France) using SPOT data and a DEM.
ITC Journal, 2, pp. 71–77.
EYERS, R., MOORE, J., HERVAS, J. and LIU, J.G., 1995, Landslide mapping using digital
imagery: A case history from Southeast Spain. In Proceedings of the Geohazards and
Engineering Conference, pp. 379–383 (Coventry: Coventry University).
FOOKES, P.G. and DALE, S.G., 1992, Comparison of interpretations of a major landslide at an
earthfill dam site in Papua New Guinea. The Quarterly Journal of Engineering
Geology, 25, pp. 313–330.
FOOKES, P.G., DALE, S.G. and LAND, J.M., 1992, Some observations on a comparative aerial
photography interpretation of a landslipped area. The Quarterly Journal of
Engineering Geology and Hydrogeology, 12, pp. 221–233.
HERVAS, J. and ROSIN, P.L., 1996, Landslide mapping by textural analysis of ATM data. In
Proceedings of the Eleventh Thematic Conference and Workshops on Applied Geologic
Remote Sensing, 27–29 February 1996, Las Vegas, Nevada (Ann Arbor, MI:
Environmental Research Institute of Michigan), pp. II394–II402.
1230 M. F. Ramli and D. N. Petley
Dow
nloa
ded
By: [
Asia
n In
stitu
te o
f Tec
hnol
ogy]
At:
12:4
1 31
May
200
7
HUTCHINSON, J.N., 1983, Methods of locating slip surfaces in landslides. Bulletin of the
Association of Engineering Geologists, 20, pp. 235–252.
HUTCHINSON, J.N., 2001, Reading the ground; morphology and geology in site appraisal.
Quarterly Journal of Engineering Geology and Hydrogeology, 34, pp. 7–50.
JENSEN, J.R., 1996, Introductory digital image processing: A remote sensing perspective (New
Jersey: Prentice-Hall).
KUSAKA, T., OOTSUKA, M., SHIKADA, M. and KAWATA, Y., 1996, Estimation of landslide
areas using satellite imagery and spatial features of watersheds. In Proceedings of the
Eleventh Thematic Conference and Workshops on Applied Geologic Remote Sensing,
27–29 February 1996, Las Vegas, Nevada (Ann Arbor, MI: Environmental Research
Institute of Michigan), pp. II415–II421.
LILLESAND, T.M. and KIEFER, R.W., 1994, Remote sensing and image interpretation, 3rd edn
(New York: John Wiley).
MANTOVANI, F., SOETERS, R. and VAN WESTEN, C.J., 1996, Remote sensing techniques for
landslide studies and hazard zonation in Europe. Geomorphology, 15, pp. 213–225.
MASON, P.J., ROSENBAUM, M.S. and MCMOORE, J.M., 1995, Texture analysis using multi-
temporal digital data for landslide hazard mapping. In Proceedings of the Geohazards
and Engineering Conference, pp. 215–223 (Coventry: Coventry University).
RAMLI, M.F., 2001, The use of remotely-sensed imagery for investigating landslides in
temperate environment. PhD thesis, University of Portsmouth.
RAMLI, M.F. and PETLEY, D.N., 2002, Morphological mapping: Its subjectivity and
application to the delineation of relict landslides. Science Putra, 10, pp. 22–26.
RAMLI, M.F., PETLEY, D.N., MURPHY, W. and INKPEN, R., 2000, The detection of relict
landslides using Airborne Thematic Mapper Imagery. In Landslides In Research,
Theory and Practice, E. Bromhead, N. Dixon and M.-L. Ibsen (Eds), pp. 1269–1274
(London: Thomas Telford).
RAMLI, M.F., PETLEY, D.N., MURPHY, W. and INKPEN, R., 2002, Integration of high
resolution thematic mapper and digital elevation model for landslide mapping. In
Proceedings of the Regional Symposium on Environmental and Natural Resources, 10–
11 April 2002, Kuala Lumpur (Bangi: Universiti Kebangsaan Malaysia), pp. 647–653.
ROTHERY, D.A., 1987, Decorrelation stretching and related techniques as an aid to image
interpretation in geology. In Proceedings of the Thirteenth Annual Conference of the
Remote Sensing Society, pp. 194–203 (Nottingham: University of Nottingham).
SABINS, F., 1978, Remote sensing: Principles and interpretation (San Francisco: Freeman).
SAMARAKOON, L., OGAWA, S., EBISU, N., LAPITAN, R. and KOHKI, Z., 1993, Inference of
landslide susceptible areas by Landsat Thematic Mapper data. In Proceedings of the
Yokohama Symposium, 13–16 July 1993, Japan (Wallingford: International
Association of Hydrological Sciences Press), pp. 83–90.
SAUCHYN, D.J. and TRENCH, N.R., 1978, Landsat applied to landslide mapping.
Photogrammetric Engineering and Remote Sensing, 44, pp. 735–741.
SHEFFIELD, C., 1985, Selecting band combinations from multispectral data. Photogrammetric
Engineering and Remote Sensing, 51, pp. 681–687.
SOETERS, R. and VAN WESTEN, C.J., 1996, Slope instability recognition, analysis, and
zonation. In Landslides: Investigation and mitigation, A.K. Turner and R.L. Schuster
(Eds), pp. 129–173, Special Report 247 (Washington: Transportation Board).
WILSON, V., WELCH, F.B.A., ROBBIE, J.A. and GREEN, G.M., 1958, Geology of the country
around Bridport and Yeovil, Sheets 327 and 312. Memoir of the Geological Survey of
Great Britain (England and Wales) (London: HMSO).
Band combinations for landslide studies 1231
Related Documents