BERKSHIRE HATHAWAY INC. 2000 ANNUAL REPORT TABLE OF CONTENTS Busi ne ss Act iv it ie s .................................................. Insi de Fron t Cover Corp orat e Perfo rmanc e vs. the S&P 500 .............................................. 2 Chairman's Let ter*............................................................................... 3 Selected Financial Data For The Past Five Years ............................................................................... 22 Acqu isi tio n Crit eria................................. ............................................. 23 Ind epe nde nt Audit ors ' Report ............................................................... 23 Cons oli dat ed Fina nci al Stat emen ts...................................... .................. 24 Mana geme nt' s Dis cussion..................................................................... 46 Owner's Manual...................................................................................59 Combined Financial Statements — Unaudited — for Ber ksh ire Bus ines s Grou ps ......................................................... 67 Shareholder-Designated Contributions..................................................74 Common Sto ck Data ............................................................................ 76 Directors and Officers of the Company.........................Inside Back Cover *Copyright © 2001 By Warren E. Buffett All Rights Reserved

Welcome message from author
This document is posted to help you gain knowledge. Please leave a comment to let me know what you think about it! Share it to your friends and learn new things together.
Transcript
8/14/2019 Berkshire Hathaway 2000 Annual Report
http://slidepdf.com/reader/full/berkshire-hathaway-2000-annual-report 1/78
BERKSHIRE HATHAWAY INC.
2000 ANNUAL REPORT
TABLE OF CONTENTS
Business Activities .................................................. Inside Front Cover
Corporate Performance vs. the S&P 500 ....................... ....................... 2
Chairman's Letter*................ ........................... ........................... ......... 3
Selected Financial Data For ThePast Five Years ......................... ........................... ........................... 22
Acquisition Criteria................................. ........................... .................. 23
Independent Auditors' Report ........................... ........................... .........23
Consolidated Financial Statements...................................... .................. 24
Management's Discussion............................ ........................... ..............46
Owner's Manual...................................................................................59
Combined Financial Statements — Unaudited —
for Berkshire Business Groups ......................... ........................... .....67
Shareholder-Designated Contributions..................................................74
Common Stock Data .......................... ........................... ....................... 76
Directors and Officers of the Company.........................Inside Back Cover
*Copyright © 2001 By Warren E. Buffett
All Rights Reserved
8/14/2019 Berkshire Hathaway 2000 Annual Report
http://slidepdf.com/reader/full/berkshire-hathaway-2000-annual-report 2/78
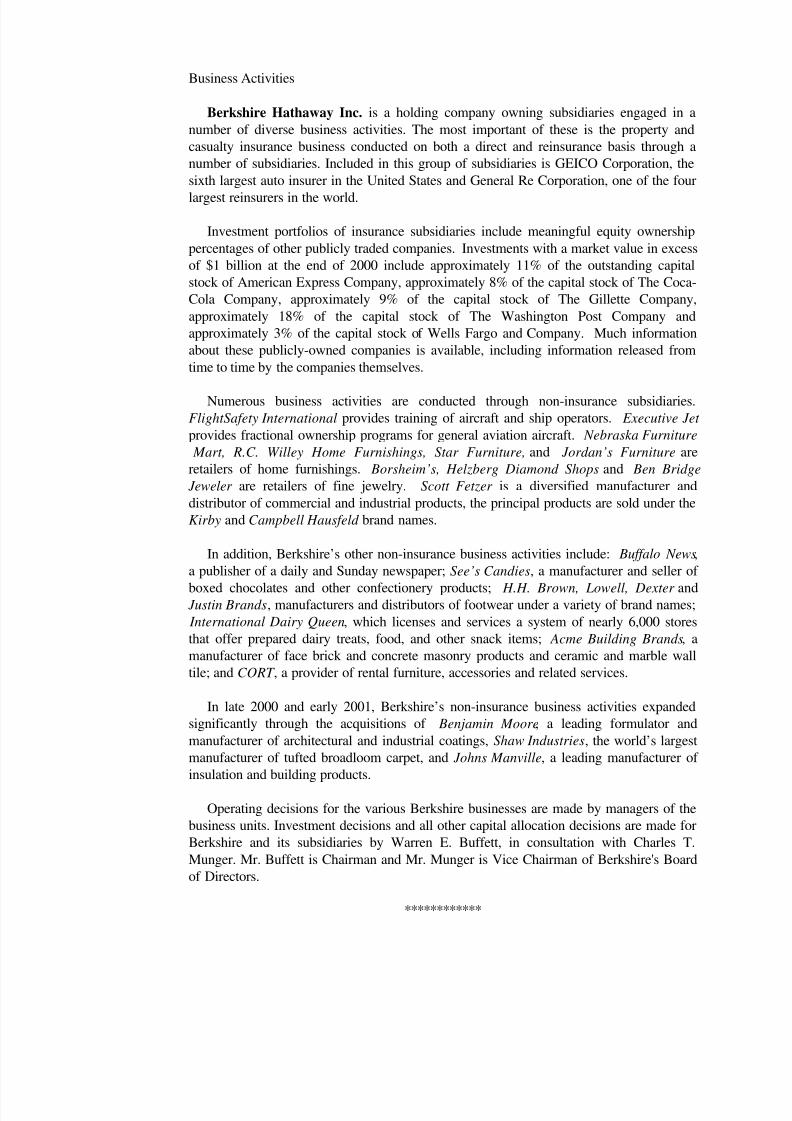
Business Activities
Berkshire Hathaway Inc. is a holding company owning subsidiaries engaged in a
number of diverse business activities. The most important of these is the property and
casualty insurance business conducted on both a direct and reinsurance basis through a
number of subsidiaries. Included in this group of subsidiaries is GEICO Corporation, the
sixth largest auto insurer in the United States and General Re Corporation, one of the four
largest reinsurers in the world.
Investment portfolios of insurance subsidiaries include meaningful equity ownership
percentages of other publicly traded companies. Investments with a market value in excess
of $1 billion at the end of 2000 include approximately 11% of the outstanding capital
stock of American Express Company, approximately 8% of the capital stock of The Coca-
Cola Company, approximately 9% of the capital stock of The Gillette Company,
approximately 18% of the capital stock of The Washington Post Company and
approximately 3% of the capital stock of Wells Fargo and Company. Much information
about these publicly-owned companies is available, including information released from
time to time by the companies themselves.
Numerous business activities are conducted through non-insurance subsidiaries.
FlightSafety International provides training of aircraft and ship operators. Executive Jet
provides fractional ownership programs for general aviation aircraft. Nebraska Furniture
Mart, R.C. Willey Home Furnishings, Star Furniture, and Jordan’s Furniture are
retailers of home furnishings. Borsheim’s, Helzberg Diamond Shops and Ben Bridge
Jeweler are retailers of fine jewelry. Scott Fetzer is a diversified manufacturer and
distributor of commercial and industrial products, the principal products are sold under the
Kirby and Campbell Hausfeld brand names.
In addition, Berkshire’s other non-insurance business activities include: Buffalo News,
a publisher of a daily and Sunday newspaper; See’s Candies, a manufacturer and seller of
boxed chocolates and other confectionery products; H.H. Brown, Lowell, Dexter and Justin Brands, manufacturers and distributors of footwear under a variety of brand names;
International Dairy Queen, which licenses and services a system of nearly 6,000 stores
that offer prepared dairy treats, food, and other snack items; Acme Building Brands, a
manufacturer of face brick and concrete masonry products and ceramic and marble wall
tile; and CORT , a provider of rental furniture, accessories and related services.
In late 2000 and early 2001, Berkshire’s non-insurance business activities expanded
significantly through the acquisitions of Benjamin Moore, a leading formulator and
manufacturer of architectural and industrial coatings, Shaw Industries, the world’s largest
manufacturer of tufted broadloom carpet, and Johns Manville, a leading manufacturer of
insulation and building products.
Operating decisions for the various Berkshire businesses are made by managers of the
business units. Investment decisions and all other capital allocation decisions are made for
Berkshire and its subsidiaries by Warren E. Buffett, in consultation with Charles T.
Munger. Mr. Buffett is Chairman and Mr. Munger is Vice Chairman of Berkshire's Board
of Directors.
************
8/14/2019 Berkshire Hathaway 2000 Annual Report
http://slidepdf.com/reader/full/berkshire-hathaway-2000-annual-report 3/78
2
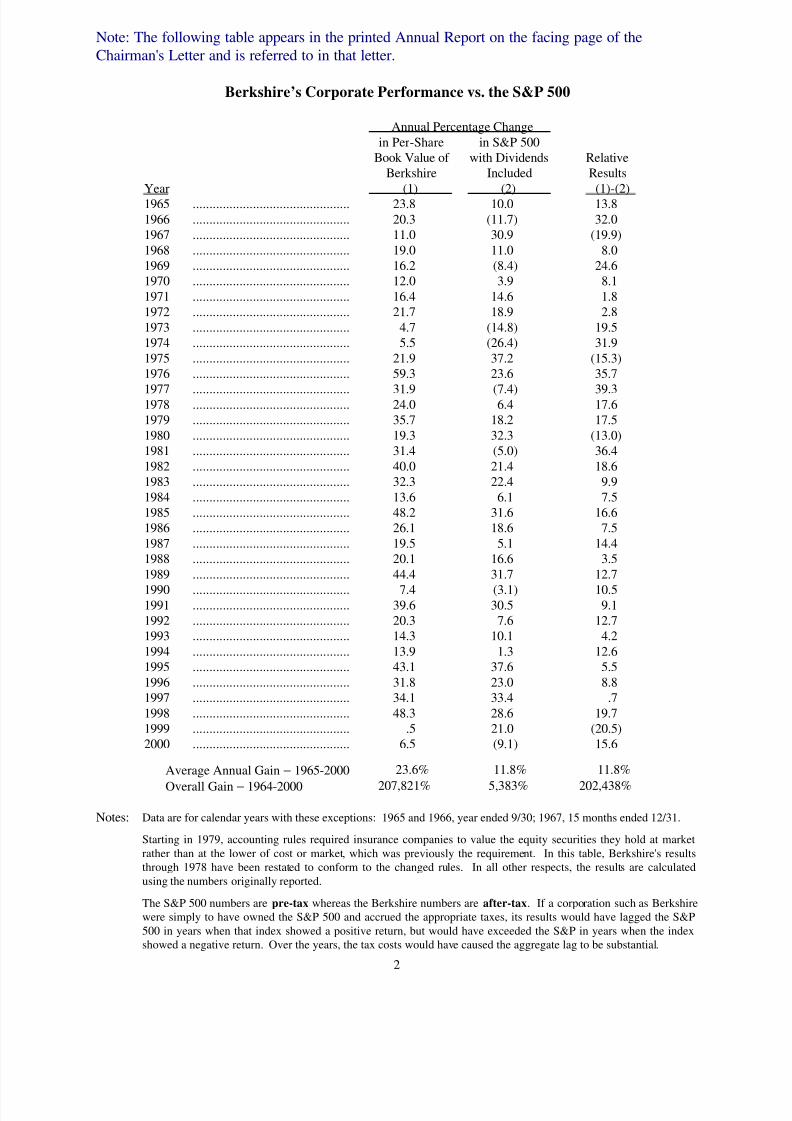
Note: The following table appears in the printed Annual Report on the facing page of theChairman's Letter and is referred to in that letter.
Berkshire’s Corporate Performance vs. the S&P 500
Annual Percentage Change
in Per-Share in S&P 500Book Value of with Dividends Relative
Berkshire Included Results
Year (1) (2) (1)-(2)1965 ............................................... 23.8 10.0 13.8
1966 ............................................... 20.3 (11.7) 32.01967 ............................................... 11.0 30.9 (19.9)
1968 ............................................... 19.0 11.0 8.01969 ............................................... 16.2 (8.4) 24.61970 ............................................... 12.0 3.9 8.1
1971 ............................................... 16.4 14.6 1.81972 ............................................... 21.7 18.9 2.8
1973 ............................................... 4.7 (14.8) 19.51974 ............................................... 5.5 (26.4) 31.9
1975 ............................................... 21.9 37.2 (15.3)1976 ............................................... 59.3 23.6 35.7
1977 ............................................... 31.9 (7.4) 39.31978 ............................................... 24.0 6.4 17.61979 ............................................... 35.7 18.2 17.5
1980 ............................................... 19.3 32.3 (13.0)1981 ............................................... 31.4 (5.0) 36.4
1982 ............................................... 40.0 21.4 18.61983 ............................................... 32.3 22.4 9.9
1984 ............................................... 13.6 6.1 7.51985 ............................................... 48.2 31.6 16.61986 ............................................... 26.1 18.6 7.5
1987 ............................................... 19.5 5.1 14.41988 ............................................... 20.1 16.6 3.5
1989 ............................................... 44.4 31.7 12.7
1990 ............................................... 7.4 (3.1) 10.51991 ............................................... 39.6 30.5 9.11992 ............................................... 20.3 7.6 12.71993 ............................................... 14.3 10.1 4.2
1994 ............................................... 13.9 1.3 12.61995 ............................................... 43.1 37.6 5.5
1996 ............................................... 31.8 23.0 8.81997 ............................................... 34.1 33.4 .7
1998 ............................................... 48.3 28.6 19.71999 ............................................... .5 21.0 (20.5)2000 ............................................... 6.5 (9.1) 15.6
Average Annual Gain − 1965-2000 23.6% 11.8% 11.8%
Overall Gain − 1964-2000 207,821% 5,383% 202,438%
Notes: Data are for calendar years with these exceptions: 1965 and 1966, year ended 9/30; 1967, 15 months ended 12/31.
Starting in 1979, accounting rules required insurance companies to value the equity securities they hold at market
rather than at the lower of cost or market, which was previously the requirement. In this table, Berkshire's resultsthrough 1978 have been restated to conform to the changed rules. In all other respects, the results are calculated
using the numbers originally reported.
The S&P 500 numbers are pre-tax whereas the Berkshire numbers are after-tax. If a corporation such as Berkshirewere simply to have owned the S&P 500 and accrued the appropriate taxes, its results would have lagged the S&P
500 in years when that index showed a positive return, but would have exceeded the S&P in years when the indexshowed a negative return. Over the years, the tax costs would have caused the aggregate lag to be substantial.
8/14/2019 Berkshire Hathaway 2000 Annual Report
http://slidepdf.com/reader/full/berkshire-hathaway-2000-annual-report 4/78
3
BERKSHIRE HATHAWAY INC.
To the Shareholders of Berkshire Hathaway Inc.:
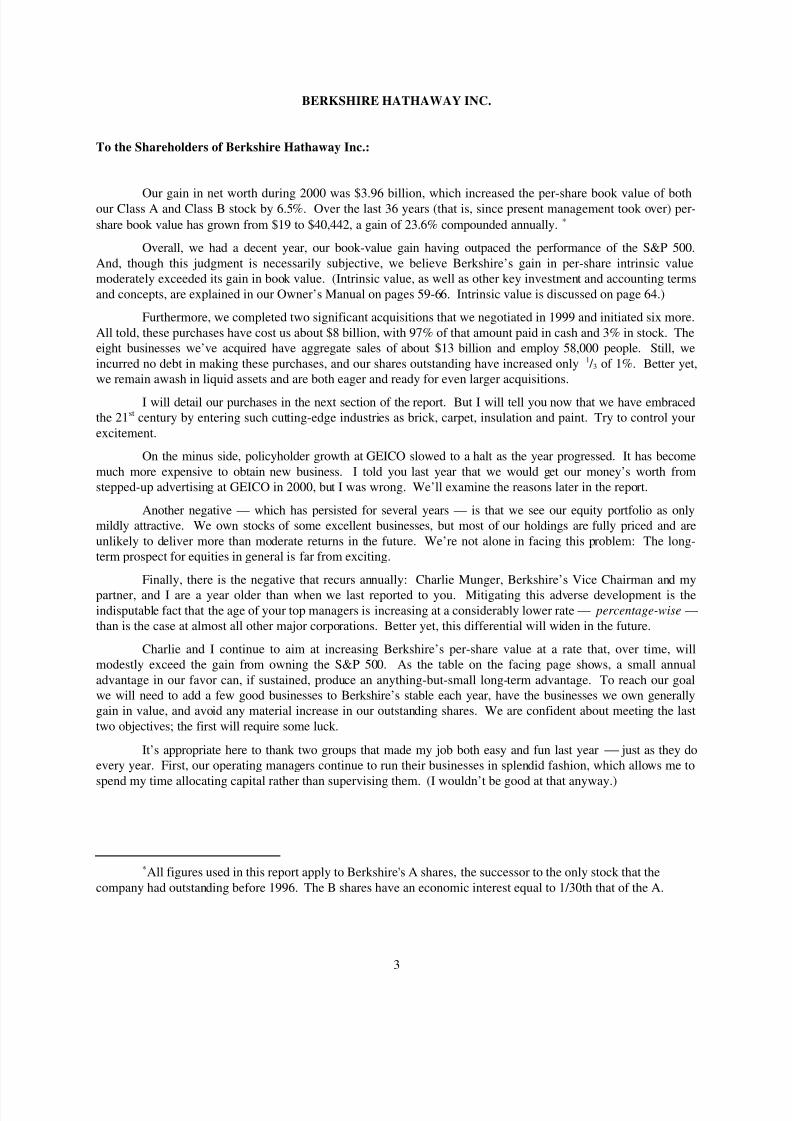
Our gain in net worth during 2000 was $3.96 billion, which increased the per-share book value of bothour Class A and Class B stock by 6.5%. Over the last 36 years (that is, since present management took over) per-
share book value has grown from $19 to $40,442, a gain of 23.6% compounded annually.∗
Overall, we had a decent year, our book-value gain having outpaced the performance of the S&P 500.
And, though this judgment is necessarily subjective, we believe Berkshire’s gain in per-share intrinsic valuemoderately exceeded its gain in book value. (Intrinsic value, as well as other key investment and accounting terms
and concepts, are explained in our Owner’s Manual on pages 59-66. Intrinsic value is discussed on page 64.)
Furthermore, we completed two significant acquisitions that we negotiated in 1999 and initiated six more.
All told, these purchases have cost us about $8 billion, with 97% of that amount paid in cash and 3% in stock. Theeight businesses we’ve acquired have aggregate sales of about $13 billion and employ 58,000 people. Still, we
incurred no debt in making these purchases, and our shares outstanding have increased only 1 / 3 of 1%. Better yet,we remain awash in liquid assets and are both eager and ready for even larger acquisitions.
I will detail our purchases in the next section of the report. But I will tell you now that we have embracedthe 21st century by entering such cutting-edge industries as brick, carpet, insulation and paint. Try to control your
excitement.
On the minus side, policyholder growth at GEICO slowed to a halt as the year progressed. It has become
much more expensive to obtain new business. I told you last year that we would get our money’s worth fromstepped-up advertising at GEICO in 2000, but I was wrong. We’ll examine the reasons later in the report.
Another negative — which has persisted for several years — is that we see our equity portfolio as onlymildly attractive. We own stocks of some excellent businesses, but most of our holdings are fully priced and are
unlikely to deliver more than moderate returns in the future. We’re not alone in facing this problem: The long-term prospect for equities in general is far from exciting.
Finally, there is the negative that recurs annually: Charlie Munger, Berkshire’s Vice Chairman and mypartner, and I are a year older than when we last reported to you. Mitigating this adverse development is the
indisputable fact that the age of your top managers is increasing at a considerably lower rate — percentage-wise —than is the case at almost all other major corporations. Better yet, this differential will widen in the future.
Charlie and I continue to aim at increasing Berkshire’s per-share value at a rate that, over time, willmodestly exceed the gain from owning the S&P 500. As the table on the facing page shows, a small annual
advantage in our favor can, if sustained, produce an anything-but-small long-term advantage. To reach our goalwe will need to add a few good businesses to Berkshire’s stable each year, have the businesses we own generallygain in value, and avoid any material increase in our outstanding shares. We are confident about meeting the last
two objectives; the first will require some luck.
It’s appropriate here to thank two groups that made my job both easy and fun last year just as they doevery year. First, our operating managers continue to run their businesses in splendid fashion, which allows me to
spend my time allocating capital rather than supervising them. (I wouldn’t be good at that anyway.)
∗All figures used in this report apply to Berkshire's A shares, the successor to the only stock that the
company had outstanding before 1996. The B shares have an economic interest equal to 1/30th that of the A.
8/14/2019 Berkshire Hathaway 2000 Annual Report
http://slidepdf.com/reader/full/berkshire-hathaway-2000-annual-report 5/78
4
Our managers are a very special breed. At most large companies, the truly talented divisional managersseldom have the job they really want. Instead they yearn to become CEOs, either at their present employer or
elsewhere. Indeed, if they stay put, they and their colleagues are likely to feel they have failed.
At Berkshire, our all-stars have exactly the jobs they want, ones that they hope and expect to keep
throughout their business lifetimes. They therefore concentrate solely on maximizing the long-term value of thebusinesses that they “own” and love. If the businesses succeed, they have succeeded. And they stick with us: In
our last 36 years, Berkshire has never had a manager of a significant subsidiary voluntarily leave to join anotherbusiness.
The other group to which I owe enormous thanks is the home-office staff. After the eight acquisitionsmore than doubled our worldwide workforce to about 112,000, Charlie and I went soft last year and added one
more person at headquarters. (Charlie, bless him, never lets me forget Ben Franklin’s advice: “A small leak cansink a great ship.”) Now we have 13.8 people.
This tiny band works miracles. In 2000 it handled all of the details connected with our eight acquisitions,processed extensive regulatory and tax filings (our tax return covers 4,896 pages), smoothly produced an annual
meeting to which 25,000 tickets were issued, and accurately dispensed checks to 3,660 charities designated by ourshareholders. In addition, the group dealt with all the routine tasks served up by a company with a revenue run-rate of $40 billion and more than 300,000 owners. And, to add to all of this, the other 12.8 are a delight to be
around.I should pay to have my job.
Acquisitions of 2000
Our acquisition technique at Berkshire is simplicity itself: We answer the phone. I’m also glad to reportthat it rings a bit more often now, because owners and/or managers increasingly wish to join their companies with
Berkshire. Our acquisition criteria are set forth on page 23, and the number to call is 402-346-1400.
Let me tell you a bit about the businesses we have purchased during the past 14 months, starting with the
two transactions that were initiated in 1999, but closed in 2000. (This list excludes some smaller purchases thatwere made by the managers of our subsidiaries and that, in most cases, will be integrated into their operations.)
• I described the first purchase — 76% of MidAmerican Energy — in last year’s report. Because
of regulatory constraints on our voting privileges, we perform only a “one-line” consolidation of MidAmerican’s earnings and equity in our financial statements. If we instead fully consolidated
the company’s figures, our revenues in 2000 would have been $5 billion greater than wereported, though net income would remain the same.
• On November 23, 1999, I received a one-page fax from Bruce Cort that appended a Washington
Post article describing an aborted buyout of CORT Business Services. Despite his name, Brucehas no connection with CORT. Rather, he is an airplane broker who had sold Berkshire a jet in1986 and who, before the fax, had not been in touch with me for about ten years.
I knew nothing about CORT, but I immediately printed out its SEC filings and liked what I saw.
That same day I told Bruce I had a possible interest and asked him to arrange a meeting withPaul Arnold, CORT’s CEO. Paul and I got together on November 29, and I knew at once that wehad the right ingredients for a purchase: a fine though unglamorous business, an outstanding
manager, and a price (going by that on the failed deal) that made sense.
Operating out of 117 showrooms, CORT is the national leader in “rent-to-rent” furniture,primarily used in offices but also by temporary occupants of apartments. This business, it shouldbe noted, has no similarity to “rent-to-own” operations, which usually involve the sale of home
furnishings and electronics to people having limited income and poor credit.
8/14/2019 Berkshire Hathaway 2000 Annual Report
http://slidepdf.com/reader/full/berkshire-hathaway-2000-annual-report 6/78
5
We quickly purchased CORT for Wesco, our 80%-owned subsidiary, paying about $386 millionin cash. You will find more details about CORT’s operations in Wesco’s 1999 and 2000 annual
reports. Both Charlie and I enjoy working with Paul, and CORT looks like a good bet to beat ouroriginal expectations.
• Early last year, Ron Ferguson of General Re put me in contact with Bob Berry, whose family had
owned U.S. Liability for 49 years. This insurer, along with two sister companies, is a medium-sized, highly-respected writer of unusual risks — “excess and surplus lines” in insurance jargon.After Bob and I got in touch, we agreed by phone on a half-stock, half-cash deal.
In recent years, Tom Nerney has managed the operation for the Berry family and has achieved arare combination of excellent growth and unusual profitability. Tom is a powerhouse in other
ways as well. In addition to having four adopted children (two from Russia), he has an extendedfamily: the Philadelphia Belles, a young-teen girls basketball team that Tom coaches. The team
had a 62-4 record last year and finished second in the AAU national tournament.
Few property-casualty companies are outstanding businesses. We have far more than our share,
and U.S. Liability adds luster to the collection.
• Ben Bridge Jeweler was another purchase we made by phone, prior to any face-to-face meetingbetween me and the management. Ed Bridge, who with his cousin, Jon, manages this 65-store
West Coast retailer, is a friend of Barnett Helzberg, from whom we bought Helzberg Diamondsin 1995. Upon learning that the Bridge family proposed to sell its company, Barnett gave
Berkshire a strong recommendation. Ed then called and explained his business to me, alsosending some figures, and we made a deal, again half for cash and half for stock.
Ed and Jon are fourth generation owner-managers of a business started 89 years ago in Seattle.Both the business and the family— including Herb and Bob, the fathers of Jon and Ed — enjoy
extraordinary reputations. Same-store sales have increased by 9%, 11%, 13%, 10%, 12%, 21%and 7% over the past seven years, a truly remarkable record.
It was vital to the family that the company operate in the future as in the past. No one wantedanother jewelry chain to come in and decimate the organization with ideas about synergy and
cost saving (which, though they would never work, were certain to be tried). I told Ed and Jonthat they would be in charge, and they knew I could be believed: After all, it’s obvious that yourChairman would be a disaster at actually running a store or selling jewelry (though there are
members of his family who have earned black belts as purchasers).
In their typically classy way, the Bridges allocated a substantial portion of the proceeds from theirsale to the hundreds of co-workers who had helped the company achieve its success. We’reproud to be associated with both the family and the company.
• In July we acquired Justin Industries, the leading maker of Western boots — including the
Justin, Tony Lama, Nocona, and Chippewa brands and the premier producer of brick in Texasand five neighboring states.
Here again, our acquisition involved serendipity. On May 4th, I received a fax from Mark Jones,a stranger to me, proposing that Berkshire join a group to acquire an unnamed company. I faxed
him back, explaining that with rare exceptions we don’t invest with others, but would happily
pay him a commission if he sent details and we later made a purchase. He replied that the“mystery company” was Justin. I then went to Fort Worth to meet John Roach, chairman of the
company and John Justin, who had built the business and was its major shareholder. Soon after,we bought Justin for $570 million in cash.
John Justin loved Justin Industries but had been forced to retire because of severe health problems
(which sadly led to his death in late February). John was a class act as a citizen, businessmanand human being. Fortunately, he had groomed two outstanding managers, Harrold Melton at
Acme and Randy Watson at Justin Boot, each of whom runs his company autonomously.
8/14/2019 Berkshire Hathaway 2000 Annual Report
http://slidepdf.com/reader/full/berkshire-hathaway-2000-annual-report 7/78
8/14/2019 Berkshire Hathaway 2000 Annual Report
http://slidepdf.com/reader/full/berkshire-hathaway-2000-annual-report 8/78
7
Consequently, the deal was called off on Friday, December 8th. The following Monday, Charlieand I called Bob Felise, chairman of the trust, and made an all-cash offer with no financing
contingencies. The next day the trustees voted tentatively to accept our offer, and a week later wesigned a contract.
JM is the nation’s leading producer of commercial and industrial insulation and also has majorpositions in roofing systems and a variety of engineered products. The company’s sales exceed
$2 billion and the business has earned good, if cyclical, returns. Jerry Henry, JM’s CEO, hadannounced his retirement plans a year ago, but I’m happy to report that Charlie and I haveconvinced him to stick around.
* * * * * * * * * * * *
Two economic factors probably contributed to the rush of acquisition activity we experienced last year.
First, many managers and owners foresaw near-term slowdowns in their businesses and, in fact, we purchasedseveral companies whose earnings will almost certainly decline this year from peaks they reached in 1999 or 2000.
The declines make no difference to us, given that we expect all of our businesses to now and then have ups anddowns. (Only in the sales presentations of investment banks do earnings move forever upward.) We don’t careabout the bumps; what matters are the overall results. But the decisions of other people are sometimes affected by
the near-term outlook, which can both spur sellers and temper the enthusiasm of purchasers who might otherwise
compete with us.A second factor that helped us in 2000 was that the market for junk bonds dried up as the year progressed.
In the two preceding years, junk bond purchasers had relaxed their standards, buying the obligations of ever-
weaker issuers at inappropriate prices. The effects of this laxity were felt last year in a ballooning of defaults. In
this environment, “financial” buyers of businesses those who wish to buy using only a sliver of equity
became unable to borrow all they thought they needed. What they could still borrow, moreover, came at a high
price. Consequently, LBO operators became less aggressive in their bidding when businesses came up for sale lastyear. Because we analyze purchases on an all-equity basis, our evaluations did not change, which means we
became considerably more competitive.
Aside from the economic factors that benefited us, we now enjoy a major and growing advantage in
making acquisitions in that we are often the buyer of choice for the seller. That fact, of course, doesn’t assure a
deal sellers have to like our price, and we have to like their business and management but it does help.
We find it meaningful when an owner cares about whom he sells to. We like to do business with someone
who loves his company, not just the money that a sale will bring him (though we certainly understand why he likesthat as well). When this emotional attachment exists, it signals that important qualities will likely be found within
the business: honest accounting, pride of product, respect for customers, and a loyal group of associates having astrong sense of direction. The reverse is apt to be true, also. When an owner auctions off his business, exhibiting atotal lack of interest in what follows, you will frequently find that it has been dressed up for sale, particularly when
the seller is a “financial owner.” And if owners behave with little regard for their business and its people, theirconduct will often contaminate attitudes and practices throughout the company.
When a business masterpiece has been created by a lifetime — or several lifetimes — of unstinting careand exceptional talent, it should be important to the owner what corporation is entrusted to carry on its history.
Charlie and I believe Berkshire provides an almost unique home. We take our obligations to the people whocreated a business very seriously, and Berkshire’s ownership structure ensures that we can fulfill our promises.
When we tell John Justin that his business will remain headquartered in Fort Worth, or assure the Bridge familythat its operation will not be merged with another jeweler, these sellers can take those promises to the bank.
How much better it is for the “painter” of a business Rembrandt to personally select its permanent homethan to have a trust officer or uninterested heirs auction it off. Throughout the years we have had great experiences
with those who recognize that truth and apply it to their business creations. We’ll leave the auctions to others.
8/14/2019 Berkshire Hathaway 2000 Annual Report
http://slidepdf.com/reader/full/berkshire-hathaway-2000-annual-report 9/78
8
The Economics of Property/Casualty Insurance
Our main business — though we have others of great importance — is insurance. To understand
Berkshire, therefore, it is necessary that you understand how to evaluate an insurance company. The keydeterminants are: (1) the amount of float that the business generates; (2) its cost; and (3) most critical of all, the
long-term outlook for both of these factors.
To begin with, float is money we hold but don't own. In an insurance operation, float arises becausepremiums are received before losses are paid, an interval that sometimes extends over many years. During thattime, the insurer invests the money. This pleasant activity typically carries with it a downside: The premiums that
an insurer takes in usually do not cover the losses and expenses it eventually must pay. That leaves it running an"underwriting loss," which is the cost of float. An insurance business has value if its cost of float over time is less
than the cost the company would otherwise incur to obtain funds. But the business is a lemon if its cost of float ishigher than market rates for money.
A caution is appropriate here: Because loss costs must be estimated, insurers have enormous latitude infiguring their underwriting results, and that makes it very difficult for investors to calculate a company's true cost
of float. Errors of estimation, usually innocent but sometimes not, can be huge. The consequences of thesemiscalculations flow directly into earnings. An experienced observer can usually detect large-scale errors inreserving, but the general public can typically do no more than accept what's presented, and at times I have been
amazed by the numbers that big-name auditors have implicitly blessed. Both the income statements and balancesheets of insurers can be minefields.
At Berkshire, we strive to be both consistent and conservative in our reserving. But we will makemistakes. And we warn you that there is nothing symmetrical about surprises in the insurance business: They
almost always are unpleasant.
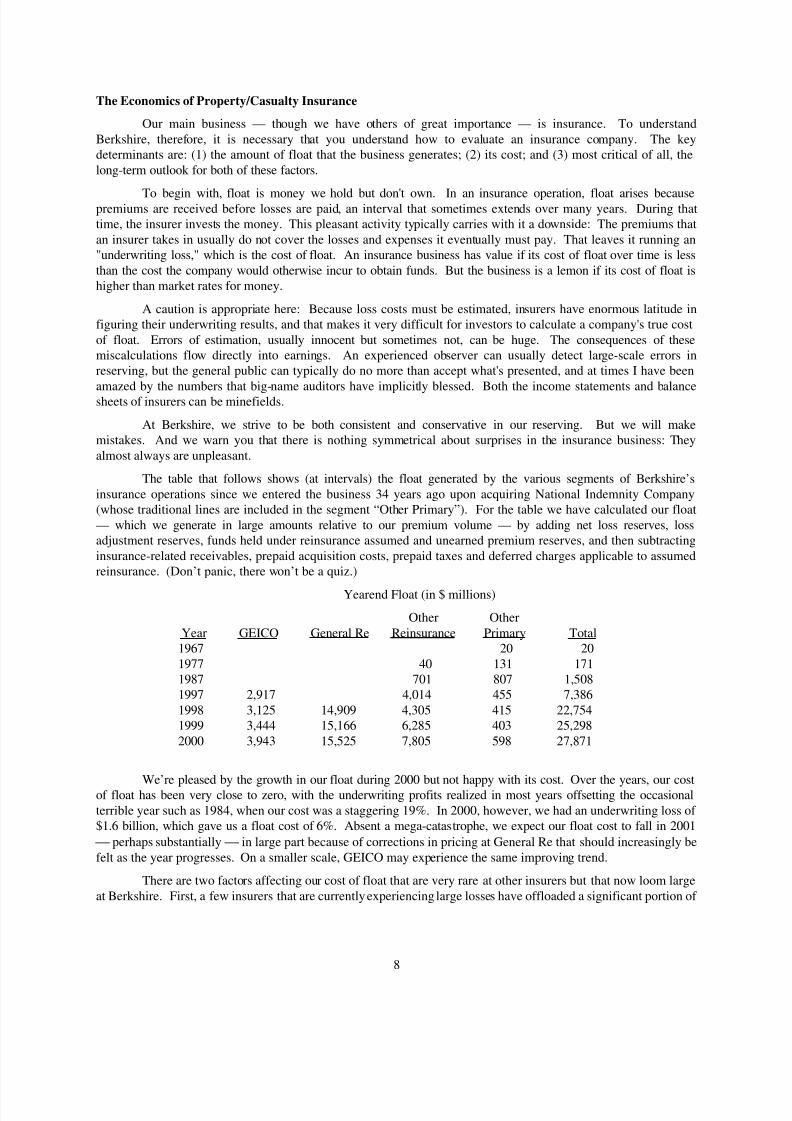
The table that follows shows (at intervals) the float generated by the various segments of Berkshire’s
insurance operations since we entered the business 34 years ago upon acquiring National Indemnity Company(whose traditional lines are included in the segment “Other Primary”). For the table we have calculated our float
— which we generate in large amounts relative to our premium volume — by adding net loss reserves, lossadjustment reserves, funds held under reinsurance assumed and unearned premium reserves, and then subtracting
insurance-related receivables, prepaid acquisition costs, prepaid taxes and deferred charges applicable to assumedreinsurance. (Don’t panic, there won’t be a quiz.)
Yearend Float (in $ millions)
Other Other
Year GEICO General Re Reinsurance Primary Total1967 20 20
1977 40 131 1711987 701 807 1,5081997 2,917 4,014 455 7,386
1998 3,125 14,909 4,305 415 22,7541999 3,444 15,166 6,285 403 25,298
2000 3,943 15,525 7,805 598 27,871
We’re pleased by the growth in our float during 2000 but not happy with its cost. Over the years, our costof float has been very close to zero, with the underwriting profits realized in most years offsetting the occasional
terrible year such as 1984, when our cost was a staggering 19%. In 2000, however, we had an underwriting loss of $1.6 billion, which gave us a float cost of 6%. Absent a mega-catastrophe, we expect our float cost to fall in 2001
perhaps substantially in large part because of corrections in pricing at General Re that should increasingly be
felt as the year progresses. On a smaller scale, GEICO may experience the same improving trend.
There are two factors affecting our cost of float that are very rare at other insurers but that now loom large
at Berkshire. First, a few insurers that are currently experiencing large losses have offloaded a significant portion of
8/14/2019 Berkshire Hathaway 2000 Annual Report
http://slidepdf.com/reader/full/berkshire-hathaway-2000-annual-report 10/78
9
these on us in a manner that penalizes our current earnings but gives us float we can use for many years to come.After the loss that we incur in the first year of the policy, there are no further costs attached to this business.
When these policies are properly priced, we welcome the pain-today, gain-tomorrow effects they have. In1999, $400 million of our underwriting loss (about 27.8% of the total) came from business of this kind and in 2000
the figure was $482 million (34.4% of our loss). We have no way of predicting how much similar business we willwrite in the future, but what we do get will typically be in large chunks. Because these transactions can materially
distort our figures, we will tell you about them as they occur.
Other reinsurers have little taste for this insurance. They simply can’t stomach what huge underwriting
losses do to their reported results, even though these losses are produced by policies whose overall economics arecertain to be favorable. You should be careful, therefore, in comparing our underwriting results with those of other
insurers.
An even more significant item in our numbers — which, again, you won’t find much of elsewhere —
arises from transactions in which we assume past losses of a company that wants to put its troubles behind it. Toillustrate, the XYZ insurance company might have last year bought a policy obligating us to pay the first $1 billion
of losses and loss adjustment expenses from events that happened in, say, 1995 and earlier years. These contractscan be very large, though we always require a cap on our exposure. We entered into a number of such transactionsin 2000 and expect to close several more in 2001.
Under GAAP accounting, this “retroactive” insurance neither benefits nor penalizes our current earnings.Instead, we set up an asset called “deferred charges applicable to assumed reinsurance,” in an amount reflecting
the difference between the premium we receive and the (higher) losses we expect to pay (for which reserves areimmediately established). We then amortize this asset by making annual charges to earnings that create equivalent
underwriting losses. You will find the amount of the loss that we incur from these transactions in both ourquarterly and annual management discussion. By their nature, these losses will continue for many years, often
stretching into decades. As an offset, though, we have the use of float lots of it.
Clearly, float carrying an annual cost of this kind is not as desirable as float we generate from policies thatare expected to produce an underwriting profit (of which we have plenty). Nevertheless, this retroactive insurance
should be decent business for us.
The net of all this is that a) I expect our cost of float to be very attractive in the future but b) rarely to
return to a “no-cost” mode because of the annual charge that retroactive reinsurance will lay on us. Also —
obviously the ultimate benefits that we derive from float will depend not only on its cost but, fully as important,how effectively we deploy it.
Our retroactive business is almost single-handedly the work of Ajit Jain, whose praises I sing annually. Itis impossible to overstate how valuable Ajit is to Berkshire. Don’t worry about my health; worry about his.
Last year, Ajit brought home a $2.4 billion reinsurance premium, perhaps the largest in history, from apolicy that retroactively covers a major U.K. company. Subsequently, he wrote a large policy protecting the Texas
Rangers from the possibility that Alex Rodriguez will become permanently disabled. As sports fans know, “A-Rod”was signed for $252 million, a record, and we think that our policy probably also set a record for disability
insurance. We cover many other sports figures as well.
In another example of his versatility, Ajit last fall negotiated a very interesting deal with Grab.com, an
Internet company whose goal was to attract millions of people to its site and there to extract information from them
that would be useful to marketers. To lure these people, Grab.com held out the possibility of a $1 billion prize(having a $170 million present value) and we insured its payment. A message on the site explained that thechance of anyone winning the prize was low, and indeed no one won. But the possibility of a win was far from nil.
Writing such a policy, we receive a modest premium, face the possibility of a huge loss, and get goododds. Very few insurers like that equation. And they’re unable to cure their unhappiness by reinsurance. Because
each policy has unusual and sometimes unique characteristics, insurers can’t lay off the occasional shock loss
8/14/2019 Berkshire Hathaway 2000 Annual Report
http://slidepdf.com/reader/full/berkshire-hathaway-2000-annual-report 11/78
10
through their standard reinsurance arrangements. Therefore, any insurance CEO doing a piece of business like thismust run the small, but real, risk of a horrible quarterly earnings number, one that he would not enjoy explaining to
his board or shareholders. Charlie and I, however, like any proposition that makes compelling mathematical sense,regardless of its effect on reported earnings.
At General Re, the news has turned considerably better: Ron Ferguson, along with Joe Brandon, TadMontross, and a talented supporting cast took many actions during 2000 to bring that company’s profitability back
to past standards. Though our pricing is not fully corrected, we have significantly repriced business that wasseverely unprofitable or dropped it altogether. If there’s no mega-catastrophe in 2001, General Re’s float costshould fall materially.
The last couple of years haven’t been any fun for Ron and his crew. But they have stepped up to tough
decisions, and Charlie and I applaud them for these. General Re has several important and enduring businessadvantages. Better yet, it has managers who will make the most of them.
In aggregate, our smaller insurance operations produced an excellent underwriting profit in 2000 whilegenerating significant float — just as they have done for more than a decade. If these companies were a single and
separate operation, people would consider it an outstanding insurer. Because the companies instead reside in anenterprise as large as Berkshire, the world may not appreciate their accomplishments — but I sure do. Last year Ithanked Rod Eldred, John Kizer, Don Towle and Don Wurster, and I again do so. In addition, we now also owe
thanks to Tom Nerney at U.S. Liability and Michael Stearns, the new head of Cypress.You may notice that Brad Kinstler, who was CEO of Cypress and whose praises I’ve sung in the past, is no
longer in the list above. That’s because we needed a new manager at Fechheimer Bros., our Cincinnati-baseduniform company, and called on Brad. We seldom move Berkshire managers from one enterprise to another, but
maybe we should try it more often: Brad is hitting home runs in his new job, just as he always did at Cypress.
GEICO (1-800-847-7536 or GEICO.com)
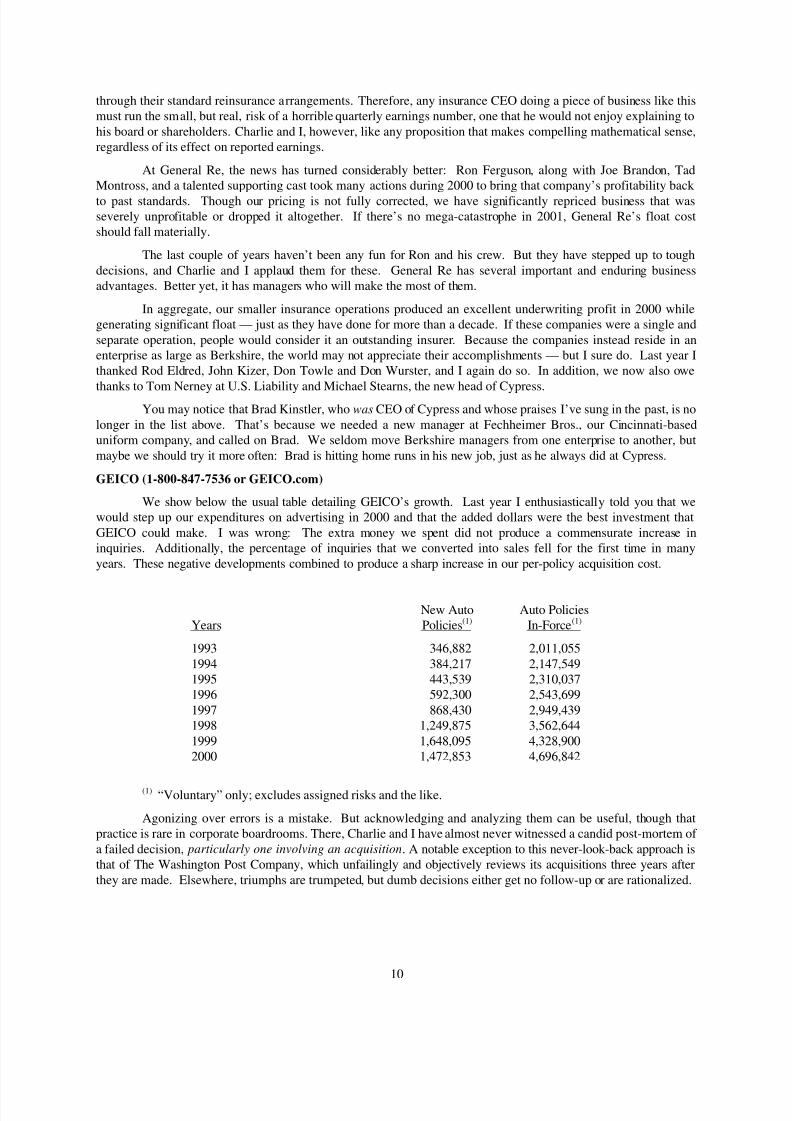
We show below the usual table detailing GEICO’s growth. Last year I enthusiastically told you that wewould step up our expenditures on advertising in 2000 and that the added dollars were the best investment that
GEICO could make. I was wrong: The extra money we spent did not produce a commensurate increase ininquiries. Additionally, the percentage of inquiries that we converted into sales fell for the first time in many
years. These negative developments combined to produce a sharp increase in our per-policy acquisition cost.
New Auto Auto PoliciesYears Policies(1) In-Force(1)
1993 346,882 2,011,055
1994 384,217 2,147,5491995 443,539 2,310,0371996 592,300 2,543,699
1997 868,430 2,949,4391998 1,249,875 3,562,644
1999 1,648,095 4,328,9002000 1,472,853 4,696,842
(1) “Voluntary” only; excludes assigned risks and the like.
Agonizing over errors is a mistake. But acknowledging and analyzing them can be useful, though thatpractice is rare in corporate boardrooms. There, Charlie and I have almost never witnessed a candid post-mortem of
a failed decision, particularly one involving an acquisition. A notable exception to this never-look-back approach isthat of The Washington Post Company, which unfailingly and objectively reviews its acquisitions three years after
they are made. Elsewhere, triumphs are trumpeted, but dumb decisions either get no follow-up or are rationalized.
8/14/2019 Berkshire Hathaway 2000 Annual Report
http://slidepdf.com/reader/full/berkshire-hathaway-2000-annual-report 12/78
11
The financial consequences of these boners are regularly dumped into massive restructuring charges orwrite-offs that are casually waved off as “nonrecurring.” Managements just love these. Indeed, in recent years it
has seemed that no earnings statement is complete without them. The origins of these charges, though, are neverexplored. When it comes to corporate blunders, CEOs invoke the concept of the Virgin Birth.
To get back to our examination of GEICO: There are at least four factors that could account for theincreased costs we experienced in obtaining new business last year, and all probably contributed in some manner.
First, in our advertising we have pushed “frequency” very hard, and we probably overstepped in certainmedia. We’ve always known that increasing the number of messages through any medium would eventually
produce diminishing returns. The third ad in an hour on a given cable channel is simply not going to be as effectiveas the first.
Second, we may have already picked much of the low-hanging fruit. Clearly, the willingness to dobusiness with a direct marketer of insurance varies widely among individuals: Indeed, some percentage of
Americans particularly older ones are reluctant to make direct purchases of any kind. Over the years,
however, this reluctance will ebb. A new generation with new habits will find the savings from direct purchase of their auto insurance too compelling to ignore.
Another factor that surely decreased the conversion of inquiries into sales was stricter underwriting byGEICO. Both the frequency and severity of losses increased during the year, and rates in certain areas became
inadequate, in some cases substantially so. In these instances, we necessarily tightened our underwriting standards.This tightening, as well as the many rate increases we put in during the year, made our offerings less attractive tosome prospects.
A high percentage of callers, it should be emphasized, can still save money by insuring with us.
Understandably, however, some prospects will switch to save $200 per year but will not switch to save $50.Therefore, rate increases that bring our prices closer to those of our competitors will hurt our acceptance rate, evenwhen we continue to offer the best deal.
Finally, the competitive picture changed in at least one important respect: State Farm by far the largestpersonal auto insurer, with about 19% of the market — has been very slow to raise prices. Its costs, however, areclearly increasing right along with those of the rest of the industry. Consequently, State Farm had an underwriting
loss last year from auto insurance (including rebates to policyholders) of 18% of premiums, compared to 4% atGEICO. Our loss produced a float cost for us of 6.1%, an unsatisfactory result. (Indeed, at GEICO we expect float,
over time, to be free.) But we estimate that State Farm’s float cost in 2000 was about 23%. The willingness of thelargest player in the industry to tolerate such a cost makes the economics difficult for other participants.
That does not take away from the fact that State Farm is one of America’s greatest business stories. I’veurged that the company be studied at business schools because it has achieved fabulous success while following a
path that in many ways defies the dogma of those institutions. Studying counter-evidence is a highly useful activity,though not one always greeted with enthusiasm at citadels of learning.
State Farm was launched in 1922, by a 45-year-old, semi-retired Illinois farmer, to compete with long-
established insurers haughty institutions in New York, Philadelphia and Hartford that possessedoverwhelming advantages in capital, reputation, and distribution. Because State Farm is a mutual company, its
board members and managers could not be owners, and it had no access to capital markets during its years of fastgrowth. Similarly, the business never had the stock options or lavish salaries that many people think vital if an
American enterprise is to attract able managers and thrive.In the end, however, State Farm eclipsed all its competitors. In fact, by 1999 the company had amassed a
tangible net worth exceeding that of all but four American businesses. If you want to read how this happened, get acopy of The Farmer from Merna.
8/14/2019 Berkshire Hathaway 2000 Annual Report
http://slidepdf.com/reader/full/berkshire-hathaway-2000-annual-report 13/78
12
Despite State Farm’s strengths, however, GEICO has much the better business model, one that embodiessignificantly lower operating costs. And, when a company is selling a product with commodity-like economic
characteristics, being the low-cost producer is all-important. This enduring competitive advantage of GEICO
one it possessed in 1951 when, as a 20-year-old student, I first became enamored with its stock is the reason that
over time it will inevitably increase its market share significantly while simultaneously achieving excellent profits.Our growth will be slow, however, if State Farm elects to continue bearing the underwriting losses that it is now
suffering.
Tony Nicely, GEICO’s CEO, remains an owner’s dream. Everything he does makes sense. He never
engages in wishful thinking or otherwise distorts reality, as so many managers do when the unexpected happens. As2000 unfolded, Tony cut back on advertising that was not cost-effective, and he will continue to do that in 2001 if cutbacks are called for (though we will always maintain a massive media presence). Tony has also aggressively
filed for price increases where we need them. He looks at the loss reports every day and is never behind the curve.To steal a line from a competitor, we are in good hands with Tony.
I’ve told you about our profit-sharing arrangement at GEICO that targets only two variables — growth inpolicies and the underwriting results of seasoned business. Despite the headwinds of 2000, we still had a
performance that produced an 8.8% profit-sharing payment, amounting to $40.7 million.
GEICO will be a huge part of Berkshire’s future. Because of its rock-bottom operating costs, it offers a
great many Americans the cheapest way to purchase a high-ticket product that they must buy. The company thencouples this bargain with service that consistently ranks high in independent surveys. That’s a combination
inevitably producing growth and profitability.
In just the last few years, far more drivers have learned to associate the GEICO brand with saving money
on their insurance. We will pound that theme relentlessly until all Americans are aware of the value that we offer.
Investments
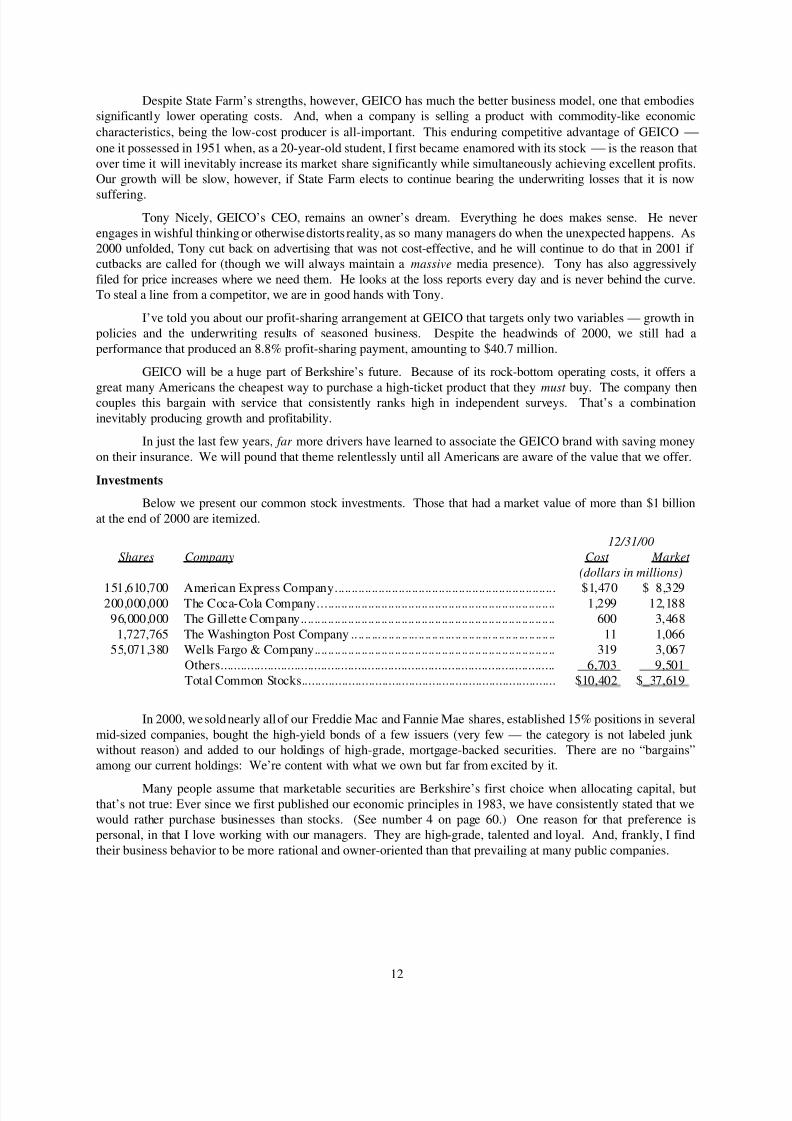
Below we present our common stock investments. Those that had a market value of more than $1 billion
at the end of 2000 are itemized.
12/31/00
Shares Company Cost Market
(dollars in millions)
151,610,700 American Express Company.................................................................. $1,470 $ 8,329200,000,000 The Coca-Cola Company....................................................................... 1,299 12,18896,000,000 The Gillette Company............................................................................ 600 3,468
1,727,765 The Washington Post Company .... .. ... .. .. .. .. ... .. .. .. .. ... .. .. .. .. ... .. .. .. .. ... .. .. .. .. 11 1,06655,071,380 Wells Fargo & Company........................................................................ 319 3,067
Others.................................................................................................... 6,703 9,501Total Common Stocks............................................................................ $10,402 $_37,619
In 2000, we sold nearly all of our Freddie Mac and Fannie Mae shares, established 15% positions in several
mid-sized companies, bought the high-yield bonds of a few issuers (very few — the category is not labeled junk without reason) and added to our holdings of high-grade, mortgage-backed securities. There are no “bargains”among our current holdings: We’re content with what we own but far from excited by it.
Many people assume that marketable securities are Berkshire’s first choice when allocating capital, butthat’s not true: Ever since we first published our economic principles in 1983, we have consistently stated that wewould rather purchase businesses than stocks. (See number 4 on page 60.) One reason for that preference ispersonal, in that I love working with our managers. They are high-grade, talented and loyal. And, frankly, I find
their business behavior to be more rational and owner-oriented than that prevailing at many public companies.
8/14/2019 Berkshire Hathaway 2000 Annual Report
http://slidepdf.com/reader/full/berkshire-hathaway-2000-annual-report 14/78
13
But there’s also a powerful financial reason behind the preference, and that has to do with taxes. The taxcode makes Berkshire’s owning 80% or more of a business far more profitable for us, proportionately, than our
owning a smaller share. When a company we own all of earns $1 million after tax, the entire amount inures to ourbenefit. If the $1 million is upstreamed to Berkshire, we owe no tax on the dividend. And, if the earnings are
retained and we were to sell the subsidiary not likely at Berkshire! for $1million more than we paid for it, we
would owe no capital gains tax. That’s because our “tax cost” upon sale would include both what we paid for the
business and all earnings it subsequently retained.Contrast that situation to what happens when we own an investment in a marketable security. There, if we
own a 10% stake in a business earning $10 million after tax, our $1 million share of the earnings is subject toadditional state and federal taxes of (1) about $140,000 if it is distributed to us (our tax rate on most dividends is
14%); or (2) no less than $350,000 if the $1 million is retained and subsequently captured by us in the form of acapital gain (on which our tax rate is usually about 35%, though it sometimes approaches 40%). We may defer
paying the $350,000 by not immediately realizing our gain, but eventually we must pay the tax. In effect, thegovernment is our “partner” twice when we own part of a business through a stock investment, but only once when
we own at least 80%.
Leaving aside tax factors, the formula we use for evaluating stocks and businesses is identical. Indeed, the
formula for valuing all assets that are purchased for financial gain has been unchanged since it was first laid out bya very smart man in about 600 B.C. (though he wasn’t smart enough to know it was 600 B.C.).
The oracle was Aesop and his enduring, though somewhat incomplete, investment insight was “a bird inthe hand is worth two in the bush.” To flesh out this principle, you must answer only three questions. How certain
are you that there are indeed birds in the bush? When will they emerge and how many will there be? What is therisk-free interest rate (which we consider to be the yield on long-term U.S. bonds)? If you can answer these three
questions, you will know the maximum value of the bush and the maximum number of the birds you nowpossess that should be offered for it. And, of course, don’t literally think birds. Think dollars.
Aesop’s investment axiom, thus expanded and converted into dollars, is immutable. It applies to outlays
for farms, oil royalties, bonds, stocks, lottery tickets, and manufacturing plants. And neither the advent of the steamengine, the harnessing of electricity nor the creation of the automobile changed the formula one iota — nor will theInternet. Just insert the correct numbers, and you can rank the attractiveness of all possible uses of capital
throughout the universe.
Common yardsticks such as dividend yield, the ratio of price to earnings or to book value, and even growthrates have nothing to do with valuation except to the extent they provide clues to the amount and timing of cashflows into and from the business. Indeed, growth can destroy value if it requires cash inputs in the early years of a
project or enterprise that exceed the discounted value of the cash that those assets will generate in later years.Market commentators and investment managers who glibly refer to “growth” and “value” styles as contrasting
approaches to investment are displaying their ignorance, not their sophistication. Growth is simply a component
usually a plus, sometimes a minus in the value equation.
Alas, though Aesop’s proposition and the third variable that is, interest rates are simple, plugging in
numbers for the other two variables is a difficult task. Using precise numbers is, in fact, foolish; working with arange of possibilities is the better approach.
Usually, the range must be so wide that no useful conclusion can be reached. Occasionally, though, evenvery conservative estimates about the future emergence of birds reveal that the price quoted is startlingly low in
relation to value. (Let’s call this phenomenon the IBT Inefficient Bush Theory.) To be sure, an investor needssome general understanding of business economics as well as the ability to think independently to reach a well-founded positive conclusion. But the investor does not need brilliance nor blinding insights.
At the other extreme, there are many times when the most brilliant of investors can’t muster a convictionabout the birds to emerge, not even when a very broad range of estimates is employed. This kind of uncertainty
frequently occurs when new businesses and rapidly changing industries are under examination. In cases of this sort,any capital commitment must be labeled speculative.
8/14/2019 Berkshire Hathaway 2000 Annual Report
http://slidepdf.com/reader/full/berkshire-hathaway-2000-annual-report 15/78
14
Now, speculation — in which the focus is not on what an asset will produce but rather on what the nextfellow will pay for it — is neither illegal, immoral nor un-American. But it is not a game in which Charlie and I
wish to play. We bring nothing to the party, so why should we expect to take anything home?
The line separating investment and speculation, which is never bright and clear, becomes blurred still
further when most market participants have recently enjoyed triumphs. Nothing sedates rationality like large dosesof effortless money. After a heady experience of that kind, normally sensible people drift into behavior akin to that
of Cinderella at the ball. They know that overstaying the festivities that is, continuing to speculate in companies
that have gigantic valuations relative to the cash they are likely to generate in the future will eventually bring on
pumpkins and mice. But they nevertheless hate to miss a single minute of what is one helluva party. Therefore, thegiddy participants all plan to leave just seconds before midnight. There’s a problem, though: They are dancing ina room in which the clocks have no hands.
Last year, we commented on the exuberance and, yes, it was irrational that prevailed, noting thatinvestor expectations had grown to be several multiples of probable returns. One piece of evidence came from aPaine Webber-Gallup survey of investors conducted in December 1999, in which the participants were asked their
opinion about the annual returns investors could expect to realize over the decade ahead. Their answers averaged19%. That, for sure, was an irrational expectation: For American business as a whole, there couldn’t possibly be
enough birds in the 2009 bush to deliver such a return.
Far more irrational still were the huge valuations that market participants were then putting on businessesalmost certain to end up being of modest or no value. Yet investors, mesmerized by soaring stock prices andignoring all else, piled into these enterprises. It was as if some virus, racing wildly among investment professionals
as well as amateurs, induced hallucinations in which the values of stocks in certain sectors became decoupled fromthe values of the businesses that underlay them.
This surreal scene was accompanied by much loose talk about “value creation.” We readily acknowledgethat there has been a huge amount of true value created in the past decade by new or young businesses, and that
there is much more to come. But value is destroyed, not created, by any business that loses money over its lifetime,no matter how high its interim valuation may get.
What actually occurs in these cases is wealth transfer , often on a massive scale. By shamelesslymerchandising birdless bushes, promoters have in recent years moved billions of dollars from the pockets of the
public to their own purses (and to those of their friends and associates). The fact is that a bubble market has allowed
the creation of bubble companies, entities designed more with an eye to making money off investors rather than for them. Too often, an IPO, not profits, was the primary goal of a company’s promoters. At bottom, the “business
model” for these companies has been the old-fashioned chain letter, for which many fee-hungry investment bankersacted as eager postmen.
But a pin lies in wait for every bubble. And when the two eventually meet, a new wave of investors learns
some very old lessons: First, many in Wall Street a community in which quality control is not prized will sellinvestors anything they will buy. Second, speculation is most dangerous when it looks easiest.
At Berkshire, we make no attempt to pick the few winners that will emerge from an ocean of unprovenenterprises. We’re not smart enough to do that, and we know it. Instead, we try to apply Aesop’s 2,600-year-old
equation to opportunities in which we have reasonable confidence as to how many birds are in the bush and whenthey will emerge (a formulation that my grandsons would probably update to “A girl in a convertible is worth five
in the phonebook.”). Obviously, we can never precisely predict the timing of cash flows in and out of a business or
their exact amount. We try, therefore, to keep our estimates conservative and to focus on industries where businesssurprises are unlikely to wreak havoc on owners. Even so, we make many mistakes: I’m the fellow, remember,who thought he understood the future economics of trading stamps, textiles, shoes and second-tier departmentstores.
Lately, the most promising “bushes” have been negotiated transactions for entire businesses, and that
pleases us. You should clearly understand, however, that these acquisitions will at best provide us only reasonablereturns. Really juicy results from negotiated deals can be anticipated only when capital markets are severelyconstrained and the whole business world is pessimistic. We are 180 degrees from that point.
8/14/2019 Berkshire Hathaway 2000 Annual Report
http://slidepdf.com/reader/full/berkshire-hathaway-2000-annual-report 16/78
15
Sources of Reported Earnings
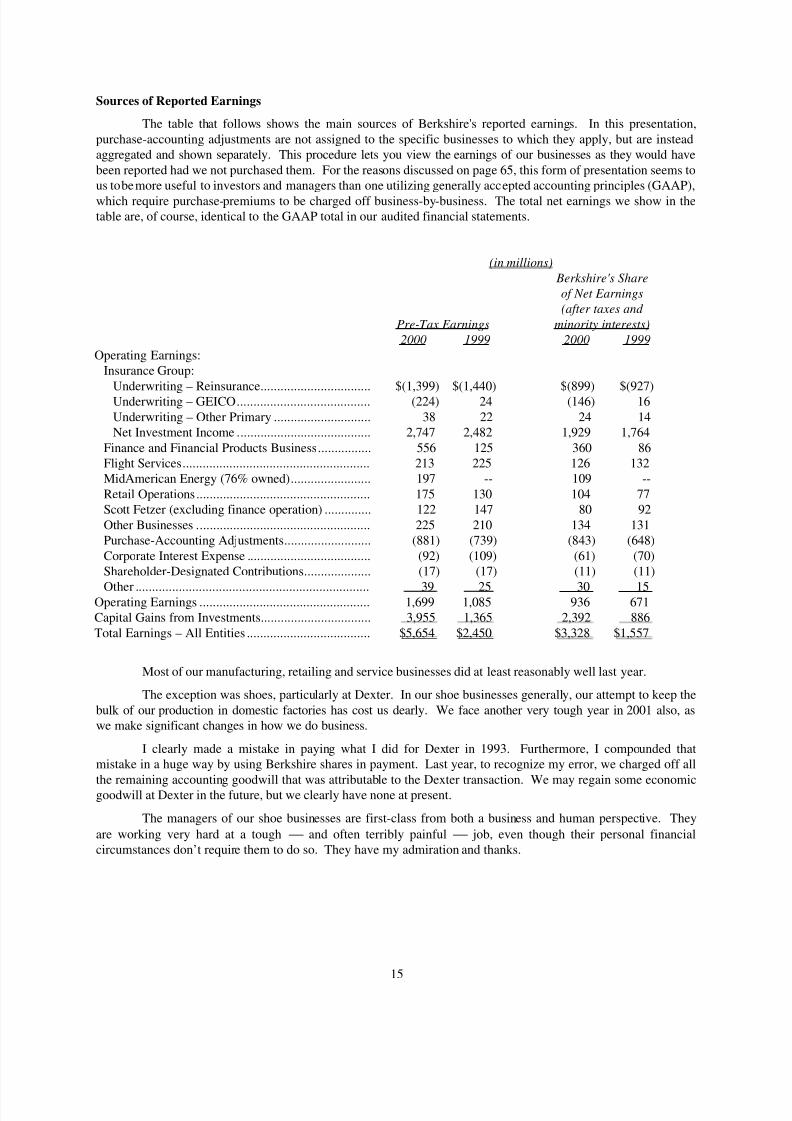
The table that follows shows the main sources of Berkshire's reported earnings. In this presentation,
purchase-accounting adjustments are not assigned to the specific businesses to which they apply, but are insteadaggregated and shown separately. This procedure lets you view the earnings of our businesses as they would have
been reported had we not purchased them. For the reasons discussed on page 65, this form of presentation seems tous to be more useful to investors and managers than one utilizing generally accepted accounting principles (GAAP),
which require purchase-premiums to be charged off business-by-business. The total net earnings we show in thetable are, of course, identical to the GAAP total in our audited financial statements.
(in millions)
Berkshire's Share
of Net Earnings
(after taxes and
Pre-Tax Earnings minority interests)
2000 1999 2000 1999
Operating Earnings:Insurance Group:
Underwriting – Reinsurance................................. $(1,399) $(1,440) $(899) $(927)Underwriting – GEICO........................................ (224) 24 (146) 16
Underwriting – Other Primary ............................. 38 22 24 14Net Investment Income ........................................ 2,747 2,482 1,929 1,764
Finance and Financial Products Business................ 556 125 360 86Flight Services........................................................ 213 225 126 132MidAmerican Energy (76% owned)........................ 197 -- 109 --
Retail Operations.................................................... 175 130 104 77Scott Fetzer (excluding finance operation) .............. 122 147 80 92
Other Businesses .................................................... 225 210 134 131Purchase-Accounting Adjustments.......................... (881) (739) (843) (648)
Corporate Interest Expense ..................................... (92) (109) (61) (70)Shareholder-Designated Contributions.................... (17) (17) (11) (11)
Other ...................................................................... 39 25 30 15Operating Earnings ................................................... 1,699 1,085 936 671Capital Gains from Investments................................. 3,955 1,365 2,392 886
Total Earnings – All Entities ..................................... $5,654 $2,450 $3,328 $1,557
Most of our manufacturing, retailing and service businesses did at least reasonably well last year.
The exception was shoes, particularly at Dexter. In our shoe businesses generally, our attempt to keep the
bulk of our production in domestic factories has cost us dearly. We face another very tough year in 2001 also, aswe make significant changes in how we do business.
I clearly made a mistake in paying what I did for Dexter in 1993. Furthermore, I compounded thatmistake in a huge way by using Berkshire shares in payment. Last year, to recognize my error, we charged off all
the remaining accounting goodwill that was attributable to the Dexter transaction. We may regain some economicgoodwill at Dexter in the future, but we clearly have none at present.
The managers of our shoe businesses are first-class from both a business and human perspective. They
are working very hard at a tough and often terribly painful job, even though their personal financialcircumstances don’t require them to do so. They have my admiration and thanks.
8/14/2019 Berkshire Hathaway 2000 Annual Report
http://slidepdf.com/reader/full/berkshire-hathaway-2000-annual-report 17/78
16
On a more pleasant note, we continue to be the undisputed leader in two branches of Aircraft Services
pilot training at FlightSafety (FSI) and fractional ownership of business jets at Executive Jet (EJA). Bothcompanies are run by their remarkable founders.
Al Ueltschi at FSI is now 83 and continues to operate at full throttle. Though I am not a fan of stock splits,I am planning to split Al’s age 2-for-1 when he hits 100. (If it works, guess who’s next.)
We spent $272 million on flight simulators in 2000, and we’ll spend a similar amount this year. Anyonewho thinks that the annual charges for depreciation don’t reflect a real cost every bit as real as payroll or raw
materials should get an internship at a simulator company. Every year we spend amounts equal to our
depreciation charge simply to stay in the same economic place and then spend additional sums to grow. Andgrowth is in prospect for FSI as far as the eye can see.
Even faster growth awaits EJA (whose fractional-ownership program is called NetJets®). Rich Santulli is
the dynamo behind this business.
Last year I told you that EJA’s recurring revenue from monthly management fees and hourly usage grewby 46% in 1999. In 2000 the growth was 49%. I also told you that this was a low-margin business, in whichsurvivors will be few. Margins were indeed slim at EJA last year, in part because of the major costs we are
incurring in developing our business in Europe.
Regardless of the cost, you can be sure that EJA’s spending on safety will be whatever is needed.Obviously, we would follow this policy under any circumstances, but there’s some self-interest here as well: I, mywife, my children, my sisters, my 94-year-old aunt, all but one of our directors, and at least nine Berkshire managers
regularly fly in the NetJets program. Given that cargo, I applaud Rich’s insistence on unusually high amounts of pilot training (an average of 23 days a year). In addition, our pilots cement their skills by flying 800 or so hours a
year. Finally, each flies only one model of aircraft, which means our crews do no switching around among planeswith different cockpit and flight characteristics.
EJA’s business continues to be constrained by the availability of new aircraft. Still, our customers willtake delivery of more than 50 new jets in 2001, 7% of world output. We are confident we will remain the world
leader in fractional ownership, in respect to number of planes flying, quality of service, and standards of safety.
* * * * * * * * * *
Additional information about our various businesses is given on pages 42-58, where you will also find oursegment earnings reported on a GAAP basis. In addition, on pages 67-73, we have rearranged Berkshire’s financial
data into four segments on a non-GAAP basis, a presentation that corresponds to the way Charlie and I think aboutthe company.
Look-Through Earnings
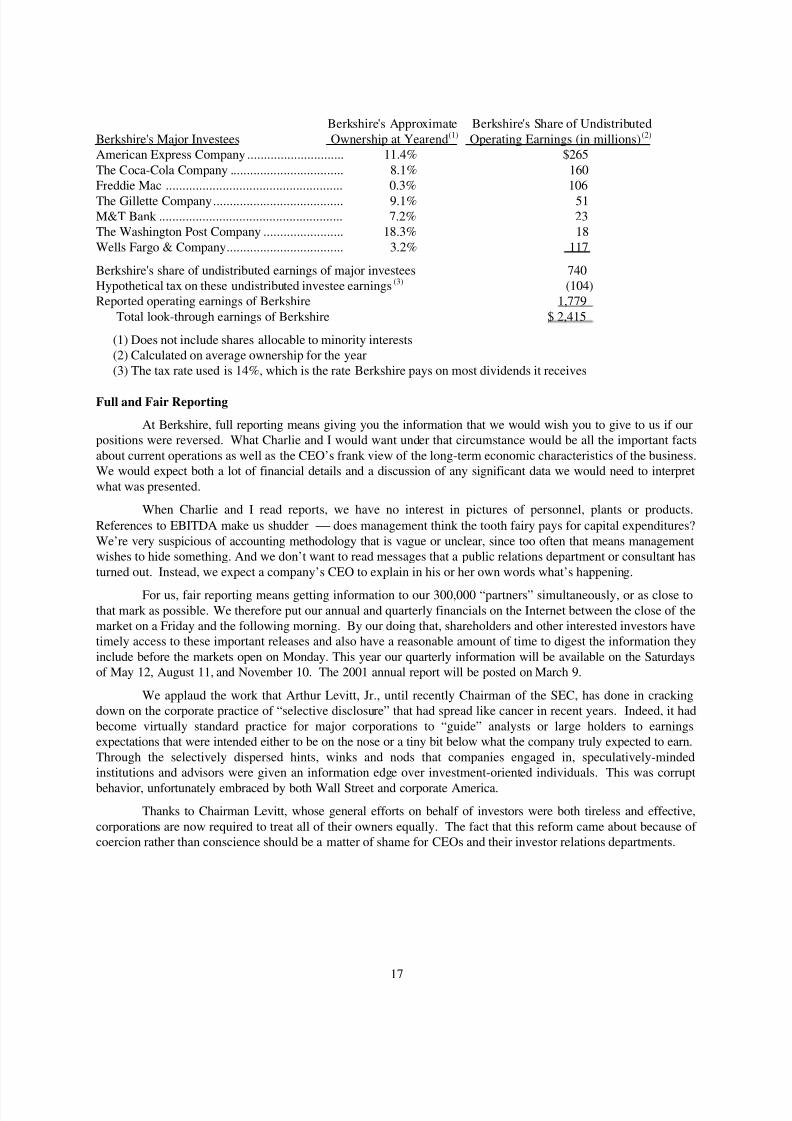
Reported earnings are an inadequate measure of economic progress at Berkshire, in part because the
numbers shown in the table on page 15 include only the dividends we receive from investees though these
dividends typically represent only a small fraction of the earnings attributable to our ownership. To depictsomething closer to economic reality at Berkshire than reported earnings, though, we employ the concept of "look-
through" earnings. As we calculate these, they consist of: (1) the operating earnings reported on page 15; plus; (2)our share of the retained operating earnings of major investees that, under GAAP accounting, are not reflected in
our profits, less; (3) an allowance for the tax that would be paid by Berkshire if these retained earnings of investees
had instead been distributed to us. When tabulating "operating earnings" here, we exclude purchase-accountingadjustments as well as capital gains and other major non-recurring items.
The following table sets forth our 2000 look-through earnings, though I warn you that the figures can be no
more than approximate, since they are based on a number of judgment calls. (The dividends paid to us by theseinvestees have been included in the operating earnings itemized on page 15, mostly under "Insurance Group: NetInvestment Income.")
8/14/2019 Berkshire Hathaway 2000 Annual Report
http://slidepdf.com/reader/full/berkshire-hathaway-2000-annual-report 18/78
17
Berkshire's Approximate Berkshire's Share of Undistributed
Berkshire's Major Investees Ownership at Yearend(1) Operating Earnings (in millions)(2) American Express Company ............................. 11.4% $265
The Coca-Cola Company .................................. 8.1% 160Freddie Mac ..................................................... 0.3% 106
The Gillette Company....................................... 9.1% 51M&T Bank ....................................................... 7.2% 23The Washington Post Company ........................ 18.3% 18
Wells Fargo & Company................................... 3.2% 117
Berkshire's share of undistributed earnings of major investees 740Hypothetical tax on these undistributed investee earnings(3) (104)Reported operating earnings of Berkshire 1,779
Total look-through earnings of Berkshire $ 2,415
(1) Does not include shares allocable to minority interests(2) Calculated on average ownership for the year(3) The tax rate used is 14%, which is the rate Berkshire pays on most dividends it receives
Full and Fair Reporting
At Berkshire, full reporting means giving you the information that we would wish you to give to us if ourpositions were reversed. What Charlie and I would want under that circumstance would be all the important facts
about current operations as well as the CEO’s frank view of the long-term economic characteristics of the business.We would expect both a lot of financial details and a discussion of any significant data we would need to interpret
what was presented.
When Charlie and I read reports, we have no interest in pictures of personnel, plants or products.
References to EBITDA make us shudder does management think the tooth fairy pays for capital expenditures?
We’re very suspicious of accounting methodology that is vague or unclear, since too often that means managementwishes to hide something. And we don’t want to read messages that a public relations department or consultant has
turned out. Instead, we expect a company’s CEO to explain in his or her own words what’s happening.
For us, fair reporting means getting information to our 300,000 “partners” simultaneously, or as close to
that mark as possible. We therefore put our annual and quarterly financials on the Internet between the close of themarket on a Friday and the following morning. By our doing that, shareholders and other interested investors havetimely access to these important releases and also have a reasonable amount of time to digest the information they
include before the markets open on Monday. This year our quarterly information will be available on the Saturdaysof May 12, August 11, and November 10. The 2001 annual report will be posted on March 9.
We applaud the work that Arthur Levitt, Jr., until recently Chairman of the SEC, has done in crackingdown on the corporate practice of “selective disclosure” that had spread like cancer in recent years. Indeed, it had
become virtually standard practice for major corporations to “guide” analysts or large holders to earningsexpectations that were intended either to be on the nose or a tiny bit below what the company truly expected to earn.
Through the selectively dispersed hints, winks and nods that companies engaged in, speculatively-mindedinstitutions and advisors were given an information edge over investment-oriented individuals. This was corrupt
behavior, unfortunately embraced by both Wall Street and corporate America.
Thanks to Chairman Levitt, whose general efforts on behalf of investors were both tireless and effective,
corporations are now required to treat all of their owners equally. The fact that this reform came about because of coercion rather than conscience should be a matter of shame for CEOs and their investor relations departments.
8/14/2019 Berkshire Hathaway 2000 Annual Report
http://slidepdf.com/reader/full/berkshire-hathaway-2000-annual-report 19/78
18
One further thought while I’m on my soapbox: Charlie and I think it is both deceptive and dangerous forCEOs to predict growth rates for their companies. They are, of course, frequently egged on to do so by both
analysts and their own investor relations departments. They should resist, however, because too often thesepredictions lead to trouble.
It’s fine for a CEO to have his own internal goals and, in our view, it’s even appropriate for the CEO topublicly express some hopes about the future, if these expectations are accompanied by sensible caveats. But for a
major corporation to predict that its per-share earnings will grow over the long term at, say, 15% annually is to courttrouble.
That’s true because a growth rate of that magnitude can only be maintained by a very small percentage of large businesses. Here’s a test: Examine the record of, say, the 200 highest earning companies from 1970 or 1980
and tabulate how many have increased per-share earnings by 15% annually since those dates. You will find thatonly a handful have. I would wager you a very significant sum that fewer than 10 of the 200 most profitablecompanies in 2000 will attain 15% annual growth in earnings-per-share over the next 20 years.
The problem arising from lofty predictions is not just that they spread unwarranted optimism. Even more
troublesome is the fact that they corrode CEO behavior. Over the years, Charlie and I have observed manyinstances in which CEOs engaged in uneconomic operating maneuvers so that they could meet earnings targets theyhad announced. Worse still, after exhausting all that operating acrobatics would do, they sometimes played a wide
variety of accounting games to “make the numbers.” These accounting shenanigans have a way of snowballing:Once a company moves earnings from one period to another, operating shortfalls that occur thereafter require it to
engage in further accounting maneuvers that must be even more “heroic.” These can turn fudging into fraud.(More money, it has been noted, has been stolen with the point of a pen than at the point of a gun.)
Charlie and I tend to be leery of companies run by CEOs who woo investors with fancy predictions. A fewof these managers will prove prophetic — but others will turn out to be congenital optimists, or even charlatans.
Unfortunately, it’s not easy for investors to know in advance which species they are dealing with.
* * * * * * * * * * * *
I’ve warned you in the past that you should not believe everything you read or hear about Berkshire
even when it is published or broadcast by a prestigious news organization. Indeed, erroneous reports areparticularly dangerous when they are circulated by highly-respected members of the media, simply because most
readers and listeners know these outlets to be generally credible and therefore believe what they say.
An example is a glaring error about Berkshire’s activities that appeared in the December 29 issue of The
Wall Street Journal, a generally excellent paper that I have for all of my life found useful. On the front page (andabove the fold, as they say) The Journal published a news brief that said, in unequivocal terms, that we were buying
bonds of Conseco and Finova. This item directed the reader to the lead story of the Money and Investing section.There, in the second paragraph of the story, The Journal reported, again without any qualification, that Berkshirewas buying Conseco and Finova bonds, adding that Berkshire had invested “several hundred million dollars” in
each. Only in the 18th paragraph of the story (which by that point had jumped to an inside page) did the paper hedgea bit, saying that our Conseco purchases had been disclosed by “people familiar with the matter.”
Well, not that familiar. True, we had purchased bonds and bank debt of Finova though the report waswildly inaccurate as to the amount. But to this day neither Berkshire nor I have ever bought a share of stock or abond of Conseco.
Berkshire is normally covered by a Journal reporter in Chicago who is both accurate and conscientious. Inthis case, however, the “scoop” was the product of a New York reporter for the paper. Indeed, the 29th was a busy
day for him: By early afternoon, he had repeated the story on CNBC. Immediately, in lemming-like manner, otherrespected news organizations, relying solely on the Journal, began relating the same “facts.” The result: Conseco
stock advanced sharply during the day on exceptional volume that placed it ninth on the NYSE most-active list.
During all of the story’s iterations, I never heard or read the word “rumor.” Apparently reporters and
editors, who generally pride themselves on their careful use of language, just can’t bring themselves to attach thisword to their accounts. But what description would fit more precisely? Certainly not the usual “sources say” or “it
has been reported.”
8/14/2019 Berkshire Hathaway 2000 Annual Report
http://slidepdf.com/reader/full/berkshire-hathaway-2000-annual-report 20/78
19
A column entitled “Today’s Rumors,” however, would not equate with the self-image of the many newsorganizations that think themselves above such stuff. These members of the media would feel that publishing such
acknowledged fluff would be akin to L’Osservatore Romano initiating a gossip column. But rumors are what theseorganizations often publish and broadcast, whatever euphemism they duck behind. At a minimum, readers deserve
honest terminology a warning label that will protect their financial health in the same way that smokers whose
physical health is at risk are given a warning.
The Constitution’s First Amendment allows the media to print or say almost anything. Journalism’s FirstPrinciple should require that the media be scrupulous in deciding what that will be.
Miscellaneous
In last year’s report we examined the battle then raging over the use of “pooling” in accounting formergers. It seemed to us that both sides were voicing arguments that were strong in certain respects and seriously
flawed in others. We are pleased that the Financial Accounting Standards Board has since gone to an alternativeapproach that strikes us as very sound.
If the proposed rule becomes final, we will no longer incur a large annual charge for amortization of intangibles. Consequently, our reported earnings will more closely reflect economic reality. (See page 65.) None
of this will have an effect on Berkshire’s intrinsic value. Your Chairman, however, will personally benefit in thatthere will be one less item to explain in these letters.
* * * * * * * * * * * *
I’m enclosing a report generously supplied by Outstanding Investor Digest of Charlie’s remarks atlast May’s Wesco annual meeting. Charlie thinks about business economics and investment matters better than
anyone I know, and I’ve learned a lot over the years by listening to him. Reading his comments will improve yourunderstanding of Berkshire.
* * * * * * * * * * * *
In 1985, we purchased Scott Fetzer, acquiring not only a fine business but the services of Ralph Schey, atruly outstanding CEO, as well. Ralph was then 61. Most companies, focused on the calendar rather than ability,would have benefited from Ralph’s talents for only a few years.
At Berkshire, in contrast, Ralph ran Scott Fetzer for 15 years until his retirement at the end of 2000. Under
his leadership, the company distributed $1.03 billion to Berkshire against our net purchase price of $230 million.We used these funds, in turn, to purchase other businesses. All told, Ralph’s contributions to Berkshire’s presentvalue extend well into the billions of dollars.
As a manager, Ralph belongs in Berkshire’s Hall of Fame, and Charlie and I welcome him to it.
* * * * * * * * * * * *
A bit of nostalgia: It was exactly 50 years ago that I entered Ben Graham’s class at Columbia. During the
decade before, I had enjoyed make that loved analyzing, buying and selling stocks. But my results were no
better than average.
Beginning in 1951 my performance improved. No, I hadn’t changed my diet or taken up exercise. The
only new ingredient was Ben’s ideas. Quite simply, a few hours spent at the feet of the master proved far morevaluable to me than had ten years of supposedly original thinking.
In addition to being a great teacher, Ben was a wonderful friend. My debt to him is incalculable.
8/14/2019 Berkshire Hathaway 2000 Annual Report
http://slidepdf.com/reader/full/berkshire-hathaway-2000-annual-report 21/78
20
Shareholder-Designated Contributions
About 97% of all eligible shares participated in Berkshire's 2000 shareholder-designated contributions
program, with contributions totaling $16.9 million. A full description of the program appears on pages 74-75.
Cumulatively, over the 20 years of the program, Berkshire has made contributions of $164 millionpursuant to the instructions of our shareholders. The rest of Berkshire's giving is done by our subsidiaries, which
stick to the philanthropic patterns that prevailed before they were acquired (except that their former ownersthemselves take on the responsibility for their personal charities). In aggregate, our subsidiaries made contributionsof $18.3 million in 2000, including in-kind donations of $3 million.
To participate in future programs, you must own Class A shares that are registered in the name of the
actual owner, not the nominee name of a broker, bank or depository. Shares not so registered on August 31, 2001
will be ineligible for the 2001 program. When you get the contributions form from us, return it promptly so that it
does not get put aside or forgotten. Designations received after the due date will not be honored.
The Annual Meeting
Last year we moved the annual meeting to the Civic Auditorium, and it worked very well for us. We willmeet there again on Saturday, April 28. The doors will open at 7 a.m., the movie will begin at 8:30, and the meetingitself will commence at 9:30. There will be a short break at noon for food, with sandwiches available at the Civic’s
concession stands. Except for that interlude, Charlie and I will answer questions until 3:30.For the next couple of years, the Civic is our only choice. We must therefore hold the meeting on either
Saturday or Sunday to avoid the traffic and parking nightmare that would occur on a weekday. Shortly, however,Omaha will have a new Convention Center with ample parking. Assuming that the Center is then available to us, I
will poll shareholders to see whether you wish to return to a Monday meeting. We will decide that vote based onthe wishes of a majority of shareholders, not shares.
An attachment to the proxy material that is enclosed with this report explains how you can obtain thecredential you will need for admission to this year’s meeting and other events. As for plane, hotel and car
reservations, we have again signed up American Express (800-799-6634) to give you special help. In our normalfashion, we will run buses from the larger hotels to the meeting. After the meeting, the buses will make trips back
to the hotels and to Nebraska Furniture Mart, Borsheim’s and the airport. Even so, you are likely to find a caruseful.
We have added so many new companies to Berkshire this year that I’m not going to detail all of theproducts that we will be selling at the meeting. But come prepared to carry home everything from bricks to candy.One new product, however, deserves special note: Bob Shaw has designed a 3 x 5 rug featuring an excellent
likeness of Charlie. Obviously, it would be embarrassing for Charlie make that humiliating if slow sales
forced us to slash the rug’s price, so step up and do your part.
GEICO will have a booth staffed by a number of its top counselors from around the country, all of themready to supply you with auto insurance quotes. In most cases, GEICO will be able to offer you a specialshareholder’s discount (usually 8%). Bring the details of your existing insurance and check out whether we can
save you some money.
At the Omaha airport on Saturday, we will have the usual array of aircraft from Executive Jet available for
your inspection. Just ask an EJA representative at the Civic about viewing any of these planes. If you buy what we
consider an appropriate number of items during the weekend, you may well need your own plane to take themhome.
At Nebraska Furniture Mart, located on a 75-acre site on 72nd Street between Dodge and Pacific, we will
again be having “Berkshire Weekend” pricing, which means we will be offering our shareholders a discount that iscustomarily given only to employees. We initiated this special pricing at NFM four years ago and sales during the
“Weekend” grew from $5.3 million in 1997 to $9.1 million in 2000.
8/14/2019 Berkshire Hathaway 2000 Annual Report
http://slidepdf.com/reader/full/berkshire-hathaway-2000-annual-report 22/78
21
To get the discount, you must make your purchases between Wednesday, April 25 and Monday, April 30and also present your meeting credential. The period’s special pricing will even apply to the products of several
prestige manufacturers that normally have ironclad rules against discounting but that, in the spirit of our shareholderweekend, have made an exception for you. We appreciate their cooperation. NFM is open from 10 a.m. to 9 p.m.
on weekdays and 10 a.m. to 6 p.m. on Saturdays and Sundays.
Borsheim’s the largest jewelry store in the country except for Tiffany’s Manhattan store will have
two shareholder-only events. The first will be a cocktail reception from 6 p.m. to 10 p.m. on Friday, April 27. Thesecond, the main gala, will be from 9 a.m. to 5 p.m. on Sunday, April 29. Shareholder prices will be availableThursday through Monday, so if you wish to avoid the large crowds that will assemble on Friday evening andSunday, come at other times and identify yourself as a shareholder. On Saturday, we will be open until 6 p.m.
Borsheim’s operates on a gross margin that is fully twenty percentage points below that of its major rivals, so themore you buy, the more you save (or at least that’s what my family always tells me).
In the mall outside of Borsheim’s, we will have local bridge experts available to play with our shareholderson Sunday. Bob Hamman, who normally is with us, will be in Africa this year. He has promised, however, to be on
hand in 2002. Patrick Wolff, twice U.S. chess champion, will also be in the mall, taking on all comers
blindfolded! Last year, Patrick played as many as six games simultaneously with his blindfold securely in place
and demolished his opponents.
As if all this isn’t enough to test your skills, our Borsheim’s Olympiad this year will also include BillRobertie, one of only two players to twice win the backgammon world championship. Backgammon can be a big
money game, so bring along your stock certificates.
Gorat’s my favorite steakhouse will again be open exclusively for Berkshire shareholders on Sunday,April 29, and will be serving from 4 p.m. until 10 p.m. Please remember that you can’t come to Gorat’s on Sunday
without a reservation. To make one, call 402-551-3733 on April 2 (but not before). If Sunday is sold out, tryGorat’s on one of the other evenings you will be in town. If you order a rare T-bone with a double order of hash
browns, you will establish your credentials as an epicure.
The usual baseball game will be held at Rosenblatt Stadium at 7 p.m. on Saturday night. This year the
Omaha Golden Spikes will play the New Orleans Zephyrs. Ernie Banks is again going to be on hand to bravely
face my fastball (once clocked at 95 mpm miles per month).
My performance last year was not my best: It took me five pitches to throw anything resembling a strike.And, believe me, it gets lonely on the mound when you can’t find the plate. Finally, I got one over, and Ernie
lashed a line drive to left field. After I was yanked from the game, the many sports writers present asked what I hadserved up to Ernie. I quoted what Warren Spahn said after Willie Mays hit one of his pitches for a home run
(Willie’s first in the majors): “It was a helluva pitch for the first sixty feet.”
It will be a different story this year. I don’t want to tip my hand, so let’s just say Ernie will have to deal
with a pitch he has never seen before.
Our proxy statement contains instructions about obtaining tickets to the game and also a large quantity of
other information that should help you enjoy your visit in Omaha. There will be plenty of action in town. So comefor Woodstock Weekend and join our Celebration of Capitalism at the Civic.
Warren E. Buffett
February 28, 2001 Chairman of the Board
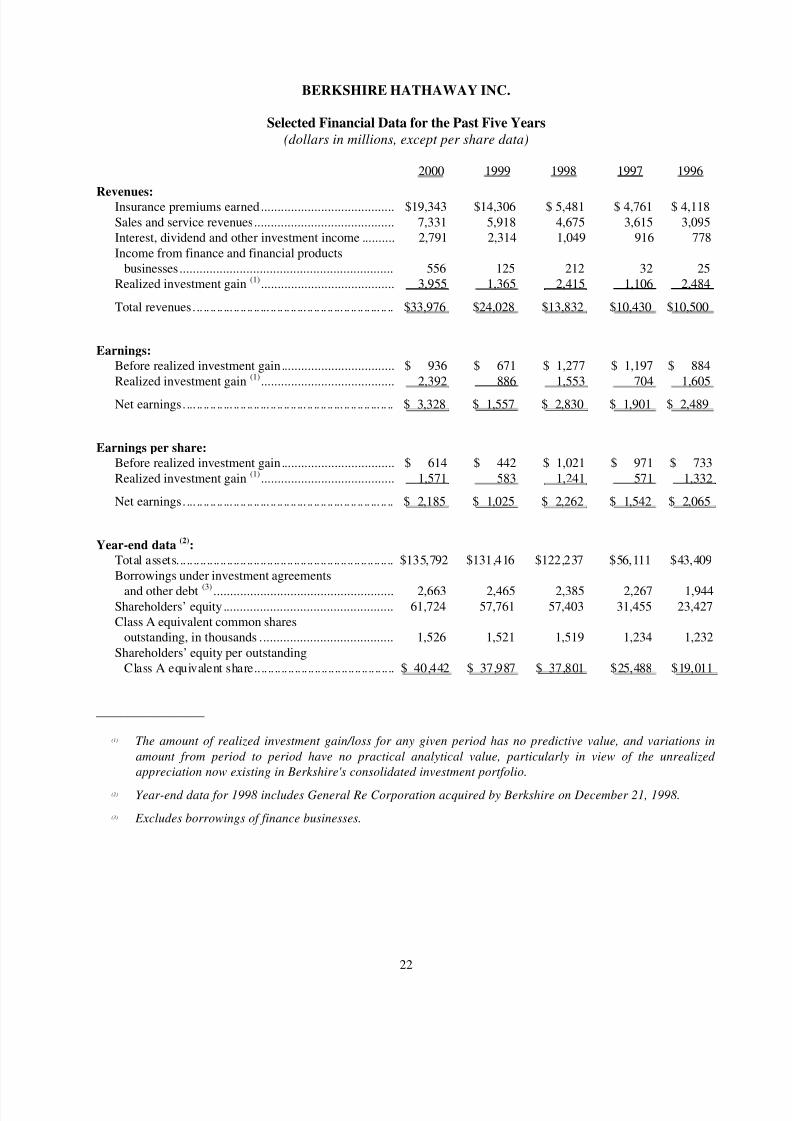
8/14/2019 Berkshire Hathaway 2000 Annual Report
http://slidepdf.com/reader/full/berkshire-hathaway-2000-annual-report 23/78
22
BERKSHIRE HATHAWAY INC.
Selected Financial Data for the Past Five Years
(dollars in millions, except per share data)
2000 1999 1998 1997 1996
Revenues:Insurance premiums earned........................................ $19,343 $14,306 $ 5,481 $ 4,761 $ 4,118
Sales and service revenues.......................................... 7,331 5,918 4,675 3,615 3,095Interest, dividend and other investment income .......... 2,791 2,314 1,049 916 778
Income from finance and financial productsbusinesses................................................................ 556 125 212 32 25
Realized investment gain (1) ........................................ 3,955 1,365 2,415 1,106 2,484
Total revenues... .. .. .. ... .. .. .. .. ... .. .. .. .. ... .. .. .. .. ... .. .. .. .. ... .. .. $33,976 $24,028 $13,832 $10,430 $10,500
Earnings:
Before realized investment gain.................................. $ 936 $ 671 $ 1,277 $ 1,197 $ 884
Realized investment gain (1) ........................................ 2,392 886 1,553 704 1,605
Net earnings.... .. .. .. .. ... .. .. .. .. ... .. .. .. .. ... .. .. .. .. ... .. .. .. .. ... .. .. $ 3,328 $ 1,557 $ 2,830 $ 1,901 $ 2,489
Earnings per share:
Before realized investment gain.................................. $ 614 $ 442 $ 1,021 $ 971 $ 733
Realized investment gain (1) ........................................ 1,571 583 1,241 571 1,332
Net earnings.... .. .. .. .. ... .. .. .. .. ... .. .. .. .. ... .. .. .. .. ... .. .. .. .. ... .. .. $ 2,185 $ 1,025 $ 2,262 $ 1,542 $ 2,065
Year-end data(2)
:
Total assets................................................................. $135,792 $131,416 $122,237 $56,111 $43,409
Borrowings under investment agreements
and other debt (3) ...................................................... 2,663 2,465 2,385 2,267 1,944Shareholders’ equity ................................................... 61,724 57,761 57,403 31,455 23,427Class A equivalent common shares
outstanding, in thousands ........................................ 1,526 1,521 1,519 1,234 1,232
Shareholders’ equity per outstandingClass A equivalent share.......................................... $ 40,442 $ 37,987 $ 37,801 $25,488 $19,011
_________________
(1) The amount of realized investment gain/loss for any given period has no predictive value, and variations in
amount from period to period have no practical analytical value, particularly in view of the unrealized
appreciation now existing in Berkshire's consolidated investment portfolio.
(2) Year-end data for 1998 includes General Re Corporation acquired by Berkshire on December 21, 1998.
(3) Excludes borrowings of finance businesses.
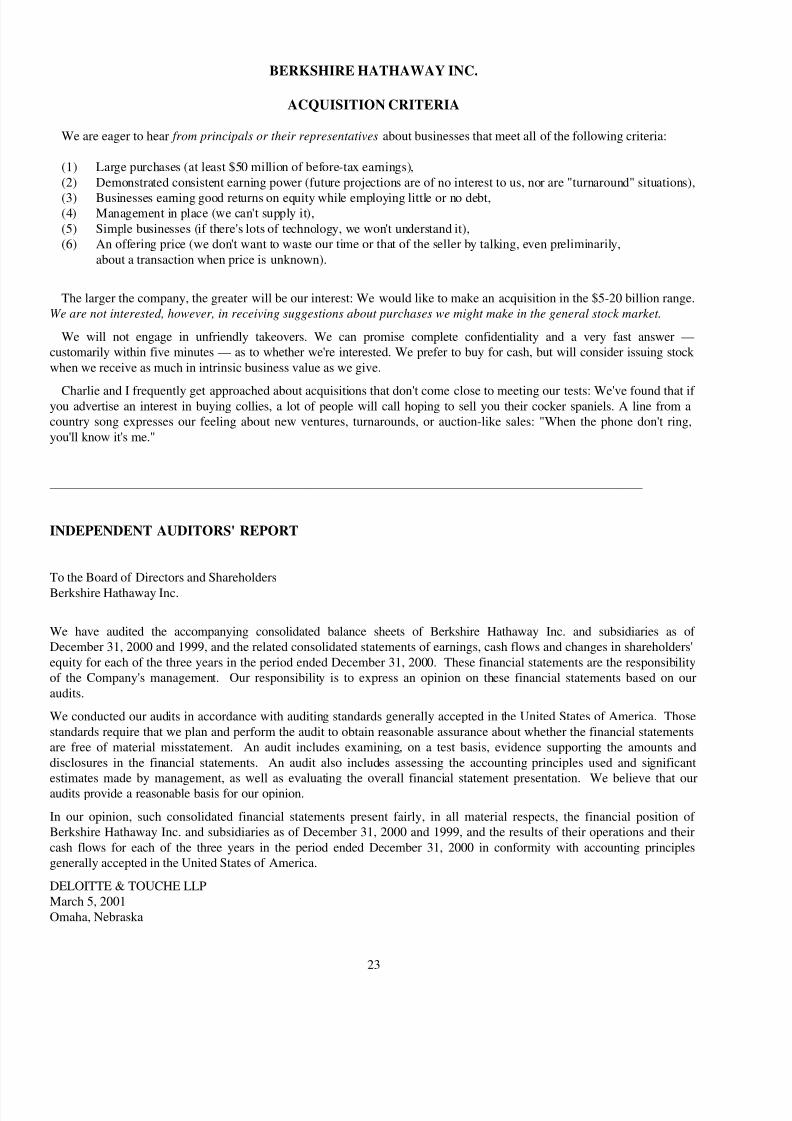
8/14/2019 Berkshire Hathaway 2000 Annual Report
http://slidepdf.com/reader/full/berkshire-hathaway-2000-annual-report 24/78
23
BERKSHIRE HATHAWAY INC.
ACQUISITION CRITERIA
We are eager to hear from principals or their representatives about businesses that meet all of the following criteria:
(1) Large purchases (at least $50 million of before-tax earnings),
(2) Demonstrated consistent earning power (future projections are of no interest to us, nor are "turnaround" situations),
(3) Businesses earning good returns on equity while employing little or no debt,(4) Management in place (we can't supply it),
(5) Simple businesses (if there's lots of technology, we won't understand it),(6) An offering price (we don't want to waste our time or that of the seller by talking, even preliminarily,
about a transaction when price is unknown).
The larger the company, the greater will be our interest: We would like to make an acquisition in the $5-20 billion range.We are not interested, however, in receiving suggestions about purchases we might make in the general stock market.
We will not engage in unfriendly takeovers. We can promise complete confidentiality and a very fast answer —customarily within five minutes — as to whether we're interested. We prefer to buy for cash, but will consider issuing stock
when we receive as much in intrinsic business value as we give.
Charlie and I frequently get approached about acquisitions that don't come close to meeting our tests: We've found that if you advertise an interest in buying collies, a lot of people will call hoping to sell you their cocker spaniels. A line from acountry song expresses our feeling about new ventures, turnarounds, or auction-like sales: "When the phone don't ring,
you'll know it's me."
_____________________________________________________________________________________________
INDEPENDENT AUDITORS' REPORT
To the Board of Directors and Shareholders
Berkshire Hathaway Inc.
We have audited the accompanying consolidated balance sheets of Berkshire Hathaway Inc. and subsidiaries as of December 31, 2000 and 1999, and the related consolidated statements of earnings, cash flows and changes in shareholders'
equity for each of the three years in the period ended December 31, 2000. These financial statements are the responsibilityof the Company's management. Our responsibility is to express an opinion on these financial statements based on our
audits.
We conducted our audits in accordance with auditing standards generally accepted in the United States of America. Those
standards require that we plan and perform the audit to obtain reasonable assurance about whether the financial statementsare free of material misstatement. An audit includes examining, on a test basis, evidence supporting the amounts and
disclosures in the financial statements. An audit also includes assessing the accounting principles used and significantestimates made by management, as well as evaluating the overall financial statement presentation. We believe that ouraudits provide a reasonable basis for our opinion.
In our opinion, such consolidated financial statements present fairly, in all material respects, the financial position of Berkshire Hathaway Inc. and subsidiaries as of December 31, 2000 and 1999, and the results of their operations and their
cash flows for each of the three years in the period ended December 31, 2000 in conformity with accounting principlesgenerally accepted in the United States of America.
DELOITTE & TOUCHE LLPMarch 5, 2001
Omaha, Nebraska
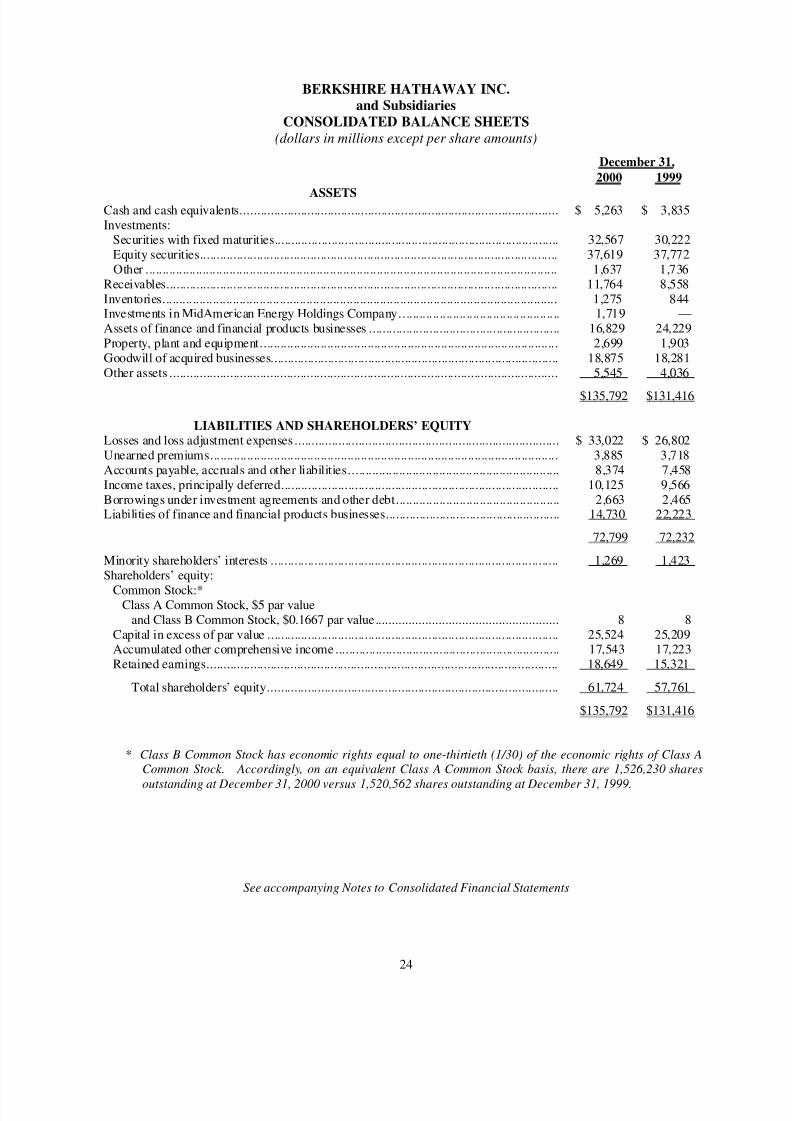
8/14/2019 Berkshire Hathaway 2000 Annual Report
http://slidepdf.com/reader/full/berkshire-hathaway-2000-annual-report 25/78
24
BERKSHIRE HATHAWAY INC.
and Subsidiaries
CONSOLIDATED BALANCE SHEETS
(dollars in millions except per share amounts)
December 31,
2000 1999
ASSETSCash and cash equivalents............................................................................................... $ 5,263 $ 3,835Investments:
Securities with fixed maturities..................................................................................... 32,567 30,222Equity securities........................................................................................................... 37,619 37,772Other ........................................................................................................................... 1,637 1,736
Receivables..................................................................................................................... 11,764 8,558Inventories...................................................................................................................... 1,275 844Investments in MidAmerican Energy Holdings Company................................................ 1,719 —Assets of finance and financial products businesses ......................................................... 16,829 24,229Property, plant and equipment......................................................................................... 2,699 1,903Goodwill of acquired businesses...................................................................................... 18,875 18,281Other assets .................................................................................................................... 5,545 4,036
$135,792 $131,416
LIABILITIES AND SHAREHOLDERS’ EQUITY
Losses and loss adjustment expenses ............................................................................... $ 33,022 $ 26,802Unearned premiums........................................................................................................ 3,885 3,718Accounts payable, accruals and other liabilities............................................................... 8,374 7,458Income taxes, principally deferred................................................................................... 10,125 9,566Borrowings under investment agreements and other debt................................................. 2,663 2,465Liabilities of finance and financial products businesses.................................................... 14,730 22,223
72,799 72,232
Minority shareholders’ interests ...................................................................................... 1,269 1,423Shareholders’ equity:
Common Stock:*Class A Common Stock, $5 par value
and Class B Common Stock, $0.1667 par value....................................................... 8 8Capital in excess of par value ....................................................................................... 25,524 25,209Accumulated other comprehensive income................................................................... 17,543 17,223Retained earnings......................................................................................................... 18,649 15,321
Total shareholders’ equity....................................................................................... 61,724 57,761
$135,792 $131,416
* Class B Common Stock has economic rights equal to one-thirtieth (1/30) of the economic rights of Class ACommon Stock. Accordingly, on an equivalent Class A Common Stock basis, there are 1,526,230 shares
outstanding at December 31, 2000 versus 1,520,562 shares outstanding at December 31, 1999.
See accompanying Notes to Consolidated Financial Statements
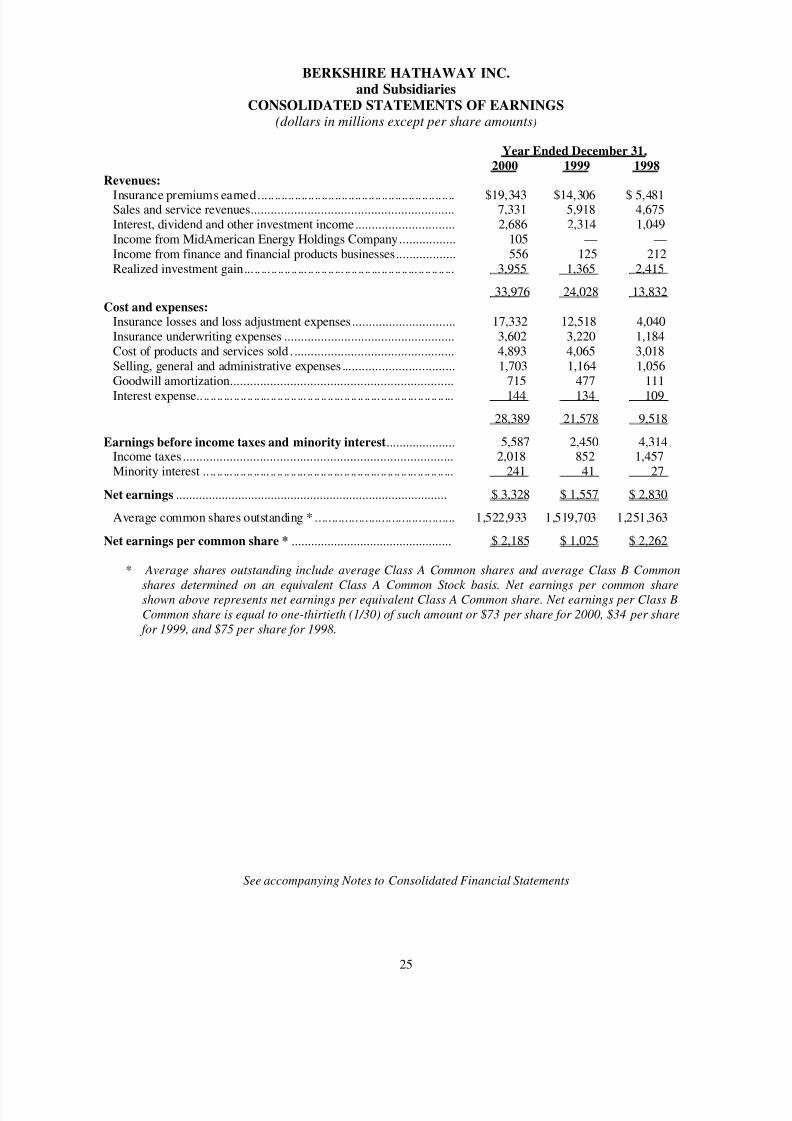
8/14/2019 Berkshire Hathaway 2000 Annual Report
http://slidepdf.com/reader/full/berkshire-hathaway-2000-annual-report 26/78
25
BERKSHIRE HATHAWAY INC.and Subsidiaries
CONSOLIDATED STATEMENTS OF EARNINGS(dollars in millions except per share amounts)
Year Ended December 31,
2000 1999 1998
Revenues:
Insurance premiums earned........................................................... $19,343 $14,306 $ 5,481Sales and service revenues............................................................. 7,331 5,918 4,675Interest, dividend and other investment income.............................. 2,686 2,314 1,049Income from MidAmerican Energy Holdings Company................. 105 — —Income from finance and financial products businesses.................. 556 125 212Realized investment gain... .. ... .. .. .. .. ... .. .. .. .. ... .. .. .. .. ... .. .. .. .. ... .. .. .. .. ... 3,955 1,365 2,415
33,976 24,028 13,832Cost and expenses:
Insurance losses and loss adjustment expenses............................... 17,332 12,518 4,040Insurance underwriting expenses ................................................... 3,602 3,220 1,184Cost of products and services sold . ................................................ 4,893 4,065 3,018Selling, general and administrative expenses .................................. 1,703 1,164 1,056Goodwill amortization................................................................... 715 477 111
Interest expense.. .. .. .. ... .. .. .. .. ... .. .. .. .. ... .. .. .. .. ... .. .. .. .. ... .. .. .. .. ... .. .. .. .. ... 144 134 109
28,389 21,578 9,518
Earnings before income taxes and minority interest..................... 5,587 2,450 4,314Income taxes ................................................................................. 2,018 852 1,457Minority interest .. .. .. ... .. .. .. .. ... .. .. .. .. ... .. .. .. .. ... .. .. .. .. ... .. .. .. .. ... .. .. .. .. ... 241 41 27
Net earnings ................................................................................... $ 3,328 $ 1,557 $ 2,830
Average common shares outstanding * .......................................... 1,522,933 1,519,703 1,251,363
Net earnings per common share * ................................................. $ 2,185 $ 1,025 $ 2,262
* Average shares outstanding include average Class A Common shares and average Class B Common
shares determined on an equivalent Class A Common Stock basis. Net earnings per common shareshown above represents net earnings per equivalent Class A Common share. Net earnings per Class BCommon share is equal to one-thirtieth (1/30) of such amount or $73 per share for 2000, $34 per share
for 1999, and $75 per share for 1998.
See accompanying Notes to Consolidated Financial Statements
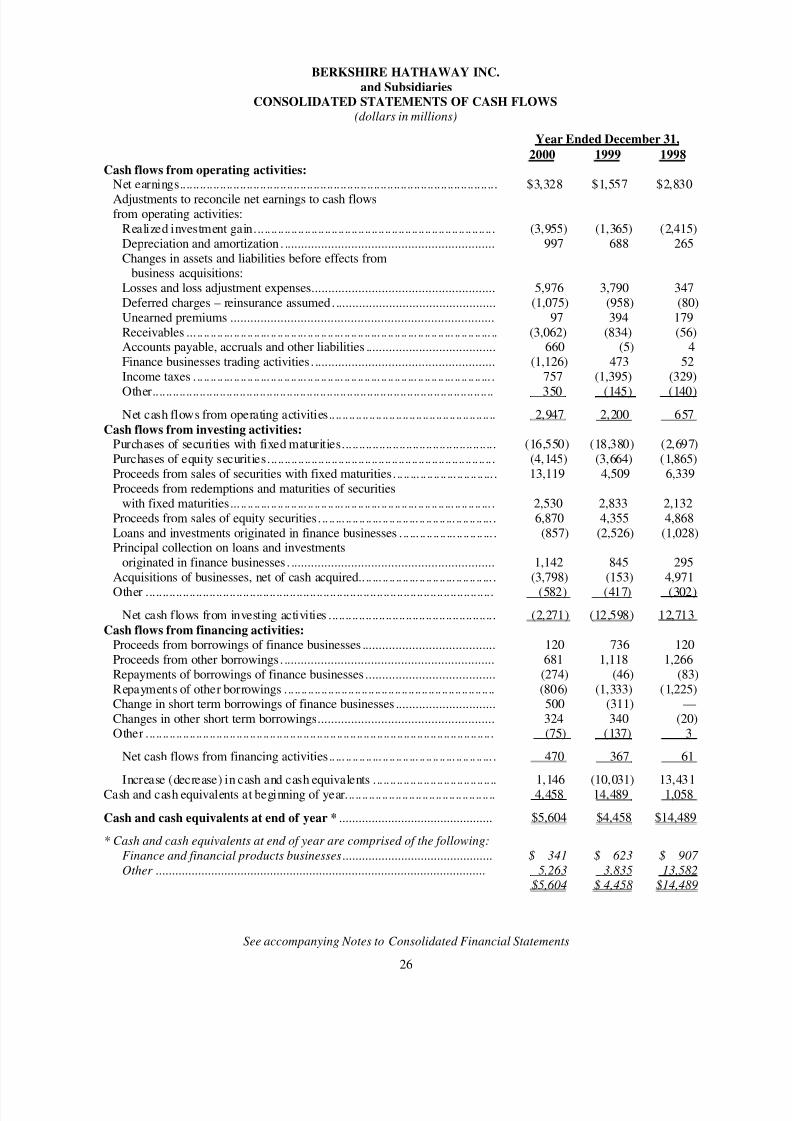
8/14/2019 Berkshire Hathaway 2000 Annual Report
http://slidepdf.com/reader/full/berkshire-hathaway-2000-annual-report 27/78
26
BERKSHIRE HATHAWAY INC.
and Subsidiaries
CONSOLIDATED STATEMENTS OF CASH FLOWS(dollars in millions)
Year Ended December 31,
2000 1999 1998
Cash flows from operating activities:Net earnings............................................................................................... $3,328 $1,557 $2,830
Adjustments to reconcile net earnings to cash flowsfrom operating activities:
Realized investment gain........................................................................ (3,955) (1,365) (2,415)Depreciation and amortization . ............................................................... 997 688 265Changes in assets and liabilities before effects from
business acquisitions:Losses and loss adjustment expenses....................................................... 5,976 3,790 347Deferred charges – reinsurance assumed. ................................................ (1,075) (958) (80)Unearned premiums ............................................................................... 97 394 179Receivables ... .. .. .. .. ... .. .. .. .. ... .. .. .. .. ... .. .. .. .. ... .. .. .. .. ... .. .. .. .. ... .. .. .. .. ... .. .. .. .. ... .. (3,062) (834) (56)Accounts payable, accruals and other liabilities ....................................... 660 (5) 4Finance businesses trading activities. ...................................................... (1,126) 473 52Income taxes ... .. .. .. ... .. .. .. .. ... .. .. .. .. ... .. .. .. .. ... .. .. .. .. ... .. .. .. .. ... .. .. .. .. ... .. .. .. .. ... . 757 (1,395) (329)
Other...................................................................................................... 350 (145) (140)
Net cash flows from operating activities.................................................. 2,947 2,200 657Cash flows from investing activities:
Purchases of securities with fixed maturities.............................................. (16,550) (18,380) (2,697)Purchases of equity securities.................................................................... (4,145) (3,664) (1,865)Proceeds from sales of securities with fixed maturities... .. ... .. .. .. .. ... .. .. .. .. ... . 13,119 4,509 6,339Proceeds from redemptions and maturities of securities
with fixed maturities... .. .. .. ... .. .. .. .. ... .. .. .. .. ... .. .. .. .. ... .. .. .. .. ... .. .. .. .. ... .. .. .. .. ... . 2,530 2,833 2,132Proceeds from sales of equity securities... .. ... .. .. .. .. ... .. .. .. .. ... .. .. .. .. ... .. .. .. .. ... . 6,870 4,355 4,868Loans and investments originated in finance businesses ... ... .. .. .. .. ... .. .. .. .. ... . (857) (2,526) (1,028)Principal collection on loans and investments
originated in finance businesses . ............................................................. 1,142 845 295Acquisitions of businesses, net of cash acquired.. .. ... .. .. .. .. ... .. .. .. .. ... .. .. .. .. ... . (3,798) (153) 4,971
Other ........................................................................................................ (582) (417) (302)
Net cash flows from investing activities .................................................. (2,271) (12,598) 12,713Cash flows from financing activities:
Proceeds from borrowings of finance businesses ........................................ 120 736 120Proceeds from other borrowings. ............................................................... 681 1,118 1,266Repayments of borrowings of finance businesses ....................................... (274) (46) (83)Repayments of other borrowings ............................................................... (806) (1,333) (1,225)Change in short term borrowings of finance businesses .............................. 500 (311) —Changes in other short term borrowings..................................................... 324 340 (20)Other ........................................................................................................ (75) (137) 3
Net cash flows from financing activities.. ... .. .. .. .. ... .. .. .. .. ... .. .. .. .. ... .. .. .. .. ... . 470 367 61
Increase (decrease) in cash and cash equivalents ..................................... 1,146 (10,031) 13,431Cash and cash equivalents at beginning of year............................................. 4,458 14,489 1,058
Cash and cash equivalents at end of year * ............................................... $5,604 $4,458 $14,489
* Cash and cash equivalents at end of year are comprised of the following:Finance and financial products businesses.............................................. $ 341 $ 623 $ 907 Other ..................................................................................................... 5,263 3,835 13,582
$5,604 $ 4,458 $14,489
See accompanying Notes to Consolidated Financial Statements
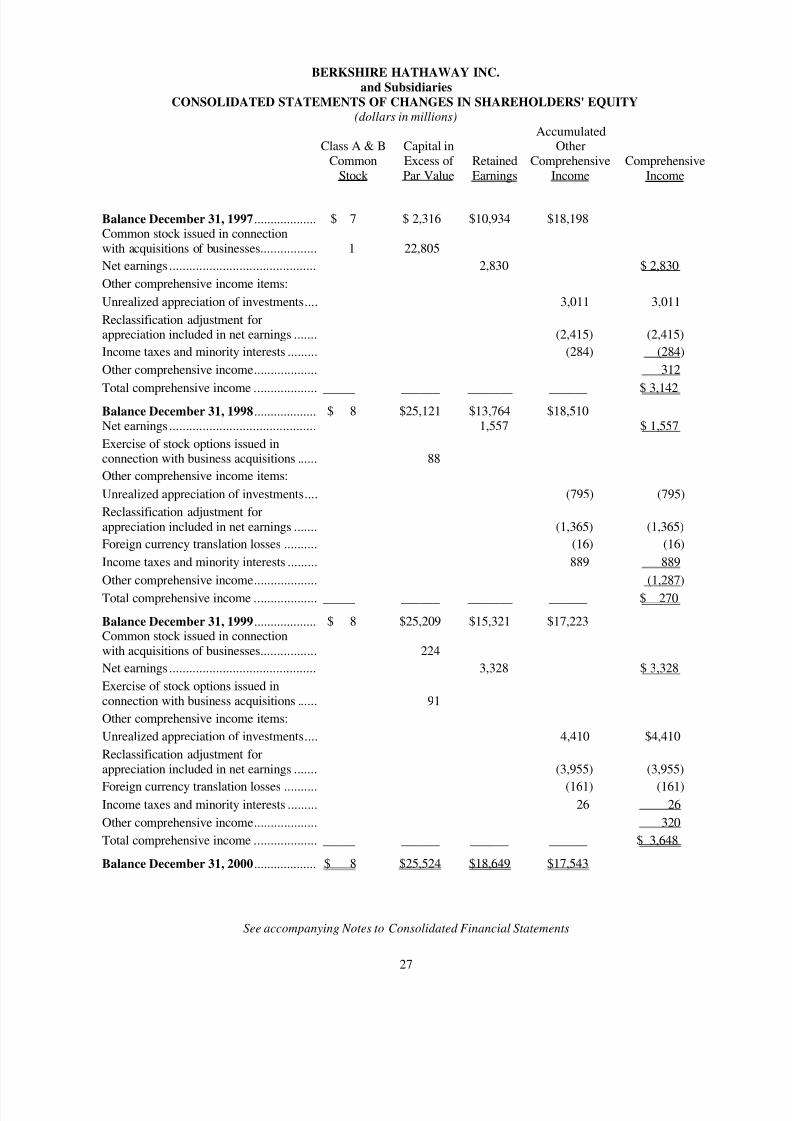
8/14/2019 Berkshire Hathaway 2000 Annual Report
http://slidepdf.com/reader/full/berkshire-hathaway-2000-annual-report 28/78
27
BERKSHIRE HATHAWAY INC.
and Subsidiaries
CONSOLIDATED STATEMENTS OF CHANGES IN SHAREHOLDERS' EQUITY(dollars in millions)
Class A & BCommon
Stock
Capital inExcess of Par Value
RetainedEarnings
AccumulatedOther
ComprehensiveIncome
ComprehensiveIncome
Balance December 31, 1997................... $ 7 $ 2,316 $10,934 $18,198Common stock issued in connectionwith acquisitions of businesses................. 1 22,805
Net earnings ............................................ 2,830 $ 2,830
Other comprehensive income items:
Unrealized appreciation of investments.... 3,011 3,011
Reclassification adjustment forappreciation included in net earnings ....... (2,415) (2,415)
Income taxes and minority interests ......... (284) (284)
Other comprehensive income................... 312
Total comprehensive income ................... _____ ______ _______ ______ $ 3,142Balance December 31, 1998................... $ 8 $25,121 $13,764 $18,510Net earnings ............................................ 1,557 $ 1,557
Exercise of stock options issued inconnection with business acquisitions ...... 88
Other comprehensive income items:
Unrealized appreciation of investments.... (795) (795)
Reclassification adjustment forappreciation included in net earnings ....... (1,365) (1,365)
Foreign currency translation losses .......... (16) (16)
Income taxes and minority interests ......... 889 889
Other comprehensive income................... (1,287)
Total comprehensive income ................... _____ ______ _______ ______ $ 270
Balance December 31, 1999................... $ 8 $25,209 $15,321 $17,223Common stock issued in connectionwith acquisitions of businesses................. 224
Net earnings ............................................ 3,328 $ 3,328
Exercise of stock options issued inconnection with business acquisitions ...... 91
Other comprehensive income items:
Unrealized appreciation of investments.... 4,410 $4,410
Reclassification adjustment forappreciation included in net earnings ....... (3,955) (3,955)
Foreign currency translation losses .......... (161) (161)Income taxes and minority interests ......... 26 26
Other comprehensive income................... 320
Total comprehensive income ................... _____ ______ ______ ______ $ 3,648
Balance December 31, 2000................... $ 8 $25,524 $18,649 $17,543
See accompanying Notes to Consolidated Financial Statements
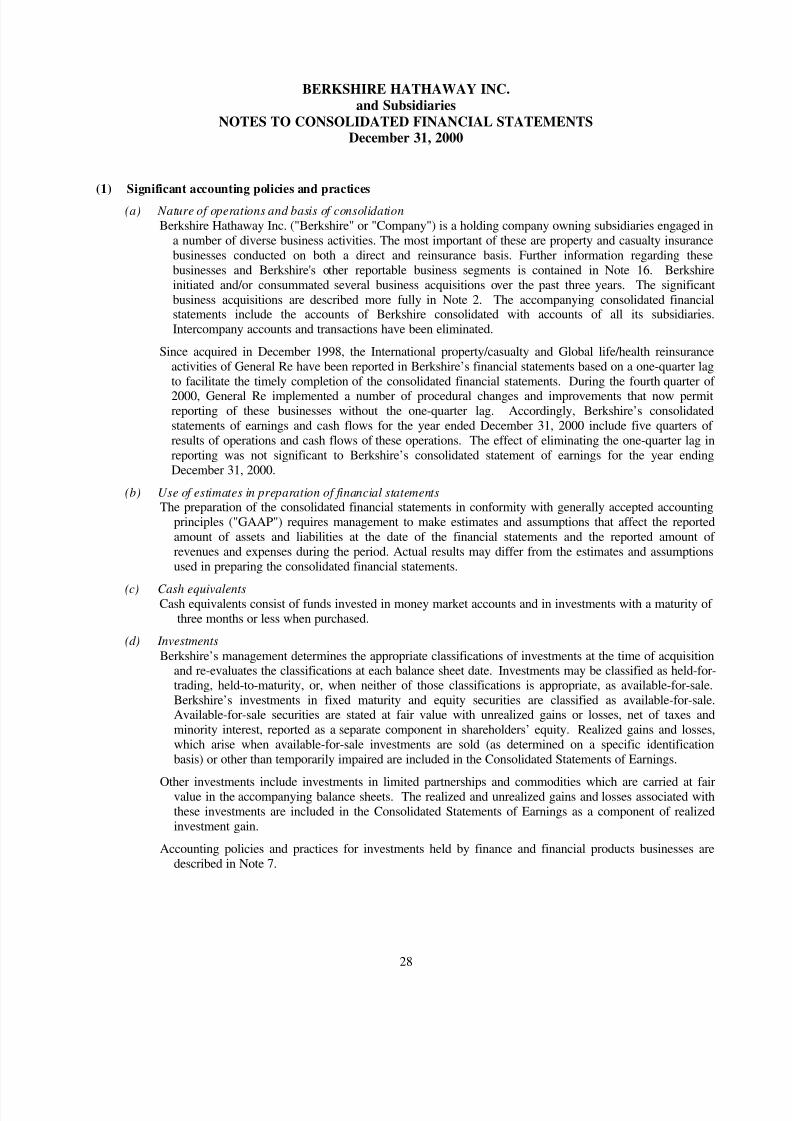
8/14/2019 Berkshire Hathaway 2000 Annual Report
http://slidepdf.com/reader/full/berkshire-hathaway-2000-annual-report 29/78
28
BERKSHIRE HATHAWAY INC.
and Subsidiaries
NOTES TO CONSOLIDATED FINANCIAL STATEMENTSDecember 31, 2000
(1) Significant accounting policies and practices
(a) Nature of operations and basis of consolidationBerkshire Hathaway Inc. ("Berkshire" or "Company") is a holding company owning subsidiaries engaged in
a number of diverse business activities. The most important of these are property and casualty insurancebusinesses conducted on both a direct and reinsurance basis. Further information regarding thesebusinesses and Berkshire's other reportable business segments is contained in Note 16. Berkshireinitiated and/or consummated several business acquisitions over the past three years. The significantbusiness acquisitions are described more fully in Note 2. The accompanying consolidated financialstatements include the accounts of Berkshire consolidated with accounts of all its subsidiaries.Intercompany accounts and transactions have been eliminated.
Since acquired in December 1998, the International property/casualty and Global life/health reinsuranceactivities of General Re have been reported in Berkshire’s financial statements based on a one-quarter lagto facilitate the timely completion of the consolidated financial statements. During the fourth quarter of
2000, General Re implemented a number of procedural changes and improvements that now permitreporting of these businesses without the one-quarter lag. Accordingly, Berkshire’s consolidatedstatements of earnings and cash flows for the year ended December 31, 2000 include five quarters of results of operations and cash flows of these operations. The effect of eliminating the one-quarter lag inreporting was not significant to Berkshire’s consolidated statement of earnings for the year endingDecember 31, 2000.
(b) Use of estimates in preparation of financial statementsThe preparation of the consolidated financial statements in conformity with generally accepted accounting
principles ("GAAP") requires management to make estimates and assumptions that affect the reportedamount of assets and liabilities at the date of the financial statements and the reported amount of revenues and expenses during the period. Actual results may differ from the estimates and assumptionsused in preparing the consolidated financial statements.
(c) Cash equivalentsCash equivalents consist of funds invested in money market accounts and in investments with a maturity of
three months or less when purchased.
(d) InvestmentsBerkshire’s management determines the appropriate classifications of investments at the time of acquisition
and re-evaluates the classifications at each balance sheet date. Investments may be classified as held-for-trading, held-to-maturity, or, when neither of those classifications is appropriate, as available-for-sale.Berkshire’s investments in fixed maturity and equity securities are classified as available-for-sale.Available-for-sale securities are stated at fair value with unrealized gains or losses, net of taxes andminority interest, reported as a separate component in shareholders’ equity. Realized gains and losses,which arise when available-for-sale investments are sold (as determined on a specific identificationbasis) or other than temporarily impaired are included in the Consolidated Statements of Earnings.
Other investments include investments in limited partnerships and commodities which are carried at fairvalue in the accompanying balance sheets. The realized and unrealized gains and losses associated withthese investments are included in the Consolidated Statements of Earnings as a component of realizedinvestment gain.
Accounting policies and practices for investments held by finance and financial products businesses aredescribed in Note 7.
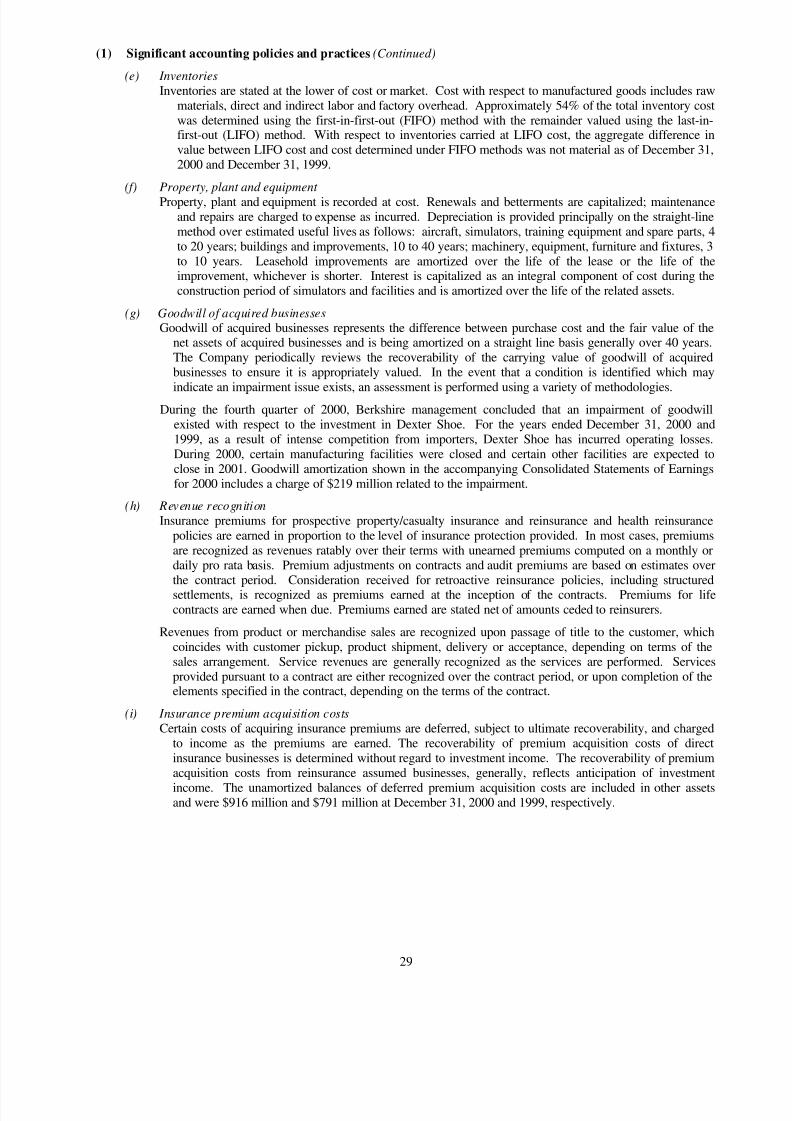
8/14/2019 Berkshire Hathaway 2000 Annual Report
http://slidepdf.com/reader/full/berkshire-hathaway-2000-annual-report 30/78
29
(1) Significant accounting policies and practices (Continued)
(e) InventoriesInventories are stated at the lower of cost or market. Cost with respect to manufactured goods includes raw
materials, direct and indirect labor and factory overhead. Approximately 54% of the total inventory costwas determined using the first-in-first-out (FIFO) method with the remainder valued using the last-in-first-out (LIFO) method. With respect to inventories carried at LIFO cost, the aggregate difference invalue between LIFO cost and cost determined under FIFO methods was not material as of December 31,2000 and December 31, 1999.
(f) Property, plant and equipment Property, plant and equipment is recorded at cost. Renewals and betterments are capitalized; maintenance
and repairs are charged to expense as incurred. Depreciation is provided principally on the straight-linemethod over estimated useful lives as follows: aircraft, simulators, training equipment and spare parts, 4to 20 years; buildings and improvements, 10 to 40 years; machinery, equipment, furniture and fixtures, 3to 10 years. Leasehold improvements are amortized over the life of the lease or the life of theimprovement, whichever is shorter. Interest is capitalized as an integral component of cost during theconstruction period of simulators and facilities and is amortized over the life of the related assets.
(g) Goodwill of acquired businessesGoodwill of acquired businesses represents the difference between purchase cost and the fair value of the
net assets of acquired businesses and is being amortized on a straight line basis generally over 40 years.The Company periodically reviews the recoverability of the carrying value of goodwill of acquiredbusinesses to ensure it is appropriately valued. In the event that a condition is identified which may
indicate an impairment issue exists, an assessment is performed using a variety of methodologies.During the fourth quarter of 2000, Berkshire management concluded that an impairment of goodwill
existed with respect to the investment in Dexter Shoe. For the years ended December 31, 2000 and1999, as a result of intense competition from importers, Dexter Shoe has incurred operating losses.During 2000, certain manufacturing facilities were closed and certain other facilities are expected toclose in 2001. Goodwill amortization shown in the accompanying Consolidated Statements of Earningsfor 2000 includes a charge of $219 million related to the impairment.
(h) Revenue recognitionInsurance premiums for prospective property/casualty insurance and reinsurance and health reinsurance
policies are earned in proportion to the level of insurance protection provided. In most cases, premiumsare recognized as revenues ratably over their terms with unearned premiums computed on a monthly ordaily pro rata basis. Premium adjustments on contracts and audit premiums are based on estimates overthe contract period. Consideration received for retroactive reinsurance policies, including structuredsettlements, is recognized as premiums earned at the inception of the contracts. Premiums for lifecontracts are earned when due. Premiums earned are stated net of amounts ceded to reinsurers.
Revenues from product or merchandise sales are recognized upon passage of title to the customer, whichcoincides with customer pickup, product shipment, delivery or acceptance, depending on terms of thesales arrangement. Service revenues are generally recognized as the services are performed. Servicesprovided pursuant to a contract are either recognized over the contract period, or upon completion of theelements specified in the contract, depending on the terms of the contract.
(i) Insurance premium acquisition costsCertain costs of acquiring insurance premiums are deferred, subject to ultimate recoverability, and charged
to income as the premiums are earned. The recoverability of premium acquisition costs of directinsurance businesses is determined without regard to investment income. The recoverability of premiumacquisition costs from reinsurance assumed businesses, generally, reflects anticipation of investment
income. The unamortized balances of deferred premium acquisition costs are included in other assetsand were $916 million and $791 million at December 31, 2000 and 1999, respectively.
8/14/2019 Berkshire Hathaway 2000 Annual Report
http://slidepdf.com/reader/full/berkshire-hathaway-2000-annual-report 31/78
30
Notes to Consolidated Financial Statements (Continued)
(1) Significant accounting polices and practices (Continued)
(j) Losses and loss adjustment expensesLiabilities for unpaid losses and loss adjustment expenses represent estimated claim and claim settlement
costs of property/casualty insurance and reinsurance contracts. The liabilities for losses and lossadjustment expenses are recorded at the estimated ultimate payment amounts, except amounts arisingfrom certain reinsurance assumed businesses are discounted. Estimated ultimate payment amounts arebased upon (1) individual case estimates, (2) estimates of incurred-but-not-reported losses, based uponpast experience and (3) reports of losses from ceding insurers.
The estimated liabilities of certain workers’ compensation claims assumed under reinsurance contracts andliabilities assumed under structured settlement reinsurance contracts are carried in the ConsolidatedBalance Sheets at discounted amounts. Discounted amounts pertaining to reinsurance of certainworkers’ compensation risks are based upon an annual discount rate of 4.5%. The discounted amountsfor structured settlement reinsurance contracts are based upon the prevailing market discount rates whenthe contracts were written and range from 5% to 13%. The periodic accretion of discounts is included inthe Consolidated Statements of Earnings as a component of losses and loss adjustment expenses. Netdiscounted liabilities were $1,531 million at December 31, 2000 and $1,529 million at December 31,1999.
(k) Deferred charges-reinsurance assumed The excess of estimated liabilities for claims and claim costs over the consideration received with respect to
retroactive property and casualty reinsurance contracts that provide for indemnification of insurance risk
is established as a deferred charge at inception of such contracts. The deferred charges are subsequentlyamortized using the interest method over the expected settlement periods of the claim liabilities. Theperiodic amortization charges are reflected in the accompanying Consolidated Statements of Earnings aslosses and loss adjustment expenses. The unamortized balance of deferred charges is included in otherassets and was $2,593 million at December 31, 2000 and $1,518 million at December 31, 1999.
(l) ReinsuranceProvisions for losses and loss adjustment expenses are reported in the accompanying Consolidated
Statements of Earnings after deducting amounts recovered and estimates of amounts that will beultimately recoverable under reinsurance contracts. Reinsurance contracts do not relieve the cedingcompany of its obligations to indemnify policyholders with respect to the underlying insurance andreinsurance contracts. Estimated losses and loss adjustment expenses recoverable under reinsurancecontracts are included in receivables and totaled $2,997 million and $2,331 million at December 31, 2000and 1999, respectively.
(m) Foreign currencyThe accounts of several foreign-based subsidiaries are measured using the local currency as the functional
currency. Revenues and expenses of these businesses are translated into U.S. dollars at the averageexchange rate for the period. Assets and liabilities are translated at the exchange rate as of the end of thereporting period. Gains or losses from translating the financial statements of foreign-based operations areincluded in shareholders’ equity as a component of other comprehensive income. Gains and lossesarising from other transactions denominated in a foreign currency are included in the ConsolidatedStatements of Earnings.
(n) Accounting pronouncements to be adopted subsequent to December 31, 2000In 1998, the Financial Accounting Standards Board (“FASB”) issued Statement of Financial Accounting
Standards (“SFAS”) No. 133, “Accounting for Derivative Instruments and Hedging Activities.” In June1999, the FASB issued SFAS No. 137, which delayed the effective date for implementing SFAS No.
133 until the beginning of 2001. In June 2000, the FASB issued SFAS No. 138, which amended certainprovisions of SFAS No. 133 with the objective of easing the implementation difficulties expected toarise. Berkshire adopted SFAS No. 133 as amended by SFAS No. 138 as of the beginning of 2001 anddoes not anticipate that the adoption of these new standards will have a material effect on its financialposition or results of operations.
(2) Significant business acquisitions
During 2000, Berkshire initiated and/or consummated eight significant business acquisitions. Six of theacquisitions were completed in 2000 and the other two were completed in early 2001. Information concerning seven of these acquisitions follows. Information concerning the other acquisition is contained in Note 3 (Investment inMidAmerican Energy Holdings Company).
8/14/2019 Berkshire Hathaway 2000 Annual Report
http://slidepdf.com/reader/full/berkshire-hathaway-2000-annual-report 32/78
31
(2) Significant business acquisitions (Continued)
CORT Business Services Corporation (“CORT”)Effective February 18, 2000, Wesco Financial Corporation, an indirect 80.1% owned subsidiary of Berkshire,
acquired CORT. CORT is a leading national provider of rental furniture, accessories and related services in the "rent-to-rent" segment of the furniture industry.
Ben Bridge Jeweler ("Ben Bridge")
Effective July 3, 2000, Berkshire acquired all of the outstanding shares of Ben Bridge common stock. Ben Bridgeis the leading operator of upscale jewelry stores based in major shopping malls in the Western United States.
Justin Industries, Inc. ("Justin")Effective August 1, 2000, Berkshire acquired 100% of the outstanding shares of Justin. Principal businesses of
Justin include: Acme Building Brands, a leading manufacturer and producer of face brick, concrete masonry productsand ceramic and marble floor and wall tile and Justin Brands, a leading manufacturer of Western footwear under anumber of brand names.
U.S. Investment Corporation ("USIC")Effective August 8, 2000, Berkshire acquired all of the outstanding shares of USIC common stock. USIC is the
parent of the United States Liability Insurance Group, one of the premier U.S. writers of specialty insurance.
Benjamin Moore & Co. (“Benjamin Moore”)Effective December 18, 2000, Berkshire acquired Benjamin Moore. Benjamin Moore is a formulator,
manufacturer and retailer of a broad range of architectural and industrial coatings, available principally in the UnitedStates and Canada.
Aggregate consideration paid for the five business acquisitions consummated in 2000 totaled $2,370 million,consisting of $2,146 million in cash and the remainder in Berkshire Class A and Class B common stock.
Shaw Industries, Inc. (“Shaw”)On October 20, 2000, Berkshire announced that it had formally entered into a merger agreement whereby it would
acquire approximately 87.3% of the common stock of Shaw for $19 per share. The transaction was completed onJanuary 8, 2001. An investment group consisting of Robert E. Shaw, Chairman and CEO of Shaw, Julian D. Saul,President of Shaw, certain family members and related family interests of Messrs. Shaw and Saul, and certain otherdirectors and members of management acquired the remaining 12.7% of Shaw.
Shaw is the world's largest manufacturer of tufted broadloom carpet and rugs for residential and commercialapplications throughout the United States and exports to most markets worldwide. Shaw markets its residential and
commercial products under a variety of brand names.
Johns Manville Corporation ("Johns Manville")On December 19, 2000, Berkshire entered into an Agreement and Plan of Merger whereby Berkshire would
acquire Johns Manville. Under the terms of the Merger Agreement, among other things, Berkshire commenced a tenderoffer to purchase all of the outstanding shares of Johns Manville common stock for $13 per share. The acquisition wascompleted on February 27, 2001.
Johns Manville is a leading manufacturer of insulation and building products. Johns Manville manufactures andmarkets products for building and equipment insulation, commercial and industrial roofing systems, high-efficiencyfiltration media, and fibers and non-woven mats used as reinforcements in building and industrial applications. JohnsManville operates manufacturing facilities in North America, Europe and China.
Berkshire paid approximately $3,830 million in cash to shareholders of Shaw and Johns Manville in connection
with the acquisitions.The results of operations for each of these entities are or will be included in Berkshire's consolidated results of
operations from the effective date of each merger. The following table sets forth certain unaudited consolidatedearnings data for the years ended December 31, 2000 and 1999, as if each of the seven acquisitions discussed abovewere consummated on the same terms at the beginning of 1999. Dollars in millions except per share amounts.
2000 1999
Total revenues.................................................................................................................... $41,396 $32,014Net earnings....................................................................................................................... 3,347 1,812
Earnings per equivalent Class A Common Share ................................................................. 2,195 1,189
8/14/2019 Berkshire Hathaway 2000 Annual Report
http://slidepdf.com/reader/full/berkshire-hathaway-2000-annual-report 33/78
32
Notes to Consolidated Financial Statements (Continued)
(2) Significant business acquisitions (Continued)
During 1998 and 1999, Berkshire completed four significant business acquisitions. Information concerning theseacquisitions follows. Effective January 7, 1998, Berkshire acquired 100% of the outstanding common stock of International Dairy Queen, Inc. ("Dairy Queen"). Dairy Queen develops, licenses and services a system of over 6,000Dairy Queen, Orange Julius and Karmelkorn stores located throughout the United States, Canada, and other foreign
countries, which feature various dairy desserts, beverages, blended fruit drinks, prepared foods, popcorn and snacks.Effective August 7, 1998, Berkshire acquired all of the outstanding common shares of Executive Jet, Inc.
("Executive Jet"). Executive Jet is the world's leading provider of fractional ownership programs for general aviationaircraft. Executive Jet currently operates its fractional ownership programs in the United States and Europe.
Effective December 21, 1998, Berkshire acquired all of the outstanding common stock of General Re Corporation("General Re"). Through its subsidiaries, General Re conducts global reinsurance and related risk managementoperations. General Re’s principal U.S. subsidiary, General Reinsurance Corporation, which together with its affiliates,comprise the largest professional property and casualty reinsurance group domiciled in the United States. General Realso owns a controlling interest in Kölnische Rückversicherungs-Gesellschaft AG ("Cologne Re"), a major internationalreinsurer. General Re operates in 28 countries and provides reinsurance coverage in 130 countries around the world.
In addition, General Re affiliates write excess and surplus lines insurance, provide reinsurance brokerage services,manage aviation insurance risks, act as business development consultants and reinsurance intermediaries and provide
specialized investment services to the insurance industry. General Re also operates as a dealer in the swap andderivatives market through Gen Re Securities Holdings Limited (formerly General Re Financial Products Corporation).
In November 1999, Berkshire acquired Jordan’s Furniture, Inc. (“Jordan’s”). Jordan’s operates a furniture retailbusiness from four locations and is believed to be the largest furniture retailer in the Massachusetts and New Hampshireareas.
Each of the business acquisitions described above was accounted for under the purchase method. The excess of thepurchase cost of the business over the fair value of net assets acquired was recorded as goodwill of acquired businesses.
(3) Investment in MidAmerican Energy Holdings Company
On October 24, 1999, Berkshire entered into an agreement along with Walter Scott, Jr. and David L. Sokol, toacquire MidAmerican Energy Holdings Company (“MidAmerican”). The transaction closed on March 14, 2000. Pursuantto the terms of the agreement, Berkshire invested approximately $1.24 billion in common stock and a non-dividend paying
convertible preferred stock of a newly formed entity that merged with and into MidAmerican, with MidAmericancontinuing as the surviving corporation. Such investment gives Berkshire about a 9.7% voting interest and a 76%economic interest in MidAmerican on a fully-diluted basis. Berkshire subsidiaries also acquired approximately $455million of an 11% non-transferable trust preferred security. Under certain conditions, for a period of up to seven yearssubsequent to the closing, Berkshire may be required to purchase up to $345 million of additional trust preferred securities.Mr. Scott, a member of Berkshire’s Board of Directors, controls approximately 86% of the voting interest in MidAmerican.Mr. Sokol is the CEO of MidAmerican.
Through its retail utility subsidiaries, MidAmerican Energy in the U.S. and Northern Electric in the U.K.,MidAmerican provides electric service to approximately 1.8 million customers and natural gas service to 1.1 millioncustomers worldwide. MidAmerican owns interests in over 10,000 net megawatts of diversified power generation facilitiesin operation, construction and development.
Berkshire’s aggregate investments in MidAmerican are included in the Consolidated Balance Sheet as Investments in
MidAmerican Energy Holdings Company. Berkshire is accounting for the common and non-dividend paying convertiblepreferred stock pursuant to the equity method. The carrying value of these equity method investments totaled $1,264million at December 31, 2000.
The Consolidated Statements of Earnings reflect, as income from MidAmerican Energy Holdings Company,Berkshire’s proportionate share of MidAmerican’s net income with respect to the investments accounted for pursuant to theequity method, as well as interest earned on the 11% trust preferred security. Income derived from equity methodinvestments totaled $66 million for the period from March 14, 2000 through December 31, 2000.
8/14/2019 Berkshire Hathaway 2000 Annual Report
http://slidepdf.com/reader/full/berkshire-hathaway-2000-annual-report 34/78
33
(4) Investments in securities with fixed maturities
The amortized cost and estimated fair values of investments in securities with fixed maturities as of December 31,2000 and 1999 are as follows (in millions):
Gross Gross Estimated
Amortized Unrealized Unrealized Fair
Cost (2) Gains Losses Value
December 31, 2000(1)
Bonds:
U.S. Treasury securities and obligations of U.S. government corporations and agencies .................. $ 3,662 $ 26 $ (9) $ 3,679
Obligations of states, municipalitiesand political subdivisions ............................................. 8,185 45 (57) 8,173
Obligations of foreign governments................................. 1,944 19 (20) 1,943Corporate bonds ............................................................. 5,918 147 (209) 5,856
Redeemable preferred stocks ............................................. 102 — (5) 97Mortgage-backed securities . .............................................. 12,609 275 (65) 12,819
$32,420 $512 $(365) $32,567
Gross Gross Estimated
Amortized Unrealized Unrealized Fair
Cost (2) Gains Losses Value
December 31, 1999(1)
Bonds:U.S. Treasury securities and obligations of
U.S. government corporations and agencies .................. $ 4,001 $ 3 $ (189) $ 3,815
Obligations of states, municipalitiesand political subdivisions ............................................. 9,029 13 (436) 8,606
Obligations of foreign governments................................. 2,208 6 (49) 2,165Corporate bonds ............................................................. 5,901 21 (237) 5,685
Redeemable preferred stocks ............................................. 133 1 (5) 129Mortgage-backed securities . .............................................. 10,157 7 (342) 9,822
$31,429 $ 51 $(1,258) $30,222
(1) Amounts above exclude securities with fixed maturities held by finance and financial products businesses. See Note 7.(2) In connection with the acquisition of General Re on December 21, 1998, fixed maturity securities with a fair value of $17.6 billion were acquired. Such amount was approximately $1.2 billion in excess of General Re’shistorical amortized cost. The unamortized excess amount was $680 million at December 31, 2000 and $940million at December 31, 1999.
Shown below are the amortized cost and estimated fair values of securities with fixed maturities at December 31,2000, by contractual maturity dates. Actual maturities will differ from contractual maturities because issuers of certain of the securities retain early call or prepayment rights. Amounts are in millions.
Estimated
Amortized Fair
Cost Value
Due in one year or less ......................................................................................... $ 4,557 $ 4,616Due after one year through five years.................................................................... 5,665 5,613
Due after five years through ten years................................................................... 4,343 4,313Due after ten years ............................................................................................... 5,246 5,206
19,811 19,748
Mortgage-backed securities .................................................................................. 12,609 12,819
$32,420 $32,567
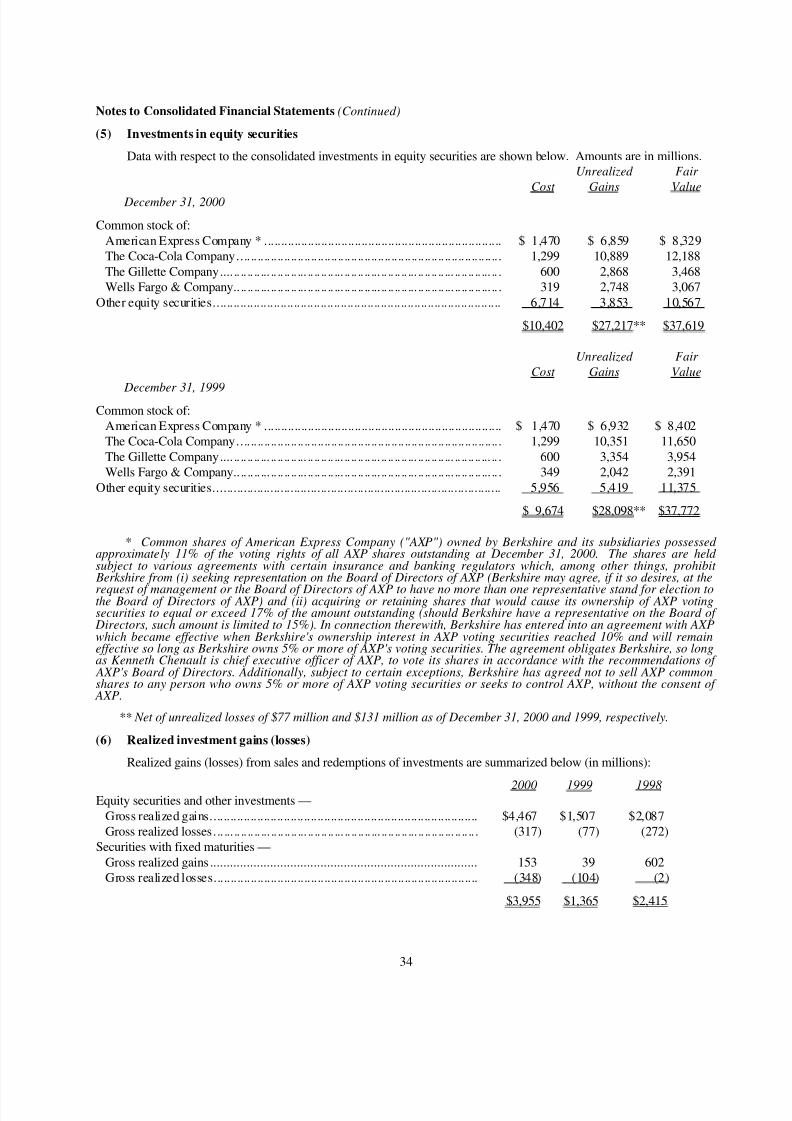
8/14/2019 Berkshire Hathaway 2000 Annual Report
http://slidepdf.com/reader/full/berkshire-hathaway-2000-annual-report 35/78
34
Notes to Consolidated Financial Statements (Continued)
(5) Investments in equity securities
Data with respect to the consolidated investments in equity securities are shown below. Amounts are in millions.Unrealized Fair
Cost Gains Value
December 31, 2000
Common stock of:
American Express Company * ....................................................................... $ 1,470 $ 6,859 $ 8,329The Coca-Cola Company............................................................................... 1,299 10,889 12,188
The Gillette Company.... .. .. .. .. ... .. .. .. .. ... .. .. .. .. ... .. .. .. .. ... .. .. .. .. ... .. .. .. .. ... .. .. .. .. ... .. . 600 2,868 3,468Wells Fargo & Company.... .. .. ... .. .. .. .. ... .. .. .. .. ... .. .. .. .. ... .. .. .. .. ... .. .. .. .. ... .. .. .. .. ... .. . 319 2,748 3,067
Other equity securities...................................................................................... 6,714 3,853 10,567
$10,402 $27,217** $37,619
Unrealized Fair
Cost Gains Value
December 31, 1999Common stock of:
American Express Company * ....................................................................... $ 1,470 $ 6,932 $ 8,402The Coca-Cola Company............................................................................... 1,299 10,351 11,650
The Gillette Company.... .. .. .. .. ... .. .. .. .. ... .. .. .. .. ... .. .. .. .. ... .. .. .. .. ... .. .. .. .. ... .. .. .. .. ... .. . 600 3,354 3,954Wells Fargo & Company.... .. .. ... .. .. .. .. ... .. .. .. .. ... .. .. .. .. ... .. .. .. .. ... .. .. .. .. ... .. .. .. .. ... .. . 349 2,042 2,391
Other equity securities...................................................................................... 5,956 5,419 11,375
$ 9,674 $28,098** $37,772
* Common shares of American Express Company ("AXP") owned by Berkshire and its subsidiaries possessed approximately 11% of the voting rights of all AXP shares outstanding at December 31, 2000. The shares are held subject to various agreements with certain insurance and banking regulators which, among other things, prohibit
Berkshire from (i) seeking representation on the Board of Directors of AXP (Berkshire may agree, if it so desires, at the
request of management or the Board of Directors of AXP to have no more than one representative stand for election tothe Board of Directors of AXP) and (ii) acquiring or retaining shares that would cause its ownership of AXP votingsecurities to equal or exceed 17% of the amount outstanding (should Berkshire have a representative on the Board of
Directors, such amount is limited to 15%). In connection therewith, Berkshire has entered into an agreement with AXPwhich became effective when Berkshire's ownership interest in AXP voting securities reached 10% and will remaineffective so long as Berkshire owns 5% or more of AXP's voting securities. The agreement obligates Berkshire, so longas Kenneth Chenault is chief executive officer of AXP, to vote its shares in accordance with the recommendations of
AXP's Board of Directors. Additionally, subject to certain exceptions, Berkshire has agreed not to sell AXP commonshares to any person who owns 5% or more of AXP voting securities or seeks to control AXP, without the consent of
AXP.
** Net of unrealized losses of $77 million and $131 million as of December 31, 2000 and 1999, respectively.
(6) Realized investment gains (losses)
Realized gains (losses) from sales and redemptions of investments are summarized below (in millions):
2000 1999 1998Equity securities and other investments —
Gross realized gains................................................................................ $4,467 $1,507 $2,087Gross realized losses... ... .. .. .. .. ... .. .. .. .. ... .. .. .. .. ... .. .. .. .. ... .. .. .. .. ... .. .. .. .. ... .. .. .. . (317) (77) (272)
Securities with fixed maturities —
Gross realized gains ................................................................................ 153 39 602Gross realized losses............................................................................... (348) (104) (2)
$3,955 $1,365 $2,415
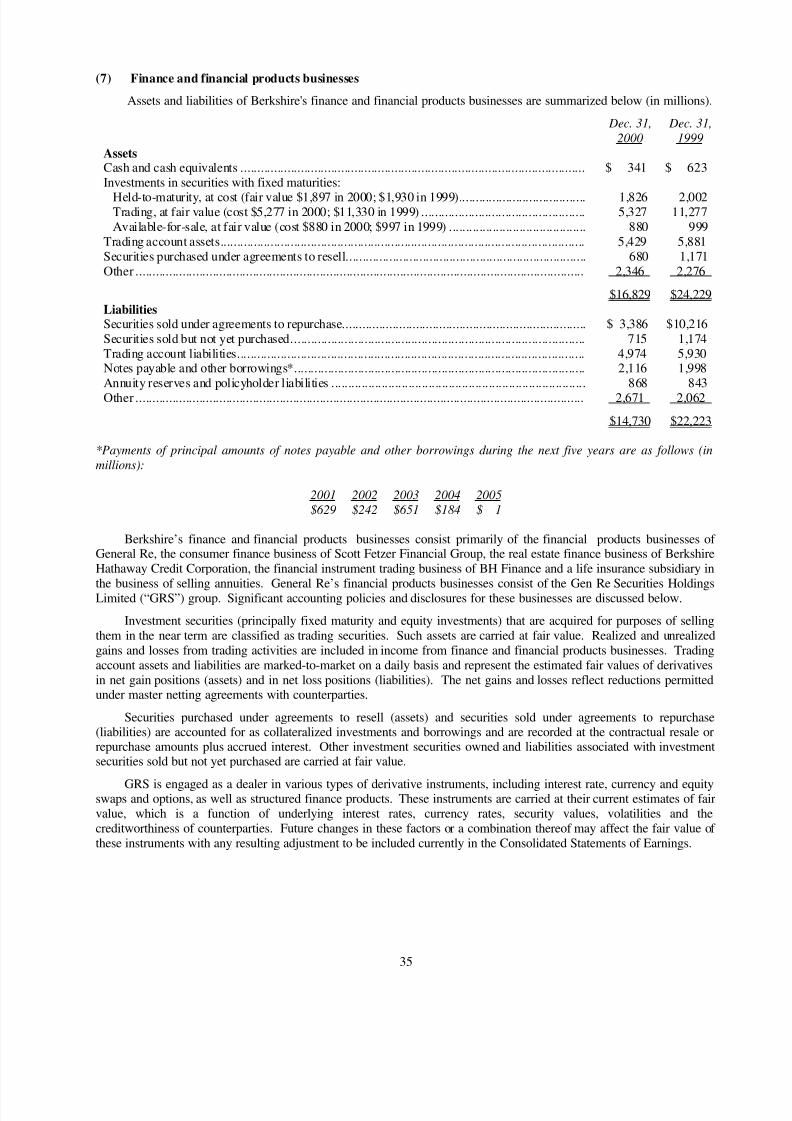
8/14/2019 Berkshire Hathaway 2000 Annual Report
http://slidepdf.com/reader/full/berkshire-hathaway-2000-annual-report 36/78
35
(7) Finance and financial products businesses
Assets and liabilities of Berkshire's finance and financial products businesses are summarized below (in millions).
Dec. 31,2000
Dec. 31,1999
AssetsCash and cash equivalents ....................................................................................................... $ 341 $ 623Investments in securities with fixed maturities:
Held-to-maturity, at cost (fair value $1,897 in 2000; $1,930 in 1999)...................................... 1,826 2,002Trading, at fair value (cost $5,277 in 2000; $11,330 in 1999) ................................................. 5,327 11,277Available-for-sale, at fair value (cost $880 in 2000; $997 in 1999) ......................................... 880 999
Trading account assets............................................................................................................. 5,429 5,881Securities purchased under agreements to resell........................................................................ 680 1,171Other ...................................................................................................................................... 2,346 2,276
$16,829 $24,229LiabilitiesSecurities sold under agreements to repurchase......................................................................... $ 3,386 $10,216Securities sold but not yet purchased........................................................................................ 715 1,174Trading account liabilities........................................................................................................ 4,974 5,930Notes payable and other borrowings*....................................................................................... 2,116 1,998Annuity reserves and policyholder liabilities ............................................................................ 868 843Other ...................................................................................................................................... 2,671 2,062
$14,730 $22,223
*Payments of principal amounts of notes payable and other borrowings during the next five years are as follows (inmillions):
2001 2002 2003 2004 2005$629 $242 $651 $184 $ 1
Berkshire’s finance and financial products businesses consist primarily of the financial products businesses of General Re, the consumer finance business of Scott Fetzer Financial Group, the real estate finance business of BerkshireHathaway Credit Corporation, the financial instrument trading business of BH Finance and a life insurance subsidiary in
the business of selling annuities. General Re’s financial products businesses consist of the Gen Re Securities HoldingsLimited (“GRS”) group. Significant accounting policies and disclosures for these businesses are discussed below.
Investment securities (principally fixed maturity and equity investments) that are acquired for purposes of sellingthem in the near term are classified as trading securities. Such assets are carried at fair value. Realized and unrealizedgains and losses from trading activities are included in income from finance and financial products businesses. Tradingaccount assets and liabilities are marked-to-market on a daily basis and represent the estimated fair values of derivativesin net gain positions (assets) and in net loss positions (liabilities). The net gains and losses reflect reductions permittedunder master netting agreements with counterparties.
Securities purchased under agreements to resell (assets) and securities sold under agreements to repurchase(liabilities) are accounted for as collateralized investments and borrowings and are recorded at the contractual resale orrepurchase amounts plus accrued interest. Other investment securities owned and liabilities associated with investmentsecurities sold but not yet purchased are carried at fair value.
GRS is engaged as a dealer in various types of derivative instruments, including interest rate, currency and equityswaps and options, as well as structured finance products. These instruments are carried at their current estimates of fairvalue, which is a function of underlying interest rates, currency rates, security values, volatilities and thecreditworthiness of counterparties. Future changes in these factors or a combination thereof may affect the fair value of these instruments with any resulting adjustment to be included currently in the Consolidated Statements of Earnings.
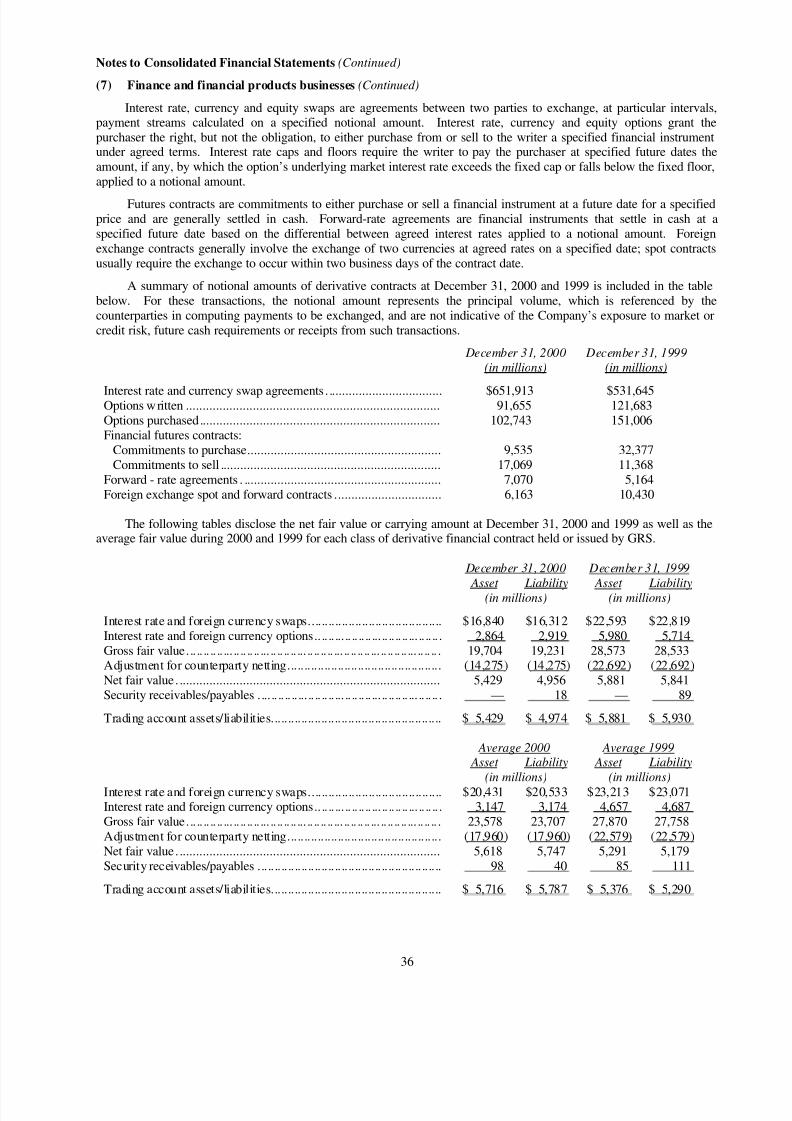
8/14/2019 Berkshire Hathaway 2000 Annual Report
http://slidepdf.com/reader/full/berkshire-hathaway-2000-annual-report 37/78
36
Notes to Consolidated Financial Statements (Continued)
(7) Finance and financial products businesses (Continued)
Interest rate, currency and equity swaps are agreements between two parties to exchange, at particular intervals,payment streams calculated on a specified notional amount. Interest rate, currency and equity options grant thepurchaser the right, but not the obligation, to either purchase from or sell to the writer a specified financial instrumentunder agreed terms. Interest rate caps and floors require the writer to pay the purchaser at specified future dates theamount, if any, by which the option’s underlying market interest rate exceeds the fixed cap or falls below the fixed floor,applied to a notional amount.
Futures contracts are commitments to either purchase or sell a financial instrument at a future date for a specifiedprice and are generally settled in cash. Forward-rate agreements are financial instruments that settle in cash at aspecified future date based on the differential between agreed interest rates applied to a notional amount. Foreignexchange contracts generally involve the exchange of two currencies at agreed rates on a specified date; spot contractsusually require the exchange to occur within two business days of the contract date.
A summary of notional amounts of derivative contracts at December 31, 2000 and 1999 is included in the tablebelow. For these transactions, the notional amount represents the principal volume, which is referenced by thecounterparties in computing payments to be exchanged, and are not indicative of the Company’s exposure to market orcredit risk, future cash requirements or receipts from such transactions.
December 31, 2000 December 31, 1999(in millions) (in millions)
Interest rate and currency swap agreements. .................................. $651,913 $531,645Options written ............................................................................ 91,655 121,683Options purchased........................................................................ 102,743 151,006Financial futures contracts:
Commitments to purchase.......................................................... 9,535 32,377Commitments to sell .................................................................. 17,069 11,368
Forward - rate agreements . ........................................................... 7,070 5,164Foreign exchange spot and forward contracts ................................ 6,163 10,430
The following tables disclose the net fair value or carrying amount at December 31, 2000 and 1999 as well as theaverage fair value during 2000 and 1999 for each class of derivative financial contract held or issued by GRS.
December 31, 2000 December 31, 1999
Asset Liability Asset Liability(in millions) (in millions)
Interest rate and foreign currency swaps........................................ $16,840 $16,312 $22,593 $22,819Interest rate and foreign currency options.. .. .. ... .. .. .. .. ... .. .. .. .. ... .. .. .. . 2,864 2,919 5,980 5,714Gross fair value... .. .. .. .. ... .. .. .. .. ... .. .. .. .. ... .. .. .. .. ... .. .. .. .. ... .. .. .. .. ... .. .. .. . 19,704 19,231 28,573 28,533Adjustment for counterparty netting.............................................. (14,275) (14,275) (22,692) (22,692)Net fair value. .............................................................................. 5,429 4,956 5,881 5,841Security receivables/payables .... .. .. .. .. ... .. .. .. .. ... .. .. .. .. ... .. .. .. .. ... .. .. .. . — 18 — 89
Trading account assets/liabilities................................................... $ 5,429 $ 4,974 $ 5,881 $ 5,930
Average 2000 Average 1999 Asset Liability Asset Liability
(in millions) (in millions)Interest rate and foreign currency swaps........................................ $20,431 $20,533 $23,213 $23,071Interest rate and foreign currency options.. .. .. ... .. .. .. .. ... .. .. .. .. ... .. .. .. . 3,147 3,174 4,657 4,687Gross fair value... .. .. .. .. ... .. .. .. .. ... .. .. .. .. ... .. .. .. .. ... .. .. .. .. ... .. .. .. .. ... .. .. .. . 23,578 23,707 27,870 27,758Adjustment for counterparty netting.............................................. (17,960) (17,960) (22,579) (22,579)Net fair value. .............................................................................. 5,618 5,747 5,291 5,179Security receivables/payables ....................................................... 98 40 85 111
Trading account assets/liabilities................................................... $ 5,716 $ 5,787 $ 5,376 $ 5,290
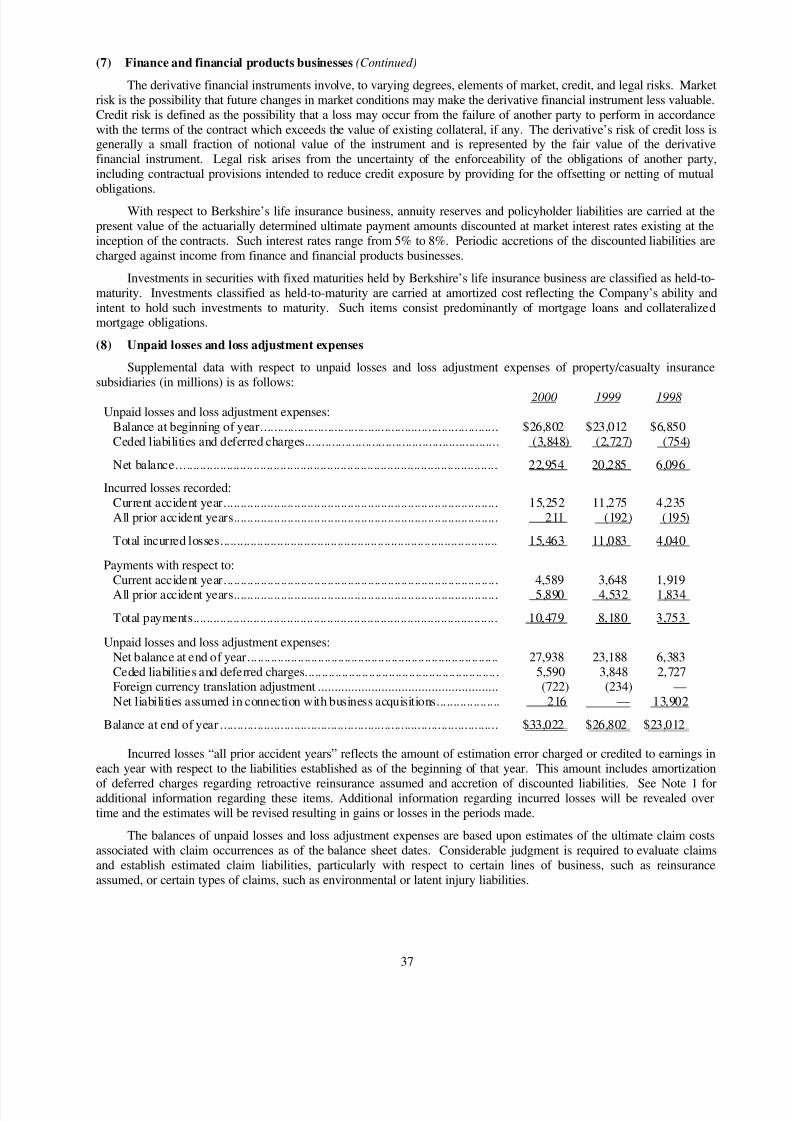
8/14/2019 Berkshire Hathaway 2000 Annual Report
http://slidepdf.com/reader/full/berkshire-hathaway-2000-annual-report 38/78
37
(7) Finance and financial products businesses (Continued)
The derivative financial instruments involve, to varying degrees, elements of market, credit, and legal risks. Marketrisk is the possibility that future changes in market conditions may make the derivative financial instrument less valuable.Credit risk is defined as the possibility that a loss may occur from the failure of another party to perform in accordancewith the terms of the contract which exceeds the value of existing collateral, if any. The derivative’s risk of credit loss isgenerally a small fraction of notional value of the instrument and is represented by the fair value of the derivativefinancial instrument. Legal risk arises from the uncertainty of the enforceability of the obligations of another party,including contractual provisions intended to reduce credit exposure by providing for the offsetting or netting of mutualobligations.
With respect to Berkshire’s life insurance business, annuity reserves and policyholder liabilities are carried at thepresent value of the actuarially determined ultimate payment amounts discounted at market interest rates existing at theinception of the contracts. Such interest rates range from 5% to 8%. Periodic accretions of the discounted liabilities arecharged against income from finance and financial products businesses.
Investments in securities with fixed maturities held by Berkshire’s life insurance business are classified as held-to-maturity. Investments classified as held-to-maturity are carried at amortized cost reflecting the Company’s ability andintent to hold such investments to maturity. Such items consist predominantly of mortgage loans and collateralizedmortgage obligations.
(8) Unpaid losses and loss adjustment expenses
Supplemental data with respect to unpaid losses and loss adjustment expenses of property/casualty insurancesubsidiaries (in millions) is as follows:
2000 1999 1998Unpaid losses and loss adjustment expenses:
Balance at beginning of year....................................................................... $26,802 $23,012 $6,850Ceded liabilities and deferred charges.......................................................... (3,848) (2,727) (754)
Net balance................................................................................................ 22,954 20,285 6,096
Incurred losses recorded:Current accident year.................................................................................. 15,252 11,275 4,235All prior accident years............................................................................... 211 (192) (195)
Total incurred losses................................................................................... 15,463 11,083 4,040
Payments with respect to:Current accident year.................................................................................. 4,589 3,648 1,919All prior accident years............................................................................... 5,890 4,532 1,834
Total payments........................................................................................... 10,479 8,180 3,753
Unpaid losses and loss adjustment expenses:Net balance at end of year........................................................................... 27,938 23,188 6,383Ceded liabilities and deferred charges.......................................................... 5,590 3,848 2,727Foreign currency translation adjustment ...................................................... (722) (234) —Net liabilities assumed in connection with business acquisitions................... 216 — 13,902
Balance at end of year ................................................................................... $33,022 $26,802 $23,012
Incurred losses “all prior accident years” reflects the amount of estimation error charged or credited to earnings ineach year with respect to the liabilities established as of the beginning of that year. This amount includes amortization
of deferred charges regarding retroactive reinsurance assumed and accretion of discounted liabilities. See Note 1 foradditional information regarding these items. Additional information regarding incurred losses will be revealed overtime and the estimates will be revised resulting in gains or losses in the periods made.
The balances of unpaid losses and loss adjustment expenses are based upon estimates of the ultimate claim costsassociated with claim occurrences as of the balance sheet dates. Considerable judgment is required to evaluate claimsand establish estimated claim liabilities, particularly with respect to certain lines of business, such as reinsuranceassumed, or certain types of claims, such as environmental or latent injury liabilities.
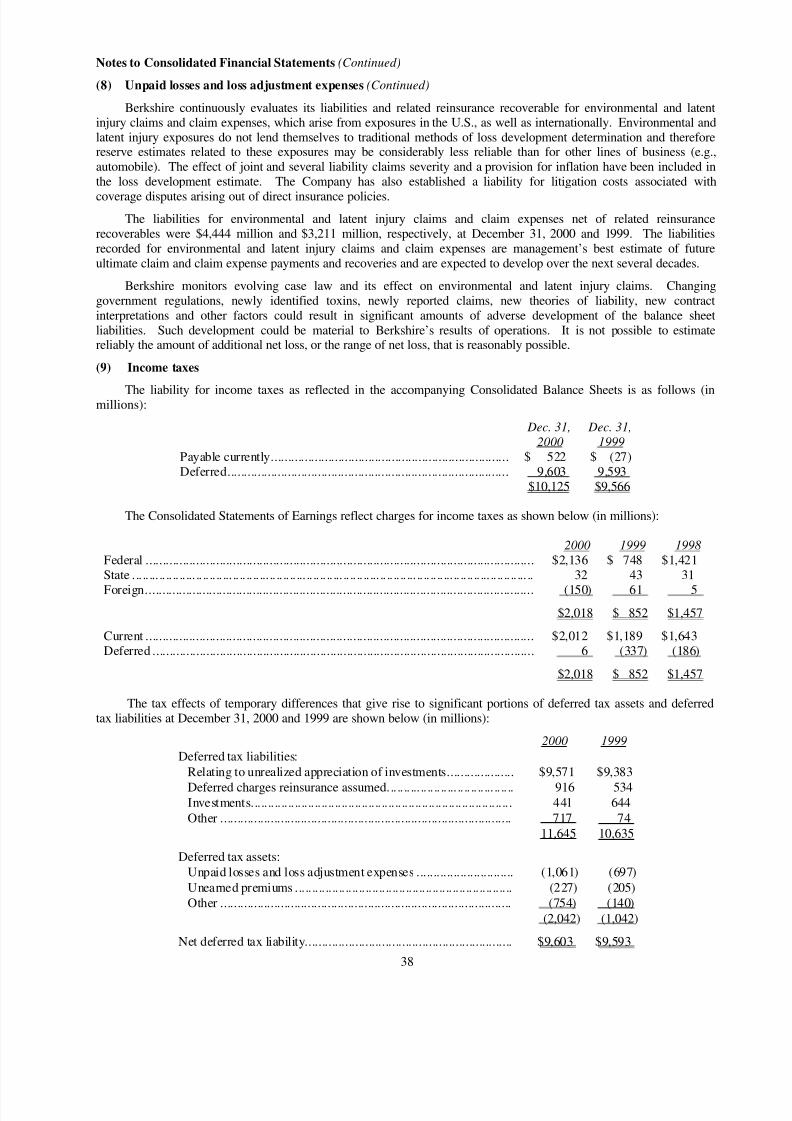
8/14/2019 Berkshire Hathaway 2000 Annual Report
http://slidepdf.com/reader/full/berkshire-hathaway-2000-annual-report 39/78
38
Notes to Consolidated Financial Statements (Continued)
(8) Unpaid losses and loss adjustment expenses (Continued)
Berkshire continuously evaluates its liabilities and related reinsurance recoverable for environmental and latentinjury claims and claim expenses, which arise from exposures in the U.S., as well as internationally. Environmental andlatent injury exposures do not lend themselves to traditional methods of loss development determination and thereforereserve estimates related to these exposures may be considerably less reliable than for other lines of business (e.g.,automobile). The effect of joint and several liability claims severity and a provision for inflation have been included inthe loss development estimate. The Company has also established a liability for litigation costs associated with
coverage disputes arising out of direct insurance policies.
The liabilities for environmental and latent injury claims and claim expenses net of related reinsurancerecoverables were $4,444 million and $3,211 million, respectively, at December 31, 2000 and 1999. The liabilitiesrecorded for environmental and latent injury claims and claim expenses are management’s best estimate of futureultimate claim and claim expense payments and recoveries and are expected to develop over the next several decades.
Berkshire monitors evolving case law and its effect on environmental and latent injury claims. Changinggovernment regulations, newly identified toxins, newly reported claims, new theories of liability, new contractinterpretations and other factors could result in significant amounts of adverse development of the balance sheetliabilities. Such development could be material to Berkshire’s results of operations. It is not possible to estimatereliably the amount of additional net loss, or the range of net loss, that is reasonably possible.
(9) Income taxes
The liability for income taxes as reflected in the accompanying Consolidated Balance Sheets is as follows (inmillions):
Dec. 31, Dec. 31,2000 1999
Payable currently....................................................................... $ 522 $ (27)Deferred.................................................................................... 9,603 9,593
$10,125 $9,566
The Consolidated Statements of Earnings reflect charges for income taxes as shown below (in millions):
2000 1999 1998Federal .................................................................................................................... $2,136 $ 748 $1,421State ... .. ... .. .. .. .. ... .. .. .. .. ... .. .. .. .. ... .. .. .. .. ... .. .. .. .. ... .. .. .. .. ... .. .. .. .. ... .. .. .. .. ... .. .. .. .. ... .. .. .. .. ... .. 32 43 31
Foreign.................................................................................................................... (150) 61 5
$2,018 $ 852 $1,457
Current .................................................................................................................... $2,012 $1,189 $1,643Deferred .................................................................................................................. 6 (337) (186)
$2,018 $ 852 $1,457
The tax effects of temporary differences that give rise to significant portions of deferred tax assets and deferredtax liabilities at December 31, 2000 and 1999 are shown below (in millions):
2000 1999
Deferred tax liabilities:
Relating to unrealized appreciation of investments.................... $9,571 $9,383
Deferred charges reinsurance assumed... .. .. ... .. .. .. .. ... .. .. .. .. ... .. .. .. 916 534Investments.............................................................................. 441 644
Other ....................................................................................... 717 7411,645 10,635
Deferred tax assets:Unpaid losses and loss adjustment expenses ............................. (1,061) (697)
Unearned premiums ................................................................. (227) (205)Other ....................................................................................... (754) (140)
(2,042) (1,042)
Net deferred tax liability.............................................................. $9,603 $9,593
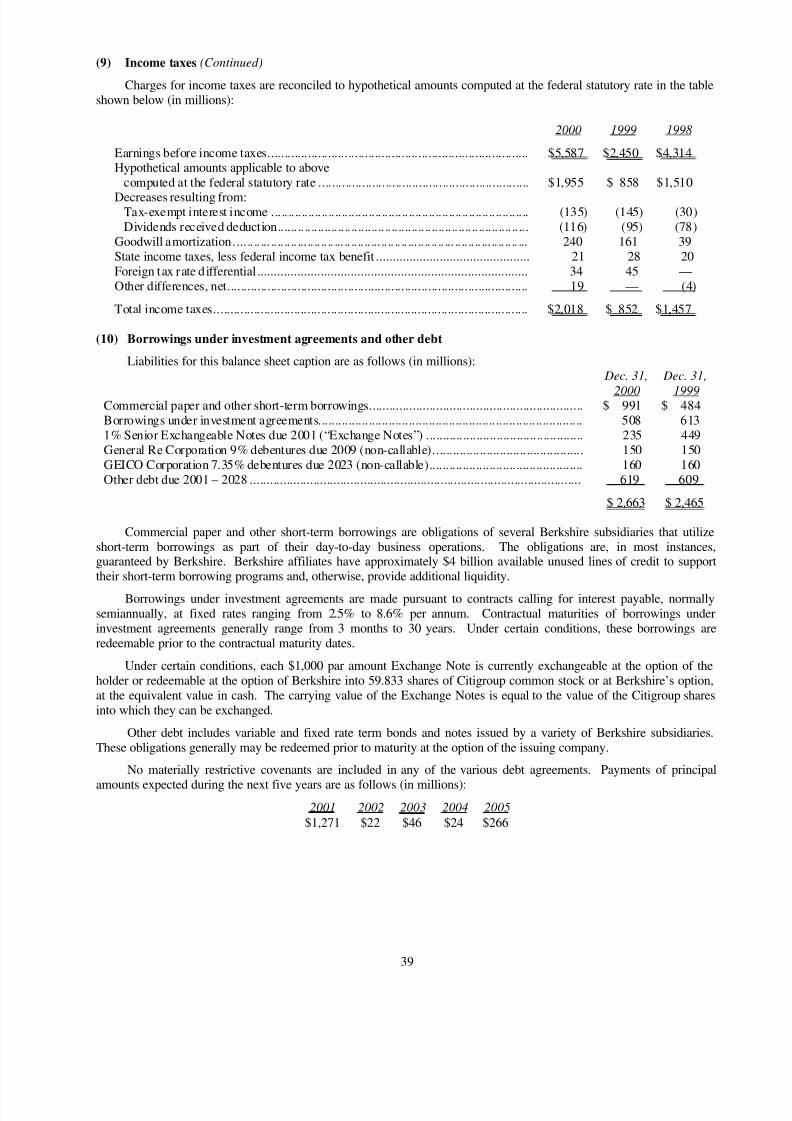
8/14/2019 Berkshire Hathaway 2000 Annual Report
http://slidepdf.com/reader/full/berkshire-hathaway-2000-annual-report 40/78
39
(9) Income taxes (Continued)
Charges for income taxes are reconciled to hypothetical amounts computed at the federal statutory rate in the tableshown below (in millions):
2000 1999 1998
Earnings before income taxes.............................................................................. $5,587 $2,450 $4,314Hypothetical amounts applicable to above
computed at the federal statutory rate ............................................................... $1,955 $ 858 $1,510
Decreases resulting from:Tax-exempt interest income ............................................................................. (135) (145) (30)Dividends received deduction........................................................................... (116) (95) (78)
Goodwill amortization.... .. .. ... .. .. .. .. ... .. .. .. .. ... .. .. .. .. ... .. .. .. .. ... .. .. .. .. ... .. .. .. .. ... .. .. .. .. ... 240 161 39State income taxes, less federal income tax benefit .............................................. 21 28 20Foreign tax rate differential ................................................................................. 34 45 —Other differences, net.......................................................................................... 19 — (4)
Total income taxes.............................................................................................. $2,018 $ 852 $1,457
(10) Borrowings under investment agreements and other debt
Liabilities for this balance sheet caption are as follows (in millions): Dec. 31, Dec. 31,
2000 1999Commercial paper and other short-term borrowings................................................................ $ 991 $ 484Borrowings under investment agreements............................................................................... 508 6131% Senior Exchangeable Notes due 2001 (“Exchange Notes”) ............................................... 235 449General Re Corporation 9% debentures due 2009 (non-callable)............................................. 150 150GEICO Corporation 7.35% debentures due 2023 (non-callable).............................................. 160 160Other debt due 2001 – 2028 ................................................................................................... 619 609
$ 2,663 $ 2,465
Commercial paper and other short-term borrowings are obligations of several Berkshire subsidiaries that utilizeshort-term borrowings as part of their day-to-day business operations. The obligations are, in most instances,guaranteed by Berkshire. Berkshire affiliates have approximately $4 billion available unused lines of credit to supporttheir short-term borrowing programs and, otherwise, provide additional liquidity.
Borrowings under investment agreements are made pursuant to contracts calling for interest payable, normallysemiannually, at fixed rates ranging from 2.5% to 8.6% per annum. Contractual maturities of borrowings underinvestment agreements generally range from 3 months to 30 years. Under certain conditions, these borrowings areredeemable prior to the contractual maturity dates.
Under certain conditions, each $1,000 par amount Exchange Note is currently exchangeable at the option of theholder or redeemable at the option of Berkshire into 59.833 shares of Citigroup common stock or at Berkshire’s option,at the equivalent value in cash. The carrying value of the Exchange Notes is equal to the value of the Citigroup sharesinto which they can be exchanged.
Other debt includes variable and fixed rate term bonds and notes issued by a variety of Berkshire subsidiaries.These obligations generally may be redeemed prior to maturity at the option of the issuing company.
No materially restrictive covenants are included in any of the various debt agreements. Payments of principal
amounts expected during the next five years are as follows (in millions):
2001 2002 2003 2004 2005
$1,271 $22 $46 $24 $266
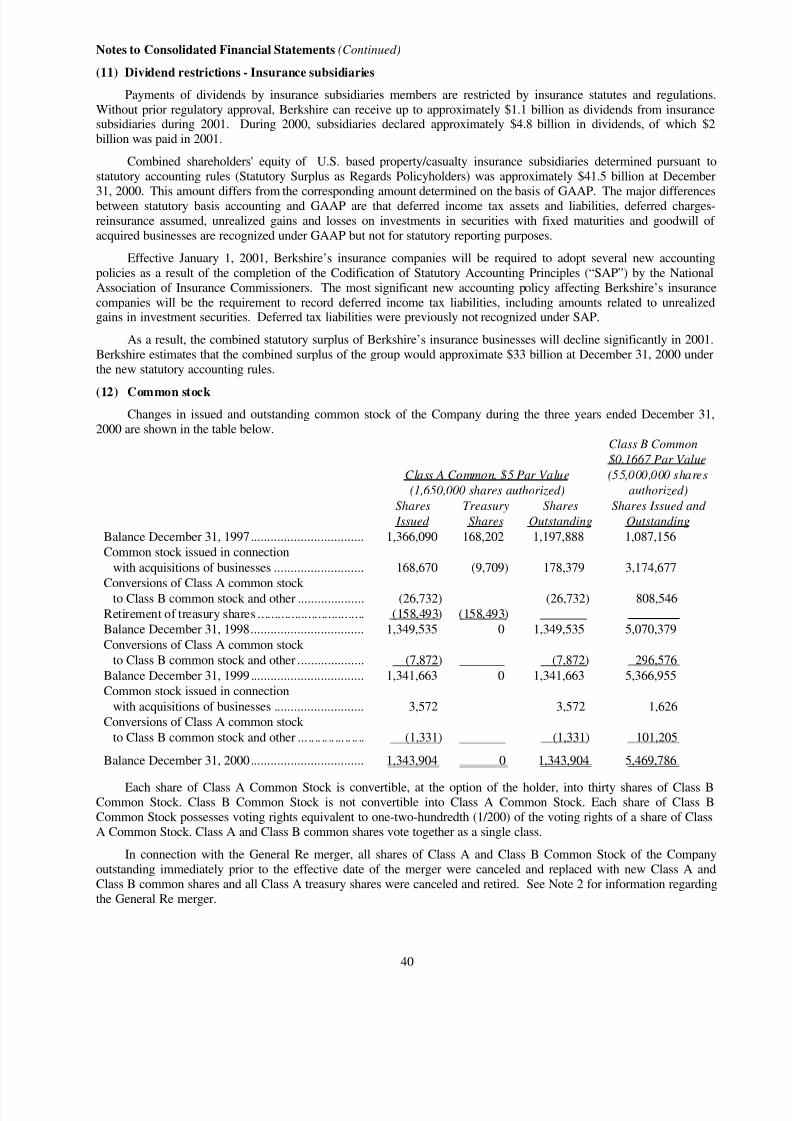
8/14/2019 Berkshire Hathaway 2000 Annual Report
http://slidepdf.com/reader/full/berkshire-hathaway-2000-annual-report 41/78
40
Notes to Consolidated Financial Statements (Continued)
(11) Dividend restrictions - Insurance subsidiaries
Payments of dividends by insurance subsidiaries members are restricted by insurance statutes and regulations.Without prior regulatory approval, Berkshire can receive up to approximately $1.1 billion as dividends from insurancesubsidiaries during 2001. During 2000, subsidiaries declared approximately $4.8 billion in dividends, of which $2billion was paid in 2001.
Combined shareholders' equity of U.S. based property/casualty insurance subsidiaries determined pursuant tostatutory accounting rules (Statutory Surplus as Regards Policyholders) was approximately $41.5 billion at December
31, 2000. This amount differs from the corresponding amount determined on the basis of GAAP. The major differencesbetween statutory basis accounting and GAAP are that deferred income tax assets and liabilities, deferred charges-reinsurance assumed, unrealized gains and losses on investments in securities with fixed maturities and goodwill of acquired businesses are recognized under GAAP but not for statutory reporting purposes.
Effective January 1, 2001, Berkshire’s insurance companies will be required to adopt several new accountingpolicies as a result of the completion of the Codification of Statutory Accounting Principles (“SAP”) by the NationalAssociation of Insurance Commissioners. The most significant new accounting policy affecting Berkshire’s insurancecompanies will be the requirement to record deferred income tax liabilities, including amounts related to unrealizedgains in investment securities. Deferred tax liabilities were previously not recognized under SAP.
As a result, the combined statutory surplus of Berkshire’s insurance businesses will decline significantly in 2001.Berkshire estimates that the combined surplus of the group would approximate $33 billion at December 31, 2000 underthe new statutory accounting rules.
(12) Common stock
Changes in issued and outstanding common stock of the Company during the three years ended December 31,2000 are shown in the table below.
Class B Common
$0.1667 Par Value
Class A Common, $5 Par Value (55,000,000 shares
(1,650,000 shares authorized) authorized)
Shares Treasury Shares Shares Issued and
Issued Shares Outstanding Outstanding
Balance December 31, 1997.................................. 1,366,090 168,202 1,197,888 1,087,156Common stock issued in connection
with acquisitions of businesses ........................... 168,670 (9,709) 178,379 3,174,677
Conversions of Class A common stock to Class B common stock and other .................... (26,732) (26,732) 808,546Retirement of treasury shares ................................ (158,493) (158,493)Balance December 31, 1998.................................. 1,349,535 0 1,349,535 5,070,379
Conversions of Class A common stock to Class B common stock and other .................... (7,872) _______ (7,872) 296,576
Balance December 31, 1999 .................................. 1,341,663 0 1,341,663 5,366,955Common stock issued in connection
with acquisitions of businesses ........................... 3,572 3,572 1,626Conversions of Class A common stock
to Class B common stock and other ... .. .. .. .. ... .. .. .. (1,331) (1,331) 101,205
Balance December 31, 2000.................................. 1,343,904 0 1,343,904 5,469,786
Each share of Class A Common Stock is convertible, at the option of the holder, into thirty shares of Class BCommon Stock. Class B Common Stock is not convertible into Class A Common Stock. Each share of Class BCommon Stock possesses voting rights equivalent to one-two-hundredth (1/200) of the voting rights of a share of ClassA Common Stock. Class A and Class B common shares vote together as a single class.
In connection with the General Re merger, all shares of Class A and Class B Common Stock of the Companyoutstanding immediately prior to the effective date of the merger were canceled and replaced with new Class A andClass B common shares and all Class A treasury shares were canceled and retired. See Note 2 for information regardingthe General Re merger.
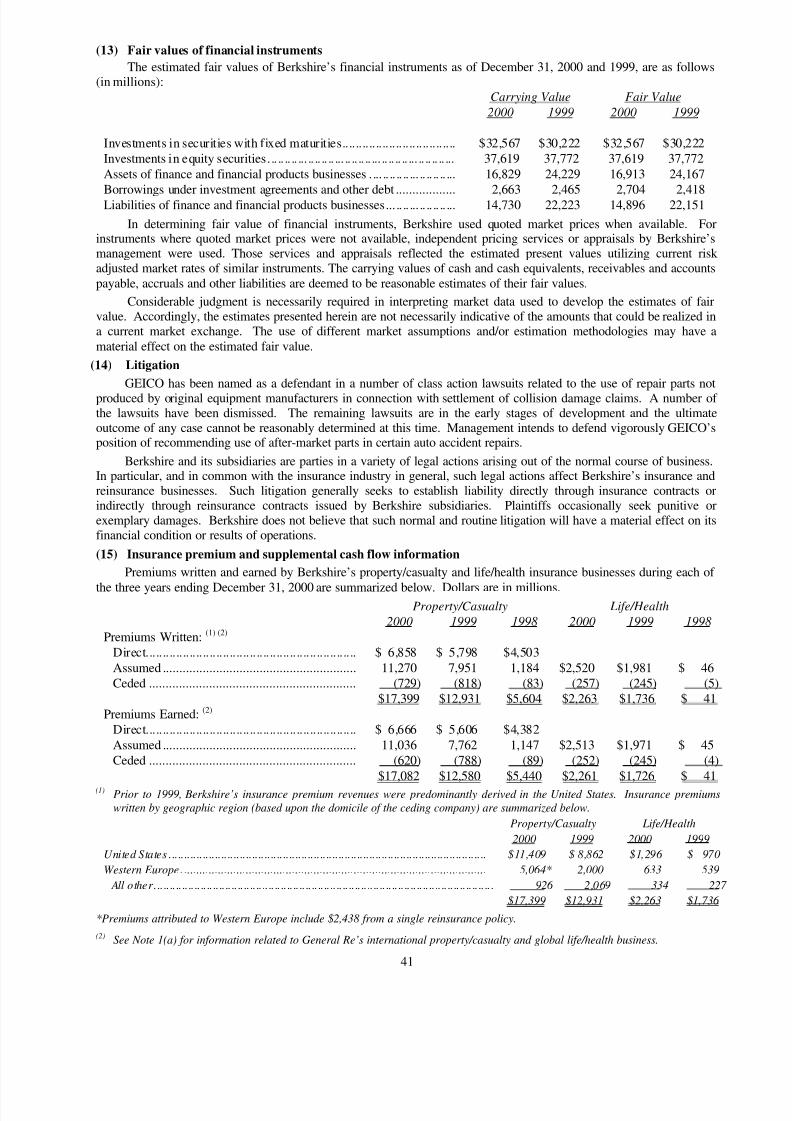
8/14/2019 Berkshire Hathaway 2000 Annual Report
http://slidepdf.com/reader/full/berkshire-hathaway-2000-annual-report 42/78
41
(13) Fair values of financial instruments
The estimated fair values of Berkshire’s financial instruments as of December 31, 2000 and 1999, are as follows(in millions):
Carrying Value Fair Value
2000 1999 2000 1999
Investments in securities with fixed maturities.................................. $32,567 $30,222 $32,567 $30,222Investments in equity securities... .. .. .. ... .. .. .. .. ... .. .. .. .. ... .. .. .. .. ... .. .. .. .. ... 37,619 37,772 37,619 37,772
Assets of finance and financial products businesses .... .. .. .. .. ... .. .. .. .. ... 16,829 24,229 16,913 24,167
Borrowings under investment agreements and other debt .................. 2,663 2,465 2,704 2,418Liabilities of finance and financial products businesses... .. .. ... .. .. .. .. ... 14,730 22,223 14,896 22,151
In determining fair value of financial instruments, Berkshire used quoted market prices when available. Forinstruments where quoted market prices were not available, independent pricing services or appraisals by Berkshire’smanagement were used. Those services and appraisals reflected the estimated present values utilizing current risk adjusted market rates of similar instruments. The carrying values of cash and cash equivalents, receivables and accountspayable, accruals and other liabilities are deemed to be reasonable estimates of their fair values.
Considerable judgment is necessarily required in interpreting market data used to develop the estimates of fairvalue. Accordingly, the estimates presented herein are not necessarily indicative of the amounts that could be realized ina current market exchange. The use of different market assumptions and/or estimation methodologies may have amaterial effect on the estimated fair value.
(14) Litigation
GEICO has been named as a defendant in a number of class action lawsuits related to the use of repair parts notproduced by original equipment manufacturers in connection with settlement of collision damage claims. A number of the lawsuits have been dismissed. The remaining lawsuits are in the early stages of development and the ultimateoutcome of any case cannot be reasonably determined at this time. Management intends to defend vigorously GEICO’sposition of recommending use of after-market parts in certain auto accident repairs.
Berkshire and its subsidiaries are parties in a variety of legal actions arising out of the normal course of business.In particular, and in common with the insurance industry in general, such legal actions affect Berkshire’s insurance andreinsurance businesses. Such litigation generally seeks to establish liability directly through insurance contracts orindirectly through reinsurance contracts issued by Berkshire subsidiaries. Plaintiffs occasionally seek punitive orexemplary damages. Berkshire does not believe that such normal and routine litigation will have a material effect on itsfinancial condition or results of operations.
(15) Insurance premium and supplemental cash flow information
Premiums written and earned by Berkshire’s property/casualty and life/health insurance businesses during each of
the three years ending December 31, 2000 are summarized below. Dollars are in millions.Property/Casualty Life/Health
2000 1999 1998 2000 1999 1998
Premiums Written: (1) (2)
Direct............................................................... $ 6,858 $ 5,798 $4,503
Assumed .......................................................... 11,270 7,951 1,184 $2,520 $1,981 $ 46Ceded .............................................................. (729) (818) (83) (257) (245) (5)
$17,399 $12,931 $5,604 $2,263 $1,736 $ 41
Premiums Earned: (2)
Direct............................................................... $ 6,666 $ 5,606 $4,382
Assumed .......................................................... 11,036 7,762 1,147 $2,513 $1,971 $ 45Ceded .............................................................. (620) (788) (89) (252) (245) (4)
$17,082 $12,580 $5,440 $2,261 $1,726 $ 41(1) Prior to 1999, Berkshire’s insurance premium revenues were predominantly derived in the United States. Insurance premiums
written by geographic region (based upon the domicile of the ceding company) are summarized below.
Property/Casualty Life/Health
2000 1999 2000 1999
United States ....................................................................................................... $11,409 $ 8,862 $1,296 $ 970
Western Europe. .................................................................................................. 5,064* 2,000 633 539
All other.............................................................................................................. 926 2,069 334 227
$17,399 $12,931 $2,263 $1,736
*Premiums attributed to Western Europe include $2,438 from a single reinsurance policy.
(2) See Note 1(a) for information related to General Re’s international property/casualty and global life/health business.
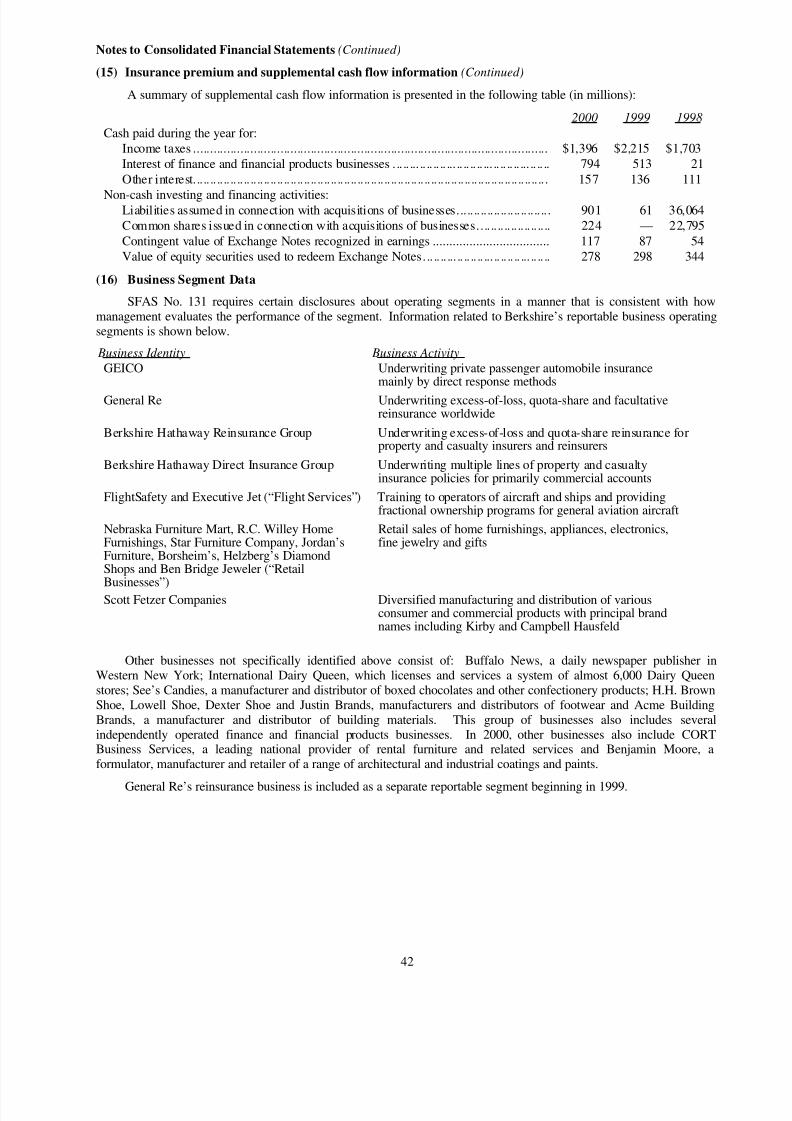
8/14/2019 Berkshire Hathaway 2000 Annual Report
http://slidepdf.com/reader/full/berkshire-hathaway-2000-annual-report 43/78
42
Notes to Consolidated Financial Statements (Continued)
(15) Insurance premium and supplemental cash flow information (Continued)
A summary of supplemental cash flow information is presented in the following table (in millions):
2000 1999 1998
Cash paid during the year for:Income taxes .......................................................................................................... $1,396 $2,215 $1,703Interest of finance and financial products businesses ... .. ... .. .. .. .. ... .. .. .. .. ... .. .. .. .. ... .. .. .. 794 513 21
Other interest.......................................................................................................... 157 136 111
Non-cash investing and financing activities:Liabilities assumed in connection with acquisitions of businesses............................ 901 61 36,064Common shares issued in connection with acquisitions of businesses...................... 224 — 22,795
Contingent value of Exchange Notes recognized in earnings ................................... 117 87 54Value of equity securities used to redeem Exchange Notes... .. .. ... .. .. .. .. ... .. .. .. .. ... .. .. .. 278 298 344
(16) Business Segment Data
SFAS No. 131 requires certain disclosures about operating segments in a manner that is consistent with howmanagement evaluates the performance of the segment. Information related to Berkshire’s reportable business operatingsegments is shown below.
Business Identity Business Activity
GEICO Underwriting private passenger automobile insurancemainly by direct response methods
General Re Underwriting excess-of-loss, quota-share and facultativereinsurance worldwide
Berkshire Hathaway Reinsurance Group Underwriting excess-of-loss and quota-share reinsurance forproperty and casualty insurers and reinsurers
Berkshire Hathaway Direct Insurance Group Underwriting multiple lines of property and casualtyinsurance policies for primarily commercial accounts
FlightSafety and Executive Jet (“Flight Services”) Training to operators of aircraft and ships and providingfractional ownership programs for general aviation aircraft
Nebraska Furniture Mart, R.C. Willey HomeFurnishings, Star Furniture Company, Jordan’sFurniture, Borsheim’s, Helzberg’s DiamondShops and Ben Bridge Jeweler (“RetailBusinesses”)
Retail sales of home furnishings, appliances, electronics,fine jewelry and gifts
Scott Fetzer Companies Diversified manufacturing and distribution of variousconsumer and commercial products with principal brandnames including Kirby and Campbell Hausfeld
Other businesses not specifically identified above consist of: Buffalo News, a daily newspaper publisher inWestern New York; International Dairy Queen, which licenses and services a system of almost 6,000 Dairy Queenstores; See’s Candies, a manufacturer and distributor of boxed chocolates and other confectionery products; H.H. BrownShoe, Lowell Shoe, Dexter Shoe and Justin Brands, manufacturers and distributors of footwear and Acme BuildingBrands, a manufacturer and distributor of building materials. This group of businesses also includes severalindependently operated finance and financial products businesses. In 2000, other businesses also include CORTBusiness Services, a leading national provider of rental furniture and related services and Benjamin Moore, aformulator, manufacturer and retailer of a range of architectural and industrial coatings and paints.
General Re’s reinsurance business is included as a separate reportable segment beginning in 1999.
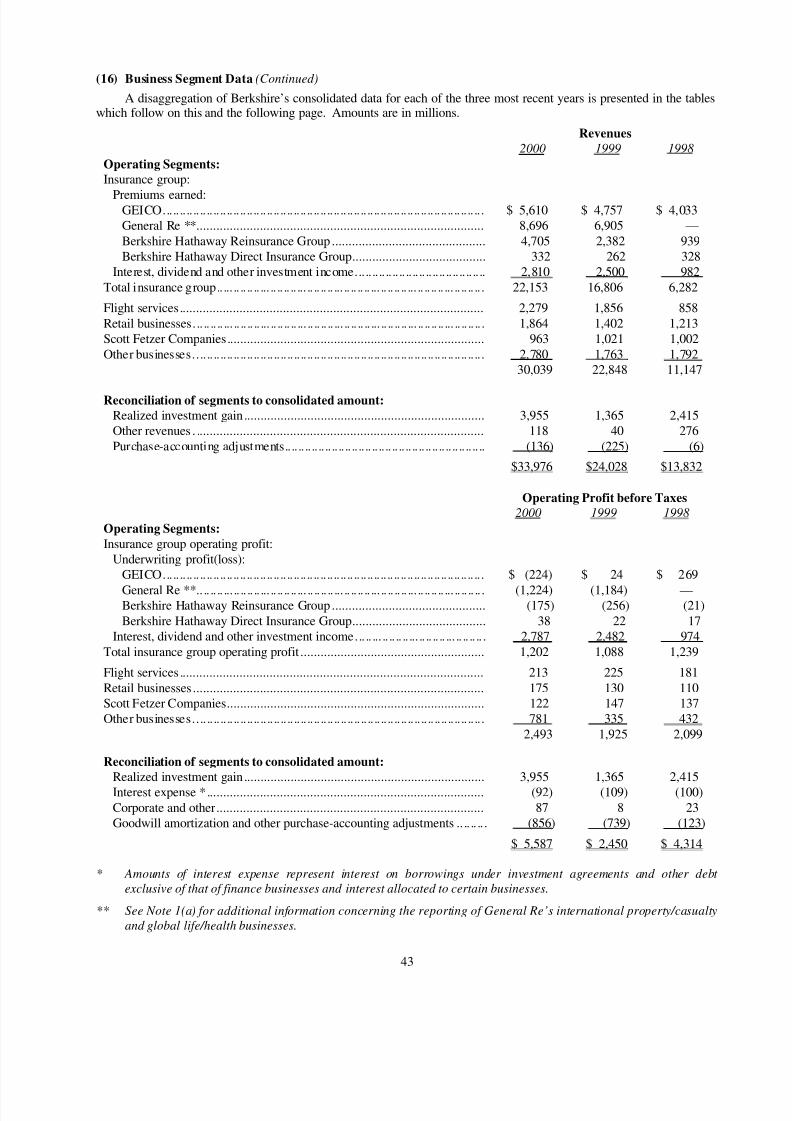
8/14/2019 Berkshire Hathaway 2000 Annual Report
http://slidepdf.com/reader/full/berkshire-hathaway-2000-annual-report 44/78
43
(16) Business Segment Data (Continued)
A disaggregation of Berkshire’s consolidated data for each of the three most recent years is presented in the tableswhich follow on this and the following page. Amounts are in millions.
Revenues
2000 1999 1998
Operating Segments:
Insurance group:
Premiums earned:GEICO................................................................................................ $ 5,610 $ 4,757 $ 4,033General Re **...................................................................................... 8,696 6,905 —
Berkshire Hathaway Reinsurance Group .............................................. 4,705 2,382 939Berkshire Hathaway Direct Insurance Group........................................ 332 262 328
Interest, dividend and other investment income....................................... 2,810 2,500 982
Total insurance group.. ... .. .. .. .. ... .. .. .. .. ... .. .. .. .. ... .. .. .. .. ... .. .. .. .. ... .. .. .. .. ... .. .. .. .. . 22,153 16,806 6,282
Flight services........................................................................................... 2,279 1,856 858
Retail businesses... .. .. .. ... .. .. .. .. ... .. .. .. .. ... .. .. .. .. ... .. .. .. .. ... .. .. .. .. ... .. .. .. .. ... .. .. .. .. . 1,864 1,402 1,213Scott Fetzer Companies............................................................................. 963 1,021 1,002
Other businesses....................................................................................... 2,780 1,763 1,79230,039 22,848 11,147
Reconciliation of segments to consolidated amount:
Realized investment gain........................................................................ 3,955 1,365 2,415Other revenues . ...................................................................................... 118 40 276
Purchase-accounting adjustments............................................................ (136) (225) (6)
$33,976 $24,028 $13,832
Operating Profit before Taxes
2000 1999 1998
Operating Segments:
Insurance group operating profit:Underwriting profit(loss):
GEICO................................................................................................ $ (224) $ 24 $ 269
General Re **.. .. .. .. ... .. .. .. .. ... .. .. .. .. ... .. .. .. .. ... .. .. .. .. ... .. .. .. .. ... .. .. .. .. ... .. .. .. .. . (1,224) (1,184) —Berkshire Hathaway Reinsurance Group .............................................. (175) (256) (21)
Berkshire Hathaway Direct Insurance Group........................................ 38 22 17Interest, dividend and other investment income... .. ... .. .. .. .. ... .. .. .. .. ... .. .. .. .. . 2,787 2,482 974
Total insurance group operating profit ....................................................... 1,202 1,088 1,239
Flight services ........................................................................................... 213 225 181
Retail businesses ....................................................................................... 175 130 110Scott Fetzer Companies............................................................................. 122 147 137Other businesses....................................................................................... 781 335 432
2,493 1,925 2,099
Reconciliation of segments to consolidated amount:
Realized investment gain........................................................................ 3,955 1,365 2,415Interest expense *................................................................................... (92) (109) (100)
Corporate and other................................................................................ 87 8 23Goodwill amortization and other purchase-accounting adjustments .. .. .. .. . (856) (739) (123)
$ 5,587 $ 2,450 $ 4,314
* Amounts of interest expense represent interest on borrowings under investment agreements and other debt exclusive of that of finance businesses and interest allocated to certain businesses.
** See Note 1(a) for additional information concerning the reporting of General Re’s international property/casualtyand global life/health businesses.
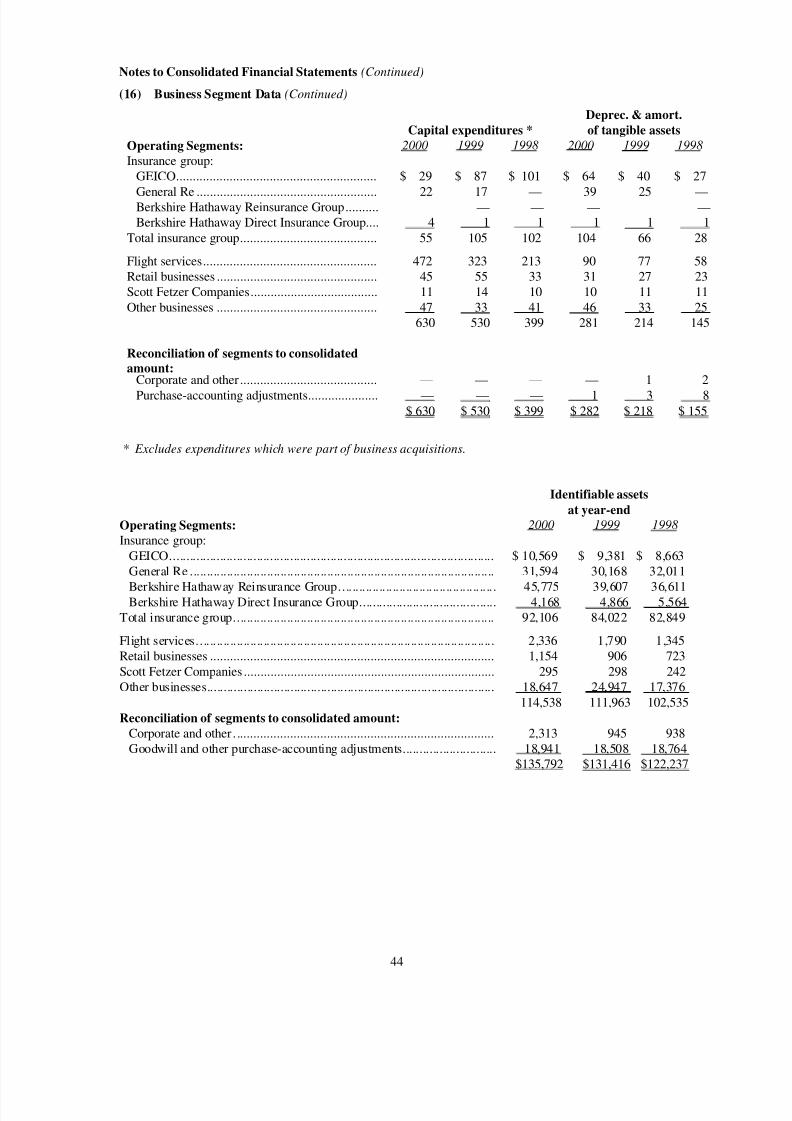
8/14/2019 Berkshire Hathaway 2000 Annual Report
http://slidepdf.com/reader/full/berkshire-hathaway-2000-annual-report 45/78
44
Notes to Consolidated Financial Statements (Continued)
(16) Business Segment Data (Continued)
Deprec. & amort.
Capital expenditures * of tangible assets
Operating Segments: 2000 1999 1998 2000 1999 1998
Insurance group:GEICO............................................................ $ 29 $ 87 $ 101 $ 64 $ 40 $ 27
General Re ...................................................... 22 17 — 39 25 —Berkshire Hathaway Reinsurance Group.......... — — — — — —Berkshire Hathaway Direct Insurance Group.... 4 1 1 1 1 1
Total insurance group......................................... 55 105 102 104 66 28
Flight services.................................................... 472 323 213 90 77 58Retail businesses ................................................ 45 55 33 31 27 23Scott Fetzer Companies...................................... 11 14 10 10 11 11
Other businesses ................................................ 47 33 41 46 33 25630 530 399 281 214 145
Reconciliation of segments to consolidated
amount:Corporate and other......................................... — — — — 1 2
Purchase-accounting adjustments..................... — — — 1 3 8$ 630 $ 530 $ 399 $ 282 $ 218 $ 155
* Excludes expenditures which were part of business acquisitions.
Identifiable assets
at year-end
Operating Segments: 2000 1999 1998
Insurance group:
GEICO................................................................................................. $ 10,569 $ 9,381 $ 8,663General Re ........................................................................................... 31,594 30,168 32,011
Berkshire Hathaway Reinsurance Group............................................... 45,775 39,607 36,611Berkshire Hathaway Direct Insurance Group......................................... 4,168 4,866 5,564
Total insurance group.............................................................................. 92,106 84,022 82,849
Flight services......................................................................................... 2,336 1,790 1,345Retail businesses ..................................................................................... 1,154 906 723
Scott Fetzer Companies ........................................................................... 295 298 242Other businesses...................................................................................... 18,647 24,947 17,376
114,538 111,963 102,535
Reconciliation of segments to consolidated amount:
Corporate and other. ............................................................................. 2,313 945 938Goodwill and other purchase-accounting adjustments............................ 18,941 18,508 18,764
$135,792 $131,416 $122,237
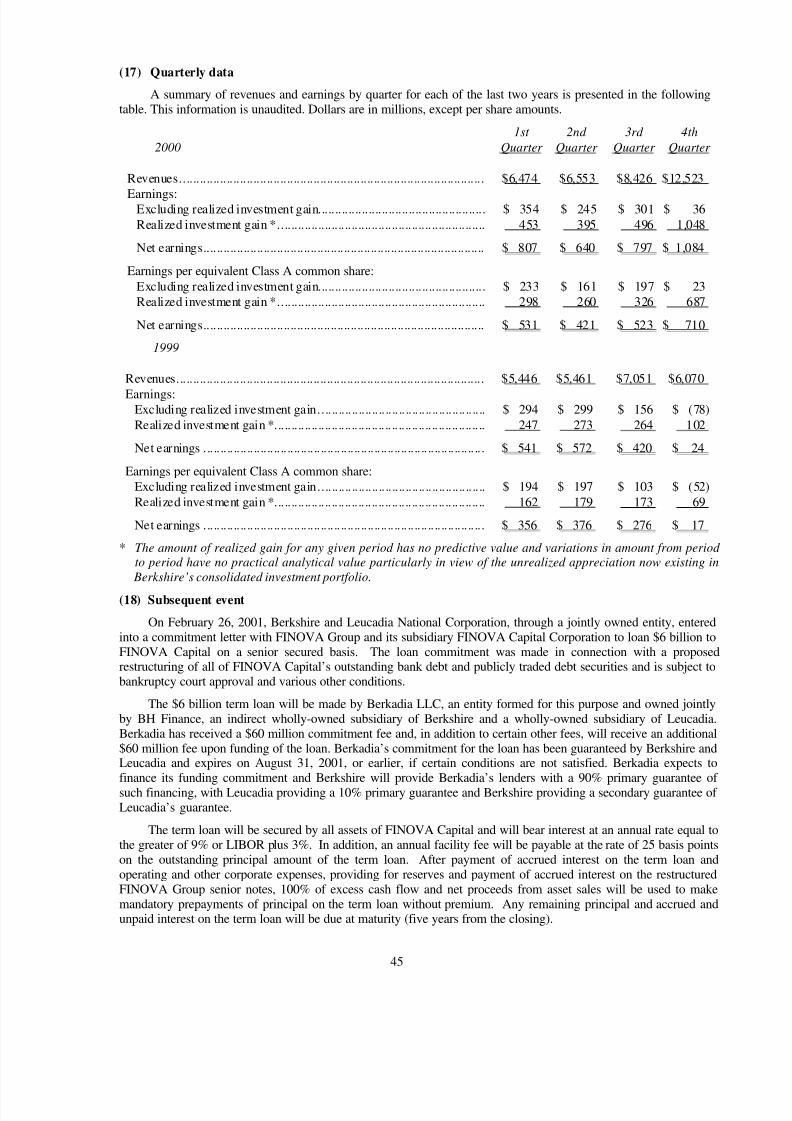
8/14/2019 Berkshire Hathaway 2000 Annual Report
http://slidepdf.com/reader/full/berkshire-hathaway-2000-annual-report 46/78
45
(17) Quarterly data
A summary of revenues and earnings by quarter for each of the last two years is presented in the followingtable. This information is unaudited. Dollars are in millions, except per share amounts.
1st 2nd 3rd 4th
2000 Quarter Quarter Quarter Quarter
Revenues........................................................................................... $6,474 $6,553 $8,426 $12,523
Earnings:Excluding realized investment gain.................................................. $ 354 $ 245 $ 301 $ 36
Realized investment gain *.............................................................. 453 395 496 1,048
Net earnings.................................................................................... $ 807 $ 640 $ 797 $ 1,084
Earnings per equivalent Class A common share:
Excluding realized investment gain.................................................. $ 233 $ 161 $ 197 $ 23Realized investment gain *.............................................................. 298 260 326 687
Net earnings.................................................................................... $ 531 $ 421 $ 523 $ 710
1999
Revenues............................................................................................ $5,446 $5,461 $7,051 $6,070
Earnings:Excluding realized investment gain.................................................. $ 294 $ 299 $ 156 $ (78)
Realized investment gain *............................................................... 247 273 264 102
Net earnings .................................................................................... $ 541 $ 572 $ 420 $ 24
Earnings per equivalent Class A common share:Excluding realized investment gain.................................................. $ 194 $ 197 $ 103 $ (52)
Realized investment gain *............................................................... 162 179 173 69
Net earnings .................................................................................... $ 356 $ 376 $ 276 $ 17
* The amount of realized gain for any given period has no predictive value and variations in amount from period to period have no practical analytical value particularly in view of the unrealized appreciation now existing in
Berkshire’s consolidated investment portfolio.
(18) Subsequent event
On February 26, 2001, Berkshire and Leucadia National Corporation, through a jointly owned entity, enteredinto a commitment letter with FINOVA Group and its subsidiary FINOVA Capital Corporation to loan $6 billion toFINOVA Capital on a senior secured basis. The loan commitment was made in connection with a proposedrestructuring of all of FINOVA Capital’s outstanding bank debt and publicly traded debt securities and is subject tobankruptcy court approval and various other conditions.
The $6 billion term loan will be made by Berkadia LLC, an entity formed for this purpose and owned jointlyby BH Finance, an indirect wholly-owned subsidiary of Berkshire and a wholly-owned subsidiary of Leucadia.Berkadia has received a $60 million commitment fee and, in addition to certain other fees, will receive an additional$60 million fee upon funding of the loan. Berkadia’s commitment for the loan has been guaranteed by Berkshire andLeucadia and expires on August 31, 2001, or earlier, if certain conditions are not satisfied. Berkadia expects tofinance its funding commitment and Berkshire will provide Berkadia’s lenders with a 90% primary guarantee of such financing, with Leucadia providing a 10% primary guarantee and Berkshire providing a secondary guarantee of Leucadia’s guarantee.
The term loan will be secured by all assets of FINOVA Capital and will bear interest at an annual rate equal tothe greater of 9% or LIBOR plus 3%. In addition, an annual facility fee will be payable at the rate of 25 basis pointson the outstanding principal amount of the term loan. After payment of accrued interest on the term loan andoperating and other corporate expenses, providing for reserves and payment of accrued interest on the restructuredFINOVA Group senior notes, 100% of excess cash flow and net proceeds from asset sales will be used to makemandatory prepayments of principal on the term loan without premium. Any remaining principal and accrued andunpaid interest on the term loan will be due at maturity (five years from the closing).
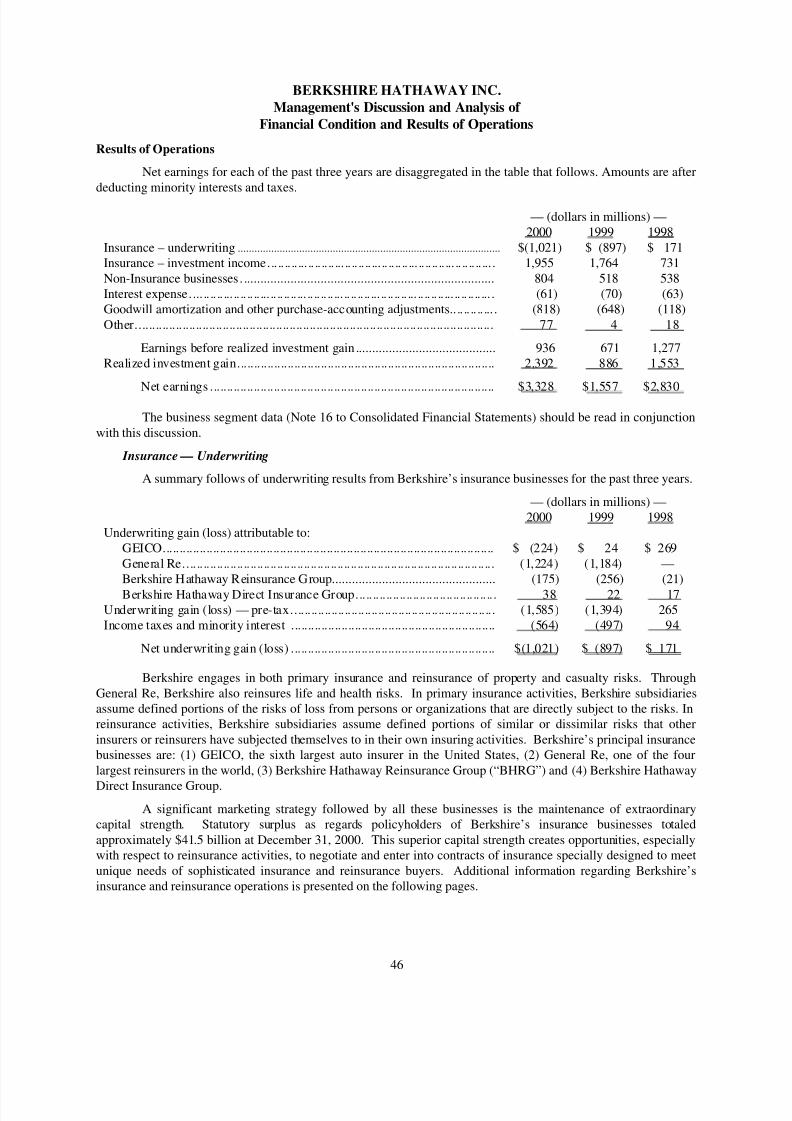
8/14/2019 Berkshire Hathaway 2000 Annual Report
http://slidepdf.com/reader/full/berkshire-hathaway-2000-annual-report 47/78
46
BERKSHIRE HATHAWAY INC.
Management's Discussion and Analysis of
Financial Condition and Results of Operations
Results of Operations
Net earnings for each of the past three years are disaggregated in the table that follows. Amounts are after
deducting minority interests and taxes.
— (dollars in millions) —2000 1999 1998
Insurance – underwriting .............................................................................................. $(1,021) $ (897) $ 171Insurance – investment income... .. .. .. ... .. .. .. .. ... .. .. .. .. ... .. .. .. .. ... .. .. .. .. ... .. .. .. .. ... . 1,955 1,764 731
Non-Insurance businesses. ........................................................................... 804 518 538Interest expense.... .. .. .. ... .. .. .. .. ... .. .. .. .. ... .. .. .. .. ... .. .. .. .. ... .. .. .. .. ... .. .. .. .. ... .. .. .. .. ... . (61) (70) (63)Goodwill amortization and other purchase-accounting adjustments.. .. .. .. .. ... . (818) (648) (118)
Other........................................................................................................... 77 4 18
Earnings before realized investment gain .......................................... 936 671 1,277Realized investment gain............................................................................. 2,392 886 1,553
Net earnings ..................................................................................... $3,328 $1,557 $2,830
The business segment data (Note 16 to Consolidated Financial Statements) should be read in conjunction
with this discussion.
Insurance — Underwriting
A summary follows of underwriting results from Berkshire’s insurance businesses for the past three years.
— (dollars in millions) —2000 1999 1998
Underwriting gain (loss) attributable to:GEICO................................................................................................... $ (224) $ 24 $ 269
General Re............................................................................................. (1,224) (1,184) —Berkshire Hathaway Reinsurance Group................................................. (175) (256) (21)
Berkshire Hathaway Direct Insurance Group.......................................... 38 22 17Underwriting gain (loss) — pre-tax............................................................. (1,585) (1,394) 265Income taxes and minority interest ............................................................. (564) (497) 94
Net underwriting gain (loss) ............................................................. $(1,021) $ (897) $ 171
Berkshire engages in both primary insurance and reinsurance of property and casualty risks. Through
General Re, Berkshire also reinsures life and health risks. In primary insurance activities, Berkshire subsidiariesassume defined portions of the risks of loss from persons or organizations that are directly subject to the risks. Inreinsurance activities, Berkshire subsidiaries assume defined portions of similar or dissimilar risks that other
insurers or reinsurers have subjected themselves to in their own insuring activities. Berkshire’s principal insurancebusinesses are: (1) GEICO, the sixth largest auto insurer in the United States, (2) General Re, one of the four
largest reinsurers in the world, (3) Berkshire Hathaway Reinsurance Group (“BHRG”) and (4) Berkshire Hathaway
Direct Insurance Group.
A significant marketing strategy followed by all these businesses is the maintenance of extraordinarycapital strength. Statutory surplus as regards policyholders of Berkshire’s insurance businesses totaled
approximately $41.5 billion at December 31, 2000. This superior capital strength creates opportunities, especiallywith respect to reinsurance activities, to negotiate and enter into contracts of insurance specially designed to meet
unique needs of sophisticated insurance and reinsurance buyers. Additional information regarding Berkshire’sinsurance and reinsurance operations is presented on the following pages.
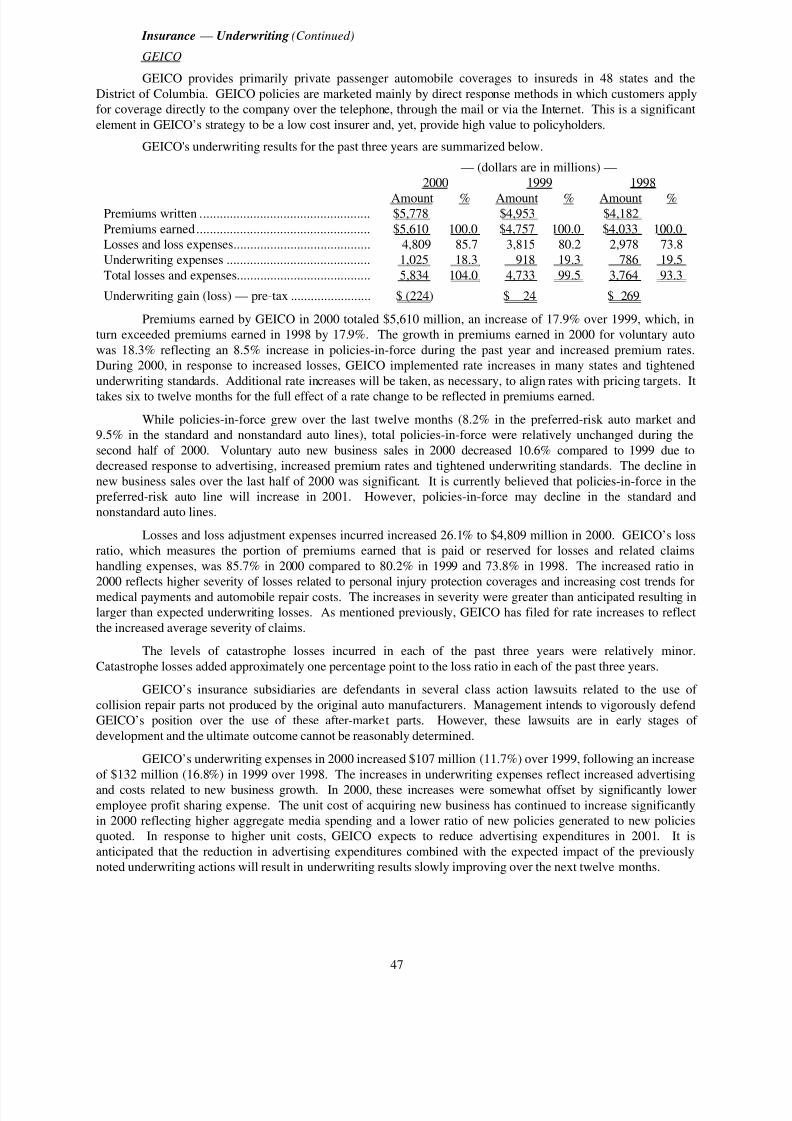
8/14/2019 Berkshire Hathaway 2000 Annual Report
http://slidepdf.com/reader/full/berkshire-hathaway-2000-annual-report 48/78
47
Insurance — Underwriting (Continued)
GEICO
GEICO provides primarily private passenger automobile coverages to insureds in 48 states and the
District of Columbia. GEICO policies are marketed mainly by direct response methods in which customers applyfor coverage directly to the company over the telephone, through the mail or via the Internet. This is a significant
element in GEICO’s strategy to be a low cost insurer and, yet, provide high value to policyholders.
GEICO's underwriting results for the past three years are summarized below.
— (dollars are in millions) —2000 1999 1998
Amount % Amount % Amount %Premiums written ................................................... $5,778 $4,953 $4,182
Premiums earned.................................................... $5,610 100.0 $4,757 100.0 $4,033 100.0Losses and loss expenses......................................... 4,809 85.7 3,815 80.2 2,978 73.8Underwriting expenses ........................................... 1,025 18.3 918 19.3 786 19.5
Total losses and expenses........................................ 5,834 104.0 4,733 99.5 3,764 93.3
Underwriting gain (loss) — pre-tax ........................ $ (224) $ 24 $ 269
Premiums earned by GEICO in 2000 totaled $5,610 million, an increase of 17.9% over 1999, which, inturn exceeded premiums earned in 1998 by 17.9%. The growth in premiums earned in 2000 for voluntary auto
was 18.3% reflecting an 8.5% increase in policies-in-force during the past year and increased premium rates.During 2000, in response to increased losses, GEICO implemented rate increases in many states and tightened
underwriting standards. Additional rate increases will be taken, as necessary, to align rates with pricing targets. It
takes six to twelve months for the full effect of a rate change to be reflected in premiums earned.
While policies-in-force grew over the last twelve months (8.2% in the preferred-risk auto market and9.5% in the standard and nonstandard auto lines), total policies-in-force were relatively unchanged during the
second half of 2000. Voluntary auto new business sales in 2000 decreased 10.6% compared to 1999 due todecreased response to advertising, increased premium rates and tightened underwriting standards. The decline in
new business sales over the last half of 2000 was significant. It is currently believed that policies-in-force in thepreferred-risk auto line will increase in 2001. However, policies-in-force may decline in the standard andnonstandard auto lines.
Losses and loss adjustment expenses incurred increased 26.1% to $4,809 million in 2000. GEICO’s lossratio, which measures the portion of premiums earned that is paid or reserved for losses and related claims
handling expenses, was 85.7% in 2000 compared to 80.2% in 1999 and 73.8% in 1998. The increased ratio in2000 reflects higher severity of losses related to personal injury protection coverages and increasing cost trends for
medical payments and automobile repair costs. The increases in severity were greater than anticipated resulting inlarger than expected underwriting losses. As mentioned previously, GEICO has filed for rate increases to reflect
the increased average severity of claims.
The levels of catastrophe losses incurred in each of the past three years were relatively minor.
Catastrophe losses added approximately one percentage point to the loss ratio in each of the past three years.
GEICO’s insurance subsidiaries are defendants in several class action lawsuits related to the use of
collision repair parts not produced by the original auto manufacturers. Management intends to vigorously defendGEICO’s position over the use of these after-market parts. However, these lawsuits are in early stages of
development and the ultimate outcome cannot be reasonably determined.
GEICO’s underwriting expenses in 2000 increased $107 million (11.7%) over 1999, following an increase
of $132 million (16.8%) in 1999 over 1998. The increases in underwriting expenses reflect increased advertising
and costs related to new business growth. In 2000, these increases were somewhat offset by significantly loweremployee profit sharing expense. The unit cost of acquiring new business has continued to increase significantlyin 2000 reflecting higher aggregate media spending and a lower ratio of new policies generated to new policiesquoted. In response to higher unit costs, GEICO expects to reduce advertising expenditures in 2001. It is
anticipated that the reduction in advertising expenditures combined with the expected impact of the previouslynoted underwriting actions will result in underwriting results slowly improving over the next twelve months.
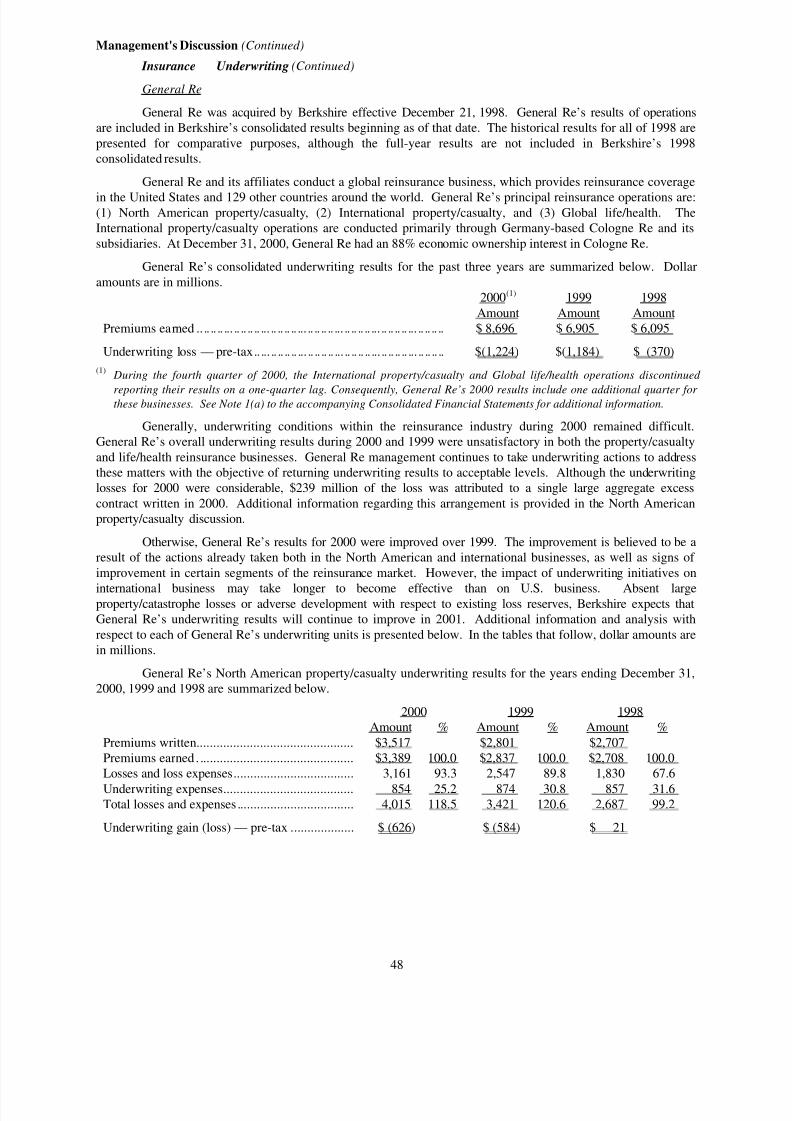
8/14/2019 Berkshire Hathaway 2000 Annual Report
http://slidepdf.com/reader/full/berkshire-hathaway-2000-annual-report 49/78
48
Management's Discussion (Continued)
Insurance — Underwriting (Continued)
General Re
General Re was acquired by Berkshire effective December 21, 1998. General Re’s results of operationsare included in Berkshire’s consolidated results beginning as of that date. The historical results for all of 1998 are
presented for comparative purposes, although the full-year results are not included in Berkshire’s 1998consolidated results.
General Re and its affiliates conduct a global reinsurance business, which provides reinsurance coverage
in the United States and 129 other countries around the world. General Re’s principal reinsurance operations are:(1) North American property/casualty, (2) International property/casualty, and (3) Global life/health. TheInternational property/casualty operations are conducted primarily through Germany-based Cologne Re and its
subsidiaries. At December 31, 2000, General Re had an 88% economic ownership interest in Cologne Re.
General Re’s consolidated underwriting results for the past three years are summarized below. Dollar
amounts are in millions.2000(1) 1999 1998
Amount Amount AmountPremiums earned .. .. .. .. ... .. .. .. .. ... .. .. .. .. ... .. .. .. .. ... .. .. .. .. ... .. .. .. .. ... .. .. .. .. $ 8,696 $ 6,905 $ 6,095
Underwriting loss — pre-tax.. ... .. .. .. .. ... .. .. .. .. ... .. .. .. .. ... .. .. .. .. ... .. .. .. .. $(1,224) $(1,184) $ (370)
(1) During the fourth quarter of 2000, the International property/casualty and Global life/health operations discontinued
reporting their results on a one-quarter lag. Consequently, General Re’s 2000 results include one additional quarter for these businesses. See Note 1(a) to the accompanying Consolidated Financial Statements for additional information.
Generally, underwriting conditions within the reinsurance industry during 2000 remained difficult.General Re’s overall underwriting results during 2000 and 1999 were unsatisfactory in both the property/casualty
and life/health reinsurance businesses. General Re management continues to take underwriting actions to addressthese matters with the objective of returning underwriting results to acceptable levels. Although the underwritinglosses for 2000 were considerable, $239 million of the loss was attributed to a single large aggregate excess
contract written in 2000. Additional information regarding this arrangement is provided in the North Americanproperty/casualty discussion.
Otherwise, General Re’s results for 2000 were improved over 1999. The improvement is believed to be aresult of the actions already taken both in the North American and international businesses, as well as signs of
improvement in certain segments of the reinsurance market. However, the impact of underwriting initiatives on
international business may take longer to become effective than on U.S. business. Absent largeproperty/catastrophe losses or adverse development with respect to existing loss reserves, Berkshire expects thatGeneral Re’s underwriting results will continue to improve in 2001. Additional information and analysis with
respect to each of General Re’s underwriting units is presented below. In the tables that follow, dollar amounts arein millions.
General Re’s North American property/casualty underwriting results for the years ending December 31,2000, 1999 and 1998 are summarized below.
2000 1999 1998Amount % Amount % Amount %
Premiums written............................................... $3,517 $2,801 $2,707Premiums earned . .............................................. $3,389 100.0 $2,837 100.0 $2,708 100.0Losses and loss expenses.................................... 3,161 93.3 2,547 89.8 1,830 67.6
Underwriting expenses....................................... 854 25.2 874 30.8 857 31.6Total losses and expenses ................................... 4,015 118.5 3,421 120.6 2,687 99.2
Underwriting gain (loss) — pre-tax ................... $ (626) $ (584) $ 21
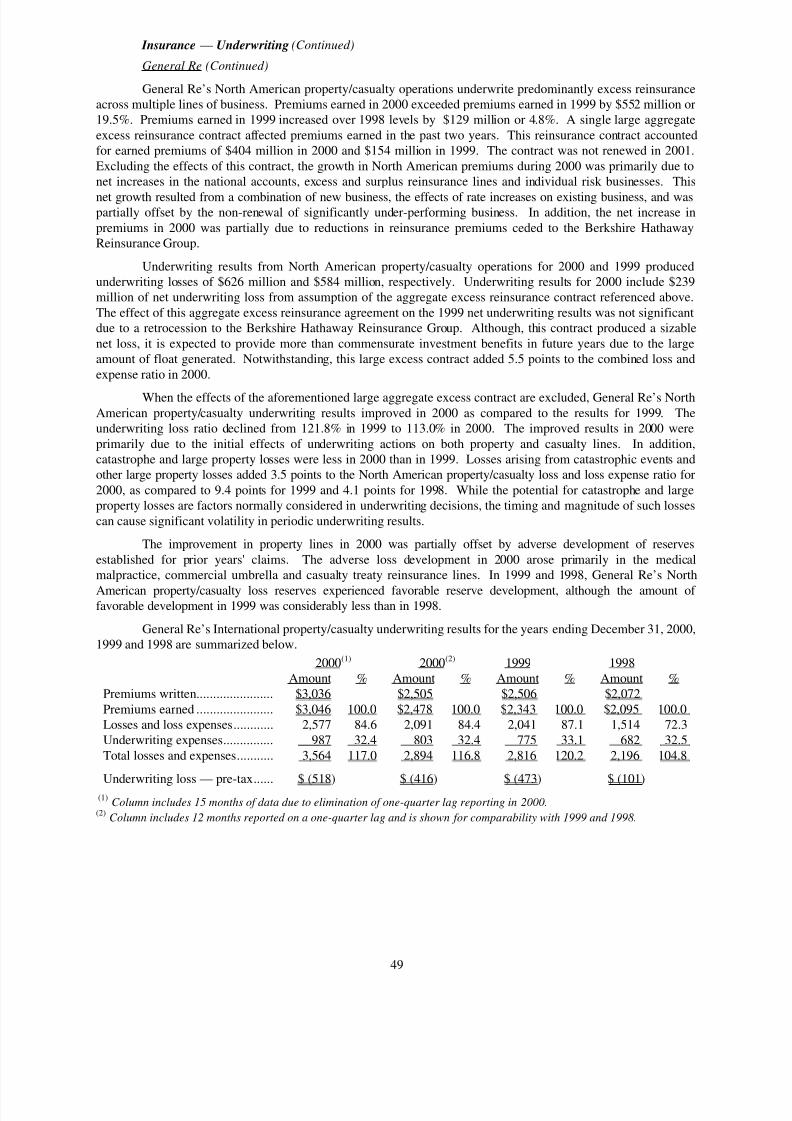
8/14/2019 Berkshire Hathaway 2000 Annual Report
http://slidepdf.com/reader/full/berkshire-hathaway-2000-annual-report 50/78
49
Insurance — Underwriting (Continued)
General Re (Continued)
General Re’s North American property/casualty operations underwrite predominantly excess reinsuranceacross multiple lines of business. Premiums earned in 2000 exceeded premiums earned in 1999 by $552 million or19.5%. Premiums earned in 1999 increased over 1998 levels by $129 million or 4.8%. A single large aggregate
excess reinsurance contract affected premiums earned in the past two years. This reinsurance contract accountedfor earned premiums of $404 million in 2000 and $154 million in 1999. The contract was not renewed in 2001.
Excluding the effects of this contract, the growth in North American premiums during 2000 was primarily due tonet increases in the national accounts, excess and surplus reinsurance lines and individual risk businesses. This
net growth resulted from a combination of new business, the effects of rate increases on existing business, and waspartially offset by the non-renewal of significantly under-performing business. In addition, the net increase in
premiums in 2000 was partially due to reductions in reinsurance premiums ceded to the Berkshire HathawayReinsurance Group.
Underwriting results from North American property/casualty operations for 2000 and 1999 producedunderwriting losses of $626 million and $584 million, respectively. Underwriting results for 2000 include $239million of net underwriting loss from assumption of the aggregate excess reinsurance contract referenced above.
The effect of this aggregate excess reinsurance agreement on the 1999 net underwriting results was not significantdue to a retrocession to the Berkshire Hathaway Reinsurance Group. Although, this contract produced a sizable
net loss, it is expected to provide more than commensurate investment benefits in future years due to the largeamount of float generated. Notwithstanding, this large excess contract added 5.5 points to the combined loss and
expense ratio in 2000.
When the effects of the aforementioned large aggregate excess contract are excluded, General Re’s NorthAmerican property/casualty underwriting results improved in 2000 as compared to the results for 1999. Theunderwriting loss ratio declined from 121.8% in 1999 to 113.0% in 2000. The improved results in 2000 were
primarily due to the initial effects of underwriting actions on both property and casualty lines. In addition,catastrophe and large property losses were less in 2000 than in 1999. Losses arising from catastrophic events andother large property losses added 3.5 points to the North American property/casualty loss and loss expense ratio for
2000, as compared to 9.4 points for 1999 and 4.1 points for 1998. While the potential for catastrophe and largeproperty losses are factors normally considered in underwriting decisions, the timing and magnitude of such losses
can cause significant volatility in periodic underwriting results.
The improvement in property lines in 2000 was partially offset by adverse development of reserves
established for prior years' claims. The adverse loss development in 2000 arose primarily in the medicalmalpractice, commercial umbrella and casualty treaty reinsurance lines. In 1999 and 1998, General Re’s North
American property/casualty loss reserves experienced favorable reserve development, although the amount of favorable development in 1999 was considerably less than in 1998.
General Re’s International property/casualty underwriting results for the years ending December 31, 2000,1999 and 1998 are summarized below.
2000(1) 2000(2) 1999 1998
Amount % Amount % Amount % Amount %Premiums written....................... $3,036 $2,505 $2,506 $2,072
Premiums earned ....................... $3,046 100.0 $2,478 100.0 $2,343 100.0 $2,095 100.0Losses and loss expenses............ 2,577 84.6 2,091 84.4 2,041 87.1 1,514 72.3Underwriting expenses............... 987 32.4 803 32.4 775 33.1 682 32.5
Total losses and expenses........... 3,564 117.0 2,894 116.8 2,816 120.2 2,196 104.8
Underwriting loss — pre-tax...... $ (518) $ (416) $ (473) $ (101)
(1) Column includes 15 months of data due to elimination of one-quarter lag reporting in 2000.(2) Column includes 12 months reported on a one-quarter lag and is shown for comparability with 1999 and 1998.
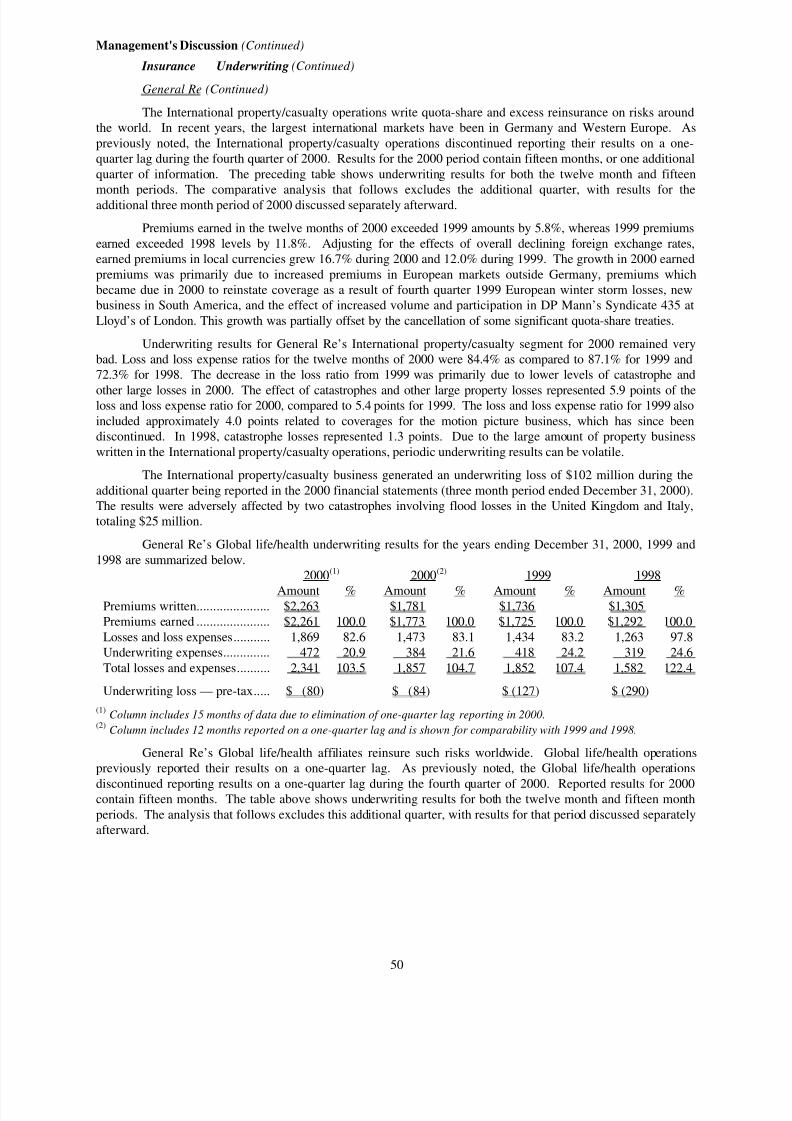
8/14/2019 Berkshire Hathaway 2000 Annual Report
http://slidepdf.com/reader/full/berkshire-hathaway-2000-annual-report 51/78
50
Management's Discussion (Continued)
Insurance — Underwriting (Continued)
General Re (Continued)
The International property/casualty operations write quota-share and excess reinsurance on risks aroundthe world. In recent years, the largest international markets have been in Germany and Western Europe. As
previously noted, the International property/casualty operations discontinued reporting their results on a one-quarter lag during the fourth quarter of 2000. Results for the 2000 period contain fifteen months, or one additional
quarter of information. The preceding table shows underwriting results for both the twelve month and fifteen
month periods. The comparative analysis that follows excludes the additional quarter, with results for theadditional three month period of 2000 discussed separately afterward.
Premiums earned in the twelve months of 2000 exceeded 1999 amounts by 5.8%, whereas 1999 premiums
earned exceeded 1998 levels by 11.8%. Adjusting for the effects of overall declining foreign exchange rates,earned premiums in local currencies grew 16.7% during 2000 and 12.0% during 1999. The growth in 2000 earned
premiums was primarily due to increased premiums in European markets outside Germany, premiums whichbecame due in 2000 to reinstate coverage as a result of fourth quarter 1999 European winter storm losses, newbusiness in South America, and the effect of increased volume and participation in DP Mann’s Syndicate 435 at
Lloyd’s of London. This growth was partially offset by the cancellation of some significant quota-share treaties.
Underwriting results for General Re’s International property/casualty segment for 2000 remained verybad. Loss and loss expense ratios for the twelve months of 2000 were 84.4% as compared to 87.1% for 1999 and72.3% for 1998. The decrease in the loss ratio from 1999 was primarily due to lower levels of catastrophe and
other large losses in 2000. The effect of catastrophes and other large property losses represented 5.9 points of theloss and loss expense ratio for 2000, compared to 5.4 points for 1999. The loss and loss expense ratio for 1999 also
included approximately 4.0 points related to coverages for the motion picture business, which has since beendiscontinued. In 1998, catastrophe losses represented 1.3 points. Due to the large amount of property business
written in the International property/casualty operations, periodic underwriting results can be volatile.
The International property/casualty business generated an underwriting loss of $102 million during the
additional quarter being reported in the 2000 financial statements (three month period ended December 31, 2000).The results were adversely affected by two catastrophes involving flood losses in the United Kingdom and Italy,totaling $25 million.
General Re’s Global life/health underwriting results for the years ending December 31, 2000, 1999 and
1998 are summarized below.2000(1) 2000(2) 1999 1998
Amount % Amount % Amount % Amount %Premiums written...................... $2,263 $1,781 $1,736 $1,305Premiums earned ...................... $2,261 100.0 $1,773 100.0 $1,725 100.0 $1,292 100.0
Losses and loss expenses........... 1,869 82.6 1,473 83.1 1,434 83.2 1,263 97.8Underwriting expenses.............. 472 20.9 384 21.6 418 24.2 319 24.6
Total losses and expenses.......... 2,341 103.5 1,857 104.7 1,852 107.4 1,582 122.4
Underwriting loss — pre-tax..... $ (80) $ (84) $ (127) $ (290)
(1) Column includes 15 months of data due to elimination of one-quarter lag reporting in 2000.(2) Column includes 12 months reported on a one-quarter lag and is shown for comparability with 1999 and 1998.
General Re’s Global life/health affiliates reinsure such risks worldwide. Global life/health operationspreviously reported their results on a one-quarter lag. As previously noted, the Global life/health operations
discontinued reporting results on a one-quarter lag during the fourth quarter of 2000. Reported results for 2000contain fifteen months. The table above shows underwriting results for both the twelve month and fifteen month
periods. The analysis that follows excludes this additional quarter, with results for that period discussed separatelyafterward.
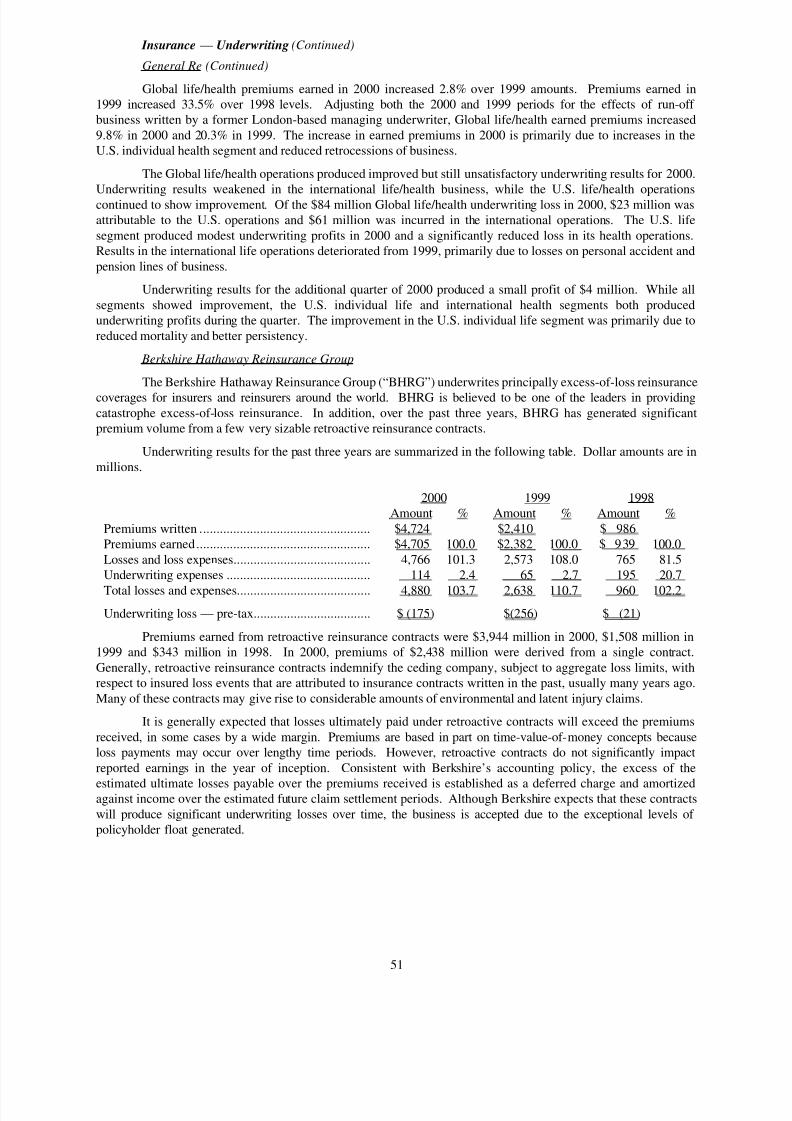
8/14/2019 Berkshire Hathaway 2000 Annual Report
http://slidepdf.com/reader/full/berkshire-hathaway-2000-annual-report 52/78
51
Insurance — Underwriting (Continued)
General Re (Continued)
Global life/health premiums earned in 2000 increased 2.8% over 1999 amounts. Premiums earned in1999 increased 33.5% over 1998 levels. Adjusting both the 2000 and 1999 periods for the effects of run-off business written by a former London-based managing underwriter, Global life/health earned premiums increased
9.8% in 2000 and 20.3% in 1999. The increase in earned premiums in 2000 is primarily due to increases in theU.S. individual health segment and reduced retrocessions of business.
The Global life/health operations produced improved but still unsatisfactory underwriting results for 2000.Underwriting results weakened in the international life/health business, while the U.S. life/health operations
continued to show improvement. Of the $84 million Global life/health underwriting loss in 2000, $23 million wasattributable to the U.S. operations and $61 million was incurred in the international operations. The U.S. life
segment produced modest underwriting profits in 2000 and a significantly reduced loss in its health operations.Results in the international life operations deteriorated from 1999, primarily due to losses on personal accident and
pension lines of business.
Underwriting results for the additional quarter of 2000 produced a small profit of $4 million. While all
segments showed improvement, the U.S. individual life and international health segments both producedunderwriting profits during the quarter. The improvement in the U.S. individual life segment was primarily due to
reduced mortality and better persistency.
Berkshire Hathaway Reinsurance Group
The Berkshire Hathaway Reinsurance Group (“BHRG”) underwrites principally excess-of-loss reinsurance
coverages for insurers and reinsurers around the world. BHRG is believed to be one of the leaders in providingcatastrophe excess-of-loss reinsurance. In addition, over the past three years, BHRG has generated significantpremium volume from a few very sizable retroactive reinsurance contracts.
Underwriting results for the past three years are summarized in the following table. Dollar amounts are inmillions.
2000 1999 1998Amount % Amount % Amount %
Premiums written ................................................... $4,724 $2,410 $ 986Premiums earned.................................................... $4,705 100.0 $2,382 100.0 $ 939 100.0
Losses and loss expenses......................................... 4,766 101.3 2,573 108.0 765 81.5Underwriting expenses ........................................... 114 2.4 65 2.7 195 20.7
Total losses and expenses........................................ 4,880 103.7 2,638 110.7 960 102.2
Underwriting loss — pre-tax................................... $ (175) $(256) $ (21)
Premiums earned from retroactive reinsurance contracts were $3,944 million in 2000, $1,508 million in1999 and $343 million in 1998. In 2000, premiums of $2,438 million were derived from a single contract.
Generally, retroactive reinsurance contracts indemnify the ceding company, subject to aggregate loss limits, withrespect to insured loss events that are attributed to insurance contracts written in the past, usually many years ago.
Many of these contracts may give rise to considerable amounts of environmental and latent injury claims.
It is generally expected that losses ultimately paid under retroactive contracts will exceed the premiums
received, in some cases by a wide margin. Premiums are based in part on time-value-of-money concepts becauseloss payments may occur over lengthy time periods. However, retroactive contracts do not significantly impact
reported earnings in the year of inception. Consistent with Berkshire’s accounting policy, the excess of the
estimated ultimate losses payable over the premiums received is established as a deferred charge and amortizedagainst income over the estimated future claim settlement periods. Although Berkshire expects that these contracts
will produce significant underwriting losses over time, the business is accepted due to the exceptional levels of policyholder float generated.
8/14/2019 Berkshire Hathaway 2000 Annual Report
http://slidepdf.com/reader/full/berkshire-hathaway-2000-annual-report 53/78
52
Management's Discussion (Continued)
Insurance — Underwriting (Continued)
Berkshire Hathaway Reinsurance Group (Continued)
Net underwriting losses with respect to retroactive reinsurance contracts were $191 million in 2000, $97million in 1999 and $90 million in 1998. The net underwriting losses from this business reflect the amortization
of deferred charges on retroactive reinsurance as well as the accretion of discounted structured settlementliabilities. The amortization and accretion charges are reported as losses incurred and, because there are no
offsetting premiums, as underwriting losses. Due to the magnitude of the retroactive reinsurance contracts entered
into during the past two years, deferred charges increased significantly. Consequently, as a result of the periodicamortization of deferred charges, underwriting losses are expected to increase in future periods.
Premiums earned from non-catastrophe reinsurance contracts totaled $447 million in 2000, $560 million
in 1999 and $310 million in 1998. In each of the last three years, the premiums earned from this business werederived predominantly from a small number of sizable contracts. Premiums earned in 2000 and 1999 included $58
million and $113 million, respectively, from contracts with General Re’s North American property/casualtyoperations.
Net underwriting losses from the non-catastrophe reinsurance business were $167 million in 2000, $355million in 1999 and $86 million in 1998. BHRG incurred a net loss of approximately $186 million from a single
aggregate excess contract during the fourth quarter of 2000. In 1999, BHRG had net underwriting losses of $220million from a similar single excess contract. As with retroactive reinsurance contracts, the premiums establishedfor non-catastrophe reinsurance contracts are based on time-value-of-money concepts because loss payments are
expected to occur over lengthy time periods. Loss reserves for this business are established without such timediscounting but, unlike retroactive reinsurance contracts, no deferred charges are established. Consequently,
significant underwriting losses can result. This business is accepted because of the large amounts of float that isproduced. It is anticipated that Berkshire will derive significant economic benefits over the lengthy period of time
that the float is available for investment.
Premiums earned from catastrophe excess contracts were $314 million in 2000 and 1999 and $286
million in 1998. Competition within the catastrophe reinsurance markets remains intense, which in manyinstances, makes premium rates inadequate or coverage conditions unacceptable. As a result, BHRG has acceptedrelatively few new arrangements. However, it is expected that this business will still produce meaningful amounts
of earned premiums during 2001.
Net underwriting gains from catastrophe reinsurance were $183 million in 2000, $196 million in 1999and $155 million in 1998. Catastrophe losses incurred in each of the past three years were relatively minor.
Significant exposure to losses remains with respect to contracts that are in-force at year-end 2000, especially withrespect to a major earthquake in California or a major hurricane affecting the U.S. Future periodic underwritingresults of this business are subject to extreme volatility. However, Berkshire’s management is willing to accept
volatility in reported results, provided there is a reasonable prospect of long-term profitability.
Berkshire Hathaway Direct Insurance Group
The Berkshire Hathaway Direct Insurance Group is comprised of a wide variety of smallerproperty/casualty businesses. These businesses include: National Indemnity Company's traditional commercial
motor vehicle and specialty risk operations (“NICO”); several companies collectively referred to as the "homestate"operations, which provide primarily standard commercial coverages to insureds and Central States Indemnity
Company (“CSI”), a provider of credit card credit insurance to individuals nationwide through financialinstitutions. In August 2000, this group of businesses was expanded as a result of Berkshire’s acquisition of United
States Investment Corporation (“USIC”), whose insurance subsidiaries underwrite specialty insurance coverage inthe United States.
Collectively, direct insurance businesses produced earned premiums of $332 million in 2000, $262million in 1999 and $328 million in 1998. In 2000, premiums earned increased primarily due to the inclusion of
USIC and to comparatively greater amounts earned by CSI. The decrease in premiums earned in 1999 comparedto 1998 was principally attributed to lower premiums at CSI. Net underwriting gains of the direct businessestotaled $38 million in 2000, $22 million in 1999 and $17 million in 1998. The increase in underwriting profits in
2000 over 1999 was primarily due to underwriting gains from USIC and an increase in underwriting gains atNICO.
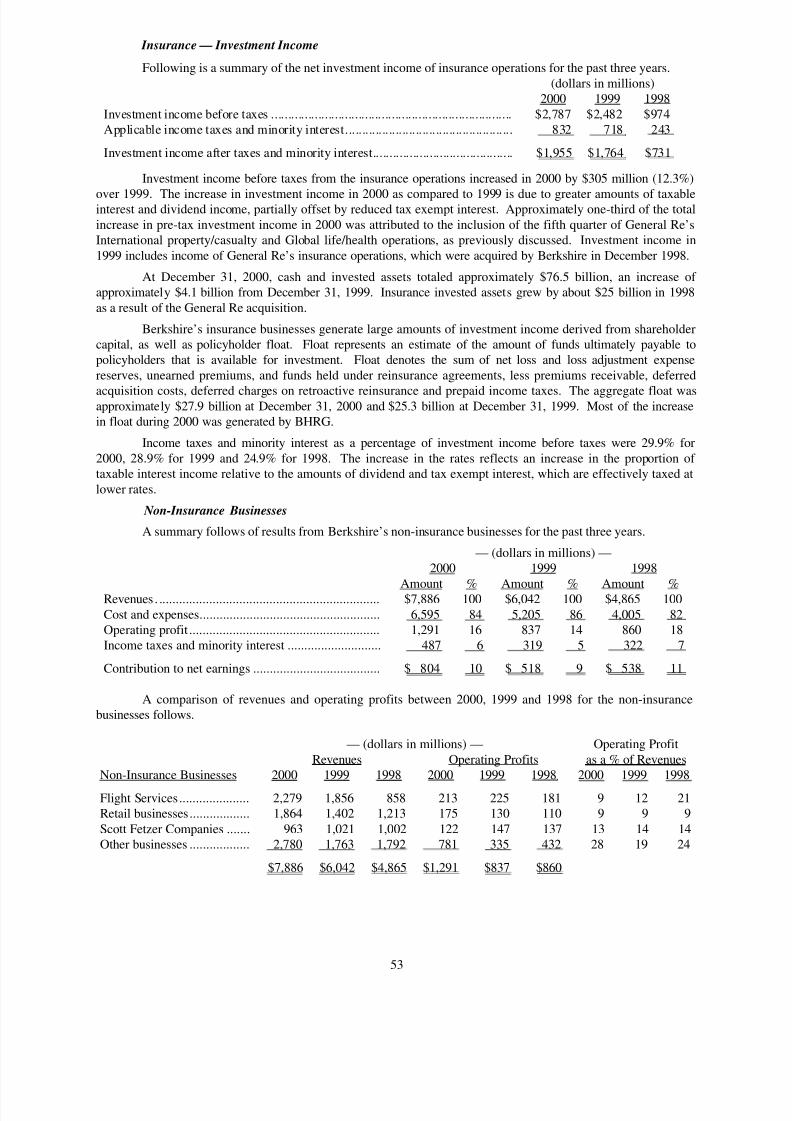
8/14/2019 Berkshire Hathaway 2000 Annual Report
http://slidepdf.com/reader/full/berkshire-hathaway-2000-annual-report 54/78
53
Insurance — Investment Income
Following is a summary of the net investment income of insurance operations for the past three years.
(dollars in millions)2000 1999 1998
Investment income before taxes ........................................................................ $2,787 $2,482 $974Applicable income taxes and minority interest.................................................. 832 718 243
Investment income after taxes and minority interest.......................................... $1,955 $1,764 $731
Investment income before taxes from the insurance operations increased in 2000 by $305 million (12.3%)
over 1999. The increase in investment income in 2000 as compared to 1999 is due to greater amounts of taxableinterest and dividend income, partially offset by reduced tax exempt interest. Approximately one-third of the total
increase in pre-tax investment income in 2000 was attributed to the inclusion of the fifth quarter of General Re’sInternational property/casualty and Global life/health operations, as previously discussed. Investment income in
1999 includes income of General Re’s insurance operations, which were acquired by Berkshire in December 1998.
At December 31, 2000, cash and invested assets totaled approximately $76.5 billion, an increase of approximately $4.1 billion from December 31, 1999. Insurance invested assets grew by about $25 billion in 1998
as a result of the General Re acquisition.
Berkshire’s insurance businesses generate large amounts of investment income derived from shareholdercapital, as well as policyholder float. Float represents an estimate of the amount of funds ultimately payable topolicyholders that is available for investment. Float denotes the sum of net loss and loss adjustment expense
reserves, unearned premiums, and funds held under reinsurance agreements, less premiums receivable, deferred
acquisition costs, deferred charges on retroactive reinsurance and prepaid income taxes. The aggregate float wasapproximately $27.9 billion at December 31, 2000 and $25.3 billion at December 31, 1999. Most of the increasein float during 2000 was generated by BHRG.
Income taxes and minority interest as a percentage of investment income before taxes were 29.9% for
2000, 28.9% for 1999 and 24.9% for 1998. The increase in the rates reflects an increase in the proportion of taxable interest income relative to the amounts of dividend and tax exempt interest, which are effectively taxed at
lower rates.
Non-Insurance Businesses
A summary follows of results from Berkshire’s non-insurance businesses for the past three years.
— (dollars in millions) —2000 1999 1998
Amount % Amount % Amount %Revenues . .................................................................. $7,886 100 $6,042 100 $4,865 100
Cost and expenses...................................................... 6,595 84 5,205 86 4,005 82Operating profit ......................................................... 1,291 16 837 14 860 18Income taxes and minority interest ............................ 487 6 319 5 322 7
Contribution to net earnings ...................................... $ 804 10 $ 518 9 $ 538 11
A comparison of revenues and operating profits between 2000, 1999 and 1998 for the non-insurancebusinesses follows.
— (dollars in millions) — Operating Profit
Revenues Operating Profits as a % of RevenuesNon-Insurance Businesses 2000 1999 1998 2000 1999 1998 2000 1999 1998
Flight Services..................... 2,279 1,856 858 213 225 181 9 12 21Retail businesses.................. 1,864 1,402 1,213 175 130 110 9 9 9
Scott Fetzer Companies ....... 963 1,021 1,002 122 147 137 13 14 14Other businesses .................. 2,780 1,763 1,792 781 335 432 28 19 24
$7,886 $6,042 $4,865 $1,291 $837 $860
8/14/2019 Berkshire Hathaway 2000 Annual Report
http://slidepdf.com/reader/full/berkshire-hathaway-2000-annual-report 55/78
54
Management's Discussion (Continued)
Non-Insurance Businesses(Continued)
2000 compared to 1999
Revenues from Berkshire’s numerous and diverse non-insurance businesses of $7,886 million in 2000
increased $1,844 million (30.5%) from the prior year. The aggregate operating profits from these businesses of $1,291 million in 2000 increased $454 million (54.2%). Revenues and operating results for Berkshire’s non-insurance business activities will change considerably in 2001. Just prior to the end of 2000, Berkshire acquired
Benjamin Moore, a leading formulator and manufacturer of architectural and industrial coatings. Additionally,
during the first two months of 2001, Berkshire acquired 87.3% of Shaw Industries, the world’s largest producer of tufted broadloom carpet and rugs and Johns Manville, a leading producer of insulation and building products.These three businesses generated approximately $7 billion in sales revenues in 2000.
The following is a discussion of significant matters impacting comparative results for the non-insurancebusinesses.
Flight Services
This segment includes FlightSafety and Executive Jet. FlightSafety provides high technology training tooperators of aircraft and ships. FlightSafety’s worldwide clients include corporations, the military and governmentagencies. Executive Jet is the world’s leading provider of fractional ownership programs for general aviation
aircraft. Revenues from flight services in 2000 increased $423 million (22.8%) over 1999. Most of the increase inrevenues was attributed to Executive Jet, which produced significant increases in revenues from both flight
operations and aircraft sales. Revenues from FlightSafety also increased approximately 10% in 2000 as comparedto 1999, reflecting both increased training revenues and product sales. Operating profits in 2000 decreased $12
million (5.3%) as compared to 1999. Increased operating profits at FlightSafety were more than offset by reducedoperating profits at Executive Jet. Executive Jet’s results in 2000 and 1999 reflect operating losses related toexpansion into Europe as well as significantly higher operating costs incurred to generate future domestic growth.
Retail Businesses
These businesses include four independently managed retailers of home furnishings (Nebraska FurnitureMart, R.C. Willey Home Furnishings, Star Furniture and Jordan’s Furniture) and three independently managed
retailers of fine jewelry (Borsheim’s, Helzberg’s Diamond Shops and Ben Bridge Jeweler). Two of thesebusinesses were acquired during the past two years (Jordan’s Furniture – November, 1999 and Ben Bridge Jeweler– July, 2000). Revenues of these businesses in 2000 increased $462 million (33.0%) as compared to 1999 and
operating profits in 2000 increased $45 million (34.6%) as compared to 1999. Approximately 70% of the increase
in revenues and 80% of the increase in operating profits in 2000 was due to the inclusion of the results of Jordan’sfor the full year in 2000 and to the inclusion of Ben Bridge from the date of its acquisition.
Scott Fetzer Companies
The Scott Fetzer companies are a group of about twenty diverse manufacturing and distribution businesses
under common management. Principal businesses in this group of companies sell products under the Kirby (homecleaning systems), Campbell Hausfeld (air compressors, paint sprayers, generators and pressure washers) andWorld Book (encyclopedias and other educational products) names. These three businesses normally produce
approximately 60% of the revenues and 65% of the operating profits of Scott Fetzer. Revenues in 2000 from ScottFetzer’s businesses decreased $58 million (5.7%) as compared to 1999. Operating profits in 2000 declined $25
million (17.0%) as compared to 1999. The decline in revenues was due primarily to lower sales of powergenerators at Campbell Hausfeld and lower unit sales at Kirby. In 1999, sales of generators were unusually high
due in part to Year 2000 concerns. In addition to the impact on operating profits from the aforementioned revenue
declines, the decline in operating profits was also due in part to reduced profits at World Book.
Other Businesses
Other businesses conduct a broad range of activities. A brief description of the most significant of the
activities conducted by this diverse group of non-insurance businesses is provided in Note 16 to the accompanyingConsolidated Financial Statements. During 2000, Berkshire acquired three businesses that are currently included
in this group (CORT Business Services, acquired in February, 2000; Justin Brands and Acme Building Brands,acquired in August, 2000; and Benjamin Moore, acquired in December, 2000).
8/14/2019 Berkshire Hathaway 2000 Annual Report
http://slidepdf.com/reader/full/berkshire-hathaway-2000-annual-report 56/78
55
Non-Insurance Businesses(Continued)
Other Businesses (Continued)
Revenues in 2000 of this group of businesses increased approximately $1,017 million (57.7%) over 1999.
Operating profits of these businesses in 2000 exceeded 1999 by $446 million (133%). Approximately $600 millionof the increase in revenues and $85 million of the increase in operating profits was attributed to the aforementioned
business acquisitions. In addition, a significant increase in net revenues and operating profits was generated byBerkshire’s finance and financial products businesses. The increase in operating profits of the finance and
financial products businesses in 2000 was produced primarily from realized gains on a large portfolio of fixedmaturity securities acquired in 1999 pursuant to a proprietary trading strategy. These securities were disposed of
during 2000. Partially offsetting the realized gains on trading securities in 2000 were operating losses at GRS.1999 compared to 1998
Revenues from the non-insurance businesses increased $1,177 million (24.2%) in 1999 as compared to
1998. Operating profits of $837 million during 1999 decreased $23 million (2.7%) from the comparable 1998amount. The most significant factor giving rise to the revenue increase was the inclusion of Executive Jet for a full
year in 1999 versus just under five months during 1998. Operating profits increased at Berkshire’s Flight Services,Retail and Scott Fetzer business segments. However, more than offsetting these increases was a decline of $87
million in operating profits from Berkshire’s finance and financial products businesses.
Goodwill amortization and other purchase-accounting adjustments
Goodwill amortization and other purchase-accounting adjustments reflect the after-tax effect on netearnings with respect to the amortization of goodwill of acquired businesses and the amortization of fair value
adjustments to certain assets and liabilities which were recorded at the business acquisition dates. The increase in2000 as compared to 1999 is primarily due to the inclusion of a charge of $219 million related to the write-off of
goodwill related to Dexter Shoe (see Note 1(g) to the Consolidated Financial Statements). The significant increasein such charges during 1999 as compared to 1998 periods is primarily due to the acquisition of General Re at theend of 1998.
Other purchase-accounting adjustments consist primarily of the amortization of the excess market valueover the historical cost of fixed maturity investments that existed as of the date of certain business acquisitions,
principally GEICO and General Re. Such excess is included in Berkshire’s cost of the investments and is beingamortized over the estimated remaining lives of the assets. The unamortized excess remaining in the cost of fixed
maturity investments was $680 million at December 31, 2000, $940 million at December 31, 1999 and $1.2 billionat December 31, 1998.
Realized Investment Gain
Realized investment gain has been a recurring element in Berkshire's net earnings for many years. Theamount — recorded when investments are sold, other-than-temporarily impaired or in certain situations, asrequired by GAAP, when investments are marked-to-market with the corresponding gain or loss included in
earnings — may fluctuate significantly from period to period, with a meaningful effect upon Berkshire'sconsolidated net earnings. However, the amount of realized investment gain or loss for any given period has no
predictive value, and variations in amount from period to period have no practical analytical value, particularly inview of the net unrealized price appreciation now existing in Berkshire's consolidated investment portfolio.
While the effects of realized gains are often material to the Consolidated Statements of Earnings, such
gains often produce a minimal impact on Berkshire's total shareholders' equity. This is due to the fact thatBerkshire's investments are carried in prior periods' consolidated financial statements at market value with
unrealized gains, net of tax, reported as a separate component of shareholders' equity.
Market Risk Disclosures
Berkshire's Consolidated Balance Sheet includes a substantial amount of assets and liabilities whose fairvalues are subject to market risks. Berkshire’s significant market risks are primarily associated with equity prices
and interest rates and to a lesser degree financial products. The following sections address the significant marketrisks associated with Berkshire's business activities.
8/14/2019 Berkshire Hathaway 2000 Annual Report
http://slidepdf.com/reader/full/berkshire-hathaway-2000-annual-report 57/78
56
Management’s Discussion (Continued)
Equity Price Risk
Strategically, Berkshire strives to invest in businesses that possess excellent economics, with able and
honest management and at sensible prices. Berkshire's management prefers to invest a meaningful amount in eachinvestee. Accordingly, Berkshire's equity investments are concentrated in relatively few investees. At year-end
2000 and 1999, approximately 70% of the total fair value of investments in equity securities was concentrated infour investees.
Berkshire's preferred strategy is to hold equity investments for very long periods of time. Thus, Berkshiremanagement is not necessarily troubled by short term price volatility with respect to its investments provided that
the underlying business, economic and management characteristics of the investees remain favorable. Berkshirestrives to maintain above average levels of shareholder capital to provide a margin of safety against short termequity price volatility.
The carrying values of investments subject to equity price risks are based on quoted market prices or
management's estimates of fair value as of the balance sheet dates. Market prices are subject to fluctuation and,consequently, the amount realized in the subsequent sale of an investment may significantly differ from thereported market value. Fluctuation in the market price of a security may result from perceived changes in the
underlying economic characteristics of the investee, the relative price of alternative investments and generalmarket conditions. Furthermore, amounts realized in the sale of a particular security may be affected by the relative
quantity of the security being sold.
In addition to its equity investments, Berkshire's obligations with respect to the 1% Senior Exchangeable
Notes are subject to equity price risks. See Note 10 to the Consolidated Financial Statements for informationregarding the Exchange Notes. The Exchange Notes had a carrying value of $235 million at December 31, 2000
and $449 million at December 31, 1999. For purposes of this discussion, these amounts have been deducted fromthe fair value of equity securities.
The table below summarizes Berkshire's equity price risks as of December 31, 2000 and 1999 and showsthe effects of a hypothetical 30% increase and a 30% decrease in market prices as of those dates. The selected
hypothetical change does not reflect what could be considered the best or worst case scenarios. Indeed, resultscould be far worse due both to the nature of equity markets and the aforementioned concentrations existing inBerkshire's equity investment portfolio. Dollars are in millions.
Estimated HypotheticalFair Value after Percentage
Hypothetical Hypothetical Increase (Decrease)Fair Value Price Change Change in Prices Shareholders’ Equity
As of December 31, 2000................ $37,384 30% increase $48,599 11.730% decrease 26,170 (11.7)
As of December 31, 1999................ $37,323 30% increase $48,520 12.430% decrease 26,126 (12.4)
Interest Rate Risk
This section discusses interest rate risks associated with Berkshire’s financial assets and liabilities, otherthan those of its finance and financial products businesses, which are discussed later. Berkshire's management
prefers to invest in equity securities or to acquire entire businesses based upon the principles discussed in the
preceding section on equity price risk. When unable to do so, management may alternatively invest in bonds orother interest rate sensitive instruments. Berkshire's strategy is to acquire securities that are attractively priced inrelation to the perceived credit risk. Management recognizes and accepts that losses may occur. Berkshire hashistorically utilized a modest level of corporate borrowings and debt. Further, Berkshire strives to maintain the
highest credit ratings so that the cost of debt is minimized. Berkshire utilizes derivative products to manageinterest rate risks to a very limited degree.
8/14/2019 Berkshire Hathaway 2000 Annual Report
http://slidepdf.com/reader/full/berkshire-hathaway-2000-annual-report 58/78
57
Interest Rate Risk (Continued)
The fair values of Berkshire's fixed maturity investments and borrowings under investment agreementsand other debt will fluctuate in response to changes in market interest rates. Increases and decreases in prevailing
interest rates generally translate into decreases and increases in fair values of those instruments. Additionally, fairvalues of interest rate sensitive instruments may be affected by the credit worthiness of the issuer, prepayment
options, relative values of alternative investments, the liquidity of the instrument and other general marketconditions.
The following table summarizes the estimated effects of hypothetical increases and decreases in interestrates on assets and liabilities that are subject to interest rate risk. It is assumed that the changes occur immediately
and uniformly to each category of instrument containing interest rate risks. The hypothetical changes in marketinterest rates do not reflect what could be deemed best or worst case scenarios. Variations in market interest ratescould produce significant changes in the timing of repayments due to prepayment options available. For these
reasons, actual results might differ from those reflected in the table which follows. Dollars are in millions.
Estimated Fair Value after
Hypothetical Change in Interest Rates(bp=basis points)
100 bp 100 bp 200 bp 300 bpFair decrease increase increase increase
As of December 31, 2000
Investments in securities with fixed maturities .... $32,567 $33,466 $31,346 $30,005 $28,690Borrowings under investment agreements and
other debt......................................................... 2,470 2,540 2,404 2,336 2,274
As of December 31, 1999
Investments in securities with fixed maturities .... $30,222 $31,942 $28,483 $26,852 $25,413Borrowings under investment agreements and
other debt......................................................... 1,971 2,059 1,891 1,819 1,753
Financial Products Risk
The finance and financial products operations are subject to market risk principally through Gen ReSecurities Holdings Limited (“GRS”). GRS monitors its market risk on a daily basis across all swap and option
products by calculating the effect on operating results of potential changes in market variables over a one week period, based on historical market volatility, correlation data and informed judgment. This evaluation is done on
an individual trading book basis, against limits set by individual book, to a 99% probability level. GRS sets marketrisk limits for each type of risk, and for an aggregate measure of risk, based on a 99% probability that movements
in market rates will not affect the results from operations in excess of the risk limit over a one week period. GRS’sweekly aggregate market risk limit was $22 million in 2000 and $15 million in 1999. During 1999, the actuallosses exceeded the market risk limit on one occasion. In addition to these daily and weekly assessments of risk,
GRS prepares periodic stress tests to assess its exposure to extreme movements in various market risk factors.
The table below shows the highest, lowest and average value at risk, as calculated using the above
methodology, by broad category of market risk to which GRS is exposed. Dollars are in millions.
2000
Foreign 1999Interest Rate Exchange Rate Equity Credit All Risks All Risks
Highest ............................ $7 $6 $4 $3 $14 $10Lowest............................. 3 3 — 1 1 4
Average ........................... 5 4 1 1 4 8
8/14/2019 Berkshire Hathaway 2000 Annual Report
http://slidepdf.com/reader/full/berkshire-hathaway-2000-annual-report 59/78
58
Management's Discussion (Continued)
Financial Products Risk (Continued)
GRS evaluates and records a fair-value adjustment to recognize counterparty credit exposure and future
costs associated with administering each contract. The expected credit exposure for each trade is initiallyestablished on the trade date and is determined through the use of a proprietary credit exposure model that is based
on historical default probabilities, market volatilities and, if applicable, the legal right of setoff. These exposuresare continually monitored and adjusted due to changes in the credit quality of the counterparty, changes in interest
and currency rates or changes in other factors affecting credit exposure. Since inception, GRS has not experiencedany credit losses.
Liquidity and Capital Resources
Berkshire's balance sheet continues to reflect significant liquidity and a strong capital base. Consolidated
shareholders' equity at December 31, 2000 totaled $61.7 billion. Consolidated cash and invested assets, excludingassets of finance and financial products businesses totaled approximately $77.1 billion at December 31, 2000.
Berkshire has deployed about $7.7 billion in cash for business acquisitions and investments in MidAmericanduring 2000 and the first two months of 2001. Cash utilized in these acquisitions was generated internally.
The net amount of borrowings under investment agreements and other debt increased $198 million during2000. The increase was due to the inclusion of debt of subsidiaries assumed in connection with business
acquisitions during 2000 and an increase in borrowings of certain Berkshire subsidiaries, partially offset by adecline in corporate debt.
Forward-Looking Statements
Investors are cautioned that certain statements contained in this document, as well as some statements by
the Company in periodic press releases and some oral statements of Company officials during presentations aboutthe Company, are "forward-looking" statements within the meaning of the Private Securities Litigation Reform Act
of 1995 (the "Act"). Forward-looking statements include statements which are predictive in nature, which dependupon or refer to future events or conditions, which include words such as "expects," "anticipates," "intends,""plans," "believes," "estimates," or similar expressions. In addition, any statements concerning future financial
performance (including future revenues, earnings or growth rates), ongoing business strategies or prospects, andpossible future Company actions, which may be provided by management are also forward-looking statements as
defined by the Act. Forward-looking statements are based on current expectations and projections about futureevents and are subject to risks, uncertainties, and assumptions about the Company, economic and market factors
and the industries in which the Company does business, among other things. These statements are not guarantiesof future performance and the Company has no specific intention to update these statements.
Actual events and results may differ materially from those expressed or forecasted in forward-lookingstatements due to a number of factors. The principal important risk factors that could cause the Company's actualperformance and future events and actions to differ materially from such forward-looking statements, include, but
are not limited to, changes in market prices of Berkshire's significant equity investees, the occurrence of one ormore catastrophic events, such as an earthquake or hurricane that causes losses insured by Berkshire's insurance
subsidiaries, changes in insurance laws or regulations, changes in Federal income tax laws, and changes in generaleconomic and market factors that affect the prices of securities or the industries in which Berkshire and its
affiliates do business, especially those affecting the property and casualty insurance industry.
8/14/2019 Berkshire Hathaway 2000 Annual Report
http://slidepdf.com/reader/full/berkshire-hathaway-2000-annual-report 60/78
59
In June 1996, Berkshire's Chairman, Warren E. Buffett, issued a booklet entitled "An Owner's Manual"
to Berkshire's Class A and Class B shareholders. The booklet was reprinted in January 1999 and distributed to allof Berkshire’s shareholders. The purpose of the manual was to explain Berkshire's broad economic principles of operation. The Owner's Manual is reproduced on this and the following seven pages.
____________________________________________________________________
INTRODUCTION
Augmented by the General Re merger, Berkshire’s shareholder count has doubled in the past year to about250,000. Charlie Munger, Berkshire's Vice Chairman and my partner, and I welcome each of you. As a further
greeting, we have prepared a second printing of this booklet to help you understand our business, goals, philosophyand limitations.
These pages are aimed at explaining our broad principles of operation, not at giving you detail aboutBerkshire's many businesses. For more detail and a continuing update on our progress, you should look to our
annual reports. We will be happy to send a copy of our 1997 report to any shareholder requesting it. A great dealof additional information, including our 1977-1996 annual letters, is available at our Internet site:www.berkshirehathaway.com.
OWNER-RELATED BUSINESS PRINCIPLES
At the time of the Blue Chip merger in 1983, I set down 13 owner-related business principles that Ithought would help new shareholders understand our managerial approach. As is appropriate for "principles," all
13 remain alive and well today, and they are stated here in italics. A few words have been changed to bring themup-to-date and to each I've added a short commentary.
1. Although our form is corporate, our attitude is partnership. Charlie Munger and I think of our
shareholders as owner-partners, and of ourselves as managing partners. (Because of the size of our
shareholdings we are also, for better or worse, controlling partners.) We do not view the company itself
as the ultimate owner of our business assets but instead view the company as a conduit through which our
shareholders own the assets.
Charlie and I hope that you do not think of yourself as merely owning a piece of paper whose price
wiggles around daily and that is a candidate for sale when some economic or political event makes you
nervous. We hope you instead visualize yourself as a part owner of a business that you expect to stay withindefinitely, much as you might if you owned a farm or apartment house in partnership with members of
your family. For our part, we do not view Berkshire shareholders as faceless members of an ever-shiftingcrowd, but rather as co-venturers who have entrusted their funds to us for what may well turn out to be the
remainder of their lives.
The evidence suggests that most Berkshire shareholders have indeed embraced this long-term partnership
concept. The annual percentage turnover in Berkshire's shares is a small fraction of that occurring in thestocks of other major American corporations, even when the shares I own are excluded from the
calculation.
In effect, our shareholders behave in respect to their Berkshire stock much as Berkshire itself behaves in
respect to companies in which it has an investment. As owners of, say, Coca-Cola or Gillette shares, wethink of Berkshire as being a non-managing partner in two extraordinary businesses, in which we measure
our success by the long-term progress of the companies rather than by the month-to-month movements of their stocks. In fact, we would not care in the least if several years went by in which there was no trading,or quotation of prices, in the stocks of those companies. If we have good long-term expectations, short-
term price changes are meaningless for us except to the extent they offer us an opportunity to increase ourownership at an attractive price.
*Copyright © 1996 By Warren E. Buffett
All Rights Reserved
8/14/2019 Berkshire Hathaway 2000 Annual Report
http://slidepdf.com/reader/full/berkshire-hathaway-2000-annual-report 61/78
60
2. In line with Berkshire's owner-orientation, most of our directors have a major portion of their net worth
invested in the company. We eat our own cooking.
Charlie's family has 90% or more of its net worth in Berkshire shares; my wife, Susie, and I have more
than 99%. In addition, many of my relatives — my sisters and cousins, for example — keep a hugeportion of their net worth in Berkshire stock.
Charlie and I feel totally comfortable with this eggs-in-one-basket situation because Berkshire itself owns
a wide variety of truly extraordinary businesses. Indeed, we believe that Berkshire is close to being uniquein the quality and diversity of the businesses in which it owns either a controlling interest or a minorityinterest of significance.
Charlie and I cannot promise you results. But we can guarantee that your financial fortunes will move inlockstep with ours for whatever period of time you elect to be our partner. We have no interest in large
salaries or options or other means of gaining an "edge" over you. We want to make money only when ourpartners do and in exactly the same proportion. Moreover, when I do something dumb, I want you to be
able to derive some solace from the fact that my financial suffering is proportional to yours.
3. Our long-term economic goal (subject to some qualifications mentioned later) is to maximize Berkshire's
average annual rate of gain in intrinsic business value on a per-share basis. We do not measure the
economic significance or performance of Berkshire by its size; we measure by per-share progress. We are
certain that the rate of per-share progress will diminish in the future — a greatly enlarged capital base
will see to that. But we will be disappointed if our rate does not exceed that of the average large American corporation.
Since that was written at yearend 1983, our intrinsic value (a topic I'll discuss a bit later) has increased at
an annual rate of more than 25%, a pace that has definitely surprised both Charlie and me. Neverthelessthe principle just stated remains valid: Operating with large amounts of capital as we do today, we cannotcome close to performing as well as we once did with much smaller sums. The best rate of gain in
intrinsic value we can even hope for is an average of 15% per annum, and we may well fall far short of that target. Indeed, we think very few large businesses have a chance of compounding intrinsic value at
15% per annum over an extended period of time. So it may be that we will end up meeting our stated goal— being above average — with gains that fall significantly short of 15%.
4. Our preference would be to reach our goal by directly owning a diversified group of businesses that
generate cash and consistently earn above-average returns on capital. Our second choice is to own partsof similar businesses, attained primarily through purchases of marketable common stocks by our
insurance subsidiaries. The price and availability of businesses and the need for insurance capital
determine any given year's capital allocation.
As has usually been the case, it is easier today to buy small pieces of outstanding businesses via the stock
market than to buy similar businesses in their entirety on a negotiated basis. Nevertheless, we continue toprefer the 100% purchase, and in some years we get lucky: In the last three years in fact, we made sevenacquisitions. Though there will be dry years also, we expect to make a number of acquisitions in the
decades to come, and our hope is that they will be large. If these purchases approach the quality of thosewe have made in the past, Berkshire will be well served.
The challenge for us is to generate ideas as rapidly as we generate cash. In this respect, a depressed stock market is likely to present us with significant advantages. For one thing, it tends to reduce the prices at
which entire companies become available for purchase. Second, a depressed market makes it easier for ourinsurance companies to buy small pieces of wonderful businesses — including additional pieces of
businesses we already own — at attractive prices. And third, some of those same wonderful businesses,such as Coca-Cola, are consistent buyers of their own shares, which means that they, and we, gain from
the cheaper prices at which they can buy.
Overall, Berkshire and its long-term shareholders benefit from a sinking stock market much as a regular
purchaser of food benefits from declining food prices. So when the market plummets — as it will fromtime to time — neither panic nor mourn. It's good news for Berkshire.
8/14/2019 Berkshire Hathaway 2000 Annual Report
http://slidepdf.com/reader/full/berkshire-hathaway-2000-annual-report 62/78
61
5. Because of our two-pronged approach to business ownership and because of the limitations of
conventional accounting, consolidated reported earnings may reveal relatively little about our true
economic performance. Charlie and I, both as owners and managers, virtually ignore such consolidated
numbers. However, we will also report to you the earnings of each major business we control, numbers we
consider of great importance. These figures, along with other information we will supply about the
individual businesses, should generally aid you in making judgments about them.
To state things simply, we try to give you in the annual report the numbers and other information thatreally matter. Charlie and I pay a great deal of attention to how well our businesses are doing, and we alsowork to understand the environment in which each business is operating. For example, is one of ourbusinesses enjoying an industry tailwind or is it facing a headwind? Charlie and I need to know exactly
which situation prevails and to adjust our expectations accordingly. We will also pass along ourconclusions to you.
Over time, practically all of our businesses have exceeded our expectations. But occasionally we havedisappointments, and we will try to be as candid in informing you about those as we are in describing the
happier experiences. When we use unconventional measures to chart our progress — for instance, youwill be reading in our annual reports about insurance "float" — we will try to explain these concepts and
why we regard them as important. In other words, we believe in telling you how we think so that you canevaluate not only Berkshire's businesses but also assess our approach to management and capital
allocation.
6. Accounting consequences do not influence our operating or capital-allocation decisions. When
acquisition costs are similar, we much prefer to purchase $2 of earnings that is not reportable by us
under standard accounting principles than to purchase $1 of earnings that is reportable. This is precisely
the choice that often faces us since entire businesses (whose earnings will be fully reportable) frequently
sell for double the pro-rata price of small portions (whose earnings will be largely unreportable). In
aggregate and over time, we expect the unreported earnings to be fully reflected in our intrinsic business
value through capital gains.
We attempt to offset the shortcomings of conventional accounting by regularly reporting "look-through"
earnings (though, for special and nonrecurring reasons, we occasionally omit them). The look-throughnumbers include Berkshire's own reported operating earnings, excluding capital gains and purchase-
accounting adjustments (an explanation of which occurs later in this message) plus Berkshire's share of
the undistributed earnings of our major investees — amounts that are not included in Berkshire's figuresunder conventional accounting. From these undistributed earnings of our investees we subtract the tax wewould have owed had the earnings been paid to us as dividends. We also exclude capital gains, purchase-accounting adjustments and extraordinary charges or credits from the investee numbers.
We have found over time that the undistributed earnings of our investees, in aggregate, have been fully as
beneficial to Berkshire as if they had been distributed to us (and therefore had been included in theearnings we officially report). This pleasant result has occurred because most of our investees are engagedin truly outstanding businesses that can often employ incremental capital to great advantage, either by
putting it to work in their businesses or by repurchasing their shares. Obviously, every capital decisionthat our investees have made has not benefitted us as shareholders, but overall we have garnered far more
than a dollar of value for each dollar they have retained. We consequently regard look-through earnings asrealistically portraying our yearly gain from operations.
In 1992, our look-through earnings were $604 million, and in that same year we set a goal of raising themby an average of 15% per annum to $1.8 billion in the year 2000. Since that time, however, we have
issued additional shares — including a significant number in the 1998 merger with General Re — so thatwe now need look-through earnings of $2.4 billion in 2000 to match the per-share goal we originally were
shooting for. This is a target we still hope to hit.
8/14/2019 Berkshire Hathaway 2000 Annual Report
http://slidepdf.com/reader/full/berkshire-hathaway-2000-annual-report 63/78
62
7. We use debt sparingly and, when we do borrow, we attempt to structure our loans on a long-term fixed-
rate basis. We will reject interesting opportunities rather than over-leverage our balance sheet. This
conservatism has penalized our results but it is the only behavior that leaves us comfortable, considering
our fiduciary obligations to policyholders, lenders and the many equity holders who have committed
unusually large portions of their net worth to our care. (As one of the Indianapolis "500" winners said:
"To finish first, you must first finish.")
The financial calculus that Charlie and I employ would never permit our trading a good night's sleep for ashot at a few extra percentage points of return. I've never believed in risking what my family and friendshave and need in order to pursue what they don't have and don't need.
Besides, Berkshire has access to two low-cost, non-perilous sources of leverage that allow us to safely ownfar more assets than our equity capital alone would permit: deferred taxes and "float," the funds of others
that our insurance business holds because it receives premiums before needing to pay out losses. Both of these funding sources have grown rapidly and now total about $32 billion.
Better yet, this funding to date has been cost-free. Deferred tax liabilities bear no interest. And as long aswe can break even in our insurance underwriting — which we have done, on the average, during our 32
years in the business — the cost of the float developed from that operation is zero. Neither item, of course,is equity; these are real liabilities. But they are liabilities without covenants or due dates attached to them.In effect, they give us the benefit of debt — an ability to have more assets working for us — but saddle us
with none of its drawbacks.Of course, there is no guarantee that we can obtain our float in the future at no cost. But we feel our
chances of attaining that goal are as good as those of anyone in the insurance business. Not only have wereached the goal in the past (despite a number of important mistakes by your Chairman), our 1996
acquisition of GEICO, materially improved our prospects for getting there in the future.
8. A managerial "wish list" will not be filled at shareholder expense. We will not diversify by purchasing
entire businesses at control prices that ignore long-term economic consequences to our shareholders. We
will only do with your money what we would do with our own, weighing fully the values you can obtain by
diversifying your own portfolios through direct purchases in the stock market.
Charlie and I are interested only in acquisitions that we believe will raise the per-share intrinsic value of
Berkshire's stock. The size of our paychecks or our offices will never be related to the size of Berkshire's
balance sheet.9. We feel noble intentions should be checked periodically against results. We test the wisdom of retaining
earnings by assessing whether retention, over time, delivers shareholders at least $1 of market value for
each $1 retained. To date, this test has been met. We will continue to apply it on a five-year rolling basis.
As our net worth grows, it is more difficult to use retained earnings wisely.
We continue to pass the test, but the challenges of doing so have grown more difficult. If we reach thepoint that we can't create extra value by retaining earnings, we will pay them out and let our shareholders
deploy the funds.
10. We will issue common stock only when we receive as much in business value as we give. This rule applies
to all forms of issuance — not only mergers or public stock offerings, but stock-for-debt swaps, stock
options, and convertible securities as well. We will not sell small portions of your company — and that is
what the issuance of shares amounts to — on a basis inconsistent with the value of the entire enterprise.
When we sold the Class B shares in 1996, we stated that Berkshire stock was not undervalued — and
some people found that shocking. That reaction was not well-founded. Shock should have registeredinstead had we issued shares when our stock was undervalued. Managements that say or imply during a
public offering that their stock is undervalued are usually being economical with the truth oruneconomical with their existing shareholders' money: Owners unfairly lose if their managersdeliberately sell assets for 80¢ that in fact are worth $1. We didn't commit that kind of crime in our
offering of Class B shares and we never will. (We did not, however, say at the time of the sale that ourstock was overvalued, though many media have reported that we did.)

8/14/2019 Berkshire Hathaway 2000 Annual Report
http://slidepdf.com/reader/full/berkshire-hathaway-2000-annual-report 64/78
63
11. You should be fully aware of one attitude Charlie and I share that hurts our financial performance:
Regardless of price, we have no interest at all in selling any good businesses that Berkshire owns. We are
also very reluctant to sell sub-par businesses as long as we expect them to generate at least some cash
and as long as we feel good about their managers and labor relations. We hope not to repeat the capital-
allocation mistakes that led us into such sub-par businesses. And we react with great caution to
suggestions that our poor businesses can be restored to satisfactory profitability by major capital
expenditures. (The projections will be dazzling and the advocates sincere, but, in the end, major
additional investment in a terrible industry usually is about as rewarding as struggling in quicksand.) Nevertheless, gin rummy managerial behavior (discard your least promising business at each turn) is not
our style. We would rather have our overall results penalized a bit than engage in that kind of behavior.
We continue to avoid gin rummy behavior. True, we closed our textile business in the mid-1980's after 20years of struggling with it, but only because we felt it was doomed to run never-ending operating losses.
We have not, however, given thought to selling operations that would command very fancy prices norhave we dumped our laggards, though we focus hard on curing the problems that cause them to lag.
12. We will be candid in our reporting to you, emphasizing the pluses and minuses important in appraising
business value. Our guideline is to tell you the business facts that we would want to know if our positions
were reversed. We owe you no less. Moreover, as a company with a major communications business, it
would be inexcusable for us to apply lesser standards of accuracy, balance and incisiveness when
reporting on ourselves than we would expect our news people to apply when reporting on others. We also
believe candor benefits us as managers: The CEO who misleads others in public may eventually mislead himself in private.
At Berkshire you will find no "big bath" accounting maneuvers or restructurings nor any "smoothing" of
quarterly or annual results. We will always tell you how many strokes we have taken on each hole andnever play around with the scorecard. When the numbers are a very rough "guesstimate," as theynecessarily must be in insurance reserving, we will try to be both consistent and conservative in our
approach.
We will be communicating with you in several ways. Through the annual report, I try to give all
shareholders as much value-defining information as can be conveyed in a document kept to reasonablelength. We also try to convey a liberal quantity of condensed but important information in our quarterly
reports, though I don't write those (one recital a year is enough). Still another important occasion for
communication is our Annual Meeting, at which Charlie and I are delighted to spend five hours or moreanswering questions about Berkshire. But there is one way we can't communicate: on a one-on-one basis.That isn't feasible given Berkshire's many thousands of owners.
In all of our communications, we try to make sure that no single shareholder gets an edge: We do notfollow the usual practice of giving earnings "guidance" or other information of value to analysts or large
shareholders. Our goal is to have all of our owners updated at the same time.
13. Despite our policy of candor, we will discuss our activities in marketable securities only to the extent
legally required. Good investment ideas are rare, valuable and subject to competitive appropriation just
as good product or business acquisition ideas are. Therefore we normally will not talk about our
investment ideas. This ban extends even to securities we have sold (because we may purchase them again)
and to stocks we are incorrectly rumored to be buying. If we deny those reports but say "no comment" on
other occasions, the no-comments become confirmation.
Though we continue to be unwilling to talk about specific stocks, we freely discuss our business andinvestment philosophy. I benefitted enormously from the intellectual generosity of Ben Graham, the
greatest teacher in the history of finance, and I believe it appropriate to pass along what I learned fromhim, even if that creates new and able investment competitors for Berkshire just as Ben's teachings did for
him.
8/14/2019 Berkshire Hathaway 2000 Annual Report
http://slidepdf.com/reader/full/berkshire-hathaway-2000-annual-report 65/78
64
AN ADDED PRINCIPLE
To the extent possible, we would like each Berkshire shareholder to record a gain or loss in market value during
his period of ownership that is proportional to the gain or loss in per-share intrinsic value recorded by the
company during that holding period. For this to come about, the relationship between the intrinsic value and the
market price of a Berkshire share would need to remain constant, and by our preferences at 1-to-1. As that
implies, we would rather see Berkshire's stock price at a fair level than a high level. Obviously, Charlie and I
can't control Berkshire's price. But by our policies and communications, we can encourage informed, rational
behavior by owners that, in turn, will tend to produce a stock price that is also rational. Our it's-as-bad-to-be-
overvalued-as-to-be-undervalued approach may disappoint some shareholders. We believe, however, that it
affords Berkshire the best prospect of attracting long-term investors who seek to profit from the progress of the
company rather than from the investment mistakes of their partners.
INTRINSIC VALUE
Now let's focus on two terms that I mentioned earlier and that you will encounter in future annual reports.
Let's start with intrinsic value, an all-important concept that offers the only logical approach to evaluating therelative attractiveness of investments and businesses. Intrinsic value can be defined simply: It is the discounted value of the
cash that can be taken out of a business during its remaining life.The calculation of intrinsic value, though, is not so simple. As our definition suggests, intrinsic value is an
estimate rather than a precise figure, and it is additionally an estimate that must be changed if interest rates move orforecasts of future cash flows are revised. Two people looking at the same set of facts, moreover — and this would apply
even to Charlie and me — will almost inevitably come up with at least slightly different intrinsic value figures. That is onereason we never give you our estimates of intrinsic value. What our annual reports do supply, though, are the facts that we
ourselves use to calculate this value.
Meanwhile, we regularly report our per-share book value, an easily calculable number, though one of limited use.
The limitations do not arise from our holdings of marketable securities, which are carried on our books at their currentprices. Rather the inadequacies of book value have to do with the companies we control, whose values as stated on our
books may be far different from their intrinsic values.
The disparity can go in either direction. For example, in 1964 we could state with certitude that Berkshire's per-share book value was $19.46. However, that figure considerably overstated the company's intrinsic value, since all of thecompany's resources were tied up in a sub-profitable textile business. Our textile assets had neither going-concern norliquidation values equal to their carrying values. Today, however, Berkshire's situation is reversed: Now, our book value far
understates Berkshire's intrinsic value, a point true because many of the businesses we control are worth much more thantheir carrying value.
Inadequate though they are in telling the story, we give you Berkshire's book-value figures because they today serveas a rough, albeit significantly understated, tracking measure for Berkshire's intrinsic value. In other words, the percentage
change in book value in any given year is likely to be reasonably close to that year's change in intrinsic value.
You can gain some insight into the differences between book value and intrinsic value by looking at one form of investment, a college education. Think of the education's cost as its "book value." If this cost is to be accurate, it shouldinclude the earnings that were foregone by the student because he chose college rather than a job.
For this exercise, we will ignore the important non-economic benefits of an education and focus strictly on itseconomic value. First, we must estimate the earnings that the graduate will receive over his lifetime and subtract from that
figure an estimate of what he would have earned had he lacked his education. That gives us an excess earnings figure,which must then be discounted, at an appropriate interest rate, back to graduation day. The dollar result equals the intrinsic
economic value of the education.
Some graduates will find that the book value of their education exceeds its intrinsic value, which means that
whoever paid for the education didn't get his money's worth. In other cases, the intrinsic value of an education will farexceed its book value, a result that proves capital was wisely deployed. In all cases, what is clear is that book value is
meaningless as an indicator of intrinsic value.
8/14/2019 Berkshire Hathaway 2000 Annual Report
http://slidepdf.com/reader/full/berkshire-hathaway-2000-annual-report 66/78
65
PURCHASE-ACCOUNTING ADJUSTMENTS
Next: spinach time. I know that a discussion of accounting technicalities turns off many readers, so let me assureyou that a full and happy life can still be yours if you decide to skip this section.
Our 1996 acquisition of GEICO, however, means that purchase-accounting adjustments of about $40 million arecharged against our annual earnings as recorded under generally accepted accounting principles (GAAP). Our General Re
acquisition will produce an annual charge many times this number, but we don’t have final figures at this time. So themagnitude of these charges makes them a subject of importance to Berkshire. In our annual reports, therefore, we will
sometimes talk of earnings that we will describe as "before purchase-accounting adjustments." The discussion that followswill tell you why we think earnings of that description have far more economic meaning than the earnings produced byGAAP.
When Berkshire buys a business for a premium over the GAAP net worth of the acquiree — as will usually be thecase, since most companies we'd want to buy don't come at a discount — that premium has to be entered on the asset side of
our balance sheet. There are loads of rules about just how a company should record the premium. But to simplify thisdiscussion, we will focus on "Goodwill," the asset item to which almost all of Berkshire's acquisition premiums have been
allocated. For example, when we acquired in 1996 the half of GEICO we didn't previously own, we recorded goodwill of about $1.6 billion.
GAAP requires goodwill to be amortized — that is, written off — over a period no longer than 40 years. Therefore,to extinguish our $1.6 billion in GEICO goodwill, we will take annual charges of about $40 million until 2036. This
amount is not deductible for tax purposes, so it reduces both our pre-tax and after-tax earnings by $40 million.
In an accounting sense, consequently, our GEICO goodwill will disappear gradually in even-sized bites. But the
one thing I can guarantee you is that the economic goodwill we have purchased at GEICO will not decline in the samemeasured way. In fact, my best guess is that the economic goodwill assignable to GEICO has dramatically increased since
our purchase and will likely continue to increase — quite probably in a very substantial way.
I made a similar statement in our 1983 Annual Report about the goodwill attributed to See's Candy, when I used
that company as an example in a discussion of goodwill accounting. At that time, our balance sheet carried about $36million of See's goodwill. We have since been charging about $1 million against earnings every year in order to amortizethe asset, and the See's goodwill on our balance sheet is now down to about $21 million. In other words, from an accounting
standpoint, See's is now presented as having lost a good deal of goodwill since 1983.
The economic facts could not be more different. In 1983, See's earned about $27 million pre-tax on $11 million of net operating assets; in 1997 it earned $59 million on $5 million of net operating assets. Clearly See's economic goodwill
has increased dramatically during the interval rather than decreased. Just as clearly, See's is worth many hundreds of millions of dollars more than its stated value on our books.
We could, of course, be wrong, but we expect that GEICO's gradual loss of accounting value will continue to be
paired with major increases in its economic value. Certainly that has been the pattern at most of our subsidiaries, not justSee's. That is why we regularly present our operating earnings in a way that allows you to ignore all purchase-accounting
adjustments.
Before leaving this subject, we should issue an important warning: Investors are often led astray by CEOs and
Wall Street analysts who equate depreciation charges with the amortization charges we have just discussed. In no way arethe two the same: With rare exceptions, depreciation is an economic cost every bit as real as wages, materials, or taxes.
Certainly that is true at Berkshire and at virtually all the other businesses we have studied. Furthermore, we do not think so-called EBITDA (earnings before interest, taxes, depreciation and amortization) is a meaningful measure of performance.
Managements that dismiss the importance of depreciation — and emphasize "cash flow" or EBITDA — are apt to make
faulty decisions, and you should keep that in mind as you make your own investment decisions.
THE MANAGING OF BERKSHIRE
I think it's appropriate that I conclude with a discussion of Berkshire's management, today and in the future. As
our first owner-related principle tells you, Charlie and I are the managing partners of Berkshire. But we subcontract all of the heavy lifting in this business to the managers of our subsidiaries. In fact, we delegate almost to the point of abdication:
Though Berkshire has about 45,000 employees, only 12 of these are at headquarters.
8/14/2019 Berkshire Hathaway 2000 Annual Report
http://slidepdf.com/reader/full/berkshire-hathaway-2000-annual-report 67/78
66
Charlie and I mainly attend to capital allocation and the care and feeding of our key managers. Most of thesemanagers are happiest when they are left alone to run their businesses, and that is customarily just how we leave them. That
puts them in charge of all operating decisions and of dispatching the excess cash they generate to headquarters. By sendingit to us, they don't get diverted by the various enticements that would come their way were they responsible for deploying
the cash their businesses throw off. Furthermore, Charlie and I are exposed to a much wider range of possibilities forinvesting these funds than any of our managers could find in his or her own industry.
Most of our managers are independently wealthy, and it's therefore up to us to create a climate that encouragesthem to choose working with Berkshire over golfing or fishing. This leaves us needing to treat them fairly and in the
manner that we would wish to be treated if our positions were reversed.
As for the allocation of capital, that's an activity both Charlie and I enjoy and in which we have acquired some
useful experience. In a general sense, grey hair doesn't hurt on this playing field: You don't need good hand-eyecoordination or well-toned muscles to push money around (thank heavens). As long as our minds continue to function
effectively, Charlie and I can keep on doing our jobs pretty much as we have in the past.
On my death, Berkshire's ownership picture will change but not in a disruptive way: First, only about 1% of my
stock will have to be sold to take care of bequests and taxes; second, the balance of my stock will go to my wife, Susan, if she survives me, or to a family foundation if she doesn't. In either event, Berkshire will possess a controlling shareholder
guided by the same philosophy and objectives that now set our course.
At that juncture, the Buffett family will not be involved in managing the business, only in picking and overseeing
the managers who do. Just who those managers will be, of course, depends on the date of my death. But I can anticipate
what the management structure will be: Essentially my job will be split into two parts, with one executive becomingresponsible for investments and another for operations. If the acquisition of new businesses is in prospect, the two will
cooperate in making the decisions needed. Both executives will report to a board of directors who will be responsive to thecontrolling shareholder, whose interests will in turn be aligned with yours.
Were we to need the management structure I have just described on an immediate basis, my family and a few keyindividuals know who I would pick to fill both posts. Both currently work for Berkshire and are people in whom I have total
confidence.
I will continue to keep my family posted on the succession issue. Since Berkshire stock will make up virtually my
entire estate and will account for a similar portion of the assets of either my wife or the foundation for a considerable periodafter my death, you can be sure that I have thought through the succession question carefully. You can be equally sure that
the principles we have employed to date in running Berkshire will continue to guide the managers who succeed me.
Lest we end on a morbid note, I also want to assure you that I have never felt better. I love running Berkshire, andif enjoying life promotes longevity, Methuselah's record is in jeopardy.
Warren E. Buffett
Chairman
8/14/2019 Berkshire Hathaway 2000 Annual Report
http://slidepdf.com/reader/full/berkshire-hathaway-2000-annual-report 68/78
67
BERKSHIRE HATHAWAY INC.
COMBINED FINANCIAL STATEMENTS
BUSINESS GROUPS
Berkshire's consolidated data is rearranged in the presentations on the
following six pages into four categories, corresponding to the way Mr.
Buffett and Mr. Munger think about Berkshire's businesses. The
presentations may be helpful to readers in making estimates of Berkshire's
intrinsic value.
The presentations in this section do not conform in all respects to GAAP.
Principal departures from GAAP relate to accounting treatment for assets
acquired in business acquisitions, although students and practitioners of
accounting will recognize others.
Opinions of Berkshire's independent auditors were not solicited for
this data. The four-category presentations in no way fell within their
purview.
8/14/2019 Berkshire Hathaway 2000 Annual Report
http://slidepdf.com/reader/full/berkshire-hathaway-2000-annual-report 69/78
68
BERKSHIRE HATHAWAY INC.
INSURANCE GROUP
Berkshire's insurance businesses are comprised of four operating
groups of subsidiaries. GEICO, through its subsidiaries, is a multiple lineproperty and casualty insurer the principal business of which is writing private
passenger automobile insurance. GEICO policies are marketed mainly bydirect response methods in which customers apply for coverage directly to thecompany over the telephone, through the mail or via the Internet. GEICO is
currently the sixth largest auto insurer in the U.S.
The Berkshire Hathaway Reinsurance Group provides treaty andlimited facultative reinsurance to other property/casualty insurers and
reinsurers. Berkshire is one of the world's leading providers of catastropheexcess of loss reinsurance. In recent years, the group has generated significant
premium volume from a few very sizable retroactive reinsurance contracts.Berkshire's unparalleled capital strength has enabled it to offer dollar coverages
of a magnitude far in excess of its competitors.
On December 21, 1998, Berkshire acquired General Re Corporation.
General Re is a holding company for global reinsurance and related risk management operations. General Re, through its domestic subsidiaries,
General Reinsurance Corporation and National Reinsurance Corporation, isone of the largest professional property/casualty reinsurance groups domiciledin the United States. General Re also owns a controlling interest in Cologne
Re, a major international reinsurer.
Berkshire's fourth group of businesses underwrite miscellaneous forms
of direct insurance. National Indemnity Company and other affiliated entitiesunderwrite multiple lines of traditional insurance for primarily commercial
accounts. The "Homestate Group" companies underwrite various commercialcoverages for risks in an increasing number of selected states. Cypress
Insurance Company provides workers' compensation insurance to employers inCalifornia and other states. Central States Indemnity Company issues creditinsurance distributed through credit card issuers nationwide, Kansas Bankers
Surety Company is an insurer for primarily small and medium sized bankslocated in the midwest and the United States Liability Insurance Group
(acquired on August 8, 2000) is a provider of excess and surplus lines of insurance.
Combined financial statements of the Insurance Group — unaudited
and not fully adjusted to conform to GAAP — are presented on the followingpage. These combined financial statements exclude the operating results of General Re from 1998's Statement of Earnings.
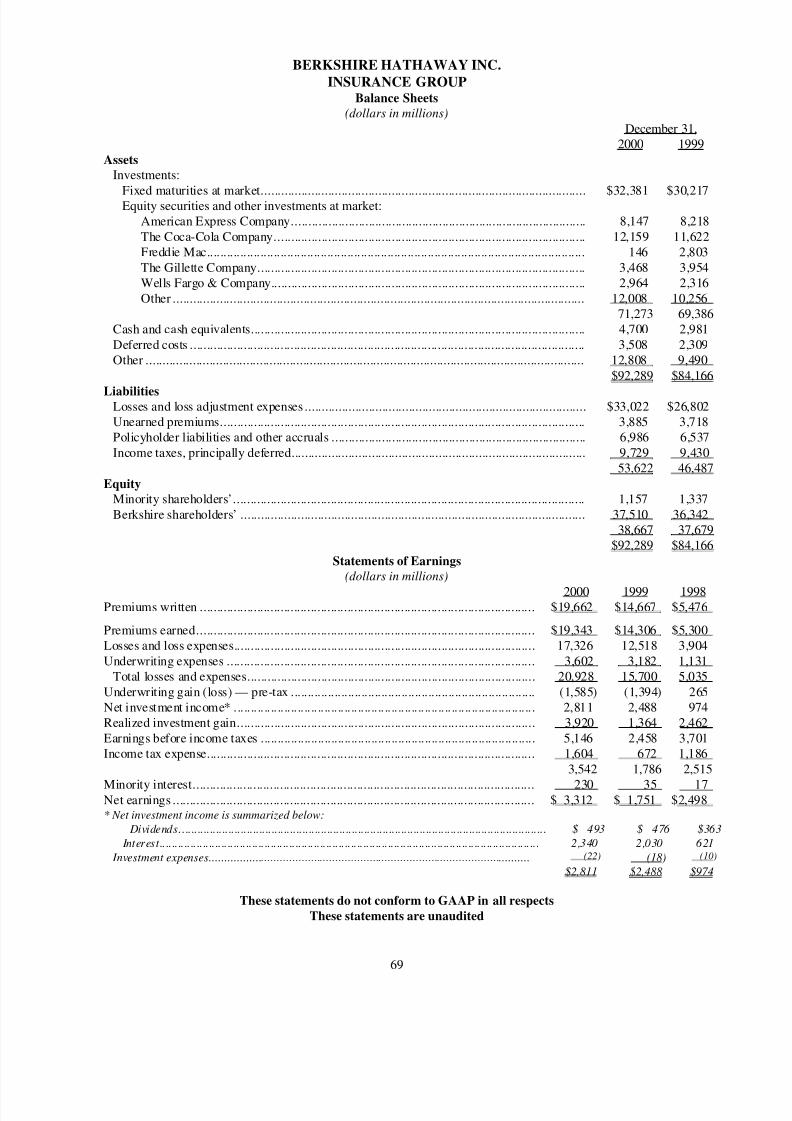
8/14/2019 Berkshire Hathaway 2000 Annual Report
http://slidepdf.com/reader/full/berkshire-hathaway-2000-annual-report 70/78
69
BERKSHIRE HATHAWAY INC.
INSURANCE GROUPBalance Sheets
(dollars in millions)
December 31,2000 1999
Assets
Investments:
Fixed maturities at market................................................................................................. $32,381 $30,217Equity securities and other investments at market:American Express Company........................................................................................ 8,147 8,218
The Coca-Cola Company............................................................................................. 12,159 11,622Freddie Mac................................................................................................................. 146 2,803
The Gillette Company.................................................................................................. 3,468 3,954Wells Fargo & Company.............................................................................................. 2,964 2,316
Other ........................................................................................................................... 12,008 10,25671,273 69,386
Cash and cash equivalents.................................................................................................... 4,700 2,981
Deferred costs ...................................................................................................................... 3,508 2,309Other ................................................................................................................................... 12,808 9,490
$92,289 $84,166
LiabilitiesLosses and loss adjustment expenses .................................................................................... $33,022 $26,802Unearned premiums............................................................................................................. 3,885 3,718Policyholder liabilities and other accruals ............................................................................ 6,986 6,537
Income taxes, principally deferred........................................................................................ 9,729 9,43053,622 46,487
Equity
Minority shareholders’......................................................................................................... 1,157 1,337
Berkshire shareholders’ ....................................................................................................... 37,510 36,34238,667 37,679
$92,289 $84,166
Statements of Earnings
(dollars in millions)
2000 1999 1998Premiums written .................................................................................................... $19,662 $14,667 $5,476
Premiums earned..................................................................................................... $19,343 $14,306 $5,300Losses and loss expenses.......................................................................................... 17,326 12,518 3,904
Underwriting expenses ............................................................................................ 3,602 3,182 1,131Total losses and expenses...................................................................................... 20,928 15,700 5,035
Underwriting gain (loss) — pre-tax ......................................................................... (1,585) (1,394) 265Net investment income* .......................................................................................... 2,811 2,488 974Realized investment gain......................................................................................... 3,920 1,364 2,462
Earnings before income taxes .................................................................................. 5,146 2,458 3,701Income tax expense.................................................................................................. 1,604 672 1,186
3,542 1,786 2,515
Minority interest...................................................................................................... 230 35 17Net earnings ............................................................................................................ $ 3,312 $ 1,751 $2,498* Net investment income is summarized below:
Dividends....................................................................................................................... $ 493 $ 476 $363
Interest........................................................................................................................... 2,340 2,030 621
Investment expenses........................................................................................................ (22) (18) (10)
$2,811 $2,488 $974
These statements do not conform to GAAP in all respects
These statements are unaudited
8/14/2019 Berkshire Hathaway 2000 Annual Report
http://slidepdf.com/reader/full/berkshire-hathaway-2000-annual-report 71/78
70
BERKSHIRE HATHAWAY INC.
MANUFACTURING, RETAILING AND SERVICES BUSINESSES
Combined financial statements of Berkshire's Manufacturing, Retailing and Services businesses - unaudited andnot fully adjusted to conform to GAAP - are presented on the following page. The operations whose data have been
combined in these presentations include the following:
Operation Product/Service/Activity
Acme Building Brands Face brick and other building materials Adalet Electrical enclosure systems and cable accessories Ben Bridge Jeweler Retailing fine jewelry Benjamin Moore Architectural and industrial coatings Blue Chip Stamps Marketing motivational services Borsheim's Retailing fine jewelry Buffalo News Daily and Sunday newspaperCampbell Hausfeld Air compressors and tools, painting systems, pressure washers, welders and generators
Carefree Comfort and convenience products for the recreational vehicle industryCleveland Wood Products Vacuum cleaner brushes and bagsCORT Business Services Provider of rental furniture, accessories and related services
Dexter Shoe Company Dress, casual and athletic shoes Douglas Products Specialty and cordless vacuum cleaners Executive Jet Fractional ownership programs for general aviation aircraftFechheimer Bros. Co. Uniforms and accessoriesFlightSafety High technology training to operators of aircraft and shipsFrance Sign transformers including components and battery chargers
H. H. Brown Shoe Co. Work shoes, boots and casual footwear Halex Zinc die cast conduit fittings and other electrical construction materials Helzberg's Diamond Shops Retailing fine jewelry International Dairy Queen Licensing and servicing Dairy Queen Stores
Jordan’s Furniture Retailing home furnishings Justin Brands Western footwearKingston Appliance controls and actuatorsKirby Home cleaning systems
Lowell Shoe, Inc. Women's and nurses' shoes Meriam Pressure and flow measurement devices MidAmerican Energy Production, supply and distribution of energy Nebraska Furniture Mart Retailing home furnishings Northland Fractional horsepower electric motorsPowerwinch Marine and general purpose winches, windlasses, and hoistsPrecision Steel Products Steel service centerQuikut Cutlery for the home and sporting goods marketsScottCare Cardiopulmonary rehabilitation and monitoring equipment
Scot Labs Cleaning compounds and solutionsSee's Candies Boxed chocolates and other confectionery productsStahl Truck equipment including service flatbed and dump bodies, cranes, tool boxes, and hoistStar Furniture Company Retailing home furnishingsWayne Combustion Systems Oil and gas burners for residential and commercial appliances and equipmentWayne Water Systems Sump, utility, sewage and well pumpsWestern Enterprises Medical and industrial compressed gas fittings and regulatorsWestern Plastics Molded plastic components
R.C. Willey Home Furnishings Retailing home furnishingsWorld Book Printed and multimedia encyclopedias and other educational materials
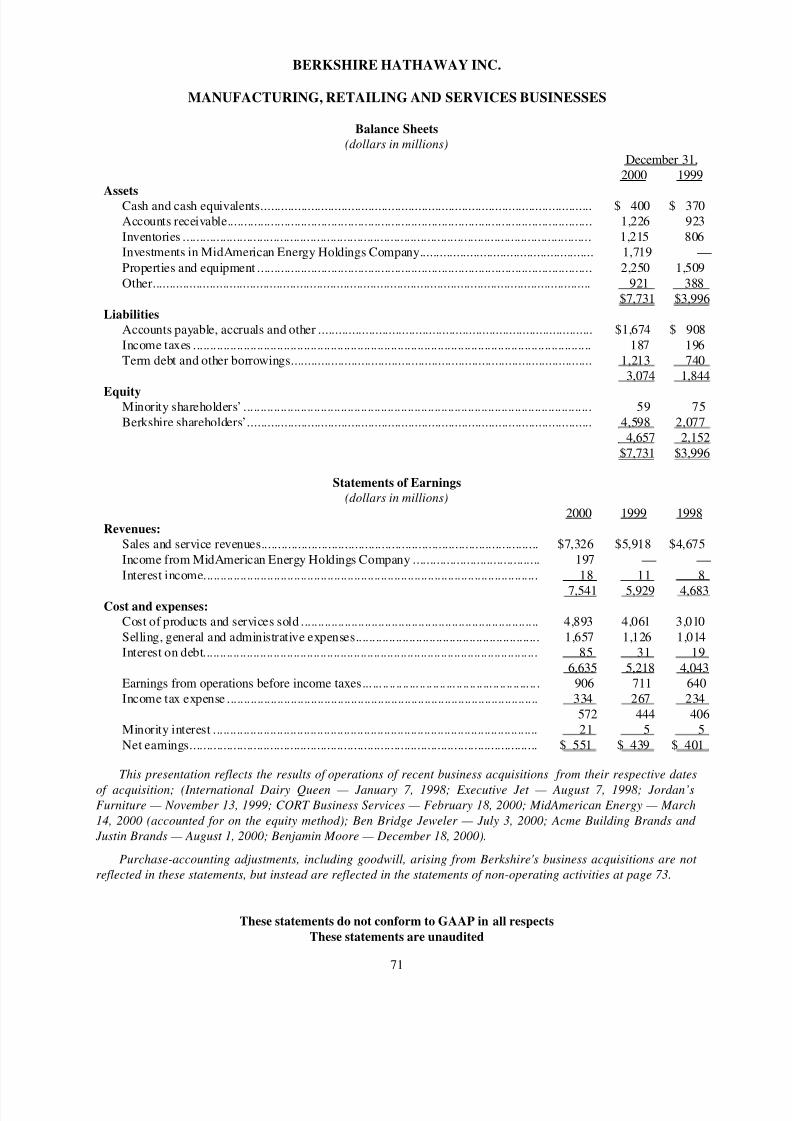
8/14/2019 Berkshire Hathaway 2000 Annual Report
http://slidepdf.com/reader/full/berkshire-hathaway-2000-annual-report 72/78
71
BERKSHIRE HATHAWAY INC.
MANUFACTURING, RETAILING AND SERVICES BUSINESSES
Balance Sheets
(dollars in millions)
December 31,2000 1999
AssetsCash and cash equivalents................................................................................................... $ 400 $ 370Accounts receivable............................................................................................................. 1,226 923
Inventories .......................................................................................................................... 1,215 806Investments in MidAmerican Energy Holdings Company.................................................... 1,719
Properties and equipment .................................................................................................... 2,250 1,509
Other................................................................................................................................... 921 388$7,731 $3,996
Liabilities
Accounts payable, accruals and other .................................................................................. $1,674 $ 908
Income taxes ....................................................................................................................... 187 196Term debt and other borrowings.......................................................................................... 1,213 740
3,074 1,844
EquityMinority shareholders’ ........................................................................................................ 59 75
Berkshire shareholders’....................................................................................................... 4,598 2,0774,657 2,152
$7,731 $3,996
Statements of Earnings
(dollars in millions)
2000 1999 1998
Revenues:
Sales and service revenues................................................................................... $7,326 $5,918 $4,675
Income from MidAmerican Energy Holdings Company ...................................... 197
Interest income.................................................................................................... 18 11 8
7,541 5,929 4,683Cost and expenses:
Cost of products and services sold ....................................................................... 4,893 4,061 3,010
Selling, general and administrative expenses....................................................... 1,657 1,126 1,014Interest on debt.................................................................................................... 85 31 19
6,635 5,218 4,043Earnings from operations before income taxes... ... .. .. .. .. ... .. .. .. .. ... .. .. .. .. ... .. .. .. .. ... .. . 906 711 640Income tax expense ............................................................................................. 334 267 234
572 444 406Minority interest ................................................................................................. 21 5 5
Net earnings........................................................................................................ $ 551 $ 439 $ 401
This presentation reflects the results of operations of recent business acquisitions from their respective dates
of acquisition; (International Dairy Queen — January 7, 1998; Executive Jet — August 7, 1998; Jordan’sFurniture — November 13, 1999; CORT Business Services — February 18, 2000; MidAmerican Energy — March
14, 2000 (accounted for on the equity method); Ben Bridge Jeweler — July 3, 2000; Acme Building Brands and
Justin Brands — August 1, 2000; Benjamin Moore — December 18, 2000).
Purchase-accounting adjustments, including goodwill, arising from Berkshire's business acquisitions are not
reflected in these statements, but instead are reflected in the statements of non-operating activities at page 73.
These statements do not conform to GAAP in all respects
These statements are unaudited
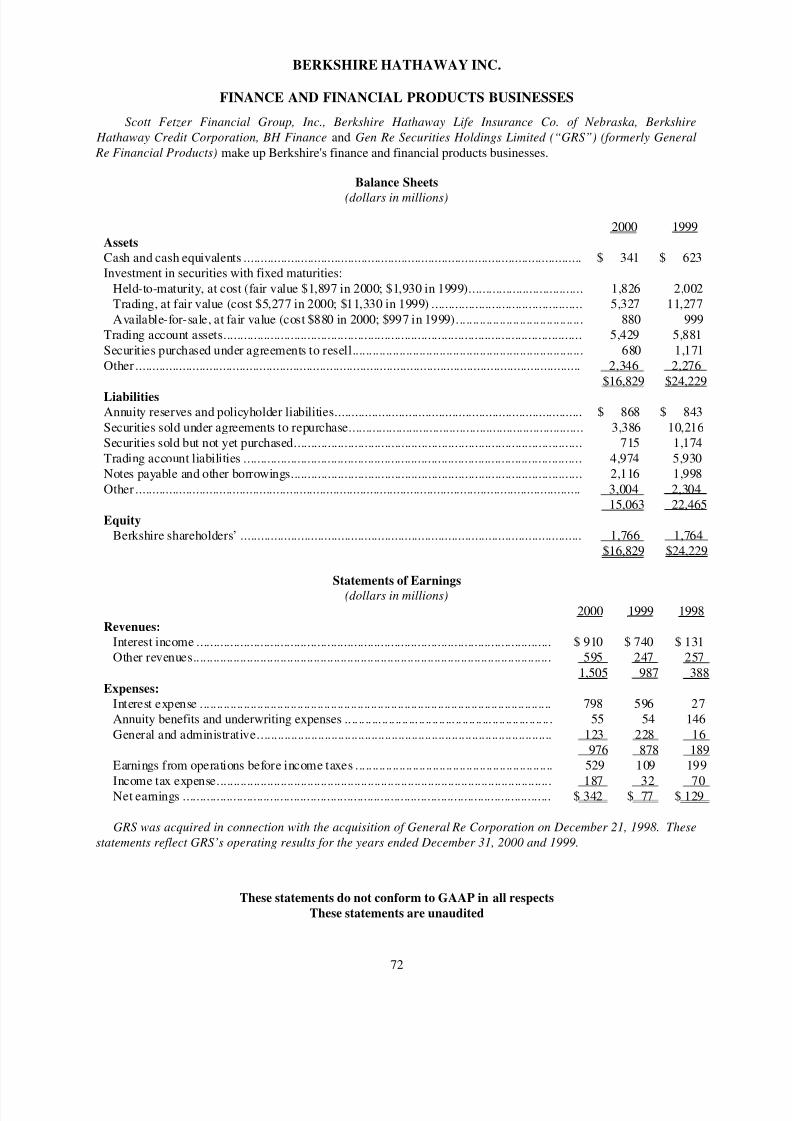
8/14/2019 Berkshire Hathaway 2000 Annual Report
http://slidepdf.com/reader/full/berkshire-hathaway-2000-annual-report 73/78
72
BERKSHIRE HATHAWAY INC.
FINANCE AND FINANCIAL PRODUCTS BUSINESSES
Scott Fetzer Financial Group, Inc., Berkshire Hathaway Life Insurance Co. of Nebraska, Berkshire
Hathaway Credit Corporation, BH Finance and Gen Re Securities Holdings Limited (“GRS”) (formerly General
Re Financial Products) make up Berkshire's finance and financial products businesses.
Balance Sheets
(dollars in millions)
2000 1999
Assets
Cash and cash equivalents ..................................................................................................... $ 341 $ 623Investment in securities with fixed maturities:
Held-to-maturity, at cost (fair value $1,897 in 2000; $1,930 in 1999).................................. 1,826 2,002Trading, at fair value (cost $5,277 in 2000; $11,330 in 1999) ............................................. 5,327 11,277
Available-for-sale, at fair value (cost $880 in 2000; $997 in 1999)...................................... 880 999Trading account assets........................................................................................................... 5,429 5,881
Securities purchased under agreements to resell..................................................................... 680 1,171Other ..................................................................................................................................... 2,346 2,276
$16,829 $24,229
LiabilitiesAnnuity reserves and policyholder liabilities.......................................................................... $ 868 $ 843
Securities sold under agreements to repurchase...................................................................... 3,386 10,216Securities sold but not yet purchased...................................................................................... 715 1,174
Trading account liabilities ..................................................................................................... 4,974 5,930Notes payable and other borrowings....................................................................................... 2,116 1,998
Other ..................................................................................................................................... 3,004 2,30415,063 22,465
Equity
Berkshire shareholders’ ...................................................................................................... 1,766 1,764$16,829 $24,229
Statements of Earnings
(dollars in millions)
2000 1999 1998
Revenues:
Interest income .......................................................................................................... $ 910 $ 740 $ 131Other revenues........................................................................................................... 595 247 257
1,505 987 388
Expenses:
Interest expense ......................................................................................................... 798 596 27Annuity benefits and underwriting expenses .. .. .. .. ... .. .. .. .. ... .. .. .. .. ... .. .. .. .. ... .. .. .. .. ... .. .. .. . 55 54 146
General and administrative........................................................................................ 123 228 16976 878 189
Earnings from operations before income taxes ........................................................... 529 109 199
Income tax expense.................................................................................................... 187 32 70Net earnings .............................................................................................................. $ 342 $ 77 $ 129
GRS was acquired in connection with the acquisition of General Re Corporation on December 21, 1998. These
statements reflect GRS’s operating results for the years ended December 31, 2000 and 1999.
These statements do not conform to GAAP in all respects
These statements are unaudited
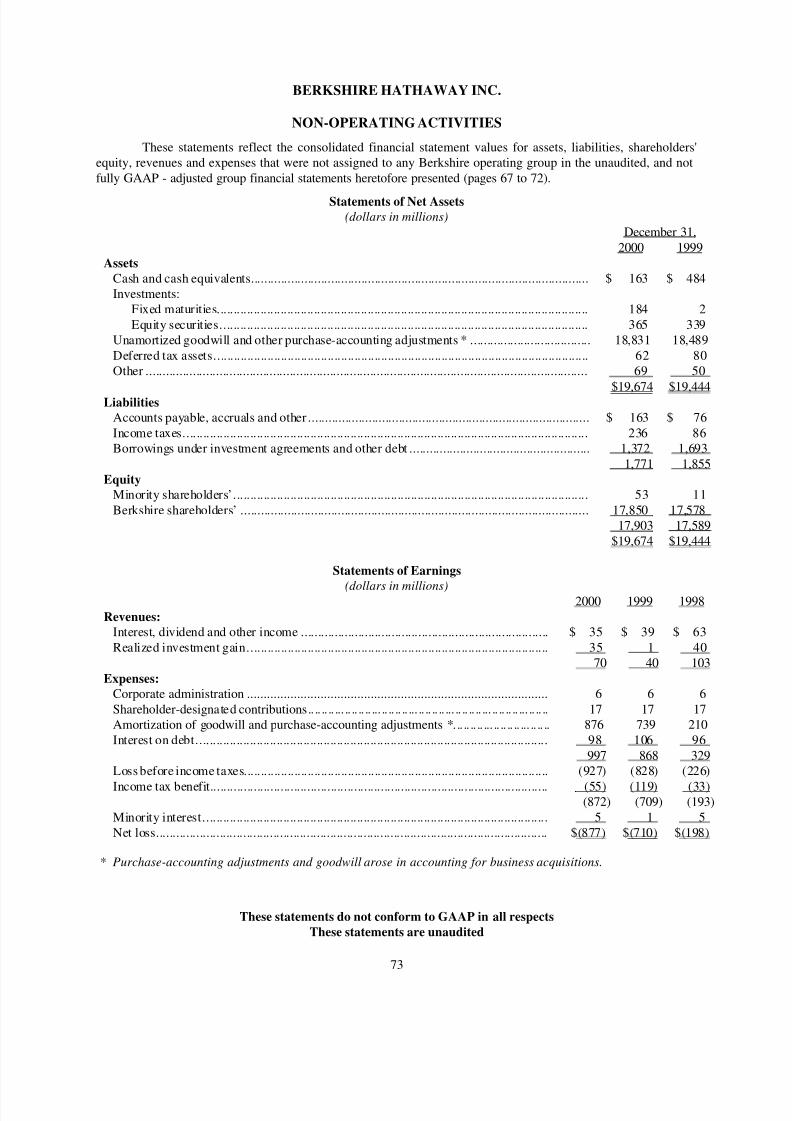
8/14/2019 Berkshire Hathaway 2000 Annual Report
http://slidepdf.com/reader/full/berkshire-hathaway-2000-annual-report 74/78
73
BERKSHIRE HATHAWAY INC.
NON-OPERATING ACTIVITIES
These statements reflect the consolidated financial statement values for assets, liabilities, shareholders'equity, revenues and expenses that were not assigned to any Berkshire operating group in the unaudited, and not
fully GAAP - adjusted group financial statements heretofore presented (pages 67 to 72).
Statements of Net Assets
(dollars in millions)
December 31,
2000 1999
Assets
Cash and cash equivalents..................................................................................................... $ 163 $ 484Investments:
Fixed maturities............................................................................................................... 184 2
Equity securities.............................................................................................................. 365 339Unamortized goodwill and other purchase-accounting adjustments * .................................... 18,831 18,489
Deferred tax assets................................................................................................................ 62 80Other .................................................................................................................................... 69 50
$19,674 $19,444Liabilities
Accounts payable, accruals and other .................................................................................... $ 163 $ 76
Income taxes......................................................................................................................... 236 86Borrowings under investment agreements and other debt ...................................................... 1,372 1,693
1,771 1,855
Equity
Minority shareholders’.......................................................................................................... 53 11
Berkshire shareholders’ ........................................................................................................ 17,850 17,57817,903 17,589
$19,674 $19,444
Statements of Earnings
(dollars in millions)2000 1999 1998
Revenues:
Interest, dividend and other income .......................................................................... $ 35 $ 39 $ 63
Realized investment gain.......................................................................................... 35 1 4070 40 103
Expenses:
Corporate administration .......................................................................................... 6 6 6
Shareholder-designated contributions.. .. .. .. ... .. .. .. .. ... .. .. .. .. ... .. .. .. .. ... .. .. .. .. ... .. .. .. .. ... .. .. .. 17 17 17Amortization of goodwill and purchase-accounting adjustments *... .. .. .. ... .. .. .. .. ... .. .. .. 876 739 210Interest on debt......................................................................................................... 98 106 96
997 868 329Loss before income taxes........................................................................................... (927) (828) (226)
Income tax benefit..................................................................................................... (55) (119) (33)(872) (709) (193)
Minority interest....................................................................................................... 5 1 5Net loss..................................................................................................................... $(877) $(710) $(198)
* Purchase-accounting adjustments and goodwill arose in accounting for business acquisitions.
These statements do not conform to GAAP in all respects
These statements are unaudited
8/14/2019 Berkshire Hathaway 2000 Annual Report
http://slidepdf.com/reader/full/berkshire-hathaway-2000-annual-report 75/78
74
BERKSHIRE HATHAWAY INC.
SHAREHOLDER-DESIGNATED CONTRIBUTIONS
The Company has conducted this program of corporate giving during each of the past twenty years. On October 14,1981, the Chairman sent to the shareholders a letter* explaining the program. Portions of that letter follow:
"On September 30, 1981 Berkshire received a tax ruling from the U.S. Treasury Department that, inmost years, should produce a significant benefit for charities of your choice.
"Each Berkshire shareholder — on a basis proportional to the number of shares of Berkshire that he
owns — will be able to designate recipients of charitable contributions by our company. You'll name thecharity; Berkshire will write the check. The ruling states that there will be no personal tax consequences toour shareholders from making such designations.
"Thus, our approximately 1500 owners now can exercise a perquisite that, although routinelyexercised by the owners in closely-held businesses, is almost exclusively exercised by the managers in
more widely-held businesses.
"In a widely-held corporation the executives ordinarily arrange all charitable donations, with no
input at all from shareholders, in two main categories:
(1) Donations considered to benefit the corporation directly in an amount roughly
commensurate with the cost of the donation; and
(2) Donations considered to benefit the corporation indirectly through hard-to-measure, long-delayed feedback effects of various kinds.
"I and other Berkshire executives have arranged in the past, as we will arrange in the future, all
charitable donations in the first category. However, the aggregate level of giving in such category has beenquite low, and very likely will remain quite low, because not many gifts can be shown to produce roughly
commensurate direct benefits to Berkshire.
"In the second category, Berkshire's charitable gifts have been virtually nil, because I am not
comfortable with ordinary corporate practice and had no better practice to substitute. What bothers meabout ordinary corporate practice is the way gifts tend to be made based more on who does the asking and
how corporate peers are responding than on an objective evaluation of the donee's activities.Conventionality often overpowers rationality.
"A common result is the use of the stockholder's money to implement the charitable inclinations of the corporate manager, who usually is heavily influenced by specific social pressures on him. Frequently
there is an added incongruity; many corporate managers deplore governmental allocation of the taxpayer'sdollar but embrace enthusiastically their own allocation of the shareholder's dollar.
"For Berkshire, a different model seems appropriate. Just as I wouldn't want you to implement yourpersonal judgments by writing checks on my bank account for charities of your choice, I feel it
inappropriate to write checks on your corporate "bank account" for charities of my choice. Your charitablepreferences are as good as mine and, for both you and me, funds available to foster charitable interests in atax-deductible manner reside largely at the corporate level rather than in our own hands.
"Under such circumstances, I believe Berkshire should imitate more closely-held companies, notlarger public companies. If you and I each own 50% of a corporation, our charitable decision making
would be simple. Charities very directly related to the operations of the business would have first claim on
our available charitable funds. Any balance available after the "operations-related" contributions would bedivided among various charitable interests of the two of us, on a basis roughly proportional to ourownership interest. If the manager of our company had some suggestions, we would listen carefully — but
the final decision would be ours. Despite our corporate form, in this aspect of the business we probablywould behave as if we were a partnership.
*Copyright © 1981 By Warren E. BuffettAll Rights Reserved
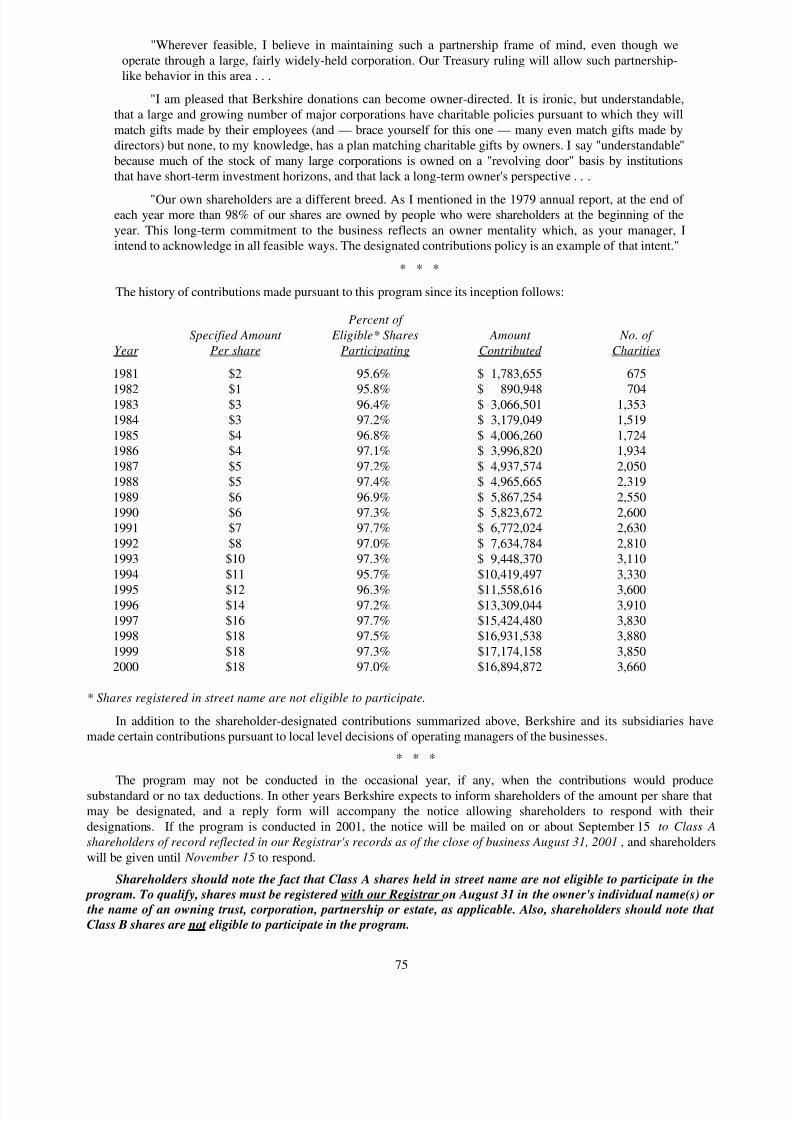
8/14/2019 Berkshire Hathaway 2000 Annual Report
http://slidepdf.com/reader/full/berkshire-hathaway-2000-annual-report 76/78
75
"Wherever feasible, I believe in maintaining such a partnership frame of mind, even though we
operate through a large, fairly widely-held corporation. Our Treasury ruling will allow such partnership-like behavior in this area . . .
"I am pleased that Berkshire donations can become owner-directed. It is ironic, but understandable,that a large and growing number of major corporations have charitable policies pursuant to which they will
match gifts made by their employees (and — brace yourself for this one — many even match gifts made bydirectors) but none, to my knowledge, has a plan matching charitable gifts by owners. I say "understandable"
because much of the stock of many large corporations is owned on a "revolving door" basis by institutionsthat have short-term investment horizons, and that lack a long-term owner's perspective . . .
"Our own shareholders are a different breed. As I mentioned in the 1979 annual report, at the end of each year more than 98% of our shares are owned by people who were shareholders at the beginning of the
year. This long-term commitment to the business reflects an owner mentality which, as your manager, Iintend to acknowledge in all feasible ways. The designated contributions policy is an example of that intent."
* * *
The history of contributions made pursuant to this program since its inception follows:
Percent of
Specified Amount Eligible* Shares Amount No. of
Year Per share Participating Contributed Charities
1981 $2 95.6% $ 1,783,655 675
1982 $1 95.8% $ 890,948 7041983 $3 96.4% $ 3,066,501 1,3531984 $3 97.2% $ 3,179,049 1,519
1985 $4 96.8% $ 4,006,260 1,7241986 $4 97.1% $ 3,996,820 1,934
1987 $5 97.2% $ 4,937,574 2,0501988 $5 97.4% $ 4,965,665 2,319
1989 $6 96.9% $ 5,867,254 2,5501990 $6 97.3% $ 5,823,672 2,6001991 $7 97.7% $ 6,772,024 2,630
1992 $8 97.0% $ 7,634,784 2,8101993 $10 97.3% $ 9,448,370 3,110
1994 $11 95.7% $10,419,497 3,330
1995 $12 96.3% $11,558,616 3,6001996 $14 97.2% $13,309,044 3,9101997 $16 97.7% $15,424,480 3,8301998 $18 97.5% $16,931,538 3,880
1999 $18 97.3% $17,174,158 3,8502000 $18 97.0% $16,894,872 3,660
* Shares registered in street name are not eligible to participate.
In addition to the shareholder-designated contributions summarized above, Berkshire and its subsidiaries havemade certain contributions pursuant to local level decisions of operating managers of the businesses.
* * *
The program may not be conducted in the occasional year, if any, when the contributions would producesubstandard or no tax deductions. In other years Berkshire expects to inform shareholders of the amount per share thatmay be designated, and a reply form will accompany the notice allowing shareholders to respond with their
designations. If the program is conducted in 2001, the notice will be mailed on or about September 15 to Class A
shareholders of record reflected in our Registrar's records as of the close of business August 31, 2001 , and shareholders
will be given until November 15 to respond.
Shareholders should note the fact that Class A shares held in street name are not eligible to participate in the
program. To qualify, shares must be registered with our Registrar on August 31 in the owner's individual name(s) or
the name of an owning trust, corporation, partnership or estate, as applicable. Also, shareholders should note that
Class B shares are not eligible to participate in the program.
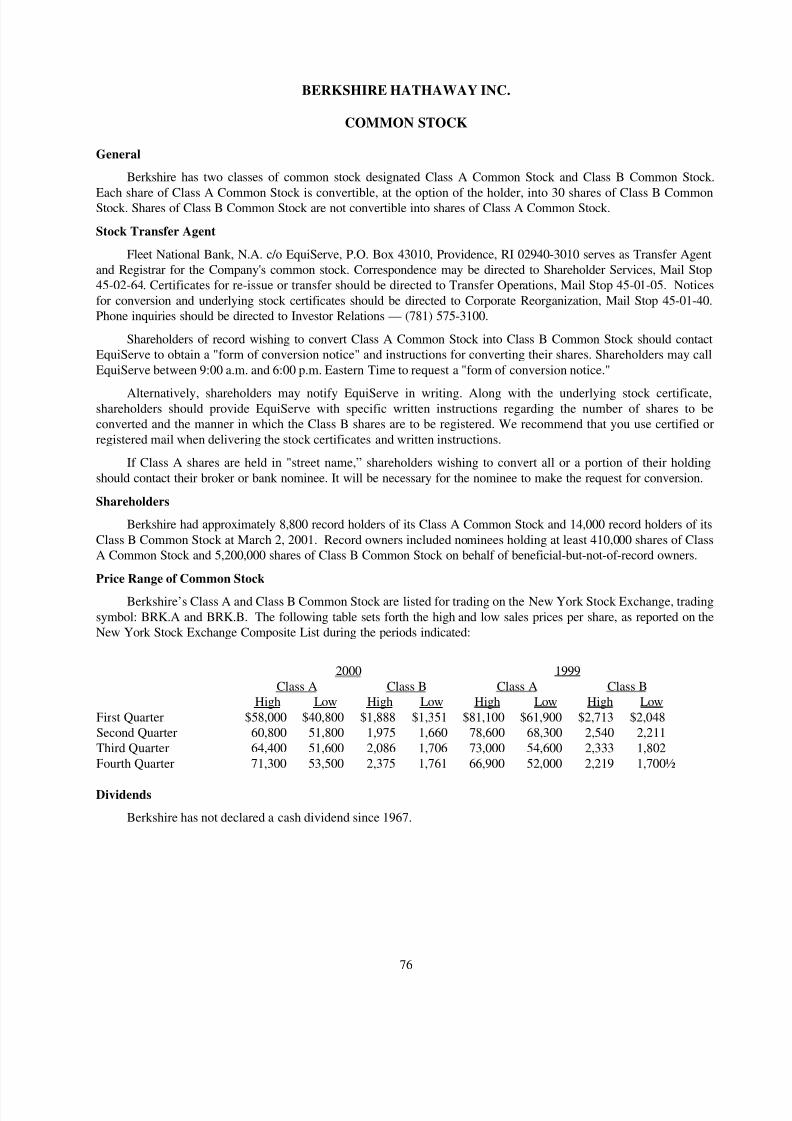
8/14/2019 Berkshire Hathaway 2000 Annual Report
http://slidepdf.com/reader/full/berkshire-hathaway-2000-annual-report 77/78
76
BERKSHIRE HATHAWAY INC.
COMMON STOCK
General
Berkshire has two classes of common stock designated Class A Common Stock and Class B Common Stock.
Each share of Class A Common Stock is convertible, at the option of the holder, into 30 shares of Class B CommonStock. Shares of Class B Common Stock are not convertible into shares of Class A Common Stock.
Stock Transfer Agent
Fleet National Bank, N.A. c/o EquiServe, P.O. Box 43010, Providence, RI 02940-3010 serves as Transfer Agentand Registrar for the Company's common stock. Correspondence may be directed to Shareholder Services, Mail Stop45-02-64. Certificates for re-issue or transfer should be directed to Transfer Operations, Mail Stop 45-01-05. Notices
for conversion and underlying stock certificates should be directed to Corporate Reorganization, Mail Stop 45-01-40.Phone inquiries should be directed to Investor Relations — (781) 575-3100.
Shareholders of record wishing to convert Class A Common Stock into Class B Common Stock should contactEquiServe to obtain a "form of conversion notice" and instructions for converting their shares. Shareholders may call
EquiServe between 9:00 a.m. and 6:00 p.m. Eastern Time to request a "form of conversion notice."
Alternatively, shareholders may notify EquiServe in writing. Along with the underlying stock certificate,shareholders should provide EquiServe with specific written instructions regarding the number of shares to beconverted and the manner in which the Class B shares are to be registered. We recommend that you use certified or
registered mail when delivering the stock certificates and written instructions.
If Class A shares are held in "street name,” shareholders wishing to convert all or a portion of their holding
should contact their broker or bank nominee. It will be necessary for the nominee to make the request for conversion.
Shareholders
Berkshire had approximately 8,800 record holders of its Class A Common Stock and 14,000 record holders of its
Class B Common Stock at March 2, 2001. Record owners included nominees holding at least 410,000 shares of ClassA Common Stock and 5,200,000 shares of Class B Common Stock on behalf of beneficial-but-not-of-record owners.
Price Range of Common Stock
Berkshire’s Class A and Class B Common Stock are listed for trading on the New York Stock Exchange, trading
symbol: BRK.A and BRK.B. The following table sets forth the high and low sales prices per share, as reported on theNew York Stock Exchange Composite List during the periods indicated:
2000 1999
Class A Class B Class A Class BHigh Low High Low High Low High Low
First Quarter $58,000 $40,800 $1,888 $1,351 $81,100 $61,900 $2,713 $2,048Second Quarter 60,800 51,800 1,975 1,660 78,600 68,300 2,540 2,211Third Quarter 64,400 51,600 2,086 1,706 73,000 54,600 2,333 1,802
Fourth Quarter 71,300 53,500 2,375 1,761 66,900 52,000 2,219 1,700½
Dividends
Berkshire has not declared a cash dividend since 1967.
8/14/2019 Berkshire Hathaway 2000 Annual Report
http://slidepdf.com/reader/full/berkshire-hathaway-2000-annual-report 78/78
BERKSHIRE HATHAWAY INC.
DIRECTORS
WARREN E. BUFFETT, Chairman
Chief Executive Officer of Berkshire
CHARLES T. MUNGER, Vice Chairman of BerkshireSUSAN T. BUFFETT
HOWARD G. BUFFETT,
Chairman of the Board of Directors of The GSI Group,
a company primarily engaged in the manufacture of
agricultural equipment.
MALCOLM G. CHACE,
Chairman of the Board of Directors of BankRI,
a community bank located in the State
of Rhode Island.
RONALD L. OLSON,
Partner of the law firm of
Munger Tolles & Olson, LLP.
WALTER SCOTT, JR.,
Chairman of Level 3 Communications, a successor to certain
businesses of Peter Kiewit Sons’ Inc. which is engaged in
telecommunications and computer outsourcing.
OFFICERS
WARREN E. BUFFETT, Chairman and CEO
CHARLES T. MUNGER, Vice Chairman
MARC D. HAMBURG, Vice President, Treasurer
DANIEL J. JAKSICH, Controller FORREST N. KRUTTER, Secretary
REBECCA K. AMICK,
Director of Internal Auditing
JERRY W. HUFTON,
Director of Taxes
MARK D. MILLARD,
Director of Financial Assets
Letters from Annual Reports (1977 through 2000), quarterly reports, press releases and
other information about Berkshire may be obtained on the Internet at berkshirehathaway com
Related Documents