BERGRIVIER MUNICIPALITY Annual Water Services Development Plan Performance- and Water Services Audit Report as directed by the Water Services Act (Act 108 of 1997) and the Regulations relating to Compulsory National Standards and Measures to Conserve Water FY 2016/2017 3 NOVEMBER 2017 Ref C00574/A0003 WorleyParsons RSA (Pty) Ltd Contact person: Jaco Human 31 Allen Drive, Loevenstein 7530 PO Box 398, Bellville 7535 South Africa Telephone: +27 (0)21 912 3000 Facsimile: +27 (0)21 912 3222 email: [email protected] ABN 61 001 279 812 PO Box 60 Piketberg 7320 Tel: (022) 913 6000 Fax: (022) 913 1406

Welcome message from author
This document is posted to help you gain knowledge. Please leave a comment to let me know what you think about it! Share it to your friends and learn new things together.
Transcript
BERGRIVIER MUNICIPALITY
Annual Water Services Development Plan Performance- and Water Services Audit Report
as directed by the Water Services Act (Act 108 of 1997) and the Regulations relating to Compulsory National
Standards and Measures to Conserve Water
FY 2016/2017 3 NOVEMBER 2017
Ref C00574/A0003
WorleyParsons RSA (Pty) Ltd Contact person: Jaco Human 31 Allen Drive, Loevenstein 7530 PO Box 398, Bellville 7535 South Africa Telephone: +27 (0)21 912 3000 Facsimile: +27 (0)21 912 3222 email: [email protected] ABN 61 001 279 812
© Copyright 2011 WorleyParsons
PO Box 60 Piketberg 7320
Tel: (022) 913 6000 Fax: (022) 913 1406

Bergrivier Municipality: Annual WSDP Performance- and Water Services Audit Report for 2016/2017
2017/11/03 Bergrivier Water Services Audit 2016-2017
ii
FOREWORD:
Bergrivier Municipality is required in terms of Section 18 of the Water Services Act, 1997 (Act No.108 of 1997), as well as the “Regulations relating to compulsory national standards and measures to conserve water”, as issued in terms of sections 9(1) and 73(1)(j) of the Water Services Act, to report on the implementation of its WSDP during each financial year and to include a water services audit in such an annual report.
The WSDP Performance- and Water Services Audit is designed to monitor the compliance of Bergrivier Municipality with these regulations. It also assists the communities within Bergrivier Municipality’s Management Area and the DWS to assess how well the Municipality is performing relative to their stated intentions and their capacity. The Water Services Audit Report can be seen as an annexure to the Municipality’s Annual Report. The Annual Report is compiled as required by the Local Government Municipal Systems Act, Act no 32 of 2000 (Section 46) and the Local Government: Municipal Finance Management Act, Act no 56 of 2003 (Section 121).
The Municipality’s overall Blue Drop score came down from 90.60% for 2012 to 63.79% for 2014. The DWS mentioned that Bergrivier Municipality was well prepared for the assessment and demonstrated a positive approach to the Blue Drop Certification Programme. Consequently, it is anticipated that through acknowledgement of the identified gaps that progressive improvement in compliance will once again be achieved in future assessments. The overall 2014 Risk Rating for Bergrivier Municipality is 52%.
The overall Green Drop Score of the Municipality came down from 70.00% in 2011 to 44.21% in 2013 and was performing below average with regard to wastewater quality management. The highest Green Drop Score of 62.60% was for the Porterville WWTW and drainage system and the lowest Green Drop Score of 24.23% was for the Eendekuil WWTW and drainage system. The Municipality is however committed to improve their future Green Drop Scores.
The CRRs decreased in two of the systems (Dwarskersbos and Eendekuil) and stayed roughly the same for Piketberg, Porterville and Velddrif during the 2013/2014 Green Drop Progress Reporting in 2014. Upgrades to the system have been made, resulting in improved compliance at most plants. A W2RAP is in place and are being implemented to ensure that high risk areas are abated. All indicators are that Bergrivier is showing PROGRESS against the CRR rating over the 2011 to 2012 assessment year. The team is congratulated for their preparedness and positive contribution to the PAT assessments.
The implementation of Bergrivier Municipality’s WC/WDM Strategy has been extremely successful and the Municipality was able to reduce the water requirements of the towns significantly. The average annual growth percentage in total raw water requirements for Bergrivier Municipality over the period 2010/2011 to 2016/2017 was only 0.21 %/a. The overall percentage of NRW for all the internal distribution systems came down from 12.13% in 2015/2016 to 10.90% for the 2016/2017 financial year, which is very good.
The Western Cape is currently experienced a severe drought, which also impacts on the availability and supply of bulk water from the West Coast District Municipality to Bergrivier Municipality and the yield of the Municipality’s own existing surface water resources. WC/WDM measures to lower the future water requirements and the augmentation of the existing water resources with groundwater or other sources are therefore critical at this stage. Various levels of water restrictions were therefore implemented by Bergrivier Municipality over the last financial year.
A comprehensive Performance Management System and Customer Services and Complaints system are also in place. The SDBIP is the process plan and performance indicator / evaluation process for the execution of the budget. The SDBIP is being used as a management, implementation and monitoring tool that assists and guide the Executive Mayor, Councillors, Municipal Manager, Senior Managers and the community. The plan serves as an input to the performance agreements of the Municipal Manager and Directors. It also forms the basis for the monthly, quarterly, mid-year and the annual assessment report and performance assessments of the Municipal Manager and Directors.
Bergrivier Municipality: Annual WSDP Performance- and Water Services Audit Report for 2016/2017
2017/11/03 Bergrivier Water Services Audit 2016-2017
iii
The water and sanitation services of Bergrivier Municipality is managed in a financial sustainable manner, with a surplus generated on the operation and maintenance budgets of both services for the last seven financial years. The Operation and Maintenance budget allocated towards the rehabilitation and maintenance of the existing water and sewerage infrastructure however needs to be increased. A budget of approximately 2% of the total asset value per annum should be allocated towards the replacement of existing infrastructure. In the case of the operations and maintenance of the systems, a budget of approximately 1% to 2% of the value of the system is typically required to ensure that the systems remain in good condition.
The Municipality has maintained a high and consistent level of service to its urban water consumers. After hour emergency requests are being dealt with by the control room on a twenty-four hour basis. Bergrivier Municipality further developed a Client Services Charter in collaboration with various stakeholders to affirm their commitment to providing unsurpassed service delivery within the Bergrivier Municipality’s Management Area.
“Community involvement and excellent client services are the building blocks of Bergrivier Municipality”
Bergrivier Municipality also successfully completed various capital projects over the last financial year. The capital budget expenditure, for the 2016/2017 financial year, was R5.335 million (98% of the budget) for the water infrastructure projects and R2.168 million (108% of the budget) for the sewerage infrastructure projects.

Bergrivier Municipality: Annual WSDP Performance- and Water Services Audit Report for 2016/2017
2017/11/03 Bergrivier Water Services Audit 2016-2017
iv
BERGRIVIER MUNICIPALITY
WATER SERVICES AUDIT FOR 2016/2017
ITEM DESCRIPTION PAGE
FOREWORD ..................................................................................................................................... ii
LIST OF TABLES AND FIGURES .................................................................................................... vi
ABBREVIATIONS AND DEFINITIONS .............................................................................................. x
KEY TERMS AND INTERPRETATIONS ......................................................................................... xii
EXECUTIVE SUMMARY ................................................................................................................ xiv
BACKGROUND ................................................................................................................................ 1
Appointment ..................................................................................................................................... 1
Purpose ............................................................................................................................................ 1
SECTION A: WATER SERVICES AUTHORITY PROFILE ............................................................... 2
A.1. Map of Water Services Authority Area of Jurisdiction .......................................................... 2
A.2. Water Services Administration and Organization ................................................................ 4
A.3 Water Services Overview .................................................................................................... 5
SECTION B: WSDP PERFORMANCE REPORT ............................................................................14
B.1 WSDP Reference and Status .............................................................................................14
B.2 Performance on Water Services Objectives and Strategies ...............................................14
B.3 Status of Water Services Projects ..................................................................................... 19
B.4 Past Financial Year Water Services Project Impact Declaration ....................................... 20
SECTION C: WATER SERVICES AUDIT REPORT ........................................................................21
C.1 Quantity of Water Services Provided (Water Balance) ...................................................... 21
C.2 Water Services Delivery Profile ......................................................................................... 26
C.2.1 User Connection Profile .................................................................................................... 26
C.2.2 Residential Water Services Delivery Access Profile .......................................................... 31
C.2.3 Residential Water Services Delivery Access Profile .......................................................... 37
C.3 Cost Recovery and Free Basic Services ........................................................................... 39
C.3.1 Tariffs ................................................................................................................................ 39
C.3.2 Metering, Billing and Free Basic Services ......................................................................... 40
C.4 Water Quality ................................................................................................................... 44

Bergrivier Municipality: Annual WSDP Performance- and Water Services Audit Report for 2016/2017
2017/11/03 Bergrivier Water Services Audit 2016-2017
v
C.4.1 Sampling Programme ....................................................................................................... 44
C.4.2 Water Quality Compliance ................................................................................................ 53
C.4.3 Incident Management ........................................................................................................ 57
C.5 Water Conservation and Water Demand Management ......................................................59
C.6 Water Services Infrastructure Management ...................................................................... 64
C.7 Associated Services .......................................................................................................... 70
C.8 Water Resources .............................................................................................................. 71
C.9 Institutional Arrangement Profile ....................................................................................... 79
C.10 Social and Customer Services Requirements ................................................................... 84
SECTION D: APPROVAL AND PUBLICATION RECORD ...............................................................89
REFERENCES
ANNEXURES:
Annexure A: Monthly billed metered consumption per category user per town
Monthly number of consumer units per category per town
Water balance models for the various distribution systems
WTWs flows and capacities
WWTWs flows and capacities
DWS’s Scorecard for assessing the potential for WC/WDM efforts
Annexure B: No Drop Spreadsheets and ILI for the various distribution systems
Annexure C: Future Water Requirement Projection Models for the various distribution systems.
Annexure D: Water Quality Compliance Sample Results
Final Effluent Quality Compliance Sample Results
Annexure E: Water and Sanitation Operational and Maintenance Budget
Annexure F: Organogram (Water and Wastewater)

Bergrivier Municipality: Annual WSDP Performance- and Water Services Audit Report for 2016/2017
2017/11/03 Bergrivier Water Services Audit 2016-2017
vi
LIST OF TABLES AND FIGURES
TABLES
Table A.1.1 Overview of settlements in Bergrivier Municipality’s Management Area ................................. 3
Table A.2.1 Water Services Administrative Structure ................................................................................. 4
Table A.3.1 Summary of existing main water infrastructure ..................................................................... 10
Table A.3.2 Summary of existing main sewerage infrastructure .............................................................. 10
Table A.3.3 Definitions of Water Supply and Sanitation Services ............................................................ 10
Table A.3.4 Annual population growth percentages per distribution system ............................................ 11
Table A.3.5 Water Services Overview (Water) ......................................................................................... 12
Table A.3.6 Water Services Overview (Sanitation) ................................................................................... 13
Table B.1.1 WSDP and Reporting Reference .......................................................................................... 14
Table B.2.1 Performance on Water Services Objectives and Strategies per WSDP Topic ..................... 15
Table B.3.1 Water Services Projects Status and Performance ................................................................ 19
Table B.4.1 Past Financial Year Project Impact Declaration .................................................................... 20
Table C.1.1 Bulk water supply to the various towns ................................................................................. 21
Table C.1.2 Quantity of Water Services Provided / Water Balance .......................................................... 22
Table C.1.3 Quantity of water used by each user sector (Ml/a) ................................................................ 23
Table C.1.4 Quantity of effluent received at the various WWTWs ........................................................... 24
Table C.1.5 Current effluent re-used practices at the various WWTWs .................................................. 25
Table C.2.1.1 User Connection Profile (Water Services) ............................................................................ 26
Table C.2.1.2 User Connection Profile (Wastewater Services) ................................................................... 28
Table C.2.1.3 Number of consumer units in each user sector per town ...................................................... 30
Table C.2.1.4 Total number of consumer units per town and percentage annual growth from 2013/2014 to 2016/2017 .......................................................................................................................... 30
Table C.2.1.5 Total number of new water and sanitation connections for 2014/2015 - 2016/2017 ............. 31
Table C.2.2.1 Residential Water Services Delivery Access Profile: Water .................................................. 32
Table C.2.2.2 Residential water services levels (Residential Consumer Units) .......................................... 33
Table C.2.2.3 Residential Water Services Delivery Access Profile: Sanitation ........................................... 34
Table C.2.2.4 Residential sanitation services levels (Residential Consumer Units) .................................... 36
Table C.2.3.1 Residential Water Services Delivery Adequacy Profile (Water) ............................................ 37
Table C.2.3.2 Residential Water Services Delivery Adequacy Profile (Sanitation) ...................................... 38
Table C.3.1 Water tariffs for 2016/2017 and the previous four financial years ......................................... 39
Table C.3.2 Sewerage tariffs for 2016/2017 and the previous four financial years .................................. 39
Table C.3.2.1 Overview of Metering, Billing and Free Basic Services ......................................................... 40
Table C.3.3.1 Overview of Water Services Revenue Collection and Cost Recovery .................................. 41
Table C.3.3.2 Operational and Maintenance budget for water services for the last five years .................... 43
Table C.3.3.3 Operational and Maintenance budget for sanitation services for the last five years ............. 43
Table C.3.3.4 Consumer debtors per service for the last seven financial years .......................................... 44

Bergrivier Municipality: Annual WSDP Performance- and Water Services Audit Report for 2016/2017
2017/11/03 Bergrivier Water Services Audit 2016-2017
vii
LIST OF TABLES AND FIGURES / Continue
TABLES
Table C.4.1.1 Sampling Programme for Potable Water Quality - Network .................................................. 44
Table C.4.1.2 Sampling Programme for Potable Water Quality - WTW...................................................... 45
Table C.4.1.3 Bergrivier Municipality’s compliance of the monthly E.Coli monitoring frequency in the water distributions systems in terms of the minimum requirements of SANS 241-2:2015 (Table 2). ............................................................................................................................... 45
Table C.4.1.4 Sampling Programme for Wastewater Effluent Quality ......................................................... 46
Table C.4.1.5 Compliance to the Sampling Programme(s) ......................................................................... 46
Table C.4.1.6 Water Quality Monitoring Overview from WSDP Guide Framework Perspective ................. 47
Table C.4.1.7 Wastewater Quality Monitoring Overview from WSDP Guide Framework Perspective ........ 47
Table C.4.1.8 Blue Drop Performance of the Municipality (DWS’s 2014 Blue Drop Report) ....................... 48
Table C.4.1.9 DWS’s 2014 Blue Drop Risk Ratings for Bergrivier Municipality ........................................... 49
Table C.4.1.10 Average residential daily consumption (l/p/d) for the last four financial years. ...................... 50
Table C.4.1.11 Green Drop Performance of the Municipality (DWS’s 2013 Green Drop Report) ................. 51
Table C.4.1.12 DWS’s 2014 Green Drop Risk Profile Progress Report results for Bergrivier Municipality ... 52
Table C.4.2.1 Overview of Water Quality Compliance ................................................................................. 53
Table C.4.2.2 Number of water quality compliance samples taken throughout the various water distribution systems over the period July 2016 to June 2017 ................................................ 53
Table C.4.2.3 Percentage compliance of the water quality samples for the period July 2016 to June 2017 .............................................................................................................................. 54
Table C.4.2.4 Four categories under which the risks posed by micro-organism, physical or aesthetic property or chemical substance of potable water is normally classified ................................ 56
Table C.4.2.5 Overview of Wastewater Quality Compliance ....................................................................... 56
Table C.4.2.6 Percentage Microbiological (Faecal Coliforms) Compliance of the Compliance Samples Taken at the Various WWTWs for the Last Three Financial Years ...................................... 56
Table C.4.2.7 Percentage Chemical Compliance of the Compliance Samples Taken at the Various WWTWs for the Last Three Financial Years ........................................................................ 57
Table C.4.2.8 Percentage Physical Compliance of the Compliance Samples Taken at the Various WWTWs for the Last Three Financial Years ........................................................................ 57
Table C.4.3.1 Incident Management and Reporting Overview .................................................................... 58
Table C.4.3.2 Water Quality Incident Reporting Compliance (Health Oriented) .......................................... 58
Table C.5.1 Overview of WC/WDM Activities ........................................................................................... 59
Table C.5.2 Internal Non revenue water for the various distribution systems ........................................... 60
Table C.5.3 Potential savings on bulk water supply through the implementation of pressure management and the existing average operating pressures, static pressures and residual pressures in the various towns ................................................................................ 61
Table C.6.1 Opening costs and book values of the water infrastructure .................................................. 64
Table C.6.2 Overview of the remaining useful life by facility type for water infrastructure (Opening Costs) .................................................................................................................................... 65
Table C.6.3 Overview of the age distribution by facility type for the water infrastructure (Opening Costs) .................................................................................................................................... 65

Bergrivier Municipality: Annual WSDP Performance- and Water Services Audit Report for 2016/2017
2017/11/03 Bergrivier Water Services Audit 2016-2017
viii
LIST OF TABLES AND FIGURES / Continue
TABLES
Table C.6.4 Condition grading per water facility type (Opening Costs)..................................................... 66
Table C.6.5 Opening costs and book values of all sewerage infrastructure ............................................. 67
Table C.6.6 Overview of the RUL by facility type for the sewerage infrastructure (Opening Costs) ......... 67
Table C.6.7 Overview of the age distribution by facility type for the sewerage infrastructure (Opening Costs) .................................................................................................................................... 68
Table C.6.8 Condition grading per sewerage facility type (Opening Costs) .............................................. 69
Table C.7.1 Service Levels at Schools ..................................................................................................... 70
Table C.7.2 Service Levels at Medical Facilities ....................................................................................... 70
Table C.8.1 Years in which the annual water requirement will exceed the allocations / yields from the various water resources ........................................................................................................ 71
Table C.8.2 Projected future water requirements and allocations / yields surplus (+) / shortfall (-) based on WSDP model ......................................................................................................... 71
Table C.8.3 Allocations for the West Coast District Municipality’s bulk distribution systems (Ml/a) ......... 73
Table C.8.4 Potential future water resources for the various towns (DWS’s All Towns Reconciliation Strategies) ............................................................................................................................. 74
Table C.9.1 Municipal Strategic Self-Assessment (MuSSA) of Water Services for Bergrivier Municipality ............................................................................................................ 80
Table C.9.2 Training provided during the 2016/2017 financial year (Workplace Skills Plan) ................... 83
Table C.10.1 Water indicators monitored by Bergrivier Municipality with regard to customer services and maintenance work .......................................................................................................... 84
Table C.10.2 Sanitation indicators monitored by Bergrivier Municipality with regard to customer services and maintenance work ............................................................................................ 85
Table C.10.3 Water and Sewerage standards as included in the Client Services Charter ......................... 87
FIGURES
Figure A.1.1 Location of Bergrivier Municipality in the Western Cape ......................................................... 2
Figure A.1.2 Bergrivier Municipality’s Management Area ............................................................................ 3
Figure C.1.1 Bulk water supply for the various distribution systems .......................................................... 21
Figure C.1.2 Quantity of water services provided / water balance ............................................................. 23
Figure C.2.1.1 User connection profile for water ........................................................................................... 27
Figure C.2.1.2 User connection distribution for water – Year 2016/2017...................................................... 27
Figure C.2.1.3 Number of new water connections provided during 2016/2017 ............................................ 27
Figure C.2.1.4 User connection profile for wastewater ................................................................................. 29
Figure C.2.1.5 User connection distribution for wastewater – Year 2016/2017 ............................................ 29
Figure C.2.1.6 Number of new wastewater connections provided during 2016/2017 ................................... 29
Figure C.2.1.7 Number of consumer units per town for the last four financial years .................................... 31
Figure C.2.2.1 Household water access profile ............................................................................................ 32
Figure C.2.2.2 Household sanitation access profile ...................................................................................... 34
Figure C.3.3.1 Revenue collection and cost recovery profile (Water) ........................................................... 42
Bergrivier Municipality: Annual WSDP Performance- and Water Services Audit Report for 2016/2017
2017/11/03 Bergrivier Water Services Audit 2016-2017
ix
LIST OF TABLES AND FIGURES / Continue
FIGURES
Figure C.3.3.2 Revenue collection and cost recovery profile (Wastewater) ................................................. 42
Figure C.6.1 Opening Costs and Book Values of the water infrastructure................................................. 64
Figure C.6.2 Remaining Useful Life of the water infrastructure ................................................................. 65
Figure C.6.3 Age distribution of the water infrastructure ............................................................................ 66
Figure C.6.4 Condition grading of the water infrastructure ........................................................................ 66
Figure C.6.5 Opening costs and book values of the sewerage infrastructure ........................................... 67
Figure C.6.6 Remaining Useful Life of the sewer infrastructure ................................................................ 68
Figure C.6.7 Age distribution of the sewerage infrastructure ..................................................................... 69
Figure C.6.8 Condition grading of the sewerage infrastructure .................................................................. 70
Figure C.9.1 Spider Diagram of the vulnerability levels of Bergrivier Municipality for 2016 ....................... 79
Figure C.10.1 Water Indicators Monitored by Bergrivier Municipality .......................................................... 86
Figure C.10.2 Sanitation Indicators Monitored by Bergrivier Municipality .................................................... 86

Bergrivier Municipality: Annual WSDP Performance- and Water Services Audit Report for 2016/2017
2017/11/03 Bergrivier Water Services Audit 2016-2017
x
ABBREVIATIONS AND DEFINITIONS
ACIP Accelerated Community Infrastructure Programme
ADWF Average Dry Weather Flow
ASS Annual Survey of public and independent Schools
BDS Blue Drop System
CES Community Engineering Services
CFO Chief Financial Officer
COD Chemical Oxygen Demand
CPM Contract Programme Manager
CRC Current Replacement Cost
CRR Cumulative Risk Ratio
DLG Department of Local Government
DRC Depreciated Replacement Cost
DWQ Drinking Water Quality
DWS Department of Water and Sanitation
EIA Environmental Impact Assessment
ESETA Energy and Water Services Sector Education and Training Authority
ESKOM Electricity Supply Commission
GAMAP General Accepted Municipal Accounting Practice
GDS Green Drop System
GIS Geographic Information Systems
IAM Infrastructure Asset Management
ICT Information and Communications Technology
IDP Integrated Development Plan
IDZ Industrial Development Zone
ILI Infrastructure Leakage Index
IMP Incident Management Protocol
IMQS Infrastructure Management Query System
IWA International Water Association
km2 Square Kilometre
LGTAS Local Government Turn Around Strategy
m Metre
MAR Mean Annual Runoff
MFMA Municipal Finance Management Act
MIG Municipal Infrastructure Grant
MISA Municipal Infrastructure Support Agent
Mℓ Mega Litre
Ml/a Mega Litre per Annum
NGA National Groundwater Archive
NGDB National Groundwater Database
NQF National Qualifications Framework
NRW Non-Revenue Water
PAT Progress Assessment Tool
PRV Pressure Reducing Valve
RDP Reconstruction and Development Programme
Bergrivier Municipality: Annual WSDP Performance- and Water Services Audit Report for 2016/2017
2017/11/03 Bergrivier Water Services Audit 2016-2017
xi
ABBREVIATIONS AND DEFINITIONS / Continue
RSA Republic of South Africa
RUL Remaining Useful Life
SABS South African Bureau Standard
SALGA South African Local Government Association
SANS South African National Standard
SDBIP Service Delivery and Budget Implementation Plan
SWRO Sea water reverse osmosis
TMG Table Mountain Group
UAW Unaccounted for Water
VAT Value Added Tax
WARMS Water Authorisation Registration and Management System
WCDM West Coast District Municipality
WCWSS Western Cape Water Supply System
WDM Water Demand Management
WRM Water Resource Management
WSA Water Services Authority
WSDP Water Services Development Plan
WSI Water Services Institution
WSP Water Services Provider
WSS Water Supply System
WTW Water Treatment Works
WWTW Waste Water Treatment Works

Bergrivier Municipality: Annual WSDP Performance- and Water Services Audit Report for 2016/2017
2017/11/03 Bergrivier Water Services Audit 2016-2017
xii
KEY TERMS AND INTERPRETATIONS
KEY TERMS INTERPRETATIONS
Current replacement cost (CRC)
The cost of replacing the service potential of an existing asset, by reference to some measure of capacity, with an appropriate modern equivalent asset. GAMAP defines CRC as the cost the entity would incur to acquire the asset on the reporting date.
Depreciated Replacement Cost (DRC) The replacement cost of an existing asset after deducting an allowance for wear or consumption to reflect the remaining economic life of the existing asset.
Financial Year
Financial year means in relation to-
• a national or provincial department, the year ending 31 March; or
• a municipality, the year ending 30 June.
Integrated Development Plan (IDP)
An IDP is a legislative requirement for municipalities, which identifies the municipality’s key development priorities; formulates a clear vision, mission and values; formulates appropriate strategies; shows the appropriate organisational structure and systems to realise the vision and the mission and aligns resources with the development priorities.
Municipal Finance Management Act (MFMA)
Municipal Finance Management Act, 2003 (Act No. 56 of 2003)
MIG A conditional grant from national government to support investment in basic municipal infrastructure.
Remaining useful life (RUL) The time remaining over which an asset is expected to be used.
Service Delivery Budget
Implementation Plan (SDBIP)
The SDBIP is a management, implementation and monitoring tool that enable the Municipal Manager to monitor the performance of senior managers, the Mayor to monitor the performance of the Municipal Manager, and for the community to monitor the performance of the municipality.
Strategic Framework for Water
Services
The Strategic Framework provides a comprehensive summary of policy with respect to the water services sector in South Africa and sets out a strategic framework for its implementation over the next ten years.
Water Conservation The minimisation of loss or waste, the care and protection of water resources and the efficient and effective use of water.
Water Demand Management
The adaptation and implementation of a strategy by a water institution or consumer to influence the water demand and usage of water in order to meet any of the following objectives: economic efficiency, social development, social equity, environmental protection, sustainability of water supply and services, and political acceptability.
Water Services Authority (WSA)
A water services authority means a municipality with the executive authority and the right to administer water services as authorised in terms of the Municipal Structures Act, 1998 (Act No.117 of 1998). There can only be one water services authority in any specific area. Water services authority area boundaries cannot overlap. Water services authorities are metropolitan municipalities, district municipalities and authorised local municipalities.

Bergrivier Municipality: Annual WSDP Performance- and Water Services Audit Report for 2016/2017
2017/11/03 Bergrivier Water Services Audit 2016-2017
xiii
KEY TERMS AND INTERPRETATIONS / Continue
KEY TERMS INTERPRETATIONS
Water Services Development Plan (WSDP)
A plan to be developed and adopted by the WSA in terms of the Water Services Act, 1997 (Act No.108 of 1997)
WSDP Guide Framework
Modular tool which has been developed by the DWS to support WSAs in complying with the Water Services Act with respect to Water Services Development Planning and which is also used by the DWS to regulate such compliance.
Water Services Provider (WSP) A WSP means any person or institution that provides water services to consumers or to another water services institution, but does not include a water services intermediary.
Unaccounted for Water (UAW)
SABS 0306 definition
UAW is the difference between the measured volume of water put into the water distribution system and the total volume of water measured to authorised consumers whose fixed property address appears on the official list of the WSA.
Water Balance
The water balance is the difference between the measured volume of potable water put into a water distribution system and the total volume of potable water measured at any intermediate point in the water distribution system. This is a statement setting out the amount of water flowing in and flowing out on an area-by-area basis.
Bergrivier Municipality: Annual WSDP Performance- and Water Services Audit Report for 2016/2017
2017/11/03 Bergrivier Water Services Audit 2016-2017
xiv
BERGRIVIER MUNICIPALITY
ANNUAL WSDP PERFORMANCE AND WATER SERVICES AUDIT REPORT FOR 2016/2017
EXECUTIVE SUMMARY
Bergrivier Municipality is required in terms of Section 18 of the Water Services Act, 1997 (Act No.108 of 1997), as well as the “Regulations relating to compulsory national standards and measures to conserve water”, as issued in terms of sections 9(1) and 73(1)(j) of the Water Services Act, to report on the implementation of its WSDP during each financial year and to include a water services audit in such an annual report.
Section 62 of the Water Services Act requires the Minister to monitor every WSI in order to ensure compliance with the prescribed national standards. This regulation requires a WSA to complete and submit a WSDP Performance- and Water Services Audit Report every financial year.
The WSDP Performance- and Water Services Audit is designed to monitor the compliance of the WSA and other WSIs with these regulations. The Water Services Act allows the audit to be used as a tool to compare actual performance of the WSA against the targets and indicators set in their WSDP. The Water Services Audit also assists local communities and DWS to assess how well WSAs are performing relative to their stated intentions and their capacity.
The WSDP Performance- and Water Services Audit Report will give an overview of the implementation of the Municipality’s previous year’s WSDP, for the 2016/2017 financial year, and can be seen as an annexure to Bergrivier Municipality’s Annual Report. The Annual Report is compiled as required by the Local Government: Municipal Systems Act, Act no 32 of 2000 (Section 46) and the Local Government: Municipal Finance Management Act, Act no 56 of 2003 (Section 121).
Availability of the Water Services Audit Report: The WSDP Performance- and Water Services Audit Report is a public document and must be made available within four months after the end of each financial year and must be available for inspection at the offices of the WSA. It is also recommended that the document be placed on the Municipality’s website and that copies of the document be placed at the public libraries. The WSDP Performance- and Water Services Audit Report also needs to be made available to the Minister of the DWS, the Minister of the Department of Cooperative Governance, the Province and to SALGA, as required by the Water Services Act, 1997.
The WSDP Performance- and Water Services Audit Report include the following detail information:
• The Municipality’s performance with regard to their KPIs for water and sewerage services for the 2016/2017 financial year, as included in the Municipality’s SDBIP.
• The Municipality’s Performance with regard to DWS’s Blue and Green Drop Assessments. Blue drop status is awarded to those towns that comply with 95% criteria on drinking water quality management. Green drop status is awarded to those WWTWs that comply with 90% criteria on key selected indicators on waste water quality management.
• DWS’s Scorecard for assessing the potential for WC/WDM efforts in the Municipality.
• Information to be included in a WSDP Performance- and Water Services Audit as stipulated in regulations under section 9 of the Water Services Act, “Guidelines for Compulsory National Standards” and also required by DWS’s 2014 WSDP Performance- and Water Services Audit Report guidelines.
• Information on the implementation of the various WSDP activities, as included under the WSDP Business Elements in DWS’s WSDP guidelines.
Bergrivier Municipality: Annual WSDP Performance- and Water Services Audit Report for 2016/2017
2017/11/03 Bergrivier Water Services Audit 2016-2017
xv
The Municipality has a comprehensive Performance Management System in place. The SDBIP is the process plan and performance indicator / evaluation for the execution of the budget. The SDBIP is being used as a management, implementation and monitoring tool that assists and guide the Executive Mayor, Councillors, Municipal Manager, Senior Managers and the community. The plan serves as an input to the performance agreements of the Municipal Manager and Directors. It also forms the basis for the monthly, quarterly, mid-year and the annual assessment report and performance assessments of the Municipal Manager and Directors.
The following water and sanitation related investigations were successfully completed during the last financial year.
• The WSDP Performance- and Water Services Audit Report for the 2015/2016 financial year was finalised and approved by Council as part of the Annual Report. The NRW water balance models were also updated for each of the distribution systems (Up to the end of June 2016) as part of the Water Services Audit Process.
• Bergrivier Municipality continues with the implementation of their Drinking Water Quality and Effluent Quality Sampling Programmes (Both Operational and Compliance Monitoring). Sample results are loaded on a monthly basis onto DWS’s BDS and GDS. All the WTWs and WWTWs are also registered on the BDS and GDS websites.
• Dam safety inspections were done for the Porterville and Eendekuil dams, during May 2017.
• The Asset Register was updated to include all the water and sewerage capital projects completed during the 2016/2017 financial year.
• The Municipality’s WSDP was updated and approved by Council.
The following awards / acknowledgements were also received by the Municipality:
• The Municipality’s overall Blue Drop score came down from 90.60% for 2012 to 63.79% for 2014. The highest blue drop score was 72.93% for Porterville and the lowest blue drop score was 49.29% for Eendekuil. The DWS mentioned that Bergrivier Municipality was well prepared for the assessment and demonstrated a positive approach to the Blue Drop Certification Programme. Consequently, it is anticipated that through acknowledgement of the identified gaps that progressive improvement in compliance will once again be achieved in future assessments.
The overall 2014 Risk Rating for Bergrivier Municipality is 52%. This risk value is based on Process Control RR, Drinking Water Quality RR and Risk Management RR, with scores above 50% (medium to critical risks) for Process Control in 4 of the 6 systems and Drinking Water Quality in 3 of the 6 systems.
• The overall Green Drop Score of the Municipality came down from 70.00% in 2011 to 44.21% in 2013 and was performing below average with regard to wastewater quality management. The highest Green Drop Score of 62.60% was for the Porterville WWTW and drainage system and the lowest Green Drop Score of 24.23% was for the Eendekuil WWTW and drainage system. The Green Water Services Audit revealed substantial shortcomings in the areas of risk- and asset management, as well as effluent quality.
The CRRs decreased in two of the systems (Dwarskersbos and Eendekuil) and stayed roughly the same for Piketberg, Porterville and Velddrif during the 2013/2014 Green Drop Progress Reporting in 2014. Upgrades to the system have been made, resulting in improved compliance at most plants. However, the Velddrif and Eendekuil plants are not meeting standards. A W2RAP is in place and are being implemented to ensure that high risk areas are abated. Flows are monitored at each site, with the exception of Dwarskersbos, which receive low flow to the pond system. All indicators are that Bergrivier is showing PROGRESS against the CRR rating over the 2011 to 2012 assessment year. The team is congratulated for their preparedness and positive contribution to the PAT assessments.
• Bergrivier Municipality achieved 100% expenditure in the 2016/2017 financial year on their MIG (DLG) funding received.
Bergrivier Municipality: Annual WSDP Performance- and Water Services Audit Report for 2016/2017
2017/11/03 Bergrivier Water Services Audit 2016-2017
xvi
Quantity of Water Services Provided (Water Balance)
Detail water balance models are in place for each of the distribution systems in Bergrivier Municipality’s Management Area. These models include the volume of potable water supplied to the Bergrivier Municipality by the West Coast District Municipality, the volume of water abstracted from the Municipality’s own water resources, the treated volume supplied from the WTW (System Input Volume) and the billed metered consumption for each of the distribution systems. The volume and percentage of NRW were also calculated from the available data. The flows at the WTWs and WWTWs are also recorded by the Municipality.
Water Services Delivery Profile
The number of consumer units per category or user type is available for each of the distribution systems. All the households in the urban areas of Bergrivier Municipality’s Management Area are provided with water connections inside the erven. Informal areas are provided with shared services as an intermediary measure. Bergrivier Municipality is committed to work with the private landowners to ensure that at least basic water and sanitation services are provided to those households in the rural areas with existing services still below RDP standard.
Cost Recovery and Free Basic Services
A detail nine block step tariff system is implemented by Bergrivier Municipality. This tariff system discourages the wasteful or inefficient use of water. It is expected that this tariff structure will continue to be implemented in the future. The sustainable supply of potable water is however becoming an ever increasing challenge, due to the huge bulk infrastructure needs of Bergrivier Municipality over the next number of years.
The first six (6) kl of water is provided free to all indigent households. Bergrivier Municipality’s tariffs support the viability and sustainability of water supply services to the poor through cross-subsidies (where feasible). Free basic water and sanitation services are linked to the Municipality’s Indigent Policy and all indigent households therefore receive free basic water and sanitation services. This implies that either the equitable share is used to cover this cost, or higher consumption blocks are charged at a rate greater than the cost in order to generate a surplus to cross-subsidies consumers who use up to six (6) kilolitres per month.
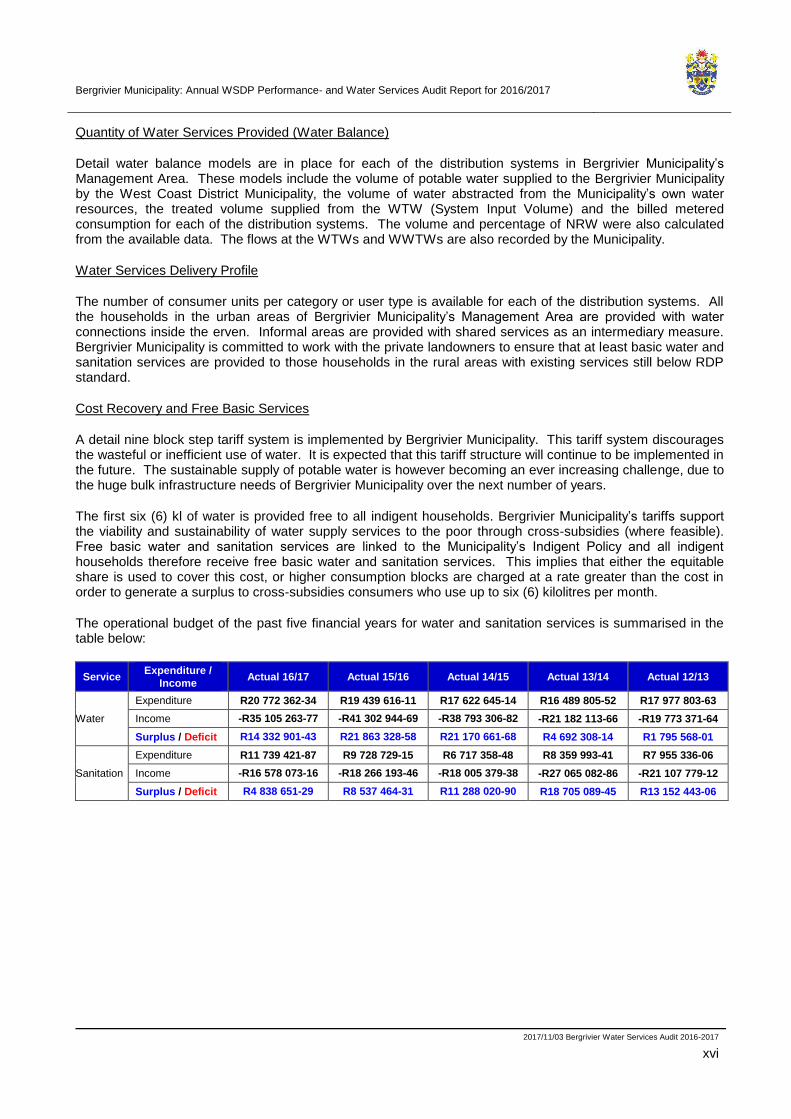
The operational budget of the past five financial years for water and sanitation services is summarised in the table below:
Service Expenditure /
Income Actual 16/17 Actual 15/16 Actual 14/15 Actual 13/14 Actual 12/13
Water
Expenditure R20 772 362-34 R19 439 616-11 R17 622 645-14 R16 489 805-52 R17 977 803-63
Income -R35 105 263-77 -R41 302 944-69 -R38 793 306-82 -R21 182 113-66 -R19 773 371-64
Surplus / Deficit R14 332 901-43 R21 863 328-58 R21 170 661-68 R4 692 308-14 R1 795 568-01
Sanitation
Expenditure R11 739 421-87 R9 728 729-15 R6 717 358-48 R8 359 993-41 R7 955 336-06
Income -R16 578 073-16 -R18 266 193-46 -R18 005 379-38 -R27 065 082-86 -R21 107 779-12
Surplus / Deficit R4 838 651-29 R8 537 464-31 R11 288 020-90 R18 705 089-45 R13 152 443-06
Bergrivier Municipality: Annual WSDP Performance- and Water Services Audit Report for 2016/2017
2017/11/03 Bergrivier Water Services Audit 2016-2017
xvii
Water Quality
Operational and Compliance Water Quality sampling programmes are implemented by the Bergrivier Municipality and the West Coast District Municipality. Operational and Compliance Final Effluent Quality sampling programmes are also implemented by Bergrivier Municipality at the various WWTWs.
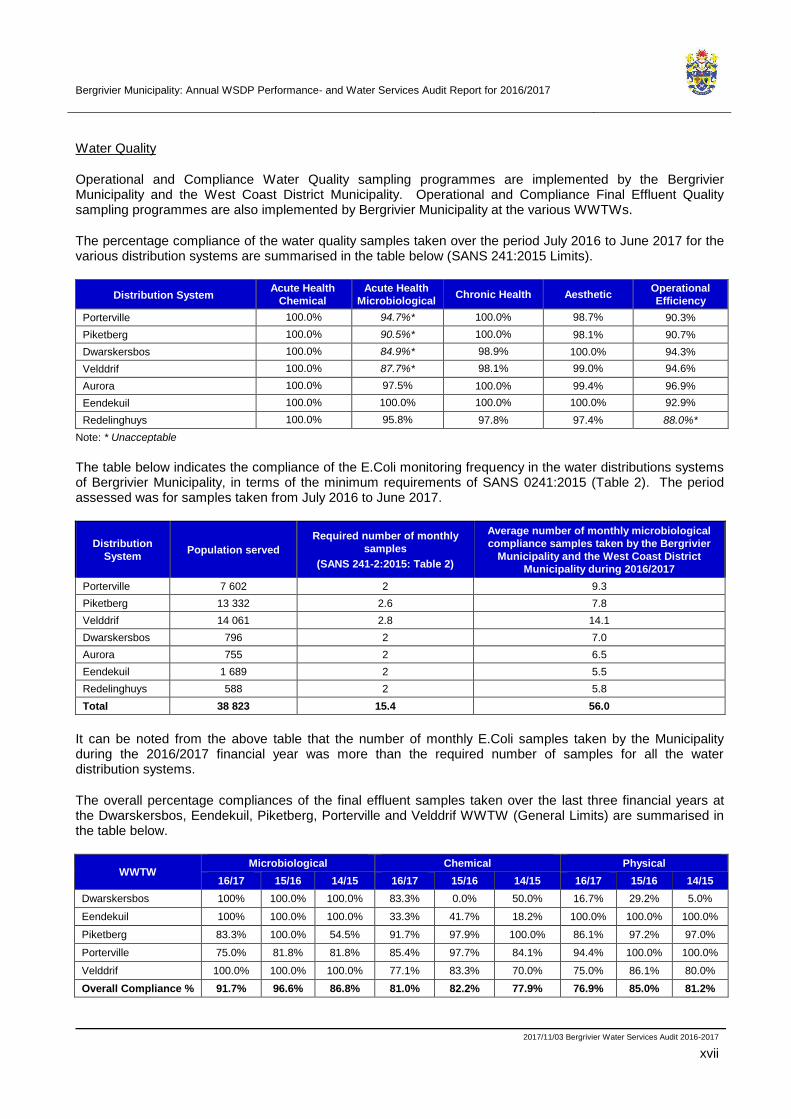
The percentage compliance of the water quality samples taken over the period July 2016 to June 2017 for the various distribution systems are summarised in the table below (SANS 241:2015 Limits).
Distribution System Acute Health
Chemical
Acute Health
Microbiological Chronic Health Aesthetic
Operational
Efficiency
Porterville 100.0% 94.7%* 100.0% 98.7% 90.3%
Piketberg 100.0% 90.5%* 100.0% 98.1% 90.7%
Dwarskersbos 100.0% 84.9%* 98.9% 100.0% 94.3%
Velddrif 100.0% 87.7%* 98.1% 99.0% 94.6%
Aurora 100.0% 97.5% 100.0% 99.4% 96.9%
Eendekuil 100.0% 100.0% 100.0% 100.0% 92.9%
Redelinghuys 100.0% 95.8% 97.8% 97.4% 88.0%*
Note: * Unacceptable
The table below indicates the compliance of the E.Coli monitoring frequency in the water distributions systems of Bergrivier Municipality, in terms of the minimum requirements of SANS 0241:2015 (Table 2). The period assessed was for samples taken from July 2016 to June 2017.
Distribution
System Population served
Required number of monthly
samples
(SANS 241-2:2015: Table 2)
Average number of monthly microbiological
compliance samples taken by the Bergrivier
Municipality and the West Coast District
Municipality during 2016/2017
Porterville 7 602 2 9.3
Piketberg 13 332 2.6 7.8
Velddrif 14 061 2.8 14.1
Dwarskersbos 796 2 7.0
Aurora 755 2 6.5
Eendekuil 1 689 2 5.5
Redelinghuys 588 2 5.8
Total 38 823 15.4 56.0
It can be noted from the above table that the number of monthly E.Coli samples taken by the Municipality during the 2016/2017 financial year was more than the required number of samples for all the water distribution systems.
The overall percentage compliances of the final effluent samples taken over the last three financial years at the Dwarskersbos, Eendekuil, Piketberg, Porterville and Velddrif WWTW (General Limits) are summarised in the table below.
WWTW Microbiological Chemical Physical
16/17 15/16 14/15 16/17 15/16 14/15 16/17 15/16 14/15
Dwarskersbos 100% 100.0% 100.0% 83.3% 0.0% 50.0% 16.7% 29.2% 5.0%
Eendekuil 100% 100.0% 100.0% 33.3% 41.7% 18.2% 100.0% 100.0% 100.0%
Piketberg 83.3% 100.0% 54.5% 91.7% 97.9% 100.0% 86.1% 97.2% 97.0%
Porterville 75.0% 81.8% 81.8% 85.4% 97.7% 84.1% 94.4% 100.0% 100.0%
Velddrif 100.0% 100.0% 100.0% 77.1% 83.3% 70.0% 75.0% 86.1% 80.0%
Overall Compliance % 91.7% 96.6% 86.8% 81.0% 82.2% 77.9% 76.9% 85.0% 81.2%
Bergrivier Municipality: Annual WSDP Performance- and Water Services Audit Report for 2016/2017
2017/11/03 Bergrivier Water Services Audit 2016-2017
xviii
WC/WDM
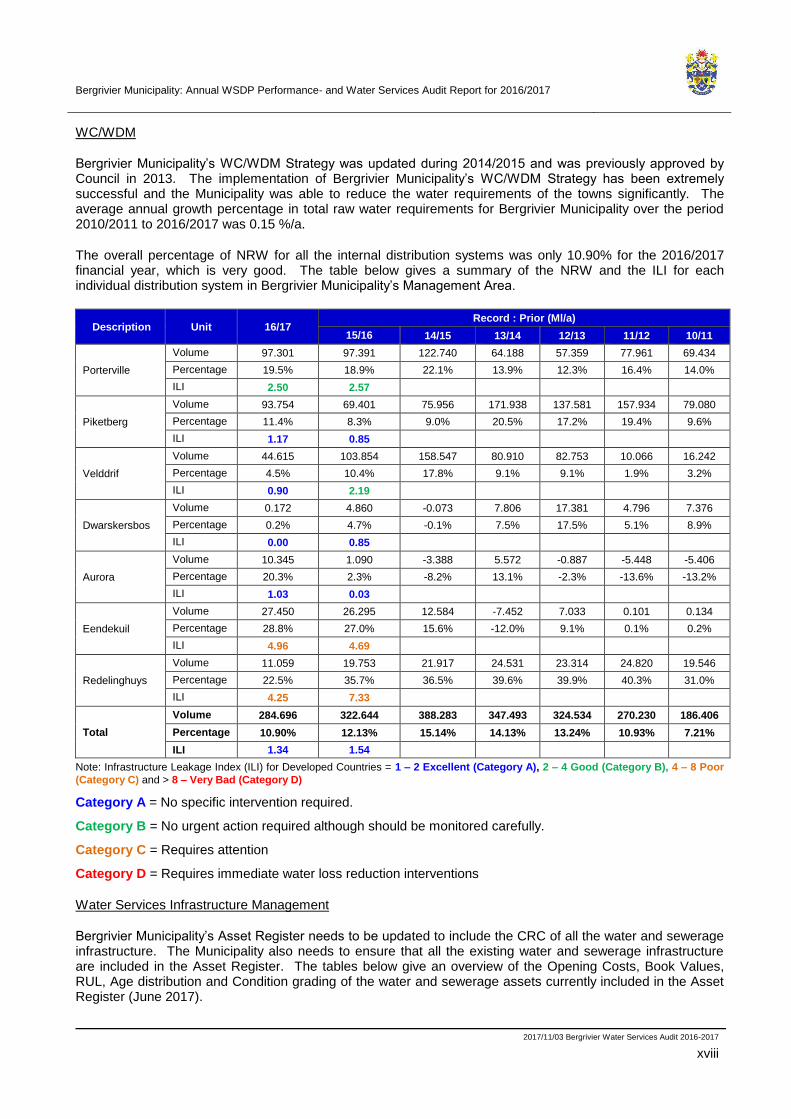
Bergrivier Municipality’s WC/WDM Strategy was updated during 2014/2015 and was previously approved by Council in 2013. The implementation of Bergrivier Municipality’s WC/WDM Strategy has been extremely successful and the Municipality was able to reduce the water requirements of the towns significantly. The average annual growth percentage in total raw water requirements for Bergrivier Municipality over the period 2010/2011 to 2016/2017 was 0.15 %/a.
The overall percentage of NRW for all the internal distribution systems was only 10.90% for the 2016/2017 financial year, which is very good. The table below gives a summary of the NRW and the ILI for each individual distribution system in Bergrivier Municipality’s Management Area.
Description Unit 16/17 Record : Prior (Ml/a)
15/16 14/15 13/14 12/13 11/12 10/11
Porterville
Volume 97.301 97.391 122.740 64.188 57.359 77.961 69.434
Percentage 19.5% 18.9% 22.1% 13.9% 12.3% 16.4% 14.0%
ILI 2.50 2.57
Piketberg
Volume 93.754 69.401 75.956 171.938 137.581 157.934 79.080
Percentage 11.4% 8.3% 9.0% 20.5% 17.2% 19.4% 9.6%
ILI 1.17 0.85
Velddrif
Volume 44.615 103.854 158.547 80.910 82.753 10.066 16.242
Percentage 4.5% 10.4% 17.8% 9.1% 9.1% 1.9% 3.2%
ILI 0.90 2.19
Dwarskersbos
Volume 0.172 4.860 -0.073 7.806 17.381 4.796 7.376
Percentage 0.2% 4.7% -0.1% 7.5% 17.5% 5.1% 8.9%
ILI 0.00 0.85
Aurora
Volume 10.345 1.090 -3.388 5.572 -0.887 -5.448 -5.406
Percentage 20.3% 2.3% -8.2% 13.1% -2.3% -13.6% -13.2%
ILI 1.03 0.03
Eendekuil
Volume 27.450 26.295 12.584 -7.452 7.033 0.101 0.134
Percentage 28.8% 27.0% 15.6% -12.0% 9.1% 0.1% 0.2%
ILI 4.96 4.69
Redelinghuys
Volume 11.059 19.753 21.917 24.531 23.314 24.820 19.546
Percentage 22.5% 35.7% 36.5% 39.6% 39.9% 40.3% 31.0%
ILI 4.25 7.33
Total
Volume 284.696 322.644 388.283 347.493 324.534 270.230 186.406
Percentage 10.90% 12.13% 15.14% 14.13% 13.24% 10.93% 7.21%
ILI 1.34 1.54
Note: Infrastructure Leakage Index (ILI) for Developed Countries = 1 – 2 Excellent (Category A), 2 – 4 Good (Category B), 4 – 8 Poor
(Category C) and > 8 – Very Bad (Category D)
Category A = No specific intervention required.
Category B = No urgent action required although should be monitored carefully.
Category C = Requires attention
Category D = Requires immediate water loss reduction interventions
Water Services Infrastructure Management
Bergrivier Municipality’s Asset Register needs to be updated to include the CRC of all the water and sewerage infrastructure. The Municipality also needs to ensure that all the existing water and sewerage infrastructure are included in the Asset Register. The tables below give an overview of the Opening Costs, Book Values, RUL, Age distribution and Condition grading of the water and sewerage assets currently included in the Asset Register (June 2017).

Bergrivier Municipality: Annual WSDP Performance- and Water Services Audit Report for 2016/2017
2017/11/03 Bergrivier Water Services Audit 2016-2017
xix
Asset Type Opening Costs Book Values % Book Values / Opening Costs
Water Infrastructure R56 317 696 R56 685 650 100.65%
Sewerage Infrastructure R71 533 280 R55 275 879 77.27%
Remaining Useful Life (Opening Costs)
Asset Type 0 – 5 yrs 6 – 10 yrs 11 – 15 yrs 16 – 20 yrs > 20 yrs
Water Infrastructure R4 108 664 R4 937 732 R255 089 R4 447 R47 011 764
Sewerage Infrastructure R5 469 033 R11 680 068 R7 294 958 R733 043 R46 356 178
Age Distribution (Opening Costs)
Asset Type 0 – 5 yrs 6 – 10 yrs 11 – 15 yrs 16 – 20 yrs > 20 yrs
Water Infrastructure R16 222 744 R40 094 953 R0 R0 R0
Sewerage Infrastructure R40 938 955 R30 594 324 R0 R0 R0
Condition Grading (Opening Costs)
Asset Type Very Good Good Fair Poor Very Poor
Water Infrastructure R14 876 830 R0 R11 939 726 R29 501 139 R0
Sewerage Infrastructure R33 575 686 R2 104 731 R222 658 R35 521 782 R108 423
It is important for Bergrivier Municipality to allocate adequate funds for the rehabilitation and maintenance of their existing infrastructure, which is critical to ensure the sustainability of the services that are provided by the Municipality. All possible external sources of funding to assist with the development of the bulk infrastructure and additional sources need to be identified.
Associated Services
All schools and medical facilities in Bergrivier Municipality’s Management Area are supplied with adequate water and sanitation services.
Water Resources
A Service Level Agreement is in place with the West Coast District Municipality for the provision of bulk potable water to Velddrif and Dwarskersbos. The West Coast District Municipality is however over their water allocation from the Berg River for the last number of years and applied to the DWS for an increased allocation from the Berg River. The allocation from the Berg River for Piketberg is also exceeded for the last number of years and the Municipality needs to apply to the DWS for an increased allocation from the Berg River for Piketberg. The safe yields of the Redelinghuys and Aurora sources need to be determined in order to determine whether the yields from these resources are adequate to meet the town’s future water requirements. The yield from the existing resources for Eendekuil is adequate to meet the short to medium future water requirements of the town.
The table below gives an overview of the years in which the annual water requirement will exceed the sustainable yields / allocations from the various resources.
Distribution System Allocation (A) /
Yield (Y) (Ml/a)
Annual Growth on
2015/2016 requirement
(%)
Annual Growth on
2015/2016 requirement
(%)
WSDP Projection
Model
Porterville 711.385 (Y) > 2041 (1%) 2029 (2%) 2034
Piketberg 945.075 (A) 2017 (3%) 2017 (4%) 2018
Velddrif WCWSS Over (2%) Over (3%) Over
Dwarskersbos WCWSS Over (2%) Over (3%) Over
Aurora 56.000 (A) Over (1.5%) Over (2.5%) Over
Eendekuil 116.435 (Y) 2020 (2%) 2019 (3%) 2025
Redelinghuys 46.500 (A) Over (1%) Over (2%) Over
Note: The sustainable yield of the Aurora and Redelinghuys water resources needs to be determined, which might impact on the figures included in the above table.
Bergrivier Municipality: Annual WSDP Performance- and Water Services Audit Report for 2016/2017
2017/11/03 Bergrivier Water Services Audit 2016-2017
xx
Institutional Arrangement Profile
Bergrivier Municipality is the WSA for the entire Municipal Management Area. A Service Level Agreement is in place with the West Coast District Municipality for the provision of bulk potable water to Velddrif and Dwarskersbos. The Municipal staff is continuously exposed to training opportunities, skills development and capacity building at a technical, operations and management level in an effort to create a more efficient overall service to the users. A Workplace Skills Plan is compiled annually and the specific training needs of the personnel, with regard to water and wastewater management are determined annually.
Social and Customer Services Requirements
A comprehensive Customer Services and Complaints system is in place at Bergrivier Municipality and the Municipality has maintained a high and a very consistent level of service to its urban water consumers. After hour emergency requests are being dealt with by the control room on a twenty-four hour basis.
Bergrivier Municipality further developed a Client Services Charter in collaboration with various stakeholders to affirm their commitment to providing unsurpassed service delivery within the Bergrivier Municipality’s Management Area.
“Community involvement and excellent client services are the building blocks of Bergrivier Municipality”
Barriers implemented by Bergrivier Municipality against contamination and deteriorating water quality include the following:
• Service Delivery Agreement between the West Coast District Municipality and Bergrivier Municipality. A Monitoring Committee is also in place.
• Participate in catchment management and water source protection initiatives.
• Protection at points of abstraction such as river intakes and dams (Abstraction Management).
• Correct operation and maintenance of the WTWs (Coagulation, flocculation, sedimentation and filtration).
• Protection and maintenance of the distribution systems. This includes ensuring an adequate disinfectant residual at all times, rapid response to pipe bursts and other leaks, regular cleaning of reservoirs, keeping all delivery points tidy and clean, etc.
Three other important barriers implemented by Bergrivier Municipality against poor quality drinking water that are a prerequisite to those listed above are as follows:
• A well informed Council and municipal managers that understand the extreme importance of and are committed to providing adequate resources for continuous professional operation and maintenance of the water supply system.
• Competent managers and supervisors in the technical department who are responsible for water supply services lead by example and are passionate about monitoring and safeguarding drinking water quality.
• Well-informed community members and other consumers of water supply services that know how to protect the water from becoming contaminated once it has been delivered, that have respect for water as a precious resource and that adhere to safe hygiene and sanitation practices.

Bergrivier Municipality: Annual WSDP Performance- and Water Services Audit Report for 2016/2017
2017/11/03 Bergrivier Water Services Audit 2016-2017
1
BERGRIVIER MUNICIPALITY
ANNUAL WSDP PERFORMANCE AND WATER SERVICES AUDIT REPORT FOR 2016/2017
BACKGROUND
Appointment
WorleyParsons RSA was appointed by Bergrivier Municipality to assist them with the compilation of their WSDP Performance- and Water Services Audit Report, which forms part of their annual report for the 2016/2017 financial year. The purpose of the WSDP Performance- and Water Services Audit Report is to report on the implementation of Bergrivier Municipality’s previous year’s WSDP, for the 2016/2017 financial year.
The DWS developed the “Annual Water Services Development Plan Performance- and Water Services Audit Report” template during 2014, to assist Municipalities with the drafting of their reports. WorleyParsons RSA agreed with Bergrivier Municipality to follow this template as far as possible.
Purpose
Bergrivier Municipality is required in terms of Section 18 of the Water Services Act, 1997 (Act No.108 of 1997), as well as the “Regulations relating to compulsory national standards and measures to conserve water”, as issued in terms of sections 9(1) and 73(1)(j) of the Water Services Act, to report on the implementation of its WSDP during each financial year and to include a water services audit in such an annual report.
Section 62 of the Water Services Act requires the Minister to monitor every WSI in order to ensure compliance with the prescribed national standards. This regulation requires a WSA to complete and submit a WSDP Performance- and Water Services Audit every financial year. The WSDP Performance- and Water Services Audit is designed to monitor the compliance of the WSA and other WSIs with these regulations. The Water Services Act allows the audit to be used as a tool to compare actual performance of the WSA against the targets and indicators set in their WSDP. The purpose of the water services audit is as follows:
• To monitor compliance with the Act and these regulations;
• To compare actual performance against targets contained in the WSDPs.
• To identify possibilities for improving water conservation and water demand management.
The WSDP Performance- and Water Services Audit Report will give an overview of the implementation of the Municipality’s previous year’s WSDP, for the 2016/2017 financial year, and can be seen as an annexure to Bergrivier Municipality’s Annual Report. The Annual Report is compiled as required by the Local Government: Municipal Systems Act, Act no 32 of 2000 (Section 46) and the Local Government: Municipal Finance Management Act, Act no 56 of 2003 (Section 121). The WSDP Performance- and Water Services Audit Report contains the following detail information:
• The Municipality’s performance with regard to their KPIs for water and sewerage services for the 2016/2017 financial year, as included in the Municipality’s SDBIP.
• The Municipality’s Performance with regard to DWS’s Blue and Green Drop Assessments. Blue drop status is awarded to those towns that comply with 95% criteria on drinking water quality management. Green drop status is awarded to those WWTWs that comply with 90% criteria on key selected indicators on waste water quality management.
• DWS’s Scorecard for assessing the potential for WC/WDM efforts in the Municipality.

Bergrivier Municipality: Annual WSDP Performance- and Water Services Audit Report for 2016/2017
2017/11/03 Bergrivier Water Services Audit 2016-2017
2
• Information to be included in a WSDP Performance- and Water Services Audit as stipulated in regulations under section 9 of the Water Services Act, “Guidelines for Compulsory National Standards” and also required by DWS’s 2014 WSDP Performance- and Water Services Audit Report guidelines.
• Information on the implementation of the various WSDP activities, as included under the WSDP Business Elements in DWS’s WSDP guidelines.
A. WATER SERVICES AUTHORITY PROFILE
A.1. Map of Water Services Authority Area of Jurisdiction
Bergrivier Municipality is located in the West Coast Region of the Western Cape, as indicated on the figure below.
Figure A.1.1: Location of Bergrivier Municipality in the Western Cape
Bergrivier Municipality: Annual WSDP Performance- and Water Services Audit Report for 2016/2017
2017/11/03 Bergrivier Water Services Audit 2016-2017
3
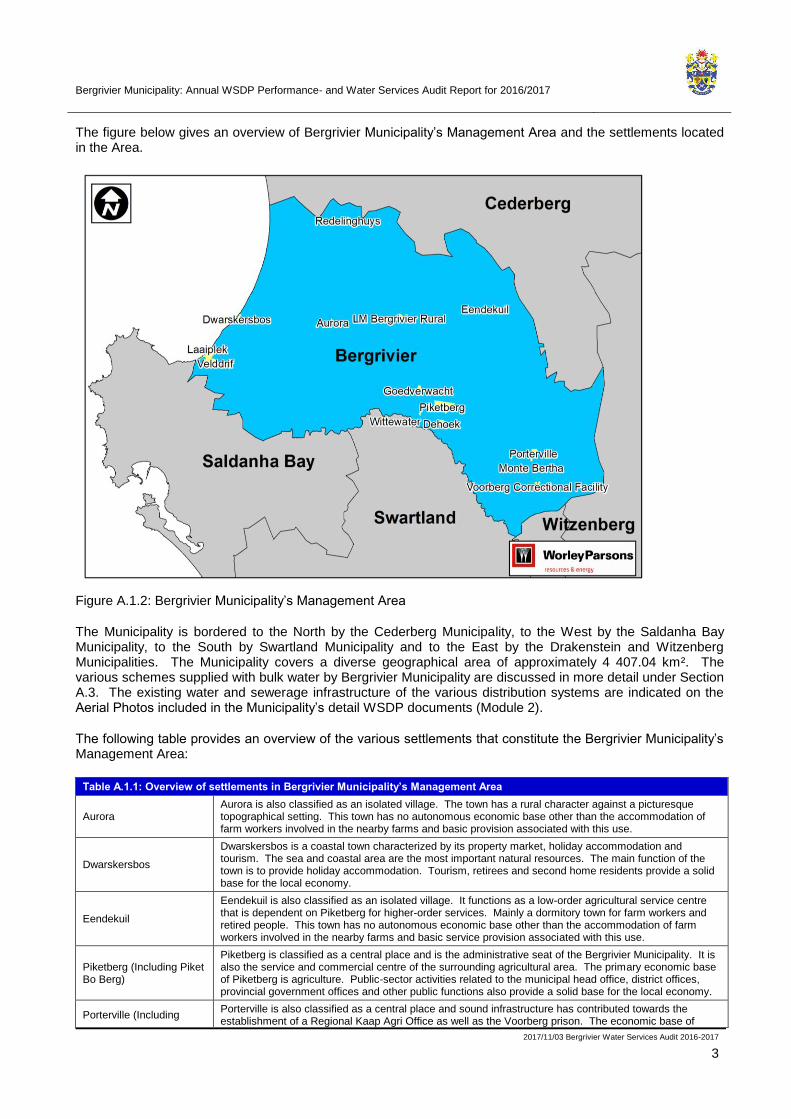
The figure below gives an overview of Bergrivier Municipality’s Management Area and the settlements located in the Area.
Figure A.1.2: Bergrivier Municipality’s Management Area
The Municipality is bordered to the North by the Cederberg Municipality, to the West by the Saldanha Bay Municipality, to the South by Swartland Municipality and to the East by the Drakenstein and Witzenberg Municipalities. The Municipality covers a diverse geographical area of approximately 4 407.04 km². The various schemes supplied with bulk water by Bergrivier Municipality are discussed in more detail under Section A.3. The existing water and sewerage infrastructure of the various distribution systems are indicated on the Aerial Photos included in the Municipality’s detail WSDP documents (Module 2).
The following table provides an overview of the various settlements that constitute the Bergrivier Municipality’s Management Area:
Table A.1.1: Overview of settlements in Bergrivier Municipality’s Management Area
Aurora Aurora is also classified as an isolated village. The town has a rural character against a picturesque topographical setting. This town has no autonomous economic base other than the accommodation of farm workers involved in the nearby farms and basic provision associated with this use.
Dwarskersbos
Dwarskersbos is a coastal town characterized by its property market, holiday accommodation and tourism. The sea and coastal area are the most important natural resources. The main function of the town is to provide holiday accommodation. Tourism, retirees and second home residents provide a solid base for the local economy.
Eendekuil
Eendekuil is also classified as an isolated village. It functions as a low-order agricultural service centre that is dependent on Piketberg for higher-order services. Mainly a dormitory town for farm workers and retired people. This town has no autonomous economic base other than the accommodation of farm workers involved in the nearby farms and basic service provision associated with this use.
Piketberg (Including Piket Bo Berg)
Piketberg is classified as a central place and is the administrative seat of the Bergrivier Municipality. It is also the service and commercial centre of the surrounding agricultural area. The primary economic base of Piketberg is agriculture. Public-sector activities related to the municipal head office, district offices, provincial government offices and other public functions also provide a solid base for the local economy.
Porterville (Including Porterville is also classified as a central place and sound infrastructure has contributed towards the establishment of a Regional Kaap Agri Office as well as the Voorberg prison. The economic base of

Bergrivier Municipality: Annual WSDP Performance- and Water Services Audit Report for 2016/2017
2017/11/03 Bergrivier Water Services Audit 2016-2017
4
Table A.1.1: Overview of settlements in Bergrivier Municipality’s Management Area
Dasklip Pass) Porterville is primarily agriculture, which is supplemented by some recreational and tourism activities.
Redelinghuys
Redelinghuys is classified as an isolated village. The town mainly functions as a residential area for the surrounding agricultural sector and retired people. There is some recreational and tourism potential in the Verlorenvlei area which is a Ramsar Site which falls partially within Bergrivier’s area of jurisdiction. This town has no autonomous economic base other than the accommodation of farm workers involved in the nearby farms and basic service provision associated with this use.
Velddrif (Including Laaiplek, Port Owen and Noordhoek)
Velddrif is a coastal town which functions as a focal point for the fishing industry along the West Coast. The most important resources are the sea, the coastal environment, salt pans and the Bergrivier Estuary. Tourism, retirees and second home residents provide a solid base for the local economy.
Goedverwacht and Wittewater
Goedverwacht and Wittewater are also classified as isolated villages. These towns are located on private land, within a predominantly agricultural area. They are Mission Stations run by the Moravian Church of South Africa, and have little direct investment to stimulate economic activities. Inhabitants work mainly on the surrounding farms, but the villages do boast some very good builders. The scenic mountains and the missionary culture offer some tourism potential, but this can only be realized within the context of the larger tourism plan for the region.
A.2. Water Services Administration and Organization
Bergrivier Municipality is the WSA for the entire Municipal Management Area. The small rural settlements of Goedverwacht and Wittewater are however Moravian Mission stations and the services are managed by the Church and Bergrivier Municipality only provides a support service to the Church. Bergrivier Municipality’s Organogram for Engineering Services are included in Annexure F. The table below gives the contact details of the persons responsible for water services management and planning within Bergrivier Municipality.
Table A.2.1: Water Services Administrative Structure
Accounting Officer
Designation Municipal Manager
Name Adv. H Linde
Telephone Nr. 022 913 6012
Cell Nr. 082 448 1231
Email [email protected]
WSA Manager
Designation Manager: Civil Services
Name Mr J Breunissen
Telephone Nr. 022 913 6025
Cell Nr. 083 272 3805
Email [email protected]
WSP Manager
Designation Manager: Civil Services
Name Mr J Breunissen
Telephone Nr. 022 913 6025
Cell Nr. 083 272 3805
Email [email protected]
WSDP Manager
Designation Manager: Civil Services
Name Mr J Breunissen
Telephone Nr. 022 913 6025
Cell Nr. 083 272 3805
Email [email protected]
IDP Manager
Designation Manager: Strategic Services
Name Ms A van Sittert
Telephone Nr. 022 913 6076
Cell Nr. 083 607 4644
Email [email protected]

Bergrivier Municipality: Annual WSDP Performance- and Water Services Audit Report for 2016/2017
2017/11/03 Bergrivier Water Services Audit 2016-2017
5
A.3. Water Services Overview
Bergrivier Municipality is located within the newly established Berg-Olifants Water Management Area. The Municipality further falls within the West Coast Region of the Western Cape Province, in which the following Local Municipalities are also located:
• Matzikama Municipality;
• Cederberg Municipality;
• Swartland Municipality; and
• Saldanha Bay Municipality
The Municipality comprises of nine (9) urban settlements, approximately 40 kilometres of coastline and a vast rural area. The main urban settlements that constitute the Municipality are Piketberg which is the administrative head office, Porterville, Velddrif (which include Port Owen, Laaiplek and Noordhoek), Dwarskersbos, Eendekuil, Aurora, Redelinghuys, Goedverwacht and Wittewater. Another settlement, De Hoek, also falls within the municipal boundary, but is not serviced in respect of water by the Municipality.
The Municipality consists of seven (7) individual wards, and is the only WSA within this municipal area. It is also the Water Services Provider (WSP). Bulk potable water is however provided to the towns of Velddrif and Dwarskersbos by the West Coast District Municipality through their Withoogte bulk water distribution system. The bulk potable water supplied from the Withoogte WTW is augmented by abstraction of groundwater from the Langebaan Road Groundwater Aquifer System. The bulk distribution scheme is a cross-border scheme and supply water to Bergrivier Municipality, Swartland Municipality and Saldanha Bay Municipality. A Service Level Agreement between the West Coast District Municipality and Bergrivier Municipality is in place for the provision of bulk potable water to these two towns. Bergrivier Municipality’s responsibility as WSA also extends to the rural areas within its Municipal boundary.
Bergrivier Municipality’s Management Area includes the following areas (Water Distribution Systems):
• Porterville - Porterville Water Distribution System
• Piketberg – Piketberg Water Distribution System
• Velddrif – Velddrif Water Distribution System
• Dwarskersbos – Dwarskersbos Water Distribution System
• Aurora – Aurora Water Distribution System
• Eendekuil – Eendekuil Water Distribution System
• Redelinghuys – Redelinghuys Water Distribution System
• Wittewater, managed by the Moravian Church
• Goedverwacht, managed by the Moravian Church
• The rural farm areas
The towns in Bergrivier Municipality’s Management Area supplied with bulk potable water by the West Coast District Municipality are as follows:
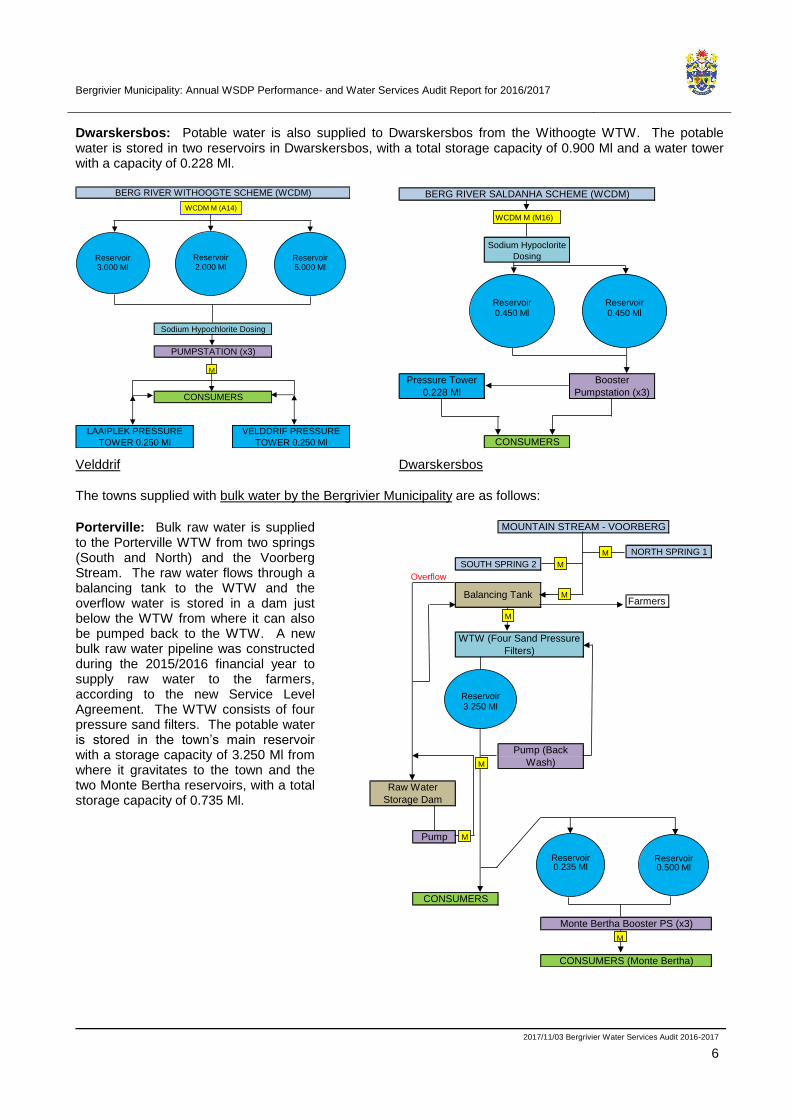
Velddrif: Potable water is supplied to Velddrif by the West Coast District Municipality as part of the Withoogte Regional Scheme, which forms part of the Western Cape Water Supply System. The Voëlvlei Dam is the main storage dam to supply water to this part of the system, as well as the Berg River. Water can also be released from the Berg River Dam in the upper part of the Berg River should it be necessary. Raw water is pumped from the Misverstand Weir to the Withoogte WTW for treatment, before distribution to the various West Coast District Municipality’s consumers. The potable water supplied by the West Coast District Municipality to Velddrif is stored in two reservoirs in Velddrif, with a total storage capacity of 10.000 Ml. There are also two water towers with a total storage capacity of 0.500 Ml in Velddrif.
Bergrivier Municipality: Annual WSDP Performance- and Water Services Audit Report for 2016/2017
2017/11/03 Bergrivier Water Services Audit 2016-2017
6
Farmers
Pump
CONSUMERS
Monte Bertha Booster PS (x3)
Raw Water
Storage Dam
CONSUMERS (Monte Bertha)
NORTH SPRING 1
Pump (Back
Wash)
Balancing Tank
WTW (Four Sand Pressure
Filters)
MOUNTAIN STREAM - VOORBERG
SOUTH SPRING 2
Reservoir0.235 Ml
Reservoir0.500 Ml
M
M
M
M
M
Reservoir3.250 Ml
M
Overflow
M
Dwarskersbos: Potable water is also supplied to Dwarskersbos from the Withoogte WTW. The potable water is stored in two reservoirs in Dwarskersbos, with a total storage capacity of 0.900 Ml and a water tower with a capacity of 0.228 Ml.
Sodium Hypochlorite Dosing
CONSUMERS
LAAIPLEK PRESSURE
TOWER 0.250 Ml
VELDDRIF PRESSURE
TOWER 0.250 Ml
BERG RIVER WITHOOGTE SCHEME (WCDM)
PUMPSTATION (x3)
Reservoir3.000 Ml
Reservoir2.000 Ml
WCDM M (A14)
M
Reservoir5.000 Ml
BERG RIVER SALDANHA SCHEME (WCDM)
Pressure Tower
0.228 Ml
Booster
Pumpstation (x3)
Sodium Hypoclorite
Dosing
CONSUMERS
Reservoir0.450 Ml
WCDM M (M16)
Reservoir0.450 Ml
Velddrif Dwarskersbos
The towns supplied with bulk water by the Bergrivier Municipality are as follows:
Porterville: Bulk raw water is supplied to the Porterville WTW from two springs (South and North) and the Voorberg Stream. The raw water flows through a balancing tank to the WTW and the overflow water is stored in a dam just below the WTW from where it can also be pumped back to the WTW. A new bulk raw water pipeline was constructed during the 2015/2016 financial year to supply raw water to the farmers, according to the new Service Level Agreement. The WTW consists of four pressure sand filters. The potable water is stored in the town’s main reservoir with a storage capacity of 3.250 Ml from where it gravitates to the town and the two Monte Bertha reservoirs, with a total storage capacity of 0.735 Ml.
Bergrivier Municipality: Annual WSDP Performance- and Water Services Audit Report for 2016/2017
2017/11/03 Bergrivier Water Services Audit 2016-2017
7
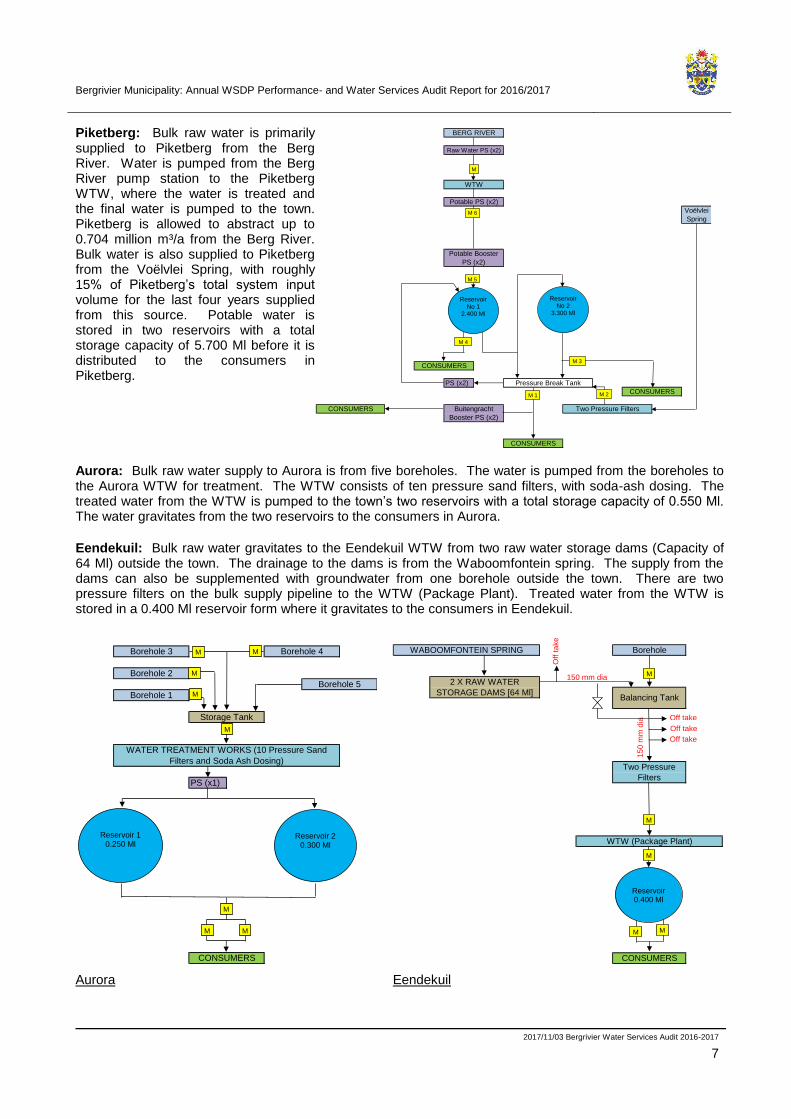
PS (x2)
CONSUMERS
BERG RIVER
Raw Water PS (x2)
Buitengracht
Booster PS (x2)
Pressure Break Tank
Two Pressure Filters
CONSUMERS
CONSUMERS
Voëlvlei
Spring
CONSUMERS
WTW
Potable PS (x2)
Potable Booster
PS (x2)
Reservoir No 2
3.300 Ml
M
M 5
M 6
Reservoir No 1
2.400 Ml
M 4
M 2
M 3
M 1
Piketberg: Bulk raw water is primarily supplied to Piketberg from the Berg River. Water is pumped from the Berg River pump station to the Piketberg WTW, where the water is treated and the final water is pumped to the town. Piketberg is allowed to abstract up to 0.704 million m³/a from the Berg River. Bulk water is also supplied to Piketberg from the Voëlvlei Spring, with roughly 15% of Piketberg’s total system input volume for the last four years supplied from this source. Potable water is stored in two reservoirs with a total storage capacity of 5.700 Ml before it is distributed to the consumers in Piketberg.
Aurora: Bulk raw water supply to Aurora is from five boreholes. The water is pumped from the boreholes to the Aurora WTW for treatment. The WTW consists of ten pressure sand filters, with soda-ash dosing. The treated water from the WTW is pumped to the town’s two reservoirs with a total storage capacity of 0.550 Ml. The water gravitates from the two reservoirs to the consumers in Aurora.
Eendekuil: Bulk raw water gravitates to the Eendekuil WTW from two raw water storage dams (Capacity of 64 Ml) outside the town. The drainage to the dams is from the Waboomfontein spring. The supply from the dams can also be supplemented with groundwater from one borehole outside the town. There are two pressure filters on the bulk supply pipeline to the WTW (Package Plant). Treated water from the WTW is stored in a 0.400 Ml reservoir form where it gravitates to the consumers in Eendekuil.
PS (x1)
CONSUMERS
Borehole 5
WATER TREATMENT WORKS (10 Pressure Sand
Filters and Soda Ash Dosing)
Borehole 3 Borehole 4
Storage Tank
Borehole 1
Borehole 2
Reservoir 10.250 Ml
Reservoir 20.300 Ml
M
M
MM
M
M
M M
2 X RAW WATER
STORAGE DAMS [64 Ml]
Borehole
Balancing Tank
WABOOMFONTEIN SPRING
Two Pressure
Filters
WTW (Package Plant)
CONSUMERS
M150 mm dia
Off
ta
ke
15
0m
m d
ia Off take
Off take
Off take
M
M
Reservoir0.400 Ml
MM
Aurora Eendekuil
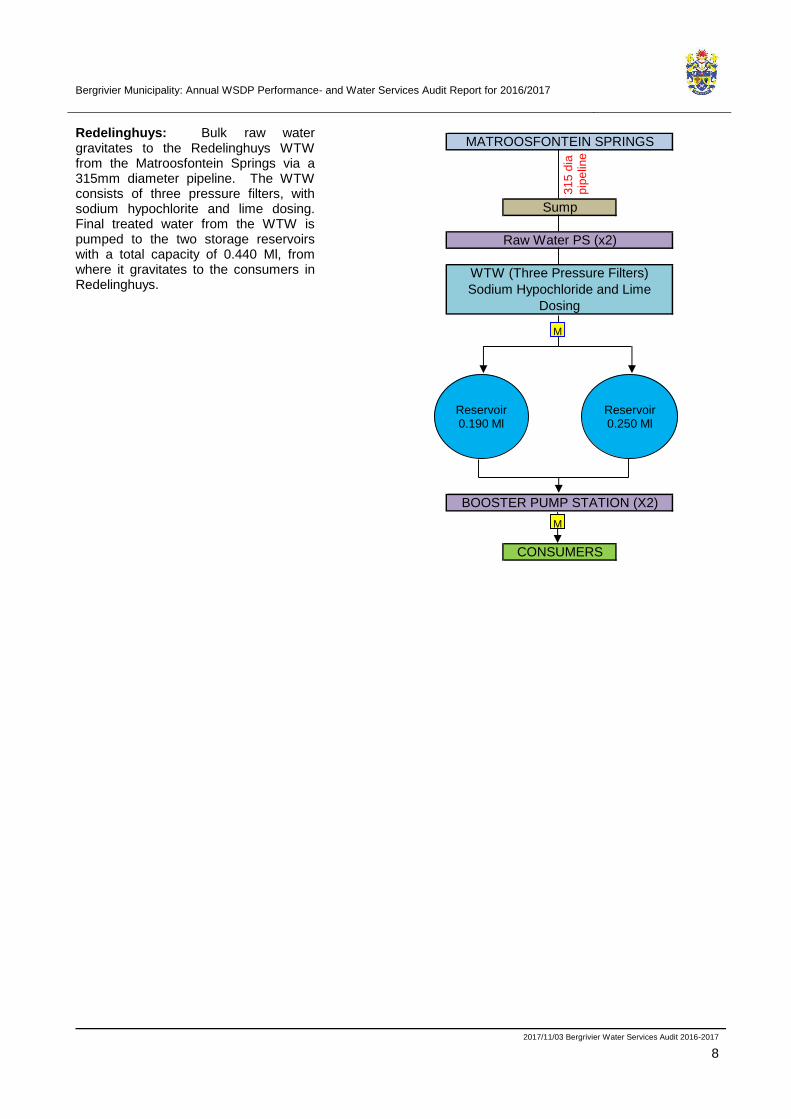
Bergrivier Municipality: Annual WSDP Performance- and Water Services Audit Report for 2016/2017
2017/11/03 Bergrivier Water Services Audit 2016-2017
8
BOOSTER PUMP STATION (X2)
CONSUMERS
MATROOSFONTEIN SPRINGS
WTW (Three Pressure Filters)
Sodium Hypochloride and Lime
Dosing
Raw Water PS (x2)
Sump
Reservoir0.190 Ml
Reservoir0.250 Ml
M
31
5 d
iap
ipe
line
M
Redelinghuys: Bulk raw water gravitates to the Redelinghuys WTW from the Matroosfontein Springs via a 315mm diameter pipeline. The WTW consists of three pressure filters, with sodium hypochlorite and lime dosing. Final treated water from the WTW is pumped to the two storage reservoirs with a total capacity of 0.440 Ml, from where it gravitates to the consumers in Redelinghuys.

Bergrivier Municipality: Annual WSDP Performance- and Water Services Audit Report for 2016/2017
2017/11/03 Bergrivier Water Services Audit 2016-2017
9
Consumers
Consumers
RIET RIVER
Two Pressure Filters & Sodium
Hypochlorite Dosing
Consumers
Raw Water PS (x2)
Reservoir
0.150 Ml
Reservoir0.136 Ml
Reservoir
0.204 Ml
Reservoir
0.136 Ml
M
15
0 D
ia B
ulk
P
ipe
line
The towns managed by the Moravian Church, for which Bergrivier Municipality only provides a support service, are as follows:
Wittewater: The town relies on surface water abstracted from the local stream and a fountain that also feed the stream. Groundwater is also pumped from two boreholes to the WTW. The WTW consists of two sand pressure filters that treat the raw water, before the potable water is pumped to the town’s main storage reservoir with a storage capacity of 0.350 Ml.
Goedverwacht: Raw water is abstracted from the Riet River and distributed via a 150mm diameter pipeline to the WTW. The WTW consists of two pressure filters with sodium hypochlorite dosing. From there the treated water is distributed to four reservoirs, with a total capacity of 0.626 Ml. Potable water gravitates from these reservoirs to the consumers in Goedverwacht.
Potable PS (x2)
CONSUMERS
Two Sand Pressure Filters
Berg Raw Water
Inlet
BoreholeBorehole
Raw Water PS for
fountain water
(x1)
Filter PS (x2)
PPC Reservoir 0.050 Ml
PPC Reservoir 0.050 Ml
PPC Reservoir 0.050 Ml
Reservoir 0.350 Ml
Wittewater Goedverwacht

Bergrivier Municipality: Annual WSDP Performance- and Water Services Audit Report for 2016/2017
2017/11/03 Bergrivier Water Services Audit 2016-2017
10
The table below gives an overview of the major water infrastructure components, for the various distribution systems, in Bergrivier Municipality’s Management Area.
Table A.3.1: Summary of existing main water infrastructure
Water
Distribution
System
Bulk Supply WTW Bulk and
Reticulation
Number of
Water PS
Number of
Reservoirs
(Resources) (Capacity in Ml/d) (km) (RW/PW) (Storage in Ml)
Porterville Voorberg Mountain Stream
2.270 3.565 (Bulk)
32.750 (Network)
1 (RW)
1 (TW) 3 (3.985)
Two Springs
Piketberg Berg River
3.150 19.400 (Bulk)
54.130 (Network)
1 (RW)
4 (TW) 2 (5.700)
Voëlvlei Spring
Wittewater
Mountain Stream
Unknown 0.546 (Bulk)
6.640 (Network)
1 (RW)
1 (TW) 4 (0.500) Fountain
Two Boreholes
Goedverwacht Riet River Unknown 1.839 (Bulk)
14.570 (Network) 1 (RW) 4 (0.626)
Velddrif Withoogte Bulk Scheme (WCDM) - 87.325 (Network) 1 (TW) 5 (10.500)
Dwarskersbos Withoogte Bulk Scheme (WCDM) - 15.605 (Network) 1 (TW) 3 (1.128)
Aurora Five Boreholes 0.200 2.633 (Bulk)
12.945 (Network) 1 (TW) 2 (0.550)
Eendekuil Waboomfontein River and Spring
0.200 13.436 (Bulk)
7.180 (Network) - 1 (0.400)
Borehole
Redelinghuys Matroosfontein Springs 0.260 3.208 (Bulk)
8.515 (Network)
1 (RW)
1 (TW) 2 (0.440)
The table below gives an overview of the major sewerage infrastructure components, for the various drainage systems, in Bergrivier Municipality’s Management Area.
Table A.3.2: Summary of existing main sewerage infrastructure
Sewer Drainage Systems Sewer Drainage Network (km) Number of Sewer PS WWTW
(Capacity in Ml/d)
Porterville Gravity 28.1 1 Activated Sludge (1.200)
Piketberg Gravity 45.9; Rising 0.9 2 Activated Sludge (3.150)
Wittewater - - -
Goedverwacht - - -
Velddrif Gravity 34.0; Rising 15.5 48 Activated Sludge (1.995)
Dwarskersbos Gravity 6.3; Rising 5.2 5 Oxidation Ponds (0.294)
Aurora - - -
Eendekuil Gravity 2.4; Rising 1.5 2 Oxidation Ponds (0.140)
Redelinghuys - - -
Every WSA has a duty to ensure that at least a basic water supply and sanitation service is provided to every household within its area of jurisdiction. The definition of basic water supply and sanitation services are summarised in the table below:
Table A.3.3: Definitions of Water Supply and Sanitation Services
Basic water supply facility
The infrastructure necessary to supply 25 litres of potable water per person per day supplied within 200 metres of a household and with a minimum flow of 10 litres per minute (in the case of communal water points) or 6 000 litres of potable water supplied per formal connection per month (in the case of yard or house connections).
Basic water supply service
The provision of a basic water supply facility, the sustainable operation of the facility (available for at least 350 days per year and not interrupted for more than 48 consecutive hours per incident) and the communication of good water-use, hygiene and related practices.
Basic sanitation facility
The infrastructure necessary to provide a sanitation facility which is safe, reliable, private, protected from the weather and ventilated, keeps smells to the minimum, is easy to keep clean, minimises the risk of the spread of sanitation-related diseases by facilitating the appropriate control of disease carrying flies and pests, and enables safe and appropriate treatment and/or removal of human waste and wastewater in an environmentally sound manner.
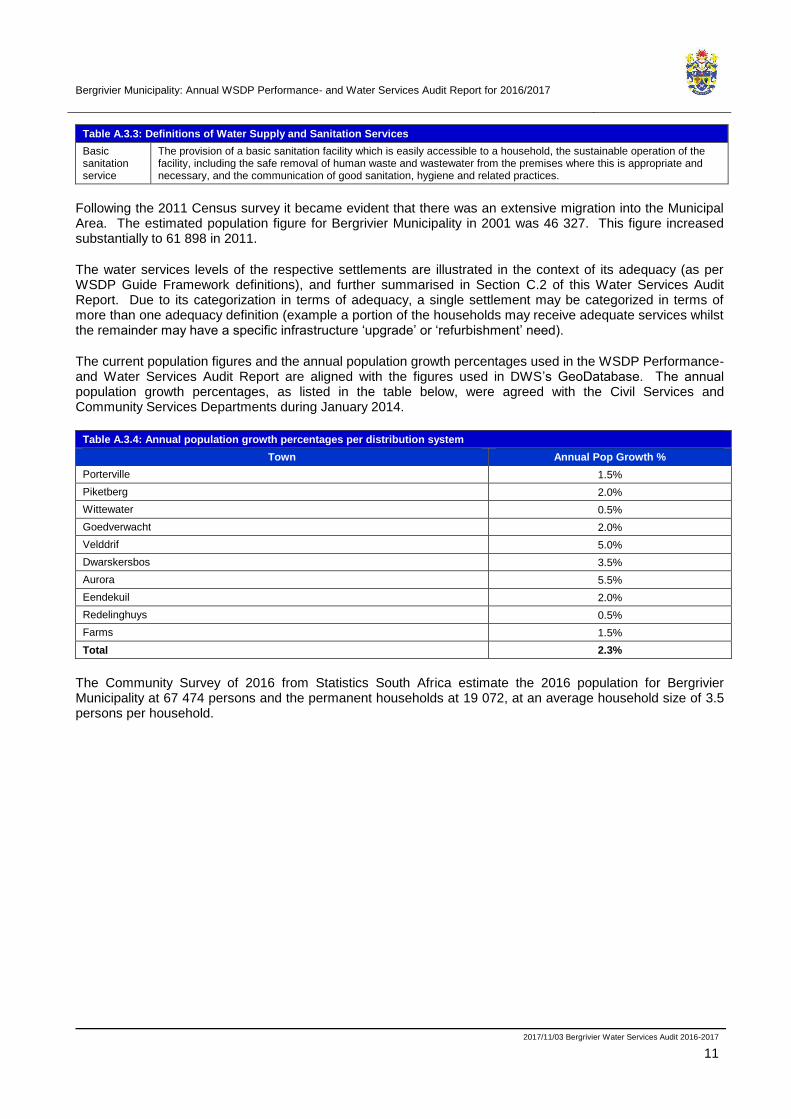
Bergrivier Municipality: Annual WSDP Performance- and Water Services Audit Report for 2016/2017
2017/11/03 Bergrivier Water Services Audit 2016-2017
11
Table A.3.3: Definitions of Water Supply and Sanitation Services
Basic sanitation service
The provision of a basic sanitation facility which is easily accessible to a household, the sustainable operation of the facility, including the safe removal of human waste and wastewater from the premises where this is appropriate and necessary, and the communication of good sanitation, hygiene and related practices.
Following the 2011 Census survey it became evident that there was an extensive migration into the Municipal Area. The estimated population figure for Bergrivier Municipality in 2001 was 46 327. This figure increased substantially to 61 898 in 2011.
The water services levels of the respective settlements are illustrated in the context of its adequacy (as per WSDP Guide Framework definitions), and further summarised in Section C.2 of this Water Services Audit Report. Due to its categorization in terms of adequacy, a single settlement may be categorized in terms of more than one adequacy definition (example a portion of the households may receive adequate services whilst the remainder may have a specific infrastructure ‘upgrade’ or ‘refurbishment’ need).
The current population figures and the annual population growth percentages used in the WSDP Performance- and Water Services Audit Report are aligned with the figures used in DWS’s GeoDatabase. The annual population growth percentages, as listed in the table below, were agreed with the Civil Services and Community Services Departments during January 2014.
Table A.3.4: Annual population growth percentages per distribution system
Town Annual Pop Growth %
Porterville 1.5%
Piketberg 2.0%
Wittewater 0.5%
Goedverwacht 2.0%
Velddrif 5.0%
Dwarskersbos 3.5%
Aurora 5.5%
Eendekuil 2.0%
Redelinghuys 0.5%
Farms 1.5%
Total 2.3%
The Community Survey of 2016 from Statistics South Africa estimate the 2016 population for Bergrivier Municipality at 67 474 persons and the permanent households at 19 072, at an average household size of 3.5 persons per household.

Bergrivier Municipality: Annual WSDP Performance- and Water Services Audit Report for 2016/2017
2017/11/03 Bergrivier Water Services Audit 2016-2017
12
The tables below give an overview of the projected population and permanent number of households and the water and sanitation service levels in Bergrivier Municipality’s Management Area.
Ho
useh
old
s
Po
pu
lati
on
Ho
useh
old
s
Po
pu
lati
on
Ad
eq
ua
te: F
orm
al
Ad
eq
ua
te: In
form
al
Ad
eq
ua
te: S
ah
red
Se
rvic
es
Wa
ter
reso
urc
es n
ee
ds o
nly
O&
M n
ee
ds o
nly
Infr
astr
uctu
re n
ee
ds o
nly
Infr
astr
uctu
re &
O&
M n
ee
ds
Infr
astr
uctu
re, O
&M
& R
eso
urc
e n
ee
d
No
Se
rvic
es: In
form
al
No
Se
rvic
es: F
orm
al
Metropolitan Area
Sub-Total 0 0 0 0
Formal Town
Porterville 1,949 7,057 2,100 7,602 P P
Piketberg 2,920 12,075 3,224 13,332 P P
Wittewater 190 848 195 869 P P
Goedverwacht 539 1,979 595 2,185 P P
Velddrif 3,622 10,677 4,543 13,741 P P
Dwarskersbos 211 670 251 796 P P
Aurora 199 578 260 755 P P
Eendekuil 379 1,530 418 1,689 P P
Redelinghuys 139 574 143 588 P P
Sub-Total 10,148 35,988 11,728 41,558
Townships
Sub-Total 0 0 0 0
Informal Settlements
Velddrif 85 340 80 320 P
Sub-Total 85 340 80 320
Working towns & service centres
Sub-Total 0 0 0 0
Sub-Total: (Urban) 10,233 36,328 11,808 41,878
Rural / Farming
Farms 6,162 25,570 6,638 27,546 P P P
Sub-Total 6,162 25,570 6,638 27,546
Informal Settlements
Sub-Total 0 0 0 0
Sub-Total (Rural) 6,162 25,570 6,638 27,546
TOTAL 16,395 61,898 18,446 69,424
Adequate
Adequate Below RDP None
Adequate Below RDP None
Water category
Settlement Type
2011/2012 2016/2017
Adequate Below RDP None
RURAL
Adequate Below RDP None
Table A.3.5: Water Services Overview (Water)
Below RDP None
Adequate Below RDP
URBAN
None
Adequate Below RDP None

Bergrivier Municipality: Annual WSDP Performance- and Water Services Audit Report for 2016/2017
2017/11/03 Bergrivier Water Services Audit 2016-2017
13
Ho
useh
old
s
Po
pu
lati
on
Ho
useh
old
s
Po
pu
lati
on
Ad
eq
ua
te: F
orm
al
Ad
eq
ua
te: In
form
al
Ad
eq
ua
te: S
ah
red
Se
rvic
es
Wa
ter
reso
urc
es n
ee
ds o
nly
O&
M n
ee
ds o
nly
Infr
astr
uctu
re n
ee
ds o
nly
Infr
astr
uctu
re &
O&
M n
ee
ds
Infr
astr
uctu
re, O
&M
& R
eso
urc
e n
ee
d
No
Se
rvic
es: In
form
al
No
Se
rvic
es: F
orm
al
Metropolitan Area
Sub-Total 0 0 0 0
Formal Town
Porterville 1,949 7,057 2,100 7,602 P P
Piketberg 2,920 12,075 3,224 13,332 P P
Wittewater 190 848 195 869 P P
Goedverwacht 539 1,979 595 2,185 P P
Velddrif 3,622 10,677 4,543 13,741 P P
Dwarskersbos 211 670 251 796 P P
Aurora 199 578 260 755 P P
Eendekuil 379 1,530 418 1,689 P P
Redelinghuys 139 574 143 588 P P
Sub-Total 10,148 35,988 11,728 41,558
Townships
Sub-Total 0 0 0 0
Informal Settlements
Velddrif 85 340 80 320 P
Sub-Total 85 340 80 320
Working towns & service centres
Sub-Total 0 0 0 0
Sub-Total: (Urban) 10,233 36,328 11,808 41,878
Rural / Farming
Farms 6,162 25,570 6,638 27,546 P P P
Sub-Total 6,162 25,570 6,638 27,546
Informal Settlements
Sub-Total 0 0 0 0
Sub-Total (Rural) 6,162 25,570 6,638 27,546
TOTAL 16,395 61,898 18,446 69,424
Table A.3.6: Water Services Overview (Sanitation)
Settlement Type
2011/2012 2016/2017 Sanitation category
URBAN
Adequate Below RDP None
Adequate Below RDP None
Adequate Below RDP None
Adequate Below RDP None
Adequate Below RDP None
RURAL
Adequate Below RDP None
Adequate Below RDP None

Bergrivier Municipality: Annual WSDP Performance- and Water Services Audit Report for 2016/2017
2017/11/03 Bergrivier Water Services Audit 2016-2017
14
B. WSDP PERFORMANCE REPORT
B.1. WSDP Reference and Status
Bergrivier Municipality’s WSDP was updated according to the new eWSDP format and was approved by Council on the 25th of October 2016 (2017-2022 WSDP First Cycle).
Drafted: Jul'16 Year 1 2011/12 Year -3
Comment submit: After Oct'16 Year 2 2012/13 Year -3
Finalised: After Comments Year 3 2013/14 Year -2
Adopted: 25/10/2016 Year 4 2014/15 Year -1
Published: 25/10/2016 Year 5 2015/16 Year 0
Legend:
Past Financial Years
Previous Financial Year (financial year of reporting)
Future Years
WSDP
Year
Financial
Year
Reporting
year
Table B.1.1: WSDP and Reporting Reference
1
WSDP IDP Sector Input
Report, eWSDP, Module
2: Base Data and
Compliance Data and
Module 3: Strategies
DateStatusWSDP Title and
ReferenceNr
B.2. Performance on Water Services Objectives and Strategies
The IDP is the Municipality’s single most strategic document that drives and directs all implementation and related processes. The Municipality’s budget is developed based on the priorities, programmes and projects of the IDP, after which a Service Delivery Budget Implementation Plan (SDBIP) is developed, to ensure that the organisation actually delivers on the IDP targets.
The SDBIP is the process plan and performance indicator / evaluation for the execution of the budget. The SDBIP is being used as a management, implementation and monitoring tool that assists and guide the Executive Mayor, Councillors, Municipal Manager, Senior Managers and the community. The plan serves as an input to the performance agreements of the Municipal Manager and Directors. It also forms the basis for the monthly, quarterly, mid-year and the annual assessment report and performance assessments of the Municipal Manager and Directors.
Finally, the Annual Report, of which the Water Services Audit Report forms a part, records the success or otherwise of the previous year’s implementation.
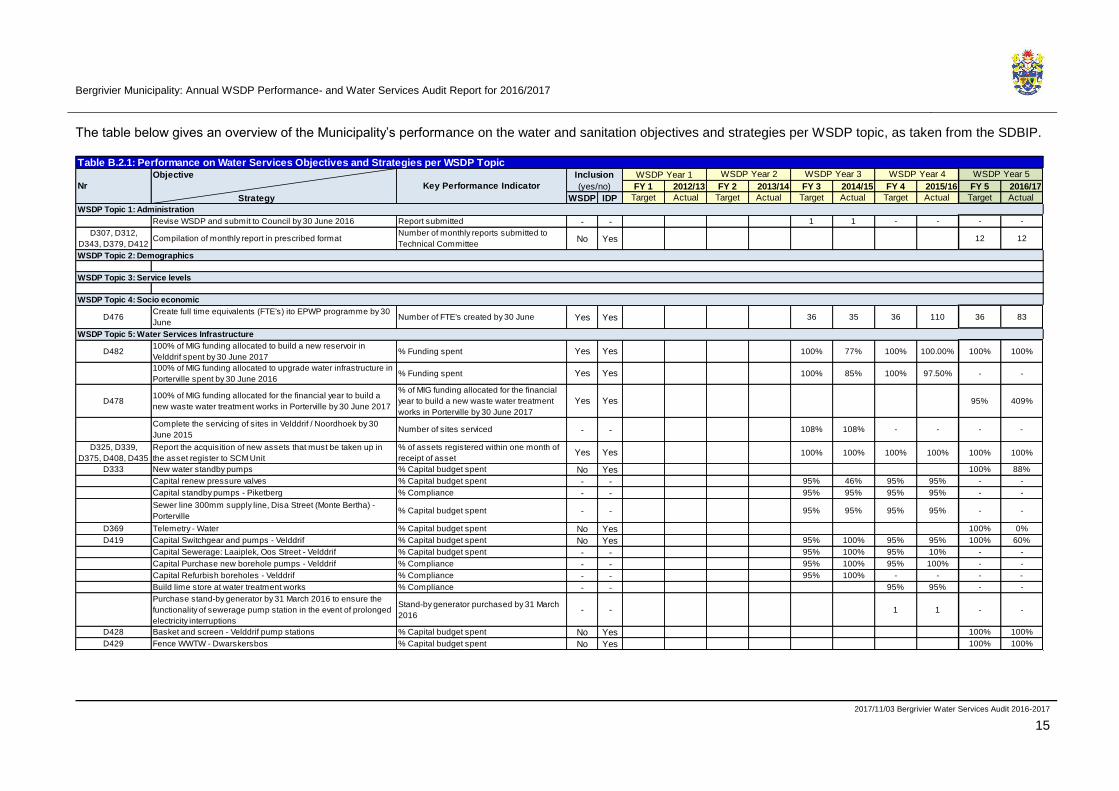
Bergrivier Municipality: Annual WSDP Performance- and Water Services Audit Report for 2016/2017
2017/11/03 Bergrivier Water Services Audit 2016-2017
15
The table below gives an overview of the Municipality’s performance on the water and sanitation objectives and strategies per WSDP topic, as taken from the SDBIP.
FY 1 2012/13 FY 2 2013/14 FY 3 2014/15 FY 4 2015/16 FY 5 2016/17
WSDP IDP Target Actual Target Actual Target Actual Target Actual Target Actual
Revise WSDP and submit to Council by 30 June 2016 Report submitted - - 1 1 - - - -
D307, D312,
D343, D379, D412Compilation of monthly report in prescribed format
Number of monthly reports submitted to
Technical CommitteeNo Yes 12 12
D476Create full time equivalents (FTE's) ito EPWP programme by 30
June Number of FTE's created by 30 June Yes Yes 36 35 36 110 36 83
D482100% of MIG funding allocated to build a new reservoir in
Velddrif spent by 30 June 2017% Funding spent Yes Yes 100% 77% 100% 100.00% 100% 100%
100% of MIG funding allocated to upgrade water infrastructure in
Porterville spent by 30 June 2016% Funding spent Yes Yes 100% 85% 100% 97.50% - -
D478100% of MIG funding allocated for the financial year to build a
new waste water treatment works in Porterville by 30 June 2017
% of MIG funding allocated for the financial
year to build a new waste water treatment
works in Porterville by 30 June 2017
Yes Yes 95% 409%
Complete the servicing of sites in Velddrif / Noordhoek by 30
June 2015Number of sites serviced - - 108% 108% - - - -
D325, D339,
D375, D408, D435
Report the acquisition of new assets that must be taken up in
the asset register to SCM Unit
% of assets registered within one month of
receipt of assetYes Yes 100% 100% 100% 100% 100% 100%
D333 New water standby pumps % Capital budget spent No Yes 100% 88%
Capital renew pressure valves % Capital budget spent - - 95% 46% 95% 95% - -
Capital standby pumps - Piketberg % Compliance - - 95% 95% 95% 95% - -
Sewer line 300mm supply line, Disa Street (Monte Bertha) -
Porterville% Capital budget spent - - 95% 95% 95% 95% - -
D369 Telemetry - Water % Capital budget spent No Yes 100% 0%
D419 Capital Switchgear and pumps - Velddrif % Capital budget spent No Yes 95% 100% 95% 95% 100% 60%
Capital Sewerage: Laaiplek, Oos Street - Velddrif % Capital budget spent - - 95% 100% 95% 10% - -
Capital Purchase new borehole pumps - Velddrif % Compliance - - 95% 100% 95% 100% - -
Capital Refurbish boreholes - Velddrif % Compliance - - 95% 100% - - - -
Build lime store at water treatment works % Compliance - - 95% 95% - -
Purchase stand-by generator by 31 March 2016 to ensure the
functionality of sewerage pump station in the event of prolonged
electricity interruptions
Stand-by generator purchased by 31 March
2016- - 1 1 - -
D428 Basket and screen - Velddrif pump stations % Capital budget spent No Yes 100% 100%
D429 Fence WWTW - Dwarskersbos % Capital budget spent No Yes 100% 100%
WSDP Topic 1: Administration
WSDP Topic 3: Service levels
WSDP Topic 4: Socio economic
Table B.2.1: Performance on Water Services Objectives and Strategies per WSDP TopicInclusion
(yes/no)
WSDP Year 3 WSDP Year 4WSDP Year 1 WSDP Year 2
Key Performance Indicator
WSDP Year 5
Nr
Objective
Strategy
WSDP Topic 2: Demographics
WSDP Topic 5: Water Services Infrastructure

Bergrivier Municipality: Annual WSDP Performance- and Water Services Audit Report for 2016/2017
2017/11/03 Bergrivier Water Services Audit 2016-2017
16
FY 1 2012/13 FY 2 2013/14 FY 3 2014/15 FY 4 2015/16 FY 5 2016/17
WSDP IDP Target Actual Target Actual Target Actual Target Actual Target Actual
D430 Sewerage standby pumps % Capital budget spent No Yes 100% 100%
D431 Replace water meters % Capital budget spent No Yes 100% 100%
D472 Build new reservoir (Velddrif) % Capital budget spent No Yes 95% 100%
D425 Install Ozone filters at Albatros/Astr % Capital budget spent No Yes 100% 100%
D418 Purchase new borehole pumps % Capital budget spent No Yes 100% 100%
D357, D389, D401 Development of Standard Operating Procedures (SOP's) No of SOP's developed per quarter No Yes 8 8 8 8 8 8
D477 Limit unaccounted for water to 10% by 30 June % unaccounted water by 30 June Yes Yes 10% 8.88% 10% 10.53% 10% 9.93%
D329 Monitor water losses on a monthly basis No of monthly reports on water losses Yes Yes 1 1 12 12 12 12
Restrict annual water losses to 10% % water losses - - 10% 8.88% 10% 5.13% - -
D331Compilation of monthly report on water losses and refuse
volumes in prescribed format
Number of contributions to monthly reports
submitted to Technical CommitteeYes Yes 1 1 12 13 12 12
D348, D384, D416Repair / replace faulty water meters on list received from
Finance within 2 working days
% meters repaired within 5 working days
(Subject to availability of material from
suppliers)
Yes Yes 100% 100% 100% 100% 100% 100%
Capital Replace water meters % compliance - - 95% 100% 95% 95% - -
D352 Replace redundant meters % capital budget spent Yes Yes 100% 100%
D328, D337,
D373, D406
Monitor potable water quaility (SANS 241 standards) in perusal
of blue drop requirements
No of monthly reports on water quality
results and publication thereof on website
within 10 days after month end
Yes Yes 100% 100% 12 12 12 12
D327, D336,
D372, D405
Monitor waste water quality in perusal of green drop
requirements
No of monthly reports on waste water quality
results and publication thereof on website
within 10 days after month end
Yes Yes 100% 100% 12 12 12 12
D48795% water quality level obtained as per SANS 241 physical &
micro parameters as at 31 December 2016 and 30 June 2017
% water quality level as at 31 December
2016 and 30 June 2017Yes Yes 95% 96%
Monitor waste volumes on a monthly basis No of monthly reports on waste volumes - - 100% 100% 12 12 - -
Capital Water meter at source - Velddrif % compliance - - 95% 100% 95% 100% - -
D397 Capital Dam Safety Report (Waboomspruit) % capital budget spent No Yes 95% 95% - - 100% 100%
D398 Capital Dam Safety Report (Porterville Dam) % capital budget spent No Yes 95% 95% - - 100% 100%
WSDP Year 1 WSDP Year 2 WSDP Year 3 WSDP Year 4 WSDP Year 5
WSDP Topic 7: Associated services
WSDP Topic 8: Conservation and Demand management
WSDP Topic 9: Water Resources
WSDP Topic 6: Operation Maintenance
Table B.2.1: Performance on Water Services Objectives and Strategies per WSDP Topic
Nr
Objective
Strategy
Key Performance Indicator
Inclusion
(yes/no)
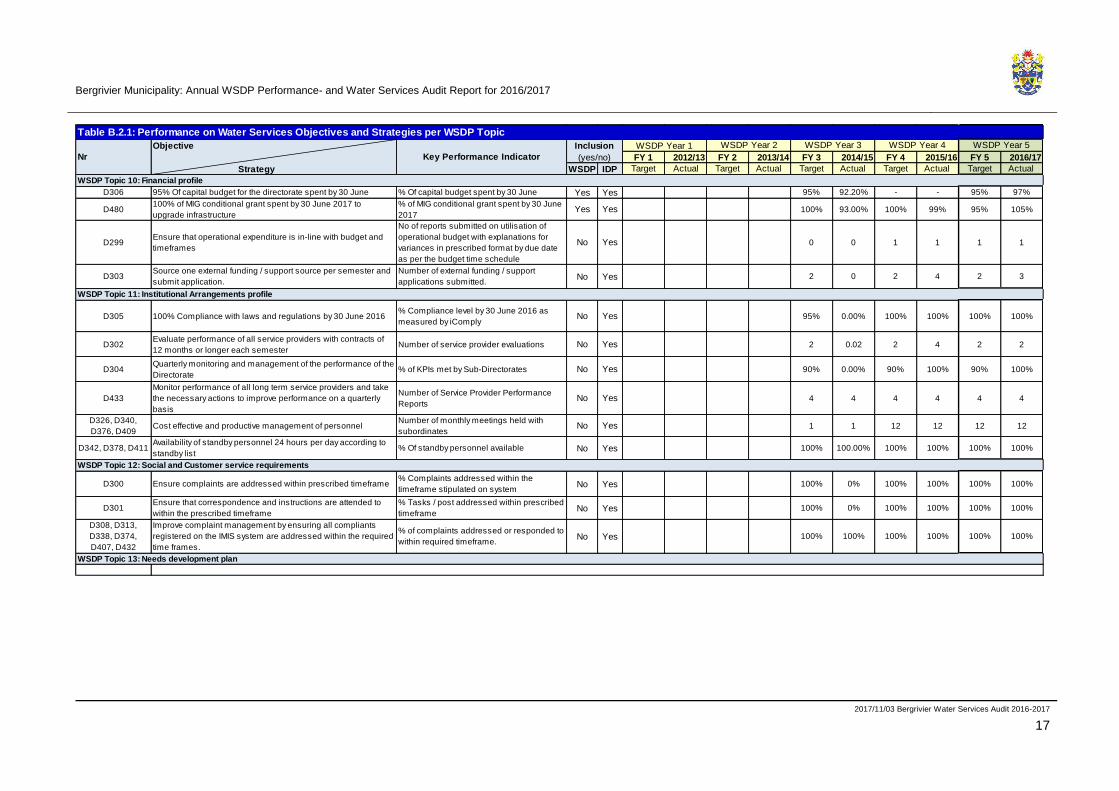
Bergrivier Municipality: Annual WSDP Performance- and Water Services Audit Report for 2016/2017
2017/11/03 Bergrivier Water Services Audit 2016-2017
17
FY 1 2012/13 FY 2 2013/14 FY 3 2014/15 FY 4 2015/16 FY 5 2016/17
WSDP IDP Target Actual Target Actual Target Actual Target Actual Target Actual
D306 95% Of capital budget for the directorate spent by 30 June % Of capital budget spent by 30 June Yes Yes 95% 92.20% - - 95% 97%
D480100% of MIG conditional grant spent by 30 June 2017 to
upgrade infrastructure
% of MIG conditional grant spent by 30 June
2017Yes Yes 100% 93.00% 100% 99% 95% 105%
D299Ensure that operational expenditure is in-line with budget and
timeframes
No of reports submitted on utilisation of
operational budget with explanations for
variances in prescribed format by due date
as per the budget time schedule
No Yes 0 0 1 1 1 1
D303Source one external funding / support source per semester and
submit application.
Number of external funding / support
applications submitted.No Yes 2 0 2 4 2 3
D305 100% Compliance with laws and regulations by 30 June 2016% Compliance level by 30 June 2016 as
measured by iComplyNo Yes 95% 0.00% 100% 100% 100% 100%
D302Evaluate performance of all service providers with contracts of
12 months or longer each semesterNumber of service provider evaluations No Yes 2 0.02 2 4 2 2
D304Quarterly monitoring and management of the performance of the
Directorate% of KPIs met by Sub-Directorates No Yes 90% 0.00% 90% 100% 90% 100%
D433
Monitor performance of all long term service providers and take
the necessary actions to improve performance on a quarterly
basis
Number of Service Provider Performance
ReportsNo Yes 4 4 4 4 4 4
D326, D340,
D376, D409Cost effective and productive management of personnel
Number of monthly meetings held with
subordinatesNo Yes 1 1 12 12 12 12
D342, D378, D411Availability of standby personnel 24 hours per day according to
standby list% Of standby personnel available No Yes 100% 100.00% 100% 100% 100% 100%
D300 Ensure complaints are addressed within prescribed timeframe% Complaints addressed within the
timeframe stipulated on systemNo Yes 100% 0% 100% 100% 100% 100%
D301Ensure that correspondence and instructions are attended to
within the prescribed timeframe
% Tasks / post addressed within prescribed
timeframeNo Yes 100% 0% 100% 100% 100% 100%
D308, D313,
D338, D374,
D407, D432
Improve complaint management by ensuring all compliants
registered on the IMIS system are addressed within the required
time frames.
% of complaints addressed or responded to
within required timeframe.No Yes 100% 100% 100% 100% 100% 100%
WSDP Topic 12: Social and Customer service requirements
WSDP Topic 13: Needs development plan
WSDP Topic 10: Financial profile
WSDP Topic 11: Institutional Arrangements profile
Table B.2.1: Performance on Water Services Objectives and Strategies per WSDP Topic
Nr
WSDP Year 3 WSDP Year 4 WSDP Year 5Objective
Strategy
Key Performance Indicator
Inclusion
(yes/no)
WSDP Year 1 WSDP Year 2
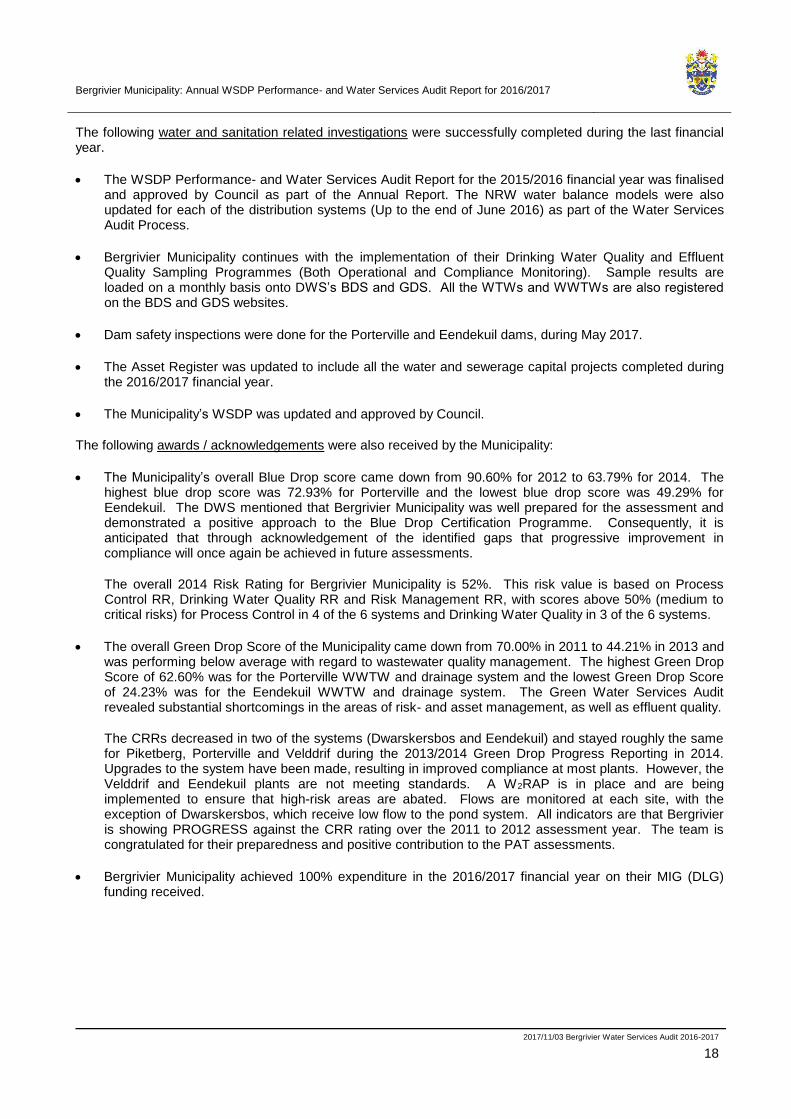
Bergrivier Municipality: Annual WSDP Performance- and Water Services Audit Report for 2016/2017
2017/11/03 Bergrivier Water Services Audit 2016-2017
18
The following water and sanitation related investigations were successfully completed during the last financial year.
• The WSDP Performance- and Water Services Audit Report for the 2015/2016 financial year was finalised and approved by Council as part of the Annual Report. The NRW water balance models were also updated for each of the distribution systems (Up to the end of June 2016) as part of the Water Services Audit Process.
• Bergrivier Municipality continues with the implementation of their Drinking Water Quality and Effluent Quality Sampling Programmes (Both Operational and Compliance Monitoring). Sample results are loaded on a monthly basis onto DWS’s BDS and GDS. All the WTWs and WWTWs are also registered on the BDS and GDS websites.
• Dam safety inspections were done for the Porterville and Eendekuil dams, during May 2017.
• The Asset Register was updated to include all the water and sewerage capital projects completed during the 2016/2017 financial year.
• The Municipality’s WSDP was updated and approved by Council.
The following awards / acknowledgements were also received by the Municipality:
• The Municipality’s overall Blue Drop score came down from 90.60% for 2012 to 63.79% for 2014. The highest blue drop score was 72.93% for Porterville and the lowest blue drop score was 49.29% for Eendekuil. The DWS mentioned that Bergrivier Municipality was well prepared for the assessment and demonstrated a positive approach to the Blue Drop Certification Programme. Consequently, it is anticipated that through acknowledgement of the identified gaps that progressive improvement in compliance will once again be achieved in future assessments.
The overall 2014 Risk Rating for Bergrivier Municipality is 52%. This risk value is based on Process Control RR, Drinking Water Quality RR and Risk Management RR, with scores above 50% (medium to critical risks) for Process Control in 4 of the 6 systems and Drinking Water Quality in 3 of the 6 systems.
• The overall Green Drop Score of the Municipality came down from 70.00% in 2011 to 44.21% in 2013 and was performing below average with regard to wastewater quality management. The highest Green Drop Score of 62.60% was for the Porterville WWTW and drainage system and the lowest Green Drop Score of 24.23% was for the Eendekuil WWTW and drainage system. The Green Water Services Audit revealed substantial shortcomings in the areas of risk- and asset management, as well as effluent quality.
The CRRs decreased in two of the systems (Dwarskersbos and Eendekuil) and stayed roughly the same for Piketberg, Porterville and Velddrif during the 2013/2014 Green Drop Progress Reporting in 2014. Upgrades to the system have been made, resulting in improved compliance at most plants. However, the Velddrif and Eendekuil plants are not meeting standards. A W2RAP is in place and are being implemented to ensure that high-risk areas are abated. Flows are monitored at each site, with the exception of Dwarskersbos, which receive low flow to the pond system. All indicators are that Bergrivier is showing PROGRESS against the CRR rating over the 2011 to 2012 assessment year. The team is congratulated for their preparedness and positive contribution to the PAT assessments.
• Bergrivier Municipality achieved 100% expenditure in the 2016/2017 financial year on their MIG (DLG) funding received.
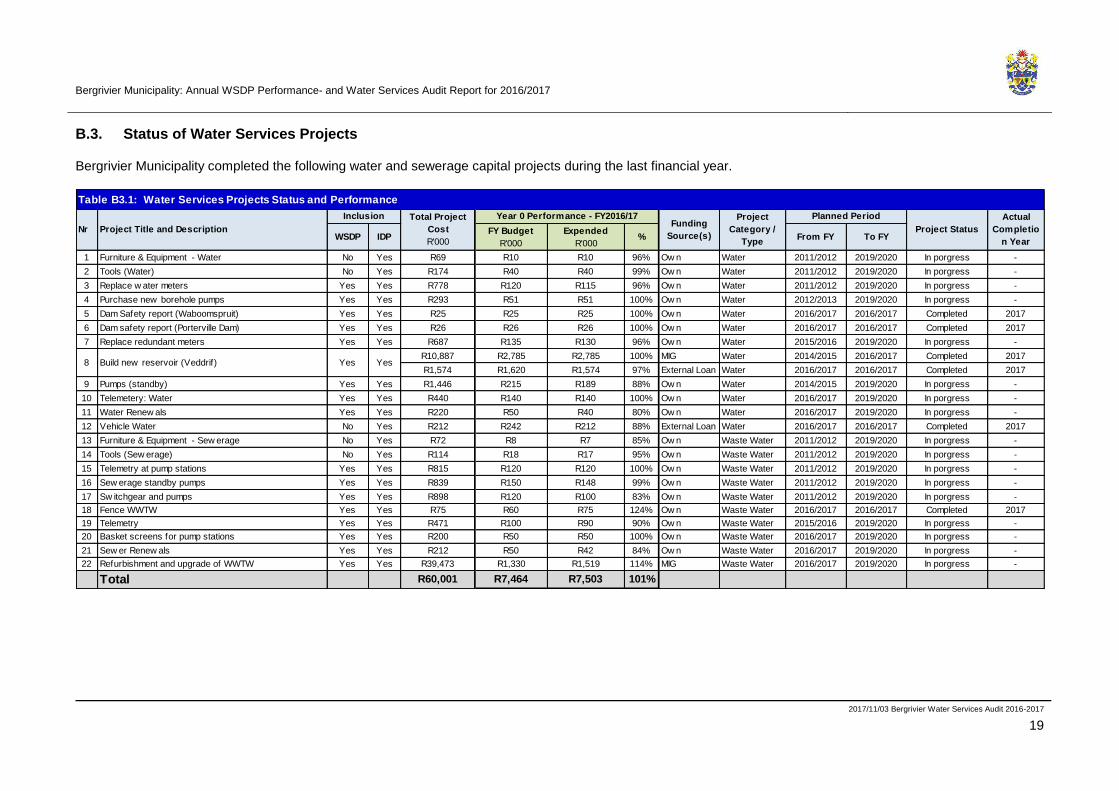
Bergrivier Municipality: Annual WSDP Performance- and Water Services Audit Report for 2016/2017
2017/11/03 Bergrivier Water Services Audit 2016-2017
19
B.3. Status of Water Services Projects
Bergrivier Municipality completed the following water and sewerage capital projects during the last financial year.
WSDP IDPFY Budget
R'000
Expended
R'000% From FY To FY
1 Furniture & Equipment - Water No Yes R69 R10 R10 96% Ow n Water 2011/2012 2019/2020 In porgress -
2 Tools (Water) No Yes R174 R40 R40 99% Ow n Water 2011/2012 2019/2020 In porgress -
3 Replace w ater meters Yes Yes R778 R120 R115 96% Ow n Water 2011/2012 2019/2020 In porgress -
4 Purchase new borehole pumps Yes Yes R293 R51 R51 100% Ow n Water 2012/2013 2019/2020 In porgress -
5 Dam Safety report (Waboomspruit) Yes Yes R25 R25 R25 100% Ow n Water 2016/2017 2016/2017 Completed 2017
6 Dam safety report (Porterville Dam) Yes Yes R26 R26 R26 100% Ow n Water 2016/2017 2016/2017 Completed 2017
7 Replace redundant meters Yes Yes R687 R135 R130 96% Ow n Water 2015/2016 2019/2020 In porgress -
R10,887 R2,785 R2,785 100% MIG Water 2014/2015 2016/2017 Completed 2017
R1,574 R1,620 R1,574 97% External Loan Water 2016/2017 2016/2017 Completed 2017
9 Pumps (standby) Yes Yes R1,446 R215 R189 88% Ow n Water 2014/2015 2019/2020 In porgress -
10 Telemetery: Water Yes Yes R440 R140 R140 100% Ow n Water 2016/2017 2019/2020 In porgress -
11 Water Renew als Yes Yes R220 R50 R40 80% Ow n Water 2016/2017 2019/2020 In porgress -
12 Vehicle Water No Yes R212 R242 R212 88% External Loan Water 2016/2017 2016/2017 Completed 2017
13 Furniture & Equipment - Sew erage No Yes R72 R8 R7 85% Ow n Waste Water 2011/2012 2019/2020 In porgress -
14 Tools (Sew erage) No Yes R114 R18 R17 95% Ow n Waste Water 2011/2012 2019/2020 In porgress -
15 Telemetry at pump stations Yes Yes R815 R120 R120 100% Ow n Waste Water 2011/2012 2019/2020 In porgress -
16 Sew erage standby pumps Yes Yes R839 R150 R148 99% Ow n Waste Water 2011/2012 2019/2020 In porgress -
17 Sw itchgear and pumps Yes Yes R898 R120 R100 83% Ow n Waste Water 2011/2012 2019/2020 In porgress -
18 Fence WWTW Yes Yes R75 R60 R75 124% Ow n Waste Water 2016/2017 2016/2017 Completed 2017
19 Telemetry Yes Yes R471 R100 R90 90% Ow n Waste Water 2015/2016 2019/2020 In porgress -
20 Basket screens for pump stations Yes Yes R200 R50 R50 100% Ow n Waste Water 2016/2017 2019/2020 In porgress -
21 Sew er Renew als Yes Yes R212 R50 R42 84% Ow n Waste Water 2016/2017 2019/2020 In porgress -
22 Refurbishment and upgrade of WWTW Yes Yes R39,473 R1,330 R1,519 114% MIG Waste Water 2016/2017 2019/2020 In porgress -
Total R60,001 R7,464 R7,503 101%
Yes Yes
Table B3.1: Water Services Projects Status and Performance
Project Title and DescriptionNr
Total Project
Cost
R'000
Planned Period
Project Status
Actual
Completio
n Year
Inclusion Funding
Source(s)
Project
Category /
Type
Year 0 Performance - FY2016/17
Build new reservoir (Veddrif)8

Bergrivier Municipality: Annual WSDP Performance- and Water Services Audit Report for 2016/2017
2017/11/03 Bergrivier Water Services Audit 2016-2017
20
B.4. Past Financial Year Water Services Projects Impact Declaration
The impacts of the water and sewerage capital projects, which were implemented by Bergrivier Municipality in the previous financial year, were as follows:
Households Population
1 Furniture & Equipment - Water Other Management Area - - -
2 Tools (Water) Other Management Area - - Ensure adequate operation and maintenance of existing infrastructure.
3 Replace w ater meters WC/WDM Management Area - - Reduce NRW and Water Losses.
4 Purchase new borehole pumps Source Aurora 755 260 Ensure sustainability of ground w ater resources.
5 Dam Safety report (Waboomspruit) Source Eendekuil 1689 418 Ensure dam safety (Risk management).
6 Dam safety report (Porterville Dam) Source Porterville 2100 7602 Ensure dam safety (Risk management).
7 Replace redundant meters WC/WDM Management Area - - Reduce NRW and Water Losses.
8 Build new reservoir (Veddrif) Reservoir Velddrif 4623 14061 Increase reservoir storage capacity.
9 Pumps (standby) Pump Stations Management Area - - Ensure adequate w ater supply and pressure.
10 Telemetery: Water Other Management Area - - Monitoring of w ater levels and w ater usage.
11 Water Renew als Other Management Area - - -
12 Vehicle Water Other Management Area - - Ensure adequate operation of existing infrastructure.
13 Furniture & Equipment - Sew erage Other Management Area - - -
14 Tools (Sew erage) Other Management Area - - Ensure adequate operation and maintenance of existing infrastructure.
15 Telemetry at pump stations Other Management Area - - Monitoring of sew er pump stations.
16 Sew erage standby pumps Pump Stations Management Area - - Ensure adequate pump capacity, in order to prevent any possible spillages.
17 Sw itchgear and pumps Pump Stations Management Area - - Ensure adequate pump capacity, in order to prevent any possible spillages.
18 Fence WWTW WWTW Management Area 251 796 Improve security at Dw arskersbos WWTW.
19 Telemetry Other Management Area - - Monitoring of sew er pump stations and WWTW flow s.
20 Basket screens for pump stations Pump Stations Management Area - - Basket screens for sew er pump stations, in order to prevent blockages and possible spillages.
21 Sew er Renew als Other Management Area - - -
22 Refurbishment and upgrade of WWTW WWTW Porterville 2100 7602 Increase treatment capacity and ensure compliance w ith f inal eff luent quality.
11518 30739TOTAL
Table B.4.1: Past Financial Year Project Impact Declaration
NrNr Beneficiaries
Impact DeclarationSettlements which
benefittedProject CategoryProject Title and Description
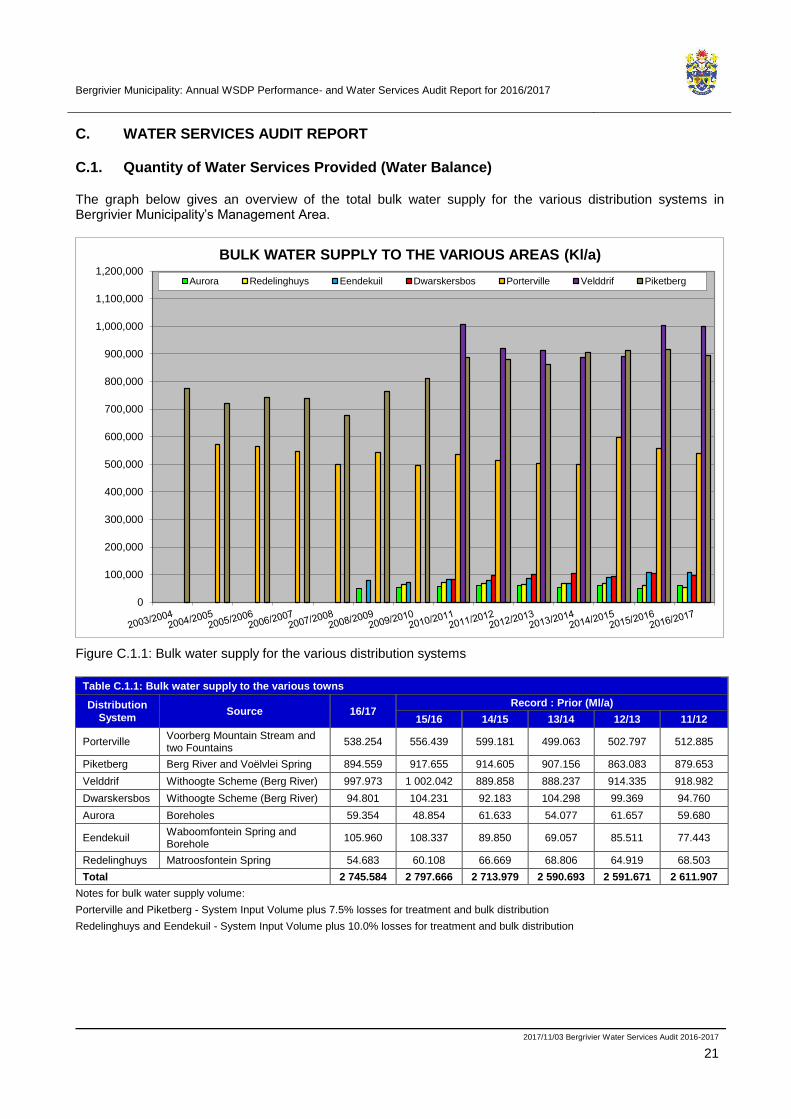
Bergrivier Municipality: Annual WSDP Performance- and Water Services Audit Report for 2016/2017
2017/11/03 Bergrivier Water Services Audit 2016-2017
21
C. WATER SERVICES AUDIT REPORT
C.1. Quantity of Water Services Provided (Water Balance)
The graph below gives an overview of the total bulk water supply for the various distribution systems in Bergrivier Municipality’s Management Area.
0
100,000
200,000
300,000
400,000
500,000
600,000
700,000
800,000
900,000
1,000,000
1,100,000
1,200,000
BULK WATER SUPPLY TO THE VARIOUS AREAS (Kl/a)
Aurora Redelinghuys Eendekuil Dwarskersbos Porterville Velddrif Piketberg
Figure C.1.1: Bulk water supply for the various distribution systems
Table C.1.1: Bulk water supply to the various towns
Distribution
System Source 16/17
Record : Prior (Ml/a)
15/16 14/15 13/14 12/13 11/12
Porterville Voorberg Mountain Stream and two Fountains
538.254 556.439 599.181 499.063 502.797 512.885
Piketberg Berg River and Voëlvlei Spring 894.559 917.655 914.605 907.156 863.083 879.653
Velddrif Withoogte Scheme (Berg River) 997.973 1 002.042 889.858 888.237 914.335 918.982
Dwarskersbos Withoogte Scheme (Berg River) 94.801 104.231 92.183 104.298 99.369 94.760
Aurora Boreholes 59.354 48.854 61.633 54.077 61.657 59.680
Eendekuil Waboomfontein Spring and Borehole
105.960 108.337 89.850 69.057 85.511 77.443
Redelinghuys Matroosfontein Spring 54.683 60.108 66.669 68.806 64.919 68.503
Total 2 745.584 2 797.666 2 713.979 2 590.693 2 591.671 2 611.907
Notes for bulk water supply volume:
Porterville and Piketberg - System Input Volume plus 7.5% losses for treatment and bulk distribution
Redelinghuys and Eendekuil - System Input Volume plus 10.0% losses for treatment and bulk distribution

Bergrivier Municipality: Annual WSDP Performance- and Water Services Audit Report for 2016/2017
2017/11/03 Bergrivier Water Services Audit 2016-2017
22
The table below gives an overview of the quantity of water services provided / water balance for all the distribution systems in Bergrivier Municipality’s Management Area.
Year 0 Year - 1 Year - 2 Year 0 Year - 1 Year - 2
FY2016/17 FY2015/16 FY2014/15 FY2016/17 FY2015/16 FY2014/15
RAW WATER
7.2.1 Surface water purchased 0 0 0 0.00 0.00 0.00
7.1 / 7.2.2 Surface water abstracted 2,686,230 2,748,812 2,652,346 7.36 7.53 7.27
7.1 / 7.2.3 Ground water abstracted 59,354 48,854 61,633 0.16 0.13 0.17
7.2.14 Effluent recycled 0 0 0 0.00 0.00 0.00
7.2.4less Raw water supplied to
others0 0 0 0.00 0.00 0.00
7.2.5 Sub-Total: Raw Water supplied2,745,584 2,797,666 2,713,979 7.52 7.66 7.44
10.2 (g) (i) BULK WATER SUPPLY
7.2.6 Volume of water treated 1,519,765 1,553,092 1,582,689 4.16 4.26 4.34
7.2.7 10.2 (a) (ii) Purchased treated water 1,092,774 1,106,273 982,041 2.99 3.03 2.69
7.2.7A Ground water not treated 0 0 0 0.00 0.00 0.00
7.2.6Aless Treated water supplied to
others0 0 0 0.00 0.00 0.00
Sub-Total: System Input
Volume2,612,539 2,659,365 2,564,730 7.16 7.29 7.03
WATER CONSUMPTION
7.2.8.1 Billed Metered: 2,327,843 2,336,721 2,176,447 6.38 6.40 5.96
10.2 (a) (i) Domestic
10.2 (a) (i) Commercial
10.2 (a) (i) Industrial 46,200 52,301 66,954 0.13 0.14 0.18
10.2 (a) (i) Municipal, Others & Farms 360,966 363,800 304,020 0.99 1.00 0.83
7.2.8.2 Billed Unmetered 0 0 0 0.00 0.00 0.00
10.2 (a) (i) Domestic 0 0 0 0.00 0.00 0.00
10.2 (a) (i) Commercial 0 0 0 0.00 0.00 0.00
10.2 (a) (i) Industrial 0 0 0 0.00 0.00 0.00
10.2 (a) (i) Municipal, Others & Farms 0 0 0 0.00 0.00 0.00
7.2.8.3 Unbilled Metered 0 0 0 0.00 0.00 0.00
7.2.8.4 Unbilled Unmetered 5,225 5,319 5,129 0.01 0.01 0.01
10.2 (g) (i)Sub-Total: Authorized
consumption2,333,068 2,342,040 2,181,576 6.39 6.42 5.98
UNACCOUNTED FOR WATER
7.3.1 Raw water bulk loss 1,225,819 1,244,574 1,131,290 3.36 3.41 3.10
7.2.3/7.2.4 Billing losses 5,225 5,319 5,129 0.01 0.01 0.01
7.2.5 Apparent losses 36,331 41,252 49,810 0.10 0.11 0.14
7.2.5.1 Illegal connections 5,589 6,347 7,663 0.02 0.02 0.02
7.2.5.2 Inaccurate meters 27,947 31,733 38,315 0.08 0.09 0.10
7.2.5.3 Data errors 2,795 3,173 3,832 0.01 0.01 0.01
7.2.6 Real losses 243,140 276,073 333,344 0.67 0.76 0.91
10.2 (g) (ii)Sub-Total: Unaccounted for
water279,471 317,325 383,154 0.77 0.87 1.05
WASTEWATER TREATMENT
7.2.9 10.2 (a) (iii) Total received at WWTW 1,485,234 1,460,230 1,430,095 4.07 4.00 3.92
7.2.11 Total discharged 1,226,403 1,179,382 1,156,208 3.36 3.23 3.17
7.2.13 Returned to environment 803,668 752,676 717,540 2.20 2.06 1.97
7.2.14 Recycled 422,735 426,706 438,668 1.16 1.17 1.20
10.2 (a) (iv)Quantity of water supplied
not discharged to WWTWs847,834 881,810 751,481 2.32 2.42 2.06
1,920,677 1,920,620 1,805,473 5.26 5.26 4.95
Table C.1.2: Quantity of Water Services Provided / Water Balance
m3 per annum Ml/dWSDP
Ref. #
Regulation
s Ref. #Description

Bergrivier Municipality: Annual WSDP Performance- and Water Services Audit Report for 2016/2017
2017/11/03 Bergrivier Water Services Audit 2016-2017
23
0
500,000
1,000,000
1,500,000
2,000,000
Domestic &Commercial
Industrial Municipal, Others &Farms
Unaccounted forwater
1,9
20
,67
7
46
,20
0 36
0,9
66
27
9,4
71
1,9
20
,62
0
52
,30
1 36
3,8
00
31
7,3
25
1,8
05
,47
3
66
,95
4
30
4,0
20
38
3,1
54
Qty
of
wat
er
(m3
per
an
nu
m)
Sector
Qty of Water use per sector
2016/2017 2015/2016 2014/2015
Figure C.1.2: Quantity of water services provided / water balance
Graphs of the water usage per sector for the various distribution systems within Bergrivier Municipality’s Management Area are included as part of the water balance models in Annexure A. The table below gives a summary of the information (Billed Metered Consumption).
Table C.1.3: Quantity of water used by each user sector (Ml/a)
Town Year Residential &
Commercial Industrial Municipal Other Farms Total
Porterville
10/11 350.457 0.000 48.111 27.945 0.000 426.513
11/12 343.145 0.000 29.762 23.551 0.000 396.458
12/13 348.739 0.000 35.899 23.090 0.000 407.728
13/14 344.642 0.000 34.259 18.544 0.000 397.445
14/15 369.694 0.000 47.415 14.393 0.000 431.502
15/16 344.709 0.000 50.295 22.311 0.000 417.315
16/17 336.796 0.000 42.003 21.785 0.000 400.584
Piketberg
10/11 556.872 46.645 77.427 27.713 33.740 742.397
11/12 529.574 46.091 36.341 27.356 16.383 655.745
12/13 535.191 52.164 36.869 23.713 12.834 660.771
13/14 537.741 59.737 40.672 24.841 4.190 667.181
14/15 576.465 66.681 92.816 30.724 3.368 770.054
15/16 549.345 51.974 116.572 29.556 23.152 770.599
16/17 515.156 45.827 96.779 30.060 44.632 732.454
Velddrif
10/11 732.709 0.000 88.182 2.651 0.000 823.542
11/12 771.785 0.000 77.721 3.332 0.000 852.838
12/13 734.087 0.000 93.591 3.904 0.000 831.582
13/14 712.122 0.000 90.847 4.358 0.000 807.327
14/15 653.515 0.000 71.219 6.577 0.000 731.311
15/16 816.634 0.000 71.283 10.271 0.000 898.188
16/17 866.968 0.000 71.051 15.339 0.000 953.358
Dwarskersbos
10/11 73.205 0.000 2.693 0.000 0.000 75.898
11/12 86.991 0.000 2.973 0.000 0.000 89.964
12/13 78.524 0.000 3.464 0.000 0.000 81.988
13/14 93.539 0.000 2.953 0.000 0.000 96.492
14/15 89.800 0.000 2.456 0.000 0.000 92.256
15/16 93.713 0.000 5.658 0.000 0.000 99.371
16/17 88.454 0.000 6.175 0.000 0.000 94.629

Bergrivier Municipality: Annual WSDP Performance- and Water Services Audit Report for 2016/2017
2017/11/03 Bergrivier Water Services Audit 2016-2017
24
Table C.1.3: Quantity of water used by each user sector (Ml/a)
Town Year Residential &
Commercial Industrial Municipal Other Farms Total
Aurora
10/11 33.858 0.000 12.620 0.000 0.000 46.478
11/12 33.797 0.000 11.796 0.000 0.000 45.593
12/13 33.606 0.000 6.500 0.000 0.000 40.106
13/14 31.227 0.000 5.880 0.000 0.000 37.107
14/15 37.690 0.000 7.268 0.000 0.000 44.958
15/16 38.065 0.000 7.631 0.000 0.000 45.696
16/17 32.060 0.000 8.688 0.000 0.000 40.748
Eendekuil
10/11 48.095 0.449 2.120 2.223 21.222 74.109
11/12 45.515 0.261 2.321 1.524 19.977 69.598
12/13 43.612 0.314 1.966 2.572 21.463 69.927
13/14 44.863 0.271 2.043 2.107 20.319 69.603
14/15 45.796 0.273 1.201 4.228 16.783 68.281
15/16 49.237 0.327 1.459 4.132 16.053 71.208
16/17 50.401 0.373 2.294 1.893 12.953 67.914
Redelinghuys
10/11 33.419 0.000 0.000 10.088 0.000 43.507
11/12 30.244 0.000 0.000 6.589 0.000 36.833
12/13 28.967 0.000 0.000 6.146 0.000 35.113
13/14 31.122 0.000 0.000 6.272 0.000 37.394
14/15 32.513 0.000 0.055 5.517 0.000 38.085
15/16 28.917 0.000 0.157 5.270 0.000 34.344
16/17 30.842 0.000 0.191 7.123 0.000 38.156
TOTAL
10/11 1 828.615 47.094 231.153 70.620 54.962 2 232.444
11/12 1 841.051 46.352 160.914 62.352 36.360 2 147.029
12/13 1 802.726 52.478 178.289 59.425 34.297 2 127.215
13/14 1 795.256 60.008 176.654 56.122 24.509 2 112.549
14/15 1 805.473 66.954 222.430 61.439 20.151 2 176.447
15/16 1 920.620 52.301 253.055 71.540 39.205 2 336.721
16/17 1 920.677 46.200 227.181 76.200 57.585 2 327.843
Quantity of effluent received at the WWTWs (Ml/a):
The influent received at the Porterville-, Piketberg-, Eendekuil- and Velddrif WWTW is metered. The influent received at the Dwarskersbos WWTW is not metered and was therefore calculated as a percentage of the billed metered consumption data. The hydraulic and organic design capacities of the various WWTWs and the monthly flows and organic loads at the various plants, as well as the rainfall are included in Annexure A. The table below gives an overview of the annual volume of effluent received at the various WWTWs.
Table C.1.4: Quantity of effluent received at the various WWTWs
WWTWs % of Billed Metered
Consumption 16/17
Record : Prior (Ml/a)
15/16 14/15 13/14 12/13
Porterville NA - Metered 250.359 230.070 258.434 270.415 248.651
Piketberg NA - Metered 887.273 888.253 894.507 947.965 883.466
Velddrif NA - Metered 287.420 277.040 214.727 216.150 213.765
Eendekuil NA - Metered 3.405 5.244 7.073 6.960 6.993
Dwarskersbos 60% 56.777 59.623 55.354 57.895 49.193
Total 1 485.234 1 460.230 1 430.095 1 499.385 1 402.068
Note: Estimated from billed metered data

Bergrivier Municipality: Annual WSDP Performance- and Water Services Audit Report for 2016/2017
2017/11/03 Bergrivier Water Services Audit 2016-2017
25
Quantity of treated effluent returned to the water resource system:
The quantity of effluent treated by industrial consumers on their own premises and re-used by them is not known at this stage. All effluent discharged into the Municipal sewer system is however treated at the existing WWTWs and the current effluent re-used practices are as follows:
Table C.1.5: Current effluent re-used practices at the various WWTWs
WWTWs Current effluent re-used practices
Porterville On-site stream leading to farmer’s irrigation dam
Piketberg Irrigation of town sport fields: Cricket, Rugby and Soccer and golf course. Irrigation of school fields.
Velddrif Irrigation of Rugby field, Golf course, Cricket field and Bowls field (Licence number: 12/9/11/L436/9 - section 5)
Eendekuil Evaporate, but final effluent also run-off to farm dam for irrigation purposes
Dwarskersbos Evaporate, but final effluent can also be pumped to farm for irrigation purposes
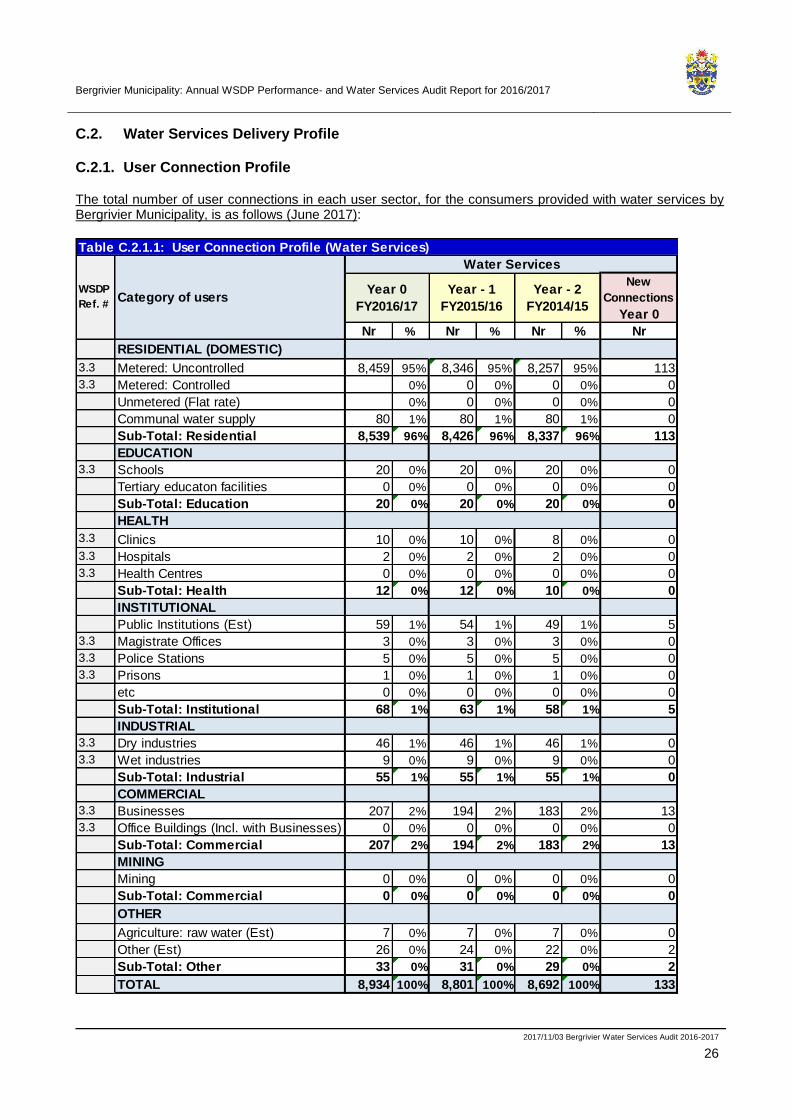
Bergrivier Municipality: Annual WSDP Performance- and Water Services Audit Report for 2016/2017
2017/11/03 Bergrivier Water Services Audit 2016-2017
26
C.2. Water Services Delivery Profile
C.2.1. User Connection Profile
The total number of user connections in each user sector, for the consumers provided with water services by Bergrivier Municipality, is as follows (June 2017):
New
Connections
Year 0
Nr % Nr % Nr % Nr
RESIDENTIAL (DOMESTIC)
3.3 Metered: Uncontrolled 8,459 95% 8,346 95% 8,257 95% 113
3.3 Metered: Controlled 0% 0 0% 0 0% 0
Unmetered (Flat rate) 0% 0 0% 0 0% 0
Communal water supply 80 1% 80 1% 80 1% 0
Sub-Total: Residential 8,539 96% 8,426 96% 8,337 96% 113
EDUCATION
3.3 Schools 20 0% 20 0% 20 0% 0
Tertiary educaton facilities 0 0% 0 0% 0 0% 0
Sub-Total: Education 20 0% 20 0% 20 0% 0
HEALTH
3.3 Clinics 10 0% 10 0% 8 0% 0
3.3 Hospitals 2 0% 2 0% 2 0% 0
3.3 Health Centres 0 0% 0 0% 0 0% 0
Sub-Total: Health 12 0% 12 0% 10 0% 0
INSTITUTIONAL
Public Institutions (Est) 59 1% 54 1% 49 1% 5
3.3 Magistrate Offices 3 0% 3 0% 3 0% 0
3.3 Police Stations 5 0% 5 0% 5 0% 0
3.3 Prisons 1 0% 1 0% 1 0% 0
etc 0 0% 0 0% 0 0% 0
Sub-Total: Institutional 68 1% 63 1% 58 1% 5
INDUSTRIAL
3.3 Dry industries 46 1% 46 1% 46 1% 0
3.3 Wet industries 9 0% 9 0% 9 0% 0
Sub-Total: Industrial 55 1% 55 1% 55 1% 0
COMMERCIAL
3.3 Businesses 207 2% 194 2% 183 2% 13
3.3 Office Buildings (Incl. with Businesses) 0 0% 0 0% 0 0% 0
Sub-Total: Commercial 207 2% 194 2% 183 2% 13
MINING
Mining 0 0% 0 0% 0 0% 0
Sub-Total: Commercial 0 0% 0 0% 0 0% 0
OTHER
Agriculture: raw water (Est) 7 0% 7 0% 7 0% 0
Other (Est) 26 0% 24 0% 22 0% 2
Sub-Total: Other 33 0% 31 0% 29 0% 2
TOTAL 8,934 100% 8,801 100% 8,692 100% 133
Table C.2.1.1: User Connection Profile (Water Services)
WSDP
Ref. #Category of users
Year 0
FY2016/17
Water Services
Year - 1
FY2015/16
Year - 2
FY2014/15

Bergrivier Municipality: Annual WSDP Performance- and Water Services Audit Report for 2016/2017
2017/11/03 Bergrivier Water Services Audit 2016-2017
27
0
1,000
2,000
3,000
4,000
5,000
6,000
7,000
8,000
9,000
Residential Education Health Institutional Industrial Commercial Mining Other
Nu
mb
er
of
con
ne
ctio
ns
Sector
User Connection Profile: Water
2016/2017 2015/2016 2014/2015
Figure C.2.1.1: User connection profile for water
96%
0%0%
1%
1% 2% 0%
0%
User Connection Profile: Water - 2016/2017
Residential
Education
Health
Institutional
Industrial
Commercial
Mining
Other
Figure C.2.1.2: User connection distribution for water – Year 2016/2017
0 20 40 60 80 100 120
Residential
Education
Health
Institutional
Industrial
Commercial
Mining
Other
Number of new connections
Sect
or
Number of new connections: Water - 2016/2017
Figure C.2.1.3: Number of new water connections provided during 2016/2017
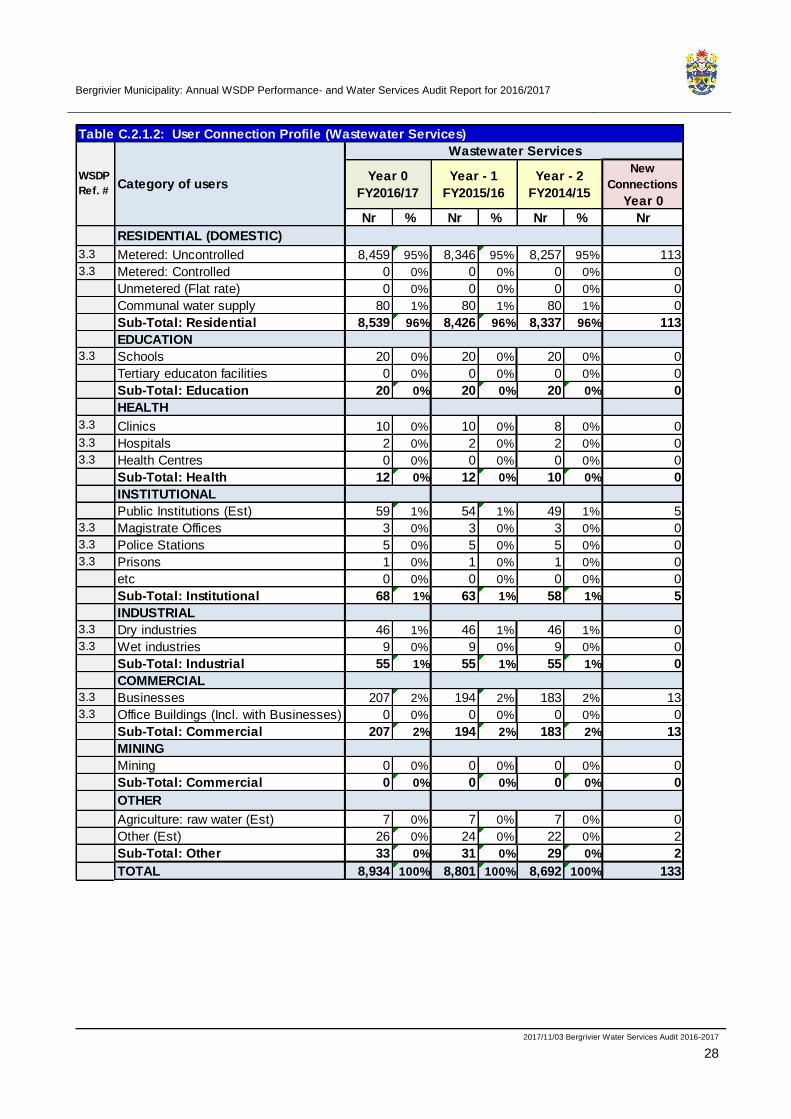
Bergrivier Municipality: Annual WSDP Performance- and Water Services Audit Report for 2016/2017
2017/11/03 Bergrivier Water Services Audit 2016-2017
28
New
Connections
Year 0
Nr % Nr % Nr % Nr
RESIDENTIAL (DOMESTIC)
3.3 Metered: Uncontrolled 8,459 95% 8,346 95% 8,257 95% 113
3.3 Metered: Controlled 0 0% 0 0% 0 0% 0
Unmetered (Flat rate) 0 0% 0 0% 0 0% 0
Communal water supply 80 1% 80 1% 80 1% 0
Sub-Total: Residential 8,539 96% 8,426 96% 8,337 96% 113
EDUCATION
3.3 Schools 20 0% 20 0% 20 0% 0
Tertiary educaton facilities 0 0% 0 0% 0 0% 0
Sub-Total: Education 20 0% 20 0% 20 0% 0
HEALTH
3.3 Clinics 10 0% 10 0% 8 0% 0
3.3 Hospitals 2 0% 2 0% 2 0% 0
3.3 Health Centres 0 0% 0 0% 0 0% 0
Sub-Total: Health 12 0% 12 0% 10 0% 0
INSTITUTIONAL
Public Institutions (Est) 59 1% 54 1% 49 1% 5
3.3 Magistrate Offices 3 0% 3 0% 3 0% 0
3.3 Police Stations 5 0% 5 0% 5 0% 0
3.3 Prisons 1 0% 1 0% 1 0% 0
etc 0 0% 0 0% 0 0% 0
Sub-Total: Institutional 68 1% 63 1% 58 1% 5
INDUSTRIAL
3.3 Dry industries 46 1% 46 1% 46 1% 0
3.3 Wet industries 9 0% 9 0% 9 0% 0
Sub-Total: Industrial 55 1% 55 1% 55 1% 0
COMMERCIAL
3.3 Businesses 207 2% 194 2% 183 2% 13
3.3 Office Buildings (Incl. with Businesses) 0 0% 0 0% 0 0% 0
Sub-Total: Commercial 207 2% 194 2% 183 2% 13
MINING
Mining 0 0% 0 0% 0 0% 0
Sub-Total: Commercial 0 0% 0 0% 0 0% 0
OTHER
Agriculture: raw water (Est) 7 0% 7 0% 7 0% 0
Other (Est) 26 0% 24 0% 22 0% 2
Sub-Total: Other 33 0% 31 0% 29 0% 2
TOTAL 8,934 100% 8,801 100% 8,692 100% 133
Table C.2.1.2: User Connection Profile (Wastewater Services)
WSDP
Ref. #Category of users
Year 0
FY2016/17
Wastewater Services
Year - 1
FY2015/16
Year - 2
FY2014/15

Bergrivier Municipality: Annual WSDP Performance- and Water Services Audit Report for 2016/2017
2017/11/03 Bergrivier Water Services Audit 2016-2017
29
0
1,000
2,000
3,000
4,000
5,000
6,000
7,000
8,000
9,000
Residential Education Health Institutional Industrial Commercial Mining Other
Nu
mb
er
of
con
ne
ctio
ns
Sector
User Connection Profile: Wastewater
2016/2017 2015/2016 2014/2015
Figure C.2.1.4: User connection profile for wastewater
96%
0%0%
1%
1% 2% 0%0%
User Connection Profile: Wastewater - 2016/2017
Residential
Education
Health
Institutional
Industrial
Commercial
Mining
Other
Figure C.2.1.5: User connection distribution for wastewater – Year 2016/2017
0 20 40 60 80 100 120
Residential
Education
Health
Institutional
Industrial
Commercial
Mining
Other
Number of new connections
Sect
or
Number of new connections: Wastewater - 2016/2017
Figure C.2.1.6: Number of new wastewater connections provided during 2016/2017

Bergrivier Municipality: Annual WSDP Performance- and Water Services Audit Report for 2016/2017
2017/11/03 Bergrivier Water Services Audit 2016-2017
30
The number of user connections in each user sector, for the various distribution systems in Bergrivier Municipality’s Management Area, is as follows:
Table C.2.1.3: Number of user connections in each user sector per town
Town Year Residential and Commercial Industrial Total
Porterville
13/14 1 589 - 1 589
14/15 1 595 - 1 595
15/16 1 588 - 1 588
16/17 1 656 - 1 656
Piketberg
13/14 2 441 50 2 491
14/15 2 512 53 2 565
15/16 2 500 54 2 554
16/17 2 462 53 2 515
Velddrif
13/14 3 228 - 3 228
14/15 3 288 - 3 288
15/16 3 373 - 3 373
16/17 3 467 - 3 467
Dwarskersbos
13/14 353 - 353
14/15 373 - 373
15/16 406 - 406
16/17 423 - 423
Aurora
13/14 250 - 250
14/15 251 - 251
15/16 252 - 252
16/17 250 - 250
Eendekuil
13/14 343 4 347
14/15 349 4 353
15/16 350 5 355
16/17 345 5 350
Redelinghuys
13/14 182 - 182
14/15 187 - 187
15/16 193 - 193
16/17 193 - 193
TOTAL
13/14 8 386 54 8 440
14/15 8 555 57 8 612
15/16 8 662 59 8 721
16/17 8 796 58 8 854
Table C.2.1.4: Total number of consumer units per town and percentage annual growth from 2013/2014 to 2016/2017
Distribution System Annual Growth % (13/14 – 16/17) 16/17 15/16 14/15 13/14
Porterville 1.39% 1 656 1 588 1 595 1 589
Piketberg 0.32% 2 515 2 554 2 565 2 491
Velddrif 2.41% 3 467 3 373 3 288 3 228
Dwarskersbos 6.22% 423 406 373 353
Aurora 0.00% 250 252 251 250
Eendekuil 0.29% 350 355 353 347
Redelinghuys 1.98% 193 193 187 182
TOTALS 1.61% 8 854 8 721 8 612 8 440
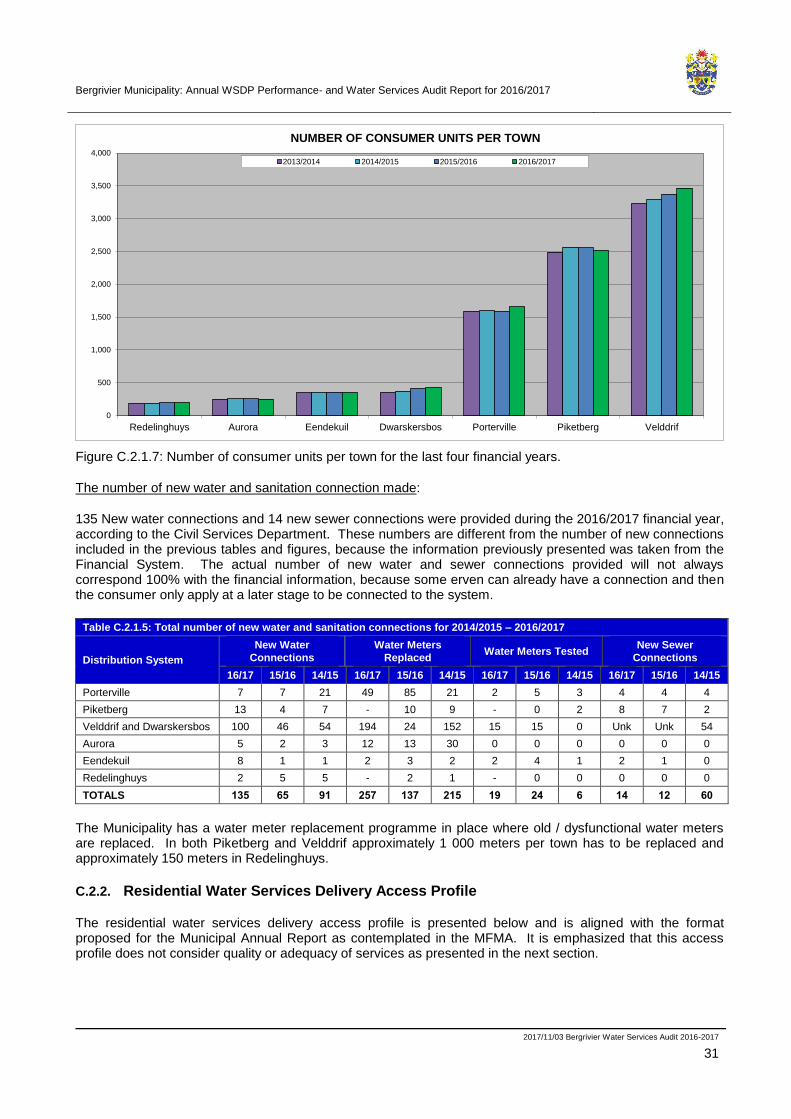
Bergrivier Municipality: Annual WSDP Performance- and Water Services Audit Report for 2016/2017
2017/11/03 Bergrivier Water Services Audit 2016-2017
31
0
500
1,000
1,500
2,000
2,500
3,000
3,500
4,000
Redelinghuys Aurora Eendekuil Dwarskersbos Porterville Piketberg Velddrif
NUMBER OF CONSUMER UNITS PER TOWN
2013/2014 2014/2015 2015/2016 2016/2017
Figure C.2.1.7: Number of consumer units per town for the last four financial years.
The number of new water and sanitation connection made:
135 New water connections and 14 new sewer connections were provided during the 2016/2017 financial year, according to the Civil Services Department. These numbers are different from the number of new connections included in the previous tables and figures, because the information previously presented was taken from the Financial System. The actual number of new water and sewer connections provided will not always correspond 100% with the financial information, because some erven can already have a connection and then the consumer only apply at a later stage to be connected to the system.
Table C.2.1.5: Total number of new water and sanitation connections for 2014/2015 – 2016/2017
Distribution System
New Water
Connections
Water Meters
Replaced Water Meters Tested
New Sewer
Connections
16/17 15/16 14/15 16/17 15/16 14/15 16/17 15/16 14/15 16/17 15/16 14/15
Porterville 7 7 21 49 85 21 2 5 3 4 4 4
Piketberg 13 4 7 - 10 9 - 0 2 8 7 2
Velddrif and Dwarskersbos 100 46 54 194 24 152 15 15 0 Unk Unk 54
Aurora 5 2 3 12 13 30 0 0 0 0 0 0
Eendekuil 8 1 1 2 3 2 2 4 1 2 1 0
Redelinghuys 2 5 5 - 2 1 - 0 0 0 0 0
TOTALS 135 65 91 257 137 215 19 24 6 14 12 60
The Municipality has a water meter replacement programme in place where old / dysfunctional water meters are replaced. In both Piketberg and Velddrif approximately 1 000 meters per town has to be replaced and approximately 150 meters in Redelinghuys.
C.2.2. Residential Water Services Delivery Access Profile
The residential water services delivery access profile is presented below and is aligned with the format proposed for the Municipal Annual Report as contemplated in the MFMA. It is emphasized that this access profile does not consider quality or adequacy of services as presented in the next section.

Bergrivier Municipality: Annual WSDP Performance- and Water Services Audit Report for 2016/2017
2017/11/03 Bergrivier Water Services Audit 2016-2017
32
All the formal households in the urban areas of Bergrivier Municipality’s Management Area are provided with water connections inside the erven. Informal areas are supplied with shared services as an intermediary measure. Bergrivier Municipality is committed to work with the private landowners to ensure that at least basic water and sanitation services are provided to those households in the rural areas with existing services still below RDP standard.
The table below gives an overview of the residential water services delivery access profile of Bergrivier Municipality.
Nr % Nr % Nr %
WATER (ABOVE MIN LEVEL)
Piped (tap) water inside dwelling/institution House connections 14,599 78% 14,474 80% 14,120 80%
Piped (tap) water inside yard Yard connections 3,735 20% 3,397 19% 3,291 19%
Piped (tap) water on community stand: distance less
than 200m from dwelling/institution
Standpipe connection
< 200 m208 1% 208 1% 208 1%
Sub-Total: Minimum Serivce
Level and Above18,542 99% 18,079 99% 17,619 99%
WATER (BELOW MIN LEVEL)
Piped (tap) water on community stand: distance
between 200m and 500m from dwelling/institution
Standpipe connection:
> 200 m < 500 m12 0% 12 0% 12 0%
Piped (tap) water on community stand: distance
between 500m and 1000m (1km) from dwelling
/institution
Standpipe connection:
> 500 m < 1 000 m5 0% 5 0% 5 0%
Piped (tap) water on community stand: distance
greater than 1000m (1km) from dwelling/institution
Standpipe connection:
> 1 000 m6 0% 6 0% 6 0%
No access to piped (tap) water No services 76 0% 76 0% 76 0%
Sub-Total: Below Minimum
Service Level99 1% 99 1% 99 1%
Total number of households 18,641 100% 18,178 100% 17,718 100%
Table C.2.2.1: Residential Water Services Delivery Access Profile: Water
DescriptionCensus Category
Year 0
FY2016/17
Year - 1
FY2015/16
Year - 1
FY2014/15
0.0%
20.0%
40.0%
60.0%
80.0%
100.0%
HH's with access to piped water HH's with access to communalwater points*
HH's below minimum servicelevel
Pro
pe
rio
n o
f h
ou
seh
old
s
Access to Water
2016/2017 2015/2016 2014/2015
Figure C.2.2.1: Household water access profile
Number of households provided with water through communal water services:
All the households in the urban areas are supplied with water connections inside the houses, except 80 households in Velddrif that still make use of communal services. Informal areas are supplied with shared services as an intermediary measure. The only other areas where communal water services are currently still in use is on some of the farms in the rural areas.

Bergrivier Municipality: Annual WSDP Performance- and Water Services Audit Report for 2016/2017
2017/11/03 Bergrivier Water Services Audit 2016-2017
33
The existing residential water service levels in Bergrivier Municipality’s Management Area are estimated as follows:
Table C.2.2.2: Residential water service levels (Residential Consumer Units)
Service Level Piketberg Porterville Velddrif Dwarskersbos Aurora Wittewater Redelinghuys Eendekuil Goedverwacht Farms Total
No Water Services 0 0 0 0 0 2 2) 0 0 0 74 2) 76
Below RDP: Infrastructure Upgrade 0 0 0 0 0 0 0 0 0 0 0
Below RDP: Infrastructure Extension
0 0 0 0 0 0 0 0 0 23 3) 23
Below RDP: Infrastructure Refurbishment
0 0 0 0 0 0 0 0 0 0 0
Below RDP: O&M Needs 0 0 0 0 0 0 0 0 0 0 0
Below RDP: Water Resource Needs 0 0 0 0 0 0 0 0 0 0 0
Below RDP: Infrastructure and O&M Needs
0 0 0 0 0 0 0 0 0 0 0
Below RDP: Infrastructure, O&M and Water Resource Needs
0 0 0 0 0 0 0 0 0 0 0
Total Basic Need (RDP) 0 0 0 0 0 2 0 0 0 97 99
Below Housing Interim 4) 0 0 0 0 0 0 0 0 0 0 0
Adequate Housing Permanent 5) 0 0 80 0 0 0 0 0 0 0 80
Total Housing Need 0 0 80 0 0 0 0 0 0 0 80
Standpipes 0 0 0 0 0 2 0 0 2 124 128
Yard Connections 6) 821 518 1 231 0 21 0 0 84 0 1 060 3 735
House Connections 1) 2 403 1 582 3 312 404 239 191 184 334 593 5 357 14 599
Total Adequate 3 224 2 100 4 543 404 260 193 184 418 595 6 541 18 462
Total per Area 3 224 2 100 4 623 404 260 195 184 418 595 6 638 18 641
Notes: 1) Number of residential consumer units for the various towns for 2016/2017, as calculated from the financial data. The estimated number of commercial units was subtracted from the total number of consumer units, in order to calculate the residential consumer units per town.
2) Census 2011: Number of households with no access to piped (tap) water 74 and 2
3) Census 2011: Number of households with communal services (200m – 500m) 12, (500m – 1000m) 5 and (>1000m) 6.
4) Below Housing Interim in the above table is the number of shacks in informal areas without basic water services.
5) Adequate Housing Permanent in the above table is the number of shacks in informal areas with communal water services, as confirmed by the Municipality.
6) Projected number of residential households (2016/2017) – Number of residential consumers units (2016/2017) = Estimated number of backyard dwellers

Bergrivier Municipality: Annual WSDP Performance- and Water Services Audit Report for 2016/2017
2017/11/03 Bergrivier Water Services Audit 2016-2017
34
The Municipality provides sanitation services to all towns in its area of jurisdiction with the exception of Goedverwacht, Wittewater and De Hoek, which are private towns. All the urban households within the Municipality’s area of jurisdiction have access to minimum sanitation service levels. Eighty households in Velddrif make use of communal water borne sanitation facilities. These households are included in the Municipality’s “housing pipeline” and individual services per household will be accommodated in a new residential development. The table below gives an overview of the residential sanitation services delivery access profile of Bergrivier Municipality.
Nr % Nr % Nr %
SANITATION (ABOVE MIN LEVEL)
Waterborne 9,288 50% 8,953 49% 8,609 49%
Waterborne: Low Flush 0 0% 0 0% 0 0%
Flush toilet (with septic tank) Septic tanks / Conservancy 8,062 43% 7,934 44% 7,818 44%
Chemical toilet 35 0% 35 0% 35 0%
Pit toilet with ventilation (VIP) 83 0% 83 0% 83 0%
Other / Communal Services 80 0% 80 0% 80 0%
Sub-Total: Minimum Serivce Level
and Above17,548 94% 17,085 94% 16,625 94%
SANITATION (BELOW MIN LEVEL)
Pit toilet without ventilation Pit toilet 36 0% 36 0% 36 0%
Bucket toilet Bucket toilet 177 1% 177 1% 177 1%
Other toilet provision (below min. service level Other 364 2% 364 2% 364 2%
No toilet provisions No services 516 3% 516 3% 516 3%
Sub-Total: Below Minimum Service
Level1,093 6% 1,093 6% 1,093 6%
Total number of households 18,641 100% 18,178 100% 17,718 100%
Table C.2.2.3: Residential Water Services Delivery Access Profile: Sanitation
Year - 1
FY2014/15
Flush toilet (connected to sewerage system)
Non-waterborne (above min. service level)
Census Category Description
Year 0
FY2016/17
Year - 1
FY2015/16
0%
20%
40%
60%
80%
100%
HH's with access to flush toilets HH's with access to on-sitetoilets (above min. service level)
HH's below minimum servicelevel
Pro
pe
rio
n o
f h
ou
seh
old
s
Access to Sanitation
2016/2017 2015/2016 2014/2015
Figure C.2.2.2: Household sanitation access profile
Bergrivier Municipality: Annual WSDP Performance- and Water Services Audit Report for 2016/2017
2017/11/03 Bergrivier Water Services Audit 2016-2017
35
The Municipality upgraded their WWTWs and sewer networks in order to provide a better quality of effluent and to increase the capacity of the WWTWs to accommodate the future developments, subject to available funding. One of the most recent projects is the upgrading of the Porterville WWTW. The sanitation service levels within the various towns can be described as follows:
• Aurora and Redelinghuys: The entire towns of Aurora and Redelinghuys are serviced by septic tank systems. The goal of the Municipality is to upgrade the towns to a waterborne sewer system, which include new WWTWs to treat the generated sewage.
• Dwarskersbos: Approximately 50% - 60% of the households in Dwarskersbos are serviced through septic tanks. The upgrading of the septic tank systems to a waterborne sewer system including incorporation into the existing waterborne network is ongoing.
• Eendekuil: Approximately 30% - 40% of the households in Eendekuil are serviced through septic tanks. The upgrading of the septic tank systems to a waterborne sewer system including incorporation into the existing waterborne network is ongoing.
• Piketberg and Porterville: All households in these two towns are connected to the waterborne sewer system. The Municipality is currently busy with the upgrading of the Porterville WWTW, due to various developments over the last number of years.
• Velddrif: Approximately 20% - 30% of the households in Velddrif are serviced through septic tanks. The upgrading of the septic tank systems to a waterborne sewer system including incorporation into the existing waterborne network is ongoing.

Bergrivier Municipality: Annual WSDP Performance- and Water Services Audit Report for 2016/2017
2017/11/03 Bergrivier Water Services Audit 2016-2017
36
The existing residential sanitation service levels in Bergrivier Municipality’s Management Area are estimated as follows:
Table C2.2.4: Residential sanitation service levels (Residential Consumer Units)
Service Levels Piketberg Porterville Velddrif Dwarskersbos Aurora Wittewater Redelinghuys Eendekuil Goedverwacht Farms Total
No Sanitation Services 3) 0 0 0 0 0 0 0 0 10 506 516
Below RDP: Infrastructure Upgrade 4) 0 0 0 0 0 24 0 0 70 518 612
Below RDP: Infrastructure Extension 0 0 0 0 0 0 0 0 0 0 0
Below RDP: Infrastructure Refurbishment
0 0 0 0 0 0 0 0 0 0 0
Below RDP: O&M Needs 0 0 0 0 0 0 0 0 0 0 0
Below RDP: Water Resource Needs 0 0 0 0 0 0 0 0 0 0 0
Below RDP: Infrastructure and O&M Needs
0 0 0 0 0 0 0 0 0 0 0
Below RDP: Infrastructure, O&M and Water Resource Needs
0 0 0 0 0 0 0 0 0 0 0
Total Basic Need (RDP) 0 0 0 0 0 24 0 0 80 1 024 1 128
Below Housing Interim 5) 0 0 0 0 0 0 0 0 0 0 0
Adequate Housing Permanent 6) 0 0 80 0 0 0 0 0 0 0 80
Total Housing Need 0 0 80 0 0 0 0 0 0 0 80
None Waterborne 0 0 0 0 0 30 0 0 9 44 83
Waterborne Low Flush 0 0 0 0 0 0 0 0 0 0 0
Septic Tanks / Conservancy 1) 0 0 1 050 217 260 141 184 134 506 5 570 8 062
Waterborne WWTW 3 224 2 100 3 493 187 0 0 0 284 0 0 9 288
Total Adequate 2) 3 224 2 100 4 543 404 260 171 184 418 515 5 614 17 433
Total per Area 3 224 2 100 4 623 404 260 195 184 418 595 6 638 18 641
1) Waterborne Low Flush, Septic Tanks and Conservancy tanks as agreed with the Municipality during January 2014, as part of DWS’s Backlog Eradication Strategy process.
2) House Connections for 2016/2017 were projected from the 2011 Census data, except for Dwarskersbos and Redelinghuys where the number of consumer units as calculated from the financial system were used. The Backyard dwellers are included in these figures.
3) Census 2011: Number of households with no toilet facility 506 + 10.
4) Census 2011: Number of households with existing buckets 131 + 39 +7, chemical toilets 23 + 12, pit toilets without ventilation 30 +2 + 4 and “other” 334 + 29 +1.
5) Below Housing Interim in the above table is the number of shacks in informal areas without basic sanitation services.
6) Adequate Housing Permanent in the above table is the number of shacks in informal areas with communal ablution facilities, as confirmed by the Municipality.
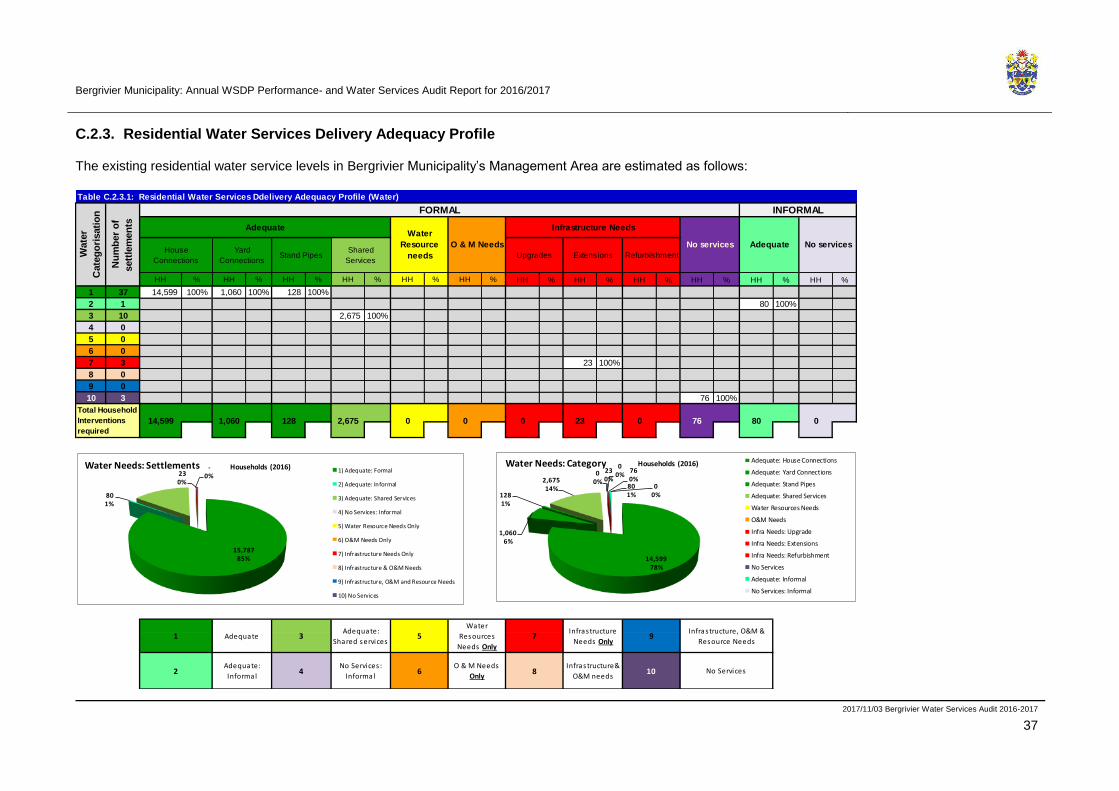
Bergrivier Municipality: Annual WSDP Performance- and Water Services Audit Report for 2016/2017
2017/11/03 Bergrivier Water Services Audit 2016-2017
37
C.2.3. Residential Water Services Delivery Adequacy Profile
The existing residential water service levels in Bergrivier Municipality’s Management Area are estimated as follows:
HH % HH % HH % HH % HH % HH % HH % HH % HH % HH % HH % HH %
1 37 14,599 100% 1,060 100% 128 100%
2 1 80 100%
3 10 2,675 100%
4 0
5 0
6 0
7 3 23 100%
8 0
9 0
10 3 76 100%
076 80
Table C.2.3.1: Residential Water Services Ddelivery Adequacy Profile (Water)
Wate
r
Cate
go
risati
on
Nu
mb
er
of
sett
lem
en
ts
FORMAL INFORMAL
AdequateWater
Resource
needs
O & M Needs
Infrastructure Needs
No services Adequate No servicesHouse
Connections
Total Household
Interventions
required
14,599 1,060 128 2,675
Adequate 3Adequate:
Shared services5
Refurbishment
0 0 23 00
Yard
ConnectionsStand Pipes
Shared
ServicesUpgrades Extensions
No Services
Infrastructure, O&M &
Resource Needs
2Adequate:
Informal4
No Services :
Informal6
O & M Needs
Only8
Infrastructure&
O&M needs10
Water
Resources
Needs Only
7Infrastructure
Needs Only91
15,787 85%
80 1%
-0%23
0%
Water Needs: Settlements1) Adequate: Formal
2) Adequate: Informal
3) Adequate: Shared Services
4) No Services: Informal
5) Water Resource Needs Only
6) O&M Needs Only
7) Infrastructure Needs Only
8) Infrastructure & O&M Needs
9) Infrastructure, O&M and Resource Needs
10) No Services
14,59978%
1,0606%
1281%
2,67514%
00%
230%
00%
760%
801%
00%
Water Needs: Category Adequate: House Connections
Adequate: Yard Connections
Adequate: Stand Pipes
Adequate: Shared Services
Water Resources Needs
O&M Needs
Infra Needs: Upgrade
Infra Needs: Extensions
Infra Needs: Refurbishment
No Services
Adequate: Informal
No Services: Informal
Households (2016)Households (2016)
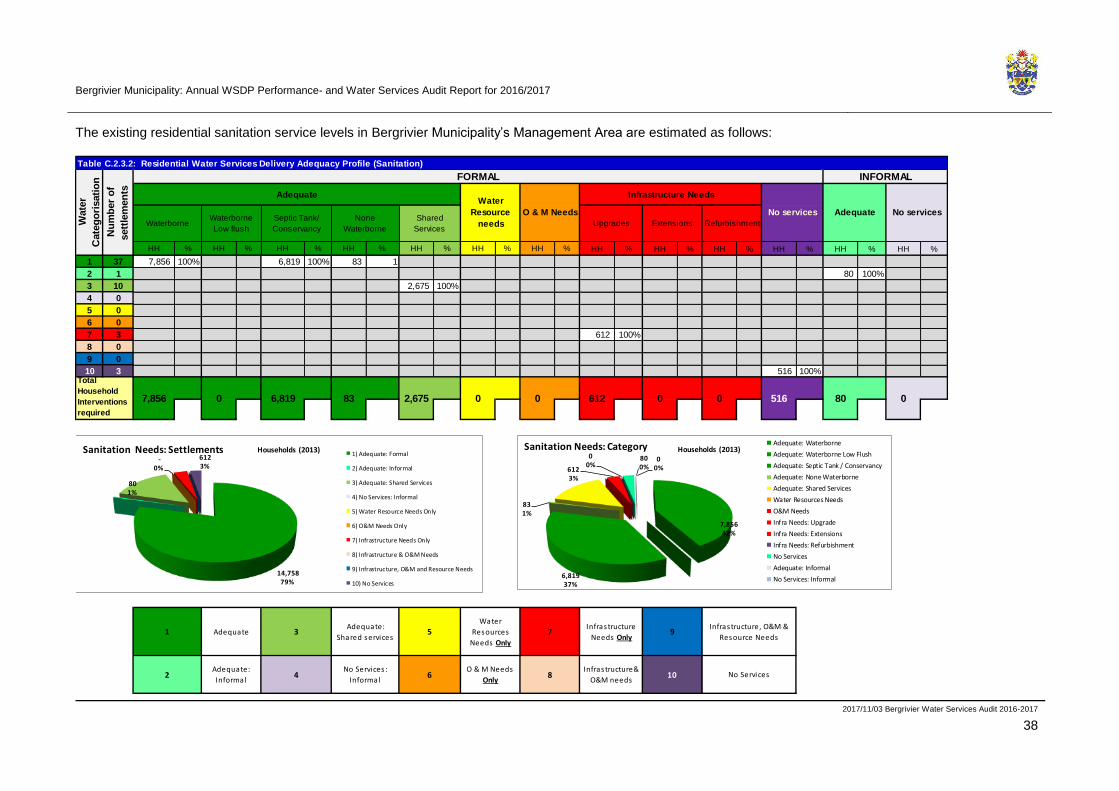
Bergrivier Municipality: Annual WSDP Performance- and Water Services Audit Report for 2016/2017
2017/11/03 Bergrivier Water Services Audit 2016-2017
38
The existing residential sanitation service levels in Bergrivier Municipality’s Management Area are estimated as follows:
HH % HH % HH % HH % HH % HH % HH % HH % HH % HH % HH % HH % HH %
1 37 7,856 100% 6,819 100% 83 1
2 1 80 100%
3 10 2,675 100%
4 0
5 0
6 0
7 3 612 100%
8 0
9 0
10 3 516 100%
Table C.2.3.2: Residential Water Services Delivery Adequacy Profile (Sanitation)
INFORMAL
AdequateWater
Resource
needs
O & M Needs
Infrastructure Needs
No services Adequate No services
WaterborneWaterborne
Low flush
Septic Tank/
Conservancy
None
Waterborne
Shared
ServicesExtensions Refurbishment
80 00 0 516
Wate
r
Cate
go
risati
on
Nu
mb
er
of
sett
lem
en
ts
FORMAL
Total
Household
Interventions
required
7,856 0 6,819 83
Adequate 3Adequate:
Shared services5
Upgrades
0 0 6122,675
10 No Services
9Infrastructure, O&M &
Resource Needs
2Adequate:
Informal4
No Services :
Informal6
O & M Needs
Only8
Infrastructure&
O&M needs
Water
Resources
Needs Only
7Infrastructure
Needs Only1
14,758 79%
80 1%
-0%
612 3%
Sanitation Needs: Settlements 1) Adequate: Formal
2) Adequate: Informal
3) Adequate: Shared Services
4) No Services: Informal
5) Water Resource Needs Only
6) O&M Needs Only
7) Infrastructure Needs Only
8) Infrastructure & O&M Needs
9) Infrastructure, O&M and Resource Needs
10) No Services
Households (2013)
7,85642%
6,81937%
831%
6123%
00%
800%
00%
Sanitation Needs: Category Adequate: Waterborne
Adequate: Waterborne Low Flush
Adequate: Septic Tank / Conservancy
Adequate: None Waterborne
Adequate: Shared Services
Water Resources Needs
O&M Needs
Infra Needs: Upgrade
Infra Needs: Extensions
Infra Needs: Refurbishment
No Services
Adequate: Informal
No Services: Informal
Households (2013)

Bergrivier Municipality: Annual WSDP Performance- and Water Services Audit Report for 2016/2017
2017/11/03 Bergrivier Water Services Audit 2016-2017
39
C.3. Cost Recovery and Free Basic Services
C.3.1. Tariffs
The water tariff structures for Bergrivier Municipality for the 2016/2017 financial year and the previous four financial years are summarised in the table below (Subject to 14% VAT).
Table C.3.1: Water tariffs for 2016/2017 and the previous four financial years
Consumer/Description Category 16/17 15/16 14/15 13/14 12/13
Uncontrolled volume supply: Basic Monthly Charge R47-00 R44-00 R41-66 R38-57 R35-70
Households Consumption
0 – 6 kl R6-57 R6-20 R5-85 R5-42 R5-02
7 – 20 kl R13-25 R12-50 R11-79 R10-91 R10-10
21 – 50 kl R13-25 R12-50 R11-79 R10-92 R10-11
51 – 100 kl R15-25 R14-39 R13-58 R12-57 R11-64
101 – 200 kl R16-03 R15-12 R14-26 R13-21 R12-23
201 – 1 000 kl R16-86 R15-91 R15-01 R13-90 R12-87
1 000 – 1 500 kl R14-33 R13-52 R12-75 R11-80 R10-92
1 501 – 2 000 kl R12-17 R11-48 R10-83 R10-03 R9-29
> 2 000 kl R10-30 R9-72 R9-17 R8-49 R7-87
Sport Clubs / Schools / Welfare Organisations
Basic Tariff per kl R6-00 R6-00 R5-82 R5-39 R5-02
Municipal Usage Basic Tariff per kl R6-00 R6-00 R5-82 R5-39 R5-02
Consumers outside previous municipal area
Basic Tariff per kl R6-00 R6-00 R5-85 R10-86 R10-10
New connection R2 674-00 R2 523-00 R2 380-05 R2 203-75 R2 050-00
Changing from 15mm to 20mm R1 357-00 R1 280-00 R1 207-44 R1 118-00 R1 040-00
The above rates are based on saving measures of 20%. If these measures increase further, the above-mentioned tariffs will increase by 2.5% for every 5% that increases the savings measures.
The sewerage tariff structures for Bergrivier Municipality for the 2016/2017 financial year and the previous four financial years are summarised in the table below (Subject to 14% VAT).
Table C.3.2: Sewerage tariffs for 2016/2017 and the previous four financial years
Consumer/Description Category 16/17 15/16 14/15 13/14 12/13
Fixed monthly standard charge per connection / resident unit.
R142-00 R134-00 R125-99 R116-66 R108-01
Septic Tanks: Velddrif
During office hours R326-00 R308-00 R290-25 R268-75 R250-00
After office hours R535-00 R505-00 R476-01 R440-75 R410-00
Sundays / Public Holidays
R939-00 R886-00 R835-92 R774-00 R720-00
Septic Tanks: Eendekuil During office hours R137-00 R129-00 R121-91 R112-88 R105-00
Septic Tanks: Aurora During office hours R137-00 R129-00 R121-91 R112-88 R105-00
Septic Tanks: Outside previous municipal area
During office hours R535-00 R505-00 R476-01 R440-75 R410-00
After office hours R1 214-00 R1 145-00 R1 079-73 R999-75 R930-00
Sundays / Public Holidays
R1 878-00 R1 772-00 R1 671-84 R1 548-00 R1 440-00
Outside town boundaries per km from WWTW
R7-00 R7-00 R6-97 R6-45 R6-00
New connection same side of road R809-00 R763-00 R720-00 R667-00 R620-00
New connection on other side of road R1 618-00 R1 526-00 R1 440-00 R1 333-00 R1 240-00

Bergrivier Municipality: Annual WSDP Performance- and Water Services Audit Report for 2016/2017
2017/11/03 Bergrivier Water Services Audit 2016-2017
40
C.3.2. Metering, Billing and Free Basic Services
Service charges relating to water are based on consumption and a basic charge as per Council resolution. Meters are read on a monthly basis and are recognised as revenue when invoiced. Provisional estimates of consumption are made monthly when meter readings have not been performed. The provisional estimates of consumption are recognised as revenue when invoiced. Adjustments to provisional estimates of consumption are made in the invoicing period in which meters have been read. These adjustments are recognised as revenue in the invoicing period. Services relating to sanitation (sewerage) are recognised on a monthly basis in arrears by applying the approved tariff to each property. Tariffs are determined per category of property usage. In the case of residential property a fixed monthly tariff is levied and in the case of commercial property a tariff is levied based on the number of sewerage connections on the property. Service charges are based on a basic charge as per Council resolution. The table below gives an overview of the metering, billing and free basic services of Bergrivier Municipality.
Unit Year 0 Year - 1 Year - 2
FY2016/17 FY2015/16 FY2014/15
UNITS SUPPLIED (as per water services access profile)
10.2 (b) (i) Household water connections (house and yard connections) Nr 18,334 17,871 17,411
10.2 (b) (iv) Household sewerage connections Nr 17,350 16,887 16,427
METERING
Metered Water Connections (aligned with Table C2.1)
Residential Nr 8,459 8,346 8,257
Commercial / Business Nr 207 194 183
Industrial Nr 55 55 55
Government / Institutional Nr 100 95 88
etc. Nr 33 31 29
Sub-Total: Metered Water Connections Nr 8,854 8,721 8,612
Proportion of metered connections (residential)* % 46% 47% 47%
Total number of meters Nr 8,854 8,721 8,612
10.2 (b) (vi) Total number of new connections (aligned with Table C.2.1) Nr 133 109 59
10.2 (e) (i) Total number of new meters installed Nr 133 109 59
Proportion of new connections, metered % 100.0% 100.0% 100.0%
Number of meters tested Nr 19 24 6
10.2 (e) (ii) Proportion of meters tested to total number of meters % 0.2% 0.3% 0.1%
Number of meters replaced Nr 257 137 215
10.2 (e) (ii) Proportion of meters replaced to total number of meters % 2.9% 1.6% 2.5%
BILLING
Customer billing (water and sewerage) Nr Nr Nr
Residential Nr 8,459 8,346 8,257
Commercial / Business Nr 207 194 183
Industrial Nr 55 55 55
Government / Institutional Nr 100 95 88
etc. Nr 33 31 29
Sub-Total: Customers billed Nr 8,854 8,721 8,612
Proportion of bills to metered connections % 100% 100% 100%
Residential % 100% 100% 100%
Commercial / Business % 100% 100% 100%
Industrial % 100% 100% 100%
Government / Institutional % 100% 100% 100%
etc. % 100% 100% 100%
FREE BASIC SERVICES
Nr customers receiving:
Free Basic Water Nr 1,890 1,687 1,795
10.2 (b) (v) Free Basic Sanitation Nr 1,693 1,516 1,605
Proportion of Free Basic Services
Water % 22% 20% 22%
Sewerage % 10% 9% 10%
DescriptionRegulations Ref. #
Table C.3.2.1: Overview of Metering, Billing and Free Basic Services
Note: * All residential consumers in the urban areas of Bergrivier Municipality's Management Area are metered. The "Water
Services Access Profile" however includes the consumers on the farms and the backyard dwellers on formal erven in the
urban areas. Backyard dwellers use the service of the main house, which is metered. Consumers on the farms util ise their
own water sources, which is not metered by the Municipality, therfore the 40% - 50% compliance in the above table.

Bergrivier Municipality: Annual WSDP Performance- and Water Services Audit Report for 2016/2017
2017/11/03 Bergrivier Water Services Audit 2016-2017
41
Revenue Collection and Cost Recovery
The table and figures below gives an overview of Bergrivier Municipality’s water services revenue collection and cost recovery. The information was sourced from the 2014/2015 and 2015/2016 audited and the 2016/2017 unaudited Annual Financial Statements of the Municipality.
Year 0 Year - 1 Year - 2
FY2016/17 FY2015/16 FY2014/15
INCOME R'000 R'000 R'000
Billed
Water reticulation / provision R 33,382 R 39,125 R 36,896
Sewerage / wastewater R 13,595 R 15,314 R 15,140
Sub-Total: Billed R 46,977 R 54,439 R 52,036
Collections
Water reticulation / provision R 33,936 R 41,381 R 36,845
Sewerage / wastewater R 14,696 R 18,734 R 16,475
Sub-Total: Collections R 48,633 R 60,115 R 53,320
Equitable share income
Water reticulation / provision R 1,723 R 2,178 R 1,898
Sewerage / wastewater R 2,983 R 2,952 R 2,865
Sub-Total: Equitable share income R 4,706 R 5,130 R 4,763
EXPENDITURE (O&M) R'000 R'000 R'000
Water services R 20,772 R 19,440 R 17,623
Sewerage / wastewater services R 11,739 R 9,729 R 6,717
Total: Water Services O&M R 32,512 R 29,168 R 24,340
COST RECOVERY ANALYSIS / RATIO'S % % %
10.2 (d) (ii) Billed as % of Cost
Water 169% 212% 220%
Sewerage 141% 188% 268%
Total 144% 187% 214%
10.2 (d) (iii) Unrecovered as % of Cost
Water services 6% 0% 11%
Sewerage / wastewater services 16% -5% 23%
Total 9% -2% 14%
Regulations
Ref. #Description
Table C.3.3.1: Overview of Water Services Revenue Collection and Cost Recovery
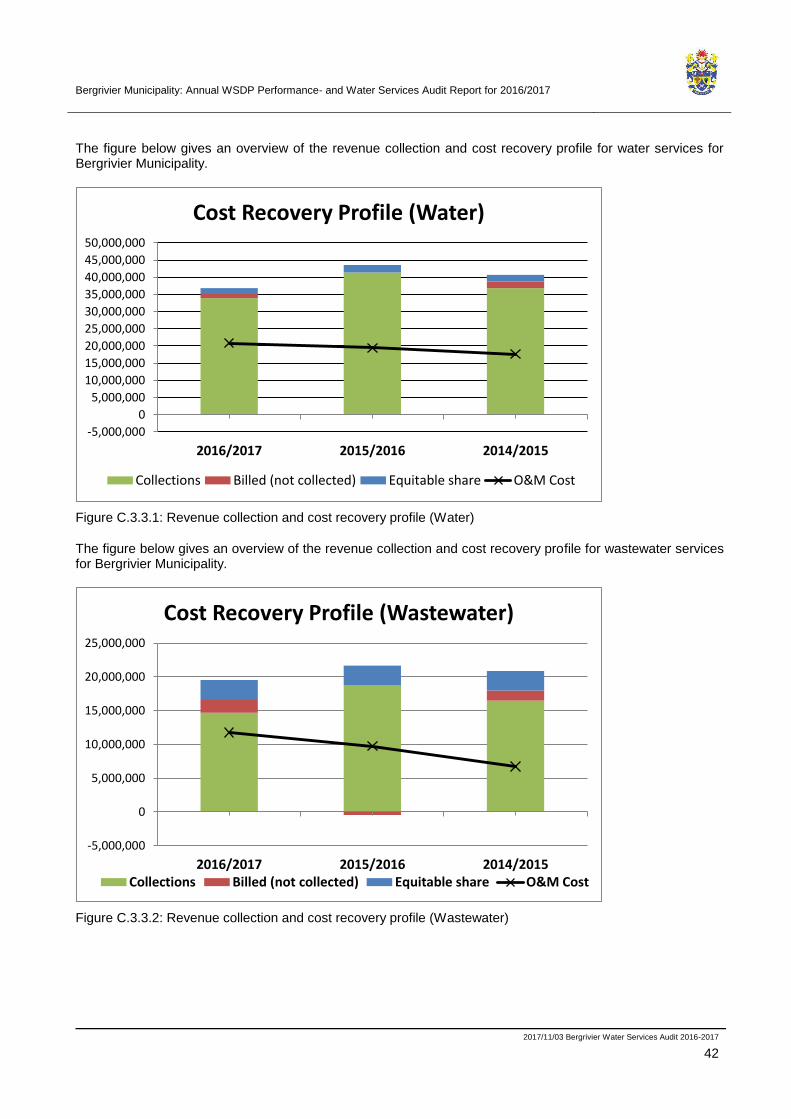
Bergrivier Municipality: Annual WSDP Performance- and Water Services Audit Report for 2016/2017
2017/11/03 Bergrivier Water Services Audit 2016-2017
42
The figure below gives an overview of the revenue collection and cost recovery profile for water services for Bergrivier Municipality.
-5,000,000
0
5,000,000
10,000,000
15,000,000
20,000,000
25,000,000
30,000,000
35,000,000
40,000,000
45,000,000
50,000,000
2016/2017 2015/2016 2014/2015
Cost Recovery Profile (Water)
Collections Billed (not collected) Equitable share O&M Cost
Figure C.3.3.1: Revenue collection and cost recovery profile (Water)
The figure below gives an overview of the revenue collection and cost recovery profile for wastewater services for Bergrivier Municipality.
-5,000,000
0
5,000,000
10,000,000
15,000,000
20,000,000
25,000,000
2016/2017 2015/2016 2014/2015
Cost Recovery Profile (Wastewater)
Collections Billed (not collected) Equitable share O&M Cost
Figure C.3.3.2: Revenue collection and cost recovery profile (Wastewater)

Bergrivier Municipality: Annual WSDP Performance- and Water Services Audit Report for 2016/2017
2017/11/03 Bergrivier Water Services Audit 2016-2017
43
Bergrivier Municipality’s Operational and Maintenance Budget for water services for the last five years are summarised in the table below. A more detail breakdown of the water operational budgets are also included in Annexure E.
Table C.3.3.2: Operational and Maintenance budget for water services for the last five financial years
Description Actual 16/17 Record : Prior
Actual 15/16 Actual 14/15 Actual 13/14 Actual 12/13
EXPENDITURE
Employee Related Costs R4 487 377-80 R3 687 337-17 R2 852 773-78 R2 512 220-73 R2 522 848-46
Repairs and Maintenance R534 540-55 R641 995-23 R867 445-65 R526 522-57 R1 019 886-90
Capital Costs and Other R921 025-50 R3 804 135-46 R3 571 610-79 R3 290 447-20 R2 952 238-57
General Expenses R14 829 418-49 R11 306 148-25 R10 330 814-92 R10 160 615-02 R11 482 829-70
Total Expenditure R20 772 362-34 R19 439 616-11 R17 622 645-14 R16 489 805-52 R17 977 803-63
INCOME
Total Income -R35 105 263-77 -R41 302 944-69 -R38 793 306-82 -R21 182 113-66 -R19 773 371-64
Nett Surplus / Deficit R14 332 901-43 R21 863 328-58 R21 170 661-68 R4 692 308-14 R1 795 568-01
Bergrivier Municipality’s Operational and Maintenance Budget for sanitation services for the last five years are summarised in the table below. A more detail breakdown of the sanitation operational budgets are also included in Annexure E.
Table C.3.3.3: Operational and Maintenance budget for sanitation services for the last five financial years
Description Actual 16/17 Record : Prior
Actual 15/16 Actual 14/15 Actual 13/14 Actual 12/13
EXPENDITURE
Employee Related Costs R2 056 728-70 R2 104 451-34 R1 884 958-33 R1 919 258-55 R1 739 442-16
Repairs and Maintenance R623 195-59 R500 008-61 R466 857-57 R310 615-04 R322 769-00
Capital Costs and Other R381 830-50 R3 638 885-17 R1 028 259-40 R2 498 102-46 R2 455 744-13
General Expenses R8 677 667-08 R3 485 384-03 R3 337 283-18 R3 632 017-36 R3 437 380-77
Total Expenditure R11 739 421-87 R9 728 729-15 R6 717 358-48 R8 359 993-41 R7 955 336-06
INCOME
Total Income -R16 578 073-16 -R18 266 193-46 -R18 005 379-38 -R27 065 082-86 -R21 107 779-12
Nett Surplus / Deficit R4 838 651-29 R8 537 464-31 R11 288 020-90 R18 705 089-45 R13 152 443-06

Bergrivier Municipality: Annual WSDP Performance- and Water Services Audit Report for 2016/2017
2017/11/03 Bergrivier Water Services Audit 2016-2017
44
The table below gives an overview of the analysis of the consumer debtors for the past seven financial years
Table C.3.3.4: Consumer debtors per service for the last seven financial years
Year General
debit/credit Services: Old Electricity Water Sewerage
Refuse
Removal Total
2010/2011 -R1 042 318-28 R107 212-90 R7 293 471-51 R4 998 198-78 R4 143 848-04 R5 375 499-51 R20 875 912-46
2011/2012 -R1 118 140-39 R106 007-16 R6 598 115-16 R4 604 543-09 R3 139 549-26 R5 123 607-35 R18 453 681-63
2012/2013 -R1 048 856-15 R94 337-51 R6 575 726-66 R4 623 040-89 R3 572 291-82 R6 260 353-61 R20 076 894-34
2013/2014 -R1 420 973-12 R71 576-70 R8 640 727-30 R6 550 646-49 R4 286 155-33 R7 213 767-20 R25 341 899-90
2014/2015 -R2 235 527-48 R23 066-42 R8 263 989-97 R7 797 917-44 R4 977 280-90 R8 063 592-38 R26 890 319-63
2015/2016 -R2 238 376-49 R10 902-76 R7 538 802-32 R7 746 652-56 R4 732 364-99 R7 810 512-25 R25 600 858-39
2016/2017 -R2 068 504-90 R9 478-72 R8 184 231-09 R8 682 944-98 R5 924 987-56 R9 993 744-10 R30 726 881-55
C.4. Water Quality
C.4.1. Sampling Programme
The Bergrivier Municipality has implemented a comprehensive drinking water sampling programme for its formal water supply schemes, which includes schemes supplied by surface water, groundwater and potable bulk water supplied by the West Coast District Municipality. The current compliance monitoring is done by an accredited external laboratory. The Municipality continuously strive to provide good quality water and strive to achieve Blue Drop Status for all their water supply networks.
The two tables below give an overview of the Bergrivier Municipality’s water quality compliance sampling programmes for their networks and WTWs, as taken from the BDS and compared with the actual compliance sample results, as included in Annexure D.
Year 0 Year-1 Year-2 Year 0 Year-1 Year-2
# Name FY2016/17 FY2015/16 FY2014/15 FY2016/17 FY2015/16 FY2014/15
Piketberg Community Centre (WWBMPB-001) Yes Yes Yes Microbiological (Health)Piketberg Municipal Offices (WWBMPB-003) Yes Yes Yes E.Coli (Count per 100 ml) 30 30 30
Aurora Municipal Office (WWBMAU-001) Yes Yes Yes
Eendekuil Municpal Office (WWBMEK-001) Yes Yes Yes Aesthetic
Porterville Municipal Office (WWBMPV-001) Yes Yes Yes Conductivity at 25oC (mS/m) 30 30 30
Porterville Sew age Plant Drinking Water (WWBRPV-002) Yes Yes Yes Colour 30 30 30
Porterville Biblioteek Yes - - Sodium as Na (mg/l) - 30 30
Redelinghuys Municipal Office (WWBMRH-001) Yes Yes Yes Total Dissolved Solids (mg/l) 30 30 30
Velddrif Civic Centre (Noordhoek Saal) Yes Yes Yes Magnesium as Mg (mg/l) 30 30 30
Velddrif Tap Unathi Spaza (WWBMVD-006) - Yes Yes Chloride as Cl- (mg/l) - 30 30
Velddrif Municipal Office Yes - - Potassium as K (mg/l) - 30 30
Zinc as Zn (mg/l) - 30 30
Sampled but not on programme Ammonia Nitrogen as N (mg/l) - 30 30
On programme but not sampled Iron as Fe (µg/l) - 30 30
Manganese as Mn (µg/l) - 30 30
Operational
pH at 25oC 30 30 30
Turbidity 30 30 30
Aluminium as Al (μg/l) 30 30 30
Heterotrophic Plate Count count per 1ml 30 30 30
Total Coliform Count per 100 ml 30 30 30
Disinfectant Residual
Residual Chlorine 30 30 30
Chemical (Health)
Fluoride as F- (mg/l) 30 30 30
Nitrate and Nitrite as N (mg/l) - 30 30
Nitrite as N (mg/l) - 30 30
Sulfate as SO4 (mg/l) - 30 30
Not in STD / Limit Set
Calcium as Ca (mg/l) 30 30 30
Calcium Hardness (as CaCO3) - 30 30
Magnesium Hardness (as CaCO3) - 30 30
Alkalinity (as CaCO3) 30 30 30
Total Hardness (as CaCO3) 30 30 30
Table C.4.1.1: Sampling Programme for Potable Water Quality - Network
Treated Water Schemes: Piketberg, Porterville, Eendekuil, Redelinghuys, Velddrif, Aurora
Frequency (days)Active (yes/no)
Determinands per Category
Registered Sites per Scheme

Bergrivier Municipality: Annual WSDP Performance- and Water Services Audit Report for 2016/2017
2017/11/03 Bergrivier Water Services Audit 2016-2017
45
Year 0 Year-1 Year-2 Year 0 Year-1 Year-2
# Name FY2016/17 FY2015/16 FY2014/15 FY2016/17 FY2015/16 FY2014/15
Aurora - WTW Final (WWBRAU-003) Yes Yes Yes Microbiological (Health)Eendekuil WTW Final (WWBREK-003) Yes Yes Yes E.Coli (Count per 100 ml) 30 30 30
Piketberg WTW Final (WWBRPB-009) Yes Yes Yes
Porterville WTW Final (WWBRPV-004) Yes Yes Yes Aesthetic
Redelinghuys WTW (WWBRPH-001) Yes Yes Yes Conductivity at 25oC (mS/m) 30 30 30
Storage Colour 30 30 30
Dw arskersbos Reservoir (WWBRVD-009) Yes Yes Yes Sodium as Na (mg/l) 30 30 30
Velddrif Reservoir (Reservoir 1) Yes Yes Yes Total Dissolved Solids (mg/l) 30 30 30
Magnesium as Mg (mg/l) 30 30 30
On programme but not sampled Chloride as Cl- (mg/l) 30 30 30
Sampled but not on programme Potassium as K (mg/l) - 30 30
Zinc as Zn (mg/l) - 30 30
Ammonia Nitrogen as N (mg/l) - 30 30
Iron as Fe (µg/l) - 30 30
Manganese as Mn (µg/l) - 30 30
Operational
pH at 25oC 30 30 30
Turbidity 30 30 30
Aluminium as Al (μg/l) 30 30 30
Heterotrophic Plate Count count per 1ml 30 - -
Total Coliform Count per 100 ml 30 30 30
Disinfectant Residual
Residual Chlorine 30 30 30
Chemical (Health)
Fluoride as F- (mg/l) 30 30 30
Nitrate and Nitrite as N (mg/l) - 30 30
Nitrite as N (mg/l) - 30 30
Sulfate as SO4 (mg/l) - 30 30
Not in STD / Limit Set
Calcium as Ca (mg/l) 30 30 30
Calcium Hardness (as CaCO3) - 30 30
Magnesium Hardness (as CaCO3) - 30 30
Total Alkalinity (as CaCO3) 30 30 30
Total Hardness (as CaCO3) 30 30 30
Sodium is not sampled in Aurora, Velddrif and
Dw arskersbos
Chloride is also sampled in Piketberg, Eendekuil and
Redelinghuys.
Table C.4.1.2: Sampling Programme for Potable Water Quality - WTW
Treated Water Schemes: Piketberg, Porterville, Eendekuil, Redelinghuys, Velddrif, Aurora, Dwarskersbos
Registered Sites per SchemeActive (yes/no)
Determinands per Category
Frequency (days)
The table below indicates the compliance of the E.Coli monitoring frequency in the water distributions systems of Bergrivier Municipality, in terms of the minimum requirements of SANS 0241:2015 (Table 2). The period assessed was for samples taken from July 2016 to June 2017.
Table C.4.1.3: Bergrivier Municipality’s compliance of the monthly E.Coli monitoring frequency in the water distributions
systems in terms of the minimum requirements of SANS 241-2:2015 (Table 2).
Distribution
System Population served
Required number of monthly
samples
(SANS 241-2:2015: Table 2)
Average number of monthly microbiological
compliance samples taken by the Bergrivier
Municipality and the West Coast District
Municipality during 2016/2017
Porterville 7 602 2 9.3
Piketberg 13 332 2.6 7.8
Velddrif 14 061 2.8 14.1
Dwarskersbos 796 2 7.0
Aurora 755 2 6.5
Eendekuil 1 689 2 5.5
Redelinghuys 588 2 5.8
Total 38 823 15.4 56.0
It can be noted from the above table that the number of monthly E.Coli samples taken by the Municipality during the 2016/2017 financial year was more than the required number of samples for all the water distribution systems.

Bergrivier Municipality: Annual WSDP Performance- and Water Services Audit Report for 2016/2017
2017/11/03 Bergrivier Water Services Audit 2016-2017
46
The table below gives an overview of Bergrivier Municipality’s compliance sampling programme for wastewater (final effluent) quality, as compiled from the final effluent compliance sample results.
Year 0 Year-1 Year-2 Year 0 Year-1 Year-2
# Name FY2016/17 FY2015/16 FY2014/15 FY2016/17 FY2015/16 FY2014/15
1 Dw arskersbos Yes Yes Yes Microbiological
2 Eendekuil Yes Yes Yes E.Coli (count per 100mℓ) - 30 30
3 Piketberg Yes Yes Yes Faecal Coliforms (count per 100mℓ) 30 - -
4 Porterville Yes Yes Yes
5 Velddrif Yes Yes Yes Chemical
Ammonia Nitrogen (mg/ℓ as N) 30 30 30
Nitrate Nitrogen (mg/ℓ as N) 30 30 30
Nitrite Nitrogen (mg/ℓ as N) 30 - 30
Ortho Phosphate (mg/ℓ as P) 30 30 30
COD (mg/ℓ) Filtered 30 - -
COD (mg/ℓ) Unfiltered 30 30 30
Free Chlorine (mg/ℓ) 30 30 30
Physical
Electrical Conductivity (mS/m) 30 30 30
pH 30 30 30
Total Suspended Solids (mg/ℓ) 30 30 30
Frequency (days)
Determinands per
Category
Registered Sites
Active
Table C.4.1.4: Sampling Programme for Wastewater Effluent Quality
The table below gives an overview of the compliance of the Municipality with regard to their Water Quality and Wastewater Quality Sampling Programmes, as taken from the BDS and GDS.
M C P O M C P O M C P O
Nr registered 6 6 6 6 6 6 6 6 6 6 6 6
Nr submitted 6 6 6 6 6 6 6 6 6 6 6 6
Annual % 100% 100% 100% 100% 100% 100% 100% 100% 100% 95% 100% 100%
Monitoring compliance Average % 85% 65% 76% 62% 86% 64% 81% 62% 84% N/A 66% 88%
Data Credibility Average % 100% 99% 100% 100% 94% 92% 92% 94% 100% 100% 100% 100%
BDS In-Time Submission Annual % 98% 99% 98% 99% 88% 84% 80% 85% 58% 49% 53% 80%
Monitoring compliance Average %
Operational monitoring
complianceAverage %
Legend M: Microbiological; C: Chemical; P: Physical; O: Operational
Year-1
FY2015/16
Year-2
FY2014/15
Table C.4.1.5: Compliance to the Sampling Programme (s)
Measurable / Enabling
FactorUnit
Year 0
FY2016/17
Not captured on GDS and recorded by Process Controllers at each of the WWTW
76% 79% 61%
Potable Water Quality
Wastewater Quality
Supply system submissions

Bergrivier Municipality: Annual WSDP Performance- and Water Services Audit Report for 2016/2017
2017/11/03 Bergrivier Water Services Audit 2016-2017
47
The table below gives an overview of the water quality monitoring from the WSDP Guide Framework perspective.
Year 0 Year - 1 Year - 2
FY2016/17 FY2015/16 FY2014/15
6.3 Water Supply and Quality
6.3.2 Process Control in place yes/total WTW in % 100% 100% 100%
6.3.3 Monitoring Programme in place yes/total schemes in % 100% 100% 100%
6.3.4 Sample Analysis Credibility Average % 100% 100% 100%
9.2 Monitoring
9.2.1 % of w ater abstracted monitored: Surface w aterQ monitored / Q
abstracted in %100% 100% 100%
9.2.2 % of w ater abstracted monitored: Ground w aterQ monitored / Q
abstracted in %100% 100% 100%
9.2.3% of w ater abstracted monitored: External Sources (Bulk
purchase)
Q monitored ow n / Q
purchased in %100% 100% 100%
9.2.6Water quality for formal schemes? (1: daily, 2: w eekly, 3:
monthly, 4: annually, 5: never)frequency Monthly Monthly Monthly
9.2.7Water quality for rudimentary schemes? (1: daily, 2: w eekly, 3:
monthly, 4: annually, 5: never)frequency N/A N/A N/A
9.2.9Is the number suff icient in accordance to the SANS241
requirements?yes/no Yes Yes Yes
9.3 Water Quality
Is there a w ater safety plan in place? yes/no Yes Yes Yes
9.3.1 Reporting on quality of w ater taken from source: urban & rural yes/total schemes in % 100% 100% 100%
9.3.5Quality of w ater taken from source: urban - % monitored by
WSA self?
monitored by WSA /
total schemes in %100% 100% 100%
9.3.6Quality of w ater taken from source: rural - % monitored by
WSA self?
monitored by WSA /
total schemes in %N/A N/A N/A
9.3.9 Are these results available in electronic format? yes/no Yes Yes Yes
WSDP
Ref #Measurable / Enabling Factor Unit
Table C.4.1.6: Water Quality Monitoring Overview from WSDP Guide Framework Perspective
The table below gives an overview of the wastewater quality monitoring from the WSDP Guide Framework perspective.
Year 0 Year - 1 Year - 2
FY2016/17 FY2015/16 FY2014/15
5.3.1 Monitoring and Sample Failure
5.3.1.1
Compliance Monitoring: % of tests performed as required by general
limits /special limits/ license requirements (Average % over previous
12 months)
Annual % 76% 79% 61%
5.3.1.2
Operational: % of tests performed as required by
general limits /special limits/ license requirements (Average % over
previous 12 months)
Annual %
6.4 Wastewater Supply and Quality
6.4.2 Process Control in place yes/total WWTW in % 57% 57% 57%
6.4.3 Monitoring Programme in place yes/total WWTW in % 78% 78% 78%
6.4.4 Sample Analysis Credibility Average % 100% 100% 100%
9.2 Monitoring
9.2.10 Is the number suff icient in accordance to licences? yes/no Yes Yes Yes
9.3 Water Quality
Is there a w astew ater risk abatement plan in place? yes/no Yes Yes Yes
9.3.2 Monitor quality of w ater returned to the resource: urban yes/total WWTW in % Yes Yes Yes
9.3.3 Monitor quality of w ater returned to the resource: rural yes/total WWTW in % N/A N/A N/A
9.3.7Quality of w ater returned to resource: urban - % monitored by WSA
self?
monitored by WSA /
urban WWTW in %Yes Yes Yes
9.3.8Quality of w ater returned to resource: rural - % monitored by WSA
self?
monitored by WSA /
rural WWTW in %N/A N/A N/A
9.3.9 Are these results available in electronic format? yes/no Yes Yes Yes
WSDP
Ref #Measurable / Enabling Factor Unit
Table C.4.1.7 : Wastewater Quality Monitoring Overview from WSDP Guide Framework Perspective
Not captured on GDS and recorded by
Process Controllers at each of the
WWTW
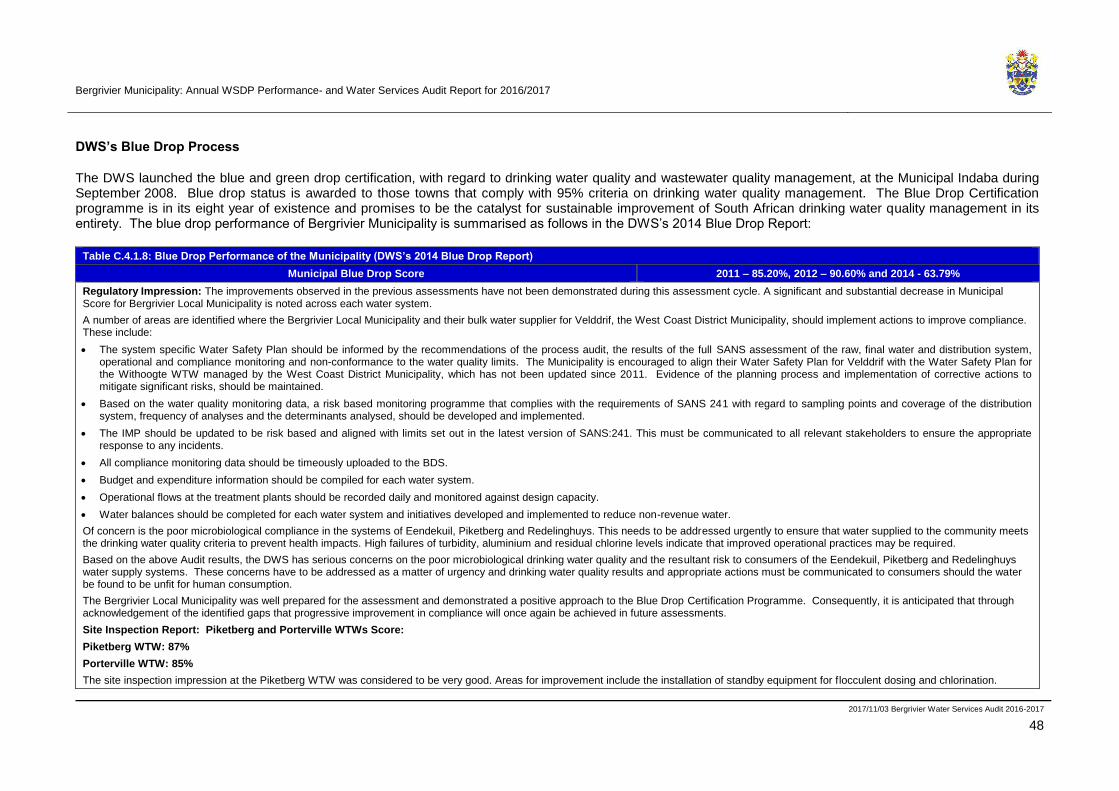
Bergrivier Municipality: Annual WSDP Performance- and Water Services Audit Report for 2016/2017
2017/11/03 Bergrivier Water Services Audit 2016-2017
48
DWS’s Blue Drop Process
The DWS launched the blue and green drop certification, with regard to drinking water quality and wastewater quality management, at the Municipal Indaba during September 2008. Blue drop status is awarded to those towns that comply with 95% criteria on drinking water quality management. The Blue Drop Certification programme is in its eight year of existence and promises to be the catalyst for sustainable improvement of South African drinking water quality management in its entirety. The blue drop performance of Bergrivier Municipality is summarised as follows in the DWS’s 2014 Blue Drop Report:
Table C.4.1.8: Blue Drop Performance of the Municipality (DWS’s 2014 Blue Drop Report)
Municipal Blue Drop Score 2011 – 85.20%, 2012 – 90.60% and 2014 - 63.79%
Regulatory Impression: The improvements observed in the previous assessments have not been demonstrated during this assessment cycle. A significant and substantial decrease in Municipal Score for Bergrivier Local Municipality is noted across each water system.
A number of areas are identified where the Bergrivier Local Municipality and their bulk water supplier for Velddrif, the West Coast District Municipality, should implement actions to improve compliance. These include:
• The system specific Water Safety Plan should be informed by the recommendations of the process audit, the results of the full SANS assessment of the raw, final water and distribution system, operational and compliance monitoring and non-conformance to the water quality limits. The Municipality is encouraged to align their Water Safety Plan for Velddrif with the Water Safety Plan for the Withoogte WTW managed by the West Coast District Municipality, which has not been updated since 2011. Evidence of the planning process and implementation of corrective actions to mitigate significant risks, should be maintained.
• Based on the water quality monitoring data, a risk based monitoring programme that complies with the requirements of SANS 241 with regard to sampling points and coverage of the distribution system, frequency of analyses and the determinants analysed, should be developed and implemented.
• The IMP should be updated to be risk based and aligned with limits set out in the latest version of SANS:241. This must be communicated to all relevant stakeholders to ensure the appropriate response to any incidents.
• All compliance monitoring data should be timeously uploaded to the BDS.
• Budget and expenditure information should be compiled for each water system.
• Operational flows at the treatment plants should be recorded daily and monitored against design capacity.
• Water balances should be completed for each water system and initiatives developed and implemented to reduce non-revenue water.
Of concern is the poor microbiological compliance in the systems of Eendekuil, Piketberg and Redelinghuys. This needs to be addressed urgently to ensure that water supplied to the community meets the drinking water quality criteria to prevent health impacts. High failures of turbidity, aluminium and residual chlorine levels indicate that improved operational practices may be required.
Based on the above Audit results, the DWS has serious concerns on the poor microbiological drinking water quality and the resultant risk to consumers of the Eendekuil, Piketberg and Redelinghuys water supply systems. These concerns have to be addressed as a matter of urgency and drinking water quality results and appropriate actions must be communicated to consumers should the water be found to be unfit for human consumption.
The Bergrivier Local Municipality was well prepared for the assessment and demonstrated a positive approach to the Blue Drop Certification Programme. Consequently, it is anticipated that through acknowledgement of the identified gaps that progressive improvement in compliance will once again be achieved in future assessments.
Site Inspection Report: Piketberg and Porterville WTWs Score:
Piketberg WTW: 87%
Porterville WTW: 85%
The site inspection impression at the Piketberg WTW was considered to be very good. Areas for improvement include the installation of standby equipment for flocculent dosing and chlorination.
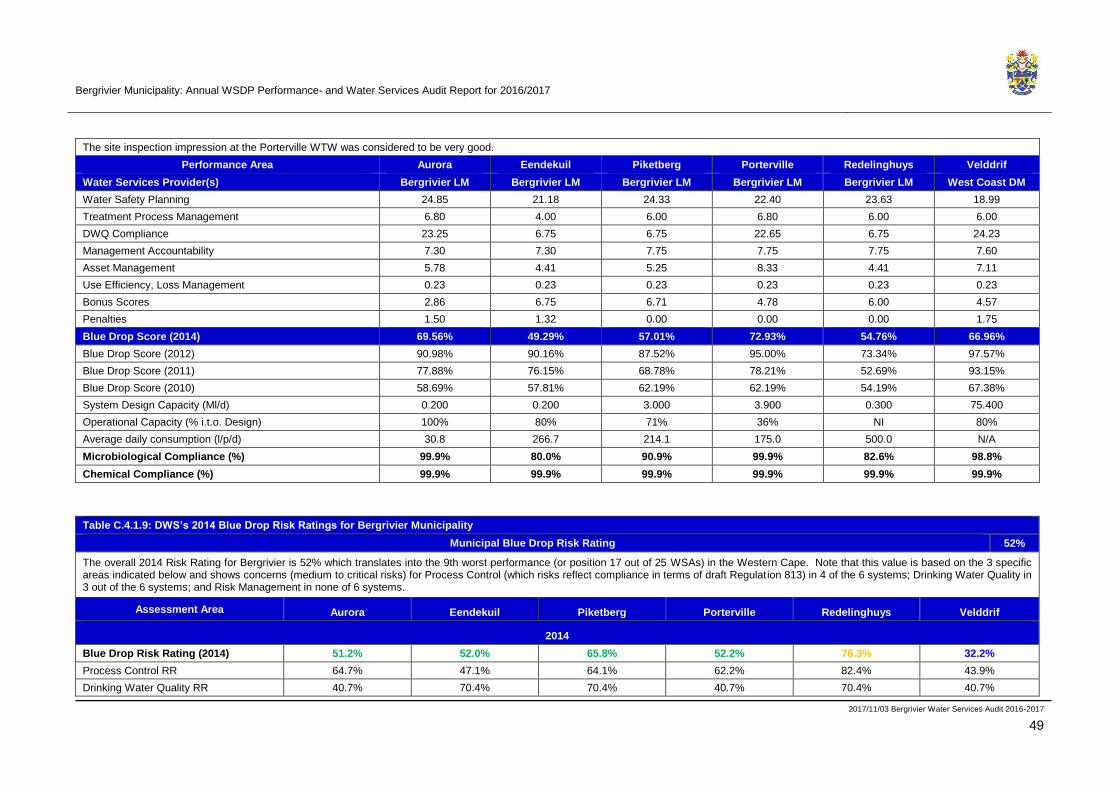
Bergrivier Municipality: Annual WSDP Performance- and Water Services Audit Report for 2016/2017
2017/11/03 Bergrivier Water Services Audit 2016-2017
49
The site inspection impression at the Porterville WTW was considered to be very good.
Performance Area Aurora Eendekuil Piketberg Porterville Redelinghuys Velddrif
Water Services Provider(s) Bergrivier LM Bergrivier LM Bergrivier LM Bergrivier LM Bergrivier LM West Coast DM
Water Safety Planning 24.85 21.18 24.33 22.40 23.63 18.99
Treatment Process Management 6.80 4.00 6.00 6.80 6.00 6.00
DWQ Compliance 23.25 6.75 6.75 22.65 6.75 24.23
Management Accountability 7.30 7.30 7.75 7.75 7.75 7.60
Asset Management 5.78 4.41 5.25 8.33 4.41 7.11
Use Efficiency, Loss Management 0.23 0.23 0.23 0.23 0.23 0.23
Bonus Scores 2.86 6.75 6.71 4.78 6.00 4.57
Penalties 1.50 1.32 0.00 0.00 0.00 1.75
Blue Drop Score (2014) 69.56% 49.29% 57.01% 72.93% 54.76% 66.96%
Blue Drop Score (2012) 90.98% 90.16% 87.52% 95.00% 73.34% 97.57%
Blue Drop Score (2011) 77.88% 76.15% 68.78% 78.21% 52.69% 93.15%
Blue Drop Score (2010) 58.69% 57.81% 62.19% 62.19% 54.19% 67.38%
System Design Capacity (Ml/d) 0.200 0.200 3.000 3.900 0.300 75.400
Operational Capacity (% i.t.o. Design) 100% 80% 71% 36% NI 80%
Average daily consumption (l/p/d) 30.8 266.7 214.1 175.0 500.0 N/A
Microbiological Compliance (%) 99.9% 80.0% 90.9% 99.9% 82.6% 98.8%
Chemical Compliance (%) 99.9% 99.9% 99.9% 99.9% 99.9% 99.9%
Table C.4.1.9: DWS’s 2014 Blue Drop Risk Ratings for Bergrivier Municipality
Municipal Blue Drop Risk Rating 52%
The overall 2014 Risk Rating for Bergrivier is 52% which translates into the 9th worst performance (or position 17 out of 25 WSAs) in the Western Cape. Note that this value is based on the 3 specific areas indicated below and shows concerns (medium to critical risks) for Process Control (which risks reflect compliance in terms of draft Regulation 813) in 4 of the 6 systems; Drinking Water Quality in 3 out of the 6 systems; and Risk Management in none of 6 systems.
Assessment Area Aurora Eendekuil Piketberg Porterville Redelinghuys Velddrif
2014
Blue Drop Risk Rating (2014) 51.2% 52.0% 65.8% 52.2% 76.3% 32.2%
Process Control RR 64.7% 47.1% 64.1% 62.2% 82.4% 43.9%
Drinking Water Quality RR 40.7% 70.4% 70.4% 40.7% 70.4% 40.7%

Bergrivier Municipality: Annual WSDP Performance- and Water Services Audit Report for 2016/2017
2017/11/03 Bergrivier Water Services Audit 2016-2017
50
Table C.4.1.9: DWS’s 2014 Blue Drop Risk Ratings for Bergrivier Municipality
Municipal Blue Drop Risk Rating 52%
Risk Management RR 34.8% 34.8% 34.8% 34.8% 34.8% 39.1%
2013
Blue Drop Risk Rating (2013) 31.3% 55.6% 50.3% 36.9% 56.7% 13.2%
Process Control RR 41.2% 76.5% 56.4% 48.6% 58.8% 31.7%
Drinking Water Quality RR 11.1% 11.1% 40.7% 11.1% 40.7% 11.1%
Risk Management RR 73.9% 73.9% 82.6% 73.9% 82.6% 30.4%
2012
Blue Drop Risk Rating (2012) 54.1% 66.0% 80.2% 62.8% 63.9% 78.3%
Process Control RR 76.5% 94.1% 94.9% 78.4% 76.5% 80.5%
Drinking Water Quality RR 11.1% 11.1% 11.1% 11.1% 33.3% 11.1%
Risk Management RR 52.2% 43.5% 52.2% 52.2% 52.2% 21.7%
The average daily consumption (l/p/d) for the last four financial years are summarised in the table below:
Table C.4.1.10: Average residential daily consumption (l/p/d) for the last four financial years.
Distribution
System
2013/2014 2014/2015 2015/2016 2016/2017
Estimated
Permanent
Population
Aver. Daily
Billed
Metered Res.
& Comm.
Consump-
tion (kl)
Aver. Daily
consumption
(l/p/d)
Estimated
Permanent
Population
Aver. Daily
Billed
Metered Res.
& Comm.
Consump-
tion (kl)
Aver. Daily
consumption
(l/p/d)
Estimated
Permanent
Population
Aver. Daily
Billed
Metered Res.
& Comm.
Consump-
tion (kl)
Aver. Daily
consumption
(l/p/d)
Estimated
Permanent
Population
Aver. Daily
Billed
Metered Res.
& Comm.
Consump-
tion (kl)
Aver. Daily
consumption
(l/p/d)
Porterville 7 270 944 130 7 379 1 013 137 7 490 944 126 7 602 923 121
Piketberg 12 563 1 473 117 12 814 1 579 123 13 070 1 505 115 13 332 1 411 106
Velddrif * 12 146 1 736 143 12 754 1 976 155 13 391 2 086 156 14 061 2 332 166
Dwarskersbos * 718 219 305 743 212 285 769 223 290 796 207 260
Aurora 643 86 134 679 103 152 716 104 145 755 88 117
Eendekuil 1 592 123 77 1 624 125 77 1 656 135 82 1 689 138 82
Redelinghuys 580 85 147 583 89 153 586 79 135 588 84 143
Note: * The average residential billed metered consumptions in the above table for Velddrif and Dwarskersbos are for the period July to June each financial year, excluding the period November to February.

Bergrivier Municipality: Annual WSDP Performance- and Water Services Audit Report for 2016/2017
2017/11/03 Bergrivier Water Services Audit 2016-2017
51
DWS’s Green Drop Process
The DWS also completed their Third Order Assessment of Municipal Waste Water Treatment Plants, DWS’s Green Drop Report for 2013, which provides a scientific and verifiable status of municipal waste water treatment. Green drop status is awarded to those WSAs that comply with 90% criteria on key selected indicators on waste water quality management. The green drop performance of Bergrivier Municipality is summarised as follows in the DWS’s 2013 Green Drop Report:
Table C.4.1.11: Green Drop Performance of the Municipality (DWS’s 2013 Green Drop Report)
Average Green Drop Score 2009 – 11.00%, 2011 – 70.00%, 2013 - 44.21%
Regulatory Impression: Bergrivier Local Municipality’s performance is not on par with the Regulator’s expectations. The significant decline in the municipal Green Drop score from 70% (2011) to 44.2% indicates that the gains of 2011 have not been carried forward. The Regulator finds it hard to justify the current performance of the municipality, given that a skilled and competent supervisory structure is in place, albeit shortcomings in the support structures were observed. The score awarded to Bergrivier also impacts on the Provincial Green Drop score for Western Cape, and the municipality is to realise that not only does the score fails the good that has been done in the municipality, but also in the region.
The Green Water Services Audit revealed substantial shortcomings in the areas of risk- and asset management, as well as effluent quality. As risk management and effluent quality comprises of 45% of the total Green Drop score, this is possibly the areas that the municipality need to focus going forward. The mismatch between the good site inspection score 79% and the 62% Green Drop score (see Porterville site assessment) suggest that the municipality has indeed evidence of good practice, but that such evidence has not been organised to represent the municipality to its full potential. The Regulatory wish to encourage the municipality to return to its previous benchmark and build on the good work previously achieved.
The decline in the Green Drop score is reflected in the CRR ratings as well, with 2 plants having moved from a low risk to a high risk position.
Green Drop findings:
1. Three (3) of five (5) plants do not keep operational logbooks at the sites, whilst two (2) plants do not have O&M manuals in place
2. Despite good registration status of supervisor/s, the Process Controllers category is lacking.
3. Two (2) of the plants do not have evidence of design capacity and are not monitoring the inflow to the plants, which compromise the daily operation of the plants and medium term forward planning. The awarding of -40% attest to the seriousness of this default
4. Despite a good attempt to maintain best practice in compliance monitoring, none of the systems have succeeded in presenting operational monitoring regimes. This in part, could be the reason why better effluent quality has not been achieved.
5. The W2RAP has been drafted, but is of sub-standard quality and does not represent a forward thinking and acting process to guide planning and implementation actions and resources. No incident management protocol is available. No signature by the Municipal Manager and/or CFO could be presented.
6. All systems failed in terms of asset registers, condition of assets, as well as cost pertaining to collection and treatment of sewage in the municipality. This again impacts on the ability to set tariffs and enhance revenue practices.
7. Four (4) of five (5) systems failed in terms of proof that pump stations are being maintained, and that all wastewater reaches the treatment plant.
Site Inspection Score: Porterville WWTW 70%
GREEN DROP REPORT CARD
Key Performance Area Porterville Dwarskersbos Velddrif Eendekuil Piketberg
Process Control and Maintenance Skills 76 42 56 42 71
Monitoring Programme 83 83 75 59 88
Submission of Results 100 100 100 100 100
Effluent Quality Compliance 66 10 10 10 34
Risk Management 25 25 25 25 25
Local Regulation 24 24 24 24 24
Treatment Capacity 66 -40 66 -40 26
Asset Management 38 13 13 13 13
Bonus Scores 7.54 6.75 9.63 2.07 9.09
Penalties 3.48 3.60 3.60 3.60 3.60
Green Drop Score (2013) 62.60% 32.48% 40.91% 24.23% 48.94%
Green Drop Score (2011) 81.50% 73.30% 58.40% 38.00% 73.80%
Green Drop Score (2009) 16.60% 11.00% 5.00% NA (0%) 11.00%
System Design Capacity (Ml/d) 1.088 NI (1) 0.97 NI (1) 3.15
Capacity Utilisation (% ADWF i.t.o. Design Capacity) 66.36% 151.00% 60.00% 151.00% 74.29%
Resource Discharged into Golf course Golf course Golf course Golf course Golf course

Bergrivier Municipality: Annual WSDP Performance- and Water Services Audit Report for 2016/2017
2017/11/03 Bergrivier Water Services Audit 2016-2017
52
GREEN DROP REPORT CARD
Key Performance Area Porterville Dwarskersbos Velddrif Eendekuil Piketberg
Microbiological Compliance 83.33% 75.00% 41.67% 58.33% 50.00%
Chemical Compliance 93.75% 70.83% 29.17% 29.17% 68.75%
Physical Compliance 100.00% 33.33% 61.11% 75.00% 91.67%
Overall Compliance 94.79% 57.29% 42.71% 50.00% 75.00%
Wastewater Risk Rating (2012) 41.20% 52.90% 58.80% 58.80% 58.80%
Wastewater Risk Rating (2013) 41.18% 76.47% 58.82% 76.47% 58.82%
The 2014 Green Drop Risk Profile Progress Report of the DWS is further the product of a “gap” year, whereby progress is reported in terms of the improvement or decline in the risk position of the particular WWTW, as compare to the previous year’s risks profile. This tool to collect, assess and report the risk profile is called the Green Drop Progress Assessment Tool (PAT). The PAT progress assessment period was done on compliance data and actions during 1 July 2012 – 30 June 2013, which represents the year immediately following the Green Drop 2013 assessment period. The results for Bergrivier Municipality were summarised as follow in DWS’s 2014 Green Drop Risk Profile Progress Report.
Table C.4.1.12: DWS’s 2014 Green Drop Risk Profile Progress Report results for Bergrivier Municipality
Assessment Areas Porterville Dwarskersbos Velddrif Eendekuil Piketberg
Technology
Activated sludge and mechanical
aeration Lagoons
Anaerobic ponds/ Facultative ponds
Anaerobic digestion
Biological (trickling) filters
Anaerobic digestion
Anaerobic ponds/ Facultative ponds
Anaerobic digestion
Activated sludge and mechanical
aeration Lagoons
Design Capacity (Ml/d) 1.2 0.294 0.97 0.14 3.15
Operational flow (% of Design Capacity)
66.7% 17.0% 63.9% 71.4% 62.2%
Microbiological Compliance 75.0% 33.0% 8.0% 33.0% 50.0%
Chemical Compliance 83.3% 62.5% 27.0% 33.3% 56.3%
Physical Compliance 97.3% 39.0% 53.0% 64.0% 89.0%
Annual Average Effluent
Quality Compliance 85.2% 44.8% 29.3% 43.4% 65.1%
Wastewater Risk Rating
(%CRR/CRRmax) 41.2% (↓) 52.9% (↑) 58.8% (↓) 58.8% (↓) 58.8% (↓)
Highest Risk Area Effluent quality Low flow to plant Effluent quality (disinfection)
Effluent / sludge management
Effluent quality / sludge
management
Risk Abatement Process Final W2RAP Final W2RAP Final W2RAP Final W2RAP Final W2RAP
Capital & Refurbishment expenditure in 2010/2011
R 100 000 R 0 R 300 000 R 0 R 8 087 000
Description of Projects’ Expenditure
Replace and repair
aerators/pumps N/A
Replace sewerage pumps and install
new telemetry N/A
Upgrade of WWTW to
double up the capacity
Wastewater Risk Abatement Planning
Bergrivier produced a simple W2RAP in-house which uses the CRR 2009 as baseline values and then identify the risks and mitigation measures to reduce the various elements of the CRR (A,B,C,D) in the period >2010. Further work would be required to add more intelligence to the approach, however, this provides for a meaningful 1st phase to risk abatement,
Additional Notes Significant effort has been made to address key risk areas, as can be seen by the allocation of financial resources.
Regulatory Impression
The municipality was well prepared and aim to raise the Green Drop score by a further 10% (from 72%) for the 2012/13 year. Upgrades to the systems have been made, resulting in improved compliance at most plants. However, the Velddrif and Eendekuil plants are not meeting standards. A W2RAP is in place and are being implemented to ensure that high risk areas are abated. Flows are monitored at each site, with the exception of Dwarskersbos, which receive low flow to the pond system. All indicators are that Berg River is showing PROGRESS against the CRR rating over the 2011 to 2012 assessment year. The team is congratulated for their preparedness and positive contribution to the PAT assessments.
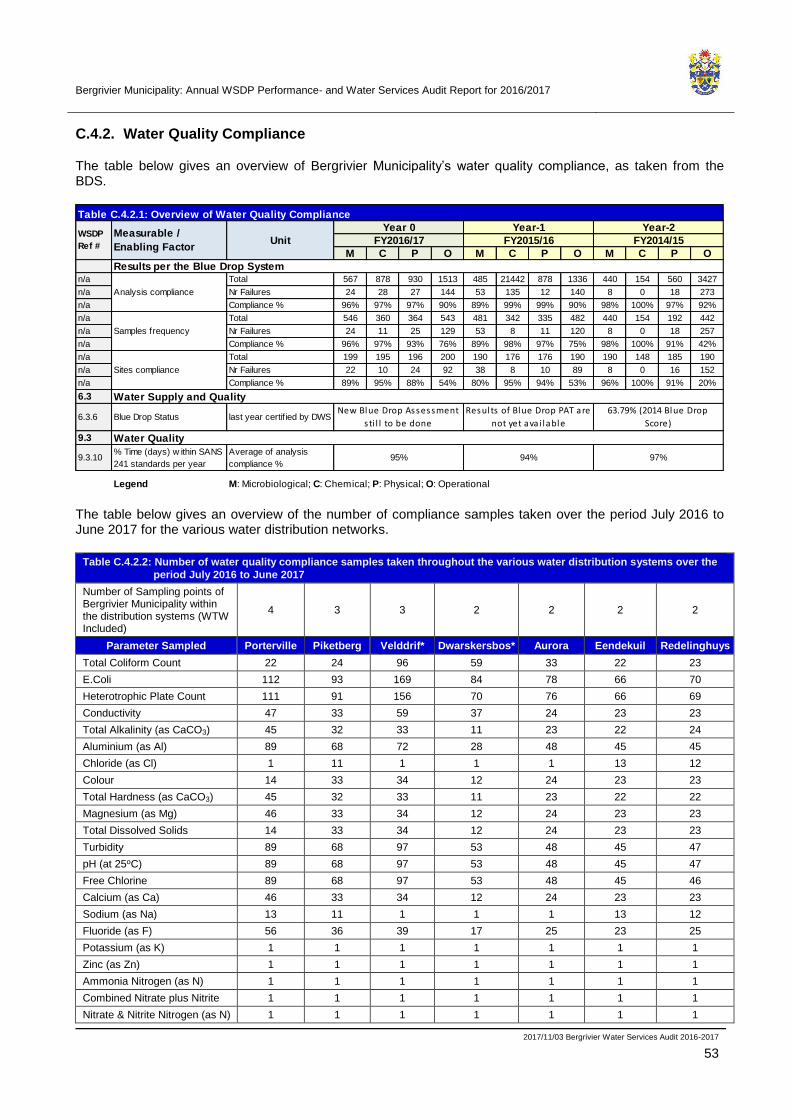
Bergrivier Municipality: Annual WSDP Performance- and Water Services Audit Report for 2016/2017
2017/11/03 Bergrivier Water Services Audit 2016-2017
53
C.4.2. Water Quality Compliance
The table below gives an overview of Bergrivier Municipality’s water quality compliance, as taken from the BDS.
M C P O M C P O M C P O
Results per the Blue Drop Systemn/a Total 567 878 930 1513 485 21442 878 1336 440 154 560 3427
n/a Nr Failures 24 28 27 144 53 135 12 140 8 0 18 273
n/a Compliance % 96% 97% 97% 90% 89% 99% 99% 90% 98% 100% 97% 92%
n/a Total 546 360 364 543 481 342 335 482 440 154 192 442
n/a Nr Failures 24 11 25 129 53 8 11 120 8 0 18 257
n/a Compliance % 96% 97% 93% 76% 89% 98% 97% 75% 98% 100% 91% 42%
n/a Total 199 195 196 200 190 176 176 190 190 148 185 190
n/a Nr Failures 22 10 24 92 38 8 10 89 8 0 16 152
n/a Compliance % 89% 95% 88% 54% 80% 95% 94% 53% 96% 100% 91% 20%
6.3
6.3.6 Blue Drop Status last year certif ied by DWS
9.3
9.3.10% Time (days) w ithin SANS
241 standards per year
Average of analysis
compliance %
Legend M: Microbiological; C: Chemical; P: Physical; O: Operational
Analysis compliance
Samples frequency
Sites compliance
Water Supply and Quality
95% 94% 97%
63.79% (2014 Blue Drop
Score)
Water Quality
Results of Blue Drop PAT are
not yet avai lable
New Blue Drop Assessment
s ti l l to be done
Table C.4.2.1: Overview of Water Quality Compliance
WSDP
Ref #
Measurable /
Enabling FactorUnit
Year 0 Year-1 Year-2
FY2016/17 FY2015/16 FY2014/15
The table below gives an overview of the number of compliance samples taken over the period July 2016 to June 2017 for the various water distribution networks.
Table C.4.2.2: Number of water quality compliance samples taken throughout the various water distribution systems over the
period July 2016 to June 2017
Number of Sampling points of Bergrivier Municipality within the distribution systems (WTW Included)
4 3 3 2 2 2 2
Parameter Sampled Porterville Piketberg Velddrif* Dwarskersbos* Aurora Eendekuil Redelinghuys
Total Coliform Count 22 24 96 59 33 22 23
E.Coli 112 93 169 84 78 66 70
Heterotrophic Plate Count 111 91 156 70 76 66 69
Conductivity 47 33 59 37 24 23 23
Total Alkalinity (as CaCO3) 45 32 33 11 23 22 24
Aluminium (as Al) 89 68 72 28 48 45 45
Chloride (as Cl) 1 11 1 1 1 13 12
Colour 14 33 34 12 24 23 23
Total Hardness (as CaCO3) 45 32 33 11 23 22 22
Magnesium (as Mg) 46 33 34 12 24 23 23
Total Dissolved Solids 14 33 34 12 24 23 23
Turbidity 89 68 97 53 48 45 47
pH (at 25oC) 89 68 97 53 48 45 47
Free Chlorine 89 68 97 53 48 45 46
Calcium (as Ca) 46 33 34 12 24 23 23
Sodium (as Na) 13 11 1 1 1 13 12
Fluoride (as F) 56 36 39 17 25 23 25
Potassium (as K) 1 1 1 1 1 1 1
Zinc (as Zn) 1 1 1 1 1 1 1
Ammonia Nitrogen (as N) 1 1 1 1 1 1 1
Combined Nitrate plus Nitrite 1 1 1 1 1 1 1
Nitrate & Nitrite Nitrogen (as N) 1 1 1 1 1 1 1

Bergrivier Municipality: Annual WSDP Performance- and Water Services Audit Report for 2016/2017
2017/11/03 Bergrivier Water Services Audit 2016-2017
54
Table C.4.2.2: Number of water quality compliance samples taken throughout the various water distribution systems over the
period July 2016 to June 2017
Number of Sampling points of Bergrivier Municipality within the distribution systems (WTW Included)
4 3 3 2 2 2 2
Parameter Sampled Porterville Piketberg Velddrif* Dwarskersbos* Aurora Eendekuil Redelinghuys
Nitrate as N 1 1 1 1 1 1 1
Nitrite as N 1 1 1 1 1 1 1
Sulphate (as SO42-) 1 1 1 1 1 1 1
Iron (as Fe) 13 1 1 1 1 1 1
Manganese (as Mn) 13 1 1 1 1 1 1
Antimony (as Sb) 1 1 1 1 1 1 1
Arsenic (as As) 1 1 1 1 1 1 1
Cadmium (as Cd) 1 1 1 1 1 1 1
Chromium (as Cr) 1 1 1 1 1 1 1
Copper (as Cu) 1 1 1 1 1 1 1
Lead (as Pb) 1 1 1 1 1 1 1
Mercury (as Hg) 1 1 1 1 1 1 1
Nickel (as Ni) 1 1 1 1 1 1 1
Selenium (as Se) 1 1 1 1 1 1 1
Uranium (as U) 1 1 1 1 1 1 1
Cyanide 1 1 1 1 1 1 1
Total Organic Carbon 1 1 1 1 1 1 1
Chloroform 1 1 1 1 1 1 1
Bromoform 1 1 1 1 1 1 1
Dibromochloromethane 1 1 1 1 1 1 1
Bromodichloromethane 1 1 1 1 1 1 1
Combined Trihalomethanes 1 1 1 1 1 1 1
Microcystin 1 1 1 1 1 1 1
Phenols 1 1 1 1 1 1 1
Somatic Coliphages 1 1 1 1 1 1 1
Giardia Species 1 1 1 1 1 1 1
Cryptosporidium Species 1 1 1 1 1 1 1
Monochloramine 1 1 1 1 1 1 1
Barium 1 1 1 1 1 1 1
Baron 1 1 1 1 1 1 1
Total number of samples 987 802 1 121 561 607 577 592
Notes: * Velddrif and Dwarskersbos include the samples taken by the West Coast District Municipality in these two towns.
The water quality compliance sample results are included in Annexure D for each of the distribution systems. The overall percentage of compliance of the water quality samples taken over the period July 2016 to June 2017 is summarised in the table below per distribution system (SANS 241: 2015 Limits).
Table C.4.2.3: Percentage compliance of the water quality samples for the period July 2016 to June 2017
Performance Indicator
Performance Indicator
categorised as unacceptable
Yes / No
(Table 4 of SANS 241-2:2015)
% Sample Compliance
according to SANS
241-2015 Limits
Frequency of Additional
Monitoring due to failure
(Table 3 of SANS 241-
2:2015)
Porterville
Acute Health Chemical No (Excellent) 100.0% -
Acute Health Microbiological Yes (Unacceptable) 94.7% Monthly
Chronic Health No (Excellent) 100.0% -
Aesthetic No (Excellent) 98.7% -
Operational Efficiency No (Good) 90.3% -
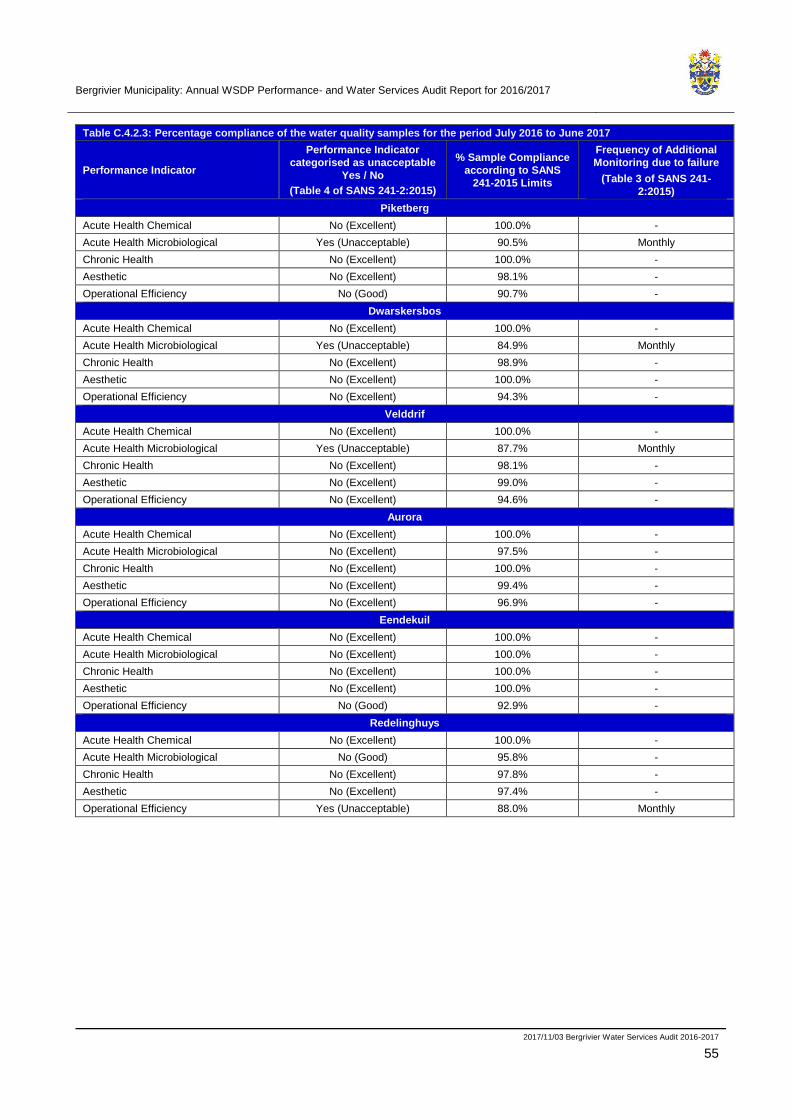
Bergrivier Municipality: Annual WSDP Performance- and Water Services Audit Report for 2016/2017
2017/11/03 Bergrivier Water Services Audit 2016-2017
55
Table C.4.2.3: Percentage compliance of the water quality samples for the period July 2016 to June 2017
Performance Indicator
Performance Indicator
categorised as unacceptable
Yes / No
(Table 4 of SANS 241-2:2015)
% Sample Compliance
according to SANS
241-2015 Limits
Frequency of Additional
Monitoring due to failure
(Table 3 of SANS 241-
2:2015)
Piketberg
Acute Health Chemical No (Excellent) 100.0% -
Acute Health Microbiological Yes (Unacceptable) 90.5% Monthly
Chronic Health No (Excellent) 100.0% -
Aesthetic No (Excellent) 98.1% -
Operational Efficiency No (Good) 90.7% -
Dwarskersbos
Acute Health Chemical No (Excellent) 100.0% -
Acute Health Microbiological Yes (Unacceptable) 84.9% Monthly
Chronic Health No (Excellent) 98.9% -
Aesthetic No (Excellent) 100.0% -
Operational Efficiency No (Excellent) 94.3% -
Velddrif
Acute Health Chemical No (Excellent) 100.0% -
Acute Health Microbiological Yes (Unacceptable) 87.7% Monthly
Chronic Health No (Excellent) 98.1% -
Aesthetic No (Excellent) 99.0% -
Operational Efficiency No (Excellent) 94.6% -
Aurora
Acute Health Chemical No (Excellent) 100.0% -
Acute Health Microbiological No (Excellent) 97.5% -
Chronic Health No (Excellent) 100.0% -
Aesthetic No (Excellent) 99.4% -
Operational Efficiency No (Excellent) 96.9% -
Eendekuil
Acute Health Chemical No (Excellent) 100.0% -
Acute Health Microbiological No (Excellent) 100.0% -
Chronic Health No (Excellent) 100.0% -
Aesthetic No (Excellent) 100.0% -
Operational Efficiency No (Good) 92.9% -
Redelinghuys
Acute Health Chemical No (Excellent) 100.0% -
Acute Health Microbiological No (Good) 95.8% -
Chronic Health No (Excellent) 97.8% -
Aesthetic No (Excellent) 97.4% -
Operational Efficiency Yes (Unacceptable) 88.0% Monthly

Bergrivier Municipality: Annual WSDP Performance- and Water Services Audit Report for 2016/2017
2017/11/03 Bergrivier Water Services Audit 2016-2017
56
The table below gives an overview of the five categories under which the risks posed by micro-organism, physical or aesthetic property or chemical substance of potable water is normally classified:
Table C.4.2.4.: Four categories under which the risks posed by micro-organism, physical or aesthetic property or chemical
substance of potable water is normally classified
Category Risk
Acute Health Determinand that poses an immediate unacceptable health risk if present at concentration values exceeding the numerical limits specified in this part of SANS 241.
Aesthetic Determinand that taints water with respect to taste, odour and colour and that does not pose an unacceptable health risk if present at concentration values exceeding the numerical limits specified in SANS 241.
Chronic Health Determinand that poses an unacceptable health risk if ingested over an extended period if present at concentration values exceeding the numerical limits specified in SANS 241.
Operational Determinand that is essential for assessing the efficient operation of treatment systems and risks from infrastructure
The table below gives an overview of Bergrivier Municipality’s wastewater quality compliance, as taken from the GDS.
M C P O M C P O M C P O
n/a Total - - - - - - - - - - - -n/a Nr Failures - - - - - - - - - - - -n/a Compliance % 18% 31% 42% N/A 56% 67% 55% N/A 43% 49% 41% N/A
n/a Total
n/a Nr Failures
n/a Compliance %
5.3.1
5.3.1.3
5.3.1.4
5.3.1.5
Average % of sample failure Failure % 82% 69% 58% N/A 44% 33% 45% N/A 57% 51% 59% N/A
6.3
6.4.6 Green Drop Statuslast year certified
by DWS
Legend M: Microbiologica l ; C: Chemical ; P: Phys ica l ; O: Operational
CRR Vlues: 52.9%
Dwarskersbos; 58.8%
Eendekuil, Piketberg and
Velddrif; 41.2% Porterville.
Monitoring and Sample Failure
Water Supply and Quality
FY2014/15
Results per the Green Drop System
New Green Drop
Assessment still to be
done
Green Drop PAT still to be
done
Table C.4.2.5: Overview of Wastewater Quality Compliance
Operational compliance
Regulatory compliance
WSDP
Ref #
Measurable / Enabling
FactorUnit
Year 0 Year-1 Year-2FY2016/17 FY2015/16
Not captured on GDS and recorded by Process Controllers at each of
the WWTW
The final effluent quality compliance sample results are included in Annexure D for each of the WWTWs. The overall Microbiological, Chemical and Physical compliance percentages of the final effluent samples taken over the last three financial years at the Dwarskersbos-, Eendekuil-, Piketberg-, Porterville- and Velddrif WWTW is summarised in the table below (General Limits):
Table 4.2.6: Percentage Microbiological (Faecal Coliforms) Compliance of the Compliance Samples Taken at the Various
WWTWs for the Last Three Financial Years
WWTW 2016/2017 2015/2016 2014/2015
Dwarskersbos 100% 100.0% 100.0%
Eendekuil 100% 100.0% 100.0%
Piketberg 83.3% 100.0% 54.5%
Porterville 75.0% 81.8% 81.8%
Velddrif 100.0% 100.0% 100.0%
Total 91.7% 96.6% 86.8%
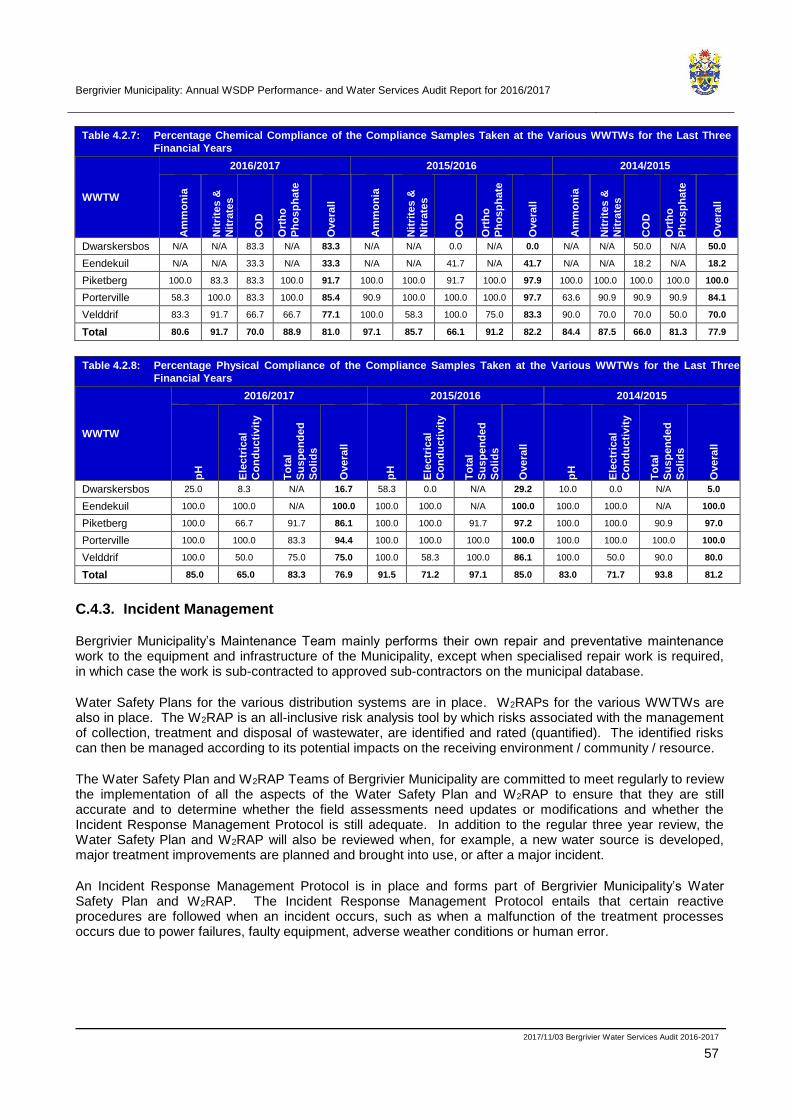
Bergrivier Municipality: Annual WSDP Performance- and Water Services Audit Report for 2016/2017
2017/11/03 Bergrivier Water Services Audit 2016-2017
57
Table 4.2.7: Percentage Chemical Compliance of the Compliance Samples Taken at the Various WWTWs for the Last Three
Financial Years
WWTW
2016/2017 2015/2016 2014/2015
Am
mo
nia
Nit
rite
s &
Nit
rate
s
CO
D
Ort
ho
Ph
os
ph
ate
Overa
ll
Am
mo
nia
Nit
rite
s &
Nit
rate
s
CO
D
Ort
ho
Ph
os
ph
ate
Overa
ll
Am
mo
nia
Nit
rite
s &
Nit
rate
s
CO
D
Ort
ho
Ph
os
ph
ate
Overa
ll
Dwarskersbos N/A N/A 83.3 N/A 83.3 N/A N/A 0.0 N/A 0.0 N/A N/A 50.0 N/A 50.0
Eendekuil N/A N/A 33.3 N/A 33.3 N/A N/A 41.7 N/A 41.7 N/A N/A 18.2 N/A 18.2
Piketberg 100.0 83.3 83.3 100.0 91.7 100.0 100.0 91.7 100.0 97.9 100.0 100.0 100.0 100.0 100.0
Porterville 58.3 100.0 83.3 100.0 85.4 90.9 100.0 100.0 100.0 97.7 63.6 90.9 90.9 90.9 84.1
Velddrif 83.3 91.7 66.7 66.7 77.1 100.0 58.3 100.0 75.0 83.3 90.0 70.0 70.0 50.0 70.0
Total 80.6 91.7 70.0 88.9 81.0 97.1 85.7 66.1 91.2 82.2 84.4 87.5 66.0 81.3 77.9
Table 4.2.8: Percentage Physical Compliance of the Compliance Samples Taken at the Various WWTWs for the Last Three
Financial Years
WWTW
2016/2017 2015/2016 2014/2015
pH
Ele
ctr
ical
Co
nd
uc
tivit
y
To
tal
Su
sp
en
de
d
So
lid
s
Overa
ll
pH
Ele
ctr
ical
Co
nd
ucti
vit
y
To
tal
Su
sp
en
de
d
So
lid
s
Overa
ll
pH
Ele
ctr
ical
Co
nd
ucti
vit
y
To
tal
Su
sp
en
de
d
So
lid
s
Overa
ll
Dwarskersbos 25.0 8.3 N/A 16.7 58.3 0.0 N/A 29.2 10.0 0.0 N/A 5.0
Eendekuil 100.0 100.0 N/A 100.0 100.0 100.0 N/A 100.0 100.0 100.0 N/A 100.0
Piketberg 100.0 66.7 91.7 86.1 100.0 100.0 91.7 97.2 100.0 100.0 90.9 97.0
Porterville 100.0 100.0 83.3 94.4 100.0 100.0 100.0 100.0 100.0 100.0 100.0 100.0
Velddrif 100.0 50.0 75.0 75.0 100.0 58.3 100.0 86.1 100.0 50.0 90.0 80.0
Total 85.0 65.0 83.3 76.9 91.5 71.2 97.1 85.0 83.0 71.7 93.8 81.2
C.4.3. Incident Management
Bergrivier Municipality’s Maintenance Team mainly performs their own repair and preventative maintenance work to the equipment and infrastructure of the Municipality, except when specialised repair work is required, in which case the work is sub-contracted to approved sub-contractors on the municipal database.
Water Safety Plans for the various distribution systems are in place. W2RAPs for the various WWTWs are also in place. The W2RAP is an all-inclusive risk analysis tool by which risks associated with the management of collection, treatment and disposal of wastewater, are identified and rated (quantified). The identified risks can then be managed according to its potential impacts on the receiving environment / community / resource.
The Water Safety Plan and W2RAP Teams of Bergrivier Municipality are committed to meet regularly to review the implementation of all the aspects of the Water Safety Plan and W2RAP to ensure that they are still accurate and to determine whether the field assessments need updates or modifications and whether the Incident Response Management Protocol is still adequate. In addition to the regular three year review, the Water Safety Plan and W2RAP will also be reviewed when, for example, a new water source is developed, major treatment improvements are planned and brought into use, or after a major incident.
An Incident Response Management Protocol is in place and forms part of Bergrivier Municipality’s Water Safety Plan and W2RAP. The Incident Response Management Protocol entails that certain reactive procedures are followed when an incident occurs, such as when a malfunction of the treatment processes occurs due to power failures, faulty equipment, adverse weather conditions or human error.

Bergrivier Municipality: Annual WSDP Performance- and Water Services Audit Report for 2016/2017
2017/11/03 Bergrivier Water Services Audit 2016-2017
58
Year 0 Year - 1 Year - 2
FY2016/17 FY2015/16 FY2014/15
6.3 Water Supply and Quality
6.3.1 Incident Management Protocol in place yes/total schemes in % Yes / 100% Yes / 100% Yes / 100%
6.3.5 Failure Response Management in place yes/total schemes in % Yes / 100% Yes / 100% Yes / 100%
6.4 Waste Water Supply and Quality
6.4.1 Incident Management Protocol in place yes/total schemes in % Yes / 100% Yes / 100% Yes / 100%
6.4.5 Failure Response Management in place yes/total schemes in % Yes / 100% Yes / 50% Yes / 50%
WSDP Ref # Measurable / Enabling Factor Unit
Table C.4.3.1: Incident Management and Reporting Overview
Acute
Health
Mic
riobio
logic
al
Acute
Health
Chem
ical
Chro
nic
Health
Acute
Health
Mic
riobio
logic
al
Acute
Health
Chem
ical
Chro
nic
Health
Acute
Health
- 1
Mic
riobio
logic
al
Acute
Health
- 1
Chem
ical
Acute
Health
- 2
Mic
riobio
logic
al
Chro
nic
Health
Total nr 686 42 845 532 803 440 154
Nr of failures 54 0 6 63 6 8 0
Failure % 7.9% 0.0% 0.7% 11.8% 0.7% 1.8% 0.0%
Nr reported 54 0 6 63 6 8 0
Reported % of failure 100% 100% 100% 100% 100% 100% 100%
Total 686 42 845 532 803 440 154
Nr of failures 54 0 6 63 6 8 0
Failure % 7.9% 0.0% 0.7% 11.8% 0.7% 1.8% 0.0%
Nr reported 54 0 6 63 6 8 0
Reported % of failure 100% 100% 100% 100% 100% 100% 100%
Total 686 42 845 532 803 190 148
Nr of failures 54 0 6 63 6 8 0
Failure % 7.9% 0.0% 0.7% 11.8% 0.7% 4.2% 0.0%
Nr reported 54 0 6 63 6 8 0
Reported % of failure 100% 100% 100% 100% 100% 100% 100%
Table C.4.3.2: Water Quality Incident Reporting Compliance (Health Oriented)
Failures in terms
of Samples
Failures in terms
of Sites
Measurable /
Enabling
Factor
Unit
Year 0 Year-2
FY2016/17 FY2015/16 FY2014/15
Failures in terms
of Analysis
Year-1

Bergrivier Municipality: Annual WSDP Performance- and Water Services Audit Report for 2016/2017
2017/11/03 Bergrivier Water Services Audit 2016-2017
59
C.5. Water Conservation and Water Demand Management
The table below gives an overview of the WC/WDM activities implemented by Bergrivier Municipality.
7.1.1 10.2.g.i i i
Number of customers where the following
activities have been pursued:Nr % of total Nr % of total Nr % of total Nr % of total Nr % of total Nr % of total
7.1.1.1 Night flow metering 0 0% 0 0% 0 0% 0 0% 0 0% 0 0%
7.1.1.2 Day flow metering 8,854 100% 8,721 100% 8,612 100% 0 0% 0 0% 0 0%
7.1.1.3 Reticulation leaks fixed Unknown Unknown Unknown Unknown Unknown 100% 0 0% 0 0% 0 0%
7.1.1.4 Il legal connections formalized 0 0% 0 100% 0 100% 0 0% 0 0% 0 0%
7.1.1.5 Un-metered connections, metered 0 0% 0 100% 0 100% 0 0% 0 0% 0 0%
7.1.2 10.2.g.i i i
Number of residential consumers with water
supply pressure of:Nr % of total Nr % of total Nr % of total Nr % of total Nr % of total Nr % of total
7.1.2.1 < 300 kPa 5,091 57.5% 5,015 57.5% 4,952 57.5% 0 0% 0 0% 0 0%
7.1.2.2 300 kPa - 600 kPa 1,116 12.6% 1,099 12.6% 1,085 12.6% 0 0% 0 0% 0 0%
7.1.2.3 600 kPa - 900 kPa 2,249 25.4% 2,215 25.4% 2,187 25.4% 0 0% 0 0% 0 0%
7.1.2.4 10.2.b.i i i > 900 kPa 398 4.5% 392 4.5% 388 4.5% 0 0% 0 0% 0 0%
7.1.3 10.2.g.i i i
Number of consumer units targeted by: Nr % of total Nr % of total Nr % of total Nr % of total Nr % of total Nr % of total
7.1.3.1 Leak repair assistance programme 0 0% 0 0% 0 0% 0 0% 0 0% 0 0%
7.1.3.2 10.2.g.iv Retro-fitting of water inefficient toilets 0 0% 0 0% 0 0% 0 0% 0 0% 0 0%
7.1.3.3 Meter repair programme 257 3% 137 2% 215 2% 0 0% 0 0% 0 0%
7.1.4 10.2.g.i i i
Nr % of total Nr % of total Nr % of total Nr % of total Nr % of total Nr % of total
7.1.4.1Number of schools targeted by education
programmes10 50% 10 50% 10 50% 0 0% 0 0% 0 0%
7.1.4.2Number of consumers (people) targeted by
public information programmes8,854 100% 8,721 100% 8,612 100% 0 0% 0 0% 0 0%
Year - 2Year - 1
2015/16
Year - 2
2014/15
Year 0
Table C.5.1: Overview of WC/WDM Activities
REDUCING UNACCOUNTED FOR WATER AND WATER INEFFICIENCIES
REDUCING HIGH PRESSURES FOR RESIDENTIAL CONSUMERS
LEAK AND METER REPAIR PROGRAMMES
CONSUMER / END-USE DEMAND MANAGEMENT: PUBLIC INFO AND EDUCATION PROGRAMMES
WSDP
Ref. #
Regulations
Ref. #Description
Urban SettlementsYear - 1
2016/17 2015/16 2014/15
Rural SettlementsYear 0
2016/17

Bergrivier Municipality: Annual WSDP Performance- and Water Services Audit Report for 2016/2017
2017/11/03 Bergrivier Water Services Audit 2016-2017
60
Quantity of water unaccounted for (Ml/year):
Bergrivier Municipality’s WC/WDM Strategy was updated during 2014/2015 and was previously approved by Council in 2013. The average annual growth percentage in total raw water requirements for Bergrivier Municipality over the period 2010/2011 to 2016/2017 was 0.15 %/a. The table below gives a summary of the internal NRW for the various distribution systems in Bergrivier Municipality’s Management Area (System Input Volume – Billed Metered Consumption).
Table C.5.2: Internal Non revenue water for the various distribution systems
Description Unit 16/17 Record : Prior (Ml/a)
15/16 14/15 13/14 12/13 11/12 10/11
Porterville
Volume 97.301 97.391 122.740 64.188 57.359 77.961 69.434
Percentage 19.5% 18.9% 22.1% 13.9% 12.3% 16.4% 14.0%
ILI 2.50 2.57
Piketberg
Volume 93.754 69.401 75.956 171.938 137.581 157.934 79.080
Percentage 11.4% 8.3% 9.0% 20.5% 17.2% 19.4% 9.6%
ILI 1.17 0.85
Velddrif
Volume 44.615 103.854 158.547 80.910 82.753 10.066 16.242
Percentage 4.5% 10.4% 17.8% 9.1% 9.1% 1.9% 3.2%
ILI 0.90 2.19
Dwarskersbos
Volume 0.172 4.860 -0.073 7.806 17.381 4.796 7.376
Percentage 0.2% 4.7% -0.1% 7.5% 17.5% 5.1% 8.9%
ILI 0.00 0.85
Aurora
Volume 10.345 1.090 -3.388 5.572 -0.887 -5.448 -5.406
Percentage 20.3% 2.3% -8.2% 13.1% -2.3% -13.6% -13.2%
ILI 1.03 0.03
Eendekuil
Volume 27.450 26.295 12.584 -7.452 7.033 0.101 0.134
Percentage 28.8% 27.0% 15.6% -12.0% 9.1% 0.1% 0.2%
ILI 4.96 4.69
Redelinghuys
Volume 11.059 19.753 21.917 24.531 23.314 24.820 19.546
Percentage 22.5% 35.7% 36.5% 39.6% 39.9% 40.3% 31.0%
ILI 4.25 7.33
Total
Volume 284.696 322.644 388.283 347.493 324.534 270.230 186.406
Percentage 10.90% 12.13% 15.14% 14.13% 13.24% 10.93% 7.21%
ILI 1.34 1.54
Note: Infrastructure Leakage Index (ILI) for Developed Countries = 1 – 2 Excellent (Category A), 2 – 4 Good (Category B), 4 – 8 Poor
(Category C) and > 8 – Very Bad (Category D)
Category A = No specific intervention required.
Category B = No urgent action required although should be monitored carefully.
Category C = Requires attention
Category D = Requires immediate water loss reduction interventions
The Infrastructure Leakage Index (ILI) is also included in the above table, which is the most recent and preferred performance indicator for comparing leakage from one system to another. It is a non-dimensional index representing the ratio of the current real leakage and the “Unavoidable Annual Real Losses”. A high ILI value indicates a poor performance with large potential for improvement while a small ILI value indicates a well-managed system with less scope for improvement. The parameters used to calculate the ILIs for the various distribution systems are included in the Models in Annexure B. Attaining and ILI = 1 is a theoretical limit which is the minimum water loss in an operational water reticulation system. A value of less than 1 should not occur since this implies that the actual leakage is less than the theoretical minimum level of leakage.
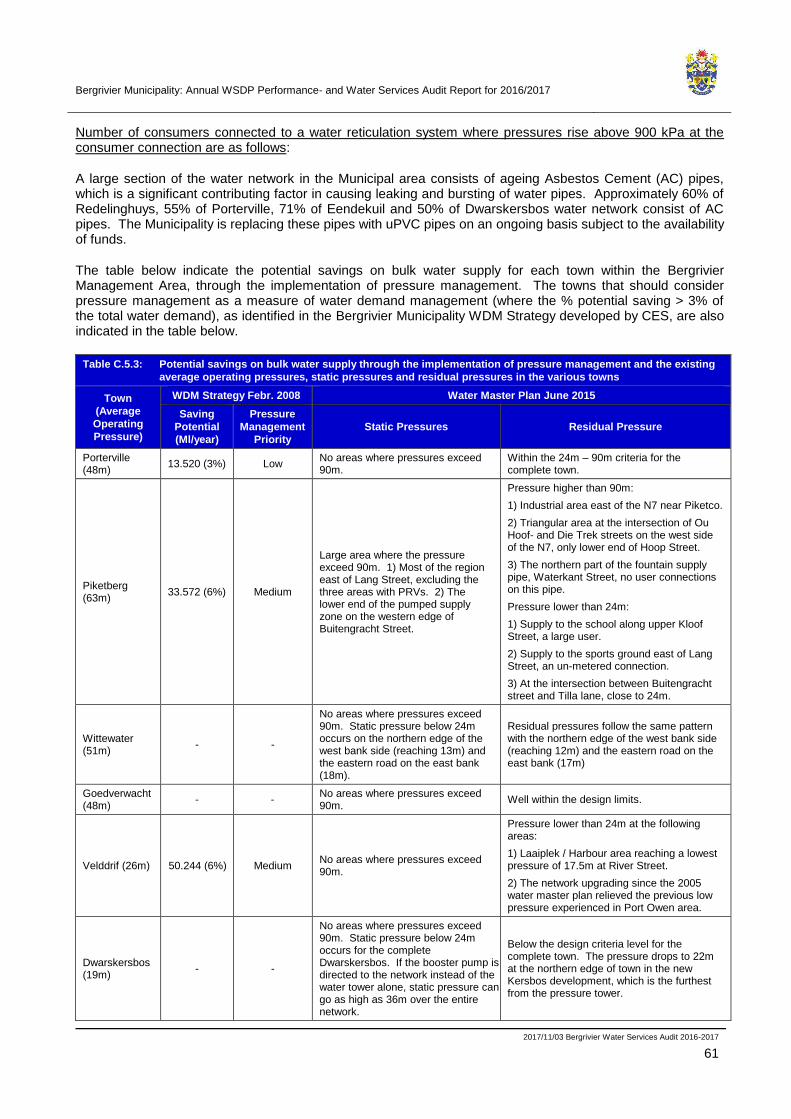
Bergrivier Municipality: Annual WSDP Performance- and Water Services Audit Report for 2016/2017
2017/11/03 Bergrivier Water Services Audit 2016-2017
61
Number of consumers connected to a water reticulation system where pressures rise above 900 kPa at the consumer connection are as follows:
A large section of the water network in the Municipal area consists of ageing Asbestos Cement (AC) pipes, which is a significant contributing factor in causing leaking and bursting of water pipes. Approximately 60% of Redelinghuys, 55% of Porterville, 71% of Eendekuil and 50% of Dwarskersbos water network consist of AC pipes. The Municipality is replacing these pipes with uPVC pipes on an ongoing basis subject to the availability of funds.
The table below indicate the potential savings on bulk water supply for each town within the Bergrivier Management Area, through the implementation of pressure management. The towns that should consider pressure management as a measure of water demand management (where the % potential saving > 3% of the total water demand), as identified in the Bergrivier Municipality WDM Strategy developed by CES, are also indicated in the table below.
Table C.5.3: Potential savings on bulk water supply through the implementation of pressure management and the existing
average operating pressures, static pressures and residual pressures in the various towns
Town
(Average
Operating
Pressure)
WDM Strategy Febr. 2008 Water Master Plan June 2015
Saving
Potential
(Ml/year)
Pressure
Management
Priority
Static Pressures Residual Pressure
Porterville (48m)
13.520 (3%) Low No areas where pressures exceed 90m.
Within the 24m – 90m criteria for the complete town.
Piketberg (63m)
33.572 (6%) Medium
Large area where the pressure exceed 90m. 1) Most of the region east of Lang Street, excluding the three areas with PRVs. 2) The lower end of the pumped supply zone on the western edge of Buitengracht Street.
Pressure higher than 90m:
1) Industrial area east of the N7 near Piketco.
2) Triangular area at the intersection of Ou Hoof- and Die Trek streets on the west side of the N7, only lower end of Hoop Street.
3) The northern part of the fountain supply pipe, Waterkant Street, no user connections on this pipe.
Pressure lower than 24m:
1) Supply to the school along upper Kloof Street, a large user.
2) Supply to the sports ground east of Lang Street, an un-metered connection.
3) At the intersection between Buitengracht street and Tilla lane, close to 24m.
Wittewater (51m)
- -
No areas where pressures exceed 90m. Static pressure below 24m occurs on the northern edge of the west bank side (reaching 13m) and the eastern road on the east bank (18m).
Residual pressures follow the same pattern with the northern edge of the west bank side (reaching 12m) and the eastern road on the east bank (17m)
Goedverwacht (48m)
- - No areas where pressures exceed 90m.
Well within the design limits.
Velddrif (26m) 50.244 (6%) Medium No areas where pressures exceed 90m.
Pressure lower than 24m at the following areas:
1) Laaiplek / Harbour area reaching a lowest pressure of 17.5m at River Street.
2) The network upgrading since the 2005 water master plan relieved the previous low pressure experienced in Port Owen area.
Dwarskersbos (19m)
- -
No areas where pressures exceed 90m. Static pressure below 24m occurs for the complete Dwarskersbos. If the booster pump is directed to the network instead of the water tower alone, static pressure can go as high as 36m over the entire network.
Below the design criteria level for the complete town. The pressure drops to 22m at the northern edge of town in the new Kersbos development, which is the furthest from the pressure tower.
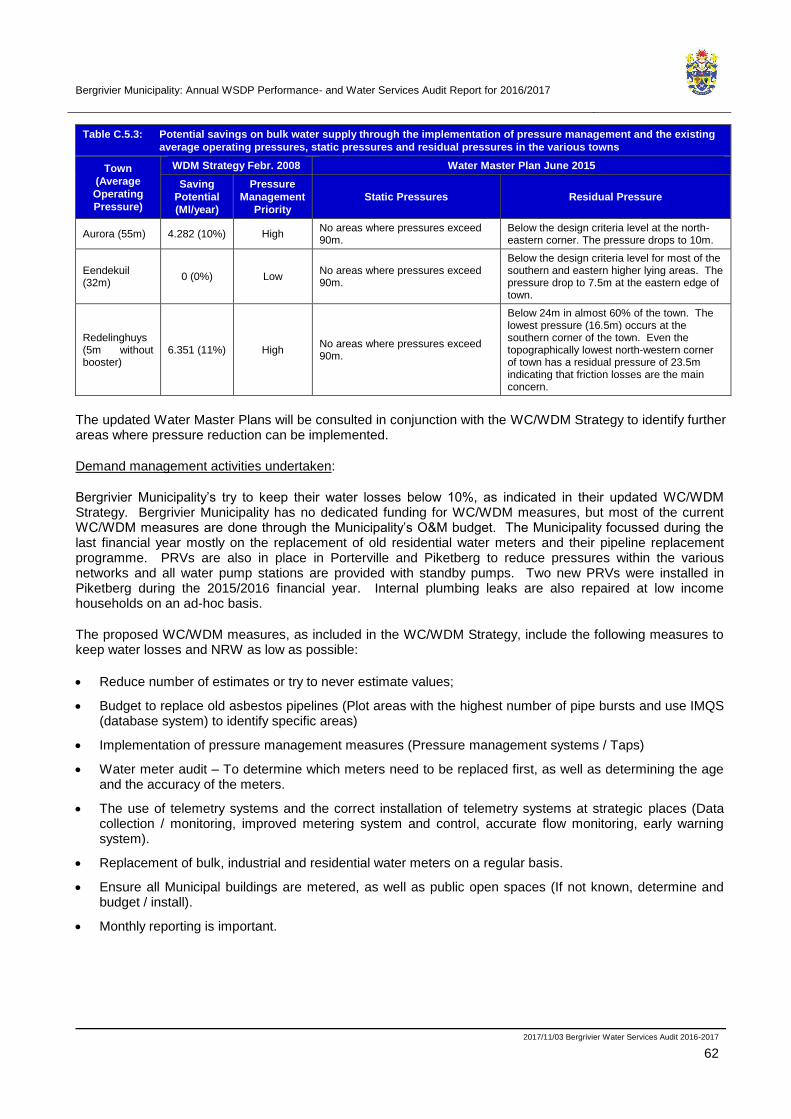
Bergrivier Municipality: Annual WSDP Performance- and Water Services Audit Report for 2016/2017
2017/11/03 Bergrivier Water Services Audit 2016-2017
62
Table C.5.3: Potential savings on bulk water supply through the implementation of pressure management and the existing
average operating pressures, static pressures and residual pressures in the various towns
Town
(Average
Operating
Pressure)
WDM Strategy Febr. 2008 Water Master Plan June 2015
Saving
Potential
(Ml/year)
Pressure
Management
Priority
Static Pressures Residual Pressure
Aurora (55m) 4.282 (10%) High No areas where pressures exceed 90m.
Below the design criteria level at the north-eastern corner. The pressure drops to 10m.
Eendekuil (32m)
0 (0%) Low No areas where pressures exceed 90m.
Below the design criteria level for most of the southern and eastern higher lying areas. The pressure drop to 7.5m at the eastern edge of town.
Redelinghuys (5m without booster)
6.351 (11%) High No areas where pressures exceed 90m.
Below 24m in almost 60% of the town. The lowest pressure (16.5m) occurs at the southern corner of the town. Even the topographically lowest north-western corner of town has a residual pressure of 23.5m indicating that friction losses are the main concern.
The updated Water Master Plans will be consulted in conjunction with the WC/WDM Strategy to identify further areas where pressure reduction can be implemented.
Demand management activities undertaken:
Bergrivier Municipality’s try to keep their water losses below 10%, as indicated in their updated WC/WDM Strategy. Bergrivier Municipality has no dedicated funding for WC/WDM measures, but most of the current WC/WDM measures are done through the Municipality’s O&M budget. The Municipality focussed during the last financial year mostly on the replacement of old residential water meters and their pipeline replacement programme. PRVs are also in place in Porterville and Piketberg to reduce pressures within the various networks and all water pump stations are provided with standby pumps. Two new PRVs were installed in Piketberg during the 2015/2016 financial year. Internal plumbing leaks are also repaired at low income households on an ad-hoc basis.
The proposed WC/WDM measures, as included in the WC/WDM Strategy, include the following measures to keep water losses and NRW as low as possible:
• Reduce number of estimates or try to never estimate values;
• Budget to replace old asbestos pipelines (Plot areas with the highest number of pipe bursts and use IMQS (database system) to identify specific areas)
• Implementation of pressure management measures (Pressure management systems / Taps)
• Water meter audit – To determine which meters need to be replaced first, as well as determining the age and the accuracy of the meters.
• The use of telemetry systems and the correct installation of telemetry systems at strategic places (Data collection / monitoring, improved metering system and control, accurate flow monitoring, early warning system).
• Replacement of bulk, industrial and residential water meters on a regular basis.
• Ensure all Municipal buildings are metered, as well as public open spaces (If not known, determine and budget / install).
• Monthly reporting is important.
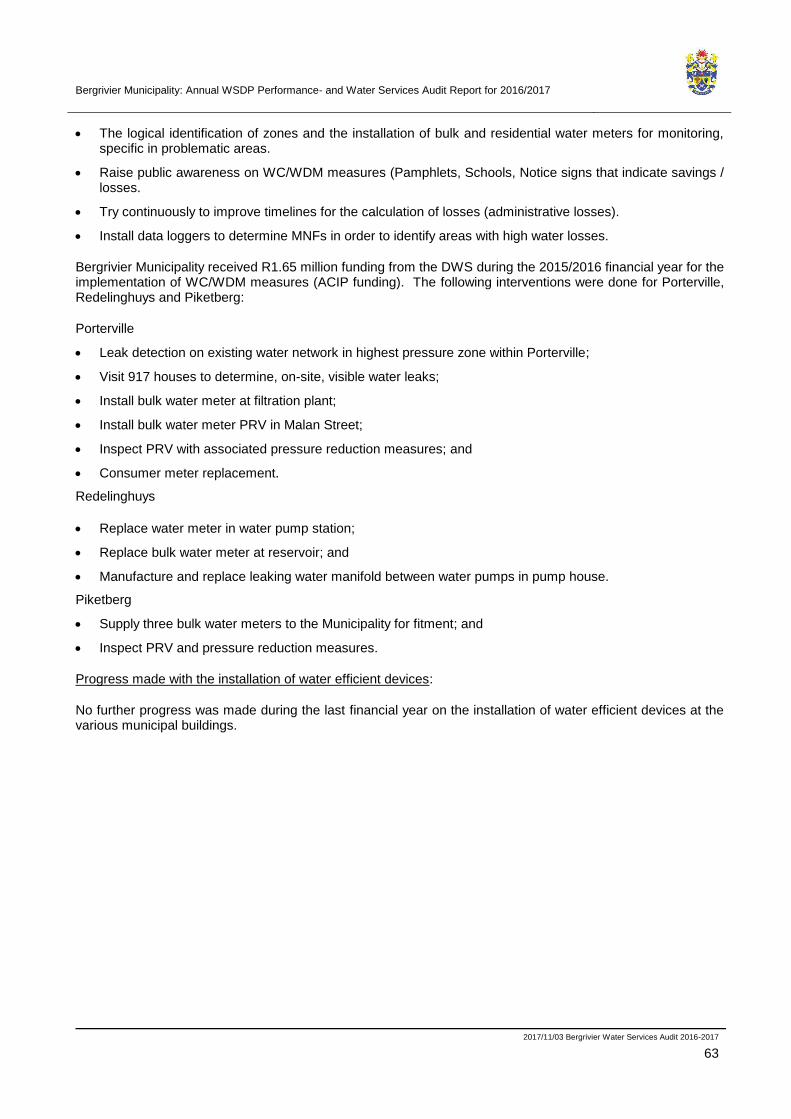
Bergrivier Municipality: Annual WSDP Performance- and Water Services Audit Report for 2016/2017
2017/11/03 Bergrivier Water Services Audit 2016-2017
63
• The logical identification of zones and the installation of bulk and residential water meters for monitoring, specific in problematic areas.
• Raise public awareness on WC/WDM measures (Pamphlets, Schools, Notice signs that indicate savings / losses.
• Try continuously to improve timelines for the calculation of losses (administrative losses).
• Install data loggers to determine MNFs in order to identify areas with high water losses.
Bergrivier Municipality received R1.65 million funding from the DWS during the 2015/2016 financial year for the implementation of WC/WDM measures (ACIP funding). The following interventions were done for Porterville, Redelinghuys and Piketberg:
Porterville
• Leak detection on existing water network in highest pressure zone within Porterville;
• Visit 917 houses to determine, on-site, visible water leaks;
• Install bulk water meter at filtration plant;
• Install bulk water meter PRV in Malan Street;
• Inspect PRV with associated pressure reduction measures; and
• Consumer meter replacement.
Redelinghuys
• Replace water meter in water pump station;
• Replace bulk water meter at reservoir; and
• Manufacture and replace leaking water manifold between water pumps in pump house.
Piketberg
• Supply three bulk water meters to the Municipality for fitment; and
• Inspect PRV and pressure reduction measures.
Progress made with the installation of water efficient devices:
No further progress was made during the last financial year on the installation of water efficient devices at the various municipal buildings.
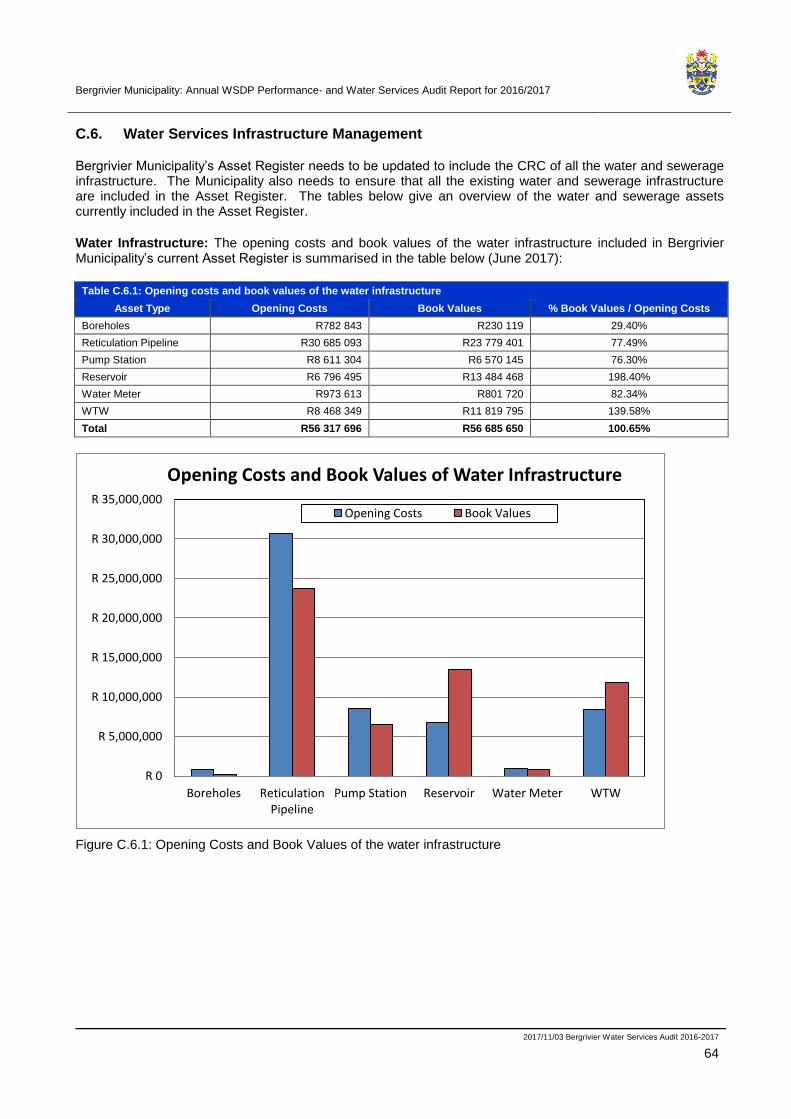
Bergrivier Municipality: Annual WSDP Performance- and Water Services Audit Report for 2016/2017
2017/11/03 Bergrivier Water Services Audit 2016-2017
64
C.6. Water Services Infrastructure Management
Bergrivier Municipality’s Asset Register needs to be updated to include the CRC of all the water and sewerage infrastructure. The Municipality also needs to ensure that all the existing water and sewerage infrastructure are included in the Asset Register. The tables below give an overview of the water and sewerage assets currently included in the Asset Register.
Water Infrastructure: The opening costs and book values of the water infrastructure included in Bergrivier Municipality’s current Asset Register is summarised in the table below (June 2017):
Table C.6.1: Opening costs and book values of the water infrastructure
Asset Type Opening Costs Book Values % Book Values / Opening Costs
Boreholes R782 843 R230 119 29.40%
Reticulation Pipeline R30 685 093 R23 779 401 77.49%
Pump Station R8 611 304 R6 570 145 76.30%
Reservoir R6 796 495 R13 484 468 198.40%
Water Meter R973 613 R801 720 82.34%
WTW R8 468 349 R11 819 795 139.58%
Total R56 317 696 R56 685 650 100.65%
R 0
R 5,000,000
R 10,000,000
R 15,000,000
R 20,000,000
R 25,000,000
R 30,000,000
R 35,000,000
Boreholes ReticulationPipeline
Pump Station Reservoir Water Meter WTW
Opening Costs and Book Values of Water Infrastructure
Opening Costs Book Values
Figure C.6.1: Opening Costs and Book Values of the water infrastructure
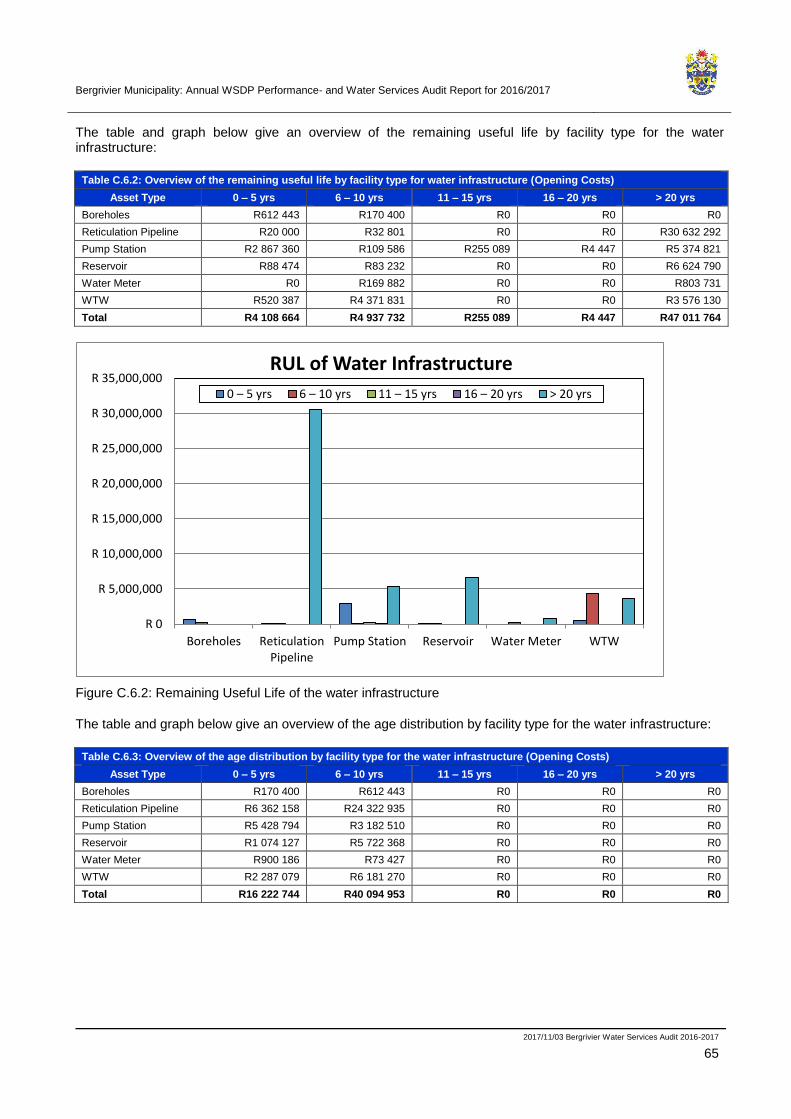
Bergrivier Municipality: Annual WSDP Performance- and Water Services Audit Report for 2016/2017
2017/11/03 Bergrivier Water Services Audit 2016-2017
65
The table and graph below give an overview of the remaining useful life by facility type for the water infrastructure:
Table C.6.2: Overview of the remaining useful life by facility type for water infrastructure (Opening Costs)
Asset Type 0 – 5 yrs 6 – 10 yrs 11 – 15 yrs 16 – 20 yrs > 20 yrs
Boreholes R612 443 R170 400 R0 R0 R0
Reticulation Pipeline R20 000 R32 801 R0 R0 R30 632 292
Pump Station R2 867 360 R109 586 R255 089 R4 447 R5 374 821
Reservoir R88 474 R83 232 R0 R0 R6 624 790
Water Meter R0 R169 882 R0 R0 R803 731
WTW R520 387 R4 371 831 R0 R0 R3 576 130
Total R4 108 664 R4 937 732 R255 089 R4 447 R47 011 764
R 0
R 5,000,000
R 10,000,000
R 15,000,000
R 20,000,000
R 25,000,000
R 30,000,000
R 35,000,000
Boreholes ReticulationPipeline
Pump Station Reservoir Water Meter WTW
RUL of Water Infrastructure
0 – 5 yrs 6 – 10 yrs 11 – 15 yrs 16 – 20 yrs > 20 yrs
Figure C.6.2: Remaining Useful Life of the water infrastructure
The table and graph below give an overview of the age distribution by facility type for the water infrastructure:
Table C.6.3: Overview of the age distribution by facility type for the water infrastructure (Opening Costs)
Asset Type 0 – 5 yrs 6 – 10 yrs 11 – 15 yrs 16 – 20 yrs > 20 yrs
Boreholes R170 400 R612 443 R0 R0 R0
Reticulation Pipeline R6 362 158 R24 322 935 R0 R0 R0
Pump Station R5 428 794 R3 182 510 R0 R0 R0
Reservoir R1 074 127 R5 722 368 R0 R0 R0
Water Meter R900 186 R73 427 R0 R0 R0
WTW R2 287 079 R6 181 270 R0 R0 R0
Total R16 222 744 R40 094 953 R0 R0 R0
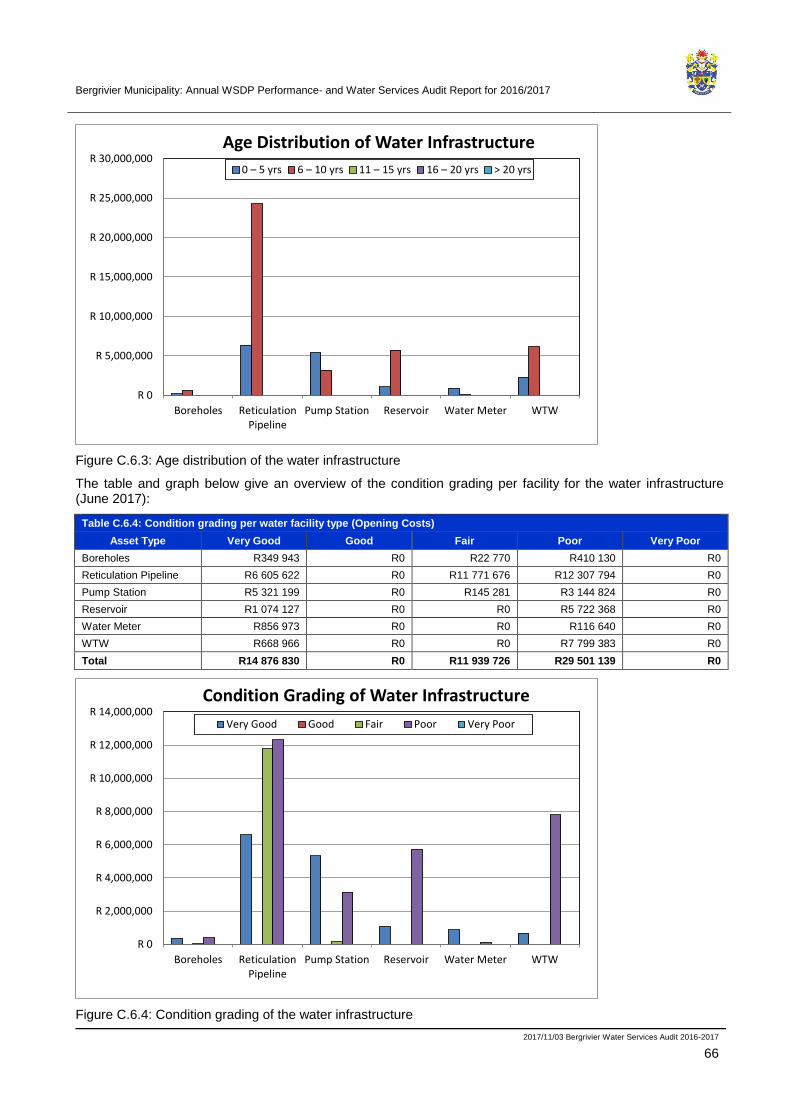
Bergrivier Municipality: Annual WSDP Performance- and Water Services Audit Report for 2016/2017
2017/11/03 Bergrivier Water Services Audit 2016-2017
66
R 0
R 5,000,000
R 10,000,000
R 15,000,000
R 20,000,000
R 25,000,000
R 30,000,000
Boreholes ReticulationPipeline
Pump Station Reservoir Water Meter WTW
Age Distribution of Water Infrastructure
0 – 5 yrs 6 – 10 yrs 11 – 15 yrs 16 – 20 yrs > 20 yrs
Figure C.6.3: Age distribution of the water infrastructure
The table and graph below give an overview of the condition grading per facility for the water infrastructure (June 2017):
Table C.6.4: Condition grading per water facility type (Opening Costs)
Asset Type Very Good Good Fair Poor Very Poor
Boreholes R349 943 R0 R22 770 R410 130 R0
Reticulation Pipeline R6 605 622 R0 R11 771 676 R12 307 794 R0
Pump Station R5 321 199 R0 R145 281 R3 144 824 R0
Reservoir R1 074 127 R0 R0 R5 722 368 R0
Water Meter R856 973 R0 R0 R116 640 R0
WTW R668 966 R0 R0 R7 799 383 R0
Total R14 876 830 R0 R11 939 726 R29 501 139 R0
R 0
R 2,000,000
R 4,000,000
R 6,000,000
R 8,000,000
R 10,000,000
R 12,000,000
R 14,000,000
Boreholes ReticulationPipeline
Pump Station Reservoir Water Meter WTW
Condition Grading of Water Infrastructure
Very Good Good Fair Poor Very Poor
Figure C.6.4: Condition grading of the water infrastructure

Bergrivier Municipality: Annual WSDP Performance- and Water Services Audit Report for 2016/2017
2017/11/03 Bergrivier Water Services Audit 2016-2017
67
Sewerage Infrastructure: The opening costs and book values of the sewerage infrastructure of Bergrivier Municipality is summarised in the table below (June 2017):
Table C.6.5: Opening costs and book values of all sewerage infrastructure
Asset Type Opening Costs Book Values % Book Values /
Opening Costs
Sewer Pump Stations R2 775 194 R1 743 600 62.83%
Sewer Reticulation Pipelines R11 468 733 R7 747 764 67.56%
Porterville WWTW (0001) R12 617 785 R10 557 880 83.67%
Velddrif WWTW (0002) R31 531 315 R27 963 787 88.69%
Eendekuil WWTW (0003) R138 232 R81 945 59.28%
Piketberg WWTW (0004) R12 872 578 R7 123 832 55.34%
Septic Tanks R129 443 R57 071 44.09%
Totals R71 533 280 R55 275 879 77.27%
R 0
R 5,000,000
R 10,000,000
R 15,000,000
R 20,000,000
R 25,000,000
R 30,000,000
R 35,000,000
Sewer PumpStations
SewerReticulation
Pipelines
PortervilleWWTW(0001)
VelddrifWWTW(0002)
EendekuilWWTW(0003)
PiketbergWWTW(0004)
Septic Tanks
Opening Costs and Book Values of Sewerage Infrastructure
Opening Costs Book Values
Figure C.6.5: Opening costs and book values of the sewerage infrastructure
The following tables and graphs give an overview of the remaining useful life by facility type for the sewerage infrastructure:
Table C.6.6: Overview of the RUL by facility type for the sewerage infrastructure (Opening Costs)
Asset Type 0 – 5 yrs 6 – 10 yrs 11 – 15 yrs 16 – 20 yrs > 20 yrs
Sewer Pump Stations R1 443 250 R168 196 R97 800 R0 R1 065 947
Sewer Reticulation Pipelines R241 496 R0 R0 R493 988 R10 733 249
Porterville WWTW (0001) R2 415 513 R39 590 R0 R120 372 R10 042 310
Velddrif WWTW (0002) R998 528 R928 619 R7 197 158 R0 R22 407 010
Eendekuil WWTW (0003) R0 R0 R0 R99 053 R39 179
Piketberg WWTW (0004) R289 522 R10 543 663 R0 R19 629 R2 019 764
Septic Tanks R80 723 R0 R0 R0 R48 720
Totals R5 469 033 R11 680 068 R7 294 958 R733 043 R46 356 178
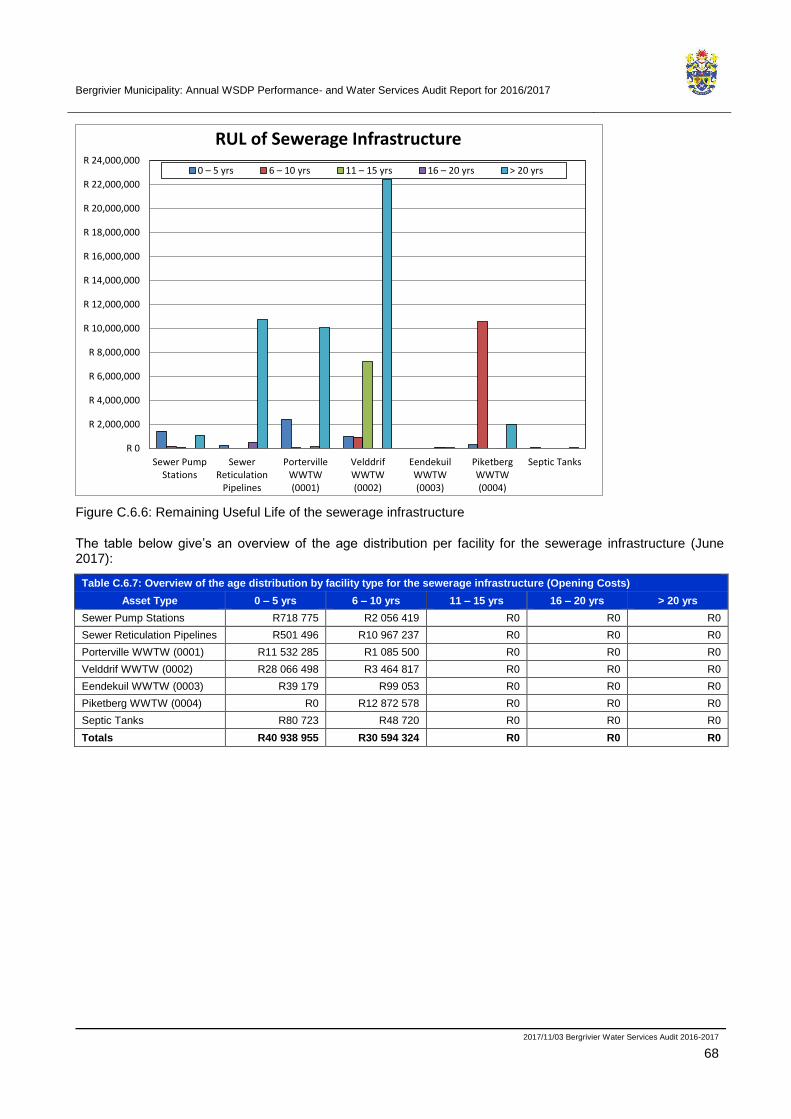
Bergrivier Municipality: Annual WSDP Performance- and Water Services Audit Report for 2016/2017
2017/11/03 Bergrivier Water Services Audit 2016-2017
68
R 0
R 2,000,000
R 4,000,000
R 6,000,000
R 8,000,000
R 10,000,000
R 12,000,000
R 14,000,000
R 16,000,000
R 18,000,000
R 20,000,000
R 22,000,000
R 24,000,000
Sewer PumpStations
SewerReticulation
Pipelines
PortervilleWWTW(0001)
VelddrifWWTW(0002)
EendekuilWWTW(0003)
PiketbergWWTW(0004)
Septic Tanks
RUL of Sewerage Infrastructure
0 – 5 yrs 6 – 10 yrs 11 – 15 yrs 16 – 20 yrs > 20 yrs
Figure C.6.6: Remaining Useful Life of the sewerage infrastructure
The table below give’s an overview of the age distribution per facility for the sewerage infrastructure (June 2017):
Table C.6.7: Overview of the age distribution by facility type for the sewerage infrastructure (Opening Costs)
Asset Type 0 – 5 yrs 6 – 10 yrs 11 – 15 yrs 16 – 20 yrs > 20 yrs
Sewer Pump Stations R718 775 R2 056 419 R0 R0 R0
Sewer Reticulation Pipelines R501 496 R10 967 237 R0 R0 R0
Porterville WWTW (0001) R11 532 285 R1 085 500 R0 R0 R0
Velddrif WWTW (0002) R28 066 498 R3 464 817 R0 R0 R0
Eendekuil WWTW (0003) R39 179 R99 053 R0 R0 R0
Piketberg WWTW (0004) R0 R12 872 578 R0 R0 R0
Septic Tanks R80 723 R48 720 R0 R0 R0
Totals R40 938 955 R30 594 324 R0 R0 R0
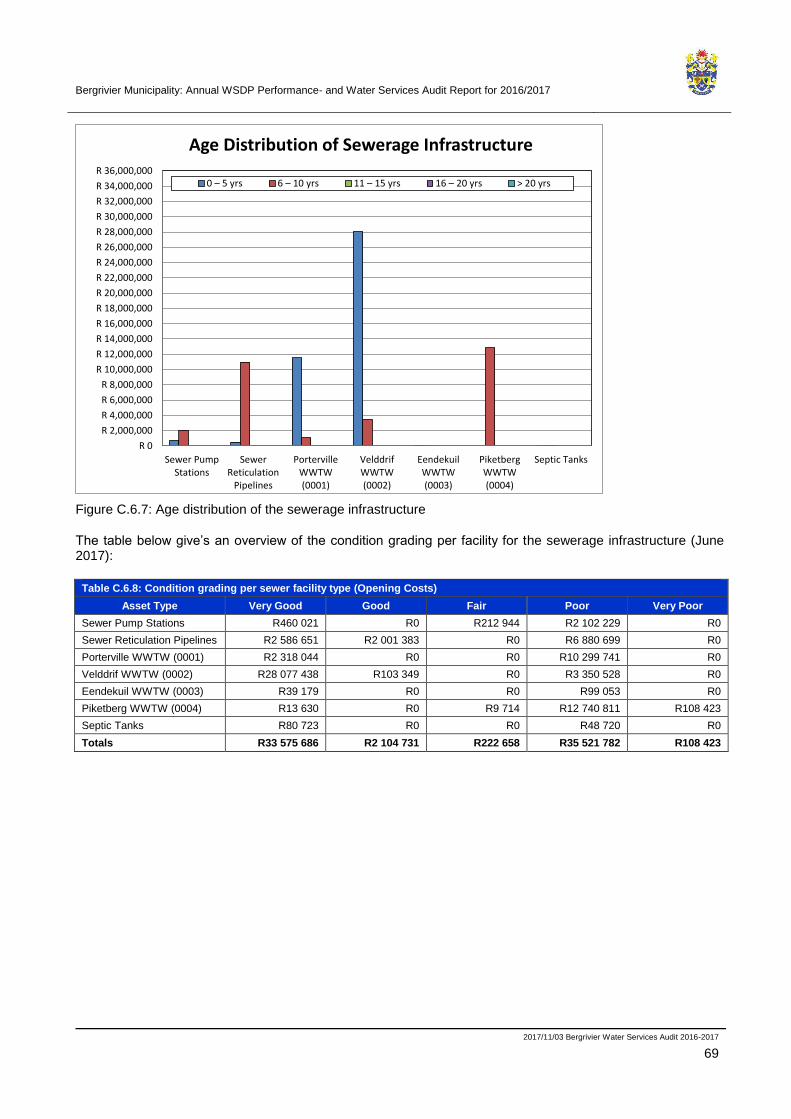
Bergrivier Municipality: Annual WSDP Performance- and Water Services Audit Report for 2016/2017
2017/11/03 Bergrivier Water Services Audit 2016-2017
69
R 0
R 2,000,000
R 4,000,000
R 6,000,000
R 8,000,000
R 10,000,000
R 12,000,000
R 14,000,000
R 16,000,000
R 18,000,000
R 20,000,000
R 22,000,000
R 24,000,000
R 26,000,000
R 28,000,000
R 30,000,000
R 32,000,000
R 34,000,000
R 36,000,000
Sewer PumpStations
SewerReticulation
Pipelines
PortervilleWWTW(0001)
VelddrifWWTW(0002)
EendekuilWWTW(0003)
PiketbergWWTW(0004)
Septic Tanks
Age Distribution of Sewerage Infrastructure
0 – 5 yrs 6 – 10 yrs 11 – 15 yrs 16 – 20 yrs > 20 yrs
Figure C.6.7: Age distribution of the sewerage infrastructure
The table below give’s an overview of the condition grading per facility for the sewerage infrastructure (June 2017):
Table C.6.8: Condition grading per sewer facility type (Opening Costs)
Asset Type Very Good Good Fair Poor Very Poor
Sewer Pump Stations R460 021 R0 R212 944 R2 102 229 R0
Sewer Reticulation Pipelines R2 586 651 R2 001 383 R0 R6 880 699 R0
Porterville WWTW (0001) R2 318 044 R0 R0 R10 299 741 R0
Velddrif WWTW (0002) R28 077 438 R103 349 R0 R3 350 528 R0
Eendekuil WWTW (0003) R39 179 R0 R0 R99 053 R0
Piketberg WWTW (0004) R13 630 R0 R9 714 R12 740 811 R108 423
Septic Tanks R80 723 R0 R0 R48 720 R0
Totals R33 575 686 R2 104 731 R222 658 R35 521 782 R108 423
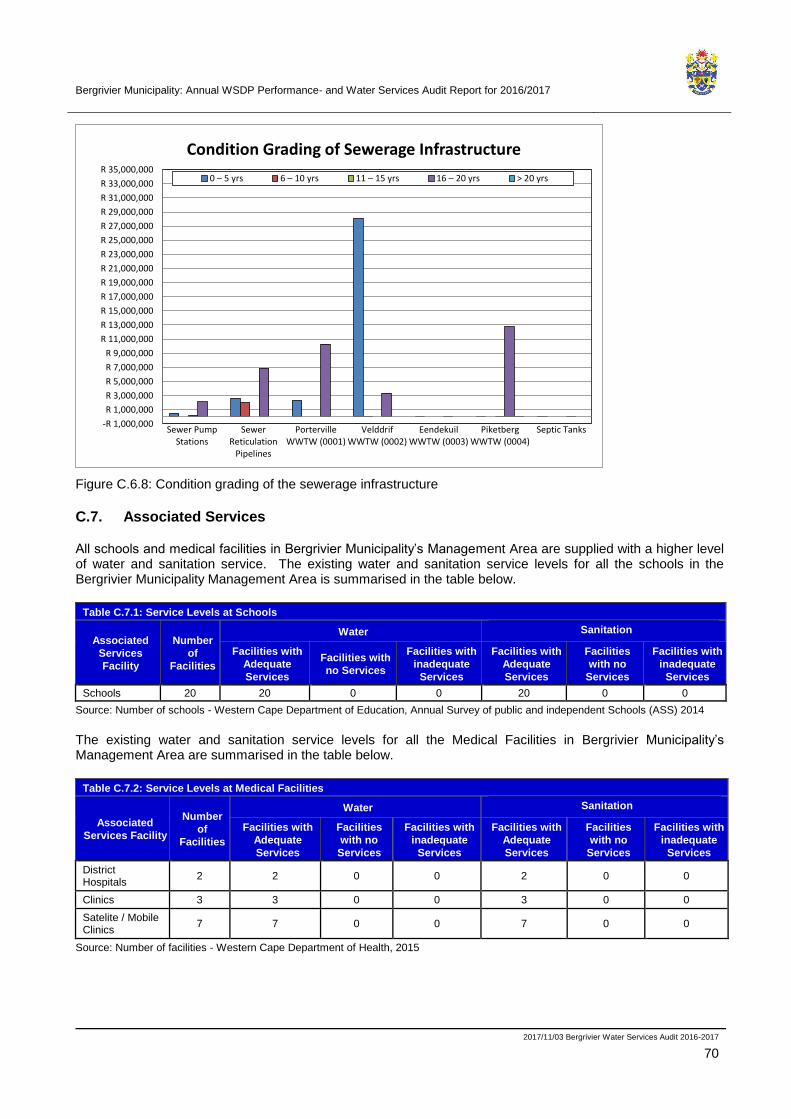
Bergrivier Municipality: Annual WSDP Performance- and Water Services Audit Report for 2016/2017
2017/11/03 Bergrivier Water Services Audit 2016-2017
70
-R 1,000,000
R 1,000,000
R 3,000,000
R 5,000,000
R 7,000,000
R 9,000,000
R 11,000,000
R 13,000,000
R 15,000,000
R 17,000,000
R 19,000,000
R 21,000,000
R 23,000,000
R 25,000,000
R 27,000,000
R 29,000,000
R 31,000,000
R 33,000,000
R 35,000,000
Sewer PumpStations
SewerReticulation
Pipelines
PortervilleWWTW (0001)
VelddrifWWTW (0002)
EendekuilWWTW (0003)
PiketbergWWTW (0004)
Septic Tanks
Condition Grading of Sewerage Infrastructure
0 – 5 yrs 6 – 10 yrs 11 – 15 yrs 16 – 20 yrs > 20 yrs
Figure C.6.8: Condition grading of the sewerage infrastructure
C.7. Associated Services
All schools and medical facilities in Bergrivier Municipality’s Management Area are supplied with a higher level of water and sanitation service. The existing water and sanitation service levels for all the schools in the Bergrivier Municipality Management Area is summarised in the table below.
Table C.7.1: Service Levels at Schools
Associated
Services
Facility
Number
of
Facilities
Water Sanitation
Facilities with
Adequate
Services
Facilities with
no Services
Facilities with
inadequate
Services
Facilities with
Adequate
Services
Facilities
with no
Services
Facilities with
inadequate
Services
Schools 20 20 0 0 20 0 0
Source: Number of schools - Western Cape Department of Education, Annual Survey of public and independent Schools (ASS) 2014
The existing water and sanitation service levels for all the Medical Facilities in Bergrivier Municipality’s Management Area are summarised in the table below.
Table C.7.2: Service Levels at Medical Facilities
Associated
Services Facility
Number
of
Facilities
Water Sanitation
Facilities with
Adequate
Services
Facilities
with no
Services
Facilities with
inadequate
Services
Facilities with
Adequate
Services
Facilities
with no
Services
Facilities with
inadequate
Services
District Hospitals
2 2 0 0 2 0 0
Clinics 3 3 0 0 3 0 0
Satelite / Mobile Clinics
7 7 0 0 7 0 0
Source: Number of facilities - Western Cape Department of Health, 2015

Bergrivier Municipality: Annual WSDP Performance- and Water Services Audit Report for 2016/2017
2017/11/03 Bergrivier Water Services Audit 2016-2017
71
C.8. Water Resources
The Western Cape is currently experiencing a severe drought, which also affect the yield of the Municipality’s own existing surface and groundwater resources. WC/WDM measures to lower the future water requirements and the augmentation of the existing water resources with groundwater or other sources are therefore critical at this stage.
Water balance models were developed for each of the towns within Bergrivier Municipality’s Management Area, which are included in Annexure A. Graphs of the total water requirements (bulk raw water volumes, system input volumes and billed metered consumption), peak month factors, annual NRW per town and water usage per sector are included in Annexure A.
Future water requirement projection models were developed for each of the towns within Bergrivier Municipality’s Management Area and are included in Annexure C. The table below gives an overview of the years in which the annual water requirement will exceed the sustainable yields / allocations from the various resources.
Table C.8.1: Years in which the annual water requirement will exceed the allocations / yields from the various water resources
Distribution System Allocation (A) /
Yield (Y) (Ml/a)
Annual Growth on
2016/2017 requirement
(%)
Annual Growth on
2016/2017 requirement
(%)
WSDP Projection
Model
Porterville 711.385 (Y) > 2041 (1%) 2029 (2%) 2034
Piketberg 945.075 (A) 2017 (3%) 2017 (4%) 2018
Velddrif WCWSS Over (2%) Over (3%) Over
Dwarskerbos WCWSS Over (2%) Over (3%) Over
Aurora 56.000 (A) Over (1.5%) Over (2.5%) Over
Eendekuil 116.435 (Y) 2020 (2%) 2019 (3%) 2025
Redelinghuys 46.500 (A) Over (1%) Over (2%) Over
Note: The sustainable yield of the Aurora and Redelinghuys water resources needs to be determined, which might affect the figures included in the above table.
The future water requirement projection models include the future projections up to 2041 and were calibrated by using historic billed metered consumption data and bulk metered abstraction data. The percentage NRW was determined for each of the distribution systems and growth in demand was based on agreed population and growth figures. The projected future water requirements are indicated in the table below for each of the distribution systems.
Table C.8.2: Projected future water requirements and allocations / yields surplus (+) / shortfall (-) based on WSDP model
Distribution
System Model
PROJECTED FUTURE WATER REQUIREMENTS (Ml/a)
2021 2026 2031 2036 2041
Porterville
1% Annual Growth 565.710 594.567 624.896 656.772 690.274
2% Annual Growth 594.276 565.129 724.419 799.817 883.063
WSDP Model 561.604 611.473 667.987 732.251 805.581
Yield surplus (+) / shortfall (-) +149.781 +99.912 +43.398 -20.866 -94.196
Piketberg
3% Annual Growth 1 037.039 1 202.212 1 393.694 1 615.673 1 873.008
4% Annual Growth 1 088.368 1 324.166 1 611.050 1 960.089 2 384.748
WSDP Model 978.150 1 087.779 1 212.981 1 356.358 1 520.996
Allocation surplus (+) / shortfall (-) -33.075 -142.704 -267.906 -411.283 -575.921
Velddrif
2% Annual Growth 1 101.843 1 216.524 1 343.140 1 482.935 1 637.280
3% Annual Growth 1 156.924 1 341.192 1 554.809 1 802.450 2 089.534
WSDP Model 1 292.252 1 580.671 1 939.564 2 387.036 2 945.972
Allocation surplus (+) / shortfall (-) West Coast DM exceeds their allocation from the WCWSS
Dwarskersbos
2% Annual Growth 104.668 115.562 127.590 140.869 155.531
3% Annual Growth 109.900 127.405 147.697 171.221 198.492
WSDP Model 120.097 139.150 161.559 187.955 219.094

Bergrivier Municipality: Annual WSDP Performance- and Water Services Audit Report for 2016/2017
2017/11/03 Bergrivier Water Services Audit 2016-2017
72
Table C.8.2: Projected future water requirements and allocations / yields surplus (+) / shortfall (-) based on WSDP model
Distribution
System Model
PROJECTED FUTURE WATER REQUIREMENTS (Ml/a)
2021 2026 2031 2036 2041
Allocation surplus (+) / shortfall (-) West Coast DM exceeds their allocation from the WCWSS
Aurora
1.5% Annual Growth 63.941 68.883 74.206 79.941 86.119
2.5% Annual Growth 67.154 75.978 85.962 97.258 110.039
WSDP Model 56.163 65.349 76.624 90.539 107.797
Allocation surplus (+) / shortfall (-) -0.163 -9.349 -20.624 -34.539 -51.797
Eendekuil
2% Annual Growth 116.988 129.165 142.608 157.451 173.839
3% Annual Growth 122.837 142.401 165.082 191.376 221.857
WSDP Model 107.232 117.031 127.887 139.925 153.284
Yield surplus (+) / shortfall (-) 9.203 -0.596 -11.452 -23.490 -36.849
Redelinghuys
1% Annual Growth 57.473 60.404 63.486 66.724 70.128
2% Annual Growth 60.375 66.659 73.597 81.257 89.714
WSDP Model 52.351 54.212 56.263 58.525 61.025
Allocation surplus (+) / shortfall (-) -5.851 -7.712 -9.763 -12.025 -14.525
Note: Velddrif and Dwarskersbos - Bulk potable water is supplied by the West Coast DM from the WCWSS. The system is currently under pressure to meet future water requirements. Next augmentation scheme needs to be implemented.
Velddrif and Dwarskersbos: In order to ensure sustainable economic development in the West Coast region the West Coast District Municipality started with a comprehensive study in 2007 to identify a sustainable long-term alternative water source for the region, in order to ensure sustainable economic development. Various alternative sources and combinations thereof were evaluated and eventually a 25.5 Ml/day sea water desalination plant in the Saldanha Bay area was identified as the most beneficial alternative, to be developed in 3 phases as the water requirements grow.
Desalination: The West Coast District Municipality is therefore proposing to construct and operate a sea water desalination plant in the Saldanha Bay area using sea water reverse osmosis (SWRO) technology. The intake capacity of the plant will be approximately 60 Ml/d (21.9 million Ml/a) producing 25.5Ml/d (9.3 million Ml/a) at final capacity. Approximately 36 Ml/d (13 million Ml/a) brine will be discharged into the sea. It will have a lifespan of 25 years with the potential of an extended lifespan.
The plant will be constructed in three phases of 8.5 Ml/d to reach the full capacity by 2026. All infrastructure however will be constructed for the full capacity in the first construction phase. The proposed project consists of the following components:
• Sea water abstraction infrastructure consisting of an intake structure and pipe connected to either an intake sump and pump station at the coast with a pump line to the SWRO plant or connected directly to the sump and pump station situated at the plant.
• The SWRO desalination plant located on land at the sites selected for the study. The size of the site needed is approximately 4-5 Ha and the plant will consist of pre-treatment, RO treatment, electrical and mechanical equipment in a building, reservoir, and other site related infrastructure.
• Treated water reservoir and pump station at the SWRO plant pumping the potable water to the existing Besaansklip reservoirs of the West Coast District Municipality.
• Brine disposal infrastructure from the plant to the sea.
• Access roads to the plant.
• Site works at the plant.
• Electrical substation and connections

Bergrivier Municipality: Annual WSDP Performance- and Water Services Audit Report for 2016/2017
2017/11/03 Bergrivier Water Services Audit 2016-2017
73
The environmental screening and technical evaluation reduced the ten possible sites, which were originally identified, to two proposed sites to be evaluated, i.e. the site at Arcelor Mittal in the Industrial Development Zone (IDZ) of Saldanha Bay and a site in Danger Bay. The Danger Bay site was identified as the most suitable site and the EIA approval was obtained during August 2013 for this site and the concomitant bulk infrastructure.
The proposed desalination plant and bulk infrastructure will cost an estimated R500 million, R300 million more than the original cost estimate. The first phase will include the construction of the desalination plant with a capacity of 8.5 Mℓ per day and the bulk infrastructure, with a capacity of 25.5 Mℓ per day. The desalination plant will be upgraded in three phases of 8.5Mℓ per day up to the final capacity of 25.5 Mℓ per day. Funding of this plant is currently a major challenge, as the West Coast District Municipality is not in a position to co-fund a project of this extent.
The levels of salinity in the Berg River have increased dramatically to the point where the level of assurance of 98% cannot be reached without major engineering effort. Urgent measuring devices must be put in place to monitor the Berg River, to find the reason for the high salinity readings and to mitigate these circumstances. Additional factors will have to be addressed through further investigations to determine the sources of contamination and to include these in the management options at Misverstand.
Increase storage at Withoogte: Although the modelling results from the ‘Analysis of Management Options at Misverstand Weir” to mitigate the potential impact on salinity of the Berg Water Project and Voëlvlei Augmentation Scheme (DWS, 2007) indicated that the incremental impact of the Berg Water Project and the Voëlvlei Augmentation Scheme could be mitigated through the provision of an additional 250 000 m³ of off-channel storage capacity, this re-analysis shows that the desired 98% level of assurance would not be achievable. To obtain a 98% level of assurance an additional 0.7 million m³ of storage would be required over and above the readily available 0.5 million m³ at Withoogte.
Increased treatment capacity at Withoogte (Subject to available water from the Berg River)
Water from the Berg River is pumped to the Withoogte WTW from the Misverstand Weir. The current capacity of the WTW is 72 Mℓ/day, which is already critical and needs to be increased to be able to meet the future water requirements. The potable water gravitates to the Besaansklip reservoir at Vredenburg from Withoogte and it was established that the ultimate design capacity of the pipeline is 105 Mℓ/day. The Withoogte WTW therefore needs to be upgraded from the current 72 Mℓ/day to 105 Mℓ/day to be able to accommodate the full design flow of the pipeline. The allocation from the WCWSS therefore has to allow an additional 33 Mℓ/day increase in allocation and an extension to the WTW to treat a total of 105 Mℓ/day. This demand will be reached by 2032 when a sea water desalination plant will have to be in operation to supply the future requirement i.e. 31 Mℓ/day until 3045.
The current raw water allocations from the different sources for the West Coast District Municipality’s bulk distribution systems are summarised in the table below.
Table 8.3: Allocations for the West Coast District Municipality’s bulk distribution systems (Ml/a)
Name Resource Name Permit Reg. Certificate Current Allocations
Withoogte from Misverstand Weir Berg River No. 22062820 17 440.000
Swartland from Voëlvlei Dam Berg River (Voëlvlei Dam) No. 22062777 4 200.000
Langebaan Road boreholes Saldanha Underground No. 22062688 1 500.000
Minus 10% of Langebaan Road (as recommended by Monitoring Committee) -150.000
Hopefield aquifer boreholes Hopefield aquifer 160.000
Total Allocation for the West Coast District Municipality 23 150.000
Total Allocation for the West Coast District Municipality from the WCWSS 21 640.000
The West Coast District Municipality has already exceeded their current allocation of 21.64 million Ml/a from the Berg River System for the last ten years. The West Coast District Municipality therefore also applied to the DWS in December 2013 to increase the allocation from the System to initially 18.087 million m3/a for the Withoogte supply area, which is to be increased to 30.3 million m3/a by 2033, and to 6.39 million m3/a for the Swartland supply area (to be increased to 11.1 million m3/a by 2033). Feedback from the DWS is still outstanding.
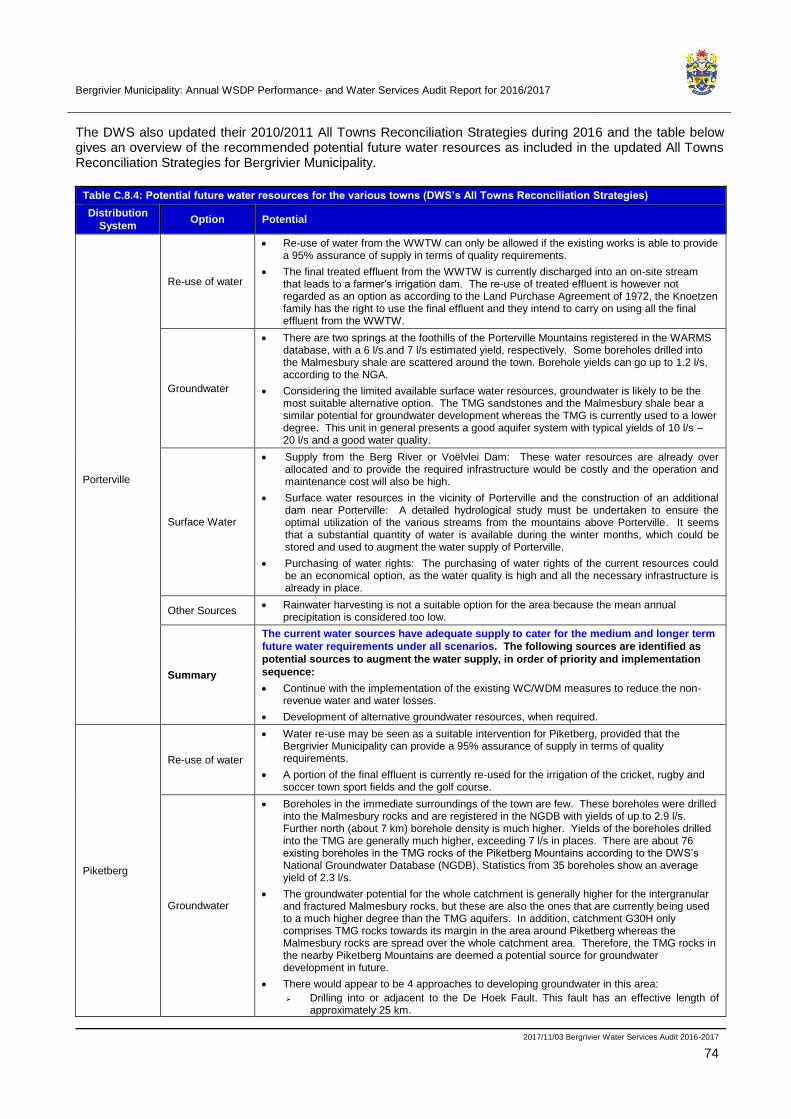
Bergrivier Municipality: Annual WSDP Performance- and Water Services Audit Report for 2016/2017
2017/11/03 Bergrivier Water Services Audit 2016-2017
74
The DWS also updated their 2010/2011 All Towns Reconciliation Strategies during 2016 and the table below gives an overview of the recommended potential future water resources as included in the updated All Towns Reconciliation Strategies for Bergrivier Municipality.
Table C.8.4: Potential future water resources for the various towns (DWS’s All Towns Reconciliation Strategies)
Distribution
System Option Potential
Porterville
Re-use of water
• Re-use of water from the WWTW can only be allowed if the existing works is able to provide a 95% assurance of supply in terms of quality requirements.
• The final treated effluent from the WWTW is currently discharged into an on-site stream that leads to a farmer’s irrigation dam. The re-use of treated effluent is however not regarded as an option as according to the Land Purchase Agreement of 1972, the Knoetzen family has the right to use the final effluent and they intend to carry on using all the final effluent from the WWTW.
Groundwater
• There are two springs at the foothills of the Porterville Mountains registered in the WARMS database, with a 6 l/s and 7 l/s estimated yield, respectively. Some boreholes drilled into the Malmesbury shale are scattered around the town. Borehole yields can go up to 1.2 l/s, according to the NGA.
• Considering the limited available surface water resources, groundwater is likely to be the most suitable alternative option. The TMG sandstones and the Malmesbury shale bear a similar potential for groundwater development whereas the TMG is currently used to a lower degree. This unit in general presents a good aquifer system with typical yields of 10 l/s – 20 l/s and a good water quality.
Surface Water
• Supply from the Berg River or Voëlvlei Dam: These water resources are already over allocated and to provide the required infrastructure would be costly and the operation and maintenance cost will also be high.
• Surface water resources in the vicinity of Porterville and the construction of an additional dam near Porterville: A detailed hydrological study must be undertaken to ensure the optimal utilization of the various streams from the mountains above Porterville. It seems that a substantial quantity of water is available during the winter months, which could be stored and used to augment the water supply of Porterville.
• Purchasing of water rights: The purchasing of water rights of the current resources could be an economical option, as the water quality is high and all the necessary infrastructure is already in place.
Other Sources • Rainwater harvesting is not a suitable option for the area because the mean annual
precipitation is considered too low.
Summary
The current water sources have adequate supply to cater for the medium and longer term
future water requirements under all scenarios. The following sources are identified as
potential sources to augment the water supply, in order of priority and implementation
sequence:
• Continue with the implementation of the existing WC/WDM measures to reduce the non-revenue water and water losses.
• Development of alternative groundwater resources, when required.
Piketberg
Re-use of water
• Water re-use may be seen as a suitable intervention for Piketberg, provided that the Bergrivier Municipality can provide a 95% assurance of supply in terms of quality requirements.
• A portion of the final effluent is currently re-used for the irrigation of the cricket, rugby and soccer town sport fields and the golf course.
Groundwater
• Boreholes in the immediate surroundings of the town are few. These boreholes were drilled into the Malmesbury rocks and are registered in the NGDB with yields of up to 2.9 l/s. Further north (about 7 km) borehole density is much higher. Yields of the boreholes drilled into the TMG are generally much higher, exceeding 7 l/s in places. There are about 76 existing boreholes in the TMG rocks of the Piketberg Mountains according to the DWS’s National Groundwater Database (NGDB). Statistics from 35 boreholes show an average yield of 2.3 l/s.
• The groundwater potential for the whole catchment is generally higher for the intergranular and fractured Malmesbury rocks, but these are also the ones that are currently being used to a much higher degree than the TMG aquifers. In addition, catchment G30H only comprises TMG rocks towards its margin in the area around Piketberg whereas the Malmesbury rocks are spread over the whole catchment area. Therefore, the TMG rocks in the nearby Piketberg Mountains are deemed a potential source for groundwater development in future.
• There would appear to be 4 approaches to developing groundwater in this area:
➢ Drilling into or adjacent to the De Hoek Fault. This fault has an effective length of approximately 25 km.
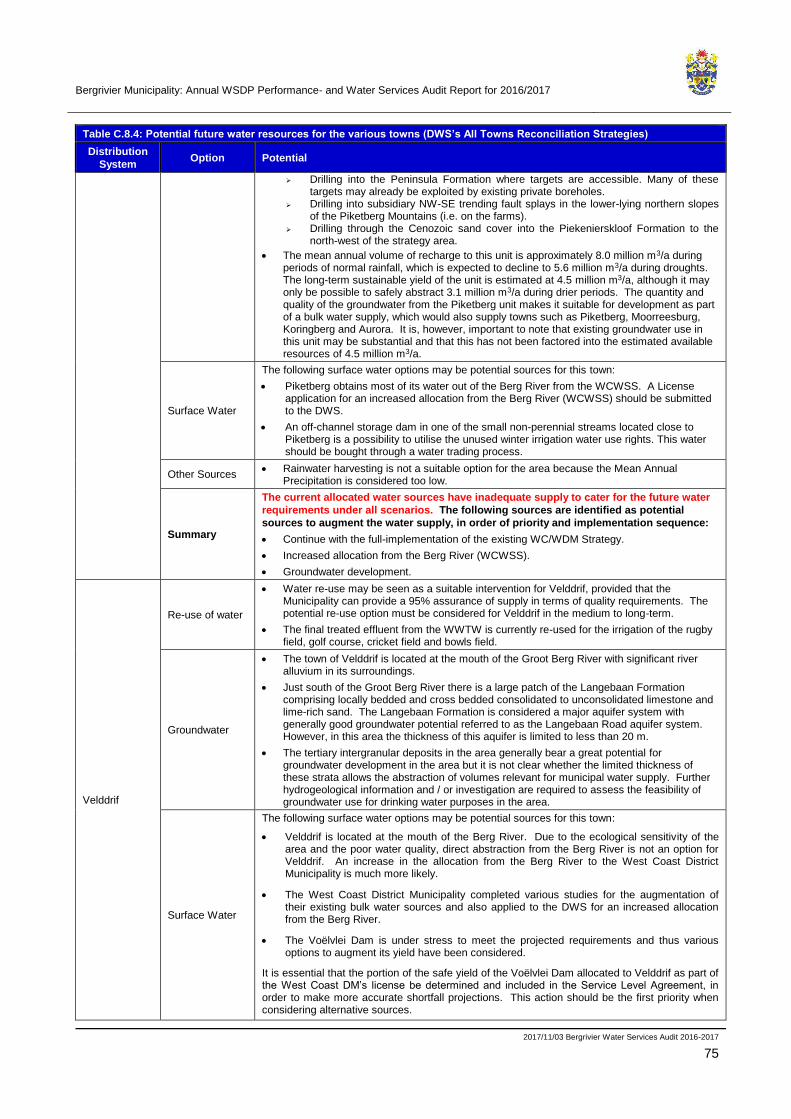
Bergrivier Municipality: Annual WSDP Performance- and Water Services Audit Report for 2016/2017
2017/11/03 Bergrivier Water Services Audit 2016-2017
75
Table C.8.4: Potential future water resources for the various towns (DWS’s All Towns Reconciliation Strategies)
Distribution
System Option Potential
➢ Drilling into the Peninsula Formation where targets are accessible. Many of these targets may already be exploited by existing private boreholes.
➢ Drilling into subsidiary NW-SE trending fault splays in the lower-lying northern slopes of the Piketberg Mountains (i.e. on the farms).
➢ Drilling through the Cenozoic sand cover into the Piekenierskloof Formation to the north-west of the strategy area.
• The mean annual volume of recharge to this unit is approximately 8.0 million m3/a during periods of normal rainfall, which is expected to decline to 5.6 million m3/a during droughts. The long-term sustainable yield of the unit is estimated at 4.5 million m3/a, although it may only be possible to safely abstract 3.1 million m3/a during drier periods. The quantity and quality of the groundwater from the Piketberg unit makes it suitable for development as part of a bulk water supply, which would also supply towns such as Piketberg, Moorreesburg, Koringberg and Aurora. It is, however, important to note that existing groundwater use in this unit may be substantial and that this has not been factored into the estimated available resources of 4.5 million m3/a.
Surface Water
The following surface water options may be potential sources for this town:
• Piketberg obtains most of its water out of the Berg River from the WCWSS. A License application for an increased allocation from the Berg River (WCWSS) should be submitted to the DWS.
• An off-channel storage dam in one of the small non-perennial streams located close to Piketberg is a possibility to utilise the unused winter irrigation water use rights. This water should be bought through a water trading process.
Other Sources • Rainwater harvesting is not a suitable option for the area because the Mean Annual
Precipitation is considered too low.
Summary
The current allocated water sources have inadequate supply to cater for the future water
requirements under all scenarios. The following sources are identified as potential
sources to augment the water supply, in order of priority and implementation sequence:
• Continue with the full-implementation of the existing WC/WDM Strategy.
• Increased allocation from the Berg River (WCWSS).
• Groundwater development.
Velddrif
Re-use of water
• Water re-use may be seen as a suitable intervention for Velddrif, provided that the Municipality can provide a 95% assurance of supply in terms of quality requirements. The potential re-use option must be considered for Velddrif in the medium to long-term.
• The final treated effluent from the WWTW is currently re-used for the irrigation of the rugby field, golf course, cricket field and bowls field.
Groundwater
• The town of Velddrif is located at the mouth of the Groot Berg River with significant river alluvium in its surroundings.
• Just south of the Groot Berg River there is a large patch of the Langebaan Formation comprising locally bedded and cross bedded consolidated to unconsolidated limestone and lime-rich sand. The Langebaan Formation is considered a major aquifer system with generally good groundwater potential referred to as the Langebaan Road aquifer system. However, in this area the thickness of this aquifer is limited to less than 20 m.
• The tertiary intergranular deposits in the area generally bear a great potential for groundwater development in the area but it is not clear whether the limited thickness of these strata allows the abstraction of volumes relevant for municipal water supply. Further hydrogeological information and / or investigation are required to assess the feasibility of groundwater use for drinking water purposes in the area.
Surface Water
The following surface water options may be potential sources for this town:
• Velddrif is located at the mouth of the Berg River. Due to the ecological sensitivity of the area and the poor water quality, direct abstraction from the Berg River is not an option for Velddrif. An increase in the allocation from the Berg River to the West Coast District Municipality is much more likely.
• The West Coast District Municipality completed various studies for the augmentation of their existing bulk water sources and also applied to the DWS for an increased allocation from the Berg River.
• The Voëlvlei Dam is under stress to meet the projected requirements and thus various options to augment its yield have been considered.
It is essential that the portion of the safe yield of the Voëlvlei Dam allocated to Velddrif as part of the West Coast DM’s license be determined and included in the Service Level Agreement, in order to make more accurate shortfall projections. This action should be the first priority when considering alternative sources.

Bergrivier Municipality: Annual WSDP Performance- and Water Services Audit Report for 2016/2017
2017/11/03 Bergrivier Water Services Audit 2016-2017
76
Table C.8.4: Potential future water resources for the various towns (DWS’s All Towns Reconciliation Strategies)
Distribution
System Option Potential
Other Sources
• Rainwater harvesting is not a suitable option for the area because the mean annual precipitation is considered too low.
• A desalination plant with a capacity of 25.5 Ml/d is at present under consideration as part of the long-term planning for the West Coast area. If implemented, such a plant will provide relief to possible water shortages at Velddrif due to the integrated system operated by the West Coast DM.
Summary
The current water sources do not have adequate supply to cater for the short, medium
and longer term future water requirements under all growth scenarios. The following
sources are identified as potential sources to augment the water supply, in order of
priority and implementation sequence:
• Continue with the implementation of the existing WC/WDM Strategy to keep the water losses and non-revenue water low and achieve savings in water consumption.
• Increased allocation from the WCWSS.
• Incremental groundwater development.
• Desalination of seawater
Dwarskersbos
Re-use of water
• The re-use of treated effluent is not a feasible option for Dwarskersbos, considering the current treatment process at the WWTW as well as the limited volumes of treated effluent available.
• Effluent evaporates from the ponds, but the works has an alternative to irrigate kikuyu grass when there is excess effluent from the last pond. A pump station for irrigation is located below the last pond.
Groundwater
• The Quaternary sands in the area form a shallow, unconfined, intergranular aquifer. The underlying Malmesbury Group is not considered to form an aquifer. Median borehole yields in the area are low, ranging from 0.1 to 0.5 l/s
• Although the potential of the intergranular aquifer is high, the saturated thickness of the aquifer is insufficient for abstracting reasonable quantities of groundwater. Further, the groundwater quality is such that it cannot be used for domestic supply purposes without treatment. It is therefore concluded that the underlying aquifer is not of regional significance, and can only be used at a local scale for garden irrigation and stock watering purposes.
Surface Water
• There are no major surface water resources near Dwarskersbos.
• The West Coast District Municipality completed various studies for the augmentation of their existing bulk water sources and also applied to the DWS for an increased allocation from the Berg River.
• The Voëlvlei Dam is under stress to meet the projected future requirements and thus various options to augment its yield have been considered.
It is essential that the portion of the safe yield of the Voëlvlei Dam allocated to Dwarskersbos as part of the West Coast DM’s license be determined and included in the Service Level Agreement, in order to make more accurate shortfall projections. This action should be the first priority when considering alternative sources.
Other Sources
• Rainwater harvesting is not a suitable option for the area because the mean annual precipitation is considered too low.
• Desalination of seawater is a feasible option specifically to address the peak holiday requirements. This option should be investigated further, specific for Dwarskersbos.
• A desalination plant with a capacity of 25.5 Ml/d is at present under consideration as part of the long-term planning for the West Coast area. If implemented, such a plant will provide relief to possible water shortages at Dwarskersbos due to the integrated system.
Summary
The current water sources do not have adequate supply to cater for the short, medium
and longer term future water requirements under all growth scenarios. The following
sources are identified as potential sources to augment the water supply, in order of
priority and implementation sequence:
• Continue with the implementation of the existing WC/WDM Strategy in order to keep the water losses and non-revenue water low and achieve savings in water consumption.
• Increasing the allocation to the West Coast District Municipality from the WCWSS.
• Incremental groundwater development.
• Desalination of seawater.
Aurora
Re-use of water • Re-use of treated effluent is currently not a feasible option in Aurora as there is no water-
borne sanitation system in place.
Groundwater • There are numerous boreholes, mostly in the area north-northwest of Aurora, registered in the NGA. Usually borehole yields range below 2 l/s. One borehole drilled into the

Bergrivier Municipality: Annual WSDP Performance- and Water Services Audit Report for 2016/2017
2017/11/03 Bergrivier Water Services Audit 2016-2017
77
Table C.8.4: Potential future water resources for the various towns (DWS’s All Towns Reconciliation Strategies)
Distribution
System Option Potential
Peninsula sandstone, however, is registered with a yield of 5 l/s.
• The town itself is underlain by an extensive quaternary sand layer, which is part of the Adamboerskraal Aquifer System. The safe yield and licensed abstraction of the municipal boreholes and spring are unknown. It is essential that these be determined in order to perform a more accurate prediction of the future water scenario in Aurora.
• The potential for groundwater use is very high for the intergranular aquifers. The number for the TMG aquifers is very small because they only constitute a small proportion of the catchment surface. However, since Aurora is located at the transition between intergranular deposits and the TMG outcrops, both might be a reasonable option for groundwater development.
• There are two target options:
➢ The quaternary sand: an aquifer system with possible yields of 2 – 5 l/s, but sensitive to abstraction and periods of low rainfall and susceptible to contamination. The advantages of use of this system are ease of access and development.
➢ Fractured sandstone of the Peninsula Formation. This unit generally presents a good aquifer system with typical yields of 10 l/s – 20 l/s and a good water quality.
• The report Development Potential of the Groundwater Resources of the WCDM [4] states the groundwater quality in the Cenozoic deposits to the north of the Papkuils River (Aurora) as generally good (50 – 170 mS/m) due to significant lateral inflows of fresh groundwater from the TMG aquifer system between Aurora and Piketberg.
Surface Water • There are limited local surface water resources available in the area but it can be linked to
the Saldanha Regional Scheme at Velddrif.
Other Sources • Rainwater harvesting is not a suitable option for the area because the mean annual
precipitation is considered too low.
Summary
It is not known whether the current water sources have adequate supply to cater for the
medium and longer-term future water requirements, as their yields are unknown. It is
recommended that the yields of all available sources be determined before any other
interventions are considered. The following sources are identified as potential sources to
augment the water supply, if the existing yield is not adequate, in order of priority and
implementation sequence:
• Continue with the implementation of the existing WC/WDM Strategy in order to reduce the existing water losses and non-revenue water even further.
• Incremental groundwater development.
• Link up with the Saldanha Regional Scheme at Velddrif.
Eendekuil
Re-use of water
• Eendekuil is not entitled to use the minimal effluent from the Eendekuil WWTW. If any, it is used by the neighbouring farmer as part of the land agreement for the WWTW.
• The re-use of treated effluent is further not a feasible option for Eendekuil, considering the current treatment process at the WWTW as well as the limited volumes of treated effluent available.
Groundwater
• On the 1:500 000 hydrogeological map the intergranular and fractured aquifer is reported to show a low average borehole yield of 0.1 to 0.5 l/s. Water quality is low, too, with an electrical conductivity of 300 to 1 000 mS/m. Groundwater recharge is 25 to 37 mm/a (medium).
• There are a few boreholes registered in the NGA in the area around Eendekuil. The registered yields are in the order of 1.2 l/s.
• There is a high groundwater potential for the intergranular and fractured Malmesbury rocks. The limiting factor for development of this source is the low borehole yields most likely caused by low hydraulic conductivity of the shale. The groundwater potential of the quaternary deposits is assessed significantly lower. This aquifer system shows available yields of 2 – 5 l/s, but is sensitive to abstraction and periods of low rainfall and susceptible to contamination. The advantages of use of this system are ease of access and development. The TMG only exhibits a potential of 1.38 million m3/a. However, this unit in general presents a good aquifer system with typical yields of 10 l/s – 20 l/s and a good water quality.
• Borehole density and yields increase significantly towards the west. There is intensive groundwater use along the foothills of the outcrops of the TMG about 8km west. The adjacent tertiary deposits also seem to be more practicable for groundwater development. To assess the options of groundwater usage for municipal supply in the Eendekuil area in detail, further hydrogeological investigation is required.
Surface Water Eendekuil is currently supplied with water from the Waboom River and the Waboomfontein Spring. Apart from the Waboom dams, it seems that all other existing dams are privately owned and that no water in these dams is available to Eendekuil. The current water supply will meet
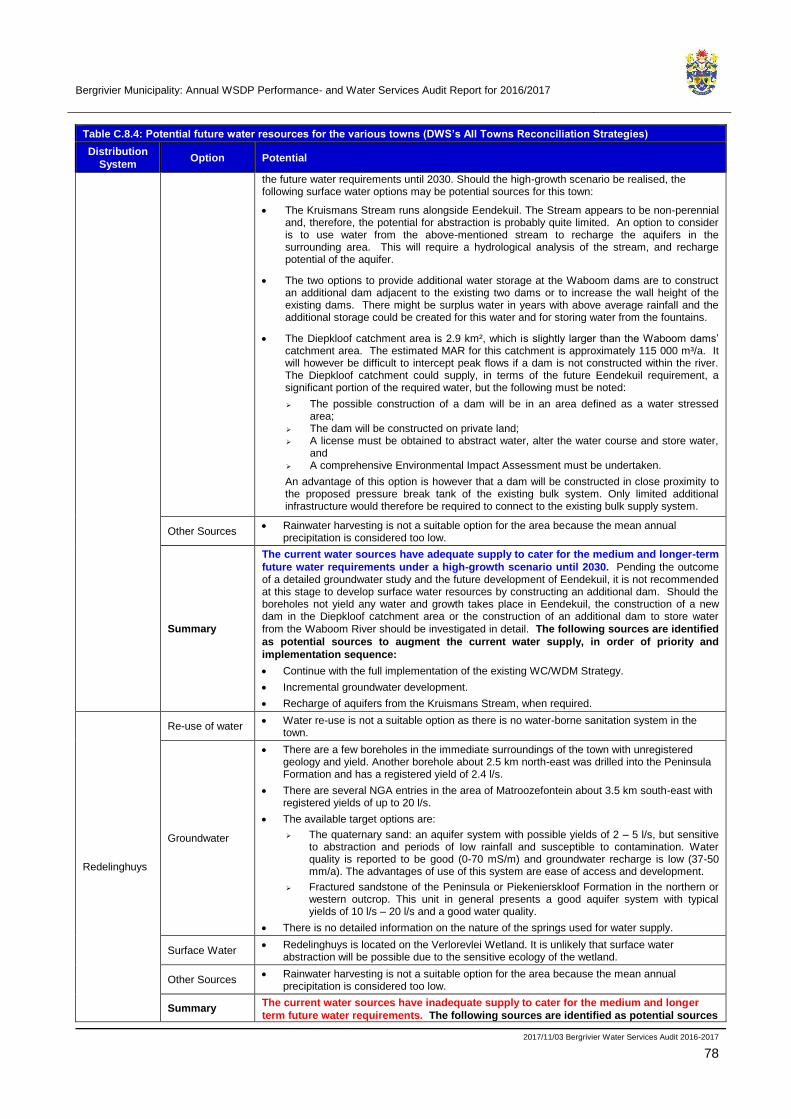
Bergrivier Municipality: Annual WSDP Performance- and Water Services Audit Report for 2016/2017
2017/11/03 Bergrivier Water Services Audit 2016-2017
78
Table C.8.4: Potential future water resources for the various towns (DWS’s All Towns Reconciliation Strategies)
Distribution
System Option Potential
the future water requirements until 2030. Should the high-growth scenario be realised, the following surface water options may be potential sources for this town:
• The Kruismans Stream runs alongside Eendekuil. The Stream appears to be non-perennial and, therefore, the potential for abstraction is probably quite limited. An option to consider is to use water from the above-mentioned stream to recharge the aquifers in the surrounding area. This will require a hydrological analysis of the stream, and recharge potential of the aquifer.
• The two options to provide additional water storage at the Waboom dams are to construct an additional dam adjacent to the existing two dams or to increase the wall height of the existing dams. There might be surplus water in years with above average rainfall and the additional storage could be created for this water and for storing water from the fountains.
• The Diepkloof catchment area is 2.9 km², which is slightly larger than the Waboom dams’ catchment area. The estimated MAR for this catchment is approximately 115 000 m³/a. It will however be difficult to intercept peak flows if a dam is not constructed within the river. The Diepkloof catchment could supply, in terms of the future Eendekuil requirement, a significant portion of the required water, but the following must be noted:
➢ The possible construction of a dam will be in an area defined as a water stressed area;
➢ The dam will be constructed on private land; ➢ A license must be obtained to abstract water, alter the water course and store water,
and ➢ A comprehensive Environmental Impact Assessment must be undertaken.
An advantage of this option is however that a dam will be constructed in close proximity to the proposed pressure break tank of the existing bulk system. Only limited additional infrastructure would therefore be required to connect to the existing bulk supply system.
Other Sources • Rainwater harvesting is not a suitable option for the area because the mean annual
precipitation is considered too low.
Summary
The current water sources have adequate supply to cater for the medium and longer-term
future water requirements under a high-growth scenario until 2030. Pending the outcome of a detailed groundwater study and the future development of Eendekuil, it is not recommended at this stage to develop surface water resources by constructing an additional dam. Should the boreholes not yield any water and growth takes place in Eendekuil, the construction of a new dam in the Diepkloof catchment area or the construction of an additional dam to store water
from the Waboom River should be investigated in detail. The following sources are identified
as potential sources to augment the current water supply, in order of priority and
implementation sequence:
• Continue with the full implementation of the existing WC/WDM Strategy.
• Incremental groundwater development.
• Recharge of aquifers from the Kruismans Stream, when required.
Redelinghuys
Re-use of water • Water re-use is not a suitable option as there is no water-borne sanitation system in the
town.
Groundwater
• There are a few boreholes in the immediate surroundings of the town with unregistered geology and yield. Another borehole about 2.5 km north-east was drilled into the Peninsula Formation and has a registered yield of 2.4 l/s.
• There are several NGA entries in the area of Matroozefontein about 3.5 km south-east with registered yields of up to 20 l/s.
• The available target options are:
➢ The quaternary sand: an aquifer system with possible yields of 2 – 5 l/s, but sensitive to abstraction and periods of low rainfall and susceptible to contamination. Water quality is reported to be good (0-70 mS/m) and groundwater recharge is low (37-50 mm/a). The advantages of use of this system are ease of access and development.
➢ Fractured sandstone of the Peninsula or Piekenierskloof Formation in the northern or western outcrop. This unit in general presents a good aquifer system with typical yields of 10 l/s – 20 l/s and a good water quality.
• There is no detailed information on the nature of the springs used for water supply.
Surface Water • Redelinghuys is located on the Verlorevlei Wetland. It is unlikely that surface water
abstraction will be possible due to the sensitive ecology of the wetland.
Other Sources • Rainwater harvesting is not a suitable option for the area because the mean annual
precipitation is considered too low.
Summary The current water sources have inadequate supply to cater for the medium and longer
term future water requirements. The following sources are identified as potential sources
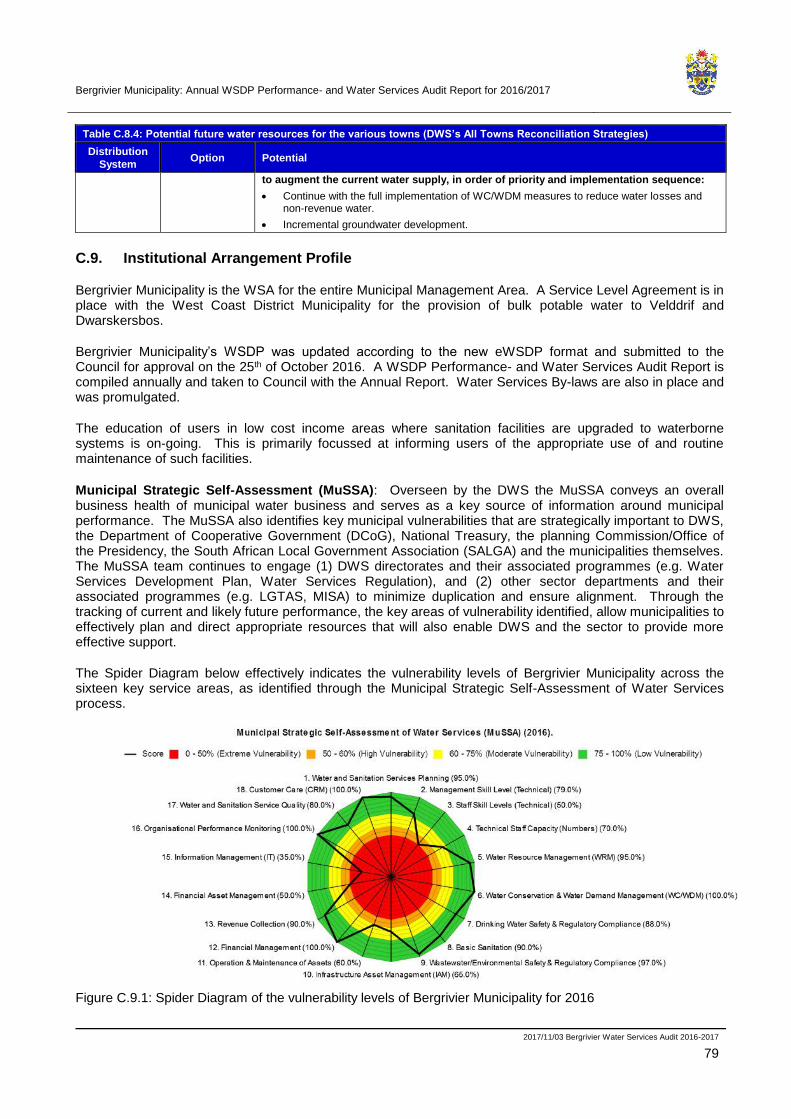
Bergrivier Municipality: Annual WSDP Performance- and Water Services Audit Report for 2016/2017
2017/11/03 Bergrivier Water Services Audit 2016-2017
79
Table C.8.4: Potential future water resources for the various towns (DWS’s All Towns Reconciliation Strategies)
Distribution
System Option Potential
to augment the current water supply, in order of priority and implementation sequence:
• Continue with the full implementation of WC/WDM measures to reduce water losses and non-revenue water.
• Incremental groundwater development.
C.9. Institutional Arrangement Profile
Bergrivier Municipality is the WSA for the entire Municipal Management Area. A Service Level Agreement is in place with the West Coast District Municipality for the provision of bulk potable water to Velddrif and Dwarskersbos.
Bergrivier Municipality’s WSDP was updated according to the new eWSDP format and submitted to the Council for approval on the 25th of October 2016. A WSDP Performance- and Water Services Audit Report is compiled annually and taken to Council with the Annual Report. Water Services By-laws are also in place and was promulgated.
The education of users in low cost income areas where sanitation facilities are upgraded to waterborne systems is on-going. This is primarily focussed at informing users of the appropriate use of and routine maintenance of such facilities.
Municipal Strategic Self-Assessment (MuSSA): Overseen by the DWS the MuSSA conveys an overall business health of municipal water business and serves as a key source of information around municipal performance. The MuSSA also identifies key municipal vulnerabilities that are strategically important to DWS, the Department of Cooperative Government (DCoG), National Treasury, the planning Commission/Office of the Presidency, the South African Local Government Association (SALGA) and the municipalities themselves. The MuSSA team continues to engage (1) DWS directorates and their associated programmes (e.g. Water Services Development Plan, Water Services Regulation), and (2) other sector departments and their associated programmes (e.g. LGTAS, MISA) to minimize duplication and ensure alignment. Through the tracking of current and likely future performance, the key areas of vulnerability identified, allow municipalities to effectively plan and direct appropriate resources that will also enable DWS and the sector to provide more effective support.
The Spider Diagram below effectively indicates the vulnerability levels of Bergrivier Municipality across the sixteen key service areas, as identified through the Municipal Strategic Self-Assessment of Water Services process.
Figure C.9.1: Spider Diagram of the vulnerability levels of Bergrivier Municipality for 2016
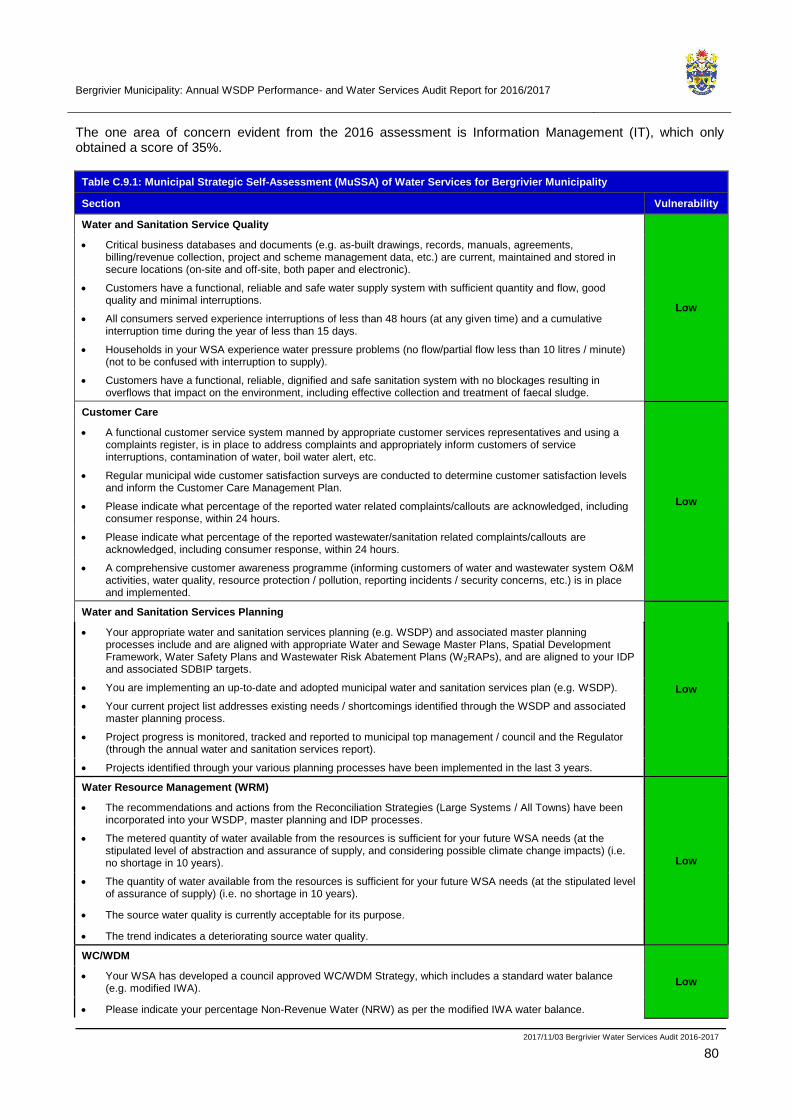
Bergrivier Municipality: Annual WSDP Performance- and Water Services Audit Report for 2016/2017
2017/11/03 Bergrivier Water Services Audit 2016-2017
80
The one area of concern evident from the 2016 assessment is Information Management (IT), which only obtained a score of 35%.
Table C.9.1: Municipal Strategic Self-Assessment (MuSSA) of Water Services for Bergrivier Municipality
Section Vulnerability
Water and Sanitation Service Quality
Low
• Critical business databases and documents (e.g. as-built drawings, records, manuals, agreements, billing/revenue collection, project and scheme management data, etc.) are current, maintained and stored in secure locations (on-site and off-site, both paper and electronic).
• Customers have a functional, reliable and safe water supply system with sufficient quantity and flow, good quality and minimal interruptions.
• All consumers served experience interruptions of less than 48 hours (at any given time) and a cumulative interruption time during the year of less than 15 days.
• Households in your WSA experience water pressure problems (no flow/partial flow less than 10 litres / minute) (not to be confused with interruption to supply).
• Customers have a functional, reliable, dignified and safe sanitation system with no blockages resulting in overflows that impact on the environment, including effective collection and treatment of faecal sludge.
Customer Care
Low
• A functional customer service system manned by appropriate customer services representatives and using a complaints register, is in place to address complaints and appropriately inform customers of service interruptions, contamination of water, boil water alert, etc.
• Regular municipal wide customer satisfaction surveys are conducted to determine customer satisfaction levels and inform the Customer Care Management Plan.
• Please indicate what percentage of the reported water related complaints/callouts are acknowledged, including consumer response, within 24 hours.
• Please indicate what percentage of the reported wastewater/sanitation related complaints/callouts are acknowledged, including consumer response, within 24 hours.
• A comprehensive customer awareness programme (informing customers of water and wastewater system O&M activities, water quality, resource protection / pollution, reporting incidents / security concerns, etc.) is in place and implemented.
Water and Sanitation Services Planning
Low
• Your appropriate water and sanitation services planning (e.g. WSDP) and associated master planning processes include and are aligned with appropriate Water and Sewage Master Plans, Spatial Development Framework, Water Safety Plans and Wastewater Risk Abatement Plans (W2RAPs), and are aligned to your IDP and associated SDBIP targets.
• You are implementing an up-to-date and adopted municipal water and sanitation services plan (e.g. WSDP).
• Your current project list addresses existing needs / shortcomings identified through the WSDP and associated master planning process.
• Project progress is monitored, tracked and reported to municipal top management / council and the Regulator (through the annual water and sanitation services report).
• Projects identified through your various planning processes have been implemented in the last 3 years.
Water Resource Management (WRM)
Low
• The recommendations and actions from the Reconciliation Strategies (Large Systems / All Towns) have been incorporated into your WSDP, master planning and IDP processes.
• The metered quantity of water available from the resources is sufficient for your future WSA needs (at the stipulated level of abstraction and assurance of supply, and considering possible climate change impacts) (i.e. no shortage in 10 years).
• The quantity of water available from the resources is sufficient for your future WSA needs (at the stipulated level of assurance of supply) (i.e. no shortage in 10 years).
• The source water quality is currently acceptable for its purpose.
• The trend indicates a deteriorating source water quality.
WC/WDM
Low • Your WSA has developed a council approved WC/WDM Strategy, which includes a standard water balance
(e.g. modified IWA).
• Please indicate your percentage Non-Revenue Water (NRW) as per the modified IWA water balance.
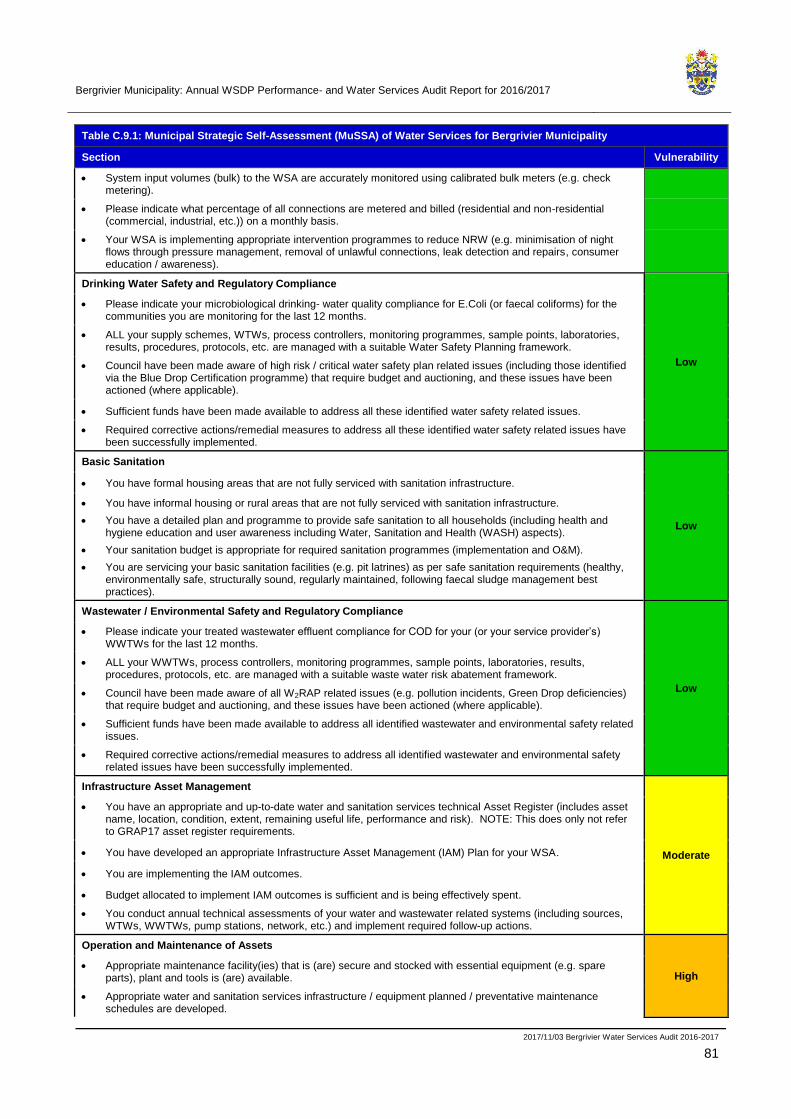
Bergrivier Municipality: Annual WSDP Performance- and Water Services Audit Report for 2016/2017
2017/11/03 Bergrivier Water Services Audit 2016-2017
81
Table C.9.1: Municipal Strategic Self-Assessment (MuSSA) of Water Services for Bergrivier Municipality
Section Vulnerability
• System input volumes (bulk) to the WSA are accurately monitored using calibrated bulk meters (e.g. check metering).
• Please indicate what percentage of all connections are metered and billed (residential and non-residential (commercial, industrial, etc.)) on a monthly basis.
• Your WSA is implementing appropriate intervention programmes to reduce NRW (e.g. minimisation of night flows through pressure management, removal of unlawful connections, leak detection and repairs, consumer education / awareness).
Drinking Water Safety and Regulatory Compliance
Low
• Please indicate your microbiological drinking- water quality compliance for E.Coli (or faecal coliforms) for the communities you are monitoring for the last 12 months.
• ALL your supply schemes, WTWs, process controllers, monitoring programmes, sample points, laboratories, results, procedures, protocols, etc. are managed with a suitable Water Safety Planning framework.
• Council have been made aware of high risk / critical water safety plan related issues (including those identified via the Blue Drop Certification programme) that require budget and auctioning, and these issues have been actioned (where applicable).
• Sufficient funds have been made available to address all these identified water safety related issues.
• Required corrective actions/remedial measures to address all these identified water safety related issues have been successfully implemented.
Basic Sanitation
Low
• You have formal housing areas that are not fully serviced with sanitation infrastructure.
• You have informal housing or rural areas that are not fully serviced with sanitation infrastructure.
• You have a detailed plan and programme to provide safe sanitation to all households (including health and hygiene education and user awareness including Water, Sanitation and Health (WASH) aspects).
• Your sanitation budget is appropriate for required sanitation programmes (implementation and O&M).
• You are servicing your basic sanitation facilities (e.g. pit latrines) as per safe sanitation requirements (healthy, environmentally safe, structurally sound, regularly maintained, following faecal sludge management best practices).
Wastewater / Environmental Safety and Regulatory Compliance
Low
• Please indicate your treated wastewater effluent compliance for COD for your (or your service provider’s) WWTWs for the last 12 months.
• ALL your WWTWs, process controllers, monitoring programmes, sample points, laboratories, results, procedures, protocols, etc. are managed with a suitable waste water risk abatement framework.
• Council have been made aware of all W2RAP related issues (e.g. pollution incidents, Green Drop deficiencies) that require budget and auctioning, and these issues have been actioned (where applicable).
• Sufficient funds have been made available to address all identified wastewater and environmental safety related issues.
• Required corrective actions/remedial measures to address all identified wastewater and environmental safety related issues have been successfully implemented.
Infrastructure Asset Management
Moderate
• You have an appropriate and up-to-date water and sanitation services technical Asset Register (includes asset name, location, condition, extent, remaining useful life, performance and risk). NOTE: This does only not refer to GRAP17 asset register requirements.
• You have developed an appropriate Infrastructure Asset Management (IAM) Plan for your WSA.
• You are implementing the IAM outcomes.
• Budget allocated to implement IAM outcomes is sufficient and is being effectively spent.
• You conduct annual technical assessments of your water and wastewater related systems (including sources, WTWs, WWTWs, pump stations, network, etc.) and implement required follow-up actions.
Operation and Maintenance of Assets
High • Appropriate maintenance facility(ies) that is (are) secure and stocked with essential equipment (e.g. spare
parts), plant and tools is (are) available.
• Appropriate water and sanitation services infrastructure / equipment planned / preventative maintenance schedules are developed.

Bergrivier Municipality: Annual WSDP Performance- and Water Services Audit Report for 2016/2017
2017/11/03 Bergrivier Water Services Audit 2016-2017
82
Table C.9.1: Municipal Strategic Self-Assessment (MuSSA) of Water Services for Bergrivier Municipality
Section Vulnerability
• Appropriate planned / preventative maintenance is performed at all WTWs and associated reservoirs, pump stations and distribution networks.
• Appropriate planned / preventative maintenance is performed at all WWTWs and associated collection systems and pump stations.
• Please indicate your infrastructure repairs and maintenance costs as a function of total operating expenditure (%).
Information Management
Extreme
• You have a developed, approved and implemented IT Master Systems Plan (e.g. covering 3-5 years) that addresses your IT business requirements.
• You have a developed, approved and implemented ICT Technology Master Plan that addresses your current and future IT infrastructure requirements.
• You have IT systems that support your full range of water and sanitation services business requirements (e.g. billing, GIS, customer care, O&M, asset management).
• ICT service continuity – Adequate IT security exists with off-site back-ups / archiving of operation critical applications, databases, data, etc. routinely performed in terms of an IT disaster Recovery Plan.
• You have sufficient budget and staff to keep key IT systems table and up-to-date as per IT policies and procedures.
Organisational Performance Monitoring
Low
• Appropriate plans, policies and procedures to address Disaster Management / emergencies and other issues (safety, public participation, communication, etc.) are developed and implemented. NOTE: Although Disaster Management is a district function, LMs need to ensure they are aware of their associated roles and responsibilities and have developed a Disaster Management Framework.
• An organisational performance management system is developed and implemented (i.e. effectively measure, monitor and track water and sanitation services performance indicators).
• A municipal risk management framework is developed and implemented and includes monitoring and tracking of water and sanitation related risks.
• Effective administration support is available to technical staff to assist with processing work orders, providing order numbers, handling correspondence, etc.
• "Access to Basic Water and Sanitation Services" progress reports are frequently produced and presented to council for discussion, action and follow-up.
Financial Management
Low
• Financial controls - Please state the audit opinion with regard to your last audit report on the financial statements.
• Cash flow status – Please state your Cash / Cost Coverage Ratio (excluding Unspent Conditional Grants)
• Your actual operating expenditure closely reflects your budgeted operating expenditure (i.e. Operating Expenditure Budget Implementation Indicator).
• Your actual revenue closely reflects your budgeted operating revenue (i.e. Operating Revenue Budget Implementation Indicator).
• Liabilities (Creditors) - Money is owed by your municipality to major / critical service providers (e.g. ESKOM, Water Board, largest contractors, etc.) for more than 30 days from receipt of invoice (NOTE: Ignore disputed invoices).
Revenue Collection
Low
• Please indicate the frequency of actual consumer meter readings.
• Net Surplus / Deficit – Please state your net surplus / deficit from water services activities for the last 12 months (NOTE: This question tests whether your WSA currently has fully cost reflective Water and Sanitation Tariffs, which take into account cost of maintenance and renewal of purification plants and networks and the cost of new infrastructure).
• Revenue collections - Please state the revenue collection rate in respect to Water and Sanitation Services (%).
• Revenue Growth – Please state your Water and Sanitation Services revenue growth for the last 12 months (%).
• Grant dependency – Actual-operating revenue less operational grants / subsidies (e.g. equitable share) sufficiently covers actual operating expenditure.
Financial Asset Management Extreme
• Capital Expenditure (Municipal). Please state your municipal Capital Expenditure as a percentage of Total
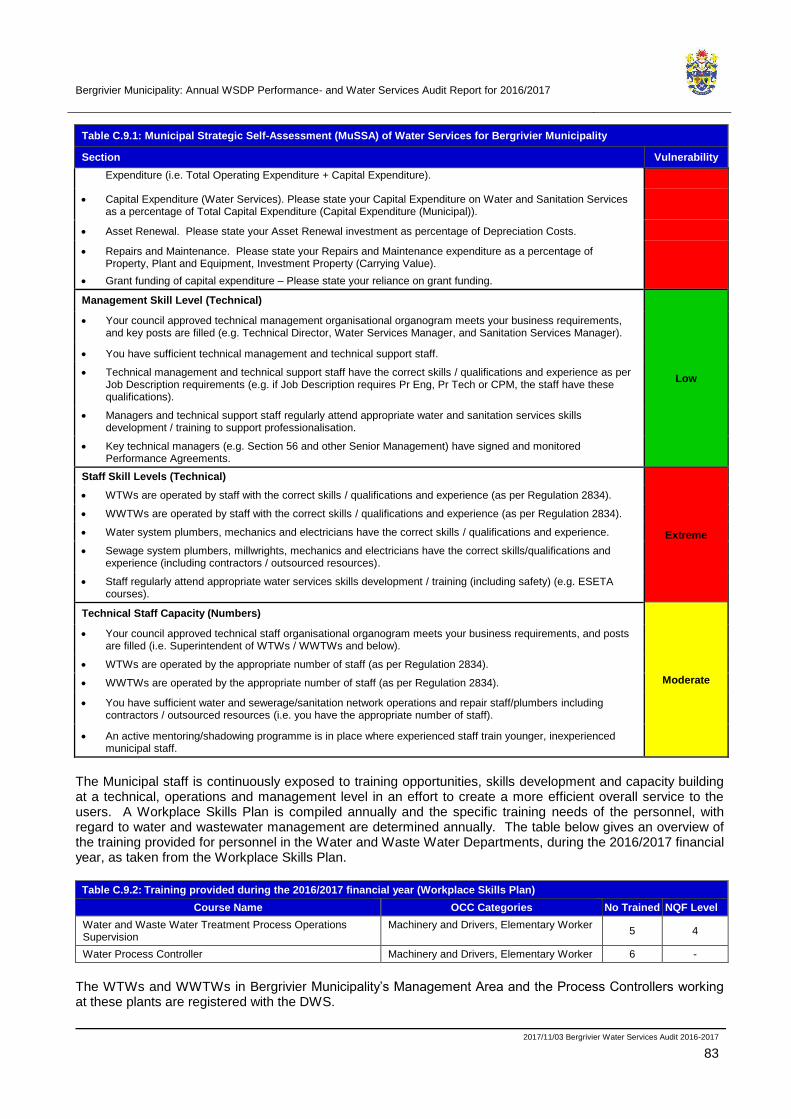
Bergrivier Municipality: Annual WSDP Performance- and Water Services Audit Report for 2016/2017
2017/11/03 Bergrivier Water Services Audit 2016-2017
83
Table C.9.1: Municipal Strategic Self-Assessment (MuSSA) of Water Services for Bergrivier Municipality
Section Vulnerability
Expenditure (i.e. Total Operating Expenditure + Capital Expenditure).
• Capital Expenditure (Water Services). Please state your Capital Expenditure on Water and Sanitation Services as a percentage of Total Capital Expenditure (Capital Expenditure (Municipal)).
• Asset Renewal. Please state your Asset Renewal investment as percentage of Depreciation Costs.
• Repairs and Maintenance. Please state your Repairs and Maintenance expenditure as a percentage of Property, Plant and Equipment, Investment Property (Carrying Value).
• Grant funding of capital expenditure – Please state your reliance on grant funding.
Management Skill Level (Technical)
Low
• Your council approved technical management organisational organogram meets your business requirements, and key posts are filled (e.g. Technical Director, Water Services Manager, and Sanitation Services Manager).
• You have sufficient technical management and technical support staff.
• Technical management and technical support staff have the correct skills / qualifications and experience as per Job Description requirements (e.g. if Job Description requires Pr Eng, Pr Tech or CPM, the staff have these qualifications).
• Managers and technical support staff regularly attend appropriate water and sanitation services skills development / training to support professionalisation.
• Key technical managers (e.g. Section 56 and other Senior Management) have signed and monitored Performance Agreements.
Staff Skill Levels (Technical)
Extreme
• WTWs are operated by staff with the correct skills / qualifications and experience (as per Regulation 2834).
• WWTWs are operated by staff with the correct skills / qualifications and experience (as per Regulation 2834).
• Water system plumbers, mechanics and electricians have the correct skills / qualifications and experience.
• Sewage system plumbers, millwrights, mechanics and electricians have the correct skills/qualifications and experience (including contractors / outsourced resources).
• Staff regularly attend appropriate water services skills development / training (including safety) (e.g. ESETA courses).
Technical Staff Capacity (Numbers)
Moderate
• Your council approved technical staff organisational organogram meets your business requirements, and posts are filled (i.e. Superintendent of WTWs / WWTWs and below).
• WTWs are operated by the appropriate number of staff (as per Regulation 2834).
• WWTWs are operated by the appropriate number of staff (as per Regulation 2834).
• You have sufficient water and sewerage/sanitation network operations and repair staff/plumbers including contractors / outsourced resources (i.e. you have the appropriate number of staff).
• An active mentoring/shadowing programme is in place where experienced staff train younger, inexperienced municipal staff.
The Municipal staff is continuously exposed to training opportunities, skills development and capacity building at a technical, operations and management level in an effort to create a more efficient overall service to the users. A Workplace Skills Plan is compiled annually and the specific training needs of the personnel, with regard to water and wastewater management are determined annually. The table below gives an overview of the training provided for personnel in the Water and Waste Water Departments, during the 2016/2017 financial year, as taken from the Workplace Skills Plan.
Table C.9.2: Training provided during the 2016/2017 financial year (Workplace Skills Plan)
Course Name OCC Categories No Trained NQF Level
Water and Waste Water Treatment Process Operations Supervision
Machinery and Drivers, Elementary Worker 5 4
Water Process Controller Machinery and Drivers, Elementary Worker 6 -
The WTWs and WWTWs in Bergrivier Municipality’s Management Area and the Process Controllers working at these plants are registered with the DWS.
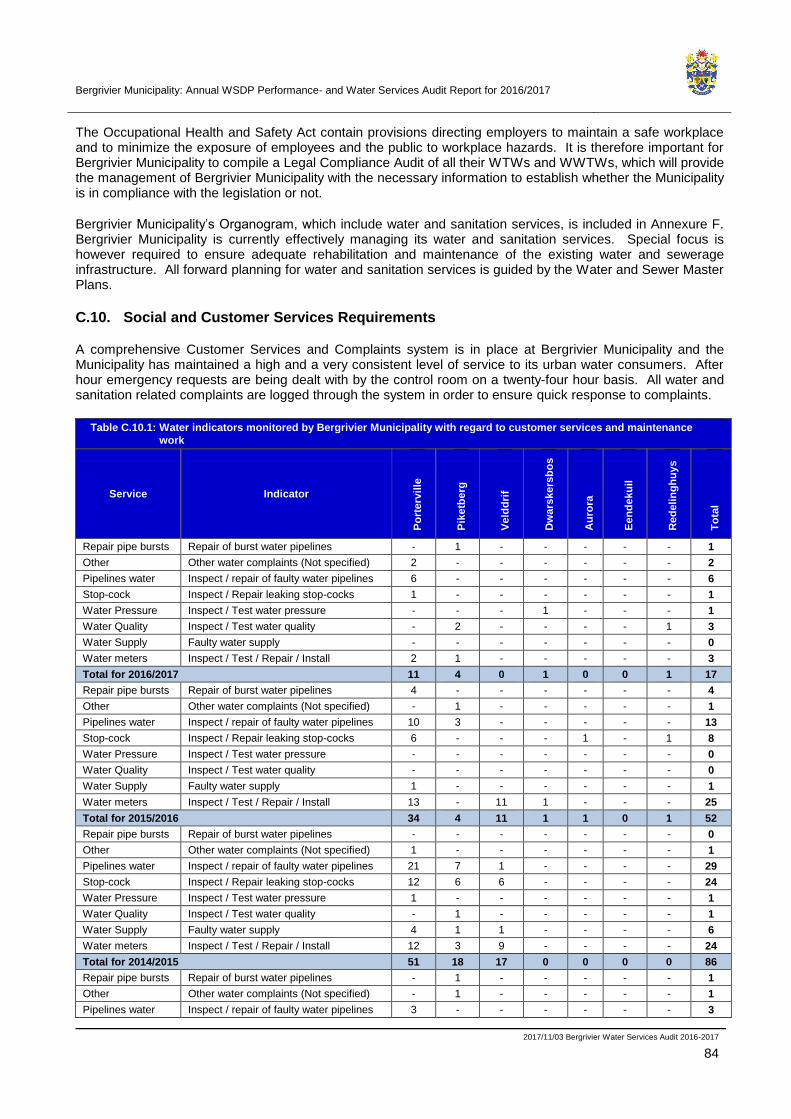
Bergrivier Municipality: Annual WSDP Performance- and Water Services Audit Report for 2016/2017
2017/11/03 Bergrivier Water Services Audit 2016-2017
84
The Occupational Health and Safety Act contain provisions directing employers to maintain a safe workplace and to minimize the exposure of employees and the public to workplace hazards. It is therefore important for Bergrivier Municipality to compile a Legal Compliance Audit of all their WTWs and WWTWs, which will provide the management of Bergrivier Municipality with the necessary information to establish whether the Municipality is in compliance with the legislation or not.
Bergrivier Municipality’s Organogram, which include water and sanitation services, is included in Annexure F. Bergrivier Municipality is currently effectively managing its water and sanitation services. Special focus is however required to ensure adequate rehabilitation and maintenance of the existing water and sewerage infrastructure. All forward planning for water and sanitation services is guided by the Water and Sewer Master Plans.
C.10. Social and Customer Services Requirements
A comprehensive Customer Services and Complaints system is in place at Bergrivier Municipality and the Municipality has maintained a high and a very consistent level of service to its urban water consumers. After hour emergency requests are being dealt with by the control room on a twenty-four hour basis. All water and sanitation related complaints are logged through the system in order to ensure quick response to complaints.
Table C.10.1: Water indicators monitored by Bergrivier Municipality with regard to customer services and maintenance
work
Service Indicator
Po
rterv
ille
Pik
etb
erg
Veld
dri
f
Dw
ars
kers
bo
s
Au
rora
Een
de
ku
il
Red
eli
ng
hu
ys
To
tal
Repair pipe bursts Repair of burst water pipelines - 1 - - - - - 1
Other Other water complaints (Not specified) 2 - - - - - - 2
Pipelines water Inspect / repair of faulty water pipelines 6 - - - - - - 6
Stop-cock Inspect / Repair leaking stop-cocks 1 - - - - - - 1
Water Pressure Inspect / Test water pressure - - - 1 - - - 1
Water Quality Inspect / Test water quality - 2 - - - - 1 3
Water Supply Faulty water supply - - - - - - - 0
Water meters Inspect / Test / Repair / Install 2 1 - - - - - 3
Total for 2016/2017 11 4 0 1 0 0 1 17
Repair pipe bursts Repair of burst water pipelines 4 - - - - - - 4
Other Other water complaints (Not specified) - 1 - - - - - 1
Pipelines water Inspect / repair of faulty water pipelines 10 3 - - - - - 13
Stop-cock Inspect / Repair leaking stop-cocks 6 - - - 1 - 1 8
Water Pressure Inspect / Test water pressure - - - - - - - 0
Water Quality Inspect / Test water quality - - - - - - - 0
Water Supply Faulty water supply 1 - - - - - - 1
Water meters Inspect / Test / Repair / Install 13 - 11 1 - - - 25
Total for 2015/2016 34 4 11 1 1 0 1 52
Repair pipe bursts Repair of burst water pipelines - - - - - - - 0
Other Other water complaints (Not specified) 1 - - - - - - 1
Pipelines water Inspect / repair of faulty water pipelines 21 7 1 - - - - 29
Stop-cock Inspect / Repair leaking stop-cocks 12 6 6 - - - - 24
Water Pressure Inspect / Test water pressure 1 - - - - - - 1
Water Quality Inspect / Test water quality - 1 - - - - - 1
Water Supply Faulty water supply 4 1 1 - - - - 6
Water meters Inspect / Test / Repair / Install 12 3 9 - - - - 24
Total for 2014/2015 51 18 17 0 0 0 0 86
Repair pipe bursts Repair of burst water pipelines - 1 - - - - - 1
Other Other water complaints (Not specified) - 1 - - - - - 1
Pipelines water Inspect / repair of faulty water pipelines 3 - - - - - - 3
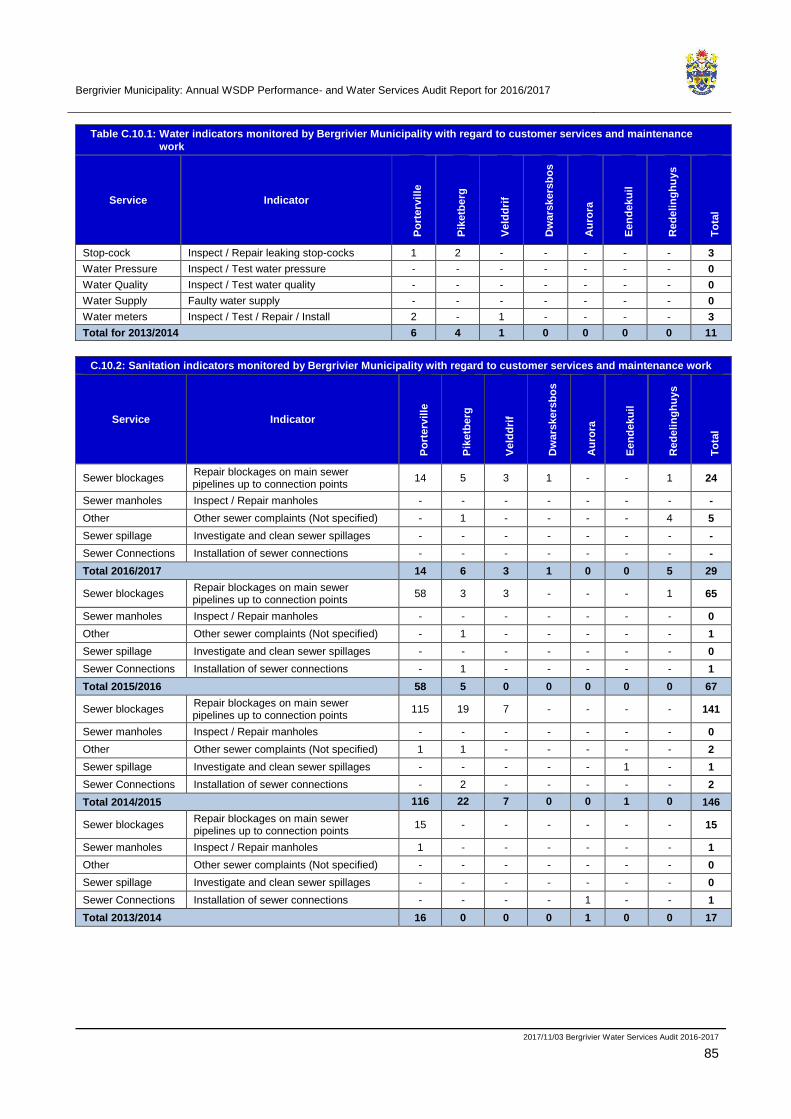
Bergrivier Municipality: Annual WSDP Performance- and Water Services Audit Report for 2016/2017
2017/11/03 Bergrivier Water Services Audit 2016-2017
85
Table C.10.1: Water indicators monitored by Bergrivier Municipality with regard to customer services and maintenance
work
Service Indicator
Po
rterv
ille
Pik
etb
erg
Veld
dri
f
Dw
ars
kers
bo
s
Au
rora
Een
de
ku
il
Red
eli
ng
hu
ys
To
tal
Stop-cock Inspect / Repair leaking stop-cocks 1 2 - - - - - 3
Water Pressure Inspect / Test water pressure - - - - - - - 0
Water Quality Inspect / Test water quality - - - - - - - 0
Water Supply Faulty water supply - - - - - - - 0
Water meters Inspect / Test / Repair / Install 2 - 1 - - - - 3
Total for 2013/2014 6 4 1 0 0 0 0 11
C.10.2: Sanitation indicators monitored by Bergrivier Municipality with regard to customer services and maintenance work
Service Indicator P
ort
erv
ille
Pik
etb
erg
Veld
dri
f
Dw
ars
kers
bo
s
Au
rora
Een
de
ku
il
Red
eli
ng
hu
ys
To
tal
Sewer blockages Repair blockages on main sewer pipelines up to connection points
14 5 3 1 - - 1 24
Sewer manholes Inspect / Repair manholes - - - - - - - -
Other Other sewer complaints (Not specified) - 1 - - - - 4 5
Sewer spillage Investigate and clean sewer spillages - - - - - - - -
Sewer Connections Installation of sewer connections - - - - - - - -
Total 2016/2017 14 6 3 1 0 0 5 29
Sewer blockages Repair blockages on main sewer pipelines up to connection points
58 3 3 - - - 1 65
Sewer manholes Inspect / Repair manholes - - - - - - - 0
Other Other sewer complaints (Not specified) - 1 - - - - - 1
Sewer spillage Investigate and clean sewer spillages - - - - - - - 0
Sewer Connections Installation of sewer connections - 1 - - - - - 1
Total 2015/2016 58 5 0 0 0 0 0 67
Sewer blockages Repair blockages on main sewer pipelines up to connection points
115 19 7 - - - - 141
Sewer manholes Inspect / Repair manholes - - - - - - - 0
Other Other sewer complaints (Not specified) 1 1 - - - - - 2
Sewer spillage Investigate and clean sewer spillages - - - - - 1 - 1
Sewer Connections Installation of sewer connections - 2 - - - - - 2
Total 2014/2015 116 22 7 0 0 1 0 146
Sewer blockages Repair blockages on main sewer pipelines up to connection points
15 - - - - - - 15
Sewer manholes Inspect / Repair manholes 1 - - - - - - 1
Other Other sewer complaints (Not specified) - - - - - - - 0
Sewer spillage Investigate and clean sewer spillages - - - - - - - 0
Sewer Connections Installation of sewer connections - - - - 1 - - 1
Total 2013/2014 16 0 0 0 1 0 0 17
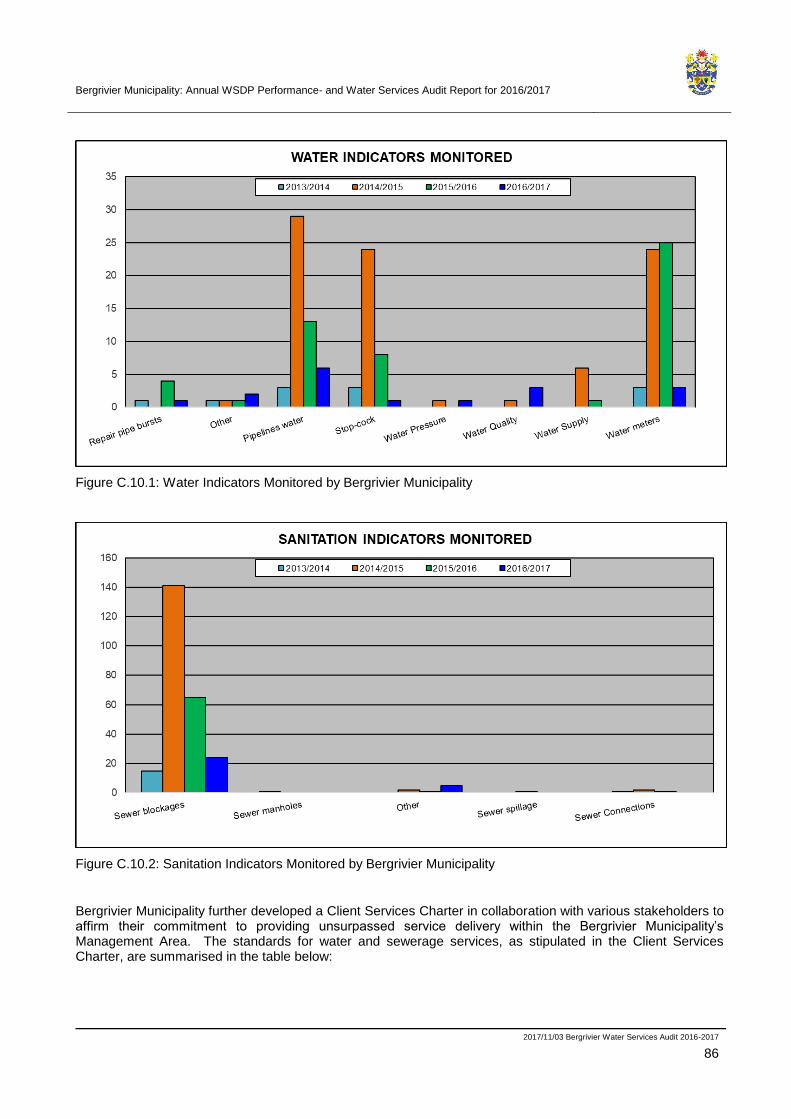
Bergrivier Municipality: Annual WSDP Performance- and Water Services Audit Report for 2016/2017
2017/11/03 Bergrivier Water Services Audit 2016-2017
86
Figure C.10.1: Water Indicators Monitored by Bergrivier Municipality
Figure C.10.2: Sanitation Indicators Monitored by Bergrivier Municipality
Bergrivier Municipality further developed a Client Services Charter in collaboration with various stakeholders to affirm their commitment to providing unsurpassed service delivery within the Bergrivier Municipality’s Management Area. The standards for water and sewerage services, as stipulated in the Client Services Charter, are summarised in the table below:
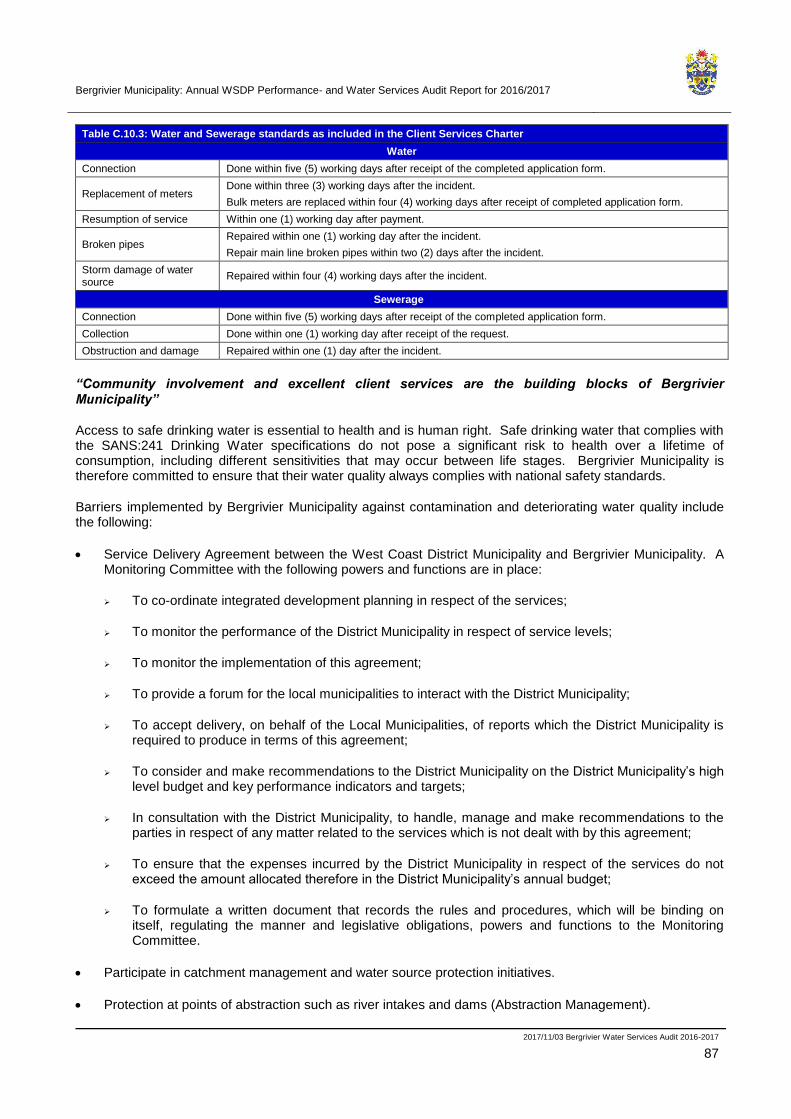
Bergrivier Municipality: Annual WSDP Performance- and Water Services Audit Report for 2016/2017
2017/11/03 Bergrivier Water Services Audit 2016-2017
87
Table C.10.3: Water and Sewerage standards as included in the Client Services Charter
Water
Connection Done within five (5) working days after receipt of the completed application form.
Replacement of meters Done within three (3) working days after the incident.
Bulk meters are replaced within four (4) working days after receipt of completed application form.
Resumption of service Within one (1) working day after payment.
Broken pipes Repaired within one (1) working day after the incident.
Repair main line broken pipes within two (2) days after the incident.
Storm damage of water source
Repaired within four (4) working days after the incident.
Sewerage
Connection Done within five (5) working days after receipt of the completed application form.
Collection Done within one (1) working day after receipt of the request.
Obstruction and damage Repaired within one (1) day after the incident.
“Community involvement and excellent client services are the building blocks of Bergrivier Municipality”
Access to safe drinking water is essential to health and is human right. Safe drinking water that complies with the SANS:241 Drinking Water specifications do not pose a significant risk to health over a lifetime of consumption, including different sensitivities that may occur between life stages. Bergrivier Municipality is therefore committed to ensure that their water quality always complies with national safety standards.
Barriers implemented by Bergrivier Municipality against contamination and deteriorating water quality include the following:
• Service Delivery Agreement between the West Coast District Municipality and Bergrivier Municipality. A Monitoring Committee with the following powers and functions are in place:
➢ To co-ordinate integrated development planning in respect of the services;
➢ To monitor the performance of the District Municipality in respect of service levels;
➢ To monitor the implementation of this agreement;
➢ To provide a forum for the local municipalities to interact with the District Municipality;
➢ To accept delivery, on behalf of the Local Municipalities, of reports which the District Municipality is required to produce in terms of this agreement;
➢ To consider and make recommendations to the District Municipality on the District Municipality’s high level budget and key performance indicators and targets;
➢ In consultation with the District Municipality, to handle, manage and make recommendations to the parties in respect of any matter related to the services which is not dealt with by this agreement;
➢ To ensure that the expenses incurred by the District Municipality in respect of the services do not exceed the amount allocated therefore in the District Municipality’s annual budget;
➢ To formulate a written document that records the rules and procedures, which will be binding on itself, regulating the manner and legislative obligations, powers and functions to the Monitoring Committee.
• Participate in catchment management and water source protection initiatives.
• Protection at points of abstraction such as river intakes and dams (Abstraction Management).

Bergrivier Municipality: Annual WSDP Performance- and Water Services Audit Report for 2016/2017
2017/11/03 Bergrivier Water Services Audit 2016-2017
88
• Correct operation and maintenance of the WTWs (Coagulation, flocculation, sedimentation and filtration).
• Protection and maintenance of the distribution systems. This includes ensuring an adequate disinfectant residual at all times, rapid response to pipe bursts and other leaks, regular cleaning of reservoirs, keeping all delivery points tidy and clean, etc.
Three other important barriers implemented by Bergrivier Municipality against poor quality drinking water that are a prerequisite to those listed above are as follows:
• A well-informed Council and municipal managers that understand the extreme importance of and are committed to providing adequate resources for continuous professional operation and maintenance of the water supply system.
• Competent managers and supervisors in the technical department who are responsible for water supply services lead by example and are passionate about monitoring and safeguarding drinking water quality.
• Well-informed community members and other consumers of water supply services that know how to protect the water from becoming contaminated once it has been delivered, that have respect for water as a precious resource and that adhere to safe hygiene and sanitation practices.

Bergrivier Municipality: Annual WSDP Performance- and Water Services Audit Report for 2016/2017
REFERENCES
• SA Census Data (2011), Community Profiles.
• Water Services Act, Act 108 of 1997. Regulations under Section 9 of the Water Services Act, which include the water services audit as Section 10 of the Guidelines for Compulsory National Standards.
• DWS’s Annual Water Services Development Plan Performance- and Water Services Audit Report Template, August 2014.
• DWS’s 2014 Blue Drop Report.
• DWS’s 2013 Green Drop Report.
• DWS’s 2014 Green Drop Progress Report.
• DWS’s All Towns Reconciliation Strategy Documents for each of the towns in Bergrivier Municipality’s Management Area, Version 2 May 2016.
• Draft Municipal Services Strategic Assessment (MuSSA) for Western Cape, 2016, DWS.
• Bergrivier Municipality’s Annual Water Services Development Plan Performance- and Water Services Audit Report for 2015/2016, WorleyParsons RSA.
• Bergrivier Municipality’s Operational Budgets and Tariffs.
• Asset Register for Water and Sewerage Infrastructure Assets, June 2017.
• SDBIP of Bergrivier Municipality for 2016/2017.
• Socio-Economic Profile for Bergrivier Municipality, Provincial Treasury, 2015.
• WC WSS Reconciliation Strategy, Status Report, April 2016, Department of Water and Sanitation.

Bergrivier Municipality: Annual WSDP Performance- and Water Services Audit Report for 2016/2017
ATTENDANCE REGISTER (DISCUSSION OF DRAFT DOCUMENT)
Bergrivier Municipality: Annual WSDP Performance- and Water Services Audit Report for 2016/2017
ANNEXURE A
Monthly Billed Metered Consumption per category user per town
Monthly number of consumer units per category per town
Water balance models for the various distribution systems
WTWs flows and capacities
WWTWs flows and capacities
DWS’s Scorecard for assessing the potential for WC/WDM efforts

Bergrivier Municipality: Annual WSDP Performance- and Water Services Audit Report for 2016/2017
ANNEXURE B
No Drop Spreadsheets and ILI for the various distribution systems
Bergrivier Municipality: Annual WSDP Performance- and Water Services Audit Report for 2016/2017
ANNEXURE C
Future Water Requirement Projection Models for the various distribution
systems

Bergrivier Municipality: Annual WSDP Performance- and Water Services Audit Report for 2016/2017
ANNEXURE D
Water Quality Compliance Sample Results
Final Effluent Quality Compliance Sample Results

Bergrivier Municipality: Annual WSDP Performance- and Water Services Audit Report for 2016/2017
ANNEXURE E
Water and Sanitation Operational and Maintenance Budget
Bergrivier Municipality: Annual WSDP Performance- and Water Services Audit Report for 2016/2017
ANNEXURE F
Organogram (Water and Wastewater)
Related Documents