BER Survey Results 2013Q2 Dr Johan Snyman Medium-Term Forecasting Associates STELLENBOSCH 21 June 2013 M ED IU M -TER M FO R EC A STIN G A SSO C IA TES Building Econom ists Tel:(021)881-3887 PO Box 7119 Fax:(021)881-3887 STELLENBO SC H , 7599 E-m ail: [email protected]

BER Survey Results 2013Q2 Dr Johan Snyman Medium-Term Forecasting Associates STELLENBOSCH 21 June 2013.
Dec 29, 2015
Welcome message from author
This document is posted to help you gain knowledge. Please leave a comment to let me know what you think about it! Share it to your friends and learn new things together.
Transcript

BER Survey Results 2013Q2
Dr Johan Snyman
Medium-Term Forecasting Associates
STELLENBOSCH
21 June 2013
MEDIUM-TERM FORECASTING ASSOCIATES Building Economists Tel: (021) 881-3887 PO Box 7119 Fax: (021) 881-3887 STELLENBOSCH, 7599 E-mail: [email protected]

Summary
Banks, Building, Architects and Quantity Surveyors
The BER business survey for the second quarter of 2013 (with prospects for the third quarter of 2013) have been released:
“The 2013Q2 survey results suggest that the recovery in the building sector is gaining momentum. Moreover, the rise in confidence across the different phases of the building sector indicates that the recovery is becoming more broad-based and therefore likely to be more sustained”.
Our MFA analysis indicates that there is a close correspondence between the perceptions of roleplayers in the building industry, as captured by the BER, and investment data, as compiled by the SA Reserve Bank. The great benefit of “soft” business survey data is that it is more recent than “hard” SARB investment data. The SARB data pertain to 2013Q1, whereas the BER survey data reflect the perceptions of business people during 2013Q2.

The results of the BER business survey amongst retail banks show that banks applied stricter lending criteria during the latter part of 2012 when great uncertainty prevailed in the South African economy. The latest 2013Q2 results indicate a return to normality. The current reading of 70 is just above the long term average of 66. This finding is positive for the housing market because mortgage loans could become more freely available.
BANKS' LENDING CRITERIA for HOUSEHOLDS Percentage of respondents
30
40
50
60
70
80
90
100
| 02 | 03 | 04 | 05 | 06 | 07 | 08 | 09 | 10 | 11 | 12 | 13 |
Source: BER; Ernst & Young; MFA DATABASE (Economic upswings shaded)
VE
RY
EA
SY
< E
AS
IER
<
> S
TR
ICT
ER
>
VE
RY
ST
RIC
T
Global FinancialCrisis
National Credit ActIntroduced
STRICT
EASY EASY
VERYSTRICT
NORMALAverage 66

The MFA CLIBI moved sideways for six quarters, but rose in 2011Q4 to an index level of 33. In 2012Q1 it rose further to 37. During the second and third quarters of 2012 the index dropped marginally to 35. In the fourth quarter of 2012 it rose to 40. It rose to 43 during 2013Q2. This improvement could presage a continued recovery in real building activity levels in coming quarters.
MFA COMPOSITE LEADING INDICATOR (CLIBI)FOR THE SOUTH AFRICAN BUILDING INDUSTRY
0
10
20
30
40
50
60
70
80
90
100
| 71 | 74 | 77 | 80 | 83 | 86 | 89 | 92 | 95 | 98 | 01 | 04 | 07 | 10 | 13
Source: FNB / BER; SARB; MFA DATABASE
PE
SS
IMIS
M <
50
> O
PT
IMIS
M
OPTIMISM
PESSIMISM
Shaded areas represent the upswing phases of the business cycle
This comparison between “soft” BER data and “hard” SARB data of real investment in total buildings shows that building investment is growing modestly (1% to 3% y-o-y). Phrased differently, overall building demand is gradually recovering from a severe slump
MFA LEADING INDICATOR COMPARED TO ANNUAL PERCENTAGE CHANGE in TOTAL INVESTMENT IN BUILDINGS
-20
-15
-10
-5
0
5
10
15
20
25
30
| 71 | 74 | 77 | 80 | 83 | 86 | 89 | 92 | 95 | 98 | 01 | 04 | 07 | 10 | 13
Source: FNB / BER; SARB; MFA DATABASE
SA
RB
AN
NU
AL
PE
RC
EN
TA
GE
CH
AN
GE
0
10
20
30
40
50
60
70
80
90
100
PE
SS
IMIS
M
<
50
>
O
PT
IMIS
M
SARB ANNUAL PERCENTAGE CHANGE MFA LEADING INDICATOR
ANNUAL % CHANGELEFT-HAND SCALE
MFA CLIBIRIGHT-HAND SCALE

The improvement in the BER business confidence levels of residential building contractors suggests that levels in real investment in residential buildings (SARB data) could improve further in coming quarters. Note that both indicators are in positive territory for the first time in 5 years
COMPARISON: ANNUAL PERCENTAGE CHANGE in INVESTMENT IN RESIDENTIAL BUILDINGS & BUSINESS MOOD RESIDENTIAL BUILDING CONTRACTORS
-40
-30
-20
-10
0
10
20
30
40
| 72 | 77 | 82 | 87 | 92 | 97 | 02 | 07 | 12
Source: BER, SARB; MFA DATABASE
AN
NU
AL
PE
RC
EN
TA
GE
CH
AN
GE
INV
ES
TM
EN
T
0
10
20
30
40
50
60
70
80
90
100
PE
SS
IMIS
M
< 5
0 >
O
PT
IMIS
M
APC INVESTMENT in RESIDENTIAL BUILDINGS BUSINESS MOOD RESIDENTIAL CONTRACTORS
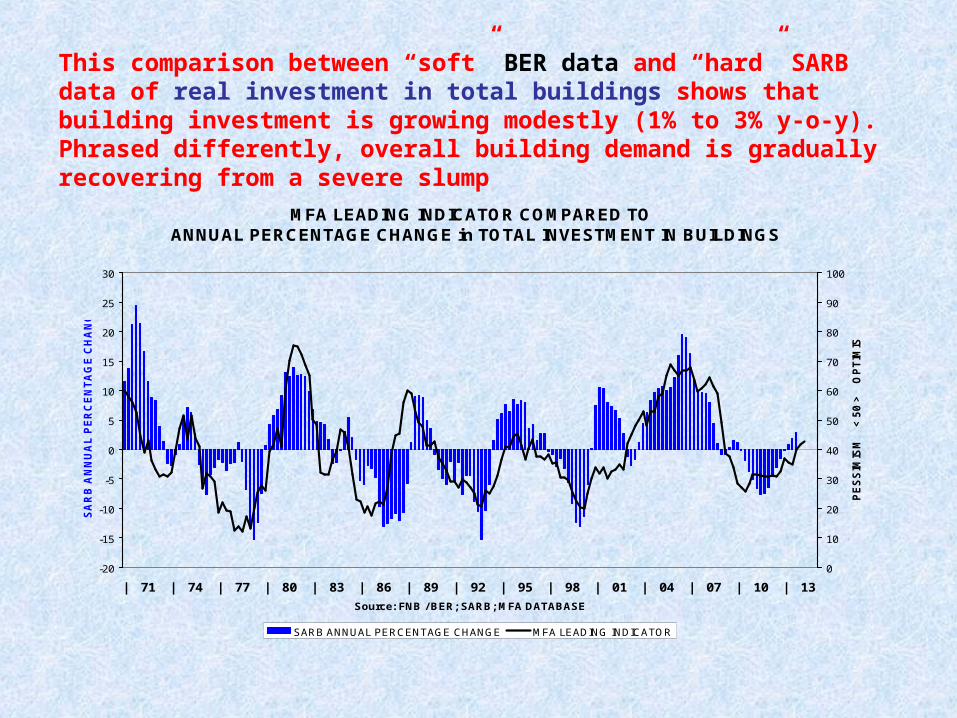
Note that the leading indicator of the BER business mood amongst non-residential builders is in positive territory for the first time in 5 years. SARB investment data in non-residential buildings are also barely positive, reflecting modest growth
COMPARISON: ANNUAL PERCENTAGE CHANGE in INVESMENT IN NON-RESIDENTIAL BUILDINGS & BUSINESS MOOD NON-RES BUILDING CONTRACTORS
-30
-20
-10
0
10
20
30
| 72 | 77 | 82 | 87 | 92 | 97 | 02 | 07 | 12
Source: BER; SARB; MFA DATABASE
AN
NU
AL
PE
RC
EN
TA
GE
CH
AN
GE
0
10
20
30
40
50
60
70
80
90
100
PE
SS
IMIS
M <
5
0
> O
PT
IMIS
M
INVESTMENT NON-RES BUSMOOD NON-RES CONTRACTORS
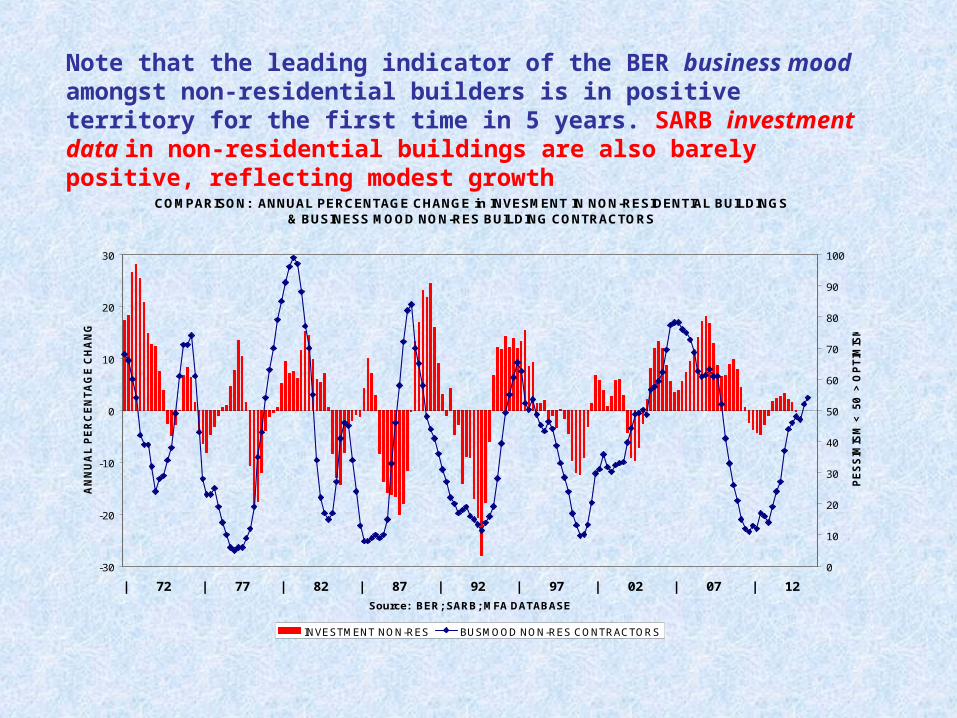
When compared to the overall economy (manufacturing, wholesale, retail, and vehicle sales surveyed by the BER), the business mood of building industry respondents reached a deeper level of pessimism during the recent downturn. However, both these key indicators are now presaging growth in coming quarters
BUSINESS CYCLE & BUILDING INDUSTRY BUSINESS MOOD
0
10
20
30
40
50
60
70
80
90
100
| 62 | 67 | 72 | 77 | 82 | 87 | 92 | 97 | 02 | 07 | 12
Source: RMB / BER; SARB; MFA DATABASE
PE
SS
IMIS
M <
50
> O
PT
IMIS
M
OVERALL ECONOMY BUILDING INDUSTRY
PESSIMISM
OPTIMISM
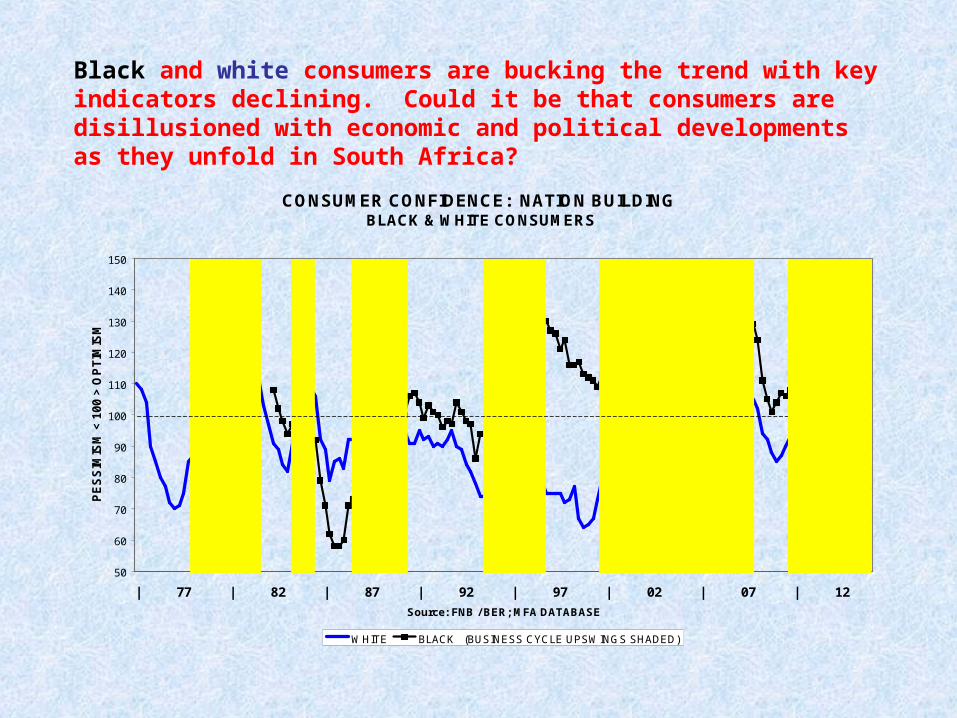
Black and white consumers are bucking the trend with key indicators declining. Could it be that consumers are disillusioned with economic and political developments as they unfold in South Africa?
CONSUMER CONFIDENCE: NATION BUILDING BLACK & WHITE CONSUMERS
50
60
70
80
90
100
110
120
130
140
150
| 77 | 82 | 87 | 92 | 97 | 02 | 07 | 12
Source: FNB / BER; MFA DATABASE
PE
SS
IMIS
M <
10
0 >
OP
TIM
ISM
WHITE BLACK (BUSINESS CYCLE UPSWINGS SHADED)
ASIAN CRISIS
GOLDBOOM
RUBICON
DEMOCRATIC ELECTIONS
PETROLPRICEHIKES& JOBLOSSES
SOCCERWORLDCUP BID
GLOBALFINANCIALCRISIS

The business mood indicators of architects, quantity surveyors and building contractors are showing further improvement
ARCHITECTS, QUANTITY SURVEYORS & BUILDING CONTRACTORS BUSINESS MOOD
0
10
20
30
40
50
60
70
80
90
100
| 71 | 74 | 77 | 80 | 83 | 86 | 89 | 92 | 95 | 98 | 01 | 04 | 07 | 10 | 13
Source: FNB / BER; MFA DATABASE (Economic Upswings Shaded)
PE
SS
IMIS
M <
50
> O
PT
IMIS
M
Contractors Architects Quantity Surveyors
OPTIMISM
PESSIMISM

Both indicators have crossed into positive territory for the first time in 5 years
COMPARISON RESIDENTIAL & NON-RESIDENTIAL CONTRACTORS BUSINESS MOOD
0
10
20
30
40
50
60
70
80
90
100
| 92 | 93 | 94 | 95 | 96 | 97 | 98 | 99 | 20 | 01 | 02 | 03 | 04 | 05 | 06 | 07 | 08 | 09 | 10 | 11 | 12 | 13 |
Source: FNB / BER; SARB; MFA DATABASE
PE
SS
IMIS
M
> 5
0
< O
PT
IMIS
M
RES CONTRACTORS NON-RES CONTRACTORS
OPTIMISM
PESSIMISM
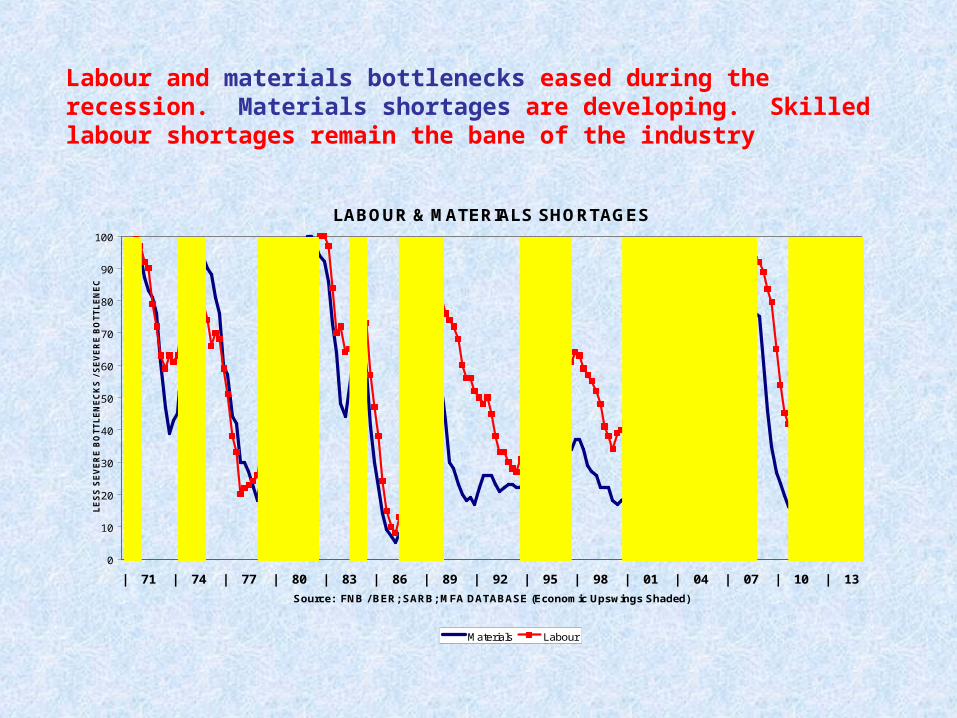
Labour and materials bottlenecks eased during the recession. Materials shortages are developing. Skilled labour shortages remain the bane of the industry
LABOUR & MATERIALS SHORTAGES
0
10
20
30
40
50
60
70
80
90
100
| 71 | 74 | 77 | 80 | 83 | 86 | 89 | 92 | 95 | 98 | 01 | 04 | 07 | 10 | 13
Source: FNB / BER; SARB; MFA DATABASE (Economic Upswings Shaded)
LE
SS
SE
VE
RE
BO
TT
LE
NE
CK
S /
SE
VE
RE
BO
TT
LE
NE
CK
S
Materials Labour
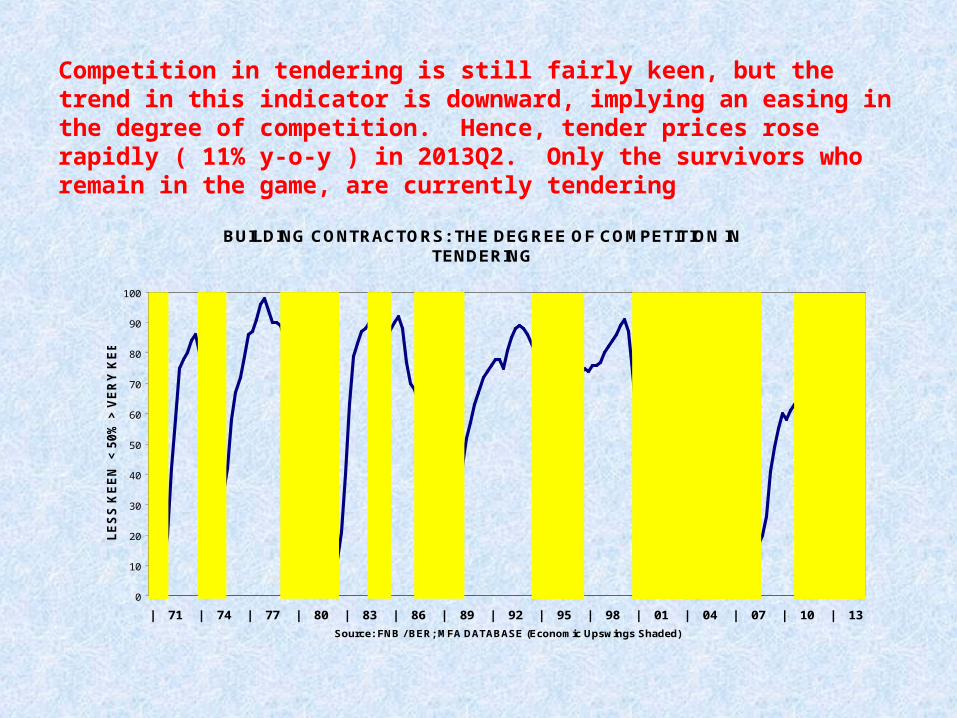
Competition in tendering is still fairly keen, but the trend in this indicator is downward, implying an easing in the degree of competition. Hence, tender prices rose rapidly ( 11% y-o-y ) in 2013Q2. Only the survivors who remain in the game, are currently tendering
BUILDING CONTRACTORS: THE DEGREE OF COMPETITION IN TENDERING
0
10
20
30
40
50
60
70
80
90
100
| 71 | 74 | 77 | 80 | 83 | 86 | 89 | 92 | 95 | 98 | 01 | 04 | 07 | 10 | 13
Source: FNB / BER; MFA DATABASE (Economic Upswings Shaded)
LE
SS
KE
EN
<
50
% >
VE
RY
KE
EN

The average number of tenderers on the tender list has fallen quite suddenly as happened in 1974, 1978 and 1986. This reflects less intense competition in tendering with the indicator having fallen from 10 in 2010, to 6 during 2013Q2
AVERAGE NUMBER OF TENDERS RECEIVED PER BUILDING PROJECT
0
2
4
6
8
10
12
| 71 | 74 | 77 | 80 | 83 | 86 | 89 | 92 | 95 | 98 | 01 | 04 | 07 | 10 | 13
Source: BER; MFA DATABASE (Economic Upswings Shaded)
NU
MB
ER
OF
TE
ND
ER
S P
ER
PR
OJE
CT
TRENDBREAK
THE SHADED AREAS REPRESENT THE UPSWING PHASES OF THE BUSINESS CYCLE
BUILDING BOOM
ONLY 3 TENDERERS ON AVERAGE in 2007
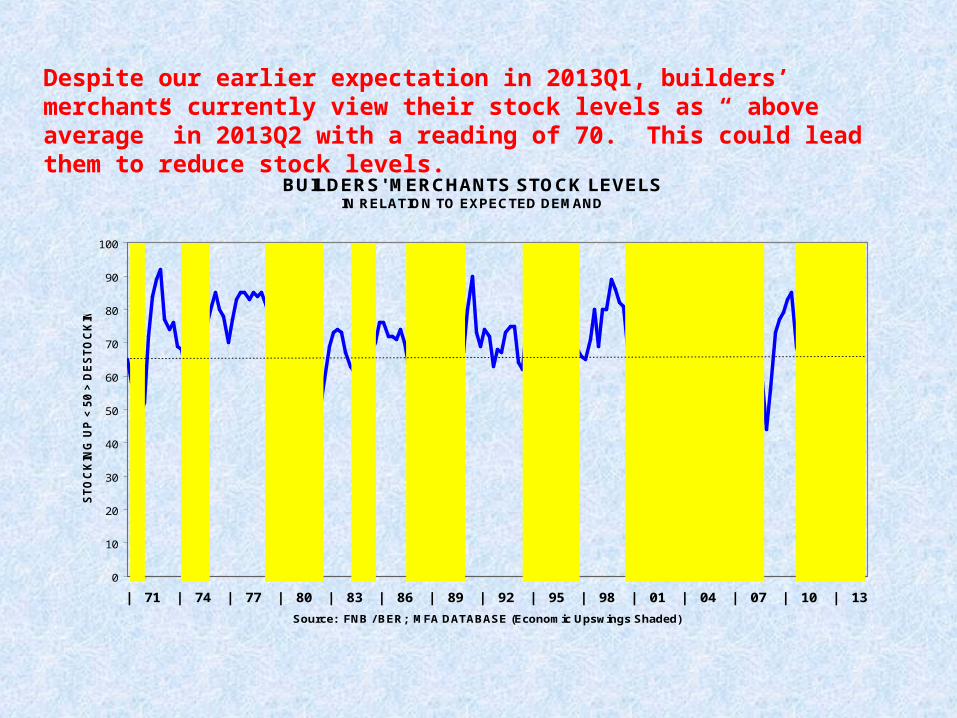
Despite our earlier expectation in 2013Q1, builders’ merchants currently view their stock levels as “ above average” in 2013Q2 with a reading of 70. This could lead them to reduce stock levels.
BUILDERS' MERCHANTS STOCK LEVELSIN RELATION TO EXPECTED DEMAND
0
10
20
30
40
50
60
70
80
90
100
| 71 | 74 | 77 | 80 | 83 | 86 | 89 | 92 | 95 | 98 | 01 | 04 | 07 | 10 | 13
Source: FNB / BER; MFA DATABASE (Economic Upswings Shaded)
ST
OC
KIN
G U
P <
50
> D
ES
TO
CK
ING
AVERAGE is 66 Stocking up
Destocking

On balance, general business conditions in the Western Cape seem to be improving, with main contractors now in the positive zone. Sub-contractors seem to lag
WESTERN CAPE: BUILDING CONTRACTORS & SUB-CONTRACTORSBUSINESS MOOD
0
10
20
30
40
50
60
70
80
90
100
| 71 | 74 | 77 | 80 | 83 | 86 | 89 | 92 | 95 | 98 | 01 | 04 | 07 | 10 | 13
Source: FNB / BER; MFA DATABASE (Economic Upswings Shaded)
PE
SS
IMIS
M <
50
> O
PT
IMIS
M
CONTRACTORS SUB-CONTRACTORS
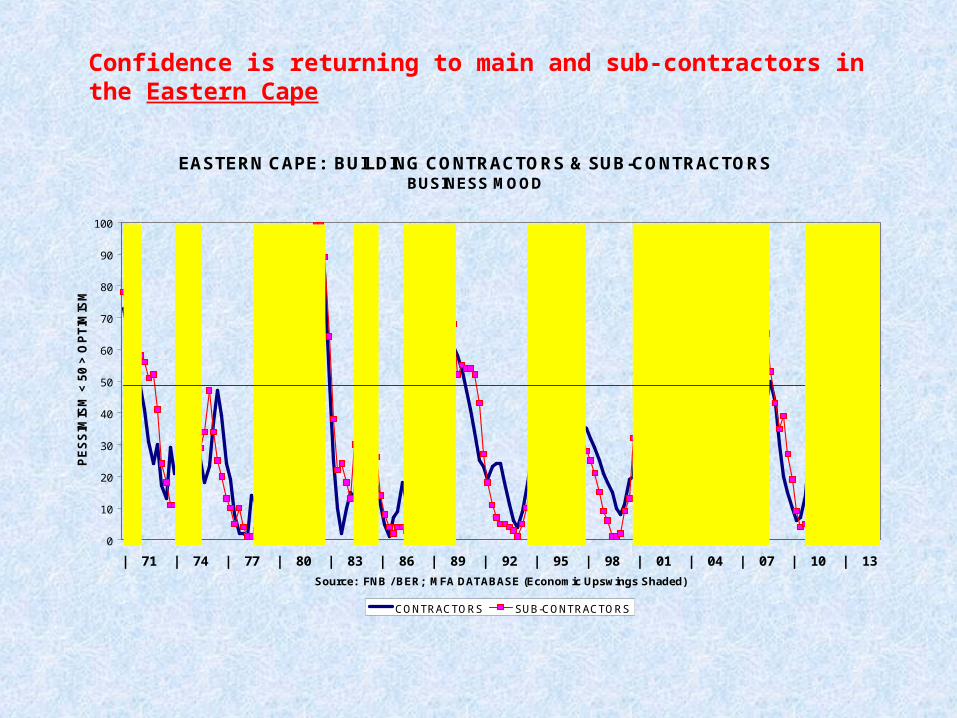
Confidence is returning to main and sub-contractors in the Eastern Cape
EASTERN CAPE: BUILDING CONTRACTORS & SUB-CONTRACTORS BUSINESS MOOD
0
10
20
30
40
50
60
70
80
90
100
| 71 | 74 | 77 | 80 | 83 | 86 | 89 | 92 | 95 | 98 | 01 | 04 | 07 | 10 | 13
Source: FNB / BER; MFA DATABASE (Economic Upswings Shaded)
PE
SS
IMIS
M <
50
> O
PT
IMIS
M
CONTRACTORS SUB-CONTRACTORS
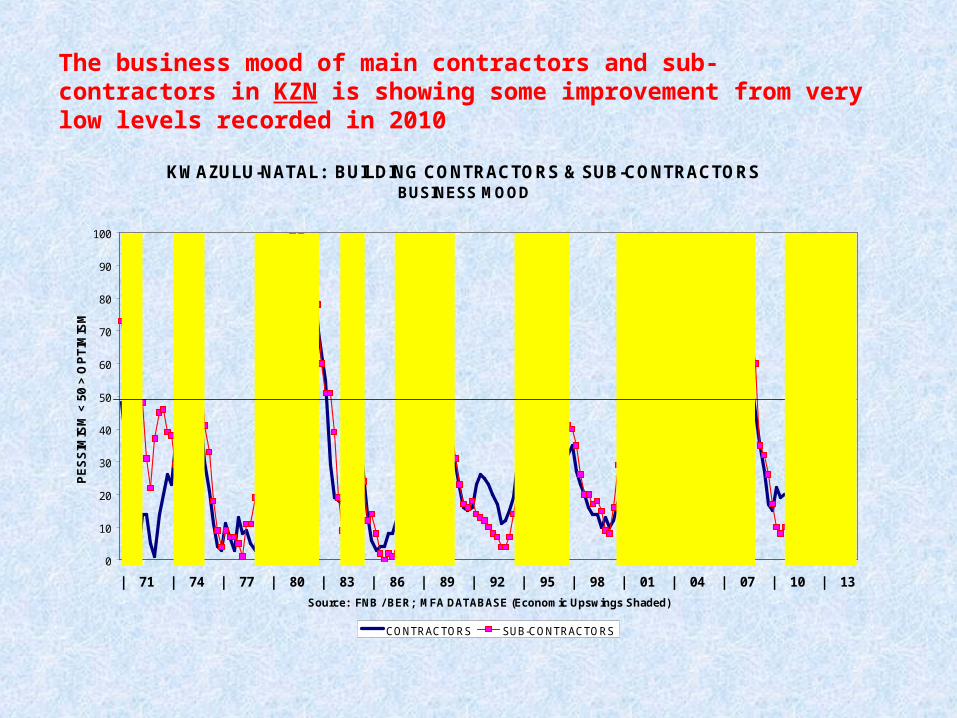
The business mood of main contractors and sub-contractors in KZN is showing some improvement from very low levels recorded in 2010
KWAZULU-NATAL: BUILDING CONTRACTORS & SUB-CONTRACTORS BUSINESS MOOD
0
10
20
30
40
50
60
70
80
90
100
| 71 | 74 | 77 | 80 | 83 | 86 | 89 | 92 | 95 | 98 | 01 | 04 | 07 | 10 | 13
Source: FNB / BER; MFA DATABASE (Economic Upswings Shaded)
PE
SS
IMIS
M <
50
> O
PT
IMIS
M
CONTRACTORS SUB-CONTRACTORS
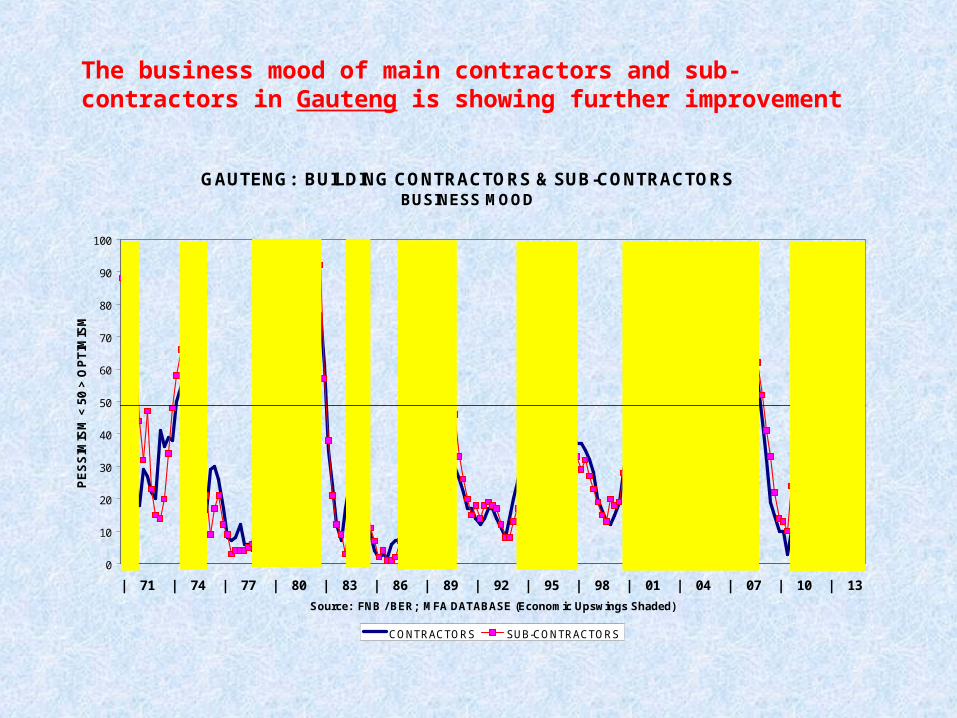
The business mood of main contractors and sub-contractors in Gauteng is showing further improvement
GAUTENG: BUILDING CONTRACTORS & SUB-CONTRACTORSBUSINESS MOOD
0
10
20
30
40
50
60
70
80
90
100
| 71 | 74 | 77 | 80 | 83 | 86 | 89 | 92 | 95 | 98 | 01 | 04 | 07 | 10 | 13
Source: FNB / BER; MFA DATABASE (Economic Upswings Shaded)
PE
SS
IMIS
M <
50
> O
PT
IMIS
M
CONTRACTORS SUB-CONTRACTORS
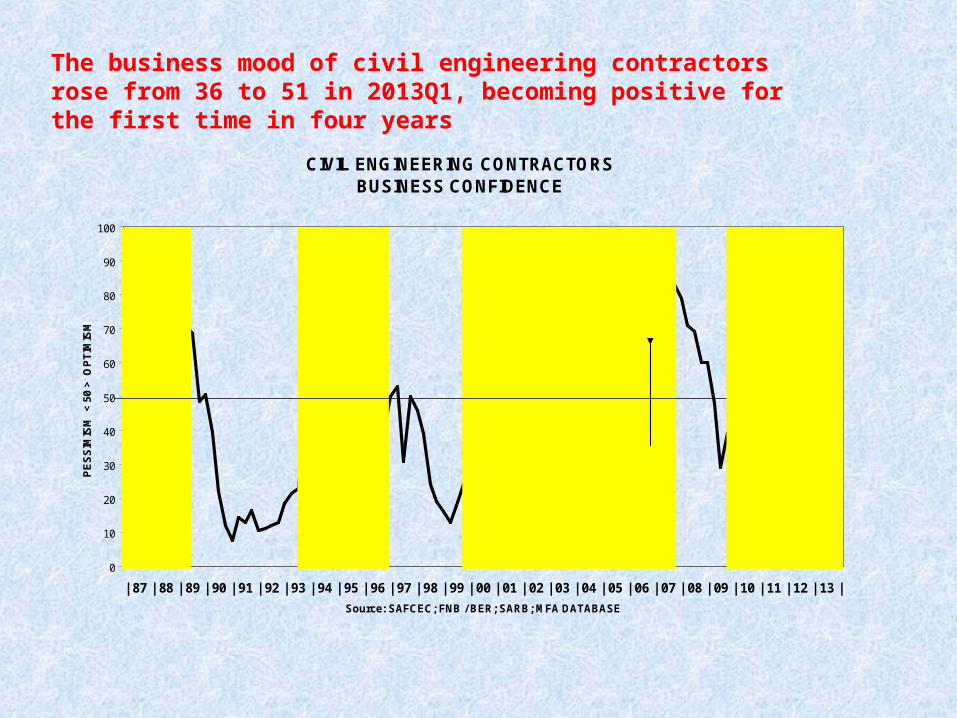
The business mood of civil engineering contractors rose from 36 to 51 in 2013Q1, becoming positive for the first time in four years
CIVIL ENGINEERING CONTRACTORSBUSINESS CONFIDENCE
0
10
20
30
40
50
60
70
80
90
100
| 87 | 88 | 89 | 90 | 91 | 92 | 93 | 94 | 95 | 96 | 97 | 98 | 99 | 00 | 01 | 02 | 03 | 04 | 05 | 06 | 07 | 08 | 09 | 10 | 11 | 12 | 13 |
Source: SAFCEC; FNB / BER; SARB; MFA DATABASE
PE
SS
IMIS
M <
50
> O
PT
IMIS
M
THE SHADED AREAS REPRESENT THE UPSWING PHASE OF THE BUSINESS CYCLE
ESKOMROADSTRANSNETGAUTRAINSOCCER CUPMEGA - PROJECTSPESSIMISM
OPTIMISM
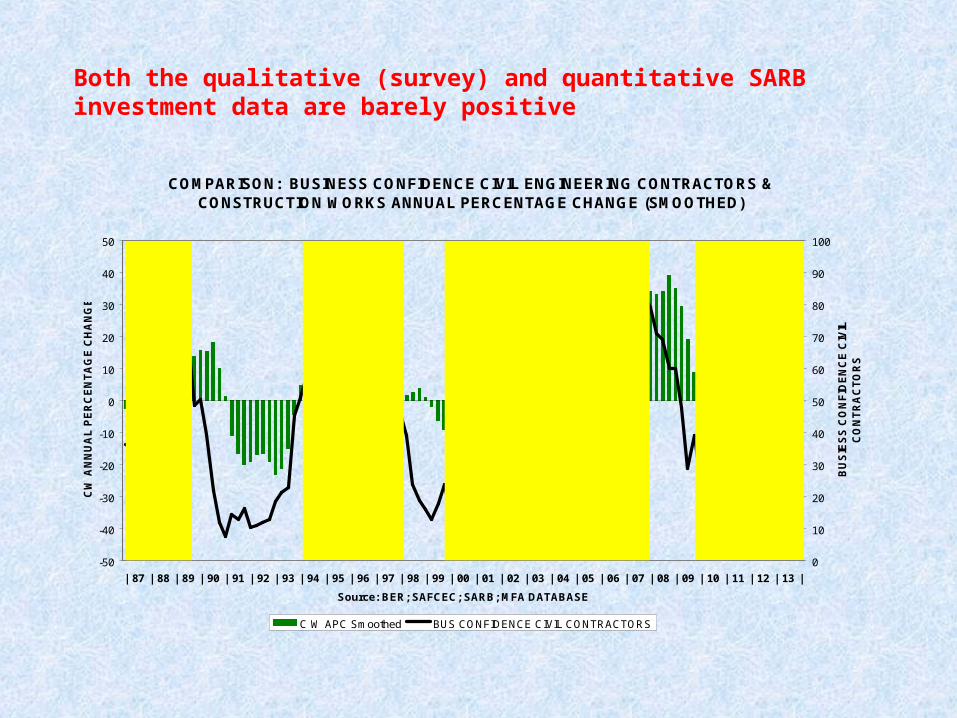
Both the qualitative (survey) and quantitative SARB investment data are barely positive
COMPARISON: BUSINESS CONFIDENCE CIVIL ENGINEERING CONTRACTORS & CONSTRUCTION WORKS ANNUAL PERCENTAGE CHANGE (SMOOTHED)
-50
-40
-30
-20
-10
0
10
20
30
40
50
| 87 | 88 | 89 | 90 | 91 | 92 | 93 | 94 | 95 | 96 | 97 | 98 | 99 | 00 | 01 | 02 | 03 | 04 | 05 | 06 | 07 | 08 | 09 | 10 | 11 | 12 | 13 |
Source: BER; SAFCEC; SARB; MFA DATABASE
CW
AN
NU
AL
PE
RC
EN
TA
GE
CH
AN
GE
0
10
20
30
40
50
60
70
80
90
100
BU
SIE
SS
CO
NF
IDE
NC
E C
IVIL
C
ON
TR
AC
TO
RS
C W APC Smoothed BUS CONFIDENCE CIVIL CONTRACTORS
PESSIMISM
OPTIMISM
Related Documents