This article appeared in a journal published by Elsevier. The attached copy is furnished to the author for internal non-commercial research and education use, including for instruction at the authors institution and sharing with colleagues. Other uses, including reproduction and distribution, or selling or licensing copies, or posting to personal, institutional or third party websites are prohibited. In most cases authors are permitted to post their version of the article (e.g. in Word or Tex form) to their personal website or institutional repository. Authors requiring further information regarding Elsevier’s archiving and manuscript policies are encouraged to visit: http://www.elsevier.com/authorsrights

Welcome message from author
This document is posted to help you gain knowledge. Please leave a comment to let me know what you think about it! Share it to your friends and learn new things together.
Transcript
This article appeared in a journal published by Elsevier. The attachedcopy is furnished to the author for internal non-commercial researchand education use, including for instruction at the authors institution
and sharing with colleagues.
Other uses, including reproduction and distribution, or selling orlicensing copies, or posting to personal, institutional or third party
websites are prohibited.
In most cases authors are permitted to post their version of thearticle (e.g. in Word or Tex form) to their personal website orinstitutional repository. Authors requiring further information
regarding Elsevier’s archiving and manuscript policies areencouraged to visit:
http://www.elsevier.com/authorsrights
Author's personal copy
Ecological Indicators 38 (2014) 113– 123
Contents lists available at ScienceDirect
Ecological Indicators
jou rn al hom epage: www.elsev ier .com/ locate /eco l ind
Environmental impacts on the Galapagos Islands: Identificationof interactions, perceptions and steps ahead
Francisco Benitez-Capistrosa,∗, Jean Hugéa,b,c, Nico Koedama
a Laboratory of Plant Biology and Nature Management (APNA), Faculty of Sciences and Bio-engineering Sciences, Vrije Universiteit Brussel, Pleinlaan 2,B-1050 Brussels, Belgiumb Centre for Sustainable Development, University of Ghent, Poel 16, B-9000 Ghent, Belgiumc Institute for Environment and Sustainable Development, University of Antwerp, Universiteitsplein 1, B-2060 Antwerp, Belgium
a r t i c l e i n f o
Article history:Received 12 March 2013Received in revised form 11 October 2013Accepted 16 October 2013
Keywords:Environmental impactsGalapagos IslandsDelphi methodDPSIR frameworkEcosystem servicesSustainability indicatorsSocio-ecological system
a b s t r a c t
In the Galapagos Islands human activities such as fisheries and tourism, have boosted the islands’ econ-omy at the cost of ecological losses and constant pressures to the fragile insular ecosystems. Hencethe evaluation of environmental impacts is essential and requires multiple indicators, appropriate formeasuring the state and the interactions of the interrelated social and environmental variables and itsrelation to ecosystem services. The present research proposes a participatory approach to understandthe perception of environmental impacts and its relation to ecosystem services to develop responsiveimpact mitigation strategies in the Galapagos Islands. The Drivers–Pressures–State–Impact–Responses(DPSIR) framework provided an analytical lens, while the Delphi method was chosen to involve selectedGalapagos experts in the indicator selection process. The Delphi method consists of an iterative set ofquestionnaire surveys, interspersed with feedback from earlier response rounds. According to our results,37/55 statistical consent indicators (qi ≥ 3.5 and Q ≤ 0.5) and 7/28 relevant interactions of environmentalimpacts (mean ≥ 0.5 and CV ≤ 0.5) explain a cascade of socio-ecological interconnectivity that generatesenvironmental impacts on the Galapagos Islands. Hence, first the socio-economic-cultural and institu-tional forces (drivers) that include: the increase of tourism and migration, economic growth, continentallifestyles, lack of education and weak management of institutions. These drivers place stress on theenvironment (pressures). The pressures include: the importation of goods, land clearing for agricul-ture/abandonment and urban zone extension. Subsequently, these pressures generate changes in theenvironmental functions (impacts). The identification of impacts and their interactions indicate a closerelationship between eight impacts in Galapagos: introduction of species, biodiversity loss, land usechange, loss of biological resources, habitat fragmentation, landscape alterations, water basin overex-ploitation and decrease of water quality. Lastly, scientifically sound solutions and alternatives to dealwith the Galapagos’ social, economical, political, managerial and technical problems are also provided(responses). This study is an applicable useful systemic reference for Galapagos’ decision makers to deliverpolicies in order to move towards proper conservation management.
© 2013 Elsevier Ltd. All rights reserved.
1. Introduction
Since Charles Darwin visited the Galapagos Islands in 1835,this oceanic Pacific Ecuadorian archipelago has been at the focusof interest of many natural science and evolutionary researchers.However, rapid social development and the impacts of globaliza-tion have triggered complex social-ecological change (Gonzalezet al., 2008) that affect the island’s ecosystem services (ES). ESare defined as “benefits that humans recognize as obtained from
∗ Corresponding author. Tel.: +32 494780298.E-mail addresses: [email protected], [email protected]
(F. Benitez-Capistros).
ecosystems that support, directly or indirectly, their survival andquality of life” (Harrington et al., 2010). Hence, Galapagos’ humanwell-being depends on ES direct consumptive use values (i.e. fish-eries) and non-consumptive values (i.e. tourism) (Goulder andKennedy, 1997, 2011; Seddon et al., 2011).
Today more than 25,000 people inhabit four of the 19 largestislands Isabela (4670 km2), Santa Cruz (986 km2), San Cristobal(557 km2) and Floreana (173 km2) (INEC, 2010). Direct consump-tive uses of land, removal of building materials such as sand, rock,and timber for use in housing and road construction are common;but, at the same time, generate related population demands forwaste management, sewage disposal, water, electricity and goodsto be transported to the island (Gonzalez et al., 2008; Kerr et al.,2004). These transported goods carry the risk of introduction of
1470-160X/$ – see front matter © 2013 Elsevier Ltd. All rights reserved.http://dx.doi.org/10.1016/j.ecolind.2013.10.019
Author's personal copy
114 F. Benitez-Capistros et al. / Ecological Indicators 38 (2014) 113– 123
invasive species, today recognized as the largest single threat toGalapagos biodiversity in the short term (Gonzalez et al., 2008;Guézou et al., 2010).
As mentioned by Goulder and Kennedy (1997, 2011) the otherdirect consumptive use value corresponds to Galapagos’ marineecosystem. Since 1990 there has been a significant fishery for eco-nomically important trade species. The illegal fishing activities,mostly for shark fins (Reyes and Murillo, 2008), overexploitationof sea cucumbers especially Isostichopus fuscus (Hearn et al., 2005;Toral-Granda, 2008) and lobsters Scyllarides astori, Panulirus peni-cillatus and Panulirus gracilis (Hearn, 2006, 2008) are recognizedas the major threats for these local marine resources and wildlife(Baine, 2007; Baine et al., 2007; Toral-Granda, 2008).
Against these direct consumptive use values is the non-consumptive value of tourism. In Galapagos there are 66 terrestrialvisiting points distributed over 15 islands and 74 marine visitingsites distributed around 19 islands where certain activities such asscuba diving, snorkelling, kayak and panga rides are allowed (GNP,2013). With more than 180,000 people visiting Galapagos (GNP,2012), tourism is a cultural ecosystem service that can easily becaptured in economic terms due to its iconic aesthetic measurablevalue (Satz et al., 2013). The revenues received from tourism gen-erate more than 65% of Galapagos GDP with 85 million USD/year(Epler, 2007). Hence, tourism is the sector that provides the mostemployment (33%), followed by trade (21.5%), the public sector(11.6%), domestic jobs (8.7%), agriculture (5.9%) and construction(5.7%) (CGREG, 2010). Paradoxically, this process often poses adirect threat to the nature values that lie at the basis of tourismand economic prosperity itself (Samways et al., 2008) and makesGalapagos’ economy crucially dependent on successful conserva-tion strategies. The loss of wildlife would cause the loss of tourismand hence the rapid decline of the economy and vice versa. Ideallytourism brings money and could be invested in conservation efforts.In reality most revenues flow to tour operators, most of them non-Ecuadorian, and to other off-island entities; consequently, conflictsover resources (in particular of sea cucumber fisheries), the indirectuse values of tourism by locals; and biodiversity conservation havearisen (Goulder and Kennedy, 2011).
Retrieving basic information on the dynamics of the inter-connections between the social and ecological systems and therelationship of ecosystem services to human well-being is of sumimportance (Carpenter et al., 2009). Sustainability is a concept thatoffers a solution to these problems by providing decision makerswith strategies to guide their decisions so as to allow to presentand future generations to meet their needs within the limits ofthe earth’s carrying capacity (Rockstrom et al., 2009; Waas et al.,2011). However, in order to translate sustainability from a conceptto a tangible strategy, indicators are key tools. Generically indi-cators could be defined as ‘sign or signals that relay a complexmessage, from potentially numerous sources, in a simple and use-ful manner’ (Kurtz et al., 2001) and are designed to communicate aproperty or trend of a system to decision makers (Bell and Morse,2008; Hak et al., 2007; Miller, 2001). Hence when extended, sus-tainability indicators would be described as a set of indicators thatmeasure characteristics or processes of the socio-ecological sys-tems to ensure its continuity and functionality far into the future.
In the present research, the Drivers–Pressures–State–Impact–Responses (DPSIR) framework was used to structure our analysisand develop sustainability indicators. DPSIR is an approach thatallows identifying the role of humans in nature by representinga system that includes societal (human) and ecological (biophysi-cal) subsystems in mutual interactions (Elliott, 2002; Omann et al.,2009; Rogers and Greenaway, 2005; Scheren et al., 2004). The maingoal of this paper is to identify and characterize environmentalimpacts and their interconnections associated with human activi-ties and the ecosystem services on the Galapagos Islands. The DPSIR
framework was used as an analytical lens to provide a sequen-tial list of sustainability indicators, while the Delphi method wasused to determine which indicators are perceived as more relevantaccording to a selected group of participants. Delphi is an itera-tive questionnaire designed to elicit expert’s knowledge. The studyalso investigated whether crucial environmental information waslacking, how impacts interact with each other, the relation withecosystem services, how multiple stakeholders in Galapagos per-ceive these impacts and what solutions they have to offer to furtherguide and facilitate a sustainable development and protection ofthe archipelago.
2. Materials and methods
Delphi is defined as ‘a method of structuring a group communi-cation process so that the process is effective in allowing a group ofindividuals as a whole to deal with a complex problems’ (Hugé et al.,2010). It has been frequently used in many research areas rangingfrom medicine (Hwang et al., 2006; Thangaratinam and Redman,2005) to environmental, scientific and policy evaluations and sce-narios (Kuo et al., 2005; Miller, 2001; Nowack et al., 2011; Swor andCanter, 2011; Turoff and Linstone, 2002; Wright, 2006) and conser-vation management (Eycott et al., 2011; James et al., 2009; Mehnenet al., 2012).
The method is a structured and iterative survey of ‘experts’ orparticipants intended to generate unbiased opinions and trans-forming such opinions into one or more collective notion(s)through a feedback process. After completing the surveys each par-ticipant is given a communal feedback on the group responses.With this information in hand, the participants complete the surveyform again. Then (s)he can change or not his opinion based on theinformation provided by the other participants. The process can berepeated several times in several rounds until consensus increasesor is reached.
The reasons to use Delphi in this research were numerous butthree were considered key: (1) Rigorous for expert and stakeholderqueries (Dalal et al., 2011; Okoli and Pawlowski, 2004), (2) flexi-ble design (Elmer et al., 2010); and (3) anonymous survey (Landetaand Barrutia, 2011). In the present study, the Delphi method wasused in an online environment. The web-based survey tool usedfor this particular study was OSuCre online survey creator (seehttp://www.osucre.be/). The online-based Delphi was used to over-come limitations in the Delphi process using paper-based surveysand space limitations as observed on other Delphi studies (Camet al., 2002; Steyaert and Lisoir, 2005).
2.1. Selection and identification of Delphi participants
Delphi is an expert elicitation method that has been used sincethe 1950s. An expert is a person who is particularly competent asauthority on a certain matter of facts (Flick, 2009). However, defin-ing what or who is an expert and the interrelated expertise andknowledge is challenging (Burgman et al., 2011; Failing et al., 2007).For instance, in the case of interactions with stakeholders that aredesigned to foster the acceptance of proposed actions, expertiseshould include the ability of an effective communication (Burgmanet al., 2011). However, the separation of experts and stakehol-ders might be unrealistic and counter-productive as it can preventthe social capital resulting from co-generation of knowledge in astakeholder group (Krueger et al., 2012). Moreover, knowledge iscontextual and it depends on the interests it serves, the purposefor which it is harnessed, or the manner in which it is generated(Burgman et al., 2011). Thus, the selection of the participants in Del-phi is critical and must be performed rigorously so that the groupcomposition reflects the diversity of valuable knowledge (Okoli and
Author's personal copy
F. Benitez-Capistros et al. / Ecological Indicators 38 (2014) 113– 123 115
Pawlowski, 2004; Steyaert and Lisoir, 2005). For this research weconsidered an ‘expert’ as a person or participant who, by a verifiablemean (particular job position, expertise/knowledge, publications),is known to have information or that has access to information,which concerns the issues under investigation. To properly identifyDelphi participants and to minimize possible known biases (Freweret al., 2011) and generate groups with similar size of participants,we decided to follow four steps described by Okoli and Pawlowski(2004). Hence, the final group of participants was established asfollows:
1. Government officials: Besides the officials of the GalapagosNational Park (GNP) directory, which at time was the most influ-ential governmental body in charge of policies regulation andmanagement of both the Galapagos National Park and MarineReserve (GMR), officials from the GMR and officials from themunicipalities of Santa Cruz, San Cristobal and Isabella islands,were also selected.
2. Scientists/academics: The group was covered by scientists relatedto natural and exact sciences (e.g. biology, ecology), socialand policy related sciences (e.g. economy, sociology, envi-ronmental management) and interdisciplinary sciences (e.g.socio-ecological modelling). All scientists were identified bytheir publication record over the past 15 years.
3. Local residents: The group was formed by residents involved ineducation, fishery and tourism activities, whereby both publicand private sectors were selected.
4. Officials of Non-Governmental Organizations (NGOs): This cate-gory mainly involves groups with a long history in the GalapagosIslands. The Charles Darwin foundation, Galapagos Conservancy,WWF, Conservation International among the most renownedones. However, many other officials of NGOs that contributeor have contributed to Galapagos protection and developmentwere also invited.
2.2. Preparation and distribution of Delphi questionnaires
First, documents explaining the aim and purpose of Del-phi were distributed to 42 potential participants. Second,an interactive bilingual (English–Spanish) web page platform(http://student.vub.ac.be/∼fbenitez/) to upload any necessary doc-uments (e.g. reports, procedures, links, and contact information)and to facilitate communication and visualization of the resultsamong the participants anonymously was also created. Electronicinvitation letters were sent for each of the three consecutive rounds.The online questionnaires were first created in an MS Excel (XLS)environment, which were then uploaded to a hypertext preproces-sor (PHP) server provided by OSuCre (http://survey.osucre.be/fjb)where all three questionnaires were uploaded and the obtaineddata was kept and could be downloaded in a comma separatedvalue (CSV) format for statistical analysis. Reports describing theresults of each questionnaire were sent via email and uploaded tothe main webpage after each of the three Delphi rounds in thisresearch. The time frame given to respond to each of the threeconsecutive rounds was of four weeks. The time elapsed betweenthe delivery of the first questionnaire in round 1 and round 3 wasapproximately 5 months.
2.3. The DPSIR framework
The DPSIR framework logic was used to structure the secondround questionnaire based on the generated responses providedby the participants in the first round, especially of the open-ended questions. The DPSIR was chosen because of its provensuitability in the context of describing linkages between humanpressures and environmental issues and because of its usefulness in
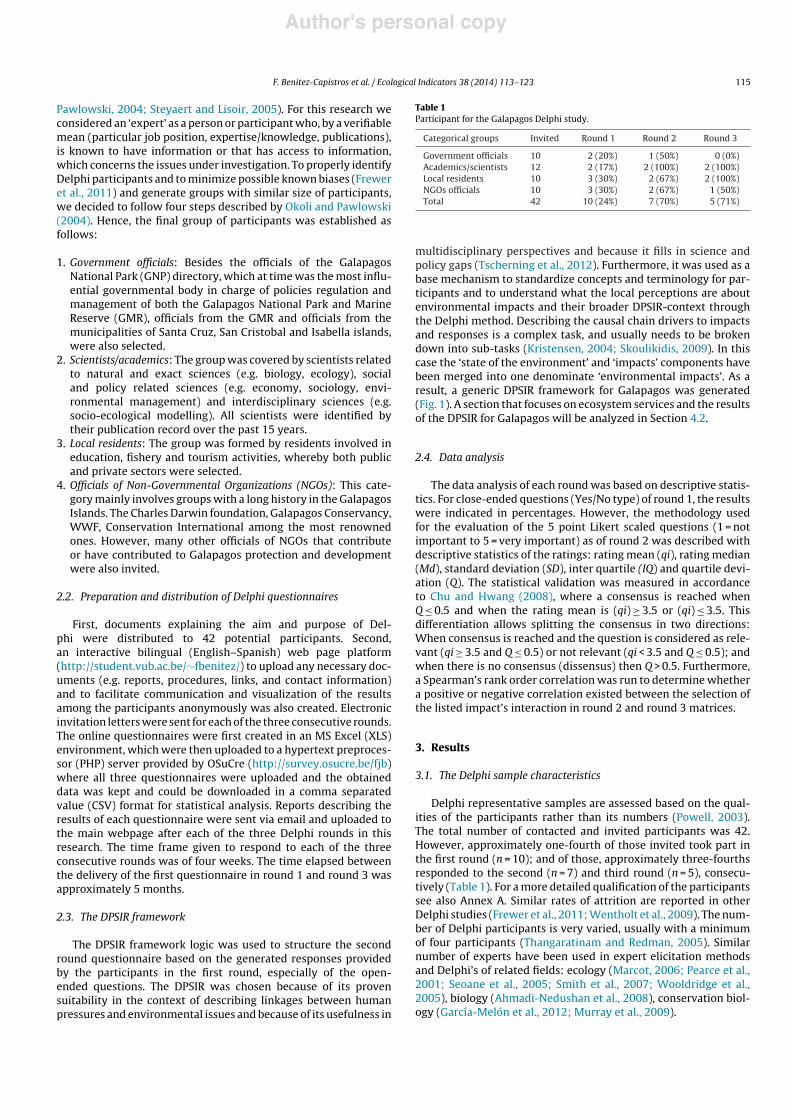
Table 1Participant for the Galapagos Delphi study.
Categorical groups Invited Round 1 Round 2 Round 3
Government officials 10 2 (20%) 1 (50%) 0 (0%)Academics/scientists 12 2 (17%) 2 (100%) 2 (100%)Local residents 10 3 (30%) 2 (67%) 2 (100%)NGOs officials 10 3 (30%) 2 (67%) 1 (50%)Total 42 10 (24%) 7 (70%) 5 (71%)
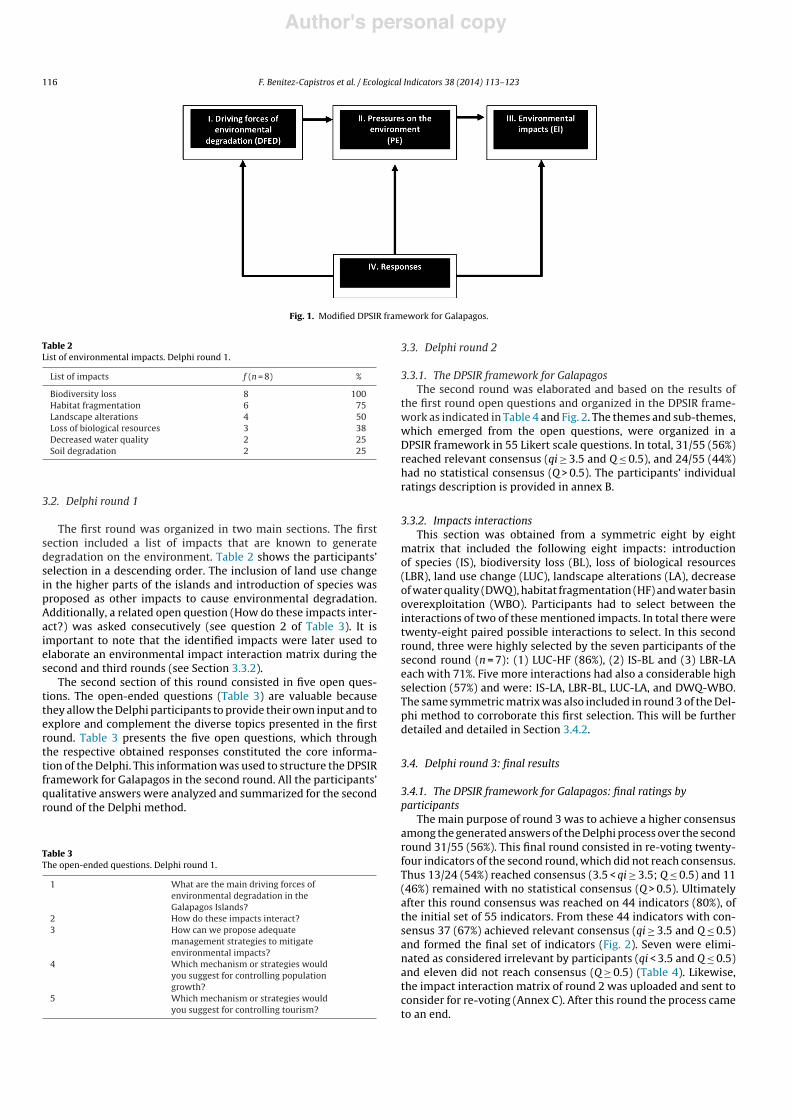
multidisciplinary perspectives and because it fills in science andpolicy gaps (Tscherning et al., 2012). Furthermore, it was used as abase mechanism to standardize concepts and terminology for par-ticipants and to understand what the local perceptions are aboutenvironmental impacts and their broader DPSIR-context throughthe Delphi method. Describing the causal chain drivers to impactsand responses is a complex task, and usually needs to be brokendown into sub-tasks (Kristensen, 2004; Skoulikidis, 2009). In thiscase the ‘state of the environment’ and ‘impacts’ components havebeen merged into one denominate ‘environmental impacts’. As aresult, a generic DPSIR framework for Galapagos was generated(Fig. 1). A section that focuses on ecosystem services and the resultsof the DPSIR for Galapagos will be analyzed in Section 4.2.
2.4. Data analysis
The data analysis of each round was based on descriptive statis-tics. For close-ended questions (Yes/No type) of round 1, the resultswere indicated in percentages. However, the methodology usedfor the evaluation of the 5 point Likert scaled questions (1 = notimportant to 5 = very important) as of round 2 was described withdescriptive statistics of the ratings: rating mean (qi), rating median(Md), standard deviation (SD), inter quartile (IQ) and quartile devi-ation (Q). The statistical validation was measured in accordanceto Chu and Hwang (2008), where a consensus is reached whenQ ≤ 0.5 and when the rating mean is (qi) ≥ 3.5 or (qi) ≤ 3.5. Thisdifferentiation allows splitting the consensus in two directions:When consensus is reached and the question is considered as rele-vant (qi ≥ 3.5 and Q ≤ 0.5) or not relevant (qi < 3.5 and Q ≤ 0.5); andwhen there is no consensus (dissensus) then Q > 0.5. Furthermore,a Spearman’s rank order correlation was run to determine whethera positive or negative correlation existed between the selection ofthe listed impact’s interaction in round 2 and round 3 matrices.
3. Results
3.1. The Delphi sample characteristics
Delphi representative samples are assessed based on the qual-ities of the participants rather than its numbers (Powell, 2003).The total number of contacted and invited participants was 42.However, approximately one-fourth of those invited took part inthe first round (n = 10); and of those, approximately three-fourthsresponded to the second (n = 7) and third round (n = 5), consecu-tively (Table 1). For a more detailed qualification of the participantssee also Annex A. Similar rates of attrition are reported in otherDelphi studies (Frewer et al., 2011; Wentholt et al., 2009). The num-ber of Delphi participants is very varied, usually with a minimumof four participants (Thangaratinam and Redman, 2005). Similarnumber of experts have been used in expert elicitation methodsand Delphi’s of related fields: ecology (Marcot, 2006; Pearce et al.,2001; Seoane et al., 2005; Smith et al., 2007; Wooldridge et al.,2005), biology (Ahmadi-Nedushan et al., 2008), conservation biol-ogy (García-Melón et al., 2012; Murray et al., 2009).
Author's personal copy
116 F. Benitez-Capistros et al. / Ecological Indicators 38 (2014) 113– 123
Fig. 1. Modified DPSIR framework for Galapagos.
Table 2List of environmental impacts. Delphi round 1.
List of impacts f (n = 8) %
Biodiversity loss 8 100Habitat fragmentation 6 75Landscape alterations 4 50Loss of biological resources 3 38Decreased water quality 2 25Soil degradation 2 25
3.2. Delphi round 1
The first round was organized in two main sections. The firstsection included a list of impacts that are known to generatedegradation on the environment. Table 2 shows the participants’selection in a descending order. The inclusion of land use changein the higher parts of the islands and introduction of species wasproposed as other impacts to cause environmental degradation.Additionally, a related open question (How do these impacts inter-act?) was asked consecutively (see question 2 of Table 3). It isimportant to note that the identified impacts were later used toelaborate an environmental impact interaction matrix during thesecond and third rounds (see Section 3.3.2).
The second section of this round consisted in five open ques-tions. The open-ended questions (Table 3) are valuable becausethey allow the Delphi participants to provide their own input and toexplore and complement the diverse topics presented in the firstround. Table 3 presents the five open questions, which throughthe respective obtained responses constituted the core informa-tion of the Delphi. This information was used to structure the DPSIRframework for Galapagos in the second round. All the participants’qualitative answers were analyzed and summarized for the secondround of the Delphi method.
Table 3The open-ended questions. Delphi round 1.
1 What are the main driving forces ofenvironmental degradation in theGalapagos Islands?
2 How do these impacts interact?3 How can we propose adequate
management strategies to mitigateenvironmental impacts?
4 Which mechanism or strategies wouldyou suggest for controlling populationgrowth?
5 Which mechanism or strategies wouldyou suggest for controlling tourism?
3.3. Delphi round 2
3.3.1. The DPSIR framework for GalapagosThe second round was elaborated and based on the results of
the first round open questions and organized in the DPSIR frame-work as indicated in Table 4 and Fig. 2. The themes and sub-themes,which emerged from the open questions, were organized in aDPSIR framework in 55 Likert scale questions. In total, 31/55 (56%)reached relevant consensus (qi ≥ 3.5 and Q ≤ 0.5), and 24/55 (44%)had no statistical consensus (Q > 0.5). The participants’ individualratings description is provided in annex B.
3.3.2. Impacts interactionsThis section was obtained from a symmetric eight by eight
matrix that included the following eight impacts: introductionof species (IS), biodiversity loss (BL), loss of biological resources(LBR), land use change (LUC), landscape alterations (LA), decreaseof water quality (DWQ), habitat fragmentation (HF) and water basinoverexploitation (WBO). Participants had to select between theinteractions of two of these mentioned impacts. In total there weretwenty-eight paired possible interactions to select. In this secondround, three were highly selected by the seven participants of thesecond round (n = 7): (1) LUC-HF (86%), (2) IS-BL and (3) LBR-LAeach with 71%. Five more interactions had also a considerable highselection (57%) and were: IS-LA, LBR-BL, LUC-LA, and DWQ-WBO.The same symmetric matrix was also included in round 3 of the Del-phi method to corroborate this first selection. This will be furtherdetailed and detailed in Section 3.4.2.
3.4. Delphi round 3: final results
3.4.1. The DPSIR framework for Galapagos: final ratings byparticipants
The main purpose of round 3 was to achieve a higher consensusamong the generated answers of the Delphi process over the secondround 31/55 (56%). This final round consisted in re-voting twenty-four indicators of the second round, which did not reach consensus.Thus 13/24 (54%) reached consensus (3.5 < qi ≥ 3.5; Q ≤ 0.5) and 11(46%) remained with no statistical consensus (Q > 0.5). Ultimatelyafter this round consensus was reached on 44 indicators (80%), ofthe initial set of 55 indicators. From these 44 indicators with con-sensus 37 (67%) achieved relevant consensus (qi ≥ 3.5 and Q ≤ 0.5)and formed the final set of indicators (Fig. 2). Seven were elimi-nated as considered irrelevant by participants (qi < 3.5 and Q ≤ 0.5)and eleven did not reach consensus (Q ≥ 0.5) (Table 4). Likewise,the impact interaction matrix of round 2 was uploaded and sent toconsider for re-voting (Annex C). After this round the process cameto an end.
Author's personal copy
F. Benitez-Capistros et al. / Ecological Indicators 38 (2014) 113– 123 117
Table 4Final results of the DPSIR framework for Galapagos.
DPSIR framework Consensus for relevant indicators qi ≥ 3.5 andQ ≤ 0.5
Consensus for not relevantindicators qi < 3.5 and Q ≤ 0.5
No consensus (dissensus) Q ≥ 0.5
Driving forces ofenvironmentaldegradation (DFED)
Increase in tourism and high migration fromcontinent (DFED1), economic growth (DFED2),flights and ship cargos number increase(DFED3), increase in the number of vehicles(DFED4), continental lifestyle and lack ofeducation (DFED5), inappropriate model ofdevelopment does not integrate ecosystemsresilience (DFED6), weak management ofinstitutions (DFED10), dysfunctional judicialsystem (DFED11), bad government of thepopulation (DFED13)
Erroneous local tourismdevelopment (DFED7)
Tourism monopolization (DFED8), noproper regulation of tourism activities(DFED9), complicity between localpeople (DFED12)
Pressures on theenvironment (PE)
Importation of goods (PE1), land clearing foragriculture and abandonment (PE2), urbanzone extension and higher pressure towardsnatural resources (PE3)
– Illegal fishing (PE4)
Responses DFED: Tourismgrowth strategies (R TS)
Define ecotourism products to becommercialized and government entities topromote them (R TS2), regulatory plan forspecific quantities of tourist per season (R TS3),establish a management system of touristicactivities in the inhabited centres (R TS4),establish maximum annual quotas (R TS5),stop the tourism growth quotas (R TS6),change the touristic packages (R TS7), demandthe consumption of local products (R TS9)
Certify operations and tourismenterprises (R TS10), decreasenumber of planes arrivals anddefine new visit itineraries(R TS12)
Develop an ecological tourism (R TS1),increase the minimum staying time to7 days (R TS8), control materials andprocess of hotels constructions(R TS11)
Responses DFED: populationgrowth strategies (R PS)
Woman sex education leading to theireconomic independence (R PS1), sexeducation: Birth control, family planning(R PS2), demographic integral studies (R PS5),strengthened local capacity building (R PS6)
One child per couple policies(R PS3), abortion approval(R PS4)
Reinforce and be stricter withmigratory restrictions (R PS7), fastenapproval of temporary residents(R PS8), penalize if illegal people ishired (R PS9)
Responses DFED: economicalternatives (R Ec)
Tourism as the main economic engine (R Ec1),managing the archipelago as a figure ofbiosphere reserve (R Ec4)
Stop foreign investment(R Ec3)
Improve the redistribution of incomesderived from tourism (R Ec2)
Responses DFED: socialalternatives (R So)
Learning to live in a natural environment(R So1), restoration vision (R So2), newcultural identity to respect its limits (R So3),development based in valuing naturalresources (R So4)
– –
Responses to pressures onthe environment (R PE)
Develop local agricultural production withhigh ecological standards (R PE1), Improvemanagement and control of imported products(R PE2)
Control material used forconstruction and penalization(R PE3)
–
Responses to environmentalimpacts (R EI)
Strengthen quarantine system for introducedspecies (R EI1), priorization of areas with highbiodiversity (R EI2), eradication largevertebrates (R EI3), completely forbid dogsand cats (R EI4), economic penalization forimporting animals (R EI5), implement a GMRzoning with latest scientific knowledge (R EI6)
– –
Total 37 7 11
3.4.2. Final set of environmental impacts and their interactionson the environment
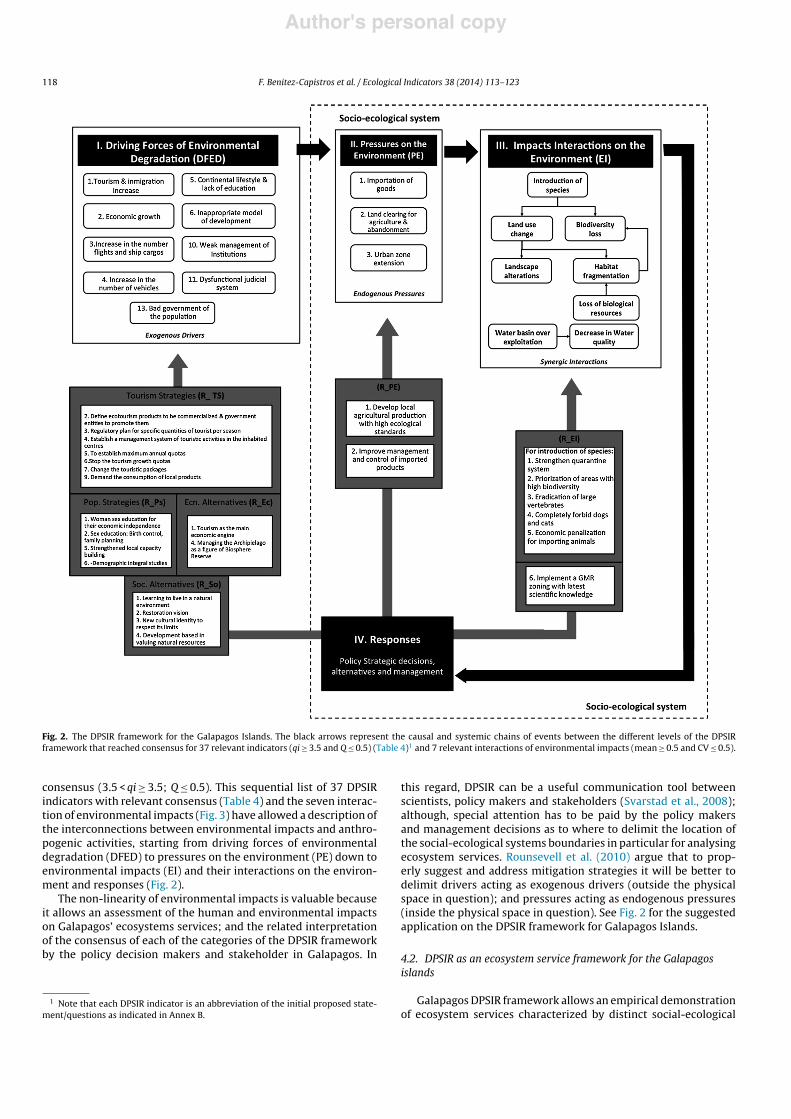
In the third round the same matrix of twenty-eight differentpaired environmental impacts had similar results as in the sec-ond round (Annex C). A Spearman’s rank order correlation wasrun to determine the relationship between the twenty eight pairedenvironmental impacts interactions between round 2 and round3 scores. There was a strong, positive correlation between round 2and round 3 scores, which was statistically significant (rs(8) = 0.698,P = 0.000). The comparison between round 2 and round 3 hasallowed the identification of different groups in accordance to theparticipants’ selection in both rounds. Therefore, and as observed inFig. 3, seven interactions of at least two set environmental impacts(EI) and their interaction on the environment in Galapagos werealso found to be the most relevant (mean ≥ 0.50; CV ≤ 0.5). Themean and the coefficient of variation (CV) between the two roundswere calculated and thus the interaction of environmental impactswhich resulted to have mean > 0.5 and CV ≤ 0.5 were considered to
have a higher degree of importance according to the participants’selection.
4. Discussion
4.1. Analysis of the DPSIR framework for the Galapagos Islands
The potential of the DPSIR framework to organize and structurecomplex information (Kristensen, 2003) was evident as the quali-tative complex information retrieved in round 1 of the Delphi (fromthe questions in Tables 2 and 3) was organized and structured usingthe DPSIR framework logic during the second round of the Delphi.The DPSIR framework has allowed describing the linkages of humanpressures and environmental issues (Tscherning et al., 2012). Inthis research this was even statistically verified in each of the lev-els of the DPSIR. As observed in Table 4 of the Delphi final round(round 3), an elevated consensus was reached (80%) with 44/55DPSIR question indicators, of which 37/55 (67%) reached relevant
Author's personal copy
118 F. Benitez-Capistros et al. / Ecological Indicators 38 (2014) 113– 123
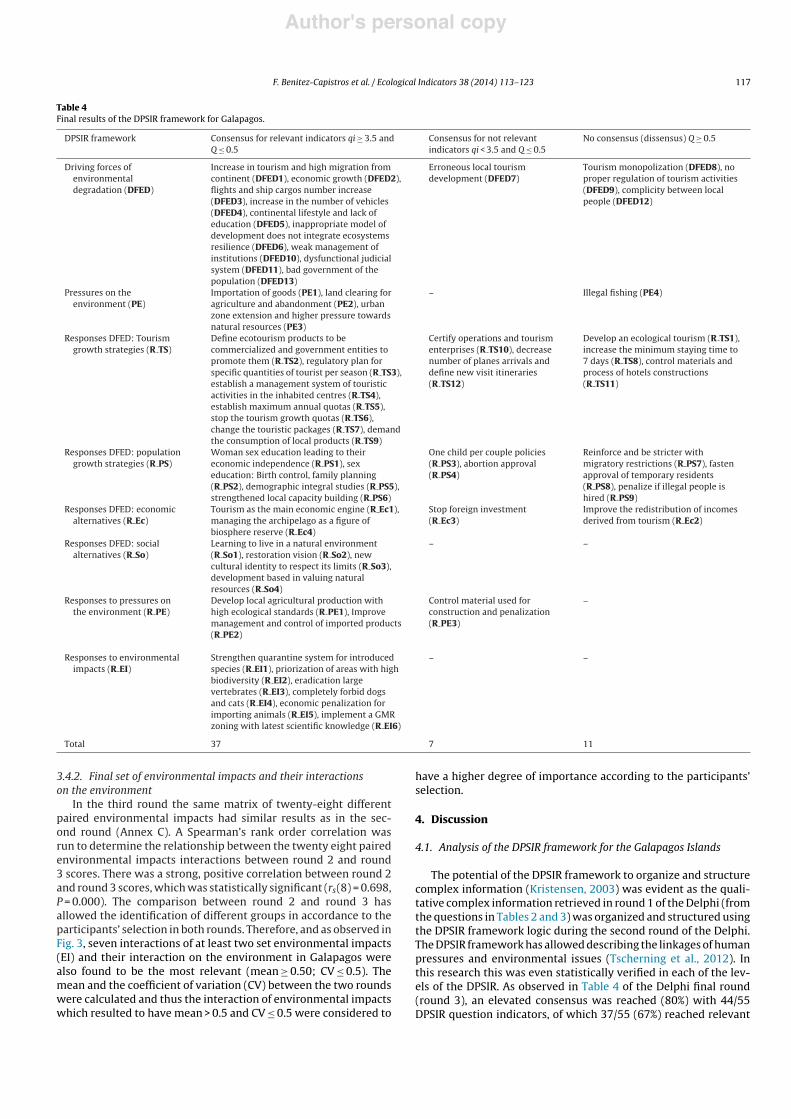
Fig. 2. The DPSIR framework for the Galapagos Islands. The black arrows represent the causal and systemic chains of events between the different levels of the DPSIRframework that reached consensus for 37 relevant indicators (qi ≥ 3.5 and Q ≤ 0.5) (Table 4)1 and 7 relevant interactions of environmental impacts (mean ≥ 0.5 and CV ≤ 0.5).
consensus (3.5 < qi ≥ 3.5; Q ≤ 0.5). This sequential list of 37 DPSIRindicators with relevant consensus (Table 4) and the seven interac-tion of environmental impacts (Fig. 3) have allowed a description ofthe interconnections between environmental impacts and anthro-pogenic activities, starting from driving forces of environmentaldegradation (DFED) to pressures on the environment (PE) down toenvironmental impacts (EI) and their interactions on the environ-ment and responses (Fig. 2).
The non-linearity of environmental impacts is valuable becauseit allows an assessment of the human and environmental impactson Galapagos’ ecosystems services; and the related interpretationof the consensus of each of the categories of the DPSIR frameworkby the policy decision makers and stakeholder in Galapagos. In
1 Note that each DPSIR indicator is an abbreviation of the initial proposed state-ment/questions as indicated in Annex B.
this regard, DPSIR can be a useful communication tool betweenscientists, policy makers and stakeholders (Svarstad et al., 2008);although, special attention has to be paid by the policy makersand management decisions as to where to delimit the location ofthe social-ecological systems boundaries in particular for analysingecosystem services. Rounsevell et al. (2010) argue that to prop-erly suggest and address mitigation strategies it will be better todelimit drivers acting as exogenous drivers (outside the physicalspace in question); and pressures acting as endogenous pressures(inside the physical space in question). See Fig. 2 for the suggestedapplication on the DPSIR framework for Galapagos Islands.
4.2. DPSIR as an ecosystem service framework for the Galapagosislands
Galapagos DPSIR framework allows an empirical demonstrationof ecosystem services characterized by distinct social-ecological
Author's personal copy
F. Benitez-Capistros et al. / Ecological Indicators 38 (2014) 113– 123 119
Fig. 3. (a) On the vertical axis, the paired impact chosen by the participants is represented. The horizontal axis represents the percentage of selection calculated by the meanbetween round 2 (n = 7) and round 3 (n = 5). The black darkest bars represent the seven paired environmental impacts which fulfilled the condition mean ≥ 0.50; CV ≤ 0.5 overround 2 and round 3. (b) The arrows represent the flow of interactions of the environmental impacts obtained as selected by participants, which represents the interactionof two impacts (i.e. introduction of species causing: biodiversity loss with mean = 0.66 and CV = 0.12 and land use change with mean = 0.51, CV = 0.24).
dynamics. For instance, the indicators that represent the exoge-nous driving forces of environmental degradation (DFED) showthe dynamics and/or relationships between the interrelated socio-economic (DFED1, DFED2, DFED3, DFED4), socio-cultural activities(DFED5, DFED6) and institutional systems (DFED10, DFED11,DFED13). These DFEDs are the underlying forces of environmentalchange (Elliott, 2002; Omann et al., 2009; Rounsevell et al., 2010)which can be well thought-out as exogenous to the system or region(e.g. climate, social, economic changes), reflecting either the past,present or future conditions that cause change to the ecosystems(Rounsevell et al., 2010).
Regarding the three out of four relevant pressures on the envi-ronment (PE1, PE2, PE3) that were considered as relevant byparticipants (qi ≥ 3.5, Q ≤ 0.5), we see that in fact these pressuresare the stresses that human activities place on the environment(Fig. 2). However, it is clear that at this very initial step of the DPSIRthe “state of the environment”, which represents the sensitivity ofthe system to the pressure variables of the environment, alreadyinvolves in one hand relevant elements to supply the ecosystemsservice by biological organisms (e.g. water supply for fauna andflora) and in the other hand a demand for ecosystems services frompeople (e.g. water supply, agricultural land). In the particular casethis research, and because of the extreme dependence on tourismin Galapagos (a part of DFED), we see that there are general socialor ecological conditions that could change how ecosystem servicesare bundled (Raudsepp-Hearne et al., 2010). For instance, tourismis a cultural ecosystem service that could, directly or indirectly,change the rest of known coastal ecosystem services: provision,support and regulation (van Beukering, 2013). This highlights the
importance of measuring tourism as a cultural ecosystem service(Nahuelhual et al., 2013) and the relationship between tourismand ecosystem services (Gee and Burkhard, 2010; Gossling, 2002;Williams and Shaw, 2009); however, this lies outside the scopeof our research. We used DPSIR to make sense of the complexsocio-ecological system as a whole and to capture the perceivedhuman and environmental impacts on the ecosystem servicebundles.
Therefore, it is possible to see that although the 9 DFEDs are lin-early connected to 3 PEs and those are connected to the 7 pairedinterrelated environmental impacts (EI) there are several non-linear dynamics involved that can affect the provision of ecosystemservices (consumptive or non consumptive use values) in thearchipelago. For example, although fisheries were an importantdirect consumptive use value since 1990 (Goulder and Kennedy,1997, 2011); the results in this research (PE4) show that fisheriesmight not be a relevant, additional, cause of environmental impacts.On the contrary, PE2 and PE3 could be identified as direct con-sumptive use values. The endogenous pressures land clearing foragriculture and land abandonment (PE2) are associated with DFED1and DFED2. Land clearing for agriculture is the consequence of localfood production to supply the increasing population and touristdemand on the islands (DFED1); whereas, land abandonment canbe attributed as the consequence of the exogenous driver economicgrowth (DFED2), as farmers attracted by better profitable economicopportunities in other activities abandoned agricultural lands (Villaand Segarra, 2010). PE2 is then bundled to impacts such as: land usechange (LUC) habitat fragmentation (HF) and biodiversity loss (BL)(Fig. 3b).
Author's personal copy
120 F. Benitez-Capistros et al. / Ecological Indicators 38 (2014) 113– 123
The endogenous pressure urban zone extension and higher pres-sure towards natural resources (PE3) is similarly in direct connectionwith DFED1 and DFED2. PE3 explains the increase in the touris-tic in-land infrastructure in San Cristobal, Isabella and Santa Cruz.From 1991 to 2006 the number of hotels doubled (25–65); andrestaurants and bars tripled (31–114) (Proano and Epler, 2008).The increase in the construction sector, so far with few ecologi-cal regulation, brings impacts related to resources extraction (lossof biological resources), such as rocks, sand, wood, water and vol-canic stones extracted from beneath the soil (Jimbo and Grenier,2010). Also, PE3 creates an increase in the energy and fresh waterdemand. Related to this is the result in EI, that indicate the inter-action of the consumptive use values for the ecosystem serviceswith the impact interaction between water basin overexploitation(WBO) and decrease of water quality (DWQ) (Fig. 3b).
In our research the analysis of the results of the interaction ofenvironmental impacts (EI) allowed us to identify recurrent pairedimpacts. For example, introduction of species (IS) and biodiver-sity loss (BL) bundle (IS-BL) easily reflect the serious situation thatthis interaction of environmental impacts generates in Galapagos(Gonzalez et al., 2008; Guézou et al., 2010). Moreover, BL could beconsidered the ultimate impact indicator that represents the “stateof the environment” and which generates visible impacts. BL reflectschanges in the environmental functions that can, in turn, affect thesocial and economic dimensions by affecting tourism. For exam-ple, fewer tourists would be attracted to Galapagos if its iconicwildlife were lost. Hence, BL could impact tourism and generatea cascading social and economic effect in Galapagos. So, tourismis a non-consumptive value that extremely depends on biodiver-sity conservation, and hence if affected will ultimately generateresponses for management decisions towards biodiversity conser-vation policies. In this regards, attention needs to be paid in DPSIRframeworks since the driving forces are perceived as external forcesdamaging the area or species that need protection rather thansocio-economic and cultural processes that are integrated withdevelopments in biodiversity (Svarstad et al., 2008). We considerthat future assessments on biodiversity in the Galapagos Islandsshould address linkages between ecosystem change and humanwell-being and sustainability (Sachs and Reid, 2006).
Finally, it is clear that the ecosystem services bundles inGalapagos involve multiple trade-offs and synergies involved inmanagement decisions. The DPSIR response section (box IV Fig. 2)is critical since it can provide ‘policy actions initiated by institu-tions or groups (politicians, managers, consensus group) which aredirectly or indirectly triggered by (societal perceptions of) impactsand which attempts to prevent, eliminate, compensate, reduce oradapt to them and their consequences’ (Omann et al., 2009). Thesecharacteristics aim to contribute to the mitigation (and to the pre-vention) of environmental impacts and its relation to the ecosystemservices and consequent well-being of its local population.
4.3. Suitability of the Delphi as a method
Expert opinion is often the only source of evidence when nodata are available and when data are difficult to attain at afford-able costs, time and due to given the complexity of environmentalsystems (Brooks et al., 2006; Burgman et al., 2011; Krueger et al.,2012; Vrana et al., 2012). In this research Delphi was chosen notonly because of its expert elicitation capabilities for complex sys-tems, but also because it is a method that was developed to avoidthe problems of freely interacting groups such as the dominantindividuals and the pressures to conform the majority of opin-ions. As indicated in the introduction “conflicts in Galapagos haverisen over the dispute between conservation and the use of naturalresources/tourism.” In Delphi, these sources of conflict that in anelicitation process can generate “process loss” are removed through
anonymity and control feedback. The feedback from each round(in this research called Delphi reports), is usually individualized orindicated in-group percentages (Steyaert and Lisoir, 2005) wherethe majority of opinions can be apparent; and this can cause that theminority position change their opinions (Bolger and Wright, 2011).Due to its iterative nature and controlled feedback, forging a avoid-ing conflicts and consensus increases after each round, although itsis not always evident (Orsi et al., 2011). In this research, several ele-ments might have contributed to generate consensus: (1) the useof Chu and Hwang’s (2008) five point Likert scale which proved tobe efficient to measure consensus; (2) because consensus is easilyachieved with participants that have similar societal perspectives(particularly towards biodiversity conservation); (3) because smallgroups tend to reach consensus faster (Tan et al., 1995); and (4)because the best argument determines the outcome (Habermas,2006). In this regard, Bolger and Wright (2011) argue that in socialdecision scheme theory (SDST). . . “– the best argument wins – inwhich it is assumed that if there is a group member who actuallyknows the best argument, then she or he will be able to persuadethe rest of the group of this fact. The probability that the groups willchoose the correct alternative is therefore equal to the probabilitythat someone in the group will know the best argument.”
The Delphi’s participatory nature and the rigorous queriesenabled close collaboration with local stakeholders and decisionmakers and this enhanced the policy relevance of the DPSIR struc-tured results. We highlight the use of the DPSIR as an instrumentalapproach to be used with the Delphi method for similar future envi-ronmental related research. Interestingly, although DPSIR criticssuggest that the framework demonstrates narrow scoping, gener-ates non-neutral knowledge (favouring biodiversity conservation)and suffers from inadequate communication channels between sci-entists, stakeholders and decision makers (Svarstad et al., 2008),in this research these shortcomings of the DPSIR might have beenoverpassed due to the Delphi method and its anonymity, statisti-cal consensus approach and its iterative nature. In this sense Delphifavours a critical verifiable generation of group communication andinformation.
However, despite the fact that the Delphi method for addressingenvironmental impacts in the Galapagos Islands was conducted fol-lowing the recommendations of Delphi studies to minimize errorsand possible biases, certain shortcomings were noted. For instance,eliciting experts’ knowledge with Delphi will clearly tend towardssubjectivity, in particular when dealing with environmental sys-tems (Krueger et al., 2012). As explained in Section 2.1, this situationis linked to the inherent difficulty to determine who is an “expert”,what is “expertise” and what is “knowledge”. Even the use of theword “expert” to recruit participants is not straightforward, as someimportant participants might not feel confident enough to partic-ipate and give important opinions (Burgman et al., 2011). In thisresearch, this was specified by some of the invited participants.
Related to this is the difficulty to recruit participants and avoid-ing drop-outs in each round. Knol et al. (2010) suggest that “forexpert elicitation there is no guideline on which to base the numberexperts to be invited; and that even beyond 12 experts, the bene-fit of including additional experts begins to drop off”. To ensurediversity of opinion, viewpoints, credibility and result reliability, aminimum sample size of 3 participants would be robust enough(Krueger et al., 2012). This fact is corroborated by Clemen andWinkler (1999) who demonstrated diminishing marginal returnsassociated with large numbers of experts. In Delphi studies andbecause its iterative nature and possible drop-out situation dur-ing each round, similar threshold are found. For instance, Ziglio(1996) suggests a minimum of 10 participants in the first roundand others such as Linstone and Turoff (1975) suggest a minimumof 7 participants. Therefore, although we expected more partic-ipants, our research sample size in the three Delphi rounds (10,
Author's personal copy
F. Benitez-Capistros et al. / Ecological Indicators 38 (2014) 113– 123 121
7, 5) is within the limits of an adequate expert elicitation pro-cess and Delphi method. Similar number of experts have beenused in many other expert elicitation and/or Delphi studies inrelated fields: ecology (Marcot, 2006; Pearce et al., 2001; Seoaneet al., 2005; Smith et al., 2007; Wooldridge et al., 2005), biology(Ahmadi-Nedushan et al., 2008), conservation biology (García-Melón et al., 2012; Murray et al., 2009). Suggestions to avoiddrop-outs is by giving some kind of incentives to the participants(Bolger and Wright, 2011); however, this should be further ana-lyzed and investigated. In our research we detected personal andmotivational aspects, timing, long questionnaires and the exhaust-ing iteration processes, as the main factors that contributed to thedropouts.
We argue that those participants who participated along thewhole Delphi process might have had a higher motivationsbecause: (1) felt that they have no voice in the official dialoguein Galapagos; (2) they feel they should engage in a scientific studybecause it will grant them more credibility; or (3) just that theyhoped to have an issue introduced and taken upon by experts. How-ever, all these are just hypotheses. The fact that certain interestsdrive the experts is difficult to know and requires another type ofdiscussion that is out of the scope in this paper.
While opinions were given by the participants, other opinionswere noted to be missing or did not match the latest scientificknowledge either related to environmental impacts or conserva-tion. For example, little attention was paid by participants to wasteburden and degradation of the vegetation, disturbances, pollu-tion and noise in the Islands or even to loss of genetic diversity,which are all recognized as key conservation issues (Grove, 1992;Samways et al., 2008; Sanaa and Fadhel, 2010). Attention has tobe paid to the use of some terms and concepts by participants, asthey can have various interpretations (ecotourism/nature tourismor biological resources and biodiversity). These ambiguities arerecognized as a general problem in ecological science, and Delphiapplications are no exception (Orsi et al., 2011).
Finally, although the results tend to favour a biodiversity conser-vation criteria which generates a “bias” in relation to the problemsand proposed solutions, we may with some reason be expectedto work in a framework where rational arguments dictate thatthe Galapagos Islands should be in a good state of conservationin order to be economically viable, more so than in some otherplaces. Tourism alone represents 65% of Galapagos GDP (85 millionUSD/year) (Epler, 2007). Hence, nature tourism is the main pro-ductive activity on the islands and the main economic driver ofthe islands. Galapagos’ economy is a “revenue system” anchored totourism (Ciccozzi, 2013). In this sense, Galapagos future has twoalternatives. Either it heads towards a model of “nature conserva-tion and sustainability” with the maintenance of its unique naturaldiversity and a moderate thriving economy, or it heads towardsa model of “business as usual” with a rapid impoverished naturaldiversity and “temporary thriving economy”.
Next to the realization of the economic importance of nature,is the need for a sense of shared ownership of the islands’ ecosys-tems, as well as a sense of belonging to the community. So far, “theparticipatory management currently in play in the islands has shownthe limits arising from the absence of institutions able to reassure therespect of regulations, both in terms of positive incentives as of therepression of the transgression” (Ciccozzi, 2013). New or existing –environmental – governance mechanisms need to be perceived byeveryone as being legitimate. If this is the case, then an explicitknowledge of the importance of nature for the Galapagos islands’economy is not even necessary as long as ‘everyone’ agrees with theregulations, recommendations in place, not – only – by fear of beingfined/punished, but also because they perceive the regulations inplace to be legitimate. Then, the Galapagos Islands’ ecosystems cansurvive, and hopefully thrive.
The participatory development of indicators, and the partici-patory development/improvement of environmental governancemechanisms will ideally contribute to both a better understanding,and an increased legitimacy of ‘institutions’ required to protect theunique ecosystems in Galapagos.
5. Conclusions
The aim of this study was to identify and characterize envi-ronmental impacts and their interconnections associated withanthropogenic activities, through the development of sustaina-bility indicators. This goal was achieved through combined use ofthe participatory Delphi method and the DPSIR analytical frame-work. The identification of DPSIR sustainability indicators allowedretrieving basic information that is able to describe and measure thefunction of the complex socio-ecological system and of the ecosys-tem and services of the Galapagos Islands. Moreover, it was not onlypossible to specifically integrate each indicator into an analysis ofits own DPSIR level where internal interconnections were present(i.e. tourism growth – economic growth); but also, at a broaderlevel, between each level within the DPSIR going from drivingforces of environmental degradation, pressures on the environ-ment, environmental impacts and responses. Therefore, GalapagosDPSIR interpretable framework and its sustainability indicators arepotentially suited for opening discussions on policy alternatives byGalapagos’ decision makers and stakeholders. We consider that theresearch results can be used as a way to improve the implementa-tion of mitigation processes in the archipelago.
This study has proved that the participatory approach – throughthe Delphi method – is a tool to gather opinions and forge groupconsensus. Delphi has demonstrated to be an efficient, versatilemethod capable of integrating knowledge of varied groups of stake-holders. The mitigation of environmental impacts in Galapagoswill require several routes (social, economical, political, technolog-ical) passing by driving forces and pressures to specific recognizedenvironmental impacts. Although, the research results have beenpresented to local stakeholders, who have demonstrated greatinterest and expectations about the outcomes of this research, thefinal indicator sets will benefit from further discussions based ondifferent perceptions of different groups in Galapagos. We recom-mend the use of this research by policy and decision makers inGalapagos to implement management policies and strategies thatwill contribute to the mitigation of environmental impacts and tothe consequent well-being of its local population. The research hasendeavoured to contribute and complement the understanding ofthe underlying causes of environmental problems in Galapagos.
Acknowledgments
The authors would like to thank all the Galapagos’ Delphi partic-ipants for sharing their time and expertise, as well as to ProfessorDirk Berkvens for verifying the statistical validation of the Delphiconsensus and to the anonymous reviewers of this article that havesuggested important aspects to improve the quality of this paper.
Appendix A. Supplementary data
Supplementary data associated with this article can befound, in the online version, at http://dx.doi.org/10.1016/j.ecolind.2013.10.019.
References
Ahmadi-Nedushan, B., St-Hilaire, A., Bérubé, M., Ouarda, T.B.M.J., Robichaud, É., 2008.Instream flow determination using a multiple input fuzzy-based rule system: acase study. River Res. Appl. 24, 279–292.
Author's personal copy
122 F. Benitez-Capistros et al. / Ecological Indicators 38 (2014) 113– 123
Baine, M., 2007. Special Issue on the Galapagos Islands and the San AndresArchipelago. Ocean Coast. Manage. 50, 145–147.
Baine, M., Howard, M., Kerr, S., Edgar, G., Toral, V., 2007. Coastal and marine resourcemanagement in the Galapagos Islands and the Archipelago of San Andres: issues,problems and opportunities. Ocean Coast. Manage. 50, 148–173.
Bell, S., Morse, S., 2008. Sustainability indicators measuring the immeasurable?,second ed. Earthscan, London, UK.
Bolger, F., Wright, G., 2011. Improving the Delphi process: lessons from social psy-chological research. Technol. Forecast. Soc. Change 78, 1500–1513.
Brooks, T.M., Mittermeier, R.A., da Fonseca, G.A.B., Gerlach, J., Hoffmann, M.,Lamoreux, J.F., Mittermeier, C.G., Pilgrim, J.D., Rodrigues, A.S.L., 2006. Globalbiodiversity conservation priorities. Science 313, 58–61.
Burgman, M., Carr, A., Godden, L., Gregory, R., McBride, M., Flander, L., Maguire, L.,2011. Redefining expertise and improving ecological judgment. Conserv. Lett. 4,81–87.
Cam, K.M., McKnight, P.E., Doctor, J.N., 2002. The Delphi method online: medicalexpert consensus via the Internet. In: Proc. AMIA Symp.
Carpenter, S.R., Mooney, H.A., Agard, J., Capistrano, D., DeFries, R.S., Diaz, S., Dietz,T., Duraiappah, A.K., Oteng-Yeboah, A., Pereira, H.M., Perrings, C., Reid, W.V.,Sarukhan, J., Scholes, R.J., Whyte, A., 2009. Science for managing ecosystem ser-vices: beyond the Millennium Ecosystem Assessment. Proc. Natl. Acad. Sci. U. S.A. 106, 1305–1312.
CGREG, 2010. Así vamos, Indicadores Institucionales, Sociales, Económicosy Ambi-entales de Galápagos. Consejo de Gobierno de Galápagos, Puerto BaquerizoMoreno, Galapagos, Ecuador.
Chu, H., Hwang, G., 2008. A Delphi-based approach to developing expert systemswith the cooperation of multiple experts. Expert Syst. Appl. 34, 2826–2840.
Ciccozzi, E., 2013. Les Galápagos, gouvernance et gestion démocratique desresources naturelles. L’ Harmattan, Paris.
Clemen, R.T., Winkler, R.L., 1999. Combining probability distributions from expertsin risk analysis. Risk Anal. 19, 187–203.
Dalal, S., Khodyakov, D., Srinivasan, R., Straus, S., Adams, J., 2011. ExpertLens: asystem for eliciting opinions from a large pool of non-collocated experts withdiverse knowledge. Technol. Forecast. Soc. Change 78, 1426–1444.
Elliott, M., 2002. The role of the DPSIR approach and conceptual models in marineenvironmental management: an example for offshore wind power. Mar. Pollut.Bull. 44, iii-vii.
Elmer, F., Seifert, I., Kreibich, H., Thieken, A.H., 2010. A Delphi method expert surveyto derive standards for flood damage data collection. Risk Anal. 30, 107–124.
Epler, B., 2007. Tourism, the Economy, Population Growth, and Conservation inGalapagos Population, English ed. Chares Darwin Foundation, Puerto Ayora,Santa Cruz Island, pp. 68, http://www.darwinfoundation.org/english/ upload/Epler Tourism Report-en 5-08.pdf
Eycott, A.E., Marzano, M., Watts, K., 2011. Filling evidence gaps with expert opinion:the use of Delphi analysis in least-cost modelling of functional connectivity.Landscape Urban Plann. 103, 400–409.
Failing, L., Gregory, R., Harstone, M., 2007. Integrating science and local knowledgein environmental risk management: a decision-focused approach. Ecol. Econ.64, 47–60.
Flick, U., 2009. An Introduction to Qualitative Research. Sage Publications, Los Ange-les.
Frewer, L.J., Fischer, A.R.H., Wentholt, M.T.A., Marvin, H.J.P., Ooms, B.W., Coles, D.,Rowe, G., 2011. The use of Delphi methodology in agrifood policy development:some lessons learned. Technol. Forecast. Soc. Change 78, 1514–1525.
García-Melón, M., Gómez-Navarro, T., Acuna-Dutra, S., 2012. A combined ANP-delphi approach to evaluate sustainable tourism. Environ. Impact Assess. Rev34, 41–50.
Gee, K., Burkhard, B., 2010. Cultural ecosystem services in the context of offshorewind farming: A case study from the west coast of Schleswig-Holstein. Ecol.Complex 7, 349–358.
GNP, 2012. Galapagos National Park: Statistics of visitors to Galapagos. Direc-torate of Galapagos National Park, http://galapagospark.org/onecol.php?page=turismo estadisticas&set lang=en
GNP, 2013. Galapagos National Park. Visitor Site Guide, http://www.galapagospark.org/onecolmap.php?page=sitiosdevisita index
Gonzalez, J.A., Montes, C., Rodriguez, J., Tapia, W., 2008. Rethinking the GalapagosIslands as a complex social-ecological system: implications for conservation andmanagement. Ecol. Soc., 13.
Gossling, S., 2002. Human-environmental relations with tourism. Annals of TourismResearch 29, 539–556.
Goulder, L.H., Kennedy, D., 1997. Valuing ecosystem services: philosophical basesand empirical methods. In: Daily, G.C. (Ed.), Nature’s services: societal depend-ence on natural ecosystems. Island press, Washington, USA, pp. 40–44.
Goulder, L.H., Kennedy, D., 2011. Interpreting and estimating the value of ecosystemservices. In: Kareiva, P., Tallis, H., Ricketts, T.H., Daily, G.C., Polasky, S. (Eds.),Natural Capital: A Theory and Practice of Mapping Ecosystem Services,. OxfordUniversity Press, New York, USA, pp. 15–33.
Grove, R.H., 1992. Origins of western environmentalism. Sci. Am. 267, 42–47.Guézou, A., Trueman, M., Buddenhagen, C.E., Chamorro, S., Guerrero, A.M., Pozo, P.,
Atkinson, R., 2010. An extensive alien plant inventory from the inhabited areasof Galapagos. PLoS ONE 5, e10276.
Habermas, J., 2006. Political communication in media society: does democracy stillenjoy an epistemic dimension? The impact of normative theory on empiricalresearch. Commun. Theory 16, 411–426.
Hak, T., Moldan, B., Dahl, A.L., 2007. Sustainability Indicators: A Scientific Assess-ment. Island Press, Washington, DC, USA.
Harrington, R., Anton, C., Dawson, T.P., de Bello, F., Feld, C.K., Haslett, J.R., Kluvankova-Oravska, T., Kontogianni, A., Lavorel, S., Luck, G.W., Rounsevell, M.D.A., Samways,M.J., Settele, J., Skourtos, M., Spangenberg, J.H., Vandewalle, M., Zobel, M., Harri-son, P.A., 2010. Ecosystem services and biodiversity conservation: concepts anda glossary. Biodivers. Conserv. 19, 2773–2790.
Hearn, A., Martínez, P., Veronica Toral-Granda, M., Murillo, J.C., Polovina, J., 2005.Population dynamics of the exploited sea cucumber Isostichopus fuscus in thewestern Galápagos Islands, Ecuador. Fish. Oceanogr. 14, 377–385.
Hearn, A., 2006. Life history of the slipper lobster Scyllarides astori Holthuis 1960,in the Galapagos islands Ecuador. J. Exp. Mar. Biol. Ecol. 328, 87–97.
Hearn, A., 2008. The rocky path to sustainable fisheries management and conserva-tion in the Galápagos Marine Reserve. Ocean Coast. Manage. 51, 567–574.
Hugé, J., Le Trinh, H., Hai, P.H., Kuilman, J., Hens, L., 2010. Sustainability indicatorsfor clean development mechanism projects in Vietnam. Environ. Dev. Sustain.12, 561–571.
Hwang, G.-H., Chen, J.-M., Hwang, G.-J., Chu, H.-C., 2006. A time scale-orientedapproach for building medical expert systems. Expert Syst. Appl. 31, 299–308.
INEC, 2010. Censo de Polbacion y Vivienda Ecuador-Galapagos. In: (INEC),I.N.d.E.y.C. (Ed.), Redtam. , http://redatam.inec.gob.ec/cgibin/RpWebEngine.exe/PortalAction?&MODE=MAIN&BASE=CPV2010&MAIN=WebServerMain.inl
James, P., Tzoulas, K., Adams, M.D., Barber, A., Box, J., Breuste, J., Elmqvist, T., Frith, M.,Gordon, C., Greening, K.L., Handley, J., Haworth, S., Kazmierczak, A.E., Johnston,M., Korpela, K., Moretti, M., Niemelä, J., Pauleit, S., Roe, M.H., Sadler, J.P., WardThompson, C., 2009. Towards an integrated understanding of green space in theEuropean built environment. Urban Forest. Urban Greening 8, 65–75.
Jimbo, W., Grenier, C, 2010. El sector de la construcción en Puerto Ayora, InformeGalápagos 2009-2010, Puerto Ayora, Galápagos, Ecuador.
Kerr, S., Cardenas, S., Hendy, J., 2004. Migration and the Environment in the Galapa-gos: An Analysis of Economic and Policy Incentives Driving Migration, PotentialImpacts from Migration Control, and potential policies to reduce migration pres-sure. Public Policy Research.
Knol, A.B., Slottje, P., van der Sluijs, J.P., Lebret, E., 2010. The use of expert elicitationin environmental health impact assessment: a seven step procedure. Environ.Health 9.
Kristensen, P., 2003. EEA core set of indicators. Revised version April 2003. Adoptedversion for ECCAA countries May 2003. European Environment Agency, pp. 1–79.http://www.unece.org/fileadmin/DAM/env/europe/monitoring/StPetersburg/EEACore Set of Indicators rev2EECCA.pdf
Kristensen, P., 2004. The DPSIR Framework, A Comprehensive/Detailed Assess-ment of the Vulnerability of Water Resources to Environmental Changein Africa Using River Basin Approach. UNEP, Nairobi, Kenya, http://enviro.lclark.edu:8002/rid=1145949501662 742777852 522/DPSIROverview.pdf
Krueger, T., Page, T., Hubacek, K., Smith, L., Hiscock, K., 2012. The role of expertopinion in environmental modelling. Environ. Model. Softw. 36, 4–18.
Kuo, N.-W., Hsiao, T.-Y., Yu, Y.-H., 2005. A Delphi – matrix approach to SEA and itsapplication within the tourism sector in Taiwan. Environ. Impact Assess. Rev 25,259–280.
Kurtz, J.C., Jackson, L.E., Fisher, W.S., 2001. Strategies for evaluating indicators basedon guidelines from the Environmental Protection Agency’s Office of Researchand Development. Ecol. Indicators 1, 49–60.
Landeta, J., Barrutia, J., 2011. People consultation to construct the future: a Delphiapplication. Int. J. Forscat. 27, 134–151.
Linstone, H.A., Turoff, M., 1975. The Delphi Method: Techniques and Applications.Addison-Wesley Pub. Co., Advanced Book Program.
Marcot, B.G., 2006. Characterizing species at risk I: modeling rare species under theNorthwest Forest Plan. Ecol. Soc., 11.
Mehnen, N., Mose, I., Strijker, D., 2012. The Delphi method as a useful tool to studygovernance and protected areas? Landsc. Res., 1–18.
Miller, G., 2001. The development of indicators for sustainable tourism:results of a Delphi survey of tourism researchers. Tourism Manage. 22,351–362.
Murray, J.V., Goldizen, A.W., O’Leary, R.A., McAlpine, C.A., Possingham, H.P., Choy,S.L., 2009. How useful is expert opinion for predicting the distribution of aspecies within and beyond the region of expertise? A case study using brush-tailed rock-wallabies Petrogale penicillata. J. Appl. Ecol. 46, 842–851.
Nahuelhual, L., Carmona, A., Lozada, P., Jaramillo, A., Aguayo, M., 2013. Mappingrecreation and ecotourism as a cultural ecosystem service: An application at thelocal level in Southern Chile. Applied Geography 40, 71–82.
Nowack, M., Endrikat, J., Guenther, E., 2011. Review of Delphi-based scenariostudies: quality and design considerations. Technol. Forecast. Soc. Change 78,1603–1615.
Okoli, C., Pawlowski, S.D., 2004. The Delphi method as a research tool: an example,design considerations and applications. Inform. Manage. 42, 15–29.
Omann, I., Stocker, A., Jäger, J., 2009. Climate change as a threat to biodiversity: anapplication of the DPSIR approach. Ecol. Econ. 69, 24–31.
Orsi, F., Geneletti, D., Newton, A.C., 2011. Towards a common set of criteria and indi-cators to identify forest restoration priorities: an expert panel-based approach.Ecol. Indicators 11, 337–347.
Pearce, J.L., Cherry, K., Drielsma, M., Ferrier, S., Whish, G., 2001. Incorporating expertopinion and fine-scale vegetation mapping into statistical models of faunal dis-tribution. J. Appl. Ecol. 38, 412–424.
Powell, C., 2003. The Delphi technique: myths and realities. J. Adv. Nurs. 41, 376–382.Proano, E., Epler, B., 2008. Tourism in Galapagos: a strong growth trend, in: CDF,
G., & INGALA (Ed.), Galapagos Report 2006-2007. Charles Darwin Founda-tion, Puerto Ayora, Galapagos, Ecuador. http://www.galapagos.org/wp-content/uploads/2012/04/socio4-tourism-in-galapagos.pdf
Author's personal copy
F. Benitez-Capistros et al. / Ecological Indicators 38 (2014) 113– 123 123
Raudsepp-Hearne, C., Peterson, G.D., Bennett, E.M., 2010. Ecosystem service bundlesfor analyzing tradeoffs in diverse landscapes. Proc. Natl. Acad. Sci. U.S.A. 107,5242–5247.
Reyes, H., Murillo, C., 2008. Efforts to control illegal fishing activities in the MarineReserve, in: CDF, G., & INGALA (Ed.), Galapagos Report 2006-2007 Puerto Ayora,Galapagos, Ecuador, p. 23.
Rockstrom, J., Steffen, W., Noone, K., Persson, A., Chapin, F.S., Lambin, E., Lenton,T.M., Scheffer, M., Folke, C., Schellnhuber, H.J., Nykvist, B., de Wit, C.A., Hughes,T., van der Leeuw, S., Rodhe, H., Sorlin, S., Snyder, P.K., Costanza, R., Svedin,U., Falkenmark, M., Karlberg, L., Corell, R.W., Fabry, V.J., Hansen, J., Walker, B.,Liverman, D., Richardson, K., Crutzen, P., Foley, J., 2009. Planetary boundaries:exploring the safe operating space for humanity. Ecol. Soc., 14.
Rogers, S.I., Greenaway, B., 2005. A UK perspective on the development of marineecosystem indicators. Mar. Pollut. Bull. 50, 9–19.
Rounsevell, M.D.A., Dawson, T.P., Harrison, P.A., 2010. A conceptual framework toassess the effects of environmental change on ecosystem services. Biodivers.Conserv. 19, 2823–2842.
Sachs, J.D., Reid, W.V., 2006. Investments Toward Sustainable Development. Science312, 1002.
Samways, M.J., Hitchins, P.M., Bourquin, O., Henwood, J., 2008. Restorationof a tropical island: Cousine Island, Seychelles. Biodivers. Conserv. 19,425–434.
Sanaa, A., Fadhel, N.B., 2010. Genetic diversity in mainland and island populationsof the endangered Pancratium maritimum L. (Amaryllidaceae) in Tunisia. Sci.Hortic. 125, 740–747.
Satz, D., Gould, R.K., Chan, K.M.A., Guerry, A., Norton, B., Satterfield, T., Halpern, B.S.,Levine, J., Woodside, U., Hannahs, N., Basurto, X., Klain, S., 2013. The Challengesof Incorporating Cultural Ecosystem Services into Environmental Assessment.Ambio 42, 675–684.
Scheren, P.A.G.M., Kroeze, C., Janssen, F.J.J.G., Hordijk, L., Ptasinski, K.J., 2004. Inte-grated water pollution assessment of the Ebrié Lagoon, Ivory Coast, West Africa.J. Mar. Syst. 44, 1–17.
Seoane, J., Bustamante, J., D.Í.Az-Delgado, R., 2005. Effect of expert opinion on thepredictive ability of environmental models of bird distribution. Conserv. Biol.19, 512–522.
Skoulikidis, N.T., 2009. The environmental state of rivers in the Balkans—a reviewwithin the DPSIR framework. Sci. Total Environ. 407, 2501–2516.
Smith, C.S., Howes, A.L., Price, B., McAlpine, C.A., 2007. Using a Bayesian belief net-work to predict suitable habitat of an endangered mammal – the Julia Creekdunnart (Sminthopsis douglasi). Biol. Conserv. 139, 333–347.
Steyaert, S., Lisoir, H., 2005. Participatory methods toolkit – a practitioner’smanual. King Baudouin Foundation and Flemish Institute for Science andTechnology Assessment, Belgium, http://www.kbs-frb.be/publication.aspx?id=294864&langtype=1033
Svarstad, H., Petersen, L.K., Rothman, D., Siepel, H., Watzold, F., 2008. Discursivebiases of the environmental research framework DPSIR. Land Use Policy 25,116–125.
Swor, T., Canter, L., 2011. Promoting environmental sustainability via an expertelicitation process. Environ. Impact Assess. Rev. 31, 506–514.
Tan, B.C.Y., Teo, H.H., Wei, K.K., 1995. Promoting consensus in small decision-makinggroups. Inform. Manage. 28, 251–259.
Thangaratinam, S., Redman, C.W.E., 2005. The Delphi technique. ObstetricianGynaecol. 7, 120–125.
Toral-Granda, V., 2008. Galapagos Islands: a hotspot of sea cucumber fisheries inLatin America and the Caribbean. In: Toral-Granda, V., Lovatelli, A., Vasconcellos,M. (Eds.), Sea Cucumbers A Global Review of Fisheries and Trade. FAO, Rome,pp. 231–253.
Tscherning, K., Helming, K., Krippner, B., Sieber, S., Paloma, S.G.y., 2012. Doesresearch applying the DPSIR framework support decision making? Land UsePolicy 29, 102–110.
Turoff, M., Linstone, H.A., 2002. In: Turoff, M., Linstone, H.A., Helmer, O. (Eds.),The Delphi Method: Techniques and Applications. , http://is.njit.edu/pubs/delphibook/-copyright
van Beukering, P.J.H., 2013. Marine-related ecosystems services. In: Van Beukering,P., Papyrakis, E., Bouma, J., Brouwer, R. (Eds.), Nature’s Wealth: The Economics ofEcosystems Services and poverty. Cambridge University Press, Cambridge, USA,pp. 107–114.
Villa, A., Segarra, P., 2010. El cambio histórico del uso del suelo y cobertura vegetalen el área rural de Santa Cruz y San Cristóbal, Informe Galápagos 2009-2010,Puerto Ayora, Galápagos, Ecuador.
Vrana, I., Vanícek, J., Kovár, P., Brozek, J., Aly, S., 2012. A group agreement-basedapproach for decision making in environmental issues. Environ. Model. Softw.36, 99–110.
Waas, T., Hugé, J., Verbruggen, A., Wright, T., 2011. Sustainable development: a bird’seye view. Sustainability 3, 1637–1661.
Wentholt, M.T.A., Rowe, G., König, A., Marvin, H.J.P., Frewer, L.J., 2009. The views ofkey stakeholders on an evolving food risk governance framework: results froma Delphi study. Food Policy 34, 539–548.
Williams, A.M., Shaw, G., 2009. Future play: tourism, recreation and land use. LandUse Policy 26, S326–S335.
Wooldridge, S., Done, T., Berkelmans, R., Jones, R., Marshall, P., 2005. Precursors forresilience in coral communities in a warming climate: a belief network approach.Mar. Ecol. Prog. Ser. 295, 157–169.
Wright, T.S.A., 2006. Giving teeth to an environmental policy: a Delphi study atDalhousie University. J. Clean. Prod. 14, 761–768.
Ziglio, E., 1996. The Delphi method and its contribution to decision making. In: Adler,M., Ziglio, E. (Eds.), Gazing into the Oracle: The Delphi Method and Its Applicationto Social Policy and Public Health. Jessica Kingsley Publishers, Philadelphia.
Related Documents