Benefit transfers as a field experiment in Poland – the case of forest use values Det Miljøøkonomiske Råds Konference 24.08 2010 Skodsborg Kurhotel & Spa Marianne Zandersen, Anna Bartzcack & Henrik Lindhjem POLFOREX is financed by EEA grants & Norway grants

Benefit transfers as a field experiment in Poland – the case of forest use values Det Miljøøkonomiske Råds Konference 24.08 2010 Skodsborg Kurhotel & Spa.
Dec 20, 2015
Welcome message from author
This document is posted to help you gain knowledge. Please leave a comment to let me know what you think about it! Share it to your friends and learn new things together.
Transcript
Benefit transfers as a field experiment in Poland – the case of forest use values
Det Miljøøkonomiske Råds Konference 24.08 2010Skodsborg Kurhotel & Spa
Marianne Zandersen, Anna Bartzcack & Henrik Lindhjem
POLFOREX is financed by EEA grants & Norway grants

2
Overview
On-site Surveys & Design
Travel Cost Model Results
Some Benefit Transfer Results
Conclusions

3
Four On-site Surveys Selected for Benefit Transfer Tests
12
3
4
Forest ID Conservation regime Type of forest Dominant speciesForest cover
in region1 Landscape Park mixed broadleaved pine, sessile oak 14%
2Landscape Park & Promotional Area
mixed broadleaved pine, sessile oak, oak 25%
3Landscape Park & Promotional Area
broadleavedbeech, alder,
hornbeam32%
4 Noneconiferous, broadleaved
pine, ash alder 49%
Forest ID Adjacent cityInhabitants
('000s)Unemployme
nt rate
Avg. monthly household
income (EUR)1 Lublin 352 5% 6912 Radom 225 12% 6403 Szczecin 408 3.5% 7444 Zielona Gora 118 2.7% 692
4
Combined Survey Design & Data
Identical sampling of the four sites- 1345 persons approached; 11% opted out or resigned - 1128 interviews in total.- Polled along main paths, picnic areas and parking places; randomly
7 days a week during day time;
TCM/CVM combined design- Individual TCM with observed and reported seasonal number of visits
aims at estimating recreational value per visit and forest visitation patterns
- CVM focuses on valuing biodiversity and aesthetic aspects of the forests through two forest management programmes
- Sample retained for TCM analysis excludes multi-destination trips and comprises day-trips only (744 respondents)
5
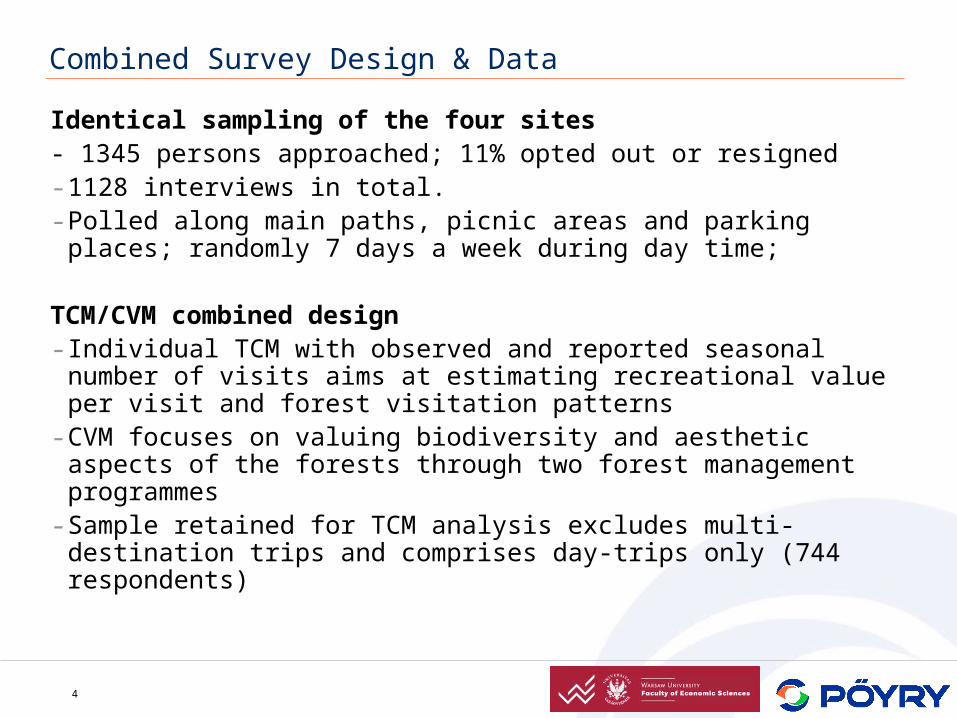
Summary Statistics of visits to four sites
Forest Lublin Radom Szczecin Zielona
Gora All forests
Variable Mean (std.) One-way distance (km)
18 (12) 7 (10) 18 (18) 13 (19) 14 (15)
One-way travel time (mn)
27 (14) 17 (16) 31 (26) 29 (27) 25 (22)
Time spent on site (mn)
112 (57) 105 (67) 115 (81) 94 (50) 108 (67)
TRAVEL MODE (main) - car 0.91 0.64 0.78 0.71 0.76 - bike 0.1 0.19 0.08 0.08 0.12 - public transport 0.03 0.02 0.14 0.1 0.06
PURPOSE OF TRIP (main) - Walking 0.48 0.61 0.63 0.59 0.58 - Watching nature 0.14 0.19 0.28 0.29 0.22 - Picking berries/mushrooms
0.69 0.44 0.31 0.40 0.46

6
Estimation of Demand for Forest Recreation
• Count data model with a Poisson distribution adjusted for:– left truncation at zero;– endogenous stratification; and– right-truncated distributions.
• Seasonal and annual estimation of demand function;
• Demand system of count models in TCM (incl. seasonal demand):
• Joint Poisson estimation model (incl. seasonal demand):
,xmTC = )yln( isiss is
4
sj=sis
PL
3
1s
n
1i
a
0j
jsi
sisisi )!j
ln()!yln()ln(y
n
1i
a
0j
ji
iii )!j
ln())!1yln(()ln()1y(= +

7
Overview
On-site Surveys & Design
Travel Cost Model Results
Some Benefit Transfer Results
Conclusions

8
Travel Cost Model Estimation
Variable 4 Forests Lublin Radom Szczecin Zielona Gora
Constant 1.9118*** (0.4272)
3.54770** (1.27137)
0.90374 (0.74373)
2.58411* (1.22859)
-2.63507 (4.82297)
2*distance -0.0405*** (0.0060)
-0.0715** (0.02132)
-0.0435*** (0.00703)
-0.0362** (0.01477)
-0.03615 (0.02775)
Male (1=0) 0.06062 (0.00487)
0.20304 (0.40780)
0.39183 (0.25240)
-0.05945 (0.34297)
-0.24700 (0.55202)
Age 0.00908 (0.1471)
-0.02176 (0.01716)
0.01230* (0.00621)
0.01370 (0.01353)
0.05992 (0.05782)
Income 0.06095 (0.06156)
-0.25732 (0.21557)
-0.07264 (0.13567)
0.14961 (0.21223)
-1.03445 (1.26190)
Years Education
0.03505 (0.02335)
0.05374 (0.05786)
0.05959 (0.05525)
0.04930 (0.082639
0.20668 (0.19405)
Household size -0.06137 (0.05691)
-0.03474 (0.13214)
0.09336 (0.07235)
-0.42347 (0.23789)
0.44567 (0.56631)
Log Likelihood -13887.79 -2122.42 -5640.04 -3397.39 -1360.81 Sample size 744 184 228 203 125

9
Travel Cost Results
Predicted Annual trips & Obs. distance traveled
0
5
10
15
20
25
30
Full sample (n=744)
Pre
dic
ted
an
nu
al
trip
s
0
20
40
60
80
100
120
140
Ob
serv
ed
dis
tan
ce (
km)
predicted no trips distance
Consumer Surplus per Person
0
100
200
300
400
500
600
700
Full Sample (n=744)
CS
(km
)
CS per person
Forest Marginal CS (km)
Average CS (km)
Predicted Lambda
Predicted beta (km)
Lublin 14 86 6.156 -0.072 Radom 23 220 9.542 -0.043 Szczecin 28 287 10.412 -0.036 (Zielona 28 343 12.408 -0.036) All Four forests 24 212 8.575 -0.041

10
Overview
On-site Surveys & Design
Travel Cost Model Results
Some Benefit Transfer Results
Conclusions

11
Unit Value Transfer of marginal CS – 3 forests
• Unit Value transfer of the marginal CS produce errors in the range from -50% to 100%
Transfer Error of unit value transfer
CS (km) estimated
Value transfer to:
4 Forests 24 Lublin Radom Szczecin
Lublin 14 - -39% -50% Radom 23 64% - -18%
Value Transfer from: Szczecin 28 100% 22% - Average transfer errors 82% -9% -34%

12
Updated Value Transfer of Average CS – 3 forests
1. Value transfer of predicted number of annual trips (λ) from policy site to study site, keeping marginal CS (βTC) of the study site constant
– Value Transfer from forest A to B : CSB= - λ(forest A)/ βTC(Forest B)
2. Value transfer of marginal CS (βTC) , keeping the predicted number of annual trips (λ) constant
– Value Transfer from forest A to B: CSB = - λ(forest B)/ βTC(Forest A)
Policy site results
Predicted λ Predicted βTC Significance level of βTC
Four sites 8.575 -0.041 *** Lublin 6.156 -0.072 ** Radom 9.542 -0.043 *** Szczecin 10.412 -0.036 **

13
Updated Value Transfer - Results
• Errors of λ transfer range from -41% to 69%
• Errors of βTC transfer range from -49% to 97%
Error of updated value transfer (λ)
Transfer to:
Forests Lublin Radom Szczecin Lublin - -35% -41% Radom 55% - -8%
Transfer from:
Szczecin 69% 9% - Average transfer errors 62% 5% -4% Error of updated value transfer (βTC)
Transfer to:
Forests Lublin Radom Szczecin Lublin - -39% -49% Radom 65% - -17%
Transfer from:
Szczecin 97% 20% - Average transfer errors 81% 10% -8%

14
Overview
On-site Surveys & Design
Travel Cost Model Results
Some Benefit Transfer Results
Some Conclusions & Next Steps
15
Conclusions & Next Steps
Conclusions:• Updating the value transfer does not necessarily perform better than
a single unit transfer;• Unit value transfer appear to perform better than updating the value
function with the marginal utility of income;• Updating with predicted number of trips provides overall the best
transfer results;• Errors however remain in the best case up to 60%.
Next steps:• Test of transfer of demand function, keeping population constant;• Pooled policy site transfers;• Statistical tests of coefficients and LL ratios;• Comparison of transfer results between TCM & CVM;

16
POLFOREX
http://www.polforex.wne.uw.edu.pl
Tak for opmærksomheden!
Related Documents