Bending Behavior of Textile Thermosetting Composite Prepregs during Forming Processes Hassan Abdullah Alshahrani A Thesis In the Department of Mechanical, Industrial & Aerospace Engineering Presented in Partial Fulfillment of the Requirements for the Degree of Doctor of Philosophy (Mechanical Engineering) at Concordia University Montr´ eal, Qu´ ebec, Canada August 2017 c Hassan Abdullah Alshahrani, 2017

Welcome message from author
This document is posted to help you gain knowledge. Please leave a comment to let me know what you think about it! Share it to your friends and learn new things together.
Transcript

Bending Behavior of Textile Thermosetting
Composite Prepregs during Forming Processes
Hassan Abdullah Alshahrani
A Thesis
In the Department
of
Mechanical, Industrial & Aerospace Engineering
Presented in Partial Fulfillment of the Requirements
for the Degree of
Doctor of Philosophy (Mechanical Engineering) at
Concordia University
Montreal, Quebec, Canada
August 2017
c© Hassan Abdullah Alshahrani, 2017

Concordia University
School of Graduate Studies
This is to certify that the thesis prepared
By: Mr. Hassan Abdullah Alshahrani
Entitled: Bending Behavior of Textile Thermosetting Composite
Prepregs during Forming Processes
and submitted in partial fulfillment of the requirements for the degree of
Doctor of Philosophy (Mechanical Engineering)
complies with the regulations of this University and meets the accepted standards with
respect to originality and quality.
Signed by the Final Examining Committee:
ChairDr. Ashutosh Bagchi
External ExaminerDr. Abbas Milani
External to ProgramDr. Michelle Nokken
ExaminerDr. Van Suong Hoa
ExaminerDr. Martin Pugh
SupervisorDr. Mehdi Hojjati
Approved byDr. Martin D. Pugh, ChairDepartment of Mechanical, Industrial & Aerospace Engineering
29th June, 2017Dr. Amir Asif, DeanFaculty of Engineering and Computer Science
Abstract
Bending Behavior of Textile Thermosetting Composite Prepregs during Form-
ing Processes
Hassan Abdullah Alshahrani, Ph.D.
Concordia University, 2017
Composite materials are increasingly replacing metals for many modern structures used
in the aerospace and automotive industry. Textile composites are favored due to their su-
perior forming capabilities to produce complex shapes. However, the formability of a textile
composite is limited by failure modes, such as wrinkling, which remain challenging issues
during the forming process. The ability to accurately predict wrinkles and ultimately pre-
vent them during the forming process is highly desirable for process optimization in an
industrial environment. To predict those defects, a thorough understanding of the deform-
ation behavior of textile-woven prepregs is required. Out-of-plane bending is one of the
deformation mechanisms that govern the appearance of wrinkles during composite forming.
This thesis therefore presents an experimental, theoretical, and numerical study on the out-
of-plane bending behavior of woven out-of-autoclave prepregs with application in forming
simulations.
Within this thesis, a new test method for characterizing the bending behavior of prepreg
materials at forming conditions was developed based on a vertical cantilever test associated
with a linear actuator and load cell. This test method allowed for sufficient control of
the deflection shape, testing rates, and processing temperatures within the range of the
thermosetting resin. Investigations for out-of-plane bending behavior and viscoelastic be-
havior at the forming process conditions were undertaken using the developed test method.
iii
Through the cantilever beam theory, where the prepreg yarn is composed of two external vis-
coelastic polymer plies with a linear elastic ply, a theoretical model is proposed to estimate
the bending stiffness over a range of processing conditions. A new approach for consider-
ing the testing rate and temperature with respect to a reference value is also established.
Experimental tests were carried out to estimate the model parameters and to validate the
proposed model. The predicted bending stiffness was found to be in a good agreement with
experimental values at selected conditions. However, there were slight differences due to the
complexity of undulation in the woven fabric structure. Then, a finite element model for the
bending behavior of multilayered prepregs was developed by considering the actual bending
behavior of the material. The prepreg ply was modeled by incorporating the characterized
behavior of intra-ply shear and inter-ply friction. The effect of stacking sequences on out-
of-plane bending deformation during the forming process was studied experimentally and
numerically. Moreover, the feasibility of using a viscoelastic approach and its application
in forming simulations were analyzed.
Finally, a series of real forming experiments using a double diaphragm process were car-
ried out to investigate the formability of textile out-of-autoclave thermoset prepregs over
complex geometry for aerospace applications. A one-step procedure was used for both the
forming and curing processes using the same experimental setup. A finite element model
was developed to simulate the double diaphragm forming process, with consideration for
the diaphragm material properties at forming conditions. In addition, important considera-
tions, such as local fiber compressive stresses, shear angle distributions, and stacking lay-up
sequences, were analyzed to identify the potential causes of wrinkles in the formed parts.
The resulting knowledge from the modeling methodology allowed the designers to reliably
choose the appropriate stacking sequences and suitable process parameters for complex
structures prior to conducting expensive trial and error tests.
iv

Dedication
To my dear mother, Zahrah
for her everlasting support, patience, and love
To my beloved late father, Abdullah
who passed away during this journey ..... I miss you dad
To my brothers and sisters
for their unconditional support and encouragement
”especially”
my dear brother, Khalid
v
Acknowledgments
First and foremost, praises and thanks to Allah for the strengths and His blessing in
completing this thesis.
I would like to express my deep gratitude to my supervisor, Dr. Mehdi Hojjati, for his
guidance and support throughout my PhD program at Concordia University. This work
would not have been possible without his help. Also, I would like to thank my research
colleagues, Rahul, Harinderpal, Muhsen and Sam for all their help and collaborations.
My gratitude goes to the Government of Saudi Arabia and Najran University for provid-
ing me with all the financial needs that enabled me to achieve the goal. Also, the support
and cooperation from the Natural Sciences and Engineering Research Council of Canada
(NSERC) and Bombardier Aerospace are highly appreciated.
Many thanks to my friends; Dr. Abu Ahmed, Dr. Abdullahi Gujba, Dr. Othman
Hassan, Abdullah Saeed, Gassim, Gamal, Mohamad Hamdoun, Omar Yagubi, Bader Al-
harbi, Sultan Alqahtani, Saeed Alzahrani, Khalid Aljabri, Abdulmajeed Aloraini, Majed
Almuslmani, and other friends for their continuous support during my studies.
Sincere thanks to my mother (Zahrah), my late father (Abdullah), my brothers (Nasser,
Safar, and Khalid), and my sisters (Fatima, Azizah, Haila, Mastorah, Norah, and Sahar)
for their moral support and their encouragement during my study. Finally, many warm
thanks for him and just for him, my brother (Khalid), for his support and standing by my
side during all the difficulties that I faced during this journey.
vi
Contents
List of Figures xi
List of Tables xvii
1 Introduction 1
1.1 Double–diaphragm forming . . . . . . . . . . . . . . . . . . . . . . . . . . . 3
1.2 Forming deformation mechanisms . . . . . . . . . . . . . . . . . . . . . . . . 4
1.3 Out-of-plane bending of prepregs . . . . . . . . . . . . . . . . . . . . . . . . 6
1.4 Motivation . . . . . . . . . . . . . . . . . . . . . . . . . . . . . . . . . . . . 7
1.5 Objectives . . . . . . . . . . . . . . . . . . . . . . . . . . . . . . . . . . . . . 9
1.6 Thesis outline . . . . . . . . . . . . . . . . . . . . . . . . . . . . . . . . . . . 10
2 A new test method for the characterization of the bending behavior of
textile prepregs 12
2.1 Introduction . . . . . . . . . . . . . . . . . . . . . . . . . . . . . . . . . . . . 13
2.2 Review of bending test methods . . . . . . . . . . . . . . . . . . . . . . . . . 14
2.3 Materials . . . . . . . . . . . . . . . . . . . . . . . . . . . . . . . . . . . . . 19
2.4 Experimental procedure . . . . . . . . . . . . . . . . . . . . . . . . . . . . . 20
2.4.1 Test set-up . . . . . . . . . . . . . . . . . . . . . . . . . . . . . . . . 20
2.4.2 Selection and analysis of temperature . . . . . . . . . . . . . . . . . 22
2.4.3 Sample preparation and test conditions . . . . . . . . . . . . . . . . 24
2.4.4 Bending test procedure . . . . . . . . . . . . . . . . . . . . . . . . . 26
2.5 Results and discussion . . . . . . . . . . . . . . . . . . . . . . . . . . . . . . 28
vii

2.5.1 Temperature and rate dependencies . . . . . . . . . . . . . . . . . . 33
2.5.2 Investigation of viscoelastic behavior . . . . . . . . . . . . . . . . . . 37
2.5.3 Consolidation effect . . . . . . . . . . . . . . . . . . . . . . . . . . . 38
2.5.4 Bending stiffness calculation . . . . . . . . . . . . . . . . . . . . . . . 41
2.6 Conclusion . . . . . . . . . . . . . . . . . . . . . . . . . . . . . . . . . . . . 46
3 A theoretical model with experimental verification for bending stiffness
of thermosetting prepreg during forming process 47
3.1 Introduction . . . . . . . . . . . . . . . . . . . . . . . . . . . . . . . . . . . . 48
3.2 Motivation . . . . . . . . . . . . . . . . . . . . . . . . . . . . . . . . . . . . 49
3.3 Theoretical formulation . . . . . . . . . . . . . . . . . . . . . . . . . . . . . 50
3.3.1 Constitutive models . . . . . . . . . . . . . . . . . . . . . . . . . . . 51
3.3.2 Model parameters determination . . . . . . . . . . . . . . . . . . . . 55
3.3.3 Time–Temperature dependencies . . . . . . . . . . . . . . . . . . . . 59
3.4 Experimental verification . . . . . . . . . . . . . . . . . . . . . . . . . . . . 61
3.4.1 Materials and test setup . . . . . . . . . . . . . . . . . . . . . . . . . 61
3.4.2 Samples and test procedure . . . . . . . . . . . . . . . . . . . . . . . 62
3.5 Results and discussion . . . . . . . . . . . . . . . . . . . . . . . . . . . . . . 63
3.5.1 Model parameters . . . . . . . . . . . . . . . . . . . . . . . . . . . . 63
3.5.2 Experimental results in comparison with proposed model . . . . . . 67
3.6 Conclusion . . . . . . . . . . . . . . . . . . . . . . . . . . . . . . . . . . . . 72
4 Bending behavior of multilayered textile composite prepregs: Experiment
and finite element modeling 74
4.1 Introduction . . . . . . . . . . . . . . . . . . . . . . . . . . . . . . . . . . . . 75
4.2 Characterization of material properties . . . . . . . . . . . . . . . . . . . . . 77
4.2.1 Materials . . . . . . . . . . . . . . . . . . . . . . . . . . . . . . . . . 77
4.2.2 Out-of-plane bending properties . . . . . . . . . . . . . . . . . . . . 77
4.2.3 Intra-ply shear properties . . . . . . . . . . . . . . . . . . . . . . . . 80
4.2.4 Inter-ply friction properties . . . . . . . . . . . . . . . . . . . . . . . 81
viii
4.3 Finite element modeling . . . . . . . . . . . . . . . . . . . . . . . . . . . . . 83
4.3.1 Material models . . . . . . . . . . . . . . . . . . . . . . . . . . . . . 84
4.3.2 Modeling of bending test . . . . . . . . . . . . . . . . . . . . . . . . 88
4.4 Results and discussion . . . . . . . . . . . . . . . . . . . . . . . . . . . . . . 89
4.4.1 Experimental results . . . . . . . . . . . . . . . . . . . . . . . . . . . 89
4.4.2 Numerical results with experimental verification . . . . . . . . . . . 93
4.4.3 Influence of alteration of bending material model . . . . . . . . . . . 97
4.5 Application in forming simulation . . . . . . . . . . . . . . . . . . . . . . . . 97
4.5.1 Case 1 . . . . . . . . . . . . . . . . . . . . . . . . . . . . . . . . . . . 98
4.5.2 Case 2 . . . . . . . . . . . . . . . . . . . . . . . . . . . . . . . . . . . 101
4.6 Conclusion . . . . . . . . . . . . . . . . . . . . . . . . . . . . . . . . . . . . 105
5 Experimental and numerical investigations on formability of out-of-autoclave
thermoset prepreg using a double diaphragm process 106
5.1 Introduction . . . . . . . . . . . . . . . . . . . . . . . . . . . . . . . . . . . . 107
5.2 Forming experiment methodology . . . . . . . . . . . . . . . . . . . . . . . . 109
5.2.1 Double-Diaphragm Forming (DDF) setup . . . . . . . . . . . . . . . 109
5.2.2 Tool geometry . . . . . . . . . . . . . . . . . . . . . . . . . . . . . . 110
5.2.3 Materials . . . . . . . . . . . . . . . . . . . . . . . . . . . . . . . . . 111
5.2.4 DDF procedure and conditions . . . . . . . . . . . . . . . . . . . . . 111
5.3 Material characterization . . . . . . . . . . . . . . . . . . . . . . . . . . . . 112
5.3.1 Prepreg forming properties . . . . . . . . . . . . . . . . . . . . . . . 112
5.3.2 Diaphragm forming properties . . . . . . . . . . . . . . . . . . . . . 115
5.4 Forming simulation methodology . . . . . . . . . . . . . . . . . . . . . . . . 119
5.4.1 FE model for DD process . . . . . . . . . . . . . . . . . . . . . . . . 119
5.4.2 Material models . . . . . . . . . . . . . . . . . . . . . . . . . . . . . 120
5.5 Results and discussion . . . . . . . . . . . . . . . . . . . . . . . . . . . . . . 123
5.5.1 Forming experiment results . . . . . . . . . . . . . . . . . . . . . . . 123
5.5.2 Forming simulation results . . . . . . . . . . . . . . . . . . . . . . . 129
ix
5.5.3 Mitigation of wrinkle defects . . . . . . . . . . . . . . . . . . . . . . 138
5.6 Conclusion . . . . . . . . . . . . . . . . . . . . . . . . . . . . . . . . . . . . 139
6 Conclusions, Contributions, and Recommendations 141
6.1 Concluding remarks . . . . . . . . . . . . . . . . . . . . . . . . . . . . . . . 141
6.2 Contributions . . . . . . . . . . . . . . . . . . . . . . . . . . . . . . . . . . . 144
6.3 Recommendations . . . . . . . . . . . . . . . . . . . . . . . . . . . . . . . . 148
6.3.1 Technical recommendations . . . . . . . . . . . . . . . . . . . . . . . 148
6.3.2 Recommendations for future work . . . . . . . . . . . . . . . . . . . 149
References 151
x
List of Figures
Figure 1.1 Materials used in a Boeing 787 [1]. . . . . . . . . . . . . . . . . . . . 2
Figure 1.2 Typical woven fabrics. . . . . . . . . . . . . . . . . . . . . . . . . . . 3
Figure 1.3 Schematic of double–diaphragm forming [5]. . . . . . . . . . . . . . . 4
Figure 1.4 Deformation mechanisms for textile reinforcements: (a) intra-ply shear,
(b) inter-ply slip, and (c) out-of-plane bending (adapted from [2, 6]). . . . . 5
Figure 1.5 A semi-continuous production method for OOA prepreg materials. . 9
Figure 2.1 Schematic and SEM micrograph of air evacuation channels in OOA
prepreg [49]. . . . . . . . . . . . . . . . . . . . . . . . . . . . . . . . . . . . . 19
Figure 2.2 Proposed bending test setup for prepreg characterization purposes at
processing conditions (a) schematic and (b) photograph. . . . . . . . . . . . 21
Figure 2.3 (a) Method of connecting the load cell to the actuator and (b) Zaber
Console and LoadVUE software. . . . . . . . . . . . . . . . . . . . . . . . . 22
Figure 2.4 Dynamic analysis at 2 ◦C/min for Cycom-5320 OOA prepreg. . . . . 23
Figure 2.5 (a) FLIR T420 IR camera and (b) Infrared images showing temper-
ature gradient. . . . . . . . . . . . . . . . . . . . . . . . . . . . . . . . . . . 24
Figure 2.6 5HS prepreg samples and tow direction to the applied load (normal
to red spot) (a) warp direction and (b) weft direction. . . . . . . . . . . . . 25
Figure 2.7 Bending profile with tip displacement of 50 mm (a) bent shape with
selected segments and (b) data points along the sample length. . . . . . . . 27
Figure 2.8 Large deformation of a cantilever beam of length L with a concen-
trated Load F applied at the free end. . . . . . . . . . . . . . . . . . . . . . 28
xi
Figure 2.9 Bending moment versus curvature of 5HS prepreg sample in warp
direction at room temperature. . . . . . . . . . . . . . . . . . . . . . . . . . 30
Figure 2.10 Bending moment versus curvature of 5HS prepreg sample in weft
direction at room temperature. . . . . . . . . . . . . . . . . . . . . . . . . . 30
Figure 2.11 The difference between warp and weft directions in dry 5HS. . . . . 31
Figure 2.12 The difference between prepreg and dry samples in warp direction. . 32
Figure 2.13 Repeatability of bending tests on 5HS prepreg sample in warp direc-
tion (face 1) at room temperature. . . . . . . . . . . . . . . . . . . . . . . . 33
Figure 2.14 Bending moment versus curvature of 5HS prepreg sample in warp
direction (face 1) at different temperatures. . . . . . . . . . . . . . . . . . . 35
Figure 2.15 Bending moment versus curvature of 5HS prepreg sample in warp
direction (face 1) at different speeds. . . . . . . . . . . . . . . . . . . . . . . 36
Figure 2.16 The maximum bending moment versus testing rate for warp-sample
(face 1), including error bars for standard deviation of three repeats. . . . . 36
Figure 2.17 Three tests of load relaxation of 5HS prepreg sample (warp) recorded
at room temperature with 50 mm tip displacement. . . . . . . . . . . . . . . 38
Figure 2.18 Consolidation of one-ply of OOA prepreg at 70 ◦C and (b) bending
moment versus curvature for consolidated and unconsolidated samples (warp-
face 1). . . . . . . . . . . . . . . . . . . . . . . . . . . . . . . . . . . . . . . . 40
Figure 2.19 Bending moment versus curvature with linear fit for warp (face1) (a)
up to 50 mm tip displacement, (b) up to 30 mm tip displacement, and (c)
based on calculating the curvature as the second derivative (up to 50 mm). 43
Figure 3.1 (a) Prepreg yarn deformation under pure bending and (b) stress dis-
tribution in the beam cross section. . . . . . . . . . . . . . . . . . . . . . . . 51
Figure 3.2 Representation of the generalized Maxwell model. . . . . . . . . . . . 54
Figure 3.3 (a) Buckling test on prepreg sample and (b) obtained buckling test
result. . . . . . . . . . . . . . . . . . . . . . . . . . . . . . . . . . . . . . . . 56
Figure 3.4 (a) Proposed bending test for measuring the stress-relaxation response
and (b) relaxation curve recorded at room temperature. . . . . . . . . . . . 58
xii
Figure 3.5 Proposed bending test setup for prepreg characterization purposes at
processing conditions. . . . . . . . . . . . . . . . . . . . . . . . . . . . . . . 62
Figure 3.6 5HS prepreg samples and yarn direction to the applied load. . . . . . 63
Figure 3.7 Stress-strain curve of elastic buckling with linear fit (a) warp sample
and (b) weft sample. . . . . . . . . . . . . . . . . . . . . . . . . . . . . . . . 65
Figure 3.8 Comparison between relaxation tests and generalized Maxwell model
(a) warp sample and (b) weft sample. . . . . . . . . . . . . . . . . . . . . . 66
Figure 3.9 Model predications and experimental results at room temperature
with a speed of 3 mm/s (a) warp sample and (b) weft sample. . . . . . . . . 68
Figure 3.10 Model predications and experimental results of warp sample at a speed
of 9 mm/s. . . . . . . . . . . . . . . . . . . . . . . . . . . . . . . . . . . . . 70
Figure 3.11 Comparison between experimental results and model predications us-
ing TTS and shifted value for warp sample at 70 ◦C. . . . . . . . . . . . . . 72
Figure 4.1 (a) Bending test setup including heat source, and (b) steps followed
to extract the bending properties. . . . . . . . . . . . . . . . . . . . . . . . . 78
Figure 4.2 Stacking sequences of three layers of textile composite with selected
samples for bending experiments. . . . . . . . . . . . . . . . . . . . . . . . . 79
Figure 4.3 (a) Bias extension test with the measurement of the material angles
at Zone A, and (b) load-displacement response at 70 ◦C with a displacement
rate of 20 mm/min. . . . . . . . . . . . . . . . . . . . . . . . . . . . . . . . . 81
Figure 4.4 (a) The friction test rig installed on a tensile testing machine, and (b)
friction coefficients at different pulling rates. . . . . . . . . . . . . . . . . . . 82
Figure 4.5 (a) AniForm shell element, and (b) the de-coupled shell approach [32]. 83
Figure 4.6 (a) Simulation of bias extension test using elastic Mooney–Rivlin and
a cross-viscosity fluid model, and (b) bias extension response and simulation
fit. . . . . . . . . . . . . . . . . . . . . . . . . . . . . . . . . . . . . . . . . . 85
Figure 4.7 (a) Ply mesh with element numbers, and (b) bending test modeling
in AniForm. . . . . . . . . . . . . . . . . . . . . . . . . . . . . . . . . . . . . 88
xiii
Figure 4.8 (a) Load required to reach a tip displacement of 30 mm, and (b)
moment vs. curvature curves for all selected stacking sequences at 70 ◦C. . 91
Figure 4.9 (a) Maximum bending moment for stacking 1 at different temperat-
ures with a constant speed of 3 mm/s, and (b) effect of testing rate at room
temperature. . . . . . . . . . . . . . . . . . . . . . . . . . . . . . . . . . . . 92
Figure 4.10 Predicted curvature–moment curve against the experimental meas-
urements at 70 ◦C (a) for stacking 1 and 4, and (b) for stacking 2 and 3. . . 94
Figure 4.11 Experimental and FE-model results of maximum bending moment for
stacking 1 (a) at different temperatures with a constant speed of 3 mm/s,
and (b) at different testing rates. . . . . . . . . . . . . . . . . . . . . . . . . 96
Figure 4.12 Sensitivity of bending stiffness on forming simulation results (a) exper-
imental bending stiffness, and (b) experimental bending stiffness multiplied
by 0.3. . . . . . . . . . . . . . . . . . . . . . . . . . . . . . . . . . . . . . . . 99
Figure 4.13 Intra-ply shear angles within the formed part (a) experimental bend-
ing stiffness, and (b) experimental bending stiffness multiplied by 0.3. . . . 100
Figure 4.14 Forming simulation results with observed defects (a) stacking 1, (b)
stacking 2, (c) stacking 3, and (d) stacking 4. . . . . . . . . . . . . . . . . . 103
Figure 4.15 Intra-ply shear angles in each ply (a) stacking 1, (b) stacking 2, (c)
stacking 3, and (d) stacking 4. . . . . . . . . . . . . . . . . . . . . . . . . . . 104
Figure 5.1 Double diaphragm forming setup: (a) schematic, (b) photograph, (c)
DD tool, (d) vacuum box, and (e) radiant heater. . . . . . . . . . . . . . . . 110
Figure 5.2 . Selected tool geometry and its dimensions. . . . . . . . . . . . . . . 111
Figure 5.3 Applied temperature cycle during forming and curing processes. . . 112
Figure 5.4 Bias extension load-displacement response at 70 ◦C with a displace-
ment rate of 20 mm/min. . . . . . . . . . . . . . . . . . . . . . . . . . . . . 113
Figure 5.5 Bending properties of one ply tested with respect to warp yarn direc-
tion at 70 ◦C. . . . . . . . . . . . . . . . . . . . . . . . . . . . . . . . . . . . 114
Figure 5.6 Friction coefficients at different pulling rates. . . . . . . . . . . . . . 115
xiv
Figure 5.7 In-plane properties of the silicone rubber diaphragm material with
Mooney–Rivlin model fit. . . . . . . . . . . . . . . . . . . . . . . . . . . . . 116
Figure 5.8 Bending properties of the silicone rubber diaphragm material. . . . . 117
Figure 5.9 Load-displacement curve for the tool-diaphragm friction at the tem-
perature of 70 ◦C. . . . . . . . . . . . . . . . . . . . . . . . . . . . . . . . . 118
Figure 5.10 Schematic representation of the FE model for double diaphragm form-
ing process. . . . . . . . . . . . . . . . . . . . . . . . . . . . . . . . . . . . . 120
Figure 5.11 (a) Formed part during DDF process, (b) pre-trimmed part, (c) final
part, and (d) bridging defect zones. . . . . . . . . . . . . . . . . . . . . . . . 124
Figure 5.12 Forming results for single ply: (a) warp yarn direction is aligned with
the x -direction, and (b) warp yarn direction is rotated by -45◦ with respect
to x -direction. . . . . . . . . . . . . . . . . . . . . . . . . . . . . . . . . . . . 126
Figure 5.13 Formed part with different lay-up arrangements: (a) [0/0] sequence,
(b) [0/90] sequence, and (c) [0/45] sequence. . . . . . . . . . . . . . . . . . . 128
Figure 5.14 (a) Net ply shape for selected geometry, and (b) net-shaped part. . . 130
Figure 5.15 Forming predictions of single ply when the warp yarn direction is
aligned with the x -direction: (a) observed defects, (b) shear angle distribu-
tion, and (c) fiber stress in warp direction. . . . . . . . . . . . . . . . . . . . 131
Figure 5.16 Forming predictions of single ply with -45◦ orientation respect to the
x -direction: (a) observed defects, (b) shear angle distribution, and (c) fiber
stress in warp direction. . . . . . . . . . . . . . . . . . . . . . . . . . . . . . 132
Figure 5.17 Forming predictions of [0/0] lay-up sequence: (a) observed defects,
(b) shear angle distribution, and (c) fiber stress in warp direction. . . . . . 134
Figure 5.18 Forming predictions of [0/90] lay-up sequence: (a) observed defects,
(b) shear angle distribution, and (c) fiber stress in warp direction. . . . . . 135
Figure 5.19 Forming predictions of [0/45] lay-up sequence: (a) observed defects,
(b) shear angle distribution, and (c) fiber stress in warp direction. . . . . . 136
xv

Figure 5.20 Observed defects in the predicted parts: (a) [0/30] sequence, (b) [0/60]
sequence, (c) [0/45] sequence with high bending stiffness, and (d) [0/45]
sequence with low friction properties. . . . . . . . . . . . . . . . . . . . . . . 139
xvi
List of Tables
Table 2.1 Test methods developed to determine out of plane bending properties
of dry reinforcement and prepreg composites. . . . . . . . . . . . . . . . . . 18
Table 2.2 Results of calculated bending stiffness at selected test conditions. . . 44
Table 2.3 A comparison between the calculated bending stiffness and the slope
of the linear fit. . . . . . . . . . . . . . . . . . . . . . . . . . . . . . . . . . . 45
Table 3.1 Generalized Maxwell model parameters extracted from averaged relax-
ation curves. . . . . . . . . . . . . . . . . . . . . . . . . . . . . . . . . . . . 64
Table 3.2 Required model parameters of selected material. . . . . . . . . . . . . 64
Table 3.3 Results of predicted and experimental bending stiffness at selected test
conditions. . . . . . . . . . . . . . . . . . . . . . . . . . . . . . . . . . . . . . 71
Table 4.1 Material model and fitted parameters for the membrane elements (in-
plane). . . . . . . . . . . . . . . . . . . . . . . . . . . . . . . . . . . . . . . . 87
Table 4.2 Viscoelastic material model and properties for the DKT elements
(bending). . . . . . . . . . . . . . . . . . . . . . . . . . . . . . . . . . . . . . 87
Table 4.3 Ply-ply material properties for contact elements. . . . . . . . . . . . . 87
Table 5.1 Material model and parameters for in-plane properties. . . . . . . . . 121
Table 5.2 Material model and parameters for out-of-plane properties. . . . . . . 122
Table 5.3 Material model and parameters for frictional properties. . . . . . . . . 122
Table 5.4 A summary of all performed experiments and simulations with their
prediction capabilities. . . . . . . . . . . . . . . . . . . . . . . . . . . . . . . 137
xvii
Chapter 1
Introduction
Composites are a material commonly composed of fiber reinforcements bonded together
with a matrix material. Composite materials are increasingly replacing metals for many
modern structures used in the aerospace and automotive industry. A variety of composites
in recent decades have been developed that offer good mechanical and chemical properties,
including high specific stiffness and a high strength-to-weight ratio combined with good
corrosion and chemical resistance. Currently, the use of composite materials based on
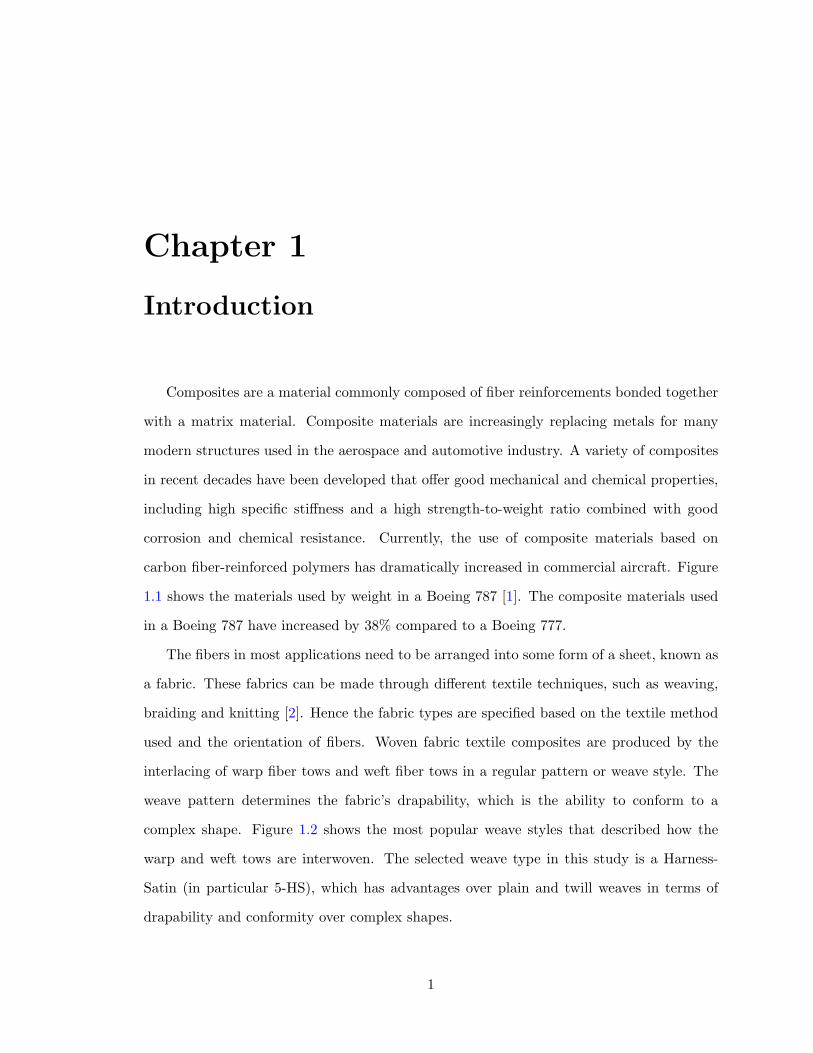
carbon fiber-reinforced polymers has dramatically increased in commercial aircraft. Figure
1.1 shows the materials used by weight in a Boeing 787 [1]. The composite materials used
in a Boeing 787 have increased by 38% compared to a Boeing 777.
The fibers in most applications need to be arranged into some form of a sheet, known as
a fabric. These fabrics can be made through different textile techniques, such as weaving,
braiding and knitting [2]. Hence the fabric types are specified based on the textile method
used and the orientation of fibers. Woven fabric textile composites are produced by the
interlacing of warp fiber tows and weft fiber tows in a regular pattern or weave style. The
weave pattern determines the fabric’s drapability, which is the ability to conform to a
complex shape. Figure 1.2 shows the most popular weave styles that described how the
warp and weft tows are interwoven. The selected weave type in this study is a Harness-
Satin (in particular 5-HS), which has advantages over plain and twill weaves in terms of
drapability and conformity over complex shapes.
1

Fabric reinforcement that has been pre–impregnated with a resin system is called prepreg.
Such materials can provide several advantages, such as a precise control of the fiber/resin
ratio, reduced production costs, and direct application into manufacturing processes. The
resin system used in prepreg materials is typically an epoxy. This thesis focuses on woven
textile out-of-autoclave (OOA) prepreg composites. The use of out-of-autoclave (OOA)
composite provides a large cost-saving opportunity because the lower curing temperatures
required by OOA materials allow for lower tooling costs. Therefore, the forming and curing
processes can be done as one step.
Figure 1.1: Materials used in a Boeing 787 [1].
2
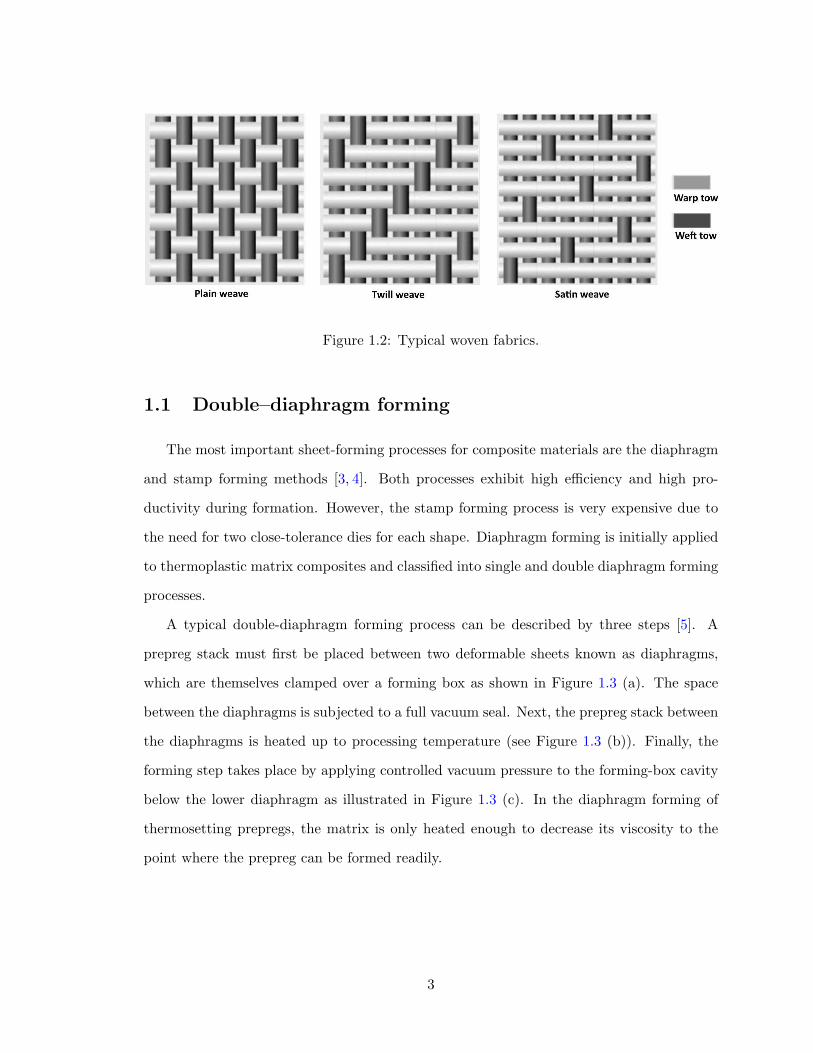
Figure 1.2: Typical woven fabrics.
1.1 Double–diaphragm forming
The most important sheet-forming processes for composite materials are the diaphragm
and stamp forming methods [3, 4]. Both processes exhibit high efficiency and high pro-
ductivity during formation. However, the stamp forming process is very expensive due to
the need for two close-tolerance dies for each shape. Diaphragm forming is initially applied
to thermoplastic matrix composites and classified into single and double diaphragm forming
processes.
A typical double-diaphragm forming process can be described by three steps [5]. A
prepreg stack must first be placed between two deformable sheets known as diaphragms,
which are themselves clamped over a forming box as shown in Figure 1.3 (a). The space
between the diaphragms is subjected to a full vacuum seal. Next, the prepreg stack between
the diaphragms is heated up to processing temperature (see Figure 1.3 (b)). Finally, the
forming step takes place by applying controlled vacuum pressure to the forming-box cavity
below the lower diaphragm as illustrated in Figure 1.3 (c). In the diaphragm forming of
thermosetting prepregs, the matrix is only heated enough to decrease its viscosity to the
point where the prepreg can be formed readily.
3

Figure 1.3: Schematic of double–diaphragm forming [5].
1.2 Forming deformation mechanisms
During the complex shapes forming process of the continuous fiber-reinforced compos-
ites, various deformation mechanisms take place to accommodate the desired geometry.
Forming woven fabric to the desired shape is associated with several deformation mechan-
isms, of which the most common are intra-ply shearing, inter-ply sliding, and out-of-plane
bending as depicted in Figure 1.4, respectively [2, 6]. Haanappel et al. [7] showed that the
4

formability of a composite laminate is determined by a delicate balance between these basic
deformation mechanisms. To ensure successful composite forming, it is therefore necessary
to thoroughly understand the mechanisms that cause defects [8]. Among numerous possible
negative outcomes during forming, wrinkling is the most prevalent defect [6]. Some studies
attributed the occurrence of wrinkles to the material’s locking angle [9, 10]. This implies
that there are wrinkles in a zone where the shear angle is larger than the locking angle.
However, Boisse et al. [11] showed that the appearance of out-of-plane wrinkles is a global
phenomenon that depends primarily on boundary conditions, as well as material strains
and stiffness. The effect of different mechanisms also varies according to circumstances and
forming processes.
Figure 1.4: Deformation mechanisms for textile reinforcements: (a) intra-ply shear, (b)inter-ply slip, and (c) out-of-plane bending (adapted from [2, 6]).
5
Intra-ply shear is considered to be the primary deformation mechanism during forming
and it needed to allow a material to conform to a compound curvature. This deformation
mechanism is characterized by rotation of the yarns at their crossovers, which causes a
change in fiber orientation. This rotation around weave crossover is mainly limited by the
ability of fiber yarns to become in contact with each other. Degree of in-plane shear of woven
is indicated by the shear angle between the weft and warp yarns. Both the bias extension
test and the picture frame test are frequently employed to investigate the in-plane shear
behavior of woven composites [12–16].
When multilayered materials are considered, adjacent plies of a laminate need to slip
across one another when formed into a single or doubly curved part. Inter-ply slip is also
referred to as ply–ply friction and it plays an important role for releasing the compressive
stresses that may cause out of plane buckling [17, 18]. In the forming process, contact
between composite laminate and the tool can also affect the final product significantly. Many
researchers [19–23] investigated how processing parameters influenced frictional behavior of
prepreg systems. Their results indicate that lay-up configuration, pressure, slip velocity,
and temperature are greatly influence the slipping behavior. A more extensive overview of
inter-ply and tool-ply slip can be found in [17,18].
The present research focuses on out-of-plane bending mechanism both experimentally
and analytically, with a goal of predicting defects during forming processes. However, in the
forming simulations, the intra-ply shearing and inter-ply sliding are considered to obtain
accurate results.
1.3 Out-of-plane bending of prepregs
The bending properties of ply prepreg materials are significantly lower than what would
be derived from the in-plane material properties using beam or plate theory [11]. This
presents a significant difficulty during forming simulations, since finite element implement-
ations assume that bending stiffness is derived from in-plane material response using a con-
ventional shell element. Furthermore, Liang et al [24] showed that, in forming simulations,
6

the bending stiffness of the prepreg at the processing temperature is an important predictor
of the size and quantity of wrinkles. Wrinkling is caused by out-of-plane deformation due to
compressive loading in the plane of the material during the forming process. This implies
that for the forces associated with out-of-plane bending to be scaled correctly, it is necessary
to first arrive at a good understanding of the relative magnitude of the bending stiffness
[6]. Thus, these properties, along with their temperature and other dependencies, must be
thoroughly characterized and properly represented in finite element forming simulation.
A review of current test methods, presented in Chapter 2, for characterization the
bending behavior of prepreg composites showed the need for a new approach that has
good control of the testing parameters and the applied load. In forming simulations, some
models are presented in the literature, where bending behavior is de–coupled from in-plane
by using specialized shell element in finite element forming simulation based on elastic [7,25–
27], elastic with temperature-dependent [13,28], or viscoelastic approaches [29]. The latter
research [29] showed that modeling rate-dependent bending behavior using a viscoelastic
approach is crucial to predict wrinkling in FE forming simulation of thermoplastic pre–
impregnated tapes. In their study, the bending characterization was based on isothermal
investigations using the rheometer bending setup presented by Sachs [30]. Some commercial
software tools, such as PAM-FORM [31] and AniForm [32], offer the possibility of modeling
a number of features of composite forming. However, no details or application of out-of-
plane bending behavior of prepreg composites based on viscoelastic material models are
available in the literature using these commercial software tools.
1.4 Motivation
The manufacture of composite structures is often performed using conventional tech-
niques such as hand lay-ups and vacuum bagging. However, increased demand for compos-
ite parts, together with an increase in their size and complexity, puts a strain on traditional
processing methods and drives the need for fast, and cost-effective manufacturing altern-
atives. The low manufacturing times and costs associated with automated manufacturing
7

processes such as Automated Tape Laying (ATL) and Automated Fiber Placement (AFP)
offer great promise to meet the growing need for composite materials in the aerospace and
automotive industries [33]. The limiting factor for the viability of these automated pro-
cesses is their capacity to produce complex geometries (such as highly-curved components
with small radii). To improve productivity while maintaining the geometrical complexity
of components, a three-step process is undertaken: first, flat laminates are laid down by
automated machines; next, these laminates are subjected to a forming process; finally, the
formed parts are cured. A semi–continuous forming method associated with automated
machines for OOA prepreg materials, shown in Figure 1.5, is a promising direction, which
offers an extreme reduction in overall manufacturing cost and time.
Textile composites are favored due to their superior forming capabilities for producing
complex shapes. However, formability of textile composite is limited by failure modes
such as wrinkling, which remains as a challenging issue during forming processes. The
bending stiffness of prepreg ply plays an important role in determining wrinkle formation.
Accurate prediction of wrinkle formation is highly desirable as a first step to prevent this
defect for process optimization in an industrial environment. Minimizing failure rates of
complex composite parts is of great interest to the aerospace and automobile industries.
Once potential material defects during forming can be accurately predicted, designers will
be able to reliably choose appropriate material types and processing parameters without
the requirement for expensive trial and error tests. However, a considerable amount of
knowledge of the mechanical behavior of prepreg materials and forming process conditions
is still required to produce defect-free complex-shaped composite parts.
8
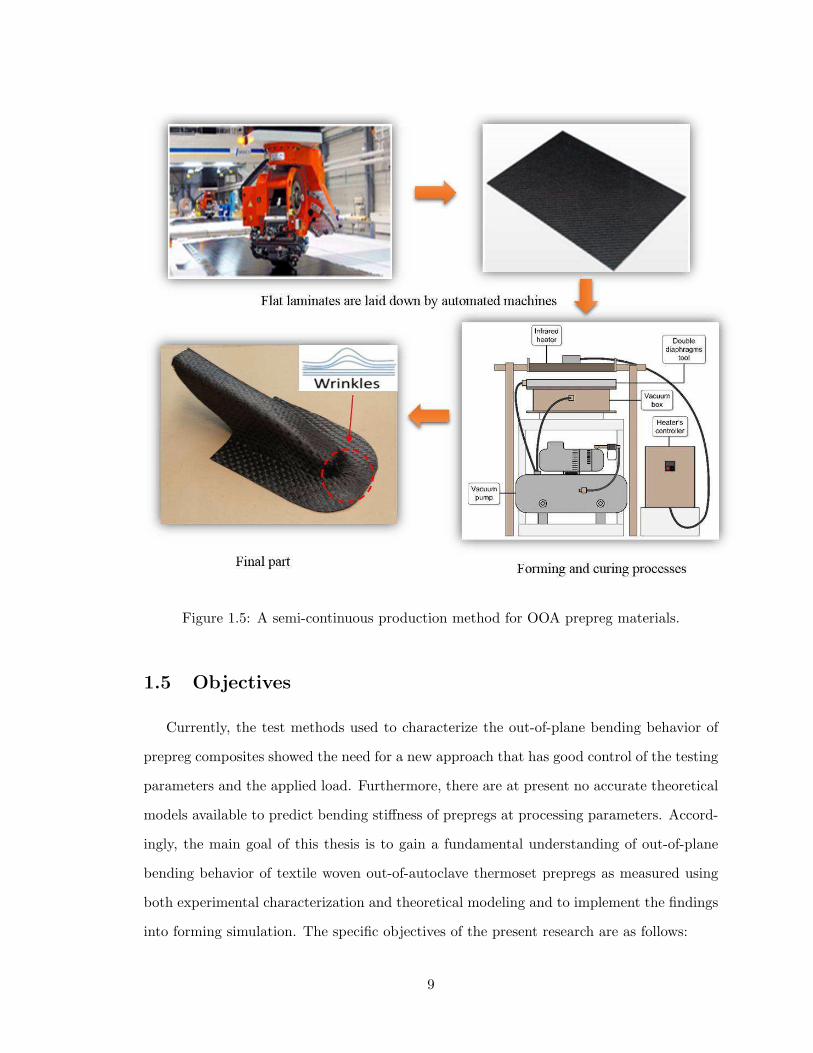
Figure 1.5: A semi-continuous production method for OOA prepreg materials.
1.5 Objectives
Currently, the test methods used to characterize the out-of-plane bending behavior of
prepreg composites showed the need for a new approach that has good control of the testing
parameters and the applied load. Furthermore, there are at present no accurate theoretical
models available to predict bending stiffness of prepregs at processing parameters. Accord-
ingly, the main goal of this thesis is to gain a fundamental understanding of out-of-plane
bending behavior of textile woven out-of-autoclave thermoset prepregs as measured using
both experimental characterization and theoretical modeling and to implement the findings
into forming simulation. The specific objectives of the present research are as follows:
9
(1) Design a simple experimental set-up to accurately characterize the bending properties
of thermosetting prepregs at processing conditions, including forming temperatures
and rates.
(2) Develop a theoretical model for estimating the bending stiffness of textile prepregs to
minimize the effort required for experimental investigations.
(3) Develop a finite element (FE) model for the bending behavior of multilayered textile
prepregs using an independent bending stiffness.
(4) Investigate experimentally and numerically the formability of OOA thermoset textile
prepregs over a complex geometry for aerospace applications using a double diaphragm
forming (DDF) process.
1.6 Thesis outline
The entire thesis is divided into six chapters and formatted in accordance to the rules
for a manuscript-based thesis. This thesis consists of four journal articles (Chapters 2 to
5); each chapter includes a review of the relevant studies and addresses one objective of this
research. These chapters are completely self-contained and can be read independently. This
implies that some introductory and parts are duplicated. A brief outline of each chapter is
given below.
Chapter 1 outlines a general introduction about textile composites and the addressed
problem, which is of high practical relevance in the manufacture of composite components.
In particular, the prediction of material wrinkling or other defect formation mechanisms is
extremely important for process optimization in an industrial environment. Motivation and
objectives of the present work are presented.
Chapter 2 presents a new test method for characterization of the bending behavior
of textile prepregs under conditions relevant to the forming process. This is based on a
comprehensive review of existing devices and their drawbacks and limitations. The proposed
setup allows for investigation into temperature, rate and viscoelastic effects. A number of
10

experimental considerations with different sample configurations are also evaluated.
Chapter 3 proposes a theoretical model that can be applied to a wide range of pro-
cessing conditions to predict the bending stiffness of thermosetting composite perpreg dur-
ing forming process. A new approach for considering the testing rate and temperature
with respect to a reference value is also established. Experimental tests are carried out for
estimation of the model parameters and validation of the proposed model.
Chapter 4 provides a systematic approach for a finite element (FE) prediction of bend-
ing behavior of multilayered textile prepregs based on viscoelastic material model. Exper-
imental investigations of bending behavior of multilayered textile prepregs are conducted
using the proposed test, presented in Chapter 2. The experimental results are subsequently
compared against the FE model. Moreover, the feasibility of using a viscoelastic approach
and its application in forming simulations are analyzed.
Chapter 5 investigates experimentally and numerically the formability of out-of-autoclave
thermoset textile prepregs over a complex geometry for aerospace applications using a
double diaphragm forming (DDF) process. An evaluation of the DDF process in terms
of observed defects, stacking sequences, and the pre–forming state is carried out. Signi-
ficant investigations are made in order to obtain the required properties for the material
models in the FE simulation, including the diaphragm material properties.
At the conclusion of this thesis, Chapter 6 summarizes the main conclusions and
contributions that are drawn from this research. In addition, recommendations for future
work directions are presented.
11
Chapter 2
A new test method for the characterization
of the bending behavior of textile prepregs∗
Abstract
To improve forming simulation outcomes for composite prepregs and predict wrinkle forma-
tion, the bending behavior of prepreg materials must be correctly characterized. This paper
proposes a new loading-rate control bending test in which the sample deflection and applied
rate are controlled by a linear actuator while the load required to achieve this deflection is
recorded by a miniature-load cell. An investigation of out-of-plane bending behavior as well
as viscoelastic behavior at the forming process conditions of woven fabric out-of-autoclave
prepregs was undertaken using this method. The experimental results show that the pro-
posed bending test provides sufficient control of the deflection shape, testing rates, and
processing temperatures within the range of thermosetting resin. Furthermore, the bending
results reveal the rate dependency and viscoelastic nature of the materials. A method is
developed to derive the bending stiffness from the nonlinear relationship between bending
moment and curvature.
∗Reproduced from: Hassan Alshahrani, Mehdi Hojjati. A new test methodfor the characterization of the bending behavior of textile prepregs. Compos-ites Part A: Applied Science and Manufacturing, 97 (2017), pp. 128–140.http://dx.doi.org/10.1016/j.compositesa.2017.02.027
12

2.1 Introduction
Many modern structures, including primary aerospace structures, high performance
sporting goods, and marine and wind energy structures, are progressively coming to rely
on advanced composite materials based on carbon fiber-reinforced thermoset polymers.
Increased demand on these composite parts, together with an increase in their size and
complexity, puts a strain on traditional processing methods and drives the need for fast,
adaptive, cost-effective manufacturing alternatives. The low manufacturing times and costs
associated with automated manufacturing processes such as Automated Tape Laying (ATL)
and Automated Fiber Placement (AFP) offer great promise to meet the growing need for
composite materials in the aerospace and automotive industries [33]. The limiting factor for
the viability of these automated processes is their capacity to produce complex geometries
(such as highly curved components with small radii). To improve productivity while main-
taining the geometrical complexity of components, a three-step process is undertaken: first,
flat laminates are laid down by automated machines; next, these laminates are subjected
to a forming process; finally, the formed parts are cured. To ensure successful composite
forming, the mechanisms that cause defects must be thoroughly understood [8]. Forming
of woven fabric to the desired shape is associated with several deformation mechanisms, of
which the most common are intra-ply shearing, out-of-plane bending, and inter-ply sliding
[6]. The success or failure of composite forming is determined by the material properties
that predominate these deformation mechanisms.
For numerical simulations to yield meaningful results, a number of different mechanical
properties must considered [11,24,34,35]. Thus, these properties, along with their temper-
ature and other dependencies, must be thoroughly characterized prior forming simulation.
One of the most common manufacturing-induced defect types to occur during composite
forming is wrinkling. Wrinkling is caused by out-of-plane deformation due to compressive
loading in the plane of the material during the forming process. Thus, for the forces asso-
ciated with out-of-plane bending to be scaled correctly, it is necessary to first arrive at a
good understanding of the relative magnitude of the bending stiffness [6].
13
Accurate prediction of wrinkle formation is highly desirable as a first step to prevent
this defect. Boisse et al. [11] showed that the appearance of out-of-plane wrinkles is a global
phenomenon which depends primarily on boundary conditions, as well as material strains
and stiffness. Recently, Liang et al. [24] have demonstrated that the effective bending
stiffness of the prepreg at the processing temperature during forming simulations is an
important predictor of the size and quantity of wrinkles. Beam or plate theory models
based on in-plane material properties predict significantly higher bending properties than
are actually found for ply prepreg materials [11]. This presents a significant difficulty during
forming simulations, because finite element implementations automatically derive bending
stiffness from in-plane material response using a conventional shell element. Consequently,
the bending stiffness must be represented separately in the finite element model [27].
During forming simulation, all three deformation mechanisms (out-of-plane bending,
intra-ply shearing, and inter-ply sliding) must be considered to achieve an accurate predic-
tion of wrinkling. However, more recent attention has focused on the mechanism of out-of-
plane bending of prepreg composites. There exists, at present, no established method to
characterize the bending behavior of prepreg materials. Thus, the present paper will pro-
pose a new test method to characterize out-of-plane bending behavior at forming-process
conditions, including both rate and temperature dependencies.
2.2 Review of bending test methods
Several test methods have been developed to measure the out-of-plane bending proper-
ties of dry reinforcement and prepreg composites; the main methods are listed in Table 2.1.
Most of the setups that have been proposed for characterization of bending behavior are
adapted from Peirce’s cantilever test [36]. In Peirces setup, a rectangular strip of fabric on
a horizontal platform is slowly extended forward to project as a cantilever horizontally until
the tip of the cantilever touches an inclined plane. The bending stiffness of the cantilever
is then calculated at a specific inclined-angle value of 41.5◦ [37]. The standard cantilever
14

test requires the assumption that a linear elastic behavior holds between the bending mo-
ment and the strip curvature. The small deformation assumption restricts such a method
to be applied to prepreg composites that require high curvature during forming process.
A modification of the cantilever test, consisting of a succession of quasi-static tests with
different load cases, was proposed by Bilbao et al. [38]. The test device comprises two
parts: a mechanical part and an optical part. The mechanical part enables the sample to
be placed in a cantilever configuration (a fixed board composed of laths) under its own
weight, while the optical part takes pictures of the bent shapes using a digital camera.
After the sample is placed, the drawer moves in the bending direction, causing the laths
to retract and the overhang length to increase. The test is stopped for a chosen overhang
length and is continued for new lengths. For each selected length, the shape of the overhang
sample is extracted and image processing is undertaken. However, the obtained curves for
all selected lengths were not identical; furthermore, large scatter points were observed in
the zones of low curvature. Liang et al. [24] proposed a modified cantilever test setup with
an environmental chamber. They followed the principles of Bilbao’s method to create a
moment–curvature graph for different temperatures. Their investigation showed that the
bending stiffness of thermoplastic prepregs is greatly influenced by temperature. However,
obtaining a uniform temperature field in the sample before starting the test is complicated
due to bending under its own weight. Moreover, the influence of the deformation rate is
not considered in their work.
Soteropoulos et al. [39] introduced a new test design that addresses the potential prob-
lem of twists in the samples (due to non-linear loading effects in the cantilever setup) by
hanging the samples vertically. In their setup, the load was applied by attaching masses
to a string tied to the tip of the sample. A digital camera was then used to capture the
relative displacement of the sample under each load. Next, the digital image was graphically
processed to generate data points along the sample length. Dangora et al. [40] used the
vertical cantilever method with a radiant heater to characterize the bending behavior of a
cross-ply thermoplastic lamina at elevated-temperature conditions.
15
Kawabata’s Evaluation System (KES) is an alternative method of measuring the basic
mechanical properties of fabrics [41,42]. In the bending test, a sample is held between a fixed
clamp and a moving clamp. The moving clamp bends the sample, following a circular path,
and provides full data on bending behavior, including stiffness as a function of curvature.
However, it is not very well adapted for composite reinforcements or prepreg which are often
thicker and stiffer than clothing textiles [38]. Additionally, the device is very expensive and
its availability is limited. A three-point bending test with a V–shaped punch and thermal
chamber was proposed by Martin et al. for studying the bending behavior of unidirectional
thermoplastic composites [43]. It has proven difficult to prevent deformation of the sample
under its own weight during this test, especially at elevated temperatures. To avoid this
problem, a buckling test was suggested by Wang et al. [44]. However, the authors note that
great care must still be taken during clamping of the samples to avoid any misalignment.
Moreover, only small samples can be tested to obtain a symmetric bending shape.
Researchers at the University of Twente have recently developed a custom-built fixture
that mounts onto a rheometer, which offers a close temperature control via an equipped
thermal chamber [45, 46]. The rheometer settings allow for testing at a range of rotational
velocities. The main difficulty with this method is that the sample must follow a perfect
circular path to ensure pure bending. Although the test has shown promising results for a
selected sample size, the researchers report that further evaluations need to be performed
at different sample lengths [46]. Note, however, that the choice of the sample size is limited
by the size of the available rheometer.
In 2015, Margossian et al. proposed a new approach that uses a Dynamic Mechanical
Analysis (DMA) system [47] to assess different test fixtures at a range of temperatures and
speeds. Based on a method suggested by TA Instruments [48] , an out-of-plane bending
modulus, EB, was calculated using
EB = K ∗GF (2.1)
16
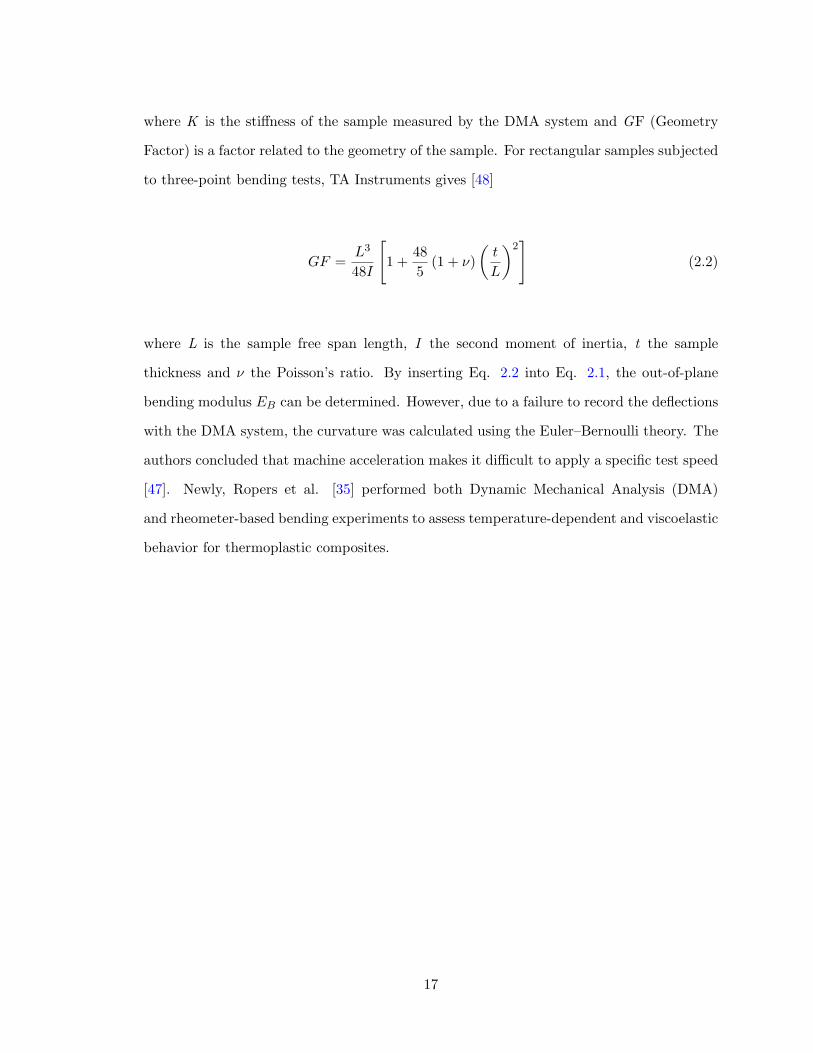
where K is the stiffness of the sample measured by the DMA system and GF (Geometry
Factor) is a factor related to the geometry of the sample. For rectangular samples subjected
to three-point bending tests, TA Instruments gives [48]
GF =L3
48I
[
1 +48
5(1 + ν)
(
t
L
)2]
(2.2)
where L is the sample free span length, I the second moment of inertia, t the sample
thickness and ν the Poisson’s ratio. By inserting Eq. 2.2 into Eq. 2.1, the out-of-plane
bending modulus EB can be determined. However, due to a failure to record the deflections
with the DMA system, the curvature was calculated using the Euler–Bernoulli theory. The
authors concluded that machine acceleration makes it difficult to apply a specific test speed
[47]. Newly, Ropers et al. [35] performed both Dynamic Mechanical Analysis (DMA)
and rheometer-based bending experiments to assess temperature-dependent and viscoelastic
behavior for thermoplastic composites.
17

Table 2.1: Test methods developed to determine out of plane bending properties of dryreinforcement and prepreg composites.
Ref. Method Temperature(◦C)
Ratecontrol
Material
Peirce [36] Cantilever test RT No Various fabrics
Bilbao et al. [38] Modified cantilevertest
RT No Dry reinforcementfabric
Liang et al. [24] Cantilever test +thermal chamber
Up to 600 No 5HS thermoplasticprepreg
Soteropoulos et al.[39]
Vertical cantilever test RT No Dry Non-Crimp Fabrics
Dangora et al.[40]
Vertical cantilever testwith a radiant heater
Up to 120 No Cross-ply thermoplastic
Lomov et al. [42] Kawabata test RT Yes Dry Non-Crimp Fabrics
Martin et al. [43] V-bending test +thermal chamber
Up to 170 Yes UD thermoplasticprepreg
Wang et al. [44] Buckling test Up to 150 Yes UD thermosettingprepreg
Ten Hove [45] Rheometer + thermalchamber
Up to 450 Yes UD thermoplasticprepreg
Margossian et al.[47]
DMA system Up to 260 Yes UD thermoplasticprepreg
Ropers et al. [35] Rheometer + thermalchamber and DMAsystem
Up to 260 Yes Woven textile and UDthermoplastic prepreg
18

2.3 Materials
The out-of-autoclave (OOA) prepreg chosen for this study was manufactured by Cytec
Engineered Materials Inc. The prepreg consists of a 5-harness (5HS) satin weave (6 K carbon
fiber tows) impregnated with an epoxy resin (Cycom 5320) designed for OOA manufacturing
applications. The fabric’s areal weight is 380 g/m2 and the resin content is 36% by weight.
The measured thickness of an uncured single-ply is approximately 0.55 mm. A dry 5HS
satin weave (6 K carbon fiber tows) was also included for comparison.
OOA prepregs differ from most autoclave prepregs in that the upper and lower fiber
plies are partially impregnated with resin. This partial impregnation creates a dry porous
medium between the upper and lower portions of the prepreg and permits the evacuation
of any trapped air before the resin wets the dry fibers, as shown in Figure 2.1 [49]. During
processing, these spaces are progressively infiltrated by resin to produce a uniform, void-
free structure. OOA composite forming provides a great cost-saving opportunity for the
aerospace industry, because the lower curing temperatures required by OOA materials allow
for lower tooling costs.
Figure 2.1: Schematic and SEM micrograph of air evacuation channels in OOA prepreg[49].
19
2.4 Experimental procedure
2.4.1 Test set-up
A review of current test methods for characterization the bending behavior of prepreg
composites showed the need for a new approach that has good control of the testing para-
meters and the applied load. To meet this need, a new test method, based on the vertical
cantilever test, is proposed in the present paper. The setup for the proposed test is illus-
trated in Figure 2.2. In this setup, metallic custom grips are used to clamp the sample
vertically, while the sample deflection and applied rate are controlled by a linear actuator.
A miniature-load cell is used to measure the load required to achieve this deflection. The
T-NA08A50 actuator and Loadstar load cell are connected by rotating the actuator until
the load cell threads into the standoff on the tip of the actuator, as shown in Figure 2.3
(a). Direct commands and change settings (such as required travel displacements, speeds,
or current position) can be sent via the Zaber Console connected to the actuator, while
LoadVUE software records the load during the test with high accuracy (see Figure 2.3 (b)).
Note that the load cell’s capacity is 9.8 N, while the maximum travel displacement of the
actuator is 50 mm.
A radiant heater is employed to heat the sample to the target testing temperature. The
temperature throughout the sample is monitored by an infrared camera (FLIR), as detailed
in Section 2.4.2. The rate-dependent effect can be measured by adjusting the testing speed
using the actuator’s controller.
20

Figure 2.2: Proposed bending test setup for prepreg characterization purposes atprocessing conditions (a) schematic and (b) photograph.
21
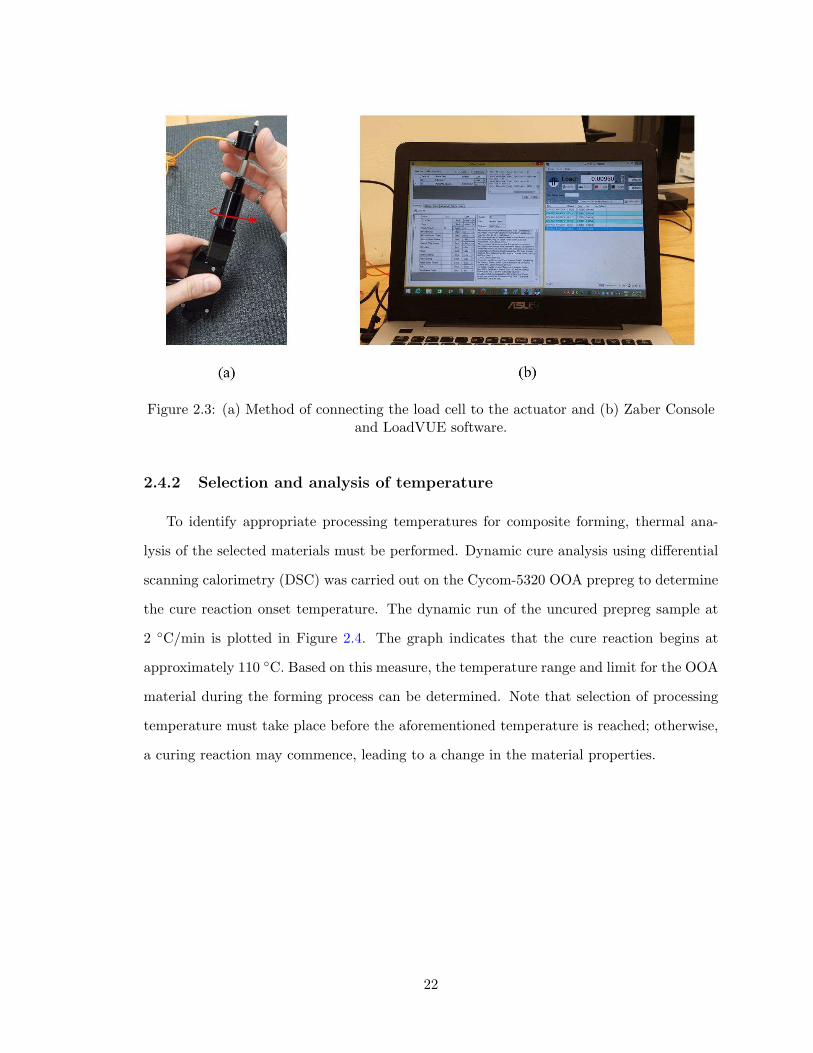
Figure 2.3: (a) Method of connecting the load cell to the actuator and (b) Zaber Consoleand LoadVUE software.
2.4.2 Selection and analysis of temperature
To identify appropriate processing temperatures for composite forming, thermal ana-
lysis of the selected materials must be performed. Dynamic cure analysis using differential
scanning calorimetry (DSC) was carried out on the Cycom-5320 OOA prepreg to determine
the cure reaction onset temperature. The dynamic run of the uncured prepreg sample at
2 ◦C/min is plotted in Figure 2.4. The graph indicates that the cure reaction begins at
approximately 110 ◦C. Based on this measure, the temperature range and limit for the OOA
material during the forming process can be determined. Note that selection of processing
temperature must take place before the aforementioned temperature is reached; otherwise,
a curing reaction may commence, leading to a change in the material properties.
22
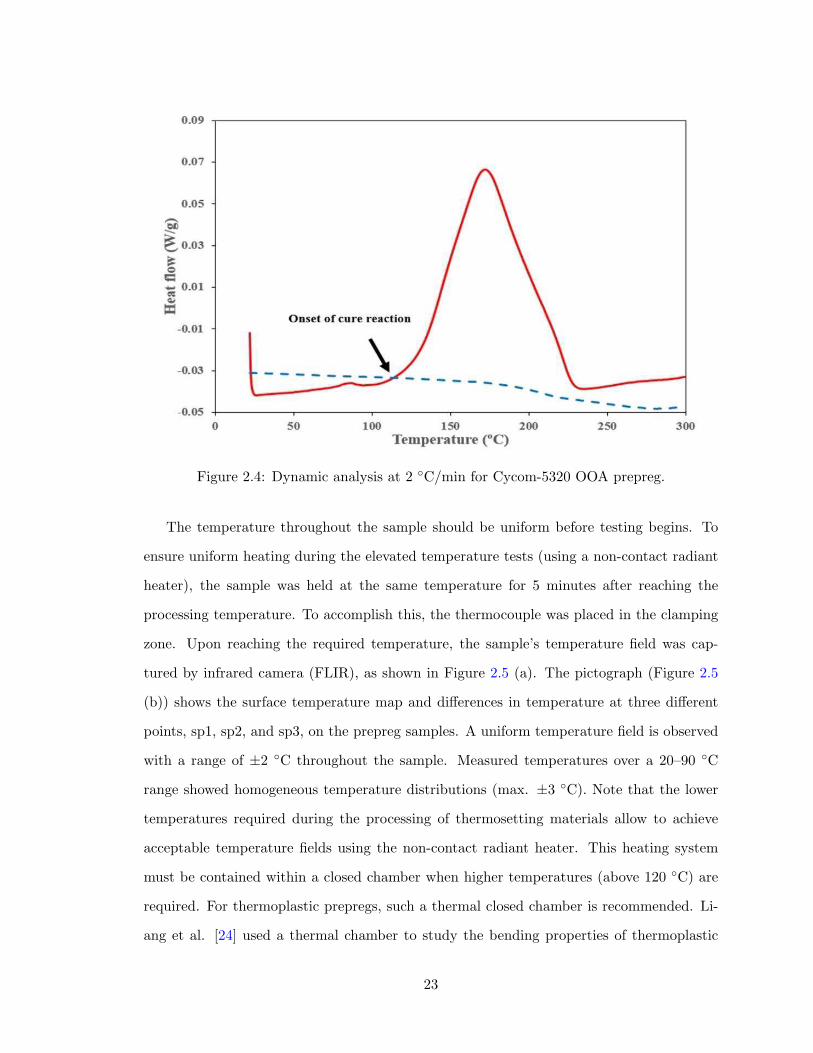
Figure 2.4: Dynamic analysis at 2 ◦C/min for Cycom-5320 OOA prepreg.
The temperature throughout the sample should be uniform before testing begins. To
ensure uniform heating during the elevated temperature tests (using a non-contact radiant
heater), the sample was held at the same temperature for 5 minutes after reaching the
processing temperature. To accomplish this, the thermocouple was placed in the clamping
zone. Upon reaching the required temperature, the sample’s temperature field was cap-
tured by infrared camera (FLIR), as shown in Figure 2.5 (a). The pictograph (Figure 2.5
(b)) shows the surface temperature map and differences in temperature at three different
points, sp1, sp2, and sp3, on the prepreg samples. A uniform temperature field is observed
with a range of ±2 ◦C throughout the sample. Measured temperatures over a 20–90 ◦C
range showed homogeneous temperature distributions (max. ±3 ◦C). Note that the lower
temperatures required during the processing of thermosetting materials allow to achieve
acceptable temperature fields using the non-contact radiant heater. This heating system
must be contained within a closed chamber when higher temperatures (above 120 ◦C) are
required. For thermoplastic prepregs, such a thermal closed chamber is recommended. Li-
ang et al. [24] used a thermal chamber to study the bending properties of thermoplastic
23
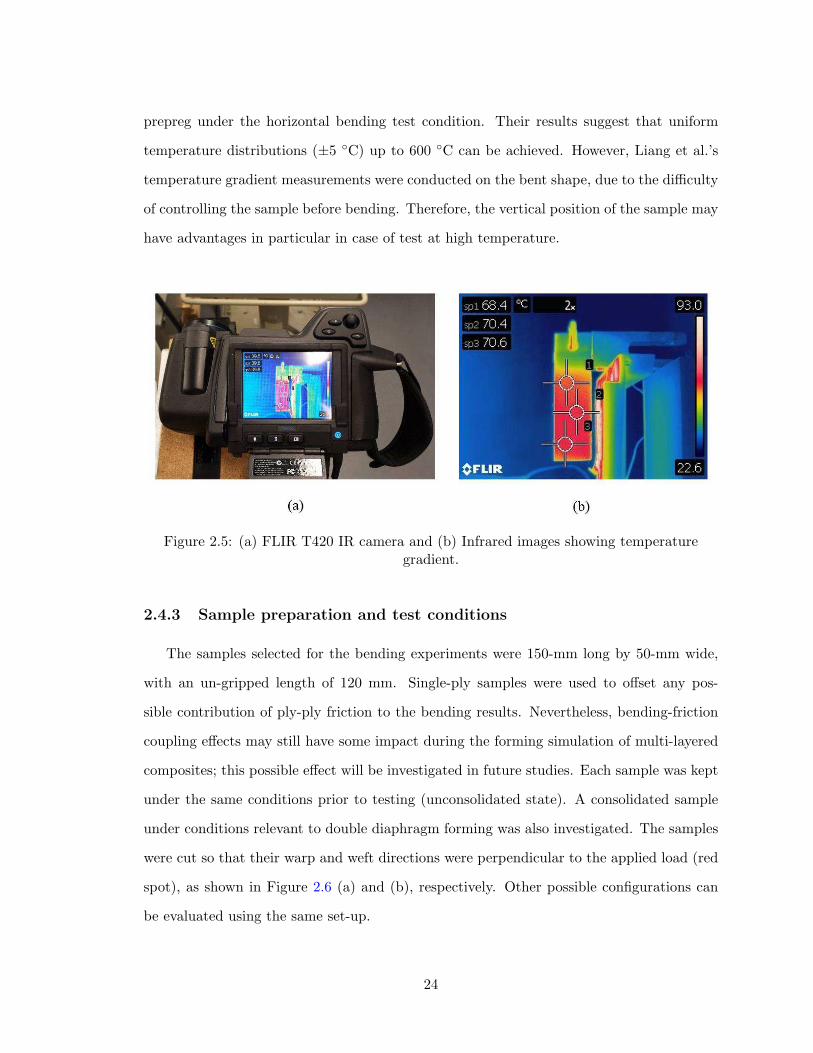
prepreg under the horizontal bending test condition. Their results suggest that uniform
temperature distributions (±5 ◦C) up to 600 ◦C can be achieved. However, Liang et al.’s
temperature gradient measurements were conducted on the bent shape, due to the difficulty
of controlling the sample before bending. Therefore, the vertical position of the sample may
have advantages in particular in case of test at high temperature.
Figure 2.5: (a) FLIR T420 IR camera and (b) Infrared images showing temperaturegradient.
2.4.3 Sample preparation and test conditions
The samples selected for the bending experiments were 150-mm long by 50-mm wide,
with an un-gripped length of 120 mm. Single-ply samples were used to offset any pos-
sible contribution of ply-ply friction to the bending results. Nevertheless, bending-friction
coupling effects may still have some impact during the forming simulation of multi-layered
composites; this possible effect will be investigated in future studies. Each sample was kept
under the same conditions prior to testing (unconsolidated state). A consolidated sample
under conditions relevant to double diaphragm forming was also investigated. The samples
were cut so that their warp and weft directions were perpendicular to the applied load (red
spot), as shown in Figure 2.6 (a) and (b), respectively. Other possible configurations can
be evaluated using the same set-up.
24
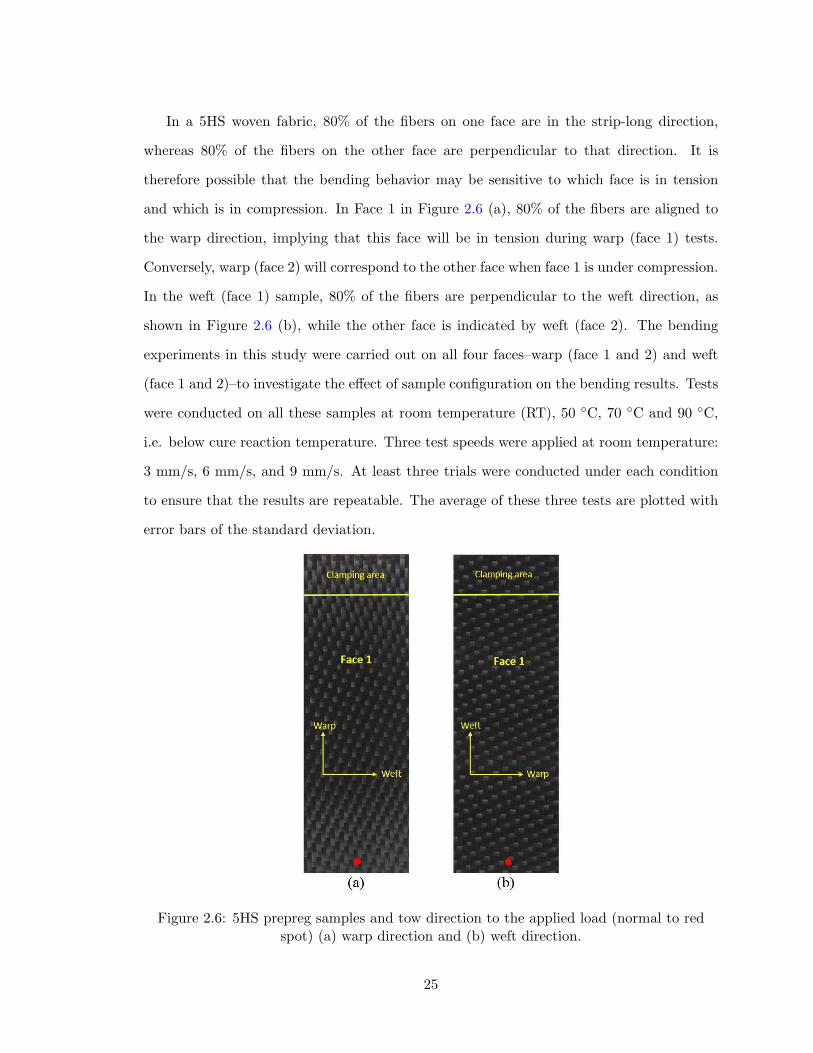
In a 5HS woven fabric, 80% of the fibers on one face are in the strip-long direction,
whereas 80% of the fibers on the other face are perpendicular to that direction. It is
therefore possible that the bending behavior may be sensitive to which face is in tension
and which is in compression. In Face 1 in Figure 2.6 (a), 80% of the fibers are aligned to
the warp direction, implying that this face will be in tension during warp (face 1) tests.
Conversely, warp (face 2) will correspond to the other face when face 1 is under compression.
In the weft (face 1) sample, 80% of the fibers are perpendicular to the weft direction, as
shown in Figure 2.6 (b), while the other face is indicated by weft (face 2). The bending
experiments in this study were carried out on all four faces–warp (face 1 and 2) and weft
(face 1 and 2)–to investigate the effect of sample configuration on the bending results. Tests
were conducted on all these samples at room temperature (RT), 50 ◦C, 70 ◦C and 90 ◦C,
i.e. below cure reaction temperature. Three test speeds were applied at room temperature:
3 mm/s, 6 mm/s, and 9 mm/s. At least three trials were conducted under each condition
to ensure that the results are repeatable. The average of these three tests are plotted with
error bars of the standard deviation.
Figure 2.6: 5HS prepreg samples and tow direction to the applied load (normal to redspot) (a) warp direction and (b) weft direction.
25
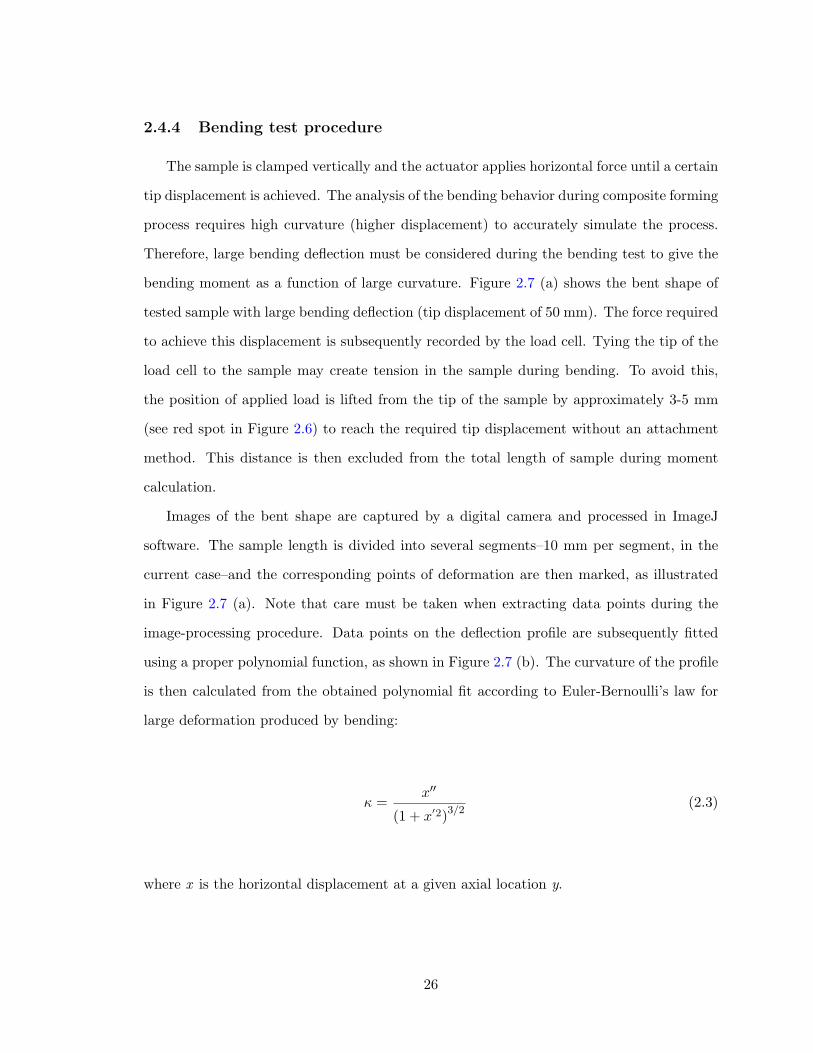
2.4.4 Bending test procedure
The sample is clamped vertically and the actuator applies horizontal force until a certain
tip displacement is achieved. The analysis of the bending behavior during composite forming
process requires high curvature (higher displacement) to accurately simulate the process.
Therefore, large bending deflection must be considered during the bending test to give the
bending moment as a function of large curvature. Figure 2.7 (a) shows the bent shape of
tested sample with large bending deflection (tip displacement of 50 mm). The force required
to achieve this displacement is subsequently recorded by the load cell. Tying the tip of the
load cell to the sample may create tension in the sample during bending. To avoid this,
the position of applied load is lifted from the tip of the sample by approximately 3-5 mm
(see red spot in Figure 2.6) to reach the required tip displacement without an attachment
method. This distance is then excluded from the total length of sample during moment
calculation.
Images of the bent shape are captured by a digital camera and processed in ImageJ
software. The sample length is divided into several segments–10 mm per segment, in the
current case–and the corresponding points of deformation are then marked, as illustrated
in Figure 2.7 (a). Note that care must be taken when extracting data points during the
image-processing procedure. Data points on the deflection profile are subsequently fitted
using a proper polynomial function, as shown in Figure 2.7 (b). The curvature of the profile
is then calculated from the obtained polynomial fit according to Euler-Bernoulli’s law for
large deformation produced by bending:
κ =x′′
(1 + x′2)3/2
(2.3)
where x is the horizontal displacement at a given axial location y.
26
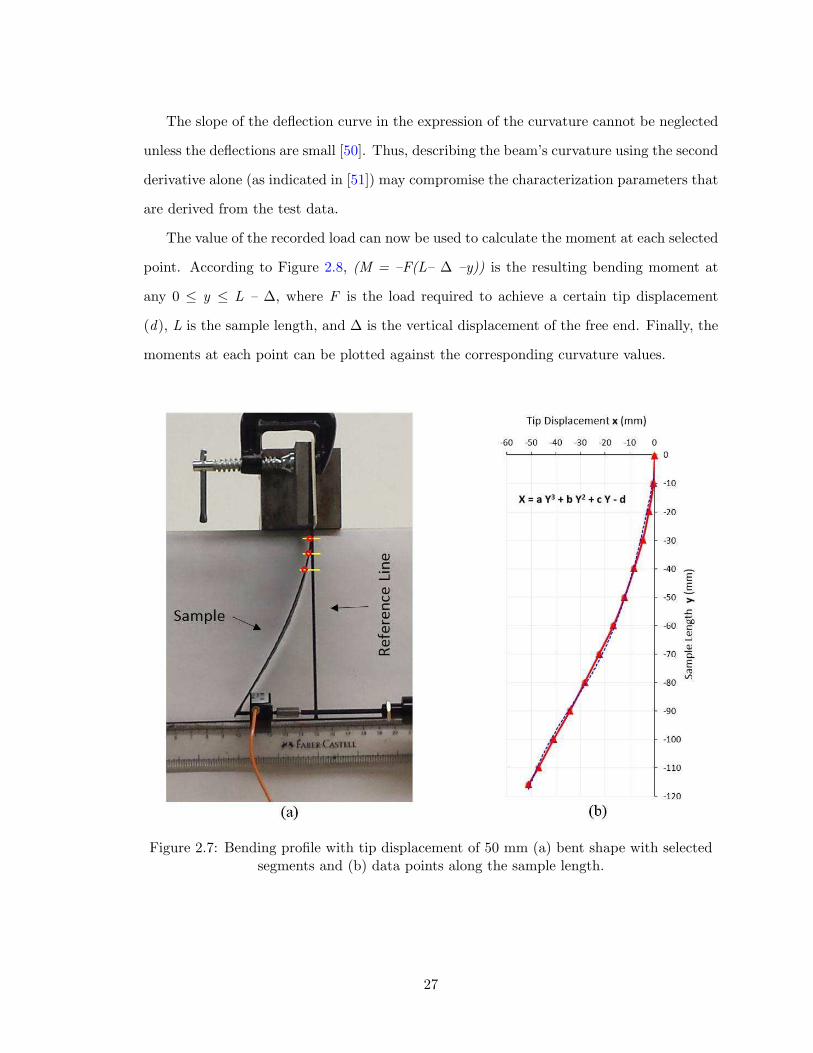
The slope of the deflection curve in the expression of the curvature cannot be neglected
unless the deflections are small [50]. Thus, describing the beam’s curvature using the second
derivative alone (as indicated in [51]) may compromise the characterization parameters that
are derived from the test data.
The value of the recorded load can now be used to calculate the moment at each selected
point. According to Figure 2.8, (M = –F(L– ∆ –y)) is the resulting bending moment at
any 0 ≤ y ≤ L – ∆, where F is the load required to achieve a certain tip displacement
(d), L is the sample length, and ∆ is the vertical displacement of the free end. Finally, the
moments at each point can be plotted against the corresponding curvature values.
Figure 2.7: Bending profile with tip displacement of 50 mm (a) bent shape with selectedsegments and (b) data points along the sample length.
27
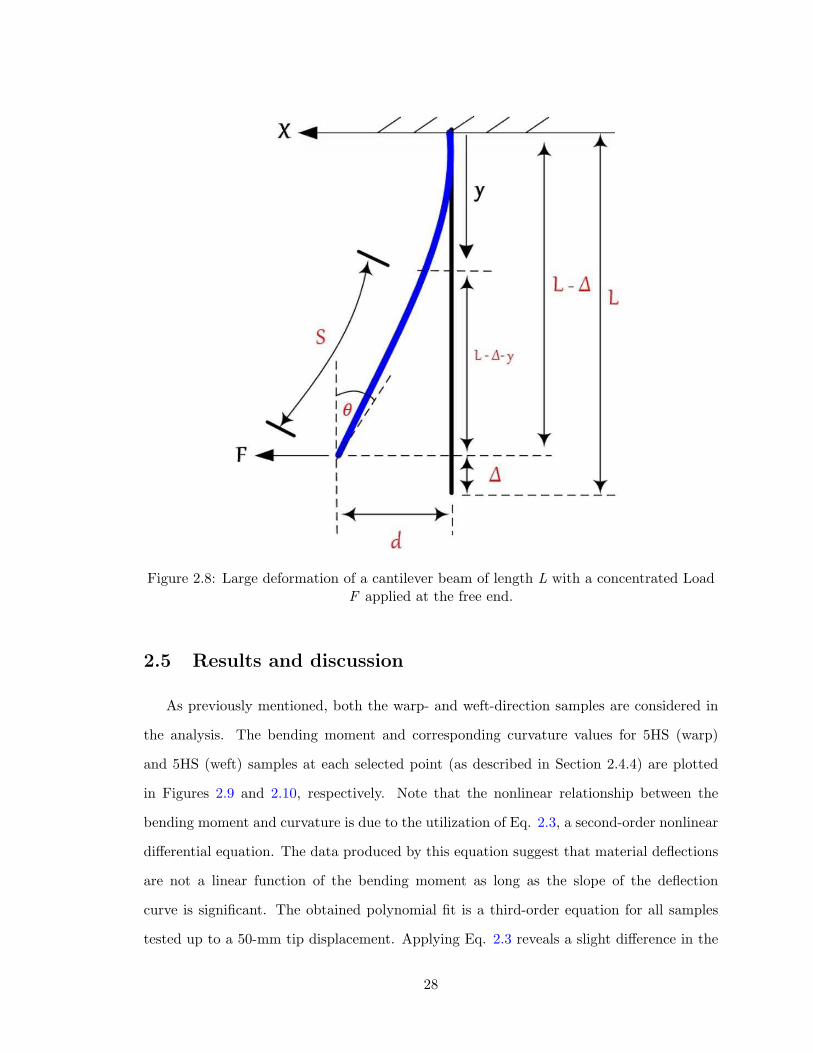
Figure 2.8: Large deformation of a cantilever beam of length L with a concentrated LoadF applied at the free end.
2.5 Results and discussion
As previously mentioned, both the warp- and weft-direction samples are considered in
the analysis. The bending moment and corresponding curvature values for 5HS (warp)
and 5HS (weft) samples at each selected point (as described in Section 2.4.4) are plotted
in Figures 2.9 and 2.10, respectively. Note that the nonlinear relationship between the
bending moment and curvature is due to the utilization of Eq. 2.3, a second-order nonlinear
differential equation. The data produced by this equation suggest that material deflections
are not a linear function of the bending moment as long as the slope of the deflection
curve is significant. The obtained polynomial fit is a third-order equation for all samples
tested up to a 50-mm tip displacement. Applying Eq. 2.3 reveals a slight difference in the
28

curvature values along the samples. Again, the procedure for extracting the data points
must be followed precisely for each sample. Figure 2.9 shows the difference between the two
faces (warp direction) tested at room temperature with a speed of 3 mm/s. The maximum
bending moment in the warp direction (face 1) is 4.816 N-mm, versus 4.175 N-mm in warp
direction (face 2). The variation between weft (face 1) and weft (face 2) is depicted in Figure
2.10. The face 1/face 2 difference is likely to have as much impact on the outcome as the
difference between warp and weft alignments. However, the results do show that the bending
moment in the warp direction is approximately 20% higher than the bending moment in
the weft direction. This distinction is attributed to the fact that the warp is straighter
than the weft (lower number of crimps) and the number of warp threads per unit area is
also higher than weft (more fabric density). Ropers et al. [35] used DMA measurements to
investigate the difference between warp and weft directions in thermoplastic prepreg and
conclude that this difference can be ignored. However, Liang et al. [24] showed that the
difference between warp and weft for PEEK-satin prepreg is about 15%. Therefore, the
bending properties of the warp and weft directions during numerical forming simulations
must be considered to ensure an accurate model.
It should be noted that the difference between warp and weft directions in dry 5HS is
greater than the one observed in 5HS prepreg. Results for dry 5HS in both directions are
shown in Figure 2.11. The moments plotted for the warp direction differ by up to 29%
from those obtained in the weft direction, whereas the equivalent warp/weft moments only
differ by 18% in prepreg samples. This contrast is likely due to the prepreg manufacturing
technique, which pulls the weft rovings out of alignment by slightly bending them [35].
However, it is also possible that the presence of resin in the OOA prepreg plays a role
in this difference. The effect of curing degree (out-time) on the bending results was not
examined in this paper; recall that all samples were kept under the same conditions before
the bending experiments.
29
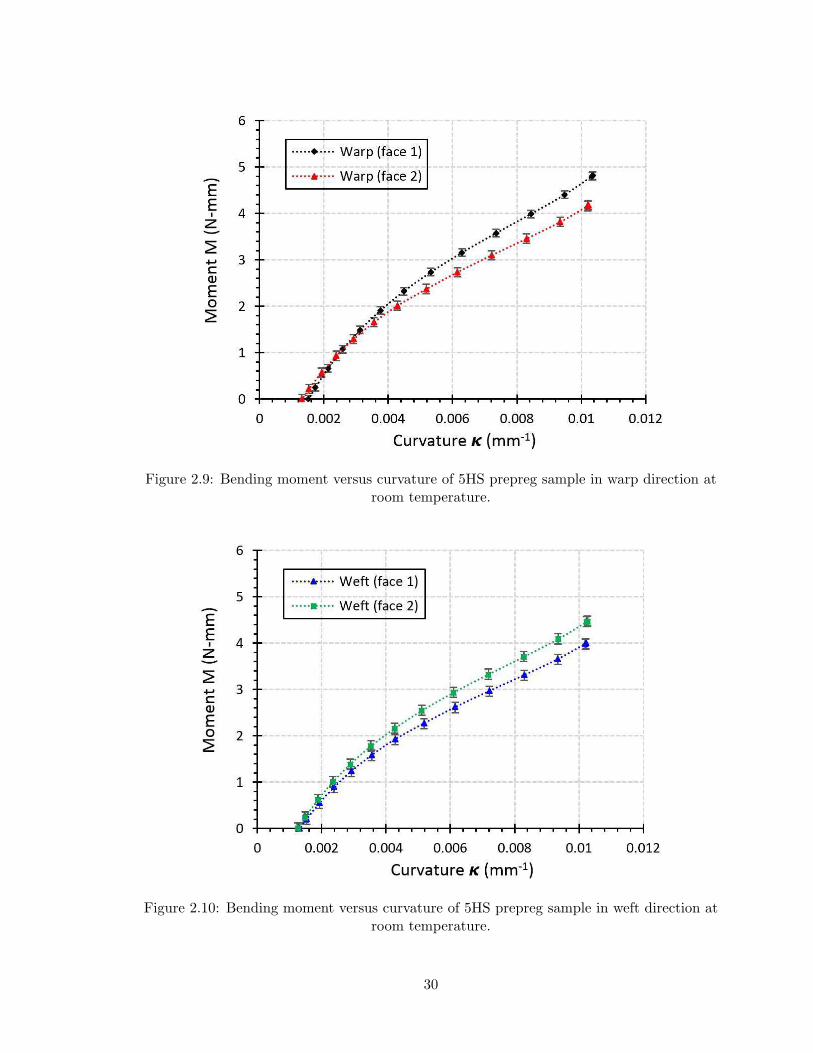
Figure 2.9: Bending moment versus curvature of 5HS prepreg sample in warp direction atroom temperature.
Figure 2.10: Bending moment versus curvature of 5HS prepreg sample in weft direction atroom temperature.
30

Figure 2.11: The difference between warp and weft directions in dry 5HS.
A room-temperature comparison between the prepreg sample and the dry sample can
indicate the contribution of resin to the bending results. The results of this comparison,
shown in Figure 2.12, reveal a significant difference between the obtained bending moments
in prepreg and dry samples: the maximum bending moment in the prepreg sample was 4.816
N-mm, versus 1.681 N-mm in the dry sample. It was expected that the difference between
the maximum bending moment of the prepreg sample and the dry one is related to the resin
content, which is 36% of the prepreg sample’s weight. However, the observed difference in
maximum bending moment between the two materials is much larger than that: about a
factor of 3. In a single prepreg yarn, it can be assumed that the load is mostly borne by
uncured resin when the direction of the load is perpendicular to the longitudinal direction of
fiber. However, it seems also that the uncured resin has a significant impact in the outcomes
more than the fabric and its style. Accordingly, it is essential to assess temperature and
rate dependencies as well as viscoelastic behavior during the bending experiments.
31

To confirm the repeatability of the results presented in this study, three tests were per-
formed on three different prepreg samples, as illustrated in Figure 2.13. A slight difference
can be seen among the three tests; the load used in the moment calculation for all tested
samples was averaged across the three test trials. Note also that the applied load position
must be centered to avoid twisting of the sample during the test, which can create problems
for extracting the bending shape and obtaining acceptable results.
Figure 2.12: The difference between prepreg and dry samples in warp direction.
32
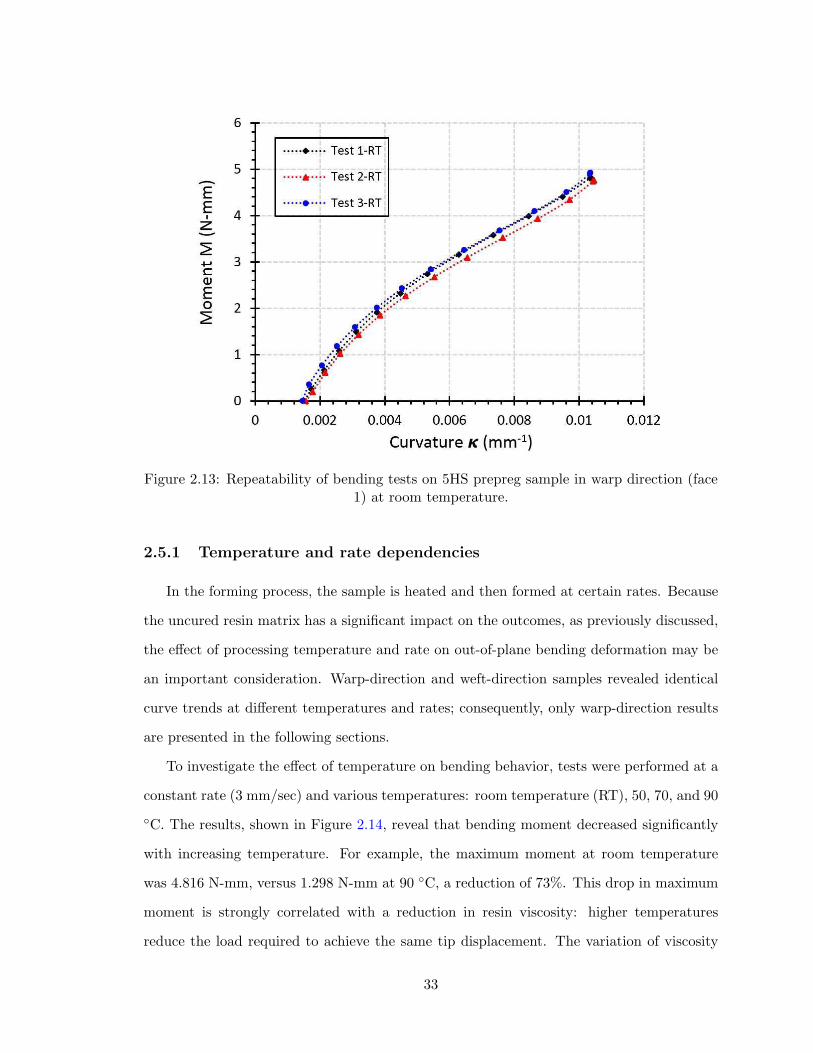
Figure 2.13: Repeatability of bending tests on 5HS prepreg sample in warp direction (face1) at room temperature.
2.5.1 Temperature and rate dependencies
In the forming process, the sample is heated and then formed at certain rates. Because
the uncured resin matrix has a significant impact on the outcomes, as previously discussed,
the effect of processing temperature and rate on out-of-plane bending deformation may be
an important consideration. Warp-direction and weft-direction samples revealed identical
curve trends at different temperatures and rates; consequently, only warp-direction results
are presented in the following sections.
To investigate the effect of temperature on bending behavior, tests were performed at a
constant rate (3 mm/sec) and various temperatures: room temperature (RT), 50, 70, and 90
◦C. The results, shown in Figure 2.14, reveal that bending moment decreased significantly
with increasing temperature. For example, the maximum moment at room temperature
was 4.816 N-mm, versus 1.298 N-mm at 90 ◦C, a reduction of 73%. This drop in maximum
moment is strongly correlated with a reduction in resin viscosity: higher temperatures
reduce the load required to achieve the same tip displacement. The variation of viscosity
33
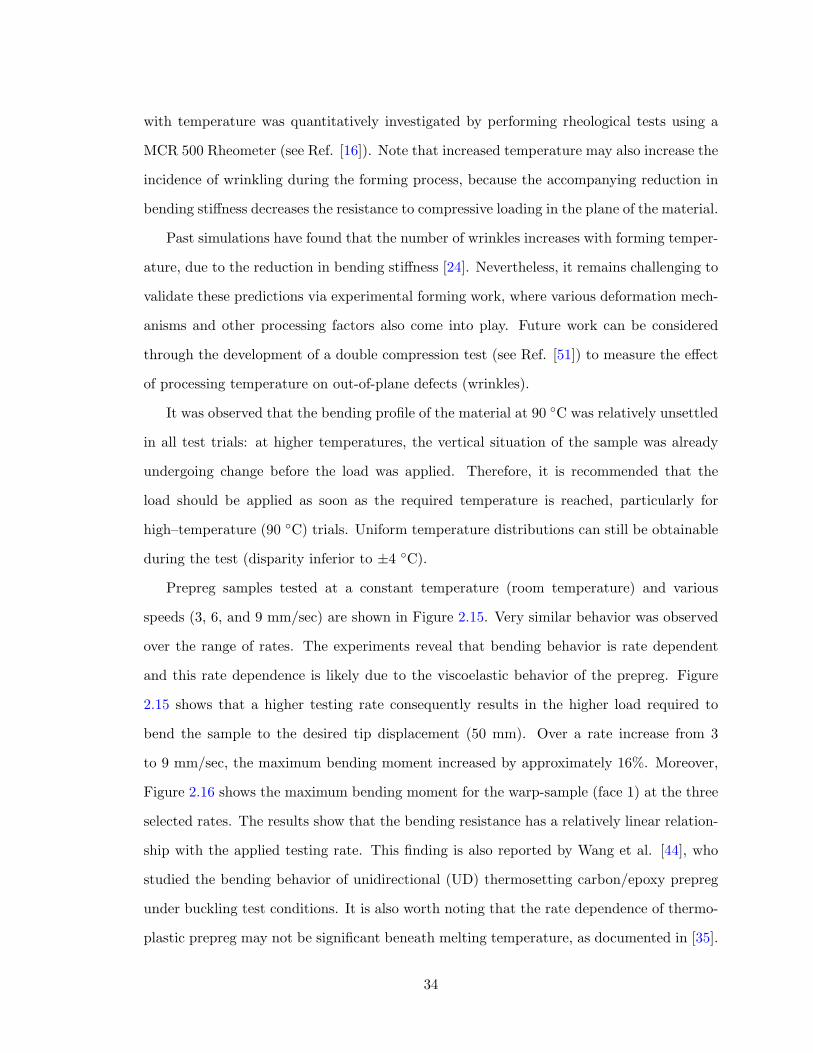
with temperature was quantitatively investigated by performing rheological tests using a
MCR 500 Rheometer (see Ref. [16]). Note that increased temperature may also increase the
incidence of wrinkling during the forming process, because the accompanying reduction in
bending stiffness decreases the resistance to compressive loading in the plane of the material.
Past simulations have found that the number of wrinkles increases with forming temper-
ature, due to the reduction in bending stiffness [24]. Nevertheless, it remains challenging to
validate these predictions via experimental forming work, where various deformation mech-
anisms and other processing factors also come into play. Future work can be considered
through the development of a double compression test (see Ref. [51]) to measure the effect
of processing temperature on out-of-plane defects (wrinkles).
It was observed that the bending profile of the material at 90 ◦C was relatively unsettled
in all test trials: at higher temperatures, the vertical situation of the sample was already
undergoing change before the load was applied. Therefore, it is recommended that the
load should be applied as soon as the required temperature is reached, particularly for
high–temperature (90 ◦C) trials. Uniform temperature distributions can still be obtainable
during the test (disparity inferior to ±4 ◦C).
Prepreg samples tested at a constant temperature (room temperature) and various
speeds (3, 6, and 9 mm/sec) are shown in Figure 2.15. Very similar behavior was observed
over the range of rates. The experiments reveal that bending behavior is rate dependent
and this rate dependence is likely due to the viscoelastic behavior of the prepreg. Figure
2.15 shows that a higher testing rate consequently results in the higher load required to
bend the sample to the desired tip displacement (50 mm). Over a rate increase from 3
to 9 mm/sec, the maximum bending moment increased by approximately 16%. Moreover,
Figure 2.16 shows the maximum bending moment for the warp-sample (face 1) at the three
selected rates. The results show that the bending resistance has a relatively linear relation-
ship with the applied testing rate. This finding is also reported by Wang et al. [44], who
studied the bending behavior of unidirectional (UD) thermosetting carbon/epoxy prepreg
under buckling test conditions. It is also worth noting that the rate dependence of thermo-
plastic prepreg may not be significant beneath melting temperature, as documented in [35].
34
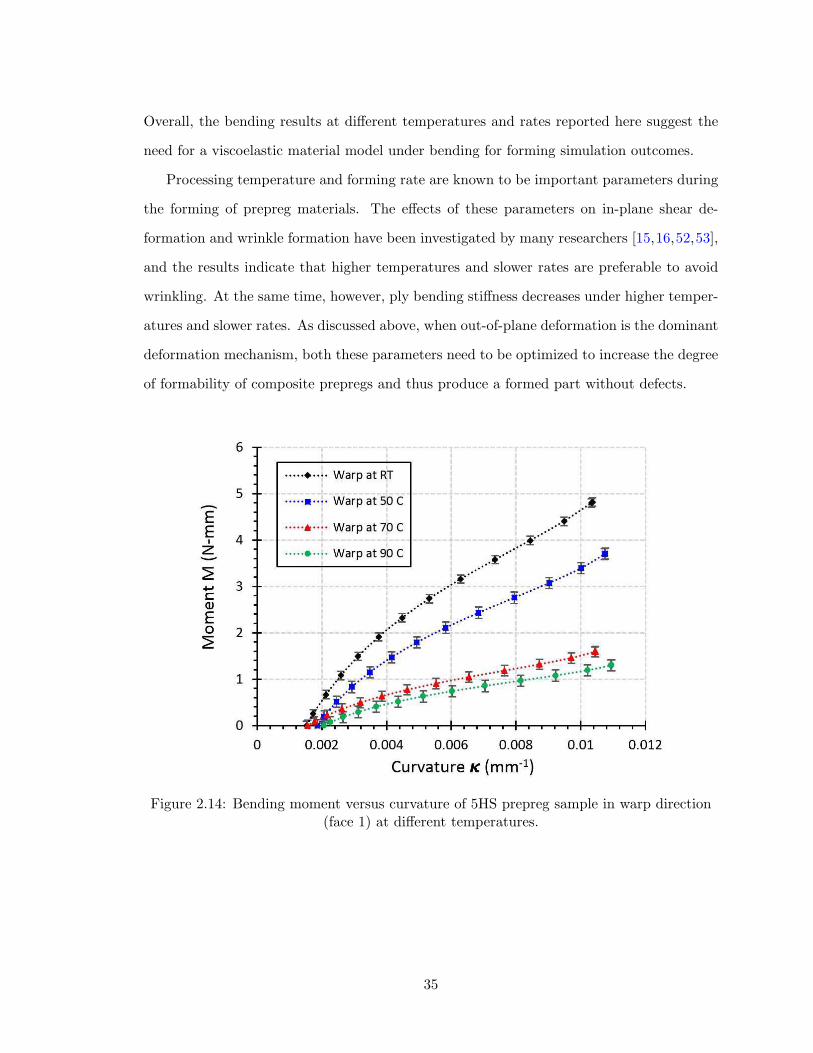
Overall, the bending results at different temperatures and rates reported here suggest the
need for a viscoelastic material model under bending for forming simulation outcomes.
Processing temperature and forming rate are known to be important parameters during
the forming of prepreg materials. The effects of these parameters on in-plane shear de-
formation and wrinkle formation have been investigated by many researchers [15,16,52,53],
and the results indicate that higher temperatures and slower rates are preferable to avoid
wrinkling. At the same time, however, ply bending stiffness decreases under higher temper-
atures and slower rates. As discussed above, when out-of-plane deformation is the dominant
deformation mechanism, both these parameters need to be optimized to increase the degree
of formability of composite prepregs and thus produce a formed part without defects.
Figure 2.14: Bending moment versus curvature of 5HS prepreg sample in warp direction(face 1) at different temperatures.
35
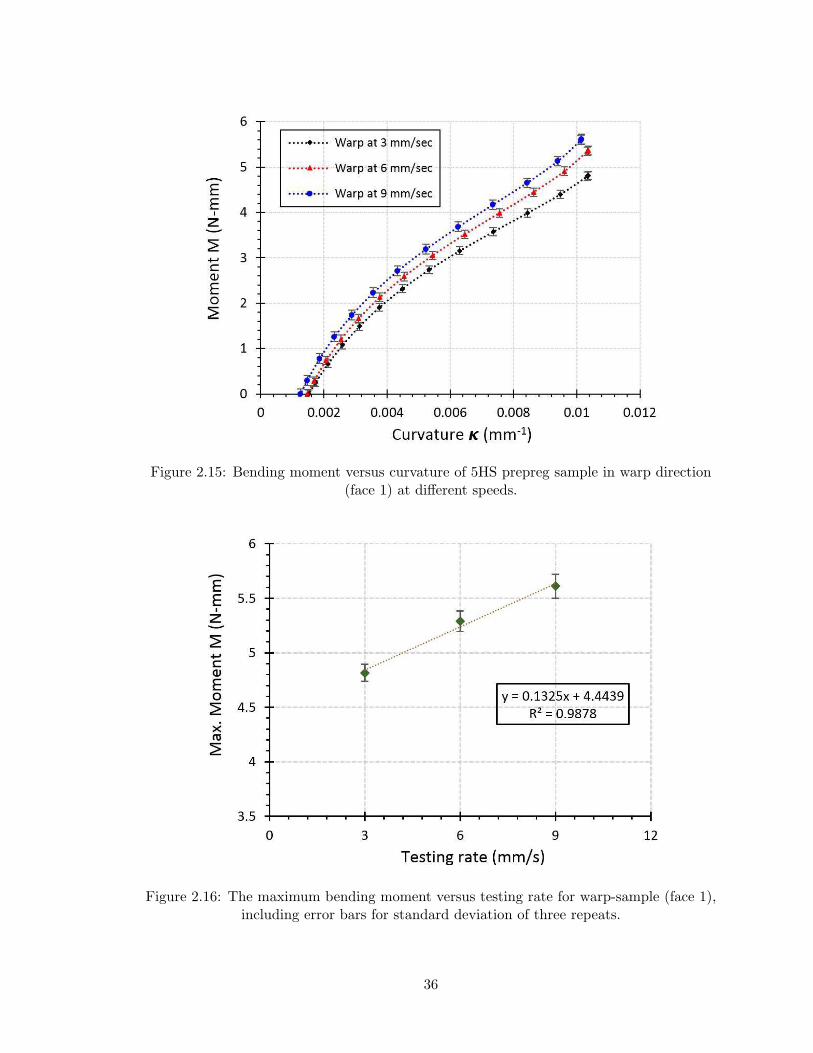
Figure 2.15: Bending moment versus curvature of 5HS prepreg sample in warp direction(face 1) at different speeds.
Figure 2.16: The maximum bending moment versus testing rate for warp-sample (face 1),including error bars for standard deviation of three repeats.
36
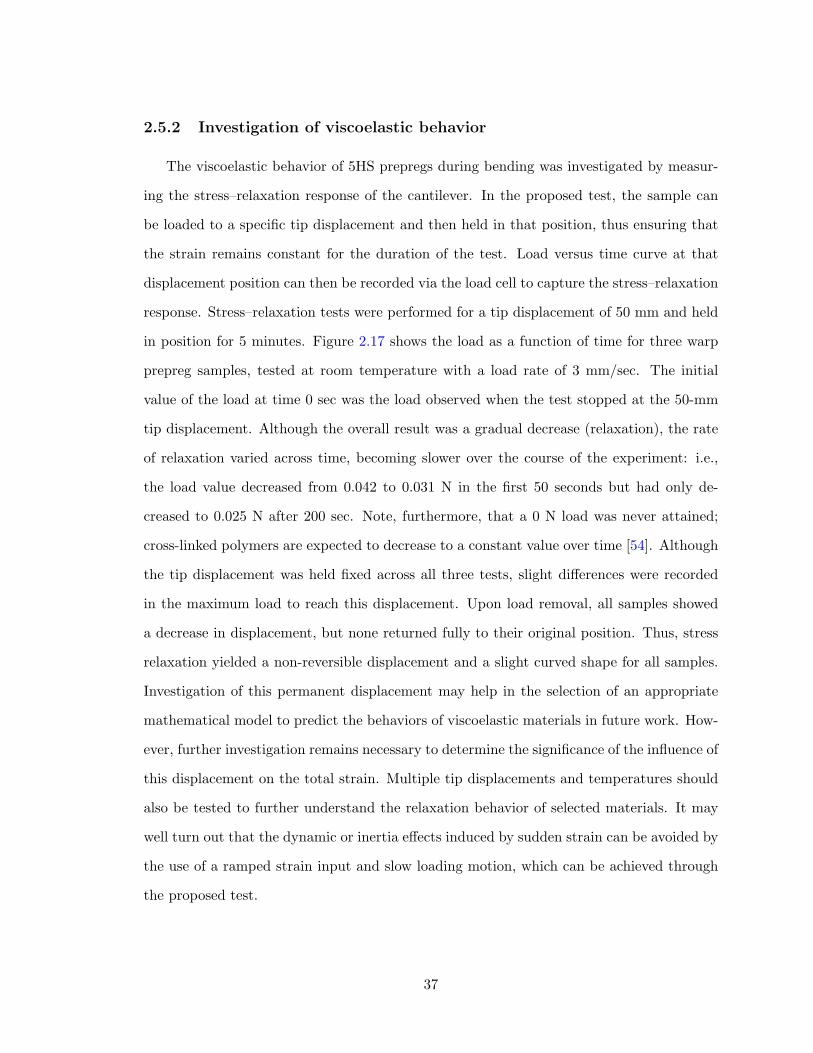
2.5.2 Investigation of viscoelastic behavior
The viscoelastic behavior of 5HS prepregs during bending was investigated by measur-
ing the stress–relaxation response of the cantilever. In the proposed test, the sample can
be loaded to a specific tip displacement and then held in that position, thus ensuring that
the strain remains constant for the duration of the test. Load versus time curve at that
displacement position can then be recorded via the load cell to capture the stress–relaxation
response. Stress–relaxation tests were performed for a tip displacement of 50 mm and held
in position for 5 minutes. Figure 2.17 shows the load as a function of time for three warp
prepreg samples, tested at room temperature with a load rate of 3 mm/sec. The initial
value of the load at time 0 sec was the load observed when the test stopped at the 50-mm
tip displacement. Although the overall result was a gradual decrease (relaxation), the rate
of relaxation varied across time, becoming slower over the course of the experiment: i.e.,
the load value decreased from 0.042 to 0.031 N in the first 50 seconds but had only de-
creased to 0.025 N after 200 sec. Note, furthermore, that a 0 N load was never attained;
cross-linked polymers are expected to decrease to a constant value over time [54]. Although
the tip displacement was held fixed across all three tests, slight differences were recorded
in the maximum load to reach this displacement. Upon load removal, all samples showed
a decrease in displacement, but none returned fully to their original position. Thus, stress
relaxation yielded a non-reversible displacement and a slight curved shape for all samples.
Investigation of this permanent displacement may help in the selection of an appropriate
mathematical model to predict the behaviors of viscoelastic materials in future work. How-
ever, further investigation remains necessary to determine the significance of the influence of
this displacement on the total strain. Multiple tip displacements and temperatures should
also be tested to further understand the relaxation behavior of selected materials. It may
well turn out that the dynamic or inertia effects induced by sudden strain can be avoided by
the use of a ramped strain input and slow loading motion, which can be achieved through
the proposed test.
37

Figure 2.17: Three tests of load relaxation of 5HS prepreg sample (warp) recorded atroom temperature with 50 mm tip displacement.
2.5.3 Consolidation effect
The bending properties would also be expected to depend in part on the state of consol-
idation of the prepreg, especially during the double-diaphragm forming; pre-heating within
a vacuum necessarily causes some degree of consolidation. The experimental approach de-
scribed above was carried out to measure the bending behavior of the consolidated sample
under conditions relevant to double-diaphragm forming. One ply of OOA prepreg was
consolidated at 70 ◦C with a pressure of 0.1 MPa using vacuum bagging for 30 minutes,
as shown in Figure 2.18 (a). The vacuum bag-only (VBO) consolidation process of OOA
prepreg includes air evacuation, fiber bed compaction, and resin flow. Once vacuum is ap-
plied, trapped air is evacuated through the dry tows, the void content decreases, and the
fiber bed is compacted [49]. The dry tow areas, (see Figure 2.1), are infiltrated by the resin
when the temperature is raised to produce a void-free micro-structure. The consolidated
sample was then cut to the same dimensions as the unconsolidated samples with respect
38
to warp direction. The evacuation of entrapped air caused by the applied pressure reduced
the measured average thickness of the consolidated sample to 0.49 mm.
The bending moments and the corresponding curvatures for consolidated and unconsol-
idated samples, tested at room temperature and 3 mm/sec, are given in Figure 2.18 (b). A
notable increase in the bending stiffness of the consolidated sample was observed (almost
17%). In this context, the increase in the bending stiffness is attributed to the change in
the degree of curing, as well as the increase in fiber volume fraction. Fiber volume fraction
is calculated using the following equation:
Vf =Mf
ρf h(2.4)
where Mf is the areal density of the fabric (kg/m2), h is the ply thickness (m), and ρf
is the density of the carbon fiber (kg/m3). Based in our measurements, the fiber volume
fraction prior to consolidation was about 43.53%, versus 48.44% in the consolidated sample.
Note also that the OOA prepreg micro-structures underwent impregnation during consol-
idation; see Centea and Hubert [55] for further details. There is an uneven distribution
of the resin through the cross-section, as shown in Figure 2.1, and the resin-rich inter-
layer (shear viscosity of resin inter-layers) plays an important role in terms of facilitating
the through thickness shearing during bending, especially at elevated temperatures. How-
ever, the sample length-to-thickness ratio is large enough to minimize the occurrence of
the through thickness shearing within the sample during the current bending experiments.
Although the consolidation conditions depend on the processing parameters utilized during
forming, the proposed experimental approach measures the bending stiffness as a function
of the consolidation state, thus allowing the modeler to determine the correct parameter
values to set during the simulation process.
39

Figure 2.18: Consolidation of one-ply of OOA prepreg at 70 ◦C and (b) bending momentversus curvature for consolidated and unconsolidated samples (warp-face 1).
40

2.5.4 Bending stiffness calculation
Given the nonlinear nature of the relationship between bending moment and curvature,
this paper proposed a new method for calculating the bending stiffness from the obtained
load and the maximum slope (tangent of θ). Accordingly, the effort needed to extract the
data points for obtaining the deflection equation and then calculate the curvature can be
minimized. Observed bending stiffness (corresponding to the slope of the linear fit) can
be used to validate the proposed method. The procedure for the proposed method is as
follows:
From the elastica theory of a flexible uniform cantilever beam loaded with a concentrated
load at the free end [50] (see Figure 2.8), a large deflection equation x (y) can be obtained:
x(y) =
∫ y
0
G(y){
1− [G(y)]2}1/2
dy (2.5)
where
G(y) =P
2EI
[
y2 − (L−∆)2]
(2.6)
Taking EI as the bending stiffness (Bs), and solving Eq. 2.5 with reference to x’(y) and
Eq. 2.6 for (Bs) gives,
Bs =P[
y2 − (L−∆)2]
√
1 + x′(y)2
2 x′(y)(2.7)
41
where P is the load required to achieve a certain tip displacement, L is the sample length,
∆ is the vertical displacement of the free end, and x’(y) is the first-derivative (slope). The
maximum slope can be obtained graphically as the tangent of θ (see Figure 2.8). The
vertical displacement ∆ can be determined graphically from the obtained image. However,
the value of ∆ is calibrated when the applied load position is shifted from the tip of the
sample, as discussed in Section 2.4.4. In the case of a 50-mm tip displacement, the value of
∆ is found to be 5-6 mm. The calculated bending stiffness at selected test conditions are
listed in Table 2.2.
The bending stiffness value was confirmed by repetition of the method under various
tip displacements (50 and 30 mm). Figures 2.19 (a) and (b) show the bending stiffness
corresponding to the slope of the linear fit between bending moment and curvature for a
50-mm and 30-mm tip displacement, respectively. The percent error in bending stiffness
values between a tip displacement of 50 mm and a tip displacement of 30 mm was found
to be small– approximately 2.63%. These values can then be used to validate the bending
stiffness calculated according to Eq. 2.7. A good agreement between the calculated bending
stiffness and the slope of the linear fit was observed for all results, as listed in Table 2.3.
However, minor errors among the values do arise due to the inaccuracy of the fit line, as
shown in Figures 2.19 (a) and (b). Figure 2.19 (c) shows the curvature-moment curve and
the bending stiffness value based on calculating the curvature as the second derivative. A
significant difference in bending stiffness value using Eq. 2.3 (Figure 19 (a)) and the second
derivative alone (Figure 2.19 (c)) was observed. Therefore, Eq. 2.3 should be used to
calculate the curvature as long as the slope of the deflection curve cannot be neglected (i.e.,
higher displacement).
42

Figure 2.19: Bending moment versus curvature with linear fit for warp (face1) (a) up to 50mm tip displacement, (b) up to 30 mm tip displacement, and (c) based on
calculating the curvature as the second derivative (up to 50 mm).
43
Table 2.2: Results of calculated bending stiffness at selected test conditions.
Sample Tipdisplacement(mm)
Testingtemperature(◦C)
Testingrate(mm/s)
BendingstiffnessBs (N-mm2)
Standarddeviationof Bs
5HS prepreg (warp-face 1)
50 RT 3 518.47
5HS prepreg (warp-face 2)
50 RT 3 449.46
5HS prepreg (weft-face 1)
50 RT 3 430.50
5HS prepreg (weft-face 2)
50 RT 3 494.93
5HS dry (warp-face1)
50 RT 3 191.89
5HS dry (weft-face1)
50 RT 3 143.88
5HS prepreg (warp-face 1)
50 50 3 399.30
5HS prepreg (warp-face 1)
50 70 3 171.20
5HS prepreg (warp-face 1)
50 90 3 139.75
5HS prepreg (warp-face 1)
50 RT 6 577.74
5HS prepreg (warp-face 1)
50 RT 9 604.07
5HS prepreg (warp-face 1)
30 RT 3 510.46
5HS consolidatedprepreg (warp-face1)
50 RT 3 599.83 178.116
44
Table 2.3: A comparison between the calculated bending stiffness and the slope of thelinear fit.
Bending stiffness (N-mm2)
Calculated Eq. 2.7 Slope of the linear fit
518.47 511.74
449.46 439.92
430.50 421.36
494.93 466.88
191.89 171.73
143.88 128.77
399.30 387.7
171.20 166.23
139.75 135.65
577.74 560.95
604.07 586.52
510.46 498.61
599.83 590.51
45
2.6 Conclusion
Given the important role of out-of-plane bending in determining wrinkle formation dur-
ing composite forming, demand for efficient and robust forming simulations for prepreg
materials is increasing. To provide accurate simulation input, a suitable prepreg bending
test that offer good control of the testing parameters (including both rate and temperature
dependencies) is necessary. To meet this need, the present study reports on a new test
method based on a vertical cantilever test associated with a linear actuator and load cell.
Investigations of out-of-plane bending behavior of satin woven carbon/epoxy prepregs
were assessed across different sample configurations, processing temperatures, and rates.
The results revealed that bending stiffness is approximately 20% higher in the warp direction
than in the weft direction. This distinction should be considered during future forming
simulation inputs. Bending stiffness was found to decrease significantly with increasing
temperature. This decrease is strongly correlated with resin viscosity reduction: higher
temperatures reduce the load required to achieve the same tip displacement. Moreover,
the experiments showed that bending behavior is rate-dependent, due to the viscoelastic
behavior of the prepreg. A good agreement between the calculated bending stiffness based
on suggested method and the slope of the linear fit was observed for all results. Although the
application of higher temperatures (over 120 ◦C) during the new test method was difficult
due to reliance on a non-contact heater facility, the new method allowed for sufficient
control of deflection shape, testing rates, and processing temperatures within the range of
thermosetting resin. An investigation of viscoelastic behavior was also undertaken. Overall,
the new test method demonstrated good reproducibility of results.
Future work is needed to address the viscoelastic behavior at different temperatures.
Once this investigation is complete, a mathematical model describing the real viscoelastic
response of the materials associated with the bending model may be developed.
46

Chapter 3
A theoretical model with experimental veri-
fication for bending stiffness of thermoset-
ting prepreg during forming process∗
Abstract
Capturing the out-of-plane properties using a suitable experimental method and combina-
tion of constitutive models and modeling techniques is required to improve forming simula-
tion outcomes for composite prepregs, with the ultimate aim of predicting and optimizing
forming processes. This paper proposes a theoretical model for bending behavior of woven
fabric-based out-of-autoclave prepregs under conditions relevant to forming process. Time
and temperature dependencies are considered by means of time–temperature superposition
in a linear viscoelastic material model. A new approach for considering the testing rate and
temperature with respect to a reference value is also established. Experimental tests are
carried out for estimation of the model parameters and validation of the proposed model.
A special bending test setup is utilized to allow for adequate control of testing rates and
temperatures as well as viscoelastic investigations. A good agreement between the predicted
bending stiffness and the experimental values was observed. The model and experimental
results reveal that the processing temperature has the strongest influence on the bending
property results.
∗Reproduced from: Hassan Alshahrani, Mehdi Hojjati. A theoretical modelwith experimental verification for bending stiffness of thermosetting prepregduring forming process. Composite Structures, 166 (2017), pp. 136–145.http://dx.doi.org/10.1016/j.compstruct.2017.01.030
47
3.1 Introduction
Use of automated technologies such as Automated Tape Laying (ATL) or Automated
Fiber Placement (AFP) to produce composite parts offers great promise to meet the grow-
ing need for composite materials in the aerospace and automotive industries due to low
manufacturing times and concomitant lower costs [33]. However, in order to improve the
productively of complex composite components used in aerospace applications, flat lamin-
ates are laid down by automated machines and then subjected to a forming process. Several
deformation mechanisms come into play during the forming of composite prepregs to a de-
sired shape, including intra-ply shear, inter-ply friction, and out-of-plane bending [6]. In
order to accurately predict defects, such as wrinkling, that may arise during composite
material forming processes, a considerable amount of knowledge of the deformation mech-
anisms of prepreg ply under forming conditions is necessary. The bending properties of the
prepreg, including their temperature and rate dependencies, must be known and properly
represented in the finite element model to achieve useful simulation results [11, 24, 34, 35].
However, the bending characterization and modeling of composite prepreg have received
little attention in the literature compared to intra-ply shear and inter-ply friction. Some
test methods have developed to measure the out-of-plane bending properties of prepreg
composites [24, 40, 47, 56]. For a comprehensive review of proposed bending tests towards
prepreg composites, the reader is referred to [47,56].
The bending behavior of dry textiles has been subjected to theoretical modeling under
a number of different approaches, including energy methods [57] and linear elastic beam
theory [58]; a recent review on this topic was presented by Syerko et al. [59]. However,
these models are unsuitable for describing the bending behavior of composite prepregs, due
to their resin existence. At present, a notable lack of research exists on bending models for
prepreg composites. One relevant study was conducted by Martin et al. [43], who developed
a viscous fluid beam bending model that relied on a plane strain assumption. This model
was based on the ’Ideal fiber-reinforced model’ (IFRM) developed by Spencer [60]. Wang
et al. [44] proposed a model for predicting buckling test results that combines both the
48
’elastic’ buckling model and the ’plastic’ buckling model. The modeling of ’elastic’ buckling
was based on classical elastic laminate beam theory, while the modeling of plastic buckling
was based on the uniaxial continuum theory for ideal fiber-reinforced fluids. Recently,
Sachs [30] developed a viscoelastic bending model that differentiates between elastic fiber
and the highly viscous thermoplastic matrix. In this approach, the fiber is subjected to
bending under the Euler-Bernoulli beam theory; the matrix is assumed to be Newtonian
and is subjected to shear. However, the model fit parameters (such as viscosity and Young’s
modulus) were much higher than the actual material properties. Currently, there are at
present no accurate theoretical models available to predict bending stiffness of prepregs
at processing parameters. Thus, this paper is developed a theoretical model for bending
behavior of thermosetting prepreg under conditions relevant to forming process.
3.2 Motivation
This work is motivated by the increased demand for more efficient and robust forming
simulations, as bending stiffness plays an important role in determining wrinkle formation
[24,35]. Wrinkling is caused by out-of-plane deformation due to compressive loading in the
plane of the material during the forming process. Consequently, capturing the out-of-plane
properties using a suitable experimental method and combination of constitutive models
and modeling techniques is required, with the ultimate aim of predicting and optimizing
forming processes.
Whereas continuous materials (such as sheet metals and composite plates with hardened
matrix) show a relatively high bending stiffness, prepreg sheets are inherently much more
flexible. This can cause problems for the calculation of bending stiffness for prepreg ma-
terials; reliance on the tensile modulus to assess bending stiffness tends to produce an
unrealistically elevated stiffness assessment that is not representative of the true property
[11, 61]. Thus, it is necessary to develop an equivalent bending stiffness model that accur-
ately captures the bending stiffness of prepreg materials as a function of its temperature-
time dependencies in order to precisely compute out-of-plane wrinkle formation in the finite
49
element forming simulations.
3.3 Theoretical formulation
Cantilever beam theory presents a possible solution with some adoptions to predict
the bending stiffness of prepreg materials. The prepreg yarn is composed of two external
viscoelastic polymer plies with a linear elastic ply of thickness h/2 in between, as shown
in Figure 3.1, and assumed to deform as an Euler-Bernoulli beam. In order to assist in
measuring bending stiffness, the cantilever is clamped at one end; a load P is then placed on
its free end and perpendicular to the bar axis. Small deformation theory is used to analyze
the cantilever, based on the following assumptions: the influence of shear is neglected, and a
uniaxial state of stress is considered. Assuming that the neutral axis does not coincide with
the geometric axis as shown in Figure 3.1, the total strain, based on the Euler-Bernoulli
assumption, can be defined as
εx =−(y + y0)
R(3.1)
where y0 is the position of the neutral axis (n.a.) relative to the geometric axis where the
total strain is zero, R is the radius of curvature. A beam with rectangular cross-section
(height = h, width = b) is considered. Equations for the axial force acting on the cross
section and the bending moment are as follows:
Fx =
[
∫
−h
4
−h
2
σ (t) bdy +
∫
−y0
−h
4
σtbdy +
∫ h
4
−y0
σcbdy +
∫ h
2
h
4
σ (t) bdy
]
= 0 (3.2)
M = −[
∫
−h
4
−h
2
σ (t) bydy +
∫
−y0
−h
4
σtybdy +
∫ h
4
−y0
σcybdy +
∫ h
2
h
4
σ (t) ybdy
]
(3.3)
50
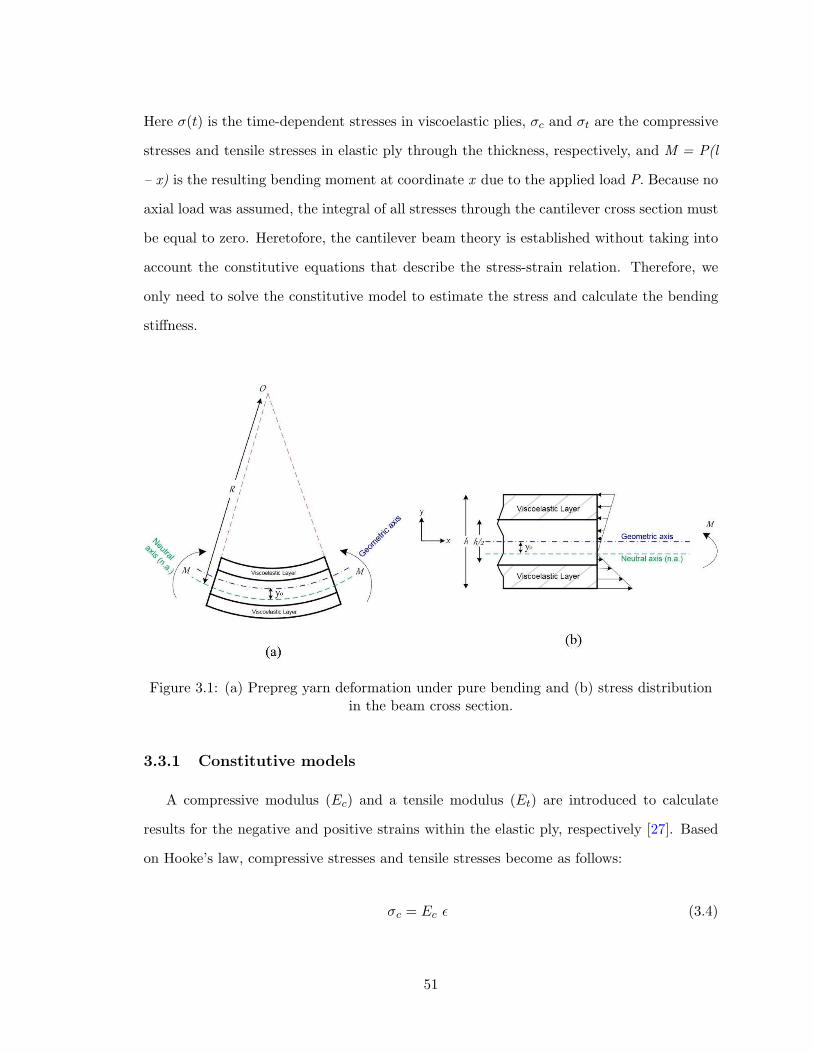
Here σ(t) is the time-dependent stresses in viscoelastic plies, σc and σt are the compressive
stresses and tensile stresses in elastic ply through the thickness, respectively, and M = P(l
– x) is the resulting bending moment at coordinate x due to the applied load P. Because no
axial load was assumed, the integral of all stresses through the cantilever cross section must
be equal to zero. Heretofore, the cantilever beam theory is established without taking into
account the constitutive equations that describe the stress-strain relation. Therefore, we
only need to solve the constitutive model to estimate the stress and calculate the bending
stiffness.
Figure 3.1: (a) Prepreg yarn deformation under pure bending and (b) stress distributionin the beam cross section.
3.3.1 Constitutive models
A compressive modulus (Ec) and a tensile modulus (Et) are introduced to calculate
results for the negative and positive strains within the elastic ply, respectively [27]. Based
on Hooke’s law, compressive stresses and tensile stresses become as follows:
σc = Ec ε (3.4)
51
σt = Et ε (3.5)
The most general model for linear viscoelasticity is the generalized Maxwell or Wiechert
model [54], schematically represented in Figure 3.2, which consists in parallel a series of
Maxwell spring–dashpot units and a Hookean spring. The stress can be expressed in the
integral form as
{σ(t)} =
∫ t
0Y [t− τ ]
∂ {ε(τ)}∂τ
dτ (3.6)
where Y(t) is the relaxation modulus. When the strain is constant in time (ε = constant),
the resulting stress equation (Eq. 3.6) reduces to [62]
σ (t) = Y (t) ε (3.7)
Note that, the latter equation is the uniaxial stress-strain relation for a polymer analogous
to Hooke’s law, however, it is valid only for the case of a constant input of strain. The
constant input of strain (strain not vary with time) can be attained through the relaxation
test that employed in this study. Based on the superposition principle, the total stress in
the element is the sum of the elemental stresses and can be described by Prony series, which
provides a convenient representation of the stress relaxation as follows [54]:
σ (t) = ε0
(
E∞ +N∑
i=1
Eie−
t
τi
)
, with τ i =ηiEi
(3.8)
where E∞ is the equilibrium modulus, t is the time, Ei and τi are the elastic components
and relaxation time in the Maxwell component. The relaxation modulus of a generalized
Maxwell model is given by
Y (t) = E∞ +N∑
i=1
Eie−
t
τi (3.9)
52
Substituting Eq. 3.1 into Eqs. 3.4, 3.5, and 3.7, the bending moment (Eq. 3.3) at time t
becomes
M(t) = −[
∫
−h
4
−h
2
Y (t)
(−y − y0R
)
bydy +
∫
−y0
−h
4
Et
(−y − y0R
)
ybdy
+
∫ h
4
−y0
Ec
(−y − y0R
)
ybdy +
∫ h
2
h
4
Y (t)
(−y − y0R
)
ybdy
] (3.10)
Solving Eq. (3.10) leads to
M(t) =Et
R
(
bh3
12
)
{
7
8
(
Y (t)
Et
)
+1
16
[
(
4y0h
− 1
)2(2y0h
+ 1
)
]
− Ec
16Et
[
(
4y0h
+ 1
)2(2y0h
− 1
)
]} (3.11)
The curvature (κ) is 1/R; the equivalent bending stiffness (Bs) can be written as
Bs(t) = Et
(
bh3
12
)
{
7
8
(
Y (t)
Et
)
+1
16
[
(
4y0h
− 1
)2(2y0h
+ 1
)
]
− Ec
16Et
[
(
4y0h
+ 1
)2(2y0h
− 1
)
]} (3.12)
The distance of the neutral axis (n.a.) from the geometric axis y0 can be obtained from
the axial force equilibrium equation as
Fx =
[
∫
−h
4
−h
2
Y (t)
(−y − y0R
)
bdy +
∫
−y0
−h
4
Et
(−y − y0R
)
bdy
+
∫ h
4
−y0
Ec
(−y − y0R
)
bdy +
∫ h
2
h
4
Y (t)
(−y − y0R
)
bdy
]
= 0
(3.13)
Eq. (3.13) results in
Fx = 16 y02 − 8 h
(
Et + Ec + Y (t)
Et − Ec
)
y0 + h2 = 0 (3.14)
53
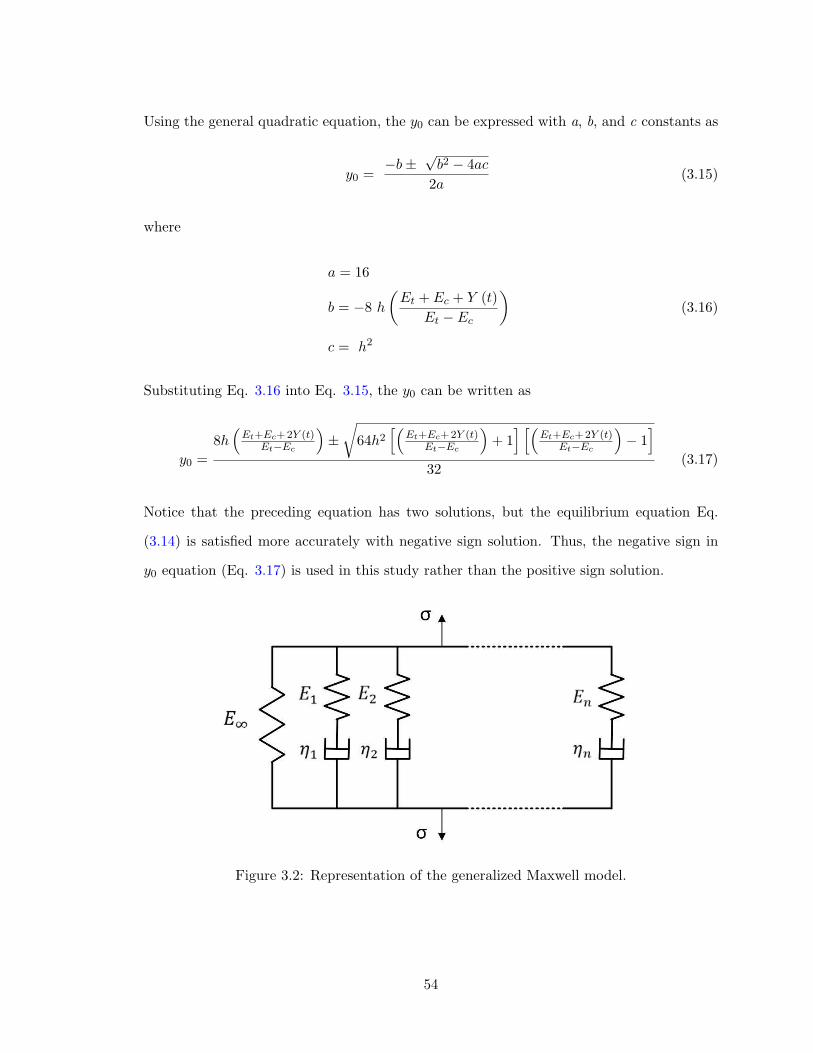
Using the general quadratic equation, the y0 can be expressed with a, b, and c constants as
y0 =−b±
√b2 − 4ac
2a(3.15)
where
a = 16
b = −8 h
(
Et + Ec + Y (t)
Et − Ec
)
c = h2
(3.16)
Substituting Eq. 3.16 into Eq. 3.15, the y0 can be written as
y0 =
8h(
Et+Ec+2Y (t)Et−Ec
)
±√
64h2[(
Et+Ec+2Y (t)Et−Ec
)
+ 1] [(
Et+Ec+2Y (t)Et−Ec
)
− 1]
32(3.17)
Notice that the preceding equation has two solutions, but the equilibrium equation Eq.
(3.14) is satisfied more accurately with negative sign solution. Thus, the negative sign in
y0 equation (Eq. 3.17) is used in this study rather than the positive sign solution.
Figure 3.2: Representation of the generalized Maxwell model.
54
3.3.2 Model parameters determination
Eqs. (3.11) and (3.12) for bending moment and stiffness include material parameters of
the prepreg and the relaxation modulus (Et, Ec, and Y (t)). Since the tensile rigidities are
large compared to the compressive rigidities, the tensile modulus (Et) of prepreg is quoted
from the data sheet provided by the supplier [63] as the young modulus of the fabrics in
both directions. While, the compressive modulus (Ec) and relaxation modulus (Y (t)) are
determined in the following subsection (3.3.2.1) and (3.3.2.2), respectively.
3.3.2.1 Compressive modulus Ec
The compressive modulus is determined by performing a compression test (buckling test)
using a HOSKIN machine of 5 kN capacity, see Figure 3.3 (a). According to [44, 64], and
the experimental observations of buckling test results, a buckling curve can be divided into
three regions: elastic, plastic buckling and a transition region, as illustrated in Figure 3.3
(b). From the elastic buckling where the prepreg samples behave like a spring (straight line
in buckling curve), the compressive modulus can be obtained by the slope of stress-strain
curve for this region. The compressive modulus can be predicted following the formulations
described byWang et al. [44], who predict the compression force required for elastic buckling
of UD prepreg using the strain energy. However, this is beyond the scope for the presented
modeling approach.
55

Figure 3.3: (a) Buckling test on prepreg sample and (b) obtained buckling test result.
3.3.2.2 Relaxation modulus Y (t)
The proposed bending test for prepreg materials at forming conditions, detailed in Sec-
tion 3.4, can be used to measure the stress–relaxation response of the cantilever. The sample
can be loaded to a specific tip displacement and then held in that position as shown in Fig-
ure 3.4 (a), thus ensuring that the strain remains constant for the duration of the test. Load
versus time curve at that displacement position can then be recorded via the load cell to
represent the stress–relaxation response. This load is multiplied by the sample’s length to
plot the bending moment against time; the relaxation curve is exhibited in Figure 3.4 (b).
The initial value of the load at time 0 sec was the load observed when the test stopped at
the desired tip displacement. The aforementioned Generalized Maxwell (Wiechert) model
with three spring–dashpot elements was chosen for approximation of the experimental data;
(Eq. 3.8) can be rewritten as
σ (t) = ε0
[
E∞ + E1e−
t
τ1 + E2e−
t
τ2 + E3e−
t
τ3
]
(3.18)
56
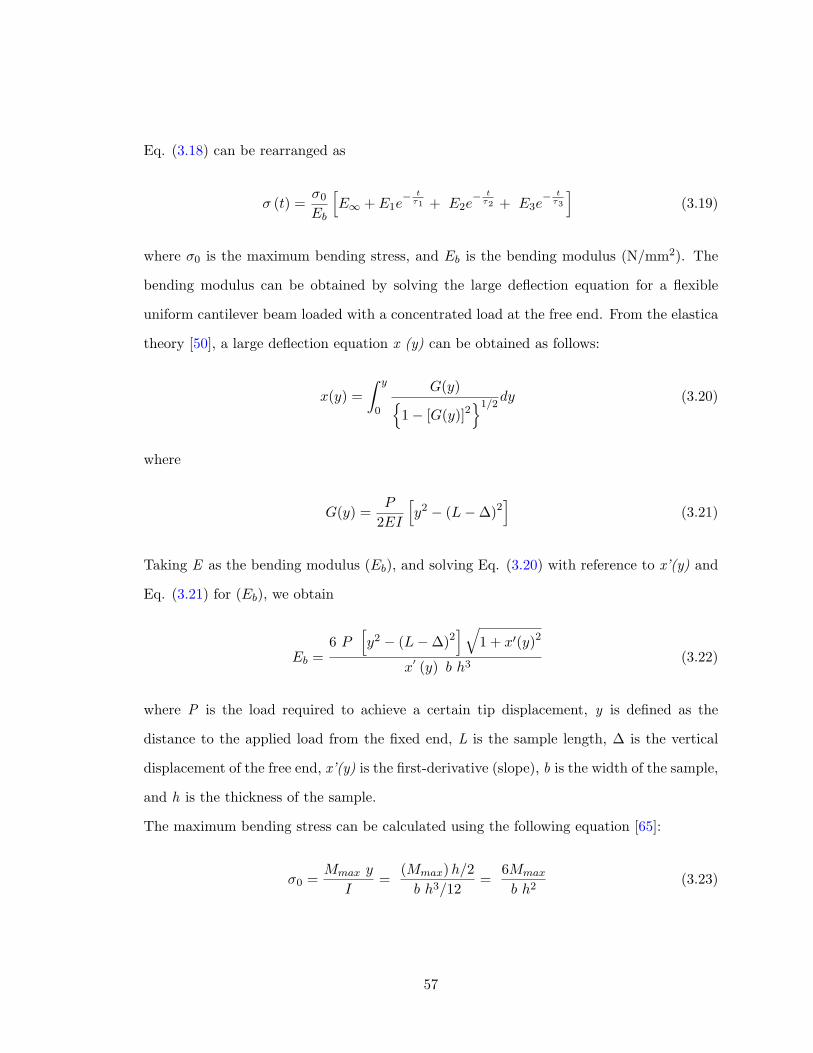
Eq. (3.18) can be rearranged as
σ (t) =σ0
Eb
[
E∞ + E1e−
t
τ1 + E2e−
t
τ2 + E3e−
t
τ3
]
(3.19)
where σ0 is the maximum bending stress, and Eb is the bending modulus (N/mm2). The
bending modulus can be obtained by solving the large deflection equation for a flexible
uniform cantilever beam loaded with a concentrated load at the free end. From the elastica
theory [50], a large deflection equation x (y) can be obtained as follows:
x(y) =
∫ y
0
G(y){
1− [G(y)]2}1/2
dy (3.20)
where
G(y) =P
2EI
[
y2 − (L−∆)2]
(3.21)
Taking E as the bending modulus (Eb), and solving Eq. (3.20) with reference to x’(y) and
Eq. (3.21) for (Eb), we obtain
Eb =6 P
[
y2 − (L−∆)2]
√
1 + x′(y)2
x′ (y) b h3(3.22)
where P is the load required to achieve a certain tip displacement, y is defined as the
distance to the applied load from the fixed end, L is the sample length, ∆ is the vertical
displacement of the free end, x’(y) is the first-derivative (slope), b is the width of the sample,
and h is the thickness of the sample.
The maximum bending stress can be calculated using the following equation [65]:
σ0 =Mmax y
I=
(Mmax)h/2
b h3/12=
6Mmax
b h2(3.23)
57
Since the maximum stress is at the cantilever beam clamp and the minimum stress at
the free-end, the average stress for the entire beam is then half the maximum stress [65].
Consequently, Eq. (3.19) becomes as follows:
M (t) =Mmax
Eb
[
E∞ + E1e−
t
τ1 + E2e−
t
τ2 + E3e−
t
τ3
]
(3.24)
Using the data analysis software (Curve-Expert) with the customized model based on Eq.
(3.24), fits to the experimental relaxation data can be obtained. Thereafter, the parameters
obtained from the curve-fitting approach are used in the subsequent equation (Eq. 3.25) to
calculate the relaxation modulus.
Y (t) =[
E∞ + E1e−
t
τ1 + E2e−
t
τ2 + E3e−
t
τ3
]
(3.25)
Figure 3.4: (a) Proposed bending test for measuring the stress-relaxation response and (b)relaxation curve recorded at room temperature.
58

3.3.3 Time–Temperature dependencies
In the forming process, the sample is heated and then formed at certain rates. The effect
of processing temperature and rate on bending stiffness calculation must therefore be taken
into consideration. The rate in this case is correlated to the testing time and ultimately to
the forming time. The testing time (ts) can be defined as
ts =d
s(3.26)
where d is the maximum tip displacement, and s is the testing speed applied to reach this
displacement. The testing time based on Eq. (3.26) is used in Eq. (3.25) to calculate the
bending stiffness at a certain rate. Following this, Eq. (3.25) can be rewritten as
Y (ts) =[
E∞ + E1e−
ts
τ1 + E2e−
ts
τ2 + E3e−
ts
τ3
]
(3.27)
It should be noted that the testing time varies with the speed applied during the bending
test. This also can be related to the forming time during the forming process operation. At
present, the moment and bending stiffness equations (Eqs. (3.11) and (3.12)) do not consider
the influence of temperature on bending behavior. To meet this need, the shift factor
(αT ) and its dependency on the bending stiffness are introduced using time-temperature
superposition. The reduced time τ and the actual time t are related by the following
equation [54]:
τ =
∫ t
0
dt
αT (T (t))(3.28)
If the temperature (T ) is constant, αT is also constant and therefore, the reduced time can
be defined as
τ =t
αT(3.29)
59
Accordingly, the relaxation modulus (Eq. 3.9) becomes
Y (t) = E∞ +
N∑
i=1
Eie−
t
αT τi (3.30)
The shift factor (αT ) can be obtained by Williams, Landel, and Ferry [66], which is accepted
for temperatures above the glass transition temperature Tg or by Arrhenius form [67] for
temperatures below the Tg. However, the bending properties at forming temperature are
significantly decreased due to a reduction in viscosity of uncured prepreg plies. Therefore,
the shift factors for each temperature respect to a chosen reference temperature can be
determined by [68]
αT =η(T )
η(Tref )(3.31)
where η(T ) and η(Tref ) are the steady-state viscosity at temperature T and reference
temperature Tref , respectively. The variation of viscosity with temperature in prepreg
sample was investigated by performing rheological tests using a MCR 500 Rheometer (see
Ref. [16]). Note that this shift factor will be applied in the relaxation modulus equation (Eq.
3.30), during calculation of bending moment and bending stiffness at processing temperature
using Eqs. (3.11) and (3.12). A MATLAB program was written for these equations in order
to facilitate the calculation of bending stiffness at given forming temperatures and rates.
60

3.4 Experimental verification
In this section, an experimental study for bending behavior of prepreg at forming con-
ditions is carried out in order to verify the results obtained from the theoretical model.
The experimental approach and the materials used are briefly presented below, see [56] for
further details.
3.4.1 Materials and test setup
The out-of-autoclave (OOA) prepreg chosen for this study consist of a 5-harness (5HS)
satin weave (6 K carbon fiber tows) impregnated with an epoxy resin (Cycom 5320). The
fabric’s areal weight is 380 g/m2 and the resin content is 36% by weight. The measured
thickness of uncured one-ply is approximately 0.55 mm.
In the proposed test, the sample is clamped vertically (vertical cantilever), while deflec-
tion shape and applied load are controlled by a linear actuator and a miniature-load cell,
respectively, see Figure 3.5. Direct commands and change settings (such as required travel
displacements, speeds, or current position) can be sent via the controller connected to the
actuator, while the force required to achieve tip displacement is subsequently recorded by
the load cell software. The temperature throughout the sample is monitored by an infrared
camera (FLIR) to ensure uniform heating during the elevated temperature tests (using a
non-contact radiant heater). The rate-dependent effect can be measured by adjusting the
testing speed using the actuator’s controller.
61
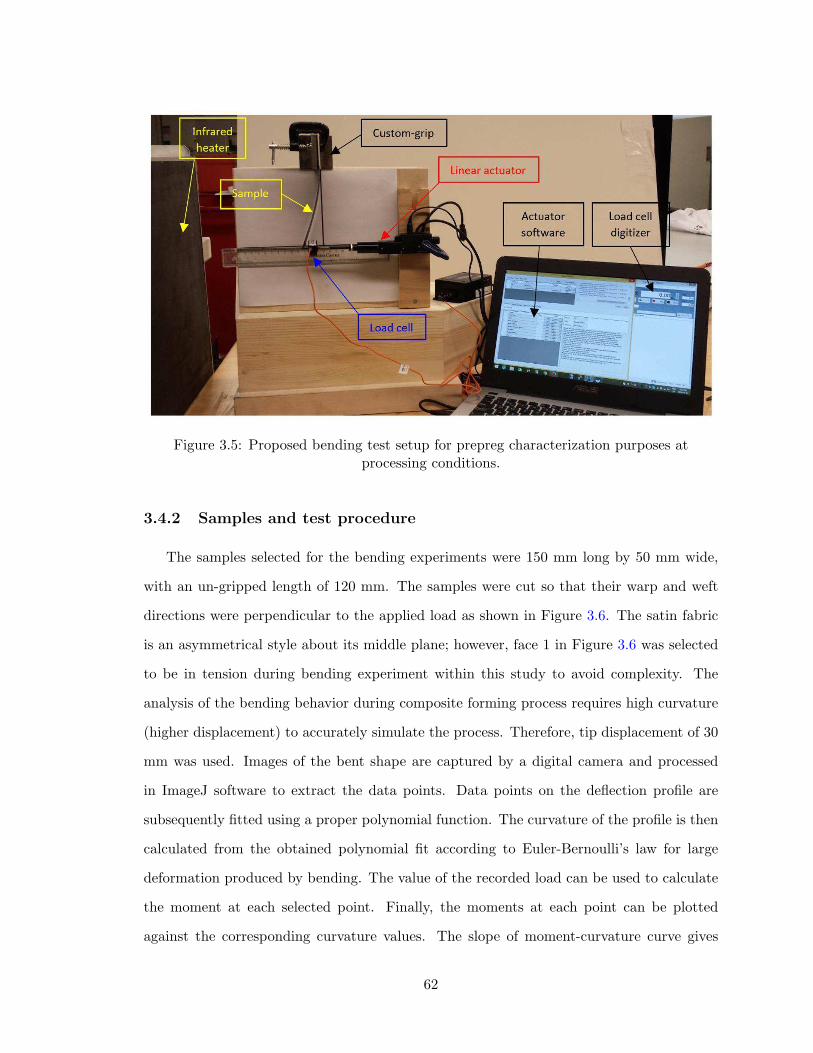
Figure 3.5: Proposed bending test setup for prepreg characterization purposes atprocessing conditions.
3.4.2 Samples and test procedure
The samples selected for the bending experiments were 150 mm long by 50 mm wide,
with an un-gripped length of 120 mm. The samples were cut so that their warp and weft
directions were perpendicular to the applied load as shown in Figure 3.6. The satin fabric
is an asymmetrical style about its middle plane; however, face 1 in Figure 3.6 was selected
to be in tension during bending experiment within this study to avoid complexity. The
analysis of the bending behavior during composite forming process requires high curvature
(higher displacement) to accurately simulate the process. Therefore, tip displacement of 30
mm was used. Images of the bent shape are captured by a digital camera and processed
in ImageJ software to extract the data points. Data points on the deflection profile are
subsequently fitted using a proper polynomial function. The curvature of the profile is then
calculated from the obtained polynomial fit according to Euler-Bernoulli’s law for large
deformation produced by bending. The value of the recorded load can be used to calculate
the moment at each selected point. Finally, the moments at each point can be plotted
against the corresponding curvature values. The slope of moment-curvature curve gives
62
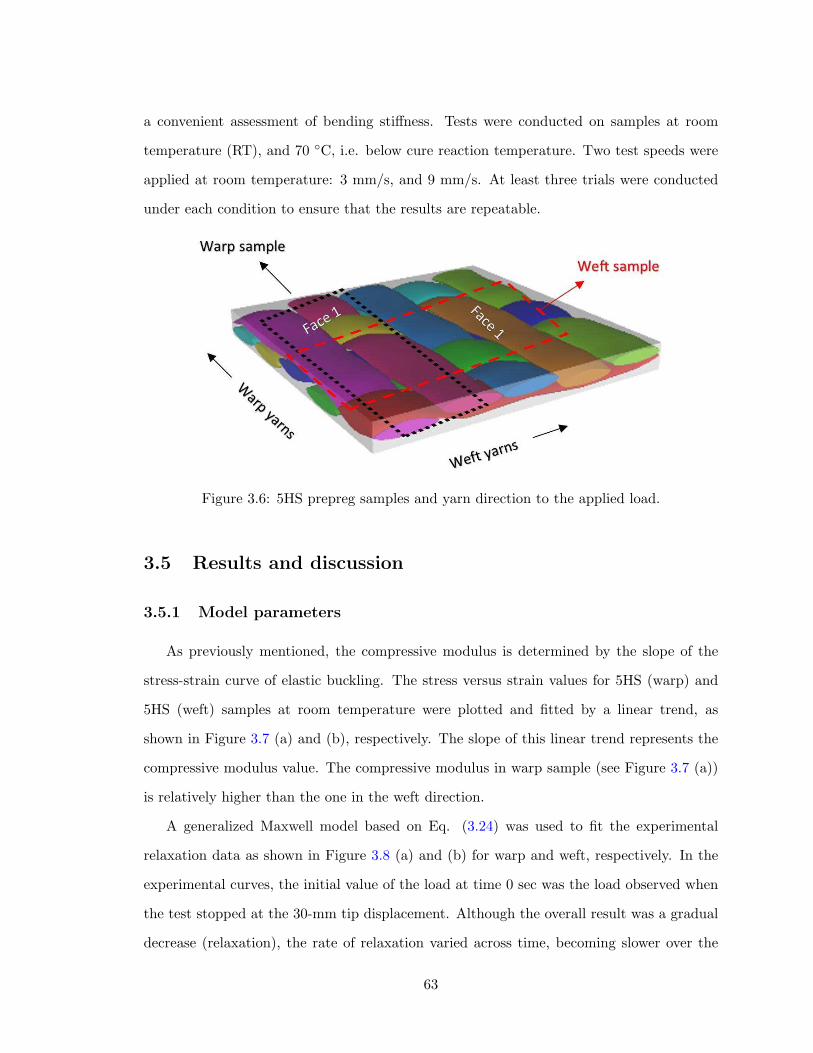
a convenient assessment of bending stiffness. Tests were conducted on samples at room
temperature (RT), and 70 ◦C, i.e. below cure reaction temperature. Two test speeds were
applied at room temperature: 3 mm/s, and 9 mm/s. At least three trials were conducted
under each condition to ensure that the results are repeatable.
Figure 3.6: 5HS prepreg samples and yarn direction to the applied load.
3.5 Results and discussion
3.5.1 Model parameters
As previously mentioned, the compressive modulus is determined by the slope of the
stress-strain curve of elastic buckling. The stress versus strain values for 5HS (warp) and
5HS (weft) samples at room temperature were plotted and fitted by a linear trend, as
shown in Figure 3.7 (a) and (b), respectively. The slope of this linear trend represents the
compressive modulus value. The compressive modulus in warp sample (see Figure 3.7 (a))
is relatively higher than the one in the weft direction.
A generalized Maxwell model based on Eq. (3.24) was used to fit the experimental
relaxation data as shown in Figure 3.8 (a) and (b) for warp and weft, respectively. In the
experimental curves, the initial value of the load at time 0 sec was the load observed when
the test stopped at the 30-mm tip displacement. Although the overall result was a gradual
decrease (relaxation), the rate of relaxation varied across time, becoming slower over the
63
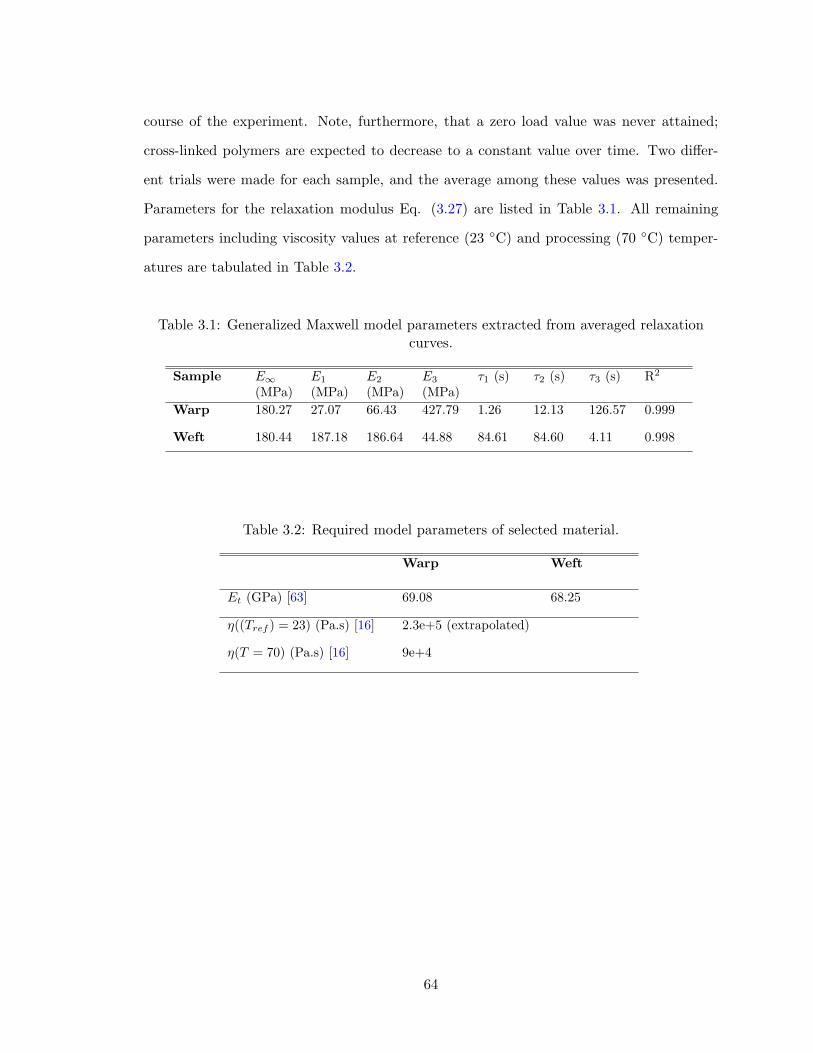
course of the experiment. Note, furthermore, that a zero load value was never attained;
cross-linked polymers are expected to decrease to a constant value over time. Two differ-
ent trials were made for each sample, and the average among these values was presented.
Parameters for the relaxation modulus Eq. (3.27) are listed in Table 3.1. All remaining
parameters including viscosity values at reference (23 ◦C) and processing (70 ◦C) temper-
atures are tabulated in Table 3.2.
Table 3.1: Generalized Maxwell model parameters extracted from averaged relaxationcurves.
Sample E∞
(MPa)E1
(MPa)E2
(MPa)E3
(MPa)τ1 (s) τ2 (s) τ3 (s) R2
Warp 180.27 27.07 66.43 427.79 1.26 12.13 126.57 0.999
Weft 180.44 187.18 186.64 44.88 84.61 84.60 4.11 0.998
Table 3.2: Required model parameters of selected material.
Warp Weft
Et (GPa) [63] 69.08 68.25
η((Tref ) = 23) (Pa.s) [16] 2.3e+5 (extrapolated)
η(T = 70) (Pa.s) [16] 9e+4
64
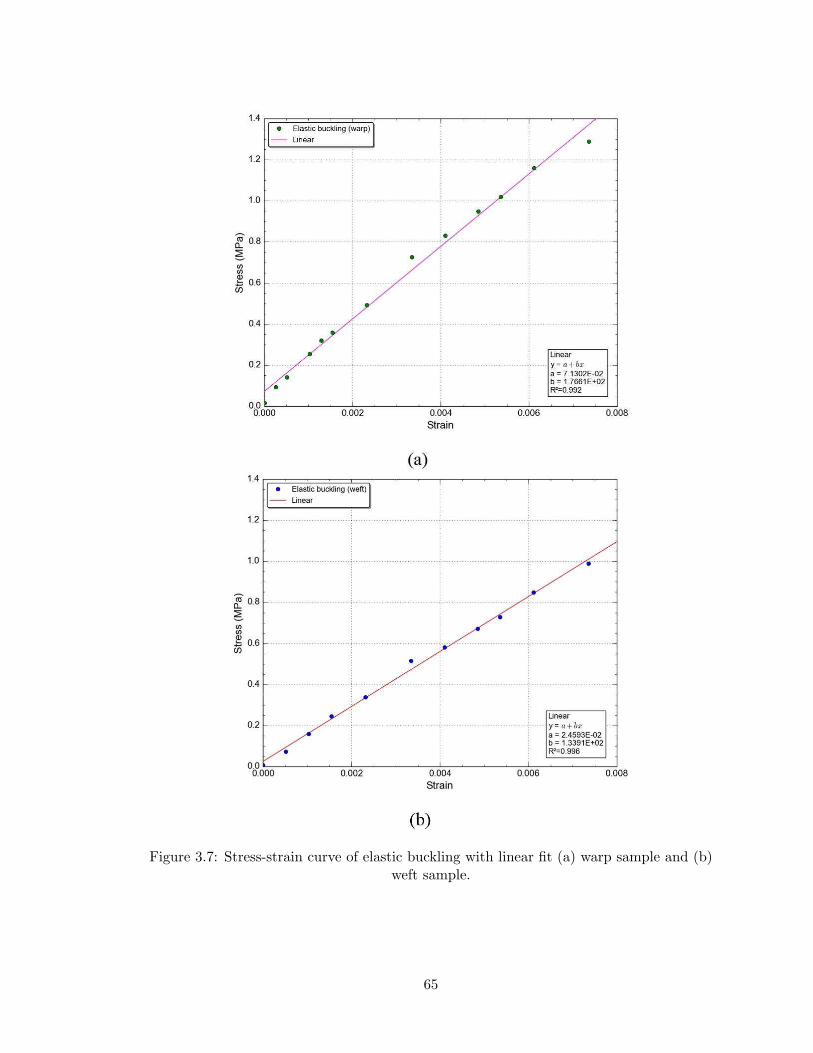
Figure 3.7: Stress-strain curve of elastic buckling with linear fit (a) warp sample and (b)weft sample.
65

Figure 3.8: Comparison between relaxation tests and generalized Maxwell model (a) warpsample and (b) weft sample.
66
3.5.2 Experimental results in comparison with proposed model
3.5.2.1 Warp vs. weft samples
Model predications and experimental results of bending moment with the parameters
from Table 3.1 and 3.2 for both warp and weft samples tested at room temperature with a
speed of 3 mm/s, are given in Figure 3.9 (a) and (b), respectively. Recall that the testing
time was calculated according to Eq. (3.26). The experimental results in Figure 3.9 (a) and
(b) show a relatively nonlinear relationship between the bending moment and curvature.
This is due to the utilization of a second-order nonlinear differential equation, based on
Euler-Bernoulli’s law for large deformation, during curvature calculation as long as the slope
of the deflection curve is significant [50]. Note that describing the beam’s curvature using
the second derivative gives a linear relationship between the bending moment and curvature;
however, this may yield a calculation error if a forming simulation is the objective. The
obtained polynomial fit is a third-order equation for all samples tested up to a 30-mm tip
displacement. A slight difference in the curvature values among the tested samples was
observed, while the load required to achieve the same tip displacement for warp and weft
samples was totally different. The experimental results show that the bending moment
in the warp direction is approximately 20% higher than the bending moment in the weft
direction. This is because the warp sample has a lower number of crimps.
According to Figure 3.9 (a) and (b), the predicted bending moments using Eq. (3.11)
is in a good agreement with the experimental results, especially at higher curvature values.
The trends of predicted curves demonstrate a linear relationship between moment and
curvature that is related to the linear elastic and viscoelastic assumptions outlined in Section
3.3. Table 3.3 showed minor error percentages between the experimental bending stiffness
value (slope) and the prediction value by means of Eq. (3.12) for both warp and weft
samples. This discrepancy is attributed to the fact that the bending behavior of woven
fabric structure is more complex due to the inherent undulation between yarns. At the
same time, the proposed model is based on a single prepreg yarn; however, it can predict
an acceptable value of bending stiffness for woven fabric prepregs to be the first input in
67
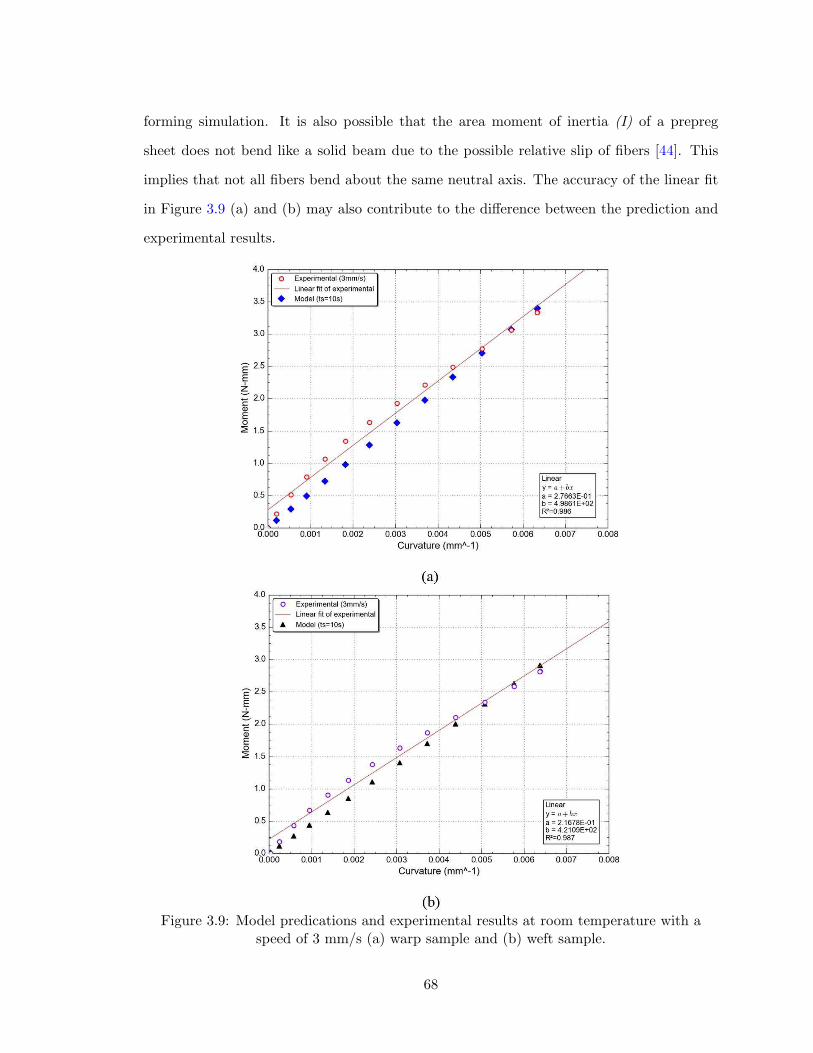
forming simulation. It is also possible that the area moment of inertia (I) of a prepreg
sheet does not bend like a solid beam due to the possible relative slip of fibers [44]. This
implies that not all fibers bend about the same neutral axis. The accuracy of the linear fit
in Figure 3.9 (a) and (b) may also contribute to the difference between the prediction and
experimental results.
Figure 3.9: Model predications and experimental results at room temperature with aspeed of 3 mm/s (a) warp sample and (b) weft sample.
68
3.5.2.2 Rate–Temperature dependencies
Processing temperature and forming rate are known to be important parameters during
the forming of prepreg materials. For simplicity, only warp-direction sample results are
presented in this section. The experiments reveal that bending behavior is rate dependent
because of the viscoelastic behavior of the prepreg. Figure 3.10 shows that higher rates
resulted in a higher load requirement in order to bend the sample to the desired tip dis-
placement (30 mm). Over a rate increase from 3 to 9 mm/sec as shown in Figure 3.9 (a) and
Figure 3.10 respectively, the maximum bending moment increased by approximately 16%.
Figure 3.10 shows the corresponding predicted bending moment with a testing time of 3.33
sec. As seen, Eq. (3.11) with different testing time that corresponds to the chosen rate can
reasonably capture the trend of the rate dependence of selected materials. Moreover, it can
be seen that decreasing the testing time, ts, increases the bending stiffness (see Table 3.3),
which was also observed during the bending experiment. However, the increase in absolute
values is relatively small when compared with the increase in experimental value.
A 2.53% error between predicted bending stiffness and the experimental value that tested
with a rate of 9 mm/sec was observed (see Table 3.3). Hence, utilization of testing time
approach respect to the reference rate gives confidence to the proposed model to predict a
viscoelastic bending stiffness at any given rates without performing extensive experiments
for relaxation test at the desired rates. It is worth noting that the time used in the proposed
model could be related to the forming experiment time as any parts are formed at certain
rates. This finding needs further investigation, particularly at different forming rates during
prepreg forming simulation.
69
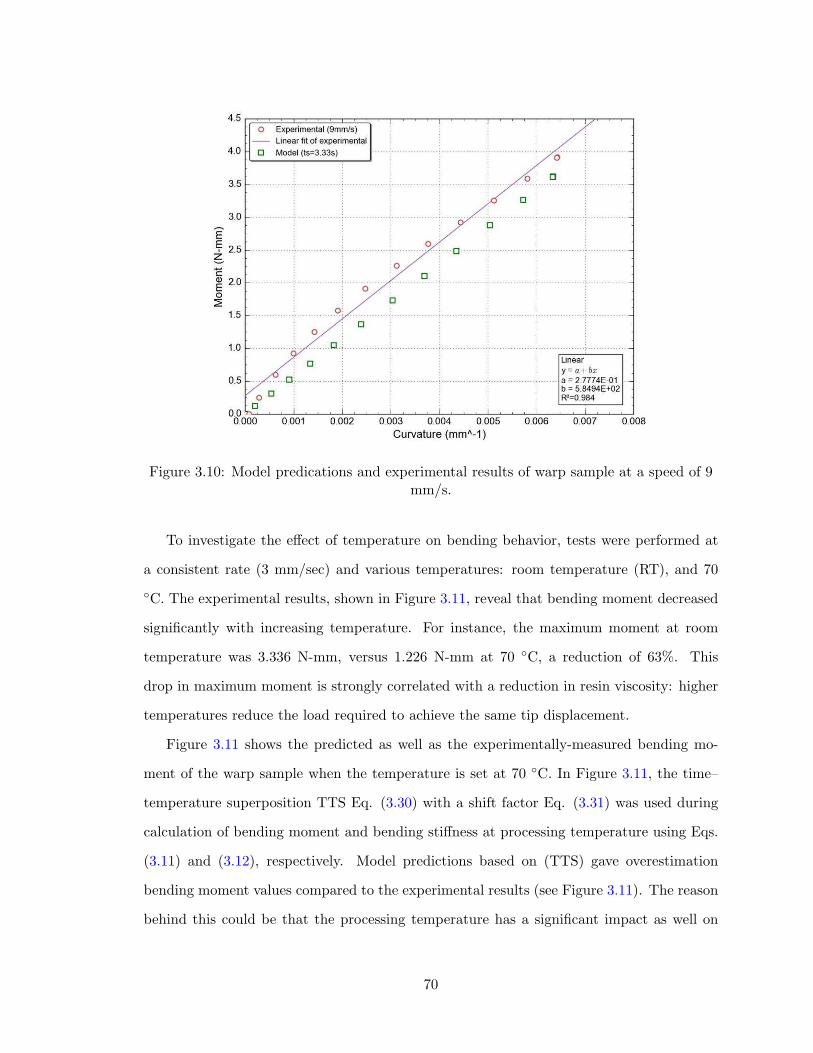
Figure 3.10: Model predications and experimental results of warp sample at a speed of 9mm/s.
To investigate the effect of temperature on bending behavior, tests were performed at
a consistent rate (3 mm/sec) and various temperatures: room temperature (RT), and 70
◦C. The experimental results, shown in Figure 3.11, reveal that bending moment decreased
significantly with increasing temperature. For instance, the maximum moment at room
temperature was 3.336 N-mm, versus 1.226 N-mm at 70 ◦C, a reduction of 63%. This
drop in maximum moment is strongly correlated with a reduction in resin viscosity: higher
temperatures reduce the load required to achieve the same tip displacement.
Figure 3.11 shows the predicted as well as the experimentally-measured bending mo-
ment of the warp sample when the temperature is set at 70 ◦C. In Figure 3.11, the time–
temperature superposition TTS Eq. (3.30) with a shift factor Eq. (3.31) was used during
calculation of bending moment and bending stiffness at processing temperature using Eqs.
(3.11) and (3.12), respectively. Model predictions based on (TTS) gave overestimation
bending moment values compared to the experimental results (see Figure 3.11). The reason
behind this could be that the processing temperature has a significant impact as well on
70

other material parameters such as compressive and tensile moduli. Moreover, the time–
temperature superposition (TTS) may not well-applicable for uncured prepreg materials as
the master curves used to be driven from cured sample during rheological tests. However,
using the same shift factor Eq. (3.31) in the final value of relaxation modulus at reference
temperature as well as in compressive and tensile moduli showed a good agreement between
experimental and model as illustrated with purple rhombuses in Figure 3.11. A comparison
between bending stiffness values are shown in Table 3.3 for both experimental and shifted
values. These findings suggest that an investigation of the viscoelastic behavior at different
temperatures should be compared with the shifted value obtained from this study. Note
that the viscosities used in Eq. (3.31) are the viscosity of selected prepreg sample not the
neat resin, reported in an earlier study [16]. Moreover, the proposed setup was found to
allow for adequate control of testing rates as well as processing temperatures within the
range of thermosetting resin. The model and experimental results showed that the bending
stiffness values are sensitive to the applied forming conditions such as rates and temper-
atures. However, the temperature influence on bending outcomes tends to be more than
the rate effect for this materials. Therefore, in order to improve the forming simulation to
predict the wrinkling, bending behavior at these conditions must be correctly represented
in the finite element simulation.
Table 3.3: Results of predicted and experimental bending stiffness at selected testconditions.
Sample Tipdisplacement(mm)
Testingtemperature(◦C)
Testingrate(mm/s)
BendingstiffnessBs(N-mm2)Experimental Model
(Eq.(3.12))Error%
Warp 30 RT 3 498.61 535.83 6.94
Weft 30 RT 3 421.09 455.81 7.61
Warp 30 RT 9 584.94 570.46 2.53
Warp 30 70 3 176.19 210.12 (shifted) 16.14
71
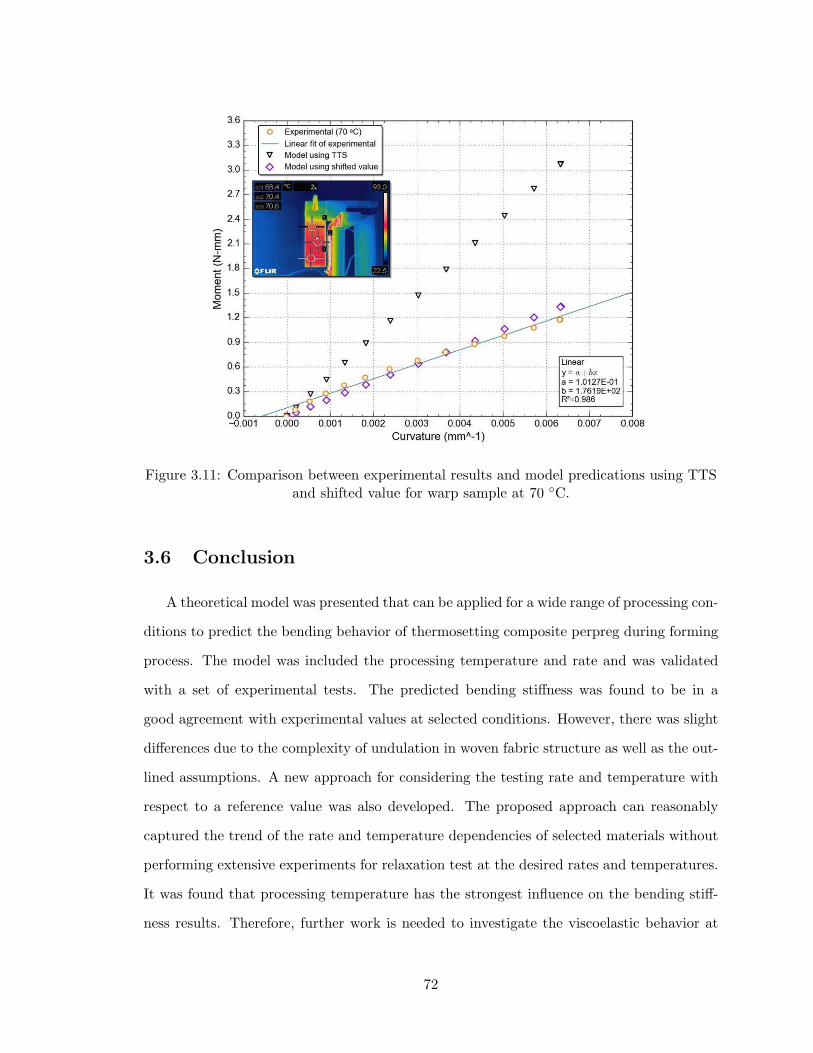
Figure 3.11: Comparison between experimental results and model predications using TTSand shifted value for warp sample at 70 ◦C.
3.6 Conclusion
A theoretical model was presented that can be applied for a wide range of processing con-
ditions to predict the bending behavior of thermosetting composite perpreg during forming
process. The model was included the processing temperature and rate and was validated
with a set of experimental tests. The predicted bending stiffness was found to be in a
good agreement with experimental values at selected conditions. However, there was slight
differences due to the complexity of undulation in woven fabric structure as well as the out-
lined assumptions. A new approach for considering the testing rate and temperature with
respect to a reference value was also developed. The proposed approach can reasonably
captured the trend of the rate and temperature dependencies of selected materials without
performing extensive experiments for relaxation test at the desired rates and temperatures.
It was found that processing temperature has the strongest influence on the bending stiff-
ness results. Therefore, further work is needed to investigate the viscoelastic behavior at
72

different temperatures in order to compare with the shifted value presented in the current
study. Overall, the bending properties obtained by the proposed model can be used as
an initial input in finite element model which reduces the effort required by experimental
investigations.
73

Chapter 4
Bending behavior of multilayered textile com-
posite prepregs: Experiment and finite ele-
ment modeling∗
Abstract
An accurate model and assessment of out-of-plane bending properties can improve the form-
ing predictions of multilayered textile prepregs using a suitable modeling technique. This
paper aims to investigate the bending properties of multilayered textile thermosetting com-
posite prepregs under conditions relevant to the forming process. A finite element model
based on a viscoelastic approach has been developed to predict the bending behavior of
different stacking sequences at different processing parameters, including temperature and
rate. The effect of stacking sequences on out-of-plane bending deformation was studied
experimentally and numerically through the developed modeling methodology. Further-
more, the paper analyzes the feasibility of using a viscoelastic material model to model
the bending behavior of rate-dependent material and its application in forming simulation.
A comparison between elastic and viscoelastic material models showed the importance of
considering the rate dependency to describe the bending behavior of prepreg materials. The
experimental and numerical results show that the bending properties strongly depend on
the fabric lay-up inside multiple stacked plies. Bending and friction properties were also
found to significantly influence the occurrence of wrinkles during the forming simulation.
∗Reproduced from: Hassan Alshahrani, Mehdi Hojjati. Bending behavior of multilayeredtextile composite prepregs: Experiment and finite element modeling. Materials & Design,124 (2017), pp. 211–224. http://dx.doi.org/10.1016/j.matdes.2017.03.077
74
4.1 Introduction
Composite materials can be produced through an assortment of manufacturing tech-
niques. Conventional composite manufacturing techniques such as hand lay-ups are labor
intensive, time–consuming, costly, and less productive. Moreover, increased demand for
many modern structures together with an increase in their size and complexity showed
the need for fast, and cost-effective manufacturing alternatives. Automated technologies
such as Automated Tape Laying (ATL) or Automated Fiber Placement (AFP) offer great
promise to meet the growing need for composite materials in the aerospace and automotive
industries, mainly due to their short manufacturing times and resulting lower costs [33].
However, to produce high-complexity and high-volume output, a forming step associated
with automated machines is required. This involves automated machines laying down flat
laminates and then transforming them into three-dimensional shapes by forming processes
using the application of heat and pressure.
Various deformation mechanisms come into play during the process of forming composite
prepregs into a desired shape, including intra-ply shear, inter-ply friction, and out-of-plane
bending [6]. Haanappel et al. [7] showed that the formability of a composite laminate is
determined by a delicate balance between these basic deformation mechanisms. In order
to accurately predict defects such as wrinkling that may arise during composite material
forming processes, out-of-plane bending behavior must be incorporated into the composite
forming model [11,24,29,35,69]. Therefore, the bending properties of the prepregs, including
their temperature and rate dependencies, must be known and properly represented in the
finite element (FE) model to achieve useful simulation results. Since this cannot be achieved
using the membrane approaches [70–72] that are common in textile sheet forming simula-
tions, it is necessary to adopt an alternative modeling strategy. Moreover, prepreg sheets
are inherently much more flexible than continuous materials; thus, using a conventional
shell element in forming simulation is no longer applicable because the bending stiffness is
derived from in-plane material response [6, 11]. Some models are presented in the literat-
ure, where bending behavior is de–coupled from in-plane by using specialized shell element
75
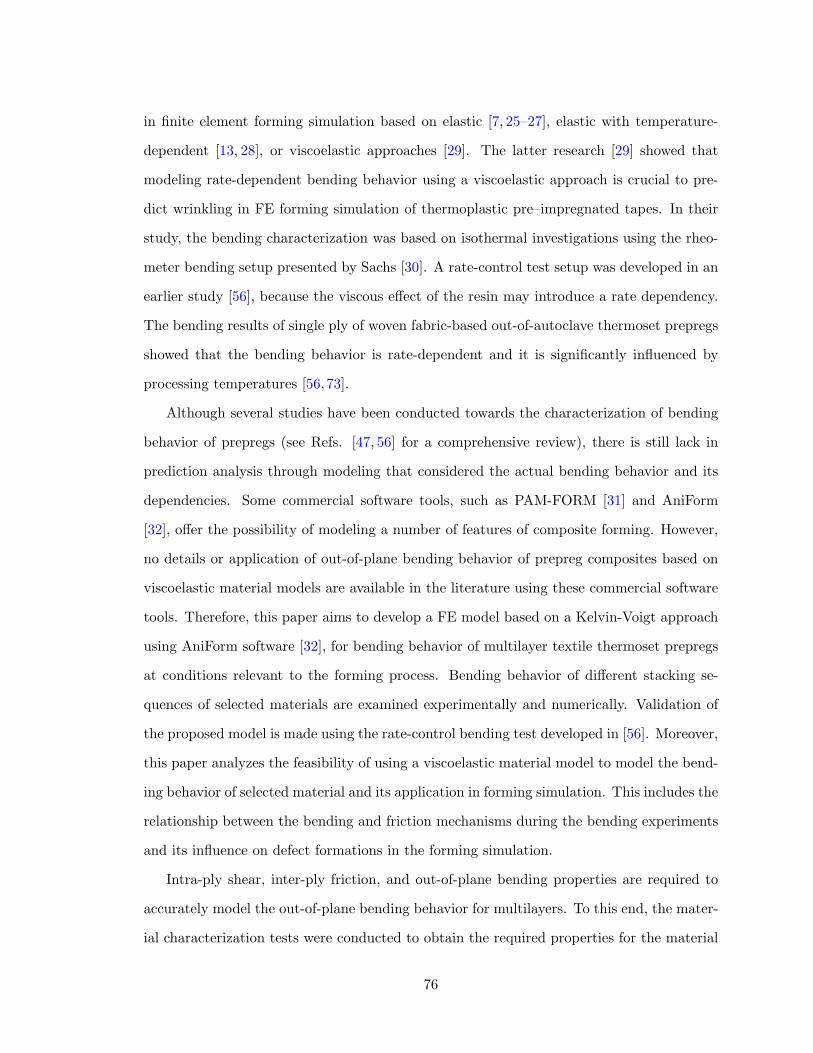
in finite element forming simulation based on elastic [7, 25–27], elastic with temperature-
dependent [13, 28], or viscoelastic approaches [29]. The latter research [29] showed that
modeling rate-dependent bending behavior using a viscoelastic approach is crucial to pre-
dict wrinkling in FE forming simulation of thermoplastic pre–impregnated tapes. In their
study, the bending characterization was based on isothermal investigations using the rheo-
meter bending setup presented by Sachs [30]. A rate-control test setup was developed in an
earlier study [56], because the viscous effect of the resin may introduce a rate dependency.
The bending results of single ply of woven fabric-based out-of-autoclave thermoset prepregs
showed that the bending behavior is rate-dependent and it is significantly influenced by
processing temperatures [56, 73].
Although several studies have been conducted towards the characterization of bending
behavior of prepregs (see Refs. [47, 56] for a comprehensive review), there is still lack in
prediction analysis through modeling that considered the actual bending behavior and its
dependencies. Some commercial software tools, such as PAM-FORM [31] and AniForm
[32], offer the possibility of modeling a number of features of composite forming. However,
no details or application of out-of-plane bending behavior of prepreg composites based on
viscoelastic material models are available in the literature using these commercial software
tools. Therefore, this paper aims to develop a FE model based on a Kelvin-Voigt approach
using AniForm software [32], for bending behavior of multilayer textile thermoset prepregs
at conditions relevant to the forming process. Bending behavior of different stacking se-
quences of selected materials are examined experimentally and numerically. Validation of
the proposed model is made using the rate-control bending test developed in [56]. Moreover,
this paper analyzes the feasibility of using a viscoelastic material model to model the bend-
ing behavior of selected material and its application in forming simulation. This includes the
relationship between the bending and friction mechanisms during the bending experiments
and its influence on defect formations in the forming simulation.
Intra-ply shear, inter-ply friction, and out-of-plane bending properties are required to
accurately model the out-of-plane bending behavior for multilayers. To this end, the mater-
ial characterization tests were conducted to obtain the required properties for the material
76

models in the FE simulation, as described in the following section.
4.2 Characterization of material properties
4.2.1 Materials
This study tested a 5-harness (5HS) satin weave (6k carbon fiber tows) impregnated with
an epoxy resin (Cycom 5320) designed for out-of-autoclave manufacturing applications. The
fabric’s areal weight is 380 g/m2 and the resin content is 36% by weight. The measured
thickness of uncured one-ply is approximately 0.55 mm. Using out-of-autoclave (OOA)
prepreg materials in the forming processes provides a great cost savings opportunity by
allowing the use of low-cost tooling due to the lower cure temperatures.
4.2.2 Out-of-plane bending properties
An experimental study of the bending behavior of selected material at forming conditions
was carried out using a special setup allowing for investigation into rate and viscoelastic
effects. The experimental approach is concisely described below; the reader is referred to
[56] for further details.
4.2.2.1 Bending test setup and procedure
In this test setup, as shown in Figure 4.1 (a), the sample is clamped vertically (vertical
cantilever) [39], while deflection shape and applied load are controlled by a linear actu-
ator and a miniature-load cell, respectively. Direct commands and change settings (such as
required travel displacements, speeds, or current position) can be sent via the controller con-
nected to the actuator, while the force required to achieve tip displacement is subsequently
recorded by the load cell software. The temperature throughout the sample is monitored
by an infrared camera (FLIR) to ensure uniform heating during the elevated temperature
tests (using a non-contact radiant heater). The rate-dependent effect can be measured by
adjusting the testing speed using the actuator’s controller.
77
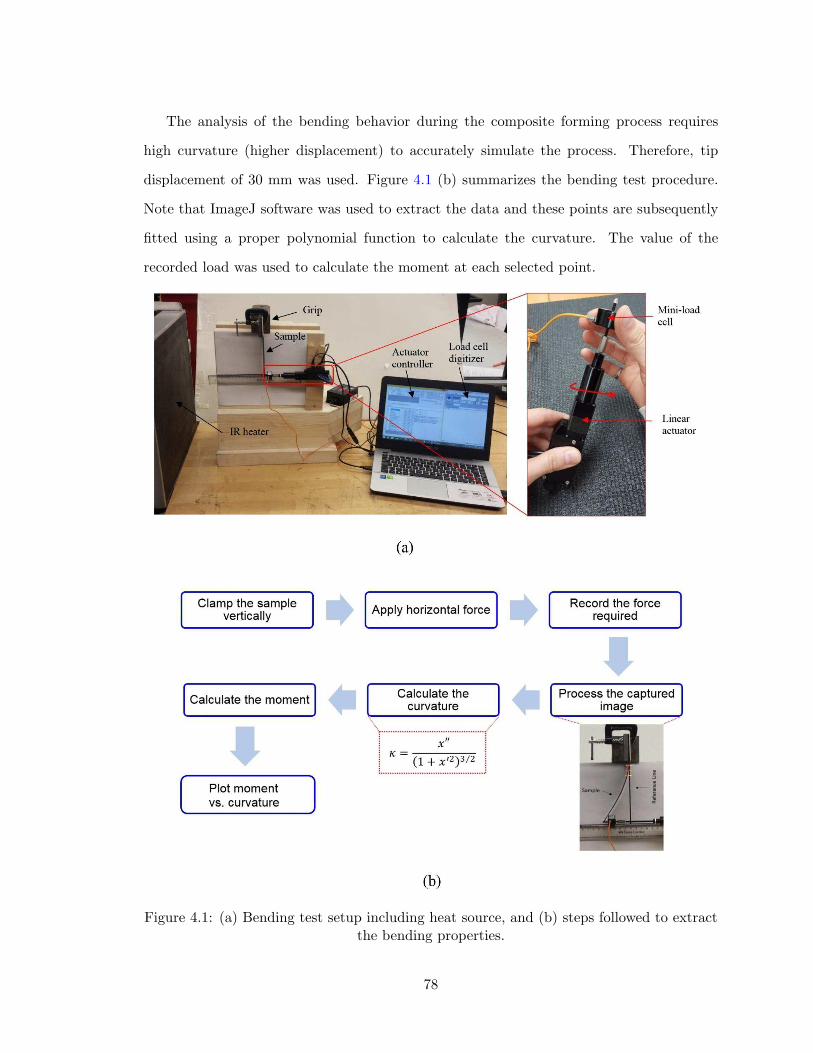
The analysis of the bending behavior during the composite forming process requires
high curvature (higher displacement) to accurately simulate the process. Therefore, tip
displacement of 30 mm was used. Figure 4.1 (b) summarizes the bending test procedure.
Note that ImageJ software was used to extract the data and these points are subsequently
fitted using a proper polynomial function to calculate the curvature. The value of the
recorded load was used to calculate the moment at each selected point.
Figure 4.1: (a) Bending test setup including heat source, and (b) steps followed to extractthe bending properties.
78
4.2.2.2 Fabric lay-up configuration
The samples selected for the bending experiments were 150 mm long by 50 mm wide,
with an ungripped length of 120 mm (see selected sample in Figure 4.2). In a 5HS-woven
fabric, 80% of the fibers on one face are in the strip-long direction, whereas 80% of the fibers
on the other face are perpendicular to that direction. Therefore, face 1 in Figure 4.2 was
selected to be in tension during the bending experiments. Three layers of textile composite
with different ply orientations, specified with respect to warp yarns as shown in Figure 4.2,
were considered. Note that the 0◦ axis was always parallel to the warp yarn direction based
on the ply 1. Prior to testing, multilayered samples were preconsolidated at 70 ◦C with
a pressure of 0.1 MPa using vacuum bagging for 30 minutes. All four stacking sequences,
shown in Figure 4.2, were tested under the conditions relevant to the forming process.
Figure 4.2: Stacking sequences of three layers of textile composite with selected samplesfor bending experiments.
79
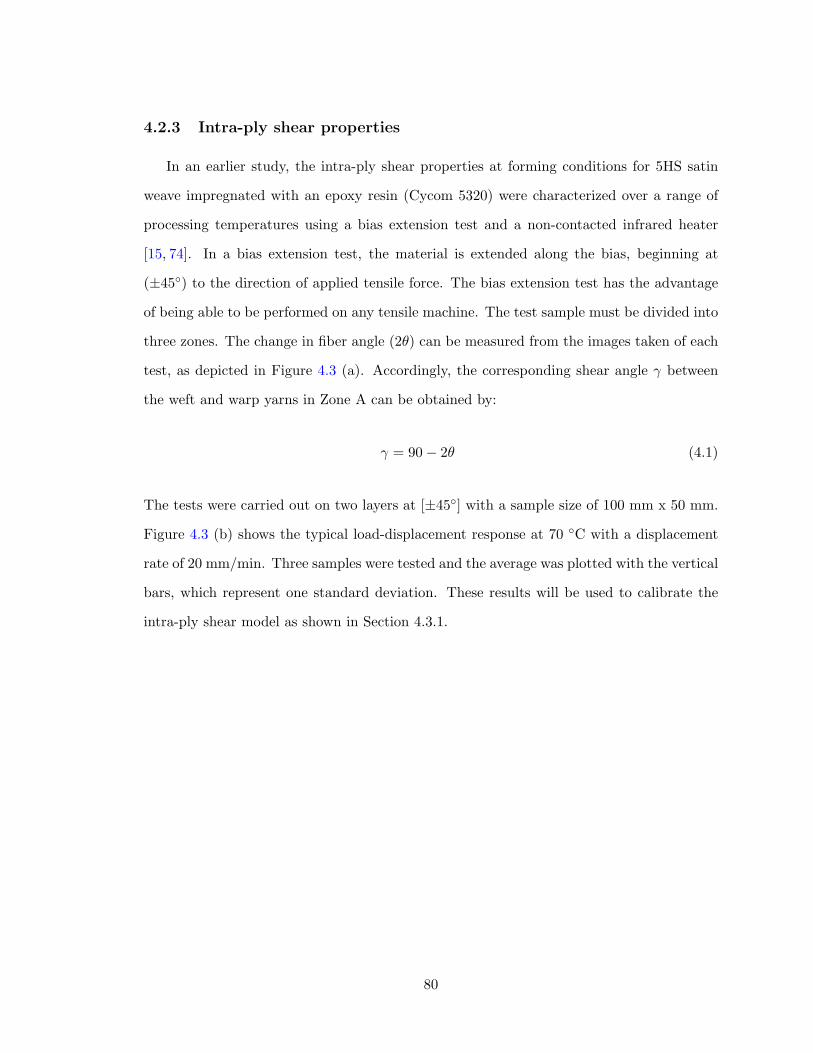
4.2.3 Intra-ply shear properties
In an earlier study, the intra-ply shear properties at forming conditions for 5HS satin
weave impregnated with an epoxy resin (Cycom 5320) were characterized over a range of
processing temperatures using a bias extension test and a non-contacted infrared heater
[15, 74]. In a bias extension test, the material is extended along the bias, beginning at
(±45◦) to the direction of applied tensile force. The bias extension test has the advantage
of being able to be performed on any tensile machine. The test sample must be divided into
three zones. The change in fiber angle (2θ) can be measured from the images taken of each
test, as depicted in Figure 4.3 (a). Accordingly, the corresponding shear angle γ between
the weft and warp yarns in Zone A can be obtained by:
γ = 90− 2θ (4.1)
The tests were carried out on two layers at [±45◦] with a sample size of 100 mm x 50 mm.
Figure 4.3 (b) shows the typical load-displacement response at 70 ◦C with a displacement
rate of 20 mm/min. Three samples were tested and the average was plotted with the vertical
bars, which represent one standard deviation. These results will be used to calibrate the
intra-ply shear model as shown in Section 4.3.1.
80
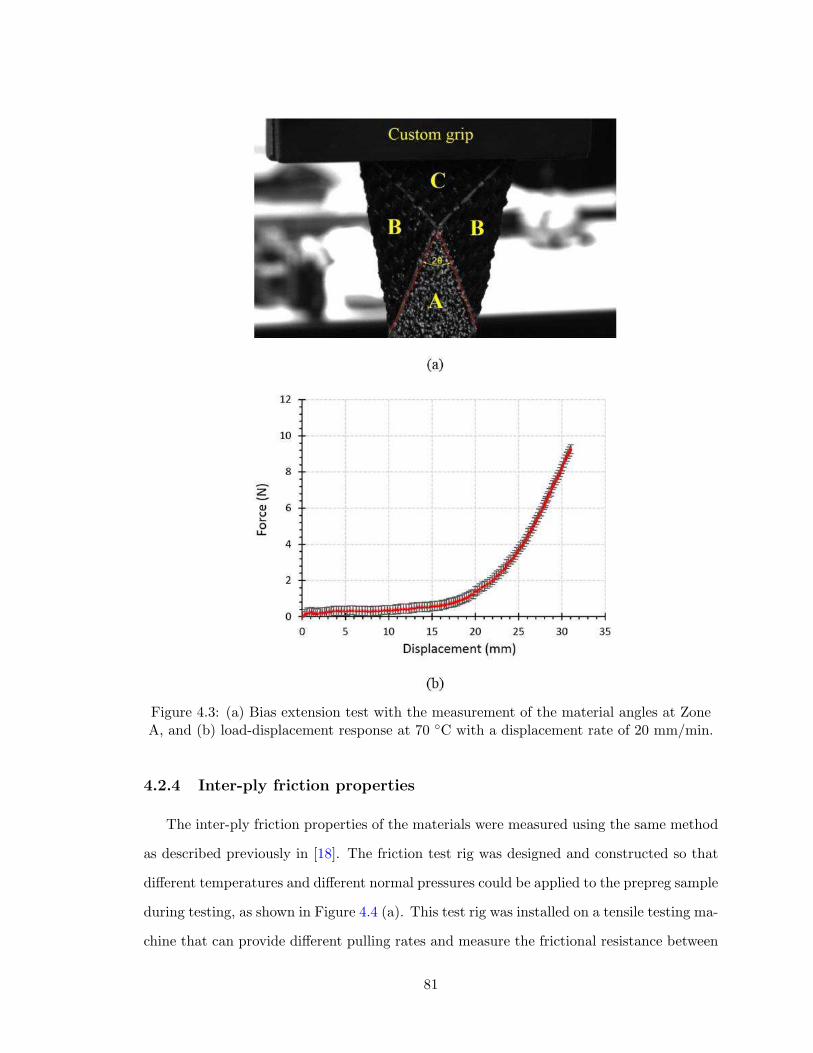
Figure 4.3: (a) Bias extension test with the measurement of the material angles at ZoneA, and (b) load-displacement response at 70 ◦C with a displacement rate of 20 mm/min.
4.2.4 Inter-ply friction properties
The inter-ply friction properties of the materials were measured using the same method
as described previously in [18]. The friction test rig was designed and constructed so that
different temperatures and different normal pressures could be applied to the prepreg sample
during testing, as shown in Figure 4.4 (a). This test rig was installed on a tensile testing ma-
chine that can provide different pulling rates and measure the frictional resistance between
81
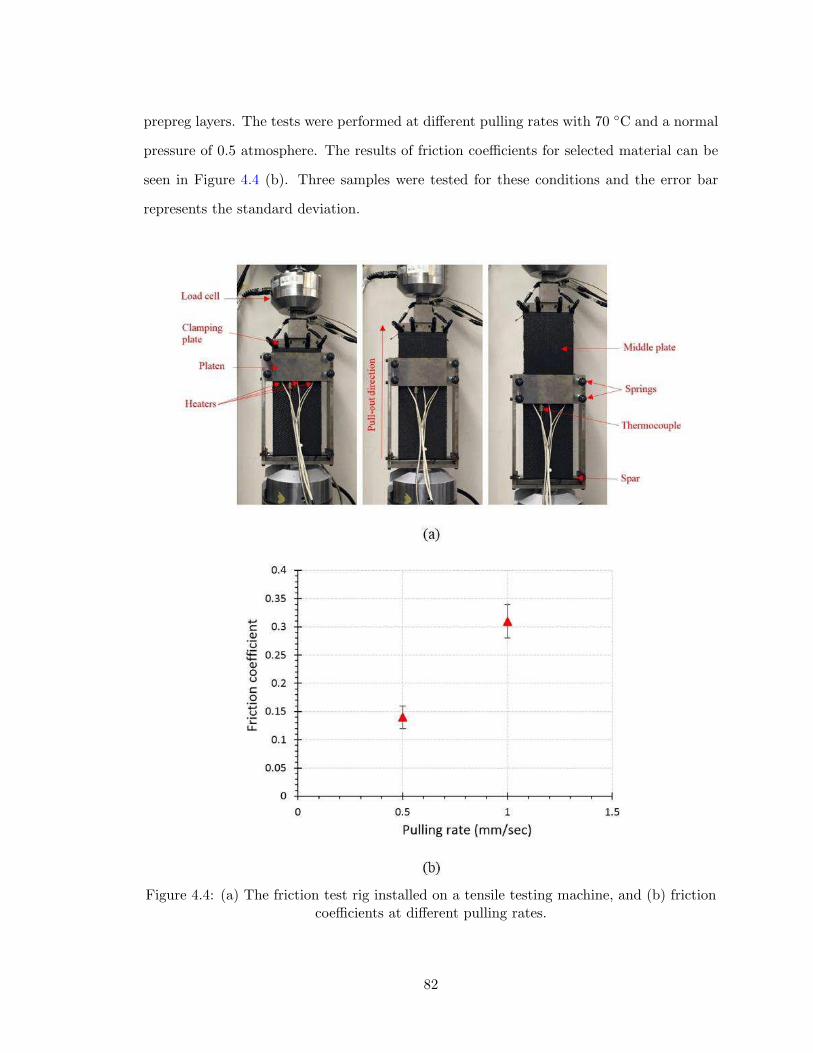
prepreg layers. The tests were performed at different pulling rates with 70 ◦C and a normal
pressure of 0.5 atmosphere. The results of friction coefficients for selected material can be
seen in Figure 4.4 (b). Three samples were tested for these conditions and the error bar
represents the standard deviation.
Figure 4.4: (a) The friction test rig installed on a tensile testing machine, and (b) frictioncoefficients at different pulling rates.
82
4.3 Finite element modeling
AniForm Finite Element software [32], which is designed for use in composite forming, is
particularly useful for predicting the behavior of anisotropy of uncured prepregs. This study
used the AniForm software to predict out-of-plane bending deformation of textile thermoset
prepregs. AniForm adopts a continuum mechanical approach solved by an implicit FE
approach: by modeling the prepreg plies as de–coupled shells allows the bending properties
to be described in continuum shell elements. An AniForm shell element is created by
combining an LTR3D membrane element with a Discrete Kirchhoff Triangle (DKT) element
using the same nodes as shown in Figure 4.5 (a). Accordingly, the resulting shell element is
able to capture realistic behavioral properties for both in- and out-of-plane materials using
different constitutive models (see Figure 4.5 (b)). Results from material characterization
procedures and the observed behavior can be used to assign proper constitutive material
models that can correctly describe the response of deformation mechanisms.
Figure 4.5: (a) AniForm shell element, and (b) the de-coupled shell approach [32].
83
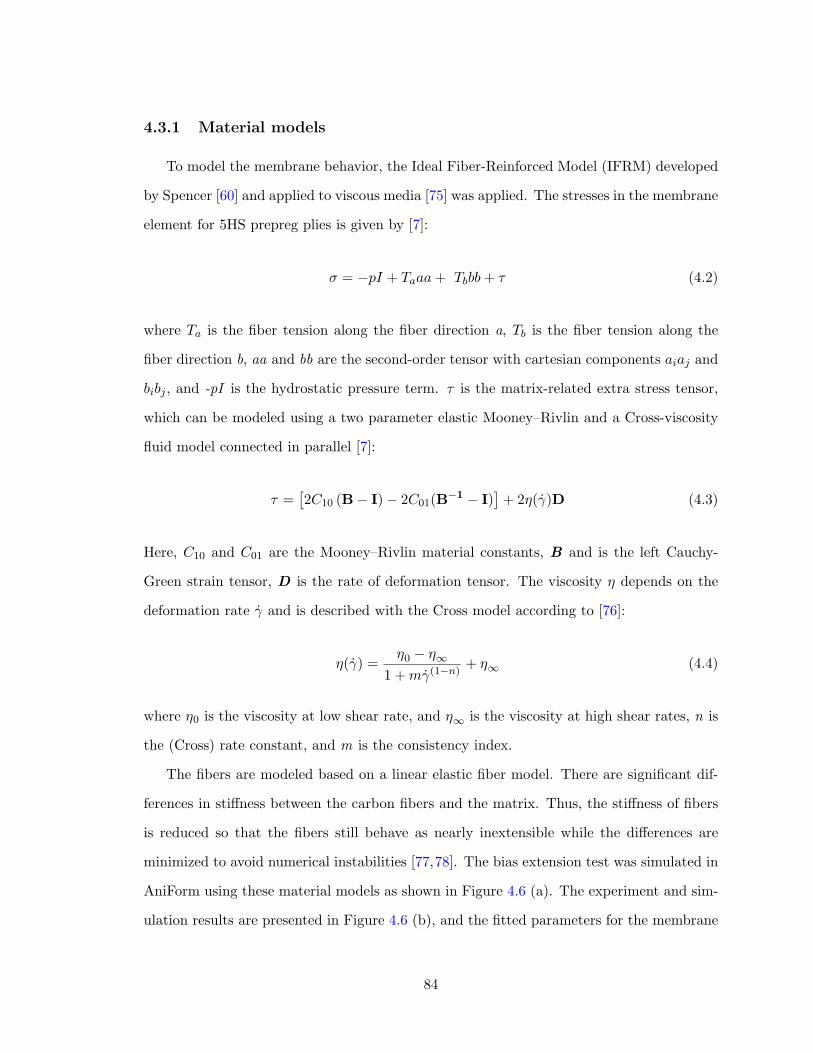
4.3.1 Material models
To model the membrane behavior, the Ideal Fiber-Reinforced Model (IFRM) developed
by Spencer [60] and applied to viscous media [75] was applied. The stresses in the membrane
element for 5HS prepreg plies is given by [7]:
σ = −pI + Taaa+ Tbbb+ τ (4.2)
where Ta is the fiber tension along the fiber direction a, Tb is the fiber tension along the
fiber direction b, aa and bb are the second-order tensor with cartesian components aiaj and
bibj , and -pI is the hydrostatic pressure term. τ is the matrix-related extra stress tensor,
which can be modeled using a two parameter elastic Mooney–Rivlin and a Cross-viscosity
fluid model connected in parallel [7]:
τ =[
2C10 (B− I)− 2C01(B−1 − I)
]
+ 2η(γ)D (4.3)
Here, C10 and C01 are the Mooney–Rivlin material constants, B and is the left Cauchy-
Green strain tensor, D is the rate of deformation tensor. The viscosity η depends on the
deformation rate γ and is described with the Cross model according to [76]:
η(γ) =η0 − η
∞
1 +mγ(1−n)+ η
∞(4.4)
where η0 is the viscosity at low shear rate, and η∞
is the viscosity at high shear rates, n is
the (Cross) rate constant, and m is the consistency index.
The fibers are modeled based on a linear elastic fiber model. There are significant dif-
ferences in stiffness between the carbon fibers and the matrix. Thus, the stiffness of fibers
is reduced so that the fibers still behave as nearly inextensible while the differences are
minimized to avoid numerical instabilities [77,78]. The bias extension test was simulated in
AniForm using these material models as shown in Figure 4.6 (a). The experiment and sim-
ulation results are presented in Figure 4.6 (b), and the fitted parameters for the membrane
84
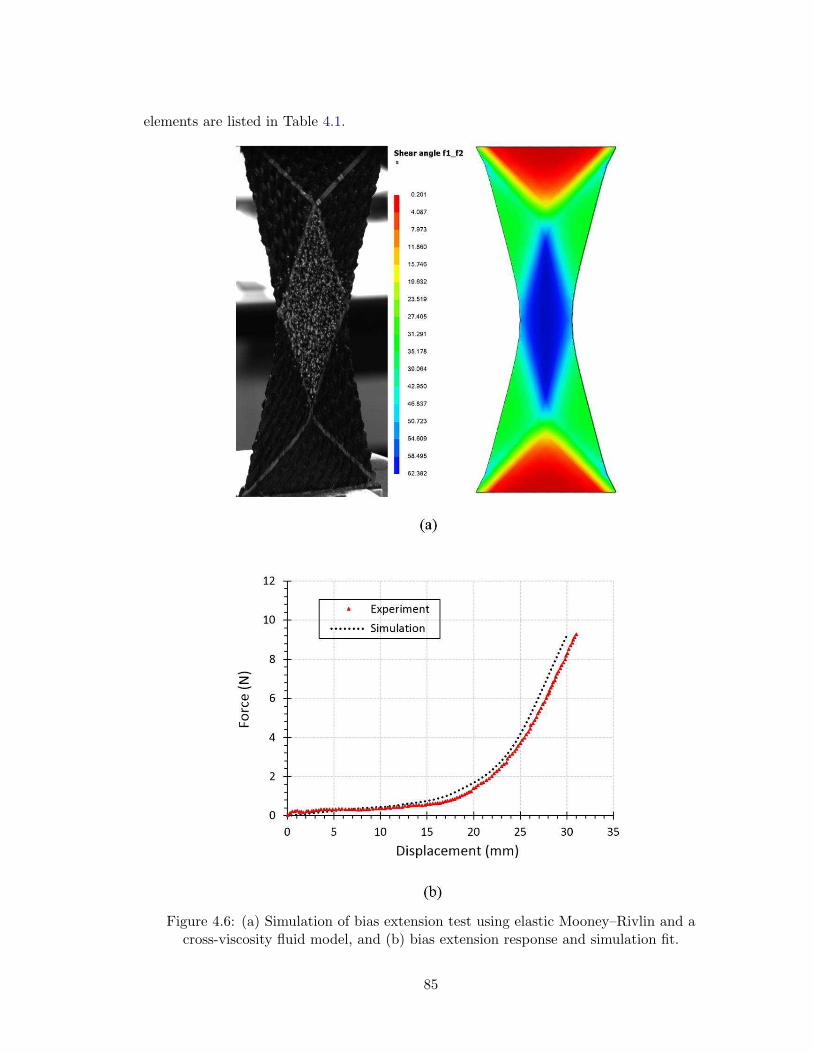
elements are listed in Table 4.1.
Figure 4.6: (a) Simulation of bias extension test using elastic Mooney–Rivlin and across-viscosity fluid model, and (b) bias extension response and simulation fit.
85
The bending characterization experiment was used to determine the initial bending
properties of one-ply, as shown in the previous section. Moreover, the ply bending stiffness
can be calculated as a function of rate and temperature using a thermo–viscoelastic model
developed in a previous study [73]. A viscoelastic approach (Kelvin–Voigt) was used to
model the out-of-plane bending behavior, which encompasses both an elastic spring and
viscous damper connected in parallel. An isotropic elastic model was used to model the
spring part, whereas the damper was modeled using a Newtonian viscous fluid model.
Table 4.2 represents constitutive models and parameter values used for out-of-plane bending
elements. Note that the input data in Table 4.2 was based on the bending experiment of
single ply at 70 ◦C and the corresponding prepreg sample viscosity according to [73] and
[16], respectively.
The inter-ply friction was modeled as a combination of Coulomb friction, viscous friction
and adhesion. These basic material models are connected in parallel generating a mixed
model (combined models) to correctly describe the interface properties. Coulomb friction
is governed by a friction coefficient independent of pressure and speed. The viscous friction
is based on the presence of fluid film between the contact surfaces. It can be defined as
τxy = ηγ (4.5)
where τxy is the in-plane surface traction, η is the viscosity, and γ is the shear rate in the
fluid film. The shear rate can be determined according to the following relation [32]:
γ =Vxy
h(4.6)
where Vxy is slip velocity and h is film thickness. Note that from the preceding equations,
the viscous friction is dependent of both speed and temperature (viscosity). The viscosity
value at processing temperatures was based on the measured neat resin viscosity of epoxy
resin (Cycom 5320) according to [79]. Besides this form of friction, a material model known
as adhesion was used to model the tacky properties between surfaces. However, the adhesive
tension was set based on the value provided by Haanappel et al. [7]. A penalty stiffness
86
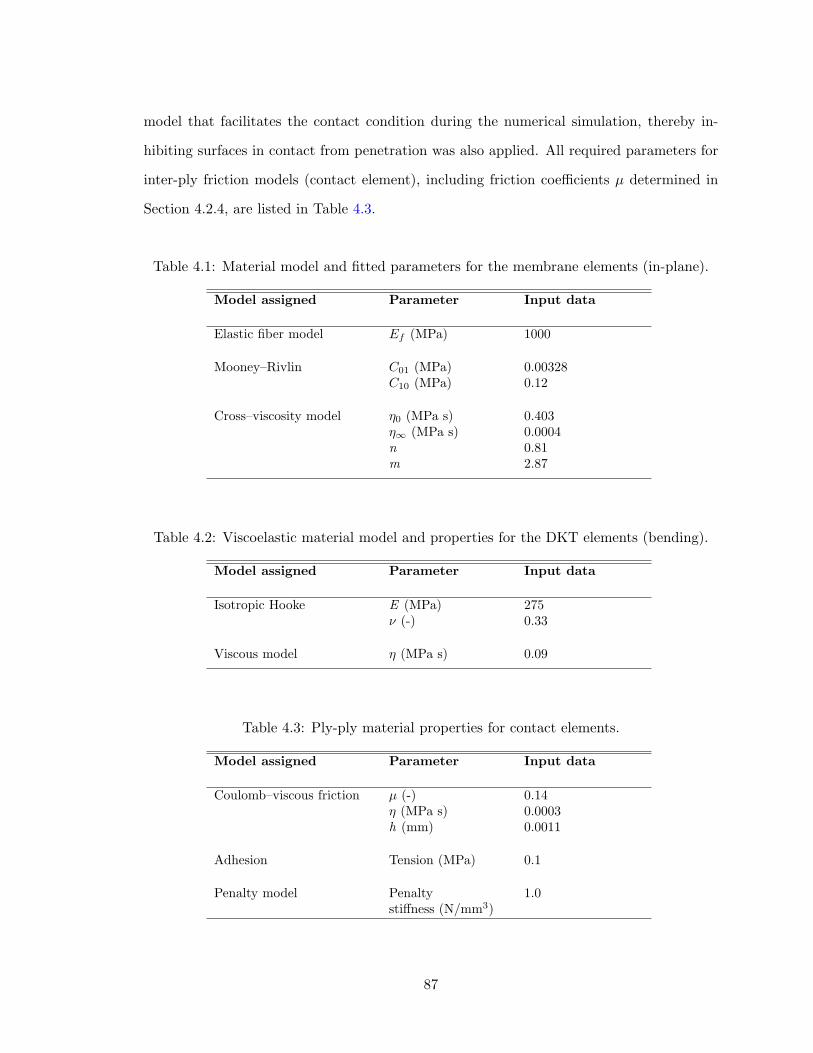
model that facilitates the contact condition during the numerical simulation, thereby in-
hibiting surfaces in contact from penetration was also applied. All required parameters for
inter-ply friction models (contact element), including friction coefficients µ determined in
Section 4.2.4, are listed in Table 4.3.
Table 4.1: Material model and fitted parameters for the membrane elements (in-plane).
Model assigned Parameter Input data
Elastic fiber model Ef (MPa) 1000
Mooney–Rivlin C01 (MPa) 0.00328C10 (MPa) 0.12
Cross–viscosity model η0 (MPa s) 0.403η∞ (MPa s) 0.0004n 0.81m 2.87
Table 4.2: Viscoelastic material model and properties for the DKT elements (bending).
Model assigned Parameter Input data
Isotropic Hooke E (MPa) 275ν (-) 0.33
Viscous model η (MPa s) 0.09
Table 4.3: Ply-ply material properties for contact elements.
Model assigned Parameter Input data
Coulomb–viscous friction µ (-) 0.14η (MPa s) 0.0003h (mm) 0.0011
Adhesion Tension (MPa) 0.1
Penalty model Penaltystiffness (N/mm3)
1.0
87
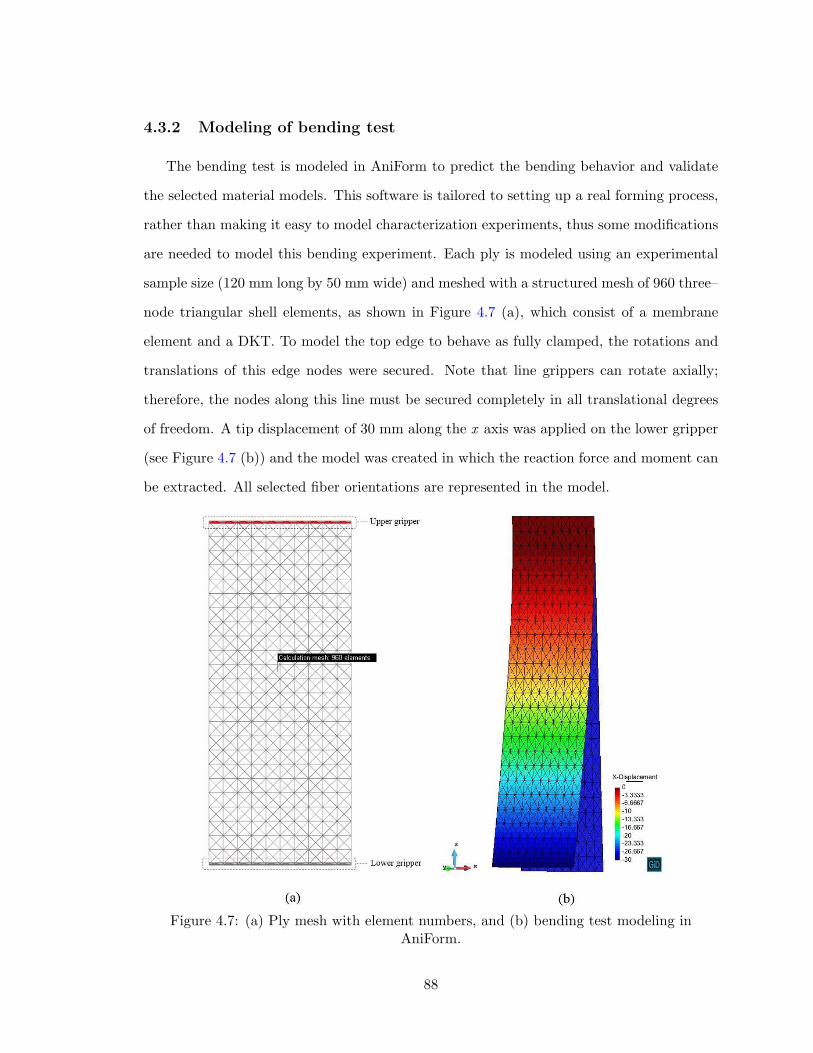
4.3.2 Modeling of bending test
The bending test is modeled in AniForm to predict the bending behavior and validate
the selected material models. This software is tailored to setting up a real forming process,
rather than making it easy to model characterization experiments, thus some modifications
are needed to model this bending experiment. Each ply is modeled using an experimental
sample size (120 mm long by 50 mm wide) and meshed with a structured mesh of 960 three–
node triangular shell elements, as shown in Figure 4.7 (a), which consist of a membrane
element and a DKT. To model the top edge to behave as fully clamped, the rotations and
translations of this edge nodes were secured. Note that line grippers can rotate axially;
therefore, the nodes along this line must be secured completely in all translational degrees
of freedom. A tip displacement of 30 mm along the x axis was applied on the lower gripper
(see Figure 4.7 (b)) and the model was created in which the reaction force and moment can
be extracted. All selected fiber orientations are represented in the model.
Figure 4.7: (a) Ply mesh with element numbers, and (b) bending test modeling inAniForm.
88
4.4 Results and discussion
Experimental tests were conducted on samples at room temperature, and 70 ◦C, i.e.
below cure reaction temperature [16]. Two test speeds were applied at room temperature–3
mm/s and 9 mm/s–to investigate the effect of testing rate. This section presents the results
from both experimental tests and numerical simulations. First, the experimental results for
selected sequences of multilayered samples are evaluated. Then, in Section 4.4.2, a numerical
outcome is compared with the experimental results by using the developed FE model with
the parameters from Tables 4.1, 4.2, and 4.3. Note that the results of multilayered samples
are presented by the stacking number (stacking 1, 2, 3, and 4) as described in Section
4.2.2.2.
4.4.1 Experimental results
The image analysis of the samples during the bending experiments shows that all stack-
ing sequences bend together with no observed separation between the plies. This is due to
the pre-consolidation process before testing and the tacky effect between layers. The test
results are based on the average of three trials conducted at each condition. Figure 4.8 (a)
shows the load required to reach a tip displacement of 30 mm for all selected stacking se-
quences at 70 ◦C, and the vertical error bars represent the standard deviation. These loads
were used to calculate the bending moment in order to generate moment versus curvature
curves, as shown in Figure 4.8 (b). As can be seen, stacking 1, [0, 90, 0] with respect to
warp direction, required the highest load to bend the sample to the desired displacement.
The results of stacking 1 were expected since the applied load was perpendicular to weft
yarns in plies 1 and 3 and warp yarns in ply 2. However, the previous findings in [56] for
single ply show that the bending stiffness is higher when the load is applied perpendicularly
to the warp yarns direction than when applied to the weft direction.
Figure 4.8 (b) also shows that rotating ply 2 and ply 3 by 45◦ and 90◦, respectively,
decreased the bending stiffness by approximately 21% compared to stacking 1. The reduc-
tion in load is attributed to middle–ply orientation (45◦), which requires the lowest load to
89
deform the sample compared to 0◦ and 90◦ orientations. However, changing the orienta-
tion of the middle–ply from 45◦ (stacking 2) to – 45◦ (stacking 3) shows different bending
stiffness responses (see Figure 4.8 (a) and (b)). A significant decrease in bending properties
was observed in stacking 4. This decrease is caused by the orientation of the second and
third plies. It is worth noting that besides the effect of fabric style and orientation, the
friction between plies plays an important role in terms of facilitating the through thickness
shear during the bending experiments at elevated temperatures. Thus, the friction also
contributes to the observed difference between tested stacking sequences. Moreover, as pre-
viously investigated in [18], the angle between the fibers and the pulling direction during
ply-ply friction experiments affects the friction resistance. The results show that frictional
resistance decreases as the angle of warp yarn changes from 0◦ to 45◦ with respect to the
pulling direction. Accordingly, the coefficient of friction decreases by approximately 22%
when the angle is set to 45◦.
Figure 4.9 (a) shows the maximum bending moment for stacking 1 at room temperat-
ure (23 ◦C) and processing temperature (70 ◦C) with a constant speed (3 mm/s). Since
matrix viscosity decreases with increasing temperature, higher temperatures are expected
to reduce load and thus reduce the effect of friction between layers. The results at elevated
temperatures from single ply [56] and multilayered samples presented in this paper have
borne out this expectation; higher temperatures do indeed result in a load reduction, and
consequently a significant decrease in bending stiffness. The effect of testing rate, which
simulates the forming rate required during the actual forming process, was investigated at
room temperature. The results are presented in Figure 4.9 (b). There is a clear correl-
ation between testing rate and the load required to bend the sample, as can be seen by
the obtained maximum bending moment values for two selected rates. This implies that a
higher testing rate results in a higher load required to bend the sample to the desired tip
displacement.
90
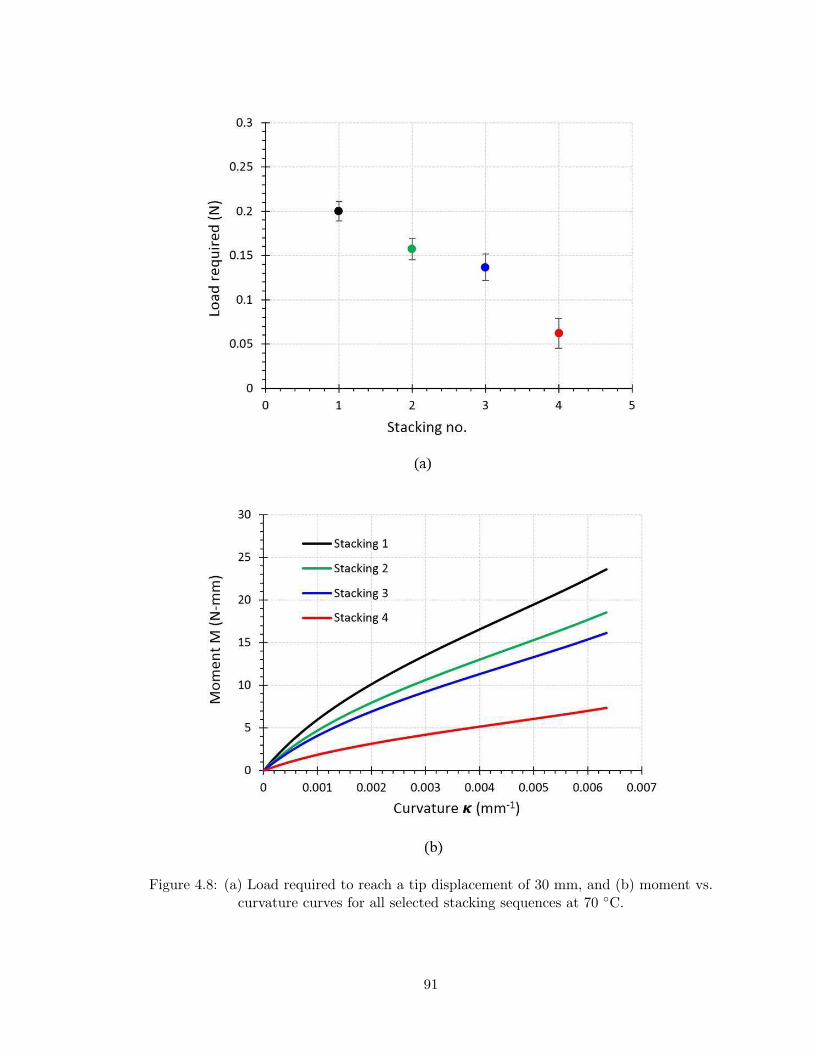
Figure 4.8: (a) Load required to reach a tip displacement of 30 mm, and (b) moment vs.curvature curves for all selected stacking sequences at 70 ◦C.
91
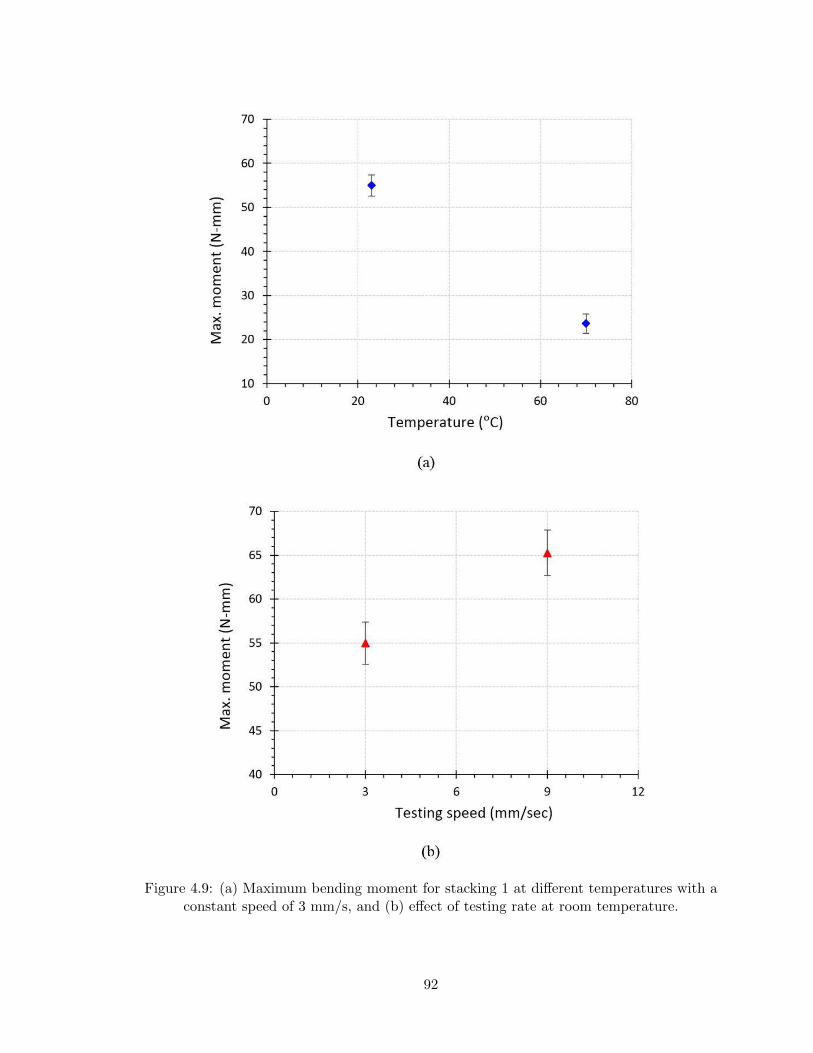
Figure 4.9: (a) Maximum bending moment for stacking 1 at different temperatures with aconstant speed of 3 mm/s, and (b) effect of testing rate at room temperature.
92

4.4.2 Numerical results with experimental verification
The simulation results are based on reaction forces and moments extracted from the
model at each selected condition. Figure 4.10 (a) shows the predicted curvature–moment
curve against the experimental measurements for stacking 1 and 4. The results from the
FE model show a good agreement with the experimental results. However, the predicted
values of stacking 4 are relatively lower than the experimental values by approximately
14%. Note the slight difference in curvature value between all tested stacking sequences;
the curvature values along the sample, shown in Figure 4.10 (a), were used to plot the present
results. Moreover, as discussed previously, the friction coefficients when the angle was set
to 45◦ to the pulling direction were used for stacking sequences 2, 3, and 4. Although
the experimental measurements show notable differences between 45◦ (stacking 2) and –
45◦ (stacking 3), Figure 4.10 (b) reveals that the reaction results from simulations for both
stacking 2 and 3 are quite similar. This similarity may be due to the lack of consideration of
the inherent undulation between yarns in woven–fabric structures. It should also be noted
that scaling of the material models of selected lay-ups for bending does not correspond to
the number of plies as in the case for in-plane models [32]. In this model, the scaling for
bending was set to 2 in the Weights setting, which was found to be more convenient to the
experimental calibration.
93

Figure 4.10: Predicted curvature–moment curve against the experimental measurementsat 70 ◦C (a) for stacking 1 and 4, and (b) for stacking 2 and 3.
94
Figure 4.11 (a) depicts the maximum bending moment (moment in the clamp) obtained
at 70 ◦C and at room temperature. As can be seen, the FE model predicts the reaction mo-
ment at the clamp with acceptable correlation for both temperatures. Further, these results
show that the predicted values at room temperature are lower than the experimental values,
unlike at 70 ◦C. This is because the model only considered bending and ply-ply properties
at room temperature, according to the obtained results in [56] and [18] respectively.
Figure 4.11 (b) shows the effect of testing rates conducted at room temperature on the
maximum bending moment. It was found that a decrease in time span in the AniForm model
can increase the reaction moment; higher rates entail lower time spans. Thus, this time in
the model should be related to the actual testing time, and ultimately to the forming time.
In this case, the testing time during the experiment was calculated as the tip displacement
over the selected testing speed. Accordingly, for a testing rate of 3 and 9 mm/s, the testing
time was 10 and 3.33 sec, respectively. The FE model can predict the bending properties
at the desired rate as long as the time span in the model is set according to the testing
time values. Therefore, the bending properties at the rate of 9 mm/s can be predicted by
using the properties obtained at 3 mm/s with a time span of 3.33 sec instead of 10 sec.
This procedure reduces the effort required for experimental investigations at different rates.
However, minor errors still exist following this procedure (see Figure 4.11 (b)). Introducing
the fiber stiffness of warp and weft yarns separately in the FE modeling approach in future
investigations will improve prediction capabilities.
95
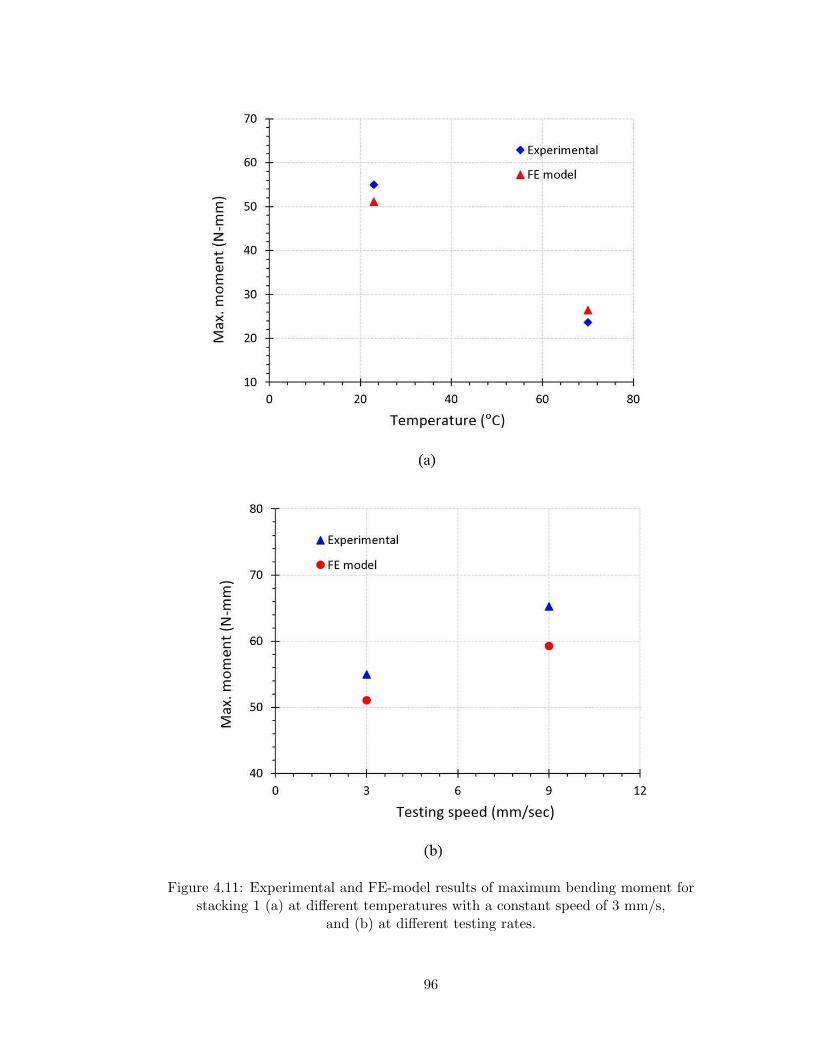
Figure 4.11: Experimental and FE-model results of maximum bending moment forstacking 1 (a) at different temperatures with a constant speed of 3 mm/s,
and (b) at different testing rates.
96
4.4.3 Influence of alteration of bending material model
The Kelvin–Voigt approach used in this study was compared to an elastic approach
in order to study the effect of the material model on the bending behavior. Stacking 1
at a temperature of 70 ◦C was modeled using an elastic bending model (Isotropic Hooke)
with parameters presented in Table 4.2. It was found that the maximum bending moment
at the clamp using the elastic model was around 33.27 N-mm. The bending moment was
overestimated compared to experimental data (23.62 N-mm) and numerical outcome using
the viscoelastic approach (26.4 N-mm). The difference between the values from the elastic
vs. the viscoelastic approach is about 23%. Although considering other viscoelastic models,
such as generalized Maxwell, may help to improve prediction of the bending behavior, as
documented by [29], the Kelvin–Voigt model in AniForm is reasonably sufficient to predict
the bending behavior of multilayered textile prepregs. However, the simulation outcomes
are highly dependent on the input data. This can be seen by the different results obtained
at 70 ◦C and room temperature as well as in the forming simulation presented below.
4.5 Application in forming simulation
The forming simulation was conducted over a geometry provided by AniForm software
[32]. The boundary conditions considered in this simulation are related to the stamp forming
process. Thus, the female tool was fixed, while the male tool was moved downwards. Note
that no blank holder boundaries were used in this simulations run. The aforementioned
material models were used with the same parameters presented in Tables 4.1, 4.2, and 4.3.
Note that the ply–tool properties in this simulation was set as half of the inter-ply friction
properties. Two different cases were considered. First, the effect of bending parameters on
forming results was studied using a single ply with fine mesh in order to capture wrinkle
formations. Second, the forming simulation process was performed for all four stacking
sequences. Each ply in multiple stacked plies was meshed with 10206 elements and grid size
of 6.1 mm to reduce the simulation time.
97
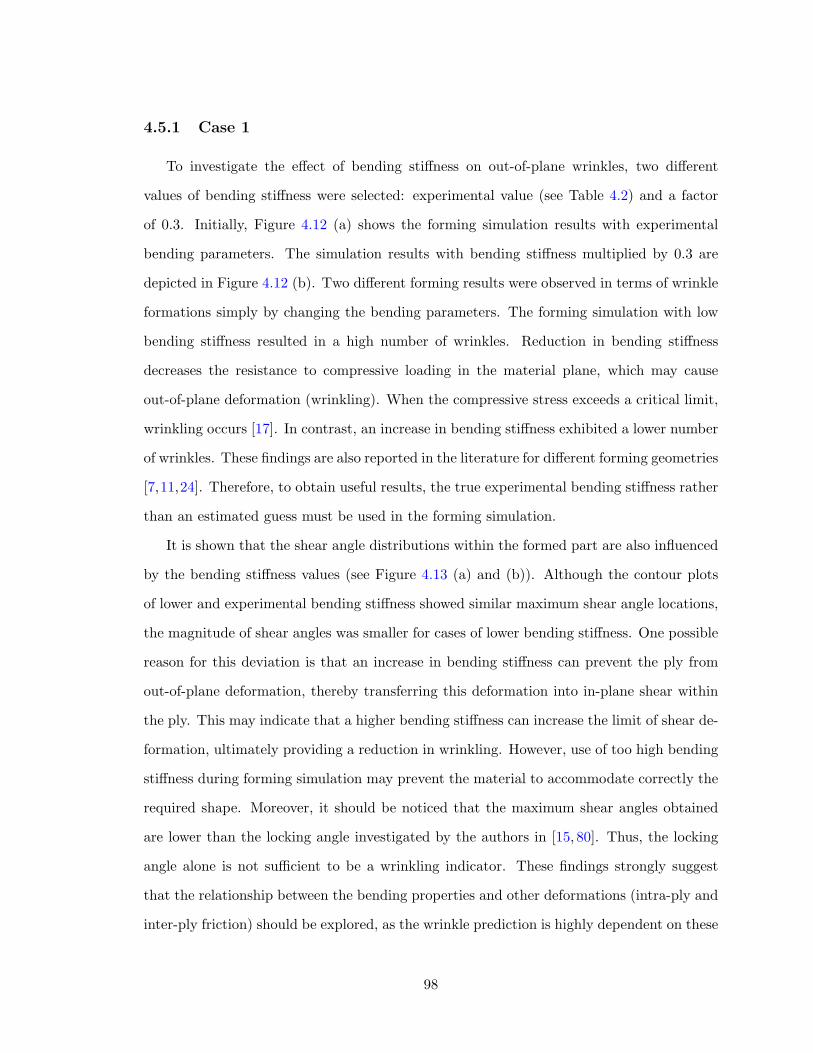
4.5.1 Case 1
To investigate the effect of bending stiffness on out-of-plane wrinkles, two different
values of bending stiffness were selected: experimental value (see Table 4.2) and a factor
of 0.3. Initially, Figure 4.12 (a) shows the forming simulation results with experimental
bending parameters. The simulation results with bending stiffness multiplied by 0.3 are
depicted in Figure 4.12 (b). Two different forming results were observed in terms of wrinkle
formations simply by changing the bending parameters. The forming simulation with low
bending stiffness resulted in a high number of wrinkles. Reduction in bending stiffness
decreases the resistance to compressive loading in the material plane, which may cause
out-of-plane deformation (wrinkling). When the compressive stress exceeds a critical limit,
wrinkling occurs [17]. In contrast, an increase in bending stiffness exhibited a lower number
of wrinkles. These findings are also reported in the literature for different forming geometries
[7,11,24]. Therefore, to obtain useful results, the true experimental bending stiffness rather
than an estimated guess must be used in the forming simulation.
It is shown that the shear angle distributions within the formed part are also influenced
by the bending stiffness values (see Figure 4.13 (a) and (b)). Although the contour plots
of lower and experimental bending stiffness showed similar maximum shear angle locations,
the magnitude of shear angles was smaller for cases of lower bending stiffness. One possible
reason for this deviation is that an increase in bending stiffness can prevent the ply from
out-of-plane deformation, thereby transferring this deformation into in-plane shear within
the ply. This may indicate that a higher bending stiffness can increase the limit of shear de-
formation, ultimately providing a reduction in wrinkling. However, use of too high bending
stiffness during forming simulation may prevent the material to accommodate correctly the
required shape. Moreover, it should be noticed that the maximum shear angles obtained
are lower than the locking angle investigated by the authors in [15, 80]. Thus, the locking
angle alone is not sufficient to be a wrinkling indicator. These findings strongly suggest
that the relationship between the bending properties and other deformations (intra-ply and
inter-ply friction) should be explored, as the wrinkle prediction is highly dependent on these
98
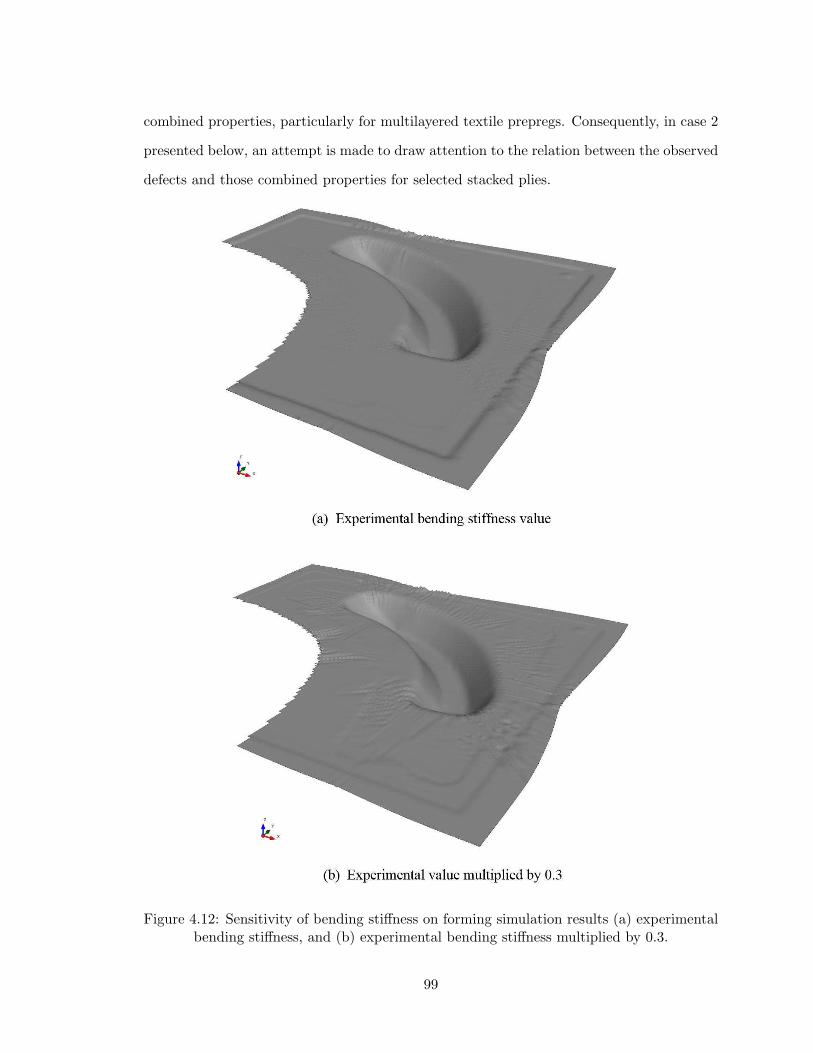
combined properties, particularly for multilayered textile prepregs. Consequently, in case 2
presented below, an attempt is made to draw attention to the relation between the observed
defects and those combined properties for selected stacked plies.
Figure 4.12: Sensitivity of bending stiffness on forming simulation results (a) experimentalbending stiffness, and (b) experimental bending stiffness multiplied by 0.3.
99
Figure 4.13: Intra-ply shear angles within the formed part (a) experimental bendingstiffness, and (b) experimental bending stiffness multiplied by 0.3.
100

4.5.2 Case 2
The forming predictions for all four stacking sequences over selected geometry are shown
in Figure 4.14. Only small wrinkles and waviness are found in stacking 1 [0, 90, 0], as can
be seen in Figure 4.14 (a). Although stacking 2 and 3 showed similar amounts of wrinkle
formations, as well as their locations, the size of wrinkles differs, especially in the wrinkles
positioned in the right and top flanges. This can be interpreted as the relative orientations
between neighboring plies in stacking 2 and 3 are similar, i.e., the difference in the amount
of inter-ply friction between + 45◦ and – 45◦ with respect to 0◦ is quite small. Moreover, the
bending properties of these two stacked plies using the FE model are in the same amount of
magnitude (see Section 4.4.2). Figure 4.14 (d) visualizes the simulation results for stacking
4; more wrinkles and other defects, such as delamination between the plies, were observed.
Note that ply 2 and ply 3 in stacking 4 are stacked opposite each other.
In order to further point out the effect of ply orientations on forming outcomes, Figure
4.15 illustrates the distribution of shear angles in each ply. Different responses between
selected stacking sequences as well as the plies within each sequence were observed. Figure
4.15 (a) shows the shear angles of stacking 1. A slight difference in in-plane deformation
was found between the plies that oriented in the same direction (see ply 1 and 3 in Figure
4.15 (a)). Ply 2 shows the inverse value of shear angles with relatively similar order of
magnitude. This is expected as the second ply is oriented by 90◦ with respect to first and
third plies. The contour plots of plies for stacking 2 and 3 are shown in Figure 4.15 (b)
and (c). The results show that the maximum obtained shear angles and their locations are
close to each other. This observation is probably related to the fact that the bending and
friction properties of stacking 2 and 3 are comparatively identical. However, the bending
experimental results showed minor differences between them. Figure 4.15 (d) visualizes the
shear angles in plies within stacking 4. The resulting plots of ply 1 and 2 do follow the
results obtained for stacking 2 and 3. However, ply 3 shows different results in terms of
value of maximum shear angles and the final shape, as seen in the top and right flanges of
Figure 4.15 (d).
101
In all cases, high bending stiffness along with low friction between the plies reduce the
risk of wrinkling. In addition, as shown in cases 1 and 2, the limit of shear deformation
(shear angles) tends to increase as the bending stiffness increases, which ultimately provides
a reduction in wrinkling. This finding is in accordance with the experimental observations
for all four stacking sequences. For example, stacking 1 had the highest bending stiff-
ness compared to other stacking sequences and resulted in less wrinkling. The orientation
between the plies, which plays an important role in terms of frictional resistance as shown
in [18], also contributed to the wrinkle formations. As the plies are oriented in the same
direction of sliding, which slides along the yarns, a higher force of friction is expected. Con-
sequently, the rotation of fibers inside the laminate eased the sliding and thus decreased
the frictional resistance. Murtagh et al. [81] reported that the resin flow across the fibers is
easier than flow along the fiber direction due to the higher apparent viscosity of the resin
in the fiber direction, compared with the transverse direction. However, this effect needs
to be explored through microscope investigations; it will be considered in a future study.
In woven fabric prepregs, the space between yarns is filled with the resin, which facilitates
the intra-ply shear and ply-ply friction. On the contrary, for UD prepregs, many fibers
are in contact, inducing high resistance against these deformations [7]. Note that to pro-
duce free-defect parts, a balance between these deformation modes during the forming is
required, as indicated in [7]. Also, the boundary conditions in the forming process, such as
tool geometry, processing parameters, and process type, impact the forming results. There-
fore, further investigations using different tool geometries and different stacking sequences
will allow for clearer conclusions to be drawn about the balance between these important
deformation modes as well as their influences on the observed defects.
102
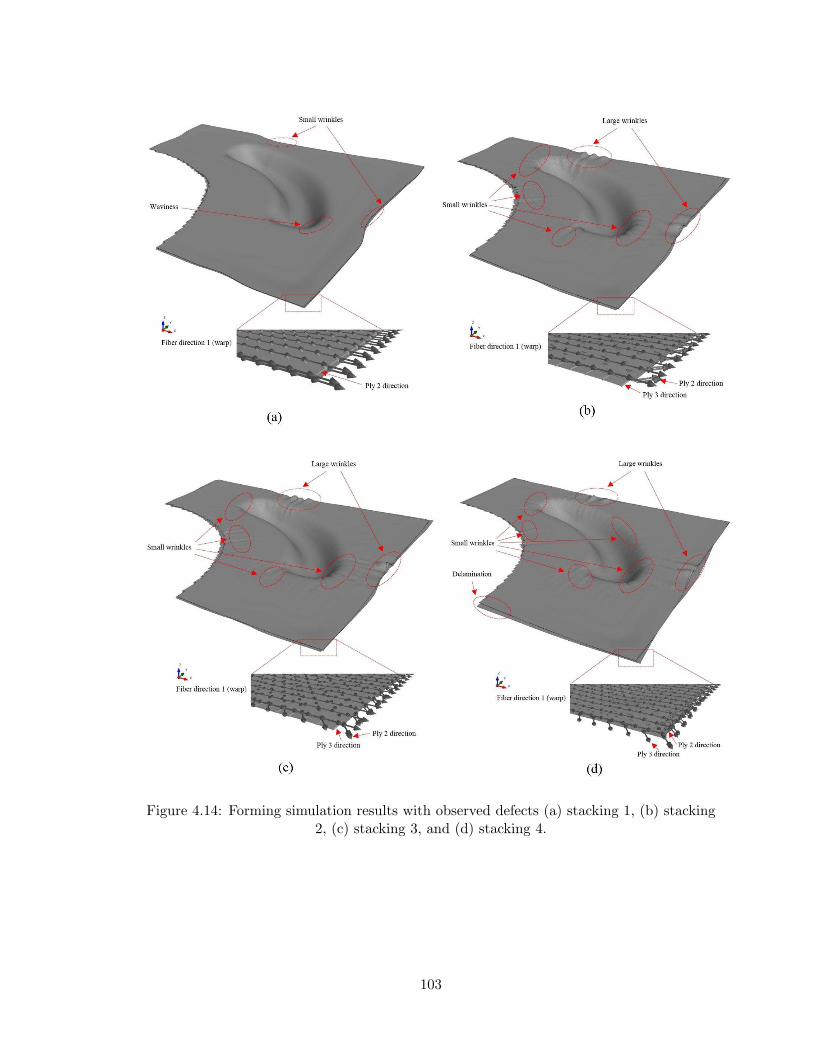
Figure 4.14: Forming simulation results with observed defects (a) stacking 1, (b) stacking2, (c) stacking 3, and (d) stacking 4.
103
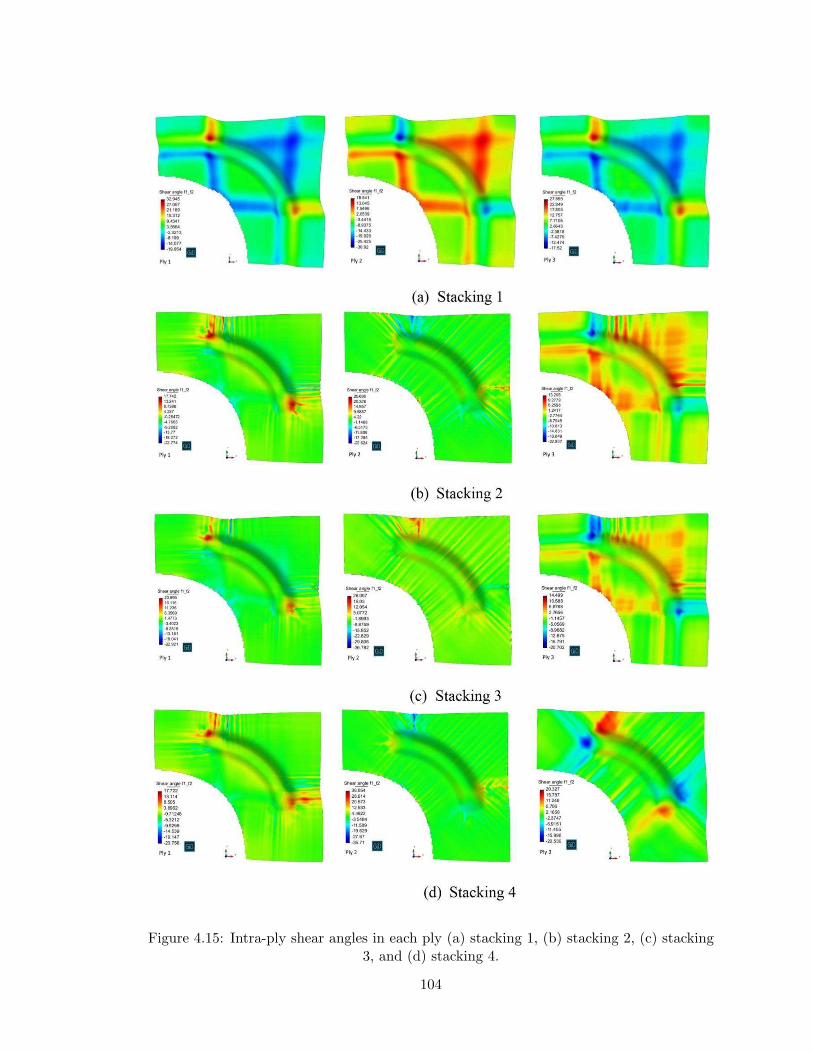
Figure 4.15: Intra-ply shear angles in each ply (a) stacking 1, (b) stacking 2, (c) stacking3, and (d) stacking 4.
104
4.6 Conclusion
A finite element model based on a viscoelastic approach was developed to predict the
bending behavior of multilayered textile thermosetting composite prepregs at different pro-
cessing parameters, including temperature and rate. The experimental and numerical res-
ults revealed that the bending properties strongly depend on the fabric lay-up inside multiple
stacked plies. The predicted bending properties were found to be in good agreement with
the experimental results for selected stacking sequences. However, the FE model gave the
same results for stacking 2 [0, + 45, 90] and stacking 3 [0, – 45, 90], while the experimental
measurements showed some differences. This difference may be due to the inherent undu-
lation between yarns in woven-fabric structures. A notable difference in bending behavior
was observed after comparing Kelvin–Voigt and elastic material models. Moreover, bend-
ing behavior is also influenced by the friction between plies, which plays an important role
in terms of facilitating the through thickness shearing during the bending experiments at
processing temperature.
The forming simulation outcomes showed that high bending stiffness along with low
friction between the plies may help to increase the limit of shear deformation (shear angles),
ultimately providing a reduction in wrinkling. However, future work needs to be conducted
using different tool geometries and different stacking sequences to verify the relation between
the observed defects and those combined properties for multiple stacked plies.
105
Chapter 5
Experimental and numerical investigations
on formability of out-of-autoclave thermoset
prepreg using a double diaphragm process∗
Abstract
The formability of textile out-of-autoclave thermoset prepreg using double diaphragm form-
ing has been investigated to produce a component for aerospace applications. A one-step
procedure has been used for both the forming and curing processes using the same experi-
mental set-up. A finite element model has been developed to simulate the double diaphragm
forming process, with consideration for the diaphragm material properties at forming condi-
tions. To identify potential causes for wrinkle development, important considerations, such
as local fiber compressive stresses, shear angle distributions, and stacking lay-up sequences,
have been analyzed. Furthermore, different forming simulation scenarios were applied to
reduce the wrinkle defects. Results indicate that a change in lay-up sequences significantly
affects the formability; thus, wrinkle formations cannot be avoided at challenging locations
for some lay-up arrangements. The forming simulations are in agreement with the exper-
imental results in terms of prediction of large wrinkles and intra-ply shear. Meanwhile,
high local compressive stress regions provide a good indication for where the critical areas
appear, which can be considered when the small wrinkles cannot be predicted with the
element size used.
∗Reproduced from: Hassan Alshahrani, Mehdi Hojjati. Experimental and numerical in-vestigations on formability of out-of-autoclave thermoset prepreg using a double diaphragmprocess. Composites Part A: Applied Science and Manufacturing, 101 (2017), pp. 199–214.https://doi.org/10.1016/j.compositesa.2017.06.021
106
5.1 Introduction
Composite materials can be produced by applying different manufacturing techniques.
Conventional composite manufacturing techniques, such as hand lay-up, are labor-intensive,
time-consuming, costly, and less productive than other techniques [6]. Automated manu-
facturing processes are promising methods in aerospace and automotive industries because
of their low manufacturing time and lower cost [33]. However, due to geometric limitations
of automated tape laying (ATL) and automated fiber placement (AFP), an additional step
is required to form complex shapes. This forming step involves the application of heat
and pressure to transform flat laminates into the desired shape prior to curing [6, 82]. The
most important sheet-forming processes for composite materials are the diaphragm (single
or double) and stamp forming methods [3, 4]. Both processes exhibit high efficiency and
high productivity during formation. However, the stamp forming process is very expensive
due to its need for two close-tolerance dies for each shape. Krebs et al. [83] conducted a
direct comparison between matched-die press and diaphragm forming using thermoplastic
composite. They found that matched-die forming produces a better surface finish and the
flange thickness variation is slightly less severe compared to diaphragm forming. At the
same time, however, the matched-die forming restricts the material movement, which may
lead to out-of-plane buckling.
Double–Diaphragm Forming (DDF) is a thermoforming process that was initially applied
to thermoplastic matrix composites [84]. In the DDF process, composite prepreg plies are
placed between two deformable sheets known as diaphragms. The diaphragms are then
clamped, heated with the laminate to the processing temperature, and formed to the mold
by applying vacuum pressure from beneath the lower diaphragm and/or positive pressure
on the top [85]. Vacuum pressure is generally used for forming thermosets [86]. During the
initial step of the forming process, the laminate must be in a flat and tension state to avoid
any compression that may lead to wrinkling [11]. Hence, the vacuum pressure is applied
between two diaphragms, inducing the clamping force during the pre–heating process. This
clamping force plays an important role in avoiding wrinkle formations as shown in [87].
107
Polymeric diaphragms are most commonly used because of their ability to deform without
rupturing under high processing temperatures [88]. As recently was reported in [86], the
deformation modes and the defects raised during the forming process are also dependent
on the diaphragm material type. However, the choice of diaphragm materials is limited by
the commercial availability of the desired properties.
Most previous research [88–92] has focused on diaphragm forming processes that use
thermoplastic prepregs. These studies have shown that forming the thermoplastic prepreg
can be influenced by processing parameters, tool geometries, and diaphragm materials.
Recently, this process has been used in forming thermoset prepregs [19, 52, 80, 93]. In the
diaphragm forming of thermosetting prepregs, the matrix is only heated enough to decrease
its viscosity to the point where the prepreg can be formed readily. Thereafter, the curing
process usually takes place in an oven or autoclave.
A forming simulation based on Finite Element (FE) methods allows for determination
of suitable process parameters without the requirement of expensive trial and error tests.
Moreover, potential material defects during forming can be predicted, which assist design-
ers in reliably choosing appropriate material types and processing parameters for complex
structure. However, a considerable amount of knowledge of the mechanical behavior of
prepreg ply and accurate material properties inputs are required to obtain precise form-
ing predictions [47, 94]. In the diaphragm forming simulation, the diaphragm material was
modeled in the literature based on the Mooney-Rivlin model [77], plastic model [95], or
Ogden model [86]. However, an important challenge is to capture the behavior and forming
properties of the diaphragms and the prepreg sheets, including their out-of-plane bending
properties. Currently, the bending properties of diaphragm materials that can be used in
DDF process simulation are unavailable. Furthermore, as shown in an earlier study [80],
the diaphragm material stiffness decreases as temperature increases, allowing for better
tool conformity. Thus, besides the prepreg material models and properties, the diaphragm
properties at forming conditions must be accurately represented in the FE model.
The current work aims to experimentally and numerically investigate the formability
of out-of-autoclave thermoset prepreg over a complex geometry for aerospace applications
108
using a DDF process. An evaluation of the DDF process in terms of observed defects, stack-
ing sequences, and pre-forming state is carried out. In the present study, out-of-autoclave
(OOA) prepregs are used to reduce overall processing time and cost. Therefore, the pro-
posed double-diaphragm setup can fully accommodate the forming and curing steps of the
process, thus bypassing the need for an oven. The diaphragm and prepreg material proper-
ties at forming conditions, including their out-of-plane bending properties, are considered
in the FE model.
5.2 Forming experiment methodology
5.2.1 Double-Diaphragm Forming (DDF) setup
A custom-built DDF setup was developed, which consists of three main parts: DD tool,
vacuum system, and heating system, as shown in Figure 5.1 (a) and (b). DD tool involves
two deformable silicone rubber diaphragms, manufactured by Torr Technologies Inc., with
a thickness of 1.6 mm. The vacuum pressure between the two diaphragms was applied
within DD tool using secured frames with a vacuum port connected to the vacuum pump,
as shown in Figure 5.1 (c). Note that a control valve and vacuum gage were used to monitor
the pressure that is applied between the diaphragms. Figure 5.1 (d) shows the vacuum box
with a movable plate inside designed to control the height of the tool with respect to the
lower diaphragm. To achieve the necessary processing temperatures, a radiant heater from
WATLOW and thermocouples were used, as seen in Figure 5.1 (e). Moreover, the DD setup
has an additional feature where the vacuum box can be adjusted using two electronic jacks
to ensure a closed chamber with the heater during the curing process.
109
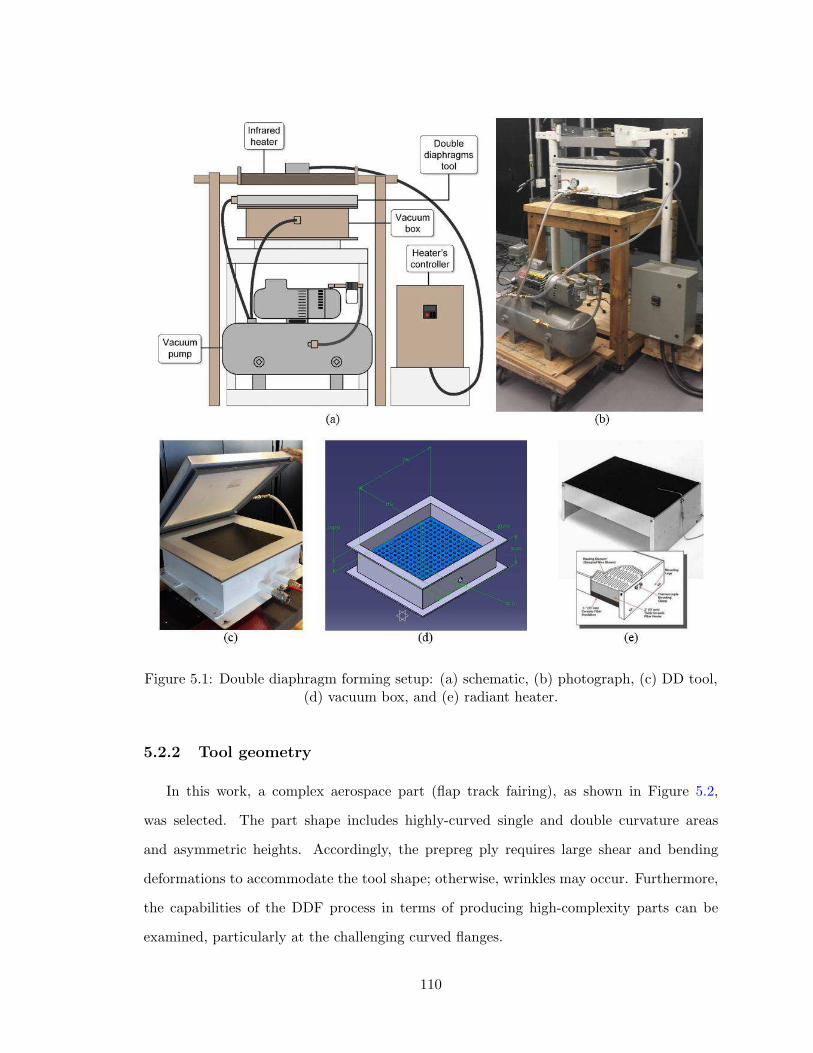
Figure 5.1: Double diaphragm forming setup: (a) schematic, (b) photograph, (c) DD tool,(d) vacuum box, and (e) radiant heater.
5.2.2 Tool geometry
In this work, a complex aerospace part (flap track fairing), as shown in Figure 5.2,
was selected. The part shape includes highly-curved single and double curvature areas
and asymmetric heights. Accordingly, the prepreg ply requires large shear and bending
deformations to accommodate the tool shape; otherwise, wrinkles may occur. Furthermore,
the capabilities of the DDF process in terms of producing high-complexity parts can be
examined, particularly at the challenging curved flanges.
110
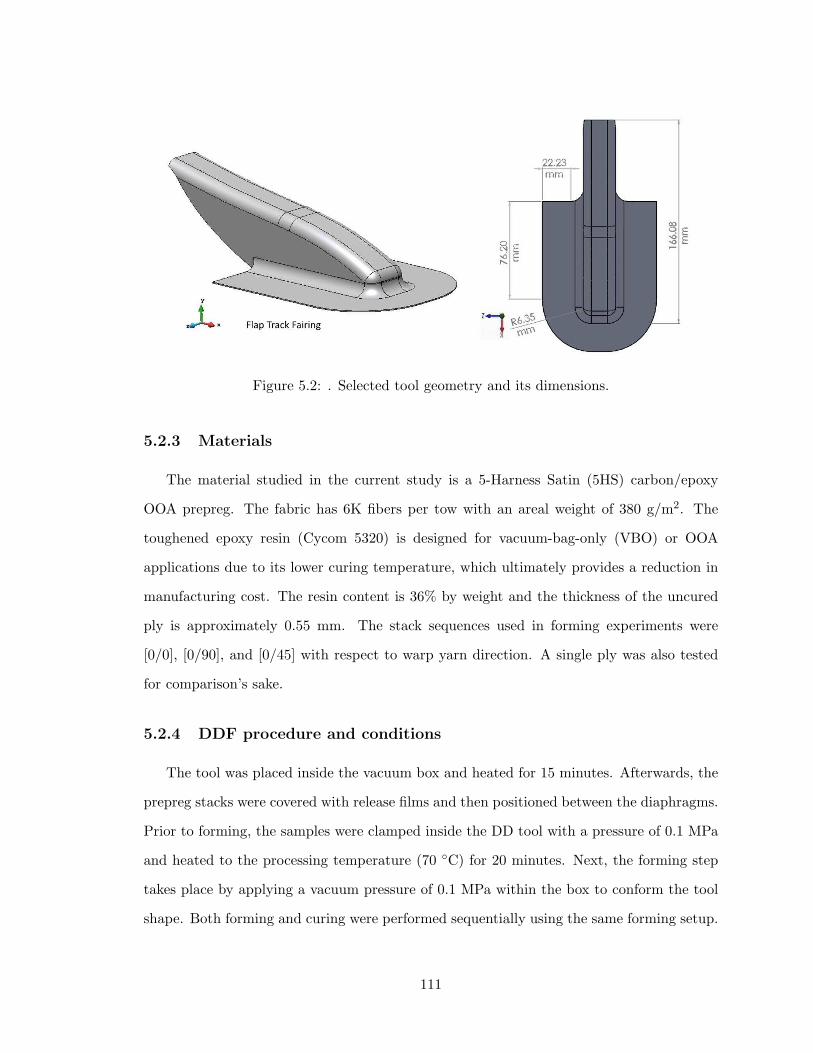
Figure 5.2: . Selected tool geometry and its dimensions.
5.2.3 Materials
The material studied in the current study is a 5-Harness Satin (5HS) carbon/epoxy
OOA prepreg. The fabric has 6K fibers per tow with an areal weight of 380 g/m2. The
toughened epoxy resin (Cycom 5320) is designed for vacuum-bag-only (VBO) or OOA
applications due to its lower curing temperature, which ultimately provides a reduction in
manufacturing cost. The resin content is 36% by weight and the thickness of the uncured
ply is approximately 0.55 mm. The stack sequences used in forming experiments were
[0/0], [0/90], and [0/45] with respect to warp yarn direction. A single ply was also tested
for comparison’s sake.
5.2.4 DDF procedure and conditions
The tool was placed inside the vacuum box and heated for 15 minutes. Afterwards, the
prepreg stacks were covered with release films and then positioned between the diaphragms.
Prior to forming, the samples were clamped inside the DD tool with a pressure of 0.1 MPa
and heated to the processing temperature (70 ◦C) for 20 minutes. Next, the forming step
takes place by applying a vacuum pressure of 0.1 MPa within the box to conform the tool
shape. Both forming and curing were performed sequentially using the same forming setup.
111
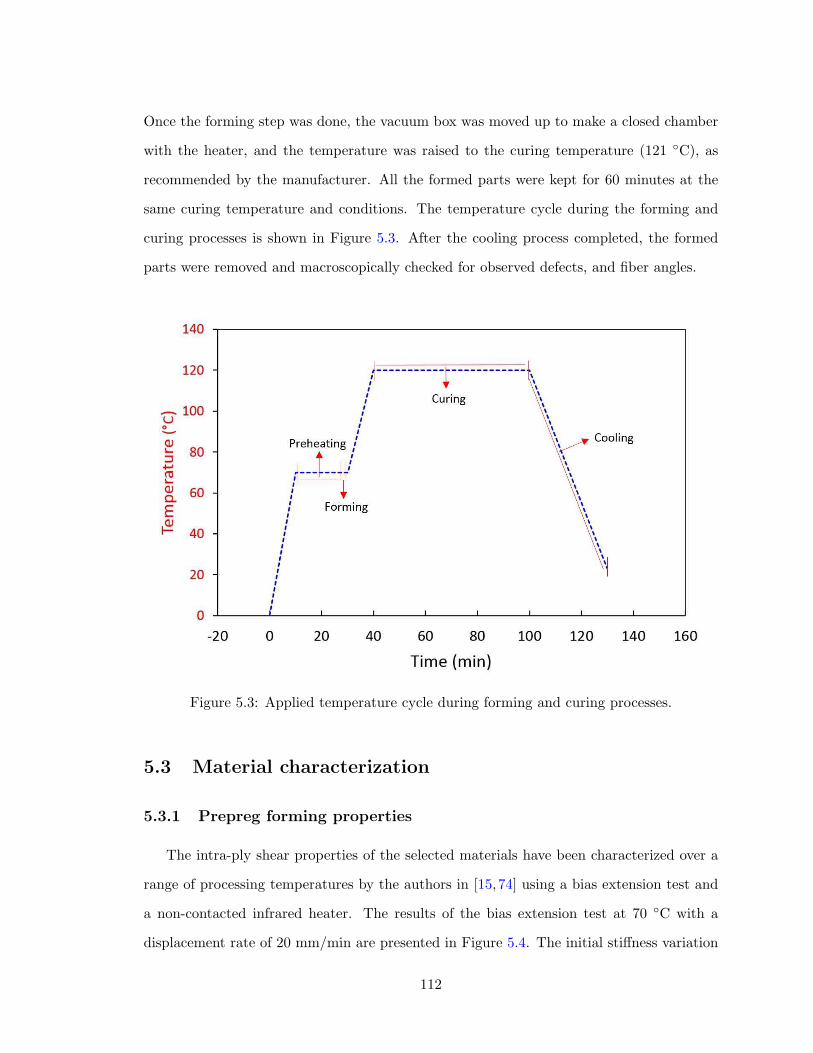
Once the forming step was done, the vacuum box was moved up to make a closed chamber
with the heater, and the temperature was raised to the curing temperature (121 ◦C), as
recommended by the manufacturer. All the formed parts were kept for 60 minutes at the
same curing temperature and conditions. The temperature cycle during the forming and
curing processes is shown in Figure 5.3. After the cooling process completed, the formed
parts were removed and macroscopically checked for observed defects, and fiber angles.
Figure 5.3: Applied temperature cycle during forming and curing processes.
5.3 Material characterization
5.3.1 Prepreg forming properties
The intra-ply shear properties of the selected materials have been characterized over a
range of processing temperatures by the authors in [15, 74] using a bias extension test and
a non-contacted infrared heater. The results of the bias extension test at 70 ◦C with a
displacement rate of 20 mm/min are presented in Figure 5.4. The initial stiffness variation
112
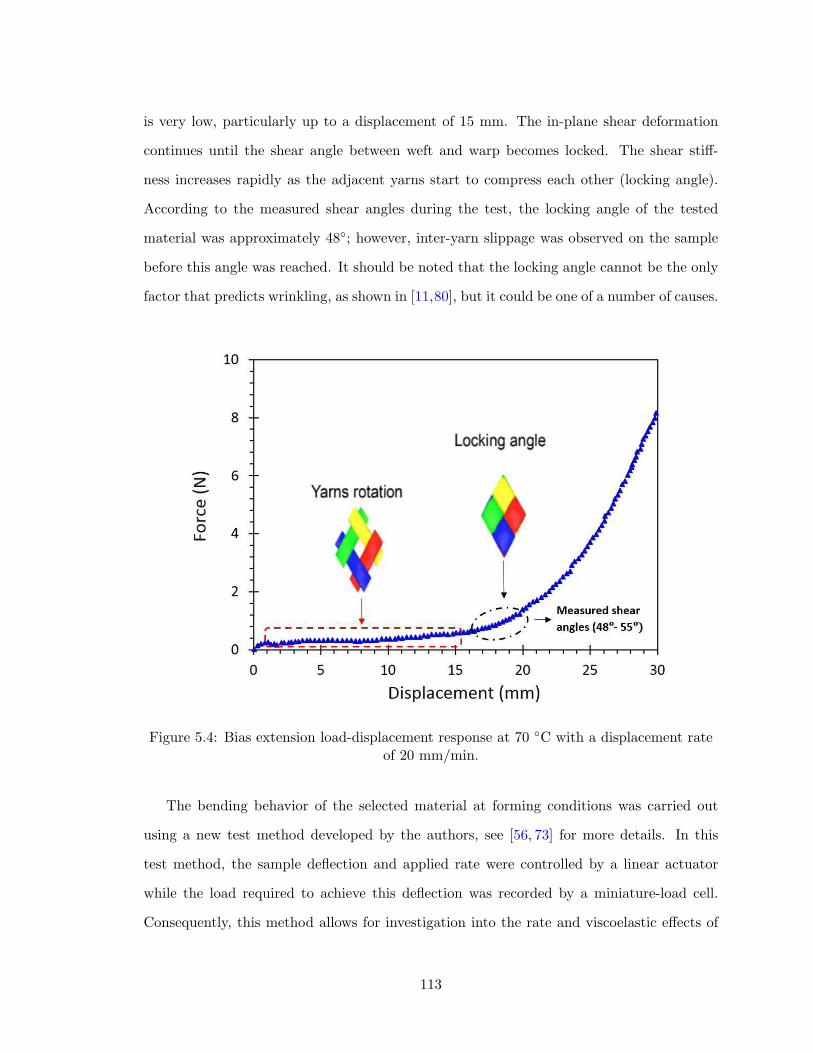
is very low, particularly up to a displacement of 15 mm. The in-plane shear deformation
continues until the shear angle between weft and warp becomes locked. The shear stiff-
ness increases rapidly as the adjacent yarns start to compress each other (locking angle).
According to the measured shear angles during the test, the locking angle of the tested
material was approximately 48◦; however, inter-yarn slippage was observed on the sample
before this angle was reached. It should be noted that the locking angle cannot be the only
factor that predicts wrinkling, as shown in [11,80], but it could be one of a number of causes.
Figure 5.4: Bias extension load-displacement response at 70 ◦C with a displacement rateof 20 mm/min.
The bending behavior of the selected material at forming conditions was carried out
using a new test method developed by the authors, see [56, 73] for more details. In this
test method, the sample deflection and applied rate were controlled by a linear actuator
while the load required to achieve this deflection was recorded by a miniature-load cell.
Consequently, this method allows for investigation into the rate and viscoelastic effects of
113
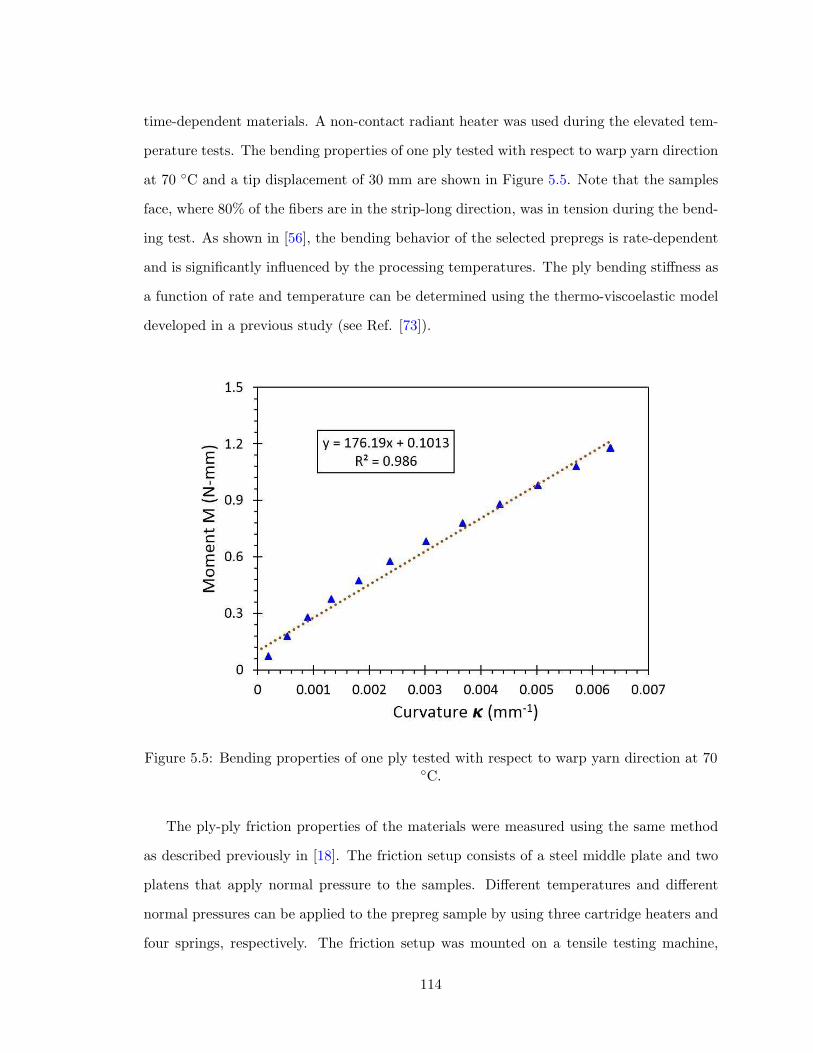
time-dependent materials. A non-contact radiant heater was used during the elevated tem-
perature tests. The bending properties of one ply tested with respect to warp yarn direction
at 70 ◦C and a tip displacement of 30 mm are shown in Figure 5.5. Note that the samples
face, where 80% of the fibers are in the strip-long direction, was in tension during the bend-
ing test. As shown in [56], the bending behavior of the selected prepregs is rate-dependent
and is significantly influenced by the processing temperatures. The ply bending stiffness as
a function of rate and temperature can be determined using the thermo-viscoelastic model
developed in a previous study (see Ref. [73]).
Figure 5.5: Bending properties of one ply tested with respect to warp yarn direction at 70◦C.
The ply-ply friction properties of the materials were measured using the same method
as described previously in [18]. The friction setup consists of a steel middle plate and two
platens that apply normal pressure to the samples. Different temperatures and different
normal pressures can be applied to the prepreg sample by using three cartridge heaters and
four springs, respectively. The friction setup was mounted on a tensile testing machine,
114
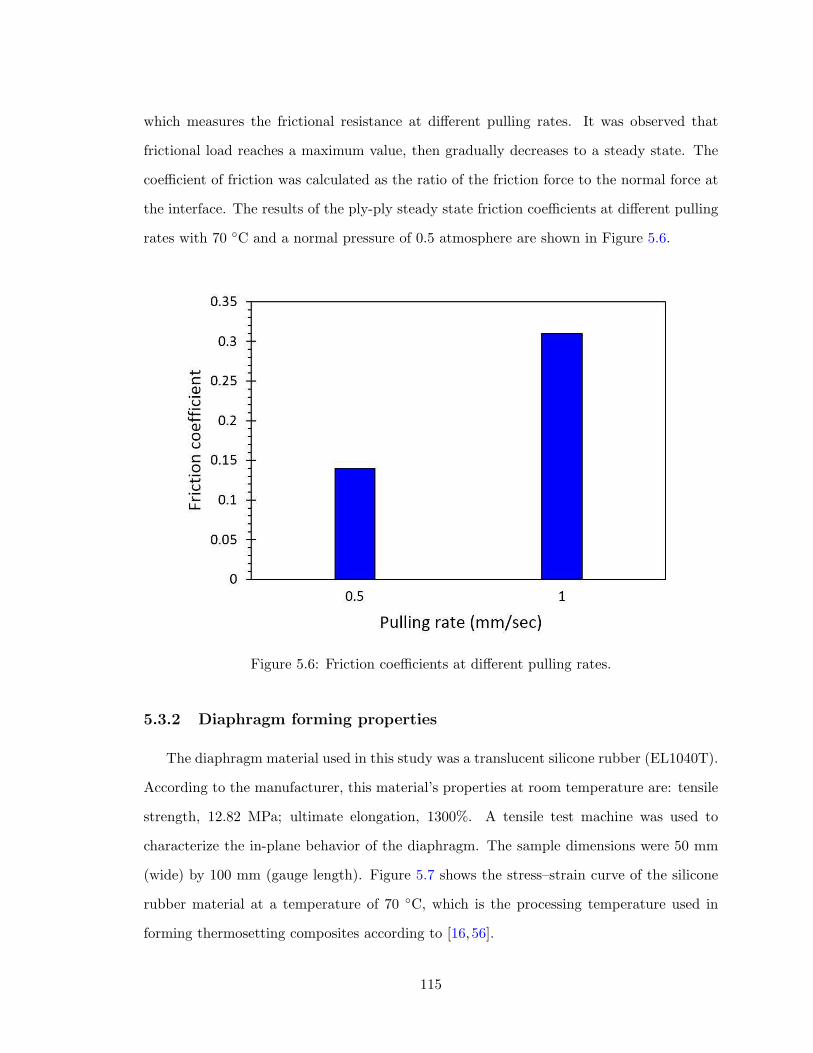
which measures the frictional resistance at different pulling rates. It was observed that
frictional load reaches a maximum value, then gradually decreases to a steady state. The
coefficient of friction was calculated as the ratio of the friction force to the normal force at
the interface. The results of the ply-ply steady state friction coefficients at different pulling
rates with 70 ◦C and a normal pressure of 0.5 atmosphere are shown in Figure 5.6.
Figure 5.6: Friction coefficients at different pulling rates.
5.3.2 Diaphragm forming properties
The diaphragm material used in this study was a translucent silicone rubber (EL1040T).
According to the manufacturer, this material’s properties at room temperature are: tensile
strength, 12.82 MPa; ultimate elongation, 1300%. A tensile test machine was used to
characterize the in-plane behavior of the diaphragm. The sample dimensions were 50 mm
(wide) by 100 mm (gauge length). Figure 5.7 shows the stress–strain curve of the silicone
rubber material at a temperature of 70 ◦C, which is the processing temperature used in
forming thermosetting composites according to [16,56].
115

Figure 5.7: In-plane properties of the silicone rubber diaphragm material withMooney–Rivlin model fit.
The bending properties of the diaphragm material were measured using the same setup
as described previously for the bending characterization of the prepreg materials. The
results are presented in Figure 5.8. As expected, the bending stiffness for the silicone
rubber is very low compared to the prepreg ply. The developed bending setup enabled
measurement of the bending properties for these flexible materials because the deflection
shape and the small loads can be consistently controlled and recorded.
116
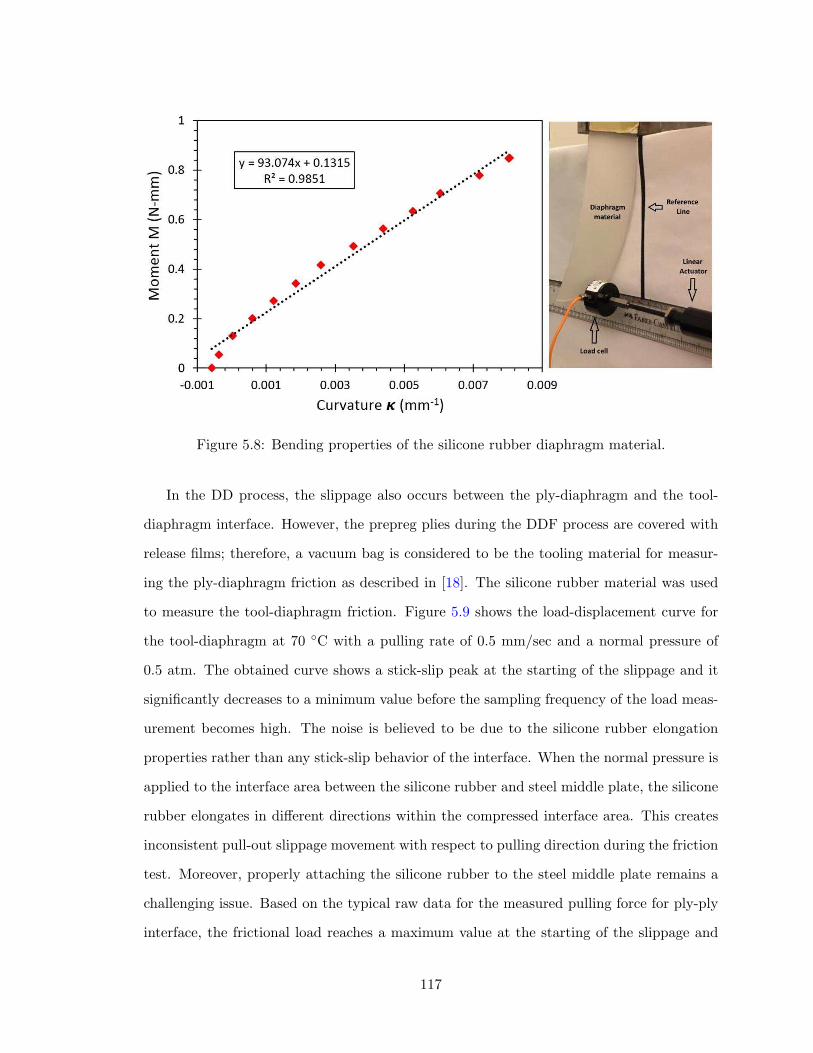
Figure 5.8: Bending properties of the silicone rubber diaphragm material.
In the DD process, the slippage also occurs between the ply-diaphragm and the tool-
diaphragm interface. However, the prepreg plies during the DDF process are covered with
release films; therefore, a vacuum bag is considered to be the tooling material for measur-
ing the ply-diaphragm friction as described in [18]. The silicone rubber material was used
to measure the tool-diaphragm friction. Figure 5.9 shows the load-displacement curve for
the tool-diaphragm at 70 ◦C with a pulling rate of 0.5 mm/sec and a normal pressure of
0.5 atm. The obtained curve shows a stick-slip peak at the starting of the slippage and it
significantly decreases to a minimum value before the sampling frequency of the load meas-
urement becomes high. The noise is believed to be due to the silicone rubber elongation
properties rather than any stick-slip behavior of the interface. When the normal pressure is
applied to the interface area between the silicone rubber and steel middle plate, the silicone
rubber elongates in different directions within the compressed interface area. This creates
inconsistent pull-out slippage movement with respect to pulling direction during the friction
test. Moreover, properly attaching the silicone rubber to the steel middle plate remains a
challenging issue. Based on the typical raw data for the measured pulling force for ply-ply
interface, the frictional load reaches a maximum value at the starting of the slippage and
117
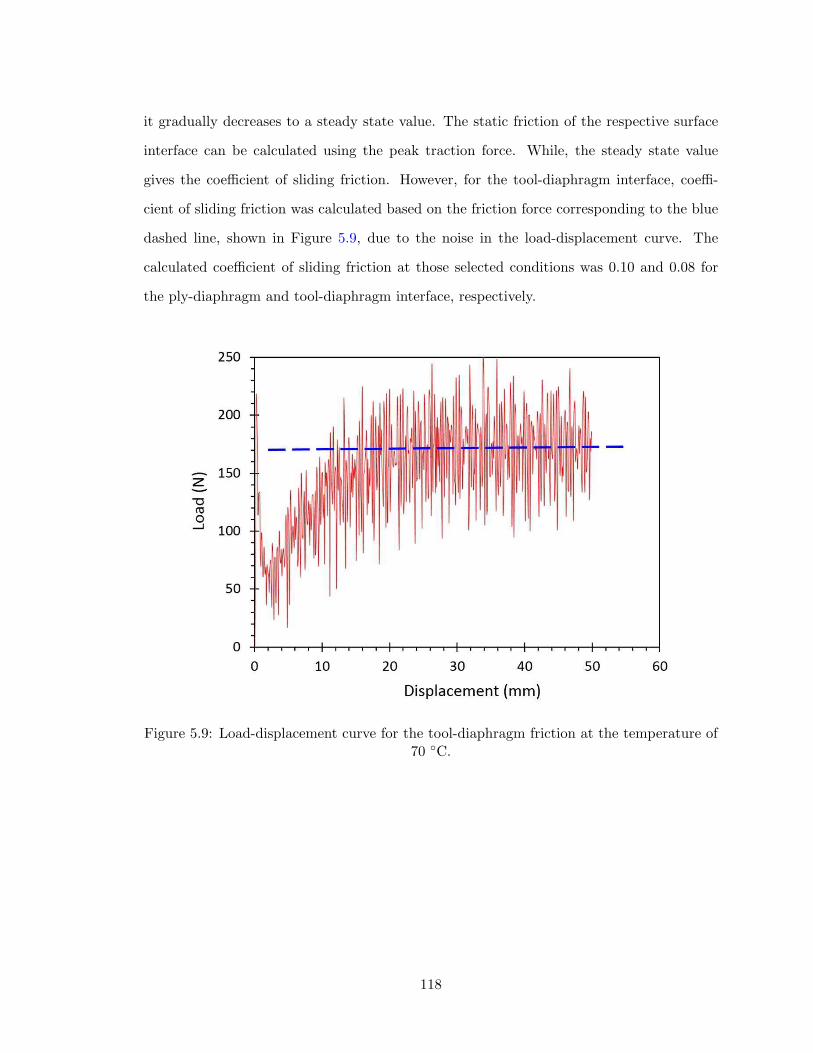
it gradually decreases to a steady state value. The static friction of the respective surface
interface can be calculated using the peak traction force. While, the steady state value
gives the coefficient of sliding friction. However, for the tool-diaphragm interface, coeffi-
cient of sliding friction was calculated based on the friction force corresponding to the blue
dashed line, shown in Figure 5.9, due to the noise in the load-displacement curve. The
calculated coefficient of sliding friction at those selected conditions was 0.10 and 0.08 for
the ply-diaphragm and tool-diaphragm interface, respectively.
Figure 5.9: Load-displacement curve for the tool-diaphragm friction at the temperature of70 ◦C.
118

5.4 Forming simulation methodology
5.4.1 FE model for DD process
The numerical simulations of the DDF process were conducted using the AniForm soft-
ware [32]. This software was built based on a continuum mechanical formulation solved by
the implicit FE approach. A schematic of the FE model is presented in Figure 5.10. In
this model, the simulation geometry consists of a forming tool placed on the top of a fixed
base and the DD frame including the upper and lower diaphragms. The prepreg plies were
modeled using linear triangle elements coupled with Kirchoff shell elements; consequently,
out-of-plane bending properties are separately defined. A mesh of 17,645 elements was
utilized for each prepreg ply. Two deformable membranes that behave according to the
assigned properties were used to model the upper and lower diaphragm sheets.
Four line grippers were used to secure the boundaries of each diaphragm in the x and
y directions (see DD frame in Figure 5.10). The forming tool and the base were modeled
as rigid bodies. Fine mesh was employed to describe those areas with higher curvatures in
the tool. To model the vacuum between the diaphragms, which generates a clamping force
on the prepreg stack during the DD process, equal pressures on the upper and lower dia-
phragms were applied as shown in the side view of Figure 5.10. After applying pressures on
both sides of the diaphragms, the DD frame was moved down (-z direction) to make contact
with the fixed base. Next, incremental pressure on top of the upper diaphragm was applied
to simulate the vacuum pressure within the forming-box cavity. After 100 increments, a
pressure of 0.1 MPa was reached. Results from the material characterization procedures,
presented in Section 5.3, were used to determine the required properties for constitutive
material models in the numerical simulations.
119
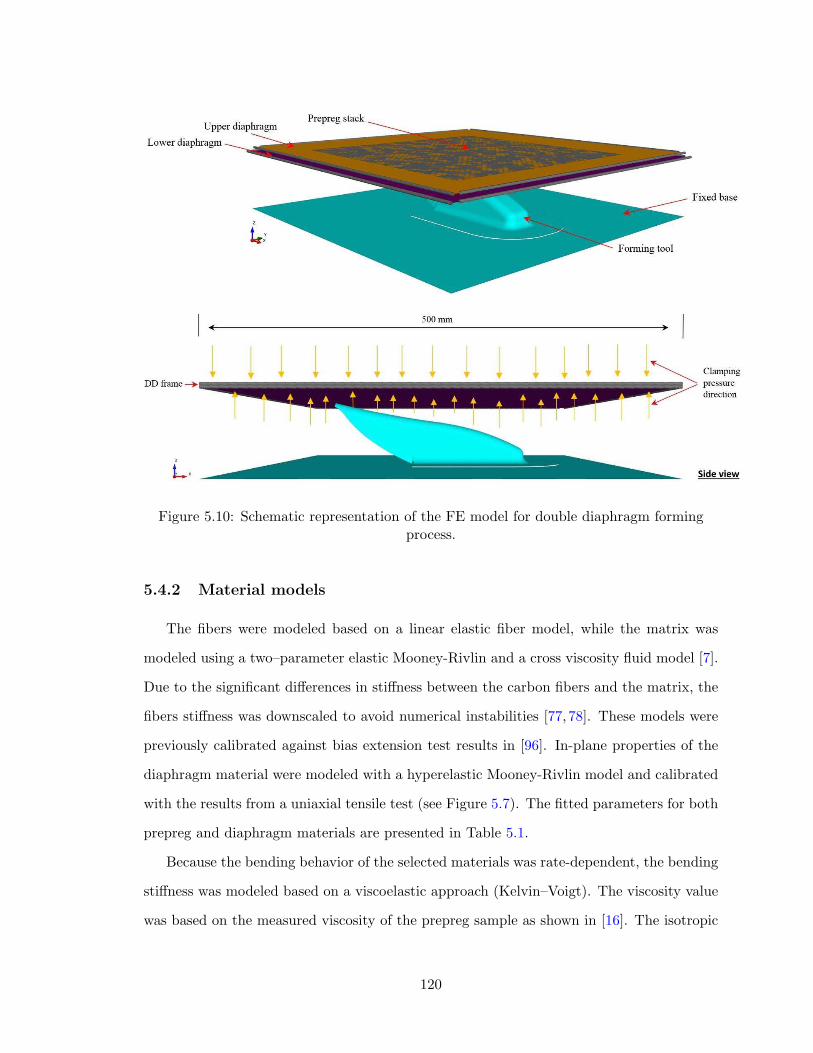
Figure 5.10: Schematic representation of the FE model for double diaphragm formingprocess.
5.4.2 Material models
The fibers were modeled based on a linear elastic fiber model, while the matrix was
modeled using a two–parameter elastic Mooney-Rivlin and a cross viscosity fluid model [7].
Due to the significant differences in stiffness between the carbon fibers and the matrix, the
fibers stiffness was downscaled to avoid numerical instabilities [77, 78]. These models were
previously calibrated against bias extension test results in [96]. In-plane properties of the
diaphragm material were modeled with a hyperelastic Mooney-Rivlin model and calibrated
with the results from a uniaxial tensile test (see Figure 5.7). The fitted parameters for both
prepreg and diaphragm materials are presented in Table 5.1.
Because the bending behavior of the selected materials was rate-dependent, the bending
stiffness was modeled based on a viscoelastic approach (Kelvin–Voigt). The viscosity value
was based on the measured viscosity of the prepreg sample as shown in [16]. The isotropic
120
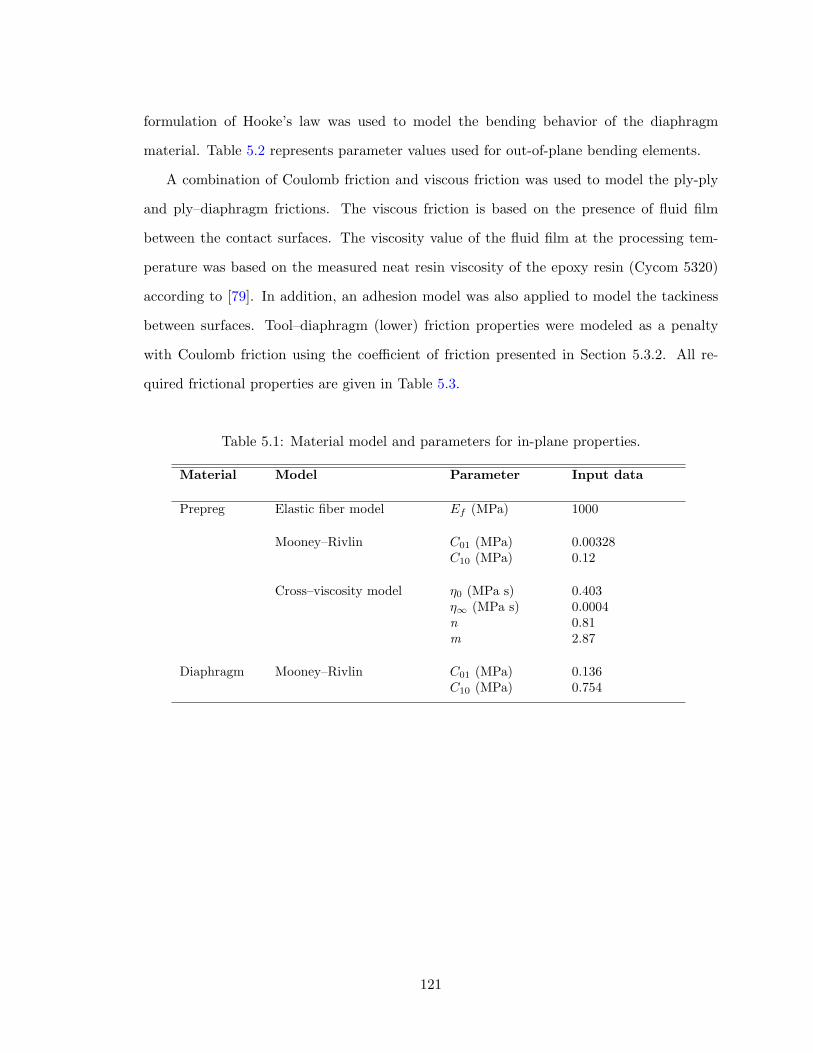
formulation of Hooke’s law was used to model the bending behavior of the diaphragm
material. Table 5.2 represents parameter values used for out-of-plane bending elements.
A combination of Coulomb friction and viscous friction was used to model the ply-ply
and ply–diaphragm frictions. The viscous friction is based on the presence of fluid film
between the contact surfaces. The viscosity value of the fluid film at the processing tem-
perature was based on the measured neat resin viscosity of the epoxy resin (Cycom 5320)
according to [79]. In addition, an adhesion model was also applied to model the tackiness
between surfaces. Tool–diaphragm (lower) friction properties were modeled as a penalty
with Coulomb friction using the coefficient of friction presented in Section 5.3.2. All re-
quired frictional properties are given in Table 5.3.
Table 5.1: Material model and parameters for in-plane properties.
Material Model Parameter Input data
Prepreg Elastic fiber model Ef (MPa) 1000
Mooney–Rivlin C01 (MPa) 0.00328C10 (MPa) 0.12
Cross–viscosity model η0 (MPa s) 0.403η∞ (MPa s) 0.0004n 0.81m 2.87
Diaphragm Mooney–Rivlin C01 (MPa) 0.136C10 (MPa) 0.754
121
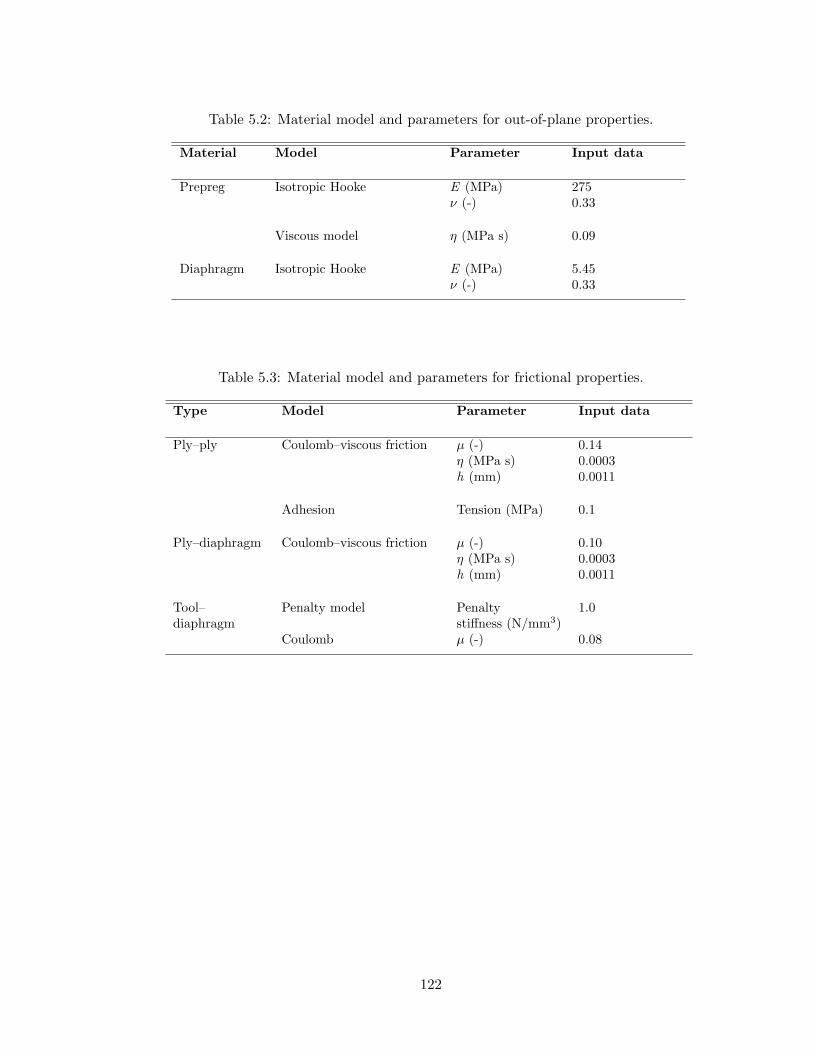
Table 5.2: Material model and parameters for out-of-plane properties.
Material Model Parameter Input data
Prepreg Isotropic Hooke E (MPa) 275ν (-) 0.33
Viscous model η (MPa s) 0.09
Diaphragm Isotropic Hooke E (MPa) 5.45ν (-) 0.33
Table 5.3: Material model and parameters for frictional properties.
Type Model Parameter Input data
Ply–ply Coulomb–viscous friction µ (-) 0.14η (MPa s) 0.0003h (mm) 0.0011
Adhesion Tension (MPa) 0.1
Ply–diaphragm Coulomb–viscous friction µ (-) 0.10η (MPa s) 0.0003h (mm) 0.0011
Tool–diaphragm
Penalty model Penaltystiffness (N/mm3)
1.0
Coulomb µ (-) 0.08
122

5.5 Results and discussion
5.5.1 Forming experiment results
Selecting a higher temperature within the range of the thermosetting resin helped to
increase the degree of formability over a double–curved tool as shown by the authors in
an earlier study [80]. Thus, the prepreg stacks were formed over the selected tool under
70 ◦C as illustrated in Figure 5.11 (a). The forming rate was estimated by dividing the
applied pressure in the vacuum box by the forming time [52]. Figures 5.11 (b) and (c)
show, respectively, the pre–trimmed and final parts. The final part was divided into several
locations, shown in Figure 5.11 (c), to analyze the observed defects.
It was difficult for both the upper and lower diaphragms to reach the exact challenging
curved-flanges as shown in Figure 5.11 (a). This produced a distance between the formed
surface and the tool at that location (bridging) as shown in Figure 5.11 (d). The clamping
forces between the double diaphragms generated a friction force which constrains the ma-
terial deformation. Also, the forming forces applied in the bridging area may induce local
tensile forces in the fibers as reported in [86]. Consequently, the yarns are constrained and
the deep cavity could not be reached. However, using thinner diaphragm materials may al-
low for better tool conformity, particularly with deep concave features. Moreover, it should
be noted that when forming proceeded at a slower rate (3.3 kPa/sec), the formed piece was
close to the actual shape (less bridging), while it deviated slightly in the case of a higher
forming rate (10 kPa/sec). This may be attributed to the rate-dependent behavior of the
prepreg, which affects the response of material deformation during the forming process at
different applied rates. For example, higher rate yields higher frictional forces between all
contact interfaces, so proper sliding is hard to achieve.
Note that the contact between the lower diaphragm and the tool occurs gradually as
the selected tool has an irregular height. This reduces the effect that may occur due to the
temperature differential between them. All forming experiments indicated that a higher
applied pressure (0.1 MPa) within the vacuum box is favorable to accommodate this complex
123

shape.
Figure 5.11: (a) Formed part during DDF process, (b) pre-trimmed part, (c) final part,and (d) bridging defect zones.
124
Figure 5.12 (a) shows a single-ply formed when the warp yarn direction is aligned with
the x -direction. The yarns along the warp and weft directions deform largely around the
double–curved regions (location A). The maximum shear angle for this sample was found
to be 51◦ at nearby location A. Small wrinkles and waviness were observed at location A
(see Figure 5.12 (a)). All other locations in the part have good surface quality. It is seen
in Figure 5.12 (b) that rotating the sample by -45◦ with respect to the x -direction results
in large wrinkles and folds throughout the part. The region of observed defects was further
concentrated in location A. The magnitude and location of maximum shear angle in this
case are shown in Figure 5.12 (b). Also, many yarns are bent in their own plane and are
concentrated between locations A and C, unlike sample 1. The folds were also obvious in
location B (see Figure 5.12 (b)).
Although the same process conditions were used in both cases, the second sample showed
less surface quality and many signs of wrinkles and folds. The reason for this could be
explained through results from Ref. [96], which shows that the ply bending stiffness of
the [45◦] sample with respect to the applied load is lower than the bending stiffness of the
[0◦] sample. Since the bending stiffness reduced, the compressive loading resistance of the
material’s plane decreases, which leads to the formation of ply wrinkles and then folds due
to the vacuum pressure.
It should be noted that the angle between the warp and weft yarns where the prepreg
can no longer deform without buckling is called the locking angle. This locking angle can
be determined experimentally as shown in [15,74], approximately 48◦ for this material, and
could be one reason behind the wrinkle formations at the double-curved section (location
A). However, wrinkling in some cases was evident at locations where the maximum shear
angle on the formed part was much less than the locking angle. Furthermore, the location
of the observed wrinkles is different than the location of the maximum shear angle as can be
seen in Figure 5.12 (b). Therefore, the combined properties, including bending and friction,
must be considered to understand their effect on the ply wrinkle formations.
These results suggest that the initial fabric orientation (start contact angle) in relation
to the applied pressure is an important consideration to minimize the occurrence of the
125
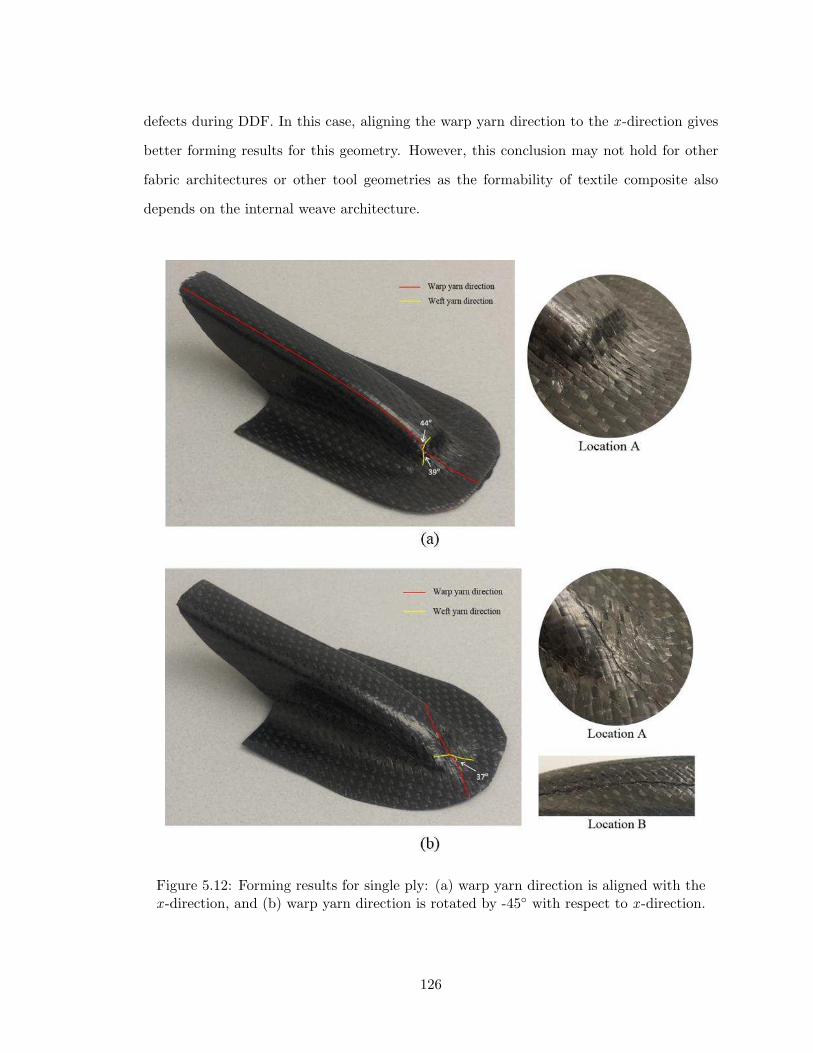
defects during DDF. In this case, aligning the warp yarn direction to the x -direction gives
better forming results for this geometry. However, this conclusion may not hold for other
fabric architectures or other tool geometries as the formability of textile composite also
depends on the internal weave architecture.
Figure 5.12: Forming results for single ply: (a) warp yarn direction is aligned with thex -direction, and (b) warp yarn direction is rotated by -45◦ with respect to x -direction.
126
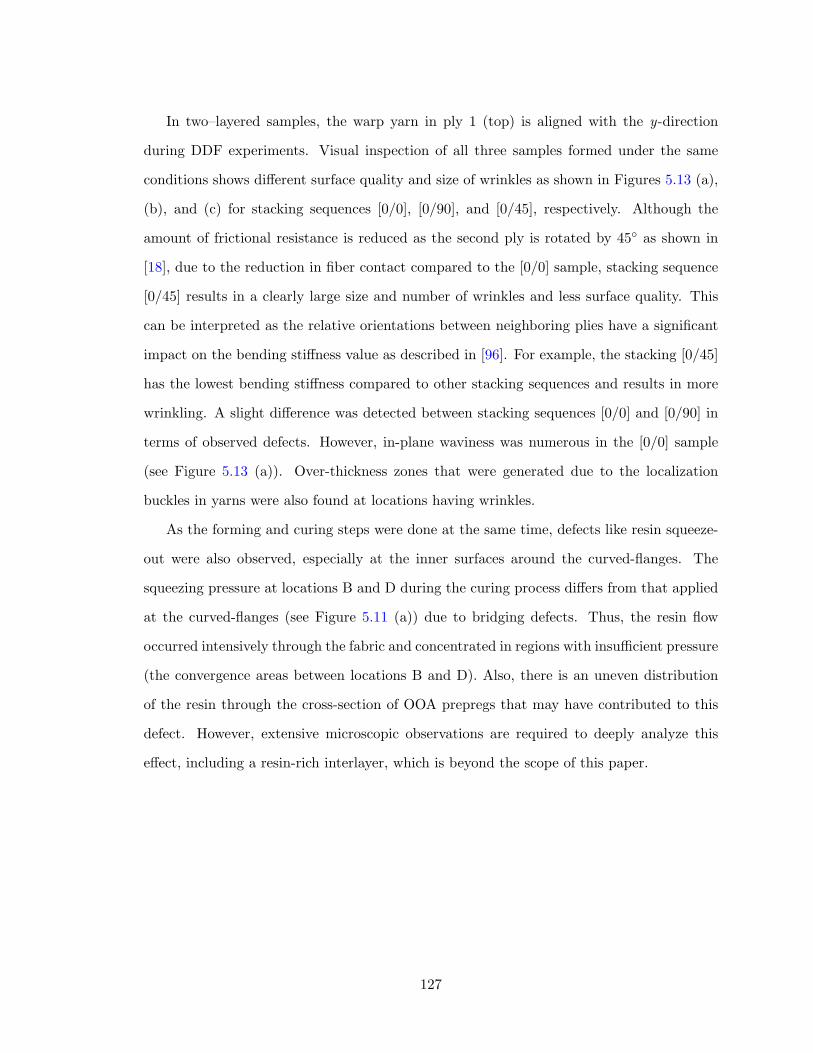
In two–layered samples, the warp yarn in ply 1 (top) is aligned with the y-direction
during DDF experiments. Visual inspection of all three samples formed under the same
conditions shows different surface quality and size of wrinkles as shown in Figures 5.13 (a),
(b), and (c) for stacking sequences [0/0], [0/90], and [0/45], respectively. Although the
amount of frictional resistance is reduced as the second ply is rotated by 45◦ as shown in
[18], due to the reduction in fiber contact compared to the [0/0] sample, stacking sequence
[0/45] results in a clearly large size and number of wrinkles and less surface quality. This
can be interpreted as the relative orientations between neighboring plies have a significant
impact on the bending stiffness value as described in [96]. For example, the stacking [0/45]
has the lowest bending stiffness compared to other stacking sequences and results in more
wrinkling. A slight difference was detected between stacking sequences [0/0] and [0/90] in
terms of observed defects. However, in-plane waviness was numerous in the [0/0] sample
(see Figure 5.13 (a)). Over-thickness zones that were generated due to the localization
buckles in yarns were also found at locations having wrinkles.
As the forming and curing steps were done at the same time, defects like resin squeeze-
out were also observed, especially at the inner surfaces around the curved-flanges. The
squeezing pressure at locations B and D during the curing process differs from that applied
at the curved-flanges (see Figure 5.11 (a)) due to bridging defects. Thus, the resin flow
occurred intensively through the fabric and concentrated in regions with insufficient pressure
(the convergence areas between locations B and D). Also, there is an uneven distribution
of the resin through the cross-section of OOA prepregs that may have contributed to this
defect. However, extensive microscopic observations are required to deeply analyze this
effect, including a resin-rich interlayer, which is beyond the scope of this paper.
127
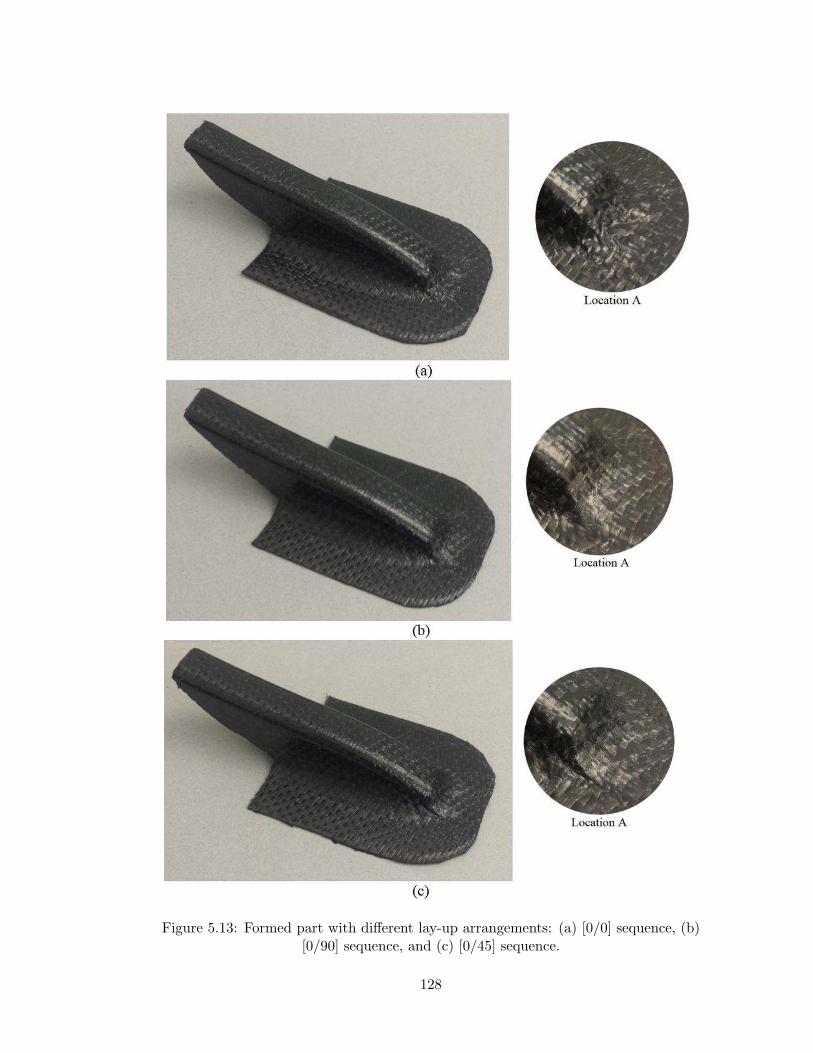
Figure 5.13: Formed part with different lay-up arrangements: (a) [0/0] sequence, (b)[0/90] sequence, and (c) [0/45] sequence.
128

5.5.2 Forming simulation results
To achieve a net-shape for the selected geometry during the forming simulation, the
ply shape, shown in Figure 5.14 (a), was obtained after several iterations. Figure 5.14
(b) shows a near net-shaped part after applying the simulation methodology described
above. There are still excessive materials in the flat zones due to the complexity of the
part, selected ply orientations, and formed defects. An initial forming simulation with
a rectangular ply demonstrated severe wrinkles and distortions in the undercut zones on
the back. Therefore, optimizing the ply shape during the DDF simulation is required to
obtain acceptable simulation outcomes. Note that the net–shaped ply was compared to
a rectangular ply during the forming experiments. However, only minor differences were
found between them in terms of observed defects. This occurred because the tool in the
DDF process was filled in the undercut zones on the back in order to facilitate the tool
machining. Thus, only rectangular plies were used in DDF experiments and then trimmed
to achieve the required shape (see Figure 5.11).
Figure 5.15 (a) shows the simulation results for a single-ply where the warp yarn direction
was aligned with the x -direction. Only one small wrinkle was found in location A. The
shear angle distributions throughout the part and the fiber stress in direction 1 (warp in
this case) are shown in Figures 5.15 (b) and (c), respectively. The higher shear angles were
concentrated in the double-curved zones in location A. The results show that the maximum
obtained shear angles and their locations were closed to the experimental observations.
However, the magnitude of the shear angles was somewhat smaller for the experimental
case due to the bridging defects that prevented the material from deforming more around
the curved sections as described earlier. Further, these results are in accordance with the
experimental findings in terms of formed wrinkles and overall quality (see Figure 5.12 (a)).
The location of the maximum compressive stress in the fiber (blue in Figure 5.15 (c)) was
found to have a similar position for the observed wrinkle.
129
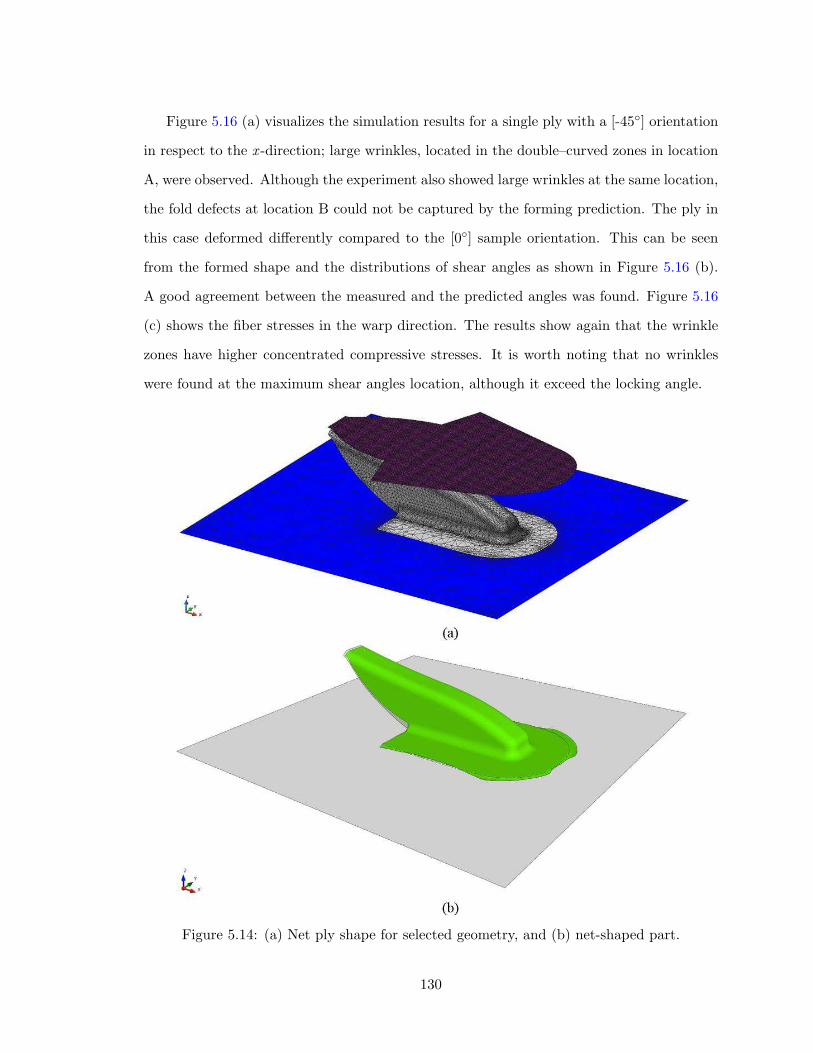
Figure 5.16 (a) visualizes the simulation results for a single ply with a [-45◦] orientation
in respect to the x -direction; large wrinkles, located in the double–curved zones in location
A, were observed. Although the experiment also showed large wrinkles at the same location,
the fold defects at location B could not be captured by the forming prediction. The ply in
this case deformed differently compared to the [0◦] sample orientation. This can be seen
from the formed shape and the distributions of shear angles as shown in Figure 5.16 (b).
A good agreement between the measured and the predicted angles was found. Figure 5.16
(c) shows the fiber stresses in the warp direction. The results show again that the wrinkle
zones have higher concentrated compressive stresses. It is worth noting that no wrinkles
were found at the maximum shear angles location, although it exceed the locking angle.
Figure 5.14: (a) Net ply shape for selected geometry, and (b) net-shaped part.
130

Figure 5.15: Forming predictions of single ply when the warp yarn direction is alignedwith the x -direction: (a) observed defects, (b) shear angle distribution, and
(c) fiber stress in warp direction.
131

Figure 5.16: Forming predictions of single ply with -45◦ orientation respect to thex -direction: (a) observed defects, (b) shear angle distribution, and
(c) fiber stress in warp direction.
The forming predictions for all three stacking sequences of [0/0], [0/90], and [0/45] over
the selected geometry are shown in Figures 5.17, 5.18, and 5.19, respectively. The warp
direction in ply 1 (top) was aligned with y-direction for all three selected sequences. Stacking
[0/0] and [0/90] showed a similar number of wrinkle formations and locations. However,
the size of the wrinkles is relatively smaller for the [0/90] lay-up, and it showed better tool
conformity. On the contrary, the [0/45] lay-up shows severe wrinkles and less surface quality
132
(see Figure 5.19 (a)). Looking carefully to the shear angle distributions in each ply for all
three sequences showed that the stack [0/90] has the highest in-plane shear deformations.
Moreover, as discussed previously in [18], the rotation of fibers inside the laminate eased the
sliding and thus decreased the frictional resistance, which allows for correct accommodation
of the desired shape. However, stack [0/0] has the highest frictional resistance, but shows
better forming results both experimentally and numerically when compared to the [0/45]
lay-up. This is attributed to the difference in bending stiffness values between the two
stacking sequences as explained in detail in [96]. Therefore, the stack is more sensitive to
wrinkling when the lower bending stiffness and higher friction between plies are expected.
Further analysis of the fiber stresses in each ply for all three stacks showed that wrinkles
occurred at the locations having higher compressive stresses as shown in Figures 5.17 (c),
5.18 (c), and 5.19 (c). This compressive stress may provide a good indication for where the
critical areas appear, mainly when the element size is much larger than the typical size of
the defects. However, this also depends on the orientation of the ply and the chosen lay-up.
Overall, concentrated compressive stresses in the most selected cases herein led to wrinkles
in the DDF experiments. A summary of all performed simulations and experiments and
how well the observed defects were predicted by the FE model is given in Table 5.4. This
includes the overall part quality, which is described by a semi qualitative ranking scale (from
1 to 5), with 1 denoting very poor quality and 5 a flawless part (see Table 5.4).
The simulation results also showed less bridging defects around the curved-flanges com-
pared to the formed parts from the DDF process. The variation in heating arrangements
between the upper and lower diaphragms may cause different responses between the two
diaphragms during the forming process [86]. This may further lead to folding and bridging
defects during the DDF experiments. Therefore, future work is required to predict tem-
perature gradients in the prepreg stack and the two diaphragms during the DDF process.
However, the simulations show sufficient predictions in terms of when and where different
kinds of wrinkles appear during the DDF over the selected geometry. Prior to investing in
expensive trial and error tests, this prediction tool allows to redesign the part with further
considerations such as material types, excessive materials locations, start contact angle,
133

appropriate stacking sequences and suitable process parameters.
Figure 5.17: Forming predictions of [0/0] lay-up sequence: (a) observed defects, (b) shearangle distribution, and (c) fiber stress in warp direction.
134
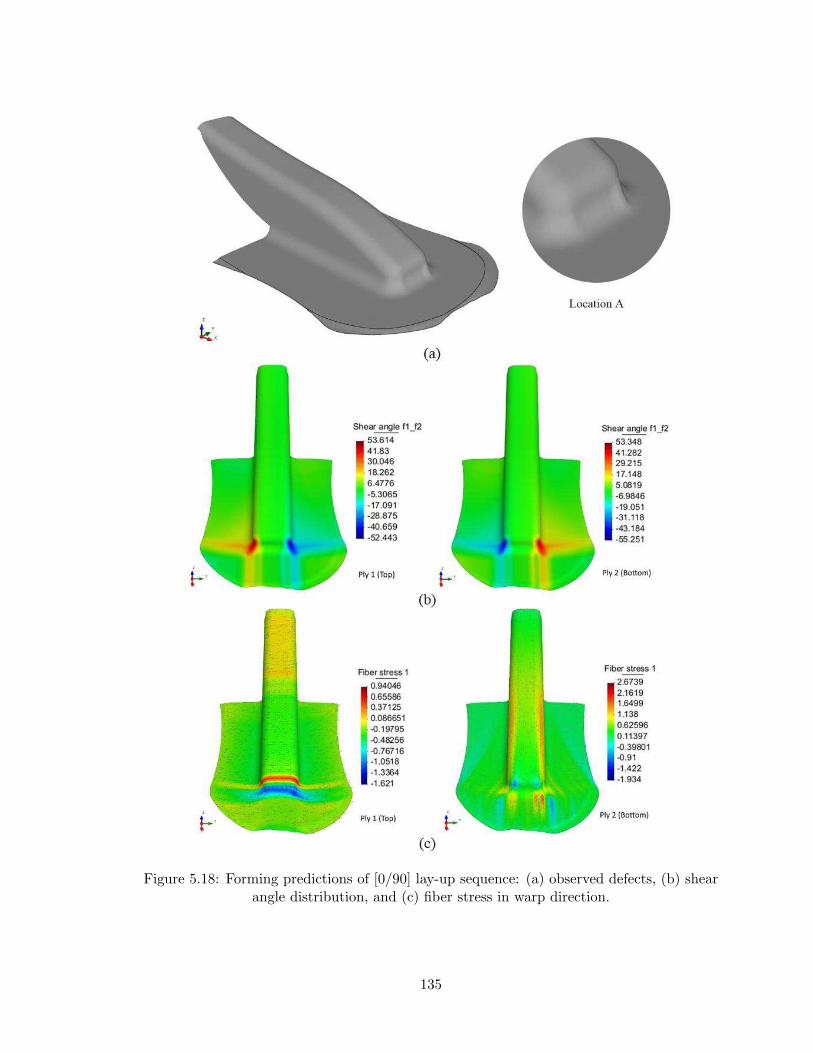
Figure 5.18: Forming predictions of [0/90] lay-up sequence: (a) observed defects, (b) shearangle distribution, and (c) fiber stress in warp direction.
135
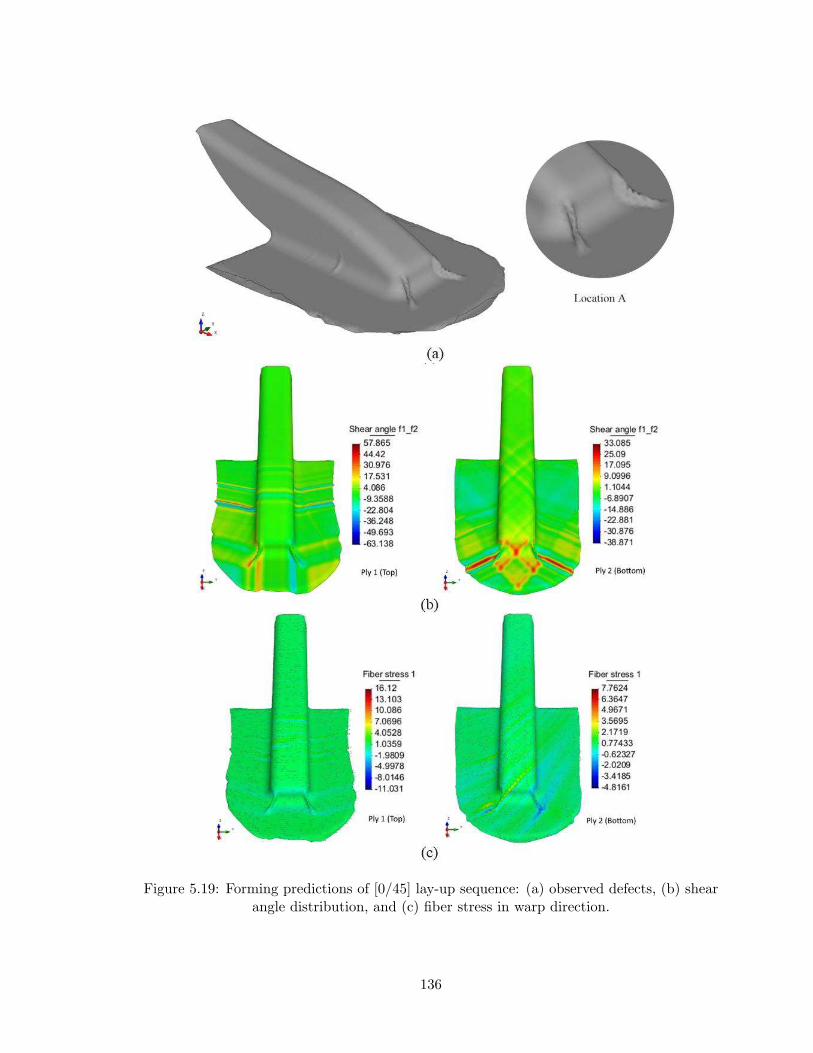
Figure 5.19: Forming predictions of [0/45] lay-up sequence: (a) observed defects, (b) shearangle distribution, and (c) fiber stress in warp direction.
136
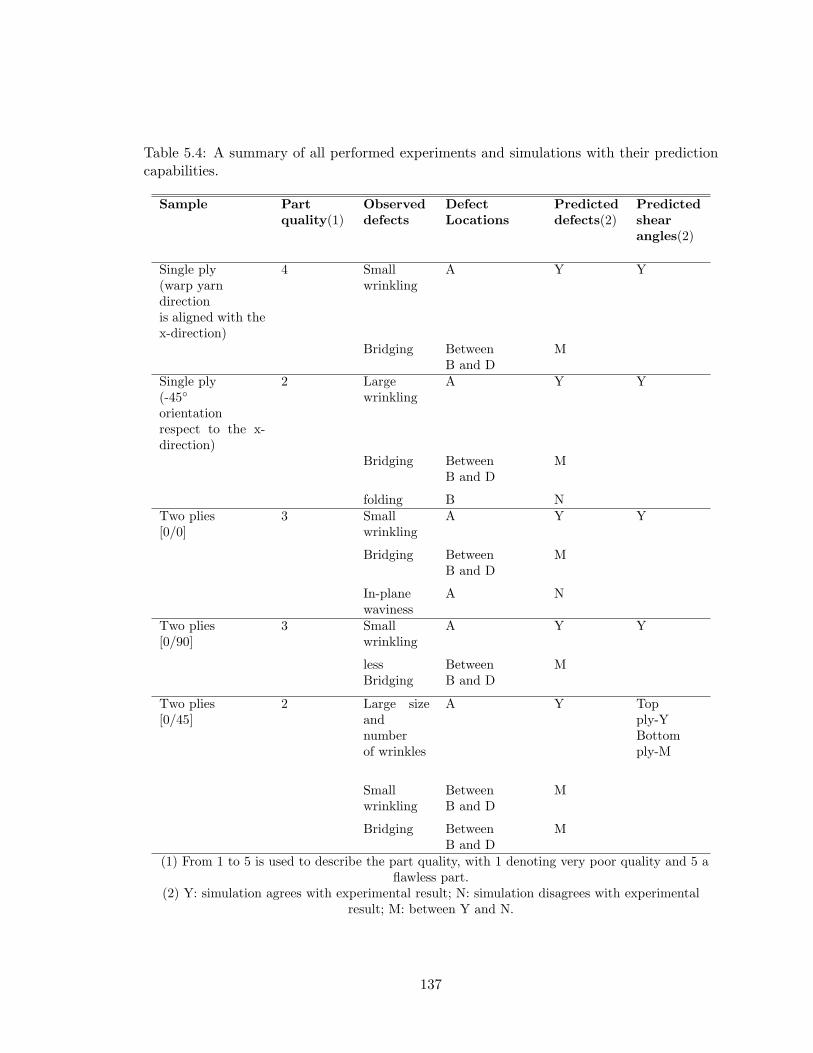
Table 5.4: A summary of all performed experiments and simulations with their predictioncapabilities.
Sample Partquality(1)
Observeddefects
DefectLocations
Predicteddefects(2)
Predictedshearangles(2)
Single ply(warp yarndirectionis aligned with thex-direction)
4 Smallwrinkling
A Y Y
Bridging BetweenB and D
M
Single ply(-45◦
orientationrespect to the x-direction)
2 Largewrinkling
A Y Y
Bridging BetweenB and D
M
folding B NTwo plies[0/0]
3 Smallwrinkling
A Y Y
Bridging BetweenB and D
M
In-planewaviness
A N
Two plies[0/90]
3 Smallwrinkling
A Y Y
lessBridging
BetweenB and D
M
Two plies[0/45]
2 Large sizeandnumberof wrinkles
A Y Topply-YBottomply-M
Smallwrinkling
BetweenB and D
M
Bridging BetweenB and D
M
(1) From 1 to 5 is used to describe the part quality, with 1 denoting very poor quality and 5 aflawless part.
(2) Y: simulation agrees with experimental result; N: simulation disagrees with experimentalresult; M: between Y and N.
137
5.5.3 Mitigation of wrinkle defects
In this section, different forming simulation scenarios were applied to reduce the wrinkle
defects in [0/45] lay-up as this was the most challenging sequence for the geometry con-
sidered. First, stacking sequences [0/30] and [0/60] were examined to further understand
the effect of ply orientation within the stacks as outlined in Figures 5.20 (a) and (b), respect-
ively. It was shown that there is only a small reduction in the formed wrinkles compared to
the [0/45] stack. However, the location of the wrinkle is different, as each layer shows dif-
ferent deformability depending on its relative fiber angle. Figure 5.20 (c) shows the forming
outcome when the bending stiffness value is multiplied by 2. A slight improvement was seen
in terms of minimizing the size of wrinkle formations. Also, the large wrinkle that appeared
in the curved-flange zone vanished. Since the bending stiffness increases, bridging defects
at locations with double curvature may tend to occur. Chen et al. [86] showed that the
wrinkling decreases simultaneously as the number of bridging fibers decreases. However,
this also depends on the tools and materials considered. On the other hand, a reduction
in friction between plies showed no major difference compared to the reference stack (see
Figure 5.20 (d)). Additionally, wrinkle size is smaller when friction is low.
From all applied scenarios, it seems that when there are fibers with certain angles (in
this case, the x -direction), wrinkles cannot be avoided. The formability can be improved,
however, when the fibers are parallel or perpendicular to the x -direction, as described in
the previous section. Note that this was not the case for the UD stacks in [77]. Although
forming a flat of textile OOA prepreg into a complex shape using the DDF process is not
straightforward, a wrinkle-free part can be produced. However, more investigation into the
process-induced defects is needed to improve the formability of OOA prepregs.
138
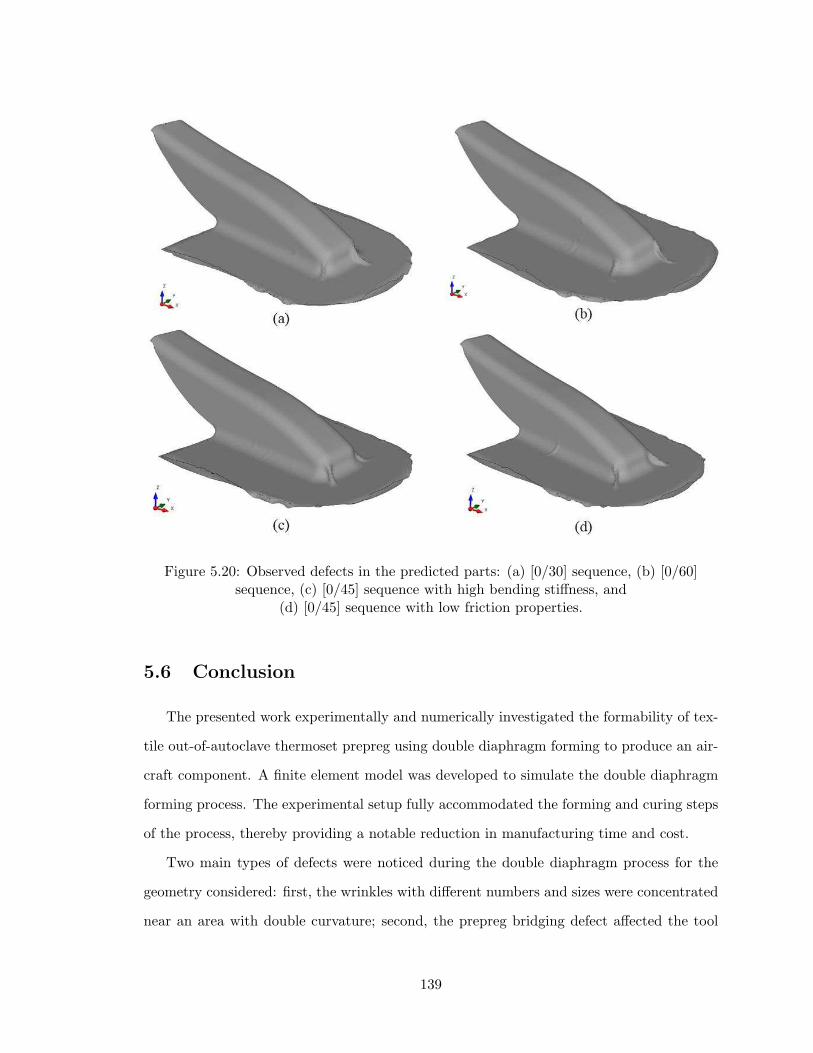
Figure 5.20: Observed defects in the predicted parts: (a) [0/30] sequence, (b) [0/60]sequence, (c) [0/45] sequence with high bending stiffness, and
(d) [0/45] sequence with low friction properties.
5.6 Conclusion
The presented work experimentally and numerically investigated the formability of tex-
tile out-of-autoclave thermoset prepreg using double diaphragm forming to produce an air-
craft component. A finite element model was developed to simulate the double diaphragm
forming process. The experimental setup fully accommodated the forming and curing steps
of the process, thereby providing a notable reduction in manufacturing time and cost.
Two main types of defects were noticed during the double diaphragm process for the
geometry considered: first, the wrinkles with different numbers and sizes were concentrated
near an area with double curvature; second, the prepreg bridging defect affected the tool
139
conformity, especially at deep concave locations. The experimental and numerical results
indicated that a change in lay-up sequences significantly affects the formability. Depending
on the lay-up arrangement, wrinkling in the formed part differed remarkably due to the
deformation modes that occurred during the forming process and their resistances to the
forming loads.
The forming simulations showed sufficient predictions in terms of when and where dif-
ferent kinds of wrinkles would appear during the DDF over the selected geometry. Higher
local compressive stresses in each single ply during forming simulations led to wrinkles in
the DDF experiments. This may be a good indication of where the critical areas will appear,
and it can be considered when the small wrinkles cannot be predicted with the element size
used.
Further work is needed to improve the formability of OOA prepregs through a focus
on the process-induced defects, such as different temperature arrangements between the
prepreg and the two diaphragms, unbalanced clamping forces, diaphragm material stiffness
and thickness, and insufficient forming loads.
140

Chapter 6
Conclusions, Contributions, and Recommend-
ations
This chapter summarizes the major conclusions arising from the work described in this
thesis. Contributions and publications accomplished during the course of the current re-
search work are highlighted. Moreover, several recommendations for future work are made.
6.1 Concluding remarks
The thesis focuses on the out-of-plane bending behavior of textile prepregs, which plays
an important role in determining wrinkle formation during composite forming. A new test
method for characterizing the bending behavior of prepreg materials at forming conditions
was developed based on a vertical cantilever test associated with a linear actuator and
load cell. This test method allowed for the sufficient control of deflection shape, testing
rates, and processing temperatures within the range of thermosetting resin. Moreover,
the developed experimental procedure allowed for investigation into viscoelastic effects and
demonstrated good reproducibility of results. A new method for calculating the bending
stiffness was proposed to minimize the effort needed to extract the data points for obtaining
the deflection equation.
An experimental investigation of bending behavior of satin woven carbon/epoxy prepregs
was assessed across different sample configurations, processing temperatures, and rates. The
results revealed that bending stiffness is approximately 20% higher in the warp direction
than in the weft direction; it decreased significantly with increasing temperature. This
decrease is strongly correlated with resin viscosity reduction: higher temperatures reduce
141
the load required to achieve the same tip displacement. Note that increased temperature
may also increase the incidence of wrinkling during the forming process, because the ac-
companying reduction in bending stiffness decreases the resistance to compressive loading
in the plane of the material. A comparison between the prepreg sample and the dry sample
indicated that the uncured resin matrix has a significant impact in the outcomes. Moreover,
the experiments showed that bending behavior is rate-dependent, due to the viscoelastic
behavior of the prepreg.
Reliance on the tensile modulus to assess bending stiffness of prepreg tends to produce
an unrealistically elevated stiffness assessment. Thus, a theoretical model was developed
that can be applied for a wide range of processing conditions to predict the bending behavior
of thermosetting composite prepreg during the forming process. The model included the
processing temperature and rate and was validated using a set of experimental tests. The
predicted bending stiffness was found to be in good agreement with experimental values at
selected conditions. However, slight differences occurred due to the complexity of undulation
in a woven fabric structure. A new approach for considering the testing rate and temperature
with respect to a reference value was also developed. The proposed approach reasonably
captured the trend of the rate and temperature dependencies of selected materials without
performing extensive experiments for relaxation test at the desired rates and temperatures.
The bending properties obtained by the proposed model can be used as the initial inputs
in a finite element model.
The developed test method was used to investigate the bending properties of mul-
tilayered textile thermosetting composite prepregs under conditions relevant to the forming
process. A finite element model based on a viscoelastic approach was developed to predict
the bending behavior of different stacking sequences at different processing parameters,
including temperature and rate. The effect of textile stacking sequences on out-of-plane
bending deformation was studied experimentally and numerically for the first time. The
bending properties strongly depend on the fabric lay-up inside multiple stacked plies. The
predicted bending properties were found to be in good agreement with the experimental
results for selected stacking sequences. The feasibility of using a viscoelastic material model
142
to model the bending behavior of selected material and its application in forming simula-
tion was analyzed. A notable difference in bending behavior was observed after comparing
Kelvin–Voigt and elastic material models. Moreover, bending behavior is also influenced by
the friction between plies, which plays an important role in terms of facilitating the through-
thickness shearing during the bending experiments at processing temperature. The forming
simulation outcomes showed that high bending stiffness along with low friction between the
plies may help increase the limit of shear deformation (shear angles), ultimately providing
a reduction in wrinkling.
Finally, this study investigated the formability of textile out-of-autoclave thermoset
prepreg using double diaphragm forming over a complex structure for aerospace applica-
tions. A custom-built double diaphragm forming setup was developed. It consisted of three
main parts: double diaphragm tool, vacuum system, and heating system. The experimental
setup fully accommodated the forming and curing steps of the process, thereby providing a
notable reduction in manufacturing time and cost. A finite element model was developed
to simulate the double diaphragm forming process. The diaphragm and prepreg material
properties at forming conditions, including their out-of-plane bending properties, were con-
sidered in the FE model. An evaluation of the double diaphragm forming process in terms
of observed defects, stacking sequences, and pre–forming state was carried out.
Wrinkles and bridging were found to be the dominant defects during double diaphragm
forming. The experimental and numerical results indicated that a change in lay-up se-
quences significantly affects the formability. Depending on the lay-up arrangement, wrink-
ling in the formed part differed remarkably due to the deformation modes that occurred
during the forming process and their resistances to the forming loads. The forming simula-
tions showed sufficient predictions in terms of when and where different kinds of wrinkles
would appear during the double diaphragm forming over the selected geometry. Higher
local compressive stresses in each single ply during forming simulations led to wrinkles in
the double diaphragm forming experiments. This may be a good indication of where the
critical areas will appear, and it can be considered when the small wrinkles cannot be
predicted with the element size used.
143
6.2 Contributions
This work made an attempt to investigate the bending deformation behavior of textile
woven out-of-autoclave thermoset prepregs both experimentally and numerically and to
implement the findings into a forming simulation. The main contributions from the present
PhD thesis include the following:
(1) A new approach for characterizing the bending behavior of prepreg materials at form-
ing conditions was developed, offering more precise control of deflection shape, testing
rates, and processing temperatures.
(2) For the first time, the bending behavior of out-of-autoclave thermoset prepregs in-
cluding multilayered samples was studied under conditions relevant to the forming
operation.
(3) A theoretical model for predicting the bending behavior of thermosetting composite
perpreg during the forming process was proposed. This model can be applied to a
wide range of processing conditions, including the processing temperature and rate.
(4) A new approach for considering the testing rate and temperature with respect to a
reference value was presented. This proposed approach is beneficial for minimizing
the efforts required for relaxation test at the desired rates and temperatures.
(5) A finite element model was proposed based on a viscoelastic approach to predict the
bending behavior of multilayered textile thermosetting composite using commercial
software (AniForm). This model will reduce the effort required by the experimental
investigations and help the modeler determine the correct parameter values to set
during the simulation process.
(6) The formability of out-of-autoclave thermoset prepregs using the double diaphragm
forming process was investigated. A one-step procedure was used for both the forming
and curing processes using the same experimental setup.
144

(7) A finite element model was built to simulate the double diaphragm forming process.
Significant investigations were made to obtain the required properties for the material
models in the FE simulation, including the diaphragm material properties.
(8) The relationships between important considerations during forming simulation, such
as local fiber compressive stresses, shear angle distributions, and stacking lay-up se-
quences, were analyzed to identify potential causes for defect development.
In addition to the above contributions, the following publications have been accomplished
during the journey of this study:
Journal Papers
(1) Alshahrani H, Hojjati M. A new test method for the characterization of the bending
behavior of textile prepregs. Composites Part A: Applied Science and Manufacturing.
2017; 97:128-140.
(2) Alshahrani H, Hojjati M. A theoretical model with experimental verification for
bending stiffness of thermosetting prepreg during forming process. Composite Struc-
tures. 2017; 166:136-145.
(3) Alshahrani H, Hojjati M. Bending behavior of multilayered textile composite prepregs:
Experiment and finite element modeling. Materials & Design. 2017; 124:211-224.
(4) Alshahrani H, Hojjati M. Experimental and numerical investigations on formability
of out-of-autoclave thermoset prepreg using a double diaphragm process. Composites
Part A: Applied Science and Manufacturing. 2017; 101:199-214.
(5) Alshahrani H, Mohan R, Hojjati M. Experimental investigation of in-plane shear de-
formation of out-of-autoclave prepreg. International Journal of Composite Materials.
2015; 5(4):81-87.
145
(6) Alshahrani H, Hojjati M. Influence of double-diaphragm vacuum compaction on
deformation during forming of composite prepregs. Journal of Science: Advanced
Materials and Devices. 2016; 1(4):507-511.
(7) Mohan RP, Alshahrani H, Hojjati M. Investigation of intra-ply shear behavior
of out-of-autoclave carbon/epoxy prepreg. Journal of Composite Materials. 2016;
50(30):4251-4268.
Conference Papers
(1) Alshahrani H, Mohan R, Hojjati M. Evaluation of in-plane shear deformation of
out-of-autoclave carbon/epoxy prepregs using bias extension test. In: Proceedings of
CAMX 2014 Conf. Orlando, FL. USA; 2014.
(2) Alshahrani H, Hojjati M. Optimum processing parameters for hot drape forming of
out-of-autoclave prepreg over complex shape using a double diaphragm technique. In
20th International Conference on Composite Materials, Copenhagen, Denmark, 2015.
(3) Alshahrani H, Hojjati M. In-plane shear deformability of out-of-autoclave prepregs
under double-diaphragm vacuum compaction. In ICANM 2015: International Confer-
ence and Exhibition on Advanced and Nano Materials, pp. 170-177, Ottawa, Canada,
2015.
(4) Alshahrani H, Hojjati M. Out-of-plane bending properties of out-of-autoclave ther-
mosetting prepregs during forming processes. ICCET 2016: 18th International Con-
ference on Composite Engineering and Technology. Dubai, UAE, 2016.
(5) Alshahrani H, Hojjati M. Comparison of horizontal and vertical cantilever tests for
the characterization of bending behavior in woven fabric prepregs. In 3rd Interna-
tional Conference on Plastic, Rubber and Composites, Seoul, Korea, 22-23 July, 2016.
146
(6) Alshahrani H, Hojjati M. Analysis of formability of thick composite component
under double-diaphragm forming process. In 2nd International Conference on Pro-
duction Automation and Mechanical Engineering, pp. 185189, Montreal, Canada,
2016.
(7) Alshahrani H, Hojjati M. Bending behavior of woven fabric out-of-autoclave prepreg
in forming. Accepted in CANCOM 2017 - Canadian International Conference On
Composite Materials, Ottawa, Canada, 17-20 July 2017.
(8) Alshahrani H, Hojjati M. Investigation of shear-bending coupled properties in com-
posite prepreg forming. Submitted to 21th International Conference on Composite
Materials, Xi’an, China, 20-25 August 2017.
(9) R. Mohan, H. Alshahrani, M. Hojjati. The Effect of processing parameters on intra-
ply shear property of out-autoclave carbon/epoxy prepreg. In 10th Canada-Japan
Workshop on Composites, Vancouver, Canada, 2014.
147

6.3 Recommendations
6.3.1 Technical recommendations
To improve the formability of textile composites prepregs and minimize the possible failures
during double diaphragm process, the following set of recommendations and guidelines are
delivered to end-users:
• In the case of forming woven fabric over complex shapes, the satin weave style is
preferred.
• The fabric lay-up inside multiple stacked plies with high bending stiffness and low
friction properties is recommended as long as the desired tool shape can be correctly
achieved.
• The forming work area should be three times larger than the tool size to obtain a
better conformity.
• Forming temperature (70 ◦C) with a lower forming speed are preferred for processing
of thermosetting matrix.
• Great care must be taken during placing of the samples between the two diaphragms.
• Initial orientation of sample respect to the direction of the largest curvature on the
forming tool should avoid the 45◦ orientation.
• In forming simulation, the actual bending properties should be used according to the
selected processing conditions.
• The analysis of observed defects during forming simulation should include the com-
pressive stresses in the fiber, which can be a good indication of where the critical areas
will appear.
148
6.3.2 Recommendations for future work
As an extension to this research, several recommendations for future work are made as
follows:
(1) The present PhD thesis mainly investigates the bending behavior of woven out-of-
autoclave thermoset prepregs in a macro-scale level. The out-of-autoclave prepregs
are different from most autoclave prepregs in that the upper and lower fiber plies are
partially impregnated with the resin system. Microscopic investigations are required
to study the effect of resin-rich interlayer flow on bending deformation mechanism,
especially at elevated temperatures and for thick samples.
(2) To further understand the material’s formability for thick components, the contribu-
tion of transverse intra-ply shear to the bending behavior needs to be determined and
explored through the finite element implementation with application to a forming sim-
ulation. This also requires some improvements in the current test method, including
the load capacity and the temperature arrangement for different material types.
(3) As a continued work, the coupling effect of shear on bending properties should be stud-
ied as these deformation mechanisms during the actual forming process are combined.
A numerical study using the combined shear-bending properties can be compared with
those obtained from each separate test.
(4) The current viscoelastic bending model can be extended to include a non-linear viscous
behavior, which can then be implemented in a finite element formulation to assess its
effect on the forming simulation outcomes.
(5) The inherent undulation between yarns in woven-fabric structures should be con-
sidered to improve the prediction capabilities. A micro-model for woven fabric is
recommended, which can be achieved through an appropriate description of the yarn
geometry and the consideration of internal weave architecture. The application of
the current model can be extended to study the defect formations during steering in
149
Automated Fiber Placement (AFP). This can be achieved by assuming the prepreg
yarn is subjected to buckling load.
(6) The prediction of defects during double diaphragm forming requires considering the
temperature development in the prepreg stack and the two diaphragms.
(7) In a double diaphragm forming process, the considerations of temperature arrange-
ments between the prepreg and the two diaphragms, clamping forces, diaphragm
material stiffness and thickness, and forming loads are necessary to improve the form-
ability of OOA prepregs.
(8) Further work is needed to improve the rate control method during the double dia-
phragm forming process in order to elaborate its impact in detail on the forming
results. Such work should also compare the results with those obtained from the
press forming process, where the forming rate is well-controlled.
150

Bibliography
[1] Boeing 787, “Aircraft Rescue and Firefighting Composite Structure,” accessed 15-
March-2017.
[2] A. C. Long, Design and manufacture of textile composites. Elsevier, 2005.
[3] D. Bhattacharyya, Composite sheet forming. Elesvier, Amsterdam, 1997.
[4] C. Tucker, Forming of advanced composites. Wiley, New York, 1997.
[5] X. Yu, L. Zhang, and Y.-W. Mai, “Modelling and finite element treatment of intra-ply
shearing of woven fabric,” Journal of materials processing technology, vol. 138, no. 1,
pp. 47–52, 2003.
[6] A. C. Long (editor), Composites forming technolgies. CRC Press LLC, Boca Raton
FL, 2007.
[7] S. P. Haanappel, R. H. W. Ten Thije, U. Sachs, B. Rietman, and R. Akkerman, “Form-
ability analyses of uni-directional and textile reinforced thermoplastics,” Composites
Part A: Applied Science and Manufacturing, vol. 56, pp. 80–92, 2014.
[8] J. S. Lightfoot, M. R. Wisnom, and K. Potter, “Defects in woven preforms: Formation
mechanisms and the effects of laminate design and layup protocol,” Composites Part
A: Applied Science and Manufacturing, vol. 51, pp. 99–107, 2013.
[9] B. Zhu, T. Yu, and X. Tao, “An experimental study of in-plane large shear deformation
of woven fabric composite,” Composites Science and Technology, vol. 67, no. 2, pp. 252–
261, 2007.
[10] G. Lebrun, M. N. Bureau, and J. Denault, “Evaluation of bias-extension and picture-
frame test methods for the measurement of intraply shear properties of PP/glass com-
mingled fabrics,” Composite Structures, vol. 61, no. 4, pp. 341–352, 2003.
151
[11] P. Boisse, N. Hamila, E. Vidal-Salle, and F. Dumont, “Simulation of wrinkling dur-
ing textile composite reinforcement forming. Influence of tensile, in-plane shear and
bending stiffnesses,” Composites Science and Technology, vol. 71, no. 5, pp. 683–692,
2011.
[12] P. Harrison, M. Clifford, and A. Long, “Shear characterisation of viscous woven textile
composites: a comparison between picture frame and bias extension experiments,”
Composites Science and Technology, vol. 64, no. 10, pp. 1453–1465, 2004.
[13] E. Guzman-Maldonado, N. Hamila, P. Boisse, and J. Bikard, “Thermomechanical ana-
lysis, modelling and simulation of the forming of pre-impregnated thermoplastics com-
posites,” Composites Part A: Applied Science and Manufacturing, vol. 78, pp. 211–222,
2015.
[14] I. Taha, Y. Abdin, and S. Ebeid, “Comparison of picture frame and bias-extension
tests for the characterization of shear behaviour in natural fibre woven fabrics,” Fibers
and Polymers, vol. 14, no. 2, p. 338, 2013.
[15] H. Alshahrani, R. Mohan, and M. Hojjati, “Experimental investigation of in-plane
shear deformation of out-of-autoclave prepreg,” International Journal of Composite
Materials, vol. 5, no. 4, pp. 81–87, 2015.
[16] R. P. Mohan, H. Alshahrani, and M. Hojjati, “Investigation of intra-ply shear behavior
of out-of-autoclave carbon/epoxy prepreg,” Journal of Composite Materials, vol. 50,
no. 30, pp. 4251–4268, 2016.
[17] K. Vanclooster, Forming of multilayered fabric reinforced thermoplastic composites.
Phd thesis, KU Leuven, 2009.
[18] H. Grewal, Characterization of interply shear behaviour of out-of-autoclave thermoset-
ting prepreg composites. Master’s thesis, Concordia University, 2015.
152
[19] J. Sun, Y. Gu, M. Li, X. Ma, and Z. Zhang, “Effect of forming temperature on the qual-
ity of hot diaphragm formed C-shaped thermosetting composite laminates,” Journal
of Reinforced Plastics and Composites, vol. 31, no. 16, pp. 1074–1087, 2012.
[20] Y. R. Larberg and M. Akermo, “On the interply friction of different generations of car-
bon/epoxy prepreg systems,” Composites Part A: Applied Science and Manufacturing,
vol. 42, no. 9, pp. 1067–1074, 2011.
[21] K. A. Fetfatsidis, D. Jauffres, J. A. Sherwood, and J. Chen, “Characterization of the
tool/fabric and fabric/fabric friction for woven-fabric composites during the thermo-
stamping process,” International journal of material forming, vol. 6, no. 2, pp. 209–221,
2013.
[22] J. Sun, M. Li, Y. Gu, D. Zhang, Y. Li, and Z. Zhang, “Interply friction of carbon
fiber/epoxy prepreg stacks under different processing conditions,” Journal of Composite
Materials, vol. 48, no. 5, pp. 515–526, 2014.
[23] K. A. Fetfatsidis, L. M. Gamache, J. L. Gorczyca, J. A. Sherwood, D. Jauffres, and
J. Chen, “Design of an apparatus for measuring tool/fabric and fabric/fabric friction
of woven-fabric composites during the thermostamping process,” International journal
of material forming, vol. 6, no. 1, pp. 1–11, 2013.
[24] B. Liang, N. Hamila, M. Peillon, and P. Boisse, “Analysis of thermoplastic prepreg
bending stiffness during manufacturing and of its influence on wrinkling simulations,”
Composites Part A: Applied Science and Manufacturing, vol. 67, pp. 111–122, 2014.
[25] S. Allaoui, P. Boisse, S. Chatel, N. Hamila, G. Hivet, D. Soulat, and E. Vidal-Salle,
“Experimental and numerical analyses of textile reinforcement forming of a tetrahedral
shape,” Composites Part A: Applied Science and Manufacturing, vol. 42, no. 6, pp. 612–
622, 2011.
[26] D. Soulat, A. Cheruet, and P. Boisse, “Simulation of continuous fibre reinforced ther-
moplastic forming using a shell finite element with transverse stress,” Computers &
structures, vol. 84, no. 13, pp. 888–903, 2006.
153
[27] W. R. Yu, M. Zampaloni, F. Pourboghrat, K. Chung, and T. J. Kang, “Analysis of
flexible bending behavior of woven preform using non-orthogonal constitutive equa-
tion,” Composites Part A: Applied Science and Manufacturing, vol. 36, pp. 839–850,
2005.
[28] E. Guzman-Maldonado, N. Hamila, N. Naouar, G. Moulin, and P. Boisse, “Simulation
of thermoplastic prepreg thermoforming based on a visco-hyperelastic model and a
thermal homogenization,” Materials & Design, vol. 93, pp. 431–442, 2016.
[29] D. Dorr, F. J. Schirmaier, F. Henning, and L. Karger, “A viscoelastic approach for
modeling bending behavior in finite element forming simulation of continuously fiber re-
inforced composites,” Composites Part A: Applied Science and Manufacturing, vol. 94,
pp. 113–123, 2017.
[30] U. Sachs, Friction and bending in thermoplastic composites forming processes. Phd
thesis, University of Twente, 2014.
[31] PAM-FORM, “Engineering System International. www.esi-group.com.”
[32] AniForm Virtual Forming Tool, “Software and help-manual. www.aniform.com.”
[33] D. Lukaszewicz, C. Ward, and K. Potter, “The engineering aspects of automated
prepreg layup: History, present and future,” Composites Part B: Engineering, vol. 43,
no. 3, pp. 997–1009, 2012.
[34] P. Wang, N. Hamila, and P. Boisse, “Thermoforming simulation of multilayer compos-
ites with continuous fibres and thermoplastic matrix,” Composites Part B: Engineering,
vol. 52, pp. 127–136, 2013.
[35] S. Ropers, M. Kardos, and T. A. Osswald, “A thermo-viscoelastic approach for the
characterization and modeling of the bending behavior of thermoplastic composites,”
Composites Part A, vol. 90, pp. 22–32, 2016.
[36] F. T. Peirce, “The Handle of Cloth As a Measurable Quantity,” Journal of the Textile
Institute Transactions, vol. 21, pp. 377–416, 1930.
154
[37] ASTM D1388-08, “Standard Test Method for Stiffness of Fabrics,” ASTM Interna-
tional, 2012.
[38] E. Bilbao, D. Soulat, G. Hivet, and A. Gasser, “Experimental Study of Bending Beha-
viour of Reinforcements,” Experimental Mechanics, vol. 50, no. 3, pp. 333–351, 2009.
[39] D. Soteropoulos, K. Fetfatsidis, J. a. Sherwood, and J. Langworthy, “Digital method
of analyzing the bending stiffness of non-crimp fabrics,” in Proceedings of the 14th
International ESAFORM Conference, vol. 1353, pp. 913–917, 2011.
[40] L. M. Dangora, C. Mitchell, K. D. White, J. A. Sherwood, and J. C. Parker, “Charac-
terization of temperature-dependent tensile and flexural rigidities of a cross-ply ther-
moplastic lamina with implementation into a forming model,” International Journal
of Material Forming, 2016.
[41] S. Kawabata, “The standardisation and analysis of hand evaluation,” The Textile Ma-
chinery Society of Japan, Osaka, 1980.
[42] S. Lomov, I. Verpoest, M. Barburski, and J. Laperre, “Carbon composites based on
multiaxial multiply stitched preforms. Part 2. KES-F characterisation of the deform-
ability of the preforms at low loads,” Composites Part A: Applied Science and Manu-
facturing, vol. 34, no. 4, pp. 359–370, 2003.
[43] T. A. Martin, D. Bhattacharyya, and I. F. Collins, “Bending of fibre-reinforced ther-
moplastic sheets,” Composites Manufacturing, vol. 6, no. 3, pp. 177–187, 1995.
[44] J. Wang, A. C. Long, and M. J. Clifford, “Experimental measurement and predict-
ive modelling of bending behaviour for viscous unidirectional composite materials,”
International Journal of Material Forming, vol. 3, pp. 1253–1266, 2010.
[45] T. Hove, Bending of CF/PEEK prepregs. Master’s thesis, University of Twente, 2012.
[46] U. Sachs, R. Akkerman, and S. P. Haanappel, “Bending characterization of ud com-
posites,” in Key Engineering Materials, vol. 611, pp. 399–406, Trans Tech Publ, 2014.
155
[47] A. Margossian, S. Bel, and R. Hinterhoelzl, “Bending characterisation of a molten uni-
directional carbon fibre reinforced thermoplastic composite using a Dynamic Mechan-
ical Analysis system,” Composites Part A: Applied Science and Manufacturing, vol. 77,
pp. 154–163, 2015.
[48] T. Instruments, “Dynamic Mechanical Analysis, basic theory and applications train-
ing. http://www.tainstruments.com/wp-content/uploads/CA-2016-DMA.pdf .” ac-
cessed 14-December-2016.
[49] T. Centea, L. Grunenfelder, and S. Nutt, “A review of out-of-autoclave prepregs Ma-
terial properties, process phenomena, and manufacturing considerations,” Composites
Part A: Applied Science and Manufacturing, vol. 70, pp. 132–154, 2015.
[50] D. Fertis, Nonlinear structural engineering. Springer-Verlag Berlin Heidelberg, 2006.
[51] L. M. Dangora, C. J. Mitchell, and J. A. Sherwood, “Predictive model for the detection
of out-of-plane defects formed during textile-composite manufacture,” Composites Part
A: Applied Science and Manufacturing, vol. 78, pp. 102–112, 2015.
[52] X. Bian, Y. Gu, J. Sun, M. Li, W. Liu, and Z. Zhang, “Effects of Processing Parameters
on the Forming Quality of C-Shaped Thermosetting Composite Laminates in Hot Dia-
phragm Forming Process,” Applied Composite Materials, vol. 20, no. 5, pp. 927–945,
2013.
[53] Y. R. Larberg, M. Akermo, and M. Norrby, “On the in-plane deformability of cross-
plied unidirectional prepreg,” Journal of composite materials, vol. 46, no. 8, pp. 929–
939, 2012.
[54] H. Brinson and L. Brinson, Polymer Engineering Science and Viscoelasticity An Intro-
duction. Springer New York Heidelberg Dordrecht London, 2015.
[55] T. Centea and P. Hubert, “Measuring the impregnation of an out-of-autoclave prepreg
by micro-CT,” Composites Science and Technology, vol. 71, no. 5, pp. 593–599, 2011.
156
[56] H. Alshahrani and M. Hojjati, “A new test method for the characterization of the
bending behavior of textile prepregs,” Composites Part A: Applied Science and Man-
ufacturing, vol. 97, pp. 128–140, 2017.
[57] K. F. Choi and S. K. Tandon, “An energy model of yarn bending,” Journal of the
Textile Institute, vol. 97, no. 1, pp. 49–56, 2006.
[58] M. Realff, M. Boyce, and S. Backer, “A micromechanical model of the tesnile behavior
of woven fabric,” Journal of Textile Research, vol. 67, no. 6, pp. 445–459, 1997.
[59] E. Syerko, S. Comas-Cardona, and C. Binetruy, “Models of mechanical proper-
ties/behavior of dry fibrous materials at various scales in bending and tension: A re-
view,” Composites Part A: Applied Science and Manufacturing, vol. 43, no. 8, pp. 1365–
1388, 2012.
[60] A.J.M. Spencer, Continuum Theory of the mechanics of fibre-reinforced composites.
Springer-Verlag Wien, New York, 1984.
[61] S. Gatouillat, A. Bareggi, E. Vidal-Salle, and P. Boisse, “Meso modelling for composite
preform shaping - Simulation of the loss of cohesion of the woven fibre network,”
Composites Part A: Applied Science and Manufacturing, vol. 54, pp. 135–144, 2013.
[62] L. Galuppi and G. Royer-Carfagni, “Laminated beams with viscoelastic interlayer,”
International Journal of Solids and Structures, vol. 49, no. 18, pp. 2637–2645, 2012.
[63] Cytec Engineered Materials, “CYCOM 5320 toughened epoxy for structural applica-
tions, out-of-autoclave manufacturing. Product data sheet,” 2015.
[64] M. Clifford, Column buckling experiment, in structural mechanics. Department of civil
and municipal engineering, University College London, 1981.
[65] J. Hunt, H. Zhang, and Y. Huang, “Analysis of cantilever-beam bending stress relaxa-
tion properties of thin wood composites,” BioResources, vol. 10, no. 2, pp. 3131–3145,
2015.
157

[66] M. L. Williams, R. F. Landel, J. D. Ferry, et al., “The temperature dependence of
relaxation mechanisms in amorphous polymers and other glass-forming liquids,” J.
Am. Chem. Soc, vol. 77, no. 14, pp. 3701–3707, 1955.
[67] R. Li, “Time-temperature superposition method for glass transition temperature of
plastic materials,” Materials Science and Engineering: A, vol. 278, no. 1, pp. 36–45,
2000.
[68] I. Emri and M. Gergesova, “Time-dependent behavior of solid polymers,” Rheology:
encyclopaedia of life support systems (EOLSS), UNESCO. Eolss, Oxford, pp. 247–330,
2010.
[69] P. Wang, N. Hamila, and P. Boisse, “Thermoforming simulation of multilayer compos-
ites with continuous fibres and thermoplastic matrix,” Composites Part B: Engineering,
vol. 52, pp. 127–136, 2013.
[70] H. Lin, J. Wang, A. Long, M. Clifford, and P. Harrison, “Predictive modelling for
optimization of textile composite forming,” Composites Science and Technology, vol. 67,
no. 15-16, pp. 3242–3252, 2007.
[71] J. S. Lee, S. J. Hong, W. R. Yu, and T. J. Kang, “The effect of blank holder force
on the stamp forming behavior of non-crimp fabric with a chain stitch,” Composites
Science and Technology, vol. 67, no. 3-4, pp. 357–366, 2007.
[72] M. Khan, T. Mabrouki, E. Vidal-Salle, and P. Boisse, “Numerical and experimental
analyses of woven composite reinforcement forming using a hypoelastic behaviour. ap-
plication to the double dome benchmark,” Journal of materials processing technology,
vol. 210, no. 2, pp. 378–388, 2010.
[73] H. Alshahrani and M. Hojjati, “A theoretical model with experimental verification for
bending stiffness of thermosetting prepreg during forming process,” Composite Struc-
tures, vol. 166, pp. 136–145, 2017.
158
[74] H. Alshahrani, R. Mohan, and M. Hojjati, “Evaluation of in-plane shear deformation
of outof-autoclave carbon/epoxy prepregs using bias extension test,” in CAMX 2014,
(Orlando, Florida, USA), 2014.
[75] T. Rogers, “Rheological characterization of anisotropic materials,” Composites, vol. 20,
no. 1, pp. 21–27, 1989.
[76] C. Macosko, Rheology principles, measurements, and applications. Wiley–VCH, 1994.
[77] J. Sjolander, P. Hallander, and M. Akermo, “Forming induced wrinkling of composite
laminates: a numerical study on wrinkling mechanisms,” Composites Part A: Applied
Science and Manufacturing, vol. 81, pp. 41–51, 2016.
[78] Y. Larberg and M. Akermo, “In-plane deformation of multi-layered unidirectional ther-
moset prepreg–modelling and experimental verification,” Composites Part A: Applied
Science and Manufacturing, vol. 56, pp. 203–212, 2014.
[79] J. Kratz, K. Hsiao, G. Fernlund, and P. Hubert, “Thermal models for MTM45-1 and
Cycom 5320 out-of-autoclave prepreg resins,” Journal of Composite Materials, vol. 47,
no. 3, pp. 341–352, 2013.
[80] H. Alshahrani and M. Hojjati, “Optimum processing parameters for hot drape forming
of out-of-autoclave prepreg over complex shape using a double diaphragm technique,”
in 20th International Conference on Composite Materials, (Copenhagen, Denmark),
2015.
[81] A. Murtagh, J. Lennon, and M. P, “Surface friction effects related to pressforming of
continuous fibre thermoplastic composites,” Composites Manufacturing, vol. 6, no. 3–4,
pp. 169–175, 1995.
[82] A. Modin, “Hot Drape forming of thermoset prepreg,” In proceedings of Composites in
Manufacturing, Pasadena, CA, pp. 93–105, 1993.
159
[83] J. Krebs, K. Friedrich, and D. Bhattacharyya, “A direct comparison of matched-die
versus diaphragm forming,” Composites Part A: Applied Science and Manufacturing,
vol. 29, no. 1, pp. 183–188, 1998.
[84] H. Bersee, S. Lindstedt, G. Nino, and A. Beukers, “Diaphragm forming of thermoset
composites,” in 16th International Conference on Composite Materials, Kyoto Inter-
national Conference Center, Kyoto, pp. 1–11, 2007.
[85] B. Christopher, Technological advances in double diaphragm forming of advanced and
uniform short fiber composites using fixed and reconfigurable tooling. Phd thesis, Rens-
selaer Polytechnic Institute, 2006.
[86] S. Chen, O. McGregor, A. Endruweit, M. Elsmore, D. De Focatiis, L. Harper, and
N. Warrior, “Double diaphragm forming simulation for complex composite structures,”
Composites Part A: Applied Science and Manufacturing, vol. 95, pp. 346–358, 2017.
[87] H. Alshahrani and M. Hojjati, “Influence of double-diaphragm vacuum compaction
on deformation during forming of composite prepregs,” Journal of Science: Advanced
Materials and Devices, vol. 1, no. 4, pp. 507–511, 2016.
[88] P. J. Mallon, C. M. O’Bradaigh, and R. B. Pipes, “Polymeric diaphragm forming of
complex-curvature thermoplastic composite parts,” Composites, vol. 20, no. 1, pp. 48–
56, 1989.
[89] S. Delaloye and M. Niedermeier, “Optimization of the diaphragm forming process for
continuous fibre-reinforced advanced thermoplastic composites,” Composites Manufac-
turing, vol. 6, no. 3-4, pp. 135–144, 1995.
[90] S. G. Pantelakis and E. Baxevani, “Optimization of the diaphragm forming process
with regard to product quality and cost,” Composites Part A: Applied Science and
Manufacturing, vol. 33, no. 4, pp. 459–470, 2002.
160
[91] N. Haibin, G. Janowski, and U. Vaidya, “Processing and Nonisothermal Crystalliza-
tion Kinetics of Carbon/PPS in Single Diaphragm Forming,” Journal of Composite
Materials, vol. 44, no. 8, pp. 915–929, 2010.
[92] M. Keane, M. Mulhern, and P. Mallon, “Investigation of the effects of varying the pro-
cessing parameters in diaphragm forming of advanced thermoplastic composite lamin-
ates,” Composites Munufuchming, vol. 6, no. 3, pp. 145–152, 1995.
[93] P. Hallander, J. Sjolander, and M. Akermo, “Forming induced wrinkling of composite
laminates with mixed ply material properties; an experimental study,” Composites Part
A: Applied Science and Manufacturing, vol. 78, pp. 234–245, 2015.
[94] P. Hallander, M. Akermo, C. Mattei, M. Petersson, and T. Nyman, “An experimental
study of mechanisms behind wrinkle development during forming of composite lam-
inates,” Composites Part A: Applied Science and Manufacturing, vol. 50, pp. 54–64,
2013.
[95] L. Sorrentino and C. Bellini, “Potentiality of hot drape forming to produce complex
shape parts in composite material,” The International Journal of Advanced Manufac-
turing Technology, vol. 85, no. 5-8, pp. 945–954, 2016.
[96] H. Alshahrani and M. Hojjati, “Bending behavior of multilayered textile composite
prepregs: Experiment and finite element modeling,” Materials & Design, vol. 124,
pp. 211–224, 2017.
161
Related Documents