Bend It Like Beckham: Ethnic Identity and Integration Alberto Bisin y Eleonora Patacchini z Thierry Verdier x Yves Zenou { October, 2008 PRELIMINARY DRAFT Abstract We propose a theoretical framework to study the determinants of ethnic and religious identity formation. We distinguish formally between two distinct motivational processes for identity forma- tion which have been proposed in the social sciences: cultural conformity and cultural defense. The unique information on ethnic preferences and attitudes provided by the Fourth National Survey of Ethnic Minorities in the UK enables us to test the relative preponderance of these two motivating processes. We nd evidence consistent with intense ethnic and religious identity to be formed mostly as a cultural defense mechanism. Consistently, we document that identity and socialization to an ethnic or religious minority are, other things equal, more intense in mixed neighborhood than in segregated neighborhoods. We argue that this results have important and up-to-now unnoticed implications for integration and assimilation policies. Key words: Ethnicity, identity, intermarriage, cultural transmission JEL Classication: A14, J15 This paper is part of the Polarization and Conict Project CIT-2-CT-2004-506084 funded by the European Commission-DG Research Sixth Framework Programme. y New York University, Department of Economics, 269 Mercer Street, New York, NY 10003, USA, and and NBER. E-mail: [email protected] z Universitadi Roma "La Sapienza," Facoltadi Scienze Statistiche, P.le Aldo Moro, 5 - 00185, Roma, Italy. E-mail: [email protected] x PSE, 48 boulevard Jourdan, 75014 Paris, France and CEPR. E-mail: [email protected] { IUI, The Research Institute of Industrial Economics, P.O. Box 55665, 102 15 Stockholm, Sweden, GAINS and CEPR. E-mail: [email protected] 1

Welcome message from author
This document is posted to help you gain knowledge. Please leave a comment to let me know what you think about it! Share it to your friends and learn new things together.
Transcript

Bend It Like Beckham: Ethnic Identity and Integration�
Alberto Bisiny Eleonora Patacchiniz Thierry Verdierx Yves Zenou{
October, 2008
PRELIMINARY DRAFT
Abstract
We propose a theoretical framework to study the determinants of ethnic and religious identity
formation. We distinguish formally between two distinct motivational processes for identity forma-
tion which have been proposed in the social sciences: cultural conformity and cultural defense. The
unique information on ethnic preferences and attitudes provided by the Fourth National Survey of
Ethnic Minorities in the UK enables us to test the relative preponderance of these two motivating
processes.
We �nd evidence consistent with intense ethnic and religious identity to be formed mostly as
a cultural defense mechanism. Consistently, we document that identity and socialization to an
ethnic or religious minority are, other things equal, more intense in mixed neighborhood than in
segregated neighborhoods. We argue that this results have important and up-to-now unnoticed
implications for integration and assimilation policies.
Key words: Ethnicity, identity, intermarriage, cultural transmissionJEL Classi�cation: A14, J15
�This paper is part of the Polarization and Con�ict Project CIT-2-CT-2004-506084 funded by the European
Commission-DG Research Sixth Framework Programme.yNew York University, Department of Economics, 269 Mercer Street, New York, NY 10003, USA, and and NBER.
E-mail: [email protected]�di Roma "La Sapienza," Facolta�di Scienze Statistiche, P.le Aldo Moro, 5 - 00185, Roma, Italy. E-mail:
[email protected], 48 boulevard Jourdan, 75014 Paris, France and CEPR. E-mail: [email protected]{IUI, The Research Institute of Industrial Economics, P.O. Box 55665, 102 15 Stockholm, Sweden, GAINS and CEPR.
E-mail: [email protected]
1

Bengali, bengali / Bengali, bengali / No no no / He does not want to depress you/ Oh no
no no no no / He only wants to impress you / Oh.. Bengali in platforms / He only wants
to embrace your culture / And to be your friend forever. [�Bengali in Platform,�Morissey,
Viva Hate, 1988, Reprise/Wea]1
One of the most important challenges facing modern societies, and at the same time one
of our most signi�cant opportunities, is the increase in ethnic and social heterogeneity in
virtually all advanced countries. [Robert D. Putnam, John Skytte Prize Lecture, 2007]
1 Introduction
Recent ethnic riots2 have placed the issue of ethnic and religious identity at the forefront of the political
debate. Underlying the debate is the relationship between ethnic identity and group con�ict.3 Indeed,
as noticed by several observers, ethnic identities often take the form of �oppositional� identities,
requiring and promoting the rejection of the majority/dominant behavioral norms; see, in particular,
Ainsworth-Darnell and Downey (1998).4
Two opposing views characterize the theoretical analysis in the social sciences regarding the re-
lationship between identity formation and con�ict between ethnic/social groups; see e.g., Putnam
(2007). A �rst group of social scientists argues that group con�ict is reduced by assimilation and blur-
ring of groups�boundaries. Assimilation theories in political science and sociology (Gordon (1964),
Moghaddam and Solliday 1991), contact theory in social psychology (Allport 1954) are e.g., direct
expressions of this line of thought. The basic premise is the idea that social contacts between groups
and intensive social interactions help weaken group loyalties and group prejudices and hence lead to
a more culturally homogeneous society. Through this process, minority groups adopt inclusive iden-
tities and integrate, progressively adopting the language, values and systems of the dominant group.
Underlying this reasoning is the principle that group identity is motivated by a tendency to cultural
1Thanks to Andrew Clark for Morissey�s quote.2The riots in Paris�suburbs (November 2005) and the riots in many Muslim communities after the publications of
vignettes representing the prophet Mohammed in a Danish newspaper (February 2006) are the most notable examples.3The study of ethnic identity formation has a long theoretical and empirical tradition in social sciences: see e.g.,
Cross (1991), Phinney (1990), Ferdman (1995) in developmental psychology; Stryker (1980) in symbolic interactionist
sociology; Tajfel (1981), Tajfel and Turner (1979), Turner et al. (1987) in social psychology; and Brewer (2001) in
political psychology.4This is the case, for instance, of �ghetto culture� in the U.S. (Wilson, 1987). Also, studies in the U.S. have found,
for example, that African American students in poor areas may be ambivalent about learning standard English and
performing well at school because this may be regarded as �acting white�and adopting mainstream identities (Austen-
Smith and Fryer, 2005, Battu, Mwale, and Zenou, 2006, Delpit, 1995, Fordham and Ogbu, 1986, Ogbu, 1997, Fryer and
Torelli, 2005, Selod and Zenou, 2006). As it is, these oppositional identities often produce signi�cant economic and social
con�icts. More generally, the relationship between ethnic diversity and economic performance is extensively studied and
surveyed by Alesina and La Ferrara (2005).
2

conformity.5
The alternative view considers individuals motivated to retain their own distinctive cultural her-
itage and to identify with a ethnic/social group to generate a sense of positive distinctiveness from
individuals who are not part of the group (Abrams and Hogg 1988, Turner 1982). Positive distinctive-
ness can be achieved through various cognitive and psychological mechanisms, from group solidarity
to prejudice and negative stereotyping with respect to other groups. Negative attitudes towards mem-
bers of other groups reassert social identity of the group. Along these lines are expressed theories of
multiculturalism (Glazer and Moynihan (1970), Taylor and Lambert (1996)), con�ict (Bobo (1999)),
and primordialism in sociology (Calhoun, (1993) and Bobrow (1996)).6 Identity formation, according
to this view, is a sort of cultural defense mechanism that allows individuals to reduce the psychological
costs associated to cultural distinctiveness.
In their purest forms, cultural conformity and cultural defense are quite distinct theories of identity
formation and have important di¤erent positive and normative implications for integration policies.
They represent a fundamental conceptual distinction in the social science of culture and identity. To
provide a conceptual frame to the issue of the determinants of identity formation, in this paper, we
formulate a simple model which accounts for both cultural conformity and cultural defense. We can
therefore formally establish the implications of these theoretical views of identity formation to guide an
empirical investigation of, in particular, ethnic and religious identity. In particular, distinguishing be-
tween cultural conformity and cultural defense provides contrasting empirical implications on the way
neighborhood segregation and identity formation interact in the process of ethnic integration. When
cultural conformity is assumed to be the main motivational process of identity formation, neighbor-
hood segregation and identity formation are likely to be complements for ethnic assimilation. On the
contrary, when cultural defense is considered as the main process of identity formation, neighborhood
segregation and identity formation tend to be substitutes for ethnic assimilation.7
More speci�cally, in this paper we study ethnic and religious identity formation as a social phe-
nomenon at the level of the neighborhood. In particular we consider the demographic characteristics
of the neighborhood where agents reside, and most importantly its ethnic and religious composition, as
exogenous with respect to the identity formation mechanism.8 Furthermore, we link identity formation
5Economists capture the notion of cultural conformity through positive social interactions across individuals sharing
the same characteristics, views and preferences; see e.g., Glaeser-Scheinkman (2000). In this view, therefore, individuals
therefore form inclusive identities to integrate so as to exploit social interactions.6At a broader level this view is also related to social identity theory in social psychology (Tajfel 1981, Turner 1982).7 In economics, the distinction between cultural conformity and cultural defense is also related to the notion of cultural
complementarity and cultural substitutability between socialization mechanism de�ned formally by Bisin-Verdier (2000);
see also Patacchini-Zenou (2004) for an empirical investigation. Indeed, in Bisin-Verdier (2000), when family and society
role models tend to be susbtitutes in the process of socialization, families with a relatively minoritarian cultural trait have
larger incentives to spend resources to socialize their children to the trait and hence guarantee its persistence. Conversely,
under cultural complementarity the more minoritarian is a family�s cultural trait, the smaller are the family�s incentives
to socialize their children to the trait and hence to limit cultural assimilation.8This is of course a strong assumption, only partly justi�ed by the observation that residential choices are done infre-
quently and are possibly dominated by factors and considerations (like e.g., vicinity to work) other than its neighborhood
composition. In the empirical work, however, we go to great lengths to argue that there is no evidence of endogeneity
3

with homogamous marriages along ethnic and religious traits. It has been extensively documented in
fact that interracial marriage is typically considered as a sign of inclination toward cultural assimilation
(see, in particular, Al-Johar, 2005, Qian, 1999, Meng and Gregory, 2005, Tucker and Mitchell-Kernan,
1990) and that marriage choices are at least in part determined by parents�preferences to socialize
their children to their own (parents�) trait (see Bisin, Topa, and Verdier, 2004, and the evidence cited
in Bisin and Verdier, 2000).
Our empirical analysis relies on the Fourth National Survey of Ethnic Minorities (FNSEM) in
the U.K. This survey asks a direct question about respondents�identi�cation with their own ethnic
group and additional (indirect) information about di¤erent dimensions of identity (e.g. attitudes
towards inter-marriage, importance of religion and other aspects of individual�s ethnic preferences).
In addition, the data can be merged with the 1991 Census, so that it is possible to obtain a detailed
picture of each individual�s residential neighborhood at a very high level of spatial disaggregation.9
With FNSEM data we estimate our model of the joint determinants of ethnic and religious identity
and homogamy both structurally and non-structurally. Our estimates provide evidence that intense
ethnic identity tmight be due to cultural defense rather than to cultural conformity. Intense ethnic
identity appears to be formed in social contexts in which the minority ethnic trait is mostly �threat-
ened�either directly by the actions of the majority group (e.g., through explicit acts of rejection or
harassment), or indirectly by being exposed to the interaction with the majority norm of behavior in
mixed neighborhood. We also address the issue of the alleged speci�city of Muslim immigrants with
regards to the strength of their identity and their (lack of) assimilation tendencies; an issue which
recently surged at the center of the political debate in Europe (see, e.g., Gallis, 2005). The results we
obtain on the restricted sample of Muslim respondents are not qualitatively di¤erent from the ones
found using the whole sample. On the other hand, quantitatively, the assimilation process of Muslims
appears to be signi�cantly slower than other ethnic and religious groups.10
Our empirical results are consistent with various recent empirical studies which indirectly address
the issue of the process of identity formation by studying the link between identity and segregation.
Notably Fryer and Torelli (2005) �nd that, in the National Longitudinal Study of Adolescent Health in
the U.S., �acting white�behaviors among blacks are more developed in racially mixed schools.11 Bisin,
Topa, and Verdier (2004) document, using the General Social Survey data, that religious socialization
in the data. Finally, our test of cultural conformity in identity formation is valid independently of the issue of the
endogeneity of the neighborhood composition.9At the level of residential ward. A UK Census ward contains on average 3,000-4,000 residents.10This is somewhat in contrast with the results of Manning-Roy (2007). They however measure identity somewhat
cursorily, from the answers of respondents to a direct question regarding their "national identity" (in the U.K. Labor
Force Survey).
On the other hand, our results on Muslim assimilation are more in line with those of Constant et al. (2006) and
Georgiadis-Manning (2008).11Anthropologists have also observed that social groups seek to preserve their identity, an activity that accelerates
when threats to internal cohesion intensify. Thus, groups may try to reinforce their identity by penalizing members for
di¤erentiating themselves from the group. The penalties are likely to increase whenever the threats to group cohesion
intensify; for an early analysis of this issues, see Whyte (1943).
4
across U.S. states is more intense when a religious faith is a minority.12 Finally, Putnam (2007) �nds
evidence in the Social Capital Community Benchmark Survey in the U.S. that trust in neighbors is
negatively correlated to the racial heterogeneity of the neighborhood.
The analysis of the dependence of identity on ethnic composition at the level of the neighborhood
may be of great interest also from a policy perspective. This is the case when assimilation is a policy
objective and, more generally, when intense socialization practices and the formation of oppositional
ethnic identities have important negative externalities. While the failure of integration policies in
Europe and the U.S. is certainly re�ected in the recent ethnic and racial riots, our empirical evidence
for cultural defense suggests that, contrary to presumptions often exposed by social scientists and
commentators, the intense and oppositional identities that give rise to such social con�icts are not
per se n favored by the segregation of the neighborhood in which ethnic and racial minorities tend to
live.
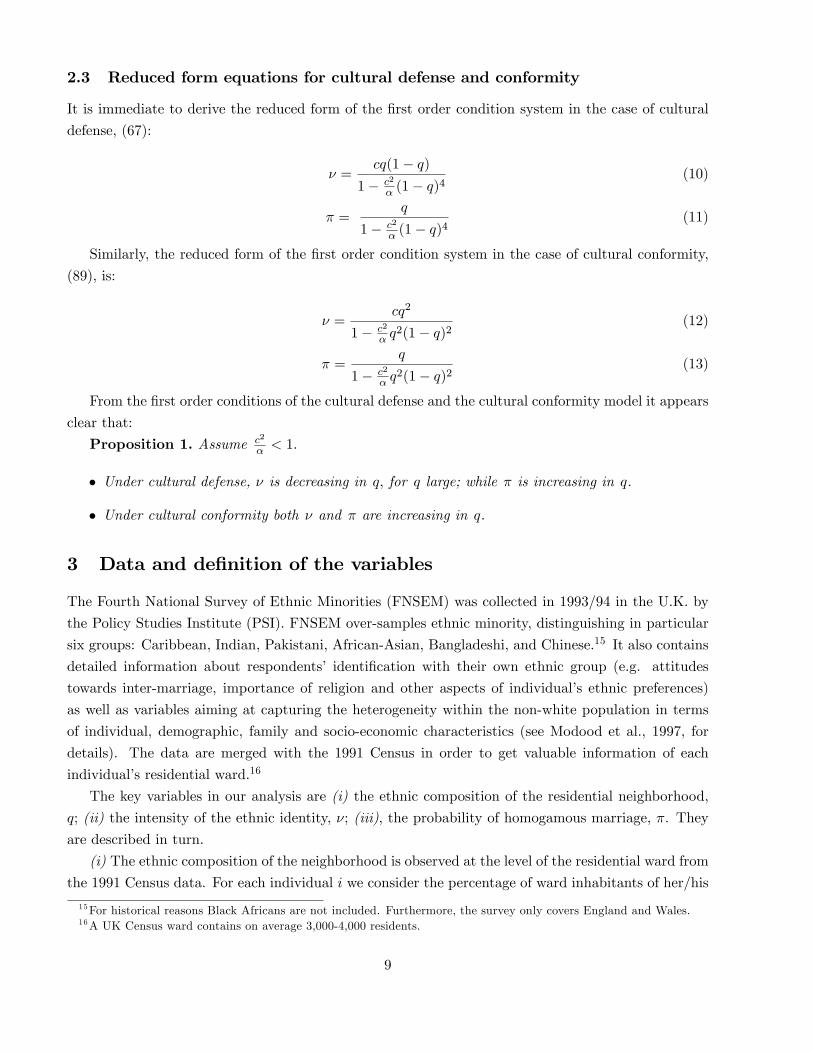
2 A simple model of identity formation
Consider a member of a minority ethnic or religious group. We postulate that he/she faces a psycho-
logically cost to interact with individuals of the dominant majority. Let q denote the proportion of the
minority in the reference neighborhood, where the member of the minority resides. Let the psycho-
logical costs be denoted C(q). Identity is de�ned as a psychological mechanism to potentially reduces
such costs. We assume however that only agents in a homogamous marriage gain from identity.
Let identity be an index I 2 f0; 1g with probfI = 1g = �.13 Let homogamy also be an index
H 2 f0; 1g with probfH = 1g = �. A minority agent married homogamously in a neighborhood with
a fraction q of minority members and whose identity is � faces psychological costs
(1� �)C(q)
Identity is a choice of the agent.14 The utility cost of developing identity �, I(�) is increasing and
convex (in the same units of the psychological costs C(q)); for simplicity we assume
I(�) =1
2�2 (1)
Minority agents also put e¤ort in �nding a spouse of the same ethnic and religious background. Let
e¤ort be denoted � 2 [0; 1]. The minority agent �rst searches a spouse in a restricted pool of partnersfrom his own community minority. By spending some resource cost, he �nds his marital partner with
12Relatedly, Bisin and Verdier (2000) provide many examples of the resilience of ethnic and other cultural traits that
can be explained by a similar mechanism, from the case of Orthodox Jews in Brooklyn to the case of aristocrats in
France.13More generally, we interpret � as a measure of the intensity of identity.14We recognize that identity is at least as much the choice of the agent as it is of the family. We have studied
family socialization in previous work: Bisin-Verdier (2000, 2001) and Bisin-Topa-Verdier (2004). In fact our analysis can
be extended to distinguish the various components of identity choice: Bisin-Patacchini-Verdier-Zenou (2008). For the
purposes of the empirical work of this paper it is withput loss of generality to think of agent and family preferences to
be perfectly aligned and hence to interpret identity choice as determined inside the family.
5

probability �. With the residual probability 1 � �, he remains unsuccessful and therefore goes to a
common pool of partners including both minority and majority types. There he gets matched with a
spouse of his community with probability q.
A minority agent married in a neighborhood with a fraction q of minority members has a probability
of marrying homogamously equal to
�(� ; q) = � + (1� �)q (2)
The utility cost of putting e¤ort � , f(�) is increasing and convex (in the same units of the psycho-
logical costs C(q)); for analytical simplicity we assume
f(�) =1
2��2 (3)
where � is a measure of the relative costs of e¤ort � with respect to �:
A minority agent�s problem is:
max�;�
��(� ; q)(1� �)C(q)� [1� �(� ; q)]C(q)� f(�)� I(�)
Given (1), (2) and (3), the �rst order condition of the problem are easily reduced to:
� = C(q)� (4)
� = q + (1� q)2 C(q)�
� (5)
This is a clear simultaneous equation system in which (�; �) are the endogenous variables and q
the exogenous variable.
We are now ready to formally distinguish the cultural defense from the cultural conformity model
of identity formation.
2.1 Cultural defense
In the cultural defense model the minority�s psychological costs to interact with individuals of the
dominant majority are increasing in the proportion of the majority in the reference neighborhood,
where the member of the minority resides, 1� q. The simplest formulation therefore has:
C(q) = c(1� q)
Then the �rst order conditions of the model are:
� = c(1� q)� (6)
� = q +c
�(1� q)3� (7)
A simple intuitive illustration of the cultural defense model can be obtained from these equations.
Consider �rst condition (6), expressing how identity formation � depends on the proportion q of mi-
nority members and on � the probability of homogamy. Clearly the larger the proportion q of minority
6

members and the more segregated the neighborhood, the smaller C(q) = 1� q, the psychological costof interacting with majority people and the smaller the incentives for identity formation as cultural
defense. On the other hand, the larger the probability � of homogamous marriage resulting from
socialization e¤orts, the larger the expected bene�ts from identity formation and the more intense is
identity.
Interestingly, marital segregation, as re�ected by �, and neighborhood segregation, as re�ected by
q, are substitutes in terms of culturally defensive identity formation. In other words, the marginal
e¤ect of marital segregation on defensive identity formation tends to be reduced the more segregated
the neighborhood (ie. the larger is q).
Consider now equation (7) characterizing the (endogenous) probability of homogamy as a function
of identity � and neighborhood segregation q. The more intense identity formation, the larger the
probability of homogamy. On the other hand, the e¤ect of q on � is ambiguous and re�ects two
opposite e¤ects. First, there is a direct e¤ect related to the fact that the larger the proportion of
minority people in the neighborhood, the larger the probability of �nding a minority spouse in the
common pool of potential partners. This e¤ect is re�ected in the �rst term q of (7). The second e¤ect
is illustrated by the second term [1� q]2C(q)� and shows the e¤ect of a change in q on the marginalincentives to marital segmentation (i.e., the socialization e¤ort �). Indeed the more segregated the
neighborhood (i.e., the larger is q), the smaller the incentives to spend resources to �nd directly a
partner in the restricted pool of minority spouses. First because social interactions with the majority
people are less costly psychologically and there is less of a need for defensive identity formation that
can be e¤ectively expressed in homogamous marriages. This is re�ected by the term C(q). Second, a
larger proportion of minority people in the neighborhood reduces as well the incentives to make special
e¤orts to �nd a spouse in a segregated marital pool, as minority people are already more likely to
be found in the common marital pool. Both channels reduce therefore the incentives for socialization
e¤orts � , which in turn tends to reduce the probability of homogamy �.
It is also interesting to observe that, for the choice of socialization e¤ort and probability of mi-
nority homogamy, culturally defensive identity and neighborhood segregation (as re�ected by q) are
substitutes. More precisely, the marginal e¤ect of defensive identity on minority homogamy tends to
be reduced the more segregated the neighborhood (i.e., the larger is q).
2.2 Cultural conformity
In the cultural conformity model the minority�s psychological costs to interact with individuals of the
dominant majority are decreasing in the proportion of the majority in the reference neighborhood,
where the member of the minority resides, 1� q. The simplest formulation therefore has:
C(q) = cq
Then the �rst order conditions of the model are:
� = cq� (8)
7

� = q +c
�q(1� q)2� (9)
Again a simple illustration can be obtained from these equations. Consider �rst (8) expressing
now how conformist identity formation � depends on the proportion q of minority members and �
the probability of homogamy. Now the larger the proportion q of minority members and the more
segregated the neighborhood, the higher C(q) the psychological costs of interacting with minority
people and the larger the incentives for cultural conformity identity formation. Similarly, the larger
the probability � of homogamous marriage, the larger the expected bene�ts from cultural conformity
identity and the more intense is that identity formation. Again the sign of the cross derivative is
interesting. Simple inspection shows immediately that , marital segregation (as re�ected by �) and
neighborhood segregation (as re�ected by q) are now complements in terms of cultural conformity
identity formation. In other words, the marginal e¤ect of marital segregation on conformity identity
formation is larger, the more segregated the neighborhood (i.e., the larger is q).
Consider now equation (9) characterizing the (endogenous) probability of homogamy as a function
of identity � and neighborhood segregation q. Simple inspection shows again that the more intense
identity formation, the larger the probability of homogamy. The e¤ect of q on � is also ambiguous
and re�ects now three e¤ects. First, there is as before the direct e¤ect related to the fact that the
larger the proportion of minority people in the neighborhood, the larger the probability of �nding a
minority spouse in the common pool of potential partners. This e¤ect is illustrated by the �rst term
q in (9). A second positive e¤ect is illustrated by �C(q) in the second term [1� q]2 �C(q) . The largerq; the larger the conformity psychological gain of social interactions with other minority individuals
in the neighborhood and the associated conformity identity process that can be e¤ectively expressed
in homogamous marriages. This increases the incentives for homogamous marriages and the marginal
incentives to marital segmentation (i.e., the socialization e¤ort �).
The last e¤ect of q on � is negative. As in the defensive identity model, it re�ects simply the fact
that a larger q reduces the incentives to make special e¤orts to �nd a spouse in a segregated marital
pool., as minority people are already likely to be found in the common marital pool. This channel
captured by the expression [1� q]2 in the second term [1� q]2 �C(q) of equation (9) decreases theincentives for socialization e¤orts � , and tends to reduce the probability of homogamy �.
Finally one may as well see how cultural conformity identity and neighborhood segregation (as
re�ected by q) interact in terms of the formation of homogamous minority marriages. The second
cross derivative of � with respect to � and q has the sign of
d
dq
�(1� q)2C(q)
the sign of which is in general ambiguous. Now when C(0) = 0, namely conformist gains are very
small for small minority populations, it is easy to see that
d
dq
�(1� q)2C(q)
> 0
for small enough values of q: In that case, neighborhood segregation and cultural conformist identity
are complements for the choicer of homogamous probability of marriage.
8
2.3 Reduced form equations for cultural defense and conformity
It is immediate to derive the reduced form of the �rst order condition system in the case of cultural
defense, (67):
� =cq(1� q)
1� c2
� (1� q)4(10)
� =q
1� c2
� (1� q)4(11)
Similarly, the reduced form of the �rst order condition system in the case of cultural conformity,
(89), is:
� =cq2
1� c2
� q2(1� q)2
(12)
� =q
1� c2
� q2(1� q)2
(13)
From the �rst order conditions of the cultural defense and the cultural conformity model it appears
clear that:
Proposition 1. Assume c2
� < 1:
� Under cultural defense, � is decreasing in q; for q large; while � is increasing in q.
� Under cultural conformity both � and � are increasing in q.
3 Data and de�nition of the variables
The Fourth National Survey of Ethnic Minorities (FNSEM) was collected in 1993/94 in the U.K. by
the Policy Studies Institute (PSI). FNSEM over-samples ethnic minority, distinguishing in particular
six groups: Caribbean, Indian, Pakistani, African-Asian, Bangladeshi, and Chinese.15 It also contains
detailed information about respondents� identi�cation with their own ethnic group (e.g. attitudes
towards inter-marriage, importance of religion and other aspects of individual�s ethnic preferences)
as well as variables aiming at capturing the heterogeneity within the non-white population in terms
of individual, demographic, family and socio-economic characteristics (see Modood et al., 1997, for
details). The data are merged with the 1991 Census in order to get valuable information of each
individual�s residential ward.16
The key variables in our analysis are (i) the ethnic composition of the residential neighborhood,
q; (ii) the intensity of the ethnic identity, �; (iii), the probability of homogamous marriage, �. They
are described in turn.
(i) The ethnic composition of the neighborhood is observed at the level of the residential ward from
the 1991 Census data. For each individual i we consider the percentage of ward inhabitants of her/his
15For historical reasons Black Africans are not included. Furthermore, the survey only covers England and Wales.16A UK Census ward contains on average 3,000-4,000 residents.
9
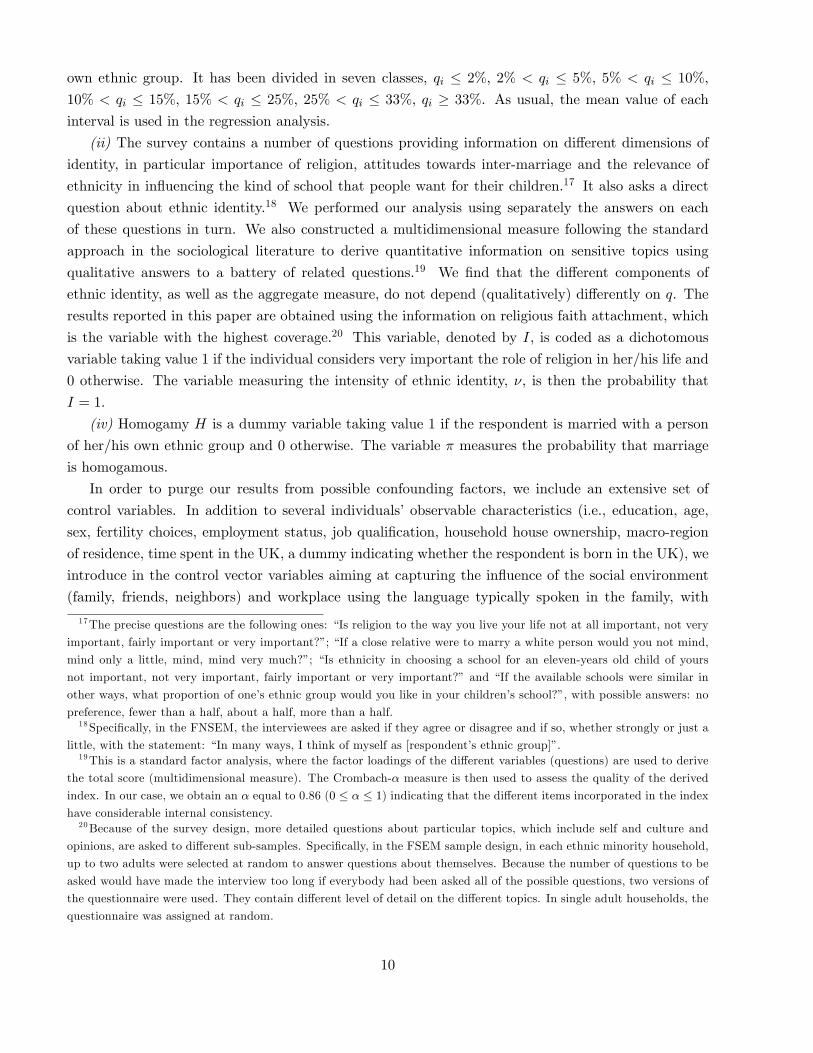
own ethnic group. It has been divided in seven classes, qi � 2%; 2% < qi � 5%; 5% < qi � 10%;
10% < qi � 15%; 15% < qi � 25%; 25% < qi � 33%; qi � 33%. As usual, the mean value of each
interval is used in the regression analysis.
(ii) The survey contains a number of questions providing information on di¤erent dimensions of
identity, in particular importance of religion, attitudes towards inter-marriage and the relevance of
ethnicity in in�uencing the kind of school that people want for their children.17 It also asks a direct
question about ethnic identity.18 We performed our analysis using separately the answers on each
of these questions in turn. We also constructed a multidimensional measure following the standard
approach in the sociological literature to derive quantitative information on sensitive topics using
qualitative answers to a battery of related questions.19 We �nd that the di¤erent components of
ethnic identity, as well as the aggregate measure, do not depend (qualitatively) di¤erently on q. The
results reported in this paper are obtained using the information on religious faith attachment, which
is the variable with the highest coverage.20 This variable, denoted by I; is coded as a dichotomous
variable taking value 1 if the individual considers very important the role of religion in her/his life and
0 otherwise. The variable measuring the intensity of ethnic identity, �, is then the probability that
I = 1.
(iv) Homogamy H is a dummy variable taking value 1 if the respondent is married with a person
of her/his own ethnic group and 0 otherwise. The variable � measures the probability that marriage
is homogamous.
In order to purge our results from possible confounding factors, we include an extensive set of
control variables. In addition to several individuals�observable characteristics (i.e., education, age,
sex, fertility choices, employment status, job quali�cation, household house ownership, macro-region
of residence, time spent in the UK, a dummy indicating whether the respondent is born in the UK), we
introduce in the control vector variables aiming at capturing the in�uence of the social environment
(family, friends, neighbors) and workplace using the language typically spoken in the family, with
17The precise questions are the following ones: �Is religion to the way you live your life not at all important, not very
important, fairly important or very important?�; �If a close relative were to marry a white person would you not mind,
mind only a little, mind, mind very much?�; �Is ethnicity in choosing a school for an eleven-years old child of yours
not important, not very important, fairly important or very important?� and �If the available schools were similar in
other ways, what proportion of one�s ethnic group would you like in your children�s school?�, with possible answers: no
preference, fewer than a half, about a half, more than a half.18Speci�cally, in the FNSEM, the interviewees are asked if they agree or disagree and if so, whether strongly or just a
little, with the statement: �In many ways, I think of myself as [respondent�s ethnic group]�.19This is a standard factor analysis, where the factor loadings of the di¤erent variables (questions) are used to derive
the total score (multidimensional measure). The Crombach-� measure is then used to assess the quality of the derived
index. In our case, we obtain an � equal to 0.86 (0 � � � 1) indicating that the di¤erent items incorporated in the indexhave considerable internal consistency.20Because of the survey design, more detailed questions about particular topics, which include self and culture and
opinions, are asked to di¤erent sub-samples. Speci�cally, in the FSEM sample design, in each ethnic minority household,
up to two adults were selected at random to answer questions about themselves. Because the number of questions to be
asked would have made the interview too long if everybody had been asked all of the possible questions, two versions of
the questionnaire were used. They contain di¤erent level of detail on the di¤erent topics. In single adult households, the
questionnaire was assigned at random.
10

friends, at work, a dummy capturing instances of discrimination and one indicating whether the
marrige is arranged by the parents. We also include the ward unemployment rate. We report the
estimation results for the model speci�cation including the more extensive set of controls. Precise
de�nitions of all these variables, as well as our sample descriptive statistics, can be found in Table 1.
Excluding the individuals with missing or inadequate information on our target variables, we obtain
a �nal sample of 1,565 individuals.
[Insert Table 1 here]
4 The empirical model
We proceed structurally, putting directly to data the model in the previous section.21
From their reduced form equations, (10-11) and (12-13), it is straightforward to nest the cultural
defense and cultural conformity models:
� =cq (q)
1� c2
� ( (q))2(1� q)2
(14)
� =q
1� c2
� ( (q))2(1� q)2
; (15)
with (q) = 1 � 2q and
1 = 2 = 1 defense (16)
1 = 0; 2 = �1 conformity
Empirically, to discriminate between the two models it is su¢ cient to verify whether 2 is greater
or smaller than zero.
Furthermore, we need to extend the model to account for a vector of exogenous regressors which
a¤ect the agents�choice of identity and homogamy. To this end, we simply assume that the exogenous
regressors enter through the costs of identity and homogamy:
I(�) =1
2�2 � �x��; I(�) =
1
2��2 � �x��
where xj are the exogenous determinants of the cost, regressors in the empirical implementation, and
�x� ; �x� represent the vector notation: �x� =PNj=1 �;jxj ; �x� =
PNj=1 �;jxj .
We can then write the reduced form equations to take to data:
� =cq (q)
1� c2
� ( (q))2 (1� q)2
+1
1� c2
� ( (q))2(1� q)2
�x� +c (q)
1� c2
� ( (q))2(1� q)2
�x� (17)
21
See Bisin-Patacchini-Verdier-Zenou (2008) for a non-structural linear probit analysis of the same data.
11
� =q
1� c2
� ( (q))2 (1� q)2
+c (q)(1� q)2
1� c2
� ( (q))2 (1� q)2
�x� +1
1� c2
� ( (q))2 (1� q)2
�x� (18)
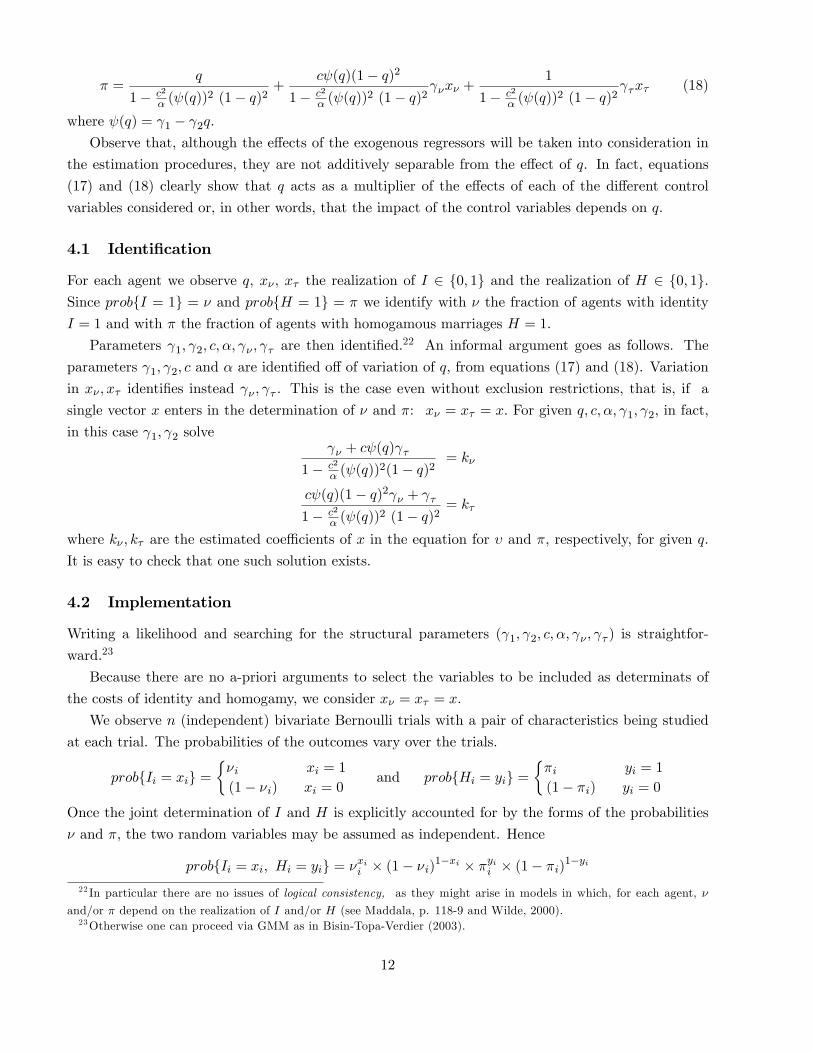
where (q) = 1 � 2q:Observe that, although the e¤ects of the exogenous regressors will be taken into consideration in
the estimation procedures, they are not additively separable from the e¤ect of q. In fact, equations
(17) and (18) clearly show that q acts as a multiplier of the e¤ects of each of the di¤erent control
variables considered or, in other words, that the impact of the control variables depends on q:
4.1 Identi�cation
For each agent we observe q, x� ; x� the realization of I 2 f0; 1g and the realization of H 2 f0; 1g.Since probfI = 1g = � and probfH = 1g = � we identify with � the fraction of agents with identity
I = 1 and with � the fraction of agents with homogamous marriages H = 1.
Parameters 1; 2; c; �; � ; � are then identi�ed.22 An informal argument goes as follows. The
parameters 1; 2; c and � are identi�ed o¤ of variation of q, from equations (17) and (18). Variation
in x� ; x� identi�es instead � ; � . This is the case even without exclusion restrictions, that is, if a
single vector x enters in the determination of � and �: x� = x� = x: For given q; c; �; 1; 2; in fact,
in this case 1; 2 solve � + c (q) �
1� c2
� ( (q))2(1� q)2
= k�
c (q)(1� q)2 � + �1� c2
� ( (q))2 (1� q)2
= k�
where k� ; k� are the estimated coe¢ cients of x in the equation for � and �, respectively, for given q:
It is easy to check that one such solution exists.
4.2 Implementation
Writing a likelihood and searching for the structural parameters ( 1; 2; c; �; � ; � ) is straightfor-
ward.23
Because there are no a-priori arguments to select the variables to be included as determinats of
the costs of identity and homogamy, we consider x� = x� = x:
We observe n (independent) bivariate Bernoulli trials with a pair of characteristics being studied
at each trial. The probabilities of the outcomes vary over the trials.
probfIi = xig =��i xi = 1
(1� �i) xi = 0and probfHi = yig =
��i yi = 1
(1� �i) yi = 0
Once the joint determination of I and H is explicitly accounted for by the forms of the probabilities
� and �, the two random variables may be assumed as independent. Hence
probfIi = xi; Hi = yig = �xii � (1� �i)1�xi � �yii � (1� �i)
1�yi
22 In particular there are no issues of logical consistency, as they might arise in models in which, for each agent, �
and/or � depend on the realization of I and/or H (see Maddala, p. 118-9 and Wilde, 2000).23Otherwise one can proceed via GMM as in Bisin-Topa-Verdier (2003).
12

The likelihood function can be written as:
L =
nYi=1
�xii � (1� �i)1�xi � �yii � (1� �i)
1�yi (19)
The maximization of the likelihood function (19) under the two (alternative) sets of constraints
(16) will then uncover which one of the two models of identity formation better �ts our data: the
higher the likelihood the more likely it is that the corresponding scenario is realized.
4.3 Results
Table 2 contains the results of the maximum likelihood analysis. An unconstrained maximization
of the likelihood returns the results listed in Table 2a. A positive estimate of 2 would be in line
with the cultural defense model, whereas a negative estimate would support the cultural conformity
model. Table 2a shows that such an estimate is indeed positive, which indicates that a cultural defense
mechanism of identity formation should be at work. The maximization of the likelihood function (19)
under the two (alternative) sets of constraints (16) will then further uncover which one of the two
models of identity formation better �ts our data: the higher the likelihood the more likely it is that the
corresponding scenario is realized. The last two rows of the table report such constrained maximized
likelihoods. The results show that the maximized likelihood value is much higher when the constraints
implied by the cultural defense model (i.e. 2 > 0) are imposed.24 ;25 The parameter estimates for the
cultural defense model (i.e., the preferred one) are reported in Table 2b.26
[Insert Table 2 here]
Controlling for the covariates, Figure 1 documents the cultural defense model�s predictions regard-
ing, respectively, identity and homogamy, � and �, as a function of the neighborhood fraction of the
minority, q:
[Insert F igure 1 here]
Other things equal, living in a ward with a (su¢ ciently) higher percentage of own ethnic minority
group is associated with a lower identity and a lower probability of homogamy.
4.3.1 Robustness
Structural estimates of the model can be criticized on the fact that they rely, both for identi�cation and
for estimation/inference, on the speci�c functional form assumptions we are making in the model, e.g.,
24The estimation has been performed using R programming language (www.r-project.org). The code is available upon
request.25A more rigorous statistical comparison is problematic in these cases because the distribution of the resulting likelihood
ratio tests with inequality constraints is non-standard; see Cherno¤ (1954), Wilks (1938), Self-Liang, (1987), Shaw-Geyer
(1997).26Here the value of 2 is set at 1 (see (16)).
13

the quadratic form of the cost functions, as well as the speci�c production function for identity and
homogamy. A more informal approach to distinguish between cultural defense and cultural conformity
would exploit Proposition 1: in the cultural conformity model the graph of � as a function of q is
monotonic increasing while, in the case of cultural substitution is decreasing for q large enough.
In fact, our main objective is not to estimate the structural parameters of the model as much
as to distinguish cultural defense from cultural conformity. Can this objective be in fact pursued
more robustly by means of a non-structural analysis? In this section we investigate this possibility by
using an approximation to (17-18). In this case, however, the parameters � and c are not identi�ed.
Nonetheless, we can distinguish cultural defense from cultural conformity by testing the di¤erent
prediction of the model under the two scenarios.
The system of equations we estimate is:
� = �1q + �2q2 + �x�
� = �1q + �2q2 + �x� ;
where we include a quadratic function in q, to allow for non-linear dependence identity and ho-
mogamy on q, as the theoretical model predicss for cultural defense. Under the added assumption of
normality for the errors, the system constitutes a bivariate probit model that can be estimated using
(full-information) maximum likelihood. The variance-covariance matrix of the errors is identi�ed as
standard in probits.27
Table 3 contains the results. The panel on the right-hand shows the e¤ects of q on identity for
di¤erent levels of q (i.e,. we report @�@q = �1 + �2q and@�@q = �1 + �2q). The dominance of the cultural
defense scenario comes again into view. Indeed, for both � and � we �nd that the e¤ect q turns into
negative for q large enough. 28
[Insert Tables 3 here]
Taken as a whole, our empirical results clearly points towards cultural defense rather than cultural
conformity as the behavioural mechanism underlying the observed evidence.
4.3.2 Endogeneity of location choices
If ethnic minorities congregated in speci�c neighborhoods because of some unobservable characteristics
that a¤ected their ethnic or religious identity, our analysis of the relationship between neighborhood
segregation and identity would be invalid and the estimates biased.
27The estimated system of equation is thus:
� = �1q + �2q2 + �x�
� = �3q ++ �x�
28The estimation has been performed using Stata version 10. The code is available upon request.
14

To address this issue we show that results are qualitatively unchanged when we restrict the sample
to a subset of respondents who are arguably �constrained�on where they live. While our data source
does not provide a direct question on the reasons underlying the location of individuals in a given
neighborhood, the questionnaire asks the individuals their judgment on the quality of the residential
area in terms of ethnic composition. Furthermore, it asks whether, given a location choice, they would
prefer to move or to stay in the area. We therefore select a sub-sample of respondent composed
of individuals i) who state that the neighborhood in which they reside is "poor" for "being with
other people of their own ethnic group" but nonetheless declare they they do not wish to move; and
individuals ii) who state that the neighborhood in which they reside is "good" for "being with other
people of their own ethnic group" but nonetheless declare they they do wish to move.
In our interpretation, in these two groups the choice of the residential neighborhood is likely to be
exogenous with respect to their concerns about the ethnic composition of the neighborhood.29
Thus, in order to check whether our evidence is driven by endogeneity issues stemming from the
individuals�residential location choices, we run our analysis on these two sub-samples. We display in
Table [to be added] the results. From a preliminary analysis it appears that the results are not di¤erent
across sub-samples and from the ones referring to the whole sample. We provisionally conclude that
endogeneity of location choices does not seem to be a major concern in our analysis.30
[complete analysis of endogenous location decision - with syntethic panels - to be added]
5 Is Muslim identity di¤erent?
A large debate in Europe concerns the alleged speci�city of Muslim immigrants with regards to the
strength of their identity and their (lack of) assimilation tendencies.31
Several of the ethnic groups for which we have data have in fact a signi�cant Muslim population.
Notably, Pakistani and Bangladeshi are predominantly Muslim, while Indians and African-Asian have
substantial Muslim minorities. Furthermore, the FNSEM survey contains a question asking the re-
spondent to identify his/her religious faith. In this section we exploit therefore our data to address
directly the alleged Muslim speci�city issue.
To this end we repeat our structural and non-structural analysis on the restricted sample of Muslim
respondents (roughly the 43 percent of the whole sample). We maintain however the distribution
29Consider indeed, for example, the individuals belonging to the group in i). If their residential choice is driven by
their concerns about ethnicity-related issues, they should have declared to prefer to move out in order to search for
more satisfactory neighborhoods in terms of ethnic composition. The fact that they say that they prefer to stay in that
neighborhood signals that other reasons are driving their location choice, such as budget constraint, distance to jobs,
availability of local services or other amenities, quality of accommodation, their concerns about their children�s education,
closeness to parents or other family reasons. A similar reasoning applies for the individual belonging to the group in ii).
30This is consistent with the related robustness analysis in Bisin-Patacchini-Verdier-Zenou (2008).31This position has been taken, in a rather extreme form, by several nationalist parties, e.g., the Lega in Italy, the
Front National in France. But similar though less extreme positions have been taken by center-right parties essentially
all over Europe. A clear example of the in�amed rhetoric that often accompanies this debate is Fallaci (2006).
15

by ethnic group as the relevant neighborhood composition variable in the identity formation and
socialization processes.
Table 4 reports our structural estimates. Tables 5 reports our non-structural estimates. They are
not qualitatively di¤erent from those in Table 2 and 3 for the whole sample. The cultural defense
model remains the mechanism more likely to represent the observed evidence. Indeed, the estimate
of 2 is still positive and the maximized likelihood value with the constraints imposed by the cultural
defense model is higher than the value which is obtained when the likelihood is constrained accordingly
to the cultural conformity mechanism of identity formation. Controlling for the covariates, Figure 2
documents the cultural defense model�s predictions regarding, respectively, identity and homogamy, �
and �, as a function of the neighborhood fraction of the minority, q:
[Insert F igure 2 here]
Such a �nding signals that the relationship between ethnic assimilation e¤ort and ethnic neighborhood
composition is not di¤erent for Muslims in respect of other minorities. In other words, other things
equal, ethnic identity and socialization e¤ort are more intense in mixed rather than in segregated
neighborhoods even when only the Muslim identity is considered.
[Insert Table 4 here]
Nonetheless, we �nd that the predicted assimilation speed32 is signi�catively lower for Muslims.
This is best documented by Figures 3 and 4, which report - for both the whole population and for the
Muslim subsample - identity and homogamy as a function of "time from arrival" for �rst generation
immigrants and for "age" for second generation immigrants. Note in particular that, in the Muslim
subsample identity and homogamy are never decreasing in "time from arrival," not even for second
generation immigrants.
[Insert F igures 3 and 4 here]
6 Discussion of results and policy implications
Our analysis suggests on the contrary that integration policies favoring the formation of mixed neigh-
borhoods, fearing the e¤ects of geographical segregation, are possibly minimally e¤ective if not coun-
terproductive. Figures 5 and 6 report on simple simulations based on our structural estimates to
illustrate this point. Identity and homogamy as a function of "time from arrival" for �rst generation
immigrants and for "age" for second generation immigrants are reported under di¤erent assumptions
on the composition of the neighborhoods where minorities live: i) all neighborhoods with the average
q of the population, ii) all neighborhoods with the minimal q of the population, iii) all neighborhoods
with the maximal q of the population.
32Predictions are based on the structural estimates.
16

[Insert F igures 5 and 6 here]
We note that integrationist policies, which include school busing, a¢ rmative action in public
schools and in the workplace, forced integration of public housing, and laws barring discrimination in
housing and employment, consistently with the view that identity formation mechanisms are driven
by cultural defense, have often had limited e¤ects and are even being at times opposed by the same
minority groups in whose interest they have been pursued (see e.g., Jacoby, 1998, and Thernstrom and
Thernstrom, 2002). J. Coleman, for instance, �fteen years after the Coleman Report (1966) which
originally proposed busing, admitted that, �the assumption that busing would improve achievement of
lower-class black children has now been shown to be �ction;�(cited in Jacoby, 1999).33 But Moving to
Opportunity (MTO) programs in the United States that relocates families from high- to low-poverty
neighborhoods (and from racially segregated to mixed neighborhoods) also have had positive but
arguably small e¤ects (see, in particular, Ludwig, Duncan, and Hirsch�eld, 2001, and Kling, Ludwig,
and Katz, 2005).34 In Europe di¤erent integration policies and ambitious social programs have been
implemented in urban areas where immigrants live but they also have had limited results. This is the
case, for instance, for the creations of Zones of Educational Priority (ZEP) and for the rehabilitation
of bleak housing projects in immigrant neighborhoods under the guise of urban policy (�politique de
la ville�) in France. Finally, even racially integrated schools have recently lost much of their appeal in
African-American communities (see e.g., the ethnographic study of Gussin Paley, 1995, for schooling).
Far from supporting policies to establish segregated neighborhoods, in this paper, we simply docu-
ment that the e¤ect of mixed neighborhood on identity formation and socialization might be perverse,
because of cultural defense.
References
[1] Ainsworth-Darnell, J.W. and D.B. Downey (1998), �Assessing the Oppositional Culture Expla-
nation for Racial/Ethnic Di¤erences in School Performance,�American Sociological Review 63,
536-553.
[2] Aboud F.(1987), " The Development of Ethnic Self-identi�cation and Attitudes", in J. Phinney
&M. Rotheran (Eds.) Childrens�Ethnic Socialization: Pluralism and Development (pp. 32-55),
Newbury Park, CA Sage.
[3] Alba, R.D. (1990), Ethnic Identity: The Transformation of White America, New Haven: Yale
University Press.
[4] Alba R.D. (2005), "Bright vs. Blurred Boundaries: Second Generation Assimilation and Exclusion
in France, Germany and the jUnited States�, Ethnic and Racial Studies, 28(1), 20-59.33The failure of the busing and other civil right policies is certainly also due to the whites��ying from de-segregated
schools and neighborhoods.34Similarly, the Toronto housing program where adults were assigned as children to di¤erent residential housing projects
(Oreopoulos, 2003) did not give the expected results in terms of education outcomes.
17
[5] Allport G.W. (1954) The Nature of Prejudice, Cambridge, MA, Addison-Wesley.
[6] Akerlof, G.A. (1980), �A Theory of Social Custom of which Unemployment May be One Conse-
quence,�Quarterly Journal of Economics 94, 749-775.
[7] Akerlof, G.A. (1997), �Social Distance and Social Decisions�, Econometrica 65, 1005-1027.
[8] Akerlof, G.A. and R.E. Kranton (2000), �Economics and Identity,�Quarterly Journal of Eco-
nomics 115, 715-753.
[9] Alesina, A. and E. La Ferrara (2005), �Ethnic Diversity and Economic Performance,�Journal of
Economic Literature 43, 762-800.
[10] Al-Johar, D. (2005), �Muslim Marriages in America: Re�ecting New Identities,� The Muslim
World 95, 557-574.
[11] Austen-Smith, D. and R.D. Fryer, Jr (2005), �An Economic Analysis of �ActingWhite�,�Quarterly
Journal of Economics 120, 551-583.
[12] Ballester, C., Calvó-Armengol, A. and Y. Zenou (2006), �Who�s Who in Networks. Wanted: The
Key Player,�Econometrica 74, 1403-1417.
[13] Banks W.(1976) "White Preference in Blacks: A Paradigm in Search of a Phenomenon" Psycho-
logical Bulletin, 83, 1179-1186.
[14] Battu, H., M. Mwale and Y. Zenou (2006), �Oppositional Identities and the Labor Market,�
Journal of Population Economics, forthcoming.
[15] Bernal, M.E. and G.P. Knight (1993), Ethnic Identity: Formation and Transmission among
Hispanics and Other Minorities, Albany: State University of New York Press.
[16] Bernheim, B.D. (1994), �A Theory of Conformity,�Journal of Political Economy 102, 841-877.
[17] Bisin, A., Patacchini, E., Verdier, T. and Y. Zenou (2008), �Are Muslims Immigrants Di¤erent
in terms of Cultural Integration?�, Journal of the European Economic Association, forthcoming.
[18] Bisin, A., Patacchini, E., Verdier, T. and Y. Zenou (2008), �Formation and Persistence of Oppo-
sitional Identities�, 6(2-3), 445-56.
[19] Bisin, A., Topa, G. and T. Verdier (2004), �Religious intermarriage and socialization in the United
States,�Journal of Political Economy 112, 615-664.
[20] Bisin, A. and T. Verdier (2000), �Beyond the Melting Pot: Cultural Transmission, Marriage, and
the Evolution of Ethnic and Religious Traits,�Quarterly Journal of Economics 115, 955-988.
[21] Bisin, A. and T. Verdier (2001), �The Economics of Cultural Transmission and the Dynamics of
Preferences,�Journal of Economic Theory 97, 298-319.
18

[22] Bobo L.D. (1999), "Prejudice as a Group Position: Microfoundations of a Sociological Approach
to Racism and Racel Relations, Journal of Social Issues 55, 445-472.
[23] Bobrow, B. (1996), "Complex Insecurity: Implications of a Sobering Metaphor," International
Studies Quarterly, 40-4, 435-50.
[24] Boyd, R. and P. J. Richerson (1985), Culture and the Evolutionary Process, Chicago: University
of Chicago Press.
[25] Brewer M. (2001),"The Many Faces of Social Identity ; Implications for Political Psychology",
Political Psychology, 22, 115-125.
[26] Calhoun, C. (1993), "Nationalism and Ethnicity," Annual Review of Sociology, 19, 211-39.
[27]
[28] Cavalli-Sforza, L.L. and M.W. Feldman (1981), Cultural Transmission and Evolution, Princeton:
Princeton University Press.
[29] Cherno¤, H. (1954), "On the Distribution of the Likelihood Ratio", The Annals of Mathematical
Statistics, Vol. 25, No. 3 pp. 573-578.
[30] Cohen-Zada, D. (2006), �Preserving Religious Identity through Education: Economic Analysis
and Evidence from the US,�Journal of Urban Economics 60.
[31] Constant, A. L. Gataullina, K.F. Zimmermann, and L. Zimmermann (2006), �Clash of Cultures:
Muslims and Christians in the Ethnosizing Process," IZA Discussion Paper 2350.
[32] Cross W.E. (1991), Shades of Black: Diversity in African-American Identity, Philadelphia: Tem-
pleUniversity Press.
[33] Delpit, L. (1995), Other People�s Children: Cultural Con�ict in the Classroom, New York: The
Free Press.
[34] Fallaci, O. (2006), The Force of Reason, New York: Rizzoli.
[35] Fershtman, C. and Y. Weiss (1998), �Social Rewards, Externalities and Stable Preferences,�
Journal of Public Economics 70, 53-73.)
[36] Fordham, S. and J. Ogbu (1986), �Blacks Students�School Successes: Coping with the Burden
of �Acting White�,�The Urban Review 18, 176-206.
[37] Fryer, R.G. Jr. and P. Torelli (2005), �An Empirical Analysis of �Acting White�,�NBER Working
Paper No. 11334.
[38] Gallis, P. (Coordinator) (2005), �Muslims in Europe: Integration Policies in Selected Countries,�
CRS Report for Congress, Congressional Research Service, The Library of Congress.
19

[39] Georgiadis and A. Manning (2008), �Change and Continuity between Minority Communities in
Britain," Journal of Population Economics, forthcoming.
[40] Glaeser, E.L. and J. Scheinkman (2000): �Non-market Interactions," NBER Working Paper 8053.
[41] Glaeser, E.L. and J. Scheinkman (2001), �Measuring Social Interactions,� In: Social Dynamics,
S.N. Durlauf and H.P. Young (Eds.), Cambridge, MA: MIT Press, pp. 83-132.
[42] Glazer N. and D.P. Moynihan (1970), Beyond the Melting Pot: The Neogroes, Puerto Ricans,
Jews, Italians and Irish of New York City, Cambridge, MA: The MIT Press.
[43] Gordon M.M. (1964), Assimilation in American Life: The Role of Race, Religion and National
Origins, New York: Oxford University Press.
[44] Gussin Paley, V. (1995), Kwanzaa and Me: A Teacher�s Story, Cambridge, MA: Harvard Univer-
sity Press.
[45] Hitmeyer W, J. Muller and H. Schroder, (1997), Turkische Jugendliche in Deutchsland, Frankfurt
am Main; Suhrkamp.
[46] Jacoby, T. (1998), Someone Else�s House: America�s Un�nished Struggle for Integration, New
York: Free Press.
[47] Jacoby, T. (1999), �Beyond Busing,�The Wall Street Journal, July 21st.
[48] Jellal, M. and F.C. Wol¤ (2002), �Cultural Evolutionary Altruism: Theory and Evidence,�Eu-
ropean Journal of Political Economy 18, 241-62.
[49] Kandel, E. and E.P. Lazear (1992), �Peer Pressure and Partnerships,�Journal of Political Econ-
omy 100, 801-817.
[50] Kling, J.R., Ludwig, J. and L.F. Katz (2005), �Neighborhood E¤ects on Crime for Female and
Male Youth: Evidence from a Randomized Housing Voucher Experiment,�Quarterly Journal of
Economics 120, 87-130.
[51] Lichter D., J.B. Brown, Z. Qian and J. H. Carmalt (2007), marital Assimilation Among Hispanics:
Evidence of Declining Cultural and Economic Incorporation?, Social Science Quarterly, 88, 745-
765.
[52] Ludwig, J., Duncan, G.J. and Hirsch�eld, P. (2001), �Urban Poverty and Juvenile Crime: Evi-
dence from a Randomized Housing-Mobility Experiment,�Quarterly Journal of Economics 116,
655-679.
[53] Meng, X. and R.G. Gregory (2005), �Intermarriage and the Economic Assimilation of Immi-
grants,�Journal of Labor Economics 23, 135-176.
20

[54] Manning, A. and S. Roy (2007), �Culture Clash or Culture Club? The Identity and Attitudes of
Immigrants in Britain," CEP Discussion Paper 790, London School Of Economics.
[55] Moghaddam F.M and E.A. Solliday (1991) " Balanced Multiculturalism and the Challenge of
Peaceful Coexistence inPluralistic Societies", Psychology and Developing Societies, 3, 51-71.
[56] Modood, T., R. Berthoud, J. Lakey, J. Nazroo, P. Smith, S. Virdee, S. Beishon (1997), Ethnic
Minorities in Britain: Diversity and Disadvantage, London: Policy Studies Institute.
[57] Mokbel, M. (2005), "Second Generation Arab Canadian Women: Issues of Acculturation and
Identity in the Greater Toronto Area". Paper presented at the annual meeting of the American
Sociological Association, Philadelphia.http://www.allacademic.com/meta/p34848_index.html
[58] Munz R, W. Seifert and R. Ulrich (1997) Zuwanderung nach Deutshland, Strukturen, Wirkungen,
Perspektiven. Frankfurt am main: Campus.
[59] Ogbu, J.U. (1997), �Beyond Language: Ebonics, Proper English and Identity in a Black American
Speech Community,�Unpublished manuscript, University of California at Berkeley, Department
of Anthropology.
[60] Oreopoulos, P. (2003), �The Long-Run Consequences of Living in a Poor Neighborhood,�Quar-
terly Journal of Economics 4, 1533-75.
[61] Patacchini, E. and Y. Zenou (2004), �Intergenerational Education Transmission: Neighborhood
Quality and/or Parents�Involvement?�, CEPR Discussion Paper No. 4744.
[62] Phinney, J.S. (1990), �Ethnic Identity in Adolescents and Adults: Review of Research,�Psycho-
logical Bulletin 108, 499-514.
[63] Putnam R. (2007) "E Pluribus Unum: Diversity and Community in the Twenty First Century;
The 2006 Johan Skytte Prize Lecture". Scandinavian Political Studies, 30, 137-174.
[64] Qian, Z. (1999), �Who Intermarries? Education, Nativity Region, and Interracial Marriage 1980
and 1990,�Journal of Comparative Family Studies 30, 579-597.
[65] Saez-Marti, M. and A. Sjögren (2006), �Peers and Culture,�Unpublished Manuscript, Research
Institute of Industrial Economics, Stockholm.
[66] Self, S.G. and K.-Y. Liang, (1987), "Asymptotic Properties of Maximum Likelihood Estimators
and Likelihood Ratio Tests Under Nonstandard Conditions", Journal of the American Statistical
Association, Vol. 82, No. 398, pp. 605-610.
[67] Selod, H. and Y. Zenou (2006), �Does City Structure A¤ect the Labor Market Outcomes of Black
Workers?�, Economic Journal 116.
[68] Shaw, F. H. and C. J. Geyer (1997), "Estimation and Testing in Constrained Covariance Com-
ponent Models", Biometrika, Vol. 84, No. 1 , pp. 95-102.
21
[69] Sheikh C. (2005) �The E¤ect of Religiosity on Ethnic Identity Among Second-Generation Muslim
Americans� Paper presented at the annual meeting of the American Sociological Association
Philadelphia http://www.allacademic.com/meta/p21451_index.html.
[70] Stryker S. (1980), Symbolic Interactionism: A Social Structural Version, Menlo Park, CA: ben-
jamin Cummings
[71] Tajfel H.(1981), Human Groups and Social Categories: Studies in Social Psychology, Cambridge,
England: Cambridge University Press.
[72] Tajfel H. and J.C.Turner (1979), "An Intergrative Theory of Intergroup Con�ict", in W.G. Austin
&S. Worchel (Eds.) The Social Psychology of Intergroup Relations (pp. 33-47), Monterey , CA
Brooks/Cole.
[73] Taylor D.M.and W.E.Lambert (1996), "The Meaning of Multiculturalism in a Culturally Diverse
Urban American Area", Journal of Social Psychology, 136, 727-740.
[74] Taylor D.M. and F.M. Moghaddam (1987), Theories of Intergroup Relations: International Social
Psychological Perspectives, New York, Praeger.
[75] Thernstrom A. and S. Thernstrom (2002), Beyond the Color Line: New Perspectives on Race and
Ethnicity in America, New York: Hoover Press and the Manhattan Institute.
[76] Tucker, M. B. and C. Mitchell-Kernan (1990), �New Trends in Black American Interracial Mar-
riage: The Social Structural Context,�Journal of Marriage and the Family 52, 209-218.
[77] Turner J.C. (1982), "Towards a Cognitive Rede�nition of the Social Group" in H. Tajfel (ed.)
Social Identity and Intergroup Relations (pp. 15-44) Cambridge England: Cambridge University
Press.
[78] Turner J.C., M.A. Hogg, P.J. Oakes, S.D Reicher and M.S. Wethrell (1987), Rediscovering the
Social Group: A Self-categorization Theory, Oxford England: Blackwell.
[79] Wilks S. S. (1938), "The Large-Sample Distribution of the Likelihood Ratio for Testing Composite
Hypotheses", The Annals of Mathematical Statistics, Vol. 9, No. 1, pp. 60-62
[80] Wilson, W. J. (1987), The truly Disadvantaged: The Inner City, the Underclass, and Public
Policy, Chicago: University of Chicago Press.
[81] Wooldridge, J. (2002), The Econometric Analysis of Cross Section and Panel Data, Cambridge:
MIT Press.
[82] Whyte, W.F. (1943), Street Corner Society, Chicago: University of Chicago Press.
[83] Zhou M.. (1997), "Segmented Assimilation: Issues, Controversies and Recent Research on the
new Second Generation", International Migration Review, 4, 975-1008.
22

Table 1: Description of data
n.obs: 1,565
Variable Explanation of the variable Mean St.dev.
Identity/Importance of religion In the text 0.61 0.49 Homogamy In the text 0.93 0.26 Ward density of own ethnicity Percentage of residents of the respondent's
ethnic group in the ward 13.59 10.76
Age at arrival Respondent's age in years at arrival in the UK
21.04 10.31
Female Dummy variable taking value one if the respondent is female.
0.47 0.50
Born in the UK Dummy variable taking value one if the respondent is born in the UK
0.10 0.30
Arranged Marriage Dummy variable taking value one if the husband/wife of the respondent has been chosen by the parents.
0.36 0.48
Discrimination Dummy variable taking value one if the respondent had been insulted or threatened in the last year for reasons to do with race or colour.
0.10 0.30
Children Dummy variable taking value one if the respondent has children.
0.91 0.29
Years since arrival Number of years since respondent's arrival in UK.
20.25 11.44
British degree Dummy variable taking value one if the respondent has a UK degree.
0.21 0.41
British high education Dummy variable taking value one if the respondent has a UK O-level (or equivalent) or above qualification.
0.16 0.37
Foreign education Dummy variable taking value one if the respondent has a qualification achieved abroad.
0.28 0.45
Employed Dummy variable taking value one if the respondent is employed.
0.47 0.50
Manager Dummy variable taking value one if the respondent is a manager.
0.03 0.161
Employee Dummy variable taking value one if the respondent is an employee
0.57 0.50
English spoken at home Dummy variable taking value one if English is the language normally spoken at home with family members (who are older) by the respondent.
0.12 0.33
English spoken with friends Dummy variable taking value one if English is the language normally spoken with friends (outside work) by the respondent.
0.52 0.50
English spoken at work Dummy variable taking value one if English is the language normally spoken at work by the respondent.
0.48 0.50
House owner Dummy variable taking value one if the household owns (or is buying) the accommodation
0.76 0.43
Ward unemployment rate Ward unemployment rate 14.40 5.22

Table 2: Maximum likelihood results -Structural approach-
Dependent variable: (1) Identity, (2) Homogamy
Table 2a Unconstrained likelihood
Table 2b Cultural defense
(1) (2) (1) (2) c 0.0714***
(0.0034) 0.0512***
(0.0054) alpha 2.2742**
(0.1088) 1.5414***
(0.1535) Gamma1 -0.8924***
(0.1820) -0.4757***
(0.1444) Gamma2 0.7980***
(0.0317) -
Age at arrival 0.0172*** (0.0061)
0.0207*** (0.0062)
-0.0173 (0.0033)
0.0220*** (0.0082)
Age -0.0203 (0.0144)
-0.0201*** (0.0060)
0.0067* (0.0037)
0.0019 (0.0125)
Age^2 -0.0004 (0.0003)
-0.0004** (0.0002)
-0.0004 (0.0003)
0.0015*** (0.0003)
Female 0.1028 (0.1082)
0.2241** (0.1086)
0.0326 (0.0929)
0.0471 (0.1179)
Born in the UK 0.0082 (0.2806)
-0.0101 (0.1292)
0.0056 (0.1300)
0.0149 (0.1940)
Arranged marriage -0.0135 (0.1462)
-0.3388*** (0.1325)
0.0216 (0.0780)
0.0296 (0.1107)
Discrimination 0.0330 (0.1463)
0.2157** (0.1099)
0.0420 (0.0958)
0.0632 (0.1357)
Children 0.0529 (0.1179)
0.3008*** (0.1079)
-0.0184 (0.0606)
0.0894 (0.1097)
Years since arrival -0.0031 (0.0055)
-0.0083** (0.0035)
-0.0093*** (0.0017)
0.0084 (0.0055)
Years since arrival^2 -0.0004** (0.0002)
-0.0005*** (0.0001)
0.0002** (0.0001)
-0.0009*** (0.0001)
British degree -0.0601 (0.2325)
-0.3172*** (0.1075)
-0.0435 (0.0759)
0.0035 (0.2643)
British high education -0.0122 (0.1880)
-0.2323** (0.1211)
0.1059 (0.0978)
-0.0355 (0.1912)
Foreign education -0.0038 (0.1416)
-0.2448 (0.1355)
-0.0144 (0.0675)
-0.0343 (0.1254)
Employed -0.0168 (0.1859)
-0.0922 (0.1803)
-0.0065 (0.0873)
-0.0030 (0.2295)
Manager 0.0082 (0.1517)
0.3625*** (0.1439)
0.0207 (0.1111)
-0.00008 (0.1512)
Employee -0.1866 (0.1272)
-0.1032 (0.1274)
-0.0372 (0.0699)
-0.1320 (0.1369)
English spoken at home 0.2059 (0.1427)
0.3106*** (0.1080)
0.0053 (0.1115)
0.0577 (0.1472)
English spoken at work -0.0025 (0.1372)
0.0419 (0.1683)
0.0701 (0.0707)
0.0081 (0.1468)
English spoken with friends 0.0304 (0.1193)
0.2487** (0.1246)
0.0016 (0.0931)
-0.0085 (0.1405)
House owner 0.0822 (0.1168)
0.2072** (0.1011)
-0.0630 (0.0807)
0.0628 (0.1176)
Ward unemployment rate 0.0995*** (0.0167)
0.0942*** (0.0125)
-0.0260*** (0.0024)
0.0113 (0.0200)
Constrained likelihood Cultural defense
-1446.305
Constrained likelihood Cultural conformity
-1635.733

Table 3: Maximum likelihood results -Non-structural approach-
Dependent variable: (1) Identity, (2) Homogamy
(1) (2) (1) Effects of q
(2)
Age at arrival 0.0070
(0.0051) 0.0263** (0.0109)
q>33% -0.0494
-0.0588
Age 0.4783** (0.2407)
-0.1089** (0.1867)
33%<q<25% -0.0398 -0.0348
Age^2 -0.0078* (0.0040)
0.0007 (0.0027)
25%<q<15% -0.0182 0.0192
Female 0.1026 (0.0916)
0.1465 (0.1566)
15%<q<10% -0.0002 0.0642
Born in the UK -7.7124** (3.5243)
1.9340 (3.1218)
10%<q<5% 0.0118 0.0942
Arranged marriage 0.3992*** (0.0983)
0.9357** (0.3771)
5%<q<2% 0.0214 0.1182
Discrimination 0.0220 (0.1341)
-0.0797 (0.1913)
q<2% 0.0250 0.1273
Children 0.0110 (0.1607)
0.1173 (0.2114)
Years since arrival -0.0202 (0.0204)
0.0293 (0.0355)
Years since arrival^2 0.0003 (0.0004)
-0.0009 (0.0007)
British degree 0.1247 (0.1157)
-0.5482*** (0.1552)
British high education 0.3393** (0.1335)
0.2217 (0.1715)
Foreign education -0.1033 (0.1009)
-0.0559 (0.1816)
Employed -0.2587** (0.1115)
0.0089 (0.1758)
Manager 0.2872 (0.2367)
-0.0247 (0.3045)
Employee -0.6926 (0.0960)
-0.3045* (0.1773)
English spoken at home -0.2830** (0.1379)
0.6298*** (0.1928)
English spoken at work 0.0470 (0.1240)
0.4075** (0.2008)
English spoken with friends -0.0502 (0.1111)
0.2099 (0.1883)
House owner -0.0358 (0.1193)
0.6545*** (0.1749)
Ward unemployment rate 0.0428*** (0.0101)
0.0086 (0.0154)
Notes. Marginal effects at the sample means and (robust) standard errors in parentheses are reported. A constant and regional dummies are included. Results weighted for population proportions. * significant at 10%; ** significant at 5%; *** significant at 1%.

Table 4: Maximum likelihood results
Muslim sub-sample -Structural approach-
Dependent variable: (1) Identity, (2) Homogamy
Table 4a Unconstrained likelihood
Table 4b Cultural defense
(1) (2) (1) (2) c 0.0576***
(0.0059) 0.04661***
(0.0052) alpha 2.4764 ***
(0.2597) 1.5727***
(0.2878) Gamma1 -0.6920**
(0.3077) -0.5925
(0.3996) Gamma2 0.8299***
(0.0743) -
Age 0.0235 (0.0855)
0.0744 (0.0452)
-0.0313 (0.0818)
-0.0340 (0.0642)
Age^2 -0.0015 (0.0041)
-0.0020 (0.0019)
0.0010 (0.0038)
0.0012 (0.0024)
Female 0.1894 (0.2429)
0.3728 (0.2636)
0.2426 (0.2606)
0.2065 (0.2115)
Born in the UK 0.0146 (0.4742)
-0.0545 (0.4934)
0.0671 (0.4624)
0.2809 (0.2982)
Arranged marriage 0.1943 (0.2512)
0.4747** (0.2460)
0.1825 (0.2311)
0.4298* (0.2317)
Children -0.0537 (0.2949)
0.4261 (0.3066)
0.0518 (0.2776)
0.3454 (0.2262)
Years since arrival -0.0002 (0.0144)
0.0156 (0.0141)
-0.0027 (0.0175)
-0.0002 (0.0120)
Years since arrival^2 0.00003 (0.0004)
0.0003 (0.0005)
0.0002 (0.0006)
0.0003 (0.0005)
British degree 0.0159 (0.2939)
-0.1766 (0.3138)
0.0310 (0.3598)
-0.5441** (0.2585)
British high education -0.0037 (0.4082)
-0.2545 (0.2998)
-0.0635 (0.4047)
-0.1536 (0.3232)
Employed -0.1830 (0.3849)
-0.3026 (0.2679)
-0.0242 (0.3286)
-0.1377 (0.2006)
Manager - 0.0266 (0.4429)
-0.5059 (0.4450)
0.0356 (0.4199)
-0.1573 (0.3245)
English spoken at home -0.0090 (0.2778)
-0.2607 (0.2868)
0.0400 (0.2846)
-0.0604 (0.2276)
English spoken at work -0.0831 (0.3759)
-0.6300*** (0.2364)
-0.5607* (0.3094)
-0.5645** (0.2531)
House owner 0.0290 (0.2721)
0.3347 (0.2103)
-0.0223 (0.2371)
0.3504 (0.2129)
Ward unemployment rate 0.1452*** (0.0301)
0.0772*** (0.0180)
0.1469*** (0.0248)
0.0791*** (0.0163)
Constrained likelihood Cultural defense
-503.023
Constrained likelihood Cultural conformity
-650.306
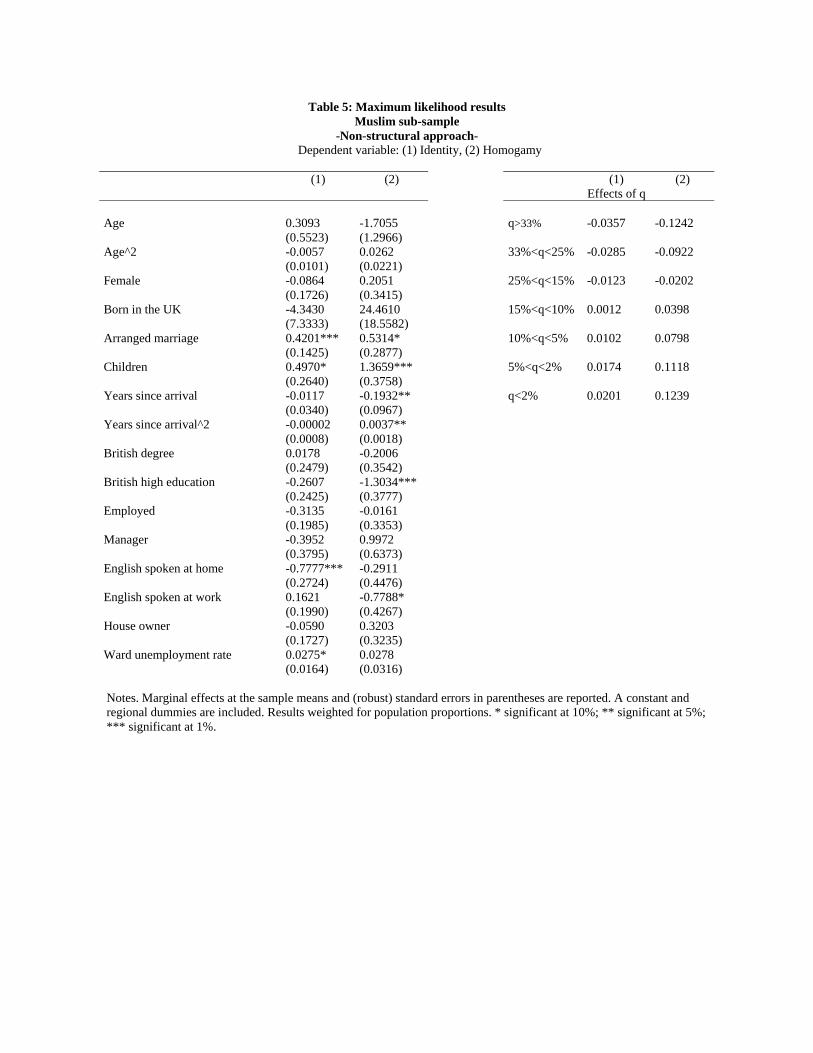
Table 5: Maximum likelihood results Muslim sub-sample
-Non-structural approach- Dependent variable: (1) Identity, (2) Homogamy
(1) (2) (1)
Effects of q (2)
Age 0.3093
(0.5523) -1.7055 (1.2966)
q>33% -0.0357
-0.1242
Age^2 -0.0057 (0.0101)
0.0262 (0.0221)
33%<q<25% -0.0285 -0.0922
Female -0.0864 (0.1726)
0.2051 (0.3415)
25%<q<15% -0.0123 -0.0202
Born in the UK -4.3430 (7.3333)
24.4610 (18.5582)
15%<q<10% 0.0012 0.0398
Arranged marriage 0.4201*** (0.1425)
0.5314* (0.2877)
10%<q<5% 0.0102 0.0798
Children 0.4970* (0.2640)
1.3659*** (0.3758)
5%<q<2% 0.0174 0.1118
Years since arrival -0.0117 (0.0340)
-0.1932** (0.0967)
q<2% 0.0201 0.1239
Years since arrival^2 -0.00002 (0.0008)
0.0037** (0.0018)
British degree 0.0178 (0.2479)
-0.2006 (0.3542)
British high education -0.2607 (0.2425)
-1.3034*** (0.3777)
Employed -0.3135 (0.1985)
-0.0161 (0.3353)
Manager -0.3952 (0.3795)
0.9972 (0.6373)
English spoken at home -0.7777*** (0.2724)
-0.2911 (0.4476)
English spoken at work 0.1621 (0.1990)
-0.7788* (0.4267)
House owner -0.0590 (0.1727)
0.3203 (0.3235)
Ward unemployment rate 0.0275* (0.0164)
0.0278 (0.0316)
Notes. Marginal effects at the sample means and (robust) standard errors in parentheses are reported. A constant and regional dummies are included. Results weighted for population proportions. * significant at 10%; ** significant at 5%; *** significant at 1%.

Figure 1: Identity and homogamy as a function of neighborhood composition- controlling for covariates; whole sample
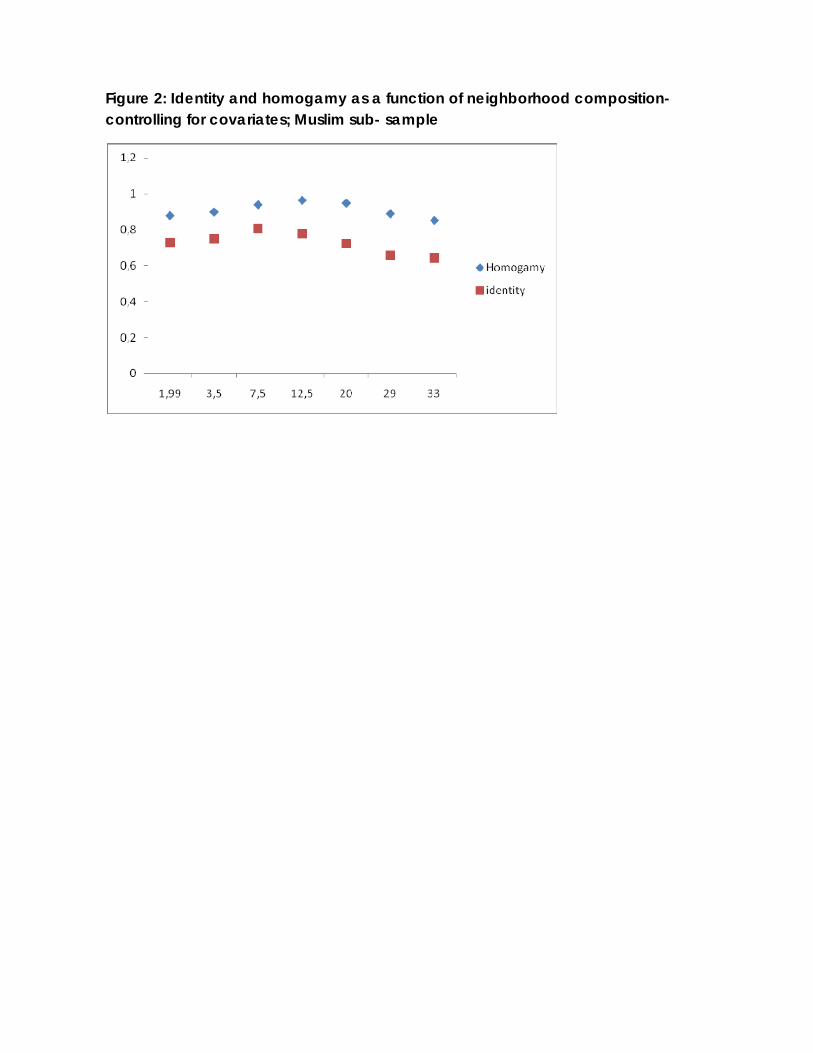
Figure 2: Identity and homogamy as a function of neighborhood composition- controlling for covariates; Muslim sub- sample

Figure 3 Predicted Identity as a function of time spent in the UK
Figure 4 Predicted Homogamy as a function of time spent in the UK

Figure 5 Predicted Identity as a function of time spent in the UK – i) at minimum q, ii) at average q, iii) at maximum q
i)
ii)
iii)

iv) Figure 5 Predicted Homogamy as a function of time spent in the UK – i) at minimum q, ii) at average q, iii) at maximum q
i)
ii)
iii)
Related Documents