Prepared by BC Management & BC Management’s International Benchmarking Advisory Board July XX, 2009 Prepared by BC Management, Inc. - October 2010 Business Continuity Program Management Benchmarking Report - SAMPLE REPORT Benchmarking. Plan Ahead. Be Ahead.

Welcome message from author
This document is posted to help you gain knowledge. Please leave a comment to let me know what you think about it! Share it to your friends and learn new things together.
Transcript
Prepared by BC Management
& BC Management’s
International Benchmarking
Advisory Board
July XX, 2009
Prepared by BC Management, Inc.
- October 2010
Business Continuity Program Management Benchmarking Report
- SAMPLE REPORT
Benchmarking. Plan Ahead. Be Ahead.
Copyright ©2010 BC Management, Inc. All rights reserved. SAMPLE REPORT
Page 2
Table of Contents
Introduction 4 Reporting History 4 Study Methodology 4 Assessment of Data & Reporting 5 Participant Data & Respondent Characteristics ~ An overview of respondent characteristics. 5-9
Business Continuity Program Management Awareness Study Topics 10-52
Program Maturity
Program maturity ratings 10
IT/ Disaster Recovery & Business Continuity strategies adequately supporting organizations 10-11
Maintain and foster relationships with other external organizations 12
Integration of program with other organizational disciplines 12-14
Status of current program 15-16
Assessment of program expenses, average full-time and part-time employees, average number of disciplines managed in program and average maturity rating by country
16
Budgeting
Budgeting of expenses within organization 16-17
Items included in the budget, percent of total budget and monetary budget amount per item 17-18
Budget revisions 18
Anticipated increase/ decrease by individual budget line item 18
Personnel
Current dedicated personnel 19
Hiring initiatives for the next year 20
Reduction of full-time, permanently employed personnel in the next year 21
Primary reason behind a reduction in force in the next year 21
Organizational Reporting Structure
Positioning of program for maximum visibility within organization 22
Change to department owner being considered 22
Department owner by program maturity 23
Department owner being considered for a change or department owner preferred 23-24
Program Sponsorship
Assessment by job title on who is totally engaged and sponsoring the program 24
Sponsor of program by program maturity 25
Sponsor’s level of engagement if a chief officer level or above 26
Sponsor’s level of separation from the executive committee 26
Change to level of sponsorship being considered 26
Level of sponsorship being considered for a change or level of sponsorship preferred 27
Program Assessment and Exercising Plans
Reviewing and updating the business impact assessment (BIA) 28
BIA by program maturity 28-29
Leverage the outcome of the BIA and/ or risk assessments to elevate the program 29
Exercising the plans 30
Exercise the plans for mission critical IT assets, mission critical business functions, less critical IT assets, and less critical business functions
30
Exercising the plans by program maturity 31-32
Scenarios implemented to exercise the plans 33
Auditing the program 33
Auditing the program by program maturity 34
Copyright ©2010 BC Management, Inc. All rights reserved. SAMPLE REPORT
Page 3
Table of Contents Continued Recovery Time
Contingency program’s point of failure to a point of availability/ up time for the service 35
Estimated financial loss per hour by downtime 35
Technology Recovery Solutions – Internal or External
Utilization of third-party hot site/ alternate site technology providers 36-37
Considering an internal recovery capability 37
Change to the technology recovery solution in the previous two years 37-38
Change to the technology recovery solution in the next year – technology recovery solutions being considered and estimated budget
38
Cloud Computing
Consideration of cloud computing in the next year 39
If yes, rate the factors in your decision making process 39
Consulting Initiatives
Utilization of contractors 40
Longest engagement time for a contractor 40
Consulting work anticipated in the next year 41-42
Vendor Utilization
Utilization of software planning tools 43-44
Consideration software tools in the next year and estimated budget 44
Utilization of automated notification tools 45-46
Consideration automated notification tools in the next year and estimated budget 46
Utilization of mobile recovery solutions 46-47
Consideration mobile recovery solutions in the next year and estimated budget 47 Managing Dispersed Offices
Accountability of offices/ facilities outside current location under existing program 48
Assessment of managing the business continuity program for dispersed offices/ facilities 48
Reasons for Planning, Regulatory Requirements & Organizational Certification
Primary reasons for developing and maintaining a program 49
Regulatory requirements and/or standards to model program after 49-50
Obtaining an organizational certification in a standard 51
Consideration of becoming certified in an organizational standard 51-52
Thank you to BC Management’s International Benchmarking Advisory Board 52 Thank you to our Sponsors and those Organizations who Distributed the Study and/or Report 52-54 About BC Management, Inc. & Where to Download Complimentary Reports 55 Customize a Report Exclusively for your Organization 55-56
Confidential Report
This is a confidential report. As such, the information within this report should not be shared outside the
organization that requested and purchased the research data. This report is not being distributed as a
complimentary report among the profession. Please contact BC Management if you would like to share or site any
of the information included within the report.
Copyright ©2010 BC Management, Inc. All rights reserved. SAMPLE REPORT
Page 4
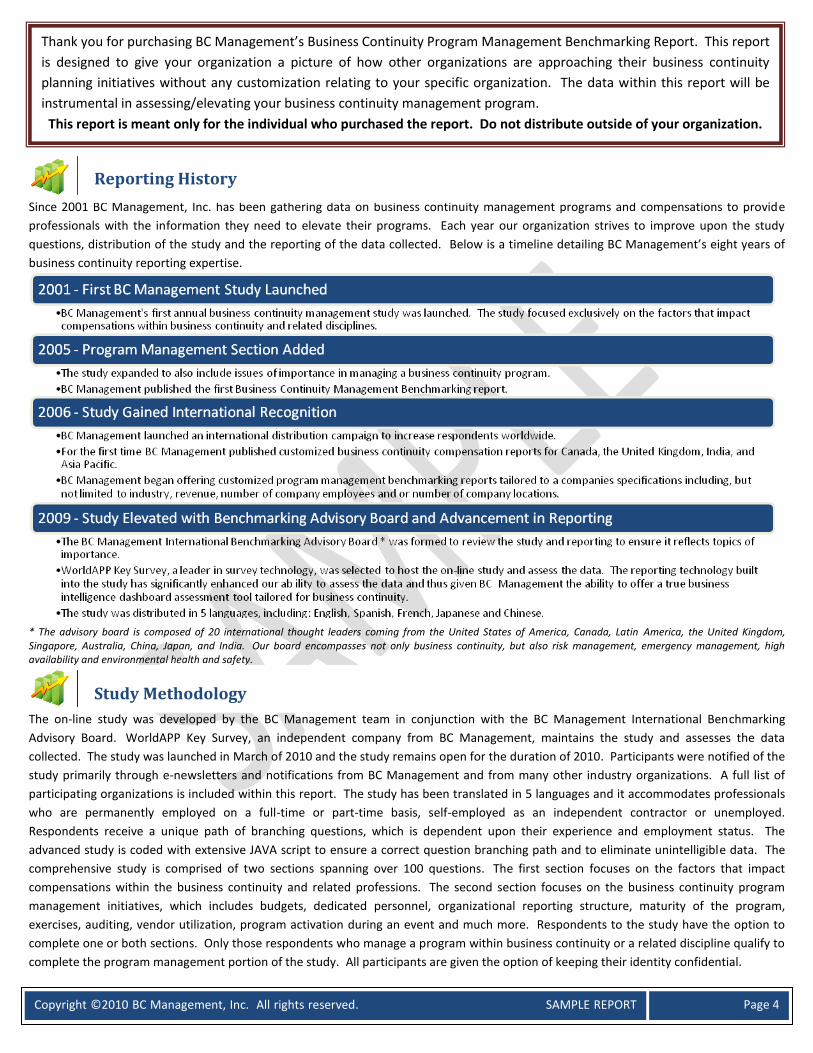
Since 2001 BC Management, Inc. has been gathering data on business continuity management programs and compensations to provide
professionals with the information they need to elevate their programs. Each year our organization strives to improve upon the study
questions, distribution of the study and the reporting of the data collected. Below is a timeline detailing BC Management’s eight years of
business continuity reporting expertise.
* The advisory board is composed of 20 international thought leaders coming from the United States of America, Canada, Latin America, the United Kingdom, Singapore, Australia, China, Japan, and India. Our board encompasses not only business continuity, but also risk management, emergency management, high availability and environmental health and safety.
The on-line study was developed by the BC Management team in conjunction with the BC Management International Benchmarking
Advisory Board. WorldAPP Key Survey, an independent company from BC Management, maintains the study and assesses the data
collected. The study was launched in March of 2010 and the study remains open for the duration of 2010. Participants were notified of the
study primarily through e-newsletters and notifications from BC Management and from many other industry organizations. A full list of
participating organizations is included within this report. The study has been translated in 5 languages and it accommodates professionals
who are permanently employed on a full-time or part-time basis, self-employed as an independent contractor or unemployed.
Respondents receive a unique path of branching questions, which is dependent upon their experience and employment status. The
advanced study is coded with extensive JAVA script to ensure a correct question branching path and to eliminate unintelligible data. The
comprehensive study is comprised of two sections spanning over 100 questions. The first section focuses on the factors that impact
compensations within the business continuity and related professions. The second section focuses on the business continuity program
management initiatives, which includes budgets, dedicated personnel, organizational reporting structure, maturity of the program,
exercises, auditing, vendor utilization, program activation during an event and much more. Respondents to the study have the option to
complete one or both sections. Only those respondents who manage a program within business continuity or a related discipline qualify to
complete the program management portion of the study. All participants are given the option of keeping their identity confidential.
Reporting History
Study Methodology
Thank you for purchasing BC Management’s Business Continuity Program Management Benchmarking Report. This report
is designed to give your organization a picture of how other organizations are approaching their business continuity
planning initiatives without any customization relating to your specific organization. The data within this report will be
instrumental in assessing/elevating your business continuity management program.
This report is meant only for the individual who purchased the report. Do not distribute outside of your organization.
Copyright ©2010 BC Management, Inc. All rights reserved. SAMPLE REPORT
Page 5
BC Management is continuously reviewing and verifying the data points received in the study. Data points in question are confirmed by
contacting the respondent that completed that study. If the respondent did not include their contact information, than their response to
the study may be removed. With our eight years of expertise in collecting and assessing such data points, BC Management has an
exceptional understanding of what is considered questionable or unintelligible data.
WorldAPP Key Survey built a customized reporting tool for BC Management, which enables us to prepare customized benchmarking reports based on a client’s request. The result is a report that provides a unique understanding on how your program compares to competitors or other similar organizations. Before creating the customized report, we verify the filters selected by the client and confirm the number of respondents that will be included in their customized report. The charts and tables are instantaneously created once the client agrees to the framework of the report. The client receives a PDF document as well as a business intelligence dashboard for further assessment. The business intelligence dashboard allows the client to further assess the data points within their customized report in a dynamic, user friendly interface. Study respondent contact information remains confidential and is never revealed. The charts and graphs will reflect what respondents answered in the study. If a selection within a question is not selected it will NOT be included in the results.
2,043 study participants from 50 countries as of October 1, 2010. Incomplete/ partial study responses were included as appropriate within
the report. Study was divided into 2 sections.
Business Continuity Compensation – 1,874 study participants completed the compensation section from 57 countries.
Business Continuity Program Management – 912 study participants completed the program management section from 39 countries. Incomplete study responses were included within this report along with the completed responses.
Complete responses were received from the following countries: Australia, Bahrain, Bermuda, Brazil, Canada, Cayman Islands, China, Costa-Rica, Egypt, Finland, France, Germany, Greece, India, Indonesia, Ireland, Israel, Italy, Japan, Jordan, Kenya, Kuwait, Luxembourg, Malaysia, Mauritius, Mexico, Netherlands, New Zealand, Nigeria, Pakistan, Philippines, Poland, Russia, Saudi Arabia, Singapore, Switzerland, United Arab Emirates, United Kingdom, and United State of America.
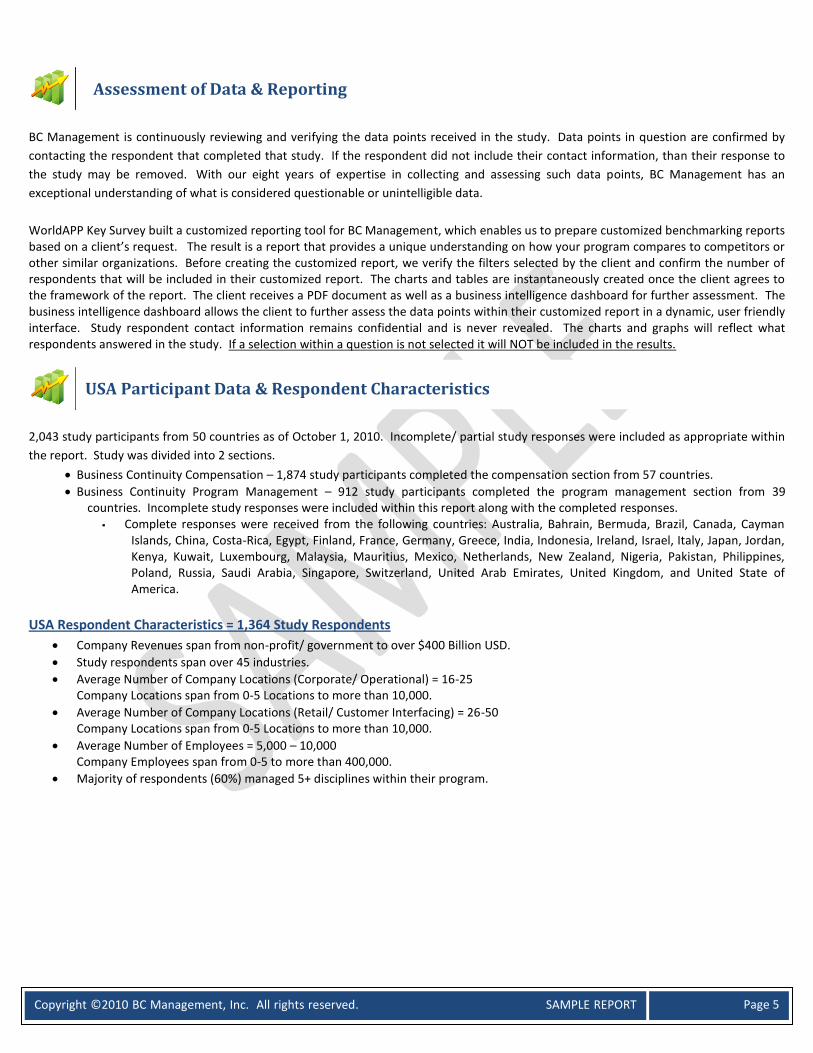
USA Respondent Characteristics = 1,364 Study Respondents
Company Revenues span from non-profit/ government to over $400 Billion USD.
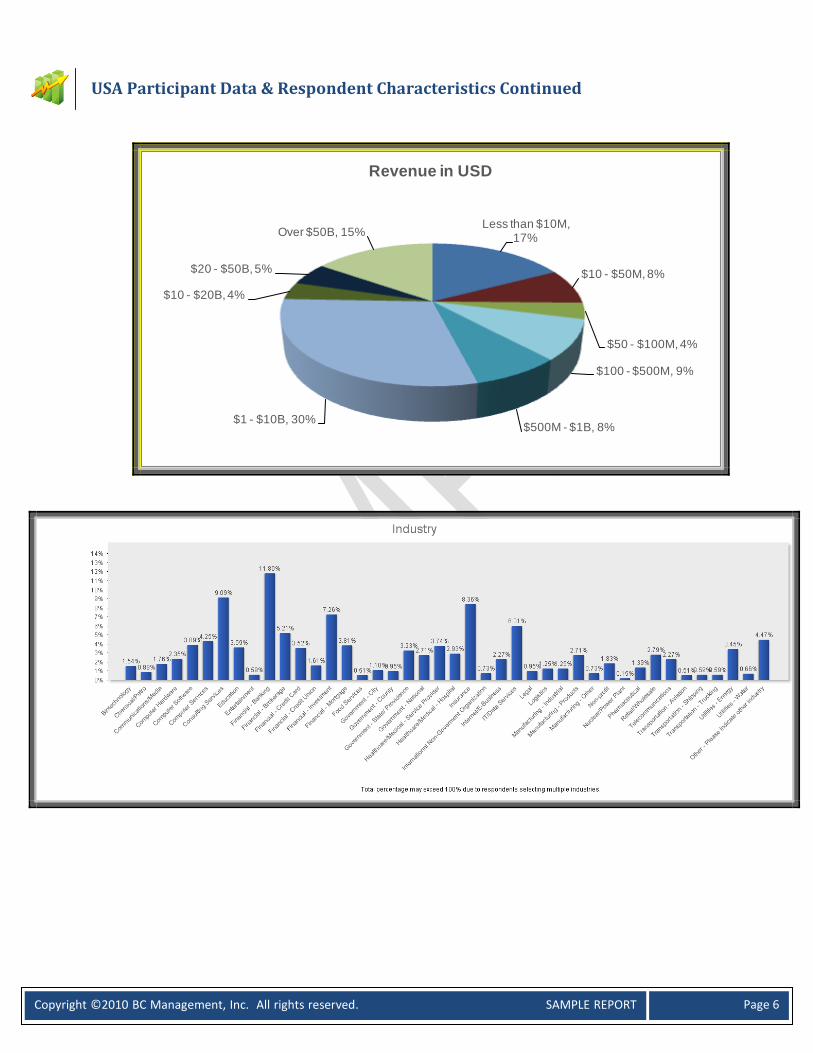
Study respondents span over 45 industries.
Average Number of Company Locations (Corporate/ Operational) = 16-25 Company Locations span from 0-5 Locations to more than 10,000.
Average Number of Company Locations (Retail/ Customer Interfacing) = 26-50 Company Locations span from 0-5 Locations to more than 10,000.
Average Number of Employees = 5,000 – 10,000 Company Employees span from 0-5 to more than 400,000.
Majority of respondents (60%) managed 5+ disciplines within their program.
Assessment of Data & Reporting
USA Participant Data & Respondent Characteristics
Copyright ©2010 BC Management, Inc. All rights reserved. SAMPLE REPORT
Page 6
Less than $10M, 17%
$10 - $50M, 8%
$50 - $100M, 4%
$100 - $500M, 9%
$500M - $1B, 8%$1 - $10B, 30%
$10 - $20B, 4%
$20 - $50B, 5%
Over $50B, 15%
Revenue in USD
USA Participant Data & Respondent Characteristics Continued

Copyright ©2010 BC Management, Inc. All rights reserved. SAMPLE REPORT
Page 7
USA Participant Data & Respondent Characteristics Continued

Copyright ©2010 BC Management, Inc. All rights reserved. SAMPLE REPORT
Page 8
USA Participant Data & Respondent Characteristics Continued

Copyright ©2010 BC Management, Inc. All rights reserved. SAMPLE REPORT
Page 9
USA Participant Data & Respondent Characteristics Continued
Copyright ©2010 BC Management, Inc. All rights reserved. SAMPLE REPORT
Page 10
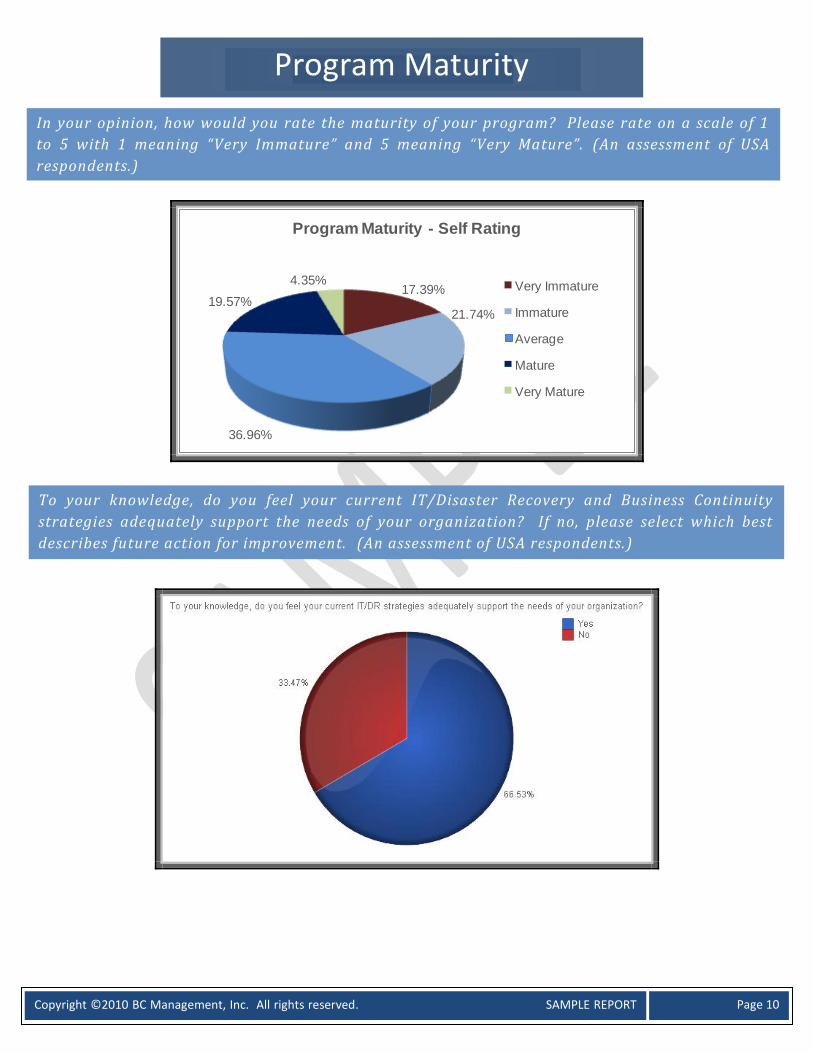
17.39%
21.74%
36.96%
19.57%
4.35%
Program Maturity - Self Rating
Very Immature
Immature
Average
Mature
Very Mature
Program Maturity
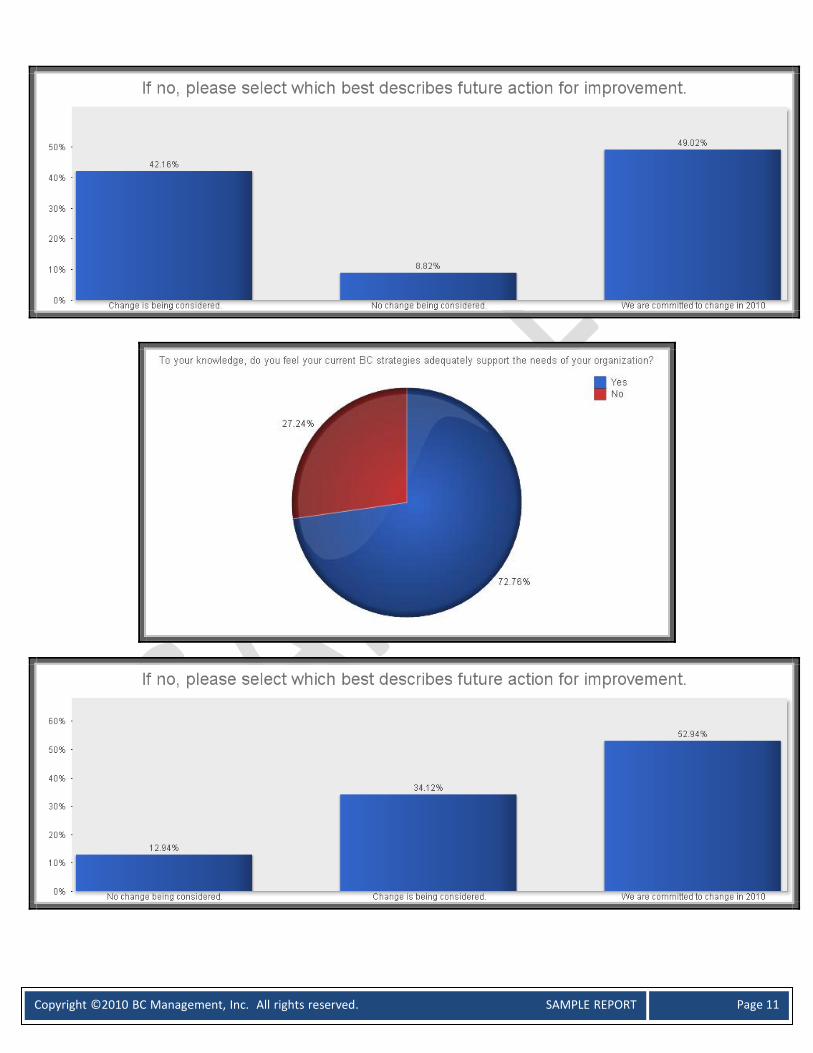
To your knowledge, do you feel your current IT/Disaster Recovery and Business Continuity
strategies adequately support the needs of your organization? If no, please select which best
describes future action for improvement. (An assessment of USA respondents.)
In your opinion, how would you rate the maturity of your program? Please rate on a scale of 1
to 5 with 1 meaning “Very Immature” and 5 meaning “Very Mature”. (An assessment of USA
respondents.)
Copyright ©2010 BC Management, Inc. All rights reserved. SAMPLE REPORT
Page 11
Copyright ©2010 BC Management, Inc. All rights reserved. SAMPLE REPORT
Page 12
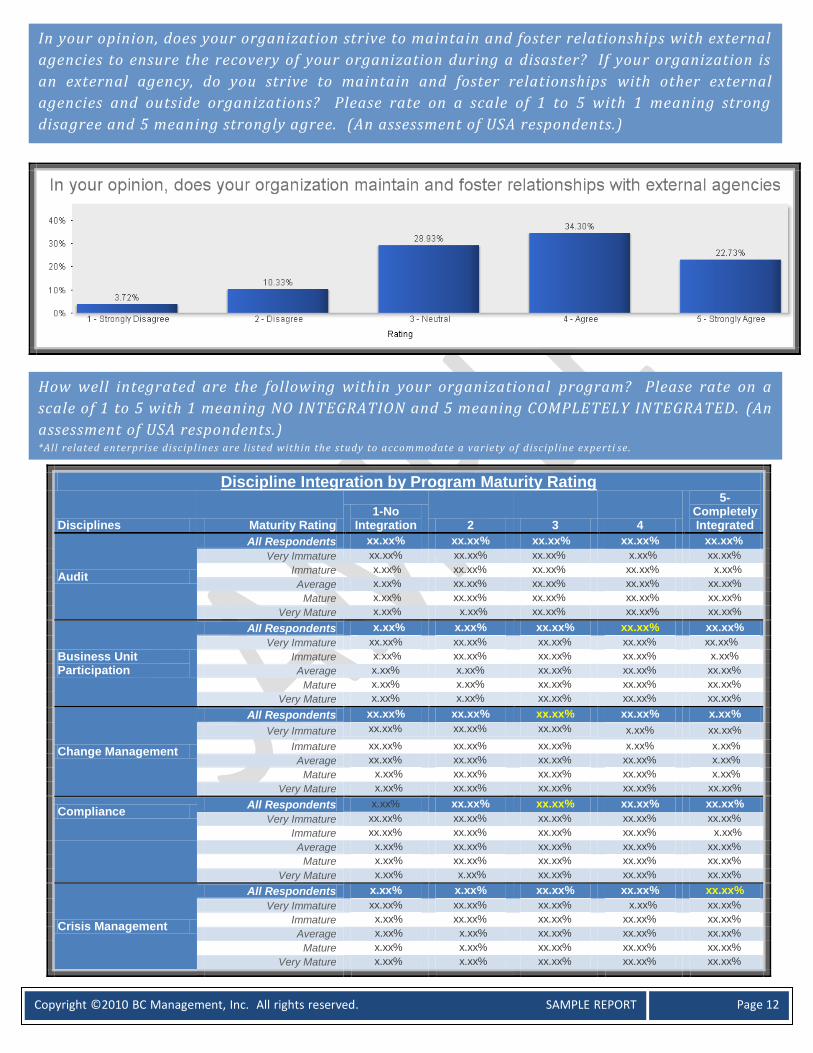
Discipline Integration by Program Maturity Rating
Disciplines Maturity Rating 1-No
Integration 2 3 4
5-Completely Integrated
Audit
All Respondents xx.xx% xx.xx% xx.xx% xx.xx% xx.xx% Very Immature xx.xx% xx.xx% xx.xx% x.xx% xx.xx%
Immature x.xx% xx.xx% xx.xx% xx.xx% x.xx%
Average x.xx% xx.xx% xx.xx% xx.xx% xx.xx%
Mature x.xx% xx.xx% xx.xx% xx.xx% xx.xx%
Very Mature x.xx% x.xx% xx.xx% xx.xx% xx.xx%
Business Unit Participation
All Respondents x.xx% x.xx% xx.xx% xx.xx% xx.xx%
Very Immature xx.xx% xx.xx% xx.xx% xx.xx% xx.xx%
Immature x.xx% xx.xx% xx.xx% xx.xx% x.xx%
Average x.xx% x.xx% xx.xx% xx.xx% xx.xx% Mature x.xx% x.xx% xx.xx% xx.xx% xx.xx%
Very Mature x.xx% x.xx% xx.xx% xx.xx% xx.xx%
Change Management
All Respondents xx.xx% xx.xx% xx.xx% xx.xx% x.xx%
Very Immature xx.xx% xx.xx% xx.xx% x.xx% xx.xx%
Immature xx.xx% xx.xx% xx.xx% x.xx% x.xx%
Average xx.xx% xx.xx% xx.xx% xx.xx% x.xx%
Mature x.xx% xx.xx% xx.xx% xx.xx% x.xx%
Very Mature x.xx% xx.xx% xx.xx% xx.xx% xx.xx%
Compliance All Respondents x.xx% xx.xx% xx.xx% xx.xx% xx.xx%
Very Immature xx.xx% xx.xx% xx.xx% xx.xx% xx.xx%
Immature xx.xx% xx.xx% xx.xx% xx.xx% x.xx%
Average x.xx% xx.xx% xx.xx% xx.xx% xx.xx% Mature x.xx% xx.xx% xx.xx% xx.xx% xx.xx%
Very Mature x.xx% x.xx% xx.xx% xx.xx% xx.xx%
Crisis Management
All Respondents x.xx% x.xx% xx.xx% xx.xx% xx.xx%
Very Immature xx.xx% xx.xx% xx.xx% x.xx% xx.xx% Immature x.xx% xx.xx% xx.xx% xx.xx% xx.xx% Average x.xx% x.xx% xx.xx% xx.xx% xx.xx%
Mature x.xx% x.xx% xx.xx% xx.xx% xx.xx% Very Mature x.xx% x.xx% xx.xx% xx.xx% xx.xx%
In your opinion, does your organization strive to maintain and foster relationships with external
agencies to ensure the recovery of your organization during a disaster? If your organization is
an external agency, do you strive to maintain and foster relationships with other external
agencies and outside organizations? Please rate on a scale of 1 to 5 with 1 meaning strong
disagree and 5 meaning strongly agree. (An assessment of USA respondents.)
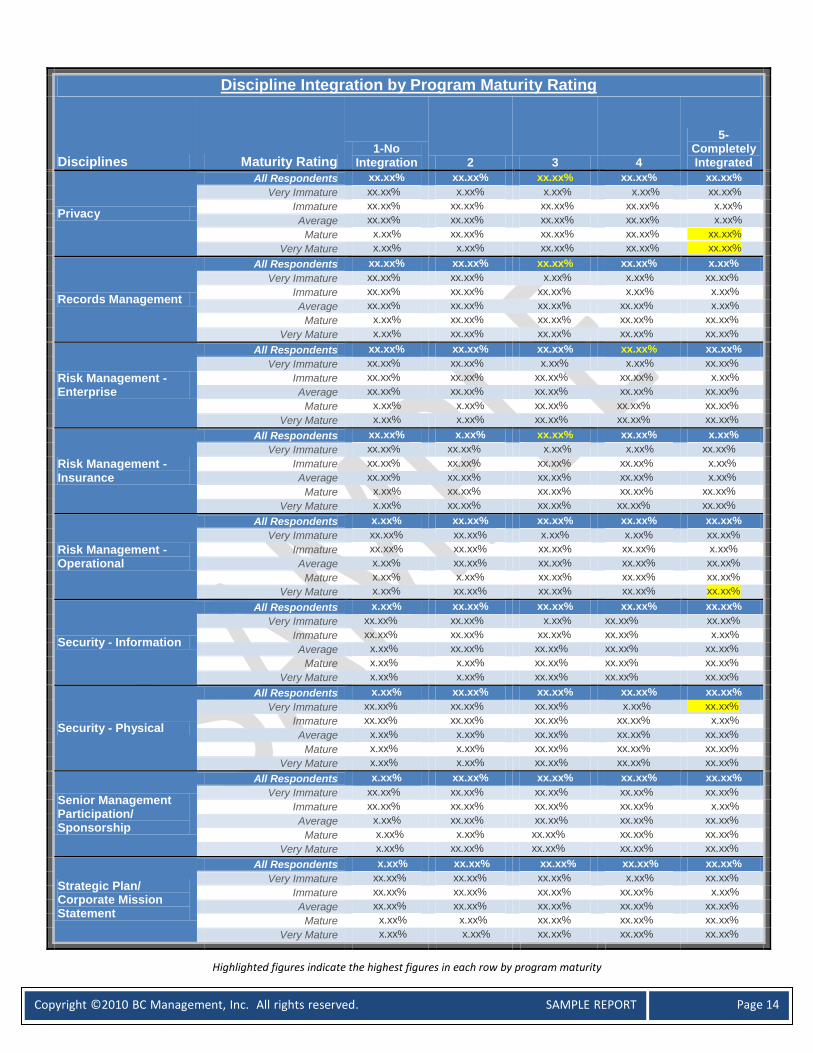
How well integrated are the following within your organizational program? Please rate on a
scale of 1 to 5 with 1 meaning NO INTEGRATION and 5 meaning COMPLETELY INTEGRATED. (An
assessment of USA respondents.) *All related enterprise discipl ines are l isted within the study to accommodate a variety of discipline experti se .

Copyright ©2010 BC Management, Inc. All rights reserved. SAMPLE REPORT
Page 13
Discipline Integration by Program Maturity Rating
Disciplines Maturity Rating 1-No
Integration 2 3 4
5-Completely Integrated
Disaster Recovery Focus) Process (IT
All Respondents x.xx% x.xx% xx.xx% xx.xx% xx.xx%
Very Immature x.xx% xx.xx% xx.xx% x.xx% xx.xx% Immature x.xx% x.xx% xx.xx% xx.xx% xx.xx% Average x.xx% x.xx% xx.xx% xx.xx% xx.xx%
Mature x.xx% x.xx% x.xx% xx.xx% xx.xx% Very Mature x.xx% x.xx% x.xx% xx.xx% xx.xx%
Emergency Management
All Respondents x.xx% x.xx% xx.xx% xx.xx% xx.xx%
Very Immature xx.xx% xx.xx% xx.xx% x.xx% xx.xx% Immature x.xx% xx.xx% xx.xx% xx.xx% xx.xx% Average x.xx% x.xx% xx.xx% xx.xx% xx.xx%
Mature x.xx% x.xx% xx.xx% xx.xx% xx.xx% Very Mature x.xx% xx.xx% x.xx% xx.xx% xx.xx%
Executive Protection
All Respondents xx.xx% xx.xx% xx.xx% xx.xx% xx.xx%
Very Immature xx.xx% xx.xx% x.xx% x.xx% xx.xx%
Immature xx.xx% xx.xx% xx.xx% x.xx% x.xx%
Average xx.xx% xx.xx% xx.xx% xx.xx% xx.xx% Mature xx.xx% xx.xx% xx.xx% xx.xx% xx.xx%
Very Mature xx.xx% xx.xx% xx.xx% xx.xx% xx.xx%
Facilities Management
All Respondents x.xx% xx.xx% x.xx% xx.xx% xx.xx% Very Immature xx.xx% xx.xx% xx.xx% x.xx% xx.xx%
Immature x.xx% xx.xx% xx.xx% xx.xx% x.xx%
Average x.xx% xx.xx% xx.xx% xx.xx% xx.xx% Mature x.xx% x.xx% xx.xx% xx.xx% xx.xx%
Very Mature x.xx% xx.xx% xx.xx% xx.xx% xx.xx%
Health & Safety - Environmental
All Respondents xx.xx% xx.xx% xx.xx% xx.xx% x.xx%
Very Immature xx.xx% xx.xx% xx.xx% x.xx% xx.xx%
Immature xx.xx% xx.xx% xx.xx% xx.xx% x.xx% Average xx.xx% xx.xx% xx.xx% xx.xx% x.xx%
Mature xx.xx% xx.xx% xx.xx% xx.xx% xx.xx% Very Mature x.xx% xx.xx% xx.xx% xx.xx% xx.xx%
Health & Safety - Occupational
All Respondents xx.xx% xx.xx% xx.xx% xx.xx% xx.xx%
Very Immature xx.xx% xx.xx% xx.xx% x.xx% x.xx%
Immature xx.xx% xx.xx% xx.xx% xx.xx% x.xx%
Average xx.xx% xx.xx% xx.xx% xx.xx% xx.xx% Mature x.xx% x.xx% xx.xx% xx.xx% xx.xx%
Very Mature x.xx% xx.xx% xx.xx% xx.xx% xx.xx%
Information Technology
All Respondents x.xx% x.xx% xx.xx% xx.xx% xx.xx%
Very Immature x.xx% xx.xx% xx.xx% xx.xx% xx.xx% Immature x.xx% xx.xx% xx.xx% xx.xx% xx.xx% Average x.xx% x.xx% xx.xx% xx.xx% xx.xx%
Mature x.xx% x.xx% xx.xx% xx.xx% xx.xx% Very Mature x.xx% x.xx% x.xx% xx.xx% xx.xx%
Media Crisis Management
All Respondents x.xx% xx.xx% xx.xx% xx.xx% xx.xx%
Very Immature xx.xx% 8.06% xx.xx% xx.xx% x.xx% Immature xx.xx% xx.xx% xx.xx% xx.xx% x.xx% Average xx.xx% xx.xx% xx.xx% xx.xx% xx.xx%
Mature x.xx% x.xx% xx.xx% xx.xx% xx.xx% Very Mature x.xx% xx.xx% xx.xx% xx.xx% xx.xx%
Pandemic Planning
All Respondents x.xx% x.xx% xx.xx% xx.xx% xx.xx%
Very Immature xx.xx% xx.xx% xx.xx% x.xx% xx.xx% Immature xx.xx% xx.xx% xx.xx% xx.xx% xx.xx% Average x.xx% x.xx% xx.xx% xx.xx% xx.xx%
Mature x.xx% x.xx% x.xx% xx.xx% xx.xx% Very Mature x.xx% xx.xx% xx.xx% xx.xx% xx.xx%
Copyright ©2010 BC Management, Inc. All rights reserved. SAMPLE REPORT
Page 14
Highlighted figures indicate the highest figures in each row by program maturity
Discipline Integration by Program Maturity Rating
Disciplines Maturity Rating 1-No
Integration 2 3 4
5-Completely Integrated
Privacy
All Respondents xx.xx% xx.xx% xx.xx% xx.xx% xx.xx%
Very Immature xx.xx% x.xx% x.xx% x.xx% xx.xx% Immature xx.xx% xx.xx% xx.xx% xx.xx% x.xx% Average xx.xx% xx.xx% xx.xx% xx.xx% x.xx%
Mature x.xx% xx.xx% xx.xx% xx.xx% xx.xx% Very Mature x.xx% x.xx% xx.xx% xx.xx% xx.xx%
Records Management
All Respondents xx.xx% xx.xx% xx.xx% xx.xx% x.xx%
Very Immature xx.xx% xx.xx% x.xx% x.xx% xx.xx% Immature xx.xx% xx.xx% xx.xx% x.xx% x.xx% Average xx.xx% xx.xx% xx.xx% xx.xx% x.xx%
Mature x.xx% xx.xx% xx.xx% xx.xx% xx.xx% Very Mature x.xx% xx.xx% xx.xx% xx.xx% xx.xx%
Risk Management - Enterprise
All Respondents xx.xx% xx.xx% xx.xx% xx.xx% xx.xx%
Very Immature xx.xx% xx.xx% x.xx% x.xx% xx.xx% Immature xx.xx% xx.xx% xx.xx% xx.xx% x.xx% Average xx.xx% xx.xx% xx.xx% xx.xx% xx.xx%
Mature x.xx% x.xx% xx.xx% xx.xx% xx.xx% Very Mature x.xx% x.xx% xx.xx% xx.xx% xx.xx%
Risk Management - Insurance
All Respondents xx.xx% x.xx% xx.xx% xx.xx% x.xx%
Very Immature xx.xx% xx.xx% x.xx% x.xx% xx.xx% Immature xx.xx% xx.xx% xx.xx% xx.xx% x.xx% Average xx.xx% xx.xx% xx.xx% xx.xx% x.xx%
Mature x.xx% xx.xx% xx.xx% xx.xx% xx.xx% Very Mature x.xx% xx.xx% xx.xx% xx.xx% xx.xx%
Risk Management - Operational
All Respondents x.xx% xx.xx% xx.xx% xx.xx% xx.xx% Very Immature xx.xx% xx.xx% x.xx% x.xx% xx.xx%
Immature xx.xx% xx.xx% xx.xx% xx.xx% x.xx% Average x.xx% xx.xx% xx.xx% xx.xx% xx.xx%
Mature x.xx% x.xx% xx.xx% xx.xx% xx.xx% Very Mature x.xx% xx.xx% xx.xx% xx.xx% xx.xx%
Security - Information
All Respondents x.xx% xx.xx% xx.xx% xx.xx% xx.xx%
Very Immature xx.xx% xx.xx% x.xx% xx.xx% xx.xx%
Immature xx.xx% xx.xx% xx.xx% xx.xx% x.xx% Average x.xx% xx.xx% xx.xx% xx.xx% xx.xx%
Mature x.xx% x.xx% xx.xx% xx.xx% xx.xx% Very Mature x.xx% x.xx% xx.xx% xx.xx% xx.xx%
Security - Physical
All Respondents x.xx% xx.xx% xx.xx% xx.xx% xx.xx%
Very Immature xx.xx% xx.xx% xx.xx% x.xx% xx.xx% Immature xx.xx% xx.xx% xx.xx% xx.xx% x.xx% Average x.xx% x.xx% xx.xx% xx.xx% xx.xx%
Mature x.xx% x.xx% xx.xx% xx.xx% xx.xx% Very Mature x.xx% x.xx% xx.xx% xx.xx% xx.xx%
Senior Management Participation/ Sponsorship
All Respondents x.xx% xx.xx% xx.xx% xx.xx% xx.xx%
Very Immature xx.xx% xx.xx% xx.xx% xx.xx% xx.xx% Immature xx.xx% xx.xx% xx.xx% xx.xx% x.xx% Average x.xx% xx.xx% xx.xx% xx.xx% xx.xx%
Mature x.xx% x.xx% xx.xx% xx.xx% xx.xx% Very Mature x.xx% xx.xx% xx.xx% xx.xx% xx.xx%
Strategic Plan/ Corporate Mission Statement
All Respondents x.xx% xx.xx% xx.xx% xx.xx% xx.xx%
Very Immature xx.xx% xx.xx% xx.xx% x.xx% xx.xx% Immature xx.xx% xx.xx% xx.xx% xx.xx% x.xx% Average xx.xx% xx.xx% xx.xx% xx.xx% xx.xx%
Mature x.xx% x.xx% xx.xx% xx.xx% xx.xx% Very Mature x.xx% x.xx% xx.xx% xx.xx% xx.xx%
Copyright ©2010 BC Management, Inc. All rights reserved. SAMPLE REPORT
Page 15
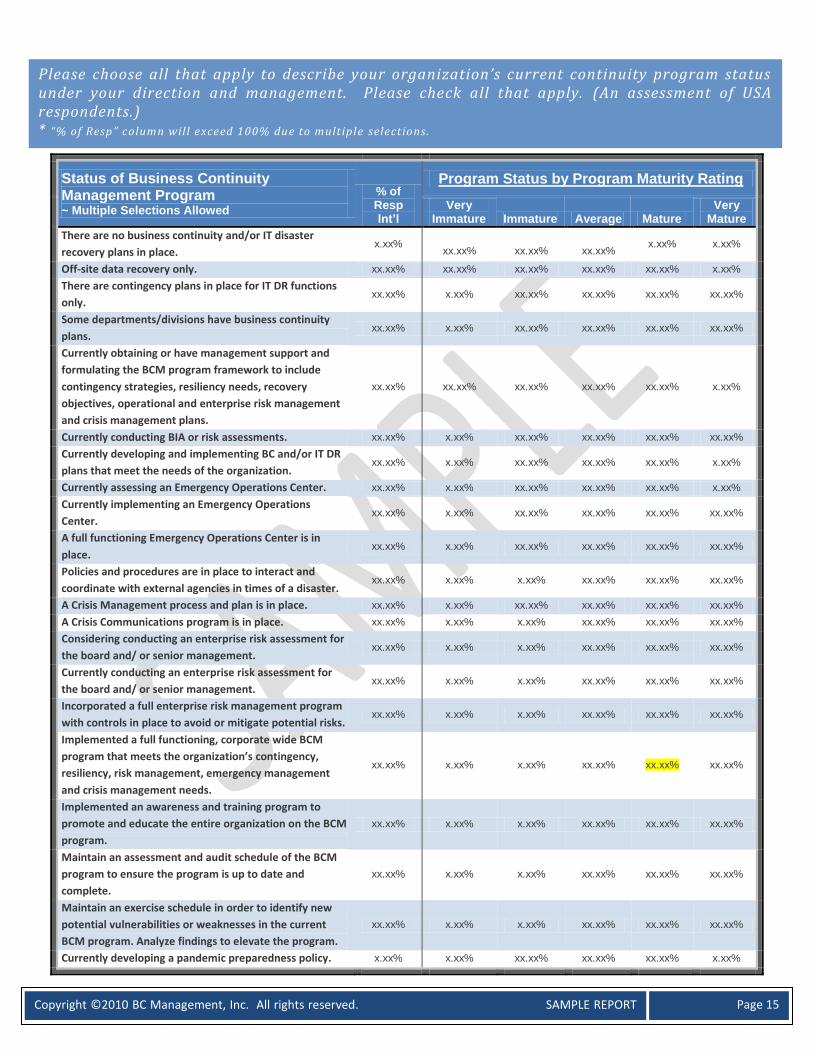
Status of Business Continuity Management Program ~ Multiple Selections Allowed
% of Resp Int’l
Program Status by Program Maturity Rating
Very Immature Immature Average Mature
Very Mature
There are no business continuity and/or IT disaster
recovery plans in place. x.xx%
xx.xx%
xx.xx%
xx.xx% x.xx% x.xx%
Off-site data recovery only. xx.xx% xx.xx% xx.xx% xx.xx% xx.xx% x.xx% There are contingency plans in place for IT DR functions
only. xx.xx% x.xx% xx.xx% xx.xx% xx.xx% xx.xx%
Some departments/divisions have business continuity
plans. xx.xx% x.xx% xx.xx% xx.xx% xx.xx% xx.xx%
Currently obtaining or have management support and
formulating the BCM program framework to include
contingency strategies, resiliency needs, recovery
objectives, operational and enterprise risk management
and crisis management plans.
xx.xx% xx.xx% xx.xx% xx.xx% xx.xx% x.xx%
Currently conducting BIA or risk assessments. xx.xx% x.xx% xx.xx% xx.xx% xx.xx% xx.xx% Currently developing and implementing BC and/or IT DR
plans that meet the needs of the organization. xx.xx% x.xx% xx.xx% xx.xx% xx.xx% x.xx%
Currently assessing an Emergency Operations Center. xx.xx% x.xx% xx.xx% xx.xx% xx.xx% x.xx% Currently implementing an Emergency Operations
Center. xx.xx% x.xx% xx.xx% xx.xx% xx.xx% xx.xx%
A full functioning Emergency Operations Center is in
place. xx.xx% x.xx% xx.xx% xx.xx% xx.xx% xx.xx%
Policies and procedures are in place to interact and
coordinate with external agencies in times of a disaster. xx.xx% x.xx% x.xx% xx.xx% xx.xx% xx.xx%
A Crisis Management process and plan is in place. xx.xx% x.xx% xx.xx% xx.xx% xx.xx% xx.xx% A Crisis Communications program is in place. xx.xx% x.xx% x.xx% xx.xx% xx.xx% xx.xx% Considering conducting an enterprise risk assessment for
the board and/ or senior management. xx.xx% x.xx% x.xx% xx.xx% xx.xx% xx.xx%
Currently conducting an enterprise risk assessment for
the board and/ or senior management. xx.xx% x.xx% x.xx% xx.xx% xx.xx% xx.xx%
Incorporated a full enterprise risk management program
with controls in place to avoid or mitigate potential risks. xx.xx% x.xx% x.xx% xx.xx% xx.xx% xx.xx%
Implemented a full functioning, corporate wide BCM
program that meets the organization’s contingency,
resiliency, risk management, emergency management
and crisis management needs.
xx.xx% x.xx% x.xx% xx.xx% xx.xx% xx.xx%
Implemented an awareness and training program to
promote and educate the entire organization on the BCM
program.
xx.xx% x.xx% x.xx% xx.xx% xx.xx% xx.xx%
Maintain an assessment and audit schedule of the BCM
program to ensure the program is up to date and
complete.
xx.xx% x.xx% x.xx% xx.xx% xx.xx% xx.xx%
Maintain an exercise schedule in order to identify new
potential vulnerabilities or weaknesses in the current
BCM program. Analyze findings to elevate the program.
xx.xx% x.xx% x.xx% xx.xx% xx.xx% xx.xx%
Currently developing a pandemic preparedness policy. x.xx% x.xx% xx.xx% xx.xx% xx.xx% x.xx%
Please choose all that apply to describe your organization’s current continuity program status under your direction and management. Please check all that apply. (An assessment of USA respondents.) * “% of Resp” column will exceed 100% due to multiple selections.

Copyright ©2010 BC Management, Inc. All rights reserved. SAMPLE REPORT
Page 16
Currently implementing a pandemic preparedness policy. xx.xx% xx.xx% xx.xx% xx.xx% xx.xx% xx.xx%
A full functioning pandemic preparedness policy is in
place. xx.xx% x.xx% x.xx% xx.xx% xx.xx% xx.xx%
Currently developing an executive/leadership transition
plan. xx.xx% x.xx% x.xx% xx.xx% xx.xx% xx.xx%
Currently implementing an executive/leadership
transition plan. x.xx% x.xx% x.xx% xx.xx% xx.xx% x.xx%
A full functioning executive/leadership transition is in
place. xx.xx% x.xx% x.xx% xx.xx% xx.xx% xx.xx%
Highlighted figures indicate the highest figures in each column by program maturity.
Indicates areas of improvement. Highlighted percent figures represent the highest percent for each selection of program status.
Program Maturity Rating Avg Budget
Avg Total FTE
Avg Total PTE
Avg Number of Disciplines in
Program Very Immature $xxx,xxx USD xx xx xx Immature $x,xxx,xxx USD xx xx xx Average $x,xxx,xxx USD xx xx xx Mature $x,xxx,xxx USD xx xx xx Very Mature $x,xxx,xxx USD xx xx xx
33.33%
33.33%
33.33%
Budgeting of Program Expenses
Program expenses are allocated independently f rom other functions
within the organization.
Program expenses are allocated to other department(s).
Program expenses do NOT have a def ined budget.
An assessment of the average business continuity management budget (approximate/ estimated
expenses spent), average number of dedicated full -time and part-time personnel, average
number of disciplines managed in a program and the average p rogram maturity rating by
country. (An assessment of USA respondents.)
Describe how continuity program expenses are budgeted under your direction and management?
(An assessment of USA respondents.)
Budgeting

Copyright ©2010 BC Management, Inc. All rights reserved. SAMPLE REPORT
Page 17
$0
$200,000
$400,000
$600,000
$800,000
$1,000,000
$1,200,000
Program expenses are allocated independently from
other functions within the organization.
Program expenses are allocated to other department(s).
Program expenses do NOT have a defined budget.
$1,111,111 $1,111,111 $1,111,111
Budgeting of Program Expenses
Budget Line Item % of Resp Include
Budget Item in
Total Budget
% of Total
Budget
Average
Budget Amount
Full Time Internal Staff xx.xx% xx.xx% $xxx,xxx.xx
Consultants/ Contractors (Business
focus) x.xx% xx.xx% $xxx,xxx.xx
Consultants/ Contractors (IT focus) x.xx% x.xx% $xxx,xxx.xx
Emergency Operations Center (EOC) x.xx% x.xx% $xxx,xxx.xx
Emergency Supplies x.xx% x.xx% $xxx,xxx.xx
Hardware x.xx% xx.xx% $x,xxx,xxx.xx
Hot-site/ Outsourced Alternate Site x.xx% xx.xx% $xxx,xxx.xx
Internal Recovery Site x.xx% xx.xx% $x,xxx,xxx.xx
Software x.xx% xx.xx% $xxx,xxx.xx
Notification/ Alerts x.xx% x.xx% $xx,xxx.xx
Mobile Recovery x.xx% xx.xx% $xxx,xxx.xx
DR Technology x.xx% xx.xx% $x,xxx,xxx.xx
Exercises xx.xx% x.xx% $xxx,xxx.xx
Training /Awareness xx.xx% x.xx% $xxx,xxx.xx
Travel xx.xx% x.xx% $xxx,xxx.xx
Other x.xx% xx.xx% $xxx,xxx.xx
Average Total N/A xxx.xx% $x,xxx,xxx USD*
Table shows a correlation between three different questions. First Question – Please specify
what is accounted for in your annual budget. Please check box if the line item is currently
included in your program budget. Second Question – Please indicate the percent of the overall
program budget for each line item. Third Question – What is your company’s approximate
annual budget for contingency related program expenses? (An assessment of USA respondents.)
* “% of Resp Included Budget Item” column will not 100% due to open/ multiple selections .
* The amount listed in the “Average Budget Amount” column was automatically calculated per study respondent based on the total budget and the
% of total budget for each line item. The average was then calculated for all study respondents.

Copyright ©2010 BC Management, Inc. All rights reserved. SAMPLE REPORT
Page 18
* All questionable or incomplete budget information was verified by directly contacting the study respondent. Questionable data responses that couldn’t be
confirmed were removed.
“Other” budget line items as noted by study participants: Budget covers Information Security, Emergency Supplies, Generator and UPS Maintenance, Other vendor costs to support BC programme, Emergency
Supplies, Supplies, Recruitment, vaulting, Response equipment, EOC Equipment repair and replacement, preparedness, general office expenses, Disaster Response Unit, PT Internal Staff, hardware, Conferences, part time staff, training for direct staff, BIA, Automation. Note: Full time internal staff budget not included, Telecommunication + equipment, Alternate Communications, no central budget, is down to each country operating officer to sign off on, Continuous Education, conferences, certifications, Supplies, documentation, Miscellaneous, Off site, training, storage and archiving, Insurance, Emergency supplies, 1-5% of the work time of 18 divisional representatives, contractor to be hired, unknown budget, Development of a DR solution, Supplies and Equipment and maintenance, hardware, public relations\ advertising and Disaster Response Equipment and Supplies.
Budget Item Increased Decreased Unchanged Not Sure Full Time Internal Staff xx.xx% x.xx% xx.xx% x.xx%
Consultants/ Contractors (Business focus) xx.xx% xx.xx% xx.xx% xx.xx%
Consultants/ Contractors (IT focus) xx.xx% x.xx% xx.xx% xx.xx%
Emergency Operations Center (EOC) x.xx% x.xx% xx.xx% x.xx%
Emergency Supplies x.xx% x.xx% xx.xx% x.xx%
Hardware xx.xx% xx.xx% xx.xx% x.xx%
Hot-site/ Outsourced Alternate Site xx.xx% xx.xx% xx.xx% x.xx%
Internal Recovery Site xx.xx% x.xx% xx.xx% x.xx%
Software xx.xx% x.xx% xx.xx% x.xx%
Notification/ Alerts xx.xx% x.xx% xx.xx% x.xx%
Mobile Recovery xx.xx% x.xx% xx.xx% x.xx%
DR Technology xx.xx% x.xx% xx.xx% x.xx%
Exercises xx.xx% x.xx% xx.xx% x.xx%
Training /Awareness xx.xx% x.xx% xx.xx% x.xx%
Travel xx.xx% xx.xx% xx.xx% x.xx%
Other x.xx% xx.xx% xx.xx% xx.xx%
Average % xx.xx% x.xx% xx.xx% x.xx%
Budget Item Increased Decreased Full Time Internal Staff xx.xx% xx.xx%
Consultants/ Contractors (Business focus) xx.xx% xx.xx%
Consultants/ Contractors (IT focus) xx.xx% x.xx%
Emergency Operations Center (EOC) x.xx%
Emergency Supplies x.xx% xx.xx%
Hardware xx.xx% xx.xx%
Hot-site/ Outsourced Alternate Site xx.xx% x.xx%
Internal Recovery Site xx.xx% x.xx%
Software xx.xx% xx.xx%
Notification/ Alerts xx.xx% xx.xx%
Mobile Recovery xx.xx% x.xx%
DR Technology xx.xx%
Exercises xx.xx% x.xx%
Training /Awareness xx.xx% x.xx%
Travel xx.xx% xx.xx%
Other xx.xx% xx.xx%
Please specify budget revisions for the next year for each budget line item – Increase, Decrease,
Remain the Same, or Not Sure. (An assessment of USA respondents.)
For each line item, if the budget increased or decreased then what percent do you anticipate the
budget for that line item to increase or decrease? (An assessment of USA respondents.)

Copyright ©2010 BC Management, Inc. All rights reserved. SAMPLE REPORT
Page 19
Disciplines – Current Personnel Avg FTE Avg PTE % of Resp Multi-Discipline xx xx xx.xx%
Audit xx xx x.xx%
Business Continuity Process (Business Focus) xx xx xx.xx%
Compliance xx xx x.xx%
Crisis Management xx xx xx.xx%
Disaster Recovery Process (IT Focus) xx xx xx.xx%
Emergency Management xx xx xx.xx%
Facilities Management xx xx x.xx%
Health & Safety – Occupational xx xx x.xx%
Health & Safety - Environmental xx xx x.xx%
Information Technology xx xx x.xx%
Pandemic Planning xx xx xx.xx%
Records Management xx xx x.xx%
Risk Management – Enterprise xx xx x.xx%
Risk Management – Insurance xx xx x.xx%
Risk Management – Operational xx xx xx.xx%
Security – Information xx xx x.xx%
Security – Physical xx xx x.xx%
Other xx xx x.xx%
Average Total XX XX
Average number of discipline FTE and PTE staff is the average only for those study respondents that indicated managing that specific discipline in their
program and having staff dedicated to that discipline.
Personnel
Table shows a correlation between two different questions. First Question – Please specify all
the disciplines that you personally manage. Select all that apply. Second Question - If you
personally manage more than one discipline within your program, please indicate how many
full-time employees (FTE) and/ or part-time employees (PTE) you have dedicated to your
continuity program? Please confirm that the number below is the total FTE and PTE headcount
for all locations under your direction and management. (Auto -sum function built into study.)
(An assessment of USA respondents.)
Copyright ©2010 BC Management, Inc. All rights reserved. SAMPLE REPORT
Page 20
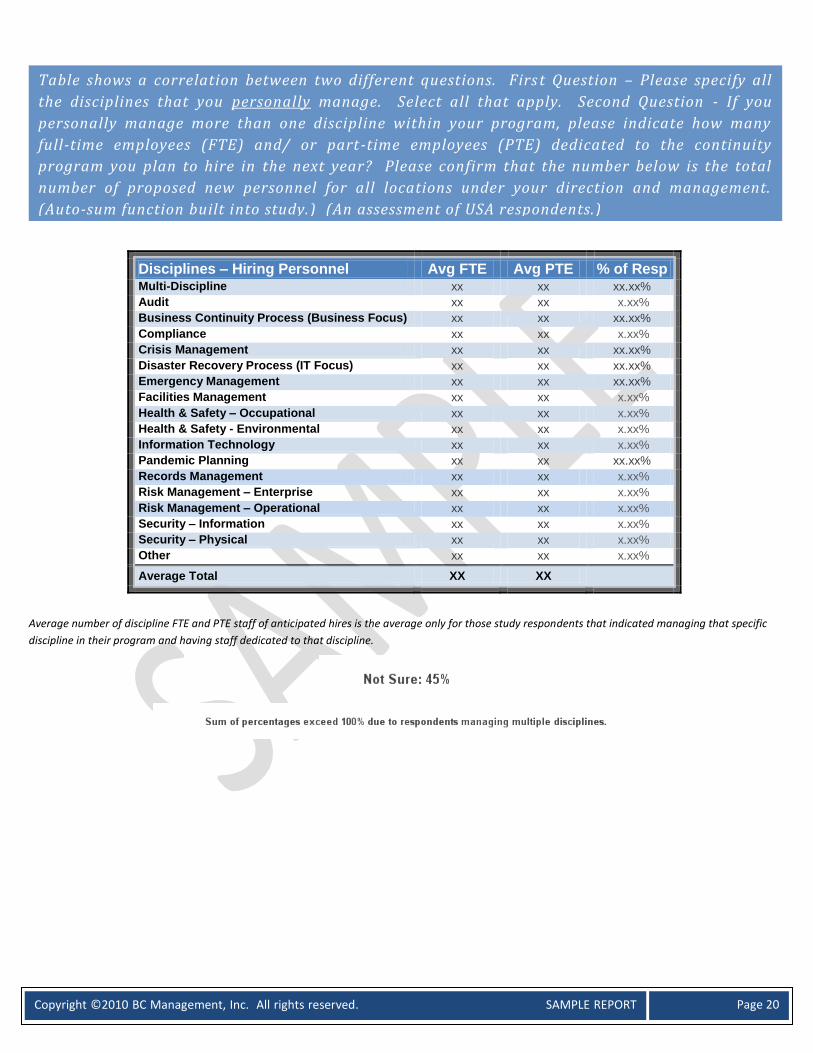
Disciplines – Hiring Personnel Avg FTE Avg PTE % of Resp Multi-Discipline xx xx xx.xx%
Audit xx xx x.xx%
Business Continuity Process (Business Focus) xx xx xx.xx%
Compliance xx xx x.xx%
Crisis Management xx xx xx.xx%
Disaster Recovery Process (IT Focus) xx xx xx.xx%
Emergency Management xx xx xx.xx%
Facilities Management xx xx x.xx%
Health & Safety – Occupational xx xx x.xx%
Health & Safety - Environmental xx xx x.xx%
Information Technology xx xx x.xx%
Pandemic Planning xx xx xx.xx%
Records Management xx xx x.xx%
Risk Management – Enterprise xx xx x.xx%
Risk Management – Operational xx xx x.xx%
Security – Information xx xx x.xx%
Security – Physical xx xx x.xx%
Other xx xx x.xx%
Average Total XX XX
Average number of discipline FTE and PTE staff of anticipated hires is the average only for those study respondents that indicated managing that specific
discipline in their program and having staff dedicated to that discipline.
Table shows a correlation between two different questions. Firs t Question – Please specify all
the disciplines that you personally manage. Select all that apply. Second Question - If you
personally manage more than one discipline within your program, please indicate how many
full-time employees (FTE) and/ or part-time employees (PTE) dedicated to the continuity
program you plan to hire in the next year? Please confirm that the number below is the total
number of proposed new personnel for all locations under your direction and management.
(Auto-sum function built into study.) (An assessment of USA respondents.)

Copyright ©2010 BC Management, Inc. All rights reserved. SAMPLE REPORT
Page 21
Will you be reducing your full-time dedicated continuity program staff in the next year under
your direction and management? (An assessment of USA respondents.)
If yes, what are the reasons for reducing your dedicated continuity program staff in the next
year? Please select all that apply. (An assessment of USA respondents.) * Total percent may exceed 100% due to multiple selections.
Copyright ©2010 BC Management, Inc. All rights reserved. SAMPLE REPORT
Page 22
Department Owner % of Resp
Program Best Situated for Maximum Visibility
Considering a Different
Department Owner?
Strongly disagree Disagree Neutral Agree
Strongly agree Yes No
Assurance/ Compliance x.xx% x.xx% x.xx% x.xx% xx.xx% xx.xx% x.xx% xxx.xx%
Audit - Internal x.xx% xx.xx% x.xx% x.xx% xx.xx% xx.xx% xx.xx% xx.xx%
Business Continuity Office xx.xx% xx.xx% x.xx% xx.xx% xx.xx% xx.xx% x.xx% xx.xx%
Corporate Offices x.xx% x.xx% xx.xx% xx.xx% xx.xx% xx.xx% x.xx% xxx.xx%
Emergency/ Crisis Management x.xx% x.xx% x.xx% xx.xx% xx.xx% xx.xx% x.xx% xxx.xx%
Facilities Management x.xx% xx.xx% xx.xx% x.xx% xx.xx% x.xx% x.xx% xxx.xx%
Finance x.xx% xx.xx% xx.xx% xx.xx% xx.xx% x.xx% xx.xx% xx.xx%
Human Resources x.xx% x.xx% xx.xx% x.xx% xx.xx% x.xx% x.xx% xxx.xx%
Information Technology xx.xx% xx.xx% xx.xx% xx.xx% xx.xx% x.xx% xx.xx% xx.xx%
Legal Counsel x.xx% x.xx% x.xx% xx.xx% xx.xx% xx.xx% x.xx% xxx.xx%
Operations x.xx% x.xx% xx.xx% x.xx% xx.xx% xx.xx% x.xx% xx.xx%
Program Management Office x.xx% x.xx% xx.xx% xx.xx% xx.xx% xx.xx% x.xx% xxx.xx%
Risk Management xx.xx% x.xx% x.xx% xx.xx% xx.xx% xx.xx% x.xx% xx.xx%
Security – Information x.xx% xx.xx% xx.xx% xx.xx% xx.xx% xx.xx% x.xx% xxx.xx%
Security – Physical x.xx% x.xx% xx.xx% xx.xx% xx.xx% xx.xx% x.xx% xx.xx%
Strategic Planning x.xx% x.xx% x.xx% xxx.xx% x.xx% x.xx% x.xx% xxx.xx%
Individual business units x.xx% xx.xx% xx.xx% x.xx% xx.xx% x.xx% x.xx% xxx.xx%
Other x.xx% xx.xx% xx.xx% x.xx% xx.xx% xx.xx% xx.xx% xx.xx%
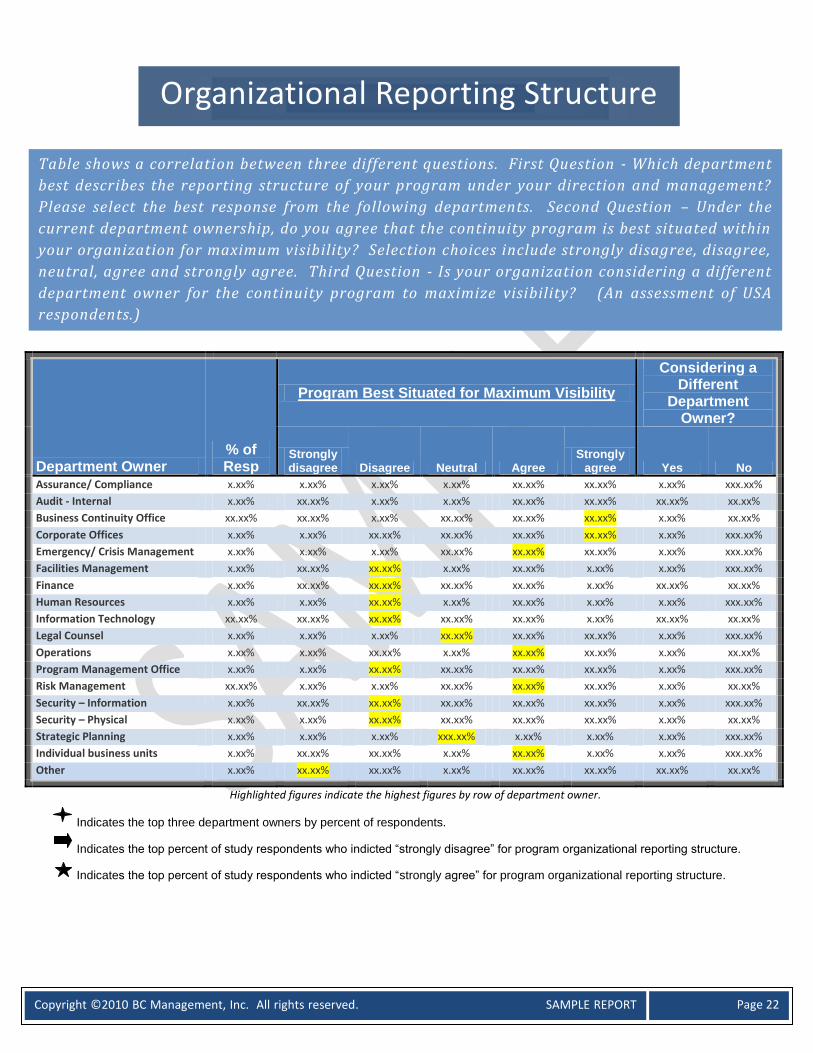
Highlighted figures indicate the highest figures by row of department owner.
Indicates the top three department owners by percent of respondents.
Indicates the top percent of study respondents who indicted “strongly disagree” for program organizational reporting structure.
Indicates the top percent of study respondents who indicted “strongly agree” for program organizational reporting structure.
Organizational Reporting Structure
Table shows a correlation between three different questions. First Question - Which department
best describes the reporting structure of your program under your direction and management?
Please select the best response from the following departments. Second Question – Under the
current department ownership, do you agree that the continuity program is best situated within
your organization for maximum visibility? Selection choices include strongly disagree, disagree,
neutral, agree and strongly agree. Third Question - Is your organization considering a different
department owner for the continuity program to maximize visibility? (An assessment of USA
respondents.)
Copyright ©2010 BC Management, Inc. All rights reserved. SAMPLE REPORT
Page 23
Department Owner Very
Immature Immature Average Mature Very
Mature
isurance/ Compliance x.xx% x.xx% x.xx% x.xx% x.xx%
Audit - Internal x.xx% x.xx% x.xx% x.xx% x.xx%
Business Continuity Office x.xx% xx.xx% xx.xx% xx.xx% xx.xx%
Corporate Offices x.xx% x.xx% x.xx% x.xx% x.xx%
Emergency/ Crisis
Management x.xx% x.xx% x.xx% x.xx% x.xx%
Facilities Management x.xx% x.xx% x.xx% x.xx% x.xx%
Finance xx.xx% x.xx% x.xx% x.xx% x.xx%
Human Resources x.xx% x.xx% x.xx% x.xx% x.xx%
Information Technology xx.xx% xx.xx% xx.xx% xx.xx% xx.xx%
Legal Counsel x.xx% x.xx% x.xx% x.xx% x.xx%
Operations x.xx% x.xx% x.xx% x.xx% x.xx%
Program Management
Office x.xx% x.xx% x.xx% x.xx% x.xx%
Risk Management x.xx% xx.xx% xx.xx% xx.xx% xx.xx%
Security – Information x.xx% x.xx% x.xx% x.xx% x.xx%
Security – Physical x.xx% x.xx% x.xx% x.xx% x.xx%
Strategic Planning x.xx% x.xx% x.xx% x.xx% x.xx%
Individual business units x.xx% x.xx% x.xx% x.xx% x.xx%
Other x.xx% x.xx% x.xx% x.xx% x.xx%
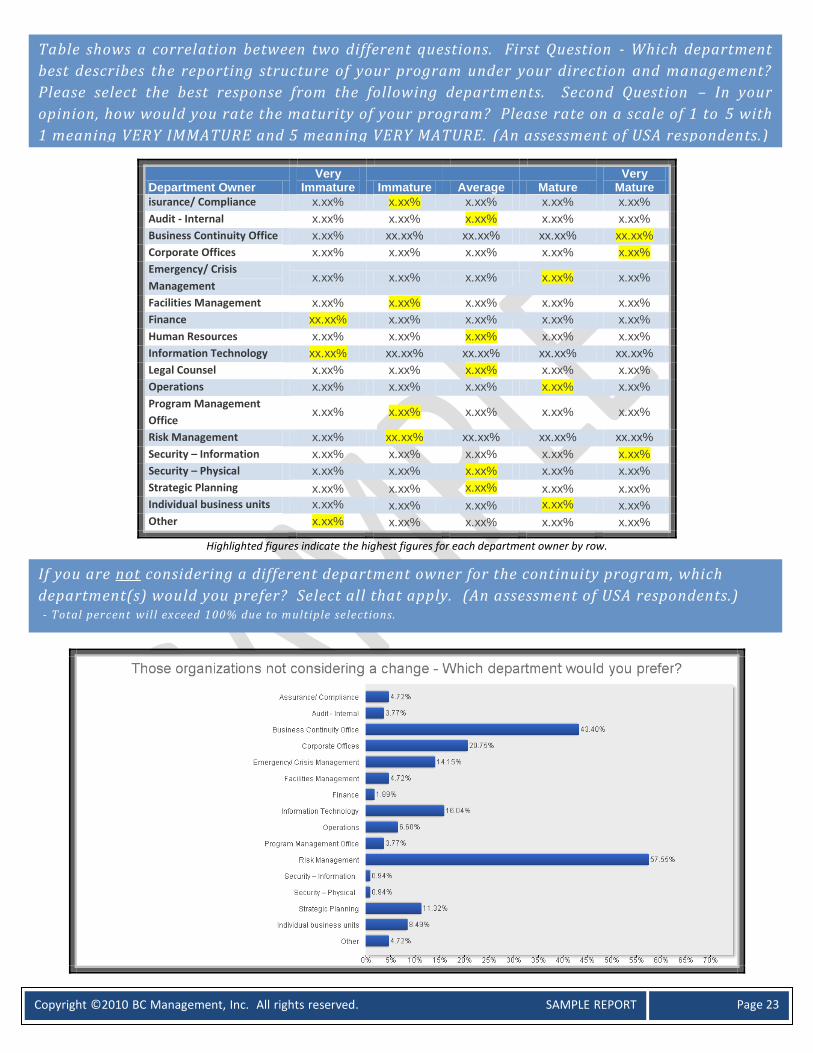
Highlighted figures indicate the highest figures for each department owner by row.
If you are not considering a different department owner for the continuity program, which
department(s) would you prefer? Select all that apply. (An assessment of USA respondents.) - Total percent will exceed 100% due to multiple selections.
Table shows a correlation between two different questions. First Question - Which department
best describes the reporting structure of your program under your direction and management?
Please select the best response from the following departments. Second Question – In your
opinion, how would you rate the maturity of your program? Please rate on a scale of 1 to 5 with
1 meaning VERY IMMATURE and 5 meaning VERY MATURE. (An assessment of USA respondents.)

Copyright ©2010 BC Management, Inc. All rights reserved. SAMPLE REPORT
Page 24
If you are considering a different department owner for the continuity program, which
department(s) is being considered? Select all that apply . (An assessment of USA respondents.) - Total percent will exceed 100% due to multiple selections.
Program Sponsorship
Please specify by job title who is totally engaged and sponsoring the continuity program
functions. Please select the best response. (An assessment of USA respondents.)
Copyright ©2010 BC Management, Inc. All rights reserved. SAMPLE REPORT
Page 25
Program Sponsor Very
Immature Immature Average Mature Very
Mature Board/ General Council/ Executive Committee
x.xx% x.xx% x.xx% x.xx% x.xx%
President x.xx% x.xx% x.xx% x.xx% x.xx%
CEO – Chief Executive Officer
xx.xx% x.xx% x.xx% xx.xx% xx.xx%
CIO/ CTO – Chief Information Officer/ Chief Technology Officer
xx.xx% xx.xx% xx.xx% xx.xx% xx.xx%
CSO/ CISO – Chief Security Officer/ Chief Information Security Officer
xx.xx% x.xx% x.xx% x.xx% x.xx%
CFO – Chief Financial Officer
x.xx% xx.xx% x.xx% xx.xx% x.xx%
COO – Chief Operating Officer
x.xx% x.xx% x.xx% xx.xx% x.xx%
CAO – Chief Administrative Officer
x.xx% x.xx% x.xx% x.xx% x.xx%
CRO – Chief Risk Officer
x.xx% x.xx% x.xx% x.xx% x.xx%
CCO – Chief Compliance Officer
x.xx% x.xx% x.xx% x.xx% x.xx%
CCO – Chief Continuity Officer
x.xx% x.xx% x.xx% x.xx% x.xx%
Other Chief Title x.xx% x.xx% x.xx% x.xx% x.xx%
Executive VP, Executive Director, General Manager
x.xx% xx.xx% x.xx% x.xx% xx.xx%
Senior VP, Senior Director, Senior Manager
x.xx% xx.xx% xx.xx% x.xx% x.xx%
VP/ Director x.xx% x.xx% xx.xx% x.xx% x.xx%
Assistant VP, Assistant Director, Manager
x.xx% x.xx% x.xx% x.xx% x.xx%
Specialist, Coordinator, Planner
x.xx% x.xx% x.xx% x.xx% x.xx%
Other x.xx% x.xx% x.xx% x.xx% x.xx%
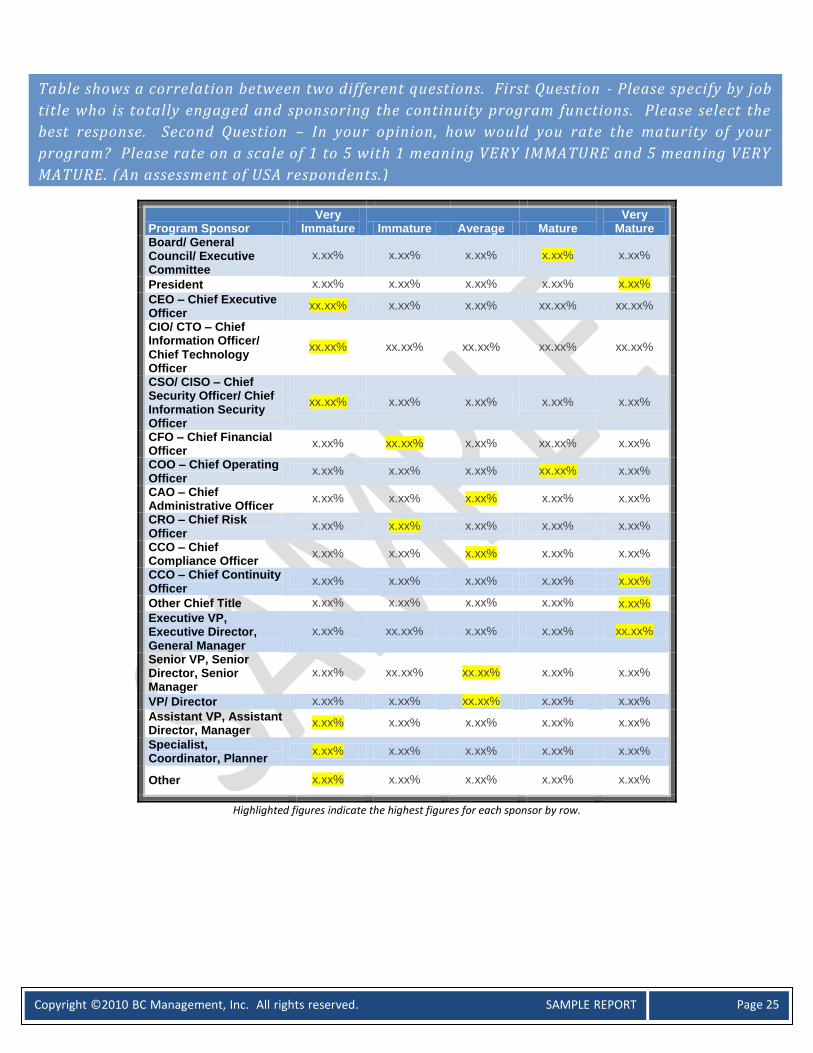
Highlighted figures indicate the highest figures for each sponsor by row.
Table shows a correlation between two different questions. First Question - Please specify by job
title who is totally engaged and sponsoring the continuity program functions. Please select the
best response. Second Question – In your opinion, how would you rate the maturity of your
program? Please rate on a scale of 1 to 5 with 1 meaning VERY IMMATURE and 5 meaning VERY
MATURE. (An assessment of USA respondents.)
Copyright ©2010 BC Management, Inc. All rights reserved. SAMPLE REPORT
Page 26
Sponsoring Job Title
How is Engaged is this Individual?
1 – Very Little Involvement 2 3 4
5 – Very Involved
Board/ General Council/ Executive Committee x.xx% x.xx% xx.xx% x.xx% xx.xx%
President x.xx% x.xx% xx.xx% xx.xx% x.xx%
CEO – Chief Executive Officer x.xx% x.xx% xx.xx% xx.xx% xx.xx%
CIO/ CTO – Chief Information Officer/ Chief Technology Officer x.xx% x.xx% xx.xx% xx.xx% xx.xx%
CSO/ CISO – Chief Security Officer/ Chief Information Security Officer x.xx% x.xx% xx.xx% xx.xx% xx.xx%
CFO – Chief Financial Officer x.xx% xx.xx% xx.xx% xx.xx% xx.xx%
COO – Chief Operating Officer x.xx% xx.xx% xx.xx% xx.xx% xx.xx%
CAO – Chief Administrative Officer x.xx% x.xx% xx.xx% xx.xx% xx.xx%
CRO – Chief Risk Officer x.xx% x.xx% xx.xx% xx.xx% x.xx%
CCO – Chief Compliance Officer xx.xx% x.xx% x.xx% x.xx% xx.xx%
CCO – Chief Continuity Officer x.xx% x.xx% xxx.xx% x.xx% x.xx%
Other Chief Title xx.xx% x.xx% x.xx% xx.xx% x.xx%
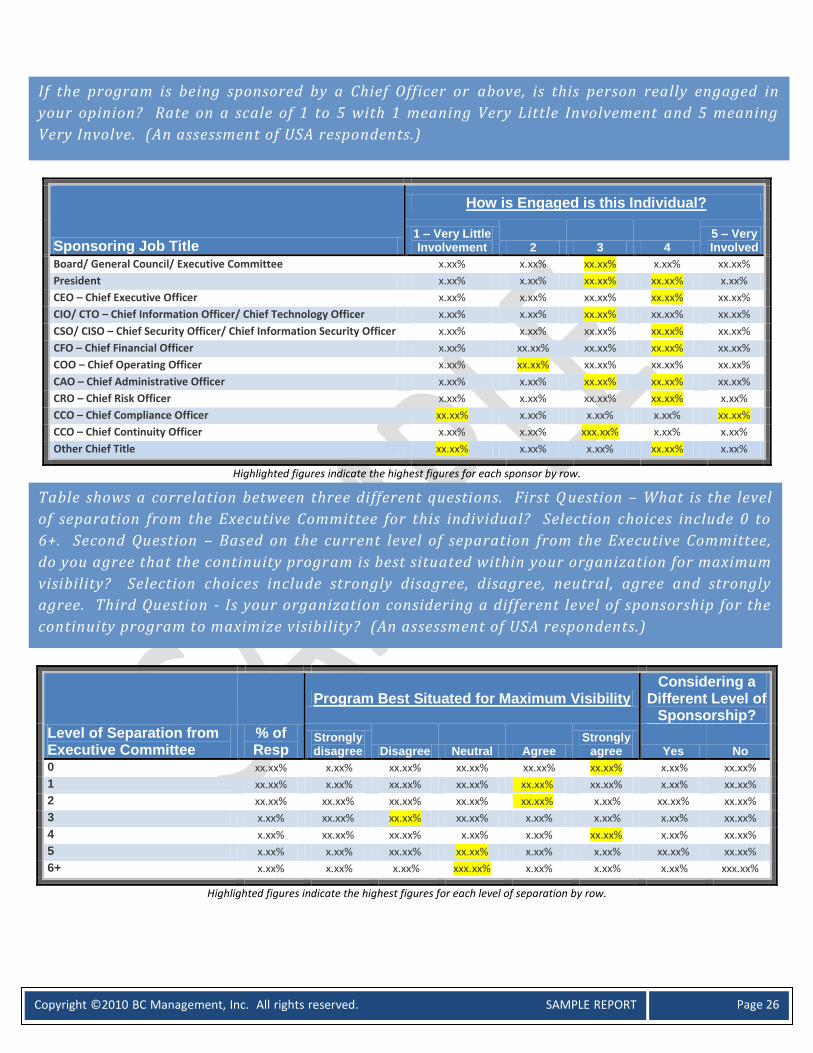
Highlighted figures indicate the highest figures for each sponsor by row.
Level of Separation from Executive Committee
% of Resp
Program Best Situated for Maximum Visibility
Considering a Different Level of
Sponsorship?
Strongly disagree Disagree Neutral Agree
Strongly agree Yes No
0 xx.xx% x.xx% xx.xx% xx.xx% xx.xx% xx.xx% x.xx% xx.xx%
1 xx.xx% x.xx% xx.xx% xx.xx% xx.xx% xx.xx% x.xx% xx.xx%
2 xx.xx% xx.xx% xx.xx% xx.xx% xx.xx% x.xx% xx.xx% xx.xx%
3 x.xx% xx.xx% xx.xx% xx.xx% x.xx% x.xx% x.xx% xx.xx%
4 x.xx% xx.xx% xx.xx% x.xx% x.xx% xx.xx% x.xx% xx.xx%
5 x.xx% x.xx% xx.xx% xx.xx% x.xx% x.xx% xx.xx% xx.xx%
6+ x.xx% x.xx% x.xx% xxx.xx% x.xx% x.xx% x.xx% xxx.xx%
Highlighted figures indicate the highest figures for each level of separation by row.
If the program is being sponsored by a Chief Officer or above, is this person really engaged in
your opinion? Rate on a scale of 1 to 5 with 1 meaning Very Little Involvement and 5 meaning
Very Involve. (An assessment of USA respondents.)
Table shows a correlation between three different questions. First Q uestion – What is the level
of separation from the Executive Committee for this individual? Selection choices include 0 to
6+. Second Question – Based on the current level of separation from the Executive Committee,
do you agree that the continuity program is best situated within your organization for maximum
visibility? Selection choices include strongly disagree, disagree, neutral, agree and strongly
agree. Third Question - Is your organization considering a different level of sponsorship for the
continuity program to maximize visibility? (An assessment of USA respondents.)
Copyright ©2010 BC Management, Inc. All rights reserved. SAMPLE REPORT
Page 27
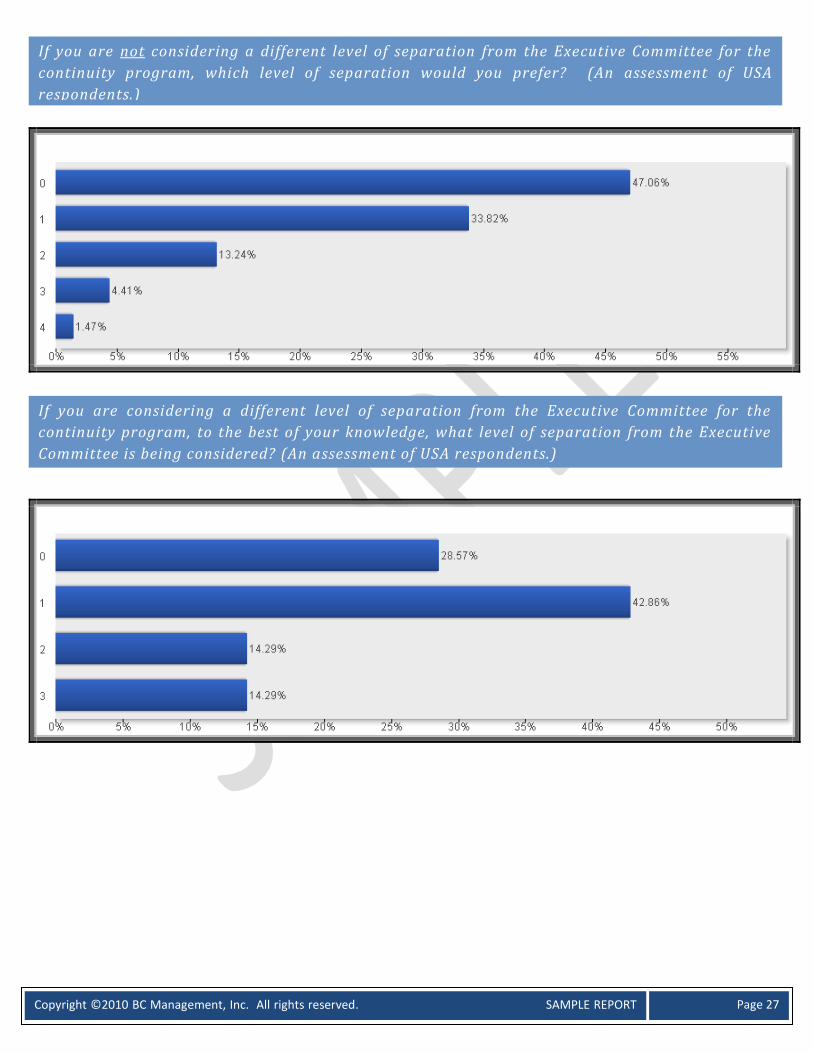
If you are not considering a different level of separation from the Executive Committee for the
continuity program, which level of separation would you prefer? (An assessment of USA
respondents.)
If you are considering a different level of separation from the Executive Committee for the
continuity program, to the best of your knowledge, what level of separation from the Executive
Committee is being considered? (An assessment of USA respondents.)

Copyright ©2010 BC Management, Inc. All rights reserved. SAMPLE REPORT
Page 28
Review & Update the BIA – Critical Processes
Very Immature Immature Average Mature
Very Mature
Every six months x.xx% x.xx% x.xx% x.xx% xx.xx%
Annually xx.xx% xx.xx% xx.xx% xx.xx% xx.xx%
Every other year xx.xx% xx.xx% xx.xx% xx.xx% x.xx%
Every three years xx.xx% xx.xx% xx.xx% xx.xx% x.xx%
Less often than three years xx.xx% x.xx% xx.xx% x.xx% x.xx%
Never xx.xx% xx.xx% x.xx% x.xx% x.xx%
Highlighted figures indicate the highest figures for each row.
Program Assessment & Exercising Plans
How often does your company review and update the BIA for organizational processes dee med
critical and non-critical? (An assessment of USA respondents.)
Table shows a correlation between two different questions. First Question - How often does your
company review and update the BIA for organizational processes deemed critical? Second
Question – In your opinion, how would you rate the maturity of your program? P lease rate on a
scale of 1 to 5 with 1 meaning VERY IMMATURE and 5 meaning VERY MATURE. (An assessment
of USA respondents.)

Copyright ©2010 BC Management, Inc. All rights reserved. SAMPLE REPORT
Page 29
Review & Update the BIA – Non-Critical Processes
Very Immature Immature Average Mature
Very Mature
Every six months x.xx% x.xx% x.xx% x.xx% x.xx%
Annually xx.xx% xx.xx% xx.xx% xx.xx% xx.xx%
Every other year xx.xx% xx.xx% xx.xx% xx.xx% xx.xx%
Every three years x.xx% xx.xx% xx.xx% xx.xx% x.xx%
Less often than three years xx.xx% x.xx% xx.xx% xx.xx% x.xx%
Never xx.xx% xx.xx% xx.xx% x.xx% x.xx%
Highlighted figures indicate the highest figures for each row.
In your opinion, does your organization leverage the outcome of the BIA and/ or risk
assessments to elevate the program? Please rate on a scale of 1 to 5 with 1 meaning Strongly
Disagree and 5 meaning Strongly Agree. (An assessment of USA respondents.)
Table shows a correlation between two different questions. First Question - How often does your
company review and update the BIA for organizational processes deemed non-critical? Second
Question – In your opinion, how would you rate the maturity of your program? Please rate on a
scale of 1 to 5 with 1 meaning VERY IMMATURE and 5 meaning VERY MATURE. (An assessment
of USA respondents.)
Copyright ©2010 BC Management, Inc. All rights reserved. SAMPLE REPORT
Page 30
Never Daily Weekly Monthly Quarterly Twice a
year Annually
Every other year
Less than every other
year
Mission Critical IT Assets
x.xx% x.xx% x.xx% x.xx% xx.xx% xx.xx% xx.xx% x.xx% x.xx%
Mission Critical Business Functions
x.xx% x.xx% x.xx% x.xx% xx.xx% xx.xx% xx.xx% x.xx% x.xx%
Less Critical IT Assets
xx.xx% x.xx% x.xx% x.xx% x.xx% xx.xx% xx.xx% xx.xx% xx.xx%
Less Critical Business Functions
xx.xx% x.xx% x.xx% x.xx% x.xx% x.xx% xx.xx% xx.xx% xx.xx%
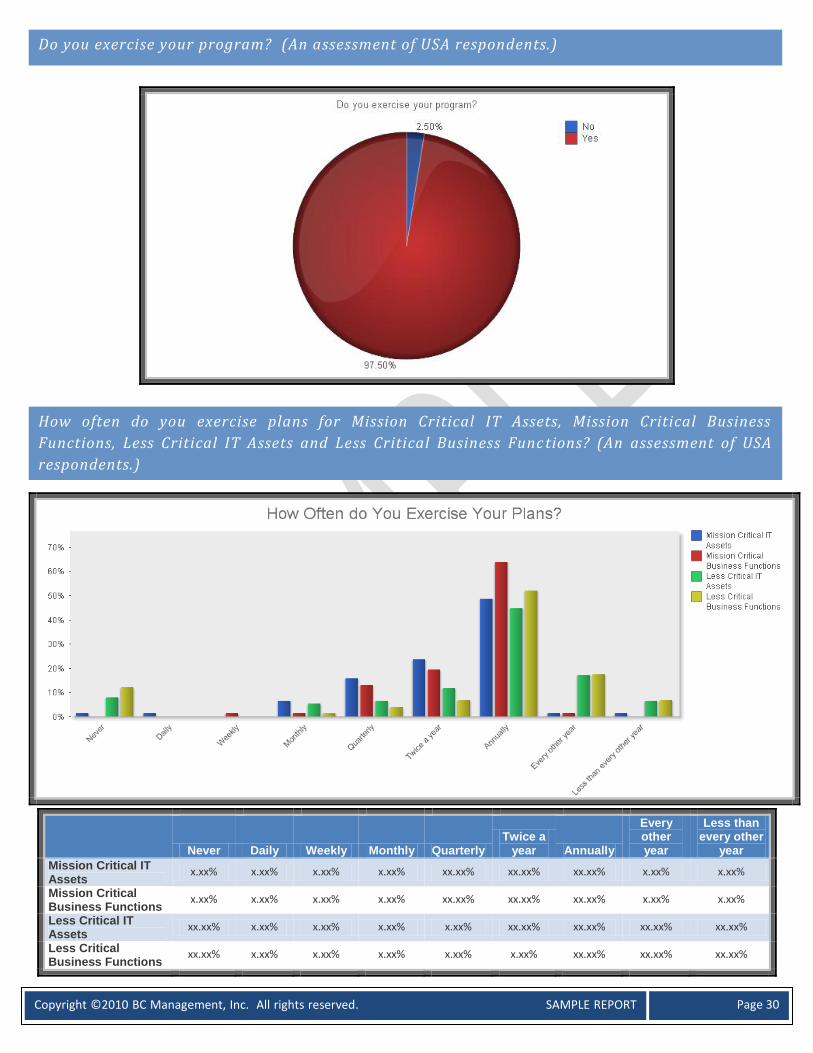
Do you exercise your program? (An assessment of USA respondents.)
How often do you exercise plans for Mission Critical IT Assets, Mission Critical Business
Functions, Less Critical IT Assets and Less Critical Business Func tions? (An assessment of USA
respondents.)

Copyright ©2010 BC Management, Inc. All rights reserved. SAMPLE REPORT
Page 31
Highlighted figures indicate the highest figures for each row.
Testing Plans – Mission Critical IT Assets
Very Immature Immature Average Mature
Very Mature
Daily x.xx% x.xx% x.xx% x.xx% x.xx%
Weekly x.xx% x.xx% x.xx% x.xx% x.xx%
Monthly x.xx% x.xx% x.xx% x.xx% x.xx%
Quarterly x.xx% x.xx% xx.xx% xx.xx% xx.xx%
Twice a year xx.xx% xx.xx% xx.xx% xx.xx% xx.xx%
Annually xx.xx% xx.xx% xx.xx% xx.xx% xx.xx%
Every other year x.xx% x.xx% x.xx% x.xx% x.xx%
Less than every other year x.xx% x.xx% x.xx% x.xx% x.xx%
Never xx.xx% x.xx% x.xx% x.xx% x.xx%
Highlighted figures indicate the highest figures for each row.
Testing Plans – Mission Critical Business Functions
Very Immature Immature Average Mature
Very Mature
Daily x.xx% x.xx% x.xx% x.xx% x.xx%
Weekly x.xx% x.xx% x.xx% x.xx% x.xx%
Monthly x.xx% x.xx% x.xx% x.xx% x.xx%
Quarterly x.xx% x.xx% x.xx% xx.xx% xx.xx%
Twice a year xx.xx% xx.xx% xx.xx% xx.xx% xx.xx%
Annually xx.xx% xx.x% xx.xx% xx.xx% xx.xx%
Every other year x.xx% x.xx% x.xx% x.xx% x.xx%
Less than every other year x.xx% x.xx% x.xx% x.xx% x.xx%
Never xx.xx% x.xx% x.xx% x.xx% x.xx%
Table shows a correlation between two different questions. First Question - How often do you
exercise plans for Mission Critical Business Functions? Second Question – In your opinion, how
would you rate the maturity of your program? Please rate on a scale of 1 to 5 with 1 meaning
VERY IMMATURE and 5 meaning VERY MATURE. (An assessment of USA respondents.)
Table shows a correlation between two different questions. First Question - How often do you
exercise plans for Mission Critical IT Assets? Second Question – In your opinion, how would you
rate the maturity of your program? Please rate on a scale of 1 to 5 with 1 meaning VERY
IMMATURE and 5 meaning VERY MATURE. (An assessment of USA respondents.)

Copyright ©2010 BC Management, Inc. All rights reserved. SAMPLE REPORT
Page 32
Highlighted figures indicate the highest figures for each row.
Testing Plans – Less Critical IT Assets
Very Immature Immature Average Mature
Very Mature
Daily x.xx% x.xx% x.xx% x.xx% x.xx%
Weekly x.xx% x.xx% x.xx% x.xx% x.xx%
Monthly x.xx% x.xx% x.xx% x.xx% x.xx%
Quarterly x.xx% x.xx% x.xx% x.xx% x.xx%
Twice a year xx.xx% x.xx% xx.xx% x.xx% xx.xx%
Annually xx.xx% xx.xx% xx.xx% xx.xx% xx.xx%
Every other year x.xx% xx.xx% xx.xx% xx.xx% xx.xx%
Less than every other year x.xx% xx.xx% xx.xx% x.xx% x.xx%
Never xx.xx% xx.xx% xx.xx% xx.xx% xx.xx%
Highlighted figures indicate the highest figures for each row.
Testing Plans – Less Critical Business Functions
Very Immature Immature Average Mature
Very Mature
Daily x.xx% x.xx% x.xx% x.xx% x.xx%
Weekly x.xx% x.xx% x.xx% x.xx% x.xx%
Monthly x.xx% x.xx% x.xx% x.xx% x.xx%
Quarterly x.xx% x.xx% x.xx% x.xx% x.xx%
Twice a year xx.xx% x.xx% x.xx% x.xx% xx.xx%
Annually xx.xx% xx.xx% xx.xx% xx.xx% xx.xx%
Every other year x.xx% xx.xx% xx.xx% xx.xx% xx.xx%
Less than every other year x.xx% xx.xx% xx.xx% xx.xx% x.xx%
Never xx.xx% xx.xx% xx.xx% xx.xx% xx.xx%
Highlighted figures indicate the highest figures for each row.
Table shows a correlation between two different questions. First Question - How often do you
exercise plans for Less Critical IT Assets? Second Question – In your opinion, how would you
rate the maturity of your program? Please rate on a sca le of 1 to 5 with 1 meaning VERY
IMMATURE and 5 meaning VERY MATURE. (An assessment of USA respondents.)
Table shows a correlation between two different questions. First Question - How often do you
exercise plans for Less Critical Business Functions? Second Question – In your opinion, how
would you rate the maturity of your program? Please rate on a scale of 1 to 5 with 1 meaning
VERY IMMATURE and 5 meaning VERY MATURE. (An assessment of USA respondents.)
Copyright ©2010 BC Management, Inc. All rights reserved. SAMPLE REPORT
Page 33
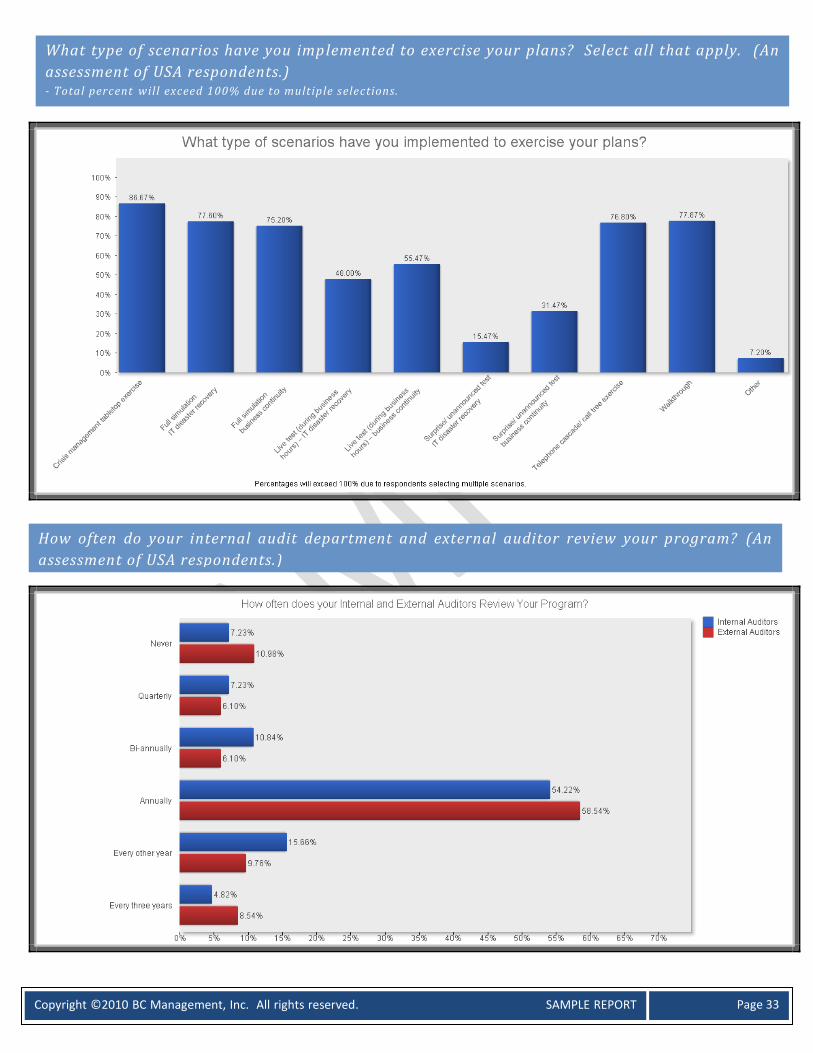
What type of scenarios have you implemented to exercise your plans? Select all that apply. (An
assessment of USA respondents.) - Total percent will exceed 100% due to multiple selections.
How often do your internal audit department and external auditor review your program? (An
assessment of USA respondents.)

Copyright ©2010 BC Management, Inc. All rights reserved. SAMPLE REPORT
Page 34
0%
5%
10%
15%
20%
25%
Internal Audit of Program by Program Maturity
Very Immature
Immature
Average
Mature
Very Mature
0%
5%
10%
15%
20%
25%
External Audit of Program by Program Maturity
Very Immature
Immature
Average
Mature
Very Mature
Table shows a correlation between two different questions. First Question - How often do
Internal Auditors review your program? Second Question – In your opinion, how would you rate
the maturity of your program? Please rate on a scale of 1 to 5 with 1 meaning VERY IMMATURE
and 5 meaning VERY MATURE. (An assessment of USA respondents.)
Table shows a correlation between two different questions. First Question - How often do
External Auditors review your program? Second Quest ion – In your opinion, how would you rate
the maturity of your program? Please rate on a scale of 1 to 5 with 1 meaning VERY IMMATURE
and 5 meaning VERY MATURE. (An assessment of USA respondents.)
Copyright ©2010 BC Management, Inc. All rights reserved. SAMPLE REPORT
Page 35
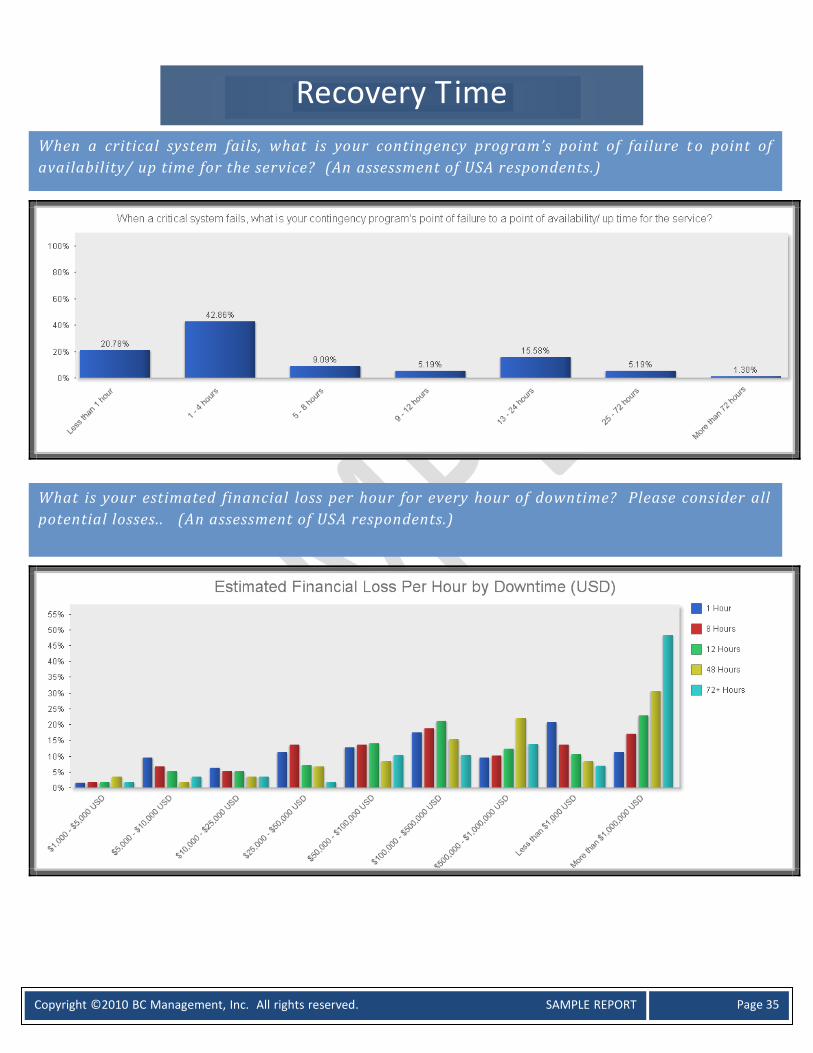
Recovery Time
When a critical system fails, what is your contingency program’s point of failure t o point of
availability/ up time for the service? (An assessment of USA respondents.)
What is your estimated financial loss per hour for every hour of downtime? Please consider all
potential losses.. (An assessment of USA respondents.)
Copyright ©2010 BC Management, Inc. All rights reserved. SAMPLE REPORT
Page 36
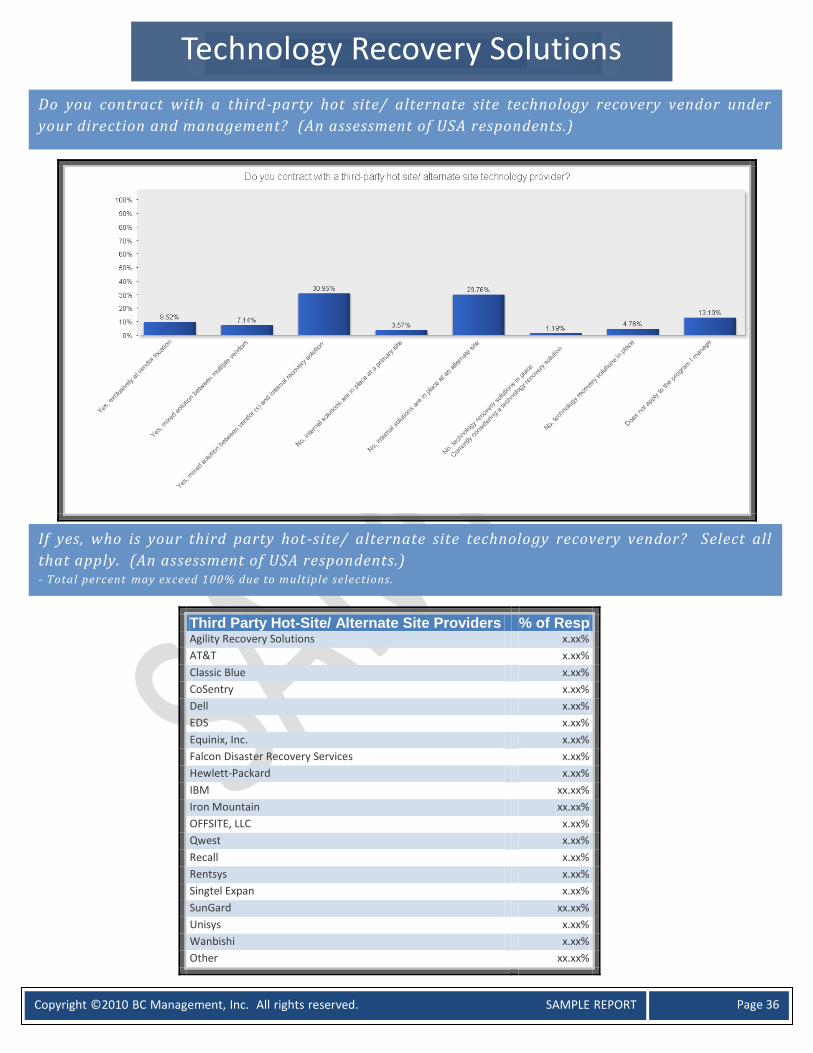
Third Party Hot-Site/ Alternate Site Providers % of Resp Agility Recovery Solutions x.xx%
AT&T x.xx%
Classic Blue x.xx%
CoSentry x.xx%
Dell x.xx%
EDS x.xx%
Equinix, Inc. x.xx%
Falcon Disaster Recovery Services x.xx%
Hewlett-Packard x.xx%
IBM xx.xx%
Iron Mountain xx.xx%
OFFSITE, LLC x.xx%
Qwest x.xx%
Recall x.xx%
Rentsys x.xx%
Singtel Expan x.xx%
SunGard xx.xx%
Unisys x.xx%
Wanbishi x.xx%
Other xx.xx%
Technology Recovery Solutions
Do you contract with a third-party hot site/ alternate site technology recovery vendor under
your direction and management? (An assessment of USA respondents.)
.
If yes, who is your third party hot-site/ alternate site technology recovery vendor? Select all
that apply. (An assessment of USA respondents.) - Total percent may exceed 100% due to multiple selections.
Copyright ©2010 BC Management, Inc. All rights reserved. SAMPLE REPORT
Page 37
Other Responses for Hot-Site/ Alternate Site Providers: Accenture; Agility Recovery Solutions ; CSX; Centrilogic; Centurion and Verizaon; Do not remember; IBM; Internal managed Hot Site; Internally owned
recovery site; Iron Mountain ; Jardine Mathieson - Hong Kong; McCoy Myers and Associates; Northrop Grumman; Not willing to share;
Office of Enterprise Technology; Peak 10; Pitney Bowes; Rentsys; Singtel Expan; SunGard; Switch Communications Group; TW Telecom; Tata
Communications Limited; VRI; cbts; cervalis; iLand;
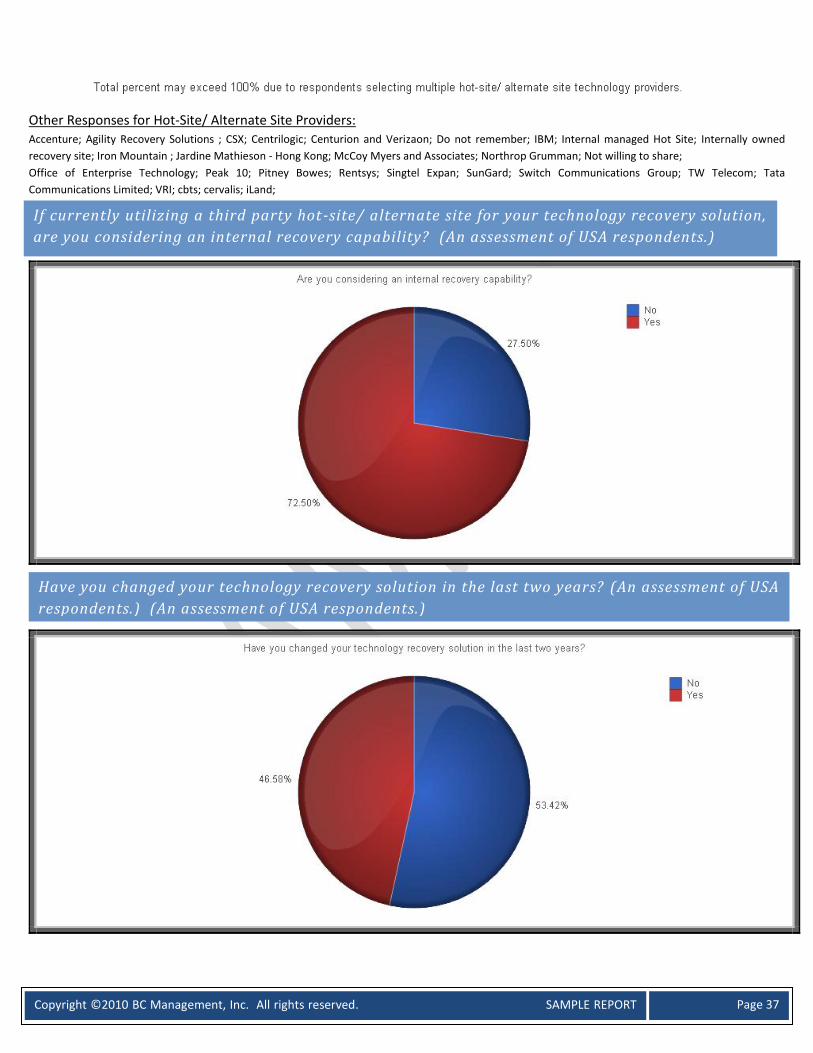
If currently utilizing a third party hot-site/ alternate site for your technology recovery solution,
are you considering an internal recovery capability? (An assessment of USA respondents.)
Have you changed your technology recovery solution in the last two years? (An assessment of USA
respondents.) (An assessment of USA respondents.)
Copyright ©2010 BC Management, Inc. All rights reserved. SAMPLE REPORT
Page 38
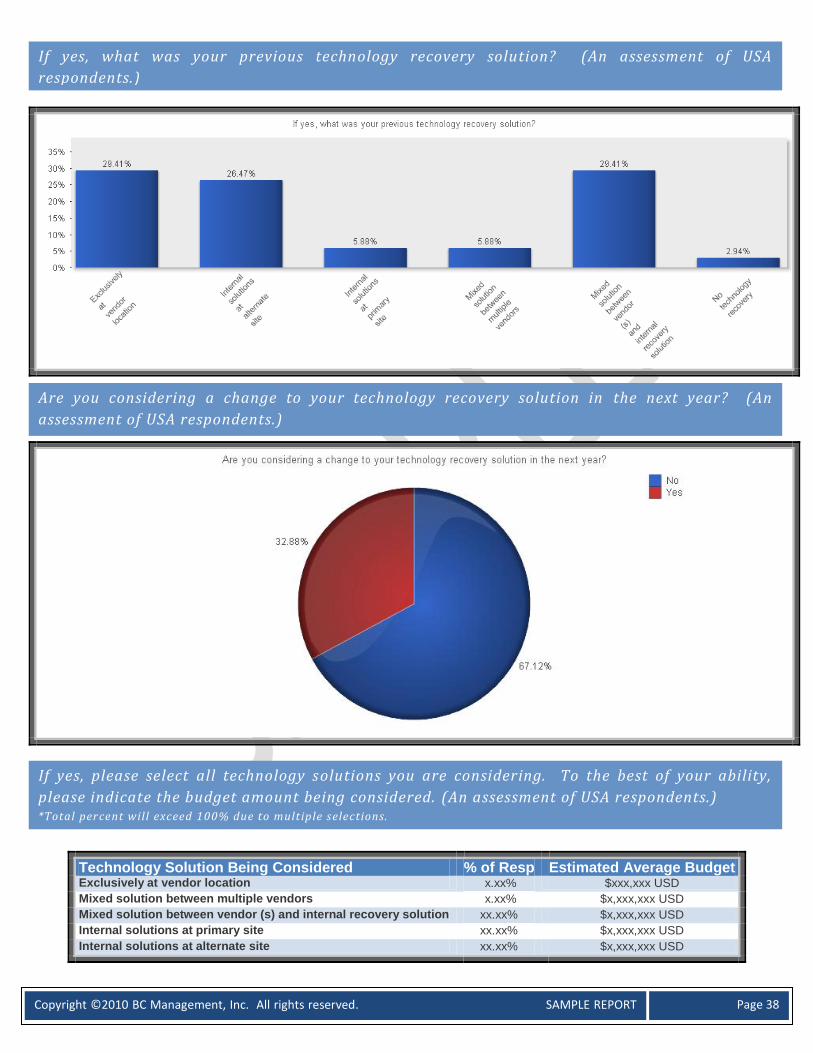
Technology Solution Being Considered % of Resp Estimated Average Budget Exclusively at vendor location x.xx% $xxx,xxx USD
Mixed solution between multiple vendors x.xx% $x,xxx,xxx USD
Mixed solution between vendor (s) and internal recovery solution xx.xx% $x,xxx,xxx USD
Internal solutions at primary site xx.xx% $x,xxx,xxx USD
Internal solutions at alternate site xx.xx% $x,xxx,xxx USD
If yes, what was your previous technology recovery solution? (An assessment of USA
respondents.)
Are you considering a change to your technology recovery solution in the next year? (An
assessment of USA respondents.)
If yes, please select all technology solutions you are considering. To the best of your ability,
please indicate the budget amount being considered. (An assessment of USA respondents.) *Total percent will exceed 100% due to multiple selections.

Copyright ©2010 BC Management, Inc. All rights reserved. SAMPLE REPORT
Page 39
Cloud Computing
Is your company considering cloud computing in the next year? (An assessment of USA
respondents.)
If yes, please rate the following in your decision making process. (An assessment of USA
respondents.)

Copyright ©2010 BC Management, Inc. All rights reserved. SAMPLE REPORT
Page 40
Consulting Initiatives
How many contractors do you currently employ for your program under your direction and
management? (An assessment of USA respondents.)
If yes, what is the length of the contract for the longest contractor? (An assessment of USA
respondents.)

Copyright ©2010 BC Management, Inc. All rights reserved. SAMPLE REPORT
Page 41
Consulting Work in the Next Year % of Respondents
Assessment
BIA xx.xx%
Facility Evaluation xx.xx%
Gap analysis xx.xx%
None/does not apply xx.xx%
Other xx.xx%
Risk Assessment xx.xx%
Technical xx.xx%
Compliance/ Standard
BASEL II x.xx%
BS 31100 (Risk Management) x.xx%
BS25777 x.xx%
BS25999 Part 2 Business Continuity Management Systems xx.xx%
COBIT xx.xx%
DRI International Professional Practices xx.xx%
FFIEC x.xx%
Good Practice Guidelines 2008 (BCI) xx.xx%
Gramm Leach Bliley Act (GLBA) x.xx%
HB 167:2006 – Security Risk Management (Australia Standard) x.xx%
HB 203:2006 – Environmental Risk Management (Australia Standard) x.xx%
HB 221:2004 (Australia Standard) x.xx%
HB 292-2006 (Australia Standard) x.xx%
HB 436:2004 – Risk Management (Australia Standard) x.xx%
HIPAA xx.xx%
ISO 27001 Information Security x.xx%
ISO 9000 Fundamentals and Vocabulary of Quality Systems x.xx%
Joint Commission (Hospitals) x.xx%
NFPA 1600 xx.xx%
NFPA 1600 (Canadian Version) x.xx%
None/does not apply xx.xx%
OSHA Compliance xx.xx%
Other x.xx%
Will you be engaging in consulting work in the next year for your program under your direction
and management? (An assessment of USA respondents.)
What consulting initiatives are you planning in the next year in regards to ASSESSMENT,
COMPLIANCE/ STANDARD, BC PROGRAM, DR PROGRAM AND GENERAL MANAGEMENT OF
PROGRAM? (An assessment of USA respondents.)
.

Copyright ©2010 BC Management, Inc. All rights reserved. SAMPLE REPORT
Page 42
Patriot Act x.xx%
Sarbanes Oxley xx.xx%
SEC Regulations x.xx%
SS540/ TR19 (Singapore Standard) x.xx%
Title IX x.xx%
BC Program (Business Processes)
Awareness xx.xx%
Crisis Mgt (Emergency Operations Center) xx.xx%
Development xx.xx%
Documentation xx.xx%
Emergency Management xx.xx%
Exercise xx.xx%
Implementation xx.xx%
None/does not apply xx.xx%
Other x.xx%
Pandemic Planning xx.xx%
DR Program (IT Processes)
Back-up/Resiliency xx.xx%
Development xx.xx%
Documentation xx.xx%
Exercise xx.xx%
High availability/ Operational Resilience xx.xx%
Implementation xx.xx%
None/does not apply xx.xx%
General Continuity Consulting
BCM Policy xx.xx%
Customer Training xx.xx%
Electronic Risk x.xx%
Executive Buy-in xx.xx%
Media/ Event Planning x.xx%
None/does not apply xx.xx%
Operational Risk xx.xx%
Other x.xx%
Project Management xx.xx%
Recommendations xx.xx%
Software Implementation xx.xx%
Software Support x.xx%
Software Upgrade x.xx%
Strategic Planning xx.xx%
Vendor Assessment x.xx%
Other Consulting Initiatives for the Next Year:
Assessment Work - Employee Training and program advice, Full Scale Exercise, Generate simulation, Plan Testing, Program Maturity Assessment, Software
Implementation, Technical DR/IT analysis, business recovery planning, exercise, incident and crisis management
Compliance/ Standard Work – AIB Food Security, ASIS Resiliency Standard, Applicable state regulations, Circular No. G-139 -2009 (Peru) Managing business
continuity, ISO 28000, PAS200
Other BC Program (Business Processes) Work – BIA, Mobile Recovery, emergency communications
Other DR Program (IT Processes) Work – NONE NOTED FOR OTHER.
Other General Continuity Consulting Work – Exercise, Gap analysis in technical recovery documentation/ testing/recovery checklist, Software Support,
Software Upgrade, Training for employees; Incident Response team training, Vendor Assessment , emergency communications
Copyright ©2010 BC Management, Inc. All rights reserved. SAMPLE REPORT
Page 43
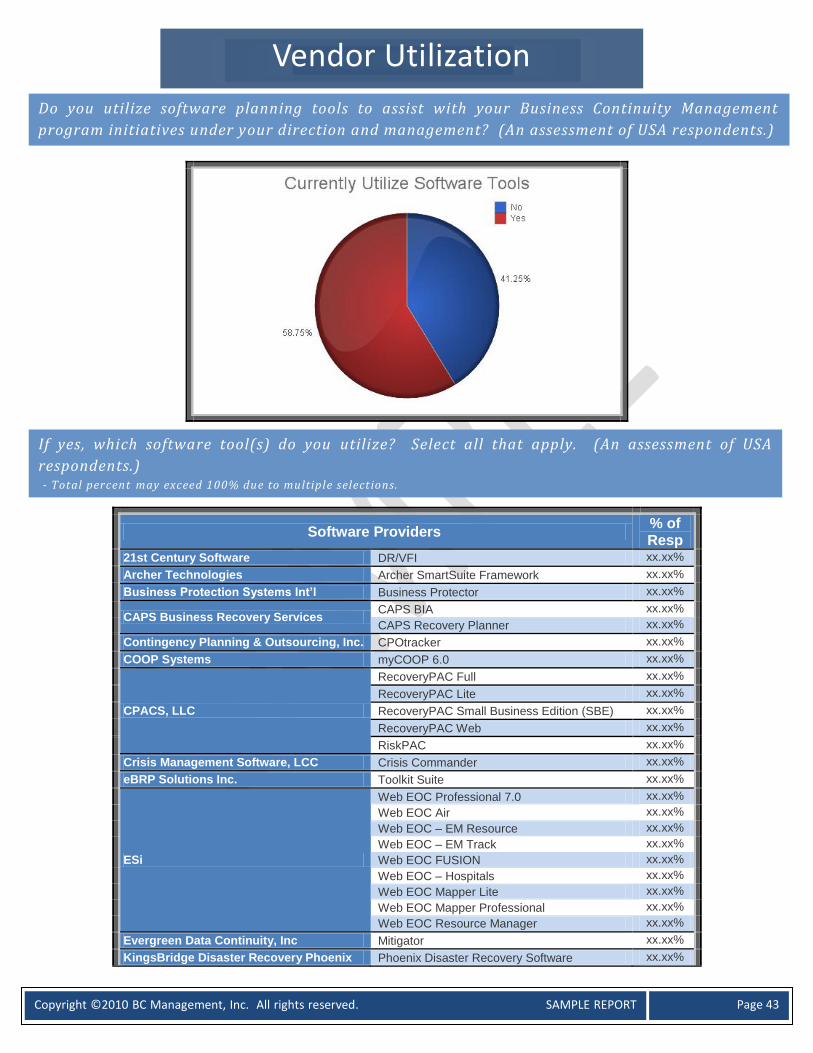
Software Providers % of Resp
21st Century Software DR/VFI xx.xx%
Archer Technologies Archer SmartSuite Framework xx.xx%
Business Protection Systems Int’l Business Protector xx.xx%
CAPS Business Recovery Services CAPS BIA xx.xx%
CAPS Recovery Planner xx.xx%
Contingency Planning & Outsourcing, Inc. CPOtracker xx.xx%
COOP Systems myCOOP 6.0 xx.xx%
CPACS, LLC
RecoveryPAC Full xx.xx%
RecoveryPAC Lite xx.xx%
RecoveryPAC Small Business Edition (SBE) xx.xx%
RecoveryPAC Web xx.xx%
RiskPAC xx.xx%
Crisis Management Software, LCC Crisis Commander xx.xx%
eBRP Solutions Inc. Toolkit Suite xx.xx%
ESi
Web EOC Professional 7.0 xx.xx%
Web EOC Air xx.xx%
Web EOC – EM Resource xx.xx%
Web EOC – EM Track xx.xx%
Web EOC FUSION xx.xx%
Web EOC – Hospitals xx.xx%
Web EOC Mapper Lite xx.xx%
Web EOC Mapper Professional xx.xx%
Web EOC Resource Manager xx.xx%
Evergreen Data Continuity, Inc Mitigator xx.xx%
KingsBridge Disaster Recovery Phoenix Phoenix Disaster Recovery Software xx.xx%
Vendor Utilization
Do you utilize software planning tools to assist with your Business Continuity Management
program initiatives under your direction and management? (An assessment of USA respondents.)
If yes, which software tool(s) do you utilize? Select all that apply. (An assessment of USA
respondents.) - Total percent may exceed 100% due to multiple selections.

Copyright ©2010 BC Management, Inc. All rights reserved. SAMPLE REPORT
Page 44
LBL Technology Partners ContingencyPro (web based) xx.xx%
LBL Contingency Planner (client/server based) xx.xx%
Linus Information Security Solutions Revive xx.xx%
NC4 E-TEAM xx.xx%
Office Shadow Shadow-Planner xx.xx%
Paradigm Solutions OpsPlanner xx.xx%
Protiviti PACEmaker xx.xx%
RecoveryPlanner.com RPX xx.xx%
Seagate Seagate Showcase xx.xx%
Softek (acquired by IBM) Softek DR Manager xx.xx%
SunGard
BIA Professional xx.xx%
EPlanner xx.xx%
Incident Manager, powered by Web EOC xx.xx%
LDRPS xx.xx%
Paragon xx.xx%
PLANet xx.xx%
Precovery xx.xx%
Tamp Systems (DRS) Disaster Recovery System xx.xx%
TexoNet Ltd ImpactAware xx.xx%
Virtual Corporation Sustainable Planner xx.xx%
Non-BCP Focused Packages (Word, Excel or Sharepoint) xx.xx%
In-house/Internally Developed Tool In-house/ Internally Developed Tool xx.xx%
Other Other x.xx%
Other Responses for Software Providers:
Avalution - The Planning Portal, Conetrix, LDRPS - living disaster recovery & planning system, SharePoint, Strategic BCP /
ResilienceOne, SunGard - NotiFind , Sungard Notifind, in-house MS-Access DB, myCoop
Avalution - The Planning Portal
Estimated Average Software Budget – Next Year: $xx,xxx USD
If not currently utilizing a software tool, are you considering in the next year? If yes, to the best
of your ability, please indicate the budget amount being considered. (An assessment of USA
respondents.)
Copyright ©2010 BC Management, Inc. All rights reserved. SAMPLE REPORT
Page 45
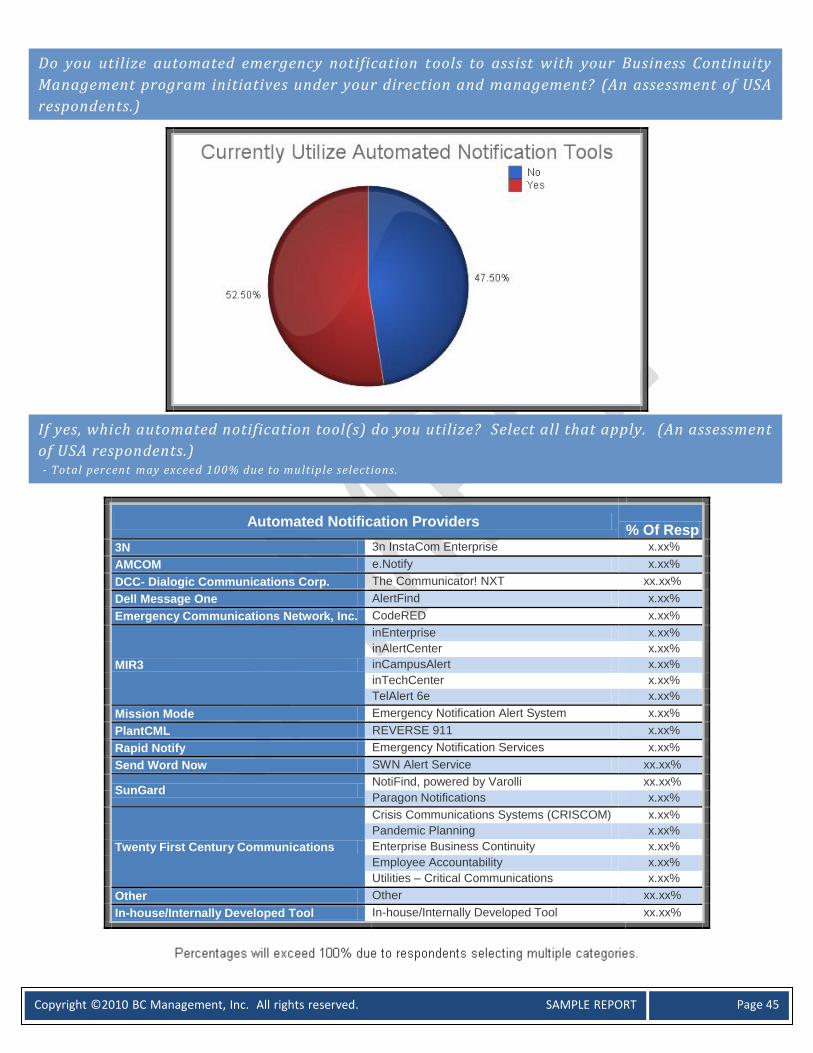
Automated Notification Providers % Of Resp
3N 3n InstaCom Enterprise x.xx%
AMCOM e.Notify x.xx%
DCC- Dialogic Communications Corp. The Communicator! NXT xx.xx%
Dell Message One AlertFind x.xx%
Emergency Communications Network, Inc. CodeRED x.xx%
MIR3
inEnterprise x.xx%
inAlertCenter x.xx%
inCampusAlert x.xx%
inTechCenter x.xx%
TelAlert 6e x.xx%
Mission Mode Emergency Notification Alert System x.xx%
PlantCML REVERSE 911 x.xx%
Rapid Notify Emergency Notification Services x.xx%
Send Word Now SWN Alert Service xx.xx%
SunGard NotiFind, powered by Varolli xx.xx%
Paragon Notifications x.xx%
Twenty First Century Communications
Crisis Communications Systems (CRISCOM) x.xx%
Pandemic Planning x.xx%
Enterprise Business Continuity x.xx%
Employee Accountability x.xx%
Utilities – Critical Communications x.xx%
Other Other xx.xx%
In-house/Internally Developed Tool In-house/Internally Developed Tool xx.xx%
Do you utilize automated emergency notification t ools to assist with your Business Continuity
Management program initiatives under your direction and management? (An assessment of USA
respondents.)
If yes, which automated notification tool(s) do you utilize? Select all that apply. (An assessment
of USA respondents.) - Total percent may exceed 100% due to multiple selections.

Copyright ©2010 BC Management, Inc. All rights reserved. SAMPLE REPORT
Page 46
Other Responses for Notification Providers:
ARCOS, Blackboard Connect CTY, Blackboard Connect-CTY, CMNS (Exigent911), Cisco Voice-over IP, Crisis Commander system(s), Everbridge, Everbridge
Aware, GroupCast, ISOS, Page One, F24, Notifind, QuikContact, Talx product, TelCom Recovery, TeleMinder, The Planning Portal (TPP) Notify, Twitter,
United Alert, Unwilling to share name of vendor, Voice Reach, command caller, don't know
Estimated Average Automated Notification Budget – Next Year: $xx,xxx USD
If not currently utilizing an automatic notification t ool, are you considering in the next year? If
yes, to the best of your ability, please indicate the budget a mount being considered. (An
assessment of USA respondents.)
Do you utilize a mobile recovery solution to assist with your Business Continuity Management
program initiatives under your direction and management? (An assessment of USA
respondents.)
Copyright ©2010 BC Management, Inc. All rights reserved. SAMPLE REPORT
Page 47
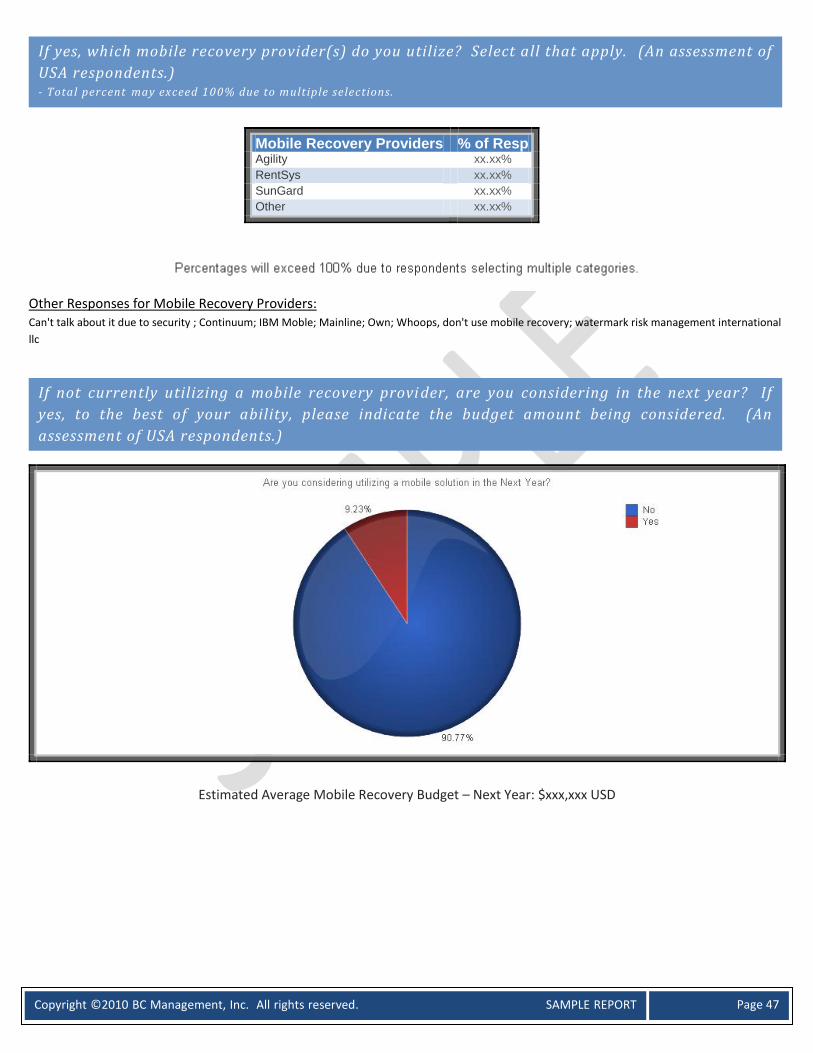
Mobile Recovery Providers % of Resp Agility xx.xx%
RentSys xx.xx%
SunGard xx.xx%
Other xx.xx%
Other Responses for Mobile Recovery Providers: Can't talk about it due to security ; Continuum; IBM Moble; Mainline; Own; Whoops, don't use mobile recovery; watermark risk management international
llc
Estimated Average Mobile Recovery Budget – Next Year: $xxx,xxx USD
If yes, which mobile recovery provider(s) do you utilize? Select all that apply. (An assessment of
USA respondents.) - Total percent may exceed 100% due to multiple selections.
If not currently utilizing a mobile recovery provi der, are you considering in the next year? If
yes, to the best of your ability, please indicate the budget amount being considered. (An
assessment of USA respondents.)
Copyright ©2010 BC Management, Inc. All rights reserved. SAMPLE REPORT
Page 48
Management Style by Number of Company Locations
1-5
6-1
0
11
-15
16
-25
26
-50
51
-10
0
10
1-3
00
30
1-5
00
50
1-1
,00
0
1,0
01
-
5,0
00
Mo
re t
han
5,0
00
Engage professional consulting services
local to the location(s). X% X% X% X% X% X% X% X% X% X% X%
Engage professional consulting services
not local to the location(s). X% X% X% X% X% X% X% X% X% X% X%
Hire consultants/ independent
contractors local to the location(s). X% X% X% X% X% X% X% X% xx% X% X%
Hire consultants/ independent
contractors not local to the location(s). X% X% X% X% X% X% X% X% X% X% X%
Hire full-time, permanent professionals
local to the location(s). xx% xx% X% X% X% X% X% X% X% xx% X%
Manage program from primary
corporate office with periodic travel to
location(s).
xx% xx% xx% xx% xx% xx% xx% xx% xx% xx% xx%
Managed locally with existing resources
that are not experienced in the
discipline.
xx% xx% xx% xx% xx% xx% xx% xx% xx% xx% xx%
Place expatriate in facility location for
specified time period. x% x% x% x% x% x% x% x% x% x% x%
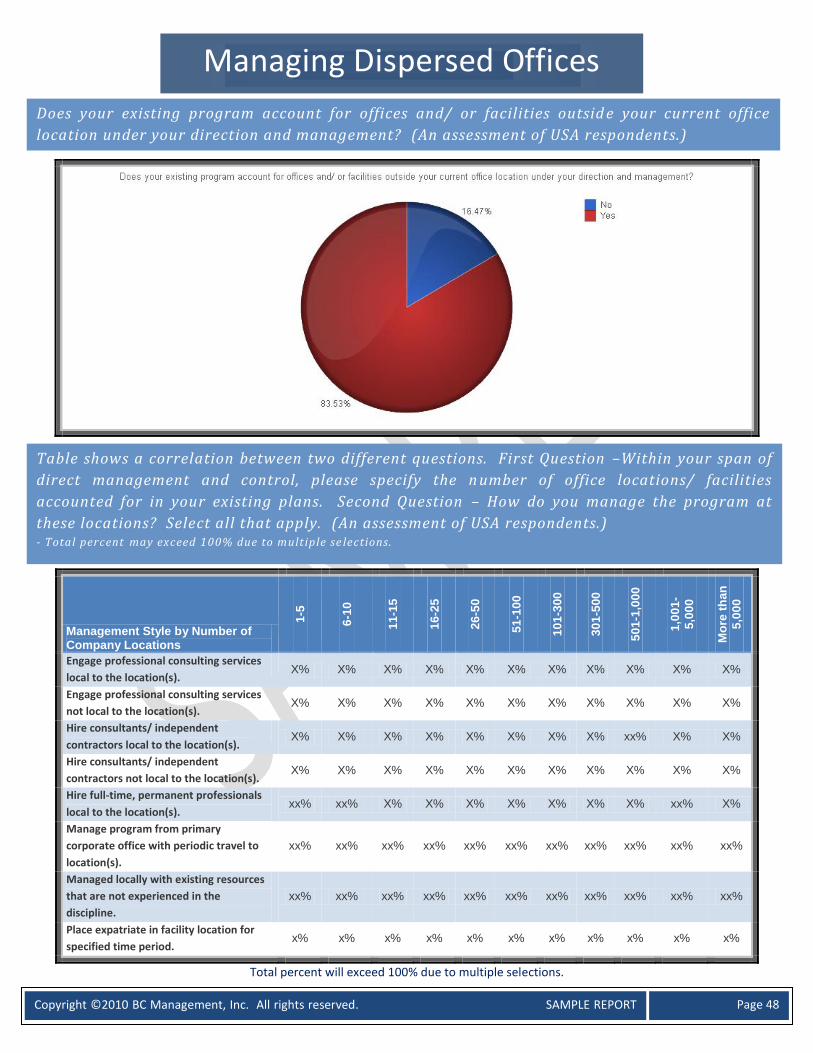
Total percent will exceed 100% due to multiple selections.
Managing Dispersed Offices
Does your existing program account for offices and/ or facilities outsid e your current office
location under your direction and management? (An assessment of USA respondents.)
Table shows a correlation between two different questions. First Question –Within your span of
direct management and control, please specify the n umber of office locations/ facilities
accounted for in your existing plans. Second Question – How do you manage the program at
these locations? Select all that apply. (An assessment of USA respondents.) - Total percent may exceed 100% due to multiple se lections.
Copyright ©2010 BC Management, Inc. All rights reserved. SAMPLE REPORT
Page 49
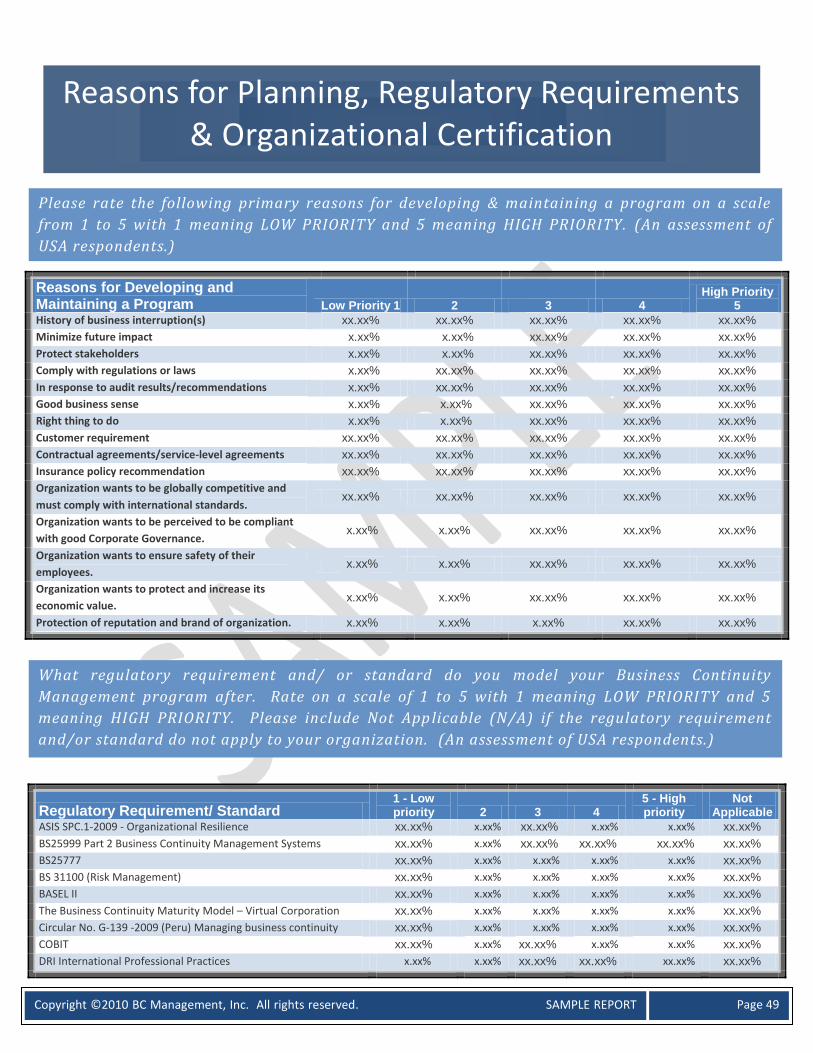
Reasons for Developing and Maintaining a Program Low Priority 1 2 3 4
High Priority 5
History of business interruption(s) xx.xx% xx.xx% xx.xx% xx.xx% xx.xx%
Minimize future impact x.xx% x.xx% xx.xx% xx.xx% xx.xx%
Protect stakeholders x.xx% x.xx% xx.xx% xx.xx% xx.xx%
Comply with regulations or laws x.xx% xx.xx% xx.xx% xx.xx% xx.xx%
In response to audit results/recommendations x.xx% xx.xx% xx.xx% xx.xx% xx.xx%
Good business sense x.xx% x.xx% xx.xx% xx.xx% xx.xx%
Right thing to do x.xx% x.xx% xx.xx% xx.xx% xx.xx%
Customer requirement xx.xx% xx.xx% xx.xx% xx.xx% xx.xx%
Contractual agreements/service-level agreements xx.xx% xx.xx% xx.xx% xx.xx% xx.xx%
Insurance policy recommendation xx.xx% xx.xx% xx.xx% xx.xx% xx.xx%
Organization wants to be globally competitive and
must comply with international standards. xx.xx% xx.xx% xx.xx% xx.xx% xx.xx%
Organization wants to be perceived to be compliant
with good Corporate Governance. x.xx% x.xx% xx.xx% xx.xx% xx.xx%
Organization wants to ensure safety of their
employees. x.xx% x.xx% xx.xx% xx.xx% xx.xx%
Organization wants to protect and increase its
economic value. x.xx% x.xx% xx.xx% xx.xx% xx.xx%
Protection of reputation and brand of organization. x.xx% x.xx% x.xx% xx.xx% xx.xx%
Regulatory Requirement/ Standard 1 - Low priority 2 3 4
5 - High priority
Not Applicable
ASIS SPC.1-2009 - Organizational Resilience xx.xx% x.xx% xx.xx% x.xx% x.xx% xx.xx%
BS25999 Part 2 Business Continuity Management Systems xx.xx% x.xx% xx.xx% xx.xx% xx.xx% xx.xx%
BS25777 xx.xx% x.xx% x.xx% x.xx% x.xx% xx.xx%
BS 31100 (Risk Management) xx.xx% x.xx% x.xx% x.xx% x.xx% xx.xx%
BASEL II xx.xx% x.xx% x.xx% x.xx% x.xx% xx.xx%
The Business Continuity Maturity Model – Virtual Corporation xx.xx% x.xx% x.xx% x.xx% x.xx% xx.xx%
Circular No. G-139 -2009 (Peru) Managing business continuity xx.xx% x.xx% x.xx% x.xx% x.xx% xx.xx%
COBIT xx.xx% x.xx% xx.xx% x.xx% x.xx% xx.xx%
DRI International Professional Practices x.xx% x.xx% xx.xx% xx.xx% xx.xx% xx.xx%
Reasons for Planning, Regulatory Requirements & Organizational Certification
What regulatory requirement and/ or standard do you model your Business Continuity
Management program after. Rate on a scale of 1 to 5 with 1 meaning LOW PRIORITY and 5
meaning HIGH PRIORITY. Please include Not App licable (N/A) if the regulatory requirement
and/or standard do not apply to your organization. (An assessment of USA respondents.)
Please rate the following primary reasons for developing & maintaining a program on a scale
from 1 to 5 with 1 meaning LOW PRIORITY and 5 meaning HIGH PRIORITY. (An assessment of
USA respondents.)

Copyright ©2010 BC Management, Inc. All rights reserved. SAMPLE REPORT
Page 50
External Circular 048 (Colombia) - Rules for the Operational Risk
Management xx.xx%
x.xx% x.xx% x.xx% x.xx% xx.xx%
FFIEC xx.xx% x.xx% x.xx% x.xx% xx.xx% xx.xx%
Good Practice Guidelines 2008 (BCI) xx.xx% x.xx% x.xx% xx.xx% x.xx% xx.xx%
Gramm Leach Bliley Act (GLBA) xx.xx% x.xx% x.xx% xx.xx% xx.xx% xx.xx%
HB 167:2006 – Security Risk Management (Australia Standard) xx.xx% x.xx% x.xx% x.xx% x.xx% xx.xx%
HB 203:2006 – Environmental Risk Management (Australia
Standard) xx.xx%
x.xx% x.xx% x.xx% x.xx% xx.xx%
HB 221:2004 (Australia Standard) xx.xx% x.xx% x.xx% x.xx% x.xx% xx.xx%
HB 292-2006 (Australia Standard) xx.xx% x.xx% x.xx% x.xx% x.xx% xx.xx%
HB 436:2004 – Risk Management (Australia Standard) xx.xx% x.xx% x.xx% x.xx% x.xx% xx.xx%
HIPAA xx.xx% x.xx% x.xx% xx.xx% xx.xx% xx.xx%
Hong Kong Monetary Authority xx.xx% x.xx% x.xx% x.xx% x.xx% xx.xx%
ISO 14001 Environmental Management xx.xx% x.xx% x.xx% x.xx% x.xx% xx.xx%
ISO 9000 Fundamentals and Vocabulary of Quality Systems xx.xx% x.xx% x.xx% x.xx% x.xx% xx.xx%
ISO 9001 Quality Management xx.xx% x.xx% xx.xx% x.xx% x.xx% xx.xx%
ISO 27001 Information Security xx.xx% x.xx% x.xx% xx.xx% xx.xx% xx.xx%
ISO 20000 IT Service Management xx.xx% x.xx% x.xx% x.xx% x.xx% xx.xx%
Joint Commission (Hospitals) xx.xx% x.xx% x.xx% x.xx% x.xx% xx.xx%
Local Banking Superintendency Requirement xx.xx% x.xx% x.xx% x.xx% x.xx% xx.xx%
MS 1970 (Malaysia Standard) xx.xx% x.xx% x.xx% x.xx% x.xx% xx.xx%
NFPA 1600 x.xx% x.xx% xx.xx% xx.xx% xx.xx% xx.xx%
NFPA 1600 (Canadian Version) xx.xx% x.xx% x.xx% x.xx% x.xx% xx.xx%
NYSE 446/NASD 3500 xx.xx% x.xx% x.xx% x.xx% x.xx% xx.xx%
OSHA Compliance xx.xx% x.xx% x.xx% xx.xx% xx.xx% xx.xx%
Patriot Act xx.xx% x.xx% x.xx% xx.xx% xx.xx% xx.xx%
Prudential Standard APS 232 on BCM (Australia) xx.xx% x.xx% x.xx% x.xx% x.xx% xx.xx%
Prudential Standard GPS 222 on BCM (Australia) xx.xx% x.xx% x.xx% x.xx% x.xx% xx.xx%
Prudential Standard LPS 232 on BCM (Australia) xx.xx% x.xx% x.xx% x.xx% x.xx% xx.xx%
Sarbanes Oxley x.xx% x.xx% xx.xx% xx.xx% xx.xx% xx.xx%
SAS70 x.xx% x.xx% x.xx% xx.xx% xx.xx% xx.xx%
SAS70-1 xx.xx% x.xx% x.xx% x.xx% xx.xx% xx.xx%
SEC Regulations xx.xx% x.xx% x.xx% x.xx% xx.xx% xx.xx%
SS540/TR19 (Singapore Standard) xx.xx% x.xx% x.xx% x.xx% x.xx% xx.xx%
Title IX x.xx% x.xx% x.xx% x.xx% x.xx% xx.xx%
Other x.xx% x.xx% x.xx% x.xx% x.xx% xx.xx%
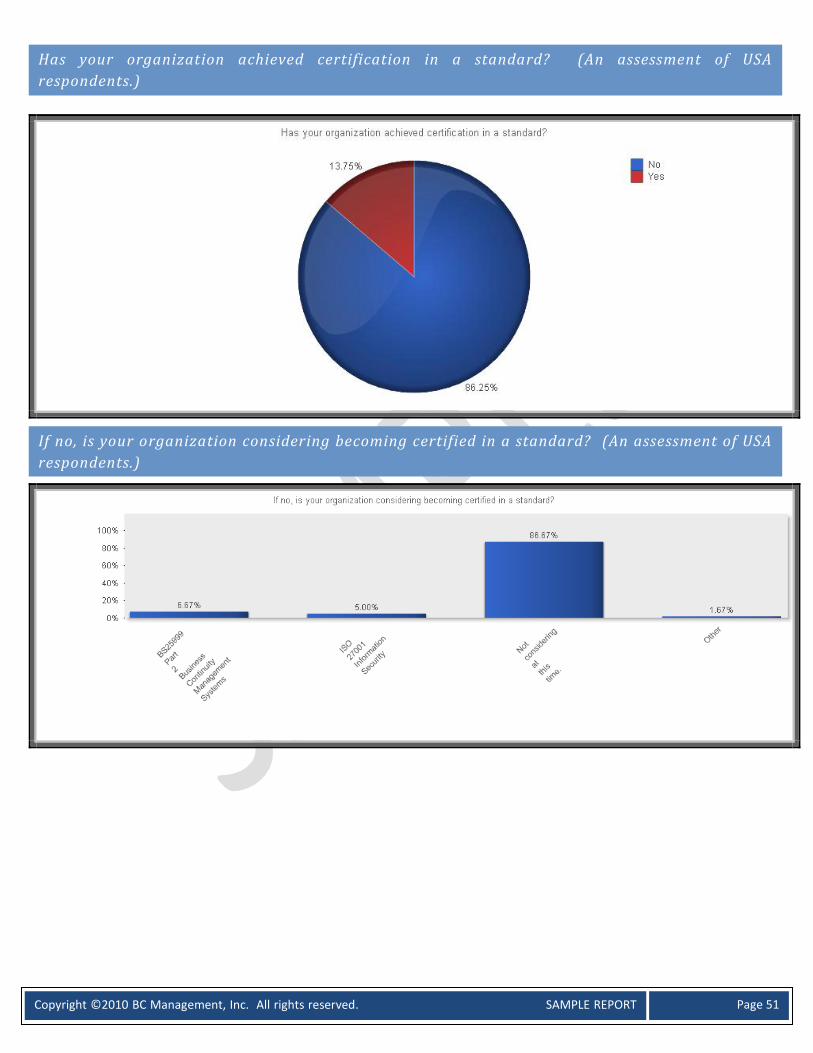
Copyright ©2010 BC Management, Inc. All rights reserved. SAMPLE REPORT
Page 51
Has your organization achieved certification in a standard? (An assessment of USA
respondents.)
If no, is your organization considering becoming certified in a standard? (An assessment of USA
respondents.)
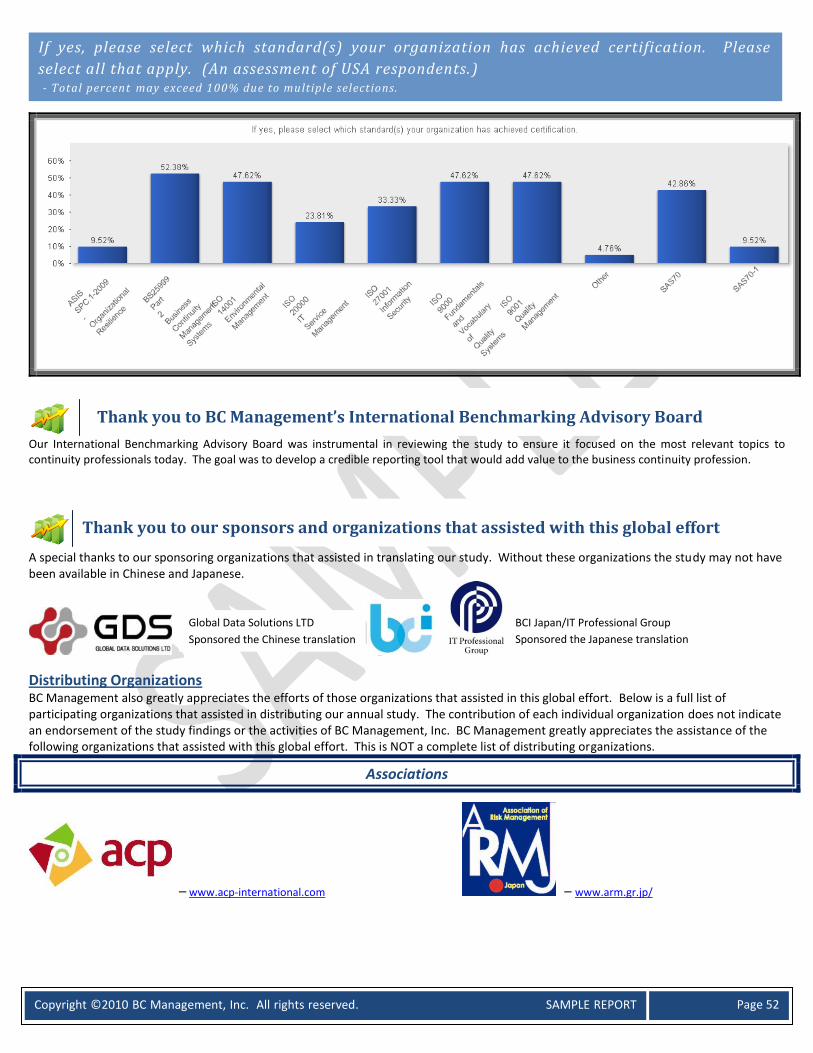
Copyright ©2010 BC Management, Inc. All rights reserved. SAMPLE REPORT
Page 52
Our International Benchmarking Advisory Board was instrumental in reviewing the study to ensure it focused on the most relevant topics to continuity professionals today. The goal was to develop a credible reporting tool that would add value to the business continuity profession.
A special thanks to our sponsoring organizations that assisted in translating our study. Without these organizations the study may not have been available in Chinese and Japanese.
Distributing Organizations
BC Management also greatly appreciates the efforts of those organizations that assisted in this global effort. Below is a full list of participating organizations that assisted in distributing our annual study. The contribution of each individual organization does not indicate an endorsement of the study findings or the activities of BC Management, Inc. BC Management greatly appreciates the assistance of the following organizations that assisted with this global effort. This is NOT a complete list of distributing organizations.
Associations
– www.acp-international.com – www.arm.gr.jp/
If yes, please select which standard(s) your organization has achieved certification. Please
select all that apply. (An assessment of USA respondents.) - Total percent may exceed 100% due to multiple selections.
Thank you to BC Management’s International Benchmarking Advisory Board
Thank you to our sponsors and organizations that assisted with this global effort
Global Data Solutions LTD
Sponsored the Chinese translation
BCI Japan/IT Professional Group
Sponsored the Japanese translation
Copyright ©2010 BC Management, Inc. All rights reserved. SAMPLE REPORT
Page 53
– www.bcpwho.org
– www.cpohio.org – www.cpeworld.org
– www.drie.org – www.nedrix.com
Certifying Organizations
– www.thebci.org
BCI Asia BCI Brazil BCI Canada BCI India BCI Japan BCI Spain
– www.drii.org
– www.dri-australia.org – www.dri.ca – www.dri-malaysia.org – www.dri-singapore.org
– www.iaem.com – www.theicor.org
Business Continuity/Disaster Recovery Service Providers
– www.allhands.us – www.avalution.com
– www.bcpasia.com – www.continuityleadership.com
– www.continuitylink.com – www.dell.com/modularservices
BCMIE Australia Inc. – www.bcmie-australia.org
Copyright ©2010 BC Management, Inc. All rights reserved. SAMPLE REPORT
Page 54
– www.ehdf.com – www.firestorm.com
– www.calamity.com.sg – www.fusionriskmgmt.com
– www.ketchconsulting.com
e-Groups
B2-ORM Yahoo e-group – Operational Risk Managers in Financial Services – http://groups.yahoo.com/group/B2-ORM/summary
– Virtual e-group – http://bcmix.groupsite.com/
UK-BCP Yahoo e-group – http://finance.groups.yahoo.com/group/uk-bcp/
Periodicals/Media
– www.contingencyplanning.com – www.continuitycentral.com
– www.continuityinsights.com – www.drj.com
– www.disaster-resource.com
Universities/Colleges
– www.norwich.edu
BCPDRPIndia – Yahoo e-group – http://finance.groups.yahoo.com/group/BCPDRPIndia/

Copyright ©2010 BC Management, Inc. All rights reserved. SAMPLE REPORT
Page 55
BC Management, Inc. was founded in 2000. We are an executive search and research firm solely dedicated to the business continuity,
disaster recovery, risk management, emergency management, crisis management and information security professions. With decades of
industry expertise, our staff has a unique understanding of the challenges professionals face with hiring, benchmarking and analyzing best
practices within these niche fields.
BC Management’s Complimentary Research
BC Management has been collecting data on the factors that impact compensations and business continuity programs since 2001. To
download our complimentary reports please visit www.bcmanagement.com.
We Value Your Comments
Thank you for participating to our annual study. Your contribution adds value to our comprehensive reporting and allows us the
opportunity to assess industry trends. Please share any comments or suggestions on how we can elevate our study or reporting at
As a result of our advancement in reporting technology with World APP Key Survey, BC Management is able to offer a true benchmarking
service exclusively for the business continuity management profession. Our benchmarking service includes a report (similar to this report)
customized to your specific filters used to drill down to the data points that compare to your compensations or program planning
initiatives. As a part of our benchmarking service, BC Management is also offering a business intelligence dashboard technology in which
you will receive all the data points (based on your filter specifications) for further independent assessment. This technology will allow your
organization to further assess the data within a flexible, intelligent, user friendly format.
COMPENSATION RESEARCH DATA: Benefits of Our Customized Compensation Benchmarking Service
Saves time and money in assessing compensations for current and future personnel. Provides a fair comparison on compensation bands based on expertise, degree, certification and geography. Assists in retaining current personnel based on compensations in the same geography and job title.
Filters Available to Customize Your Compensation Report
Employment Status – may choose from full-time permanent, part-time permanent, independent contractor and unemployed.
Geography – may choose country, state/providence, or city.
Job Title/ Position – may choose from a selection of job titles.
Discipline – may choose multiple disciplines that are managed with the program (17 to choose from).
Years of Experience – may choose from an experience band of your choice.
PROGRAM MANAGEMENT RESEARCH DATA: Benefits of Our Customized Program Management Benchmarking Service
Allows you to assess the maturity of your business continuity program focusing on industry best practices, dedicated staff, budget breakouts, reporting structure, vendor utilization, program activation and much more.
Provides assistance in presenting business case objectives to your executives to substantiate and expand your program. Prioritizes key initiatives in elevating the maturity of your programs. Assists in building a road map to advance your program and meet your goals.
Customize a Program Management Benchmarking Report for Your Organization
About BC Management, Inc.
Customize Your Compensation and/or Program Management Benchmarking Report

Copyright ©2010 BC Management, Inc. All rights reserved. SAMPLE REPORT
Page 56
Makes you more efficient by eliminating the need to do research on your own. Provides an unbiased source on how your company compares to the industry; specifically other “like” organizations, which can be
used to support your recommendations.
Filters Available to Customize Your Program Management Report
Industry – may choose more than one industry. Company Revenue – may choose a revenue band of your choice. Number of Employees – may choose a selection from number of company employees. Number of Locations – may choose a selection from number of company locations in either operational and/or retail interfacing. Geographic Distribution – may choose multiple countries as well as how the company locations are dispersed (global, multi-
country, one country, regionally within one country, statewide or citywide). Disciplines within program – may choose multiple disciplines that are managed with the program (17 to choose from). Scope of program – may choose a combination of the following: global, multi-country, one country or regionally within one
country. Maturity Rating of Program – may choose on a scale of 1 to 5 with 1 being Very Immature and 5 being Very Mature (please note
this is a self rating by the study participant). Names of Organization – may choose a list of company names that have participated in our study and completed the program
management portion of the study. Please keep in mind that not all respondents indicated their company name. Many respondents kept their organizational name private. Also, not all study respondents qualified for the program management portion of the study. Only those respondents who managed a program were encouraged to participate in the second section of the study. ALL RESPONDENT CONTACT INFORMATION IS KEPT CONFIDENTIAL AND IS NEVER REVEALED!
Inquiries
For more information or to order a report please email us at [email protected] or call us at (714) 843-5470 or toll free within the
United States (888) 250-7001
Confidential Report
This is a confidential report intended only for the organization that requested and purchased the research data. As such, this report is not
being distributed as a complimentary report among the profession. Please contact BC Management if you would like to share or site this
information.
Related Documents